(17)(b)
Goldman Sachs Funds

| | | | |
| | |
| Annual Report | | | | December 31, 2013 |
| | |
| | | | Fund of Funds Portfolios |
| | | | Balanced Strategy |
| | | | Equity Growth Strategy |
| | | | Growth and Income Strategy |
| | | | Growth Strategy |
| | | | Income Strategies |
| | | | Satellite Strategies |

Goldman Sachs Fund of Funds Portfolios
| n | | GROWTH AND INCOME STRATEGY |
| | | | |
TABLE OF CONTENTS | | | | |
| |
Principal Investment Strategies and Risks | | | 1 | |
| |
Market Review | | | 3 | |
| |
Investment Process | | | 6 | |
| |
Portfolio Management Discussions and Performance Summaries | | | 8 | |
| |
Schedules of Investments | | | 47 | |
| |
Financial Statements | | | 54 | |
| |
Financial Highlights | | | 62 | |
| |
Notes to Financial Statements | | | 74 | |
| |
Report of Independent Registered Public Accounting Firm | | | 92 | |
| |
Other Information | | | 93 | |
| | | | |
| | | |
| NOT FDIC-INSURED | | May Lose Value | | No Bank Guarantee |
GOLDMAN SACHS FUND OF FUNDS PORTFOLIOS
Principal Investment Strategies and Risks
This is not a complete list of risks that may affect the Portfolios. For additional information concerning the risks applicable to the Portfolios, please see the Portfolios’ Prospectus.
The Goldman Sachs Balanced Strategy Portfolio invests in affiliated domestic and international fixed income and equity funds (“underlying funds”). The Portfolio’s investment in any of the underlying funds may exceed 25% of its assets. The Portfolio currently expects to invest a relatively significant percentage of its assets in the Goldman Sachs Short Duration Government, Goldman Sachs Global Income, Goldman Sachs Core Fixed Income, Goldman Sachs Large Cap Growth Insights, Goldman Sachs Large Cap Value Insights, and Goldman Sachs International Equity Insights Funds. The Portfolio is subject to the risk factors of the underlying funds in direct proportion to its investments in those underlying funds, and the ability of the Portfolio to meet its investment objective is directly related to the ability of the underlying funds to meet their investment objectives, as well as the allocation among those underlying funds by the Investment Adviser. An underlying fund is subject to the risks associated with its investments, including (as applicable) those associated with equity, fixed income, foreign and derivative investments generally. From time to time, the underlying funds in which the Portfolio invests, and the size of the investments in the underlying funds, may change. Because the Portfolio is subject to the underlying fund expenses as well as its own expenses, the cost of investing in the Portfolio may be higher than investing in a mutual fund that only invests directly in stocks and bonds.
The Goldman Sachs Equity Growth Strategy Portfolio invests substantially all of its assets in affiliated domestic and international equity funds (“underlying funds”). The Portfolio’s investment in any of the underlying funds may exceed 25% of its assets. The Portfolio currently expects to invest a relatively significant percentage of its assets in the Goldman Sachs Large Cap Growth Insights, Goldman Sachs Large Cap Value Insights and Goldman Sachs International Equity Insights Funds. The Portfolio is subject to the risk factors of the underlying funds in direct proportion to its investments in those underlying funds, and the ability of the Portfolio to meet its investment objective is directly related to the ability of the underlying funds to meet their investment objectives, as well as the allocation among those underlying funds by the Investment Adviser. An underlying fund is subject to the risks associated with its investments, including (as applicable) those associated with equity, fixed income, foreign and derivative investments generally. From time to time, the underlying funds in which the Portfolio invests, and the size of the investments in the underlying funds, may change. Because the Portfolio is subject to the underlying fund expenses as well as its own expenses, the cost of investing in the Portfolio may be higher than investing in a mutual fund that only invests directly in stocks and bonds.
The Goldman Sachs Growth and Income Strategy Portfolio invests in affiliated domestic and international fixed income and equity funds (“underlying funds”). The Portfolio’s investment in any of the underlying funds may exceed 25% of its assets. The Portfolio currently expects to invest a relatively significant percentage of its assets in the Goldman Sachs Large Cap Growth Insights, Goldman Sachs Large Cap Value Insights, Goldman Sachs International Equity Insights, Goldman Sachs Core Fixed Income and Goldman Sachs Global Income Funds. The Portfolio is subject to the risk factors of the underlying funds in direct proportion to its investments in those underlying funds, and the ability of the Portfolio to meet its investment objective is directly related to the ability of the underlying funds to meet their investment objectives, as well as the allocation among those underlying funds by the Investment Adviser. An underlying fund is subject to the risks associated with its investments, including (as applicable) those associated with equity, fixed income, foreign and derivative investments generally. From time to time, the underlying funds in which the Portfolio invests, and the size of the investments in the underlying funds, may change. Because the Portfolio is subject to the underlying fund expenses as well as its own expenses, the cost of investing in the Portfolio may be higher than investing in a mutual fund that only invests directly in stocks and bonds.
1
GOLDMAN SACHS FUND OF FUNDS PORTFOLIOS
The Goldman Sachs Growth Strategy Portfolio invests in affiliated domestic and international fixed income and equity funds (“underlying funds”). The Portfolio’s investment in any of the underlying funds may exceed 25% of its assets. The Portfolio currently expects to invest a relatively significant percentage of its assets in the Goldman Sachs Large Cap Growth Insights, Goldman Sachs Large Cap Value Insights and Goldman Sachs International Equity Insights Funds. The Portfolio is subject to the risk factors of the underlying funds in direct proportion to its investments in those underlying funds, and the ability of the Portfolio to meet its investment objective is directly related to the ability of the underlying funds to meet their investment objectives, as well as the allocation among those underlying funds by the Investment Adviser. An underlying fund is subject to the risks associated with its investments, including (as applicable) those associated with equity, fixed income, foreign and derivative investments generally. From time to time, the underlying funds in which the Portfolio invests, and the size of the investments in the underlying funds, may change. Because the Portfolio is subject to the underlying fund expenses as well as its own expenses, the cost of investing in the Portfolio may be higher than investing in a mutual fund that only invests directly in stocks and bonds.
The Goldman Sachs Income Strategies Portfolio invests in affiliated domestic and international fixed income and equity funds (“underlying funds”). The Portfolio’s investment in any of the underlying funds may exceed 25% of its assets. The Portfolio currently expects to invest a relatively significant percentage of its assets in the Goldman Sachs U.S. Equity Dividend and Premium, Goldman Sachs International Equity Dividend and Premium, Goldman Sachs International Real Estate Securities, Goldman Sachs High Yield, Goldman Sachs Global Income, Goldman Sachs Local Emerging Markets Debt, Goldman Sachs Investment Grade Credit and Goldman Sachs Emerging Markets Debt Funds. The Portfolio is subject to the risk factors of the underlying funds in direct proportion to its investments in those underlying funds, and the ability of the Portfolio to meet its investment objective is directly related to the ability of the underlying funds to meet their investment objectives, as well as the allocation among those underlying funds by the Investment Adviser. An underlying fund is subject to the risks associated with its investments, including (as applicable) those associated with equity, fixed income, foreign and derivative investments generally. From time to time, the underlying funds in which the Portfolio invests, and the size of the investments in the underlying funds, may change. Because the Portfolio is subject to the underlying fund expenses as well as its own expenses, the cost of investing in the Portfolio may be higher than investing in a mutual fund that only invests directly in stocks and bonds.
The Goldman Sachs Satellite Strategies Portfolio invests primarily in affiliated fixed income and equity funds (“underlying funds”) which are considered to invest in satellite asset classes. Satellite asset classes are those that have traditionally had low correlations to traditional market exposures such as large capitalization equities and investment grade fixed income. The Portfolio’s investment in any of the underlying funds may exceed 25% of its assets. The Investment Adviser expects to invest relatively significant percentages in the following satellite equity asset classes: emerging markets equity, international small cap, U.S. and international real estate securities. The Investment Adviser may invest a relatively significant percentage in the following satellite fixed income asset classes: high yield, emerging markets debt and commodities. The Portfolio is subject to the risk factors of the underlying funds in direct proportion to its investments in those underlying funds, and the ability of the Portfolio to meet its investment objective is directly related to the ability of the underlying funds to meet their investment objectives, as well as the allocation among those underlying funds by the Investment Adviser. An underlying fund is subject to the risks associated with its investments, including (as applicable) those associated with equity, fixed income, foreign, commodity and derivative investments generally. From time to time, the underlying funds in which the Portfolio invests, and the size of the investments in the underlying funds, may change. Because the Portfolio is subject to the underlying fund expenses as well as its own expenses, the cost of investing in the Portfolio may be higher than investing in a mutual fund that only invests directly in stocks and bonds.
2
MARKET REVIEW
Fund of Funds Portfolios
Dear Shareholder:
This report provides an overview of regional and sector preferences of the Goldman Sachs Fund of Funds Portfolios (each, a “Portfolio,” and collectively, the “Portfolios”) during the 12-month period ended December 31, 2013 (the “Reporting Period”).
Market Review
During the 12 months ended December 31, 2013 (the “Reporting Period”), global equity markets overall recorded positive returns, while global fixed income markets generally declined.
Equity Markets
U.S. equities started the Reporting Period with a strong rally. European equity markets also rose early in the Reporting Period, despite a banking crisis in Cyprus and economic contraction through much of the region. The Japanese equity market extended its strong rally from 2012 on the hope that the aggressive stimulus plans of Prime Minister Shinzo Abe’s government would indeed promote economic growth and inflation.
In mid-May 2013, Federal Reserve (“Fed”) Chair Ben Bernanke announced the potential tapering of the pace of the Fed’s quantitative easing asset purchases, which led to a virtual halt in the broad global equity market rally. Equity markets, both in the U.S. and internationally, reacted negatively again in June 2013 to news the slowing could begin later in 2013, with the program ending by the middle of 2014 if the economy grew as expected.
Both U.S. and international equity markets rebounded sharply in September 2013 on the Fed’s announcement that it would not yet begin to taper its asset purchases. The rally continued into October 2013 on more evidence that suggested global monetary conditions would remain loose — the U.S. added fewer jobs than expected in September 2013; Janet Yellen, widely considered a relatively dovish choice, was nominated to succeed Bernanke as Fed Chair; and the European Central Bank (“ECB”) held its interest rates at 0.5% due to what ECB President Mario Draghi called the region’s “weak, fragile and uneven” recovery. The U.S. equity market also reflected relief, as the U.S. government narrowly avoided a default after reaching an eleventh hour agreement to raise its debt ceiling.
In December 2013, the Fed ended seven months of speculation and announced it would begin tapering its asset purchases in January 2014. Equity markets, both domestic and international, viewed the move as a sign of confidence in the U.S. economy. Days after the Fed’s announcement, the U.S. revised upward its Gross Domestic Product (“GDP”) growth estimate for the third calendar quarter to an annualized rate of 4.1%, the fastest pace in two years. Importantly, more robust consumption accounted for most of the upward revision. Strong and seemingly sustained momentum in the U.S. housing market was one of the biggest drivers of improved sentiment on the economy. The U.S. labor market also improved late in the year, with the unemployment rate dropping to 6.7% by December 2013. Amidst this better economic news, the S&P® 500 Index made record highs in December 2013. Indeed, the
3
MARKET REVIEW
S&P® 500 Index posted 45 new all-time closing highs in 2013, including a new closing high on the final day of trading. The last time the S&P® 500 Index closed the year with a new high was in 1999.
Equity markets in Japan and Europe also posted fresh highs as late as December 2013. Japan’s Nikkei 225 Stock Averagea closed the calendar year at a six-year high, as its big government stimulus program appeared to be working. The yen depreciated 22% against the U.S. dollar during the year 2013, and Japan’s consumer price index steadily increased through the fourth quarter of 2013, boosting confidence that Japan’s economy was on a path to achieve its inflation target of 2%. Germany’s Xetra Daxb also reached a new high in December 2013, as European equity markets continued to benefit from the ECB’s commitment to easy monetary policy and as economic growth returned to the region.
Fixed Income Markets
When the Reporting Period began in January 2013, risk appetite in the fixed income markets was supported by a last-minute deal on the fiscal cliff. Spread, or non-U.S. Treasury, fixed income sectors rallied. Government bond yields generally increased. This trend reversed itself during February 2013, as market volatility increased, primarily on worries about U.S. fiscal policy gridlock and Italy’s elections. The center-left’s failure to gain a majority in the upper house of Italy’s legislature raised concerns about the prospects for a stable coalition government and the country’s commitment to reform. The Fed reiterated its commitment to fiscal stimulus, but interest rates weakened on the outlook for economic growth and concerns the Fed might begin laying the groundwork for policy tightening sooner than previously expected. Toward the end of the first calendar quarter, spread sector performance cooled and government bonds rallied, as tensions resurfaced in the Eurozone on worries about Italy’s elections and Cyprus’ bailout by Euro-area finance ministers. Meanwhile, the Bank of Japan announced surprisingly aggressive new easing measures in its first policy meeting since the induction of Governor Haruhiko Kuroda and deputies Kazumasa Iwata and Hiroshi Nakaso.
U.S. economic data strengthened in the second quarter of 2013, led by strong housing market data and improved employment figures. In April 2013, spread sectors performed well globally as investors sought yield in an artificially low rate environment. However, in May 2013, the strengthening trend of U.S. economic data prompted the Fed to signal a possible wind-down of asset purchases later in the year. The prospect of the Fed tightening policy produced a global uptick in volatility across the fixed income spectrum, causing interest rates to rise and spreads, or yield differentials between bonds of comparable maturities, to widen.
Market volatility drove global bond yields higher early in the third quarter of 2013 on continued uncertainty over Fed policy, including speculation about who would replace Fed Chair Bernanke and the risk of a military intervention in Syria. Markets stabilized mid-quarter. Interest rates rose and spread sectors rallied on the Fed’s surprise decision at its September meeting to not yet start reducing asset purchases. The central bank cited insufficient economic conditions and concerns about fiscal tightening. Also during the third calendar quarter, global growth momentum showed improvement, with broad-based expansion in manufacturing. The Eurozone emerged from recession, and China’s economy stabilized on increased investment.
| a | | The Nikkei 225 Stock Average is the leading and most respected index of Japanese stocks. It is a price- weighted index comprised of Japan’s top 225 blue chip companies on the Tokyo Stock Exchange. |
| b | | The Xetra Dax is a blue chip index in Germany that tracks the performance of the 30 most actively traded stocks on the Frankfurt Stock Exchange. |
4
MARKET REVIEW
At the beginning of the fourth quarter of 2013, a political stalemate over U.S. federal government funding led to a 16-day partial federal government shutdown. The stalemate raised doubts about the prospect of an agreement to raise the debt ceiling in mid-October 2013. Ultimately, however, lawmakers extended the government’s borrowing authority to February 2014, though many observers believed the shutdown and debt ceiling debate could weigh on the economy in the near term. Overall, during the fourth calendar quarter, U.S. Treasury yields increased on improving economic data and, in December, on the Fed’s decision to begin trimming its asset purchases. The Fed announced that starting in January 2014, it would reduce its monthly purchases of U.S. Treasury securities and mortgage-backed securities by $5 billion each, cutting its total monthly asset purchases from $85 billion to $75 billion.
5
GOLDMAN SACHS FUND OF FUNDS PORTFOLIOS
What Differentiates Goldman Sachs’
Approach to Asset Allocation?
We believe that strong, consistent investment results through asset allocation are best achieved through teams
of experts working together on a global scale:
EACH GOLDMAN SACHS
ASSET ALLOCATION
PORTFOLIO SEEKS TO
DELIVER:
| n | | Comprehensive investment strategies for any life stage |
| n | | Automatic diversification and risk management benefits |
| n | | Forward-looking, quarterly tactical reallocation |
| n | | Simplicity and efficiency |
| n | | Goldman Sachs’ Quantitative Investment Strategies Team determines the strategic and quarterly tactical asset allocations. The team is comprised of over 90 professionals with significant academic and practitioner experience. |
| n | | Goldman Sachs’ Portfolio Management Teams offer expert management of the mutual funds that are contained within each Asset Allocation Portfolio (each, a “Portfolio” and together, “Portfolios”). These same teams manage portfolios for institutional and high net worth investors. |
Goldman Sachs Asset Allocation Investment Process

Quantitative Investment Strategies Team
Each Fund of Funds Portfolio represents a diversified global portfolio on the efficient frontier.* The Portfolios differ in their long-term objective, and therefore, their asset allocation mix. The long-term strategic asset allocation is the primary source of risk and the corresponding primary determinant of total return. It therefore represents an anchor, or neutral starting point, from which tactical asset allocation decisions are made.

For each Portfolio, the strategic asset allocation is combined with a measured amount of tactical risk. Changing market conditions create opportunities to capitalize on investing in different countries and asset classes relative to others over time. Within each strategy, we shift assets away from the strategic allocation (over and underweighting certain asset classes and countries) to seek to benefit from changing conditions in global capital markets.
Using proprietary portfolio construction models to maintain each Portfolio’s original risk/ return profile over time, the team makes ten active decisions based on its current outlook on global equity, fixed income and currency markets.
| | |
n Asset class selection | | Are stocks, bonds or cash more attractive? |
n Regional equity selection | | Are U.S. or non-U.S. equities more attractive? |
n Regional bond selection | | Are U.S. or non-U.S. bonds more attractive? |
n U.S. equity style selection | | Are U.S. value or U.S. growth equities more attractive? |
n U.S. equity size selection | | Are U.S. large-cap or U.S. small-cap equities more attractive? |
n Emerging/developed equity selection | | Are emerging or developed equities more attractive? |
| * | | Portfolios on the efficient frontier are optimal in both the sense that they offer maximal expected return for some given level of risk and minimal risk for some given level of expected return. The efficient frontier is the line created from the risk-reward graph, comprised of optimal portfolios. The optimal portfolios plotted along the curve have the highest expected return possible for the given amount of risk. |
6
GOLDMAN SACHS FUND OF FUNDS PORTFOLIOS

| | |
n Developed equity country selection | | Which international countries are more attractive? |
n Emerging equity country selection | | Which emerging market countries are more attractive? |
n High yield selection | | Are high yield or core fixed income securities more attractive? |
n Emerging/developed bond selection | | Are emerging or developed bonds more attractive? |

Mutual Fund Portfolio Management Teams
Each Portfolio is comprised of underlying Goldman Sachs Mutual Funds managed by broad, deep portfolio management teams. In addition to global tactical asset allocation, we seek to generate excess returns through security selection within each underlying mutual fund. Whether in the equity or fixed income arenas, these portfolio management teams share a commitment to firsthand fundamental research and seek performance driven by successful security selection.
7
PORTFOLIO RESULTS
Fund of Funds Portfolios – Asset Allocation
Investment Process and Principal Strategies
Each Portfolio seeks to achieve its investment objective by investing in a combination of underlying funds that currently exist or that may become available for investment in the future for which Goldman Sachs Asset Management (“GSAM”) or an affiliate, now or in the future, acts as investment adviser or principal underwriter (the “underlying funds”). Some of the Portfolios’ underlying funds invest primarily in fixed income or money market instruments, and some invest primarily in equity securities. Some underlying funds also invest dynamically across equity, fixed income and commodity instruments through a managed-volatility approach.
The investment adviser allows the Portfolios’ strategic targets to shift with their respective market returns but continues to adjust tactical tilts on a quarterly basis to reflect the investment adviser’s latest views. The investment adviser adjusts the overall asset allocation of the Portfolios based on current market conditions and the investment adviser’s economic and market forecasts.
Portfolio Management Discussion and Analysis
Below, the Goldman Sachs Quantitative Investment Strategies Team discusses the Portfolios’ performance and positioning for the 12-month period ended December 31, 2013 (the “Reporting Period”).
| Q | | How did the Portfolios perform during the Reporting Period? |
| A | | Goldman Sachs Balanced Strategy Portfolio — During the Reporting Period, the Balanced Strategy Portfolio’s Class A, B, C, Institutional, Service, IR and R Shares generated average annual total returns of 8.23%, 7.46%, 7.42%, 8.67%, 8.08%, 8.45% and 8.00%, respectively. This compares to the 8.64% average annual total return of the Portfolio’s blended benchmark, which is comprised 60% of the Barclays Global Aggregate Bond Index (hedged to U.S. dollars) (“Barclays Global Index”) and 40% of the MSCI All Country World Index (unhedged) (“MSCI ACWI Index”), during the same period. |
| | The components of the Portfolio’s blended benchmark, the Barclays Global Index and the MSCI ACWI Index, generated average annual total returns of -0.14% and 22.80%, respectively, during the same period. |
| | Goldman Sachs Equity Growth Strategy Portfolio — During the Reporting Period, the Equity Growth Strategy Portfolio’s Class A, B, C, Institutional, Service, IR and R Shares generated average annual total returns of 23.51%, 22.53%, 22.60%, 23.96%, 23.28%, 23.77% and 23.17%, respectively. This compares to the 22.80% average annual total return of the Portfolio’s benchmark, the MSCI ACWI Index, during the same period. |
| | Goldman Sachs Growth and Income Strategy Portfolio — During the Reporting Period, the Growth and Income Strategy Portfolio’s Class A, B, C, Institutional, Service, IR and R Shares generated average annual total returns of 13.10%, 12.26%, 12.32%, 13.63%, 13.08%, 13.36% and 12.76%, respectively. This compares to the 13.23% average annual total return of the Portfolio’s blended benchmark, which is comprised 40% of the Barclays Global Index and 60% of the MSCI ACWI Index, during the same period. |
| | The components of the Portfolio’s blended benchmarks, the Barclays Global Index and the MSCI ACWI Index, generated average annual total returns of -0.14% and 22.80%, respectively, during the same period. |
| | Goldman Sachs Growth Strategy Portfolio — During the Reporting Period, the Growth Strategy Portfolio’s Class A, B, C, Institutional, Service, IR and R Shares generated average annual total returns of 18.31%, 17.44%,17.37%, 18.81%, 18.19%, 18.65% and 17.93%, respectively. This compares to the 17.95% average annual total return of the Portfolio’s blended benchmark, which is comprised 80% of |
8
PORTFOLIO RESULTS
| | the MSCI ACWI Index and 20% of the Barclays Global Index, during the same period. |
| | The components of the Portfolio’s blended benchmarks, the Barclays Global Index and the MSCI ACWI Index, generated average annual total returns of -0.14% and 22.80%, respectively, during the same period. |
| Q | | What key factors affected the Portfolios’ performance during the Reporting Period? |
| A | | During the Reporting Period, the Portfolios generated positive absolute returns and also outperformed their respective blended benchmarks. Overall, our strategic, long-term asset allocation policy contributed positively to relative performance. Our quarterly tactical views also enhanced relative results, especially in Portfolios with greater equity exposure. In addition, security selection within the underlying funds added to the performance of each of the Portfolios. |
| Q | | How did Global Tactical Asset Allocation decisions affect the Portfolios’ performance during the Reporting Period? |
| A | | As indicated, the implementation of our quarterly tactical views added to the performance of the Portfolios during the Reporting Period. Overall, the Portfolios’ overweight in equities versus fixed income was the largest positive contributor to relative returns. These gains overall were partially offset by the Portfolios’ underweight in U.S. equities versus international equities during the Reporting Period. |
| | Within the equity allocation, underweight positions in emerging markets equities versus developed markets equities added to performance, particularly in those Portfolios with greater equity exposure. These gains were partially offset by an underweight in U.S. equities versus international equities in most of the Portfolios during the Reporting Period, which detracted. |
| | Within fixed income allocations, the Portfolios benefited from an overweight in high yield corporate bonds versus investment grade corporate bonds. The Portfolios’ underweight in U.S. dollar denominated emerging markets debt relative to developed markets debt, especially in the first quarter of 2013, also added value. On the other hand, an overweight in local emerging markets debt (through which the Portfolios gain exposure to local currencies) versus developed markets debt detracted, particularly in the first half of the Reporting Period, from the performance of most of the Portfolios. |
| | Our other asset class tactical views did not have a significant impact on performance during the Reporting Period. |
| Q | | How did the Portfolios’ underlying funds perform relative to their respective benchmark indices during the Reporting Period? |
| A | | Of the Portfolios’ underlying equity funds, the Goldman Sachs International Small Cap Insights Fund and the Goldman Sachs Large Cap Growth Insights Fund performed best relative to their respective benchmark indices. The Goldman Sachs Small Cap Equity Insights underperformed its benchmark index most during the Reporting Period. |
| | On the fixed income side, the Goldman Sachs Global Income Fund and the Goldman Sachs Core Fixed Income Fund outperformed their respective benchmark indices most. The Goldman Sachs Local Emerging Markets Debt Fund underperformed its benchmark index most during the Reporting Period.c |
| | Among alternative investment classes, the Goldman Sachs Real Estate Securities Fund outperformed its benchmark index most. The Goldman Sachs Commodity Strategy Fund underperformed its benchmark most during the Reporting Period. |
| Q | | How did the Portfolios use derivatives and similar instruments during the Reporting Period? |
| A | | The Portfolios do not directly invest in derivatives. However, some of the underlying funds used derivatives during the Reporting Period to apply their active investment views with greater versatility and to afford greater risk management precision. As market conditions warranted during the Reporting Period, some of these underlying funds engaged in forward foreign currency exchange contracts, financial futures contracts, options, swap contracts and structured securities to attempt to enhance portfolio return and for hedging purposes. |
| c | | Effective after the close of business on May 3, 2013, the Goldman Sachs Structured International Small Cap Fund was renamed the Goldman Sachs International Small Cap Insights Fund, the Goldman Sachs Structured Large Cap Growth Fund was renamed the Goldman Sachs Large Cap Growth Insights Fund and the Goldman Sachs Structured Small Cap Equity Fund was renamed the Goldman Sachs Small Cap Equity Insights Fund. |
9
PORTFOLIO RESULTS
| Q | | What changes did you make during the Reporting Period within both the equity and fixed income portions of the Portfolio? |
| A | | Throughout the Reporting Period, we favored equities over fixed income in implementing our strategies. |
| | Within equities, at the beginning of the Reporting Period, we were bullish on U.S. stocks versus international stocks. During the first quarter of 2013, we became bullish on international equities over U.S. equities given supportive macroeconomic conditions for international equities relative to U.S. equities. We remained bullish on international equities over U.S. equities during the second quarter of 2013 because of supportive macroeconomic conditions and the attractive valuations of international equities. In the third quarter of 2013, we continued to be bullish on international equities given their attractive valuations compared to U.S. equities. In the fourth quarter of 2013, we became slightly bullish on U.S. equities versus international equities given their strong momentum, high risk premiums and a supportive macroeconomic environment for U.S. equity markets. Also, when the Reporting Period started, we were modestly bullish on emerging markets equities versus developed markets equities, growing increasingly more bullish during the first quarter of 2013. During the second calendar quarter, we became bullish on developed markets equities versus emerging markets equities because of the attractive relative valuations of developed markets equities. In the third calendar quarter, we remained bullish on developed markets equities relative to emerging markets equities due to the strong momentum in developed markets equities and less supportive macroeconomic conditions for emerging economies. In the fourth quarter of 2013, we remained bullish on developed markets equities versus emerging markets equities because of attractive relative valuations in developed markets equities. |
| | We implemented our country level views within the Goldman Sachs International Equity Insights Fund and the Goldman Sachs Emerging Markets Equity Insights Fund, which served as underlying funds during the Reporting Period.d At the end of the Reporting Period, we were bullish on Japan due to supportive macroeconomic conditions, attractive valuations, high risk premiums and strong momentum. We were also bullish on Germany primarily because of relatively cheap long-term valuations and strong short-term momentum. We had a bearish view on Portugal as a result of low risk premiums, weak momentum and unattractive valuations. In addition, at the end of the Reporting Period, we were bearish on Australia due to unattractive valuations and low risk premiums. |
| | Among U.S. equities, we began the Reporting Period slightly bullish on value stocks versus growth stocks because of strong sentiment and high risk premiums for value stocks. We became more bullish on value stocks over growth stocks during the first quarter of 2013 as a result of high risk premiums for value stocks. In the second calendar quarter, we remained bullish on value stocks versus growth stocks given strong sentiment for value stocks. We became slightly bullish on growth stocks over value stocks in the third calendar quarter because of high risk premiums for growth stocks. We remained bullish on growth stocks versus value stocks in the fourth quarter of 2013 due to strong investor sentiment for growth stocks. |
| | We were bullish at the beginning of the Reporting Period on U.S. small-cap stocks relative to U.S. large-cap stocks, growing more bullish in the first quarter of 2013, because of the strong sentiment and high risk premiums for U.S. small-cap equities. During the second and third calendar quarters, we maintained our bullish view on U.S. small-cap stocks relative to U.S. large-cap stocks as a result of strong sentiment for U.S. small-cap stocks. In the fourth calendar quarter, we became neutral on U.S. small-cap stocks relative to U.S. large-cap stocks as high risk premiums for U.S. small-cap stocks were offset by poor sentiment and less attractive valuations. |
| | Within fixed income, throughout the Reporting Period, we remained neutral on international fixed income versus U.S. fixed income. We also were bullish on high yield bonds versus investment grade bonds throughout the Reporting Period because of the relatively strong momentum of high yield bonds. |
| | When the Reporting Period started, we held a bullish view on U.S. dollar denominated emerging markets debt versus |
| d | | Effective after the close of business on May 3, 2013, the Goldman Sachs Structured International Equity Fund was renamed the Goldman Sachs International Equity Insights Fund and the Goldman Sachs Structured Emerging Markets Equity Fund was renamed the Goldman Sachs Emerging Markets Equity Insights Fund. |
10
PORTFOLIO RESULTS
| | developed markets debt as a result of strong momentum for U.S. dollar denominated emerging markets debt. During the first quarter of 2013, we became bullish on developed markets debt relative to U.S. dollar denominated emerging markets debt primarily because of weakening momentum in U.S. dollar denominated emerging markets debt. We became neutral on U.S. dollar denominated emerging markets debt relative to developed markets debt in the second calendar quarter as a result of weak momentum in U.S. dollar denominated emerging markets debt. In the third calendar quarter, we grew bullish on U.S. dollar denominated emerging markets debt versus developed markets debt primarily because of strong momentum in U.S. dollar denominated emerging markets debt. During the fourth quarter of 2013, we became bullish on developed markets debt relative to U.S. dollar denominated emerging markets debt due to strong momentum in developed markets debt. |
| | At the beginning of the Reporting Period, we were bullish on local emerging markets debt relative to developed markets debt due to supportive macroeconomic conditions. We remained bullish on local emerging markets debt relative to developed markets debt in the first quarter of 2013 because of strong currency momentum and high risk premiums. During the second calendar quarter and through the end of the Reporting Period, we were bearish on local emerging markets debt versus developed markets debt primarily because of poor momentum for local emerging markets debt. |
| Q | | What is the Portfolios’ tactical view and strategy for the months ahead? |
| A | | Global equilibrium is the foundation of our strategic asset allocation process — that is, we believe that a globally-diversified portfolio of asset classes, weighted by their market capitalization, provides economically intuitive, meaningful and balanced exposures to investment opportunities. We make 10 active decisions within the Portfolios based on our current outlook on global equity, fixed income and currency markets. On a quarterly basis, we shift assets away from the strategic allocation (tilting our positions in certain asset classes and countries from their longer-term, strategic weights) in an effort to benefit from changing conditions in global capital markets. |
| | At the end of the Reporting Period, we remained bullish on equities relative to fixed income due to continued strong momentum. Within U.S. equities, we were slightly bullish on growth stocks relative to value stocks and had a neutral view on U.S. small-cap stocks versus U.S. large-cap stocks. We were bullish on developed markets equities versus emerging markets equities and were slightly bullish on U.S. equities versus international equities. |
| | In fixed income at the end of the Reporting Period, we were neutral on international fixed income relative to U.S. fixed income. We remained bullish on high yield bonds relative to investment grade bonds. Also, we were bullish on developed markets debt versus U.S. dollar denominated emerging markets debt and continued to favor developed markets debt over local emerging markets debt. |
11
FUND BASICS
Balanced Strategy
as of December 31, 2013
| | | | | | | | | | |
| | PERFORMANCE REVIEW | |
| | | January 1, 2013–December 31, 2013 | | Portfolio Total Return
(based on NAV)1 | | | Balanced Strategy
Composite Index2 | |
| | Class A | | | 8.23 | % | | | 8.64 | % |
| | Class B | | | 7.46 | | | | 8.64 | |
| | Class C | | | 7.42 | | | | 8.64 | |
| | Institutional | | | 8.67 | | | | 8.64 | |
| | Service | | | 8.08 | | | | 8.64 | |
| | Class IR | | | 8.45 | | | | 8.64 | |
| | | Class R | | | 8.00 | | | | 8.64 | |
| | 1 | | The net asset value (“NAV”) represents the net assets of the class of the Portfolio (ex-dividend) divided by the total number of shares of the class outstanding. The Portfolio’s performance assumes the reinvestment of dividends and other distributions. The Portfolio’s performance does not reflect the deduction of any applicable sales charges. |
| | 2 | | The Balanced Strategy Composite Index (“Balanced Composite”) is a composite representation prepared by the investment adviser of the performance of the Portfolio’s asset classes weighted according to their respective weightings in the Portfolio’s target range. The Balanced Composite is comprised of a blend of the Barclays Global Aggregate Bond Index (hedged to U.S. dollars) (60%) and the MSCI All Country World Index (unhedged) (the “MSCI ACWI Index”) (40%). The Balanced Composite figures do not reflect any deduction for fees, expenses or taxes. The Barclays Global Aggregate Bond Index hedged to the U.S. dollar, is an unmanaged index, provides a broad-based measure of the global investment-grade fixed-rate debt markets and covers the most liquid portion of the global investment grade fixed-rate bond market, including government, credit and collateralized securities. The Index figures do not include any deduction for fees, expenses or taxes. It is not possible to invest directly in an unmanaged index. The MSCI ACWI Index is a free float-adjusted market capitalization weighted index that is designed to measure the equity market performance of developed and emerging markets. The MSCI ACWI Index consists of 45 country indices comprising 24 developed and 21 emerging market country indices. The developed market country indices included are: Australia, Austria, Belgium, Canada, Denmark, Finland, France, Germany, Greece, Hong Kong, Ireland, Israel, Italy, Japan, Netherlands, New Zealand, Norway, Portugal, Singapore, Spain, Sweden, Switzerland, the United Kingdom and the United States. The emerging market country indices are: Brazil, Chile, China, Colombia, Czech Republic, Egypt, Hungary, India, Indonesia, Korea, Malaysia, Mexico, Morocco, Peru, Philippines, Poland, Russia, South Africa, Taiwan, Thailand, and Turkey. The Index figures do not include any deduction for fees, expenses or taxes. It is not possible to invest directly in an unmanaged index. |
The returns set forth in the table above represent past performance. Past performance does not guarantee future results. The Portfolio’s investment return and principal value will fluctuate so that an investor’s shares, when redeemed, may be worth more or less than their original cost. Current performance may be lower or higher than the performance quoted above. Please visit our web site at www.GSAMFUNDS.com to obtain the most recent month-end returns. Performance reflects fee waivers and/or expense limitations in effect. In their absence, performance would be reduced. Returns do not reflect the deduction of taxes that a shareholder would pay on Portfolio distributions or the redemption of Portfolio shares.
12
FUND BASICS
| | | | | | | | | | | | | | | | |
| | STANDARDIZED TOTAL RETURNS3 |
| | | For the period ended 12/31/13 | | One Year | | | Five Years | | Ten Years | | Since Inception | | | Inception Date |
| | Class A | | | 2.32 | % | | 7.50% | | 4.47% | | | 4.32 | % | | 1/2/98 |
| | Class B | | | 2.37 | | | 7.58 | | 4.41 | | | 4.30 | | | 1/2/98 |
| | Class C | | | 6.40 | | | 7.91 | | 4.27 | | | 3.92 | | | 1/2/98 |
| | Institutional | | | 8.67 | | | 9.16 | | 5.47 | | | 5.11 | | | 1/2/98 |
| | Service | | | 8.08 | | | 8.61 | | 4.95 | | | 4.59 | | | 1/2/98 |
| | Class IR | | | 8.45 | | | 8.97 | | N/A | | | 3.34 | | | 11/30/07 |
| | | Class R | | | 8.00 | | | 8.47 | | N/A | | | 2.85 | | | 11/30/07 |
| | 3 | | The Standardized Total Returns are average annual total returns as of the most recent calendar quarter-end. They assume reinvestment of all distributions at NAV. These returns reflect a maximum initial sales charge of 5.5% for Class A Shares and the assumed contingent deferred sales charge for Class B Shares (5% maximum declining to 0% after six years) and the assumed contingent deferred sales charge for Class C Shares (1% if redeemed within 12 months of purchase). Because Institutional, Service, Class IR and Class R Shares do not involve a sales charge, such a charge is not applied to their Standardized Total Returns. The Portfolio’s Class B Shares are no longer available for purchase by new or existing shareholders (although current Class B shareholders may continue to reinvest income and capital gains distributions into Class B Shares, and Class B shareholders may continue to exchange their shares for Class B Shares of certain other Goldman Sachs Funds). |
The returns set forth in the table above represent past performance. Past performance does not guarantee future results. The Portfolio’s investment return and principal value will fluctuate so that an investor’s shares, when redeemed, may be worth more or less than their original cost. Current performance may be lower or higher than the performance quoted above. Please visit our web site at www.GSAMFUNDS.com to obtain the most recent month-end returns. Performance reflects applicable fee waivers and/or expense limitations in effect during the periods shown. In their absence, performance would be reduced. Returns do not reflect the deduction of taxes that a shareholder would pay on Portfolio distributions or the redemption of Portfolio shares.
| | | | | | | | | | |
| | EXPENSE RATIOS4 | |
| | | | | Net Expense Ratio (Current) | | | Gross Expense Ratio (Before Waivers) | |
| | Class A | | | 1.28 | | | | 1.34 | |
| | Class B | | | 2.04 | | | | 2.09 | |
| | Class C | | | 2.03 | | | | 2.09 | |
| | Institutional | | | 0.88 | | | | 0.94 | |
| | Service | | | 1.38 | | | | 1.44 | |
| | Class IR | | | 1.03 | | | | 1.09 | |
| | | Class R | | | 1.53 | | | | 1.59 | |
| | 4 | | The expense ratios of the Portfolio, both current (net of applicable fee waivers and/or expense limitations) and before waivers (gross of applicable fee waivers and/or expense limitations) are as set forth above according to the most recent publicly available Prospectus for the Portfolio and will differ from the expense ratios disclosed in the Financial Highlights in this report due to the inclusion of Underlying Fund fees and expenses, which are not included in the operating expenses of the Portfolio reflected in the Financial Highlights. The Portfolio’s waivers and/or expense limitations will remain in place through at least April 30, 2014, and prior to such date the Investment Adviser may not terminate the arrangements without the approval of the Portfolio’s Board of Trustees. If these arrangements are discontinued in the future, the expense ratios may change without shareholder approval. |
13
FUND BASICS
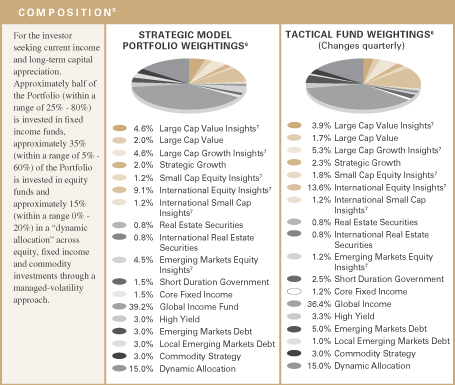
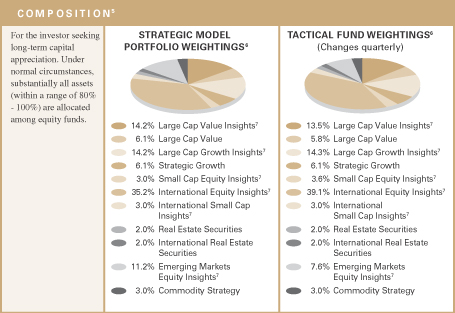
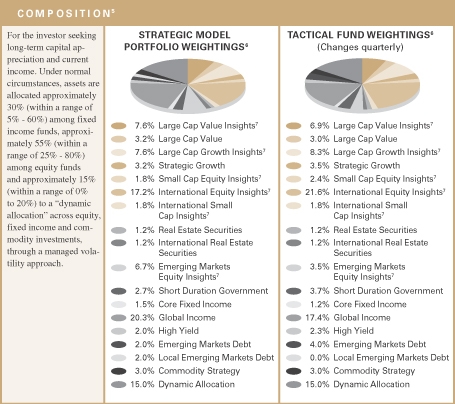
| | 5 | | The tactical fund weightings are set at the beginning of each calendar quarter. The weighting in the chart above reflects the allocations from September 30, 2013 to December 31, 2013. Actual Fund weighting in the Asset Allocation Portfolios may differ from the figures shown above due to rounding, differences in returns of the Underlying Funds, or both. The above figures are not indicative of future allocations. |
| | 6 | | Strategic allocation is the process of determining the areas of the global markets in which to invest, and in what long-term proportion, for each Fund. Our global approach attempts to generate strong long-term returns across geographies and asset classes, and is determined through a careful review of market opportunities and risk/return tradeoffs. It is rebalanced annually. On a quarterly basis, we shift assets around the strategic allocation, over and under-weighting asset classes and countries relative to the neutral starting point, seeking to benefit from changing short-term conditions in global capital markets. This is called tactical asset allocation. |
| | 7 | | Effective May 3, 2013, the Goldman Sachs Structured International Equity, Structured Large Cap Growth, Structured Large Cap Value, Structured Emerging Markets Equity, Structured Small Cap Equity and Structured International Small Cap Funds were renamed to the Goldman Sachs International Equity Insights, Large Cap Growth Insights, Large Cap Value Insights, Emerging Markets Equity Insights, Small Cap Equity Insights and International Small Cap Insights Funds, respectively. |
14
FUND BASICS
|
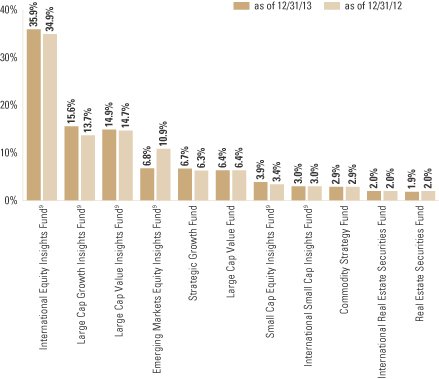
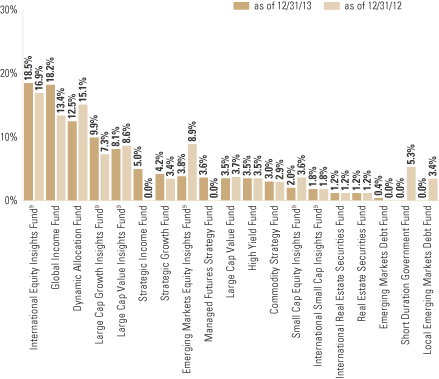
| OVERALL UNDERLYING FUND WEIGHTINGS8 |
| Percentage of Net Assets |
|
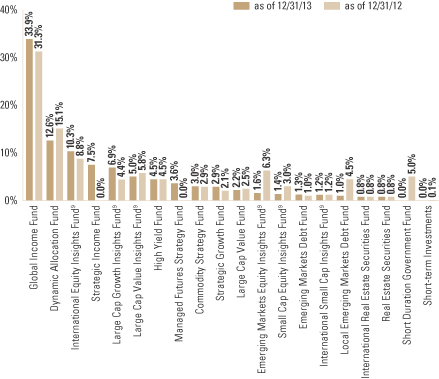
| | 8 | | The Portfolio is actively managed and, as such, its composition may differ over time. The percentage shown for each underlying fund reflects the value of that underlying fund as a percentage of net assets of the Portfolio. Short-term investments represent repurchase agreements. Figures in the above graph may not sum to 100% due to rounding and/or the exclusion of other assets and liabilities. |
| | 9 | | Effective May 3, 2013, the Goldman Sachs Structured International Equity, Structured Large Cap Growth, Structured Large Cap Value, Structured Emerging Markets Equity, Structured Small Cap Equity and Structured International Small Cap Funds were renamed to the Goldman Sachs International Equity Insights, Large Cap Growth Insights, Large Cap Value Insights, Emerging Markets Equity Insights, Small Cap Equity Insights and International Small Cap Insights Funds, respectively. |
15
GOLDMAN SACHS BALANCED STRATEGY PORTFOLIO
Performance Summary
December 31, 2013
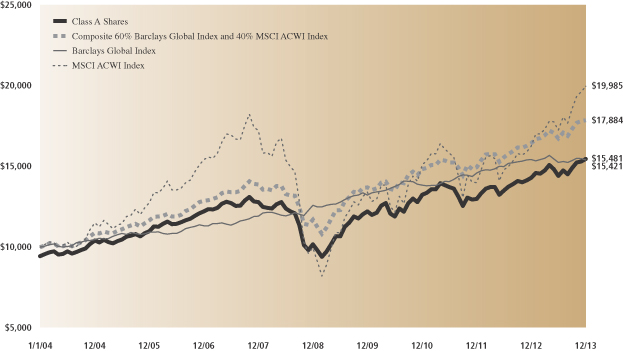
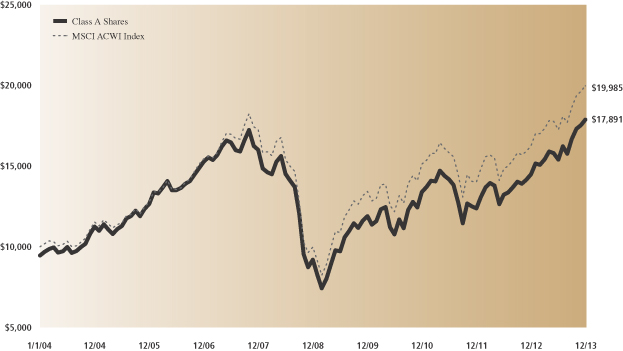
The following graph shows the value, as of December 31, 2013, of a $10,000 investment made on January 1, 2004 in Class A Shares (with the maximum sales charge of 5.5%). For comparative purposes, the performance of the Portfolio’s benchmarks, the Composite 60% Barclays Global Aggregate Bond Index (hedged to USD) and 40% MSCI All Country World Index (unhedged), the Barclays Global Aggregate Bond Index (hedged to USD) (the “Barclays Global Index”) and the MSCI All Country World Index (unhedged) (“MSCI ACWI Index”) (each with dividends reinvested), are shown. This performance data represents past performance and should not be considered indicative of future performance, which will fluctuate with changes in market conditions. These performance fluctuations will cause an investor’s shares, when redeemed, to be worth more or less than their original cost. Performance reflects applicable fee waivers and/or expense limitations currently in effect during the periods shown and in their absence, performance would be reduced. Returns do not reflect the deduction of taxes that a shareholder would pay on Portfolio distributions or the redemption of Portfolio shares. Performance of Class B, Class C, Institutional, Service, Class IR and Class R Shares will vary from Class A Shares due to differences in class specific fees and any applicable sales charges. In addition to the Investment Adviser’s decisions regarding underlying mutual fund selection and allocations among them, other factors may affect Portfolio performance. These factors include, but are not limited to, Portfolio operating fees and expenses, portfolio turnover and subscription and redemption cash flows affecting the Portfolio.
|
| Balanced Strategy Portfolio’s 10 Year Performance |
Performance of a $10,000 investment, with distributions reinvested, from January 1, 2004 through December 31, 2013.
| | | | | | | | | | | | | | |
| Average Annual Total Return through December 31, 2013 | | | One Year | | | | Five Years | | | | Ten Years | | | Since Inception |
Class A (Commenced January 2, 1998) | | | | | | | | | | | | | | |
Excluding sales charges | | | 8.23% | | | | 8.72% | | | | 5.06% | | | 4.69% |
Including sales charges | | | 2.32% | | | | 7.50% | | | | 4.47% | | | 4.32% |
|
Class B (Commenced January 2, 1998) | | | | | | | | | | | | | | |
Excluding contingent deferred sales charges | | | 7.46% | | | | 7.90% | | | | 4.41% | | | 4.30% |
Including contingent deferred sales charges | | | 2.37% | | | | 7.58% | | | | 4.41% | | | 4.30% |
|
Class C (Commenced January 2, 1998) | | | | | | | | | | | | | | |
Excluding contingent deferred sales charges | | | 7.42% | | | | 7.91% | | | | 4.27% | | | 3.92% |
Including contingent deferred sales charges | | | 6.40% | | | | 7.91% | | | | 4.27% | | | 3.92% |
|
Institutional Class (Commenced January 2, 1998) | | | 8.67% | | | | 9.16% | | | | 5.47% | | | 5.11% |
|
Service Class (Commenced January 2, 1998) | | | 8.08% | | | | 8.61% | | | | 4.95% | | | 4.59% |
|
Class IR (Commenced November 30, 2007) | | | 8.45% | | | | 8.97% | | | | N/A | | | 3.34% |
|
Class R (Commenced November 30, 2007) | | | 8.00% | | | | 8.47% | | | | N/A | | | 2.85% |
|
16
FUND BASICS
Equity Growth Strategy
as of December 31, 2013
| | | | | | | | | | |
| | PERFORMANCE REVIEW | |
| | | January 1, 2013–December 31, 2013 | | Portfolio Total Return
(based on NAV)1 | | | MSCI All Country
World Index (net,
unhedged)2 | |
| | Class A | | | 23.51 | % | | | 22.80 | % |
| | Class B | | | 22.53 | | | | 22.80 | |
| | Class C | | | 22.60 | | | | 22.80 | |
| | Institutional | | | 23.96 | | | | 22.80 | |
| | Service | | | 23.28 | | | | 22.80 | |
| | Class IR | | | 23.77 | | | | 22.80 | |
| | | Class R | | | 23.17 | | | | 22.80 | |
| | 1 | | The net asset value (“NAV”) represents the net assets of the class of the Portfolio (ex-dividend) divided by the total number of shares of the class outstanding. The Portfolio’s performance assumes the reinvestment of dividends and other distributions. The Portfolio’s performance does not reflect the deduction of any applicable sales charges. |
| | 2 | | The Fund’s Index is the MSCI All Country World Index (unhedged) (the “MSCI ACWI Index”). The MSCI ACWI Index figures do not reflect any deduction for fees, expenses or taxes. The MSCI ACWI Index is a free float adjusted market capitalization weighted index that is designed to measure the equity market performance of developed and emerging markets. The MSCI ACWI Index consists of 45 country indices comprising 24 developed and 21 emerging market country indices. The developed market country indices included are: Australia, Austria, Belgium, Canada, Denmark, Finland, France, Germany, Greece, Hong Kong, Ireland, Israel, Italy, Japan, Netherlands, New Zealand, Norway, Portugal, Singapore, Spain, Sweden, Switzerland, the United Kingdom and the United States. The emerging market country indices are: Brazil, Chile, China, Colombia, Czech Republic, Egypt, Hungary, India, Indonesia, Korea, Malaysia, Mexico, Morocco, Peru, Philippines, Poland, Russia, South Africa, Taiwan, Thailand, and Turkey. The Index figures do not include any deduction for fees, expenses or taxes. It is not possible to invest directly in an unmanaged index. |
The returns set forth in the table above represent past performance. Past performance does not guarantee future results. The Portfolio’s investment return and principal value will fluctuate so that an investor’s shares, when redeemed, may be worth more or less than their original cost. Current performance may be lower or higher than the performance quoted above. Please visit our web site at www.GSAMFUNDS.com to obtain the most recent month-end returns. Performance reflects fee waivers and/or expense limitations in effect. In their absence, performance would be reduced. Returns do not reflect the deduction of taxes that a shareholder would pay on Portfolio distributions or the redemption of Portfolio shares.
17
FUND BASICS
| | | | | | | | | | | | | | |
| | STANDARDIZED TOTAL RETURNS3 |
| | | For the period ended 12/31/13 | | One Year | | | Five Years | | Ten Years | | Since Inception | | Inception Date |
| | Class A | | | 16.76 | % | | 12.95% | | 5.99% | | 4.37% | | 1/2/98 |
| | Class B | | | 17.49 | | | 13.10 | | 5.93 | | 4.34 | | 1/2/98 |
| | Class C | | | 21.59 | | | 13.39 | | 5.79 | | 3.97 | | 1/2/98 |
| | Institutional | | | 23.96 | | | 14.69 | | 7.01 | | 5.13 | | 1/2/98 |
| | Service | | | 23.28 | | | 14.11 | | 6.47 | | 4.63 | | 1/2/98 |
| | Class IR | | | 23.77 | | | 14.54 | | N/A | | 1.85 | | 11/30/07 |
| | | Class R | | | 23.17 | | | 14.04 | | N/A | | 1.41 | | 11/30/07 |
| | 3 | | The Standardized Total Returns are average annual total returns as of the most recent calendar quarter-end. They assume reinvestment of all distributions at NAV. These returns reflect a maximum initial sales charge of 5.5% for Class A Shares and the assumed contingent deferred sales charge for Class B Shares (5% maximum declining to 0% after six years) and the assumed contingent deferred sales charge for Class C Shares (1% if redeemed within 12 months of purchase). Because Institutional, Service, Class IR and Class R Shares do not involve a sales charge, such a charge is not applied to their Standardized Total Returns. The Portfolio’s Class B Shares are no longer available for purchase by new or existing shareholders (although current Class B shareholders may continue to reinvest income and capital gains distributions into Class B Shares, and Class B shareholders may continue to exchange their shares for Class B Shares of certain other Goldman Sachs Funds). |
The returns set forth in the table above represent past performance. Past performance does not guarantee future results. The Portfolio’s investment return and principal value will fluctuate so that an investor’s shares, when redeemed, may be worth more or less than their original cost. Current performance may be lower or higher than the performance quoted above. Please visit our web site at www.GSAMFUNDS.com to obtain the most recent month-end returns. Performance reflects applicable fee waivers and/or expense limitations in effect during the periods shown. In their absence, performance would be reduced. Returns do not reflect the deduction of taxes that a shareholder would pay on Portfolio distributions or the redemption of Portfolio shares.
| | | | | | | | | | |
| | EXPENSE RATIOS4 | |
| | | | | Net Expense Ratio (Current) | | | Gross Expense Ratio (Before Waivers) | |
| | Class A | | | 1.35 | % | | | 1.44 | % |
| | Class B | | | 2.10 | | | | 2.19 | |
| | Class C | | | 2.10 | | | | 2.19 | |
| | Institutional | | | 0.95 | | | | 1.02 | |
| | Service | | | 1.46 | | | | 1.54 | |
| | Class IR | | | 1.10 | | | | 1.18 | |
| | | Class R | | | 1.60 | | | | 1.68 | |
| | 4 | | The expense ratios of the Portfolio, both current (net of applicable fee waivers and/or expense limitations) and before waivers (gross of applicable fee waivers and/or expense limitations) are as set forth above according to the most recent publicly available Prospectus for the Portfolio and will differ from the expense ratios disclosed in the Financial Highlights in this report due to the inclusion of Underlying Fund fees and expenses, which are not included in the operating expenses of the Portfolio reflected in the Financial Highlights. The Portfolio’s waivers and/or expense limitations will remain in place through at least April 30, 2014, and prior to such date the Investment Adviser may not terminate the arrangements without the approval of the Portfolio’s Board of Trustees. If these arrangements are discontinued in the future, the expense ratios may change without shareholder approval. |
18
FUND BASICS
| | 5 | | The tactical fund weightings are set at the beginning of each calendar quarter. The weighting in the chart above reflects the allocations from September 30, 2013 to December 31, 2013. Actual Fund weighting in the Asset Allocation Portfolios may differ from the figures shown above due to rounding, differences in returns of the Underlying Funds, or both. The above figures are not indicative of future allocations. |
| | 6 | | Strategic allocation is the process of determining the areas of the global markets in which to invest, and in what long-term proportion, for each Fund. Our global approach attempts to generate strong long-term returns across geographies and asset classes, and is determined through a careful review of market opportunities and risk/return tradeoffs. It is rebalanced annually. On a quarterly basis, we shift assets around the strategic allocation, over and under-weighting asset classes and countries relative to the neutral starting point, seeking to benefit from changing short-term conditions in global capital markets. This is called tactical asset allocation. |
| | 7 | | Effective May 3, 2013, the Goldman Sachs Structured International Equity, Structured Large Cap Growth, Structured Large Cap Value, Structured Emerging Markets Equity, Structured Small Cap Equity and Structured International Small Cap Funds were renamed to the Goldman Sachs International Equity Insights, Large Cap Growth Insights, Large Cap Value Insights, Emerging Markets Equity Insights, Small Cap Equity Insights and International Small Cap Insights Funds, respectively. |
19
FUND BASICS
|
| OVERALL UNDERLYING FUND WEIGHTINGS8 |
| Percentage of Net Assets |
| | 8 | | The Portfolio is actively managed and, as such, its composition may differ over time. The percentage shown for each underlying fund reflects the value of that underlying fund as a percentage of net assets of the Portfolio. Figures in the above graph may not sum to 100% due to rounding and/or the exclusion of other assets and liabilities |
| | 9 | | Effective May 3, 2013, the Goldman Sachs Structured International Equity, Structured Large Cap Growth, Structured Large Cap Value, Structured Emerging Markets Equity, Structured Small Cap Equity and Structured International Small Cap Funds were renamed to the Goldman Sachs International Equity Insights, Large Cap Growth Insights, Large Cap Value Insights, Emerging Markets Equity Insights, Small Cap Equity Insights and International Small Cap Insights Funds, respectively. |
20
GOLDMAN SACHS EQUITY GROWTH STRATEGY PORTFOLIO
Performance Summary
December 31, 2013
The following graph shows the value, as of December 31, 2013, of a $10,000 investment made on January 1, 2004 in Class A Shares (with the maximum sales charge of 5.5%). For comparative purposes, the performance of the Portfolio’s benchmark, the MSCI All Country World Index (unhedged) (“MSCI ACWI Index”) (with dividends reinvested), is shown. This performance data represents past performance and should not be considered indicative of future performance, which will fluctuate with changes in market conditions. These performance fluctuations will cause an investor’s shares, when redeemed, to be worth more or less than their original cost. Performance reflects applicable fee waivers and/or expense limitations currently in effect during the periods shown and in their absence, performance would be reduced. Returns do not reflect the deduction of taxes that a shareholder would pay on Portfolio distributions or the redemption of Portfolio shares. Performance of Class B, Class C, Institutional, Service, Class IR and Class R Shares will vary from Class A Shares due to differences in class specific fees and any applicable sales charges. In addition to the Investment Adviser’s decisions regarding underlying mutual fund selection and allocations among them, other factors may affect Portfolio performance. These factors include, but are not limited to, Portfolio operating fees and expenses, portfolio turnover and subscription and redemption cash flows affecting the Portfolio.
|
| Equity Growth Strategy Portfolio’s 10 Year Performance |
Performance of a $10,000 investment, with distributions reinvested, from January 1, 2004 through December 31, 2013.
| | | | | | | | | | | | | | |
| Average Annual Total Return through December 31, 2013 | | | One Year | | | | Five Years | | | | Ten Years | | | Since Inception |
Class A (Commenced January 2, 1998) | | | | | | | | | | | | | | |
Excluding sales charges | | | 23.51% | | | | 14.24% | | | | 6.59% | | | 4.74% |
Including sales charges | | | 16.76% | | | | 12.95% | | | | 5.99% | | | 4.37% |
|
Class B (Commenced January 2, 1998) | | | | | | | | | | | | | | |
Excluding contingent deferred sales charges | | | 22.53% | | | | 13.36% | | | | 5.93% | | | 4.34% |
Including contingent deferred sales charges | | | 17.49% | | | | 13.10% | | | | 5.93% | | | 4.34% |
|
Class C (Commenced January 2, 1998) | | | | | | | | | | | | | | |
Excluding contingent deferred sales charges | | | 22.60% | | | | 13.39% | | | | 5.79% | | | 3.97% |
Including contingent deferred sales charges | | | 21.59% | | | | 13.39% | | | | 5.79% | | | 3.97% |
|
Institutional Class (Commenced January 2, 1998) | | | 23.96% | | | | 14.69% | | | | 7.01% | | | 5.13% |
|
Service Class (Commenced January 2, 1998) | | | 23.28% | | | | 14.11% | | | | 6.47% | | | 4.63% |
|
Class IR (Commenced November 30, 2007) | | | 23.77% | | | | 14.54% | | | | N/A | | | 1.85% |
|
Class R (Commenced November 30, 2007) | | | 23.17% | | | | 14.04% | | | | N/A | | | 1.41% |
|
21
FUND BASICS
Growth and Income Strategy
as of December 31, 2013
| | | | | | | | | | |
| | PERFORMANCE REVIEW | |
| | | January 1, 2013–December 31, 2013 | | Portfolio Total Return (based on NAV)1 | | | Growth and Income Strategy Composite Index2 | |
| | Class A | | | 13.10 | % | | | 13.23 | % |
| | Class B | | | 12.26 | | | | 13.23 | |
| | Class C | | | 12.32 | | | | 13.23 | |
| | Institutional | | | 13.63 | | | | 13.23 | |
| | Service | | | 13.08 | | | | 13.23 | |
| | Class IR | | | 13.36 | | | | 13.23 | |
| | | Class R | | | 12.76 | | | | 13.23 | |
| | 1 | | The net asset value (“NAV”) represents the net assets of the class of the Portfolio (ex-dividend) divided by the total number of shares of the class outstanding. The Portfolio’s performance assumes the reinvestment of dividends and other distributions. The Portfolio’s performance does not reflect the deduction of any applicable sales charges. |
| | 2 | | The Growth and Income Strategy Composite (“Growth and Income Composite”) is comprised of a blend of the Barclays Global Aggregate Bond Index (hedged to U.S. dollars) (40%) and the MSCI All Country World Index (unhedged) (the “MSCI ACWI Index”) (60%). The Growth and Income Composite figures do not reflect any deduction for fees, expenses or taxes. The Barclays Global Aggregate Bond Index hedged to the U.S. dollar, is an unmanaged index, provides a broad-based measure of the global investment-grade fixed-rate debt markets and covers the most liquid portion of the global investment grade fixed-rate bond market, including government, credit and collateralized securities. The Index figures do not include any deduction for fees, expenses or taxes. It is not possible to invest directly in an unmanaged index. The MSCI ACWI Index is a free float-adjusted market capitalization weighted index that is designed to measure the equity market performance of developed and emerging markets. The MSCI ACWI consists of 45 country indices comprising 24 developed and 21 emerging market country indices. The developed market country indices included are: Australia, Austria, Belgium, Canada, Denmark, Finland, France, Germany, Greece, Hong Kong, Ireland, Israel, Italy, Japan, Netherlands, New Zealand, Norway, Portugal, Singapore, Spain, Sweden, Switzerland, the United Kingdom and the United States. The emerging market country indices are: Brazil, Chile, China, Colombia, Czech Republic, Egypt, Hungary, India, Indonesia, Korea, Malaysia, Mexico, Morocco, Peru, Philippines, Poland, Russia, South Africa, Taiwan, Thailand, and Turkey. The Index figures do not include any deduction for fees, expenses or taxes. It is not possible to invest directly in an unmanaged index. |
The returns set forth in the table above represent past performance. Past performance does not guarantee future results. The Portfolio’s investment return and principal value will fluctuate so that an investor’s shares, when redeemed, may be worth more or less than their original cost. Current performance may be lower or higher than the performance quoted above. Please visit our web site at www.GSAMFUNDS.com to obtain the most recent month-end returns. Performance reflects fee waivers and/or expense limitations in effect. In their absence, performance would be reduced. Returns do not reflect the deduction of taxes that a shareholder would pay on Portfolio distributions or the redemption of Portfolio shares.
22
FUND BASICS
| | | | | | | | | | | | | | |
| | STANDARDIZED TOTAL RETURNS3 |
| | | For the period ended 12/31/13 | | One Year | | | Five Years | | Ten Years | | Since Inception | | Inception Date |
| | Class A | | | 6.86 | % | | 9.96% | | 5.06% | | 4.56% | | 1/2/98 |
| | Class B | | | 7.17 | | | 10.06 | | 5.02 | | 4.53 | | 1/2/98 |
| | Class C | | | 11.30 | | | 10.38 | | 4.87 | | 4.14 | | 1/2/98 |
| | Institutional | | | 13.63 | | | 11.64 | | 6.07 | | 5.35 | | 1/2/98 |
| | Service | | | 13.08 | | | 11.09 | | 5.55 | | 4.82 | | 1/2/98 |
| | Class IR | | | 13.36 | | | 11.44 | | N/A | | 2.50 | | 11/30/07 |
| | | Class R | | | 12.76 | | | 10.92 | | N/A | | 2.03 | | 11/30/07 |
| | 3 | | The Standardized Total Returns are average annual total returns as of the most recent calendar quarter-end. They assume reinvestment of all distributions at NAV. These returns reflect a maximum initial sales charge of 5.5% for Class A Shares and the assumed contingent deferred sales charge for Class B Shares (5% maximum declining to 0% after six years) and the assumed contingent deferred sales charge for Class C Shares (1% if redeemed within 12 months of purchase). Because Institutional, Service, Class IR and Class R Shares do not involve a sales charge, such a charge is not applied to their Standardized Total Returns. The Portfolio’s Class B Shares are no longer available for purchase by new or existing shareholders (although current Class B shareholders may continue to reinvest income and capital gains distributions into Class B Shares, and Class B shareholders may continue to exchange their shares for Class B Shares of certain other Goldman Sachs Funds). |
The returns set forth in the table above represent past performance. Past performance does not guarantee future results. The Portfolio’s investment return and principal value will fluctuate so that an investor’s shares, when redeemed, may be worth more or less than their original cost. Current performance may be lower or higher than the performance quoted above. Please visit our web site at www.GSAMFUNDS.com to obtain the most recent month-end returns. Performance reflects applicable fee waivers and/or expense limitations in effect during the periods shown. In their absence, performance would be reduced. Returns do not reflect the deduction of taxes that a shareholder would pay on Portfolio distributions or the redemption of Portfolio shares.
| | | | | | | | | | |
| | EXPENSE RATIOS4 | |
| | | | | Net Expense Ratio (Current) | | | Gross Expense Ratio (Before Waivers) | |
| | Class A | | | 1.31 | % | | | 1.35 | % |
| | Class B | | | 2.07 | | | | 2.10 | |
| | Class C | | | 2.06 | | | | 2.10 | |
| | Institutional | | | 0.91 | | | | 0.94 | |
| | Service | | | 1.41 | | | | 1.45 | |
| | Class IR | | | 1.06 | | | | 1.10 | |
| | | Class R | | | 1.56 | | | | 1.60 | |
| | 4 | | The expense ratios of the Portfolio, both current (net of applicable fee waivers and/or expense limitations) and before waivers (gross of applicable fee waivers and/or expense limitations) are as set forth above according to the most recent publicly available Prospectus for the Portfolio and will differ from the expense ratios disclosed in the Financial Highlights in this report due to the inclusion of Underlying Fund fees and expenses, which are not included in the operating expenses of the Portfolio reflected in the Financial Highlights. The Portfolio’s waivers and/or expense limitations will remain in place through at least April 30, 2014, and prior to such date the Investment Adviser may not terminate the arrangements without the approval of the Portfolio’s Board of Trustees. If these arrangements are discontinued in the future, the expense ratios may change without shareholder approval. |
23
FUND BASICS
| | 5 | | The tactical fund weightings are set at the beginning of each calendar quarter. The weighting in the chart above reflects the allocations from September 30, 2013 to December 31, 2013. Actual Fund weighting in the Asset Allocation Portfolios may differ from the figures shown above due to rounding, differences in returns of the Underlying Funds, or both. The above figures are not indicative of future allocations. |
| | 6 | | Strategic allocation is the process of determining the areas of the global markets in which to invest, and in what long-term proportion, for each Fund. Our global approach attempts to generate strong long-term returns across geographies and asset classes, and is determined through a careful review of market opportunities and risk/return tradeoffs. It is rebalanced annually. On a quarterly basis, we shift assets around the strategic allocation, over and under-weighting asset classes and countries relative to the neutral starting point, seeking to benefit from changing short-term conditions in global capital markets. This is called tactical asset allocation. |
| | 7 | | Effective May 3, 2013, the Goldman Sachs Structured International Equity, Structured Large Cap Growth, Structured Large Cap Value, Structured Emerging Markets Equity, Structured Small Cap Equity and Structured International Small Cap Funds were renamed to the Goldman Sachs International Equity Insights, Large Cap Growth Insights, Large Cap Value Insights, Emerging Markets Equity Insights, Small Cap Equity Insights and International Small Cap Insights Funds, respectively. |
24
FUND BASICS
|
| OVERALL UNDERLYING FUND WEIGHTINGS8 |
| Percentage of Net Assets |
| | 8 | | The Portfolio is actively managed and, as such, its composition may differ over time. The percentage shown for each underlying fund reflects the value of that underlying fund as a percentage of net assets of the Portfolio. Short-term investments represent repurchase agreements. Figures in the above graph may not sum to 100% due to rounding and/or the exclusion of other assets and liabilities. |
| | 9 | | Effective May 3, 2013, the Goldman Sachs Structured International Equity, Structured Large Cap Growth, Structured Large Cap Value, Structured Emerging Markets Equity, Structured Small Cap Equity and Structured International Small Cap Funds were renamed to the Goldman Sachs International Equity Insights, Large Cap Growth Insights, Large Cap Value Insights, Emerging Markets Equity Insights, Small Cap Equity Insights and International Small Cap Insights Funds, respectively. |
25
GOLDMAN SACHS GROWTH AND INCOME STRATEGY PORTFOLIO
Performance Summary
December 31, 2013
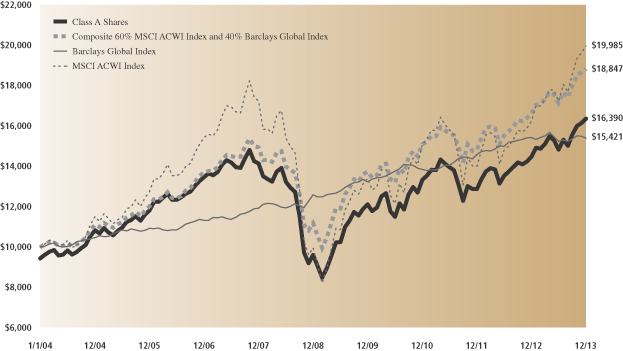
The following graph shows the value, as of December 31, 2013, of a $10,000 investment made on January 1, 2004 in Class A Shares (with the maximum sales charge of 5.5%). For comparative purposes, the performance of the Portfolio’s benchmarks, the Composite 60% MSCI All Country World Index (unhedged) and 40% Barclays Global Aggregate Bond Index (hedged to USD), the Barclays Global Aggregate Bond Index (hedged to USD) (the “Barclays Global Index”) and the MSCI All Country World Index (unhedged) (“MSCI ACWI Index”) (each with dividends reinvested), are shown. This performance data represents past performance and should not be considered indicative of future performance, which will fluctuate with changes in market conditions. These performance fluctuations will cause an investor’s shares, when redeemed, to be worth more or less than their original cost. Performance reflects applicable fee waivers and/or expense limitations currently in effect during the periods shown and in their absence, performance would be reduced. Returns do not reflect the deduction of taxes that a shareholder would pay on Portfolio distributions or the redemption of Portfolio shares. Performance of Class B, Class C, Institutional, Service, Class IR and Class R Shares will vary from Class A Shares due to differences in class specific fees and any applicable sales charges. In addition to the Investment Adviser’s decisions regarding underlying mutual fund selection and allocations among them, other factors may affect Portfolio performance. These factors include, but are not limited to, Portfolio operating fees and expenses, portfolio turnover and subscription and redemption cash flows affecting the Portfolio.
|
| Growth and Income Strategy Portfolio’s 10 Year Performance |
Performance of a $10,000 investment, with distributions reinvested, from January 1, 2004 through December 31, 2013.
| | | | | | | | | | | | | | |
| Average Annual Total Return through December 31, 2013 | | | One Year | | | | Five Years | | | | Ten Years | | | Since Inception |
Class A (Commenced January 2, 1998) | | | | | | | | | | | | | | |
Excluding sales charges | | | 13.10% | | | | 11.21% | | | | 5.66% | | | 4.93% |
Including sales charges | | | 6.86% | | | | 9.96% | | | | 5.06% | | | 4.56% |
|
Class B (Commenced January 2, 1998) | | | | | | | | | | | | | | |
Excluding contingent deferred sales charges | | | 12.26% | | | | 10.36% | | | | 5.02% | | | 4.53% |
Including contingent deferred sales charges | | | 7.17% | | | | 10.06% | | | | 5.02% | | | 4.53% |
|
Class C (Commenced January 2, 1998) | | | | | | | | | | | | | | |
Excluding contingent deferred sales charges | | | 12.32% | | | | 10.38% | | | | 4.87% | | | 4.14% |
Including contingent deferred sales charges | | | 11.30% | | | | 10.38% | | | | 4.87% | | | 4.14% |
|
Institutional Class (Commenced January 2, 1998) | | | 13.63% | | | | 11.64% | | | | 6.07% | | | 5.35% |
|
Service Class (Commenced January 2, 1998) | | | 13.08% | | | | 11.09% | | | | 5.55% | | | 4.82% |
|
Class IR (Commenced November 30, 2007) | | | 13.36% | | | | 11.44% | | | | N/A | | | 2.50% |
|
Class R (Commenced November 30, 2007) | | | 12.76% | | | | 10.92% | | | | N/A | | | 2.03% |
|
26
FUND BASICS
Growth Strategy
as of December 31, 2013
| | | | | | | | | | |
| | PERFORMANCE REVIEW | | | | | | | | |
| | | January 1, 2013–December 31, 2013 | | Portfolio Total Return
(based on NAV)1 | | | Growth Strategy
Composite Index2 | |
| | Class A | | | 18.31 | % | | | 17.95 | % |
| | Class B | | | 17.44 | | | | 17.95 | |
| | Class C | | | 17.37 | | | | 17.95 | |
| | Institutional | | | 18.81 | | | | 17.95 | |
| | Service | | | 18.19 | | | | 17.95 | |
| | Class IR | | | 18.65 | | | | 17.95 | |
| | | Class R | | | 17.93 | | | | 17.95 | |
| | 1 | | The net asset value (“NAV”) represents the net assets of the class of the Portfolio (ex-dividend) divided by the total number of shares of the class outstanding. The Portfolio’s performance assumes the reinvestment of dividends and other distributions. The Portfolio’s performance does not reflect the deduction of any applicable sales charges. |
| | 2 | | The Growth Strategy Composite Index (“Growth Strategy Composite”) is comprised of a blend of the Barclays Global Aggregate Bond Index (hedged to U.S. dollars) (20%) and the MSCI All Country World Index (unhedged) (the “MSCI ACWI Index”) (80%). The Growth Strategy Composite figures do not reflect any deduction for fees, expenses or taxes. The Barclays Global Aggregate Bond Index hedged to the U.S. dollar, is an unmanaged index, provides a broad-based measure of the global investment-grade fixed-rate debt markets and covers the most liquid portion of the global investment grade fixed-rate bond market, including government, credit and collateralized securities. The Index figures do not include any deduction for fees, expenses or taxes. It is not possible to invest directly in an unmanaged index. The MSCI ACWI Index is a free float-adjusted market capitalization weighted index that is designed to measure the equity market performance of developed and emerging markets. The MSCI ACWI Index consists of 45 country indices comprising 24 developed and 21 emerging market country indices. The developed market country indices included are: Australia, Austria, Belgium, Canada, Denmark, Finland, France, Germany, Greece, Hong Kong, Ireland, Israel, Italy, Japan, Netherlands, New Zealand, Norway, Portugal, Singapore, Spain, Sweden, Switzerland, the United Kingdom and the United States. The emerging market country indices are: Brazil, Chile, China, Colombia, Czech Republic, Egypt, Hungary, India, Indonesia, Korea, Malaysia, Mexico, Morocco, Peru, Philippines, Poland, Russia, South Africa, Taiwan, Thailand, and Turkey. The Index figures do not include any deduction for fees, expenses or taxes. It is not possible to invest directly in an unmanaged index. |
The returns set forth in the table above represent past performance. Past performance does not guarantee future results. The Portfolio’s investment return and principal value will fluctuate so that an investor’s shares, when redeemed, may be worth more or less than their original cost. Current performance may be lower or higher than the performance quoted above. Please visit our web site at www.GSAMFUNDS.com to obtain the most recent month-end returns. Performance reflects fee waivers and/or expense limitations in effect. In their absence, performance would be reduced. Returns do not reflect the deduction of taxes that a shareholder would pay on Portfolio distributions or the redemption of Portfolio shares.
27
FUND BASICS
| | | | | | | | | | | | | | |
| | STANDARDIZED TOTAL RETURNS3 |
| | | For the period ended 12/31/13 | | One Year | | | Five Years | | Ten Years | | Since Inception | | Inception Date |
| | Class A | | | 11.83 | % | | 11.49% | | 5.22% | | 4.20% | | 1/2/98 |
| | Class B | | | 12.41 | | | 11.65 | | 5.16 | | 4.18 | | 1/2/98 |
| | Class C | | | 16.37 | | | 11.93 | | 5.03 | | 3.80 | | 1/2/98 |
| | Institutional | | | 18.81 | | | 13.21 | | 6.24 | | 4.98 | | 1/2/98 |
| | Service | | | 18.19 | | | 12.65 | | 5.70 | | 4.46 | | 1/2/98 |
| | Class IR | | | 18.65 | | | 13.06 | | N/A | | 1.71 | | 11/30/07 |
| | | Class R | | | 17.93 | | | 12.48 | | N/A | | 1.21 | | 11/30/07 |
| | 3 | | The Standardized Total Returns are average annual total returns as of the most recent calendar quarter-end. They assume reinvestment of all distributions at NAV. These returns reflect a maximum initial sales charge of 5.5% for Class A Shares and the assumed contingent deferred sales charge for Class B Shares (5% maximum declining to 0% after six years) and the assumed contingent deferred sales charge for Class C Shares (1% if redeemed within 12 months of purchase). Because Institutional, Service, Class IR and Class R Shares do not involve a sales charge, such a charge is not applied to their Standardized Total Returns. The Portfolio’s Class B Shares are no longer available for purchase by new or existing shareholders (although current Class B shareholders may continue to reinvest income and capital gains distributions into Class B Shares, and Class B shareholders may continue to exchange their shares for Class B Shares of certain other Goldman Sachs Funds). |
The returns represent past performance. Past performance does not guarantee future results. The Portfolio’s investment return and principal value will fluctuate so that an investor’s shares, when redeemed, may be worth more or less than their original cost. Current performance may be lower or higher than the performance quoted above. Please visit our web site at www.GSAMFUNDS.com to obtain the most recent month-end returns. Performance reflects applicable fee waivers and/or expense limitations in effect during the periods shown. In their absence, performance would be reduced. Returns do not reflect the deduction of taxes that a shareholder would pay on Portfolio distributions or the redemption of Portfolio shares.
| | | | | | | | | | |
| | EXPENSE RATIOS4 | |
| | | | | Net Expense Ratio (Current) | | | Gross Expense Ratio (Before Waivers) | |
| | Class A | | | 1.35 | % | | | 1.40 | % |
| | Class B | | | 2.10 | | | | 2.15 | |
| | Class C | | | 2.10 | | | | 2.15 | |
| | Institutional | | | 0.95 | | | | 0.99 | |
| | Service | | | 1.45 | | | | 1.50 | |
| | Class IR | | | 1.10 | | | | 1.14 | |
| | | Class R | | | 1.60 | | | | 1.64 | |
| | 4 | | The expense ratios of the Portfolio, both current (net of applicable fee waivers and/or expense limitations) and before waivers (gross of applicable fee waivers and/or expense limitations) are as set forth above according to the most recent publicly available Prospectus for the Portfolio and will differ from the expense ratios disclosed in the Financial Highlights in this report due to the inclusion of Underlying Fund fees and expenses, which are not included in the operating expenses of the Portfolio reflected in the Financial Highlights. The Portfolio’s waivers and/or expense limitations will remain in place through at least April 30, 2014, and prior to such date the Investment Adviser may not terminate the arrangements without the approval of the Portfolio’s Board of Trustees. If these arrangements are discontinued in the future, the expense ratios may change without shareholder approval. |
28
FUND BASICS
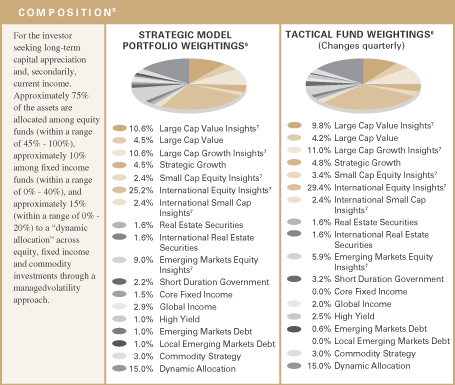
| | 5 | | The tactical fund weightings are set at the beginning of each calendar quarter. The weighting in the chart above reflects the allocations from September 30, 2013 to December 31, 2013. Actual Fund weighting in the Asset Allocation Portfolios may differ from the figures shown above due to rounding, differences in returns of the Underlying Funds, or both. The above figures are not indicative of future allocations. |
| | 6 | | Strategic allocation is the process of determining the areas of the global markets in which to invest, and in what long-term proportion, for each Fund. Our global approach attempts to generate strong long-term returns across geographies and asset classes, and is determined through a careful review of market opportunities and risk/return tradeoffs. It is rebalanced annually. On a quarterly basis, we shift assets around the strategic allocation, over and under-weighting asset classes and countries relative to the neutral starting point, seeking to benefit from changing short-term conditions in global capital markets. This is called tactical asset allocation. |
| | 7 | | Effective May 3, 2013, the Goldman Sachs Structured International Equity, Structured Large Cap Growth, Structured Large Cap Value, Structured Emerging Markets Equity, Structured Small Cap Equity and Structured International Small Cap Funds were renamed to the Goldman Sachs International Equity Insights, Large Cap Growth Insights, Large Cap Value Insights, Emerging Markets Equity Insights, Small Cap Equity Insights and International Small Cap Insights Funds, respectively. |
29
FUND BASICS
|
| OVERALL UNDERLYING FUND WEIGHTINGS8 |
| Percentage of Net Assets |
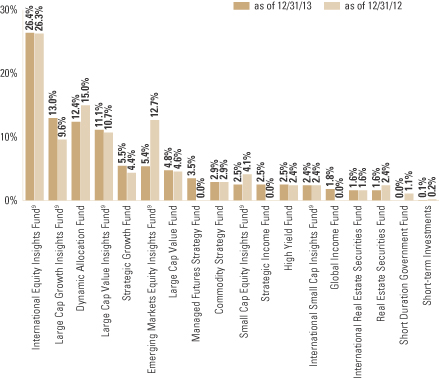
| | 8 | | The Portfolio is actively managed and, as such, its composition may differ over time. The percentage shown for each underlying fund reflects the value of that underlying fund as a percentage of net assets of the Portfolio. Short-term investments represent repurchase agreements. Figures in the above graph may not sum to 100% due to rounding and/or the exclusion of other assets and liabilities. |
| | 9 | | Effective May 3, 2013, the Goldman Sachs Structured International Equity, Structured Large Cap Growth, Structured Large Cap Value, Structured Emerging Markets Equity, Structured Small Cap Equity and Structured International Small Cap Funds were renamed to the Goldman Sachs International Equity Insights, Large Cap Growth Insights, Large Cap Value Insights, Emerging Markets Equity Insights, Small Cap Equity Insights and International Small Cap Insights Funds, respectively. |
30
GOLDMAN SACHS GROWTH STRATEGY PORTFOLIO
Performance Summary
December 31, 2013
The following graph shows the value, as of December 31, 2013, of a $10,000 investment made on January 1, 2004 in Class A Shares (with the maximum sales charge of 5.5%). For comparative purposes, the performance of the Portfolio’s benchmarks, the Composite 80% MSCI All Country World Index (unhedged) and 20% Barclays Global Aggregate Bond Index (hedged), the Barclays Global Aggregate Bond Index (hedged to USD) (the “Barclays Global Index”) and the MSCI All Country World Index (unhedged) (“MSCI ACWI Index”) (each with dividends reinvested), are shown. This performance data represents past performance and should not be considered indicative of future performance, which will fluctuate with changes in market conditions. These performance fluctuations will cause an investor’s shares, when redeemed, to be worth more or less than their original cost. Performance reflects applicable fee waivers and/or expense limitations currently in effect during the periods shown and in their absence, performance would be reduced. Returns do not reflect the deduction of taxes that a shareholder would pay on Portfolio distributions or the redemption of Portfolio shares. Performance of Class B, Class C, Institutional, Service, Class IR and Class R Shares will vary from Class A Shares due to differences in class specific fees and any applicable sales charges. In addition to the Investment Adviser’s decisions regarding underlying mutual fund selection and allocations among them, other factors may affect Portfolio performance. These factors include, but are not limited to, Portfolio operating fees and expenses, portfolio turnover and subscription and redemption cash flows affecting the Portfolio.
|
| Growth Strategy Portfolio’s 10 Year Performance |
Performance of a $10,000 investment, with distributions reinvested, from January 1, 2004 through December 31, 2013.
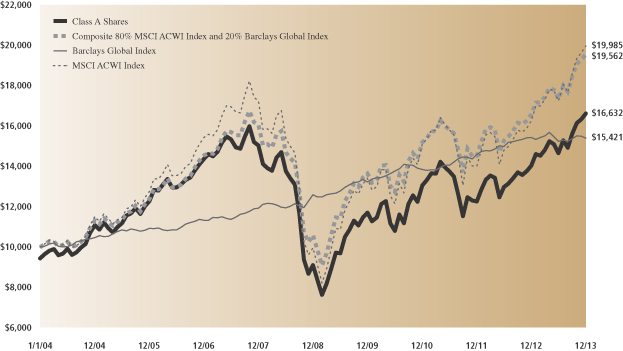
| | | | | | | | | | | | | | |
| Average Annual Total Return through December 31, 2013 | | | One Year | | | | Five Years | | | | Ten Years | | | Since Inception |
Class A (Commenced January 2, 1998) | | | | | | | | | | | | | | |
Excluding sales charges | | | 18.31% | | | | 12.76% | | | | 5.81% | | | 4.57% |
Including sales charges | | | 11.83% | | | | 11.49% | | | | 5.22% | | | 4.20% |
|
Class B (Commenced January 2, 1998) | | | | | | | | | | | | | | |
Excluding contingent deferred sales charges | | | 17.44% | | | | 11.92% | | | | 5.16% | | | 4.18% |
Including contingent deferred sales charges | | | 12.41% | | | | 11.65% | | | | 5.16% | | | 4.18% |
|
Class C (Commenced January 2, 1998) | | | | | | | | | | | | | | |
Excluding contingent deferred sales charges | | | 17.37% | | | | 11.93% | | | | 5.03% | | | 3.80% |
Including contingent deferred sales charges | | | 16.37% | | | | 11.93% | | | | 5.03% | | | 3.80% |
|
Institutional Class (Commenced January 2, 1998) | | | 18.81% | | | | 13.21% | | | | 6.24% | | | 4.98% |
|
Service Class (Commenced January 2, 1998) | | | 18.19% | | | | 12.65% | | | | 5.70% | | | 4.46% |
|
Class IR (Commenced November 30, 2007) | | | 18.65% | | | | 13.06% | | | | N/A | | | 1.71% |
|
Class R (Commenced November 30, 2007) | | | 17.93% | | | | 12.48% | | | | N/A | | | 1.21% |
|
31
PORTFOLIO RESULTS
Fund of Funds Portfolios – Income Strategies Portfolio
Investment Process and Principal Strategy
The Portfolio seeks to achieve its investment objective by investing in a combination of underlying funds that currently exist or that may become available for investment in the future for which Goldman Sachs Asset Management (“GSAM”) or an affiliate, now or in the future, acts as investment adviser or principal underwriter (the “underlying funds”). Some of the Portfolios’ underlying funds invest primarily in fixed income or money market instruments, and some invest primarily in equity securities.
The Portfolio invests assets in a strategic mix of underlying funds, which the investment adviser considers to be invested in income-producing satellite asset classes. Satellite asset classes are those that may have lower correlations to traditional market exposures such as large cap equities and may have more attractive risk-return characteristics. The investment adviser allows strategic targets to shift with their respective market returns but continues to adjust tactical tilts on a quarterly basis to reflect the investment adviser’s latest views. The investment adviser adjusts the overall asset allocation of the Portfolio based on current market conditions and the investment adviser’s economic and market forecasts.
Portfolio Management Discussion and Analysis
Below, the Goldman Sachs Quantitative Investment Strategies Team discusses the Goldman Sachs Income Strategies Portfolio’s (the “Portfolio”) performance and positioning for the 12-month period ended December 31, 2013 (the “Reporting Period”).
| Q | | How did the Portfolio perform during the Reporting Period? |
| A | | During the Reporting Period, the Portfolio’s Class A, C, Institutional, IR and R Shares generated average annual total returns of -0.11%, -0.86%, 0.18%, 0.03% and -0.36%, respectively. This compares to the 10.04% average annual total return of the Portfolio’s blended benchmark, which is comprised 60% of the Barclays Global Aggregate Bond Index (hedged to U.S. dollars) (“Barclays Global Index”) and 40% of the MSCI World Index (net, unhedged), during the same period. |
| | The components of the Portfolio’s blended benchmark, the Barclays Global Index and the MSCI World Index, generated average annual total returns of -0.14% and 22.80%, respectively, during the same period. |
| Q | | How did the various income-producing satellite asset classes perform during the Reporting Period? |
| A | | During the first quarter of 2013, income-producing satellite asset classes, with the exception of emerging markets debt, generated positive performance in response to global economic stimulus measures. However, in the second calendar quarter, income-producing satellite asset classes largely retreated on the heels of Federal Reserve (“Fed”) Chairman Ben Bernanke’s Congressional testimony on May 22nd and his subsequent tapering language at the Fed meeting on June 19th. In addition, heightened volatility across equity and fixed income markets coincided with a sell-off in riskier asset classes globally, particularly in the emerging markets. In the third and fourth quarters of 2013, satellite asset classes posted gains on the heels of positive U.S. economic data and sentiment that potential Fed tapering was a sign of confidence in the economy. For the Reporting Period overall, high yield bonds, international real estate securities and U.S. real estate securities performed well. Local emerging markets debt and U.S. dollar denominated emerging markets debt were down 9.0% and 5.3%, respectively, during the Reporting Period. |
| Q | | What key factors affected the Portfolio’s performance during the Reporting Period? |
| A | | The Portfolio underperformed its blended benchmark during the Reporting Period, largely because of the negative performance overall of its underlying funds. The Portfolio’s position through the underlying funds in income-generating, satellite asset classes, coupled with its lack of exposure to the strongly performing U.S. equity markets, detracted from performance. The Portfolio’s significant allocations through |
32
PORTFOLIO RESULTS
| | the underlying funds to local emerging markets debt (through which the Portfolio gains exposure to local currencies) and U.S. dollar denominated emerging markets debt also dampened returns. That said, in keeping with our investment approach, we dynamically adjusted Portfolio weights to ensure that overall risk and individual underlying fund contributions to risk remained within the ranges we feel are appropriate for a diversified income-producing satellite portfolio. |
| Q | | How did the Portfolio’s underlying funds perform relative to their respective benchmark indices during the Reporting Period? |
| A | | Of the Portfolio’s underlying funds, the Goldman Sachs Local Emerging Markets Debt Fund and the Goldman Sachs Emerging Markets Debt Fund underperformed their respective benchmark indices. The Goldman Sachs High Yield Fund, the Goldman Sachs Real Estate Securities Fund and the Goldman Sachs International Real Securities Fund outperformed their respective benchmark indices. |
| Q | | How did the Portfolio use derivatives and similar instruments during the Reporting Period? |
| A | | The Portfolio does not directly invest in derivatives. However, some of the underlying funds used derivatives during the Reporting Period to apply their active investment views with greater versatility and to afford greater risk management precision. As market conditions warranted during the Reporting Period, some of these underlying funds engaged in forward foreign currency exchange contracts, financial futures contracts, options, swap contracts and structured securities to enhance portfolio return and for hedging purposes. |
| Q | | What changes did you make during the Reporting Period within both the equity and fixed income portions of the Portfolio? |
| A | | In January 2013, through the Portfolio’s underlying funds, we reduced the Portfolio’s exposure to high yield bonds, U.S. real estate securities and international real estate securities, reallocating the proceeds to emerging markets debt and local emerging markets debt. In February and March 2013, contributions to portfolio risk from the underlying asset classes remained in line with our objectives, and the Portfolio’s underlying fund exposures were maintained. During both the second and third quarters of 2013, we reduced the Portfolio’s exposure through the underlying funds to high yield bonds and emerging markets debt, reallocating the proceeds to U.S. and international real estate securities. During the fourth quarter of 2013, we reduced the Portfolio’s exposures to high yield bonds and U.S. real estate securities, reallocating the proceeds to emerging markets debt and international real estate securities. |
| Q | | What is the Portfolio’s tactical view and strategy for the months ahead? |
| A | | We manage the Portfolio using a dynamic, risk-responsive rebalancing process. Using our sophisticated, proprietary risk models, we evaluate the overall risk of the Portfolio each month as well as the portion of risk contributed by each individual asset class. |
| | At the end of the Reporting Period, through its underlying funds, the Portfolio had larger allocations than it did at the beginning of the Reporting Period to local emerging markets debt, commodities, U.S. real estate securities and international real estate securities. It had reduced exposure to high yield bonds, high yield floating rate securities and U.S. dollar denominated emerging markets debt. |
| | We will continue to monitor risk on a monthly basis and adjust our allocation to the income-producing satellite asset classes as the underlying funds drift beyond our longer-term risk-related guidelines. |
33
FUND BASICS
Income Strategies
as of December 31, 2013
| | | | | | | | | | |
| | PERFORMANCE REVIEW | | | | | | | | |
| | | January 1, 2013– December 31, 2013 | | Portfolio Total Return
(based on NAV)1 | | | Income Strategies
Composite Index2 | |
| | Class A | | | -0.11 | % | | | 10.04 | % |
| | Class C | | | -0.86 | | | | 10.04 | |
| | Institutional | | | 0.18 | | | | 10.04 | |
| | Class IR | | | 0.03 | | | | 10.04 | |
| | | Class R | | | -0.36 | | | | 10.04 | |
| | 1 | | The net asset value (“NAV”) represents the net assets of the class of the Portfolio (ex-dividend) divided by the total number of shares of the class outstanding. The Portfolio’s performance assumes the reinvestment of dividends and other distributions. The Portfolio’s performance does not reflect the deduction of any applicable sales charges. |
| | 2 | | The Income Strategies Composite Index (“Income Strategies Composite”) is comprised of a blend of the Barclays Global Aggregate Bond Index (hedged to U.S. dollars) (60%) and the MSCI World Index (40%). The Income Strategies Composite figures do not reflect any deduction for fees, expenses or taxes. The Barclays Global Aggregate Bond Index hedged to the U.S. dollar, is an unmanaged index, provides a broad-based measure of the global investment-grade fixed-rate debt markets and covers the most liquid portion of the global investment grade fixed-rate bond market, including government, credit and collateralized securities. The Index figures do not include any deduction for fees, expenses or taxes. It is not possible to invest directly in an unmanaged index. The MSCI ACWI Index is a free float-adjusted market capitalization weighted index that is designed to measure the equity market performance of developed and emerging markets. The MSCI ACWI Index consists of 45 country indices comprising 24 developed and 21 emerging market country indices. The developed market country indices included are: Australia, Austria, Belgium, Canada, Denmark, Finland, France, Germany, Greece, Hong Kong, Ireland, Israel, Italy, Japan, Netherlands, New Zealand, Norway, Portugal, Singapore, Spain, Sweden, Switzerland, the United Kingdom and the United States. The emerging market country indices are: Brazil, Chile, China, Colombia, Czech Republic, Egypt, Hungary, India, Indonesia, Korea, Malaysia, Mexico, Morocco, Peru, Philippines, Poland, Russia, South Africa, Taiwan, Thailand, and Turkey. The Index figures do not include any deduction for fees, expenses or taxes. It is not possible to invest directly in an unmanaged index. |
The returns set forth in the table above represent past performance. Past performance does not guarantee future results. The Portfolio’s investment return and principal value will fluctuate so that an investor’s shares, when redeemed, may be worth more or less than their original cost. Current performance may be lower or higher than the performance quoted above. Please visit our web site at www.GSAMFUNDS.com to obtain the most recent month-end returns. Performance reflects fee waivers and/or expense limitations in effect. In their absence, performance would be reduced. Returns do not reflect the deduction of taxes that a shareholder would pay on Portfolio distributions or the redemption of Portfolio shares.
34
FUND BASICS
| | | | | | | | | | | | | | |
| | STANDARDIZED TOTAL RETURNS3 |
| | | For the period ended 12/31/13 | | One Year | | | Five Years | | | Since Inception | | Inception Date |
| | Class A | | | -5.62 | % | | | 8.69 | % | | 1.67% | | 3/30/07 |
| | Class C | | | -1.85 | | | | 9.09 | | | 1.74 | | 3/30/07 |
| | Institutional | | | 0.18 | | | | 10.30 | | | 2.88 | | 3/30/07 |
| | Class IR | | | 0.03 | | | | 10.18 | | | 2.76 | | 11/30/07 |
| | | Class R | | | -0.36 | | | | 9.64 | | | 2.29 | | 11/30/07 |
| | 3 | | The Standardized Total Returns are average annual total returns as of the most recent calendar quarter-end. They assume reinvestment of all distributions at NAV. These returns reflect a maximum initial sales charge of 5.5% for Class A Shares and the assumed contingent deferred sales charge for Class C Shares (1% if redeemed within 12 months of purchase). Because Institutional, Class IR and Class R Shares do not involve a sales charge, such a charge is not applied to their Standardized Total Returns. |
The returns set forth in the table above represent past performance. Past performance does not guarantee future results. The Portfolio’s investment return and principal value will fluctuate so that an investor’s shares, when redeemed, may be worth more or less than their original cost. Current performance may be lower or higher than the performance quoted above. Please visit our web site at www.GSAMFUNDS.com to obtain the most recent month-end returns. Performance reflects applicable fee waivers and/or expense limitations in effect during the periods shown. In their absence, performance would be reduced. Returns do not reflect the deduction of taxes that a shareholder would pay on Portfolio distributions or the redemption of Portfolio shares.
35
FUND BASICS
| | | | | | | | | | |
| | EXPENSE RATIOS4 | |
| | | | | Net Expense Ratio (Current) | | | Gross Expense Ratio (Before Waivers) | |
| | Class A | | | 1.36 | % | | | 2.02 | % |
| | Class C | | | 2.11 | | | | 2.78 | |
| | Institutional | | | 0.96 | | | | 1.59 | |
| | Class IR | | | 1.11 | | | | 1.79 | |
| | | Class R | | | 1.61 | | | | 2.30 | |
| | 4 | | The expense ratios of the Portfolio, both current (net of applicable fee waivers and/or expense limitations) and before waivers (gross of applicable fee waivers and/or expense limitations) are as set forth above according to the most recent publicly available Prospectus for the Portfolio and will differ from the expense ratios disclosed in the Financial Highlights in this report due to the inclusion of Underlying Fund fees and expenses, which are not included in the operating expenses of the Portfolio reflected in the Financial Highlights. The Portfolio’s waivers and/or expense limitations will remain in place through at least April 30, 2014, and prior to such date the Investment Adviser may not terminate the arrangements without the approval of the Portfolio’s Board of Trustees. If these arrangements are discontinued in the future, the expense ratios may change without shareholder approval. |
36
FUND BASICS
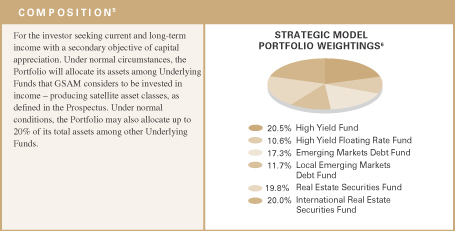
| | 5 | | The weighting in the chart above reflects the allocations from September 30, 2013 to December 31, 2013. Actual Fund weighting in the Asset Allocation Portfolios may differ from the figures shown above due to rounding, differences in returns of the Underlying Funds, or both. The above figures are not indicative of future allocations. |
| | 6 | | Strategic allocation is the process of determining the areas of the global markets in which to invest, and in what long-term proportion, for each Fund. Our global approach attempts to generate strong long-term returns across geographies and asset classes, and is determined through a careful review of market opportunities and risk/return tradeoffs. It is rebalanced annually. |
37
FUND BASICS
|
| OVERALL UNDERLYING FUND WEIGHTINGS7 |
| Percentage of Net Assets |
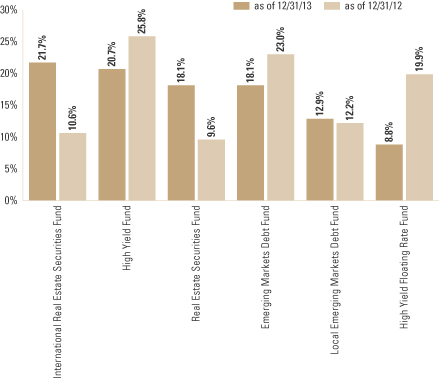
| | 7 | | The Portfolio is actively managed and, as such, its composition may differ over time. The percentage shown for each underlying fund reflects the value of that underlying fund as a percentage of net assets of the Portfolio. Figures in the above graph may not sum to 100% due to rounding and/or the exclusion of other assets and liabilities. |
38
GOLDMAN SACHS INCOME STRATEGIES PORTFOLIO
Performance Summary
December 31, 2013
The following graph shows the value, as of December 31, 2013, of a $10,000 investment made on March 30, 2007 (commencement of operations) in Class A Shares (with the maximum sales charge of 5.5%). For comparative purposes, the performance of the Portfolio’s benchmarks, the Composite 60% Barclays Global Aggregate Bond Index (hedged to USD) and 40% MSCI World Index (unhedged), the Barclays Global Aggregate Bond Index (hedged to USD) (the “Barclays Global Index”) and the MSCI World Index (unhedged) (“MSCI World Index”) (each with dividends reinvested), are shown. This performance data represents past performance and should not be considered indicative of future performance, which will fluctuate with changes in market conditions. These performance fluctuations will cause an investor’s shares, when redeemed, to be worth more or less than their original cost. Performance reflects applicable fee waivers and/or expense limitations currently in effect during the periods shown and in their absence, performance would be reduced. Returns do not reflect the deduction of taxes that a shareholder would pay on Portfolio distributions or the redemption of Portfolio shares. Performance of Class C, Institutional, Class IR and Class R Shares will vary from Class A Shares due to differences in class specific fees and any applicable sales charges. In addition to the Investment Adviser’s decisions regarding underlying mutual fund selection and allocations among them, other factors may affect Portfolio performance. These factors include, but are not limited to, Portfolio operating fees and expenses, portfolio turnover and subscription and redemption cash flows affecting the Portfolio.
|
| Income Strategies Portfolio’s Lifetime Performance |
Performance of a $10,000 investment, with distributions reinvested, from March 30, 2007 through December 31, 2013.
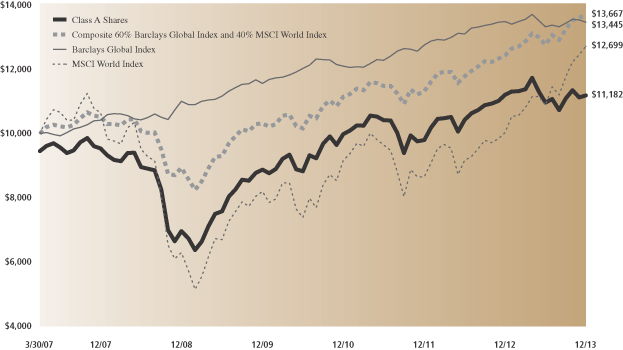
| | | | | | | | | | |
| Average Annual Total Return through December 31, 2013 | | | One Year | | | | Five Years | | | Since Inception |
Class A (Commenced March 30, 2007) | | | | | | | | | | |
Excluding sales charges | | | -0.11% | | | | 9.91% | | | 2.52% |
Including sales charges | | | -5.62% | | | | 8.69% | | | 1.67% |
|
Class C (Commenced March 30, 2007) | | | | | | | | | | |
Excluding contingent deferred sales charges | | | -0.86% | | | | 9.09% | | | 1.74% |
Including contingent deferred sales charges | | | -1.85% | | | | 9.09% | | | 1.74% |
|
Institutional Class (Commenced March 30, 2007) | | | 0.18% | | | | 10.30% | | | 2.88% |
|
Class IR (Commenced November 30, 2007) | | | 0.03% | | | | 10.18% | | | 2.76% |
|
Class R (Commenced November 30, 2007) | | | -0.36% | | | | 9.64% | | | 2.29% |
|
39
PORTFOLIO RESULTS
Fund of Funds Portfolios – Satellite
Strategies Portfolio
Investment Process and Principal Strategy
The Portfolio seeks to achieve its investment objective by investing in a combination of underlying funds that currently exist or that may become available for investment in the future for which Goldman Sachs Asset Management (“GSAM”) or an affiliate, now or in the future, acts as investment adviser or principal underwriter (the “underlying funds”). Some of the Portfolios’ underlying funds invest primarily in fixed income or money market instruments, and some invest primarily in equity securities.
The Portfolio invests assets in a strategic mix of underlying funds, which the investment adviser considers to be invested in income-producing satellite asset classes. Satellite asset classes are those that may have lower correlations to traditional market exposures such as large cap equities and may have more attractive risk-return characteristics. The investment adviser allows strategic targets to shift with their respective market returns but continues to adjust tactical tilts on a quarterly basis to reflect the investment adviser’s latest views. The investment adviser adjusts the overall asset allocation of the Portfolio based on current market conditions and the investment adviser’s economic and market forecasts.
Portfolio Management Discussion and Analysis
Below, the Goldman Sachs Quantitative Investment Strategies Team discusses the Goldman Sachs Satellite Strategies Portfolio’s (the “Portfolio”) performance and positioning for the 12-month period ended December 31, 2013 (the “Reporting Period”).
| Q | | How did the Portfolio perform during the Reporting Period? |
| A | | During the Reporting Period, the Portfolio’s Class A, C, Institutional, Service, IR and R Shares generated average annual total returns of 2.67%, 1.91%, 3.09%, 2.45%, 2.94% and 2.44%, respectively. This compares to the 15.12% average annual total return of the Fund’s blended benchmark, which is comprised 40% of the Barclays U.S. Aggregate Bond Index, 30% of the S&P® 500 Index and 30% of the MSCI EAFE Index, during the same period. |
| | The components of the blended benchmark, the Barclays U.S. Aggregate Bond Index, the S&P® 500 Index and the MSCI EAFE Index, generated average annual total returns of -2.02%, 32.39%, and 23.29%, respectively, during the same period. |
| Q | | How did the various satellite asset classes perform during the Reporting Period? |
| A | | During the first quarter of 2013, satellite asset classes, with the exception of emerging markets equities and emerging markets debt, generated positive performance in response to global economic stimulus measures. However, in the second calendar quarter, satellite asset classes largely retreated on the heels of Federal Reserve (“Fed”) Chairman Ben Bernanke’s Congressional testimony on May 22nd and his subsequent tapering language at the Fed meeting on June 19th. In addition, heightened volatility across equity and fixed income markets coincided with a sell-off in riskier asset classes globally, particularly in the emerging markets. In the third and fourth calendar quarters, satellite asset classes posted gains on positive U.S. economic data and sentiment that potential Fed tapering was a sign of confidence in the economy. For the Reporting Period overall, international small-cap stocks were stand-out performers, returning almost 30%. High yield bonds, international real estate securities and U.S. real estate securities performed well. Local emerging market debt and U.S. denominated emerging markets debt were down 9.0% and 5.3%, respectively, while emerging market equities and commodities were down 2.6% and 1.2%, respectively, for the Reporting Period. |
| Q | | What key factors affected the Portfolio’s performance during the Reporting Period? |
| A | | The Portfolio underperformed its blended benchmark during the Reporting Period, largely because of the negative performance overall of its underlying funds. The Portfolio’s position through the underlying funds in satellite asset classes, coupled with its lack of exposure to the strongly performing U.S. equity markets, detracted from performance. The |
40
PORTFOLIO RESULTS
| | Portfolio’s allocations through the underlying funds to U.S. dollar denominated emerging markets debt, local emerging markets debt, emerging markets equities and commodities also dampened returns. That said, in keeping with our investment approach, we dynamically adjusted Portfolio weights to ensure that overall risk and individual underlying fund contributions to risk remained within the ranges we feel are appropriate for a diversified satellite portfolio. |
| Q | | How did the Portfolio’s underlying funds perform relative to their respective benchmark indices during the Reporting Period? |
| A | | Overall, as mentioned earlier, the performance of the underlying funds detracted from the Portfolio’s performance. The Goldman Sachs High Yield Floating Rate Fund, the Goldman Sachs Local Emerging Markets Debt Fund and the Goldman Sachs Emerging Markets Debt Fund underperformed their benchmark indices the most. The Goldman Sachs International Small Cap Insights Fund, the Goldman Sachs International Small Cap Fund and the Goldman Sachs High Yield Fund outperformed most relative to their respective benchmark indices.e |
| Q | | How did the Portfolio use derivatives and similar instruments during the Reporting Period? |
| A | | The Portfolio does not directly invest in derivatives. However, some of the underlying funds used derivatives during the Reporting Period to apply their active investment views with greater versatility and to afford greater risk management precision. As market conditions warranted during the Reporting Period, some of these underlying funds engaged in forward foreign currency exchange contracts, financial futures contracts, options, swap contracts and structured securities to enhance portfolio return and for hedging purposes. |
| Q | | What changes did you make during the Reporting Period within both the equity and fixed income portions of the Portfolio? |
| A | | During January 2013, at the beginning of the Reporting Period, we rebalanced the Portfolio to maintain our target risk objectives in the Portfolio. The risk contributions of real estate securities had increased compared to other satellite asset classes in the Portfolio. In response, we reduced the Portfolio’s weightings in U.S. and international real estate |
| e | | Effective after the close of business on May 3, 2013, the Goldman Sachs Structured International Small Cap Fund was renamed the Goldman Sachs International Small Cap Insights Fund. |
| | securities while increasing its allocations to high yield bonds, emerging markets debt and commodities. |
| | In February and March 2013, contributions to portfolio risk from the underlying asset classes remained in line with our objectives. As a result, rebalancing trades were not required. Because of the reduced volatility of satellite asset classes compared to their longer-term averages, the Portfolio’s asset class weightings remained relatively stable. There were no outsized contributions to risk from any individual asset class or region. |
| | During April 2013, the risk contributions of high yield bonds and real estate securities had increased compared to other satellite asset classes in the Portfolio. In response, we reduced the Portfolio’s weightings in U.S. real estate securities, international real estate securities and high yield bonds while increasing its allocation to emerging markets equities. |
| | In May 2013, the risk contributions of fixed income had increased compared to other satellite asset classes in the Portfolio. In response, we reduced the Portfolio’s weighting in fixed income while increasing its allocations to emerging markets equities and international small-cap equities. |
| | In June and July 2013, the risk contributions of fixed income had increased compared to other satellite asset classes in the Portfolio. In response, we reduced the Portfolio’s weighting in fixed income while increasing its allocations to U.S. real estate securities, international small-cap equities and emerging markets equities. |
| | In August, September and October 2013, contributions to portfolio risk from the underlying asset classes remained in line with our objectives. As a result, rebalancing trades were not required. Because of the reduced volatility of satellite asset classes compared to their longer-term averages, the Portfolio’s asset class weightings remained relatively stable. There were no outsized contributions to risk from any individual asset class or region. |
| | In November 2013, we rebalanced the Portfolio to maintain our target risk objectives in the Portfolio. The risk contributions of emerging markets equities and international small cap equities had increased compared to other satellite asset classes in the Portfolio. In response, we reduced the Portfolio’s allocations to these asset classes while increasing its allocations to commodities, emerging markets debt and international real estate securities. |
41
PORTFOLIO RESULTS
| | In December 2013, contributions to portfolio risk from the underlying asset classes remained in line with our objectives. As a result, rebalancing trades were not required. Because of the reduced volatility of satellite asset classes compared to their longer-term averages, the Portfolio’s asset class weightings remained relatively stable. There were no outsized contributions to risk from any individual asset class or region. |
| Q | | What is the Portfolio’s tactical view and strategy for the months ahead? |
| A | | We manage the Portfolio using a dynamic, risk-responsive rebalancing process. Using our sophisticated, proprietary risk models, we evaluate the overall risk of the Portfolio each month as well as the portion of risk contributed by each individual asset class. |
| | At the end of the Reporting Period, through its underlying funds, the Portfolio had larger allocations than it did at the beginning of the Reporting Period to international small-cap equities, emerging markets equities, commodities and U.S. and international real estate securities. It had reduced exposure to high yield bonds, high yield floating rate securities, U.S. dollar denominated emerging markets debt and local emerging markets debt. |
| | We will continue to monitor risk on a monthly basis and adjust our allocation to the satellite asset classes as the underlying funds drift beyond our longer-term risk-related guidelines. |
42
FUND BASICS
Satellite Strategies Portfolio
as of December 31, 2013
| | | | | | | | | | |
| | PERFORMANCE REVIEW | | | | | | | | |
| | | January 1, 2013–December 31, 2013 | | Portfolio Total Return
(based on NAV)1 | | | Satellite Strategies
Composite Index2 | |
| | Class A | | | 2.67 | % | | | 15.12 | % |
| | Class C | | | 1.91 | | | | 15.12 | |
| | Institutional | | | 3.09 | | | | 15.12 | |
| | Service | | | 2.45 | | | | 15.12 | |
| | Class IR | | | 2.94 | | | | 15.12 | |
| | | Class R | | | 2.44 | | | | 15.12 | |
| | 1 | | The net asset value (“NAV”) represents the net assets of the class of the Portfolio (ex-dividend) divided by the total number of shares of the class outstanding. The Portfolio’s performance reflects the reinvestment of dividends and other distributions. The Portfolio’s performance does not reflect the deduction of any applicable sales charges. |
| | 2 | | The Satellite Strategies Composite Index (“Satellite Composite”) is a composite representation prepared by the investment adviser of the performance of the Portfolio’s asset classes weighted according to their respective weightings in the Portfolio’s target range. The Satellite Composite is comprised of the S&P 500 Index (30%), the MSCI EAFE Index (30%) and the Barclays U.S. Aggregate Bond Index (40%). The Satellite Composite figures do not reflect any deduction for fees, expenses or taxes. The Barclays U.S. Aggregate Bond Index represents an unmanaged diversified portfolio of fixed income securities, including U.S. Treasuries, investment-grade corporate bonds, and mortgage-backed and asset-backed securities. The S&P 500 Index is the Standard & Poor’s 500 Composite Index of 500 stocks, an unmanaged index of common stock prices. The unmanaged MSCI EAFE Index (unhedged) is a market capitalization weighted composite of securities in 22 developed markets. The Index figures do not include any deduction for fees, expenses or taxes. It is not possible to invest directly in an unmanaged index. |
| | | | | | | | | | | | |
| | STANDARDIZED TOTAL RETURNS3 | | |
| | | For the period ended 12/31/13 | | One Year | | | Five Years | | Since Inception | | Inception Date |
| | Class A | | | -3.00 | % | | 11.39% | | 0.69% | | 3/30/07 |
| | Class C | | | 0.89 | | | 11.82 | | 0.77 | | 3/30/07 |
| | Institutional | | | 3.09 | | | 13.10 | | 1.90 | | 3/30/07 |
| | Service | | | 2.45 | | | 12.53 | | 2.32 | | 8/29/08 |
| | Class IR | | | 2.94 | | | 12.91 | | 0.97 | | 11/30/07 |
| | | Class R | | | 2.44 | | | 12.37 | | 0.46 | | 11/30/07 |
| | 3 | | The Standardized Total Returns are average annual total returns as of the most recent calendar quarter-end. They assume reinvestment of all distributions at NAV. These returns reflect a maximum initial sales charge of 5.5% for Class A Shares and the assumed contingent deferred sales charge for Class C Shares (1% if redeemed within 12 months of purchase). Because Institutional, Service, Class IR and Class R Shares do not involve a sales charge, such a charge is not applied to their Standardized Total Returns. |
The returns set forth in the tables above represent past performance. Past performance does not guarantee future results. The Fund’s investment return and principal value will fluctuate so that an investor’s shares, when redeemed, may be worth more or less than their original cost. Current performance may be lower or higher than the performance quoted above. Please visit our web site at www.GSAMFUNDS.com to obtain the most recent month-end returns. Performance reflects applicable fee waivers and/or expense limitations in effect during the periods shown. In their absence, performance would be reduced. Returns do not reflect the deduction of taxes that a shareholder would pay on Fund distributions or the redemption of Fund shares.
43
FUND BASICS
| | | | | | | | | | |
| | EXPENSE RATIOS4 | |
| | | | | Net Expense Ratio (Current) | | | Gross Expense Ratio (Before Waivers) | |
| | Class A | | | 1.44 | % | | | 1.47 | % |
| | Class C | | | 2.19 | | | | 2.22 | |
| | Institutional | | | 1.04 | | | | 1.07 | |
| | Service | | | 1.54 | | | | 1.57 | |
| | Class IR | | | 1.19 | | | | 1.22 | |
| | | Class R | | | 1.69 | | | | 1.72 | |
| | 4 | | The expense ratios of the Portfolio, both current (net of applicable fee waivers and/ or expense limitations) and before waivers (gross of applicable fee waivers and/ or expense limitations) are as set forth above according to the most recent publicly available Prospectus for the Portfolio and will differ from the expense ratios disclosed in the Financial Highlights in this report due to the inclusion of Underlying Fund fees and expenses, which are not included in the operating expenses of the Portfolio reflected in the Financial Highlights. The Portfolio’s waivers and/or expense limitations will remain in place through at least April 30, 2014, and prior to such date the Investment Adviser may not terminate the arrangements without the approval of the Portfolio’s Board of Trustees. If these arrangements are discontinued in the future, the expense ratios may change without shareholder approval. |
|
| FUND ALLOCATIONS5 AS OF 12/ 31/13 |
| Percentage of Investment Portfolio |
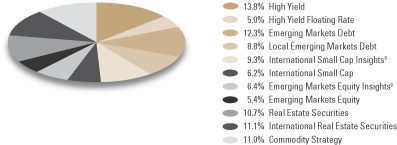
| | 5 | | Allocations reflect current fund weightings based on the overall risk of the Portfolio and the risk contribution from each asset class. Fund weightings are periodically readjusted in accordance with risk objectives of the Portfolio. |
| | 6 | | Effective May 3, 2013, the Goldman Sachs Structured Emerging Markets Equity and Structured International Small Cap Funds were renamed to the Goldman Sachs Emerging Markets Equity Insights and International Small Cap Insights Funds, respectively. |
44
FUND BASICS
|
| OVERALL UNDERLYING FUND WEIGHTINGS7 |
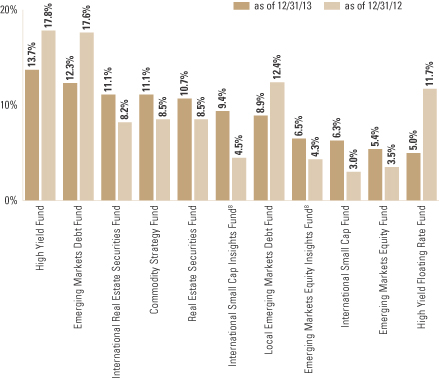
| | 7 | | The Portfolio is actively managed and, as such, its composition may differ over time. The percentage shown for each underlying fund reflects the value of that underlying fund as a percentage of net assets of the Portfolio. Figures in the above graph may not sum to 100% due to rounding and/or the exclusion of other assets and liabilities. |
| | 8 | | Effective May 3, 2013, the Goldman Sachs Structured Emerging Markets Equity and Structured International Small Cap Funds were renamed to the Goldman Sachs Emerging Markets Equity Insights and International Small Cap Insights Funds, respectively. |
45
GOLDMAN SACHS SATELLITE STRATEGIES PORTFOLIO
Performance Summary
December 31, 2013
The following graph shows the value, as of December 31, 2013, of a $10,000 investment made on March 30, 2007
(commencement of operations) in Institutional Shares at NAV. For comparative purposes, the performance of the Portfolio’s benchmarks, the Composite 40% Barclays Capital U.S. Aggregate Bond Index, 30% Morgan Stanley Capital International Europe, Australasia and Far East Index and 30% Standard & Poor’s 500 Index, the Standard & Poor’s 500 Index (“S&P 500 Index”), Barclays Capital U.S. Aggregate Bond Index (“BCAB Index”) and Morgan Stanley Capital International Europe, Australasia, and Far East Index (“MSCI EAFE Index”) (all with dividends reinvested), are shown. This performance data represents past performance and should not be considered indicative of future performance, which will fluctuate with changes in market conditions. These performance fluctuations will cause an investor’s shares, when redeemed, to be worth more or less than their original cost. Performance reflects applicable fee waivers and/or expense limitations currently in effect during the periods shown and in their absence, performance would be reduced. Returns do not reflect the deduction of taxes that a shareholder would pay on Portfolio distributions or the redemption of Portfolio shares. Performance of Class A, Class C, Service, Class IR and Class R Shares will vary from Institutional Shares due to differences in class specific fees and any applicable sales charges. In addition to the Investment Adviser’s decisions regarding underlying mutual fund selection and allocations among them, other factors may affect Portfolio performance. These factors include, but are not limited to, Portfolio operating fees and expenses, portfolio turnover and subscription and redemption cash flows affecting the Portfolio.
|
| Satellite Strategies Portfolio’s Lifetime Performance |
Performance of a $10,000 investment, with distributions reinvested, from March 30, 2007 through December 31, 2013.
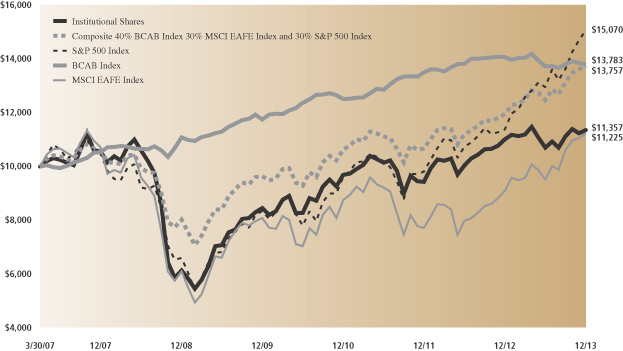
| | | | | | | | | | |
| Average Annual Total Return through December 31, 2013 | | | One Year | | | | Five Years | | | Since Inception |
Class A (Commenced March 30, 2007) | | | | | | | | | | |
Excluding sales charges | | | 2.67% | | | | 12.64% | | | 1.53% |
Including sales charges | | | -3.00% | | | | 11.39% | | | 0.69% |
|
Class C (Commenced March 30, 2007) | | | | | | | | | | |
Excluding contingent deferred sales charges | | | 1.91% | | | | 11.82% | | | 0.77% |
Including contingent deferred sales charges | | | 0.89% | | | | 11.82% | | | 0.77% |
|
Institutional Class (Commenced March 30, 2007) | | | 3.09% | | | | 13.10% | | | 1.90% |
|
Service Class (Commenced August 29, 2008) | | | 2.45% | | | | 12.53% | | | 2.32% |
|
Class IR (Commenced November 30, 2007) | | | 2.94% | | | | 12.91% | | | 0.97% |
|
Class R (Commenced November 30, 2007) | | | 2.44% | | | | 12.37% | | | 0.46% |
|
46
GOLDMAN SACHS BALANCED STRATEGY PORTFOLIO
Schedule of Investments
December 31, 2013
| | | | | | | | |
Shares | | | Description | | Value | |
| | | | | | | | |
| | Underlying Funds (Institutional Shares)(a) – 100.5% | |
| | Equity – 33.1% | | | | |
| | 5,240,195 | | | Goldman Sachs International Equity Insights Fund | | $ | 59,109,394 | |
| | 2,010,236 | | | Goldman Sachs Large Cap Growth Insights Fund | | | 39,179,494 | |
| | 1,879,351 | | | Goldman Sachs Large Cap Value Insights Fund | | | 28,810,446 | |
| | 1,289,834 | | | Goldman Sachs Strategic Growth Fund | | | 16,677,553 | |
| | 739,882 | | | Goldman Sachs Large Cap Value Fund | | | 12,422,626 | |
| | 1,073,750 | | | Goldman Sachs Emerging Markets Equity Insights Fund | | | 9,287,939 | |
| | 426,960 | | | Goldman Sachs Small Cap Equity Insights Fund | | | 7,838,980 | |
| | 669,279 | | | Goldman Sachs International Small Cap Insights Fund | | | 7,060,896 | |
| | 727,165 | | | Goldman Sachs International Real Estate Securities Fund | | | 4,617,500 | |
| | 287,026 | | | Goldman Sachs Real Estate Securities Fund | | | 4,535,011 | |
| | | | | | | | |
| | | | | | | 189,539,839 | |
| | |
| | Fixed Income – 54.8% | | | | |
| | 15,559,136 | | | Goldman Sachs Global Income Fund | | | 194,022,432 | |
| | 4,044,406 | | | Goldman Sachs Strategic Income Fund | | | 43,113,368 | |
| | 3,602,517 | | | Goldman Sachs High Yield Fund | | | 25,721,974 | |
| | 2,037,266 | | | Goldman Sachs Managed Futures Strategy Fund | | | 20,596,756 | |
| | 2,997,367 | | | Goldman Sachs Commodity Strategy Fund | | | 16,995,073 | |
| | 625,525 | | | Goldman Sachs Emerging Markets Debt Fund | | | 7,581,360 | |
| | 666,428 | | | Goldman Sachs Local Emerging Markets Debt Fund | | | 5,644,641 | |
| | | | | | | | |
| | | | | | | 313,675,604 | |
| | |
| | Dynamic – 12.6% | | | | |
| | 6,531,548 | | | Goldman Sachs Dynamic Allocation Fund | | | 71,977,659 | |
| | |
| TOTAL UNDERLYING FUNDS
(INSTITUTIONAL SHARES) – 100.5% | | | | |
| | (Cost $560,832,735) | | $ | 575,193,102 | |
| | |
| LIABILITIES IN EXCESS OF
OTHER ASSETS – (0.5)% | | | (3,114,133 | ) |
| | |
| | NET ASSETS – 100.0% | | $ | 572,078,969 | |
| | |
| | | | |
| The percentage shown for each investment category reflects the value of investments in that category as a percentage of net assets. |
(a) | | Represents Affiliated Funds. |
| | |
| The accompanying notes are an integral part of these financial statements. | | 47 |
GOLDMAN SACHS EQUITY GROWTH STRATEGY PORTFOLIO
Schedule of Investments
December 31, 2013
| | | | | | | | |
Shares | | | Description | | Value | |
| | | | | | | | |
| | Underlying Funds (Institutional Shares)(a) – 100.0% | |
| | Equity – 97.1% | |
| | 12,965,589 | | | Goldman Sachs International Equity Insights Fund | | $ | 146,251,843 | |
| | 3,255,996 | | | Goldman Sachs Large Cap Growth Insights Fund | | | 63,459,363 | |
| | 3,945,950 | | | Goldman Sachs Large Cap Value Insights Fund | | | 60,491,416 | |
| | 3,188,103 | | | Goldman Sachs Emerging Markets Equity Insights Fund | | | 27,577,095 | |
| | 2,094,135 | | | Goldman Sachs Strategic Growth Fund | | | 27,077,160 | |
| | 1,555,639 | | | Goldman Sachs Large Cap Value Fund | | | 26,119,172 | |
| | 857,039 | | | Goldman Sachs Small Cap Equity Insights Fund | | | 15,735,231 | |
| | 1,171,337 | | | Goldman Sachs International Small Cap Insights Fund | | | 12,357,600 | |
| | 1,272,567 | | | Goldman Sachs International Real Estate Securities Fund | | | 8,080,801 | |
| | 502,273 | | | Goldman Sachs Real Estate Securities Fund | | | 7,935,916 | |
| | | | | | | | |
| | | | 395,085,597 | |
| | |
| | Fixed Income – 2.9% | |
| | 2,097,805 | | | Goldman Sachs Commodity Strategy Fund | | | 11,894,553 | |
| | |
| TOTAL UNDERLYING FUNDS
(INSTITUTIONAL SHARES) – 100.0% | | | | |
| | (Cost $313,524,071) | | $ | 406,980,150 | |
| | |
| OTHER ASSETS IN EXCESS OF
LIABILITIES – 0.0% | | | 77,688 | |
| | |
| | NET ASSETS – 100.0% | | $ | 407,057,838 | |
| | |
| | | | |
| The percentage shown for each investment category reflects the value of investments in that category as a percentage of net assets. |
(a) | | Represents Affiliated Funds. |
| | |
| 48 | | The accompanying notes are an integral part of these financial statements. |
GOLDMAN SACHS GROWTH AND INCOME STRATEGY PORTFOLIO
Schedule of Investments
December 31, 2013
| | | | | | | | |
Shares | | | Description | | Value | |
| | | | | | | | |
| | Underlying Funds (Institutional Shares)(a) – 100.4% | |
| | Equity – 54.3% | |
| | 17,032,227 | | | Goldman Sachs International Equity Insights Fund | | $ | 192,123,516 | |
| | 5,306,146 | | | Goldman Sachs Large Cap Growth Insights Fund | | | 103,416,786 | |
| | 5,515,523 | | | Goldman Sachs Large Cap Value Insights Fund | | | 84,552,970 | |
| | 3,415,706 | | | Goldman Sachs Strategic Growth Fund | | | 44,165,078 | |
| | 4,568,875 | | | Goldman Sachs Emerging Markets Equity Insights Fund | | | 39,520,773 | |
| | 2,170,262 | | | Goldman Sachs Large Cap Value Fund | | | 36,438,693 | |
| | 1,119,640 | | | Goldman Sachs Small Cap Equity Insights Fund | | | 20,556,597 | |
| | 1,815,007 | | | Goldman Sachs International Small Cap Insights Fund | | | 19,148,329 | |
| | 1,971,767 | | | Goldman Sachs International Real Estate Securities Fund | | | 12,520,722 | |
| | 778,299 | | | Goldman Sachs Real Estate Securities Fund | | | 12,297,124 | |
| | | | | | | | |
| | | | 564,740,588 | |
| | |
| | Fixed Income – 33.6% | |
| | 15,226,521 | | | Goldman Sachs Global Income Fund | | | 189,874,714 | |
| | 4,843,943 | | | Goldman Sachs Strategic Income Fund | | | 51,636,432 | |
| | 3,660,400 | | | Goldman Sachs Managed Futures Strategy Fund | | | 37,006,639 | |
| | 5,050,125 | | | Goldman Sachs High Yield Fund | | | 36,057,893 | |
| | 5,417,623 | | | Goldman Sachs Commodity Strategy Fund | | | 30,717,922 | |
| | 305,427 | | | Goldman Sachs Emerging Markets Debt Fund | | | 3,701,780 | |
| | | | | | | | |
| | | | 348,995,380 | |
| | |
| | Dynamic – 12.5% | |
| | 11,829,692 | | | Goldman Sachs Dynamic Allocation Fund | | | 130,363,207 | |
| | |
| TOTAL UNDERLYING FUNDS
(INSTITUTIONAL SHARES) – 100.4% | | | | |
| | (Cost $935,168,398) | | $ | 1,044,099,175 | |
| | |
| LIABILITIES IN EXCESS OF
OTHER ASSETS – (0.4)% | | | (3,962,117 | ) |
| | |
| | NET ASSETS – 100.0% | | $ | 1,040,137,058 | |
| | |
| | | | |
| The percentage shown for each investment category reflects the value of investments in that category as a percentage of net assets. |
(a) | | Represents Affiliated Funds. |
| | |
| The accompanying notes are an integral part of these financial statements. | | 49 |
GOLDMAN SACHS GROWTH STRATEGY PORTFOLIO
Schedule of Investments
December 31, 2013
| | | | | | | | |
Shares | | | Description | | Value | |
| | Underlying Funds (Institutional Shares)(a) – 99.9% | |
| | Equity – 74.3% | | | | |
| | 21,373,240 | | | Goldman Sachs International Equity Insights Fund | | $ | 241,090,149 | |
| | 6,078,259 | | | Goldman Sachs Large Cap Growth Insights Fund | | | 118,465,262 | |
| | 6,641,919 | | | Goldman Sachs Large Cap Value Insights Fund | | | 101,820,619 | |
| | 3,908,478 | | | Goldman Sachs Strategic Growth Fund | | | 50,536,623 | |
| | 5,689,505 | | | Goldman Sachs Emerging Markets Equity Insights Fund | | | 49,214,217 | |
| | 2,611,947 | | | Goldman Sachs Large Cap Value Fund | | | 43,854,592 | |
| | 1,254,415 | | | Goldman Sachs Small Cap Equity Insights Fund | | | 23,031,061 | |
| | 2,106,688 | | | Goldman Sachs International Small Cap Insights Fund | | | 22,225,564 | |
| | 2,289,104 | | | Goldman Sachs International Real Estate Securities Fund | | | 14,535,808 | |
| | 903,580 | | | Goldman Sachs Real Estate Securities Fund | | | 14,276,561 | |
| | | | | | | | |
| | | | | | | 679,050,456 | |
| | |
| | Fixed Income – 13.2% | | | | |
| | 3,185,448 | | | Goldman Sachs Managed Futures Strategy Fund | | | 32,204,879 | |
| | 4,717,301 | | | Goldman Sachs Commodity Strategy Fund | | | 26,747,099 | |
| | 2,107,884 | | | Goldman Sachs Strategic Income Fund | | | 22,470,043 | |
| | 3,145,798 | | | Goldman Sachs High Yield Fund | | | 22,460,996 | |
| | 1,327,695 | | | Goldman Sachs Global Income Fund | | | 16,556,358 | |
| | | | | | | | |
| | | | | | | 120,439,375 | |
| | |
| | Dynamic – 12.4% | | | | |
| | 10,291,406 | | | Goldman Sachs Dynamic Allocation Fund | | | 113,411,293 | |
| | |
| TOTAL UNDERLYING FUNDS
(INSTITUTIONAL SHARES) | | | | |
| | (Cost $757,120,534) | | $ | 912,901,124 | |
| | |
Principal
Amount | | | Interest
Rate | | | Maturity
Date | | | Value | |
| | Short-term Investment(b) – 0.1% | |
| | Repurchase Agreement – 0.1% | | | | | |
| Joint Repurchase Agreement Account II | | | | | |
| $ | 400,000 | | | | 0.019 | % | | | 01/02/14 | | | $ | 400,000 | |
| | (Cost $400,000) | | | | | | | | | |
| | |
| | TOTAL INVESTMENTS – 100.0% | | | | | |
| | (Cost $757,520,534) | | | | | | | $ | 913,301,124 | |
| | |
| OTHER ASSETS IN EXCESS OF
LIABILITIES – 0.0% |
| | | 213,967 | |
| | |
| | NET ASSETS – 100.0% | | | $ | 913,515,091 | |
| | |
| | | | | | | | |
| The percentage shown for each investment category reflects the value of investments in that category as a percentage of net assets. |
(a) | | Represents Affiliated Funds. |
(b) | | Joint repurchase agreement was entered into on December 31, 2013. Additional information appears on page 53. |
| | |
| 50 | | The accompanying notes are an integral part of these financial statements. |
GOLDMAN SACHS INCOME STRATEGIES PORTFOLIO
Schedule of Investments
December 31, 2013
| | | | | | | | |
Shares | | | Description | | Value | |
| | Underlying Funds (Institutional Shares)(a) – 100.3% | |
| | Equity – 39.8% | | | | |
| | 1,040,917 | | | Goldman Sachs International Real Estate Securities Fund | | $ | 6,609,823 | |
| | 349,389 | | | Goldman Sachs Real Estate Securities Fund | | | 5,520,349 | |
| | | | | | | | |
| | | | | | | 12,130,172 | |
| | |
| | Fixed Income – 60.5% | | | | |
| | 455,448 | | | Goldman Sachs Emerging Markets Debt Fund | | | 5,520,030 | |
| | 266,790 | | | Goldman Sachs High Yield Floating Rate Fund | | | 2,694,576 | |
| | 880,998 | | | Goldman Sachs High Yield Fund | | | 6,290,326 | |
| | 462,164 | | | Goldman Sachs Local Emerging Markets Debt Fund | | | 3,914,525 | |
| | | | | | | | |
| | | | | | | 18,419,457 | |
| | |
| TOTAL UNDERLYING FUNDS
(INSTITUTIONAL SHARES) – 100.3% | | | | |
| | (Cost $31,450,189) | | $ | 30,549,629 | |
| | |
| LIABILITIES IN EXCESS OF
OTHER ASSETS – (0.3)% | | | (103,541 | ) |
| | |
| | NET ASSETS – 100.0% | | $ | 30,446,088 | |
| | |
| | | | |
| The percentage shown for each investment category reflects the value of investments in that category as a percentage of net assets. |
(a) | | Represents Affiliated Funds. |
| | |
| The accompanying notes are an integral part of these financial statements. | | 51 |
GOLDMAN SACHS SATELLITE STRATEGIES PORTFOLIO
Schedule of Investments
December 31, 2013
| | | | | | | | |
Shares | | | Description | | Value | |
| | Underlying Funds (Institutional Shares)(a) – 100.4% | |
| | Equity – 49.4% | | | | |
| | 23,265,957 | | | Goldman Sachs International Real Estate Securities Fund | | $ | 147,738,827 | |
| | 9,034,620 | | | Goldman Sachs Real Estate Securities Fund | | | 142,746,991 | |
| | 11,796,543 | | | Goldman Sachs International Small Cap Insights Fund | | | 124,453,533 | |
| | 9,910,096 | | | Goldman Sachs Emerging Markets Equity Insights Fund | | | 85,722,330 | |
| | 4,152,944 | | | Goldman Sachs International Small Cap Fund | | | 83,266,534 | |
| | 4,438,278 | | | Goldman Sachs Emerging Markets Equity Fund | | | 71,722,579 | |
| | | | | | | | |
| | | | | | | 655,650,794 | |
| | |
| | Fixed Income – 51.0% | | | | |
| | 25,437,730 | | | Goldman Sachs High Yield Fund | | | 181,625,395 | |
| | 13,538,003 | | | Goldman Sachs Emerging Markets Debt Fund | | | 164,080,592 | |
| | 25,971,752 | | | Goldman Sachs Commodity Strategy Fund | | | 147,259,836 | |
| | 13,923,169 | | | Goldman Sachs Local Emerging Markets Debt Fund | | | 117,929,245 | |
| | 6,547,780 | | | Goldman Sachs High Yield Floating Rate Fund | | | 66,132,573 | |
| | | | | | | | |
| | | | | | | 677,027,641 | |
| | |
| TOTAL UNDERLYING FUNDS
(INSTITUTIONAL SHARES) – 100.4% | | | | |
| | (Cost $1,259,221,182) | | $ | 1,332,678,435 | |
| | |
| LIABILITIES IN EXCESS OF
OTHER ASSETS – (0.4)% | | | (5,373,072 | ) |
| | |
| | NET ASSETS – 100.0% | | $ | 1,327,305,363 | |
| | |
| | | | |
| The percentage shown for each investment category reflects the value of investments in that category as a percentage of net assets. |
(a) | | Represents Affiliated Funds. |
| | |
| 52 | | The accompanying notes are an integral part of these financial statements. |
GOLDMAN SACHS FUND OF FUNDS PORTFOLIOS
Schedule of Investments
December 31, 2013
|
| ADDITIONAL INVESTMENT INFORMATION |
JOINT REPURCHASE AGREEMENT ACCOUNT II — At December 31, 2013, the Growth Strategy Portfolio had undivided interests in the Joint Repurchase Agreement Account II, with a maturity date of January 2, 2014, as follows:
| | | | |
| Principal Amount | | Maturity Value | | Collateral Allocation Value |
$400,000 | | $400,000 | | $410,566 |
REPURCHASE AGREEMENTS — At December 31, 2013, the Principal Amount of the Portfolio’s interest in the Joint Repurchase Agreement Account II was as follows:
| | | | | | | | |
| Counterparty | | Interest Rate | | | Principal Amounts | |
BNP Paribas Securities Co. | | | 0.020 | % | | $ | 54,503 | |
Citigroup Global Markets, Inc. | | | 0.010 | | | | 22,777 | |
Citigroup Global Markets, Inc. | | | 0.020 | | | | 89,482 | |
Merrill Lynch & Co., Inc. | | | 0.010 | | | | 16,042 | |
TD Securities USA LLC | | | 0.010 | | | | 113,886 | |
Wells Fargo Securities LLC | | | 0.030 | | | | 103,310 | |
| TOTAL | | | | | | $ | 400,000 | |
At December 31, 2013, the Joint Repurchase Agreement Account II was fully collateralized by:
| | | | | | | | |
| Issuer | | Interest Rates | | | Maturity Dates | |
Federal Farm Credit Bank | | | 0.157% to 3.500 | % | | | 08/14/15 to 07/03/23 | |
Federal Home Loan Bank | | | 0.000 to 5.250 | | | | 01/03/14 to 12/13/19 | |
Federal Home Loan Mortgage Corp. | | | 0.450 to 7.000 | | | | 11/25/14 to 12/01/43 | |
Federal National Mortgage Association | | | 0.000 to 7.000 | | | | 05/01/14 to 01/01/44 | |
Government National Mortgage Association | | | 2.500 to 7.500 | | | | 04/15/23 to 12/20/43 | |
Tennessee Valley Authority Interest-Only Stripped Securities | | | 0.000 | | | | 11/01/14 to 11/01/18 | |
United States Treasury Bonds | | | 5.250 to 7.625 | | | | 02/15/25 to 11/15/28 | |
United States Treasury Inflation Protected Security | | | 0.125 | | | | 4/15/2018 | |
United States Treasury Interest-Only Stripped Security | | | 0.000 | | | | 11/15/2015 | |
United States Treasury Notes | | | 0.250 to 8.875 | | | | 06/30/14 to 05/31/19 | |
United States Treasury Principal-Only Stripped Securities | | | 0.000 | | | | 02/15/14 to 08/15/18 | |
| | |
| The accompanying notes are an integral part of these financial statements. | | 53 |
GOLDMAN SACHS FUND OF FUNDS PORTFOLIOS
Statements of Assets and Liabilities
December 31, 2013
| | | | | | |
| | | | | Balanced Strategy Portfolio | |
| | Assets: | | | | |
| | Investments in Affiliated Underlying Funds, at value (cost $560,832,735, $313,524,071, $935,168,398, $757,120,534, $31,450,189 and $1,259,221,182) | | | $575,193,102 | |
| | Repurchase agreement, at value which equals cost | | | — | |
| | Cash | | | — | |
| | Receivables: | | | | |
| | Dividends | | | 5,473,246 | |
| | Portfolio shares sold | | | 3,001,585 | |
| | Reimbursement from investment adviser | | | 13,693 | |
| | Investments sold | | | 12,458 | |
| | Other assets | | | 16,584 | |
| | Total assets | | | 583,710,668 | |
| | | | | | |
| | Liabilities: | | | | |
| | Due to custodian | | | 299,034 | |
| | Payables: | | | | |
| | Portfolio shares redeemed | | | 5,490,494 | |
| | Investments purchased | | | 5,473,246 | |
| | Amounts owed to affiliates | | | 244,564 | |
| | Distributions payable | | | — | |
| | Accrued expenses | | | 124,361 | |
| | Total liabilities | | | 11,631,699 | |
| | | | | | |
| | Net Assets: | | | | |
| | Paid-in capital | | | 594,097,320 | |
| | Undistributed net investment income | | | 238,582 | |
| | Accumulated net realized loss | | | (36,617,300 | ) |
| | Net unrealized gain (loss) | | | 14,360,367 | |
| | | NET ASSETS | | | $572,078,969 | |
| | | Net Assets: | | | | |
| | | Class A | | | $186,034,426 | |
| | | Class B | | | 13,079,924 | |
| | | Class C | | | 74,053,307 | |
| | | Institutional | | | 287,623,408 | |
| | | Service | | | 1,735,572 | |
| | | Class IR | | | 3,937,725 | |
| | | Class R | | | 5,614,607 | |
| | | Total Net Assets | | | $572,078,969 | |
| | | Shares Outstanding $0.001 par value (unlimited shares authorized): | | | | |
| | | Class A | | | 16,717,099 | |
| | | Class B | | | 1,174,047 | |
| | | Class C | | | 6,654,066 | |
| | | Institutional | | | 25,832,504 | |
| | | Service | | | 155,483 | |
| | | Class IR | | | 355,004 | |
| | | Class R | | | 506,603 | |
| | | Net asset value, offering and redemption price per share:(a) | | | | |
| | | Class A | | | $11.13 | |
| | | Class B | | | 11.14 | |
| | | Class C | | | 11.13 | |
| | | Institutional | | | 11.13 | |
| | | Service | | | 11.16 | |
| | | Class IR | | | 11.09 | |
| | | Class R | | | 11.08 | |
| | (a) | | Maximum public offering price per share for Class A Shares of the Balanced Strategy, Equity Growth Strategy, Growth and Income Strategy, Growth Strategy, Income Strategies and Satellite Strategies Portfolios is $11.78, $15.12, $12.85, $13.64, $8.99 and $8.63, respectively. At redemption, Class B and Class C Shares may be subject to a contingent deferred sales charge, assessed on the amount equal to the lesser of the current NAV or the original purchase price of the shares. |
| | |
| 54 | | The accompanying notes are an integral part of these financial statements. |
GOLDMAN SACHS FUND OF FUNDS PORTFOLIOS
| | | | | | | | | | | | | | | | | | | | | | | | | | | | |
| | | Equity Growth Strategy Portfolio | | | | | Growth and Income Strategy Portfolio | | | | | Growth Strategy Portfolio | | | | | Income Strategies Portfolio | | | | | Satellite Strategies Portfolio | |
| | | | | | | | | | | | | | | | | | | | | | | | | | | | |
| | $ | 406,980,150 | | | | | $ | 1,044,099,175 | | | | | $ | 912,901,124 | | | | | $ | 30,549,629 | | | | | $ | 1,332,678,435 | |
| | | — | | | | | | — | | | | | | 400,000 | | | | | | — | | | | | | — | |
| | | — | | | | | | — | | | | | | 93,235 | | | | | | — | | | | | | — | |
| | | | | | | | | | | | | | | | | | | | | | | | | | | | |
| | | — | | | | | | 5,407,933 | | | | | | 582,518 | | | | | | 82,816 | | | | | | 2,379,697 | |
| | | 1,034,323 | | | | | | 1,774,127 | | | | | | 4,431,291 | | | | | | 8,335 | | | | | | 1,809,422 | |
| | | 17,056 | | | | | | 13,059 | | | | | | 18,714 | | | | | | 11,486 | | | | | | 1,764 | |
| | | 1,044,512 | | | | | | — | | | | | | 217,424 | | | | | | 94,001 | | | | | | 3,431,305 | |
| | | 22,856 | | | | | | 38,398 | | | | | | 49,951 | | | | | | 7,082 | | | | | | 50,591 | |
| | | 409,098,897 | | | | | | 1,051,332,692 | | | | | | 918,694,257 | | | | | | 30,753,349 | | | | | | 1,340,351,214 | |
| | | | | | | | | | | | | | | | | | | | | | | | | | | | |
| | | | | | | | | | | | | | | | | | | | | | | | | | | | |
| | | 417,832 | | | | | | 102,150 | | | | | | — | | | | | | 66,032 | | | | | | 7,675,018 | |
| | | | | | | | | | | | | | | | | | | | | | | | | | | | |
| | | 1,256,196 | | | | | | 4,091,028 | | | | | | 3,841,829 | | | | | | 60,191 | | | | | | 2,413,490 | |
| | | — | | | | | | 6,261,604 | | | | | | 582,517 | | | | | | 82,816 | | | | | | 2,379,697 | |
| | | 235,563 | | | | | | 549,942 | | | | | | 534,724 | | | | | | 18,052 | | | | | | 392,149 | |
| | | — | | | | | | 238 | | | | | | 101 | | | | | | — | | | | | | — | |
| | | 131,468 | | | | | | 190,672 | | | | | | 219,995 | | | | | | 80,170 | | | | | | 185,497 | |
| | | 2,041,059 | | | | | | 11,195,634 | | | | | | 5,179,166 | | | | | | 307,261 | | | | | | 13,045,851 | |
| | | | | | | | | | | | | | | | | | | | | | | | | | | | |
| | | | | | | | | | | | | | | | | | | | | | | | | | | | |
| | | 621,743,410 | | | | | | 1,616,127,335 | | | | | | 1,553,745,754 | | | | | | 33,137,674 | | | | | | 1,303,044,874 | |
| | | 86,454 | | | | | | 247,111 | | | | | | 491,819 | | | | | | 21,375 | | | | | | 634,438 | |
| | | (308,228,105 | ) | | | | | (685,168,165 | ) | | | | | (796,503,072 | ) | | | | | (1,812,401 | ) | | | | | (49,831,202 | ) |
| | | 93,456,079 | | | | | | 108,930,777 | | | | | | 155,780,590 | | | | | | (900,560 | ) | | | | | 73,457,253 | |
| | | $ | 407,057,838 | | | | | $ | 1,040,137,058 | | | | | $ | 913,515,091 | | | | | $ | 30,446,088 | | | | | $ | 1,327,305,363 | |
| | | | | | | | | | | | | | | | | | | | | | | | | | | | | |
| | | $ | 152,263,546 | | | | | $ | 435,812,053 | | | | | $ | 389,445,087 | | | | | $ | 9,947,989 | | | | | $ | 231,867,910 | |
| | | | 16,121,931 | | | | | | 44,858,422 | | | | | | 47,839,392 | | | | | | — | | | | | | — | |
| | | | 106,207,721 | | | | | | 196,121,111 | | | | | | 218,776,349 | | | | | | 10,064,831 | | | | | | 118,152,603 | |
| | | | 124,274,728 | | | | | | 353,202,732 | | | | | | 246,229,219 | | | | | | 7,519,435 | | | | | | 853,543,084 | |
| | | | 715,101 | | | | | | 3,917,029 | | | | | | 3,419,010 | | | | | | — | | | | | | 28,483,325 | |
| | | | 3,734,954 | | | | | | 2,795,848 | | | | | | 3,597,940 | | | | | | 2,796,078 | | | | | | 91,493,211 | |
| | | | 3,739,857 | | | | | | 3,429,863 | | | | | | 4,208,094 | | | | | | 117,755 | | | | | | 3,765,230 | |
| | | $ | 407,057,838 | | | | | $ | 1,040,137,058 | | | | | $ | 913,515,091 | | | | | $ | 30,446,088 | | | | | $ | 1,327,305,363 | |
| | | | | | | | | | | | | | | | | | | | | | | | | | | | | |
| | | | 10,657,311 | | | | | | 35,900,468 | | | | | | 30,211,348 | | | | | | 1,170,808 | | | | | | 28,412,829 | |
| | | | 1,171,366 | | | | | | 3,728,332 | | | | | | 3,682,743 | | | | | | — | | | | | | — | |
| | | | 7,766,346 | | | | | | 16,357,816 | | | | | | 17,025,092 | | | | | | 1,178,678 | | | | | | 14,554,613 | |
| | | | 8,625,063 | | | | | | 29,004,506 | | | | | | 19,116,206 | | | | | | 889,953 | | | | | | 104,728,163 | |
| | | | 50,272 | | | | | | 323,389 | | | | | | 266,248 | | | | | | — | | | | | | 3,505,757 | |
| | | | 264,723 | | | | | | 231,254 | | | | | | 282,809 | | | | | | 329,664 | | | | | | 11,226,306 | |
| | | | 263,857 | | | | | | 284,038 | | | | | | 334,207 | | | | | | 13,806 | | | | | | 463,090 | |
| | | | | | | | | | | | | | | | | | | | | | | | | | | | | |
| | | | $14.29 | | | | | | $12.14 | | | | | | $12.89 | | | | | | $8.50 | | | | | | $8.16 | |
| | | | 13.76 | | | | | | 12.03 | | | | | | 12.99 | | | | | | — | | | | | | — | |
| | | | 13.68 | | | | | | 11.99 | | | | | | 12.85 | | | | | | 8.54 | | | | | | 8.12 | |
| | | | 14.41 | | | | | | 12.18 | | | | | | 12.88 | | | | | | 8.45 | | | | | | 8.15 | |
| | | | 14.22 | | | | | | 12.11 | | | | | | 12.84 | | | | | | — | | | | | | 8.12 | |
| | | | 14.11 | | | | | | 12.09 | | | | | | 12.72 | | | | | | 8.48 | | | | | | 8.15 | |
| | | | 14.17 | | | | | | 12.08 | | | | | | 12.59 | | | | | | 8.53 | | | | | | 8.13 | |
| | |
| The accompanying notes are an integral part of these financial statements. | | 55 |
GOLDMAN SACHS FUND OF FUNDS PORTFOLIOS
Statements of Operations
For the Fiscal Year Ended December 31, 2013
| | | | | | |
| | | | | Balanced Strategy Portfolio | |
| | Investment income: | | | | |
| | Dividends from Affiliated Underlying Funds | | $ | 16,756,282 | |
| | Interest | | | 650 | |
| | Total investment income | | | 16,756,932 | |
| | | | | | |
| | Expenses: | | | | |
| | Distribution and Service fees(a) | | | 1,475,436 | |
| | Management fees | | | 832,183 | |
| | Transfer Agent fees(a) | | | 679,165 | |
| | Registration fees | | | 97,592 | |
| | Printing and mailing costs | | | 82,937 | |
| | Professional fees | | | 65,130 | |
| | Custody, accounting and administrative services | | | 46,185 | |
| | Trustee fees | | | 21,376 | |
| | Shareholder meeting expense | | | 8,189 | |
| | Service Share fees — Shareholder Administration Plan | | | 4,845 | |
| | Service Share fees — Service Plan | | | 4,845 | |
| | Other | | | 16,282 | |
| | Total expenses | | | 3,334,165 | |
| | Less — expense reimbursements | | | (307,310 | ) |
| | Net expenses | | | 3,026,855 | |
| | NET INVESTMENT INCOME | | | 13,730,077 | |
| | | | | | |
| | Realized and unrealized gain (loss): | | | | |
| | Capital gain distributions from Affiliated Underlying Funds | | | 8,595,013 | |
| | Net realized gain (loss) from Affiliated Underlying Funds | | | 34,972,889 | |
| | Net change in unrealized gain (loss) on Affiliated Underlying Funds | | | (13,041,209 | ) |
| | Net realized and unrealized gain (loss) | | | 30,526,693 | |
| | NET INCREASE (DECREASE) IN NET ASSETS RESULTING FROM OPERATIONS | | $ | 44,256,770 | |
| | (a) | | Class specific Distribution and Service and Transfer Agent fees were as follows: |
| | | | | | | | | | | | | | | | | | | | | | | | | | | | | | | | | | | | | | | | | | | | |
| | | Distribution and Service Fees | | | Transfer Agent Fees | |
Portfolio | | Class A | | | Class B | | | Class C | | | Class R | | | Class A | | | Class B | | | Class C | | | Institutional | | | Service | | | Class IR | | | Class R | |
Balanced Strategy | | $ | 505,704 | | | $ | 156,000 | | | $ | 774,326 | | | $ | 39,406 | | | $ | 384,335 | | | $ | 29,640 | | | $ | 147,122 | | | $ | 99,207 | | | $ | 775 | | | $ | 3,112 | | | $ | 14,974 | |
Equity Growth Strategy | | | 367,967 | | | | 169,821 | | | | 1,036,602 | | | | 23,146 | | | | 279,656 | | | | 32,266 | | | | 196,954 | | | | 42,529 | | | | 252 | | | | 3,176 | | | | 8,796 | |
Growth and Income Strategy | | | 1,148,873 | | | | 522,258 | | | | 2,014,603 | | | | 19,763 | | | | 873,143 | | | | 99,229 | | | | 382,775 | | | | 124,851 | | | | 1,617 | | | | 3,908 | | | | 7,510 | |
Growth Strategy | | | 973,689 | | | | 529,074 | | | | 2,218,438 | | | | 24,208 | | | | 740,003 | | | | 100,524 | | | | 421,503 | | | | 81,858 | | | | 1,320 | | | | 4,078 | | | | 9,199 | |
Income Strategies | | | 29,730 | | | | — | | | | 113,857 | | | | 685 | | | | 22,595 | | | | — | | | | 21,633 | | | | 3,279 | | | | — | | | | 4,951 | | | | 260 | |
Satellite Strategies | | | 641,209 | | | | — | | | | 1,281,779 | | | | 19,047 | | | | 487,319 | | | | — | | | | 243,538 | | | | 347,890 | | | | 13,145 | | | | 173,201 | | | | 7,238 | |
| | |
| 56 | | The accompanying notes are an integral part of these financial statements. |
GOLDMAN SACHS FUND OF FUNDS PORTFOLIOS
| | | | | | | | | | | | | | | | | | | | | | | | | | | | |
| | | Equity Growth Strategy Portfolio | | | | | Growth and Income Strategy Portfolio | | | | | Growth Strategy Portfolio | | | | | Income Strategies
Portfolio | | | | | Satellite Strategies
Portfolio | |
| | | | | | | | | | | | | | | | | | | | | | | | | | | | |
| | $ | 8,025,716 | | | | | $ | 24,898,023 | | | | | $ | 16,021,609 | | | | | $ | 1,594,654 | | | | | $ | 51,014,734 | |
| | | 73 | | | | | | 474 | | | | | | 262 | | | | | | 6 | | | | | | 686 | |
| | | 8,025,789 | | | | | | 24,898,497 | | | | | | 16,021,871 | | | | | | 1,594,660 | | | | | | 51,015,420 | |
| | | | | | | | | | | | | | | | | | | | | | | | | | | | |
| | | | | | | | | | | | | | | | | | | | | | | | | | | | |
| | | 1,597,536 | | | | | | 3,705,497 | | | | | | 3,745,409 | | | | | | 144,272 | | | | | | 1,942,035 | |
| | | 571,626 | | | | | | 1,553,122 | | | | | | 1,318,739 | | | | | | 42,431 | | | | | | 1,713,950 | |
| | | 563,629 | | | | | | 1,493,033 | | | | | | 1,358,485 | | | | | | 52,718 | | | | | | 1,272,331 | |
| | | 95,847 | | | | | | 112,151 | | | | | | 99,587 | | | | | | 65,104 | | | | | | 139,937 | |
| | | 87,192 | | | | | | 143,764 | | | | | | 202,524 | | | | | | 48,679 | | | | | | 161,101 | |
| | | 69,062 | | | | | | 74,081 | | | | | | 65,139 | | | | | | 76,031 | | | | | | 63,432 | |
| | | 40,730 | | | | | | 51,397 | | | | | | 42,140 | | | | | | 36,902 | | | | | | 43,996 | |
| | | 21,351 | | | | | | 22,808 | | | | | | 21,302 | | | | | | 19,672 | | | | | | 23,741 | |
| | | 11,287 | | | | | | 18,962 | | | | | | 24,667 | | | | | | 3,082 | | | | | | 23,730 | |
| | | 1,577 | | | | | | 10,109 | | | | | | 8,248 | | | | | | — | | | | | | 82,160 | |
| | | 1,577 | | | | | | 10,109 | | | | | | 8,248 | | | | | | — | | | | | | 82,160 | |
| | | 12,808 | | | | | | 26,749 | | | | | | 21,433 | | | | | | 8,150 | | | | | | 24,983 | |
| | | 3,074,222 | | | | | | 7,221,782 | | | | | | 6,915,921 | | | | | | 497,041 | | | | | | 5,573,556 | |
| | | (311,746 | ) | | | | | (389,533 | ) | | | | | (416,960 | ) | | | | | (251,957 | ) | | | | | (318,970 | ) |
| | | 2,762,476 | | | | | | 6,832,249 | | | | | | 6,498,961 | | | | | | 245,084 | | | | | | 5,254,586 | |
| | | 5,263,313 | | | | | | 18,066,248 | | | | | | 9,522,910 | | | | | | 1,349,576 | | | | | | 45,760,834 | |
| | | | | | | | | | | | | | | | | | | | | | | | | | | | |
| | | | | | | | | | | | | | | | | | | | | | | | | | | | |
| | | 3,275,208 | | | | | | 13,924,163 | | | | | | 10,977,628 | | | | | | 305,802 | | | | | | 9,631,974 | |
| | | 34,442,833 | | | | | | 89,562,383 | | | | | | 80,006,051 | | | | | | 184,261 | | | | | | (119,487 | ) |
| | | 37,058,796 | | | | | | 5,775,341 | | | | | | 46,293,399 | | | | | | (1,901,708 | ) | | | | | (20,693,522 | ) |
| | | 74,776,837 | | | | | | 109,261,887 | | | | | | 137,277,078 | | | | | | (1,411,645 | ) | | | | | (11,181,035 | ) |
| | $ | 80,040,150 | | | | | $ | 127,328,135 | | | | | $ | 146,799,988 | | | | | $ | (62,069 | ) | | | | $ | 34,579,799 | |
| | |
| The accompanying notes are an integral part of these financial statements. | | 57 |
GOLDMAN SACHS FUND OF FUNDS PORTFOLIOS
Statements of Changes in Net Assets
| | | | | | | | | | |
| | | | | Balanced Strategy Portfolio | |
| | | | | For the Fiscal
Year Ended
December 31, 2013 | | | For the Fiscal
Year Ended
December 31, 2012 | |
| | From operations: | | | | | | | | |
| | Net investment income | | $ | 13,730,077 | | | $ | 9,476,497 | |
| | Net realized gain | | | 43,567,902 | | | | 33,122,874 | |
| | Net change in unrealized gain (loss) | | | (13,041,209 | ) | | | 12,556,803 | |
| | Net increase in net assets resulting from operations | | | 44,256,770 | | | | 55,156,174 | |
| | | | | | | | | | |
| | Distributions to shareholders: | | | | | | | | |
| | From net investment income | | | | | | | | |
| | Class A Shares | | | (5,091,167 | ) | | | (6,275,335 | ) |
| | Class B Shares | | | (246,230 | ) | | | (341,597 | ) |
| | Class C Shares | | | (1,402,869 | ) | | | (1,552,743 | ) |
| | Institutional Shares | | | (8,257,627 | ) | | | (6,879,203 | ) |
| | Service Shares | | | (45,319 | ) | | | (52,231 | ) |
| | Class IR Shares | | | (62,667 | ) | | | (25,133 | ) |
| | Class R Shares | | | (184,172 | ) | | | (195,480 | ) |
| | Total distributions to shareholders | | | (15,290,051 | ) | | | (15,321,722 | ) |
| | | | | | | | | | |
| | From share transactions: | | | | | | | | |
| | Proceeds from sales of shares | | | 169,411,512 | | | | 210,335,373 | |
| | Reinvestment of distributions | | | 14,639,593 | | | | 14,561,935 | |
| | Cost of shares redeemed | | | (218,613,151 | ) | | | (294,150,887 | ) |
| | Net decrease in net assets resulting from share transactions | | | (34,562,046 | ) | | | (69,253,579 | ) |
| | TOTAL INCREASE (DECREASE) | | | (5,595,327 | ) | | | (29,419,127 | ) |
| | | | | | | | | | |
| | Net assets: | | | | | | | | |
| | Beginning of year | | | 577,674,296 | | | | 607,093,423 | |
| | End of year | | $ | 572,078,969 | | | $ | 577,674,296 | |
| | Undistributed (distributions in excess of) net investment income | | $ | 238,582 | | | $ | 264,846 | |
| | |
| 58 | | The accompanying notes are an integral part of these financial statements. |
GOLDMAN SACHS FUND OF FUNDS PORTFOLIOS
| | | | | | | | | | | | | | | | | | | | | | |
| | | Equity Growth Strategy Portfolio | | | | | Growth and Income Strategy Portfolio | |
| | | For the Fiscal
Year Ended
December 31, 2013 | | | | | For the Fiscal
Year Ended
December 31, 2012 | | | | | For the Fiscal
Year Ended
December 31, 2013
| | | | | For the Fiscal
Year Ended
December 31, 2012 | |
| | | | | | | | | | | | | | | | | | | | | | |
| | $ | 5,263,313 | | | | | $ | 6,420,570 | | | | | $ | 18,066,248 | | | | | $ | 16,821,975 | |
| | | 37,718,041 | | | | | | 15,991,669 | | | | | | 103,486,546 | | | | | | 68,314,839 | |
| | | 37,058,796 | | | | | | 38,066,544 | | | | | | 5,775,341 | | | | | | 46,984,908 | |
| | | 80,040,150 | | | | | | 60,478,783 | | | | | | 127,328,135 | | | | | | 132,121,722 | |
| | | | | | | | | | | | | | | | | | | | | | |
| | | | | | | | | | | | | | | | | | | | | | |
| | | | | | | | | | | | | | | | | | | | | | |
| | | (2,331,427 | ) | | | | | (2,673,271 | ) | | | | | (8,733,352 | ) | | | | | (12,556,074 | ) |
| | | (128,265 | ) | | | | | (215,276 | ) | | | | | (714,962 | ) | | | | | (1,076,859 | ) |
| | | (955,353 | ) | | | | | (1,287,853 | ) | | | | | (3,165,016 | ) | | | | | (3,900,980 | ) |
| | | (2,362,004 | ) | | | | | (2,169,434 | ) | | | | | (8,126,792 | ) | | | | | (6,653,749 | ) |
| | | (10,657 | ) | | | | | (5,760 | ) | | | | | (76,330 | ) | | | | | (92,004 | ) |
| | | (67,648 | ) | | | | | (11,010 | ) | | | | | (57,830 | ) | | | | | (41,840 | ) |
| | | (45,154 | ) | | | | | (86,405 | ) | | | | | (64,133 | ) | | | | | (89,148 | ) |
| | | (5,900,508 | ) | | | | | (6,449,009 | ) | | | | | (20,938,415 | ) | | | | | (24,410,654 | ) |
| | | | | | | | | | | | | | | | | | | | | | |
| | | | | | | | | | | | | | | | | | | | | | |
| | | 45,791,704 | | | | | | 74,093,950 | | | | | | 162,958,165 | | | | | | 212,615,443 | |
| | | 5,528,142 | | | | | | 5,985,711 | | | | | | 19,470,877 | | | | | | 22,511,989 | |
| | | (84,936,120 | ) | | | | | (162,490,004 | ) | | | | | (286,382,191 | ) | | | | | (528,521,025 | ) |
| | | (33,616,274 | ) | | | | | (82,410,343 | ) | | | | | (103,953,149 | ) | | | | | (293,393,593 | ) |
| | | 40,523,368 | | | | | | (28,380,569 | ) | | | | | 2,436,571 | | | | | | (185,682,525 | ) |
| | | | | | | | | | | | | | | | | | | | | | |
| | | | | | | | | | | | | | | | | | | | | | |
| | | 366,534,470 | | | | | | 394,915,039 | | | | | | 1,037,700,487 | | | | | | 1,223,383,012 | |
| | $ | 407,057,838 | | | | | $ | 366,534,470 | | | | | $ | 1,040,137,058 | | | | | $ | 1,037,700,487 | |
| | $ | 86,454 | | | | | $ | 170,278 | | | | | $ | 247,111 | | | | | $ | 241,946 | |
| | |
| The accompanying notes are an integral part of these financial statements. | | 59 |
GOLDMAN SACHS FUND OF FUNDS PORTFOLIOS
Statements of Changes in Net Assets (continued)
| | | | | | | | | | |
| | | | | Growth Strategy Portfolio | |
| | | | | For the Fiscal
Year Ended
December 31, 2013 | | | For the Fiscal
Year Ended
December 31, 2012 | |
| | From operations: | | | | | | | | |
| | Net investment income | | $ | 9,522,910 | | | $ | 13,519,853 | |
| | Net realized gain (loss) | | | 90,983,679 | | | | 42,151,721 | |
| | Net change in unrealized gain (loss) | | | 46,293,399 | | | | 70,599,360 | |
| | Net increase (decrease) in net assets resulting from operations | | | 146,799,988 | | | | 126,270,934 | |
| | | | | | | | | | |
| | Distributions to shareholders: | | | | | | | | |
| | From net investment income | | | | | | | | |
| | Class A Shares | | | (5,478,932 | ) | | | (8,486,632 | ) |
| | Class B Shares | | | (253,432 | ) | | | (788,283 | ) |
| | Class C Shares | | | (1,431,540 | ) | | | (3,234,948 | ) |
| | Institutional Shares | | | (4,347,999 | ) | | | (4,515,835 | ) |
| | Service Shares | | | (45,660 | ) | | | (68,320 | ) |
| | Class IR Shares | | | (57,342 | ) | | | (37,449 | ) |
| | Class R Shares | | | (52,102 | ) | | | (102,502 | ) |
| | From net realized gains | | | | | | | | |
| | Class A Shares | | | — | | | | — | |
| | Class C Shares | | | — | | | | — | |
| | Institutional Shares | | | — | | | | — | |
| | Service Shares | | | — | | | | — | |
| | Class IR Shares | | | — | | | | — | |
| | Class R Shares | | | — | | | | — | |
| | Total distributions to shareholders | | | (11,667,007 | ) | | | (17,233,969 | ) |
| | | | | | | | | | |
| | From share transactions: | | | | | | | | |
| | Proceeds from sales of shares | | | 106,874,570 | | | | 151,847,016 | |
| | Reinvestment of distributions | | | 10,992,088 | | | | 15,909,495 | |
| | Cost of shares redeemed | | | (202,564,064 | ) | | | (404,557,570 | ) |
| | Net increase (decrease) in net assets resulting from share transactions | | | (84,697,406 | ) | | | (236,801,059 | ) |
| | TOTAL INCREASE (DECREASE) | | | 50,435,575 | | | | (127,764,094 | ) |
| | | | | | | | | | |
| | Net assets: | | | | | | | | |
| | Beginning of year | | | 863,079,516 | | | | 990,843,610 | |
| | End of year | | $ | 913,515,091 | | | $ | 863,079,516 | |
| | Undistributed (distributions in excess of) net investment income | | $ | 491,819 | | | $ | 265,306 | |
| | |
| 60 | | The accompanying notes are an integral part of these financial statements. |
GOLDMAN SACHS FUND OF FUNDS PORTFOLIOS
| | | | | | | | | | | | | | | | | | | | | | |
| | | Income Strategies Portfolio | | | | | Satellite Strategies Portfolio | |
| | | For the Fiscal
Year Ended
December 31, 2013 | | | | | For the Fiscal
Year Ended
December 31, 2012 | | | | | For the Fiscal
Year Ended
December 31, 2013 | | | | | For the Fiscal
Year Ended
December 31, 2012 | |
| | | | | | | | | | | | | | | | | | | | | | |
| | $ | 1,349,576 | | | | | $ | 1,214,151 | | | | | $ | 45,760,834 | | | | | $ | 50,676,032 | |
| | | 490,063 | | | | | | 2,013,486 | | | | | | 9,512,487 | | | | | | (949 | ) |
| | | (1,901,708 | ) | | | | | 1,479,030 | | | | | | (20,693,522 | ) | | | | | 123,599,202 | |
| | | (62,069 | ) | | | | | 4,706,667 | | | | | | 34,579,799 | | | | | | 174,274,285 | |
| | | | | | | | | | | | | | | | | | | | | | |
| | | | | | | | | | | | | | | | | | | | | | |
| | | | | | | | | | | | | | | | | | | | | | |
| | | (512,598 | ) | | | | | (683,029 | ) | | | | | (8,294,943 | ) | | | | | (9,936,450 | ) |
| | | — | | | | | | — | | | | | | — | | | | | | — | |
| | | (407,721 | ) | | | | | (396,098 | ) | | | | | (3,250,031 | ) | | | | | (4,409,370 | ) |
| | | (401,595 | ) | | | | | (239,468 | ) | | | | | (32,495,398 | ) | | | | | (34,291,638 | ) |
| | | — | | | | | | — | | | | | | (1,005,197 | ) | | | | | (1,461,078 | ) |
| | | (126,126 | ) | | | | | (92,298 | ) | | | | | (3,299,388 | ) | | | | | (3,116,530 | ) |
| | | (5,642 | ) | | | | | (4,251 | ) | | | | | (123,145 | ) | | | | | (109,742 | ) |
| | | | | | | | | | | | | | | | | | | | | | |
| | | — | | | | | | — | | | | | | — | | | | | | (745,491 | ) |
| | | — | | | | | | — | | | | | | — | | | | | | (390,399 | ) |
| | | — | | | | | | — | | | | | | — | | | | | | (2,389,754 | ) |
| | | — | | | | | | — | | | | | | — | | | | | | (111,879 | ) |
| | | — | | | | | | — | | | | | | — | | | | | | (219,387 | ) |
| | | — | | | | | | — | | | | | | — | | | | | | (8,278 | ) |
| | | (1,453,682 | ) | | | | | (1,415,144 | ) | | | | | (48,468,102 | ) | | | | | (57,189,996 | ) |
| | | | | | | | | | | | | | | | | | | | | | |
| | | | | | | | | | | | | | | | | | | | | | |
| | | 11,969,864 | | | | | | 12,371,781 | | | | | | 488,941,877 | | | | | | 476,033,523 | |
| | | 1,337,339 | | | | | | 1,293,921 | | | | | | 37,051,471 | | | | | | 43,851,790 | |
| | | (14,764,373 | ) | | | | | (21,935,315 | ) | | | | | (483,281,612 | ) | | | | | (336,307,957 | ) |
| | | (1,457,170 | ) | | | | | (8,269,613 | ) | | | | | 42,711,736 | | | | | | 183,577,356 | |
| | | (2,972,921 | ) | | | | | (4,978,090 | ) | | | | | 28,823,433 | | | | | | 300,661,645 | |
| | | | | | | | | | | | | | | | | | | | | | |
| | | | | | | | | | | | | | | | | | | | | | |
| | | 33,419,009 | | | | | | 38,397,099 | | | | | | 1,298,481,930 | | | | | | 997,820,285 | |
| | $ | 30,446,088 | | | | | $ | 33,419,009 | | | | | $ | 1,327,305,363 | | | | | $ | 1,298,481,930 | |
| | $ | 21,375 | | | | | $ | 24,343 | | | | | $ | 634,438 | | | | | $ | 425,751 | |
| | |
| The accompanying notes are an integral part of these financial statements. | | 61 |
GOLDMAN SACHS BALANCED STRATEGY PORTFOLIO
Financial Highlights
Selected Data for a Share Outstanding Throughout Each Year
| | | | | | | | | | | | | | | | | | | | | | |
| | | | | | | | Income (loss) from
investment operations | | | | |
| | | Year - Share Class | | Net asset
value,
beginning
of year | | | Net
investment
income(a)(b) | | | Net realized and unrealized gain (loss) | | | Total from
investment
operations | | | Distributions
to shareholders
from net
investment
income | |
| | FOR THE FISCAL YEARS ENDED DECEMBER 31, | |
| | 2013 - A | | $ | 10.56 | | | $ | 0.25 | | | $ | 0.61 | �� | | $ | 0.86 | | | $ | (0.29 | ) |
| | 2013 - B | | | 10.56 | | | | 0.16 | | | | 0.63 | | | | 0.79 | | | | (0.21 | ) |
| | 2013 - C | | | 10.56 | | | | 0.17 | | | | 0.61 | | | | 0.78 | | | | (0.21 | ) |
| | 2013 - Institutional | | | 10.56 | | | | 0.33 | | | | 0.58 | | | | 0.91 | | | | (0.34 | ) |
| | 2013 - Service | | | 10.59 | | | | 0.23 | | | | 0.62 | | | | 0.85 | | | | (0.28 | ) |
| | 2013 - IR | | | 10.53 | | | | 0.37 | | | | 0.51 | | | | 0.88 | | | | (0.32 | ) |
| | 2013 - R | | | 10.51 | | | | 0.23 | | | | 0.61 | | | | 0.84 | | | | (0.27 | ) |
| | 2012 - A | | | 9.86 | | | | 0.16 | | | | 0.82 | | | | 0.98 | | | | (0.28 | ) |
| | 2012 - B | | | 9.86 | | | | 0.08 | | | | 0.82 | | | | 0.90 | | | | (0.20 | ) |
| | 2012 - C | | | 9.86 | | | | 0.09 | | | | 0.81 | | | | 0.90 | | | | (0.20 | ) |
| | 2012 - Institutional | | | 9.87 | | | | 0.23 | | | | 0.79 | | | | 1.02 | | | | (0.33 | ) |
| | 2012 - Service | | | 9.88 | | | | 0.15 | | | | 0.83 | | | | 0.98 | | | | (0.27 | ) |
| | 2012 - IR | | | 9.83 | | | | 0.22 | | | | 0.79 | | | | 1.01 | | | | (0.31 | ) |
| | 2012 - R | | | 9.82 | | | | 0.15 | | | | 0.80 | | | | 0.95 | | | | (0.26 | ) |
| | 2011 - A | | | 10.22 | | | | 0.15 | | | | (0.34 | ) | | | (0.19 | ) | | | (0.17 | ) |
| | 2011 - B | | | 10.22 | | | | 0.07 | | | | (0.34 | ) | | | (0.27 | ) | | | (0.09 | ) |
| | 2011 - C | | | 10.22 | | | | 0.08 | | | | (0.35 | ) | | | (0.27 | ) | | | (0.09 | ) |
| | 2011 - Institutional | | | 10.23 | | | | 0.20 | | | | (0.35 | ) | | | (0.15 | ) | | | (0.21 | ) |
| | 2011 - Service | | | 10.25 | | | | 0.14 | | | | (0.35 | ) | | | (0.21 | ) | | | (0.16 | ) |
| | 2011 - IR | | | 10.21 | | | | 0.24 | | | | (0.42 | ) | | | (0.18 | ) | | | (0.20 | ) |
| | 2011 - R | | | 10.18 | | | | 0.14 | | | | (0.35 | ) | | | (0.21 | ) | | | (0.15 | ) |
| | 2010 - A | | | 9.65 | | | | 0.21 | | | | 0.60 | | | | 0.81 | | | | (0.24 | ) |
| | 2010 - B | | | 9.65 | | | | 0.13 | | | | 0.60 | | | | 0.73 | | | | (0.16 | ) |
| | 2010 - C | | | 9.65 | | | | 0.13 | | | | 0.60 | | | | 0.73 | | | | (0.16 | ) |
| | 2010 - Institutional | | | 9.66 | | | | 0.25 | | | | 0.60 | | | | 0.85 | | | | (0.28 | ) |
| | 2010 - Service | | | 9.67 | | | | 0.21 | | | | 0.60 | | | | 0.81 | | | | (0.23 | ) |
| | 2010 - IR | | | 9.64 | | | | 0.25 | | | | 0.58 | | | | 0.83 | | | | (0.26 | ) |
| | 2010 - R | | | 9.62 | | | | 0.24 | | | | 0.54 | | | | 0.78 | | | | (0.22 | ) |
| | 2009 - A | | | 8.39 | | | | 0.36 | | | | 1.29 | | | | 1.65 | | | | (0.39 | ) |
| | 2009 - B | | | 8.39 | | | | 0.29 | | | | 1.29 | | | | 1.58 | | | | (0.32 | ) |
| | 2009 - C | | | 8.39 | | | | 0.29 | | | | 1.29 | | | | 1.58 | | | | (0.32 | ) |
| | 2009 - Institutional | | | 8.39 | | | | 0.40 | | | | 1.29 | | | | 1.69 | | | | (0.42 | ) |
| | 2009 - Service | | | 8.41 | | | | 0.33 | | | | 1.31 | | | | 1.64 | | | | (0.38 | ) |
| | 2009 - IR | | | 8.38 | | | | 0.51 | | | | 1.16 | | | | 1.67 | | | | (0.41 | ) |
| | 2009 - R | | | 8.38 | | | | 0.46 | | | | 1.16 | | | | 1.62 | | | | (0.38 | ) |
| | (a) | | Calculated based on the average shares outstanding methodology. |
| | (b) | | Recognition of net investment income by the Portfolio is affected by the timing of declaration of dividends by the Underlying Funds in which the Portfolio invests. |
| | (c) | | Assumes investment at the net asset value at the beginning of the year, reinvestment of all dividends and distributions, a complete redemption of the investment at the net asset value at the end of the year and no sales or redemption charges. Total returns would be reduced if a sales or redemption charge was taken into account. Returns do not reflect the deduction of taxes that a shareholder would pay on Portfolio distributions or the redemption of Portfolio shares. |
| | (d) | | Expense ratios exclude the expenses of the Underlying Funds in which the Portfolio invests. |
| | (e) | | The Portfolio’s portfolio turnover rate is calculated in accordance with regulatory requirements, without regard to transactions involving short term investments and certain derivatives. If such transactions were included, the Portfolio’s portfolio turnover rate may be higher. |
| | |
| 62 | | The accompanying notes are an integral part of these financial statements. |
GOLDMAN SACHS BALANCED STRATEGY PORTFOLIO
| | | | | | | | | | | | | | | | | | | | | | | | | | | | | | | | | | | | | | | | |
| | | | | | | | | | | | | | | | | | | | | | | | | | | | | | | | | | |
| | | Net asset
value, end
of year | | | | | Total
return(c) | | | | | Net assets,
end of
year
(in 000s) | | | | | Ratio of
net expenses
to average
net assets(d) | | | | | Ratio of
total expenses
to average
net assets(d) | | | | | Ratio of
net investment
income
to average
net assets(b) | | | | | Portfolio
turnover
rate(e) | |
| | | | | | | | | | | | | | | | | | | | | | | | | | | | | | | | | | | | | | | | |
| | $ | 11.13 | | | | | | 8.23 | % | | $ | | | 186,034 | | | | | | 0.60 | % | | | | | 0.65 | % | | | | | 2.29 | % | | | | | 63 | % |
| | | 11.14 | | | | | | 7.46 | | | | | | 13,080 | | | | | | 1.34 | | | | | | 1.40 | | | | | | 1.43 | | | | | | 63 | |
| | | 11.13 | | | | | | 7.42 | | | | | | 74,053 | | | | | | 1.34 | | | | | | 1.40 | | | | | | 1.57 | | | | | | 63 | |
| | | 11.13 | | | | | | 8.67 | | | | | | 287,623 | | | | | | 0.20 | | | | | | 0.25 | | | | | | 2.99 | | | | | | 63 | |
| | | 11.16 | | | | | | 8.08 | | | | | | 1,736 | | | | | | 0.69 | | | | | | 0.75 | | | | | | 2.14 | | | | | | 63 | |
| | | 11.09 | | | | | | 8.45 | | | | | | 3,938 | | | | | | 0.35 | | | | | | 0.40 | | | | | | 3.37 | | | | | | 63 | |
| | | 11.08 | | | | | | 8.00 | | | | | | 5,615 | | | | | | 0.84 | | | | | | 0.90 | | | | | | 2.07 | | | | | | 63 | |
| | | 10.56 | | | | | | 9.96 | | | | | | 219,919 | | | | | | 0.59 | | | | | | 0.65 | | | | | | 1.55 | | | | | | 66 | |
| | | 10.56 | | | | | | 9.14 | | | | | | 17,959 | | | | | | 1.35 | | | | | | 1.40 | | | | | | 0.81 | | | | | | 66 | |
| | | 10.56 | | | | | | 9.16 | | | | | | 81,123 | | | | | | 1.34 | | | | | | 1.40 | | | | | | 0.87 | | | | | | 66 | |
| | | 10.56 | | | | | | 10.32 | | | | | | 247,494 | | | | | | 0.19 | | | | | | 0.25 | | | | | | 2.23 | | | | | | 66 | |
| | | 10.59 | | | | | | 9.95 | | | | | | 2,022 | | | | | | 0.69 | | | | | | 0.75 | | | | | | 1.48 | | | | | | 66 | |
| | | 10.53 | | | | | | 10.29 | | | | | | 920 | | | | | | 0.34 | | | | | | 0.40 | | | | | | 2.14 | | | | | | 66 | |
| | | 10.51 | | | | | | 9.66 | | | | | | 8,237 | | | | | | 0.84 | | | | | | 0.90 | | | | | | 1.49 | | | | | | 66 | |
| | | 9.86 | | | | | | (1.88 | ) | | | | | 327,283 | | | | | | 0.59 | | | | | | 0.64 | | | | | | 1.49 | | | | | | 38 | |
| | | 9.86 | | | | | | (2.65 | ) | | | | | 23,444 | | | | | | 1.34 | | | | | | 1.39 | | | | | | 0.72 | | | | | | 38 | |
| | | 9.86 | | | | | | (2.64 | ) | | | | | 94,041 | | | | | | 1.34 | | | | | | 1.39 | | | | | | 0.73 | | | | | | 38 | |
| | | 9.87 | | | | | | (1.48 | ) | | | | | 151,822 | | | | | | 0.19 | | | | | | 0.24 | | | | | | 1.96 | | | | | | 38 | |
| | | 9.88 | | | | | | (2.09 | ) | | | | | 2,466 | | | | | | 0.69 | | | | | | 0.74 | | | | | | 1.36 | | | | | | 38 | |
| | | 9.83 | | | | | | (1.79 | ) | | | | | 750 | | | | | | 0.34 | | | | | | 0.39 | | | | | | 2.38 | | | | | | 38 | |
| | | 9.82 | | | | | | (2.11 | ) | | | | | 7,288 | | | | | | 0.84 | | | | | | 0.89 | | | | | | 1.38 | | | | | | 38 | |
| | | 10.22 | | | | | | 8.46 | | | | | | 427,998 | | | | | | 0.59 | | | | | | 0.64 | | | | | | 2.15 | | | | | | 38 | |
| | | 10.22 | | | | | | 7.62 | | | | | | 32,659 | | | | | | 1.34 | | | | | | 1.39 | | | | | | 1.36 | | | | | | 38 | |
| | | 10.22 | | | | | | 7.64 | | | | | | 126,032 | | | | | | 1.34 | | | | | | 1.39 | | | | | | 1.34 | | | | | | 38 | |
| | | 10.23 | | | | | | 8.89 | | | | | | 147,670 | | | | | | 0.19 | | | | | | 0.24 | | | | | | 2.57 | | | | | | 38 | |
| | | 10.25 | | | | | | 8.44 | | | | | | 3,971 | | | | | | 0.69 | | | | | | 0.74 | | | | | | 2.14 | | | | | | 38 | |
| | | 10.21 | | | | | | 8.74 | | | | | | 771 | | | | | | 0.34 | | | | | | 0.39 | | | | | | 2.55 | | | | | | 38 | |
| | | 10.18 | | | | | | 8.21 | | | | | | 5,063 | | | | | | 0.84 | | | | | | 0.89 | | | | | | 2.47 | | | | | | 38 | |
| | | 9.65 | | | | | | 19.94 | | | | | | 444,114 | | | | | | 0.59 | | | | | | 0.65 | | | | | | 4.03 | | | | | | 58 | |
| | | 9.65 | | | | | | 19.03 | | | | | | 37,883 | | | | | | 1.34 | | | | | | 1.40 | | | | | | 3.27 | | | | | | 58 | |
| | | 9.65 | | | | | | 19.05 | | | | | | 144,726 | | | | | | 1.34 | | | | | | 1.40 | | | | | | 3.26 | | | | | | 58 | |
| | | 9.66 | | | | | | 20.53 | | | | | | 140,770 | | | | | | 0.19 | | | | | | 0.25 | | | | | | 4.43 | | | | | | 58 | |
| | | 9.67 | | | | | | 19.75 | | | | | | 3,710 | | | | | | 0.69 | | | | | | 0.75 | | | | | | 3.74 | | | | | | 58 | |
| | | 9.64 | | | | | | 20.28 | | | | | | 32 | | | | | | 0.34 | | | | | | 0.40 | | | | | | 5.65 | | | | | | 58 | |
| | | 9.62 | | | | | | 19.66 | | | | | | 848 | | | | | | 0.84 | | | | | | 0.90 | | | | | | 5.01 | | | | | | 58 | |
| | |
| The accompanying notes are an integral part of these financial statements. | | 63 |
GOLDMAN SACHS EQUITY GROWTH STRATEGY PORTFOLIO
Financial Highlights
Selected Data for a Share Outstanding Throughout Each Year
| | | | | | | | | | | | | | | | | | | | | | |
| | | | | | | | Income (loss) from
investment operations | | | | |
| | | Year - Share Class | | Net asset
value,
beginning
of year | | | Net
investment
income(a)(b) | | | Net realized and unrealized gain (loss) | | | Total from
investment
operations | | | Distributions
to shareholders
from net
investment
income | |
| | FOR THE FISCAL YEARS ENDED DECEMBER 31, | |
| | 2013 - A | | $ | 11.75 | | | $ | 0.19 | | | $ | 2.57 | | | $ | 2.76 | | | $ | (0.22 | ) |
| | 2013 - B | | | 11.32 | | | | 0.08 | | | | 2.47 | | | | 2.55 | | | | (0.11 | ) |
| | 2013 - C | | | 11.26 | | | | 0.08 | | | | 2.46 | | | | 2.54 | | | | (0.12 | ) |
| | 2013 - Institutional | | | 11.85 | | | | 0.27 | | | | 2.57 | | | | 2.84 | | | | (0.28 | ) |
| | 2013 - Service | | | 11.71 | | | | 0.19 | | | | 2.54 | | | | 2.73 | | | | (0.22 | ) |
| | 2013 - IR | | | 11.62 | | | | 0.47 | | | | 2.29 | | | | 2.76 | | | | (0.27 | ) |
| | 2013 - R | | | 11.64 | | | | 0.11 | | | | 2.59 | | | | 2.70 | | | | (0.17 | ) |
| | 2012 - A | | | 10.23 | | | | 0.21 | | | | 1.53 | | | | 1.74 | | | | (0.22 | ) |
| | 2012 - B | | | 9.87 | | | | 0.11 | | | | 1.48 | | | | 1.59 | | | | (0.14 | ) |
| | 2012 - C | | | 9.82 | | | | 0.12 | | | | 1.46 | | | | 1.58 | | | | (0.14 | ) |
| | 2012 - Institutional | | | 10.33 | | | | 0.28 | | | | 1.52 | | | | 1.80 | | | | (0.28 | ) |
| | 2012 - Service | | | 10.14 | | | | 0.16 | | | | 1.55 | | | | 1.71 | | | | (0.14 | ) |
| | 2012 - IR | | | 10.13 | | | | 0.24 | | | | 1.51 | | | | 1.75 | | | | (0.26 | ) |
| | 2012 - R | | | 10.16 | | | | 0.20 | | | | 1.49 | | | | 1.69 | | | | (0.21 | ) |
| | 2011 - A | | | 11.33 | | | | 0.20 | | | | (1.05 | ) | | | (0.85 | ) | | | (0.25 | ) |
| | 2011 - B | | | 10.93 | | | | 0.11 | | | | (1.01 | ) | | | (0.90 | ) | | | (0.16 | ) |
| | 2011 - C | | | 10.88 | | | | 0.11 | | | | (1.01 | ) | | | (0.90 | ) | | | (0.16 | ) |
| | 2011 - Institutional | | | 11.45 | | | | 0.25 | | | | (1.07 | ) | | | (0.82 | ) | | | (0.30 | ) |
| | 2011 - Service | | | 11.22 | | | | 0.16 | | | | (1.02 | ) | | | (0.86 | ) | | | (0.22 | ) |
| | 2011 - IR | | | 11.23 | | | | 0.27 | | | | (1.08 | ) | | | (0.81 | ) | | | (0.29 | ) |
| | 2011 - R | | | 11.26 | | | | 0.21 | | | | (1.08 | ) | | | (0.87 | ) | | | (0.23 | ) |
| | 2010 - A | | | 10.24 | | | | 0.19 | | | | 1.11 | | | | 1.30 | | | | (0.21 | ) |
| | 2010 - B | | | 9.88 | | | | 0.11 | | | | 1.06 | | | | 1.17 | | | | (0.12 | ) |
| | 2010 - C | | | 9.84 | | | | 0.10 | | | | 1.06 | | | | 1.16 | | | | (0.12 | ) |
| | 2010 - Institutional | | | 10.35 | | | | 0.27 | | | | 1.08 | | | | 1.35 | | | | (0.25 | ) |
| | 2010 - Service | | | 10.14 | | | | 0.17 | | | | 1.10 | | | | 1.27 | | | | (0.19 | ) |
| | 2010 - IR | | | 10.16 | | | | 0.24 | | | | 1.07 | | | | 1.31 | | | | (0.24 | ) |
| | 2010 - R | | | 10.22 | | | | 0.41 | | | | 0.85 | | | | 1.26 | | | | (0.22 | ) |
| | 2009 - A | | | 8.04 | | | | 0.16 | | | | 2.19 | | | | 2.35 | | | | (0.15 | ) |
| | 2009 - B | | | 7.77 | | | | 0.09 | | | | 2.10 | | | | 2.19 | | | | (0.08 | ) |
| | 2009 - C | | | 7.73 | | | | 0.09 | | | | 2.10 | | | | 2.19 | | | | (0.08 | ) |
| | 2009 - Institutional | | | 8.12 | | | | 0.19 | | | | 2.23 | | | | 2.42 | | | | (0.19 | ) |
| | 2009 - Service | | | 7.96 | | | | 0.15 | | | | 2.17 | | | | 2.32 | | | | (0.14 | ) |
| | 2009 - IR | | | 7.98 | | | | 0.84 | | | | 1.53 | | | | 2.37 | | | | (0.19 | ) |
| | 2009 - R | | | 8.01 | | | | 0.27 | | | | 2.09 | | | | 2.36 | | | | (0.15 | ) |
| | (a) | | Calculated based on the average shares outstanding methodology. |
| | (b) | | Recognition of net investment income by the Portfolio is affected by the timing of declaration of dividends by the Underlying Funds in which the Portfolio invests. |
| | (c) | | Assumes investment at the net asset value at the beginning of the year, reinvestment of all dividends and distributions, a complete redemption of the investment at the net asset value at the end of the year and no sales or redemption charges. Total returns would be reduced if a sales or redemption charge was taken into account. Returns do not reflect the deduction of taxes that a shareholder would pay on Portfolio distributions or the redemption of Portfolio shares. |
| | (d) | | Expense ratios exclude the expenses of the Underlying Funds in which the Portfolio invests. |
| | (e) | | The Portfolio’s portfolio turnover rate is calculated in accordance with regulatory requirements, without regard to transactions involving short term investments and certain derivatives. If such transactions were included, the Portfolio’s portfolio turnover rate may be higher. |
| | |
| 64 | | The accompanying notes are an integral part of these financial statements. |
GOLDMAN SACHS EQUITY GROWTH STRATEGY PORTFOLIO
| | | | | | | | | | | | | | | | | | | | | | | | | | | | | | | | | | | | | | | | |
| | | | | | | | | | | | | | | | | | | | | | | | | | | | | | | | | | |
| | | Net asset
value, end
of year | | | | | Total
return(c) | | | | | Net assets,
end of
year
(in 000s) | | | | | Ratio of
net expenses
to average
net assets(d) | | | | | Ratio of
total expenses
to average
net assets(d) | | | | | Ratio of
net investment
income
to average
net assets(b) | | | | | Portfolio
turnover
rate(e) | |
| | | | | | | | | | | | | | | | | | | | | | | | | | | | | | | | | | | | | | | | |
| | $ | 14.29 | | | | | | 23.51 | % | | | | $ | 152,264 | | | | | | 0.60 | % | | | | | 0.68 | % | | | | | 1.45 | % | | | | | 21 | % |
| | | 13.76 | | | | | | 22.53 | | | | | | 16,122 | | | | | | 1.35 | | | | | | 1.43 | | | | | | 0.60 | | | | | | 21 | |
| | | 13.68 | | | | | | 22.60 | | | | | | 106,208 | | | | | | 1.35 | | | | | | 1.43 | | | | | | 0.68 | | | | | | 21 | |
| | | 14.41 | | | | | | 23.96 | | | | | | 124,275 | | | | | | 0.20 | | | | | | 0.28 | | | | | | 2.07 | | | | | | 21 | |
| | | 14.22 | | | | | | 23.28 | | | | | | 715 | | | | | | 0.70 | | | | | | 0.78 | | | | | | 1.48 | | | | | | 21 | |
| | | 14.11 | | | | | | 23.77 | | | | | | 3,735 | | | | | | 0.35 | | | | | | 0.43 | | | | | | 3.55 | | | | | | 21 | |
| | | 14.17 | | | | | | 23.17 | | | | | | 3,740 | | | | | | 0.84 | | | | | | 0.93 | | | | | | 0.85 | | | | | | 21 | |
| | | 11.75 | | | | | | 16.95 | | | | | | 147,814 | | | | | | 0.59 | | | | | | 0.68 | | | | | | 1.85 | | | | | | 23 | |
| | | 11.32 | | | | | | 16.05 | | | | | | 17,941 | | | | | | 1.34 | | | | | | 1.43 | | | | | | 1.06 | | | | | | 23 | |
| | | 11.26 | | | | | | 16.10 | | | | | | 102,156 | | | | | | 1.34 | | | | | | 1.43 | | | | | | 1.10 | | | | | | 23 | |
| | | 11.85 | | | | | | 17.45 | | | | | | 92,696 | | | | | | 0.19 | | | | | | 0.26 | | | | | | 2.45 | | | | | | 23 | |
| | | 11.71 | | | | | | 16.85 | | | | | | 488 | | | | | | 0.70 | | | | | | 0.78 | | | | | | 1.43 | | | | | | 23 | |
| | | 11.62 | | | | | | 17.30 | | | | | | 494 | | | | | | 0.34 | | | | | | 0.42 | | | | | | 2.20 | | | | | | 23 | |
| | | 11.64 | | | | | | 16.59 | | | | | | 4,946 | | | | | | 0.84 | | | | | | 0.92 | | | | | | 1.79 | | | | | | 23 | |
| | | 10.23 | | | | | | (7.52 | ) | | | | | 208,169 | | | | | | 0.59 | | | | | | 0.66 | | | | | | 1.77 | | | | | | 18 | |
| | | 9.87 | | | | | | (8.26 | ) | | | | | 20,844 | | | | | | 1.34 | | | | | | 1.41 | | | | | | 1.03 | | | | | | 18 | |
| | | 9.82 | | | | | | (8.28 | ) | | | | | 112,247 | | | | | | 1.34 | | | | | | 1.41 | | | | | | 1.05 | | | | | | 18 | |
| | | 10.33 | | | | | | (7.16 | ) | | | | | 46,797 | | | | | | 0.19 | | | | | | 0.26 | | | | | | 2.20 | | | | | | 18 | |
| | | 10.14 | | | | | | (7.63 | ) | | | | | 1,246 | | | | | | 0.69 | | | | | | 0.76 | | | | | | 1.39 | | | | | | 18 | |
| | | 10.13 | | | | | | (7.25 | ) | | | | | 539 | | | | | | 0.34 | | | | | | 0.41 | | | | | | 2.45 | | | | | | 18 | |
| | | 10.16 | | | | | | (7.71 | ) | | | | | 5,073 | | | | | | 0.84 | | | | | | 0.91 | | | | | | 1.91 | | | | | | 18 | |
| | | 11.33 | | | | | | 12.66 | | | | | | 296,969 | | | | | | 0.59 | | | | | | 0.66 | | | | | | 1.79 | | | | | | 27 | |
| | | 10.93 | | | | | | 11.89 | | | | | | 29,225 | | | | | | 1.34 | | | | | | 1.41 | | | | | | 1.09 | | | | | | 27 | |
| | | 10.88 | | | | | | 11.83 | | | | | | 158,142 | | | | | | 1.34 | | | | | | 1.41 | | | | | | 1.04 | | | | | | 27 | |
| | | 11.45 | | | | | | 13.09 | | | | | | 59,900 | | | | | | 0.19 | | | | | | 0.26 | | | | | | 2.52 | | | | | | 27 | |
| | | 11.22 | | | | | | 12.53 | | | | | | 3,540 | | | | | | 0.69 | | | | | | 0.76 | | | | | | 1.61 | | | | | | 27 | |
| | | 11.23 | | | | | | 12.89 | | | | | | 553 | | | | | | 0.34 | | | | | | 0.41 | | | | | | 2.36 | | | | | | 27 | |
| | | 11.26 | | | | | | 12.34 | | | | | | 4,389 | | | | | | 0.84 | | | | | | 0.91 | | | | | | 3.90 | | | | | | 27 | |
| | | 10.24 | | | | | | 29.26 | | | | | | 340,567 | | | | | | 0.59 | | | | | | 0.67 | | | | | | 1.81 | | | | | | 34 | |
| | | 9.88 | | | | | | 28.22 | | | | | | 33,103 | | | | | | 1.34 | | | | | | 1.42 | | | | | | 1.01 | | | | | | 34 | |
| | | 9.84 | | | | | | 28.39 | | | | | | 182,232 | | | | | | 1.34 | | | | | | 1.42 | | | | | | 1.02 | | | | | | 34 | |
| | | 10.35 | | | | | | 29.81 | | | | | | 50,926 | | | | | | 0.19 | | | | | | 0.27 | | | | | | 2.22 | | | | | | 34 | |
| | | 10.14 | | | | | | 29.22 | | | | | | 4,770 | | | | | | 0.69 | | | | | | 0.77 | | | | | | 1.76 | | | | | | 34 | |
| | | 10.16 | | | | | | 29.70 | | | | | | 320 | | | | | | 0.34 | | | | | | 0.42 | | | | | | 8.65 | | | | | | 34 | |
| | | 10.22 | | | | | | 29.56 | | | | | | 285 | | | | | | 0.84 | | | | | | 0.92 | | | | | | 2.92 | | | | | | 34 | |
| | |
| The accompanying notes are an integral part of these financial statements. | | 65 |
GOLDMAN SACHS GROWTH AND INCOME STRATEGY PORTFOLIO
Financial Highlights
Selected Data for a Share Outstanding Throughout Each Year
| | | | | | | | | | | | | | | | | | | | | | |
| | | | | | | | Income (loss) from
investment operations | | | | |
| | | Year - Share Class | | Net asset
value,
beginning
of year | | | Net
investment
income(a)(b) | | | Net realized
and unrealized
gain (loss) | | | Total from
investment
operations | | | Distributions to shareholders
from net
investment
income | |
| | FOR THE FISCAL YEARS ENDED DECEMBER 31, | |
| | 2013 - A | | $ | 10.95 | | | $ | 0.20 | | | $ | 1.23 | | | $ | 1.43 | | | $ | (0.24 | ) |
| | 2013 - B | | | 10.89 | | | | 0.10 | | | | 1.23 | | | | 1.33 | | | | (0.19 | ) |
| | 2013 - C | | | 10.85 | | | | 0.12 | | | | 1.22 | | | | 1.34 | | | | (0.20 | ) |
| | 2013 - Institutional | | | 10.98 | | | | 0.28 | | | | 1.21 | | | | 1.49 | | | | (0.29 | ) |
| | 2013 - Service | | | 10.92 | | | | 0.20 | | | | 1.23 | | | | 1.43 | | | | (0.24 | ) |
| | 2013 - IR | | | 10.91 | | | | 0.29 | | | | 1.16 | | | | 1.45 | | | | (0.27 | ) |
| | 2013 - R | | | 10.90 | | | | 0.16 | | | | 1.24 | | | | 1.40 | | | | (0.22 | ) |
| | 2012 - A | | | 9.98 | | | | 0.17 | | | | 1.07 | | | | 1.24 | | | | (0.27 | ) |
| | 2012 - B | | | 9.95 | | | | 0.09 | | | | 1.05 | | | | 1.14 | | | | (0.20 | ) |
| | 2012 - C | | | 9.92 | | | | 0.09 | | | | 1.04 | | | | 1.13 | | | | (0.20 | ) |
| | 2012 - Institutional | | | 10.02 | | | | 0.24 | | | | 1.03 | | | | 1.27 | | | | (0.31 | ) |
| | 2012 - Service | | | 9.97 | | | | 0.17 | | | | 1.04 | | | | 1.21 | | | | (0.26 | ) |
| | 2012 - IR | | | 9.95 | | | | 0.20 | | | | 1.05 | | | | 1.25 | | | | (0.29 | ) |
| | 2012 - R | | | 9.94 | | | | 0.16 | | | | 1.04 | | | | 1.20 | | | | (0.24 | ) |
| | 2011 - A | | | 10.55 | | | | 0.17 | | | | (0.53 | ) | | | (0.36 | ) | | | (0.21 | ) |
| | 2011 - B | | | 10.53 | | | | 0.10 | | | | (0.54 | ) | | | (0.44 | ) | | | (0.14 | ) |
| | 2011 - C | | | 10.49 | | | | 0.10 | | | | (0.53 | ) | | | (0.43 | ) | | | (0.14 | ) |
| | 2011 - Institutional | | | 10.59 | | | | 0.22 | | | | (0.54 | ) | | | (0.32 | ) | | | (0.25 | ) |
| | 2011 - Service | | | 10.53 | | | | 0.17 | | | | (0.53 | ) | | | (0.36 | ) | | | (0.20 | ) |
| | 2011 - IR | | | 10.52 | | | | 0.40 | | | | (0.73 | ) | | | (0.33 | ) | | | (0.24 | ) |
| | 2011 - R | | | 10.52 | | | | 0.18 | | | | (0.57 | ) | | | (0.39 | ) | | | (0.19 | ) |
| | 2010 - A | | | 9.81 | | | | 0.22 | | | | 0.76 | | | | 0.98 | | | | (0.24 | ) |
| | 2010 - B | | | 9.79 | | | | 0.15 | | | | 0.76 | | | | 0.91 | | | | (0.17 | ) |
| | 2010 - C | | | 9.76 | | | | 0.15 | | | | 0.75 | | | | 0.90 | | | | (0.17 | ) |
| | 2010 - Institutional | | | 9.84 | | | | 0.27 | | | | 0.77 | | | | 1.04 | | | | (0.29 | ) |
| | 2010 - Service | | | 9.79 | | | | 0.23 | | | | 0.75 | | | | 0.98 | | | | (0.24 | ) |
| | 2010 - IR | | | 9.79 | | | | 0.27 | | | | 0.73 | | | | 1.00 | | | | (0.27 | ) |
| | 2010 - R | | | 9.78 | | | | 0.30 | | | | 0.67 | | | | 0.97 | | | | (0.23 | ) |
| | 2009 - A | | | 8.11 | | | | 0.35 | | | | 1.71 | | | | 2.06 | | | | (0.36 | ) |
| | 2009 - B | | | 8.10 | | | | 0.29 | | | | 1.70 | | | | 1.99 | | | | (0.30 | ) |
| | 2009 - C | | | 8.07 | | | | 0.28 | | | | 1.71 | | | | 1.99 | | | | (0.30 | ) |
| | 2009 - Institutional | | | 8.14 | | | | 0.34 | | | | 1.76 | | | | 2.10 | | | | (0.40 | ) |
| | 2009 - Service | | | 8.10 | | | | 0.32 | | | | 1.72 | | | | 2.04 | | | | (0.35 | ) |
| | 2009 - IR | | | 8.10 | | | | 0.28 | | | | 1.79 | | | | 2.07 | | | | (0.38 | ) |
| | 2009 - R | | | 8.10 | | | | 0.75 | | | | 1.28 | | | | 2.03 | | | | (0.35 | ) |
| | (a) | | Calculated based on the average shares outstanding methodology. |
| | (b) | | Recognition of net investment income by the Portfolio is affected by the timing of declaration of dividends by the Underlying Funds in which the Portfolio invests. |
| | (c) | | Assumes investment at the net asset value at the beginning of the year, reinvestment of all dividends and distributions, a complete redemption of the investment at the net asset value at the end of the year and no sales or redemption charges. Total returns would be reduced if a sales or redemption charge was taken into account. Returns do not reflect the deduction of taxes that a shareholder would pay on Portfolio distributions or the redemption of Portfolio shares. |
| | (d) | | Expense ratios exclude the expenses of the Underlying Funds in which the Portfolio invests. |
| | (e) | | The Portfolio’s portfolio turnover rate is calculated in accordance with regulatory requirements, without regard to transactions involving short term investments and certain derivatives. If such transactions were included, the Portfolio’s portfolio turnover rate may be higher. |
| | |
| 66 | | The accompanying notes are an integral part of these financial statements. |
GOLDMAN SACHS GROWTH AND INCOME STRATEGY PORTFOLIO
| | | | | | | | | | | | | | | | | | | | | | | | | | | | | | | | | | | | | | | | |
| | | | | | | | | | | | | | | | | | | | | | | | | | | | | | | | | | |
| | | Net asset
value, end
of year | | | | | Total
return(c) | | | | | Net assets,
end of
year
(in 000s) | | | | | Ratio of
net expenses
to average
net assets(d) | | | | | Ratio of
total expenses
to average
net assets(d) | | | | | Ratio of
net investment
income
to average
net assets(b) | | | | | Portfolio
turnover
rate(e) | |
| | | | | | | | | | | | | | | | | | | | | | | | | | | | | | | | | | | | | | | | |
| | $ | 12.14 | | | | | | 13.10 | % | | | | $ | 435,812 | | | | | | 0.60 | % | | | | | 0.63 | % | | | | | 1.74 | % | | | | | 50 | % |
| | | 12.03 | | | | | | 12.26 | | | | | | 44,858 | | | | | | 1.34 | | | | | | 1.38 | | | | | | 0.89 | | | | | | 50 | |
| | | 11.99 | | | | | | 12.32 | | | | | | 196,121 | | | | | | 1.34 | | | | | | 1.38 | | | | | | 1.02 | | | | | | 50 | |
| | | 12.18 | | | | | | 13.63 | | | | | | 353,203 | | | | | | 0.20 | | | | | | 0.23 | | | | | | 2.36 | | | | | | 50 | |
| | | 12.11 | | | | | | 13.08 | | | | | | 3,917 | | | | | | 0.70 | | | | | | 0.73 | | | | | | 1.71 | | | | | | 50 | |
| | | 12.09 | | | | | | 13.36 | | | | | | 2,796 | | | | | | 0.35 | | | | | | 0.38 | | | | | | 2.46 | | | | | | 50 | |
| | | 12.08 | | | | | | 12.76 | | | | | | 3,430 | | | | | | 0.85 | | | | | | 0.88 | | | | | | 1.42 | | | | | | 50 | |
| | | 10.95 | | | | | | 12.40 | | | | | | 491,921 | | | | | | 0.59 | | | | | | 0.63 | | | | | | 1.61 | | | | | | 47 | |
| | | 10.89 | | | | | | 11.49 | | | | | | 58,399 | | | | | | 1.35 | | | | | | 1.38 | | | | | | 0.86 | | | | | | 47 | |
| | | 10.85 | | | | | | 11.42 | | | | | | 210,201 | | | | | | 1.34 | | | | | | 1.38 | | | | | | 0.89 | | | | | | 47 | |
| | | 10.98 | | | | | | 12.69 | | | | | | 267,744 | | | | | | 0.19 | | | | | | 0.22 | | | | | | 2.21 | | | | | | 47 | |
| | | 10.92 | | | | | | 12.13 | | | | | | 3,848 | | | | | | 0.69 | | | | | | 0.73 | | | | | | 1.59 | | | | | | 47 | |
| | | 10.91 | | | | | | 12.62 | | | | | | 1,519 | | | | | | 0.34 | | | | | | 0.38 | | | | | | 1.90 | | | | | | 47 | |
| | | 10.90 | | | | | | 12.12 | | | | | | 4,068 | | | | | | 0.84 | | | | | | 0.88 | | | | | | 1.54 | | | | | | 47 | |
| | | 9.98 | | | | | | (3.46 | ) | | | | | 750,376 | | | | | | 0.59 | | | | | | 0.62 | | | | | | 1.62 | | | | | | 35 | |
| | | 9.95 | | | | | | (4.18 | ) | | | | | 72,331 | | | | | | 1.34 | | | | | | 1.37 | | | | | | 0.90 | | | | | | 35 | |
| | | 9.92 | | | | | | (4.10 | ) | | | | | 250,381 | | | | | | 1.34 | | | | | | 1.37 | | | | | | 0.91 | | | | | | 35 | |
| | | 10.02 | | | | | | (3.04 | ) | | | | | 140,119 | | | | | | 0.19 | | | | | | 0.22 | | | | | | 2.12 | | | | | | 35 | |
| | | 9.97 | | | | | | (3.48 | ) | | | | | 4,073 | | | | | | 0.69 | | | | | | 0.72 | | | | | | 1.57 | | | | | | 35 | |
| | | 9.95 | | | | | | (3.18 | ) | | | | | 1,719 | | | | | | 0.34 | | | | | | 0.37 | | | | | | 3.99 | | | | | | 35 | |
| | | 9.94 | | | | | | (3.77 | ) | | | | | 4,384 | | | | | | 0.84 | | | | | | 0.87 | | | | | | 1.68 | | | | | | 35 | |
| | | 10.55 | | | | | | 10.12 | | | | | | 1,097,565 | | | | | | 0.59 | | | | | | 0.62 | | | | | | 2.24 | | | | | | 31 | |
| | | 10.53 | | | | | | 9.35 | | | | | | 102,328 | | | | | | 1.34 | | | | | | 1.37 | | | | | | 1.51 | | | | | | 31 | |
| | | 10.49 | | | | | | 9.27 | | | | | | 353,844 | | | | | | 1.34 | | | | | | 1.37 | | | | | | 1.46 | | | | | | 31 | |
| | | 10.59 | | | | | | 10.64 | | | | | | 154,835 | | | | | | 0.19 | | | | | | 0.22 | | | | | | 2.69 | | | | | | 31 | |
| | | 10.53 | | | | | | 10.04 | | | | | | 5,918 | | | | | | 0.69 | | | | | | 0.72 | | | | | | 2.27 | | | | | | 31 | |
| | | 10.52 | | | | | | 10.34 | | | | | | 210 | | | | | | 0.34 | | | | | | 0.37 | | | | | | 2.75 | | | | | | 31 | |
| | | 10.52 | | | | | | 9.96 | | | | | | 3,314 | | | | | | 0.84 | | | | | | 0.87 | | | | | | 3.02 | | | | | | 31 | |
| | | 9.81 | | | | | | 25.87 | | | | | | 1,272,519 | | | | | | 0.59 | | | | | | 0.63 | | | | | | 4.04 | | | | | | 40 | |
| | | 9.79 | | | | | | 24.84 | | | | | | 116,466 | | | | | | 1.34 | | | | | | 1.38 | | | | | | 3.31 | | | | | | 40 | |
| | | 9.76 | | | | | | 24.92 | | | | | | 424,560 | | | | | | 1.34 | | | | | | 1.38 | | | | | | 3.23 | | | | | | 40 | |
| | | 9.84 | | | | | | 26.27 | | | | | | 162,453 | | | | | | 0.19 | | | | | | 0.23 | | | | | | 3.95 | | | | | | 40 | |
| | | 9.79 | | | | | | 25.63 | | | | | | 6,124 | | | | | | 0.69 | | | | | | 0.73 | | | | | | 3.69 | | | | | | 40 | |
| | | 9.79 | | | | | | 25.99 | | | | | | 39 | | | | | | 0.34 | | | | | | 0.38 | | | | | | 2.94 | | | | | | 40 | |
| | | 9.78 | | | | | | 25.50 | | | | | | 583 | | | | | | 0.84 | | | | | | 0.88 | | | | | | 8.02 | | | | | | 40 | |
| | |
| The accompanying notes are an integral part of these financial statements. | | 67 |
GOLDMAN SACHS GROWTH STRATEGY PORTFOLIO
Financial Highlights
Selected Data for a Share Outstanding Throughout Each Year
| | | | | | | | | | | | | | | | | | | | | | |
| | | | | | | | Income (loss) from
investment operations | | | | |
| | | Year - Share Class | | Net asset
value,
beginning
of year | | | Net
investment
income(a)(b) | | | Net realized
and unrealized
gain (loss) | | | Total from
investment
operations | | | Distributions
to shareholders
from net
investment
income | |
| | FOR THE FISCAL YEARS ENDED DECEMBER 31, | |
| | 2013 - A | | $ | 11.05 | | | $ | 0.14 | | | $ | 1.88 | | | $ | 2.02 | | | $ | (0.18 | ) |
| | 2013 - B | | | 11.12 | | | | 0.04 | | | | 1.90 | | | | 1.94 | | | | (0.07 | ) |
| | 2013 - C | | | 11.02 | | | | 0.05 | | | | 1.86 | | | | 1.91 | | | | (0.08 | ) |
| | 2013 - Institutional | | | 11.04 | | | �� | 0.21 | | | | 1.87 | | | | 2.08 | | | | (0.24 | ) |
| | 2013 - Service | | | 11.01 | | | | 0.14 | | | | 1.86 | | | | 2.00 | | | | (0.17 | ) |
| | 2013 - IR | | | 10.91 | | | | 0.26 | | | | 1.77 | | | | 2.03 | | | | (0.22 | ) |
| | 2013 - R | | | 10.80 | | | | 0.10 | | | | 1.84 | | | | 1.94 | | | | (0.15 | ) |
| | 2012 - A | | | 9.86 | | | | 0.18 | | | | 1.25 | | | | 1.43 | | | | (0.24 | ) |
| | 2012 - B | | | 9.92 | | | | 0.10 | | | | 1.25 | | | | 1.35 | | | | (0.15 | ) |
| | 2012 - C | | | 9.83 | | | | 0.10 | | | | 1.25 | | | | 1.35 | | | | (0.16 | ) |
| | 2012 - Institutional | | | 9.87 | | | | 0.23 | | | | 1.24 | | | | 1.47 | | | | (0.30 | ) |
| | 2012 - Service | | | 9.83 | | | | 0.17 | | | | 1.25 | | | | 1.42 | | | | (0.24 | ) |
| | 2012 - IR | | | 9.75 | | | | 0.22 | | | | 1.22 | | | | 1.44 | | | | (0.28 | ) |
| | 2012 - R | | | 9.65 | | | | 0.17 | | | | 1.21 | | | | 1.38 | | | | (0.23 | ) |
| | 2011 - A | | | 10.75 | | | | 0.19 | | | | (0.84 | ) | | | (0.65 | ) | | | (0.24 | ) |
| | 2011 - B | | | 10.80 | | | | 0.11 | | | | (0.85 | ) | | | (0.74 | ) | | | (0.14 | ) |
| | 2011 - C | | | 10.70 | | | | 0.11 | | | | (0.83 | ) | | | (0.72 | ) | | | (0.15 | ) |
| | 2011 - Institutional | | | 10.77 | | | | 0.22 | | | | (0.83 | ) | | | (0.61 | ) | | | (0.29 | ) |
| | 2011 - Service | | | 10.72 | | | | 0.18 | | | | (0.84 | ) | | | (0.66 | ) | | | (0.23 | ) |
| | 2011 - IR | | | 10.65 | | | | 0.30 | | | | (0.92 | ) | | | (0.62 | ) | | | (0.28 | ) |
| | 2011 - R | | | 10.55 | | | | 0.20 | | | | (0.87 | ) | | | (0.67 | ) | | | (0.23 | ) |
| | 2010 - A | | | 9.87 | | | | 0.22 | | | | 0.91 | | | | 1.13 | | | | (0.25 | ) |
| | 2010 - B | | | 9.91 | | | | 0.14 | | | | 0.91 | | | | 1.05 | | | | (0.16 | ) |
| | 2010 - C | | | 9.83 | | | | 0.14 | | | | 0.89 | | | | 1.03 | | | | (0.16 | ) |
| | 2010 - Institutional | | | 9.89 | | | | 0.28 | | | | 0.90 | | | | 1.18 | | | | (0.30 | ) |
| | 2010 - Service | | | 9.85 | | | | 0.21 | | | | 0.90 | | | | 1.11 | | | | (0.24 | ) |
| | 2010 - IR | | | 9.79 | | | | 0.26 | | | | 0.88 | | | | 1.14 | | | | (0.28 | ) |
| | 2010 - R | | | 9.71 | | | | 0.27 | | | | 0.82 | | | | 1.09 | | | | (0.25 | ) |
| | 2009 - A | | | 7.87 | | | | 0.24 | | | | 2.00 | | | | 2.24 | | | | (0.24 | ) |
| | 2009 - B | | | 7.90 | | | | 0.17 | | | | 2.01 | | | | 2.18 | | | | (0.17 | ) |
| | 2009 - C | | | 7.83 | | | | 0.16 | | | | 2.01 | | | | 2.17 | | | | (0.17 | ) |
| | 2009 - Institutional | | | 7.88 | | | | 0.27 | | | | 2.02 | | | | 2.29 | | | | (0.28 | ) |
| | 2009 - Service | | | 7.84 | | | | 0.19 | | | | 2.04 | | | | 2.23 | | | | (0.22 | ) |
| | 2009 - IR | | | 7.81 | | | | 0.88 | | | | 1.38 | | | | 2.26 | | | | (0.28 | ) |
| | 2009 - R | | | 7.78 | | | | 0.60 | | | | 1.59 | | | | 2.19 | | | | (0.26 | ) |
| | (a) | | Calculated based on the average shares outstanding methodology. |
| | (b) | | Recognition of net investment income by the Portfolio is affected by the timing of declaration of dividends by the Underlying Funds in which the Portfolio invests. |
| | (c) | | Assumes investment at the net asset value at the beginning of the year, reinvestment of all dividends and distributions, a complete redemption of the investment at the net asset value at the end of the year and no sales or redemption charges. Total returns would be reduced if a sales or redemption charge was taken into account. Returns do not reflect the deduction of taxes that a shareholder would pay on Portfolio distributions or the redemption of Portfolio shares. |
| | (d) | | Expense ratios exclude the expenses of the Underlying Funds in which the Portfolio invests. |
| | (e) | | The Portfolio’s portfolio turnover rate is calculated in accordance with regulatory requirements, without regard to transactions involving short term investments and certain derivatives. If such transactions were included, the Portfolio’s portfolio turnover rate may be higher. |
| | |
| 68 | | The accompanying notes are an integral part of these financial statements. |
GOLDMAN SACHS GROWTH STRATEGY PORTFOLIO
| | | | | | | | | | | | | | | | | | | | | | | | | | | | | | | | | | | | | | | | |
| | | | | | | | | | | | | | | | | | | | | | | | | | | | | | | | | | |
| | | Net asset
value, end
of year | | | | | Total
return(c) | | | | | Net assets,
end of
year
(in 000s) | | | | | Ratio of
net expenses
to average
net assets(d) | | | | | Ratio of
total expenses
to average
net assets(d) | | | | | Ratio of
net investment
income
to average
net assets(b) | | | | | Portfolio
turnover
rate(e) | |
| | | | | | | | | | | | | | | | | | | | | | | | | | | | | | | | | | | | | | | | |
| | $ | 12.89 | | | | | | 18.31 | % | | $ | | | 389,445 | | | | | | 0.60 | % | | | | | 0.64 | % | | | | | 1.19 | % | | | | | 32 | % |
| | | 12.99 | | | | | | 17.44 | | | | | | 47,839 | | | | | | 1.35 | | | | | | 1.39 | | | | | | 0.35 | | | | | | 32 | |
| | | 12.85 | | | | | | 17.37 | | | | | | 218,776 | | | | | | 1.35 | | | | | | 1.39 | | | | | | 0.42 | | | | | | 32 | |
| | | 12.88 | | | | | | 18.81 | | | | | | 246,229 | | | | | | 0.20 | | | | | | 0.24 | | | | | | 1.77 | | | | | | 32 | |
| | | 12.84 | | | | | | 18.19 | | | | | | 3,419 | | | | | | 0.70 | | | | | | 0.74 | | | | | | 1.14 | | | | | | 32 | |
| | | 12.72 | | | | | | 18.65 | | | | | | 3,598 | | | | | | 0.35 | | | | | | 0.39 | | | | | | 2.17 | | | | | | 32 | |
| | | 12.59 | | | | | | 17.93 | | | | | | 4,208 | | | | | | 0.85 | | | | | | 0.89 | | | | | | 0.84 | | | | | | 32 | |
| | | 11.05 | | | | | | 14.49 | | | | | | 398,487 | | | | | | 0.59 | | | | | | 0.64 | | | | | | 1.65 | | | | | | 47 | |
| | | 11.12 | | | | | | 13.64 | | | | | | 57,388 | | | | | | 1.34 | | | | | | 1.39 | | | | | | 0.90 | | | | | | 47 | |
| | | 11.02 | | | | | | 13.72 | | | | | | 224,471 | | | | | | 1.34 | | | | | | 1.39 | | | | | | 0.92 | | | | | | 47 | |
| | | 11.04 | | | | | | 14.89 | | | | | | 173,180 | | | | | | 0.19 | | | | | | 0.23 | | | | | | 2.10 | | | | | | 47 | |
| | | 11.01 | | | | | | 14.42 | | | | | | 3,185 | | | | | | 0.69 | | | | | | 0.74 | | | | | | 1.60 | | | | | | 47 | |
| | | 10.91 | | | | | | 14.79 | | | | | | 1,483 | | | | | | 0.34 | | | | | | 0.38 | | | | | | 2.05 | | | | | | 47 | |
| | | 10.80 | | | | | | 14.31 | | | | | | 4,885 | | | | | | 0.84 | | | | | | 0.88 | | | | | | 1.64 | | | | | | 47 | |
| | | 9.86 | | | | | | (6.08 | ) | | | | | 562,262 | | | | | | 0.59 | | | | | | 0.63 | | | | | | 1.73 | | | | | | 35 | |
| | | 9.92 | | | | | | (6.82 | ) | | | | | 68,563 | | | | | | 1.34 | | | | | | 1.38 | | | | | | 0.98 | | | | | | 35 | |
| | | 9.83 | | | | | | (6.77 | ) | | | | | 257,778 | | | | | | 1.34 | | | | | | 1.38 | | | | | | 0.99 | | | | | | 35 | |
| | | 9.87 | | | | | | (5.69 | ) | | | | | 92,807 | | | | | | 0.19 | | | | | | 0.23 | | | | | | 2.08 | | | | | | 35 | |
| | | 9.83 | | | | | | (6.18 | ) | | | | | 3,644 | | | | | | 0.69 | | | | | | 0.73 | | | | | | 1.65 | | | | | | 35 | |
| | | 9.75 | | | | | | (5.85 | ) | | | | | 1,376 | | | | | | 0.34 | | | | | | 0.38 | | | | | | 2.90 | | | | | | 35 | |
| | | 9.65 | | | | | | (6.39 | ) | | | | | 4,413 | | | | | | 0.84 | | | | | | 0.88 | | | | | | 1.88 | | | | | | 35 | |
| | | 10.75 | | | | | | 11.46 | | | | | | 789,340 | | | | | | 0.59 | | | | | | 0.63 | | | | | | 2.16 | | | | | | 28 | |
| | | 10.80 | | | | | | 10.63 | | | | | | 97,344 | | | | | | 1.34 | | | | | | 1.38 | | | | | | 1.39 | | | | | | 28 | |
| | | 10.70 | | | | | | 10.52 | | | | | | 373,504 | | | | | | 1.34 | | | | | | 1.38 | | | | | | 1.37 | | | | | | 28 | |
| | | 10.77 | | | | | | 11.90 | | | | | | 115,999 | | | | | | 0.19 | | | | | | 0.23 | | | | | | 2.78 | | | | | | 28 | |
| | | 10.72 | | | | | | 11.30 | | | | | | 6,647 | | | | | | 0.69 | | | | | | 0.73 | | | | | | 2.14 | | | | | | 28 | |
| | | 10.65 | | | | | | 11.66 | | | | | | 675 | | | | | | 0.34 | | | | | | 0.38 | | | | | | 2.61 | | | | | | 28 | |
| | | 10.55 | | | | | | 11.20 | | | | | | 3,588 | | | | | | 0.84 | | | | | | 0.88 | | | | | | 2.73 | | | | | | 28 | |
| | | 9.87 | | | | | | 28.55 | | | | | | 902,200 | | | | | | 0.59 | | | | | | 0.64 | | | | | | 2.73 | | | | | | 39 | |
| | | 9.91 | | | | | | 27.64 | | | | | | 114,216 | | | | | | 1.34 | | | | | | 1.39 | | | | | | 1.97 | | | | | | 39 | |
| | | 9.83 | | | | | | 27.74 | | | | | | 444,309 | | | | | | 1.34 | | | | | | 1.39 | | | | | | 1.92 | | | | | | 39 | |
| | | 9.89 | | | | | | 29.12 | | | | | | 106,456 | | | | | | 0.19 | | | | | | 0.24 | | | | | | 3.16 | | | | | | 39 | |
| | | 9.85 | | | | | | 28.48 | | | | | | 7,182 | | | | | | 0.69 | | | | | | 0.74 | | | | | | 2.29 | | | | | | 39 | |
| | | 9.79 | | | | | | 29.00 | | | | | | 546 | | | | | | 0.34 | | | | | | 0.39 | | | | | | 9.20 | | | | | | 39 | |
| | | 9.71 | | | | | | 28.27 | | | | | | 1,184 | | | | | | 0.84 | | | | | | 0.89 | | | | | | 6.30 | | | | | | 39 | |
| | |
| The accompanying notes are an integral part of these financial statements. | | 69 |
GOLDMAN SACHS INCOME STRATEGIES PORTFOLIO
Financial Highlights
Selected Data for a Share Outstanding Throughout Each Year
| | | | | | | | | | | | | | | | | | | | | | |
| | | | | | | | Income (loss) from
investment operations | | | | |
| | | Year - Share Class | | Net asset
value,
beginning
of year | | | Net
investment
income(a)(b) | | | Net realized
and unrealized
gain (loss) | | | Total from
investment
operations | | | Distributions
to shareholders
from net
investment
income | |
| | FOR THE FISCAL YEARS ENDED DECEMBER 31, | |
| | 2013 - A | | $ | 8.90 | | | $ | 0.36 | | | $ | (0.37 | ) | | $ | (0.01 | ) | | $ | (0.39 | ) |
| | 2013 - C | | | 8.94 | | | | 0.29 | | | | (0.37 | ) | | | (0.08 | ) | | | (0.32 | ) |
| | 2013 - Institutional | | | 8.86 | | | | 0.39 | | | | (0.37 | ) | | | 0.02 | | | | (0.43 | ) |
| | 2013 - IR | | | 8.89 | | | | 0.38 | | | | (0.38 | ) | | | — | | | | (0.41 | ) |
| | 2013 - R | | | 8.93 | | | | 0.34 | | | | (0.37 | ) | | | (0.03 | ) | | | (0.37 | ) |
| | 2012 - A | | | 8.12 | | | | 0.29 | | | | 0.85 | | | | 1.14 | | | | (0.36 | ) |
| | 2012 - C | | | 8.16 | | | | 0.24 | | | | 0.84 | | | | 1.08 | | | | (0.30 | ) |
| | 2012 - Institutional | | | 8.10 | | | | 0.34 | | | | 0.82 | | | | 1.16 | | | | (0.40 | ) |
| | 2012 - IR | | | 8.11 | | | | 0.33 | | | | 0.84 | | | | 1.17 | | | | (0.39 | ) |
| | 2012 - R | | | 8.15 | | | | 0.30 | | | | 0.82 | | | | 1.12 | | | | (0.34 | ) |
| | 2011 - A | | | 8.58 | | | | 0.28 | | | | (0.43 | ) | | | (0.15 | ) | | | (0.31 | ) |
| | 2011 - C | | | 8.62 | | | | 0.22 | | | | (0.43 | ) | | | (0.21 | ) | | | (0.25 | ) |
| | 2011 - Institutional | | | 8.56 | | | | 0.31 | | | | (0.42 | ) | | | (0.11 | ) | | | (0.35 | ) |
| | 2011 - IR | | | 8.57 | | | | 0.30 | | | | (0.42 | ) | | | (0.12 | ) | | | (0.34 | ) |
| | 2011 - R | | | 8.61 | | | | 0.27 | | | | (0.44 | ) | | | (0.17 | ) | | | (0.29 | ) |
| | 2010 - A | | | 7.96 | | | | 0.33 | | | | 0.63 | | | | 0.96 | | | | (0.34 | ) |
| | 2010 - C | | | 8.00 | | | | 0.27 | | | | 0.63 | | | | 0.90 | | | | (0.28 | ) |
| | 2010 - Institutional | | | 7.95 | | | | 0.35 | | | | 0.64 | | | | 0.99 | | | | (0.38 | ) |
| | 2010 - IR | | | 7.95 | | | | 0.37 | | | | 0.61 | | | | 0.98 | | | | (0.36 | ) |
| | 2010 - R | | | 7.99 | | | | 0.31 | | | | 0.63 | | | | 0.94 | | | | (0.32 | ) |
| | 2009 - A | | | 6.57 | | | | 0.39 | | | | 1.37 | | | | 1.76 | | | | (0.37 | ) |
| | 2009 - C | | | 6.56 | | | | 0.33 | | | | 1.37 | | | | 1.70 | | | | (0.26 | ) |
| | 2009 - Institutional | | | 6.57 | | | | 0.40 | | | | 1.40 | | | | 1.80 | | | | (0.42 | ) |
| | 2009 - IR | | | 6.57 | | | | 0.39 | | | | 1.38 | | | | 1.77 | | | | (0.39 | ) |
| | 2009 - R | | | 6.57 | | | | 0.36 | | | | 1.39 | | | | 1.75 | | | | (0.33 | ) |
| | (a) | | Calculated based on the average shares outstanding methodology. |
| | (b) | | Recognition of net investment income by the Portfolio is affected by the timing of declaration of dividends by the Underlying Funds in which the Portfolio invests. |
| | (c) | | Assumes investment at the net asset value at the beginning of the year, reinvestment of all dividends and distributions, a complete redemption of the investment at the net asset value at the end of the year and no sales or redemption charges. Total returns would be reduced if a sales or redemption charge was taken into account. Returns do not reflect the deduction of taxes that a shareholder would pay on Portfolio distributions or the redemption of Portfolio shares. |
| | (d) | | Expense ratios exclude the expenses of the Underlying Funds in which the Portfolio invests. |
| | (e) | | The Portfolio’s portfolio turnover rate is calculated in accordance with regulatory requirements, without regard to transactions involving short term investments and certain derivatives. If such transactions were included, the Portfolio’s portfolio turnover rate may be higher. |
| | |
| 70 | | The accompanying notes are an integral part of these financial statements. |
GOLDMAN SACHS INCOME STRATEGIES PORTFOLIO
| | | | | | | | | | | | | | | | | | | | | | | | | | | | | | | | | | | | | | | | |
| | | | | | | | | | | | | | | | | | | | | �� | | | | | | | | | | | | | |
| | | Net asset
value, end
of year | | | | | Total
return(c) | | | | | Net assets,
end of
year
(in 000s) | | | | | Ratio of
net expenses
to average
net assets(d) | | | | | Ratio of
total expenses
to average
net assets(d) | | | | | Ratio of
net investment
income
to average
net assets(b) | | | | | Portfolio
turnover
rate(e) | |
| | | | | | | | | | | | | | | | | | | | | | | | | | | | | | | | | | | | | | | | |
| | $ | 8.50 | | | | | | (0.11 | )% | | | | $ | 9,948 | | | | | | 0.58 | % | | | | | 1.32 | % | | | | | 4.06 | % | | | | | 53 | % |
| | | 8.54 | | | | | | (0.86 | ) | | | | | 10,065 | | | | | | 1.33 | | | | | | 2.07 | | | | | | 3.33 | | | | | | 53 | |
| | | 8.45 | | | | | | 0.18 | | | | | | 7,519 | | | | | | 0.18 | | | | | | 0.92 | | | | | | 4.49 | | | | | | 53 | |
| | | 8.48 | | | | | | 0.03 | | | | | | 2,796 | | | | | | 0.33 | | | | | | 1.07 | | | | | | 4.39 | | | | | | 53 | |
| | | 8.53 | | | | | | (0.36 | ) | | | | | 118 | | | | | | 0.83 | | | | | | 1.57 | | | | | | 3.82 | | | | | | 53 | |
| | | 8.90 | | | | | | 14.22 | | | | | | 13,366 | | | | | | 0.57 | | | | | | 1.23 | | | | | | 3.42 | | | | | | 111 | |
| | | 8.94 | | | | | | 13.31 | | | | | | 12,195 | | | | | | 1.32 | | | | | | 1.99 | | | | | | 2.79 | | | | | | 111 | |
| | | 8.86 | | | | | | 14.46 | | | | | | 5,527 | | | | | | 0.17 | | | | | | 0.80 | | | | | | 3.97 | | | | | | 111 | |
| | | 8.89 | | | | | | 14.53 | | | | | | 2,197 | | | | | | 0.32 | | | | | | 1.00 | | | | | | 3.85 | | | | | | 111 | |
| | | 8.93 | | | | | | 13.88 | | | | | | 134 | | | | | | 0.82 | | | | | | 1.51 | | | | | | 3.42 | | | | | | 111 | |
| | | 8.12 | | | | | | (1.78 | ) | | | | | 18,278 | | | | | | 0.57 | | | | | | 1.18 | | | | | | 3.34 | | | | | | 51 | |
| | | 8.16 | | | | | | (2.50 | ) | | | | | 10,732 | | | | | | 1.32 | | | | | | 1.93 | | | | | | 2.59 | | | | | | 51 | |
| | | 8.10 | | | | | | (1.39 | ) | | | | | 8,125 | | | | | | 0.17 | | | | | | 0.78 | | | | | | 3.69 | | | | | | 51 | |
| | | 8.11 | | | | | | (1.54 | ) | | | | | 1,179 | | | | | | 0.32 | | | | | | 0.93 | | | | | | 3.57 | | | | | | 51 | |
| | | 8.15 | | | | | | (2.01 | ) | | | | | 83 | | | | | | 0.82 | | | | | | 1.43 | | | | | | 3.12 | | | | | | 51 | |
| | | 8.58 | | | | | | 12.36 | | | | | | 14,054 | | | | | | 0.57 | | | | | | 1.44 | | | | | | 4.00 | | | | | | 70 | |
| | | 8.62 | | | | | | 11.46 | | | | | | 8,130 | | | | | | 1.32 | | | | | | 2.19 | | | | | | 3.31 | | | | | | 70 | |
| | | 8.56 | | | | | | 12.83 | | | | | | 7,614 | | | | | | 0.17 | | | | | | 1.04 | | | | | | 4.31 | | | | | | 70 | |
| | | 8.57 | | | | | | 12.66 | | | | | | 501 | | | | | | 0.32 | | | | | | 1.19 | | | | | | 4.49 | | | | | | 70 | |
| | | 8.61 | | | | | | 12.00 | | | | | | 45 | | | | | | 0.82 | | | | | | 1.69 | | | | | | 3.78 | | | | | | 70 | |
| | | 7.96 | | | | | | 27.39 | | | | | | 10,619 | | | | | | 0.57 | | | | | | 1.76 | | | | | | 5.44 | | | | | | 34 | |
| | | 8.00 | | | | | | 26.53 | | | | | | 4,674 | | | | | | 1.32 | | | | | | 2.51 | | | | | | 4.64 | | | | | | 34 | |
| | | 7.95 | | | | | | 27.92 | | | | | | 9,708 | | | | | | 0.17 | | | | | | 1.36 | | | | | | 5.73 | | | | | | 34 | |
| | | 7.95 | | | | | | 27.73 | | | | | | 9 | | | | | | 0.32 | | | | | | 1.51 | | | | | | 5.57 | | | | | | 34 | |
| | | 7.99 | | | | | | 27.23 | | | | | | 9 | | | | | | 0.82 | | | | | | 2.01 | | | | | | 5.07 | | | | | | 34 | |
| | |
| The accompanying notes are an integral part of these financial statements. | | 71 |
GOLDMAN SACHS SATELLITE STRATEGIES PORTFOLIO
Financial Highlights
Selected Data for a Share Outstanding Throughout Each Year
| | | | | | | | | | | | | | | | | | | | | | | | | | | | | | |
| | | | | | | | Income (loss) from
investment operations | | | Distributions
to shareholders | |
| | | Year - Share Class | | Net asset
value,
beginning
of year | | | Net
investment
income(a) | | | Net realized
and unrealized
gain (loss) | | | Total from
investment
operations | | | From net
investment
income | | | From net
realized
gains | | | Total
distributions | |
| | FOR THE FISCAL YEARS ENDED DECEMBER 31, | |
| | 2013 - A | | $ | 8.22 | | | $ | 0.25 | (e) | | $ | (0.04 | ) | | $ | 0.21 | | | $ | (0.27 | ) | | $ | — | | | $ | (0.27 | ) |
| | 2013 - C | | | 8.18 | | | | 0.19 | (e) | | | (0.04 | ) | | | 0.15 | | | | (0.21 | ) | | | — | | | | (0.21 | ) |
| | 2013 - Institutional | | | 8.21 | | | | 0.29 | (e) | | | (0.04 | ) | | | 0.25 | | | | (0.31 | ) | | | — | | | | (0.31 | ) |
| | 2013 - Service | | | 8.19 | | | | 0.24 | (e) | | | (0.04 | ) | | | 0.20 | | | | (0.27 | ) | | | — | | | | (0.27 | ) |
| | 2013 - IR | | | 8.21 | | | | 0.28 | (e) | | | (0.04 | ) | | | 0.24 | | | | (0.30 | ) | | | — | | | | (0.30 | ) |
| | 2013 - R | | | 8.19 | | | | 0.24 | (e) | | | (0.04 | ) | | | 0.20 | | | | (0.26 | ) | | | — | | | | (0.26 | ) |
| | 2012 - A | | | 7.39 | | | | 0.33 | (e) | | | 0.86 | | | | 1.19 | | | | (0.34 | ) | | | (0.02 | ) | | | (0.36 | ) |
| | 2012 - C | | | 7.36 | | | | 0.26 | (e) | | | 0.86 | | | | 1.12 | | | | (0.28 | ) | | | (0.02 | ) | | | (0.30 | ) |
| | 2012 - Institutional | | | 7.38 | | | | 0.36 | (e) | | | 0.86 | | | | 1.22 | | | | (0.37 | ) | | | (0.02 | ) | | | (0.39 | ) |
| | 2012 - Service | | | 7.36 | | | | 0.32 | (e) | | | 0.87 | | | | 1.19 | | | | (0.34 | ) | | | (0.02 | ) | | | (0.36 | ) |
| | 2012 - IR | | | 7.38 | | | | 0.35 | (e) | | | 0.86 | | | | 1.21 | | | | (0.36 | ) | | | (0.02 | ) | | | (0.38 | ) |
| | 2012 - R | | | 7.37 | | | | 0.31 | (e) | | | 0.86 | | | | 1.17 | | | | (0.33 | ) | | | (0.02 | ) | | | (0.35 | ) |
| | 2011 - A | | | 7.95 | | | | 0.28 | (e) | | | (0.53 | ) | | | (0.25 | ) | | | (0.28 | ) | | | (0.03 | ) | | | (0.31 | ) |
| | 2011 - C | | | 7.92 | | | | 0.23 | (e) | | | (0.53 | ) | | | (0.30 | ) | | | (0.23 | ) | | | (0.03 | ) | | | (0.26 | ) |
| | 2011 - Institutional | | | 7.94 | | | | 0.32 | (e) | | | (0.53 | ) | | | (0.21 | ) | | | (0.32 | ) | | | (0.03 | ) | | | (0.35 | ) |
| | 2011 - Service | | | 7.92 | | | | 0.28 | (e) | | | (0.53 | ) | | | (0.25 | ) | | | (0.28 | ) | | | (0.03 | ) | | | (0.31 | ) |
| | 2011 - IR | | | 7.94 | | | | 0.32 | (e) | | | (0.54 | ) | | | (0.22 | ) | | | (0.31 | ) | | | (0.03 | ) | | | (0.34 | ) |
| | 2011 - R | | | 7.93 | | | | 0.26 | (e) | | | (0.52 | ) | | | (0.26 | ) | | | (0.27 | ) | | | (0.03 | ) | | | (0.30 | ) |
| | 2010 - A | | | 7.34 | | | | 0.40 | | | | 0.62 | | | | 1.02 | | | | (0.41 | ) | | | — | | | | (0.41 | ) |
| | 2010 - C | | | 7.31 | | | | 0.34 | | | | 0.63 | | | | 0.97 | | | | (0.36 | ) | | | — | | | | (0.36 | ) |
| | 2010 - Institutional | | | 7.33 | | | | 0.42 | | | | 0.63 | | | | 1.05 | | | | (0.44 | ) | | | — | | | | (0.44 | ) |
| | 2010 - Service | | | 7.31 | | | | 0.38 | | | | 0.63 | | | | 1.01 | | | | (0.40 | ) | | | — | | | | (0.40 | ) |
| | 2010 - IR | | | 7.34 | | | | 0.42 | | | | 0.61 | | | | 1.03 | | | | (0.43 | ) | | | — | | | | (0.43 | ) |
| | 2010 - R | | | 7.32 | | | | 0.41 | | | | 0.59 | | | | 1.00 | | | | (0.39 | ) | | | — | | | | (0.39 | ) |
| | 2009 - A | | | 5.58 | | | | 0.36 | (e) | | | 1.69 | | | | 2.05 | | | | (0.27 | ) | | | (0.02 | ) | | | (0.29 | ) |
| | 2009 - C | | | 5.56 | | | | 0.31 | (e) | | | 1.69 | | | | 2.00 | | | | (0.23 | ) | | | (0.02 | ) | | | (0.25 | ) |
| | 2009 - Institutional | | | 5.57 | | | | 0.42 | (e) | | | 1.66 | | | | 2.08 | | | | (0.30 | ) | | | (0.02 | ) | | | (0.32 | ) |
| | 2009 - Service | | | 5.56 | | | | 0.53 | (e) | | | 1.51 | | | | 2.04 | | | | (0.27 | ) | | | (0.02 | ) | | | (0.29 | ) |
| | 2009 - IR | | | 5.58 | | | | 0.96 | (e) | | | 1.11 | | | | 2.07 | | | | (0.29 | ) | | | (0.02 | ) | | | (0.31 | ) |
| | 2009 - R | | | 5.57 | | | | 0.50 | (e) | | | 1.53 | | | | 2.03 | | | | (0.26 | ) | | | (0.02 | ) | | | (0.28 | ) |
| | (a) | | Recognition of net investment income by the Portfolio is affected by the timing of declaration of dividends by the Underlying Funds in which the Portfolio invests. |
| | (b) | | Assumes investment at the net asset value at the beginning of the year, reinvestment of all dividends and distributions, a complete redemption of the investment at the net asset value at the end of the year and no sales or redemption charges. Total returns would be reduced if a sales or redemption charge was taken into account. Returns do not reflect the deduction of taxes that a shareholder would pay on Portfolio distributions or the redemption of Portfolio shares. |
| | (c) | | Expense ratios exclude the expenses of the Underlying Funds in which the Portfolio invests. |
| | (d) | | The Portfolio’s portfolio turnover rate is calculated in accordance with regulatory requirements, without regard to transactions involving short term investments and certain derivatives. If such transactions were included, the Portfolio’s portfolio turnover rate may be higher. |
| | (e) | | Calculated based on the average shares outstanding methodology. |
| | |
| 72 | | The accompanying notes are an integral part of these financial statements. |
GOLDMAN SACHS SATELLITE STRATEGIES PORTFOLIO
| | | | | | | | | | | | | | | | | | | | | | | | | | | | | | | | | | | | | | | | |
| | | | | | | | | | | | | | | | | | | | | | | | | | | | | | | | | | |
| | | Net asset
value, end
of year | | | | | Total
return(b) | | | | | Net assets,
end of
year
(in 000s) | | | | | Ratio of
net expenses
to average
net assets(c) | | | | | Ratio of
total expenses
to average
net assets(c) | | | | | Ratio of
net investment
income
to average
net assets(a) | | | | | Portfolio
turnover
rate(d) | |
| | | | | | | | | | | | | | | | | | | | | | | | | | | | | | | | | | | | | | | | |
| | $ | 8.16 | | | | | | 2.67 | % | | | | $ | 231,868 | | | | | | 0.58 | % | | | | | 0.60 | % | | | | | 3.08 | % | | | | | 36 | % |
| | | 8.12 | | | | | | 1.91 | | | | | | 118,153 | | | | | | 1.33 | | | | | | 1.35 | | | | | | 2.35 | | | | | | 36 | |
| | | 8.15 | | | | | | 3.09 | | | | | | 853,543 | | | | | | 0.18 | | | | | | 0.20 | | | | | | 3.53 | | | | | | 36 | |
| | | 8.12 | | | | | | 2.45 | | | | | | 28,483 | | | | | | 0.68 | | | | | | 0.70 | | | | | | 2.96 | | | | | | 36 | |
| | | 8.15 | | | | | | 2.94 | | | | | | 91,493 | | | | | | 0.33 | | | | | | 0.35 | | | | | | 3.39 | | | | | | 36 | |
| | | 8.13 | | | | | | 2.44 | | | | | | 3,765 | | | | | | 0.83 | | | | | | 0.85 | | | | | | 2.91 | | | | | | 36 | |
| | | 8.22 | | | | | | 16.30 | | | | | | 250,407 | | | | | | 0.57 | | | | | | 0.60 | | | | | | 4.13 | | | | | | 14 | |
| | | 8.18 | | | | | | 15.37 | | | | | | 130,446 | | | | | | 1.32 | | | | | | 1.35 | | | | | | 3.32 | | | | | | 14 | |
| | | 8.21 | | | | | | 16.77 | | | | | | 803,541 | | | | | | 0.17 | | | | | | 0.20 | | | | | | 4.56 | | | | | | 14 | |
| | | 8.19 | | | | | | 16.26 | | | | | | 37,068 | | | | | | 0.67 | | | | | | 0.70 | | | | | | 4.04 | | | | | | 14 | |
| | | 8.21 | | | | | | 16.60 | | | | | | 74,216 | | | | | | 0.32 | | | | | | 0.35 | | | | | | 4.37 | | | | | | 14 | |
| | | 8.19 | | | | | | 15.96 | | | | | | 2,804 | | | | | | 0.82 | | | | | | 0.85 | | | | | | 3.86 | | | | | | 14 | |
| | | 7.39 | | | | | | (3.17 | ) | | | | | 201,416 | | | | | | 0.57 | | | | | | 0.61 | | | | | | 3.59 | | | | | | 35 | |
| | | 7.36 | | | | | | (3.88 | ) | | | | | 117,790 | | | | | | 1.32 | | | | | | 1.36 | | | | | | 2.88 | | | | | | 35 | |
| | | 7.38 | | | | | | (2.77 | ) | | | | | 590,521 | | | | | | 0.17 | | | | | | 0.21 | | | | | | 4.07 | | | | | | 35 | |
| | | 7.36 | | | | | | (3.26 | ) | | | | | 28,306 | | | | | | 0.67 | | | | | | 0.71 | | | | | | 3.54 | | | | | | 35 | |
| | | 7.38 | | | | | | (2.91 | ) | | | | | 58,940 | | | | | | 0.32 | | | | | | 0.36 | | | | | | 4.12 | | | | | | 35 | |
| | | 7.37 | | | | | | (3.42 | ) | | | | | 846 | | | | | | 0.82 | | | | | | 0.86 | | | | | | 3.33 | | | | | | 35 | |
| | | 7.95 | | | | | | 14.20 | | | | | | 212,886 | | | | | | 0.57 | | | | | | 0.63 | | | | | | 5.78 | | | | | | 18 | |
| | | 7.92 | | | | | | 13.48 | | | | | | 101,615 | | | | | | 1.32 | | | | | | 1.38 | | | | | | 5.17 | | | | | | 18 | |
| | | 7.94 | | | | | | 14.66 | | | | | | 442,808 | | | | | | 0.17 | | | | | | 0.23 | | | | | | 6.30 | | | | | | 18 | |
| | | 7.92 | | | | | | 14.17 | | | | | | 22,401 | | | | | | 0.67 | | | | | | 0.73 | | | | | | 5.97 | | | | | | 18 | |
| | | 7.94 | | | | | | 14.34 | | | | | | 19,947 | | | | | | 0.32 | | | | | | 0.38 | | | | | | 6.21 | | | | | | 18 | |
| | | 7.93 | | | | | | 14.01 | | | | | | 761 | | | | | | 0.82 | | | | | | 0.88 | | | | | | 6.13 | | | | | | 18 | |
| | | 7.34 | | | | | | 37.31 | | | | | | 131,389 | | | | | | 0.57 | | | | | | 0.71 | | | | | | 5.66 | | | | | | 58 | |
| | | 7.31 | | | | | | 36.29 | | | | | | 50,972 | | | | | | 1.32 | | | | | | 1.46 | | | | | | 4.81 | | | | | | 58 | |
| | | 7.33 | | | | | | 37.89 | | | | | | 242,969 | | | | | | 0.17 | | | | | | 0.31 | | | | | | 6.37 | | | | | | 58 | |
| | | 7.31 | | | | | | 37.17 | | | | | | 11,311 | | | | | | 0.67 | | | | | | 0.81 | | | | | | 7.60 | | | | | | 58 | |
| | | 7.34 | | | | | | 37.70 | | | | | | 6,331 | | | | | | 0.32 | | | | | | 0.46 | | | | | | 13.43 | | | | | | 58 | |
| | | 7.32 | | | | | | 36.96 | | | | | | 160 | | | | | | 0.82 | | | | | | 0.96 | | | | | | 7.44 | | | | | | 58 | |
| | |
| The accompanying notes are an integral part of these financial statements. | | 73 |
GOLDMAN SACHS FUND OF FUNDS PORTFOLIOS
Notes to Financial Statements
December 31, 2013
Goldman Sachs Trust (the “Trust”) is a Delaware statutory trust registered under the Investment Company Act of 1940, as amended (the “Act”), as an open-end management investment company. The following table lists those series of the Trust that are included in this report (collectively, the “Portfolios” or individually a “Portfolio”), along with their corresponding share classes and respective diversification status under the Act:
| | | | |
| Portfolio | | Share Classes Offered* | | Diversified/
Non-diversified |
Balanced Strategy, Equity Growth Strategy, Growth and Income Strategy, and Growth Strategy | | A, B, C, Institutional, Service, IR, R | | Diversified |
Income Strategies | | A, C, Institutional, IR, R | | Diversified |
Satellite Strategies | | A, C, Institutional, Service, IR, R | | Diversified |
| * | | Class B Shares are generally no longer available for purchase by current or prospective investors. |
Class A Shares are sold with a front-end sales charge of up to 5.50%. Class B Shares were sold with a contingent deferred sales charge (“CSDC”) that declines from 5.00% to zero, depending upon the period of time the shares are held. Class C Shares are sold with a CDSC of 1.00%, which is imposed on redemptions made within 12 months of purchase. Institutional, Service, Class IR and Class R Shares are not subject to a sales charge.
Goldman Sachs Asset Management, L.P. (“GSAM”), an affiliate of Goldman, Sachs & Co. (“Goldman Sachs”), serves as investment adviser to the Portfolios pursuant to a management agreement (the “Agreement”) with the Trust.
The Portfolios are expected to invest primarily in a combination of domestic and international equity and fixed income underlying funds (“Underlying Funds”) which are registered under the Act, for which GSAM or Goldman Sachs Asset Management International (“GSAMI”), also an affiliate of Goldman Sachs, act as investment advisers.
| | |
| 2. SIGNIFICANT ACCOUNTING POLICIES | | |
The financial statements have been prepared in accordance with accounting principles generally accepted in the United States of America (“GAAP”) and require management to make estimates and assumptions that may affect the reported amounts and disclosures. Actual results may differ from those estimates and assumptions.
A. Investment Valuation — The Portfolios’ valuation policy, as well as the Underlying Funds, is to value investments at fair value.
B. Investment Income and Investments — Investment income includes interest income and dividend income, net of any foreign withholding taxes, less any amounts reclaimable. Interest income is accrued daily and adjusted for amortization of premiums and accretion of discounts. Dividend income is recognized on ex-dividend date or, for certain foreign securities, as soon as such information is obtained subsequent to the ex-dividend date. Capital gain distributions received from Underlying Funds are recognized on ex-dividend date. Investment transactions are reflected on trade date. Realized gains and losses are calculated using identified cost. Investment transactions are recorded on the following business day for daily net asset value (“NAV”) calculations. Any foreign capital gains tax is accrued daily based upon net unrealized gains, and is payable upon sale of such investments.
C. Class Allocations and Expenses — Investment income, realized and unrealized gain (loss), and non-class specific expenses of each Portfolio are allocated daily based upon the proportion of net assets of each class. Class specific expenses, where applicable, are borne by the respective share classes and include Distribution and Service, Transfer Agent and Service and Shareholder Administration fees. Non-class specific expenses directly incurred by a Portfolio are charged to that Portfolio, while such expenses incurred by the Trust are allocated across the respective Funds on a straight-line and/or pro-rata basis depending upon the nature of the expenses.
74
GOLDMAN SACHS FUND OF FUNDS PORTFOLIOS
|
| 2. SIGNIFICANT ACCOUNTING POLICIES (continued) |
Expenses included in the accompanying financial statements reflect the expenses of each Portfolio and do not include any expenses associated with the Underlying Funds. Because the Underlying Funds have varied expense and fee levels and the Portfolios may own different proportions of the Underlying Funds at different times, the amount of fees and expenses incurred indirectly by each Portfolio will vary.
D. Federal Taxes and Distributions to Shareholders — It is each Portfolio’s policy to comply with the requirements of the Internal Revenue Code of 1986, as amended (the “Code”), applicable to regulated investment companies (mutual funds) and to distribute each year substantially all of its investment company taxable income and capital gains to its shareholders. Accordingly, the Portfolios are not required to make any provisions for the payment of federal income tax. Distributions to shareholders are recorded on the ex-dividend date. Income and capital gains distributions, if any, are declared and paid according to the following schedule:
| | | | | | |
| Portfolio | | | | Income Distributions
Declared/Paid | | Capital Gains Distributions
Declared/Paid |
Balanced Strategy, Growth and Income Strategy and Satellite Strategies | | | | Quarterly | | Annually |
Equity Growth Strategy and Growth Strategy | | | | Annually | | Annually |
Income Strategies | | | | Monthly | | Annually |
Net capital losses are carried forward to future fiscal years and may be used to the extent allowed by the Code to offset any future capital gains. Utilization of capital loss carryforwards will reduce the requirement of future capital gains distributions.
Under the Regulated Investment Company Modernization Act of 2010, the Portfolios are permitted to carry forward capital losses incurred in taxable years beginning after December 22, 2010 for an unlimited period. However, any losses incurred during those future taxable years will be required to be utilized prior to the losses incurred in pre-enactment taxable years. As a result of this ordering rule, pre-enactment capital loss carryforwards may be more likely to expire unused. Additionally, post-enactment capital losses that are carried forward will retain their character as either short-term or long-term capital losses rather than being considered all short-term as under previous law.
The characterization of distributions to shareholders for financial reporting purposes is determined in accordance with federal income tax rules, which may differ from GAAP. The source of each Portfolio’s distributions may be shown in the accompanying financial statements as either from net investment income, net realized gain or capital. Certain components of the Portfolios’ net assets on the Statements of Assets and Liabilities reflect permanent GAAP/tax differences based on the appropriate tax character.
| | |
| 3. INVESTMENTS AND FAIR VALUE MEASUREMENTS | | |
The fair value of a financial instrument is the amount that would be received to sell an asset or paid to transfer a liability in an orderly transaction between market participants at the measurement date (i.e., the exit price). GAAP establishes a fair value hierarchy that prioritizes the inputs to valuation techniques used to measure fair value. The hierarchy gives the highest priority to unadjusted quoted prices in active markets for identical assets or liabilities (Level 1 measurements) and the lowest priority to unobservable inputs (Level 3 measurements). The levels used for classifying investments are not necessarily an indication of the risk associated with investing in these investments. The three levels of the fair value hierarchy are described below:
Level 1 — Unadjusted quoted prices in active markets that are accessible at the measurement date for identical, unrestricted assets or liabilities;
Level 2 — Quoted prices in markets that are not active or financial instruments for which significant inputs are observable (including, but not limited to, quoted prices for similar investments, interest rates, foreign exchange rates, volatility and credit spreads), either directly or indirectly;
Level 3 — Prices or valuations that require significant unobservable inputs (including GSAM’s assumptions in determining fair value measurement).
75
GOLDMAN SACHS FUND OF FUNDS PORTFOLIOS
Notes to Financial Statements (continued)
December 31, 2013
|
| 3. INVESTMENTS AND FAIR VALUE MEASUREMENTS (continued) |
The Trustees have adopted Valuation Procedures that govern the valuation of the portfolio investments held by the Portfolios, including investments for which market quotations are not readily available. The Trustees have delegated to GSAM day-to-day responsibility for implementing and maintaining internal controls and procedures related to the valuation of the Portfolios’ portfolio investments. To assess the continuing appropriateness of pricing sources and methodologies, GSAM regularly performs price verification procedures and issues challenges as necessary to third party pricing vendors or brokers, and any differences are reviewed in accordance with the Valuation Procedures.
A. Level 1 and Level 2 Fair Value Investments — The valuation techniques and significant inputs used in determining the fair values for investments classified as Level 1 and Level 2 are as follows:
Underlying Funds — Investments in the Underlying Funds are valued at the NAV of the Institutional Share class of each Underlying Fund on the day of valuation. Because each Portfolio invests primarily in other mutual funds that fluctuate in value, the Portfolios’ shares will correspondingly fluctuate in value. These investments are generally classified as Level 1 of the fair value hierarchy.
The Underlying Funds may invest in debt securities which, if market quotations are readily available, are valued daily on the basis of quotations supplied by dealers or an independent pricing service approved by the Trustees. The pricing services may use valuation models or matrix pricing, which consider: (i) yield or price with respect to bonds that are considered comparable in characteristics such as rating, interest rate and maturity date or (ii) quotations from securities dealers to determine current value. Short-term debt obligations that mature in sixty days or less and that do not exhibit signs of credit deterioration are valued at amortized cost, which approximates fair value. With the exception of treasury securities, which are generally classified as Level 1, these investments are generally classified as Level 2 of the fair value hierarchy.
The Underlying Funds may invest in equity securities and investment companies. Investments in equity securities and investment companies traded on a United States (“U.S.”) securities exchange or the NASDAQ system, or those located on certain foreign exchanges, including but not limited to the Americas, are valued daily at their last sale price or official closing price on the principal exchange or system on which they are traded. If no sale occurs, equity securities and exchange traded investment companies are valued at the last bid price for long positions and at the last ask price for short positions. Investments in investment companies (other than those that are exchange traded) are valued at the NAV on the valuation date. To the extent these investments are actively traded, they are classified as Level 1 of the fair value hierarchy.
Unlisted equity securities for which market quotations are available are valued at the last sale price on the valuation date, or if no sale occurs, at the last bid price. Securities traded on certain foreign securities exchanges are valued daily at fair value determined by an independent fair value service (if available) under Valuation Procedures approved by the Trustees and consistent with applicable regulatory guidance. The independent fair value service takes into account multiple factors including, but not limited to, movements in the securities markets, certain depositary receipts, futures contracts and foreign currency exchange rates that have occurred subsequent to the close of the foreign securities exchange. These investments are generally classified as Level 2 of the fair value hierarchy.
Short Term Investments — Short-term investments having a maturity of 60 days or less are generally valued at amortized cost which approximates fair market value. These investments are classified as level 2 of the fair value hierarchy.
Repurchase Agreements — Repurchase agreements involve the purchase of securities subject to the seller’s agreement to repurchase the securities at a mutually agreed upon date and price, under the terms of a Master Repurchase Agreement (“MRA”). During the term of a repurchase agreement, the value of the underlying securities held as collateral on behalf of a Portfolio, including accrued interest, is required to exceed the value of the repurchase agreement, including accrued interest. The underlying securities for all repurchase agreements are held at the Portfolios’ custodian or designated sub-custodians under tri-party repurchase agreements.
In December 2011, the Financial Accounting Standards Board (“FASB”) issued an Accounting Standards Update (“ASU”) No. 2011-11: Disclosures about Offsetting Assets and Liabilities (“netting”) on the Statements of Assets and Liabilities that are subject to master netting arrangements or similar agreements. ASU 2011-11 was amended by ASU No. 2013-01, clarifying which investments and transactions are subject to the netting disclosure. The scope of the disclosure
76
GOLDMAN SACHS FUND OF FUNDS PORTFOLIOS
|
| 3. INVESTMENTS AND FAIR VALUE MEASUREMENTS (continued) |
requirements is limited to derivative instruments, repurchase agreements and reverse repurchase agreements, and securities borrowing and securities lending transactions. This information is intended to enable users of the Portfolios’ financial statements to evaluate the effect or potential effect of netting arrangements on the Portfolios’ financial position. The ASU is effective for the financial statements with fiscal years beginning on or after January 1, 2013, and interim periods within those fiscal years. The Portfolios adopted the disclosure requirement on netting for the current reporting period. Since these amended principles require additional disclosures concerning offsetting and related arrangements, adoption did not affect the Portfolios’ financial condition or results of operations.
For financial reporting purposes, the Portfolios do not offset financial assets and financial liabilities that are subject to master netting arrangements or similar agreements on the Statement of Assets and Liabilities.
A MRA governs transactions between a Portfolio and select counterparties. A MRA contains provisions for, among other things, initiation, income payments, events of default and maintenance of securities for repurchase agreements. A MRA also permits offsetting with collateral to create one single net payment in the event of default or similar events, including the bankruptcy or insolvency of a counterparty.
If the seller defaults, a Portfolio could suffer a loss to the extent that the proceeds from the sale of the underlying securities and other collateral held by the Portfolio are less than the repurchase price and the Portfolio’s costs associated with delay and enforcement of the repurchase agreement. In addition, in the event of default or insolvency of the seller, a court could determine that a Portfolio’s interest in the collateral is not enforceable, resulting in additional losses to the Portfolio.
At December 31, 2013, the Growth Strategy Portfolio’s investment in a repurchase agreement was subject to enforceable MRAs. The repurchase agreement on a net basis was as follows:
| | | | |
| Repurchase Agreement | | Growth Strategy | |
Total gross amount presented in Statements of Assets and Liabilities | | $ | 400,000 | |
Non-cash Collateral offsetting(1) | | | (400,000 | ) |
Net Amount(2) | | $ | — | |
| | (1) | | At December 31, 2013 the value of the collateral received from each seller exceeded the value of the related repurchase agreements. |
| | (2) | | Net amount represents the net amount due from the counterparty in the event of a default based on the contractual set-off rights under the agreement. |
Pursuant to exemptive relief granted by the Securities and Exchange Commission (“SEC”) and terms and conditions contained therein, the Portfolios, together with other funds of the Trust and registered investment companies having management agreements with GSAM or its affiliates, may transfer uninvested cash into joint accounts, the daily aggregate balance of which is invested in one or more repurchase agreements. Under these joint accounts, the Portfolios maintain pro- rata credit exposure to the underlying repurchase agreements’ counterparties. With the exception of certain transaction fees, the Portfolios are not subject to any expenses in relation to these investments.
B. Level 3 Fair Value Investments — To the extent that the aforementioned significant inputs are unobservable, or if quotations are not readily available, or if GSAM believes that such quotations do not accurately reflect fair value, the fair value of the Portfolios’ investments may be determined under Valuation Procedures approved by the Trustees. GSAM, consistent with its procedures and applicable regulatory guidance, may make an adjustment to the most recent valuation prices of either domestic or foreign securities in light of significant events to reflect what it believes to be the fair value of the securities at the time of determining a Portfolio’s NAV. Significant events which could affect a large number of securities in a particular market may include, but are not limited to: significant fluctuations in U.S. or foreign markets; market dislocations; market disruptions; or unscheduled market closings. Significant events which could also affect a single issuer may include, but are not limited to: corporate actions such as reorganizations, mergers and buy-outs; ratings downgrades; and bankruptcies.
77
GOLDMAN SACHS FUND OF FUNDS PORTFOLIOS
Notes to Financial Statements (continued)
December 31, 2013
|
| 3. INVESTMENTS AND FAIR VALUE MEASUREMENTS (continued) |
C. Fair Value Hierarchy — The following is a summary of the Portfolios’ investments classified in the fair value hierarchy as of December 31, 2013:
| | | | | | | | | | | | |
| | | |
| BALANCED STRATEGY | | | | | | | | | | | | |
| | | |
| Investment Type | | Level 1 | | | Level 2 | | | Level 3 | |
| Assets | | | | | | | | | | | | |
Equity Underlying Funds | | $ | 189,539,839 | | | $ | — | | | $ | — | |
Fixed Income Underlying Funds | | | 313,675,604 | | | | — | | | | — | |
Dynamic Underlying Funds | | | 71,977,659 | | | | — | | | | — | |
| Total | | $ | 575,193,102 | | | $ | — | | | $ | — | |
| | | |
| EQUITY GROWTH STRATEGY | | | | | | | | | | | | |
| | | |
| Investment Type | | Level 1 | | | Level 2 | | | Level 3 | |
| Assets | | | | | | | | | | | | |
Equity Underlying Funds | | $ | 395,085,597 | | | $ | — | | | $ | — | |
Fixed Income Underlying Funds | | | 11,894,553 | | | | — | | | | — | |
| Total | | $ | 406,980,150 | | | $ | — | | | $ | — | |
| | | |
| GROWTH AND INCOME STRATEGY | | | | | | | | | | | | |
| | | |
| Investment Type | | Level 1 | | | Level 2 | | | Level 3 | |
| Assets | | | | | | | | | | | | |
Equity Underlying Funds | | $ | 564,740,588 | | | $ | — | | | $ | — | |
Fixed Income Underlying Funds | | | 348,995,380 | | | | — | | | | — | |
Dynamic Underlying Funds | | | 130,363,207 | | | | — | | | | — | |
| Total | | $ | 1,044,099,175 | | | $ | — | | | $ | — | |
| | | |
| GROWTH STRATEGY | | | | | | | | | | | | |
| | | |
| Investment Type | | Level 1 | | | Level 2 | | | Level 3 | |
| Assets | | | | | | | | | | | | |
Equity Underlying Funds | | $ | 679,050,456 | | | $ | — | | | $ | — | |
Fixed Income Underlying Funds | | | 120,439,375 | | | | — | | | | — | |
Dynamic Underlying Funds | | | 113,411,293 | | | | — | | | | — | |
Short-term Investments | | | — | | | | 400,000 | | | | — | |
| Total | | $ | 912,901,124 | | | $ | 400,000 | | | $ | — | |
| | | |
| INCOME STRATEGIES | | | | | | | | | | | | |
| | | |
| Investment Type | | Level 1 | | | Level 2 | | | Level 3 | |
| Assets | | | | | | | | | | | | |
Equity Underlying Funds | | $ | 12,130,172 | | | $ | — | | | $ | — | |
Fixed Income Underlying Funds | | | 18,419,457 | | | | — | | | | — | |
| Total | | $ | 30,549,629 | | | $ | — | | | $ | — | |
78
GOLDMAN SACHS FUND OF FUNDS PORTFOLIOS
|
| 3. INVESTMENTS AND FAIR VALUE MEASUREMENTS (continued) |
| | | | | | | | | | | | |
| | | |
| SATELLITE STRATEGIES | | | | | | | | | | | | |
| | | |
| Investment Type | | Level 1 | | | Level 2 | | | Level 3 | |
| Assets | | | | | | | | | | | | |
Equity Underlying Funds | | $ | 655,650,794 | | | $ | — | | | $ | — | |
Fixed Income Underlying Funds | | | 677,027,641 | | | | — | | | | — | |
| Total | | $ | 1,332,678,435 | | | $ | — | | | $ | — | |
For further information regarding security characteristics, see the Schedules of Investments.
| | |
| 4. AGREEMENTS AND AFFILIATED TRANSACTIONS | | |
A. Management Agreement — Under the Agreement, GSAM manages the Portfolios, subject to the general supervision of the Trustees.
As compensation for the services rendered pursuant to the Agreement, the assumption of the expenses related thereto and administration of the Portfolios’ business affairs, including providing facilities, GSAM is entitled to a management fee, accrued daily and paid monthly, equal to an annual percentage rate of average daily net assets of 0.124% for the Income Strategies and Satellite Strategies Portfolios and 0.15% for each of the other Portfolios.
B. Distribution and Service Plans — The Trust, on behalf of each Portfolio, has adopted Distribution and Service Plans (the “Plans”). Under the Plans, Goldman Sachs, which serves as distributor (the “Distributor”), is entitled to a fee, accrued daily and paid monthly, for distribution services and personal and account maintenance services, which may then be paid by Goldman Sachs to authorized dealers, at the following annual rates calculated on a Portfolio’s average daily net assets of each respective share class:
| | | | | | | | | | | | | | | | |
| | | Distribution and Service Plan Rates | |
| | | Class A* | | | Class B | | | Class C | | | Class R* | |
Distribution Plan | | | 0.25 | % | | | 0.75 | % | | | 0.75 | % | | | 0.50 | % |
Service Plan | | | — | | | | 0.25 | | | | 0.25 | | | | — | |
| * | | With respect to Class A and Class R Shares, the Distributor at its discretion may use compensation for distribution services paid under the Distribution Plan to compensate service organizations for personal and account maintenance services and expenses as long as such total compensation does not exceed the maximum cap on “service fees” imposed by the Financial Industry Regulatory Authority. |
79
GOLDMAN SACHS FUND OF FUNDS PORTFOLIOS
Notes to Financial Statements (continued)
December 31, 2013
|
| 4. AGREEMENTS AND AFFILIATED TRANSACTIONS (continued) |
C. Distribution Agreement — Goldman Sachs, as Distributor of the shares of the Portfolios pursuant to a Distribution Agreement, may retain a portion of the Class A front end sales charge and Class B and Class C Shares’ CDSC. During the fiscal year ended December 31, 2013, Goldman Sachs advised that it retained the following amounts. There were no amounts retained for Class B during this period.
| | | | | | | | | | |
| | | | | Front End
Sales Charge | | | Contingent Deferred
Sales Charge | |
| Portfolio | | | | Class A | | | Class C | |
Balanced Strategy | | | | $ | 20,356 | | | $ | 22 | |
Equity Growth Strategy | | | | | 16,778 | | | | 376 | |
Growth and Income Strategy | | | | | 42,101 | | | | 675 | |
Growth Strategy | | | | | 41,459 | | | | 247 | |
Income Strategies | | | | | 9,275 | | | | — | |
Satellite Strategies | | | | | 70,500 | | | | — | |
D. Service Plan and Shareholder Administration Plan — The Trust, on behalf of each Portfolio that offers Service Shares, has adopted a Service Plan and a Shareholder Administration Plan. These plans allow for service organizations to provide varying levels of personal and account maintenance and shareholder administration services to their customers who are beneficial owners of such shares. The Service Plan and Shareholder Administration Plan each provide for compensation to the service organizations which is accrued daily and paid monthly at an annual rate of 0.25% (0.50% in aggregate) of the average daily net assets of the Service Shares.
E. Transfer Agency Agreement — Goldman Sachs also serves as the transfer agent of the Portfolios for a fee pursuant to Transfer Agency Agreement. The fees charged for such transfer agency services are accrued daily and paid monthly at annual rates as follows: 0.19% of the average daily net assets of Class A, Class B, Class C, Class IR and Class R Shares and 0.04% of the average daily net assets of Institutional and Service Shares.
F. Other Expense Agreements and Affiliated Transactions — GSAM has agreed to limit certain “Other Expense” of the Portfolios (excluding transfer agent fees and expenses, service fees and shareholder administration fees (as applicable), taxes, interest, brokerage fees, shareholder meetings, litigation, indemnification and extraordinary expenses) to the extent such expenses exceed, on an annual basis, a percentage rate of the average daily net assets of each Portfolio. Such Other Expense reimbursements, if any, are accrued daily and paid monthly. In addition, the Portfolios are not obligated to reimburse GSAM for prior fiscal year expense reimbursements, if any. The Other Expense limitations as an annual percentage rate of average daily net assets are 0.01% for the Income Strategies and Satellite Strategies Portfolios and 0.004% of each other Portfolio. These Other Expense limitations will remain in place through at least April 30, 2014, and prior to such date GSAM may not terminate the arrangements without the approval of the Trustees. The Portfolios bear their respective share of costs related to proxy and shareholder meetings, and GSAM has agreed to reimburse each Portfolio to the extent such expenses exceed a specified percentage of the Portfolio’s net assets. In addition, the Portfolios have entered into certain offset arrangements with the custodian and the transfer agent, which may result in a reduction of the Portfolios’ expenses and are received irrespective of the application of the “Other Expense” limitations described above. Such Other Expense reimbursements, if any, are accrued daily and paid monthly and are disclosed in the Statements of Operations for the fiscal year ended December 31, 2013.
80
GOLDMAN SACHS FUND OF FUNDS PORTFOLIOS
|
| 4. AGREEMENTS AND AFFILIATED TRANSACTIONS (continued) |
As of December 31, 2013, the amounts owed to affiliates of the Portfolios were as follows:
| | | | | | | | | | | | | | | | | | |
| Portfolio | | | | Management Fees | | | Distribution and Service Fees | | | Transfer Agent Fees | | | Total | |
Balanced Strategy | | | | $ | 72,087 | | | $ | 116,958 | | | $ | 55,519 | | | $ | 244,564 | |
Equity Growth Strategy | | | | | 50,935 | | | | 135,667 | | | | 48,961 | | | | 235,563 | |
Growth and Income Strategy | | | | | 131,037 | | | | 297,342 | | | | 121,563 | | | | 549,942 | |
Growth Strategy | | | | | 113,325 | | | | 307,591 | | | | 113,808 | | | | 534,724 | |
Income Strategies | | | | | 3,228 | | | | 10,832 | | | | 3,992 | | | | 18,052 | |
Satellite Strategies | | | | | 139,592 | | | | 150,955 | | | | 101,602 | | | | 392,149 | |
G. Line of Credit Facility — As of December 31, 2013, the Portfolios participated in a $780,000,000 committed, unsecured revolving line of credit facility (the “facility”) together with other funds of the Trust and registered investment companies having management agreements with GSAM or its affiliates (“Other Borrowers”). Pursuant to the terms of the facility, the Portfolios and Other Borrowers could increase the credit amount by an additional $220,000,000, for a total of up to $1,000,000,000. This facility is to be used solely for temporary or emergency purposes, which may include the funding of redemptions. The interest rate on borrowings is based on the federal funds rate. The facility also requires a fee to be paid by the Portfolios based on the amount of the commitment that has not been utilized. For the fiscal year ended December 31, 2013, the Portfolios did not have any borrowings under the facility.
H. Other Transactions with Affiliates — The Portfolios invest primarily in the Institutional Shares of the Underlying Funds. These Underlying Funds are considered to be affiliated with the Portfolios. The tables below show the transactions in and earnings from investments in these affiliated Funds for the fiscal year ended December 31, 2013 (in thousands):
| | | | | | | | | | | | | | | | | | | | | | | | | | | | | | | | |
|
| Balanced Strategy Portfolio | |
| Underlying Funds | | Market
Value
12/31/2012 | | | Purchases
at Cost* | | | Proceeds
from Sales | | | Net
Realized
Gain (Loss) | | | Change in
Unrealized
Gain (Loss) | | | Market
Value
12/31/2013 | | | Dividend
Income | | | Capital Gain
Distributions | |
Goldman Sachs Commodity Strategy Fund | | $ | 17,021 | | | $ | 5,257 | | | $ | (5,082 | ) | | $ | 306 | | | $ | (507 | ) | | $ | 16,995 | | | $ | — | | | $ | — | |
Goldman Sachs Core Fixed Income Fund | | | — | | | | 6,780 | | | | (6,773 | ) | | | (7 | ) | | | — | | | | — | | | | 35 | | | | — | |
Goldman Sachs Dynamic Allocation Fund | | | 87,442 | | | | 19,913 | | | | (37,177 | ) | | | 1,045 | | | | 755 | | | | 71,978 | | | | 12 | | | | 2,722 | |
Goldman Sachs Emerging Markets Debt Fund | | | 5,718 | | | | 30,416 | | | | (26,693 | ) | | | (615 | ) | | | (1,245 | ) | | | 7,581 | | | | 749 | | | | 418 | |
Goldman Sachs Emerging Markets Equity Insights Fund | | | 36,233 | | | | 5,132 | | | | (29,256 | ) | | | (359 | ) | | | (2,462 | ) | | | 9,288 | | | | 96 | | | | — | |
Goldman Sachs Global Income Fund | | | 180,959 | | | | 89,025 | | | | (65,749 | ) | | | 3,843 | | | | (14,056 | ) | | | 194,022 | | | | 9,358 | | | | 3,036 | |
Goldman Sachs High Yield Fund | | | 25,773 | | | | 12,681 | | | | (12,227 | ) | | | 1,584 | | | | (2,089 | ) | | | 25,722 | | | | 1,503 | | | | 661 | |
Goldman Sachs International Equity Insights Fund | | | 51,111 | | | | 43,783 | | | | (47,316 | ) | | | 6,063 | | | | 5,468 | | | | 59,109 | | | | 2,384 | | | | — | |
Goldman Sachs International Real Estate Securities Fund | | | 4,735 | | | | 1,181 | | | | (1,358 | ) | | | 377 | | | | (317 | ) | | | 4,618 | | | | 216 | | | | — | |
Goldman Sachs International Small Cap Insights Fund | | | 7,045 | | | | 1,482 | | | | (3,148 | ) | | | 1,542 | | | | 140 | | | | 7,061 | | | | 227 | | | | 46 | |
Goldman Sachs Large Cap Growth Insights Fund | | | 25,586 | | | | 22,971 | | | | (17,101 | ) | | | 4,840 | | | | 2,883 | | | | 39,179 | | | | 331 | | | | — | |
Goldman Sachs Large Cap Value Fund | | | 14,529 | | | | 5,991 | | | | (11,600 | ) | | | 3,447 | | | | 56 | | | | 12,423 | | | | 102 | | | | — | |
Goldman Sachs Large Cap Value Insights Fund | | | 33,503 | | | | 13,944 | | | | (26,964 | ) | | | 8,101 | | | | 226 | | | | 28,810 | | | | 444 | | | | — | |
Goldman Sachs Local Emerging Markets Debt Fund | | | 25,819 | | | | 6,348 | | | | (23,423 | ) | | | (1,646 | ) | | | (1,453 | ) | | | 5,645 | | | | 813 | | | | — | |
Goldman Sachs Managed Futures Strategy Fund | | | — | | | | 20,075 | | | | (67 | ) | | | 1 | | | | 588 | | | | 20,597 | | | | — | | | | — | |
Goldman Sachs Real Estate Securities Fund | | | 4,677 | | | | 1,213 | | | | (1,426 | ) | | | 804 | | | | (733 | ) | | | 4,535 | | | | 78 | | | | — | |
Goldman Sachs Short Duration Government Fund | | | 28,841 | | | | 7,571 | | | | (36,225 | ) | | | 792 | | | | (979 | ) | | | — | | | | 240 | | | | — | |
Goldman Sachs Small Cap Equity Insights Fund | | | 17,091 | | | | 2,060 | | | | (15,200 | ) | | | 3,287 | | | | 601 | | | | 7,839 | | | | 117 | | | | — | |
81
GOLDMAN SACHS FUND OF FUNDS PORTFOLIOS
Notes to Financial Statements (continued)
December 31, 2013
|
| 4. AGREEMENTS AND AFFILIATED TRANSACTIONS (continued) |
| | | | | | | | | | | | | | | | | | | | | | | | | | | | | | | | |
| | | | | | | | |
| Balanced Strategy Portfolio (continued) | | | | | | | | | | | | | | | | | | | | | | | | | | | | | | | | |
| Underlying Funds | | Market
Value
12/31/2012 | | | Purchases
at Cost* | | | Proceeds
from Sales | | | Net
Realized
Gain (Loss) | | | Change in
Unrealized
Gain (Loss) | | | Market
Value
12/31/2013 | | | Dividend
Income | | | Capital Gain
Distributions | |
Goldman Sachs Strategic Growth Fund | | $ | 12,041 | | | $ | 11,667 | | | $ | (8,480 | ) | | $ | 1,568 | | | $ | (118 | ) | | $ | 16,678 | | | $ | 51 | | | $ | 1,712 | |
Goldman Sachs Strategic Income Fund | | | — | | | | 43,055 | | | | (143 | ) | | | — | | | | 201 | | | | 43,113 | | | | — | | | | — | |
Total | | $ | 578,124 | | | $ | 350,545 | | | $ | (375,408 | ) | | $ | 34,973 | | | $ | (13,041 | ) | | $ | 575,193 | | | $ | 16,756 | | | $ | 8,595 | |
|
| Equity Growth Strategy Portfolio | |
| Underlying Funds | | Market
Value
12/31/2012 | | | Purchases
at Cost* | | | Proceeds
from Sales | | | Net
Realized
Gain (Loss) | | | Change in
Unrealized
Gain (Loss) | | | Market
Value
12/31/2013 | | | Dividend
Income | | | Capital Gain
Distributions | |
Goldman Sachs Commodity Strategy Fund | | $ | 10,643 | | | $ | 2,941 | | | $ | (1,566 | ) | | $ | 109 | | | $ | (232 | ) | | $ | 11,895 | | | $ | — | | | $ | — | |
Goldman Sachs Emerging Markets Equity Insights Fund | | | 39,925 | | | | 3,406 | | | | (14,083 | ) | | | 1,907 | | | | (3,578 | ) | | | 27,577 | | | | 409 | | | | — | |
Goldman Sachs International Equity Insights Fund | | | 128,064 | | | | 26,033 | | | | (33,545 | ) | | | 8,668 | | | | 17,032 | | | | 146,252 | | | | 4,778 | | | | — | |
Goldman Sachs International Real Estate Securities Fund | | | 7,413 | | | | 1,618 | | | | (1,044 | ) | | | 220 | | | | (126 | ) | | | 8,081 | | | | 369 | | | | — | |
Goldman Sachs International Small Cap Insights Fund | | | 11,027 | | | | 894 | | | | (2,423 | ) | | | 946 | | | | 1,914 | | | | 12,358 | | | | 394 | | | | 80 | |
Goldman Sachs Large Cap Growth Insights Fund | | | 50,021 | | | | 13,546 | | | | (15,575 | ) | | | 7,062 | | | | 8,405 | | | | 63,459 | | | | 619 | | | | — | |
Goldman Sachs Large Cap Value Fund | | | 23,323 | | | | 4,227 | | | | (7,746 | ) | | | 2,342 | | | | 3,973 | | | | 26,119 | | | | 241 | | | | — | |
Goldman Sachs Large Cap Value Insights Fund | | | 53,822 | | | | 8,986 | | | | (17,424 | ) | | | 7,308 | | | | 7,799 | | | | 60,491 | | | | 828 | | | | — | |
Goldman Sachs Real Estate Securities Fund | | | 7,319 | | | | 1,587 | | | | (1,044 | ) | | | 559 | | | | (485 | ) | | | 7,936 | | | | 127 | | | | — | |
Goldman Sachs Small Cap Equity Insights Fund | | | 12,506 | | | | 7,977 | | | | (9,338 | ) | | | 3,550 | | | | 1,040 | | | | 15,735 | | | | 165 | | | | — | |
Goldman Sachs Strategic Growth Fund | | | 23,132 | | | | 8,410 | | | | (7,554 | ) | | | 1,772 | | | | 1,317 | | | | 27,077 | | | | 96 | | | | 3,195 | |
Total | | $ | 367,195 | | | $ | 79,625 | | | $ | (111,342 | ) | | $ | 34,443 | | | $ | 37,059 | | | $ | 406,980 | | | $ | 8,026 | | | $ | 3,275 | |
|
| Growth and Income Strategy Portfolio | |
| Underlying Funds | | Market
Value
12/31/2012 | | | Purchases
at Cost* | | | Proceeds
from Sales | | | Net
Realized
Gain (Loss) | | | Change in
Unrealized
Gain (Loss) | | | Market
Value
12/31/2013 | | | Dividend
Income | | | Capital Gain
Distributions | |
Goldman Sachs Commodity Strategy Fund | | $ | 30,395 | | | $ | 6,969 | | | $ | (6,259 | ) | | $ | 481 | | | $ | (868 | ) | | $ | 30,718 | | | $ | — | | | $ | — | |
Goldman Sachs Core Fixed Income Fund | | | — | | | | 12,072 | | | | (12,061 | ) | | | (11 | ) | | | — | | | | — | | | | 67 | | | | — | |
Goldman Sachs Dynamic Allocation Fund | | | 156,308 | | | | 22,344 | | | | (51,712 | ) | | | 1,395 | | | | 2,028 | | | | 130,363 | | | | 21 | | | | 4,883 | |
Goldman Sachs Emerging Markets Debt Fund | | | — | | | | 53,371 | | | | (47,170 | ) | | | (2,140 | ) | | | (359 | ) | | | 3,702 | | | | — | | | | 606 | |
Goldman Sachs Emerging Markets Equity Insights Fund | | | 92,055 | | | | 9,322 | | | | (55,638 | ) | | | 4,290 | | | | (10,508 | ) | | | 39,521 | | | | 487 | | | | — | |
Goldman Sachs Global Income Fund | | | 138,554 | | | | 109,294 | | | | (49,273 | ) | | | 3,515 | | | | (12,215 | ) | | | 189,875 | | | | 8,382 | | | | 2,644 | |
Goldman Sachs High Yield Fund | | | 35,790 | | | | 17,931 | | | | (16,971 | ) | | | 616 | | | | (1,308 | ) | | | 36,058 | | | | 2,129 | | | | 843 | |
Goldman Sachs International Equity Insights Fund | | | 175,512 | | | | 70,927 | | | | (91,260 | ) | | | 23,348 | | | | 13,596 | | | | 192,123 | | | | 6,875 | | | | — | |
Goldman Sachs International Real Estate Securities Fund | | | 12,699 | | | | 1,956 | | | | (2,311 | ) | | | 553 | | | | (376 | ) | | | 12,521 | | | | 589 | | | | — | |
Goldman Sachs International Small Cap Insights Fund | | | 18,890 | | | | 1,802 | | | | (6,273 | ) | | | 2,794 | | | | 1,935 | | | | 19,148 | | | | 616 | | | | 125 | |
Goldman Sachs Large Cap Growth Insights Fund | | | 75,422 | | | | 37,565 | | | | (33,309 | ) | | | 12,617 | | | | 11,122 | | | | 103,417 | | | | 932 | | | | — | |
Goldman Sachs Large Cap Value Fund | | | 38,851 | | | | 11,670 | | | | (24,130 | ) | | | 7,378 | | | | 2,670 | | | | 36,439 | | | | 321 | | | | — | |
Goldman Sachs Large Cap Value Insights Fund | | | 89,590 | | | | 26,983 | | | | (56,093 | ) | | | 24,419 | | | | (346 | ) | | | 84,553 | | | | 1,307 | | | | — | |
Goldman Sachs Local Emerging Markets Debt Fund | | | 35,785 | | | | 9,446 | | | | (40,933 | ) | | | (3,638 | ) | | | (660 | ) | | | — | | | | 1,001 | | | | — | |
Goldman Sachs Managed Futures Strategy Fund | | | — | | | | 36,031 | | | | (85 | ) | | | 1 | | | | 1,060 | | | | 37,007 | | | | — | | | | — | |
Goldman Sachs Real Estate Securities Fund | | | 12,539 | | | | 2,098 | | | | (2,494 | ) | | | 1,499 | | | | (1,345 | ) | | | 12,297 | | | | 215 | | | | — | |
Goldman Sachs Short Duration Government Fund | | | 55,372 | | | | 12,632 | | | | (67,581 | ) | | | (589 | ) | | | 166 | | | | — | | | | 544 | | | | — | |
Goldman Sachs Small Cap Equity Insights Fund | | | 36,810 | | | | 2,059 | | | | (27,388 | ) | | | 8,956 | | | | 119 | | | | 20,556 | | | | 281 | | | | — | |
82
GOLDMAN SACHS FUND OF FUNDS PORTFOLIOS
|
| 4. AGREEMENTS AND AFFILIATED TRANSACTIONS (continued) |
| | | | | | | | | | | | | | | | | | | | | | | | | | | | | | | | |
| | | | | | | | |
| Growth and Income Strategy Portfolio (continued) | | | | | | | | | | | | | | | | | | | | | | | | | | | | | | | | |
| Underlying Funds | | Market
Value
12/31/2012 | | | Purchases
at Cost* | | | Proceeds
from Sales | | | Net
Realized
Gain (Loss) | | | Change in
Unrealized
Gain (Loss) | | | Market
Value
12/31/2013 | | | Dividend
Income | | | Capital Gain
Distributions | |
Goldman Sachs Strategic Growth Fund | | $ | 35,189 | | | $ | 21,331 | | | $ | (17,256 | ) | | $ | 4,078 | | | $ | 823 | | | $ | 44,165 | | | $ | 145 | | | $ | 4,823 | |
Goldman Sachs Strategic Income Fund | | | — | | | | 51,517 | | | | (122 | ) | | | — | | | | 241 | | | | 51,636 | | | | 986 | | | | — | |
Total | | $ | 1,039,761 | | | $ | 517,320 | | | $ | (608,319 | ) | | $ | 89,562 | | | $ | 5,775 | | | $ | 1,044,099 | | | $ | 24,898 | | | $ | 13,924 | |
|
| Growth Strategy Portfolio | |
| Underlying Funds | | Market
Value
12/31/2012 | | | Purchases
at Cost* | | | Proceeds
from Sales | | | Net
Realized
Gain (Loss) | | | Change in
Unrealized
Gain (Loss) | | | Market
Value
12/31/2013 | | | Dividend
Income | | | Capital Gain
Distributions | |
Goldman Sachs Commodity Strategy Fund | | $ | 25,092 | | | $ | 6,134 | | | $ | (4,154 | ) | | $ | 325 | | | $ | (650 | ) | | $ | 26,747 | | | $ | — | | | $ | — | |
Goldman Sachs Dynamic Allocation Fund | | | 129,066 | | | | 20,769 | | | | (39,313 | ) | | | 1,062 | | | | 1,827 | | | | 113,411 | | | | 18 | | | | 4,189 | |
Goldman Sachs Emerging Markets Debt Fund | | | — | | | | 5,219 | | | | (5,171 | ) | | | (48 | ) | | | — | | | | — | | | | 56 | | | | 75 | |
Goldman Sachs Emerging Markets Equity Insights Fund | | | 109,586 | | | | 3,060 | | | | (57,805 | ) | | | 8,072 | | | | (13,699 | ) | | | 49,214 | | | | 708 | | | | — | |
Goldman Sachs Global Income Fund | | | — | | | | 18,466 | | | | (1,307 | ) | | | 1 | | | | (604 | ) | | | 16,556 | | | | 534 | | | | 254 | |
Goldman Sachs High Yield Fund | | | 21,107 | | | | 5,182 | | | | (3,325 | ) | | | 964 | | | | (1,467 | ) | | | 22,461 | | | | 1,378 | | | | 767 | |
Goldman Sachs International Equity Insights Fund | | | 226,963 | | | | 52,140 | | | | (82,421 | ) | | | 21,010 | | | | 23,398 | | | | 241,090 | | | | 8,054 | | | | — | |
Goldman Sachs International Real Estate Securities Fund | | | 13,980 | | | | 2,484 | | | | (2,130 | ) | | | 439 | | | | (238 | ) | | | 14,535 | | | | 669 | | | | — | |
Goldman Sachs International Small Cap Insights Fund | | | 20,796 | | | | 1,608 | | | | (5,501 | ) | | | 2,418 | | | | 2,905 | | | | 22,226 | | | | 706 | | | | 143 | |
Goldman Sachs Large Cap Growth Insights Fund | | | 82,366 | | | | 33,041 | | | | (24,295 | ) | | | 11,299 | | | | 16,054 | | | | 118,465 | | | | 1,073 | | | | — | |
Goldman Sachs Large Cap Value Fund | | | 39,994 | | | | 7,019 | | | | (13,942 | ) | | | 4,272 | | | | 6,512 | | | | 43,855 | | | | 391 | | | | — | |
Goldman Sachs Large Cap Value Insights Fund | | | 92,024 | | | | 14,855 | | | | (30,778 | ) | | | 13,050 | | | | 12,670 | | | | 101,821 | | | | 1,400 | | | | — | |
Goldman Sachs Managed Futures Strategy Fund | | | — | | | | 31,323 | | | | (39 | ) | | | 1 | | | | 920 | | | | 32,205 | | | | — | | | | — | |
Goldman Sachs Real Estate Securities Fund | | | 20,359 | | | | 2,425 | | | | (9,055 | ) | | | 5,291 | | | | (4,743 | ) | | | 14,277 | | | | 287 | | | | — | |
Goldman Sachs Short Duration Government Fund | | | 9,177 | | | | 35,892 | | | | (44,869 | ) | | | (218 | ) | | | 18 | | | | — | | | | 278 | | | | — | |
Goldman Sachs Small Cap Equity Insights Fund | | | 35,593 | | | | 1,280 | | | | (23,492 | ) | | | 8,801 | | | | 849 | | | | 23,031 | | | | 303 | | | | — | |
Goldman Sachs Strategic Growth Fund | | | 38,287 | | | | 20,043 | | | | (13,447 | ) | | | 3,218 | | | | 2,436 | | | | 50,537 | | | | 167 | | | | 5,550 | |
Goldman Sachs Strategic Income Fund | | | — | | | | 22,393 | | | | (28 | ) | | | — | | | | 105 | | | | 22,470 | | | | — | | | | — | |
Total | | $ | 864,390 | | | $ | 283,333 | | | $ | (361,072 | ) | | $ | 79,957 | | | $ | 46,293 | | | $ | 912,901 | | | $ | 16,022 | | | $ | 10,978 | |
|
| Income Strategies Portfolio | |
| Underlying Funds | | Market
Value
12/31/2012 | | | Purchases
at Cost* | | | Proceeds
from Sales | | | Net
Realized
Gain (Loss) | | | Change in
Unrealized
Gain (Loss) | | | Market
Value
12/31/2013 | | | Dividend
Income | | | Capital Gain
Distributions | |
Goldman Sachs Emerging Markets Debt Fund | | $ | 7,698 | | | $ | 2,324 | | | $ | (3,632 | ) | | $ | (164 | ) | | $ | (706 | ) | | $ | 5,520 | | | $ | 317 | | | $ | 83 | |
Goldman Sachs High Yield Floating Rate Fund | | | 6,655 | | | | 1,515 | | | | (5,513 | ) | | | 22 | | | | 16 | | | | 2,695 | | | | 190 | | | | 3 | |
Goldman Sachs High Yield Fund | | | 8,604 | | | | 2,535 | | | | (4,711 | ) | | | 61 | | | | (199 | ) | | | 6,290 | | | | 501 | | | | 220 | |
Goldman Sachs International Real Estate Securities Fund | | | 3,545 | | | | 4,927 | | | | (1,904 | ) | | | 123 | | | | (81 | ) | | | 6,610 | | | | 300 | | | | — | |
Goldman Sachs Local Emerging Markets Debt Fund | | | 4,089 | | | | 1,890 | | | | (1,442 | ) | | | (30 | ) | | | (592 | ) | | | 3,915 | | | | 199 | | | | — | |
Goldman Sachs Real Estate Securities Fund | | | 3,207 | | | | 4,783 | | | | (2,302 | ) | | | 172 | | | | (340 | ) | | | 5,520 | | | | 88 | | | | — | |
Total | | $ | 33,798 | | | $ | 17,974 | | | $ | (19,504 | ) | | $ | 184 | | | $ | (1,902 | ) | | $ | 30,550 | | | $ | 1,595 | | | $ | 306 | |
83
GOLDMAN SACHS FUND OF FUNDS PORTFOLIOS
Notes to Financial Statements (continued)
December 31, 2013
|
| 4. AGREEMENTS AND AFFILIATED TRANSACTIONS (continued) |
| | | | | | | | | | | | | | | | | | | | | | | | | | | | | | | | |
|
| Satellite Strategies Portfolio | |
| Underlying Funds | | Market
Value
12/31/2012 | | | Purchases
at Cost* | | | Proceeds
from Sales | | | Net
Realized
Gain (Loss) | | | Change in
Unrealized
Gain (Loss) | | | Market
Value
12/31/2013 | | | Dividend
Income | | | Capital Gain
Distributions | |
Goldman Sachs Commodity Strategy Fund | | $ | 110,445 | | | $ | 56,431 | | | $ | (18,739 | ) | | $ | (2,126 | ) | | $ | 1,249 | | | $ | 147,260 | | | $ | — | | | $ | — | |
Goldman Sachs Emerging Markets Debt Fund | | | 228,215 | | | | 49,648 | | | | (87,214 | ) | | | (1,225 | ) | | | (25,343 | ) | | | 164,081 | | | | 9,420 | | | | 2,458 | |
Goldman Sachs Emerging Markets Equity Fund | | | 45,540 | | | | 40,797 | | | | (13,218 | ) | | | (1,903 | ) | | | 507 | | | | 71,723 | | | | 542 | | | | — | |
Goldman Sachs Emerging Markets Equity Insights Fund | | | 56,352 | | | | 49,720 | | | | (17,318 | ) | | | (1,305 | ) | | | (1,727 | ) | | | 85,722 | | | | 1,207 | | | | — | |
Goldman Sachs High Yield Floating Rate Fund | | | 152,247 | | | | 27,826 | | | | (114,879 | ) | | | 1,349 | | | | (410 | ) | | | 66,133 | | | | 4,252 | | | | 63 | |
Goldman Sachs High Yield Fund | | | 231,391 | | | | 52,267 | | | | (97,785 | ) | | | 671 | | | | (4,919 | ) | | | 181,625 | | | | 13,866 | | | | 6,312 | |
Goldman Sachs International Real Estate Securities Fund | | | 106,788 | | | | 64,392 | | | | (24,338 | ) | | | 780 | | | | 117 | | | | 147,739 | | | | 6,874 | | | | — | |
Goldman Sachs International Small Cap Fund | | | 38,556 | | | | 40,344 | | | | (9,711 | ) | | | 1,415 | | | | 12,662 | | | | 83,266 | | | | 1,583 | | | | — | |
Goldman Sachs International Small Cap Insights Fund | | | 58,170 | | | | 61,558 | | | | (18,845 | ) | | | 1,538 | | | | 22,032 | | | | 124,453 | | | | 3,928 | | | | 799 | |
Goldman Sachs Local Emerging Markets Debt Fund | | | 160,306 | | | | 32,803 | | | | (52,664 | ) | | | (1,961 | ) | | | (20,555 | ) | | | 117,929 | | | | 6,965 | | | | — | |
Goldman Sachs Real Estate Securities Fund | | | 110,597 | | | | 69,255 | | | | (35,446 | ) | | | 2,648 | | | | (4,307 | ) | | | 142,747 | | | | 2,378 | | | | — | |
Total | | $ | 1,298,607 | | | $ | 545,041 | | | $ | (490,157 | ) | | $ | (119 | ) | | $ | (20,694 | ) | | $ | 1,332,678 | | | $ | 51,015 | | | $ | 9,632 | |
| * | | Includes reinvestment of distributions. |
| | |
| 5. PORTFOLIO SECURITIES TRANSACTIONS | | |
The cost of purchases and proceeds from sales of the Underlying Funds for the fiscal year ended December 31, 2013, were as follows:
| | | | | | | | | | |
| Portfolio | | | | Purchases | | | Sales | |
Balanced Strategy | | | | $ | 350,545,170 | | | $ | 375,408,150 | |
Equity Growth Strategy | | | | | 79,624,978 | | | | 111,341,845 | |
Growth and Income Strategy | | | | | 517,319,164 | | | | 608,318,771 | |
Growth Strategy | | | | | 283,333,365 | | | | 361,072,355 | |
Income Strategies | | | | | 17,973,687 | | | | 19,504,405 | |
Satellite Strategies | | | | | 545,041,922 | | | | 490,157,374 | |
The tax character of distributions paid during the fiscal year ended December 31, 2013 was as follows:
| | | | | | | | | | | | | | | | | | | | | | | | |
| | | Balanced
Strategy | | | Equity
Growth
Strategy | | | Growth and
Income
Strategy | | | Growth
Strategy | | | Income
Strategies | | | Satellite
Strategies | |
Distributions paid from ordinary income | | $ | 15,290,051 | | | $ | 5,900,508 | | | $ | 20,938,415 | | | $ | 11,667,007 | | | $ | 1,453,682 | | | $ | 48,468,102 | |
84
GOLDMAN SACHS FUND OF FUNDS PORTFOLIOS
|
| 6. TAX INFORMATION (continued) |
The tax character of distributions paid during the fiscal year ended December 31, 2012 was as follows:
| | | | | | | | | | | | | | | | | | | | | | | | |
| | | Balanced
Strategy | | | Equity
Growth
Strategy | | | Growth and
Income
Strategy | | | Growth
Strategy | | | Income
Strategies | | | Satellite
Strategies | |
Distributions paid from: | | | | | | | | | | | | | | | | | | | | | | | | |
Ordinary income | | $ | 15,321,722 | | | $ | 6,449,009 | | | $ | 24,410,654 | | | $ | 17,233,969 | | | $ | 1,415,144 | | | $ | 53,331,898 | |
Net long-term capital gains | | | — | | | | — | | | | — | | | | — | | | | — | | | | 3,858,098 | |
Total taxable distributions | | $ | 15,321,722 | | | $ | 6,449,009 | | | $ | 24,410,654 | | | $ | 17,233,969 | | | $ | 1,415,144 | | | $ | 57,189,996 | |
As of December 31, 2013 the components of accumulated earnings (losses) on a tax basis were as follows:
| | | | | | | | | | | | | | | | | | | | | | | | |
| | | Balanced
Strategy | | | Equity Growth
Strategy | | | Growth and
Income Strategy | | | Growth
Strategy | | | Income
Strategies | | | Satellite
Strategies | |
Undistributed ordinary income — net | | $ | 238,400 | | | $ | 86,091 | | | $ | 246,275 | | | $ | 490,996 | | | $ | 19,293 | | | $ | 593,817 | |
Undistributed long-term capital gains | | | — | | | | — | | | | — | | | | — | | | | — | | | | 6,372,248 | |
Capital loss carryovers:(1) | | | | | | | | | | | | | | | | | | | | | | | | |
Expiring 2016(2) | | | — | | | | (46,668,527 | ) | | | (106,482,891 | ) | | | (144,662,145 | ) | | | — | | | | — | |
Expiring 2017(2) | | | — | | | | (109,415,161 | ) | | | (358,977,420 | ) | | | (372,899,651 | ) | | | (8 | ) | | | — | |
Expiring 2018(2) | | | (26,308,041 | ) | | | (76,608,179 | ) | | | (187,607,636 | ) | | | (181,275,105 | ) | | | (1,112,940 | ) | | | — | |
Perpetual Short-term | | | — | | | | — | | | | — | | | | — | | | | — | | | | — | |
Perpetual Long-term | | | — | | | | (35,003,218 | ) | | | — | | | | (62,210,460 | ) | | | — | | | | — | |
Total capital loss carryovers | | $ | (26,308,041 | ) | | $ | (267,695,085 | ) | | $ | (653,067,947 | ) | | $ | (761,047,361 | ) | | $ | (1,112,948 | ) | | $ | — | |
Timing differences (Post October Loss Deferrals) | | | — | | | | — | | | | (1,515,717 | ) | | | (145,572 | ) | | | (29,799 | ) | | | — | |
Unrealized gains (losses) — net | | | 4,051,290 | | | | 52,923,422 | | | | 78,347,112 | | | | 120,471,274 | | | | (1,568,132 | ) | | | 17,294,423 | |
Total accumulated earnings (losses) — net | | $ | (22,018,351 | ) | | $ | (214,685,572 | ) | | $ | (575,990,277 | ) | | $ | (640,230,663 | ) | | $ | (2,691,586 | ) | | $ | 24,260,488 | |
| (1) | | The Balanced Strategy, Equity Growth Strategy, Growth and Income Strategy, Growth Strategy, Income Strategies and Satellite Strategies Portfolios utilized $29,393,994, $11,438,339, $44,286,622, $22,178,138, $422,506 and $3,988,954, respectively, of capital losses in the current fiscal year. |
| (2) | | With the exception of perpetual capital loss carryforwards, expiration occurs on December 31 of the year indicated. |
As of December 31, 2013, the Portfolios’ aggregate security unrealized gains and losses based on cost for U.S. federal income tax purposes were as follows:
| | | | | | | | | | | | | | | | | | | | | | | | |
| | | Balanced
Strategy | | | Equity
Growth
Strategy | | | Growth and
Income
Strategy | | | Growth
Strategy | | | Income
Strategies | | | Satellite
Strategies | |
Tax Cost | | $ | 571,141,812 | | | $ | 354,056,728 | | | $ | 965,752,063 | | | $ | 792,829,850 | | | $ | 32,117,761 | | | $ | 1,315,384,012 | |
Gross unrealized gain | | | 26,419,466 | | | | 93,456,079 | | | | 114,129,905 | | | | 156,473,336 | | | | 96,359 | | | | 80,395,350 | |
Gross unrealized loss | | | (22,368,176 | ) | | | (40,532,657 | ) | | | (35,782,793 | ) | | | (36,002,062 | ) | | | (1,664,491 | ) | | | (63,100,927 | ) |
Net unrealized security gain (loss) | | $ | 4,051,290 | | | $ | 52,923,422 | | | $ | 78,347,112 | | | $ | 120,471,274 | | | $ | (1,568,132 | ) | | $ | 17,294,423 | |
The difference between GAAP-basis and tax-basis unrealized gains (losses) is attributable primarily to wash sales and differences in the tax treatment of Underlying Fund investments.
85
GOLDMAN SACHS FUND OF FUNDS PORTFOLIOS
Notes to Financial Statements (continued)
December 31, 2013
|
| 6. TAX INFORMATION (continued) |
In order to present certain components of the Portfolios’ capital accounts on a tax-basis, certain reclassifications have been recorded to the Portfolios’ accounts. These reclassifications have no impact on the net asset value of the Portfolios and result primarily from differences related to the tax treatment of Underlying Fund investments.
| | | | | | | | | | |
| Portfolio | | | | Accumulated
Net Realized
Gain (Loss) | | | Undistributed
Net Investment
Income (Loss) | |
Balanced Strategy | | | | $ | (1,533,710 | ) | | $ | 1,533,710 | |
Equity Growth Strategy | | | | | (553,371 | ) | | | 553,371 | |
Growth and Income Strategy | | | | | (2,877,332 | ) | | | 2,877,332 | |
Growth Strategy | | | | | (2,370,610 | ) | | | 2,370,610 | |
Income Strategies | | | | | (101,138 | ) | | | 101,138 | |
Satellite Strategies | | | | | (2,915,955 | ) | | | 2,915,955 | |
GSAM has reviewed the Portfolios’ tax positions for all open tax years (the current and prior three years, as applicable) and has concluded that no provision for income tax is required in the Portfolios’ financial statements. Such open tax years remain subject to examination and adjustment by tax authorities.
The Portfolios’ risks include, but are not limited to, the following:
Investments in the Underlying Funds — The investments of a Portfolio are concentrated in the Underlying Funds, and the Portfolio’s investment performance is directly related to the investment performance of the Underlying Funds it holds. A Portfolio is subject to the risk factors associated with the investments of the Underlying Funds in direct proportion to the amount of assets allocated to each. A Portfolio that has a relative concentration of its portfolio in a single Underlying Fund may be more susceptible to adverse developments affecting that Underlying Fund, and may be more susceptible to losses because of these developments.
Liquidity Risk — An Underlying Fund may make investments that are illiquid or that may become less liquid in response to market developments or adverse investor perceptions. Illiquid investments may be more difficult to value. Liquidity risk may also refer to the risk that a Portfolio will not be able to pay redemption proceeds within the allowable time period because of unusual market conditions, an unusually high volume of redemption requests, or other reasons. To meet redemption requests, a Portfolio may be forced to sell investments at an unfavorable time and/or under unfavorable conditions.
Market and Credit Risks — In the normal course of business, the Portfolios and the Underlying Funds trade financial instruments and enter into financial transactions where risk of potential loss exists due to changes in the market (market risk). Additionally, the Portfolios and the Underlying Funds may also be exposed to credit risk in the event that an issuer fails to perform or that an institution or entity with which the Portfolios and the Underlying Funds have unsettled or open transactions defaults.
Investing in foreign markets by the Underlying Funds may involve special risks and considerations not typically associated with investing in the U.S. These risks include revaluation of currencies, high rates of inflation, repatriation restrictions on income and capital, and adverse political and economic developments. Moreover, securities issued in these markets may be less liquid, be subject to government ownership controls, have delayed settlements and their prices may be more volatile than those of comparable securities in the U.S.
86
GOLDMAN SACHS FUND OF FUNDS PORTFOLIOS
Under the Trust’s organizational documents, its Trustees, officers, employees and agents are indemnified, to the extent permitted by the Act and state law, against certain liabilities that may arise out of performance of their duties to the Portfolios. Additionally, in the course of business, the Portfolios enter into contracts that contain a variety of indemnification clauses. The Portfolios’ maximum exposure under these arrangements is unknown, as this would involve future claims that may be made against the Portfolios that have not yet occurred. However, GSAM believes the risk of loss under these arrangements to be remote.
Subsequent events after the Statement of Assets and Liabilities date have been evaluated through the date the financial statements were issued. GSAM has concluded that there is no impact requiring adjustment or disclosure in the financial statements.
Mergers and Reorganizations — At a meeting held on February 12, 2014, the Board of Trustees of the Trust approved an agreement and Plan of Reorganization (the “Agreement”) providing for the tax-free acquisition of the Income Strategies Portfolio by the Satellite Strategies Portfolio. The acquisition is expected to be completed in April 2014.
87
GOLDMAN SACHS FUND OF FUNDS PORTFOLIOS
Notes to Financial Statements (continued)
December 31, 2013
|
| 10. SUMMARY OF SHARE TRANSACTIONS |
Share activity is as follows:
| | | | | | | | | | | | | | | | |
| | | Balanced Strategy Portfolio | |
| | | | |
| | | For the Fiscal Year Ended
December 31, 2013 | | | For the Fiscal Year Ended
December 31, 2012 | |
| | | | |
| | | Shares | | | Dollars | | | Shares | | | Dollars | |
| | | | |
| Class A Shares | | | | | | | | | | | | | | | | |
Shares sold | | | 1,995,871 | | | $ | 21,765,218 | | | | 3,933,626 | | | $ | 40,835,144 | |
Reinvestment of distributions | | | 442,633 | | | | 4,876,042 | | | | 577,879 | | | | 6,035,036 | |
Shares converted from Class B(a) | | | 45,998 | | | | 502,786 | | | | 32,785 | | | | 343,670 | |
Shares redeemed | | | (6,598,332 | ) | | | (72,015,165 | ) | | | (16,916,989 | ) | | | (176,900,717 | ) |
| | | | (4,113,830 | ) | | | (44,871,119 | ) | | | (12,372,699 | ) | | | (129,686,867 | ) |
| Class B Shares | | | | | | | | | | | | | | | | |
Shares sold | | | 38,356 | | | | 416,745 | | | | 57,213 | | | | 591,472 | |
Reinvestment of distributions | | | 20,388 | | | | 226,271 | | | | 29,947 | | | | 313,775 | |
Shares converted to Class A(a) | | | (46,030 | ) | | | (502,786 | ) | | | (32,816 | ) | | | (343,670 | ) |
Shares redeemed | | | (538,830 | ) | | | (5,890,497 | ) | | | (731,211 | ) | | | (7,607,861 | ) |
| | | | (526,116 | ) | | | (5,750,267 | ) | | | (676,867 | ) | | | (7,046,284 | ) |
| Class C Shares | | | | | | | | | | | | | | | | |
Shares sold | | | 678,673 | | | | 7,379,568 | | | | 780,030 | | | | 8,055,984 | |
Reinvestment of distributions | | | 98,733 | | | | 1,093,819 | | | | 110,702 | | | | 1,159,929 | |
Shares redeemed | | | (1,807,729 | ) | | | (19,717,227 | ) | | | (2,744,930 | ) | | | (28,326,703 | ) |
| | | | (1,030,323 | ) | | | (11,243,840 | ) | | | (1,854,198 | ) | | | (19,110,790 | ) |
| Institutional Shares | | | | | | | | | | | | | | | | |
Shares sold | | | 12,048,804 | | | | 133,208,886 | | | | 14,683,558 | | | | 155,603,066 | |
Reinvestment of distributions | | | 743,349 | | | | 8,192,315 | | | | 651,608 | | | | 6,815,401 | |
Shares redeemed | | | (10,389,336 | ) | | | (113,600,227 | ) | | | (7,293,625 | ) | | | (75,796,293 | ) |
| | | | 2,402,817 | | | | 27,800,974 | | | | 8,041,541 | | | | 86,622,174 | |
| Service Shares | | | | | | | | | | | | | | | | |
Shares sold | | | 38,390 | | | | 414,907 | | | | 37,770 | | | | 396,112 | |
Reinvestment of distributions | | | 1,543 | | | | 17,074 | | | | 1,638 | | | | 17,183 | |
Shares redeemed | | | (75,483 | ) | | | (821,327 | ) | | | (97,888 | ) | | | (1,007,108 | ) |
| | | | (35,550 | ) | | | (389,346 | ) | | | (58,480 | ) | | | (593,813 | ) |
| Class IR Shares | | | | | | | | | | | | | | | | |
Shares sold | | | 308,262 | | | | 3,358,922 | | | | 54,761 | | | | 574,134 | |
Reinvestment of distributions | | | 5,687 | | | | 62,667 | | | | 2,406 | | | | 25,133 | |
Shares redeemed | | | (46,364 | ) | | | (509,739 | ) | | | (46,007 | ) | | | (466,633 | ) |
| | | | 267,585 | | | | 2,911,850 | | | | 11,160 | | | | 132,634 | |
| Class R Shares | | | | | | | | | | | | | | | | |
Shares sold | | | 262,194 | | | | 2,867,266 | | | | 411,741 | | | | 4,279,461 | |
Reinvestment of distributions | | | 15,595 | | | | 171,405 | | | | 18,768 | | | | 195,478 | |
Shares redeemed | | | (554,586 | ) | | | (6,058,969 | ) | | | (389,385 | ) | | | (4,045,572 | ) |
| | | | (276,797 | ) | | | (3,020,298 | ) | | | 41,124 | | | | 429,367 | |
NET DECREASE | | | (3,312,214 | ) | | $ | (34,562,046 | ) | | | (6,868,419 | ) | | $ | (69,253,579 | ) |
| (a) | | Class B Shares automatically convert into Class A Shares on or about the fifteenth day of the last month of the calendar quarter that is eight years after the initial purchase date of either the Portfolio or another Goldman Sachs Fund. |
88
GOLDMAN SACHS FUND OF FUNDS PORTFOLIOS
| | | | | | | | | | | | | | | | | | | | | | | | | | | | | | |
| Equity Growth Strategy Portfolio | | | Growth and Income Strategy Portfolio | |
For the Fiscal Year Ended
December 31, 2013 | | | For the Fiscal Year Ended
December 31, 2012 | | | For the Fiscal Year Ended
December 31, 2013 | | | For the Fiscal Year Ended
December 31, 2012 | |
| Shares | | | Dollars | | | Shares | | | Dollars | | | Shares | | | Dollars | | | Shares | | | Dollars | |
| | | | | | | | | | | | | | | | | | | | | | | | | | | | | | |
| | 1,184,590 | | | $ | 15,387,971 | | | | 1,712,604 | | | $ | 19,068,788 | | | | 3,221,984 | | | $ | 37,286,381 | | | | 5,259,273 | | | $ | 56,005,716 | |
| | 152,642 | | | | 2,173,609 | | | | 215,902 | | | | 2,502,308 | | | | 677,337 | | | | 8,145,519 | | | | 1,096,426 | | | | 11,822,273 | |
| | 49,269 | | | | 650,138 | | | | 44,832 | | | | 507,534 | | | | 69,634 | | | | 816,695 | | | | 56,774 | | | | 612,952 | |
| | (3,304,708 | ) | | | (42,583,655 | ) | | | (9,742,606 | ) | | | (111,273,376 | ) | | | (13,006,747 | ) | | | (150,580,761 | ) | | | (36,646,662 | ) | | | (392,855,985 | ) |
| | (1,918,207 | ) | | | (24,371,937 | ) | | | (7,769,268 | ) | | | (89,194,746 | ) | | | (9,037,792 | ) | | | (104,332,166 | ) | | | (30,234,189 | ) | | | (324,415,044 | ) |
| | | | | | | | | | | | | | | | | | | | | | | | | | | | | | |
| | 10,846 | | | | 129,791 | | | | 16,707 | | | | 180,936 | | | | 41,719 | | | | 480,488 | | | | 56,317 | | | | 602,114 | |
| | 8,090 | | | | 110,987 | | | | 16,643 | | | | 185,739 | | | | 52,103 | | | | 625,762 | | | | 86,515 | | | | 932,633 | |
| | (51,368 | ) | | | (650,138 | ) | | | (46,652 | ) | | | (507,534 | ) | | | (70,238 | ) | | | (816,695 | ) | | | (57,078 | ) | | | (612,952 | ) |
| | (380,562 | ) | | | (4,730,293 | ) | | | (514,353 | ) | | | (5,552,346 | ) | | | (1,658,694 | ) | | | (19,126,197 | ) | | | (1,993,536 | ) | | | (21,191,369 | ) |
| | (412,994 | ) | | | (5,139,653 | ) | | | (527,655 | ) | | | (5,693,205 | ) | | | (1,635,110 | ) | | | (18,836,642 | ) | | | (1,907,782 | ) | | | (20,269,574 | ) |
| | | | | | | | | | | | | | | | | | | | | | | | | | | | | | |
| | 531,158 | | | | 6,597,539 | | | | 558,348 | | | | 5,972,796 | | | | 880,722 | | | | 10,106,306 | | | | 1,003,911 | | | | 10,600,725 | |
| | 59,178 | | | | 806,600 | | | | 96,609 | | | | 1,072,361 | | | | 208,762 | | | | 2,498,879 | | | | 281,256 | | | | 3,023,508 | |
| | (1,894,072 | ) | | | (23,452,250 | ) | | | (3,011,929 | ) | | | (32,210,930 | ) | | | (4,101,403 | ) | | | (46,895,526 | ) | | | (7,165,780 | ) | | | (75,670,099 | ) |
| | (1,303,736 | ) | | | (16,048,111 | ) | | | (2,356,972 | ) | | | (25,165,773 | ) | | | (3,011,919 | ) | | | (34,290,341 | ) | | | (5,880,613 | ) | | | (62,045,866 | ) |
| | | | | | | | | | | | | | | | | | | | | | | | | | | | | | |
| | 1,441,266 | | | | 19,109,972 | | | | 3,988,978 | | | | 47,431,667 | | | | 9,623,589 | | | | 112,142,572 | | | | 13,056,683 | | | | 143,453,189 | |
| | 161,457 | | | | 2,318,520 | | | | 181,874 | | | | 2,124,288 | | | | 671,458 | | | | 8,060,859 | | | | 606,382 | | | | 6,573,369 | |
| | (799,416 | ) | | | (10,373,589 | ) | | | (877,736 | ) | | | (10,054,599 | ) | | | (5,670,551 | ) | | | (66,355,809 | ) | | | (3,272,864 | ) | | | (35,044,709 | ) |
| | 803,307 | | | | 11,054,903 | | | | 3,293,116 | | | | 39,501,356 | | | | 4,624,496 | | | | 53,847,622 | | | | 10,390,201 | | | | 114,981,849 | |
| | | | | | | | | | | | | | | | | | | | | | | | | | | | | | |
| | 22,408 | | | | 282,030 | | | | 9,864 | | | | 110,367 | | | | 36,601 | | | | 420,663 | | | | 18,592 | | | | 197,535 | |
| | 396 | | | | 5,624 | | | | 312 | | | | 3,600 | | | | 1,644 | | | | 19,727 | | | | 2,711 | | | | 29,218 | |
| | (14,170 | ) | | | (177,386 | ) | | | (91,468 | ) | | | (1,035,249 | ) | | | (67,119 | ) | | | (791,502 | ) | | | (77,694 | ) | | | (821,634 | ) |
| | 8,634 | | | | 110,268 | | | | (81,292 | ) | | | (921,282 | ) | | | (28,874 | ) | | | (351,112 | ) | | | (56,391 | ) | | | (594,881 | ) |
| | | | | | | | | | | | | | | | | | | | | | | | | | | | | | |
| | 290,391 | | | | 3,716,876 | | | | 13,660 | | | | 154,991 | | | | 145,001 | | | | 1,665,180 | | | | 42,856 | | | | 450,817 | |
| | 4,808 | | | | 67,648 | | | | 961 | | | | 11,010 | | | | 4,828 | | | | 57,830 | | | | 3,895 | | | | 41,840 | |
| | (73,012 | ) | | | (936,829 | ) | | | (25,302 | ) | | | (280,030 | ) | | | (57,896 | ) | | | (676,547 | ) | | | (80,277 | ) | | | (853,706 | ) |
| | 222,187 | | | | 2,847,695 | | | | (10,681 | ) | | | (114,029 | ) | | | 91,933 | | | | 1,046,463 | | | | (33,526 | ) | | | (361,049 | ) |
| | | | | | | | | | | | | | | | | | | | | | | | | | | | | | |
| | 44,627 | | | | 567,525 | | | | 106,325 | | | | 1,174,405 | | | | 74,403 | | | | 856,575 | | | | 123,865 | | | | 1,305,347 | |
| | 3,196 | | | | 45,154 | | | | 7,527 | | | | 86,405 | | | | 5,191 | | | | 62,301 | | | | 8,286 | | | | 89,148 | |
| | (208,698 | ) | | | (2,682,118 | ) | | | (188,562 | ) | | | (2,083,474 | ) | | | (168,870 | ) | | | (1,955,849 | ) | | | (199,761 | ) | | | (2,083,523 | ) |
| | (160,875 | ) | | | (2,069,439 | ) | | | (74,710 | ) | | | (822,664 | ) | | | (89,276 | ) | | | (1,036,973 | ) | | | (67,610 | ) | | | (689,028 | ) |
| | (2,761,684 | ) | | $ | (33,616,274 | ) | | | (7,527,462 | ) | | $ | (82,410,343 | ) | | | (9,086,542 | ) | | $ | (103,953,149 | ) | | | (27,789,910 | ) | | $ | (293,393,593 | ) |
89
GOLDMAN SACHS FUND OF FUNDS PORTFOLIOS
Notes to Financial Statements (continued)
December 31, 2013
|
| 10. SUMMARY OF SHARE TRANSACTIONS (continued) |
Share activity is as follows:
| | | | | | | | | | | | | | | | |
| | | Growth Strategy Portfolio | |
| | | | |
| | | For the Fiscal Year Ended
December 31, 2013 | | | For the Fiscal Year Ended
December 31, 2012 | |
| | | | |
| | | Shares | | | Dollars | | | Shares | | | Dollars | |
| | | | |
| Class A Shares | | | | | | | | | | | | | | | | |
Shares sold | | | 2,452,805 | | | $ | 29,398,045 | | | | 4,524,141 | | | $ | 48,010,421 | |
Reinvestment of distributions | | | 402,616 | | | | 5,177,549 | | | | 735,486 | | | | 8,024,155 | |
Shares converted from Class B(a) | | | 132,196 | | | | 1,593,543 | | | | 165,244 | | | | 1,789,555 | |
Shares redeemed | | | (8,829,785 | ) | | | (105,421,465 | ) | | | (26,401,820 | ) | | | (283,650,983 | ) |
| | | | (5,842,168 | ) | | | (69,252,328 | ) | | | (20,976,949 | ) | | | (225,826,852 | ) |
| Class B Shares | | | | | | | | | | | | | | | | |
Shares sold | | | 22,955 | | | | 274,482 | | | | 41,473 | | | | 446,018 | |
Reinvestment of distributions | | | 16,991 | | | | 220,167 | | | | 61,894 | | | | 679,586 | |
Shares converted to Class A(a) | | | (131,906 | ) | | | (1,593,543 | ) | | | (164,941 | ) | | | (1,789,555 | ) |
Shares redeemed | | | (1,384,669 | ) | | | (16,663,976 | ) | | | (1,690,961 | ) | | | (18,103,674 | ) |
| | | | (1,476,629 | ) | | | (17,762,870 | ) | | | (1,752,535 | ) | | | (18,767,625 | ) |
| Class C Shares | | | | | | | | | | | | | | | | |
Shares sold | | | 942,558 | | | | 11,128,191 | | | | 971,482 | | | | 10,285,943 | |
Reinvestment of distributions | | | 91,594 | | | | 1,174,236 | | | | 239,178 | | | | 2,602,249 | |
Shares redeemed | | | (4,383,657 | ) | | | (52,109,584 | ) | | | (7,056,110 | ) | | | (74,807,781 | ) |
| | | | (3,349,505 | ) | | | (39,807,157 | ) | | | (5,845,450 | ) | | | (61,919,589 | ) |
| Institutional Shares | | | | | | | | | | | | | | | | |
Shares sold | | | 5,118,966 | | | | 61,986,517 | | | | 8,162,443 | | | | 90,871,380 | |
Reinvestment of distributions | | | 334,288 | | | | 4,295,597 | | | | 406,918 | | | | 4,439,471 | |
Shares redeemed | | | (2,017,096 | ) | | | (24,213,799 | ) | | | (2,294,790 | ) | | | (24,640,673 | ) |
| | | | 3,436,158 | | | | 42,068,315 | | | | 6,274,571 | | | | 70,670,178 | |
| Service Shares | | | | | | | | | | | | | | | | |
Shares sold | | | 18,672 | | | | 221,925 | | | | 26,065 | | | | 278,076 | |
Reinvestment of distributions | | | 1,178 | | | | 15,095 | | | | 2,231 | | | | 24,255 | |
Shares redeemed | | | (42,839 | ) | | | (508,996 | ) | | | (109,702 | ) | | | (1,174,857 | ) |
| | | | (22,989 | ) | | | (271,976 | ) | | | (81,406 | ) | | | (872,526 | ) |
| Class IR Shares | | | | | | | | | | | | | | | | |
Shares sold | | | 259,825 | | | | 3,077,318 | | | | 57,362 | | | | 600,189 | |
Reinvestment of distributions | | | 4,519 | | | | 57,342 | | | | 3,474 | | | | 37,449 | |
Shares redeemed | | | (117,430 | ) | | | (1,387,974 | ) | | | (66,073 | ) | | | (688,295 | ) |
| | | | 146,914 | | | | 1,746,686 | | | | (5,237 | ) | | | (50,657 | ) |
| Class R Shares | | | | | | | | | | | | | | | | |
Shares sold | | | 68,109 | | | | 788,092 | | | | 130,742 | | | | 1,354,989 | |
Reinvestment of distributions | | | 4,148 | | | | 52,102 | | | | 9,599 | | | | 102,330 | |
Shares redeemed | | | (190,585 | ) | | | (2,258,270 | ) | | | (145,012 | ) | | | (1,491,307 | ) |
| | | | (118,328 | ) | | | (1,418,076 | ) | | | (4,671 | ) | | | (33,988 | ) |
NET INCREASE (DECREASE) | | | (7,226,547 | ) | | $ | (84,697,406 | ) | | | (22,391,677 | ) | | $ | (236,801,059 | ) |
| (a) | | Class B Shares automatically convert into Class A Shares on or about the fifteenth day of the last month of the calendar quarter that is eight years after the initial purchase date of either the Portfolio or another Goldman Sachs Fund. |
90
GOLDMAN SACHS FUND OF FUNDS PORTFOLIOS
| | | | | | | | | | | | | | | | | | | | | | | | | | | | | | |
| Income Strategies Portfolio | | | Satellite Strategies Portfolio | |
For the Fiscal Year Ended
December 31, 2013 | | | For the Fiscal Year Ended
December 31, 2012 | | | For the Fiscal Year Ended
December 31, 2013 | | | For the Fiscal Year Ended
December 31, 2012 | |
| Shares | | | Dollars | | | Shares | | | Dollars | | | Shares | | | Dollars | | | Shares | | | Dollars | |
| | | | | | | | | | | | | | | | | | | | | | | | | | | | | | |
| | 347,194 | | | $ | 3,071,089 | | | | 485,438 | | | $ | 4,173,414 | | | | 10,114,051 | | | $ | 83,139,280 | | | | 12,330,734 | | | $ | 98,039,375 | |
| | 54,817 | | | | 477,111 | | | | 74,144 | | | | 643,554 | | | | 957,227 | | | | 7,766,772 | | | | 1,255,091 | | | | 10,088,097 | |
| | — | | | | — | | | | — | | | | — | | | | — | | | | — | | | | — | | | | — | |
| | (732,790 | ) | | | (6,436,829 | ) | | | (1,308,030 | ) | | | (11,339,758 | ) | | | (13,116,365 | ) | | | (107,304,384 | ) | | | (10,372,327 | ) | | | (81,969,213 | ) |
| | (330,779 | ) | | | (2,888,629 | ) | | | (748,448 | ) | | | (6,522,790 | ) | | | (2,045,087 | ) | | | (16,398,332 | ) | | | 3,213,498 | | | | 26,158,259 | |
| | | | | | | | | | | | | | | | | | | | | | | | | | | | | | |
| | — | | | | — | | | | — | | | | — | | | | — | | | | — | | | | — | | | | — | |
| | — | | | | — | | | | — | | | | — | | | | — | | | | — | | | | — | | | | — | |
| | — | | | | — | | | | — | | | | — | | | | — | | | | — | | | | — | | | | — | |
| | — | | | | — | | | | — | | | | — | | | | — | | | | — | | | | — | | | | — | |
| | — | | | | — | | | | — | | | | — | | | | — | | | | — | | | | — | | | | — | |
| | | | | | | | | | | | | | | | | | | | | | | | | | | | | | |
| | 182,720 | | | | 1,619,789 | | | | 294,007 | | | | 2,551,527 | | | | 3,146,500 | | | | 25,790,317 | | | | 3,304,807 | | | | 26,190,653 | |
| | 42,368 | | | | 369,596 | | | | 40,276 | | | | 352,901 | | | | 311,838 | | | | 2,518,554 | | | | 458,838 | | | | 3,674,917 | |
| | (409,963 | ) | | | (3,599,055 | ) | | | (285,675 | ) | | | (2,459,446 | ) | | | (4,851,296 | ) | | | (39,236,231 | ) | | | (3,827,184 | ) | | | (30,168,139 | ) |
| | (184,875 | ) | | | (1,609,670 | ) | | | 48,608 | | | | 444,982 | | | | (1,392,958 | ) | | | (10,927,360 | ) | | | (63,539 | ) | | | (302,569 | ) |
| | | | | | | | | | | | | | | | | | | | | | | | | | | | | | |
| | 533,343 | | | | 4,742,071 | | | | 504,326 | | | | 4,382,796 | | | | 39,431,233 | | | | 325,184,736 | | | | 39,139,939 | | | | 310,588,324 | |
| | 41,543 | | | | 359,229 | | | | 23,522 | | | | 202,461 | | | | 2,847,480 | | | | 23,080,492 | | | | 3,255,593 | | | | 26,137,541 | |
| | (309,004 | ) | | | (2,721,552 | ) | | | (906,323 | ) | | | (7,693,132 | ) | | | (35,399,930 | ) | | | (289,272,901 | ) | | | (24,523,197 | ) | | | (194,498,187 | ) |
| | 265,882 | | | | 2,379,748 | | | | (378,475 | ) | | | (3,107,875 | ) | | | 6,878,783 | | | | 58,992,327 | | | | 17,872,335 | | | | 142,227,678 | |
| | | | | | | | | | | | | | | | | | | | | | | | | | | | | | |
| | — | | | | — | | | | — | | | | — | | | | 578,143 | | | | 4,704,161 | | | | 1,420,141 | | | | 11,138,323 | |
| | — | | | | — | | | | — | | | | — | | | | 34,468 | | | | 278,881 | | | | 63,122 | | | | 504,915 | |
| | — | | | | — | | | | — | | | | — | | | | (1,634,928 | ) | | | (13,223,642 | ) | | | (799,675 | ) | | | (6,316,606 | ) |
| | — | | | | — | | | | — | | | | — | | | | (1,022,317 | ) | | | (8,240,600 | ) | | | 683,588 | | | | 5,326,632 | |
| | | | | | | | | | | | | | | | | | | | | | | | | | | | | | |
| | 294,218 | | | | 2,507,524 | | | | 138,200 | | | | 1,181,458 | | | | 5,749,744 | | | | 47,309,945 | | | | 3,397,105 | | | | 27,008,671 | |
| | 14,564 | | | | 125,762 | | | | 10,438 | | | | 90,754 | | | | 405,814 | | | | 3,288,645 | | | | 414,768 | | | | 3,328,300 | |
| | (226,365 | ) | | | (1,962,788 | ) | | | (46,742 | ) | | | (398,911 | ) | | | (3,967,127 | ) | | | (32,333,708 | ) | | | (2,756,573 | ) | | | (21,937,655 | ) |
| | 82,417 | | | | 670,498 | | | | 101,896 | | | | 873,301 | | | | 2,188,431 | | | | 18,264,882 | | | | 1,055,300 | | | | 8,399,316 | |
| | | | | | | | | | | | | | | | | | | | | | | | | | | | | | |
| | 3,310 | | | | 29,391 | | | | 9,405 | | | | 82,586 | | | | 340,472 | | | | 2,813,438 | | | | 391,012 | | | | 3,068,177 | |
| | 646 | | | | 5,641 | | | | 485 | | | | 4,251 | | | | 14,632 | | | | 118,127 | | | | 14,739 | | | | 118,020 | |
| | (5,122 | ) | | | (44,149 | ) | | | (5,047 | ) | | | (44,068 | ) | | | (234,252 | ) | | | (1,910,746 | ) | | | (178,360 | ) | | | (1,418,157 | ) |
| | (1,166 | ) | | | (9,117 | ) | | | 4,843 | | | | 42,769 | | | | 120,852 | | | | 1,020,819 | | | | 227,391 | | | | 1,768,040 | |
| | (168,521 | ) | | $ | (1,457,170 | ) | | | (971,576 | ) | | $ | (8,269,613 | ) | | | 4,727,704 | | | $ | 42,711,736 | | | | 22,988,573 | | | $ | 183,577,356 | |
91
Report of Independent Registered Public
Accounting Firm
To the Board of Trustees and Shareholders of
Goldman Sachs Trust — Goldman Sachs Fund of Funds Portfolios:
In our opinion, the accompanying statements of assets and liabilities, including the schedules of investments, and the related statements of operations and of changes in net assets and the financial highlights present fairly, in all material respects, the financial position of Goldman Sachs Balanced Strategy Portfolio, Goldman Sachs Equity Growth Strategy Portfolio, Goldman Sachs Growth and Income Strategy Portfolio, Goldman Sachs Growth Strategy Portfolio, Goldman Sachs Income Strategies Portfolio and Goldman Sachs Satellite Strategies Portfolio, (collectively the “Fund of Funds Portfolios”), portfolios of Goldman Sachs Trust, at December 31, 2013, the results of their operations, the changes in their net assets and the financial highlights for each of the periods indicated, in conformity with accounting principles generally accepted in the United States of America. These financial statements and financial highlights (hereafter referred to as “financial statements”) are the responsibility of the Fund of Funds Portfolios’ management. Our responsibility is to express an opinion on these financial statements based on our audits. We conducted our audits of these financial statements in accordance with the standards of the Public Company Accounting Oversight Board (United States). Those standards require that we plan and perform the audits to obtain reasonable assurance about whether the financial statements are free of material misstatement. An audit includes examining, on a test basis, evidence supporting the amounts and disclosures in the financial statements, assessing the accounting principles used and significant estimates made by management, and evaluating the overall financial statement presentation. We believe that our audits, which included confirmation of securities at December 31, 2013, by correspondence with brokers and the transfer agent of the Underlying Funds, provide a reasonable basis for our opinion.
PricewaterhouseCoopers LLP
Boston, Massachusetts
February 26, 2014
92
GOLDMAN SACHS FUND OF FUNDS PORTFOLIOS
Fund Expenses — Six Month Period Ended December 31, 2013 (Unaudited)
As a shareholder of Class A, Class B, Class C, Institutional, Service, Class IR or Class R Shares of a Fund, you incur two types of costs: (1) transaction costs, including sales charges on purchase payments (with respect to Class A Shares), contingent deferred sales charges on redemptions (with respect to Class B and Class C Shares), and (2) ongoing costs, including management fees; distribution and service (12b-1) fees (with respect to Class A, Class B, Class C and Class R Shares); and other Fund expenses. This Example is intended to help you understand your ongoing costs (in dollars) of investing in Class A, Class B, Class C, Institutional, Service, Class IR or Class R Shares of the Funds and to compare these costs with the ongoing costs of investing in other mutual funds.
The Example is based on an investment of $1,000 invested at the beginning of the period and held for the entire period from July 1, 2013 through December 31, 2013.
Actual Expenses — The first line under each share class in the table below provides information about actual account values and actual expenses. You may use the information in this line, together with the amount you invested, to estimate the expenses that you paid over the period. Simply divide your account value by $1,000 (for example, an $8,600 account value divided by $1,000=8.6), then multiply the result by the number in the first line under the heading entitled “Expenses Paid” to estimate the expenses you paid on your account during this period.
Hypothetical Example for Comparison Purposes — The second line under each share class in the table below provides information about hypothetical account values and hypothetical expenses based on the Funds’ actual net expense ratios and an assumed rate of return of 5% per year before expenses, which is not the Funds’ actual return. The hypothetical account values and expenses may not be used to estimate the actual ending account balance or expenses you paid for the period. You may use this information to compare the ongoing costs of investing in the Funds and other funds. To do so, compare this 5% hypothetical example with the 5% hypothetical examples that appear in the shareholder reports of the other funds.
Please note that the expenses shown in the table are meant to highlight your ongoing costs only and do not reflect any transactional costs, such as sales charges, redemption fees, or exchange fees. Therefore, the second line of the table is useful in comparing ongoing costs only, and will not help you determine the relative total costs of owning different funds. In addition, if these transactional costs were included, your costs would have been higher.
| | | | | | | | | | | | | | | | | | | | | | | | | | | | | | | | | | | | |
| | | Balanced Strategy Portfolio | | | Equity Growth Strategy Portfolio | | | Growth and Income Strategy Portfolio | |
| Share Class | | Beginning
Account Value
7/1/13 | | | Ending
Account Value
12/31/13 | | | Expenses
Paid for the
6 months ended
12/31/13* | | | Beginning
Account
Value
7/1/13 | | | Ending
Account
Value
12/31/13 | | | Expenses
Paid for the
6 months ended
12/31/13* | | | Beginning
Account
Value
7/1/13 | | | Ending
Account
Value
12/31/13 | | | Expenses
Paid for the
6 months ended
12/31/13* | |
| Class A | | | | | | | | | | | | | | | | | | | | | | | | | | | | | | | | | | | | |
Actual | | $ | 1,000.00 | | | $ | 1,073.30 | | | $ | 3.14 | | | $ | 1,000.00 | | | $ | 1,161.00 | | | $ | 3.27 | | | $ | 1,000.00 | | | $ | 1,103.50 | | | $ | 3.18 | |
Hypothetical 5% return | | | 1,000.00 | | | | 1,022.18 | + | | | 3.06 | | | | 1,000.00 | | | | 1,022.18 | + | | | 3.06 | | | | 1,000.00 | | | | 1,022.18 | + | | | 3.06 | |
| Class B | | | | | | | | | | | | | | | | | | | | | | | | | | | | | | | | | | | | |
Actual | | | 1,000.00 | | | | 1,068.90 | | | | 7.04 | | | | 1,000.00 | | | | 1,156.80 | | | | 7.34 | | | | 1,000.00 | | | | 1,099.30 | | | | 7.14 | |
Hypothetical 5% return | | | 1,000.00 | | | | 1,018.40 | + | | | 6.87 | | | | 1,000.00 | | | | 1,018.40 | + | | | 6.87 | | | | 1,000.00 | | | | 1,018.40 | + | | | 6.87 | |
| Class C | | | | | | | | | | | | | | | | | | | | | | | | | | | | | | | | | | | | |
Actual | | | 1,000.00 | | | | 1,069.20 | | | | 7.04 | | | | 1,000.00 | | | | 1,157.10 | | | | 7.34 | | | | 1,000.00 | | | | 1,099.80 | | | | 7.15 | |
Hypothetical 5% return | | | 1,000.00 | | | | 1,018.40 | + | | | 6.87 | | | | 1,000.00 | | | | 1,018.40 | + | | | 6.87 | | | | 1,000.00 | | | | 1,018.40 | + | | | 6.87 | |
| Institutional | | | | | | | | | | | | | | | | | | | | | | | | | | | | | | | | | | | | |
Actual | | | 1,000.00 | | | | 1,074.40 | | | | 1.05 | | | | 1,000.00 | | | | 1,164.00 | | | | 1.09 | | | | 1,000.00 | | | | 1,106.40 | | | | 1.06 | |
Hypothetical 5% return | | | 1,000.00 | | | | 1,024.20 | + | | | 1.02 | | | | 1,000.00 | | | | 1,024.20 | + | | | 1.02 | | | | 1,000.00 | | | | 1,024.20 | + | | | 1.02 | |
| Service | | | | | | | | | | | | | | | | | | | | | | | | | | | | | | | | | | | | |
Actual | | | 1,000.00 | | | | 1,072.40 | | | | 3.66 | | | | 1,000.00 | | | | 1,160.40 | | | | 3.81 | | | | 1,000.00 | | | | 1,102.70 | | | | 3.71 | |
Hypothetical 5% return | | | 1,000.00 | | | | 1,021.68 | + | | | 3.57 | | | | 1,000.00 | | | | 1,021.68 | + | | | 3.57 | | | | 1,000.00 | | | | 1,021.68 | + | | | 3.57 | |
| Class IR | | | | | | | | | | | | | | | | | | | | | | | | | | | | | | | | | | | | |
Actual | | | 1,000.00 | | | | 1,073.90 | | | | 1.83 | | | | 1,000.00 | | | | 1,162.60 | | | | 1.91 | | | | 1,000.00 | | | | 1,105.40 | | | | 1.86 | |
Hypothetical 5% return | | | 1,000.00 | | | | 1,023.44 | + | | | 1.79 | | | | 1,000.00 | | | | 1,023.44 | + | | | 1.79 | | | | 1,000.00 | | | | 1,023.44 | + | | | 1.79 | |
| Class R | | | | | | | | | | | | | | | | | | | | | | | | | | | | | | | | | | | | |
Actual | | | 1,000.00 | | | | 1,071.20 | | | | 4.44 | | | | 1,000.00 | | | | 1,159.00 | | | | 4.63 | | | | 1,000.00 | | | | 1,101.40 | | | | 4.50 | |
Hypothetical 5% return | | | 1,000.00 | | | | 1,020.92 | + | | | 4.33 | | | | 1,000.00 | | | | 1,020.92 | + | | | 4.33 | | | | 1,000.00 | | | | 1,020.92 | + | | | 4.33 | |
93
GOLDMAN SACHS FUND OF FUNDS PORTFOLIOS
Fund Expenses — Six Month Period Ended December 31, 2013 (Unaudited) (continued)
| | | | | | | | | | | | | | | | | | | | | | | | | | | | | | | | | | | | |
| | | Growth Strategy Portfolio | | | Income Strategies Portfolio | | | Satellite Strategies Portfolio | |
| Share Class | | Beginning
Account
Value
7/1/13 | | | Ending
Account
Value
12/31/13 | | | Expenses
Paid for the
6 months ended
12/31/13* | | | Beginning
Account
Value
7/1/13 | | | Ending
Account
Value
12/31/13 | | | Expenses
Paid for the
6 months ended
12/31/13* | | | Beginning
Account
Value
7/1/13 | | | Ending
Account
Value
12/31/13 | | | Expenses
Paid for the
6 months ended
12/31/13* | |
| Class A | | | | | | | | | | | | | | | | | | | | | | | | | | | | | | | | | | | | |
Actual | | $ | 1,000.00 | | | $ | 1,133.90 | | | $ | 3.23 | | | $ | 1,000.00 | | | $ | 1,020.60 | | | $ | 3.00 | | | $ | 1,000.00 | | | $ | 1,058.90 | | | $ | 3.01 | |
Hypothetical 5% return | | | 1,000.00 | | | | 1,022.18 | + | | | 3.06 | | | | 1,000.00 | | | | 1,022.23 | + | | | 3.01 | | | | 1,000.00 | | | | 1,022.28 | + | | | 2.96 | |
| Class B | | | | | | | | | | | | | | | | | | | | | | | | | | | | | | | | | | | | |
Actual | | | 1,000.00 | | | | 1,129.70 | | | | 7.25 | | | | N/A | | | | N/A | | | | N/A | | | | N/A | | | | N/A | | | | N/A | |
Hypothetical 5% return | | | 1,000.00 | | | | 1,018.40 | + | | | 6.87 | | | | N/A | | | | N/A | | | | N/A | | | | N/A | | | | N/A | | | | N/A | |
| Class C | | | | | | | | | | | | | | | | | | | | | | | | | | | | | | | | | | | | |
Actual | | | 1,000.00 | | | | 1,129.70 | | | | 7.25 | | | | 1,000.00 | | | | 1,016.60 | | | | 6.81 | | | | 1,000.00 | | | | 1,055.20 | | | | 6.89 | |
Hypothetical 5% return | | | 1,000.00 | | | | 1,018.40 | + | | | 6.87 | | | | 1,000.00 | | | | 1,018.45 | + | | | 6.82 | | | | 1,000.00 | | | | 1,018.50 | + | | | 6.77 | |
| Institutional | | | | | | | | | | | | | | | | | | | | | | | | | | | | | | | | | | | | |
Actual | | | 1,000.00 | | | | 1,135.60 | | | | 1.08 | | | | 1,000.00 | | | | 1,021.60 | | | | 0.97 | | | | 1,000.00 | | | | 1,061.10 | | | | 0.94 | |
Hypothetical 5% return | | | 1,000.00 | | | | 1,024.20 | + | | | 1.02 | | | | 1,000.00 | | | | 1,024.25 | + | | | 0.97 | | | | 1,000.00 | | | | 1,024.30 | + | | | 0.92 | |
| Service | | | | | | | | | | | | | | | | | | | | | | | | | | | | | | | | | | | | |
Actual | | | 1,000.00 | | | | 1,132.60 | | | | 3.76 | | | | N/A | | | | N/A | | | | N/A | | | | 1,000.00 | | | | 1,057.30 | | | | 3.53 | |
Hypothetical 5% return | | | 1,000.00 | | | | 1,021.68 | + | | | 3.57 | | | | N/A | | | | N/A | | | | N/A | | | | 1,000.00 | | | | 1,021.78 | + | | | 3.47 | |
| Class IR | | | | | | | | | | | | | | | | | | | | | | | | | | | | | | | | | | | | |
Actual | | | 1,000.00 | | | | 1,134.50 | | | | 1.88 | | | | 1,000.00 | | | | 1,020.70 | | | | 1.73 | | | | 1,000.00 | | | | 1,060.30 | | | | 1.71 | |
Hypothetical 5% return | | | 1,000.00 | | | | 1,023.44 | + | | | 1.79 | | | | 1,000.00 | | | | 1,023.49 | + | | | 1.73 | | | | 1,000.00 | | | | 1,023.54 | + | | | 1.68 | |
| Class R | | | | | | | | | | | | | | | | | | | | | | | | | | | | | | | | | | | | |
Actual | | | 1,000.00 | | | | 1,132.10 | | | | 4.57 | | | | 1,000.00 | | | | 1,019.20 | | | | 4.28 | | | | 1,000.00 | | | | 1,056.50 | | | | 4.30 | |
Hypothetical 5% return | | | 1,000.00 | | | | 1,020.92 | + | | | 4.33 | | | | 1,000.00 | | | | 1,020.97 | + | | | 4.28 | | | | 1,000.00 | | | | 1,021.02 | + | | | 4.23 | |
| * | | Expenses for each share class are calculated using each Portfolio’s annualized net expense ratio for each class, which represents the ongoing expenses as a percentage of net assets for the six months ended December 31, 2013. Expenses are calculated by multiplying the annualized net expense ratio by the average account value for the period; then multiplying the result by the number of days in the most recent fiscal half year; and then dividing that result by the number of days in the fiscal year. The annualized net expense ratios for the period were as follows: |
| | | | | | | | | | | | | | | | | | | | | | | | | | | | |
| Portfolio | | Class A | | | Class B | | | Class C | | | Institutional | | | Service | | | Class IR | | | Class R | |
Balanced Strategy | | | 0.60 | % | | | 1.35 | % | | | 1.35 | % | | | 0.20 | % | | | 0.70 | % | | | 0.35 | % | | | 0.85 | % |
Equity Growth Strategy | | | 0.60 | | | | 1.35 | | | | 1.35 | | | | 0.20 | | | | 0.70 | | | | 0.35 | | | | 0.85 | |
Growth and Income Strategy | | | 0.60 | | | | 1.35 | | | | 1.35 | | | | 0.20 | | | | 0.70 | | | | 0.35 | | | | 0.85 | |
Growth Strategy | | | 0.60 | | | | 1.35 | | | | 1.35 | | | | 0.20 | | | | 0.70 | | | | 0.35 | | | | 0.85 | |
Income Strategies | | | 0.59 | | | | N/A | | | | 1.34 | | | | 0.19 | | | | N/A | | | | 0.34 | | | | 0.84 | |
Satellite Strategies | | | 0.58 | | | | N/A | | | | 1.33 | | | | 0.18 | | | | 0.68 | | | | 0.33 | | | | 0.83 | |
| +Hypothetical | | expenses are based on each Portfolio’s actual annualized net expense ratios and an assumed rate of return of 5% per year before expenses. |
94
GOLDMAN SACHS FUND OF FUNDS PORTFOLIOS
Voting Results of Special Meeting of Shareholders (Unaudited)
A Special Meeting (the “Meeting”) of the Goldman Sachs Trust (“GST”) was held on October 15, 2013 to consider and act upon the proposal below:
At the Meeting, Donald C. Burke, Joseph P. LoRusso, Herbert J. Markley, James A. McNamara, and Roy W. Templin were elected to the Trust’s Board of Trustees. In electing trustees, the Trust’s shareholders voted as follows:
| | | | | | | | | | | | | | | | |
Election of Trustees | | For | | | Against | | | Withheld | | | Broker Non-Votes | |
Donald C. Burke | | | 53,388,642,395.715 | | | | 0 | | | | 1,150,861,851.704 | | | | 0 | |
Joseph P. LoRusso | | | 53,405,131,628.159 | | | | 0 | | | | 1,134,372,619.260 | | | | 0 | |
Herbert J. Markley | | | 53,435,916,168.391 | | | | 0 | | | | 1,103,588,079.028 | | | | 0 | |
James A. McNamara | | | 53,432,564,581.647 | | | | 0 | | | | 1,106,939,665.772 | | | | 0 | |
Roy W. Templin | | | 53,435,142,748.551 | | | | 0 | | | | 1,104,361,498.868 | | | | 0 | |
| | | | | | | | | | | | | | | | |
In addition to the individuals named above, Ashok N. Bakhru, John P. Coblentz, Jr., Diana M. Daniels, Jessica Palmer, Richard P. Strubel and Alan A. Shuch continue to serve on the Trust’s Board of Trustees.
95
GOLDMAN SACHS FUND OF FUNDS PORTFOLIOS
Trustees and Officers (Unaudited)
Independent Trustees
| | | | | | | | | | |
Name,
Address and Age1 | | Position(s) Held with the Trust | | Term of Office and
Length of
Time Served2 | | Principal Occupation(s)
During Past 5 Years | | Number of
Portfolios in
Fund Complex
Overseen by
Trustee3 | | Other
Directorships Held by Trustee4 |
Ashok N. Bakhru Age: 71 | | Chairman of the Board of Trustees | | Since 1996 (Trustee since 1991) | | Mr. Bakhru is retired. He was formerly Director, Apollo Investment Corporation (a business development company) (2008-2013); President, ABN Associates (a management and financial consulting firm) (1994-1996 and 1998-2012); Trustee, Scholarship America (1998-2005); Trustee, Institute for Higher Education Policy (2003-2008); Director, Private Equity Investors — III and IV (1998-2007), and Equity-Linked Investors II (April 2002-2007). Chairman of the Board of Trustees — Goldman Sachs Fund Complex. | | 111 | | None |
Donald C. Burke Age: 53 | | Trustee | | Since 2010 | | Mr. Burke is retired. He is Director, Avista Corp. (2011-Present); and was formerly a Director, BlackRock Luxembourg and Cayman Funds (2006-2010); President and Chief Executive Officer, BlackRock U.S. Funds (2007-2009); Managing Director, BlackRock, Inc. (2006-2009). Trustee — Goldman Sachs Fund Complex. | | 108 | | Avista Corp. (an energy company) |
John P. Coblentz, Jr. Age: 72 | | Trustee | | Since 2003 | | Mr. Coblentz is retired. Formerly, he was Partner, Deloitte & Touche LLP (1975-2003); Director, Emerging Markets Group, Ltd. (2004-2006); and Director, Elderhostel, Inc. (2006-2012). Trustee — Goldman Sachs Fund Complex. | | 111 | | None |
Diana M. Daniels Age: 64 | | Trustee | | Since 2007 | | Ms. Daniels is retired. Formerly, she was Vice President, General Counsel and Secretary, The Washington Post Company (1991-2006). Ms. Daniels serves as a Presidential Councillor of Cornell University (2013-Present); Member, Advisory Board, Psychology Without Borders (international humanitarian aid organization) (2007-Present), and former Member of the Legal Advisory Board, New York Stock Exchange (2003-2006) and of the Corporate Advisory Board, Standish Mellon Management Advisors (2006-2007). Trustee — Goldman Sachs Fund Complex. | | 108 | | None |
| | | | | | | | | | |
96
GOLDMAN SACHS FUND OF FUNDS PORTFOLIOS
Trustees and Officers (Unaudited) (continued)
Independent Trustees
| | | | | | | | | | |
Name,
Address and Age1 | | Position(s) Held with the Trust | | Term of Office and
Length of
Time Served2 | | Principal Occupation(s) During Past 5 Years | | Number of
Portfolios in
Fund Complex
Overseen by
Trustee3 | | Other
Directorships Held by Trustee4 |
Joseph P. LoRusso Age: 56 | | Trustee | | Since 2010 | | Mr. LoRusso is retired. Formerly, he was President, Fidelity Investments Institutional Services Co. (“FIIS”) (2002-2008); Director, FIIS (2002-2008); Director, Fidelity Investments Institutional Operations Company (2003-2007); Executive Officer, Fidelity Distributors Corporation (2007-2008). Trustee — Goldman Sachs Fund Complex. | | 108 | | None |
Herbert J. Markley Age: 63 | | Trustee | | Since 2013 | | Mr. Markley is retired. Formerly, he was Executive Vice President, Deere & Company (an agricultural and construction equipment manufacturer) (2007-2009), and President, Agricultural Division, Deere & Company (2001-2007). Trustee — Goldman Sachs Fund Complex. | | 108 | | None |
Jessica Palmer Age: 64 | | Trustee | | Since 2007 | | Ms. Palmer is retired. She is Director, Emerson Center for the Arts and Culture (2011-Present); and was formerly a Consultant, Citigroup Human Resources Department (2007-2008); Managing Director, Citigroup Corporate and Investment Banking (previously, Salomon Smith Barney/Salomon Brothers) (1984-2006). Ms. Palmer was a Member of the Board of Trustees of Indian Mountain School (private elementary and secondary school) (2004-2009). Trustee — Goldman Sachs Fund Complex. | | 108 | | None |
Richard P. Strubel Age: 74 | | Trustee | | Since 1987 | | Mr. Strubel is retired. Formerly, he was Director, Cardean Learning Group (provider of educational services via the internet) (2003-2008); Trustee, Emeritus, The University of Chicago (1987-Present). Trustee — Goldman Sachs Fund Complex. | | 111 | | The Northern Trust Mutual Fund Complex (64 Portfolios) (Chairman of the Board of Trustees); Gildan Activewear Inc. (a clothing marketing and manufacturing company). |
Roy W. Templin Age: 53 | | Trustee | | Since 2013 | | Mr. Templin is retired. He is Director, Con-Way Incorporated (2012-Present); and was formerly Executive Vice President and Chief Financial Officer, Whirlpool Corporation (an appliance manufacturer and marketer) (2004-2012). Trustee — Goldman Sachs Fund Complex. | | 108 | | Con-Way Incorporated (a transportation, supply-chain management and logistics services company) |
| | | | | | | | | | |
97
GOLDMAN SACHS FUND OF FUNDS PORTFOLIOS
Trustees and Officers (Unaudited) (continued)
Interested Trustees
| | | | | | | | | | |
Name,
Address and Age1 | | Position(s) Held with the Trust | | Term of Office and
Length of
Time Served2 | | Principal Occupation(s) During Past 5 Years | | Number of
Portfolios in
Fund Complex
Overseen by
Trustee3 | | Other Directorships Held by Trustee4 |
James A. McNamara* Age: 51 | | President and Trustee | | Since 2007 | | Managing Director, Goldman Sachs (December 1998-Present); Director of Institutional Fund Sales, GSAM (April 1998-December 2000); and Senior Vice President and Manager, Dreyfus Institutional Service Corporation (January 1993- April 1998). President — Goldman Sachs Fund Complex (November 2007-Present); Senior Vice President — Goldman Sachs Fund Complex (May 2007-November 2007); and Vice President — Goldman Sachs Fund Complex (2001-2007). Trustee — Goldman Sachs Fund Complex (since November 2007 and December 2002-May 2004). | | 111 | | None |
| | | | | | | | | | |
Alan A. Shuch* Age: 64 | | Trustee | | Since 1990 | | Advisory Director — GSAM (May 1999-Present); Consultant to GSAM (December 1994-May 1999); and Limited Partner, Goldman Sachs (December 1994-May 1999). Trustee — Goldman Sachs Fund Complex. | | 108 | | None |
| | | | | | | | | | |
| * | | These persons are considered to be “Interested Trustees” because they hold positions with Goldman Sachs and own securities issued by The Goldman Sachs Group, Inc. Each Interested Trustee holds comparable positions with certain other companies of which Goldman Sachs, GSAM or an affiliate thereof is the investment adviser, administrator and/or distributor. |
| 1 | | Each Trustee may be contacted by writing to the Trustee, c/o Goldman Sachs, 200 West Street, New York, New York, 10282, Attn: Caroline Kraus. |
| 2 | | Each Trustee holds office for an indefinite term until the earliest of: (a) the election of his or her successor; (b) the date the Trustee resigns or is removed by the Board of Trustees or shareholders, in accordance with the Trust’s Declaration of Trust; (c) the conclusion of the first Board meeting held subsequent to the day the Trustee attains the age of 74 years, subject to waiver by a majority of the Trustees (in accordance with the current resolutions of the Board of Trustees, which may be changed by the Trustees without shareholder vote); or (d) the termination of the Trust. By resolution of the Board of Trustees determining that an extension of service would be beneficial to the Trust, the retirement age has been extended for one year with respect to Richard P. Strubel. |
| 3 | | The Goldman Sachs Fund Complex consists of the Trust, Goldman Sachs Credit Strategies Fund (“GSCSF”) and Goldman Sachs Variable Insurance Trust (“GSVIT”). As of December 27, 2013, the Trust consisted of 93 portfolios (84 of which offered shares to the public), Goldman Sachs Variable Insurance Trust consisted of 14 portfolios (12 of which offered shares to the public) and GSCSF consisted of one portfolio. The Goldman Sachs Fund Complex also includes, with respect to Messrs. Bakhru, Coblentz, Strubel and McNamara, Goldman Sachs Trust II, Goldman Sachs BDC, Inc. and Goldman Sachs MLP Income Opportunities Fund. Each consisted of one portfolio. Goldman Sachs BDC, Inc. did not offer shares to the public. |
| 4 | | This column includes only directorships of companies required to report to the Securities and Exchange Commission under the Securities Exchange Act of 1934 (i.e., “public companies”) or other investment companies registered under the Act. |
Additional information about the Trustees is available in the Fund’s Statement of Additional Information, which can be obtained from Goldman Sachs free of charge by calling this toll-free number (in the United States of America): 1-800-292-4726.
98
GOLDMAN SACHS FUND OF FUNDS PORTFOLIOS
Trustees and Officers (Unaudited) (continued)
Officers of the Trust*
| | | | | | |
Name, Address and Age | | Position(s) Held With the Trust | | Term of Office and
Length of
Time Served1 | | Principal Occupation(s) During Past 5 Years |
James A. McNamara 200 West Street New York, NY 10282 Age: 51 | | President and Trustee | | Since 2007 | | Managing Director, Goldman Sachs (December 1998-Present); Director of Institutional Fund Sales, GSAM (April 1998-December 2000); and Senior Vice President and Manager, Dreyfus Institutional Service Corporation (January 1993-April 1998). President — Goldman Sachs Mutual Fund Complex (November 2007-Present); Senior Vice President — Goldman Sachs Mutual Fund Complex (May 2007-November 2007); and Vice President — Goldman Sachs Mutual Fund Complex (2001-2007). Trustee — Goldman Sachs Fund Complex (November 2007-Present and December 2002-May 2004). |
Caroline L. Kraus 200 West Street New York, NY 10282 Age: 36 | | Secretary | | Since 2012 | | Vice President, Goldman Sachs (August 2006-Present); Associate General Counsel, Goldman Sachs (2012-Present); Assistant General Counsel, Goldman Sachs (August 2006-December 2011) and Associate, Weil, Gotshal & Manges-LLP (2002-2006). Secretary — Goldman Sachs Fund Complex (August 2012-Present); and Assistant Secretary — Goldman Sachs Fund Complex (June 2012-August 2012). |
Scott M. McHugh 200 West Street New York, NY 10282 Age: 42 | | Principal Financial Officer and Treasurer | | Since 2009 (Principal Financial Officer since 2013) | | Vice President, Goldman Sachs (February 2007-Present); Assistant Treasurer of certain mutual funds administered by DWS Scudder (2005-2007); and Director (2005-2007), Vice President (2000-2005) and Assistant Vice President (1998-2000), Deutsche Asset Management or its predecessor (1998-2007). Principal Financial Officer — Goldman Sachs Fund Complex (November 2013-Present); Treasurer — Goldman Sachs Fund Complex (October 2009-Present); Senior Vice President — Goldman Sachs Fund Complex (November 2009-Present); and Assistant Treasurer — Goldman Sachs Fund Complex (May 2007-October 2009). |
| | | | | | |
| 1 | | Officers hold office at the pleasure of the Board of Trustees or until their successors are duly elected and qualified. Each officer holds comparable positions with certain other companies of which Goldman Sachs, GSAM or an affiliate thereof is the investment adviser, administrator and/or distributor. Information is provided as of December 31, 2013. |
| * | | Represents a partial list of officers of the Trust. Additional information about all the officers is available in the Fund’s Statement of Additional Information, which can be obtained from Goldman Sachs free of charge by calling this toll-free number (in the United States): 1-800-292-4726. |
99
GOLDMAN SACHS FUND OF FUNDS PORTFOLIOS
Goldman Sachs Fund of Funds Portfolios Tax Information (Unaudited)
For the fiscal year ended December 31, 2013, 8.12%, 38.62%, 16.63%, 32.57%, 0.32%, and 0.06% of the dividends paid from net investment company taxable income by the Balanced Strategy, Equity Growth Strategy, Growth and Income Strategy, Growth Strategy, Income Strategies, and Satellite Strategies Portfolios, respectively, qualify for the dividends received deduction available to corporations.
For the 2013 tax year, each Portfolio has elected to pass through a credit for taxes paid to foreign jurisdictions. The total amount of income received by the Balanced Strategy, Equity Growth Strategy, Growth and Income Strategy, Growth Strategy, Income Strategies, and Satellite Strategies Portfolios from sources within foreign countries and possessions of the United States was $0.0448, $0.1491, $0.0753, $0.1028, $0.0611 and $0.0622 per share, respectively, all of which is attributable to qualified passive income. The percentage of net investment income dividends paid by the Balanced Strategy, Equity Growth Strategy, Growth and Income Strategy, Growth Strategy, Income Strategies, and Satellite Strategies portfolios during the year from foreign sources was 12.29%, 47.52%, 22.51%, 37.88%, 12.60% and 18.13%, respectively. The total amount of taxes paid by the Balanced Strategy, Equity Growth Strategy, Growth and Income Strategy, Growth Strategy, Income Strategies, and Satellite Strategies Portfolios to such countries was $0.0030, $0.0119, $0.0057, $0.0083, $0.0048, and $0.0073 per share, respectively.
For the fiscal year ended December 31, 2013, 20.76%, 100%, 43.69%, 88.90%, 4.00% and 12.22% of the dividends paid from net investment company taxable income by the Balanced Strategy, Equity Growth Strategy, Growth and Income Strategy, Growth Strategy, Income Strategies, and Satellite Strategies Portfolios, respectively, qualify for the reduced tax rate under the Jobs and Growth Tax Relief and Reconciliation Act of 2003.
100
FUNDS PROFILE
Goldman Sachs Funds

Goldman Sachs is a premier financial services firm, known since 1869 for creating thoughtful and customized investment solutions in complex global markets.
Today, the Investment Management Division of Goldman Sachs serves a diverse set of clients worldwide, including private institutions, public entities and individuals. With approximately $807.6 billion in assets under management as of December 31, 2013, Goldman Sachs Asset Management (“GSAM”) has portfolio management teams located around the world and our investment professionals bring firsthand knowledge of local markets to every investment decision. GSAM’s assets under management includes assets managed by Goldman Sachs Asset Management, L.P. and its Investment Advisory Affiliates.
|
| OVERVIEW OF GOLDMAN SACHS FUNDS* |
Money Market1
Financial Square FundsSM
| n | | Financial Square Tax-Exempt Funds |
| n | | Financial Square Federal Fund |
| n | | Financial Square Government Fund |
| n | | Financial Square Money Market Fund |
| n | | Financial Square Prime Obligations Fund |
| n | | Financial Square Treasury Instruments Fund |
| n | | Financial Square Treasury Obligations Fund |
Fixed Income
Short Duration and Government
| n | | High Quality Floating Rate Fund |
| n | | Short Duration Government Fund |
| n | | Short Duration Income Fund |
| n | | Inflation Protected Securities Fund |
Multi-Sector
| n | | Core Plus Fixed Income Fund |
Municipal and Tax-Free
| n | | High Yield Municipal Fund |
| n | | Short Duration Tax-Free Fund |
Single Sector
| n | | Investment Grade Credit Fund |
| n | | High Yield Floating Rate Fund |
| n | | Emerging Markets Debt Fund |
| n | | Local Emerging Markets Debt Fund |
| n | | Dynamic Emerging Markets Debt Fund |
Corporate Credit
Fundamental Equity
| n | | Small/Mid Cap Growth Fund |
| n | | Flexible Cap Growth Fund |
| n | | Concentrated Growth Fund |
| n | | Technology Tollkeeper Fund |
| n | | Growth Opportunities Fund |
| n | | Rising Dividend Growth Fund |
Structured Equity
| n | | Structured Tax-Managed Equity Fund |
| n | | Structured International Tax-Managed Equity Fund |
| n | | U.S. Equity Dividend and Premium Fund |
| n | | International Equity Dividend and Premium Fund |
Equity Insights2
| n | | Small Cap Equity Insights Fund |
| n | | U.S. Equity Insights Fund |
| n | | Small Cap Growth Insights Fund |
| n | | Large Cap Growth Insights Fund |
| n | | Large Cap Value Insights Fund |
| n | | Small Cap Value Insights Fund |
| n | | International Small Cap Insights Fund |
| n | | International Equity Insights Fund |
| n | | Emerging Markets Equity Insights Fund |
Fundamental Equity International
| n | | Strategic International Equity Fund |
| n | | Concentrated International Equity Fund |
| n | | International Small Cap Fund |
| n | | Emerging Markets Equity Fund |
| n | | BRIC Fund (Brazil, Russia, India, China) |
Select Satellite3
| n | | Real Estate Securities Fund |
| n | | International Real Estate Securities Fund |
| n | | Commodity Strategy Fund |
| n | | Dynamic Allocation Fund |
| n | | Absolute Return Tracker Fund |
| n | | Managed Futures Strategy Fund |
| n | | MLP Energy Infrastructure Fund |
| n | | Multi-Manager Alternatives Fund |
| n | | Multi-Asset Real Return Fund |
| n | | Retirement Portfolio Completion Fund |
| n | | Income Strategies Portfolio |
| n | | Fixed Income Macro Strategies Fund |
Total Portfolio Solutions3
| n | | Balanced Strategy Portfolio |
| n | | Growth and Income Strategy Portfolio |
| n | | Growth Strategy Portfolio |
| n | | Equity Growth Strategy Portfolio |
| n | | Satellite Strategies Portfolio |
| n | | Enhanced Dividend Global Equity Portfolio |
| n | | Tax Advantaged Global Equity Portfolio |
| 1 | | An investment in a money market fund is neither insured nor guaranteed by the Federal Deposit Insurance Corporation (“FDIC”) or any other government agency. Although the Funds seek to preserve the value of your investment at $1.00 per share, it is possible to lose money by investing in the Funds. |
| 2 | | Effective at the close of business May 3, 2013, the Goldman Sachs Structured Large Cap Growth, Structured Large Cap Value, Structured Small Cap Equity, Structured Small Cap Growth, Structured Small Cap Value, Structured U.S. Equity, Structured Emerging Markets Equity, Structured International Equity and Structured International Small Cap Funds were renamed the Goldman Sachs Large Cap Growth Insights, Large Cap Value Insights, Small Cap Equity Insights, Small Cap Growth Insights, Small Cap Value Insights, U.S. Equity Insights, Emerging Markets Equity Insights, International Equity Insights and International Small Cap Insights Funds, respectively. |
| 3 | | Individual Funds within the Total Portfolio Solutions and Select Satellite categories will have various placement on the risk/return spectrum and may have greater or lesser risk than that indicated by the placement of the general Total Portfolio Solutions or Select Satellite category. |
Financial Square FundsSM is a registered service mark of Goldman, Sachs & Co.
*This list covers open-end funds only. Please visit our website at www.GSAMFUNDS.com to learn about our closed-end funds.
| | |
TRUSTEES
Ashok N. Bakhru, Chairman
Donald C. Burke
John P. Coblentz, Jr.
Diana M. Daniels
Joseph P. LoRusso
Herbert J. Markley
James A. McNamara
Jessica Palmer
Alan A. Shuch
Richard P. Strubel
Roy W. Templin | | OFFICERS
James A. McNamara, President
Scott M. McHugh, Principal Financial Officer and Treasurer
Caroline L. Kraus, Secretary |
| |
GOLDMAN, SACHS & CO.
Distributor and Transfer Agent | | GOLDMAN SACHS ASSET MANAGEMENT, L.P.
Investment Adviser |
Visit our Web site at www.GSAMFUNDS.com to obtain the most recent month-end returns.
Goldman Sachs Asset Management, L.P., 200 West Street, New York, New York 10282
The portfolio risk management process includes an effort to monitor and manage risk, but does not imply low risk.
The reports concerning the Portfolios included in this shareholder report may contain certain forward-looking statements about the factors that may affect the performance of the Portfolios in the future. These statements are based on Portfolio management’s predictions and expectations concerning certain future events and their expected impact on the Portfolios, such as performance of the economy as a whole and of specific industry sectors, changes in the levels of interest rates, the impact of developing world events, and other factors that may influence the future performance of the Portfolios. Management believes these forward-looking statements to be reasonable, although they are inherently uncertain and difficult to predict. Actual events may cause adjustments in portfolio management strategies from those currently expected to be employed.
A description of the policies and procedures that the Portfolios use to determine how to vote proxies relating to portfolio securities and information regarding how a Portfolio voted proxies relating to portfolio securities during the most recent 12-month period ended June 30 is available (i) without charge, upon request by calling 1-800-526-7384 (for Retail Shareholders) or 1-800-621-2550 (for Institutional Shareholders); and (ii) on the Securities and Exchange Commission Web site at http://www.sec.gov.
The Funds file their complete schedule of portfolio holdings with the Securities and Exchange Commission (“SEC”) for the first and third quarters of each fiscal year on Form N-Q. The Funds’ Form N-Q will become available on the SEC’s website at http://www.sec.gov within 60 days after the Funds’ first and third fiscal quarters. When available, the Funds’ Forms N-Q may be reviewed and copied at the SEC’s Public Reference Room in Washington, D.C. and information on the operation of the Public Reference Room may also be obtained by calling 1-800-SEC-0330. When available, Form N-Q may be obtained upon request and without charge by calling 1-800-526-7384 (for Retail Shareholders) or 1-800-621-2550 (for Institutional Shareholders).
The website links provided are for your convenience and are not an endorsement or recommendation by GSAM of any of these websites or the products or services offered. GSAM is not responsible for the accuracy and validity of the contents of these websites.
The Global Industry Classification Standard (GICS) was developed by and is the exclusive property and a service mark of Morgan Stanley Capital International Inc. (MSCI) and Standard & Poor’s, a division of The McGraw-Hill Companies, Inc. (S&P) and is licensed for use by Goldman Sachs. Neither MSCI, S&P nor any other party involved in making or compiling the GICS or any GICS classifications makes any express or implied warranties or representations with respect to such standard or classification (or the results to be obtained by the use thereof), and all such parties hereby expressly disclaim all warranties of originality, accuracy, completeness, merchantability or fitness for a particular purpose with respect to any of such standard or classification. Without limiting any of the foregoing, in no event shall MSCI, S&P, any of their affiliates or any third party involved in making or compiling the GICS or any GICS classifications have any liability for any direct, indirect, special, punitive, consequential or any other damages (including lost profits) even if notified of the possibility of such damages.
Holdings and allocations shown are as of December 31, 2013 and may not be representative of future investments. Fund holdings should not be relied on in making investment decisions and should not be construed as research or investment advice regarding particular securities. Current and future holdings are subject to risk.
This material is not authorized for distribution to prospective investors unless preceded or accompanied by a current Prospectus or summary prospectus, if applicable. Investors should consider a Fund’s objective, risks, and charges and expenses, and read the summary prospectus, if available, and/or the Prospectus carefully before investing or sending money. The summary prospectus, if available, and the Prospectus contain this and other information about a Fund and may be obtained from your Authorized Institution or from Goldman, Sachs & Co. by calling (retail – 1-800-526-7384) (institutional – 1-800-621-2550).
© 2014 Goldman Sachs. All rights reserved. 122373.MF.MED.TMPL/2/2014/FFAR14/97.6K