EX-99.(17)(b)
Goldman Sachs Funds

| | | | |
| | |
| Annual Report | | | | October 31, 2014 |
| | |
| | | | Fundamental Emerging Markets
Equity Funds |
| | | | Asia Equity |
| | | | BRIC |
| | | | Emerging Markets Equity |
| | | | N-11 Equity |

Goldman Sachs Fundamental Emerging Markets Equity Funds
| n | | EMERGING MARKETS EQUITY |
| | | | |
TABLE OF CONTENTS | | | | |
| |
Principal Investment Strategies and Risks | | | 3 | |
| |
Investment Process | | | 5 | |
| |
Market Review | | | 6 | |
| |
Portfolio Management Discussions and Performance Summaries | | | 8 | |
| |
Schedules of Investments | | | 35 | |
| |
Financial Statements | | | 46 | |
| |
Financial Highlights | | | 50 | |
| |
Notes to Financial Statements | | | 58 | |
| |
Report of Independent Registered Public Accounting Firm | | | 76 | |
| |
Other Information | | | 77 | |
| | | | |
| | | |
| NOT FDIC-INSURED | | May Lose Value | | No Bank Guarantee |
GOLDMAN SACHS FUNDAMENTAL EMERGING MARKETS EQUITY FUNDS
Principal Investment Strategies and Risks
This is not a complete list of risks that may affect the Funds. For additional information concerning the risks applicable to the Funds, please see the Funds’ Prospectuses.
The Goldman Sachs Asia Equity Fund invests primarily in a diversified portfolio of equity investments in Asian issuers (excluding Japanese issuers). The Fund is subject to market risk, which means that the value of the securities in which it invests may go up or down in response to the prospects of individual companies, particular sectors and/or general economic conditions. Foreign and emerging markets investments may be more volatile than investments in U.S. securities and are subject to the risks of currency fluctuations and adverse economic or political developments. Because of its exposure to Asian issuers, the Fund is subject to greater risk of loss as a result of adverse securities markets, exchange rates and social, political, regulatory or economic events that may occur in Asian countries. The securities of mid- and small-capitalization companies involve greater risks than those associated with larger, more established companies and may be subject to more abrupt or erratic price movements. At times, the Fund may be unable to sell certain of its illiquid investments without a substantial drop in price, if at all.
The Goldman Sachs BRIC Fund invests primarily in a portfolio of equity investments in Brazil, Russia, India and China (“BRIC countries”) or in issuers that participate in the markets of the BRIC countries. The Fund is subject to market risk, which means that the value of the securities in which it invests may go up or down in response to the prospects of individual companies, particular sectors and/ or general economic conditions. Foreign and emerging markets investments may be more volatile than investments in U.S. securities and are subject to the risks of currency fluctuations and adverse economic or political developments. Because of its exposure to the BRIC countries, the Fund is subject to greater risk of loss as a result of adverse securities markets, exchange rates and social, political, regulatory or economic events that may occur in those countries. Because the Fund may invest heavily in specific sectors, the Fund is subject to greater risk of loss as a result of adverse economic, business or other developments affecting such sectors. At times, the Fund may be unable to sell certain of its illiquid investments without a substantial drop in price, if at all. The Fund is “non-diversified” and may invest a larger percentage of its assets in fewer issuers than “diversified” mutual funds. Accordingly, the Fund may be more susceptible to adverse developments affecting any single issuer held in its portfolio and to greater losses resulting from these developments.
The Goldman Sachs Emerging Markets Equity Fund invests primarily in a diversified portfolio of equity investments in emerging country issuers. The Fund is subject to market risk, which means that the value of the securities in which it invests may go up or down in response to the prospects of individual companies, particular sectors and/or general economic conditions. Foreign and emerging markets investments may be more volatile than investments in U.S. securities and are subject to the risks of currency fluctuations and adverse economic or political developments. The securities markets of emerging countries have less government regulation and are subject to less extensive accounting and financial reporting requirements than the markets of more developed countries. Because the Fund may invest heavily in specific sectors, the Fund is subject to greater risk of loss as a result of adverse economic, business or other developments affecting such sectors. At times, the Fund may be unable to sell certain of its illiquid investments without a substantial drop in price, if at all.
The Goldman Sachs N-11 Equity Fund invests primarily in a portfolio of equity investments that are tied economically to the “N-11 countries” or in issuers that participate in the markets of the following N-11 countries: Bangladesh, Egypt, Indonesia, Mexico, Nigeria, Pakistan, Philippines, South Korea, Turkey and Vietnam. While Iran is among the N-11 countries, the Fund will not invest in issuers
3
GOLDMAN SACHS FUNDAMENTAL EMERGING MARKETS EQUITY FUNDS
organized under the laws of Iran, or domiciled in Iran, or in certain other issuers as necessary to comply with U.S. economic sanctions against Iran. The Fund is subject to market risk, which means that the value of the securities in which it invests may go up or down in response to the prospects of individual companies, particular sectors and/or general economic conditions. Foreign and emerging markets investments may be more volatile than investments in U.S. securities and are subject to the risks of currency fluctuations and adverse economic or political developments. Such securities are also subject to foreign custody risk. Because of its exposure to the N-11 countries, the Fund is subject to greater risk of loss as a result of adverse securities markets, exchange rates and social, political, regulatory or economic events that may occur in those countries. The N-11 countries generally have smaller economies or less developed capital markets than traditional emerging markets countries, and, as a result, the risks of investing in these countries are magnified. Because the Fund may invest heavily in specific sectors, the Fund is subject to greater risk of loss as a result of adverse economic, business or other developments affecting such sectors. The Fund may concentrate its investments in a specific industry (only in the event that that industry represents 20% or more of the Fund’s benchmark index at the time of investment), subjecting it to greater risk of loss as a result of adverse economic, business or other developments affecting that industry. At times, the Fund may be unable to sell certain of its illiquid investments without a substantial drop in price, if at all. The Fund is “non-diversified” and may invest a larger percentage of its assets in fewer issuers than “diversified” mutual funds. Accordingly, the Fund may be more susceptible to adverse developments affecting any single issuer held in its portfolio and to greater losses resulting from these developments.
4
GOLDMAN SACHS FUNDAMENTAL EMERGING MARKETS EQUITY FUNDS
What Differentiates Goldman Sachs’ Fundamental Emerging Markets Equity Investment Process?
Goldman Sachs’ Fundamental Emerging Markets Equity investment process is based on the belief that strong, consistent results are best achieved through expert stock selection, performed by our dedicated Emerging Markets Team that works together on a global scale. Our deep, diverse and experienced team of research analysts and portfolio managers combines local insights with global, industry-specific expertise to identify its best investment ideas.


| n | | The Emerging Markets Equity research team, based in the United States, United Kingdom, Japan, China, Korea, Singapore, Brazil, India and Australia, focuses on long-term business and management quality |
| n | | Proprietary, bottom-up research is the key driver of our investment process |
| n | | Analysts collaborate regularly to leverage regional and industry-specific research and insights |

| n | | Members of each local investment team are aligned by sector and are responsible for finding ideas with the best risk-adjusted upside in their respective areas of coverage |
| n | | The decision-making process includes active participation in frequent and regular research meetings |
| n | | The Emerging Markets Equity team benefits from the country and currency expertise of our Global Emerging Markets Debt and Currency teams |

| n | | Security selections are aligned with levels of investment conviction and risk-adjusted upside |
| n | | Continual risk monitoring identifies various risks at the stock and portfolio level and assesses whether they are intended and justified |
| n | | Dedicated portfolio construction team assists in ongoing monitoring and adjustment of the Funds |

Emerging markets equity portfolios that strive to offer:
| | n | | Access to markets across emerging markets | |
| | n | | Disciplined approach to stock selection | |
| | n | | Optimal risk/return profiles | |
5
MARKET REVIEW
Goldman Sachs Fundamental Emerging Markets Equity Funds
Market Review
Emerging markets equities advanced, albeit only modestly, during the 12-month period ended October 31, 2014 (the “Reporting Period”). The Morgan Stanley Capital International (MSCI) Emerging Markets Index (Gross, USD, Unhedged) (the “MSCI® EM Index”) posted a return of 0.64%.* Emerging markets equities edged out developed markets equities, as measured by the MSCI® Europe Australasia and Far East (EAFE) Index, but concerns about slowing economic growth, high inflation and election uncertainty, among others, subdued the overall performance of many of the growth and emerging markets during the Reporting Period. Notably, however, equity market returns varied dramatically by region and by country.
Early in the Reporting Period, the U.S. Federal Reserve (the “Fed”) announced it would begin tapering its asset purchases in January 2014. The announcement ended seven months of speculation about the beginning of the end of the easy monetary policy that had fueled many emerging market economies in recent years. News of Argentina’s currency devaluation in January 2014 also rippled through emerging market currency and equity markets, forcing many central banks to hike interest rates, which further pressured equity markets.
From a regional perspective, Asia was the best performing region during the Reporting Period as a whole, as India’s equity market soared. India elected a new government by a large majority, raising hopes for bold reforms. Chinese equities struggled early in the Reporting Period amidst renewed concerns about China’s shadow banking system, credit quality and decelerating growth. However, Chinese equities rebounded during the second half of the Reporting Period to outperform the MSCI® EM Index. Central and Eastern Europe was the worst performing region, as the Russian equity market plunged during the Reporting Period due to the rapidly escalating geopolitical situation in Ukraine, economic sanctions from western countries and a sharp decline in the price of oil. Weakness in Latin American equity markets persisted into early 2014, though the region began to rebound toward the middle of the Reporting Period, only to experience weakness again during the second half of the Reporting Period due in part to declines in the energy and materials sectors. Brazilian equities also reflected the effects of slowing economic growth and a heated presidential election in Brazil.
For the Reporting Period overall, the energy sector declined most sharply, as the Brent Crude benchmark oil price sank throughout the second half of the Reporting Period to less than $85 per barrel, the lowest level since 2010. The materials sector also declined significantly due to weak commodity prices. Conversely, the health care and information technology sectors significantly outperformed the MSCI® EM Index during the Reporting Period amidst strong global merger and acquisition activity.
| * | | All index returns are expressed in U.S. dollar terms. |
6
MARKET REVIEW
Looking Ahead
While emerging markets equities edged out the returns of developed markets equities during the Reporting Period, many developing markets continued to face macroeconomic headwinds, negative headlines and country-specific challenges. We fully acknowledge these medium-term factors — including the end of Chinese double-digit economic growth, the impact of the end of quantitative easing on broader equity markets, currency volatility and persistent geopolitical unrest — and incorporate them in our bottom-up fundamental analysis.
The macro concerns that pressured emerging markets equities during the Reporting Period have not changed our longer-term positive view of emerging markets equity fundamentals. We believe the structural story is still intact and the domestically-focused growth of the emerging markets should continue to drive strong returns in their equity markets over the long term. Finally, we believe the recent weakness in emerging markets equities, which, at the end of the Reporting Period, were trading at a significant discount to developed markets on a forward-looking price/earnings ratio basis, may form an attractive entry point for long-term investors.
As bottom-up fundamental investors, we constantly look across a broad range of sectors, countries and market capitalizations to identify what we believe are the most compelling investment opportunities trading at attractive valuations and that may outperform over the market cycle. In particular, we look for companies with strong or improving cash flows and sustainable competitive advantages that should be able to withstand inflationary pressures on their margins while seeking to take advantage of secular growth themes in the growth and emerging markets. Finally, we seek to invest in companies with strong corporate governance track records, especially with respect to their treatment of minority shareholders. While we anticipate the uncertainty of the markets to continue, we believe our focus on companies with strong or improving fundamentals and secular growth opportunities should serve our shareholders well.
As always, we maintain our focus on seeking high-quality equity investments trading at what we believe to be compelling valuations and intend to stay true to our long-term discipline as we seek to navigate potentially volatile markets ahead.
7
PORTFOLIO RESULTS
Goldman Sachs Asia Equity Fund
Investment Objective
The Fund seeks long-term capital appreciation.
Portfolio Management Discussion and Analysis
Effective as of the close of business on April 25, 2014, the Goldman Sachs China Equity Fund was merged into the Goldman Sachs Asia Equity Fund. The reorganization was recommended by Goldman Sachs Asset Management International in connection with an effort to optimize the Goldman Sachs Funds and eliminate overlapping products. The Goldman Sachs Asia Equity Fund (the “Fund”) acquired all of the assets of the Goldman Sachs China Equity Fund — which totaled approximately $25.1 million as of April 25, 2014 — and the Goldman Sachs China Equity Fund was subsequently liquidated and shareholders of the Goldman Sachs China Equity Fund became shareholders of the Fund. Below, the Goldman Sachs Fundamental Asia ex-Japan Equity Portfolio Management Team discusses the Fund’s performance and positioning for the 12-month period ended October 31, 2014 (the “Reporting Period”).
| Q | | How did the Fund perform during the Reporting Period? |
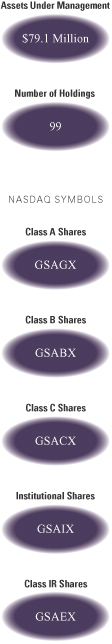
| A | | During the Reporting Period, the Fund’s Class A, B, C, and Institutional Shares generated average annual total returns, without sales charges, of 4.75%, 3.95%, 4.00% and 5.15%, respectively. These returns compare to the 5.73% average annual total return of the Fund’s benchmark, the MSCI® All Country Asia ex-Japan Index (Net, USD, Unhedged) (the “Index”), during the same time period. During the period since their inception on February 28, 2014 through October 31, 2014, the Fund’s Class IR Shares generated a cumulative total return, without sales charges, of 1.30% compared to the 8.59% cumulative total return of the Index. |
| Q | | What key factors were responsible for the Fund’s performance during the Reporting Period? |
| A | | The Fund produced solid absolute returns but its underperformance relative to the Index during the Reporting Period can be primarily attributed to individual stock selection. From a country perspective, stock selection in Indonesia, Hong Kong and Thailand detracted. Having an underweighted allocation to the strongly performing Hong Kong equity market also hurt. Effective stock selection in India, South Korea and Taiwan contributed most positively. |
| Q | | Which stocks detracted significantly from the Fund’s performance during the Reporting Period? |
| A | | Detracting most from the Fund’s results relative to the Index were positions in distressed asset management company China Cinda Asset Management (“Cinda”), South Korean electric home appliance manufacturer LiHom Cuchen and Chinese wastewater and water supply business operator SIIC Environment. |
| | A position in Cinda detracted most from the Fund’s results. The stock’s pullback during the Reporting Period was due primarily to concerns about property price weakness impacting the value of its assets. We believe the negative sentiment may have been overdone given that Cinda’s acquisition costs of these assets were attractive, in our view, leaving substantial room for profit realization. Indeed, we maintained the Fund’s position in Cinda because we believe the company has a strong growth opportunity in the coming years, as banks and non-financial companies in China are expected to increase the securitization and sales of their non-performing loans and receivables in order to strengthen their balance sheets. We believe this provides a robust business opportunity for distressed asset managers such as Cinda. |
| | LiHom Cuchen’s stock, a new purchase for the Fund during the Reporting Period, detracted from the Fund’s results on the back of concerns about potentially weaker than expected third quarter 2014 earnings and risk-averse market sentiment toward small cap names amidst volatility. At the end of the |
8
PORTFOLIO RESULTS
| | Reporting Period, we had put this holding under review pending its earnings announcement. |
| | SIIC Environment, a company operating a wastewater and water supply business in China through its “Build-Operate-Transfer” and “Transfer-Operate-Transfer” business models and another new purchase for the Fund during the Reporting Period, underperformed the Index. We believe the underperformance primarily stemmed from market concerns about the company’s ability to execute its plan to add one million tons of new water projects per day. |
| Q | | What were some of the Fund’s best-performing individual stocks? |
| A | | The Fund benefited most relative to the Index from holdings in Canadian Solar, Hanssem and Bajaj Finance. |
| | The top individual stock contributor to the Fund’s results during the Reporting Period was Canadian Solar, which designs, manufactures and sells solar module products that convert sunlight into electricity for a variety of uses. Canadian Solar outperformed the Index, as the company reported better than expected second quarter 2014 results and delivered an upbeat guidance for the third quarter of 2014. At the end of the Reporting Period, we remained positive on the stock and continued to hold this out-of-Index position, as the company’s strong results and management guidance appear to have dissipated much of the consensus concerns about softer than expected demand from China and a weakening average selling price. |
| | Another significant contributor was Hanssem, which manufactures kitchen and interior furniture and is the industry share leader in a fragmented South Korean furniture market. Its shares rose, as the company reported better than expected top-line growth on an increase in remodeling demand from an improved housing transaction volume. At the end of the Reporting Period, Hanssem led its industry in terms of earnings growth, return on equity and valuation. |
| | Bajaj Finance, an Indian non-banking finance company engaged in consumer finance, small and medium enterprise finance and commercial lending, was a strong contributor to the Fund’s relative results. The company performed well as measured by loan growth, margins and asset quality relative to its peers. Improving consumer sentiment and a strong outlook on consumer durable sales provided a positive backdrop to Bajaj Finance’s consumer lending business. At the end of the Reporting Period, we maintained the position in the Fund based on what we considered to be its healthy return ratios and attractive valuations. |
| Q | | Which equity market sectors most significantly affected Fund performance during the Reporting Period? |
| A | | The biggest detractors from the Fund’s relative results during the Reporting Period were the utilities, energy and telecommunication services sectors. Weak stock selection drove lagging performance in the utilities and energy sectors. Having an underweighted allocation to telecommunication services, which outpaced the Index during the Reporting Period, also hurt. In utilities, a position in SIIC Environment, already mentioned, detracted most. In energy, the Fund’s position in PACC Offshore Services, Singapore’s largest owner and operator of offshore support vessels, was the largest detractor from relative returns. In telecommunication services, a position in KT Corporation, a South Korean-based mobile, broadband and Internet Protocol (“IP”) television provider, disappointed most. |
| | The sectors that contributed most positively to the Fund’s performance relative to the Index were information technology, industrials and materials, where stock selection in each boosted relative results. In information technology, the Fund’s holding in Canadian Solar, mentioned earlier, was the strongest positive contributor. In industrials, a holding in Siemens India, which provides engineering solutions in automation and control, power, transportation and medical, boosted results most. In materials, a position in Monsanto India, the listed subsidiary of the global agricultural company Monsanto, was an outstanding performer. |
| Q | | How did the Fund use derivatives and similar instruments during the Reporting Period? |
| A | | During the Reporting Period, we did not use derivatives to hedge positions or as part of an active management strategy, but we used index futures on an opportunistic basis to ensure the Fund remained almost fully exposed to equities following cash inflows or stock sales. |
| Q | | Did the Fund make any significant purchases or sales during the Reporting Period? |
| A | | In addition to those new purchases already mentioned, within the consumer staples sector in South Korea, we initiated a Fund position in CJ Cheihjedang (“CJCJ”), a company that primarily engages in the production and marketing of processed foods. In our view, the company’s earnings should increase substantially by 2015, as we expect all of its three major businesses — namely, biotechnology, processed foods and raw materials — to enter into a full-fledged turnaround |
9
PORTFOLIO RESULTS
| | mode. CJCJ’s biotechnology business has suffered from competition with Chinese companies. However, we have recently seen some structural change. In its processed food segment, given CJCJ’s dominant market position and research and development capability, we believe it is able to cater to changing consumer needs, thereby improving the segment’s overall growth, margin and stability. Finally, we believe a strong Korean won, weak soft commodity prices and better control of its selling price could lead to a prolonged turnaround in CJCJ’s raw materials business. |
| | We established a Fund position in China Mobile during the Reporting Period in an effort to increase the Fund’s exposure to China’s telecommunication services sector overall. We expect the cost savings from reduced marketing expenses and handset subsidy cuts to improve the company’s profitability in the foreseeable future. |
| | We exited the Fund’s position in Hyundai Mipo Dockyard, one of the world’s top five shipbuilders specializing in mid-sized product carriers and chemical tankers. Consensus expectations on the ship building industry had long been quite low, but a rise in orders drove an increase in Hyundai Mipo Dockyard’s share price during the Reporting Period. As we believe our investment thesis had played out, we opted to eliminate the position and take profits. |
| | We sold the Fund’s position in OCI, a leading producer of poly-silicon, which is the basic material for photovoltaic cells, and a manufacturer of carbon chemicals and fine chemicals. We decided to exit the position because we expected the pace of its earnings growth to be slower than consensus expectations due to weaker than expected poly-silicon price movement and muted demand for its carbon chemicals business. |
| Q | | Were there any notable changes in the Fund’s weightings during the Reporting Period? |
| A | | Most sector weights are usually established within a relatively narrow range from the Index, as our team prefers to make decisions at the individual stock level, where we believe we can generate more added value. That said, during the Reporting Period, the Fund’s exposure to consumer discretionary, health care and materials increased, and its allocations to information technology, industrials and utilities decreased. |
| | Similarly, allocations to countries are directly the result of various stock selection decisions. During the Reporting Period, the Fund’s allocations to China, India and Taiwan increased, and its exposure to South Korea, Singapore and Indonesia decreased. |
| Q | | How was the Fund positioned relative to the Index at the end of the Reporting Period? |
| A | | At the end of the Reporting Period, the Fund had overweighted exposure to China, India, the Philippines, South Korea and Thailand compared to the Index. On the same date, the Fund had underweighted exposure relative to the Index to Hong Kong, Singapore, Taiwan and Malaysia and had rather neutral exposure relative to the Index in Indonesia. |
| | From a sector allocation perspective, the Fund had overweighted positions relative to the Index in the consumer discretionary, information technology, health care and materials sectors at the end of the Reporting Period. On the same date, the Fund had underweighted positions compared to the Index in the financials, energy, telecommunication services and utilities sectors and was relatively neutrally weighted compared to the Index in consumer staples and industrials. |
| | As always, we remained focused on individual stock selection, with sector and country positioning being a secondary, closely-monitored effect. |
10
FUND BASICS
Asia Equity Fund
as of October 31, 2014
| | | | | | | | | | |
| | PERFORMANCE REVIEW | |
| | | November 1, 2013–October 31, 2014 | | Fund Total Return
(based on NAV)1 | | | MSCI® All Country Asia ex-Japan Index
(Net, USD, Unhedged)2 | |
| | Class A | | | 4.75 | % | | | 5.73 | % |
| | Class B | | | 3.95 | | | | 5.73 | |
| | Class C | | | 4.00 | | | | 5.73 | |
| | Institutional | | | 5.15 | | | | 5.73 | |
| | | |
| | | February 28, 2014–October 31, 2014 | | | | | | |
| | | Class IR | | | 1.30 | % | | | 8.59 | % |
| | 1 | | The net asset value (“NAV”) represents the net assets of the class of the Fund (ex-dividend) divided by the total number of shares of the class outstanding. The Fund’s performance assumes the reinvestment of dividends and other distributions. The Fund’s performance does not reflect the deduction of any applicable sales charges. |
| | 2 | | The MSCI® All Country Asia ex-Japan Index (Net, USD, Unhedged) is a free float-adjusted market capitalization weighted index that is designed to measure the equity market performance of Asia, excluding Japan. The MSCI AC Asia ex-Japan Index consists of the following 10 developed and emerging market country indices: China, Hong Kong, India, Indonesia, Korea, Malaysia, Philippines, Singapore, Taiwan, and Thailand. This index is net of dividends re-invested after deduction of withholding taxes, using a tax rate applicable to non-resident institutional investors who do not benefit from double taxation treaties. This series approximates the minimum possible dividend reinvestment. The dividend is reinvested after deduction of withholding tax, applying the rate to nonresident individuals who do not benefit from double taxation treaties. MSCI Barra uses withholding tax rates applicable to Luxembourg holding companies, as Luxembourg applies the highest rates. It is not possible to invest directly in an index. |
| | | | | | | | | | | | | | | | | | | | | | |
| | STANDARDIZED TOTAL RETURNS3 | |
| | | For the period ended 9/30/14 | | One Year | | | Five Years | | | Ten Years | | | Since Inception | | | Inception Date | |
| | Class A | | | 2.84 | % | | | 4.40 | % | | | 7.00 | % | | | 2.23 | % | | | 7/08/94 | |
| | Class B | | | 3.03 | | | | 4.47 | | | | 6.94 | | | | 1.29 | | | | 5/01/96 | |
| | Class C | | | 7.01 | | | | 4.78 | | | | 6.78 | | | | 1.45 | | | | 8/15/97 | |
| | Institutional | | | 9.23 | | | | 6.01 | | | | 8.03 | | | | 2.26 | | | | 2/02/96 | |
| | | Class IR | | | N/A | | | | N/A | | | | N/A | | | | 0.58 | | | | 2/28/14 | |
| | 3 | | The Standardized Total Returns are average annual total returns as of the most recent calendar quarter-end. They assume reinvestment of all distributions at NAV. These returns reflect a maximum initial sales charge of 5.5% for Class A Shares, the assumed contingent deferred sales charge for Class B Shares (5% maximum declining to 0% after six years) and the assumed contingent deferred sales charge for Class C Shares (1% if redeemed within 12 months of purchase). Class B Shares convert automatically to Class A Shares on or about the fifteenth day of the last month of the calendar quarter that is eight years after purchase. Returns for Class B Shares for the period after conversion reflect the performance of Class A Shares. Because Institutional and Class IR Shares do not involve a sales charge, such a charge is not applied to their Standardized Total Returns. The Fund’s Class B Shares are no longer available for purchase by new or existing shareholders. |
The returns set forth in the tables above represent past performance. Past performance does not guarantee future results. The Fund’s investment return and principal value will fluctuate so that an investor’s shares, when redeemed, may be worth more or less than their original cost. Current performance may be lower or higher than the performance quoted above. Please visit our web site at www.GSAMFUNDS.com to obtain the most recent month-end returns. Performance reflects applicable fee waivers and/or expense limitations in effect during the periods shown. In their absence, performance would be reduced. Returns do not reflect the deduction of taxes that a shareholder would pay on Fund distributions or the redemption of Fund shares.
11
FUND BASICS
| | | | | | | | | | |
| | EXPENSE RATIOS4 | |
| | | | | Net Expense Ratio (Current) | | | Gross Expense Ratio (Before Waivers) | |
| | Class A | | | 1.69 | % | | | 2.19 | % |
| | Class B | | | 2.45 | | | | 2.95 | |
| | Class C | | | 2.45 | | | | 2.95 | |
| | Institutional | | | 1.29 | | | | 1.79 | |
| | | Class IR | | | 1.44 | | | | 1.94 | |
| | 4 | | The expense ratios of the Fund, both current (net of applicable fee waivers and/or expense limitations) and before waivers (gross of applicable fee waivers and/or expense limitations) are as set forth above according to the most recent publicly available Prospectus for the Fund and may differ from the expense ratios disclosed in the Financial Highlights in this report. Pursuant to a contractual arrangement, the Fund’s waivers and/or expense limitations will remain in place through at least February 28, 2015, and prior to such date the Investment Adviser may not terminate the arrangements without the approval of the Fund’s Board of Trustees. If these arrangements are discontinued in the future, the expense ratios may change without shareholder approval. |
| | | | | | | | | | |
| | TOP TEN HOLDINGS AS OF 10/31/145 |
| | | Holding | | % of
Net Assets | | | Line of Business | | Country |
| | Taiwan Semiconductor | | | 3.6 | % | | Semiconductors & | | Taiwan |
| | Manufacturing Co. Ltd. | | | | | | Semiconductor Equipment | | |
| | China Mobile Ltd. | | | 3.1 | | | Telecommunication Services | | Hong Kong |
| | Tencent Holdings Ltd. | | | 3.1 | | | Software & Services | | China |
| | CJ CheilJedang Corp. | | | 2.9 | | | Food, Beverage & Tobacco | | South Korea |
| | Sino Biopharmaceutical Ltd. | | | 2.7 | | | Pharmaceuticals,
Biotechnology & Life
Sciences | | Hong Kong |
| | Industrial & Commercial Bank of China Ltd. Class H | | | 2.7 | | | Banks | | China |
| | SK Hynix, Inc. | | | 2.3 | | | Semiconductors &
Semiconductor Equipment | | South Korea |
| | China Cinda Asset Management Co. Ltd. Class H | | | 2.2 | | | Diversified Financials | | China |
| | PICC Property & Casualty Co. Ltd. Class H | | | 2.2 | | | Insurance | | China |
| | | Galaxy Entertainment Group Ltd. | | | 2.2 | | | Consumer Services | | Hong Kong |
| | 5 | | The top 10 holdings may not be representative of the Fund’s future investments. |
12
FUND BASICS
| | |
| FUND VS. BENCHMARK SECTOR ALLOCATIONS6 |
| As of October 31, 2014 |
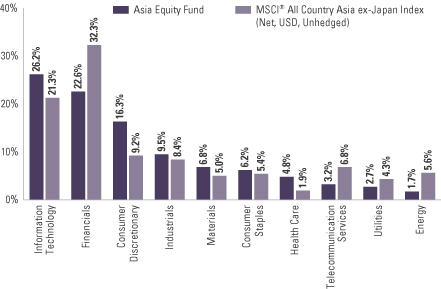
| | 6 | | The Fund is actively managed and, as such, its composition may differ over time. Consequently, the Fund’s overall sector allocations may differ from percentages contained in the graph above. The graph categorizes investments using Global Industry Classification Standard (“GICS”), however, the sector classifications used by the portfolio management team may differ from GICS. Underlying sector allocations of exchange traded funds or investment companies held by the Fund are not reflected in the graph above. The percentage shown for each investment category reflects the value of investments in that category as a percentage of market value. The graph depicts the Fund’s investments but may not represent the Fund’s market exposure due to the exclusion of certain derivatives, if any, as listed in the Additional Investment Information section of the Schedule of Investments. |
13
GOLDMAN SACHS ASIA EQUITY FUND
Performance Summary
October 31, 2014
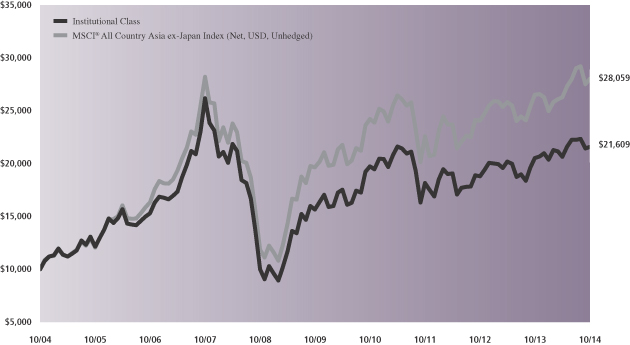
The following graph shows the value, as of October 31, 2014, of a $10,000 investment made on November 1, 2004 in Institutional Shares (at NAV). For comparative purposes, the performance of the Fund’s benchmark, the MSCI® All Country Asia ex-Japan Index (Net, USD, Unhedged) is shown. This performance data represents past performance and should not be considered indicative of future performance, which will fluctuate with changes in market conditions. These performance fluctuations will cause an investor’s shares, when redeemed, to be worth more or less than their original cost. Performance reflects applicable fee waivers and/or expense limitations in effect during the periods shown and in their absence, performance would be reduced. Returns do not reflect the deduction of taxes that a shareholder would pay on Fund distributions or the redemption of Fund shares. Performance of Class A, Class B, Class C and Class IR Shares will vary from that of Institutional Shares due to differences in class specific fees and any applicable sales charges. In addition to the Investment Adviser’s decisions regarding issuer/industry/country investment selection and allocation, other factors may affect Fund performance. These factors include, but are not limited to, Fund operating fees and expenses, portfolio turnover and subscription and redemption cash flows affecting the Fund.
|
| Asia Equity Fund’s 10 Year Performance |
Performance of a $10,000 Investment, with distributions reinvested, from November 1, 2004 through October 31, 2014.
| | | | | | | | | | | | | | |
| Average Annual Total Return through October 31, 2014 | | | One Year | | | | Five Years | | | | Ten Years | | | Since Inception |
Class A (Commenced July 8, 1994) | | | | | | | | | | | | | | |
Excluding sales charges | | | 4.75% | | | | 6.20% | | | | 7.58% | | | 2.54% |
Including sales charges | | | -1.02% | | | | 5.00% | | | | 6.97% | | | 2.25% |
|
Class B (Commenced May 1, 1996)* | | | | | | | | | | | | | | |
Excluding contingent deferred sales charges | | | 3.95% | | | | 5.42% | | | | 6.91% | | | 1.32% |
Including contingent deferred sales charges | | | -1.05% | | | | 5.09% | | | | 6.91% | | | 1.32% |
|
Class C (Commenced August 15, 1997) | | | | | | | | | | | | | | |
Excluding contingent deferred sales charges | | | 4.00% | | | | 5.40% | | | | 6.76% | | | 1.48% |
Including contingent deferred sales charges | | | 3.00% | | | | 5.40% | | | | 6.76% | | | 1.48% |
|
Institutional (Commenced February 2, 1996) | | | 5.15% | | | | 6.63% | | | | 8.01% | | | 2.29% |
|
Class IR (Commenced February 28, 2014) | | | N/A | | | | N/A | | | | N/A | | | 1.30% |
|
| | * | | Effective at the close of business on November 14, 2014, Class B Shares of the Fund have converted to Class A Shares of the Fund. In addition, effective October 15, 2014, all redemptions of Class B Shares have not been subject to a contingent deferred sales charge. Average annual total returns for Class B Shares through October 31, 2014 have not been adjusted to reflect this change. |
14
PORTFOLIO RESULTS
Goldman Sachs BRIC Fund
Investment Objective
The Fund seeks long-term capital appreciation.
Portfolio Management Discussion and Analysis
Below, the Goldman Sachs Fundamental Emerging Markets Equity Portfolio Management Team discusses the Goldman Sachs BRIC Fund’s (the “Fund”) performance and positioning for the 12-month period ended October 31, 2014 (the “Reporting Period”).
| Q | | How did the Fund perform during the Reporting Period? |
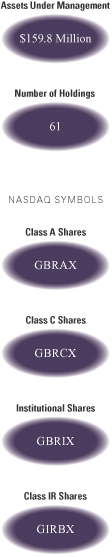
| A | | During the Reporting Period, the Fund’s Class A, C, Institutional and IR Shares generated average annual total returns, without sales charges, of 1.89%, 1.13%, 2.29% and 2.07%, respectively. These returns compare to the 0.80% average annual total return of the Fund’s benchmark, the MSCI® BRIC Index (Net, USD, Unhedged) (the “Index”), during the same period. |
| Q | | What key factors were responsible for the Fund’s performance during the Reporting Period? |
| A | | The Fund outperformed the Index on a relative basis during the Reporting Period. Effective stock selection in India and China and an overweighted allocation to the strongly-performing Indian equity market contributed most positively. Russia was the only detractor, due both to the Fund’s overweighted allocation and weak stock selection. |
| Q | | What were some of the Fund’s best-performing individual stocks? |
| A | | The strongest contributors to the Fund’s performance during the Reporting Period were Chinese Internet service company Tencent Holdings, Indian non-banking finance company Bajaj Finance and Brazilian insurance and brokerage holding company BB Seguridade. |
| | Tencent Holdings is an Internet service company in China engaged in social networks, web portals, e-commerce and multiplayer online games. Tencent Holdings’ stock performed well during the Reporting Period, as its introduction of a new version of WeChat — its proprietary social messaging platform, saw the monetization of its mobile platform in 2013. Also, subscriber growth for WeChat was strong in both its domestic and overseas markets. |
| | Bajaj Finance, an Indian non-banking finance company engaged in consumer finance, small and medium enterprise finance and commercial lending, was a strong contributor to the Fund’s relative results. The company performed well as measured by loan growth, margins and asset quality relative to its peers. Improving consumer sentiment and a strong outlook on consumer durable sales provided a positive backdrop to Bajaj Finance’s consumer lending business. At the end of the Reporting Period, we maintained the position in the Fund based on what we considered to be its healthy return ratios and attractive valuations. |
| | Against a backdrop of a difficult macro environment, BB Seguridade performed well, reporting sound results and reiterating its 2014 return on equity guidance. The company was able to increase its market share in new pension contribution and insurance premiums by leveraging the existing client base of Banco do Brasil, its parent company. |
| Q | | Which stocks detracted significantly from the Fund’s performance during the Reporting Period? |
| A | | Detracting most from the Fund’s results relative to the Index were positions in Chinese telecommunication services giant China Mobile, Chinese automobile manufacturer Great Wall Motor and Russian bank Sberbank. |
| | Not holding a position in the strongly-performing stock of China Mobile detracted significantly from the Fund’s relative results. China Mobile’s share price gain was mainly driven by three factors — 1) the Ministry of Industry and Information Technology’s request to reduce marketing expenses; 2) strong fourth generation (4G) subscriber growth; and 3) average revenue per unit improvement. In our view, the marketing expense and handset subsidy cuts could help to offset the negative earnings impact from the implementation of the value-added tax. We noted the short-term benefits on the cost reduction to China Mobile and |
15
PORTFOLIO RESULTS
| | added the stock to the Fund’s portfolio just after the close of the Reporting Period. |
| | Great Wall Motor specializes in the niche sport utility vehicles (“SUV”) segment of the Chinese automobile manufacturing industry. Its auto sales underperformed the industry during the Reporting Period, largely due to a gap in its product cycle, with launches of new SUV models and facelifts of aging small sedan models expected to come in late 2014. The repeated launch delays of high-end SUV model H8 also had a negative effect on investor sentiment. |
| | Sberbank, Russia’s largest bank, was a significant detractor from the Fund’s results during the Reporting Period. The U.S. and Europe imposed new sanctions on Russia in response to the continued conflict in eastern Ukraine. Russian equities experienced a broad-based decline, led by its financials sector. |
| Q | | Which equity market sectors most significantly affected Fund performance during the Reporting Period? |
| A | | Having an overweight to the strongly performing information technology sector and an underweight to the weaker materials sector boosted the Fund’s results significantly during the Reporting Period. Effective stock selection in information technology, financials and materials also contributed positively to the Fund’s performance. In information technology, the Fund’s position in Tencent Holdings, mentioned earlier, was the strongest contributor to relative performance within the sector. In materials, the Fund’s holding in Vale, the third-largest mining company in the world, was the largest contributor. In financials, the Fund’s position in Bajaj Finance, already mentioned, was a particularly strong performer. |
| | Conversely, weak stock selection in the health care, energy and utilities sectors detracted most from the Fund’s performance relative to the Index during the Reporting Period. At an individual stock level, the Fund’s position in OdontoPrev, a dental benefits company in Brazil, was the largest detractor within the health care sector. Within energy, the Fund’s position in Lukoil, Russia’s second-largest oil company, detracted most from performance during the Reporting Period. In utilities, the Fund’s holding in KSK Energy Ventures, an Indian mid-cap power generation company, detracted most from returns. |
| Q | | How did the Fund use derivatives and similar instruments during the Reporting Period? |
| A | | During the Reporting Period, the Fund gained exposure to select stocks through equity-linked notes and participatory notes. We used index futures on an opportunistic basis to ensure the Fund remained almost fully exposed to equities following cash inflows or stock sales. |
| Q | | Did the Fund make any significant purchases or sales during the Reporting Period? |
| A | | During the Reporting Period, we added to the Fund’s position in Sino Biopharmaceutical within the health care sector in China. The company develops drugs for the treatment of ophthalmia, hepatitis and modernized Chinese medicine. |
| | We initiated a Fund position in TCS, India’s largest information technology services company. TCS delivered double-digit growth in U.S. dollar terms in fiscal year 2014 with its new service lines growing ahead of estimates, led by digital, consulting and engineering services. Continued growth momentum as measured by both revenues and profits, with an even better fiscal year 2015 outlook, gives us confidence in the sustainability of the company’s outperformance over key competitors and the industry. |
| | We exited the Fund’s position in Vale, mentioned earlier. We believe the long-awaited iron ore price correction may well be underway and do not see this correction as short-lived. |
| | We trimmed the Fund’s position in ICBC, the world’s largest bank by market capitalization and one of the largest commercial banks in China. We like the bank for its liquid balance sheet and strong management track record. However, we reduced the Fund position in ICBC to lessen exposure to banks overall given headwinds such as slower economic growth and heightened competition from Internet finance. |
| Q | | Were there any notable changes in the Fund’s weightings during the Reporting Period? |
| A | | Most sector weights are usually established within a narrow range from the Index, as our team prefers to make decisions at the individual stock level, where we believe we can generate more added value. That said, during the Reporting Period, the Fund’s exposure relative to the Index in information technology, health care and consumer discretionary increased, and its allocations relative to the |
16
PORTFOLIO RESULTS
| | Index to financials, telecommunication services, materials, energy and utilities decreased. |
| | Resulting from various stock selection decisions, the Fund’s exposure relative to the Index to India increased, and its allocation relative to the Index to China decreased. |
| Q | | How was the Fund positioned relative to the Index at the end of the Reporting Period? |
| A | | At the end of the Reporting Period, the Fund had overweighted exposure to India and Russia and underweighted exposure to Brazil and China relative to the Index. |
| | From a sector perspective, the Fund had overweighted allocations to information technology, health care, consumer staples and consumer discretionary compared to the Index at the end of the Reporting Period. On the same date, the Fund had underweighted exposure to the energy, telecommunication services, materials, utilities, financials and industrials sectors. |
| | As always, we remained focused on individual stock selection, with sector and country positioning being a secondary, closely-monitored effect. |
17
FUND BASICS
BRIC Fund
as of October 31, 2014
| | | | | | | | | | |
| | PERFORMANCE REVIEW | |
| | | November 1, 2013–October 31, 2014 | | Fund Total Return
(based on NAV)1 | | | MSCI® BRIC Index2 | |
| | Class A | | | 1.89 | % | | | 0.80 | % |
| | Class C | | | 1.13 | | | | 0.80 | |
| | Institutional | | | 2.29 | | | | 0.80 | |
| | | Class IR | | | 2.07 | | | | 0.80 | |
| | 1 | | The net asset value (“NAV”) represents the net assets of the class of the Fund (ex-dividend) divided by the total number of shares of the class outstanding. The Fund’s performance assumes the reinvestment of dividends and other distributions. The Fund’s performance does not reflect the deduction of any applicable sales charges. |
| | 2 | | The MSCI® BRIC Index (Net, USD, Unhedged) is a free float-adjusted market capitalization weighted index that is designed to measure the equity market performance of the following four emerging market country indices: Brazil, Russia, India and China. This series approximates the minimum possible dividend reinvestment. The dividend is reinvested after deduction of withholding tax, applying the rate to non-resident individuals who do not benefit from double taxation treaties. MSCI Barra uses withholding tax rates applicable to Luxembourg holding companies, as Luxembourg applies the highest rates. It is not possible to invest directly in an index. |
| | | | | | | | | | | | | | | | |
| | STANDARDIZED TOTAL RETURNS3 |
| | | For the period ended 9/30/14 | | One Year | | | Five Years | | | Since Inception | | | Inception Date |
| | Class A | | | -1.24 | % | | | -0.66 | % | | | 3.35 | % | | 6/30/06 |
| | Class C | | | 2.68 | | | | -0.30 | | | | 3.28 | | | 6/30/06 |
| | Institutional | | | 4.93 | | | | 0.87 | | | | 4.48 | | | 6/30/06 |
| | | Class IR | | | 4.69 | | | | N/A | | | | -0.76 | | | 8/31/10 |
| | 3 | | The Standardized Total Returns are average annual total returns as of the most recent calendar quarter-end. They assume reinvestment of all distributions at NAV. These returns reflect a maximum initial sales charge of 5.5% for Class A Shares and the assumed contingent deferred sales charge for Class C Shares (1% if redeemed within 12 months of purchase). Because Institutional and Class IR Shares do not involve a sales charge, such a charge is not applied to their Standardized Total Returns. |
The returns set forth in the tables above represent past performance. Past performance does not guarantee future results. The Fund’s investment return and principal value will fluctuate so that an investor’s shares, when redeemed, may be worth more or less than their original cost. Current performance may be lower or higher than the performance quoted above. Please visit our web site at www.GSAMFUNDS.com to obtain the most recent month-end returns. Performance reflects applicable fee waivers and/or expense limitations in effect during the periods shown. In their absence, performance would be reduced. Returns do not reflect the deduction of taxes that a shareholder would pay on Fund distributions or the redemption of Fund shares.
18
FUND BASICS
| | | | | | | | | | |
| | EXPENSE RATIOS4 | |
| | | | | Net Expense Ratio (Current) | | | Gross Expense Ratio (Before Waivers) | |
| | Class A | | | 1.71 | % | | | 1.97 | % |
| | Class C | | | 2.45 | | | | 2.71 | |
| | Institutional | | | 1.31 | | | | 1.57 | |
| | | Class IR | | | 1.46 | | | | 1.72 | |
| | 4 | | The expense ratios of the Fund, both current (net of applicable fee waivers and/or expense limitations) and before waivers (gross of applicable fee waivers and/or expense limitations) are as set forth above according to the most recent publicly available Prospectus for the Fund and may differ from the expense ratios disclosed in the Financial Highlights in this report. Pursuant to a contractual arrangement, the Fund’s waivers and/or expense limitations will remain in place through at least February 28, 2015, and prior to such date the Investment Adviser may not terminate the arrangements without the approval of the Fund’s Board of Trustees. If these arrangements are discontinued in the future, the expense ratios may change without shareholder approval. |
| | | | | | | | | | |
| | TOP TEN HOLDINGS AS OF 10/31/145 |
| | | Holding | | % of
Net Assets | | | Line of Business | | Country |
| | Tencent Holdings Ltd. | | | 8.3 | % | | Software & Services | | China |
| | iShares China Large-Cap ETF | | | 5.5 | | | Exchange Traded
Fund | | United States |
| | BB Seguridade Participacoes SA | | | 5.0 | | | Insurance | | Brazil |
| | Banco Bradesco SA | | | 3.4 | | | Banks | | Brazil |
| | AMBEV SA | | | 3.1 | | | Food, Beverage &
Tobacco | | Brazil |
| | OJSC Magnit | | | 3.0 | | | Food & Staples
Retailing | | Russia |
| | Agricultural Bank of China Ltd. Class H | | | 2.9 | | | Banks | | China |
| | Odontoprev SA | | | 2.8 | | | Health Care
Equipment &
Services | | Brazil |
| | OAO Lukoil ADR | | | 2.7 | | | Energy | | Russia |
| | | Hollysys Automation Technologies Ltd. | | | 2.5 | | | Technology
Hardware &
Equipment | | China |
| | 5 | | The top 10 holdings may not be representative of the Fund’s future investments. |
19
FUND BASICS
|
| FUND VS. BENCHMARK SECTOR ALLOCATIONS6 |
| As of October 31, 2014 |

| | 6 | | The Fund is actively managed and, as such, its composition may differ over time. Consequently, the Fund’s overall sector allocations may differ from percentages contained in the graph above. The graph categorizes investments using Global Industry Classification Standard (“GICS”), however, the sector classifications used by the portfolio management team may differ from GICS. Underlying sector allocations of exchange traded funds held by the Fund are not reflected in the graph above. The percentage shown for each investment category reflects the value of investments in that category as a percentage of market value. The graph depicts the Fund’s investments but may not represent the Fund’s market exposure due to the exclusion of certain derivatives, if any, as listed in the Additional Investment Information section of the Schedule of Investments. |
20
GOLDMAN SACHS BRIC FUND
Performance Summary
October 31, 2014
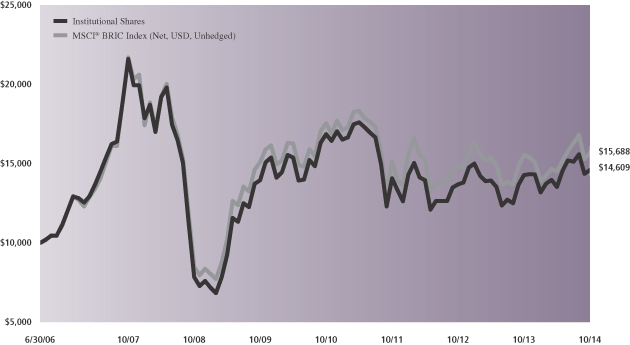
The following graph shows the value, as of October 31, 2014, of a $10,000 investment made on June 30, 2006 (commencement of operations) in Institutional Shares (at NAV). For comparative purposes, the performance of the Fund’s benchmark, the MSCI® BRIC Index (Net, USD, Unhedged), is shown. This performance data represents past performance and should not be considered indicative of future performance, which will fluctuate with changes in market conditions. These performance fluctuations will cause an investor’s shares, when redeemed, to be worth more or less than their original cost. Performance reflects applicable fee waivers and/or expense limitations in effect during the periods shown and in their absence, performance would be reduced. Returns do not reflect the deduction of taxes that a shareholder would pay on Fund distributions or the redemption of Fund shares. Performance of Class A, Class C and Class IR Shares will vary from that of Institutional Shares due to differences in class specific fees and any applicable sales charges. In addition to the Investment Adviser’s decisions regarding issuer/industry/country investment selection and allocation, other factors may affect Fund performance. These factors include, but are not limited to, Fund operating fees and expenses, portfolio turnover and subscription and redemption cash flows affecting the Fund.
|
| BRIC Fund’s Lifetime Performance |
Performance of a $10,000 Investment, with distributions reinvested, from June 30, 2006 through October 31, 2014.
| | | | | | | | | | |
| Average Annual Total Return through October 31, 2014 | | | One Year | | | | Five Years | | | Since Inception |
Class A (Commenced June 30, 2006) | | | | | | | | | | |
Excluding sales charges | | | 1.89% | | | | 0.49% | | | 4.23% |
Including sales charges | | | -3.70% | | | | -0.63% | | | 3.52% |
|
Class C (Commenced June 30, 2006) | | | | | | | | | | |
Excluding contingent deferred sales charges | | | 1.13% | | | | -0.26% | | | 3.44% |
Including contingent deferred sales charges | | | 0.13% | | | | -0.26% | | | 3.44% |
|
Institutional (Commenced June 30, 2006) | | | 2.29% | | | | 0.90% | | | 4.65% |
|
Class IR (Commenced August 31, 2010) | | | 2.07% | | | | N/A | | | -0.34% |
|
21
PORTFOLIO RESULTS
Goldman Sachs Emerging Markets Equity Fund
Investment Objective
The Fund seeks long-term capital appreciation.
Portfolio Management Discussion and Analysis
Below, the Goldman Sachs Fundamental Emerging Markets Equity Portfolio Management Team discusses the Goldman Sachs Emerging Markets Equity Fund’s (the “Fund”) performance and positioning for the 12-month period ended October 31, 2014 (the “Reporting Period”).
| Q | | How did the Fund perform during the Reporting Period? |
| A | | During the Reporting Period, the Fund’s Class A, B, C, Institutional, Service and IR Shares generated average annual total returns, without sales charges, of 5.67%, 4.94%, 4.90%, 6.17%, 5.55% and 5.93%, respectively. These returns compare to the 0.64% average annual total return of the Fund’s benchmark, the MSCI® Emerging Markets Index (Gross, USD, Unhedged) (the “Index”), during the same period. |
| Q | | What key factors were responsible for the Fund’s performance during the Reporting Period? |
| A | | The Fund outperformed the Index on a relative basis during the Reporting Period. Effective stock selection in India, South Korea and Taiwan benefited the Fund’s performance most. Having an overweighted allocation to India, which significantly outpaced the Index during the Reporting Period, also boosted the Fund’s results. Such positive contributors were only partially offset by the detracting effect of weak stock selection in South Africa and allocation positioning in Russia, South Africa and Nigeria. |
| Q | | What were some of the Fund’s best-performing individual stocks? |
| A | | The strongest contributors to the Fund’s performance during the Reporting Period were Hanssem, Bajaj Finance and PCHome Online. |
| | Hanssem, which manufactures kitchen and interior furniture and is the main consolidator of a fragmented South Korean furniture market, was the top individual stock contributor to the Fund’s relative results during the Reporting Period. Its shares rose, as the company reported better than expected top-line growth on an increase in remodeling demand from an improved housing transaction volume. At the end of the Reporting Period, Hanssem led its industry in terms of earnings growth, return on equity and valuation. |
| | Bajaj Finance, an Indian non-banking finance company engaged in consumer finance, small and medium enterprise finance and commercial lending, was another strong contributor to the Fund’s relative results. The company performed well as measured by loan growth, margins and asset quality relative to its peers. Improving consumer sentiment and a strong outlook on consumer durable sales provided a positive backdrop to Bajaj Finance’s consumer lending business. At the end of the Reporting Period, we maintained the position in the Fund based on what we considered to be its healthy return ratios and attractive valuations. |
| | PCHome Online, a leading e-commerce service provider in Taiwan, was a key positive contributor to the Fund’s results during the Reporting Period. The company beat consensus estimates in successive quarters, evidence to the market at large that the third-party payment story remains intact. As e-commerce appears to be entering a positive cycle, PCHome Online also performed well due to its strong earnings growth outlook. |
| Q | | Which stocks detracted significantly from the Fund’s performance during the Reporting Period? |
| A | | Detracting most from the Fund’s results relative to the Index were positions in Great Wall Motor, LiHom-Cuchen and China Mobile. |
| | | Great Wall Motor specializes in the niche sport utility vehicles (“SUV”) segment of the Chinese automobile manufacturing industry. Its auto sales underperformed the industry during the Reporting Period, largely due to a gap in its product cycle, with launches of new SUV models and facelifts of aging small sedan models expected to come in |
22
PORTFOLIO RESULTS
| | late 2014. The repeated launch delays of high-end SUV model H8 also had a negative effect on investor sentiment. |
| | South Korean electric home appliance manufacturer LiHom Cuchen’s stock, a new purchase for the Fund during the Reporting Period, detracted from the Fund’s results on the back of concerns about potentially weaker than expected third quarter 2014 earnings and risk-averse market sentiment toward small cap names amidst volatility. At the end of the Reporting Period, we had put this holding under review pending its earnings announcement. |
| | Not holding a position in the strongly-performing stock of China Mobile detracted significantly from the Fund’s relative results. China Mobile’s share price gain was mainly driven by three factors — 1) the Ministry of Industry and Information Technology’s request to reduce marketing expenses; 2) strong fourth generation (4G) subscriber growth; and 3) average revenue per unit improvement. We believe the marketing expense and handset subsidy cuts could help to offset the negative earnings impact from the implementation of the value-added tax. We noted the short-term benefits on the cost reduction to China Mobile and added the stock to the Fund’s portfolio just after the close of the Reporting Period. |
| Q | | Which equity market sectors most significantly affected Fund performance during the Reporting Period? |
| A | | Relative to the Index, strong stock selection within the information technology, financials and materials sectors contributed most positively to the Fund’s performance. Having an overweighted allocation to the information technology sector, which significantly outpaced the Index during the Reporting Period, and an underweighted allocation to the materials sector, which significantly lagged the Index during the Reporting Period, also boosted the Fund’s results. In information technology, the Fund’s holding in PCHome Online, mentioned earlier, was the strongest contributor. In financials, the Fund’s position in Bajaj Finance, already mentioned, was an outstanding performer. In materials, the Fund’s holding in Monsanto India, the listed subsidiary of the global agricultural company Monsanto, boosted Fund results most. |
| | Conversely, weak stock selection and allocation positioning in telecommunication services, consumer staples and utilities detracted most from the Fund’s relative results during the Reporting Period. In telecommunication services, the Fund’s position in Mobile Telesystems, Russia’s largest mobile phone carrier, was the largest detractor from relative returns. In consumer staples, the Fund’s position in Hengan International, the largest producer of sanitary napkins and baby diapers in China, was the biggest disappointment. In utilities, the Fund’s position in KSK Energy Ventures, an Indian mid-capitalization power generation company, detracted most from returns. |
| Q | | How did the Fund use derivatives and similar instruments during the Reporting Period? |
| A | During the Reporting Period, the Fund used equity-linked notes and participatory notes to gain exposure to select stocks. We used index futures on an opportunistic basis to ensure the Fund remained almost fully exposed to equities following cash inflows or stock sales. |
| Q | | Did the Fund make any significant purchases or sales during the Reporting Period? |
| A | Within the consumer discretionary sector in South Africa, we initiated a Fund position in Naspers, a multinational media group. Naspers is a global platform operator with principal operations in Internet services, pay television and print media. The company appears to us to be pushing hard to consolidate its number one position in classified ads in many regions. Also, under its new chief executive officer, the company appears focused on e-commerce upside. Tencent Holdings, of which Naspers is the largest shareholder, offers exposure to the largest and fastest growing mobile market globally. |
| | Within the industrials sector in South Korea, we initiated a Fund position in Hanjin Kal, a holding company with subsidiaries in the South Korean travel industry. We believe the company may be a direct beneficiary of strong tourism in South Korea and that its recent restructuring should improve transparency of the company and crystalize its value. It is a major shareholder of South Korea’s number two low cost carrier, Jin Air. Jin Air has been a beneficiary of increasing overseas travel demand, especially lucrative short-haul routes under the backdrop of a strong Korean won. Given that its subsidiaries are unlisted companies, we believe Hanjin Kal deserves a higher valuation than it had at the end of the Reporting Period. |
| | We exited the Fund’s position in Vale, the third-largest mining company in the world. We believe the long-awaited iron ore price correction may well be underway and do not see this correction as short-lived. |
| | Within the consumer staples sector in Brazil, we eliminated the Fund’s position in beverage company Ambev during the Reporting Period due to the persistent weakness in purchasing power of the Brazilian consumer. |
23
PORTFOLIO RESULTS
| Q | | Were there any notable changes in the Fund’s weightings during the Reporting Period? |
| A | | Most sector weights are usually established within a narrow range from the Index, as our team prefers to make decisions at the individual stock level, where we believe we can generate more added value. That said, during the Reporting Period, the Fund’s exposure relative to the Index to financials, consumer discretionary and health care increased, and its allocations relative to the Index to energy, consumer staples and telecommunication services decreased. |
| | Similarly, allocations to countries are directly the result of various stock selection decisions. As such, the Fund’s exposure relative to the Index in India, Colombia, Thailand and Peru increased, and its allocations relative to the Index to Russia, China, South Korea, Nigeria and Taiwan decreased. |
| Q | | How was the Fund positioned relative to the Index at the end of the Reporting Period? |
| A | | At the end of the Reporting Period, the Fund had overweighted exposures to India, Peru, Georgia, Indonesia and Thailand and underweighted exposures to China, South Africa, South Korea and Malaysia relative to the Index. On the same date, the Fund was relatively neutrally weighted to the Index in the remaining components of the Index. |
| | From a sector allocation perspective, the Fund had overweighted positions relative to the Index in consumer discretionary, health care, information technology and financials at the end of the Reporting Period. The Fund had underweighted positions compared to the Index in the energy, materials and utilities sectors at the end of the Reporting Period. The Fund had rather neutral positions relative to the Index in the consumer staples and industrials sectors and had no position at all in telecommunication services at the end the Reporting Period. |
| | As always, we remained focused on individual stock selection, with sector and country positioning being a secondary, closely-monitored effect. |
24
FUND BASICS
Emerging Markets Equity Fund
as of October 31, 2014
| | | | | | | | | | |
| | PERFORMANCE REVIEW | |
| | | November 1, 2013–October 31, 2014 | | Fund Total Return
(based on NAV)1 | | | MSCI® Emerging Markets Index
(Gross, USD, Unhedged)2 | |
| | Class A | | | 5.67 | % | | | 0.64 | % |
| | Class B | | | 4.94 | | | | 0.64 | |
| | Class C | | | 4.90 | | | | 0.64 | |
| | Institutional | | | 6.17 | | | | 0.64 | |
| | Service | | | 5.55 | | | | 0.64 | |
| | | Class IR | | | 5.93 | | | | 0.64 | |
| | 1 | | The net asset value (“NAV”) represents the net assets of the class of the Fund (ex-dividend) divided by the total number of shares of the class outstanding. The Fund’s performance assumes the reinvestment of dividends and other distributions. The Fund’s performance does not reflect the deduction of any applicable sales charges. |
| | 2 | | The MSCI® Emerging Markets Index (Gross, USD, Unhedged) is a free float-adjusted market capitalization index that is designed to measure equity market performance of emerging markets. As of June 2, 2014 the MSCI® Emerging Markets Index consists of the following 23 emerging market country indexes: Brazil, Chile, China, Colombia, Czech Republic, Egypt, Greece, Hungary, India, Indonesia, Korea, Malaysia, Mexico, Peru, Philippines, Poland, Qatar, Russia, South Africa, Taiwan, Thailand, Turkey and United Arab Emirates. It is not possible to invest directly in an index. |
| | | | | | | | | | | | | | | | | | | | |
| | STANDARDIZED TOTAL RETURNS3 |
| | | For the period ended 9/30/14 | | One Year | | | Five Years | | | Ten Years | | | Since Inception | | | Inception Date |
| | Class A | | | 4.05 | % | | | 2.25 | % | | | 8.52 | % | | | 6.17 | % | | 12/15/97 |
| | Class B | | | 4.27 | | | | 2.27 | | | | 8.49 | | | | 6.28 | | | 12/15/97 |
| | Class C | | | 8.20 | | | | 2.63 | | | | 8.30 | | | | 5.85 | | | 12/15/97 |
| | Institutional | | | 10.52 | | | | 3.85 | | | | 9.56 | | | | 7.07 | | | 12/15/97 |
| | Service | | | 10.00 | | | | 3.32 | | | | 9.02 | | | | 6.42 | | | 12/15/97 |
| | | Class IR | | | 10.35 | | | | N/A | | | | N/A | | | | 3.20 | | | 8/31/10 |
| | 3 | | The Standardized Total Returns are average annual total returns as of the most recent calendar quarter-end. They assume reinvestment of all distributions at NAV. These returns reflect a maximum initial sales charge of 5.5% for Class A Shares, the assumed contingent deferred sales charge for Class B Shares (5% maximum declining to 0% after six years) and the assumed contingent deferred sales charge for Class C Shares (1% if redeemed within 12 months of purchase). Class B Shares convert automatically to Class A Shares on or about the fifteenth day of the last month of the calendar quarter that is eight years after purchase. Returns for Class B Shares for the period after conversion reflect the performance of Class A Shares. Because Institutional, Service and Class IR Shares do not involve a sales charge, such a charge is not applied to their Standardized Total Returns. The Fund’s Class B Shares are no longer available for purchase by new or existing shareholders. |
The returns set forth in the tables above represent past performance. Past performance does not guarantee future results. The Fund’s investment return and principal value will fluctuate so that an investor’s shares, when redeemed, may be worth more or less than their original cost. Current performance may be lower or higher than the performance quoted above. Please visit our web site at www.GSAMFUNDS.com to obtain the most recent month-end returns. Performance reflects applicable fee waivers and/or expense limitations in effect during the periods shown. In their absence, performance would be reduced. Returns do not reflect the deduction of taxes that a shareholder would pay on Fund distributions or the redemption of Fund shares.
25
FUND BASICS
| | | | | | | | | | |
| | EXPENSE RATIOS4 | |
| | | | | Net Expense Ratio (Current) | | | Gross Expense Ratio (Before Waivers) | |
| | Class A | | | 1.72 | % | | | 1.90 | % |
| | Class B | | | 2.47 | | | | 2.65 | |
| | Class C | | | 2.47 | | | | 2.65 | |
| | Institutional | | | 1.32 | | | | 1.50 | |
| | Service | | | 1.82 | | | | 2.00 | |
| | | Class IR | | | 1.47 | | | | 1.65 | |
| | 4 | | The expense ratios of the Fund, both current (net of applicable fee waivers and/or expense limitations) and before waivers (gross of applicable fee waivers and/or expense limitations) are as set forth above according to the most recent publicly available Prospectus for the Fund and may differ from the expense ratios disclosed in the Financial Highlights in this report. Pursuant to a contractual arrangement, the Fund’s waivers and/or expense limitations will remain in place through at least February 28, 2015, and prior to such date the Investment Adviser may not terminate the arrangements without the approval of the Fund’s Board of Trustees If these arrangements are discontinued in the future, the expense ratios may change without shareholder approval. |
| | | | | | | | | | |
| | TOP TEN HOLDINGS AS OF 10/31/145 |
| | | Holding | | % of
Net Assets | | | Line of Business | | Country |
| | Tencent Holdings Ltd. | | | 3.0 | % | | Software & Services | | China |
| | Taiwan Semiconductor Manufacturing Co. Ltd. | | | 2.8 | | | Semiconductors &
Semiconductor Equipment | | Taiwan |
| | iShares MSCI South Korea Capped | | | 2.5 | | | Exchange Traded Fund | | United States |
| | iShares China Large-Cap ETF | | | 1.9 | | | Exchange Traded Fund | | United States |
| | Airports of Thailand PCL | | | 1.8 | | | Transportation | | Thailand |
| | BB Seguridade Participacoes SA | | | 1.8 | | | Insurance | | Brazil |
| | SK Hynix, Inc. | | | 1.5 | | | Semiconductors &
Semiconductor Equipment | | South Korea |
| | Banco Bradesco SA | | | 1.5 | | | Banks | | Brazil |
| | Credicorp Ltd. | | | 1.4 | | | Banks | | Peru |
| | | Naspers Ltd. Class N | | | 1.4 | | | Media | | South Africa |
| | 5 | | The top 10 holdings may not be representative of the Fund’s future investments. |
26
FUND BASICS
|
| FUND VS . BENCHMARK SECTOR ALLOCATIONS6 |
| As of October 31, 2014 |
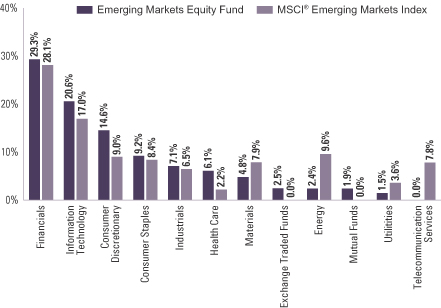
| | 6 | | The Fund is actively managed and, as such, its composition may differ over time. Consequently, the Fund’s overall sector allocations may differ from percentages contained in the graph above. The graph categorizes investments using Global Industry Classification Standard (“GICS”), however, the sector classifications used by the portfolio management team may differ from GICS. Underlying sector allocations of exchange traded funds held by the Fund are not reflected in the graph above. The percentage shown for each investment category reflects the value of investments in that category as a percentage of market value. The graph depicts the Fund’s investments but may not represent the Fund’s market exposure due to the exclusion of certain derivatives, if any, as listed in the Additional Investment Information section of the Schedule of Investments. |
27
GOLDMAN SACHS EMERGING MARKETS EQUITY FUND
Performance Summary
October 31, 2014
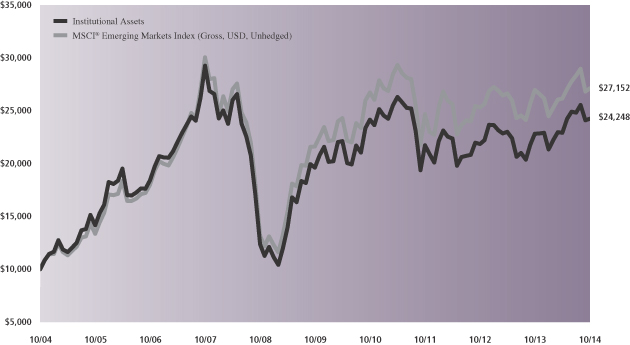
The following graph shows the value, as of October 31, 2014, of a $10,000 investment made on November 1, 2004 in Institutional Shares (at NAV). For comparative purposes, the performance of the Fund’s benchmark, the MSCI® Emerging Markets Index (Gross, USD, Unhedged), is shown. This performance data represents past performance and should not be considered indicative of future performance, which will fluctuate with changes in market conditions. These performance fluctuations will cause an investor’s shares, when redeemed, to be worth more or less than their original cost. Performance reflects applicable fee waivers and/or expense limitations in effect during the periods shown and in their absence, performance would be reduced. Returns do not reflect the deduction of taxes that a shareholder would pay on Fund distributions or the redemption of Fund shares. Performance of Class A, Class B, Class C, Service and Class IR Shares will vary from that of Institutional Shares due to differences in class specific fees and any applicable sales charges. In addition to the Investment Adviser’s decisions regarding issuer/industry/country investment selection and allocation, other factors may affect Fund performance. These factors include, but are not limited to, Fund operating fees and expenses, portfolio turnover and subscription and redemption cash flows affecting the Fund.
|
| Emerging Markets Equity Fund’s 10 Year Performance |
Performance of a $10,000 Investment, with distributions reinvested, from November 1, 2004 through October 31, 2014.
| | | | | | | | | | | | | | |
| Average Annual Total Return through October 31, 2014 | | | One Year | | | | Five Years | | | | Ten Years | | | Since Inception |
Class A (Commenced December 15, 1997) | | | | | | | | | | | | | | |
Excluding sales charges | | | 5.67% | | | | 3.87% | | | | 8.82% | | | 6.52% |
Including sales charges | | | -0.11% | | | | 2.70% | | | | 8.20% | | | 6.17% |
|
Class B (Commenced December 15, 1997)* | | | | | | | | | | | | | | |
Excluding contingent deferred sales charges | | | 4.94% | | | | 3.10% | | | | 8.17% | | | 6.27% |
Including contingent deferred sales charges | | | -0.06% | | | | 2.74% | | | | 8.17% | | | 6.27% |
|
Class C (Commenced December 15, 1997) | | | | | | | | | | | | | | |
Excluding contingent deferred sales charges | | | 4.90% | | | | 3.11% | | | | 8.01% | | | 5.85% |
Including contingent deferred sales charges | | | 3.90% | | | | 3.11% | | | | 8.01% | | | 5.85% |
|
Institutional (Commenced December 15, 1997) | | | 6.17% | | | | 4.30% | | | | 9.26% | | | 7.07% |
|
Service (Commenced December 15, 1997) | | | 5.55% | | | | 3.78% | | | | 8.71% | | | 6.41% |
|
Class IR (Commenced August 31, 2010) | | | 5.93% | | | | N/A | | | | N/A | | | 3.25% |
|
| | * | | Effective at the close of business on November 14, 2014, Class B Shares of the Fund have converted to Class A Shares of the Fund. In addition, effective October 15, 2014, all redemptions of Class B Shares have not been subject to a contingent deferred sales charge. Average annual total returns for Class B Shares through October 31, 2014 have not been adjusted to reflect this change. |
28
PORTFOLIO RESULTS
Goldman Sachs N-11 Equity Fund
Investment Objective
The Fund seeks long-term capital appreciation.
Portfolio Management Discussion and Analysis
Below, the Goldman Sachs Fundamental Emerging Markets Equity Portfolio Management Team discusses the Goldman Sachs N-11 Equity Fund’s (the “Fund”) performance and positioning for the 12-month period ended October 31, 2014 (the “Reporting Period”).
| Q | | How did the Fund perform during the Reporting Period? |
| A | | During the Reporting Period, the Fund’s Class A, C, Institutional and IR Shares generated average annual total returns, without sales charges, of 2.54%, 1.76%, 2.88% and 2.76%, respectively. These returns compare to the 4.96% average annual total return of the Fund’s benchmark, the MSCI® Next 11 ex-Iran GDP Weighted Index (Net, Unhedged, USD) (the “Index”), during the same period. |
| Q | | What key factors were responsible for the Fund’s performance during the Reporting Period? |
A The Fund produced positive absolute returns but underperformed the Index during the Reporting Period. The Fund’s stock selection in Bangladesh, South Korea and Turkey detracted most. Having an underweighted allocation to Bangladesh, which significantly outpaced the Index during the Reporting Period, also hurt. Such detractors were only partially offset by the positive contributions of effective stock selection in Egypt, Mexico and Indonesia.
| Q | | Which stocks detracted significantly from the Fund’s performance during the Reporting Period? |
| A | | Detracting most from the Fund’s results relative to the Index were positions in Lafarge Surma Cement, Afren and Turkiye Halk Bank. |
| | Lafarge Surma Cement, a Bangladesh cement producer, was a strong performer but the Fund did not own its shares for most of the Reporting Period, and so it proved to be a significant detractor from relative results. |
| | Afren, a financial company based in Nigeria, detracted from the Fund’s results. The company’s chief executive officer and chief operating officer were suspended after a Boardroom probe into unauthorized payments. However, the payments were not made by the company and were uncovered by internal compliance procedures, which speaks to the Board’s vigilance. |
| | Turkiye Halk Bank, a Turkish bank, saw its shares decline driven by political instability in Turkey. In addition, the market appeared concerned about Turkiye Halk Bank’s non-performing loans rising faster than the sector average. The company has already signaled a sizable increase in its non-performing loan ratio. |
| Q | | What were some of the Fund’s best-performing individual stocks? |
| A | | The strongest contributors to the Fund’s performance during the Reporting Period were Commercial International Bank, Turkiye IS Bankasi and SK Hynix.ynHyn |
| | Commercial International Bank is the largest private sector lender in Egypt. The company performed well. The company’s strong fundamentals helped drive its equity price higher, and we believe it may benefit from an uptick in corporate lending in Egypt going forward. |
| | Turkiye IS Bankasi, Turkey’s first public bank and one of the largest financial institutions in the country, was another top contributor to the Fund’s relative results during the Reporting Period. The stock declined during the Reporting Period, but the Fund held an underweighted position in Turkiye IS Bankasi when its stock price dipped amidst Turkey’s political instability. We subsequently increased the Fund’s position in Turkiye IS Bankasi as its valuation became more attractive in our view. |
| | SK Hynix is the world’s second largest memory chipmaker, after Samsung Electronics. Its stock was one of the largest contributors to Fund performance during the Reporting Period after the company repeatedly delivered strong quarterly results, most notably in the second quarter of 2014. Further fuelling its share price rally were expectations that |
29
PORTFOLIO RESULTS
| | the demand outlook for its products would likely remain strong in the second half of 2014 due to the launch of Apple’s iPhone 6, new Chinese smartphones and resilient personal computer demand. |
| Q | | Which equity market sectors most significantly affected Fund performance during the Reporting Period? |
| A | | Relative to the Index, weak stock selection within the materials, consumer discretionary and energy sectors detracted most from the Fund’s performance during the Reporting Period. Notable individual drivers of underperformance in the materials sector were holdings in Lafarge Surma Cement, already mentioned, and in Koza Altin, a Turkish metals and mining company. In consumer discretionary, holdings in the retail industry hurt most, with positions in South Korea’s Hyundai Motor and Hyundai Department Store especially disappointing. In energy, a notable individual driver of underperformance was Afren, mentioned earlier. |
| | Conversely, strong stock selection within consumer staples and information technology contributed most positively to the Fund’s performance. Having an overweighted allocation to utilities, which significantly outpaced the Index during the Reporting Period, also boosted the Fund’s relative results. In consumer staples, holdings within the food and beverage industry performed particularly well, with Indonesian cigarette manufacturer Gudang Garam and Nigerian food manufacturer Unilever Nigeria boosting results. In information technology, holdings within the semiconductor industry helped most, with South Korea’s SK Hynix and Seoul Semiconductor as especially strong performers. In utilities, positions in Mexican energy infrastructure company IEnova and Vietnamese utilities PV Gas were the strongest performers. |
| Q | | How did the Fund use derivatives and similar instruments during the Reporting Period? |
| A | | During the Reporting Period, the Fund gained exposure to select stocks through equity-linked notes and participatory notes. We used index futures on an opportunistic basis in seeking to ensure the Fund remained almost fully exposed to equities following cash inflows or stock sales. |
| Q | | Did the Fund make any significant purchases or sales during the Reporting Period? |
| A | | In Nigeria, we added to the Fund’s position in Zenith Bank, as we continued to like the company’s strong liquidity and capital adequacy. In an increasingly challenging regulatory environment, we believe the bank’s earnings should be more resilient. We also increased the Fund’s position in Bangladesh’s Square Pharmaceuticals. This proved beneficial given its strong performance during the Reporting Period. |
| | We sold the Fund’s position in Mexican energy infrastructure company IEnova, mentioned earlier. Its stock had performed well, and, as it exceeded our target price, we decided to take profits. We also eliminated the Fund’s position in NCSoft, a South Korea-based online video and mobile game development company. User traffic on its Blade and Soul game had been disappointing, and, as traffic growth was a key aspect of our investment thesis, we exited the position. |
| Q | | Were there any notable changes in the Fund’s weightings during the Reporting Period? |
| A | | Most sector weights are usually established within a narrow range from the Index, as our team prefers to make decisions at the individual stock level, where we believe we can generate more added value. That said, during the Reporting Period, the Fund’s exposure relative to the Index to financials and health care increased, and its allocations relative to the Index to information technology and industrials decreased. |
| | Similarly, allocations to countries are directly the result of various stock selection decisions. As such, the Fund’s allocation relative to the Index to Nigeria increased, and its exposure relative to the Index in South Korea decreased. |
| Q | | How was the Fund positioned relative to the Index at the end of the Reporting Period? |
| A | | At the end of the Reporting Period, the Fund was relatively neutrally weighted to the Index in all of the country components of the Index. |
| | From a sector allocation perspective, the Fund had overweighted positions relative to the Index in consumer discretionary and utilities at the end of the Reporting Period. The Fund had underweighted positions compared to the Index in the consumer staples and industrials sectors and rather neutral positions relative to the Index in the health care, information technology, telecommunication services, energy, financials and materials sectors at the end the Reporting Period. |
| | As always, we remained focused on individual stock selection, with sector and country positioning being a secondary, closely-monitored effect. |
30
FUND BASICS
N-11 Equity Fund
as of October 31, 2014
| | | | | | | | | | |
| | PERFORMANCE REVIEW | |
| | | November 1, 2013–October 31, 2014 | | Fund Total Return
(based on NAV)1 | | | MSCI® Next 11 ex Iran GDP
Weighted Index2 | |
| | Class A | | | 2.54 | % | | | 4.96 | % |
| | Class C | | | 1.76 | | | | 4.96 | |
| | Institutional | | | 2.88 | | | | 4.96 | |
| | | Class IR | | | 2.76 | | | | 4.96 | |
| | 1 | | The net asset value (“NAV”) represents the net assets of the class of the Fund (ex-dividend) divided by the total number of shares of the class outstanding. The Fund’s performance assumes the reinvestment of dividends and other distributions. The Fund’s performance does not reflect the deduction of any applicable sales charges. |
| | 2 | | The MSCI® Next 11 ex-Iran GDP Weighted Index (Net, Unhedged, USD) comprises the following 10 emerging and frontier market indices: Bangladesh, Egypt, Indonesia, Mexico, Nigeria, Pakistan, Philippines, South Korea, Turkey and Vietnam. The index is designed to reflect the performance of the N-11 ex Iran countries based on the size of each country’s economy rather than the size of its equity market, by using country weights based on a country’s gross domestic product (GDP). Each country is divided into large- and mid-cap segments and provides exhaustive coverage of these size segments by targeting a coverage range around 85% of free float-adjusted market capitalization in that market. It is not possible to invest directly in an index. |
| | | | | | | | | | | | | | |
| | STANDARDIZED TOTAL RETURNS3 | |
| | | For the period ended 9/30/14 | | One Year | | | Since Inception | | | Inception Date | |
| | Class A | | | 2.71 | % | | | 2.17 | % | | | 2/28/11 | |
| | Class C | | | 6.86 | | | | 3.00 | | | | 2/28/11 | |
| | Institutional | | | 9.08 | | | | 4.18 | | | | 2/28/11 | |
| | | Class IR | | | 8.87 | | | | 4.03 | | | | 2/28/11 | |
| | 3 | | The Standardized Total Returns are average annual total returns as of the most recent calendar quarter-end. They assume reinvestment of all distributions at NAV. These returns reflect a maximum initial sales charge of 5.5% for Class A Shares and the assumed contingent deferred sales charge for Class C Shares (1% if redeemed within 12 months of purchase). Because Institutional and Class IR Shares do not involve a sales charge, such a charge is not applied to their Standardized Total Returns. |
The returns set forth in the tables above represent past performance. Past performance does not guarantee future results. The Fund’s investment return and principal value will fluctuate so that an investor’s shares, when redeemed, may be worth more or less than their original cost. Current performance may be lower or higher than the performance quoted above. Please visit our web site at www.GSAMFUNDS.com to obtain the most recent month-end returns. Performance reflects applicable fee waivers and/or expense limitations in effect during the periods shown. In their absence, performance would be reduced. Returns do not reflect the deduction of taxes that a shareholder would pay on Fund distributions or the redemption of Fund shares.
31
FUND BASICS
| | | | | | | | | | |
| | EXPENSE RATIOS4 | |
| | | | | Net Expense Ratio (Current) | | | Gross Expense Ratio (Before Waivers) | |
| | Class A | | | 1.73 | % | | | 2.12 | % |
| | Class C | | | 2.48 | | | | 2.87 | |
| | Institutional | | | 1.34 | | | | 1.73 | |
| | | Class IR | | | 1.48 | | | | 1.87 | |
| | 4 | | The expense ratios of the Fund, both current (net of applicable fee waivers and/or expense limitations) and before waivers (gross of applicable fee waivers and/or expense limitations) are as set forth above according to the most recent publicly available Prospectus for the Fund and may differ from the expense ratios disclosed in the Financial Highlights in this report. Pursuant to a contractual arrangement, the Fund’s waivers and/or expense limitations will remain in place through at least February 28, 2015, and prior to such date the Investment Adviser may not terminate the arrangements without the approval of the Fund’s Board of Trustees. If these arrangements are discontinued in the future, the expense ratios may change without shareholder approval. |
| | | | | | | | | | |
| | TOP TEN HOLDINGS AS OF 10/31/145 |
| | | Holding | | % of
Net Assets | | | Line of Business | | Country |
| | Samsung Electronics Co. Ltd. | | | 4.7 | % | | Technology Hardware &
Equipment | | South Korea |
| | America Movil SAB de CV Class L ADR | | | 4.4 | | | Telecommunication Services | | Mexico |
| | Grupo Financiero Banorte SAB de CV Class O | | | 2.2 | | | Banks | | Mexico |
| | Cemex SAB de CV ADR | | | 2.1 | | | Materials | | Mexico |
| | Grupo Televisa SAB ADR | | | 1.9 | | | Media | | Mexico |
| | Commercial International Bank Egypt SAE | | | 1.8 | | | Banks | | Egypt |
| | Turkiye Garanti Bankasi AS | | | 1.8 | | | Banks | | Turkey |
| | PT Bank Central Asia Tbk | | | 1.8 | | | Banks | | Indonesia |
| | Commercial International Bank Egypt SAE (Registered) GDR | | | 1.7 | | | Banks | | Egypt |
| | | Nigerian Breweries PLC | | | 1.6 | | | Food, Beverage & Tobacco | | Nigeria |
| | 5 | | The top 10 holdings may not be representative of the Fund’s future investments. |
32
FUND BASICS
|
| FUND VS. BENCHMARK SECTOR ALLOCATIONS6 |
| As of October 31, 2014 |
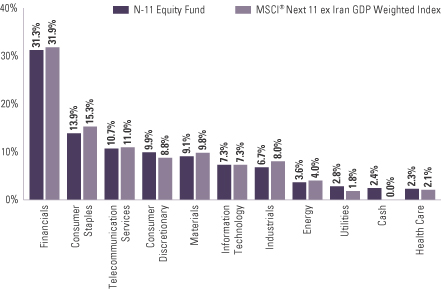
| | 6 | | The Fund is actively managed and, as such, its composition may differ over time. Consequently, the Fund’s overall sector allocations may differ from percentages contained in the graph above. The graph categorizes investments using Global Industry Classification Standard (“GICS”), however, the sector classifications used by the portfolio management team may differ from GICS. The percentage shown for each investment category reflects the value of investments in that category as a percentage of market value. The graph depicts the Fund’s investments but may not represent the Fund’s market exposure due to the exclusion of certain derivatives, if any, as listed in the Additional Investment Information section of the Schedule of Investments. |
33
GOLDMAN SACHS N-11 EQUITY FUND
Performance Summary
October 31, 2014
The following graph shows the value, as of October 31, 2014, of a $10,000 investment made on February 28, 2011 (commencement of operations) in Institutional Shares (at NAV). For comparative purposes, the performance of the Fund’s benchmark, the MSCI® Next 11 ex Iran GDP Weighted Index (Net, Unhedged, USD), is shown. This performance data represents past performance and should not be considered indicative of future performance, which will fluctuate with changes in market conditions. These performance fluctuations will cause an investor’s shares, when redeemed, to be worth more or less than their original cost. Performance reflects applicable fee waivers and/or expense limitations in effect and in their absence, performance would be reduced. Returns do not reflect the deduction of taxes that a shareholder would pay on Fund distributions or the redemption of Fund shares. Performance of Class A, Class C and Class IR Shares will vary from that of Institutional Shares due to differences in class specific fees and any applicable sales charges. In addition to the Investment Adviser’s decisions regarding issuer/industry/country investment selection and allocation, other factors may affect Fund performance. These factors include, but are not limited to, Fund operating fees and expenses, portfolio turnover and subscription and redemption cash flows affecting the Fund.
|
| N-11 Equity Fund’s Lifetime Performance |
Performance of a $10,000 Investment from February 28, 2011 through October 31, 2014.
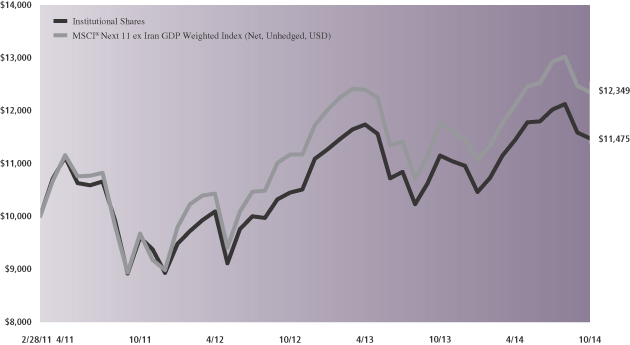
| | | | | | |
| Average Annual Total Return through October 31, 2014 | | | One Year | | | Since Inception |
Class A (Commenced February 28, 2011) | | | | | | |
Excluding sales charges | | | 2.54% | | | 3.42% |
Including sales charges | | | -3.08% | | | 1.85% |
|
Class C (Commenced February 28, 2011) | | | | | | |
Excluding contingent deferred sales charges | | | 1.76% | | | 2.63% |
Including contingent deferred sales charges | | | 0.76% | | | 2.63% |
|
Institutional (Commenced February 28, 2011) | | | 2.88% | | | 3.81% |
|
Class IR (Commenced February 28, 2011) | | | 2.76% | | | 3.66% |
|
34
GOLDMAN SACHS ASIA EQUITY FUND
Schedule of Investments
October 31, 2014
| | | | | | | | |
Shares | | | Description | | Value | |
| | | | | | | | |
| | Common Stocks – 97.8% | |
| | Canada – 0.7% | |
| | 16,882 | | | Canadian Solar, Inc. (Semiconductors & Semiconductor Equipment)* | | $ | 538,536 | |
| | |
| | China – 20.8% | |
| | 9,946 | | | Alibaba Group Holding Ltd. ADR (Software & Services)* | | | 980,676 | |
| | 507,500 | | | Bloomage Biotechnology Corp. Ltd. (Materials) | | | 809,208 | |
| | 3,682,000 | | | China Cinda Asset Management Co. Ltd. Class H (Diversified Financials)* | | | 1,742,638 | |
| | 1,597,500 | | | China Hongqiao Group Ltd. (Materials) | | | 1,231,334 | |
| | 55,000 | | | China Mengniu Dairy Co. Ltd. (Food, Beverage & Tobacco) | | | 242,946 | |
| | 146,000 | | | China Oilfield Services Ltd. Class H (Energy) | | | 305,146 | |
| | 8,743 | | | Ctrip.com International Ltd. ADR (Retailing)* | | | 509,717 | |
| | 64,000 | | | ENN Energy Holdings Ltd. (Utilities) | | | 415,258 | |
| | 18,671 | | | Hollysys Automation Technologies Ltd. (Technology Hardware & Equipment)* | | | 458,000 | |
| | 3,191,635 | | | Industrial & Commercial Bank of China Ltd. Class H (Banks) | | | 2,119,118 | |
| | 554,000 | | | PetroChina Co. Ltd. Class H (Energy) | | | 693,577 | |
| | 948,000 | | | PICC Property & Casualty Co. Ltd. Class H (Insurance) | | | 1,739,047 | |
| | 9,598 | | | Qunar Cayman Islands Ltd. ADR (Retailing)* | | | 258,186 | |
| | 830,000 | | | Shanghai Electric Group Co. Ltd. Class H (Capital Goods) | | | 415,845 | |
| | 177,000 | | | Shanghai Fosun Pharmaceutical Group Co. Ltd. Class H (Pharmaceuticals, Biotechnology & Life Sciences) | | | 637,252 | |
| | 209,000 | | | Shenzhou International Group Holdings Ltd. (Consumer Durables & Apparel) | | | 721,562 | |
| | 150,500 | | | Tencent Holdings Ltd. (Software & Services) | | | 2,418,877 | |
| | 3,152 | | | Vipshop Holdings Ltd. ADR (Retailing)* | | | 722,722 | |
| | | | | | | | |
| | | | | | | 16,421,109 | |
| | |
| | Hong Kong – 15.4% | |
| | 239,236 | | | AIA Group Ltd. (Insurance) | | | 1,335,038 | |
| | 818,000 | | | Brilliance China Automotive Holdings Ltd. (Automobiles & Components) | | | 1,414,539 | |
| | 36,000 | | | Cheung Kong Holdings Ltd. (Real Estate) | | | 639,082 | |
| | 197,500 | | | China Mobile Ltd. (Telecommunication Services) | | | 2,457,397 | |
| | 254,000 | | | Galaxy Entertainment Group Ltd. (Consumer Services) | | | 1,736,826 | |
| | 69,000 | | | Hutchison Whampoa Ltd. (Capital Goods) | | | 874,959 | |
| | |
| | | | | | | | |
| | Common Stocks – (continued) | |
| | Hong Kong – (continued) | | | | |
| | 1,960,000 | | | Peace Mark Holdings Ltd. (Consumer Durables & Apparel)* | | $ | — | |
| | 2,112,000 | | | Sino Biopharmaceutical Ltd. (Pharmaceuticals, Biotechnology & Life Sciences) | | | 2,126,337 | |
| | 109,555 | | | Sun Hung Kai Properties Ltd. (Real Estate) | | | 1,634,682 | |
| | | | | | | | |
| | | | | | | 12,218,860 | |
| | |
| | India – 12.1% | |
| | 15,250 | | | Bajaj Finance Ltd. (Diversified Financials) | | | 697,551 | |
| | 1,333 | | | Bosch Ltd. (Automobiles & Components) | | | 323,497 | |
| | 10,727 | | | Container Corp. Of India Ltd. (Transportation) | | | 237,607 | |
| | 6,089 | | | Gillette India Ltd. (Household & Personal Products) | | | 277,838 | |
| | 4,262 | | | Grasim Industries Ltd. GDR (Materials) | | | 243,445 | |
| | 45,960 | | | HCL Technologies Ltd. (Software & Services) | | | 1,205,453 | |
| | 46,464 | | | IndusInd Bank Ltd. (Banks) | | | 562,976 | |
| | 22,378 | | | Info Edge India Ltd. (Software & Services) | | | 307,533 | |
| | 9,211 | | | Infosys Ltd. (Software & Services) | | | 610,603 | |
| | 9,238 | | | Infosys Ltd. ADR (Software & Services) | | | 617,652 | |
| | 29,969 | | | Just Dial Ltd. (Software & Services) | | | 732,659 | |
| | 87,843 | | | KSK Energy Ventures Ltd. (Utilities)* | | | 91,385 | |
| | 19,081 | | | Lupin Ltd. (Pharmaceuticals, Biotechnology & Life Sciences) | | | 441,384 | |
| | 13,212 | | | Monsanto India Ltd. (Materials) | | | 642,272 | |
| | 23,731 | | | Multi Commodity Exchange of India Ltd. (Diversified Financials) | | | 331,759 | |
| | 42,426 | | | Prestige Estates Projects Ltd. (Real Estate) | | | 155,147 | |
| | 117,422 | | | Sesa Sterlite Ltd. (Materials) | | | 489,956 | |
| | 28,628 | | | Siemens Ltd. (Capital Goods) | | | 406,927 | |
| | 29,168 | | | Sobha Developers Ltd. (Real Estate) | | | 205,069 | |
| | 33,044 | | | Thermax Ltd. (Capital Goods) | | | 481,075 | |
| | 77,487 | | | Titan Co. Ltd. (Consumer Durables & Apparel) | | | 510,014 | |
| | | | | | | | |
| | | | | | | 9,571,802 | |
| | |
| | Indonesia – 3.3% | |
| | 538,400 | | | PT Bank Rakyat Indonesia (Persero) Tbk (Banks) | | | 493,388 | |
| | 123,400 | | | PT Gudang Garam Tbk (Food, Beverage & Tobacco) | | | 590,526 | |
| | 2,346,100 | | | PT Kalbe Farma Tbk (Pharmaceuticals, Biotechnology & Life Sciences) | | | 331,252 | |
| | 318,600 | | | PT Matahari Department Store Tbk (Retailing) | | | 385,752 | |
| | |
| | |
| The accompanying notes are an integral part of these financial statements. | | 35 |
GOLDMAN SACHS ASIA EQUITY FUND
Schedule of Investments (continued)
October 31, 2014
| | | | | | | | |
Shares | | | Description | | Value | |
| | | | | | | | |
| | Common Stocks – (continued) | |
| | Indonesia – (continued) | | | | |
| | 2,463,500 | | | PT Media Nusantara Citra Tbk (Media) | | $ | 571,113 | |
| | 1,021,300 | | | PT Wijaya Karya Persero Tbk (Capital Goods) | | | 241,822 | |
| | | | | | | | |
| | | | | | | 2,613,853 | |
| | |
| | Malaysia – 2.0% | |
| | 225,200 | | | Gamuda Bhd (Capital Goods) | | | 350,912 | |
| | 47,740 | | | Public Bank Bhd (Banks) | | | 269,089 | |
| | 331,100 | | | SapuraKencana Petroleum Bhd (Energy) | | | 343,238 | |
| | 983,000 | | | Tune Ins Holdings Bhd (Insurance) | | | 648,756 | |
| | | | | | | | |
| | | | | | | 1,611,995 | |
| | |
| | Philippines – 3.5% | |
| | 4,066,200 | | | Lafarge Republic, Inc. (Materials) | | | 860,811 | |
| | 10,998,000 | | | Megaworld Corp. (Real Estate) | | | 1,215,396 | |
| | 174,870 | | | Universal Robina Corp. (Food, Beverage & Tobacco) | | | 724,349 | |
| | | | | | | | |
| | | | | | | 2,800,556 | |
| | |
| | Singapore – 3.8% | |
| | 95,230 | | | DBS Group Holdings Ltd. (Banks) | | | 1,369,924 | |
| | 12,094,000 | | | SIIC Environment Holdings Ltd. (Utilities)* | | | 1,592,827 | |
| | | | | | | | |
| | | | | | | 2,962,751 | |
| | |
| | South Korea – 19.5% | |
| | 3,065 | | | Chong Kun Dang Pharmaceutical Corp. (Pharmaceuticals, Biotechnology & Life Sciences) | | | 204,042 | |
| | 6,391 | | | CJ CheilJedang Corp. (Food, Beverage & Tobacco) | | | 2,333,525 | |
| | 3,601 | | | CJ Korea Express Co. Ltd. (Transportation)* | | | 650,395 | |
| | 24,755 | | | Grand Korea Leisure Co. Ltd. (Consumer Services) | | | 886,460 | |
| | 34,012 | | | Hana Financial Group, Inc. (Banks) | | | 1,177,831 | |
| | 46,717 | | | Hanjin Kal Corp. (Transportation)* | | | 1,158,000 | |
| | 26,810 | | | Kia Motors Corp. (Automobiles & Components) | | | 1,302,227 | |
| | 8,321 | | | Kolon Industries, Inc. (Materials) | | | 424,330 | |
| | 7,999 | | | KONA I Co. Ltd. (Technology Hardware & Equipment) | | | 326,565 | |
| | 7,126 | | | Korean Air Lines Co. Ltd. (Transportation)* | | | 252,958 | |
| | 5,787 | | | KT Skylife Co. Ltd. (Media) | | | 105,227 | |
| | 82,374 | | | LiHOM-CUCHEN Co. Ltd. (Consumer Durables & Apparel)* | | | 894,576 | |
| | 781 | | | NAVER Corp. (Software & Services) | | | 552,653 | |
| | 11,219 | | | OCI Materials Co. Ltd. (Materials) | | | 534,131 | |
| | 20,896 | | | Samchuly Bicycle Co. Ltd. (Consumer Durables & Apparel) | | | 433,816 | |
| | |
| | | | | | | | |
| | Common Stocks – (continued) | |
| | South Korea – (continued) | | | | |
| | 5,479 | | | Samsung C&T Corp. (Capital Goods) | | $ | 370,638 | |
| | 1,341 | | | Samsung Electronics Co. Ltd. (Technology Hardware & Equipment) | | | 1,563,797 | |
| | 1,577 | | | Samsung Fire & Marine Insurance Co. Ltd. (Insurance) | | | 424,623 | |
| | 41,196 | | | SK Hynix, Inc. (Semiconductors & Semiconductor Equipment)* | | | 1,837,106 | |
| | | | | | | | |
| | | | | | | 15,432,900 | |
| | |
| | Taiwan – 12.1% | |
| | 437,000 | | | Chipbond Technology Corp. (Semiconductors & Semiconductor Equipment) | | | 805,777 | |
| | 58,120 | | | Eclat Textile Co. Ltd. (Consumer Durables & Apparel) | | | 554,418 | |
| | 17,000 | | | Hermes Microvision, Inc. (Semiconductors & Semiconductor Equipment) | | | 799,413 | |
| | 226,912 | | | Hon Hai Precision Industry Co. Ltd. (Technology Hardware & Equipment) | | | 718,176 | |
| | 89,000 | | | MediaTek, Inc. (Semiconductors & Semiconductor Equipment) | | | 1,271,183 | |
| | 36,800 | | | Merida Industry Co. Ltd. (Consumer Durables & Apparel) | | | 254,201 | |
| | 51,617 | | | PChome Online, Inc. (Software & Services) | | | 523,710 | |
| | 38,000 | | | Poya Co. Ltd. (Retailing) | | | 256,145 | |
| | 169,752 | | | Silergy Corp. (Semiconductors & Semiconductor Equipment) | | | 1,177,284 | |
| | 131,202 | | | Superalloy Industrial Co. Ltd. (Automobiles & Components) | | | 379,627 | |
| | 661,338 | | | Taiwan Semiconductor Manufacturing Co. Ltd. (Semiconductors & Semiconductor Equipment) | | | 2,866,816 | |
| | | | | | | | |
| | | | | | | 9,606,750 | |
| | |
| | Thailand – 4.1% | |
| | 170,900 | | | Airports of Thailand PCL (Transportation) | | | 1,269,888 | |
| | 794,200 | | | Bangkok Airways Co. Ltd. (Transportation)* | | | 609,610 | |
| | 459,400 | | | CP ALL PCL (Food & Staples Retailing) | | | 641,763 | |
| | 128,800 | | | The Siam Commercial Bank PCL (Banks) | | | 702,351 | |
| | | | | | | | |
| | | | | | | 3,223,612 | |
| | |
| | |
| 36 | | The accompanying notes are an integral part of these financial statements. |
GOLDMAN SACHS ASIA EQUITY FUND
| | | | | | | | |
Shares | | | Description | | Value | |
| | | | | | | | |
| | Common Stocks – (continued) | |
| | United States – 0.5% | |
| | 124,800 | | | Samsonite International SA (Consumer Durables & Apparel) | | $ | 414,676 | |
| | |
| | TOTAL INVESTMENTS – 97.8% | | | | |
| | (Cost $76,080,246) | | $ | 77,417,400 | |
| | |
| OTHER ASSETS IN EXCESS OF
LIABILITIES – 2.2% | | | 1,710,498 | |
| | |
| | NET ASSETS – 100.0% | | $ | 79,127,898 | |
| | |
| | |
| The percentage shown for each investment category reflects the value of investments in that category as a percentage of net assets. |
* | | Non-income producing security. |
| | |
|
Investment Abbreviations: |
ADR | | —American Depositary Receipt |
GDR | | —Global Depositary Receipt |
|
| | |
| The accompanying notes are an integral part of these financial statements. | | 37 |
GOLDMAN SACHS BRIC FUND
Schedule of Investments
October 31, 2014
| | | | | | | | |
Shares | | | Description | | Value | |
| | Common Stocks – 88.4% | |
| | Brazil – 16.4% | |
| | 739,432 | | | AMBEV SA (Food, Beverage & Tobacco) | | $ | 4,895,331 | |
| | 600,407 | | | BB Seguridade Participacoes SA (Insurance) | | | 8,009,909 | |
| | 202,528 | | | CETIP SA - Mercados Organizados (Diversified Financials) | | | 2,566,439 | |
| | 1,231,390 | | | Odontoprev SA (Health Care Equipment & Services) | | | 4,447,694 | |
| | 237,939 | | | Petroleo Brasileiro SA ADR (Energy) | | | 2,783,886 | |
| | 99,348 | | | Qualicorp SA (Health Care Equipment & Services)* | | | 1,010,425 | |
| | 98,239 | | | Totvs SA (Software & Services) | | | 1,431,860 | |
| | 77,000 | | | Tractebel Energia SA (Utilities) | | | 1,048,771 | |
| | | | | | | | |
| | | | | | | 26,194,315 | |
| | |
| | China – 33.3% | |
| | 322,500 | | | AAC Technologies Holdings, Inc. (Technology Hardware & Equipment) | | | 1,934,608 | |
| | 10,008,800 | | | Agricultural Bank of China Ltd. Class H (Banks) | | | 4,651,022 | |
| | 21,174 | | | Alibaba Group Holding Ltd. ADR (Software & Services)* | | | 2,087,756 | |
| | 4,389,360 | | | China Construction Bank Corp. Class H (Banks) | | | 3,274,898 | |
| | 866,000 | | | China Mengniu Dairy Co. Ltd. (Food, Beverage & Tobacco) | | | 3,825,298 | |
| | 396,000 | | | China Pacific Insurance Group Co. Ltd. Class H (Insurance) | | | 1,481,895 | |
| | 2,280,400 | | | China Petroleum & Chemical Corp. Class H (Energy) | | | 1,977,590 | |
| | 692,800 | | | China Vanke Co. Ltd. Class H (Real Estate)* | | | 1,290,678 | |
| | 14,726 | | | Ctrip.com International Ltd. ADR (Retailing)* | | | 858,526 | |
| | 342,000 | | | Haitian International Holdings Ltd. (Capital Goods) | | | 733,617 | |
| | 307,000 | | | Hengan International Group Co. Ltd. (Household & Personal Products) | | | 3,236,013 | |
| | 163,586 | | | Hollysys Automation Technologies Ltd. (Technology Hardware & Equipment)* | | | 4,012,765 | |
| | 3,883,050 | | | Industrial & Commercial Bank of China Ltd. Class H (Banks) | | | 2,578,190 | |
| | 1,968,000 | | | PetroChina Co. Ltd. Class H (Energy) | | | 2,463,826 | |
| | 499,500 | | | Shanghai Fosun Pharmaceutical Group Co. Ltd. Class H (Pharmaceuticals, Biotechnology & Life Sciences) | | | 1,798,347 | |
| | 429,000 | | | Shenzhou International Group Holdings Ltd. (Consumer Durables & Apparel) | | | 1,481,100 | |
| | 25,091 | | | TAL Education Group ADR (Consumer Services)* | | | 796,890 | |
| | |
| | Common Stocks – (continued) | |
| | China – (continued) | |
| | 823,900 | | | Tencent Holdings Ltd. (Software & Services) | | $ | 13,241,946 | |
| | 6,262 | | | Vipshop Holdings Ltd. ADR (Retailing)* | | | 1,435,814 | |
| | | | | | | | |
| | | | | | | 53,160,779 | |
| | |
| | Cyprus – 0.4% | |
| | 82,645 | | | Globaltrans Investment PLC GDR (Transportation) | | | 612,400 | |
| | |
| | Hong Kong – 3.9% | |
| | 342,000 | | | Galaxy Entertainment Group Ltd. (Consumer Services) | | | 2,338,561 | |
| | 3,920,000 | | | Sino Biopharmaceutical Ltd. (Pharmaceuticals, Biotechnology & Life Sciences) | | | 3,946,610 | |
| | | | | | | | |
| | | | | | | 6,285,171 | |
| | �� |
| | India – 22.1% | |
| | 192,409 | | | Axis Bank Ltd. (Banks) | | | 1,392,919 | |
| | 77,777 | | | Bajaj Finance Ltd. (Diversified Financials) | | | 3,557,601 | |
| | 13,529 | | | Bosch Ltd. (Automobiles & Components) | | | 3,283,261 | |
| | 26,336 | | | Container Corp. Of India Ltd. (Transportation) | | | 583,352 | |
| | 49,548 | | | CRISIL Ltd. (Diversified Financials) | | | 1,472,752 | |
| | 23,839 | | | Gillette India Ltd. (Household & Personal Products) | | | 1,087,761 | |
| | 28,112 | | | Grasim Industries Ltd. GDR (Materials) | | | 1,605,758 | |
| | 78,636 | | | HCL Technologies Ltd. (Software & Services) | | | 2,062,490 | |
| | 72,877 | | | Info Edge India Ltd. (Software & Services) | | | 1,001,524 | |
| | 29,627 | | | Infosys Ltd. (Software & Services) | | | 1,963,992 | |
| | 25,262 | | | Infosys Ltd. ADR (Software & Services) | | | 1,689,017 | |
| | 50,660 | | | Just Dial Ltd. (Software & Services) | | | 1,238,497 | |
| | 662,995 | | | KSK Energy Ventures Ltd. (Utilities)* | | | 689,724 | |
| | 540,992 | | | Prestige Estates Projects Ltd. (Real Estate) | | | 1,978,346 | |
| | 236,099 | | | Sesa Sterlite Ltd. (Materials) | | | 985,149 | |
| | 88,316 | | | Siemens Ltd. (Capital Goods) | | | 1,255,350 | |
| | 227,476 | | | Sobha Developers Ltd. (Real Estate) | | | 1,599,295 | |
| | 59,403 | | | Tata Consultancy Services Ltd. (Software & Services) | | | 2,527,656 | |
| | 234,277 | | | Thermax Ltd. (Capital Goods) | | | 3,410,753 | |
| | 307,035 | | | Titan Co. Ltd. (Consumer Durables & Apparel) | | | 2,020,881 | |
| | | | | | | | |
| | | | | | | 35,406,078 | |
| | |
| | Russia – 12.3% | |
| | 1,138,707 | | | Alrosa AO (Materials) | | | 1,018,858 | |
| | 456,721 | | | OAO Gazprom ADR (Energy) | | | 3,026,148 | |
| | |
| | |
| 38 | | The accompanying notes are an integral part of these financial statements. |
GOLDMAN SACHS BRIC FUND
| | | | | | | | |
Shares | | | Description | | Value | |
| | Common Stocks – (continued) | |
| | Russia – (continued) | |
| | 87,874 | | | OAO Lukoil ADR (Energy) | | $ | 4,307,528 | |
| | 1,663,376 | | | OAO Moscow Exchange MICEX-RTS (Diversified Financials) | | | 2,245,094 | |
| | 164,257 | | | OAO Rosneft GDR (Energy) | | | 914,191 | |
| | 17,420 | | | OJSC Magnit (Food & Staples Retailing)* | | | 4,818,833 | |
| | 1,854,947 | | | Sberbank of Russia (Banks)* | | | 3,287,628 | |
| | | | | | | | |
| | | | | | | 19,618,280 | |
| | |
| | TOTAL COMMON STOCKS | |
| | (Cost $129,560,894) | | $ | 141,277,023 | |
| | |
| | | | | | | | |
| | Preferred Stocks – 5.9% | |
| | Brazil – 5.9% | |
| | 364,817 | | | Banco Bradesco SA (Banks) | | $ | 5,494,560 | |
| | 56,892 | | | Cia Brasileira de Distribuicao Grupo Pao de Acucar (Food & Staples Retailing) | | | 2,385,520 | |
| | 99,075 | | | Itau Unibanco Holding SA (Banks) | | | 1,469,392 | |
| | |
| | TOTAL PREFERRED STOCKS | |
| | (Cost $9,585,237) | | $ | 9,349,472 | |
| | |
| | | | | | | | |
| | Exchange Traded Fund – 5.5% | |
| | United States – 5.5% | |
| | 221,467 | | | iShares China Large-Cap ETF | | $ | 8,843,177 | |
| | (Cost $8,802,740) | | | | |
| | |
| | TOTAL INVESTMENTS – 99.8% | |
| | (Cost $147,948,871) | | $ | 159,469,672 | |
| | |
| OTHER ASSETS IN EXCESS OF
LIABILITIES – 0.2% | | | 341,025 | |
| | |
| | NET ASSETS – 100.0% | | $ | 159,810,697 | |
| | |
| | |
| The percentage shown for each investment category reflects the value of investments in that category as a percentage of net assets. |
* | | Non-income producing security. |
| | |
|
Investment Abbreviations: |
ADR | | —American Depositary Receipt |
GDR | | —Global Depositary Receipt |
|
| | |
| The accompanying notes are an integral part of these financial statements. | | 39 |
GOLDMAN SACHS EMERGING MARKETS EQUITY FUND
Schedule of Investments
October 31, 2014
| | | | | | | | |
Shares | | | Description | | Value | |
| | Common Stocks – 92.4% | |
| | Brazil – 7.2% | |
| | 479,441 | | | BB Seguridade Participacoes SA (Insurance) | | $ | 6,396,125 | |
| | 230,938 | | | CETIP SA-Mercados Organizados (Diversified Financials) | | | 2,926,451 | |
| | 126,681 | | | Ez Tec Empreendimentos e Participacoes SA (Consumer Durables & Apparel) | | | 1,083,836 | |
| | 292,321 | | | LPS Brasil Consultoria de Imoveis SA (Real Estate) | | | 1,002,756 | |
| | 255,600 | | | Mahle-Metal Leve SA Industria e Comercio (Automobiles & Components) | | | 2,413,754 | |
| | 673,009 | | | Odontoprev SA (Health Care Equipment & Services) | | | 2,430,861 | |
| | 435,154 | | | Qualicorp SA (Health Care Equipment & Services)* | | | 4,425,762 | |
| | 216,113 | | | Totvs SA (Software & Services) | | | 3,149,906 | |
| | 158,257 | | | Tractebel Energia SA (Utilities) | | | 2,155,524 | |
| | | | | | | | |
| | | | | | | 25,984,975 | |
| | |
| | Chile – 0.7% | |
| | 32,552 | | | Banco de Chile ADR (Banks) | | | 2,408,848 | |
| | |
| | China – 12.1% | |
| | 309,500 | | | AAC Technologies Holdings, Inc. (Technology Hardware & Equipment) | | | 1,856,624 | |
| | 5,829,000 | | | Agricultural Bank of China Ltd. Class H (Banks) | | | 2,708,697 | |
| | 46,038 | | | Alibaba Group Holding Ltd. ADR (Software & Services)* | | | 4,539,347 | |
| | 575,000 | | | Bloomage Biotechnology Corp. Ltd. (Materials) | | | 916,837 | |
| | 628,000 | | | China Mengniu Dairy Co. Ltd. (Food, Beverage & Tobacco) | | | 2,774,004 | |
| | 1,086,400 | | | China Vanke Co. Ltd. Class H (Real Estate)* | | | 2,023,950 | |
| | 24,611 | | | Ctrip.com International Ltd. ADR (Retailing)* | | | 1,434,821 | |
| | 773,000 | | | Haitian International Holdings Ltd. (Capital Goods) | | | 1,658,145 | |
| | 231,000 | | | Hengan International Group Co. Ltd. (Household & Personal Products) | | | 2,434,915 | |
| | 158,063 | | | Hollysys Automation Technologies Ltd. (Technology Hardware & Equipment)* | | | 3,877,285 | |
| | 241,500 | | | Livzon Pharmaceutical Group, Inc. Class H (Pharmaceuticals, Biotechnology & Life Sciences) | | | 1,809,759 | |
| | 1,368,000 | | | PetroChina Co. Ltd. Class H (Energy) | | | 1,712,660 | |
| | 598,500 | | | Shanghai Fosun Pharmaceutical Group Co. Ltd. Class H (Pharmaceuticals, Biotechnology & Life Sciences) | | | 2,154,776 | |
| | 50,130 | | | TAL Education Group ADR (Consumer Services)* | | | 1,592,129 | |
| | 663,700 | | | Tencent Holdings Ltd. (Software & Services) | | | 10,667,167 | |
| | |
| | Common Stocks – (continued) | |
| | China – (continued) | |
| | 6,459 | | | Vipshop Holdings Ltd. ADR (Retailing)* | | $ | 1,480,984 | |
| | | | | | | | |
| | | | | | | 43,642,100 | |
| | |
| | Colombia – 1.2% | |
| | 63,329 | | | Banco de Bogota SA (Banks) | | | 2,093,012 | |
| | 1,169,519 | | | Grupo Aval Acciones y Valores (Banks) | | | 784,416 | |
| | 100,000 | | | Grupo Aval Acciones y Valores ADR (Banks) | | | 1,348,000 | |
| | | | | | | | |
| | | | | | | 4,225,428 | |
| | |
| | Cyprus – 0.2% | |
| | 84,136 | | | Globaltrans Investment PLC GDR (Transportation) | | | 623,448 | |
| | |
| | Georgia – 1.5% | |
| | 66,513 | | | Bank of Georgia Holdings PLC (Banks) | | | 2,727,872 | |
| | 9,227 | | | TBC Bank JSC GDR (Banks)* | | | 136,449 | |
| | 175,110 | | | TBC Bank JSC GDR (Banks)*(a) | | | 2,589,531 | |
| | | | | | | | |
| | | | | | | 5,453,852 | |
| | |
| | Hong Kong – 3.5% | |
| | 2,952,000 | | | Dawnrays Pharmaceutical Holdings Ltd. (Pharmaceuticals, Biotechnology & Life Sciences) | | | 2,931,007 | |
| | 619,000 | | | Galaxy Entertainment Group Ltd. (Consumer Services) | | | 4,232,659 | |
| | 4,144,000 | | | Sino Biopharmaceutical Ltd. (Pharmaceuticals, Biotechnology & Life Sciences) | | | 4,172,131 | |
| | 808,000 | | | Vinda International Holdings Ltd. (Household & Personal Products) | | | 1,225,558 | |
| | | | | | | | |
| | | | | | | 12,561,355 | |
| | |
| | India – 13.8% | |
| | 72,364 | | | Bajaj Finance Ltd. (Diversified Financials) | | | 3,310,005 | |
| | 86,623 | | | Balkrishna Industries Ltd. (Automobiles & Components) | | | 1,087,136 | |
| | 12,269 | | | Bosch Ltd. (Automobiles & Components) | | | 2,977,480 | |
| | 54,368 | | | Container Corp. Of India Ltd. (Transportation) | | | 1,204,272 | |
| | 38,948 | | | Gillette India Ltd. (Household & Personal Products) | | | 1,777,177 | |
| | 56,094 | | | Grasim Industries Ltd. GDR (Materials) | | | 3,204,090 | |
| | 103,257 | | | HCL Technologies Ltd. (Software & Services) | | | 2,708,257 | |
| | 214,349 | | | IndusInd Bank Ltd. (Banks) | | | 2,597,138 | |
| | 103,639 | | | Info Edge India Ltd. (Software & Services) | | | 1,424,275 | |
| | 42,118 | | | Infosys Ltd. (Software & Services) | | | 2,792,028 | |
| | |
| | |
| 40 | | The accompanying notes are an integral part of these financial statements. |
GOLDMAN SACHS EMERGING MARKETS EQUITY FUND
| | | | | | | | |
Shares | | | Description | | Value | |
| | Common Stocks – (continued) | |
| | India – (continued) | |
| | 33,061 | | | Infosys Ltd. ADR (Software & Services) | | $ | 2,210,458 | |
| | 895,672 | | | KSK Energy Ventures Ltd. (Utilities)* | | | 931,782 | |
| | 113,809 | | | Lupin Ltd. (Pharmaceuticals, Biotechnology & Life Sciences) | | | 2,632,641 | |
| | 51,248 | | | Monsanto India Ltd. (Materials) | | | 2,491,306 | |
| | 108,636 | | | Multi Commodity Exchange of India Ltd. (Diversified Financials) | | | 1,518,728 | |
| | 678,086 | | | Prestige Estates Projects Ltd. (Real Estate) | | | 2,479,683 | |
| | 287,757 | | | Sesa Sterlite Ltd. (Materials) | | | 1,200,697 | |
| | 108,905 | | | Siemens Ltd. (Capital Goods) | | | 1,548,008 | |
| | 352,449 | | | Sobha Developers Ltd. (Real Estate) | | | 2,477,932 | |
| | 78,129 | | | Tata Consultancy Services Ltd. (Software & Services) | | | 3,324,465 | |
| | 221,763 | | | Thermax Ltd. (Capital Goods) | | | 3,228,566 | |
| | 402,695 | | | Titan Co. Ltd. (Consumer Durables & Apparel) | | | 2,650,508 | |
| | | | | | | | |
| | | | | | | 49,776,632 | |
| | |
| | Indonesia – 4.0% | |
| | 3,530,900 | | | PT Bank Central Asia Tbk (Banks) | | | 3,811,751 | |
| | 2,125,800 | | | PT Bank Rakyat Indonesia (Persero) Tbk (Banks) | | | 1,948,075 | |
| | 271,800 | | | PT Gudang Garam Tbk (Food, Beverage & Tobacco) | | | 1,300,688 | |
| | 9,047,500 | | | PT Kalbe Farma Tbk (Pharmaceuticals, Biotechnology & Life Sciences) | | | 1,277,441 | |
| | 5,761,500 | | | PT Media Nusantara Citra Tbk (Media) | | | 1,335,688 | |
| | 19,049,700 | | | PT Summarecon Agung Tbk (Real Estate) | | | 1,985,829 | |
| | 4,849,000 | | | PT Surya Citra Media Tbk (Media) | | | 1,357,329 | |
| | 5,901,000 | | | PT Wijaya Karya Persero Tbk (Capital Goods) | | | 1,397,231 | |
| | | | | | | | |
| | | | | | | 14,414,032 | |
| | |
| | Jersey – 0.7% | |
| | 937,090 | | | Petra Diamonds Ltd. (Materials)* | | | 2,488,444 | |
| | |
| | Malaysia – 2.2% | |
| | 1,239,800 | | | 7-Eleven Malaysia Holdings Bhd (Food & Staples Retailing)* | | | 629,397 | |
| | 1,870,700 | | | Bursa Malaysia Bhd (Diversified Financials) | | | 4,603,833 | |
| | 3,882,600 | | | Tune Ins Holdings Bhd (Insurance) | | | 2,562,421 | |
| | | | | | | | |
| | | | | | | 7,795,651 | |
| | |
| | Mexico – 5.0% | |
| | 1,100,485 | | | Alsea SAB de CV (Consumer Services)* | | | 3,437,215 | |
| | 1,974,610 | | | Bolsa Mexicana de Valores SAB de CV (Diversified Financials) | | | 4,145,343 | |
| | 2,162,122 | | | Cemex SAB de CV (Materials)* | | | 2,663,667 | |
| | |
| | Common Stocks – (continued) | |
| | Mexico – (continued) | |
| | 1,190,820 | | | Compartamos SAB de CV (Diversified Financials) | | $ | 2,652,015 | |
| | 408,600 | | | Infraestructura Energetica Nova SAB de CV (Utilities) | | | 2,500,831 | |
| | 690,468 | | | Mexichem SAB de CV (Materials) | | | 2,824,682 | |
| | | | | | | | |
| | | | | | | 18,223,753 | |
| | |
| | Peru – 2.6% | |
| | 1,632,406 | | | BBVA Banco Continental SA (Banks) | | | 2,669,484 | |
| | 32,500 | | | Credicorp Ltd. (Banks) | | | 5,232,500 | |
| | 50,866 | | | Intercorp Financial Services, Inc. (Banks)* | | | 1,561,586 | |
| | | | | | | | |
| | | | | | | 9,463,570 | |
| | |
| | Philippines – 2.0% | |
| | 5,711,600 | | | Emperador, Inc. (Food, Beverage & Tobacco) | | | 1,353,058 | |
| | 2,915,000 | | | Lafarge Republic, Inc. (Materials) | | | 617,103 | |
| | 21,601,000 | | | Megaworld Corp. (Real Estate) | | | 2,387,140 | |
| | 696,240 | | | Universal Robina Corp. (Food, Beverage & Tobacco) | | | 2,883,973 | |
| | | | | | | | |
| | | | | | | 7,241,274 | |
| | |
| | Poland – 0.8% | |
| | 33,766 | | | Bank Pekao SA (Banks) | | | 1,767,259 | |
| | 38,352 | | | Lubelski Wegiel Bogdanka SA (Energy) | | | 1,273,088 | |
| | | | | | | | |
| | | | | | | 3,040,347 | |
| | |
| | Russia – 4.8% | |
| | 152,850 | | | OAO Gazprom ADR (Energy) | | | 1,012,756 | |
| | 92,558 | | | OAO Lukoil ADR (Energy) | | | 4,537,135 | |
| | 2,889,361 | | | OAO Moscow Exchange MICEX-RTS (Diversified Financials) | | | 3,899,831 | |
| | 16,556 | | | OJSC Magnit (Food & Staples Retailing)* | | | 4,579,827 | |
| | 447,997 | | | Sberbank of Russia ADR (Banks) | | | 3,411,474 | |
| | | | | | | | |
| | | | | | | 17,441,023 | |
| | |
| | South Africa – 4.3% | |
| | 4,061,246 | | | Alexander Forbes Group Holdings Ltd. (Diversified Financials)* | | | 3,166,592 | |
| | 298,955 | | | JSE Ltd. (Diversified Financials) | | | 2,911,015 | |
| | 508,891 | | | Metair Investments Ltd. (Automobiles & Components) | | | 1,730,176 | |
| | 41,132 | | | Naspers Ltd. Class N (Media) | | | 5,130,359 | |
| | 144,361 | | | Santam Ltd. (Insurance) | | | 2,673,946 | |
| | | | | | | | |
| | | | | | | 15,612,088 | |
| | |
| | South Korea – 10.2% | |
| | 6,387 | | | CJ CheilJedang Corp. (Food, Beverage & Tobacco) | | | 2,332,065 | |
| | 110,946 | | | Grand Korea Leisure Co. Ltd. (Consumer Services) | | | 3,972,903 | |
| | 93,360 | | | Hana Financial Group, Inc. (Banks) | | | 3,233,044 | |
| | |
| | |
| The accompanying notes are an integral part of these financial statements. | | 41 |
GOLDMAN SACHS EMERGING MARKETS EQUITY FUND
Schedule of Investments (continued)
October 31, 2014
| | | | | | | | |
Shares | | | Description | | Value | |
| | Common Stocks – (continued) | |
| | South Korea – (continued) | |
| | 199,110 | | | Hanjin Kal Corp. (Transportation)* | | $ | 4,935,449 | |
| | 21,812 | | | Hanssem Co. Ltd. (Consumer Durables & Apparel) | | | 2,599,911 | |
| | 87,406 | | | Kia Motors Corp. (Automobiles & Components) | | | 4,245,523 | |
| | 20,217 | | | Kolon Industries, Inc. (Materials) | | | 1,030,968 | |
| | 268,623 | | | LiHOM-CUCHEN Co. Ltd. (Consumer Durables & Apparel)* | | | 2,917,229 | |
| | 95,814 | | | Samchuly Bicycle Co. Ltd. (Consumer Durables & Apparel) | | | 1,989,169 | |
| | 3,411 | | | Samsung Electronics Co. Ltd. (Technology Hardware & Equipment) | | | 3,977,712 | |
| | 121,247 | | | SK Hynix, Inc. (Semiconductors & Semiconductor Equipment)* | | | 5,406,924 | |
| | | | | | | | |
| | | | | | | 36,640,897 | |
| | |
| | Taiwan – 9.6% | |
| | 1,007,000 | | | Chipbond Technology Corp. (Semiconductors & Semiconductor Equipment) | | | 1,856,791 | |
| | 85,000 | | | Hermes Microvision, Inc. (Semiconductors & Semiconductor Equipment) | | | 3,997,064 | |
| | 1,010,198 | | | Hon Hai Precision Industry Co. Ltd. (Technology Hardware & Equipment) | | | 3,197,276 | |
| | 133,000 | | | MediaTek, Inc. (Semiconductors & Semiconductor Equipment) | | | 1,899,634 | |
| | 276,150 | | | Merida Industry Co. Ltd. (Consumer Durables & Apparel) | | | 1,907,543 | |
| | 359,956 | | | PChome Online, Inc. (Software & Services) | | | 3,652,141 | |
| | 170,000 | | | Poya Co. Ltd. (Retailing) | | | 1,145,910 | |
| | 203,000 | | | President Chain Store Corp. (Food & Staples Retailing) | | | 1,520,716 | |
| | 510,497 | | | Silergy Corp. (Semiconductors & Semiconductor Equipment) | | | 3,540,460 | |
| | 614,383 | | | Superalloy Industrial Co. Ltd. (Automobiles & Components) | | | 1,777,687 | |
| | 2,326,883 | | | Taiwan Semiconductor Manufacturing Co. Ltd. (Semiconductors & Semiconductor Equipment) | | | 10,086,741 | |
| | | | | | | | |
| | | | | | | 34,581,963 | |
| | |
| | Thailand – 3.6% | |
| | 864,400 | | | Airports of Thailand PCL (Transportation) | | | 6,423,000 | |
| | 3,622,600 | | | Bangkok Airways Co. Ltd. (Transportation)* | | | 2,780,626 | |
| | 530,200 | | | Kasikornbank PCL NVDR (Banks) | | | 3,841,290 | |
| | | | | | | | |
| | | | | | | 13,044,916 | |
| | |
| | Turkey – 2.4% | |
| | 151,006 | | | BIM Birlesik Magazalar AS (Food & Staples Retailing) | | | 3,449,622 | |
| | 229,561 | | | TAV Havalimanlari Holding AS (Transportation) | | | 1,925,801 | |
| | |
| | Common Stocks – (continued) | |
| | Turkey – (continued) | |
| | 457,619 | | | Ulker Biskuvi Sanayi AS (Food, Beverage & Tobacco) | | $ | 3,373,310 | |
| | | | | | | | |
| | | | | | | 8,748,733 | |
| | |
| | TOTAL COMMON STOCKS | | | | |
| | (Cost $301,939,512) | | $ | 333,413,329 | |
| | |
| | | | | | | | |
| | Preferred Stocks – 3.1% | |
| | Brazil – 2.5% | |
| | 347,720 | | | Banco Bradesco SA (Banks) | | $ | 5,237,060 | |
| | 87,221 | | | Cia Brasileira de Distribuicao Grupo Pao de Acucar (Food & Staples Retailing) | | | 3,657,235 | |
| | | | | | | | |
| | | | | | | 8,894,295 | |
| | |
| | Colombia – 0.6% | |
| | 3,508,557 | | | Grupo Aval Acciones y Valores (Banks) | | | 2,378,827 | |
| | |
| | TOTAL PREFERRED STOCKS | | | | |
| | (Cost $11,537,141) | | $ | 11,273,122 | |
| | |
| | | | | | | | |
| | Exchange Traded Funds – 4.4% | |
| | United States – 4.4% | |
| | 172,903 | | | iShares China Large-Cap ETF | | $ | 6,904,017 | |
| | 154,050 | | | iShares MSCI South Korea Capped Fund | | | 9,031,951 | |
| | |
| | TOTAL EXCHANGE TRADED FUNDS | | | | |
| | (Cost $16,064,812) | | | 15,935,968 | |
| | |
| | TOTAL INVESTMENTS – 99.9% | |
| | (Cost $329,541,465) | | $ | 360,622,419 | |
| | |
| OTHER ASSETS IN EXCESS OF
LIABILITIES – 0.1% | | | 425,403 | |
| | |
| | NET ASSETS – 100.0% | | $ | 361,047,822 | |
| | |
| | |
| The percentage shown for each investment category reflects the value of investments in that category as a percentage of net assets. |
* | | Non-income producing security. |
(a) | | Exempt from registration under Rule 144A of the Securities Act of 1933. Under procedures approved by the Board of Trustees, such securities have been determined to be liquid by the Investment Adviser and may be resold, normally to qualified institutional buyers in transactions exempt from registration. Total market value of Rule 144A securities amounts to $2,589,531, which represents approximately 0.7% of net assets as of October 31, 2014. |
| | |
|
Investment Abbreviations: |
ADR | | —American Depositary Receipt |
GDR | | —Global Depositary Receipt |
NVDR | | —Non-Voting Depositary Receipt |
|
| | |
| 42 | | The accompanying notes are an integral part of these financial statements. |
GOLDMAN SACHS N-11 EQUITY FUND
Schedule of Investments
October 31, 2014
| | | | | | | | |
Shares | | | Description | | Value | |
| | Common Stocks – 96.9% | |
| | Bangladesh – 3.0% | |
| | 627,800 | | | GrameenPhone Ltd. (Telecommunication Services) | | $ | 3,038,200 | |
| | 3,969,754 | | | Islami Bank Bangladesh Ltd. (Banks) | | | 1,369,677 | |
| | 652,000 | | | Lafarge Surma Cement Ltd. (Materials) | | | 1,115,710 | |
| | 1,630,043 | | | Square Pharmaceuticals Ltd. (Pharmaceuticals, Biotechnology & Life Sciences) | | | 5,907,744 | |
| | 1,624,775 | | | Titas Gas Transmission & Distribution Co. Ltd. (Energy) | | | 1,925,333 | |
| | | | | | | | |
| | | | | | | 13,356,664 | |
| | |
| | Egypt – 5.4% | |
| | 1,213,776 | | | Commercial International Bank Egypt SAE (Banks) | | | 8,279,322 | |
| | 1,140,733 | | | Commercial International Bank Egypt SAE (Registered) GDR (Banks) | | | 7,788,344 | |
| | 27,877 | | | Eastern Tobacco (Food, Beverage & Tobacco) | | | 682,260 | |
| | 348,771 | | | Global Telecom Holding SAE (Telecommunication Services)* | | | 214,542 | |
| | 860,304 | | | Global Telecom Holding SAE GDR (Telecommunication Services)* | | | 2,577,218 | |
| | 1,570,725 | | | Talaat Moustafa Group (Real Estate) | | | 2,335,842 | |
| | 1,324,854 | | | Telecom Egypt Co. (Telecommunication Services) | | | 2,556,588 | |
| | | | | | | | |
| | | | | | | 24,434,116 | |
| | |
| | Indonesia – 15.0% | |
| | 10,013,700 | | | PT Astra International Tbk (Automobiles & Components) | | | 5,614,795 | |
| | 7,281,800 | | | PT Bank Central Asia Tbk (Banks) | | | 7,861,001 | |
| | 6,832,500 | | | PT Bank Mandiri (Persero) Tbk (Banks) | | | 5,868,119 | |
| | 7,285,000 | | | PT Bank Negara Indonesia (Persero) Tbk (Banks) | | | 3,590,523 | |
| | 5,609,000 | | | PT Bank Rakyat Indonesia (Persero) Tbk (Banks) | | | 5,140,066 | |
| | 19,693,900 | | | PT Bumi Serpong Damai (Real Estate) | | | 2,617,158 | |
| | 2,255,000 | | | PT Charoen Pokphand Indonesia Tbk (Food, Beverage & Tobacco) | | | 784,231 | |
| | 11,579,400 | | | PT Global Mediacom Tbk (Media) | | | 1,879,343 | |
| | 710,000 | | | PT Gudang Garam Tbk (Food, Beverage & Tobacco) | | | 3,397,678 | |
| | 251,500 | | | PT Indo Tambangraya Megah Tbk (Energy) | | | 441,287 | |
| | 1,054,000 | | | PT Indocement Tunggal Prakarsa Tbk (Materials) | | | 2,089,013 | |
| | 5,238,500 | | | PT Indofood Sukses Makmur Tbk (Food, Beverage & Tobacco) | | | 2,958,899 | |
| | 5,341,435 | | | PT Jasa Marga (Persero) Tbk (Transportation) | | | 2,808,287 | |
| | |
| | Common Stocks – (continued) | |
| | Indonesia – (continued) | |
| | 14,537,400 | | | PT Kalbe Farma Tbk (Pharmaceuticals, Biotechnology & Life Sciences) | | $ | 2,052,574 | |
| | 2,140,600 | | | PT Matahari Department Store Tbk (Retailing) | | | 2,591,780 | |
| | 6,617,500 | | �� | PT Media Nusantara Citra Tbk (Media) | | | 1,534,135 | |
| | 9,739,500 | | | PT Perusahaan Gas Negara (Persero) Tbk (Utilities) | | | 4,797,578 | |
| | 3,174,500 | | | PT Semen Indonesia (Persero) Tbk (Materials) | | | 4,169,873 | |
| | 1,255,500 | | | PT Tambang Batubara Bukit Asam (Persero) Tbk (Energy) | | | 1,346,969 | |
| | 25,868,900 | | | PT Telekomunikasi Indonesia (Persero) Tbk (Telecommunication Services) | | | 5,891,578 | |
| | | | | | | | |
| | | | | | | 67,434,887 | |
| | |
| | Mexico – 22.7% | |
| | 1,740,800 | | | Alfa SAB de CV Class A (Capital Goods) | | | 5,547,033 | |
| | 902,100 | | | Alpek SA de CV (Materials) | | | 1,595,695 | |
| | 696,027 | | | Alsea SAB de CV (Consumer Services)* | | | 2,173,946 | |
| | 812,405 | | | America Movil SAB de CV Class L ADR (Telecommunication Services) | | | 19,830,806 | |
| | 437,500 | | | Arca Continental SAB de CV (Food, Beverage & Tobacco) | | | 2,817,414 | |
| | 481,200 | | | Bolsa Mexicana de Valores SAB de CV (Diversified Financials) | | | 1,010,194 | |
| | 756,806 | | | Cemex SAB de CV ADR (Materials)* | | | 9,308,714 | |
| | 294,380 | | | Coca-Cola Femsa SAB de CVSeries L (Food, Beverage & Tobacco) | | | 3,105,732 | |
| | 1,273,082 | | | Compartamos SAB de CV (Diversified Financials) | | | 2,835,216 | |
| | 183,400 | | | El Puerto de Liverpool SAB de CV (Retailing) | | | 2,151,703 | |
| | 1,161,572 | | | Fibra Uno Administracion SA de CV (REIT) | | | 4,036,875 | |
| | 69,400 | | | Fomento Economico Mexicano SAB de CV ADR (Food, Beverage & Tobacco) | | | 6,679,056 | |
| | 902,600 | | | Genomma Lab Internacional SAB de CV Class B (Pharmaceuticals, Biotechnology & Life Sciences)* | | | 2,278,242 | |
| | 221,831 | | | Grupo Aeroportuario del Sureste SAB de CV Class B (Transportation) | | | 2,965,489 | |
| | 1,552,515 | | | Grupo Financiero Banorte SAB de CV Class O (Banks) | | | 9,959,846 | |
| | 408,800 | | | Grupo Financiero Inbursa SAB de CV Class O (Banks) | | | 1,227,652 | |
| | 1,717,908 | | | Grupo Mexico SAB de CVSeries B (Materials) | | | 5,902,727 | |
| | 235,968 | | | Grupo Televisa SAB ADR (Media) | | | 8,527,883 | |
| | |
| | |
| The accompanying notes are an integral part of these financial statements. | | 43 |
GOLDMAN SACHS N-11 EQUITY FUND
Schedule of Investments (continued)
October 31, 2014
| | | | | | | | |
Shares | | | Description | | Value | |
| | Common Stocks – (continued) | |
| | Mexico – (continued) | |
| | 51,205 | | | Industrias Penoles SAB de CV (Materials) | | $ | 1,149,182 | |
| | 998,670 | | | Mexichem SAB de CV (Materials) | | | 4,085,527 | |
| | 2,102,924 | | | Wal-Mart de Mexico SAB de CVSeries V (Food & Staples Retailing) | | | 4,861,340 | |
| | | | | | | | |
| | | | | | | 102,050,272 | |
| | |
| | Nigeria – 7.4% | |
| | 874,380 | | | Dangote Cement PLC (Materials) | | | 1,134,873 | |
| | 32,364,376 | | | FBN Holdings PLC (Banks) | | | 2,272,314 | |
| | 5,374,766 | | | Flour Mills of Nigeria PLC (Food, Beverage & Tobacco) | | | 1,995,445 | |
| | 41,246,115 | | | Guaranty Trust Bank PLC (Banks) | | | 6,224,889 | |
| | 472,200 | | | Guinness Nigeria PLC (Food, Beverage & Tobacco) | | | 460,149 | |
| | 1,100,244 | | | Lafarge Africa PLC (Materials) | | | 730,033 | |
| | 994,206 | | | Lekoil Ltd. (Energy)* | | | 771,359 | |
| | 628,196 | | | Nestle Nigeria PLC (Food, Beverage & Tobacco) | | | 3,717,456 | |
| | 7,502,785 | | | Nigerian Breweries PLC (Food, Beverage & Tobacco) | | | 7,337,466 | |
| | 614,702 | | | SEPLAT Petroleum Development Co. PLC (Energy)* | | | 1,986,344 | |
| | 14,519,431 | | | United Bank for Africa PLC (Banks) | | | 417,557 | |
| | 3,245,415 | | | Wapic Insurance PLC (Insurance)* | | | 12,931 | |
| | 47,247,934 | | | Zenith Bank PLC (Banks) | | | 6,064,843 | |
| | | | | | | | |
| | | | | | | 33,125,659 | |
| | |
| | Pakistan – 3.6% | |
| | 1,169,933 | | | Engro Corp. Ltd. (Materials) | | | 1,904,015 | |
| | 2,958,500 | | | Fatima Fertilizer Co. Ltd. (Materials) | | | 880,527 | |
| | 12,829,037 | | | K-Electric Ltd. (Utilities) | | | 976,095 | |
| | 1,506,967 | | | MCB Bank Ltd. (Banks) | | | 4,113,736 | |
| | 2,308,100 | | | Oil & Gas Development Co. Ltd. (Energy) | | | 5,121,027 | |
| | 446,920 | | | Pakistan Petroleum Ltd. (Energy) | | | 880,536 | |
| | 1,174,900 | | | United Bank Ltd. (Banks) | | | 2,247,376 | |
| | | | | | | | |
| | | | | | | 16,123,312 | |
| | |
| | Philippines – 5.1% | |
| | 2,114,300 | | | Alliance Global Group, Inc. (Capital Goods) | | | 1,191,593 | |
| | 207,690 | | | Ayala Corp. (Diversified Financials) | | | 3,192,155 | |
| | 6,554,300 | | | Ayala Land, Inc. (Real Estate) | | | 4,897,526 | |
| | 440,792 | | | Bank of the Philippine Islands (Banks) | | | 934,036 | |
| | 316,760 | | | BDO Unibank, Inc. (Banks) | | | 691,416 | |
| | 21,865,000 | | | Megaworld Corp. (Real Estate) | | | 2,416,315 | |
| | 598,988 | | | Metropolitan Bank & Trust Co. (Banks) | | | 1,101,245 | |
| | 76,865 | | | Philippine Long Distance Telephone Co. (Telecommunication Services) | | | 5,374,650 | |
| | 124,477 | | | SM Investments Corp. (Capital Goods) | | | 2,173,441 | |
| | |
| | Common Stocks – (continued) | |
| | Philippines – (continued) | |
| | 275,150 | | | Universal Robina Corp. (Food, Beverage & Tobacco) | | $ | 1,139,729 | |
| | | | | | | | |
| | | | | | | 23,112,106 | |
| | |
| | South Korea – 17.5% | |
| | 6,895 | | | CJ CheilJedang Corp. (Food, Beverage & Tobacco) | | | 2,517,550 | |
| | 3,600 | | | E-Mart Co. Ltd. (Food & Staples Retailing) | | | 667,976 | |
| | 48,496 | | | Grand Korea Leisure Co. Ltd. (Consumer Services) | | | 1,736,610 | |
| | 107,450 | | | Hana Financial Group, Inc. (Banks) | | | 3,720,979 | |
| | 19,730 | | | Hanssem Co. Ltd. (Consumer Durables & Apparel) | | | 2,351,744 | |
| | 29,317 | | | Hyundai Engineering & Construction Co. Ltd. (Capital Goods) | | | 1,330,460 | |
| | 7,671 | | | Hyundai Heavy Industries Co. Ltd. (Capital Goods) | | | 712,736 | |
| | 5,968 | | | Hyundai Mobis Co. Ltd. (Automobiles & Components) | | | 1,396,301 | |
| | 27,528 | | | Hyundai Motor Co. (Automobiles & Components) | | | 4,368,188 | |
| | 121,817 | | | KB Financial Group, Inc. (Banks) | | | 4,775,197 | |
| | 61,762 | | | Kia Motors Corp. (Automobiles & Components) | | | 2,999,931 | |
| | 17,640 | | | Kolon Industries, Inc. (Materials) | | | 899,554 | |
| | 69,130 | | | Korea Electric Power Corp. (Utilities) | | | 3,034,517 | |
| | 53,760 | | | KT Corp. (Telecommunication Services) | | | 1,656,322 | |
| | 9,372 | | | LG Chem Ltd. (Materials) | | | 1,756,453 | |
| | 33,972 | | | LG Electronics, Inc. (Consumer Durables & Apparel) | | | 2,074,726 | |
| | 3,292 | | | LG Household & Health Care Ltd. (Household & Personal Products) | | | 1,919,022 | |
| | 118,741 | | | LiHOM-CUCHEN Co. Ltd. (Consumer Durables & Apparel)* | | | 1,289,520 | |
| | 10,818 | | | Lotte Chemical Corp. (Materials) | | | 1,467,206 | |
| | 2,296 | | | NAVER Corp. (Software & Services) | | | 1,624,701 | |
| | 1,602 | | | Orion Corp. (Food, Beverage & Tobacco) | | | 1,234,769 | |
| | 7,259 | | | POSCO (Materials) | | | 2,096,669 | |
| | 18,034 | | | Samsung Electronics Co. Ltd. (Technology Hardware & Equipment) | | | 21,030,213 | |
| | 11,900 | | | Samsung Life Insurance Co. Ltd. (Insurance) | | | 1,298,011 | |
| | 14,389 | | | SK Holdings Co. Ltd. (Capital Goods) | | | 2,255,461 | |
| | 140,007 | | | SK Hynix, Inc. (Semiconductors & Semiconductor Equipment)* | | | 6,243,513 | |
| | 10,859 | | | SK Innovation Co. Ltd. (Energy) | | | 888,268 | |
| | |
| | |
| 44 | | The accompanying notes are an integral part of these financial statements. |
GOLDMAN SACHS N-11 EQUITY FUND
| | | | | | | | |
Shares | | | Description | | Value | |
| | Common Stocks – (continued) | |
| | South Korea – (continued) | |
| | 5,523 | | | SK Telecom Co. Ltd. (Telecommunication Services) | | $ | 1,384,058 | |
| | | | | | | | |
| | | | | | | 78,730,655 | |
| | |
| | Turkey – 13.4% | |
| | 1,156,573 | | | Akbank TAS (Banks) | | | 4,176,321 | |
| | 441,427 | | | Aygaz AS (Utilities) | | | 1,861,728 | |
| | 304,250 | | | BIM Birlesik Magazalar AS (Food & Staples Retailing) | | | 6,950,369 | |
| | 1,740,400 | | | Emlak Konut Gayrimenkul Yatirim Ortakligi AS (REIT) | | | 1,954,802 | |
| | 816,521 | | | Enka Insaat ve Sanayi AS (Capital Goods) | | | 1,975,833 | |
| | 67,956 | | | Pegasus Hava Tasimaciligi AS (Transportation)* | | | 873,768 | |
| | 429,040 | | | TAV Havalimanlari Holding AS (Transportation) | | | 3,599,242 | |
| | 600,976 | | | Tofas Turk Otomobil Fabrikasi AS (Automobiles & Components) | | | 3,770,694 | |
| | 1,466,606 | | | Turk Hava Yollari (Transportation)* | | | 4,807,009 | |
| | 691,931 | | | Turk Telekomunikasyon AS (Telecommunication Services) | | | 1,987,583 | |
| | 665,141 | | | Turkcell Iletisim Hizmetleri AS (Telecommunication Services)* | | | 3,866,645 | |
| | 2,102,595 | | | Turkiye Garanti Bankasi AS (Banks) | | | 8,206,204 | |
| | 739,378 | | | Turkiye Halk Bankasi AS (Banks) | | | 4,937,235 | |
| | 2,030,887 | | | Turkiye Is Bankasi Class C (Banks) | | | 5,078,037 | |
| | 2,843,751 | | | Turkiye Sinai Kalkinma Bankasi AS (Banks) | | | 2,495,087 | |
| | 463,688 | | | Ulker Biskuvi Sanayi AS (Food, Beverage & Tobacco) | | | 3,418,048 | |
| | | | | | | | |
| | | | | | | 59,958,605 | |
| | |
| | United Kingdom – 0.7% | |
| | 955,516 | | | Afren PLC (Energy)* | | | 1,178,111 | |
| | 59,510 | | | Genel Energy PLC (Energy)* | | | 669,359 | |
| | 195,572 | | | PZ Cussons PLC (Household & Personal Products) | | | 1,159,996 | |
| | | | | | | | |
| | | | | | | 3,007,466 | |
| | |
| | Vietnam – 3.1% | |
| | 820,766 | | | Bank for Foreign Trade of Vietnam JSC (Banks) | | | 1,068,384 | |
| | 65,810 | | | Bao Viet Holdings (Insurance) | | | 119,992 | |
| | 1,158,880 | | | Masan Group Corp. (Food, Beverage & Tobacco)* | | | 4,438,380 | |
| | 215,404 | | | PetroVietnam Drilling and Well Services JSC (Energy) | | | 951,503 | |
| | 395,750 | | | Petrovietnam Fertilizer & Chemicals JSC (Materials) | | | 559,778 | |
| | 382,170 | | | PetroVietnam Gas JSC (Utilities) | | | 1,903,666 | |
| | 302,601 | | | Saigon Thuong Tin Commercial JSB (Banks) | | | 271,601 | |
| | 56,740 | | | Vietnam Dairy Products JSC (Food, Beverage & Tobacco) | | | 279,967 | |
| | |
| | Common Stocks – (continued) | |
| | Vietnam – (continued) | |
| | 406,192 | | | Vietnam Joint Stock Commercial Bank for Industry and Trade (Banks) | | $ | 280,593 | |
| | 1,740,108 | | | Vingroup JSC (Real Estate) | | | 3,925,056 | |
| | | | | | | | |
| | | | | | | 13,798,920 | |
| | |
| | TOTAL COMMON STOCKS | | | | |
| | (Cost $401,149,247) | | $ | 435,132,662 | |
| | |
| | | | | | | | |
| | Preferred Stock – 0.8% | |
| | South Korea – 0.8% | |
| | 4,152 | | | Samsung Electronics Co. Ltd. (Technology Hardware & Equipment) | | $ | 3,832,559 | |
| | (Cost $3,095,611) | | | | |
| | |
| | TOTAL INVESTMENTS – 97.7% | | | | |
| | (Cost $404,244,858) | | $ | 438,965,221 | |
| | |
| OTHER ASSETS IN EXCESS OF
LIABILITIES – 2.3% | | | 10,130,604 | |
| | |
| | NET ASSETS – 100.0% | | $ | 449,095,825 | |
| | |
| | |
| The percentage shown for each investment category reflects the value of investments in that category as a percentage of net assets. |
* | | Non-income producing security. |
| | |
|
Investment Abbreviations: |
ADR | | —American Depositary Receipt |
GDR | | —Global Depositary Receipt |
REIT | | —Real Estate Investment Trust |
|
| | |
| The accompanying notes are an integral part of these financial statements. | | 45 |
GOLDMAN SACHS FUNDAMENTAL EMERGING MARKETS EQUITY FUNDS
Statements of Assets and Liabilities
October 31, 2014
| | | | | | | | | | | | | | | | | | |
| | | | | Asia Equity Fund | | | BRIC
Fund | | | Emerging Markets
Equity Fund | | | N-11 Equity Fund | |
| | Assets: | | | | | |
| | Investments, at value (cost $76,080,246, $147,948,871, $329,541,465 and $404,244,858) | | $ | 77,417,400 | | | $ | 159,469,672 | | | $ | 360,622,419 | | | $ | 438,965,221 | |
| | Cash | | | 2,408,958 | | | | 130,900 | | | | 1,552,039 | | | | 8,481,343 | |
| | Foreign currencies, at value (cost $364,408, $157,540, $2,221,447 and $3,346,541) | | | 363,645 | | | | 156,662 | | | | 2,218,911 | | | | 3,344,602 | |
| | Receivables: | | | | | | | | | | | | | | | | |
| | Investments sold | | | 595,223 | | | | 1,728,282 | | | | 1,919,189 | | | | 48,530 | |
| | Reimbursement from investment adviser | | | 68,988 | | | | 26,890 | | | | 53,647 | | | | 124,198 | |
| | Dividends | | | 33,074 | | | | 127,053 | | | | 69,813 | | | | 273,151 | |
| | Fund shares sold | | | 2,028 | | | | 39,180 | | | | 571,002 | | | | 580,628 | |
| | Foreign tax reclaims | | | — | | | | — | | | | 11,854 | | | | 74,062 | |
| | Other assets | | | 8,197 | | | | 1,649 | | | | 2,811 | | | | 3,090 | |
| | Total assets | | | 80,897,513 | | | | 161,680,288 | | | | 367,021,685 | | | | 451,894,825 | |
| | | | | | | | | | | | | | | | | | |
| | Liabilities: | | | | | |
| | Payables: | | | | | | | | | | | | | | | | |
| | Investments purchased | | | 1,318,565 | | | | 1,219,869 | | | | 3,853,139 | | | | 1,418,114 | |
| | Foreign capital gains taxes | | | 224,763 | | | | — | | | | 727,667 | | | | 223,553 | |
| | Management Fees | | | 65,834 | | | | 139,728 | | | | 307,358 | | | | 422,572 | |
| | Distribution and Service fees and Transfer Agent fees | | | 9,570 | | | | 65,378 | | | | 40,651 | | | | 65,166 | |
| | Fund shares redeemed | | | 2,139 | | | | 270,668 | | | | 743,530 | | | | 283,190 | |
| | Accrued expenses | | | 148,744 | | | | 173,948 | | | | 301,518 | | | | 386,405 | |
| | Total liabilities | | | 1,769,615 | | | | 1,869,591 | | | | 5,973,863 | | | | 2,799,000 | |
| | | | | | | | | | | | | | | | | | |
| | Net Assets: | | | | | |
| | Paid-in capital | | | 89,317,502 | | | | 383,924,867 | | | | 793,026,950 | | | | 430,236,026 | |
| | Undistributed (distributions in excess of) net investment income | | | 187,703 | | | | 656,761 | | | | 922,424 | | | | 826,912 | |
| | Accumulated net realized loss | | | (11,480,871 | ) | | | (236,250,038 | ) | | | (463,075,937 | ) | | | (16,535,905 | ) |
| | Net unrealized gain | | | 1,103,564 | | | | 11,479,107 | | | | 30,174,385 | | | | 34,568,792 | |
| | | NET ASSETS | | $ | 79,127,898 | | | $ | 159,810,697 | | | $ | 361,047,822 | | | $ | 449,095,825 | |
| | | Net Assets: | | | | | | | | | | | | | | | | |
| | | Class A | | $ | 13,711,478 | | | $ | 57,505,330 | | | $ | 28,157,393 | | | $ | 96,439,738 | |
| | | Class B | | | 300,193 | | | | — | | | | 1,765,810 | | | | — | |
| | | Class C | | | 2,114,280 | | | | 41,942,729 | | | | 11,217,182 | | | | 15,127,174 | |
| | | Institutional | | | 62,950,806 | | | | 59,702,191 | | | | 303,676,139 | | | | 310,186,252 | |
| | | Service | | | — | | | | — | | | | 15,918,712 | | | | — | |
| | | Class IR | | | 51,141 | (a) | | | 660,447 | | | | 312,586 | | | | 27,342,661 | |
| | | Total Net Assets | | $ | 79,127,898 | | | $ | 159,810,697 | | | $ | 361,047,822 | | | $ | 449,095,825 | |
| | | Shares outstanding $0.001 par value (unlimited shares authorized): | | | | | | | | | | | | | | | | |
| | | Class A | | | 684,356 | | | | 4,353,001 | | | | 1,759,326 | | | | 8,575,405 | |
| | | Class B | | | 15,845 | | | | — | | | | 122,290 | | | | — | |
| | | Class C | | | 112,911 | | | | 3,328,573 | | | | 771,170 | | | | 1,376,187 | |
| | | Institutional | | | 2,998,426 | | | | 4,423,576 | | | | 17,783,112 | | | | 27,347,012 | |
| | | Service | | | — | | | | — | | | | 1,025,442 | | | | — | |
| | | Class IR | | | 2,438 | | | | 48,582 | | | | 18,394 | | | | 2,419,071 | |
| | | Net asset value, offering and redemption price per share:(b) | | | | | | | | | | | | | | | | |
| | | Class A | | | $20.04 | | | | $13.21 | | | | $16.00 | | | | $11.25 | |
| | | Class B | | | 18.95 | | | | — | | | | 14.44 | | | | — | |
| | | Class C | | | 18.73 | | | | 12.60 | | | | 14.55 | | | | 10.99 | |
| | | Institutional | | | 20.99 | | | | 13.50 | | | | 17.08 | | | | 11.34 | |
| | | Service | | | — | | | | — | | | | 15.52 | | | | — | |
| | | Class IR | | | 20.98 | | | | 13.59 | | | | 16.99 | | | | 11.30 | |
| | (a) | | Commenced operations on February 28, 2014. |
| | (b) | | Maximum public offering price per share for Class A shares of the Asia Equity, BRIC, Emerging Markets Equity and N-11 Equity Funds is $21.21, $13.98, $16.93 and $11.90, respectively. At redemption, Class B and Class C Shares may be subject to a contingent deferred sales charge assessed on the amount equal to the lesser of the current NAV or the original purchase price of the shares. |
| | |
| 46 | | The accompanying notes are an integral part of these financial statements. |
GOLDMAN SACHS FUNDAMENTAL EMERGING MARKETS EQUITY FUNDS
Statements of Operations
For the Fiscal Year Ended October 31, 2014
| | | | | | | | | | | | | | | | | | |
| | | | | Asia
Equity Fund | | | BRIC
Fund | | | Emerging Markets
Equity Fund | | | N-11
Equity Fund | |
| | Investment income: | | | | | |
| | Dividends (net of foreign taxes withheld of $111,176, $150,024, $498,825 and $1,081,548) | | $ | 1,321,508 | | | $ | 4,222,276 | | | $ | 7,043,789 | | | $ | 8,655,894 | |
| | | | | | | | | | | | | | | | | | |
| | Expenses: | | | | | |
| | Management fees | | | 703,889 | | | | 2,508,884 | | | | 4,485,843 | | | | 5,862,404 | |
| | Custody, accounting and administrative services | | | 288,799 | | | | 277,814 | | | | 708,067 | | | | 1,082,319 | |
| | Professional fees | | | 119,391 | | | | 97,481 | | | | 103,353 | | | | 170,506 | |
| | Registration fees | | | 72,524 | | | | 43,271 | | | | 60,637 | | | | 77,138 | |
| | Distribution and Service fees(a) | | | 61,584 | | | | 651,017 | | | | 217,420 | | | | 422,909 | |
| | Transfer Agent fees(a) | | | 53,413 | | | | 256,696 | | | | 218,678 | | | | 403,702 | |
| | Printing and mailing costs | | | 28,463 | | | | 82,654 | | | | 120,701 | | | | 117,946 | |
| | Trustee fees | | | 27,793 | | | | 23,714 | | | | 24,732 | | | | 23,747 | |
| | Service share fees — Service Plan | | | — | | | | — | | | | 38,408 | | | | — | |
| | Service share fees — Shareholder Administration Plan | | | — | | | | — | | | | 38,408 | | | | — | |
| | Other | | | 44,157 | | | | 67,185 | | | | 56,630 | | | | 62,848 | |
| | Total expenses | | | 1,400,013 | | | | 4,008,716 | | | | 6,072,877 | | | | 8,223,519 | |
| | Less — expense reductions | | | (379,809 | ) | | | (554,314 | ) | | | (834,108 | ) | | | (1,528,480 | ) |
| | Net expenses | | | 1,020,204 | | | | 3,454,402 | | | | 5,238,769 | | | | 6,695,039 | |
| | NET INVESTMENT INCOME | | | 301,304 | | | | 767,874 | | | | 1,805,020 | | | | 1,960,855 | |
| | | | | | | | | | | | | | | | | | |
| | Realized and unrealized gain (loss): | | | | | |
| | Net realized gain (loss) from: | | | | | | | | | | | | | | | | |
| | Investments | | | 9,435,831 | | | | 1,383,641 | | | | 15,752,345 | | | | (3,172,973 | ) |
| | Futures contracts | | | — | | | | — | | | | (165,103 | ) | | | 70,584 | |
| | Foreign currency transactions | | | (147,854 | ) | | | (110,009 | ) | | | (613,108 | ) | | | (298,061 | ) |
| | Net change in unrealized gain (loss) on: | | | | | | | | | | | | | | | | |
| | Investments (including the effects of the net change in the foreign capital gains tax liability of $9,462, $0, $365,347
and $62,955) | | | (6,160,065 | ) | | | (564,491 | ) | | | 2,761,651 | | | | 11,842,515 | |
| | Foreign currency translation | | | (106,024 | ) | | | 3,724 | | | | (481,926 | ) | | | (102,473 | ) |
| | Net realized and unrealized gain | | | 3,021,888 | | | | 712,865 | | | | 17,253,859 | | | | 8,339,592 | |
| | NET INCREASE IN NET ASSETS RESULTING FROM OPERATIONS | | $ | 3,323,192 | | | $ | 1,480,739 | | | $ | 19,058,879 | | | $ | 10,300,447 | |
| | (a) | | Class specific Distribution and Service, and Transfer Agent fees were as follows: |
| | | | | | | | | | | | | | | | | | | | | | | | | | | | | | | | | | | | |
| | | Distribution and Service Fees | | | Transfer Agent Fees | |
Fund | | Class A | | | Class B | | | Class C | | | Class A | | | Class B | | | Class C | | | Institutional | | | Service | | | Class IR | |
Asia Equity | | $ | 35,530 | | | $ | 4,303 | | | $ | 21,751 | | | $ | 27,002 | | | $ | 818 | | | $ | 4,133 | | | $ | 21,420 | | | $ | — | | | $ | 40 | (b) |
BRIC | | | 178,854 | | | | — | | | | 472,163 | | | | 135,930 | | | | — | | | | 89,711 | | | | 29,330 | | | | — | | | | 1,725 | |
Emerging Markets Equity | | | 80,088 | | | | 24,815 | | | | 112,517 | | | | 60,868 | | | | 4,715 | | | | 21,378 | | | | 124,945 | | | | 6,145 | | | | 627 | |
N-11 Equity | | | 257,525 | | | | — | | | | 165,384 | | | | 195,720 | | | | — | | | | 31,423 | | | | 120,831 | | | | — | | | | 55,728 | |
| | (b) | | Commenced operations on February 28, 2014. |
| | |
| The accompanying notes are an integral part of these financial statements. | | 47 |
GOLDMAN SACHS FUNDAMENTAL EMERGING MARKETS EQUITY FUNDS
Statements of Changes in Net Assets
| | | | | | | | | | |
| | | | | Asia Equity Fund | |
| | | | | For the Fiscal Year Ended
October 31, 2014 | | | For the Fiscal Year Ended
October 31, 2013 | |
| | From operations: | | | | | | | | |
| | Net investment income | | $ | 301,304 | | | $ | 282,707 | |
| | Net realized gain (loss) | | | 9,287,977 | | | | 5,837,132 | |
| | Net change in unrealized loss | | | (6,266,089 | ) | | | (880,952 | ) |
| | Net increase in net assets resulting from operations | | | 3,323,192 | | | | 5,238,887 | |
| | | | | | | | | | |
| | Distributions to shareholders: | | | | | | | | |
| | From net investment income | | | | | | | | |
| | Class A Shares | | | (57,630 | ) | | | (95,521 | ) |
| | Class B Shares | | | — | | | | (2,425 | ) |
| | Class C Shares | | | — | | | | (12,432 | ) |
| | Institutional Shares | | | (337,444 | ) | | | (646,294 | ) |
| | Service Shares | | | — | | | | — | |
| | Class IR Shares | | | — | | | | — | |
| | Total distributions to shareholders | | | (395,074 | ) | | | (756,672 | ) |
| | | | | | | | | | |
| | From share transactions: | | | | | | | | |
| | Proceeds from sales of shares | | | 10,769,299 | | | | 3,564,748 | |
| | Proceeds received in connection with merger | | | 25,146,142 | | | | — | |
| | Reinvestment of distributions | | | 393,393 | | | | 747,985 | |
| | Cost of shares redeemed | | | (20,372,806 | ) | | | (11,525,428 | ) |
| | Net increase (decrease) in net assets resulting from share transactions | | | 15,936,028 | | | | (7,212,695 | ) |
| | TOTAL INCREASE (DECREASE) | | | 18,864,146 | | | | (2,730,480 | ) |
| | | | | | | | | | |
| | Net assets: | | | | | | | | |
| | Beginning of year | | | 60,263,752 | | | | 62,994,232 | |
| | End of year | | $ | 79,127,898 | | | $ | 60,263,752 | |
| | Undistributed (distributions in excess of) net investment income | | $ | 187,703 | | | $ | 72,950 | |
| | |
| 48 | | The accompanying notes are an integral part of these financial statements. |
GOLDMAN SACHS FUNDAMENTAL EMERGING MARKETS EQUITY FUNDS
| | | | | | | | | | | | | | | | | | | | | | | | | | | | | | | | | | |
| | | BRIC Fund | | | | | Emerging Markets Equity Fund | | | | | N-11 Equity Fund | |
| | | For the Fiscal Year Ended
October 31, 2014 | | | | | For the Fiscal Year Ended
October 31, 2013 | | | | | For the Fiscal Year Ended
October 31, 2014 | | | | | For the Fiscal Year Ended
October 31, 2013 | | | | | For the Fiscal Year Ended
October 31, 2014 | | | | | For the Fiscal Year Ended
October 31, 2013 | |
| | | | |
| | $ | 767,874 | | | | | $ | 2,812,081 | | | | | $ | 1,805,020 | | | | | $ | 3,005,772 | | | | | $ | 1,960,855 | | | | | $ | 1,040,072 | |
| | | 1,273,632 | | | | | | 19,221,533 | | | | | | 14,974,134 | | | | | | 20,338,559 | | | | | | (3,400,450 | ) | | | | | (3,590,389 | ) |
| | | (560,767 | ) | | | | | (15,940,375 | ) | | | | | 2,279,725 | | | | | | (8,521,391 | ) | | | | | 11,740,042 | | | | | | 8,725,006 | |
| | | 1,480,739 | | | | | | 6,093,239 | | | | | | 19,058,879 | | | | | | 14,822,940 | | | | | | 10,300,447 | | | | | | 6,174,689 | |
| | | | | | | | | | | | | | | | | | | | | | | | | | | | | | | | | | |
| | | | |
| | | | | | | | | | | | | | | | | | | | | | | | | | | | | | | | | | |
| | | (878,085 | ) | | | | | (1,017,354 | ) | | | | | (138,840 | ) | | | | | (190,220 | ) | | | | | (574,638 | ) | | | | | (20,076 | ) |
| | | — | | | | | | — | | | | | | — | | | | | | — | | | | | | — | | | | | | — | |
| | | (92,382 | ) | | | | | — | | | | | | — | | | | | | — | | | | | | (15,699 | ) | | | | | — | |
| | | (1,612,238 | ) | | | | | (2,044,696 | ) | | | | | (2,726,144 | ) | | | | | (2,931,010 | ) | | | | | (2,695,030 | ) | | | | | (369,180 | ) |
| | | — | | | | | | — | | | | | | (34,951 | ) | | | | | (77,760 | ) | | | | | — | | | | | | — | |
| | | (9,450 | ) | | | | | (25,542 | ) | | | | | (1,886 | ) | | | | | (1,945 | ) | | | | | (258,613 | ) | | | | | (27,660 | ) |
| | | (2,592,155 | ) | | | | | (3,087,592 | ) | | | | | (2,901,821 | ) | | | | | (3,200,935 | ) | | | | | (3,543,980 | ) | | | | | (416,916 | ) |
| | | | | | | | | | | | | | | | | | | | | | | | | | | | | | | | | | |
| | | | |
| | | 15,318,479 | | | | | | 50,945,290 | | | | | | 64,399,140 | | | | | | 181,644,756 | | | | | | 119,952,293 | | | | | | 430,326,569 | |
| | | — | | | | | | — | | | | | | — | | | | | | — | | | | | | — | | | | | | — | |
| | | 2,403,225 | | | | | | 2,829,897 | | | | | | 2,705,592 | | | | | | 2,915,644 | | | | | | 3,290,941 | | | | | | 412,563 | |
| | | (117,137,821 | ) | | | | | (185,568,666 | ) | | | | | (177,112,853 | ) | | | | | (126,231,261 | ) | | | | | (159,511,410 | ) | | | | | (121,352,608 | ) |
| | | (99,416,117 | ) | | | | | (131,793,479 | ) | | | | | (110,008,121 | ) | | | | | 58,329,139 | | | | | | (36,268,176 | ) | | | | | 309,386,524 | |
| | | (100,527,533 | ) | | | | | (128,787,832 | ) | | | | | (93,851,063 | ) | | | | | 69,951,144 | | | | | | (29,511,709 | ) | | | | | 315,144,297 | |
| | | | | | | | | | | | | | | | | | | | | | | | | | | | | | | | | | |
| | | | |
| | | 260,338,230 | | | | | | 389,126,062 | | | | | | 454,898,885 | | | | | | 384,947,741 | | | | | | 478,607,534 | | | | | | 163,463,237 | |
| | $ | 159,810,697 | | | | | $ | 260,338,230 | | | | | $ | 361,047,822 | | | | | $ | 454,898,885 | | | | | $ | 449,095,825 | | | | | $ | 478,607,534 | |
| | $ | 656,761 | | | | | $ | 2,591,051 | | | | | $ | 922,424 | | | | | $ | 2,712,792 | | | | | $ | 826,912 | | | | | $ | 1,435,775 | |
| | |
| The accompanying notes are an integral part of these financial statements. | | 49 |
GOLDMAN SACHS ASIA EQUITY FUND
Financial Highlights
Selected Data for a Share Outstanding Throughout Each Year
| | | | | | | | | | | | | | | | | | | | | | |
| | | | | | | | Income (loss) from
investment operations | | | | |
| | | Year - Share Class | | Net asset
value,
beginning
of year | | | Net
investment
income (loss)(a) | | | Net realized
and unrealized
gain (loss) | | | Total from
investment
operations | | | Distributions
to shareholders
from net
investment
income | |
| | FOR THE FISCAL YEARS ENDED OCTOBER 31, | | | | | | | | | | | | | | | | | | | | |
| | 2014 - A | | $ | 19.21 | | | $ | — | (d)(e) | | $ | 0.91 | | | $ | 0.91 | | | $ | (0.08 | ) |
| | 2014 - B | | | 18.23 | | | | (0.16 | )(d) | | | 0.88 | | | | 0.72 | | | | — | |
| | 2014 - C | | | 18.02 | | | | (0.13 | )(d) | | | 0.84 | | | | 0.71 | | | | — | |
| | 2014 - Institutional | | | 20.13 | | | | 0.12 | (d) | | | 0.90 | | | | 1.02 | | | | (0.16 | ) |
| | 2014 - IR (Commenced February 28, 2014) | | | 20.71 | | | | 0.06 | (d) | | | 0.21 | | | | 0.27 | | | | — | |
| | 2013 - A | | | 17.78 | | | | 0.04 | | | | 1.51 | | | | 1.55 | | | | (0.12 | ) |
| | 2013 - B | | | 16.94 | | | | (0.10 | ) | | | 1.44 | | | | 1.34 | | | | (0.05 | ) |
| | 2013 - C | | | 16.77 | | | | (0.10 | ) | | | 1.43 | | | | 1.33 | | | | (0.08 | ) |
| | 2013 - Institutional | | | 18.71 | | | | 0.12 | | | | 1.58 | | | | 1.70 | | | | (0.28 | ) |
| | 2012 - A | | | 17.33 | | | | 0.11 | | | | 0.41 | | | | 0.52 | | | | (0.07 | ) |
| | 2012 - B | | | 16.56 | | | | (0.03 | ) | | | 0.41 | | | | 0.38 | | | | — | |
| | 2012 - C | | | 16.39 | | | | (0.03 | ) | | | 0.41 | | | | 0.38 | | | | — | |
| | 2012 - Institutional | | | 18.24 | | | | 0.19 | | | | 0.43 | | | | 0.62 | | | | (0.15 | ) |
| | 2011 - A | | | 19.14 | | | | 0.12 | | | | (1.69 | ) | | | (1.57 | ) | | | (0.24 | ) |
| | 2011 - B | | | 18.28 | | | | (0.03 | ) | | | (1.60 | ) | | | (1.63 | ) | | | (0.09 | ) |
| | 2011 - C | | | 18.12 | | | | (0.03 | ) | | | (1.59 | ) | | | (1.62 | ) | | | (0.11 | ) |
| | 2011 - Institutional | | | 20.12 | | | | 0.23 | | | | (1.80 | ) | | | (1.57 | ) | | | (0.31 | ) |
| | 2010 - A | | | 15.39 | | | | 0.07 | (g) | | | 3.84 | | | | 3.91 | | | | (0.16 | ) |
| | 2010 - B | | | 14.75 | | | | (0.06 | )(g) | | | 3.68 | | | | 3.62 | | | | (0.09 | ) |
| | 2010 - C | | | 14.64 | | | | (0.05 | )(g) | | | 3.64 | | | | 3.59 | | | | (0.11 | ) |
| | 2010 - Institutional | | | 16.16 | | | | 0.14 | (g) | | | 4.03 | | | | 4.17 | | | | (0.21 | ) |
| | (a) | | Calculated based on the average shares outstanding methodology. |
| | (b) | | Assumes investment at the net asset value at the beginning of the year, reinvestment of all distributions, a complete redemption of the investment at the net asset value at the end of the year and no sales or redemption charges. Total returns would be reduced if a sales or redemption charge was taken into account. Returns do not reflect the deduction of taxes that a shareholder would pay on Fund distributions or the redemption of Fund shares. Total returns for periods less than one full year are not annualized. |
| | (c) | | The Fund’s portfolio turnover rate is calculated in accordance with regulatory requirements, without regard to transactions involving short term investments and certain derivatives. If such transactions were included, the Fund’s portfolio turnover rate may be higher. |
| | (d) | | Reflects income recognized from special dividends which amounted to $0.05 per share and 0.25% of average net assets. |
| | (e) | | Amount is less than $0.005 per share. |
| | (g) | | Reflects income recognized from special dividends which amounted to $0.02 per share and 0.10% of average net assets. |
| | |
| 50 | | The accompanying notes are an integral part of these financial statements. |
GOLDMAN SACHS ASIA EQUITY FUND
| | | | | | | | | | | | | | | | | | | | | | | | | | | | | | | | | | | | | | | | |
| | | | | | | | | | | | | | | | | | | | | | | | | | | | | | | | | | |
| | | Net asset
value, end
of year | | | | | Total
return(b) | | | | | Net assets,
end of year (in 000s) | | | | | Ratio of
net expenses
to average
net assets | | | | | Ratio of
total expenses
to average
net assets | | | | | Ratio of
net investment
income (loss)
to average net assets | | | | | Portfolio
turnover
rate(c) | |
| | | | | | | | | | | | | | | | | | | | | | | | | | | | | | | | | | | | | | | | |
| | $ | 20.04 | | | | | | 4.75 | % | | | | $ | 13,711 | | | | | | 1.73 | % | | | | | 2.24 | % | | | | | 0.02 | %(d) | | | | | 169 | % |
| | | 18.95 | | | | | | 3.95 | | | | | | 300 | | | | | | 2.49 | | | | | | 2.97 | | | | | | (0.87 | )(d) | | | | | 169 | |
| | | 18.73 | | | | | | 4.00 | | | | | | 2,114 | | | | | | 2.48 | | | | | | 3.00 | | | | | | (0.71 | )(d) | | | | | 169 | |
| | | 20.99 | | | | | | 5.15 | | | | | | 62,951 | | | | | | 1.32 | | | | | | 1.87 | | | | | | 0.59 | (d) | | | | | 169 | |
| | | 20.98 | | | | | | 1.30 | | | | | | 51 | | | | | | 1.43 | (f) | | | | | 2.06 | (f) | | | | | 0.41 | (d)(f) | | | | | 169 | |
| | | 19.21 | | | | | | 8.72 | | | | | | 14,097 | | | | | | 1.72 | | | | | | 2.25 | | | | | | 0.21 | | | | | | 102 | |
| | | 18.23 | | | | | | 7.92 | | | | | | 628 | | | | | | 2.47 | | | | | | 2.99 | | | | | | (0.56 | ) | | | | | 102 | |
| | | 18.02 | | | | | | 7.87 | | | | | | 2,331 | | | | | | 2.47 | | | | | | 2.99 | | | | | | (0.56 | ) | | | | | 102 | |
| | | 20.13 | | | | | | 9.16 | | | | | | 43,208 | | | | | | 1.32 | | | | | | 1.85 | | | | | | 0.62 | | | | | | 102 | |
| | | 17.78 | | | | | | 3.05 | | | | | | 15,136 | | | | | | 1.60 | | | | | | 2.24 | | | | | | 0.66 | | | | | | 83 | |
| | | 16.94 | | | | | | 2.29 | | | | | | 829 | | | | | | 2.35 | | | | | | 2.98 | | | | | | (0.20 | ) | | | | | 83 | |
| | | 16.77 | | | | | | 2.31 | | | | | | 2,684 | | | | | | 2.35 | | | | | | 2.97 | | | | | | (0.18 | ) | | | | | 83 | |
| | | 18.71 | | | | | | 3.50 | | | | | | 44,345 | | | | | | 1.20 | | | | | | 1.79 | | | | | | 1.03 | | | | | | 83 | |
| | | 17.33 | | | | | | (8.33 | ) | | | | | 39,688 | | | | | | 1.60 | | | | | | 2.17 | | | | | | 0.61 | | | | | | 107 | |
| | | 16.56 | | | | | | (8.95 | ) | | | | | 1,164 | | | | | | 2.35 | | | | | | 2.92 | | | | | | (0.18 | ) | | | | | 107 | |
| | | 16.39 | | | | | | (9.00 | ) | | | | | 3,219 | | | | | | 2.35 | | | | | | 2.92 | | | | | | (0.18 | ) | | | | | 107 | |
| | | 18.24 | | | | | | (7.94 | ) | | | | | 27,071 | | | | | | 1.20 | | | | | | 1.77 | | | | | | 1.15 | | | | | | 107 | |
| | | 19.14 | | | | | | 25.59 | | | | | | 47,238 | | | | | | 1.60 | | | | | | 2.32 | | | | | | 0.40 | (g) | | | | | 85 | |
| | | 18.28 | | | | | | 24.66 | | | | | | 1,622 | | | | | | 2.35 | | | | | | 3.07 | | | | | | (0.38 | )(g) | | | | | 85 | |
| | | 18.12 | | | | | | 24.53 | | | | | | 4,986 | | | | | | 2.35 | | | | | | 3.07 | | | | | | (0.32 | )(g) | | | | | 85 | |
| | | 20.12 | | | | | | 26.05 | | | | | | 24,864 | | | | | | 1.20 | | | | | | 1.92 | | | | | | 0.82 | (g) | | | | | 85 | |
| | |
| The accompanying notes are an integral part of these financial statements. | | 51 |
GOLDMAN SACHS BRIC FUND
Financial Highlights
Selected Data for a Share Outstanding Throughout Each Year
| | | | | | | | | | | | | | | | | | | | | | |
| | | | | | | | Income (loss) from
investment operations | | | | |
| | | Year - Share Class | | Net asset
value,
beginning
of year | | | Net
investment
income (loss)(a) | | | Net realized
and unrealized
gain (loss) | | | Total from
investment
operations | | | Distributions
to shareholders
from net
investment
income | |
| | FOR THE FISCAL YEARS ENDED OCTOBER 31, | | | | | | | | | | | | | | | | | | | | |
| | 2014 - A | | $ | 13.10 | | | $ | 0.06 | | | $ | 0.18 | | | $ | 0.24 | | | $ | (0.13 | ) |
| | 2014 - C | | | 12.49 | | | | (0.03 | ) | | | 0.16 | | | | 0.13 | | | | (0.02 | ) |
| | 2014 - Institutional | | | 13.40 | | | | 0.10 | | | | 0.20 | | | | 0.30 | | | | (0.20 | ) |
| | 2014 - IR | | | 13.47 | | | | 0.10 | | | | 0.17 | | | | 0.27 | | | | (0.15 | ) |
| | 2013 - A | | | 12.71 | | | | 0.10 | | | | 0.39 | | | | 0.49 | | | | (0.10 | ) |
| | 2013 - C | | | 12.11 | | | | — | (d) | | | 0.38 | | | | 0.38 | | | | — | |
| | 2013 - Institutional | | | 13.01 | | | | 0.17 | | | | 0.38 | | | | 0.55 | | | | (0.16 | ) |
| | 2013 - IR | | | 13.08 | | | | 0.12 | | | | 0.41 | | | | 0.53 | | | | (0.14 | ) |
| | 2012 - A | | | 13.13 | | | | 0.09 | | | | (0.51 | ) | | | (0.42 | ) | | | — | |
| | 2012 - C | | | 12.60 | | | | — | (d) | | | (0.49 | ) | | | (0.49 | ) | | | — | |
| | 2012 - Institutional | | | 13.38 | | | | 0.15 | | | | (0.52 | ) | | | (0.37 | ) | | | — | |
| | 2012 - IR | | | 13.47 | | | | 0.15 | | | | (0.54 | ) | | | (0.39 | ) | | | — | |
| | 2011 - A | | | 15.78 | | | | 0.03 | | | | (2.68 | ) | | | (2.65 | ) | | | — | |
| | 2011 - C | | | 15.26 | | | | (0.06 | ) | | | (2.60 | ) | | | (2.66 | ) | | | — | |
| | 2011 - Institutional | | | 16.04 | | | | 0.18 | | | | (2.81 | ) | | | (2.63 | ) | | | (0.03 | ) |
| | 2011 - IR | | | 16.19 | | | | 0.03 | | | | (2.72 | ) | | | (2.69 | ) | | | (0.03 | ) |
| | 2010 - A | | | 13.12 | | | | (0.03 | )(e) | | | 2.69 | | | | 2.66 | | | | — | |
| | 2010 - C | | | 12.79 | | | | (0.13 | )(e) | | | 2.60 | | | | 2.47 | | | | — | |
| | 2010 - Institutional | | | 13.29 | | | | 0.05 | (e) | | | 2.70 | | | | 2.75 | | | | — | |
| | 2010 - IR (Commenced August 31, 2010) | | | 14.12 | | | | (0.02 | )(e) | | | 2.09 | | | | 2.07 | | | | — | |
| | (a) | | Calculated based on the average shares outstanding methodology. |
| | (b) | | Assumes investment at the net asset value at the beginning of the year, reinvestment of all distributions, a complete redemption of the investment at the net asset value at the end of the year and no sales or redemption charges. Total returns would be reduced if a sales or redemption charge was taken into account. Returns do not reflect the deduction of taxes that a shareholder would pay on Fund distributions or the redemption of Fund shares. Total returns for periods less than one full year are not annualized. |
| | (c) | | The Fund’s portfolio turnover rate is calculated in accordance with regulatory requirements, without regard to transactions involving short term investments and certain derivatives. If such transactions were included, the Fund’s portfolio turnover rate may be higher. |
| | (d) | | Amount is less than $0.005 per share. |
| | (e) | | Reflects income recognized from special dividends which amounted to $0.02 per share and 0.12% of average net assets. |
| | |
| 52 | | The accompanying notes are an integral part of these financial statements. |
GOLDMAN SACHS BRIC FUND
| | | | | | | | | | | | | | | | | | | | | | | | | | | | | | | | | | | | | | | | |
| | | | | | | | | | | | | | | | | | | | | | | | | | | | | | | | | | |
| | | Net asset
value, end
of year | | | | | Total
return(b) | | | | | Net assets,
end of year (in 000s) | | | | | Ratio of
net expenses
to average
net assets | | | | | Ratio of
total expenses
to average
net assets | | | | | Ratio of
net investment
income (loss)
to average net assets | | | | | Portfolio
turnover
rate(c) | |
| | | | | | | | | | | | | | | | | | | | | | | | | | | | | | | | | | | | | | | | |
| | $ | 13.21 | | | | | | 1.89 | % | | | | $ | 57,505 | | | | | | 1.76 | % | | | | | 2.05 | % | | | | | 0.48 | % | | | | | 64 | % |
| | | 12.60 | | | | | | 1.13 | | | | | | 41,943 | | | | | | 2.51 | | | | | | 2.80 | | | | | | (0.25 | ) | | | | | 64 | |
| | | 13.50 | | | | | | 2.29 | | | | | | 59,702 | | | | | | 1.36 | | | | | | 1.64 | | | | | | 0.73 | | | | | | 64 | |
| | | 13.59 | | | | | | 2.07 | | | | | | 660 | | | | | | 1.51 | | | | | | 1.80 | | | | | | 0.76 | | | | | | 64 | |
| | | 13.10 | | | | | | 3.83 | | | | | | 90,652 | | | | | | 1.76 | | | | | | 1.97 | | | | | | 0.77 | | | | | | 94 | |
| | | 12.49 | | | | | | 3.06 | | | | | | 57,124 | | | | | | 2.50 | | | | | | 2.72 | | | | | | 0.04 | | | | | | 94 | |
| | | 13.40 | | | | | | 4.26 | | | | | | 111,712 | | | | | | 1.36 | | | | | | 1.57 | | | | | | 1.29 | | | | | | 94 | |
| | | 13.47 | | | | | | 4.09 | | | | | | 851 | | | | | | 1.51 | | | | | | 1.72 | | | | | | 0.93 | | | | | | 94 | |
| | | 12.71 | | | | | | (3.19 | ) | | | | | 140,354 | | | | | | 1.82 | | | | | | 1.96 | | | | | | 0.69 | | | | | | 82 | |
| | | 12.11 | | | | | | (3.88 | ) | | | | | 81,879 | | | | | | 2.57 | | | | | | 2.71 | | | | | | (0.02 | ) | | | | | 82 | |
| | | 13.01 | | | | | | (2.76 | ) | | | | | 164,600 | | | | | | 1.42 | | | | | | 1.56 | | | | | | 1.20 | | | | | | 82 | |
| | | 13.08 | | | | | | (2.89 | ) | | | | | 2,292 | | | | | | 1.57 | | | | | | 1.71 | | | | | | 1.19 | | | | | | 82 | |
| | | 13.13 | | | | | | (16.79 | ) | | | | | 227,178 | | | | | | 1.86 | | | | | | 1.92 | | | | | | 0.16 | | | | | | 91 | |
| | | 12.60 | | | | | | (17.43 | ) | | | | | 114,773 | | | | | | 2.61 | | | | | | 2.67 | | | | | | (0.41 | ) | | | | | 91 | |
| | | 13.38 | | | | | | (16.45 | ) | | | | | 219,820 | | | | | | 1.46 | | | | | | 1.52 | | | | | | 1.15 | | | | | | 91 | |
| | | 13.47 | | | | | | (16.66 | ) | | | | | 200 | | | | | | 1.60 | | | | | | 1.66 | | | | | | 0.18 | | | | | | 91 | |
| | | 15.78 | | | | | | 20.27 | | | | | | 474,512 | | | | | | 1.89 | | | | | | 1.92 | | | | | | (0.22 | )(e) | | | | | 87 | |
| | | 15.26 | | | | | | 19.31 | | | | | | 178,404 | | | | | | 2.64 | | | | | | 2.67 | | | | | | (0.96 | )(e) | | | | | 87 | |
| | | 16.04 | | | | | | 20.69 | | | | | | 158,912 | | | | | | 1.49 | | | | | | 1.52 | | | | | | 0.36 | (e) | | | | | 87 | |
| | | 16.19 | | | | | | 14.66 | | | | | | 23 | | | | | | 1.64 | (f) | | | | | 1.64 | (f) | | | | | (0.83 | )(e)(f) | | | | | 87 | |
| | |
| The accompanying notes are an integral part of these financial statements. | | 53 |
GOLDMAN SACHS EMERGING MARKETS EQUITY FUND
Financial Highlights
Selected Data for a Share Outstanding Throughout Each Year
| | | | | | | | | | | | | | | | | | | | | | |
| | | | | | | | Income (loss) from
investment operations | | | | |
| | | Year - Share Class | | Net asset
value,
beginning
of year | | | Net
investment
income (loss)(a) | | | Net realized
and unrealized
gain (loss) | | | Total from
investment
operations | | | Distributions
to shareholders
from net
investment
income | |
| | FOR THE FISCAL YEARS ENDED OCTOBER 31, | | | | | | | | | | | | | | | | | | | | |
| | 2014 - A | | $ | 15.20 | | | $ | 0.03 | | | $ | 0.83 | | | $ | 0.86 | | | $ | (0.06 | ) |
| | 2014 - B | | | 13.77 | | | | (0.08 | ) | | | 0.75 | | | | 0.67 | | | | — | |
| | 2014 - C | | | 13.87 | | | | (0.08 | ) | | | 0.76 | | | | 0.68 | | | | — | |
| | 2014 - Institutional | | | 16.22 | | | | 0.10 | | | | 0.88 | | | | 0.98 | | | | (0.12 | ) |
| | 2014 - Service | | | 14.74 | | | | 0.02 | | | | 0.80 | | | | 0.82 | | | | (0.04 | ) |
| | 2014 - IR | | | 16.14 | | | | 0.08 | | | | 0.87 | | | | 0.95 | | | | (0.10 | ) |
| | 2013 - A | | | 14.68 | | | | 0.05 | | | | 0.54 | | | | 0.59 | | | | (0.07 | ) |
| | 2013 - B | | | 13.33 | | | | (0.06 | ) | | | 0.50 | | | | 0.44 | | | | — | |
| | 2013 - C | | | 13.42 | | | | (0.06 | ) | | | 0.51 | | | | 0.45 | | | | — | |
| | 2013 - Institutional | | | 15.65 | | | | 0.13 | | | | 0.58 | | | | 0.71 | | | | (0.14 | ) |
| | 2013 - Service | | | 14.24 | | | | 0.04 | | | | 0.53 | | | | 0.57 | | | | (0.07 | ) |
| | 2013 - IR | | | 15.58 | | | | 0.10 | | | | 0.58 | | | | 0.68 | | | | (0.12 | ) |
| | 2012 - A | | | 14.66 | | | | 0.06 | | | | (0.04 | ) | | | 0.02 | | | | — | |
| | 2012 - B | | | 13.41 | | | | (0.05 | ) | | | (0.03 | ) | | | (0.08 | ) | | | — | |
| | 2012 - C | | | 13.51 | | | | (0.05 | ) | | | (0.04 | ) | | | (0.09 | ) | | | — | |
| | 2012 - Institutional | | | 15.63 | | | | 0.12 | | | | (0.05 | ) | | | 0.07 | | | | (0.05 | ) |
| | 2012 - Service | | | 14.24 | | | | 0.05 | | | | (0.05 | ) | | | — | (d) | | | — | |
| | 2012 - IR | | | 15.59 | | | | 0.12 | | | | (0.07 | ) | | | 0.05 | | | | (0.06 | ) |
| | 2011 - A | | | 16.38 | | | | 0.04 | | | | (1.73 | ) | | | (1.69 | ) | | | (0.03 | ) |
| | 2011 - B | | | 15.09 | | | | (0.08 | ) | | | (1.58 | ) | | | (1.66 | ) | | | (0.02 | ) |
| | 2011 - C | | | 15.20 | | | | (0.07 | ) | | | (1.60 | ) | | | (1.67 | ) | | | (0.02 | ) |
| | 2011 - Institutional | | | 17.48 | | | | 0.11 | | | | (1.84 | ) | | | (1.73 | ) | | | (0.12 | ) |
| | 2011 - Service | | | 15.95 | | | | 0.02 | | | | (1.68 | ) | | | (1.66 | ) | | | (0.05 | ) |
| | 2011 - IR | | | 17.56 | | | | 0.02 | | | | (1.87 | ) | | | (1.85 | ) | | | (0.12 | ) |
| | 2010 - A | | | 13.37 | | | | (0.02 | )(e) | | | 3.03 | | | | 3.01 | | | | — | |
| | 2010 - B | | | 12.41 | | | | (0.10 | )(e) | | | 2.78 | | | | 2.68 | | | | — | |
| | 2010 - C | | | 12.50 | | | | (0.10 | )(e) | | | 2.80 | | | | 2.70 | | | | — | |
| | 2010 - Institutional | | | 14.22 | | | | 0.07 | (e) | | | 3.20 | | | | 3.27 | | | | (0.01 | ) |
| | 2010 - Service | | | 13.03 | | | | (0.01 | )(e) | | | 2.93 | | | | 2.92 | | | | — | |
| | 2010 - IR (Commenced August 31, 2010) | | | 15.24 | | | | (0.01 | )(e) | | | 2.33 | | | | 2.32 | | | | — | |
| | (a) | | Calculated based on the average shares outstanding methodology. |
| | (b) | | Assumes investment at the net asset value at the beginning of the year, reinvestment of all distributions, a complete redemption of the investment at the net asset value at the end of the year and no sales or redemption charges. Total returns would be reduced if a sales or redemption charge was taken into account. Returns do not reflect the deduction of taxes that a shareholder would pay on Fund distributions or the redemption of Fund shares. Total returns for periods less than one full year are not annualized. |
| | (c) | | The Fund’s portfolio turnover rate is calculated in accordance with regulatory requirements, without regard to transactions involving short term investments and certain derivatives. If such transactions were included, the Fund’s portfolio turnover rate may be higher. |
| | (d) | | Amount is less than $0.005 per share. |
| | (e) | | Reflects income recognized from special dividends which amounted to $0.02 per share and 0.12% of average net assets. |
| | |
| 54 | | The accompanying notes are an integral part of these financial statements. |
GOLDMAN SACHS EMERGING MARKETS EQUITY FUND
| | | | | | | | | | | | | | | | | | | | | | | | | | | | | | | | | | | | | | | | |
| | | | | | | | | | | | | | | | | | | | | | | | | | | | | | | | | | |
| | | Net asset
value, end
of year | | | | | Total
return(b) | | | | | Net assets,
end of
year
(in 000s) | | | | | Ratio of
net expenses
to average
net assets | | | | | Ratio of
total expenses
to average
net assets | | | | | Ratio of
net investment
income (loss)
to average net assets | | | | | Portfolio
turnover
rate(c) | |
| | | | | | | | | | | | | | | | | | | | | | | | | | | | | | | | | | | | | | | | |
| | $ | 16.00 | | | | | | 5.67 | % | | | | $ | 28,157 | | | | | | 1.70 | % | | | | | 1.93 | % | | | | | 0.19 | % | | | | | 114 | % |
| | | 14.44 | | | | | | 4.94 | | | | | | 1,766 | | | | | | 2.45 | | | | | | 2.67 | | | | | | (0.61 | ) | | | | | 114 | |
| | | 14.55 | | | | | | 4.90 | | | | | | 11,217 | | | | | | 2.46 | | | | | | 2.68 | | | | | | (0.55 | ) | | | | | 114 | |
| | | 17.08 | | | | | | 6.17 | | | | | | 303,676 | | | | | | 1.30 | | | | | | 1.53 | | | | | | 0.58 | | | | | | 114 | |
| | | 15.52 | | | | | | 5.55 | | | | | | 15,919 | | | | | | 1.81 | | | | | | 2.03 | | | | | | 0.11 | | | | | | 114 | |
| | | 16.99 | | | | | | 5.93 | | | | | | 313 | | | | | | 1.46 | | | | | | 1.68 | | | | | | 0.46 | | | | | | 114 | |
| | | 15.20 | | | | | | 4.04 | | | | | | 36,578 | | | | | | 1.73 | | | | | | 1.89 | | | | | | 0.32 | | | | | | 159 | |
| | | 13.77 | | | | | | 3.23 | | | | | | 3,492 | | | | | | 2.48 | | | | | | 2.64 | | | | | | (0.46 | ) | | | | | 159 | |
| | | 13.87 | | | | | | 3.35 | | | | | | 11,869 | | | | | | 2.48 | | | | | | 2.64 | | | | | | (0.44 | ) | | | | | 159 | |
| | | 16.22 | | | | | | 4.49 | | | | | | 388,046 | | | | | | 1.33 | | | | | | 1.49 | | | | | | 0.80 | | | | | | 159 | |
| | | 14.74 | | | | | | 4.02 | | | | | | 14,584 | | | | | | 1.83 | | | | | | 1.99 | | | | | | 0.25 | | | | | | 159 | |
| | | 16.14 | | | | | | 4.37 | | | | | | 329 | | | | | | 1.48 | | | | | | 1.64 | | | | | | 0.62 | | | | | | 159 | |
| | | 14.68 | | | | | | 0.14 | | | | | | 38,889 | | | | | | 1.82 | | | | | | 1.94 | | | | | | 0.39 | | | | | | 119 | |
| | | 13.33 | | | | | | (0.59 | ) | | | | | 4,788 | | | | | | 2.57 | | | | | | 2.69 | | | | | | (0.37 | ) | | | | | 119 | |
| | | 13.42 | | | | | | (0.66 | ) | | | | | 15,418 | | | | | | 2.57 | | | | | | 2.69 | | | | | | (0.35 | ) | | | | | 119 | |
| | | 15.65 | | | | | | 0.49 | | | | | | 310,167 | | | | | | 1.41 | | | | | | 1.54 | | | | | | 0.80 | | | | | | 119 | |
| | | 14.24 | | | | | | 0.00 | | | | | | 15,446 | | | | | | 1.91 | | | | | | 2.03 | | | | | | 0.36 | | | | | | 119 | |
| | | 15.58 | | | | | | 0.35 | | | | | | 240 | | | | | | 1.55 | | | | | | 1.68 | | | | | | 0.78 | | | | | | 119 | |
| | | 14.66 | | | | | | (10.33 | ) | | | | | 51,221 | | | | | | 1.90 | | | | | | 1.93 | | | | | | 0.24 | | | | | | 121 | |
| | | 13.41 | | | | | | (11.02 | ) | | | | | 6,841 | | | | | | 2.65 | | | | | | 2.68 | | | | | | (0.53 | ) | | | | | 121 | |
| | | 13.51 | | | | | | (11.01 | ) | | | | | 18,896 | | | | | | 2.65 | | | | | | 2.68 | | | | | | (0.49 | ) | | | | | 121 | |
| | | 15.63 | | | | | | (9.98 | ) | | | | | 351,982 | | | | | | 1.50 | | | | | | 1.53 | | | | | | 0.61 | | | | | | 121 | |
| | | 14.24 | | | | | | (10.43 | ) | | | | | 14,432 | | | | | | 2.00 | | | | | | 2.03 | | | | | | 0.15 | | | | | | 121 | |
| | | 15.59 | | | | | | (10.21 | ) | | | | | 21 | | | | | | 1.65 | | | | | | 1.68 | | | | | | 0.16 | | | | | | 121 | |
| | | 16.38 | | | | | | 22.51 | | | | | | 68,118 | | | | | | 1.91 | | | | | | 1.91 | | | | | | (0.16 | )(e) | | | | | 147 | |
| | | 15.09 | | | | | | 21.60 | | | | | | 10,335 | | | | | | 2.66 | | | | | | 2.66 | | | | | | (0.75 | )(e) | | | | | 147 | |
| | | 15.20 | | | | | | 21.60 | | | | | | 23,226 | | | | | | 2.66 | | | | | | 2.66 | | | | | | (0.73 | )(e) | | | | | 147 | |
| | | 17.48 | | | | | | 23.04 | | | | | | 472,994 | | | | | | 1.51 | | | | | | 1.51 | | | | | | 0.43 | (e) | | | | | 147 | |
| | | 15.95 | | | | | | 22.41 | | | | | | 13,954 | | | | | | 2.01 | | | | | | 2.01 | | | | | | (0.10 | )(e) | | | | | 147 | |
| | | 17.56 | | | | | | 15.22 | | | | | | 1 | | | | | | 1.66 | (f) | | | | | 1.66 | (f) | | | | | (0.09 | )(e)(f) | | | | | 147 | |
| | |
| The accompanying notes are an integral part of these financial statements. | | 55 |
GOLDMAN SACHS N-11 EQUITY FUND
Financial Highlights
Selected Data for a Share Outstanding Throughout Each Period
| | | | | | | | | | | | | | | | | | | | | | |
| | | | | | | | Income (loss) from
investment operations | | | | |
| | | Year - Share Class | | Net asset
value,
beginning
of period | | | Net
investment
income (loss)(a) | | | Net realized
and unrealized
gain (loss) | | | Total from
investment
operations | | | Distributions
to shareholders
from net
investment
income | |
| | FOR THE FISCAL YEARS ENDED OCTOBER 31, | | | | | | | | | | | | | | | | | | | | |
| | 2014 - A | | $ | 11.03 | | | $ | 0.02 | | | $ | 0.26 | | | $ | 0.28 | | | $ | (0.06 | ) |
| | 2014 - C | | | 10.81 | | | | (0.06 | ) | | | 0.25 | | | | 0.19 | | | | (0.01 | ) |
| | 2014 - Institutional | | | 11.12 | | | | 0.06 | | | | 0.26 | | | | 0.32 | | | | (0.10 | ) |
| | 2014 - IR | | | 11.08 | | | | 0.05 | | | | 0.25 | | | | 0.30 | | | | (0.08 | ) |
| | 2013 - A | | | 10.38 | | | | 0.01 | | | | 0.65 | | | | 0.66 | | | | (0.01 | ) |
| | 2013 - C | | | 10.25 | | | | (0.07 | ) | | | 0.63 | | | | 0.56 | | | | — | |
| | 2013 - Institutional | | | 10.45 | | | | 0.05 | | | | 0.65 | | | | 0.70 | | | | (0.03 | ) |
| | 2013 - IR | | | 10.42 | | | | 0.03 | | | | 0.65 | | | | 0.68 | | | | (0.02 | ) |
| | 2012 - A | | | 9.57 | | | | 0.01 | | | | 0.80 | | | | 0.81 | | | | — | |
| | 2012 - C | | | 9.52 | | | | (0.06 | ) | | | 0.79 | | | | 0.73 | | | | — | |
| | 2012 - Institutional | | | 9.60 | | | | 0.05 | | | | 0.80 | | | | 0.85 | | | | — | |
| | 2012 - IR | | | 9.59 | | | | 0.02 | | | | 0.81 | | | | 0.83 | | | | — | |
| | 2011 - A (Commenced February 28, 2011) | | | 10.00 | | | | (0.03 | ) | | | (0.40 | ) | | | (0.43 | ) | | | — | |
| | 2011 - C (Commenced February 28, 2011) | | | 10.00 | | | | (0.08 | ) | | | (0.40 | ) | | | (0.48 | ) | | | — | |
| | 2011 - Institutional (Commenced February 28, 2011) | | | 10.00 | | | | 0.02 | | | | (0.42 | ) | | | (0.40 | ) | | | — | |
| | 2011 - IR (Commenced February 28, 2011) | | | 10.00 | | | | (0.02 | ) | | | (0.39 | ) | | | (0.41 | ) | | | — | |
| | (a) | | Calculated based on the average shares outstanding methodology. |
| | (b) | | Assumes investment at the net asset value at the beginning of the period, reinvestment of all distributions, a complete redemption of the investment at the net asset value at the end of the period and no sales or redemption charges. Total returns would be reduced if a sales or redemption charge was taken into account. Returns do not reflect the deduction of taxes that a shareholder would pay on Fund distributions or the redemption of Fund shares. Total returns for periods less than one full year are not annualized. |
| | (c) | | The Fund’s portfolio turnover rate is calculated in accordance with regulatory requirements, without regard to transactions involving short term investments and certain derivatives. If such transactions were included, the Fund’s portfolio turnover rate may be higher. |
| | |
| 56 | | The accompanying notes are an integral part of these financial statements. |
GOLDMAN SACHS N-11 EQUITY FUND
| | | | | | | | | | | | | | | | | | | | | | | | | | | | | | | | | | | | | | | | |
| | | | | | | | | | | | | | | | | | | | | | | | | | | | | | | | | | |
| | | Net asset
value, end
of period | | | | | Total
return(b) | | | | | Net assets,
end of period (in 000s) | | | | | Ratio of
net expenses
to average
net assets | | | | | Ratio of
total expenses
to average
net assets | | | | | Ratio of
net investment
income (loss)
to average net assets | | | | | Portfolio
turnover
rate(c) | |
| | | | | | | | | | | | | | | | | | | | | | | | | | | | | | | | | | | | | | | | |
| | $ | 11.25 | | | | | | 2.54 | % | | | | $ | 96,440 | | | | | | 1.74 | % | | | | | 2.08 | % | | | | | 0.20 | % | | | | | 41 | % |
| | | 10.99 | | | | | | 1.76 | | | | | | 15,127 | | | | | | 2.49 | | | | | | 2.83 | | | | | | (0.54 | ) | | | | | 41 | |
| | | 11.34 | | | | | | 2.88 | | | | | | 310,186 | | | | | | 1.34 | | | | | | 1.68 | | | | | | 0.57 | | | | | | 41 | |
| | | 11.30 | | | | | | 2.76 | | | | | | 27,343 | | | | | | 1.49 | | | | | | 1.82 | | | | | | 0.44 | | | | | | 41 | |
| | | 11.03 | | | | | | 6.31 | | | | | | 114,658 | | | | | | 1.74 | | | | | | 2.12 | | | | | | 0.07 | | | | | | 53 | |
| | | 10.81 | | | | | | 5.46 | | | | | | 19,018 | | | | | | 2.49 | | | | | | 2.87 | | | | | | (0.66 | ) | | | | | 53 | |
| | | 11.12 | | | | | | 6.73 | | | | | | 308,502 | | | | | | 1.35 | | | | | | 1.72 | | | | | | 0.44 | | | | | | 53 | |
| | | 11.08 | | | | | | 6.48 | | | | | | 36,429 | | | | | | 1.49 | | | | | | 1.87 | | | | | | 0.26 | | | | | | 53 | |
| | | 10.38 | | | | | | 8.33 | | | | | | 35,417 | | | | | | 1.79 | | | | | | 2.35 | | | | | | 0.09 | | | | | | 90 | |
| | | 10.25 | | | | | | 7.53 | | | | | | 6,720 | | | | | | 2.54 | | | | | | 3.12 | | | | | | (0.57 | ) | | | | | 90 | |
| | | 10.45 | | | | | | 8.83 | | | | | | 111,826 | | | | | | 1.39 | | | | | | 1.94 | | | | | | 0.52 | | | | | | 90 | |
| | | 10.42 | | | | | | 8.73 | | | | | | 9,500 | | | | | | 1.54 | | | | | | 2.05 | | | | | | 0.22 | | | | | | 90 | |
| | | 9.57 | | | | | | (4.20 | ) | | | | | 18,335 | | | | | | 1.82 | (d) | | | | | 3.92 | (d) | | | | | (0.40 | )(d) | | | | | 73 | |
| | | 9.52 | | | | | | (4.70 | ) | | | | | 3,528 | | | | | | 2.57 | (d) | | | | | 4.67 | (d) | | | | | (1.29 | )(d) | | | | | 73 | |
| | | 9.60 | | | | | | (4.00 | ) | | | | | 42,740 | | | | | | 1.42 | (d) | | | | | 3.52 | (d) | | | | | 0.24 | (d) | | | | | 73 | |
| | | 9.59 | | | | | | (4.10 | ) | | | | | 1,448 | | | | | | 1.57 | (d) | | | | | 3.67 | (d) | | | | | (0.28 | )(d) | | | | | 73 | |
| | |
| The accompanying notes are an integral part of these financial statements. | | 57 |
GOLDMAN SACHS FUNDAMENTAL EMERGING MARKETS EQUITY FUNDS
Notes to Financial Statements
October 31, 2014
Goldman Sachs Trust (the “Trust”) is a Delaware statutory trust registered under the Investment Company Act of 1940, as
amended (the “Act”), as an open-end management investment company. The following table lists those series of the Trust that are included in this report (collectively, the “Funds” or individually a “Fund”), along with their corresponding share classes and respective diversification status under the Act:
| | | | |
| Fund | | Share Classes Offered | | Diversified/ Non-diversified |
Asia Equity | | A, B, C, Institutional and IR | | Diversified |
BRIC and N-11 Equity | | A, C, Institutional and IR | | Non-diversified |
Emerging Markets Equity | | A, B, C, Institutional, Service and IR | | Diversified |
Class A Shares are sold with a front-end sales charge of up to 5.50%. Class B Shares were sold with a contingent deferred sales charge (“CDSC”) that declines from 5.00% to zero, depending upon the period of time the shares are held. Class C Shares are sold with a CDSC of 1.00%, which is imposed on redemptions made within 12 months of purchase. Institutional, Service and Class IR Shares are not subject to a sales charge.
At a meeting held on August 13-14, 2014, the Board of Trustees of the Trust approved the early conversion of each Fund’s Class B Shares into Class A Shares.
Accordingly, effective at the close of business on November 14, 2014 (the “Conversion Date”), Class B Shares of each Fund have converted to Class A Shares of the Fund, including Class B Shares that were scheduled to convert on a later date. No CDSCs were assessed in connection with this early conversion. In addition, effective October 15,2014, redemptions of a Fund’s Class B Shares before the Conversion Date were not subject to a CDSC.
Goldman Sachs Asset Management International (“GSAMI”), an affiliate of Goldman, Sachs & Co. (“Goldman Sachs”), serves as investment adviser to the Funds pursuant to a management agreement (the “Agreement”) with the Trust.
Pursuant to an Agreement and Plan of Reorganization (the “Reorganization Agreement”) approved by the Trust’s Board of Trustees, all of the assets and liabilities of the Goldman Sachs China Equity Fund (the “Acquired Fund”) were transferred to the Goldman Sachs Asia Equity Fund (the “Survivor Fund”) as of the close of business on April 25, 2014 (the “Reorganization”). As part of the Reorganization, holders of Class A, Class C, Institutional, and Class IR shares of the Acquired Fund respectively received Class A, Class C, Institutional, and Class IR shares of the Survivor Fund, in an amount equal to the aggregate net asset value of his or her investment in the Acquired Fund. The exchange was a tax-free event to shareholders and the Survivor Fund was the accounting survivor in the reorganization.
|
| 2. SIGNIFICANT ACCOUNTING POLICIES |
The financial statements have been prepared in accordance with accounting principles generally accepted in the United States of America (“GAAP”) and require management to make estimates and assumptions that may affect the reported amounts and disclosures. Actual results may differ from those estimates and assumptions.
A. Investment Valuation — The Funds’ valuation policy is to value investments at fair value.
58
GOLDMAN SACHS FUNDAMENTAL EMERGING MARKETS EQUITY FUNDS
|
| 2. SIGNIFICANT ACCOUNTING POLICIES (continued) |
B. Investment Income and Investments — Investment income includes interest income and dividend income, net of any foreign withholding taxes, less any amounts reclaimable. Interest income is accrued daily and adjusted for amortization of premiums and accretion of discounts. Dividend income is recognized on ex-dividend date or, for certain foreign securities, as soon as such information is obtained subsequent to the ex-dividend date. Investment transactions are reflected on trade date. Realized gains and losses are calculated using identified cost. Investment transactions are recorded on the following business day for daily net asset value (“NAV”) calculations. Any foreign capital gains tax is accrued daily based upon net unrealized gains, and is payable upon sale of such investments. Distributions received from the Funds’ investments in U.S. real estate investment trusts (“REITs”) may be characterized as ordinary income, net capital gain or a return of capital. A return of capital is recorded by the Funds as a reduction to the cost basis of the REIT.
For derivative contracts, realized gains and losses are recorded upon settlement of the contract.
C. Class Allocations and Expenses — Investment income, realized and unrealized gain (loss), and non-class specific expenses of each Fund are allocated daily based upon the proportion of net assets of each class. Class specific expenses, where applicable, are borne by the respective share classes and include Distribution and Service, Transfer Agent and Service and Shareholder Administration fees. Non-class specific expenses directly incurred by a Fund are charged to that Fund, while such expenses incurred by the Trust are allocated across the respective Funds on a straight-line and/or pro-rata basis depending upon the nature of the expenses.
D. Federal Taxes and Distributions to Shareholders — It is each Fund’s policy to comply with the requirements of the Internal Revenue Code of 1986, as amended (the “Code”), applicable to regulated investment companies (mutual funds) and to distribute each year substantially all of its investment company taxable income and capital gains to its shareholders. Accordingly, the Funds are not required to make any provisions for the payment of federal income tax. Distributions to shareholders are recorded on the ex-dividend date. Income and capital gains distributions, if any, are declared and paid annually.
Net capital losses are carried forward to future fiscal years and may be used to the extent allowed by the Code to offset any future capital gains. Utilization of capital loss carryforwards will reduce the requirement of future capital gains distributions.
Under the Regulated Investment Company Modernization Act of 2010, the Funds are permitted to carry forward capital losses incurred in taxable years beginning after December 22, 2010 for an unlimited period. However, any losses incurred during those future taxable years will be required to be utilized prior to the losses incurred in pre-enactment taxable years. As a result of this ordering rule, pre-enactment capital loss carryforwards may be more likely to expire unused. Additionally, post-enactment capital losses that are carried forward will retain their character as either short-term or long-term capital losses rather than being considered all short-term as under previous law.
The characterization of distributions to shareholders for financial reporting purposes is determined in accordance with federal income tax rules, which may differ from GAAP. The source of each Fund’s distributions may be shown in the accompanying financial statements as either from net investment income, net realized gain or capital. Certain components of the Funds’ net assets on the Statements of Assets and Liabilities reflect permanent GAAP/tax differences based on the appropriate tax character.
E. Foreign Currency Translation — The accounting records and reporting currency of the Funds are maintained in United States (“U.S.”) dollars. Assets and liabilities denominated in foreign currencies are translated into U.S. dollars using the current exchange rates at the close of each business day. The effect of changes in foreign currency exchange rates on investments is included within net realized and unrealized gain (loss) on investments. Changes in the value of other assets and liabilities as a result of fluctuations in foreign exchange rates are included in the Statements of Operations within net change in unrealized gain (loss) on foreign currency transactions. Transactions denominated in foreign currencies are translated into U.S. dollars on the date the transaction occurred, the effects of which are included within net realized gain (loss) on foreign currency transactions.
59
GOLDMAN SACHS FUNDAMENTAL EMERGING MARKETS EQUITY FUNDS
Notes to Financial Statements (continued)
October 31, 2014
|
| 3. INVESTMENTS AND FAIR VALUE MEASUREMENTS |
The fair value of a financial instrument is the amount that would be received to sell an asset or paid to transfer a liability in an orderly transaction between market participants at the measurement date (i.e., the exit price). GAAP establishes a fair value hierarchy that prioritizes the inputs to valuation techniques used to measure fair value. The hierarchy gives the highest priority to unadjusted quoted prices in active markets for identical assets or liabilities (Level 1 measurements) and the lowest priority to unobservable inputs (Level 3 measurements). The levels used for classifying investments are not necessarily an indication of the risk associated with investing in these investments. The three levels of the fair value hierarchy are described below:
Level 1 — Unadjusted quoted prices in active markets that are accessible at the measurement date for identical, unrestricted assets or liabilities;
Level 2 — Quoted prices in markets that are not active or financial instruments for which significant inputs are observable (including, but not limited to, quoted prices for similar investments, interest rates, foreign exchange rates, volatility and credit spreads), either directly or indirectly;
Level 3 — Prices or valuations that require significant unobservable inputs (including GSAMI’s assumptions in determining fair value measurement).
The Trustees have adopted Valuation Procedures that govern the valuation of the portfolio investments held by the Funds, including investments for which market quotations are not readily available. The Trustees have delegated to GSAMI day-to-day responsibility for implementing and maintaining internal controls and procedures related to the valuation of the Funds’ portfolio investments. To assess the continuing appropriateness of pricing sources and methodologies, GSAMI regularly performs price verification procedures and issues challenges as necessary to third party pricing vendors or brokers, and any differences are reviewed in accordance with the Valuation Procedures.
A. Level 1 and Level 2 Fair Value Investments — The valuation techniques and significant inputs used in determining the fair values for investments classified as Level 1 and Level 2 are as follows:
Equity Securities — Equity securities and investment companies traded on a U.S. securities exchange or the NASDAQ system, or those located on certain foreign exchanges, including but not limited to the Americas, are valued daily at their last sale price or official closing price on the principal exchange or system on which they are traded. If no sale occurs, equity securities and exchange traded investment companies are valued at the last bid price for long positions and at the last ask price for short positions. Investments in investment companies (other than those that are exchange traded) are valued at the NAV on the valuation date. To the extent these investments are actively traded, they are classified as Level 1 of the fair value hierarchy, otherwise they are generally classified as Level 2.
Unlisted equity securities for which market quotations are available are valued at the last sale price on the valuation date, or if no sale occurs, at the last bid price. Securities traded on certain foreign securities exchanges are valued daily at fair value determined by an independent fair value service (if available) under Valuation Procedures approved by the Trustees and consistent with applicable regulatory guidance. The independent fair value service takes into account multiple factors including, but not limited to, movements in the securities markets, certain depositary receipts, futures contracts and foreign currency exchange rates that have occurred subsequent to the close of the foreign securities exchange. These investments are generally classified as Level 2 of the fair value hierarchy.
Derivative Contracts — A derivative is an instrument whose value is derived from underlying assets, indices, reference rates or a combination of these factors.
60
GOLDMAN SACHS FUNDAMENTAL EMERGING MARKETS EQUITY FUNDS
|
| 3. INVESTMENTS AND FAIR VALUE MEASUREMENTS (continued) |
Exchange-traded derivatives, including futures contracts, typically fall within Level 1 of the fair value hierarchy. Over-the-counter (“OTC”) and centrally cleared derivatives are valued using market transactions and other market evidence, including market-based inputs to models, calibration to market-clearing transactions, broker or dealer quotations, or other alternative pricing sources. Where models are used, the selection of a particular model to value OTC and centrally cleared derivatives depends upon the contractual terms of, and specific risks inherent in, the instrument, as well as the availability of pricing information in the market. Valuation models require a variety of inputs, including contractual terms, market prices, yield curves, credit curves, measures of volatility, voluntary and involuntary prepayment rates, loss severity rates and correlations of such inputs. For OTC and centrally cleared derivatives that trade in liquid markets, model inputs can generally be verified and model selection does not involve significant management judgment. OTC and centrally cleared derivatives are classified within Level 2 of the fair value hierarchy when significant inputs are corroborated by market evidence.
i. Forward Contracts — A forward contract is a contract between two parties to buy or sell an asset at a specified price on a future date. A forward contract settlement can occur on a cash or delivery basis. Forward contracts are marked-to-market daily using counterparty prices, and the change in value, if any, is recorded as an unrealized gain or loss.
A forward foreign currency contract is a forward contract in which a Fund agrees to receive or deliver a fixed quantity of one currency for another, at a pre-determined price at a future date. All forward foreign currency exchange contracts are marked-to-market daily at the applicable forward rate. Non-deliverable forward foreign currency exchange contracts are settled with the counterparty in cash without the delivery of foreign currency.
ii. Futures Contracts — Futures contracts are contracts to buy or sell a standardized quantity of a specified commodity or security and are valued based on exchanged settlement prices or independent market quotes. Futures contracts are valued at the last settlement price, or in the absence of a sale, the last bid price for long positions and at the last ask price for short positions, at the end of each day on the board of trade or exchange upon which they are traded. Upon entering into a futures contract, a Fund deposits cash or securities in an account on behalf of the broker in an amount sufficient to meet the initial margin requirement. Subsequent payments are made or received by a Fund equal to the daily change in the contract value and are recorded as variation margin receivable or payable with a corresponding offset to unrealized gains or losses.
B. Level 3 Fair Value Investments — To the extent that the aforementioned significant inputs are unobservable, or if quotations are not readily available, or if GSAMI believes that such quotations do not accurately reflect fair value, the fair value of the Funds’ investments may be determined under Valuation Procedures approved by the Trustees. GSAMI, consistent with its procedures and applicable regulatory guidance, may make an adjustment to the most recent valuation prices of either domestic or foreign securities in light of significant events to reflect what it believes to be the fair value of the securities at the time of determining a Fund’s NAV. Significant events which could affect a large number of securities in a particular market may include, but are not limited to: significant fluctuations in U.S. or foreign markets; market dislocations; market disruptions; or unscheduled market closings. Significant events which could also affect a single issuer may include, but are not limited to: corporate actions such as reorganizations, mergers and buy-outs; ratings downgrades; and bankruptcies.
61
GOLDMAN SACHS FUNDAMENTAL EMERGING MARKETS EQUITY FUNDS
Notes to Financial Statements (continued)
October 31, 2014
|
| 3. INVESTMENTS AND FAIR VALUE MEASUREMENTS (continued) |
C. Fair Value Hierarchy — The following is a summary of the Funds’ investments and derivatives classified in the fair value hierarchy as of October 31, 2014:
| | | | | | | | | | | | |
| | | |
| ASIA EQUITY | | | | | | | | | | | | |
| | | |
| Investment Type | | Level 1 | | | Level 2 | | | Level 3 | |
| Assets | | | | | | | | | | | | |
Common Stock and/or Other Equity Investments(a) | | | | | | | | | | | | |
Asia | | $ | 3,546,953 | | | $ | 72,917,235 | | | $ | — | |
North America | | | 538,536 | | | | 414,676 | | | | — | |
| Total | | $ | 4,085,489 | | | $ | 73,331,911 | | | $ | — | |
| | | |
| BRIC | | | | | | | | | | | | |
| | | |
| Investment Type | | Level 1 | | | Level 2 | | | Level 3 | |
| Assets | | | | | | | | | | | | |
Common Stock and/or Other Equity Investments(a) | | | | | | | | | | | | |
Asia | | $ | 10,880,768 | | | $ | 103,589,540 | | | $ | — | |
Europe | | | — | | | | 612,400 | | | | — | |
North America | | | 8,843,177 | | | | — | | | | — | |
South America | | | 2,783,886 | | | | 32,759,901 | | | | — | |
| Total | | $ | 22,507,831 | | | $ | 136,961,841 | | | $ | — | |
| | | |
| EMERGING MARKETS EQUITY | | | | | | | | | | | | |
| | | |
| Investment Type | | Level 1 | | | Level 2 | | | Level 3 | |
| Assets | | | | | | | | | | | | |
Common Stock and/or Other Equity Investments(a) | | | | | | | | | | | | |
Africa | | $ | — | | | $ | 15,612,088 | | | $ | — | |
Asia | | | 15,135,024 | | | | 230,753,552 | | | | — | |
Europe | | | — | | | | 11,606,091 | | | | — | |
North America | | | 34,159,721 | | | | — | | | | — | |
South America | | | 16,097,846 | | | | 37,258,097 | | | | — | |
| Total | | $ | 65,392,591 | | | $ | 295,229,828 | | | $ | — | |
62
GOLDMAN SACHS FUNDAMENTAL EMERGING MARKETS EQUITY FUNDS
|
| 3. INVESTMENTS AND FAIR VALUE MEASUREMENTS (continued) |
| | | | | | | | | | | | |
| | | |
| N-11 EQUITY | | | | | | | | | | | | |
| | | |
| Investment Type | | Level 1 | | | Level 2 | | | Level 3 | |
| Assets | | | | | | | | | | | | |
Common Stock and/or Other Equity Investments(a) | | | | | | | | | | | | |
Africa | | $ | — | | | $ | 57,559,775 | | | $ | — | |
Asia | | | — | | | | 276,347,708 | | | | — | |
Europe | | | — | | | | 3,007,466 | | | | — | |
North America | | | 102,050,272 | | | | — | | | | — | |
| Total | | $ | 102,050,272 | | | $ | 336,914,949 | | | $ | — | |
| (a) | | Amounts are disclosed by continent to highlight the impact of time zone differences between local market close and the calculation of net asset value. Security valuations are based on the principal exchange or system on which they are traded, which may differ from country of domicile. The Funds utilize fair value model prices provided by an independent fair value service for international equities, resulting in a Level 2 classification. |
For further information regarding security characteristics, see the Schedules of Investments.
|
| 4. INVESTMENTS IN DERIVATIVES |
The following table sets forth, by certain risk types, the Funds’ gains (losses) related to these derivatives and their indicative volumes for the fiscal year ended October 31, 2014. These gains (losses) should be considered in the context that these derivative contracts may have been executed to create investment opportunities and/or economically hedge certain investments, and accordingly, certain gains (losses) on such derivative contracts may offset certain (losses) gains attributable to investments. These gains (losses) are included in “Net realized gain (loss)” or “Net change in unrealized gain (loss)” on the Statements of Operations:
| | | | | | | | | | | | | | | | |
| Fund | | Risk | | Statements of Operations | | Net Realized
Gain (Loss) | | | Net Change in
Unrealized
Gain (Loss) | | | Average
Number of
Contracts(a) | |
| Emerging Market Equity | | Equity | | Net realized gain (loss) from futures contracts/Net change in unrealized gain (loss) on futures contracts | | $ | (165,103 | ) | | $ | — | | | | 1 | |
| N-11 Equity | | Equity | | Net realized gain (loss) from futures contracts/Net change in unrealized gain (loss) on futures contracts | | | 70,584 | | | | — | | | | 3 | |
| (a) | | Average number of contracts is based on the average of month end balances for the year ended December 31, 2014. |
63
GOLDMAN SACHS FUNDAMENTAL EMERGING MARKETS EQUITY FUNDS
Notes to Financial Statements (continued)
October 31, 2014
|
| 5. AGREEMENTS AND AFFILIATED TRANSACTIONS |
A. Management Agreement — Under the Agreement, GSAMI manages the Funds, subject to the general supervision of the Trustees.
As compensation for the services rendered pursuant to the Agreement, the assumption of the expenses related thereto and administration of the Funds’ business affairs, including providing facilities, GSAMI is entitled to a management fee, accrued daily and paid monthly, equal to an annual percentage rate of each Fund’s average daily net assets.
For the fiscal year ended October 31, 2014, contractual and effective net management fees with GSAMI were at the following rates:
| | | | | | | | | | | | | | | | | | | | | | | | | | | | | | |
| | | | | Contractual Management Fee Rate | | | Effective Net
Management
Fee Rate | |
| Fund | | | | First
$1 billion | | | Next
$1 billion | | | Next
$3 billion | | | Next
$3 billion | | | Over
$8 billion | | | Effective
Rate | | |
Asia Equity | | | | | 1.00 | % | | | 0.90 | % | | | 0.86 | % | | | 0.84 | % | | | 0.82 | % | | | 1.00 | % | | | 1.00 | % |
BRIC | | | | | 1.30 | | | | 1.30 | | | | 1.17 | | | | 1.11 | | | | 1.09 | | | | 1.30 | | | | 1.04 | * |
Emerging Markets Equity | | | | | 1.20 | | | | 1.20 | | | | 1.08 | | | | 1.03 | | | | 1.01 | | | | 1.20 | | | | 1.02 | * |
N-11 Equity | | | | | 1.30 | | | | 1.30 | | | | 1.24 | | | | 1.21 | | | | 1.19 | | | | 1.30 | | | | 1.13 | * |
| * | | GSAMI has agreed to waive a portion of its management fee in order to achieve net management rates as defined in the Funds’ most recent prospectuses. These waivers will be effective through at least February 28, 2015, and prior to such date, GSAMI may not terminate the arrangements without the approval of the Trustees. The Effective Net Management Rates above are calculated based on management rates before and after the waivers had been adjusted, if applicable. |
B. Distribution and Service Plans — The Trust, on behalf of each Fund, has adopted Distribution and Service Plans (the “Plans”). Under the Plans, Goldman Sachs, which serves as distributor (the “Distributor”), is entitled to a fee accrued daily and paid monthly, for distribution services and personal and account maintenance services, which may then be paid by Goldman Sachs to authorized dealers, at the following annual rates calculated on a Fund’s average daily net assets of each respective share class:
| | | | | | | | | | | | |
| | | Distribution and Service Plan Rates | |
| | | Class A* | | | Class B | | | Class C | |
Distribution Plan | | | 0.25 | % | | | 0.75 | % | | | 0.75 | % |
Service Plan | | | — | | | | 0.25 | | | | 0.25 | |
| * | | With respect to Class A Shares, the Distributor at its discretion may use compensation for distribution services paid under the Distribution Plan to compensate service organizations for personal and account maintenance services and expenses as long as such total compensation does not exceed the maximum cap on “service fees” imposed by the Financial Industry Regulatory Authority. |
64
GOLDMAN SACHS FUNDAMENTAL EMERGING MARKETS EQUITY FUNDS
|
| 5. AGREEMENTS AND AFFILIATED TRANSACTIONS (continued) |
C. Distribution Agreement — Goldman Sachs, as Distributor of the shares of the Funds pursuant to a Distribution Agreement, may retain a portion of the Class A front end sales charge and Class B and Class C Shares’ CDSC. During the fiscal year ended October 31, 2014, Goldman Sachs advised that it retained the following amounts:
| | | | | | | | | | |
| | | | | Front End
Sales Charge | | | Contingent Deferred
Sales Charge* | |
| Fund | | | | Class A | | | Class C | |
Asia Equity | | | | $ | 2,326 | | | $ | — | |
BRIC | | | | | 6,931 | | | | 162 | |
Emerging Markets Equity | | | | | 6,241 | | | | — | |
N-11 Equity | | | | | 5,737 | | | | — | |
| * | | Goldman Sachs did not retain any contingent deferred sales charges for Class B Shares. |
D. Service Plan and Shareholder Administration Plan — The Trust, on behalf of each Fund that offers Service Shares, has adopted a Service Plan and a Shareholder Administration Plan. These plans allow for service organizations to provide varying levels of personal and account maintenance and shareholder administration services to their customers who are beneficial owners of such shares. The Service Plan and Shareholder Administration Plan each provide for compensation to the service organizations which is accrued daily and paid monthly at an annual rate of 0.25% (0.50% in aggregate) of the average daily net assets of the Service Shares.
E. Transfer Agency Agreement — Goldman Sachs also serves as the transfer agent of the Funds for a fee pursuant to the Transfer Agency Agreement. The fees charged for such transfer agency services are accrued daily and paid monthly at annual rates as follows: 0.19% of the average daily net assets of Class A, Class B, Class C, and Class IR Shares; and 0.04% of the average daily net assets of Institutional and Service Shares.
F. Other Expense Agreements and Affiliated Transactions — GSAMI has agreed to reduce or limit certain “Other Expenses” of the Funds (excluding transfer agency fees and expenses, service fees and shareholder administration fees (as applicable), taxes, interest, brokerage fees, shareholder meetings, litigation, indemnification and extraordinary expenses) to the extent such expenses exceed, on an annual basis, a percentage rate of the average daily net assets of each Fund. Such Other Expense reimbursements, if any, are accrued daily and paid monthly. In addition, the Funds are not obligated to reimburse GSAMI for prior fiscal year expense reimbursements, if any. The Other Expense limitations as an annual percentage rate of average daily net assets for the Asia Equity, BRIC, Emerging Markets Equity and N-11 Equity Funds are 0.254%, 0.264%, 0.264% and 0.164%, respectively. These Other Expense limitations will remain in place through at least February 28, 2015 and prior to such date GSAMI may not terminate the arrangements without the approval of the Trustees. The Funds bear their respective share of costs related to proxy and shareholder meetings, and GSAMI has agreed to reimburse each Fund to the extent such expense exceed a specified percentage of the Fund’s net assets. In addition, the Funds have entered into certain offset arrangements with the custodian and the transfer agent, which may result in a reduction of the Funds’ expenses and are received irrespective of the application of the “Other Expense” limitations described above.
65
GOLDMAN SACHS FUNDAMENTAL EMERGING MARKETS EQUITY FUNDS
Notes to Financial Statements (continued)
October 31, 2014
|
| 5. AGREEMENTS AND AFFILIATED TRANSACTIONS (continued) |
For the fiscal year ended October 31, 2014, these expense reductions, including any fee waivers and Other Expense reimbursements, were as follows:
| | | | | | | | | | | | | | | | | | |
| Fund | | | | Management Fee Waiver | | | Other
Expense
Reimbursement | | | Custody Fee
Credits | | | Total
Expense
Reductions | |
Asia Equity | | | | $ | — | | | $ | 378,771 | | | $ | 1,038 | | | $ | 379,809 | |
BRIC | | | | | 501,778 | | | | 51,880 | | | | 656 | | | | 554,314 | |
Emerging Markets Equity | | | | | 672,876 | | | | 159,291 | | | | 1,941 | | | | 834,108 | |
N-11 Equity | | | | | 766,617 | | | | 758,097 | | | | 3,766 | | | | 1,528,480 | |
G. Line of Credit Facility — As of October 31, 2014, the Funds participated in a $1,080,000,000 committed, unsecured revolving line of credit facility (the “facility”) together with other funds of the Trust and registered investment companies having management agreements with GSAMI or its affiliates (“Other Borrowers”). Pursuant to the terms of the facility, the Funds and Other Borrowers could increase the credit amount by an additional $120,000,000, for a total of up to $1,200,000,000. This facility is to be used solely for temporary or emergency purposes, which may include the funding of redemptions. The interest rate on borrowings is based on the federal funds rate. The facility also requires a fee to be paid by the Funds based on the amount of the commitment that has not been utilized. For the fiscal year ended October 31, 2014, the Funds did not have any borrowings under the facility.
H. Other Transactions with Affiliates — For the fiscal year ended October 31, 2014, Goldman Sachs earned $386, $2,090 and $612 in brokerage commissions from portfolio transactions, including futures transactions executed with Goldman Sachs as the Futures Commission Merchant, on behalf of the BRIC, Emerging Markets Equity Funds and N-11 Equity Fund, respectively.
As of October 31, 2014 the Goldman Sachs Satellite Strategies Portfolio was the beneficial owner of 18% or more of total outstanding shares of the Emerging Markets Equity Fund.
As of October 31, 2014, the Goldman Sachs Group, Inc. was the beneficial owner of approximately 48% of the Class IR Shares of the Asia Equity Fund.
|
| 6. PORTFOLIO SECURITIES TRANSACTIONS |
The cost of purchases and proceeds from sales and maturities of long-term securities for the fiscal year ended October 31, 2014, were as follows:
| | | | | | | | | | |
| Fund | | | | Purchases | | | Sales and Maturities | |
Asia Equity | | | | $ | 118,471,308 | | | $ | 124,456,827 | |
BRIC | | | | | 124,473,421 | | | | 223,291,236 | |
Emerging Markets Equity | | | | | 430,254,801 | | | | 537,982,773 | |
N-11 Equity | | | | | 181,595,661 | | | | 224,143,971 | |
66
GOLDMAN SACHS FUNDAMENTAL EMERGING MARKETS EQUITY FUNDS
The tax character of distributions paid during the fiscal year ended October 31, 2014 was as follows:
| | | | | | | | | | | | | | | | |
| | | Asia Equity | | | BRIC | | | Emerging Markets
Equity | | | N-11 Equity | |
Distributions paid from: | | | | | | | | | | | | | | | | |
Ordinary income | | $ | 395,074 | | | $ | 2,592,155 | | | $ | 2,901,821 | | | $ | 3,543,980 | |
The tax character of distributions paid during the fiscal year ended October 31, 2013 was as follows:
| | | | | | | | | | | | | | | | | | | | |
| | | Asia Equity | | | BRIC | | | China Equity | | | Emerging Markets
Equity | | | N-11 Equity | |
Distributions paid from: | | | | | | | | | | | | | | | | | | | | |
Ordinary income | | $ | 756,672 | | | $ | 3,087,592 | | | $ | 87,571 | | | $ | 3,200,935 | | | $ | 416,916 | |
As of October 31, 2014, the components of accumulated earnings (losses) on a tax-basis were as follows:
| | | | | | | | | | | | | | | | |
| | | Asia Equity | | | BRIC | | | Emerging Markets
Equity | | | N-11 Equity | |
Undistributed ordinary income — net | | $ | 187,703 | | | $ | 656,761 | | | $ | 922,423 | | | $ | 826,912 | |
Capital loss carryforwards: | | | | | | | | | | | | | | | | |
Expiring 2016(1) | | $ | — | | | $ | (46,894,391 | ) | | $ | (16,387,620 | ) | | $ | — | |
Expiring 2017(1) | | | (11,355,624 | ) | | | (151,677,917 | ) | | | (445,745,035 | ) | | | — | |
Perpetual Long-term | | | — | | | | (16,568,112 | ) | | | — | | | | (1,196,012 | ) |
Perpetual Short-term | | | — | | | | (20,210,840 | ) | | | — | | | | (10,084,318 | ) |
Total capital loss carryforwards | | $ | (11,355,624 | ) | | $ | (235,351,260 | ) | | $ | (462,132,655 | ) | | $ | (11,280,330 | ) |
Unrealized gains — net | | | 978,317 | | | | 10,580,329 | | | | 29,231,104 | | | | 29,313,217 | |
Total accumulated gains (losses) — net | | $ | (10,189,604 | ) | | $ | (224,114,170 | ) | | $ | (431,979,128 | ) | | $ | 18,859,799 | |
| (1) | | Expiration occurs on October 31 of the year indicated. The Asia Equity, BRIC and Emerging Markets Equity Funds utilized $8,891,645, $76,898, and $14,868,620, respectively, of capital losses in the current fiscal year. |
As of October 31, 2014, the Funds’ aggregate security unrealized gains and losses based on cost for U.S. federal income tax purposes were as follows:
| | | | | | | | | | | | | | | | |
| | | Asia Equity | | | BRIC | | | Emerging Markets Equity | | | N-11 Equity | |
Tax cost | | $ | 76,205,493 | | | $ | 148,847,649 | | | $ | 330,484,746 | | | $ | 409,500,433 | |
Gross unrealized gain | | | 7,636,354 | | | | 25,185,184 | | | | 49,062,583 | | | | 53,673,112 | |
Gross unrealized loss | | | (6,424,447 | ) | | | (14,563,161 | ) | | | (18,924,910 | ) | | | (24,208,324 | ) |
Net unrealized security gain | | $ | 1,211,907 | | | $ | 10,622,023 | | | $ | 30,137,673 | | | $ | 29,464,788 | |
Net unrealized loss on other investments | | | (233,590 | ) | | | (41,694 | ) | | | (906,569 | ) | | | (151,571 | ) |
Net realized gain | | $ | 978,317 | | | $ | 10,580,329 | | | $ | 29,231,104 | | | $ | 29,313,217 | |
67
GOLDMAN SACHS FUNDAMENTAL EMERGING MARKETS EQUITY FUNDS
Notes to Financial Statements (continued)
October 31, 2014
|
| 7. TAX INFORMATION (continued) |
The difference between GAAP-basis and tax-basis unrealized gains (losses) is attributable primarily to wash sales.
In order to present certain components of the Funds’ capital accounts on a tax-basis, certain reclassifications have been recorded to the Funds’ accounts. These reclassifications have no impact on the net asset value of the Funds and result primarily from fund mergers and differences in the tax treatment of foreign currency transactions, passive foreign investment company investments and underlying fund investments.
| | | | | | | | | | | | | | |
| Fund | | | | Paid-in Capital | | | Accumulated
Net Realized
Gain (Loss) | | | Undistributed
Net Investment
Income (Loss) | |
Asia Equity | | | | $ | 383,781 | | | $ | (592,304 | ) | | $ | 208,523 | |
BRIC | | | | | — | | | | 110,009 | | | | (110,009 | ) |
Emerging Markets Equity | | | | | — | | | | 693,567 | | | | (693,567 | ) |
N-11 Equity | | | | | — | | | | (974,262 | ) | | | 974,262 | |
GSAMI has reviewed the Funds’ tax positions for all open tax years (the current and prior three years, as applicable) and has concluded that no provision for income tax is required in the Funds’ financial statements. Such open tax years remain subject to examination and adjustment by tax authorities.
The Funds’ risks include, but are not limited to, the following:
Foreign Custody Risk — A Fund that invests in foreign securities may hold such securities and foreign currency with foreign banks, agents, and securities depositories appointed by the Fund’s custodian (each a “Foreign Custodian”). Some foreign custodians may be recently organized or new to the foreign custody business. In some countries, Foreign Custodians may be subject to little or no regulatory oversight or independent evaluation of their operations. Further, the laws of certain countries may place limitations on a Fund’s ability to recover its assets if a Foreign Custodian enters bankruptcy. Investments in emerging markets may be subject to greater custody risks than investments in more developed markets. Custody services in emerging market countries are very often undeveloped and may be considerably less well regulated than in more developed countries, and thus may not afford the same level of investor protection as would apply in developed countries.
Geographic Risk — Concentration of the investments of a Fund in issuers located in a particular country or region will subject the Fund, to a greater extent than if investments were less concentrated, to the risks of adverse securities markets, exchange rates and social, political, regulatory or economic events which may occur in a given country or region. The Asia Equity Fund invests primarily in equity investments in Asian issuers. The BRIC Fund invests primarily in equity investments in Brazil, Russia, India and China issuers. The N-11 Equity Fund invests primarily in equity investments in the N-11 countries, and may invest up to 50% of its assets in any one N-11 country.
Investments in Other Investment Companies — As a shareholder of another investment company, including an exchange traded fund (“ETF”), a Fund will directly bear its proportionate share of any management fees and other expenses paid by such other investment companies, in addition to the fees and expenses regularly borne by the Fund. ETFs are subject to risks that do not apply to conventional mutual funds, including but not limited to the following: (i) the market price of the ETF’s shares may trade at a premium or a discount to their NAV; and (ii) an active trading market for an ETF’s shares may not develop or be maintained.
68
GOLDMAN SACHS FUNDAMENTAL EMERGING MARKETS EQUITY FUNDS
|
| 8. OTHER RISKS (continued) |
Large Shareholder Transactions Risk — A Fund may experience adverse effects when certain large shareholders, such as other funds, institutional investors (including those trading by use of non-discretionary mathematical formulas), financial intermediaries (who may make investment decisions on behalf of underlying clients and/or include a Fund in their investment model), individuals, accounts and Goldman Sachs affiliates, purchase or redeem large amounts of shares of a Fund. Such large shareholder redemptions may cause the Fund to sell portfolio securities at times when it would not otherwise do so, which may negatively impact a Fund’s NAV and liquidity. Similarly, large Fund share purchases may adversely affect a Fund’s performance to the extent that a Fund is delayed in investing new cash and is required to maintain a larger cash position than it ordinarily would. These transactions may also accelerate the realization of taxable income to shareholders if such sales of investments resulted in gains, and may also increase transaction costs. In addition, a large redemption could result in a Fund’s current expenses being allocated over a smaller asset base, leading to an increase in the Fund’s expense ratio.
Liquidity Risk — The Funds may make investments that are illiquid or that may become less liquid in response to market developments or adverse investor perceptions. Illiquid investments may be more difficult to value. Liquidity risk may also refer to the risk that a Fund will not be able to pay redemption proceeds within the allowable time period because of unusual market conditions, an unusually high volume of redemption requests, or other reasons. To meet redemption requests, a Fund may be forced to sell investments at an unfavorable time and/or under unfavorable conditions.
Market and Credit Risks — In the normal course of business, the Funds trade financial instruments and enter into financial transactions where risk of potential loss exists due to changes in the market (market risk). Additionally, the Funds may also be exposed to credit risk in the event that an issuer or guarantor fails to perform or that an institution or entity with which the Funds have unsettled or open transactions defaults.
Investing in foreign markets may involve special risks and considerations not typically associated with investing in the U.S. Foreign securities may be subject to risk of loss because of more or less foreign government regulation, less public information and less economic, political and social stability in the countries in which the Funds invest. Loss may also result from the imposition of exchange controls, confiscations and other government restrictions by the U.S. or other governments, or from problems in registration, settlement or custody. Foreign risk also involves the risk of negative foreign currency rate fluctuations, which may cause the value of securities denominated in such foreign currency (or other instruments through which the Funds have exposure to foreign currencies) to decline in value. Currency exchange rates may fluctuate significantly over short periods of time. To the extent that the Funds also invest in securities of issuers located in emerging markets, these risks may be more pronounced.
Non-Diversification Risk — The BRIC and N-11 Equity Funds are non-diversified, meaning that they are permitted to invest a larger percentage of their assets in fewer issuers than diversified mutual funds. Thus, a Fund may be more susceptible to adverse developments affecting any single issuer held in its portfolio, and may be more susceptible to greater losses because of these developments.
69
GOLDMAN SACHS FUNDAMENTAL EMERGING MARKETS EQUITY FUNDS
Notes to Financial Statements (continued)
October 31, 2014
Under the Trust’s organizational documents, its Trustees, officers, employees and agents are indemnified, to the extent permitted by the Act and state law, against certain liabilities that may arise out of performance of their duties to the Funds. Additionally, in the course of business, the Funds enter into contracts that contain a variety of indemnification clauses. The Funds’ maximum exposure under these arrangements is unknown, as this would involve future claims that may be made against the Funds that have not yet occurred. However, GSAMI believes the risk of loss under these arrangements to be remote.
Mergers and Reorganization — At a meeting held on February 11, 2014, the Board of Trustees of Trust approved an Agreement and Plan of Reorganization (the “Reorganization Agreement”) providing for the tax-free acquisition of the Goldman Sachs China Equity Fund by the Goldman Sachs Asia Equity Fund. The acquisition was completed on April 28, 2014 as of April 25, 2014.
Pursuant to the Reorganization Agreement, the assets and liabilities of the Acquired Fund’s Shares were transferred in exchange for the Survivor Fund’s Shares, in a tax-free exchange as follows:
| | | | | | | | | | | | |
| Survivor/Acquired Fund | | Exchanged Shares Of Survivor Issued | | | Value of Exchanged
Shares | | | Acquired Fund’s Shares
Outstanding as of April 25, 2014 | |
Asia Equity Class A/China Equity Class A | | | 1,463 | | | $ | 28,606 | | | | 3,258 | |
Asia Equity Class C/China Equity Class C | | | 16,455 | | | | 301,777 | | | | 34,927 | |
Asia Equity Institutional Class/China Equity Institutional Class | | | 1,213,633 | | | | 24,806,694 | | | | 2,815,194 | |
Asia Equity Class IR/China Equity Class IR | | | 443 | | | | 9,065 | | | | 1,030 | |
The following chart shows the Survivor Fund’s and Acquired Fund’s aggregate net assets (immediately before and after the completion of the acquisition) and the Acquired Fund’s unrealized appreciation:
| | | | | | | | | | | | | | | | | | | | |
| Survivor/Acquired Fund | | Survivor Fund’s Aggregate net Assets before acquisition | | | Acquired Fund’s Aggregate Net Assets Before acquisition | | | Survivor Fund’s
Aggregate Net
Assets Immediately
after acquisition | | | Acquired Fund’s
Unrealized
Appreciation | | | Acquired Fund’s
Capital Loss
Carryforward | |
Asia Equity/China Equity | | $ | 57,966,754 | | | $ | 25,146,142 | | | $ | 83,112,896 | | | $ | 1,103,562 | | | $ | 296,719 | |
70
GOLDMAN SACHS FUNDAMENTAL EMERGING MARKETS EQUITY FUNDS
With the exception of the conversion of Class B Shares, subsequent events after the Statement of Assets and Liabilities date have been evaluated through the date the financial statements were issued. GSAMI has concluded that there is no impact requiring adjustment or disclosure in the financial statements.
71
GOLDMAN SACHS FUNDAMENTAL EMERGING MARKETS EQUITY FUNDS
Notes to Financial Statements (continued)
October 31, 2014
|
| 12. SUMMARY OF SHARE TRANSACTIONS |
Share activity is as follows:
| | | | | | | | | | | | | | | | |
| | | Asia Equity Fund | |
| | | | |
| | | For the Fiscal Year Ended
October 31, 2014 | | | For the Fiscal Year Ended
October 31, 2013 | |
| | | | |
| | | Shares | | | Dollars | | | Shares | | | Dollars | |
| | | | |
| Class A Shares | | | | | | | | | | | | | | | | |
Shares sold | | | 372,532 | | | $ | 7,189,718 | | | | 48,908 | | | $ | 904,805 | |
Shares issued in connection with merger | | | 1,463 | | | | 28,606 | | | | — | | | | — | |
Shares converted from Class B | | | 1,317 | | | | 26,035 | | | | 805 | | | | 14,712 | |
Reinvestment of distributions | | | 2,986 | | | | 56,823 | | | | 5,101 | | | | 94,117 | |
Shares redeemed | | | (427,608 | ) | | | (8,338,547 | ) | | | (172,410 | ) | | | (3,143,752 | ) |
| | | | (49,310 | ) | | | (1,037,365 | ) | | | (117,596 | ) | | | (2,130,118 | ) |
| Class B Shares | | | | | | | | | | | | | | | | |
Shares sold | | | — | (a) | | | 6 | | | | 1,489 | | | | 26,519 | |
Shares converted to Class A | | | (1,387 | ) | | | (26,035 | ) | | | (845 | ) | | | (14,712 | ) |
Reinvestment of distributions | | | — | | | | — | | | | 93 | | | | 1,635 | |
Shares redeemed | | | (17,216 | ) | | | (320,899 | ) | | | (15,235 | ) | | | (269,068 | ) |
| | | | (18,603 | ) | | | (346,928 | ) | | | (14,498 | ) | | | (255,626 | ) |
| Class C Shares | | | | | | | | | | | | | | | | |
Shares sold | | | 30,077 | | | | 558,916 | | | | 20,039 | | | | 350,387 | |
Shares issued in connection with merger | | | 16,455 | | | | 301,777 | | | | — | | | | — | |
Reinvestment of distributions | | | — | | | | — | | | | 608 | | | | 10,581 | |
Shares redeemed | | | (63,003 | ) | | | (1,163,371 | ) | | | (51,355 | ) | | | (887,537 | ) |
| | | | (16,471 | ) | | | (302,678 | ) | | | (30,708 | ) | | | (526,569 | ) |
| Institutional Shares | | | | | | | | | | | | | | | | |
Shares sold | | | 142,559 | | | | 2,978,318 | | | | 117,645 | | | | 2,283,037 | |
Shares issued in connection with merger | | | 1,213,633 | | | | 24,806,694 | | | | — | | | | — | |
Reinvestment of distributions | | | 16,939 | | | | 336,570 | | | | 33,315 | | | | 641,652 | |
Shares redeemed | | | (520,995 | ) | | | (10,549,989 | ) | | | (374,927 | ) | | | (7,225,071 | ) |
| | | | 852,136 | | | | 17,571,593 | | | | (223,967 | ) | | | (4,300,382 | ) |
| Class IR Shares(b) | | | | | | | | | | | | | | | | |
Shares sold | | | 1,995 | | | | 42,341 | | | | — | | | | — | |
Shares issued in connection with merger | | | 443 | | | | 9,065 | | | | — | | | | — | |
| | | | 2,438 | | | | 51,406 | | | | — | | | | — | |
NET INCREASE (DECREASE) | | | 770,190 | | | $ | 15,936,028 | | | | (386,769 | ) | | $ | (7,212,695 | ) |
| (a) | | Shares are less than 1. |
| (b) | | Class IR Shares commenced operations on February 28, 2014. |
72
GOLDMAN SACHS FUNDAMENTAL EMERGING MARKETS EQUITY FUNDS
|
| 12. SUMMARY OF SHARE TRANSACTIONS (continued) |
Share activity is as follows:
| | | | | | | | | | | | | | | | |
| | | BRIC Fund | |
| | | | |
| | | For the Fiscal Year Ended
October 31, 2014 | | | For the Fiscal Year Ended
October 31, 2013 | |
| | | | |
| | | Shares | | | Dollars | | | Shares | | | Dollars | |
| | | | |
| Class A Shares | | | | | | | | | | | | | | | | |
Shares sold | | | 415,883 | | | $ | 5,385,668 | | | | 1,142,685 | | | $ | 14,903,715 | |
Reinvestment of distributions | | | 64,277 | | | | 830,475 | | | | 69,332 | | | | 906,863 | |
Shares redeemed | | | (3,044,695 | ) | | | (39,398,354 | ) | | | (5,337,106 | ) | | | (67,703,737 | ) |
| | | | (2,564,535 | ) | | | (33,182,211 | ) | | | (4,125,089 | ) | | | (51,893,159 | ) |
| Class C Shares | | | | | | | | | | | | | | | | |
Shares sold | | | 187,723 | | | | 2,283,648 | | | | 352,073 | | | | 4,270,279 | |
Reinvestment of distributions | | | 5,310 | | | | 65,892 | | | | — | | | | — | |
Shares redeemed | | | (1,439,564 | ) | | | (17,614,746 | ) | | | (2,537,381 | ) | | | (30,561,235 | ) |
| | | | (1,246,531 | ) | | | (15,265,206 | ) | | | (2,185,308 | ) | | | (26,290,956 | ) |
| Institutional Shares | | | | | | | | | | | | | | | | |
Shares sold | | | 519,033 | | | | 7,130,132 | | | | 2,359,241 | | | | 31,462,752 | |
Reinvestment of distributions | | | 113,871 | | | | 1,497,408 | | | | 142,348 | | | | 1,897,492 | |
Shares redeemed | | | (4,545,962 | ) | | | (59,413,491 | ) | | | (6,818,804 | ) | | | (85,565,784 | ) |
| | | | (3,913,058 | ) | | | (50,785,951 | ) | | | (4,317,215 | ) | | | (52,205,540 | ) |
| Class IR Shares | | | | | | | | | | | | | | | | |
Shares sold | | | 39,434 | | | | 519,031 | | | | 23,044 | | | | 308,544 | |
Reinvestment of distributions | | | 712 | | | | 9,450 | | | | 1,903 | | | | 25,542 | |
Shares redeemed | | | (54,713 | ) | | | (711,230 | ) | | | (137,097 | ) | | | (1,737,910 | ) |
| | | | (14,567 | ) | | | (182,749 | ) | | | (112,150 | ) | | | (1,403,824 | ) |
NET DECREASE | | | (7,738,691 | ) | | $ | (99,416,117 | ) | | | (10,739,762 | ) | | $ | (131,793,479 | ) |
73
GOLDMAN SACHS FUNDAMENTAL EMERGING MARKETS EQUITY FUNDS
Notes to Financial Statements (continued)
October 31, 2014
|
| 12. SUMMARY OF SHARE TRANSACTIONS (continued) |
Share activity is as follows:
| | | | | | | | | | | | | | | | |
| | | Emerging Markets Equity Fund | |
| | | | |
| | | For the Fiscal Year Ended
October 31, 2014 | | | For the Fiscal Year Ended
October 31, 2013 | |
| | | | |
| | | Shares | | | Dollars | | | Shares | | | Dollars | |
| | | | |
| Class A Shares | | | | | | | | | | | | | | | | |
Shares sold | | | 477,560 | | | $ | 7,381,033 | | | | 568,041 | | | $ | 8,500,222 | |
Shares converted from Class B | | | 7,144 | | | | 108,897 | | | | 5,209 | | | | 78,747 | |
Reinvestment of distributions | | | 9,026 | | | | 136,017 | | | | 12,073 | | | | 184,480 | |
Shares redeemed | | | (1,140,560 | ) | | | (17,611,834 | ) | | | (829,122 | ) | | | (12,376,906 | ) |
| | | | (646,830 | ) | | | (9,985,887 | ) | | | (243,799 | ) | | | (3,613,457 | ) |
| Class B Shares | | | | | | | | | | | | | | | | |
Shares sold | | | 549 | | | | 7,536 | | | | 2,924 | | | | 39,354 | |
Shares converted to Class A | | | (7,885 | ) | | | (108,897 | ) | | | (5,727 | ) | | | (78,747 | ) |
Shares redeemed | | | (124,011 | ) | | | (1,728,895 | ) | | | (102,860 | ) | | | (1,392,253 | ) |
| | | | (131,347 | ) | | | (1,830,256 | ) | | | (105,663 | ) | | | (1,431,646 | ) |
| Class C Shares | | | | | | | | | | | | | | | | |
Shares sold | | | 123,764 | | | | 1,763,211 | | | | 150,214 | | | | 2,081,408 | |
Shares redeemed | | | (208,565 | ) | | | (2,886,901 | ) | | | (442,875 | ) | | | (5,973,906 | ) |
| | | | (84,801 | ) | | | (1,123,690 | ) | | | (292,661 | ) | | | (3,892,498 | ) |
| Institutional Shares | | | | | | | | | | | | | | | | |
Shares sold | | | 3,001,698 | | | | 49,094,434 | | | | 10,131,460 | | | | 161,225,599 | |
Reinvestment of distributions | | | 158,000 | | | | 2,532,738 | | | | 163,167 | | | | 2,651,459 | |
Shares redeemed | | | (9,306,768 | ) | | | (149,200,716 | ) | | | (6,178,223 | ) | | | (95,880,633 | ) |
| | | | (6,147,070 | ) | | | (97,573,544 | ) | | | 4,116,404 | | | | 67,996,425 | |
| Service Shares | | | | | | | | | | | | | | | | |
Shares sold | | | 400,257 | | | | 6,069,974 | | | | 642,685 | | | | 9,497,267 | |
Reinvestment of distributions | | | 2,389 | | | | 34,951 | | | | 5,244 | | | | 77,760 | |
Shares redeemed | | | (366,690 | ) | | | (5,566,727 | ) | | | (742,772 | ) | | | (10,391,730 | ) |
| | | | 35,956 | | | | 538,198 | | | | (94,843 | ) | | | (816,703 | ) |
| Class IR Shares | | | | | | | | | | | | | | | | |
Shares sold | | | 5,140 | | | | 82,952 | | | | 18,949 | | | | 300,906 | |
Reinvestment of distributions | | | 118 | | | | 1,886 | | | | 120 | | | | 1,945 | |
Shares redeemed | | | (7,275 | ) | | | (117,780 | ) | | | (14,041 | ) | | | (215,833 | ) |
| | | | (2,017 | ) | | | (32,942 | ) | | | 5,028 | | | | 87,018 | |
NET INCREASE (DECREASE) | | | (6,976,109 | ) | | $ | (110,008,121 | ) | | | 3,384,466 | | | $ | 58,329,139 | |
74
GOLDMAN SACHS FUNDAMENTAL EMERGING MARKETS EQUITY FUNDS
|
| 12. SUMMARY OF SHARE TRANSACTIONS (continued) |
Share activity is as follows:
| | | | | | | | | | | | | | | | |
| | | N-11 Equity Fund | |
| | | | |
| | | For the Fiscal Year Ended
October 31, 2014 | | | For the Fiscal Year Ended
October 31, 2013 | |
| | | | |
| | | Shares | | | Dollars | | | Shares | | | Dollars | |
| | | | |
| Class A Shares | | | | | | | | | | | | | | | | |
Shares sold | | | 2,292,086 | | | $ | 25,823,261 | | | | 9,035,603 | | | $ | 100,619,699 | |
Reinvestment of distributions | | | 52,792 | | | | 572,818 | | | | 1,844 | | | | 19,768 | |
Shares redeemed | | | (4,165,612 | ) | | | (46,492,946 | ) | | | (2,052,943 | ) | | | (22,102,004 | ) |
| | | | (1,820,734 | ) | | | (20,096,867 | ) | | | 6,984,504 | | | | 78,537,463 | |
| Class C Shares | | | | | | | | | | | | | | | | |
Shares sold | | | 108,780 | | | | 1,173,462 | | | | 1,328,175 | | | | 14,609,334 | |
Reinvestment of distributions | | | 1,484 | | | | 15,699 | | | | — | | | | — | |
Shares redeemed | | | (492,940 | ) | | | (5,299,728 | ) | | | (224,863 | ) | | | (2,427,812 | ) |
| | | | (382,676 | ) | | | (4,110,567 | ) | | | 1,103,312 | | | | 12,181,522 | |
| Institutional Shares | | | | | | | | | | | | | | | | |
Shares sold | | | 7,945,164 | | | | 89,002,301 | | | | 25,420,802 | | | | 283,007,151 | |
Reinvestment of distributions | | | 223,827 | | | | 2,443,811 | | | | 33,935 | | | | 365,135 | |
Shares redeemed | | | (8,571,125 | ) | | | (94,251,261 | ) | | | (8,407,405 | ) | | | (90,814,397 | ) |
| | | | (402,134 | ) | | | (2,805,149 | ) | | | 17,047,332 | | | | 192,557,889 | |
| Class IR Shares | | | | | | | | | | | | | | | | |
Shares sold | | | 357,823 | | | | 3,953,269 | | | | 2,925,053 | | | | 32,090,385 | |
Reinvestment of distributions | | | 23,756 | | | | 258,613 | | | | 2,575 | | | | 27,660 | |
Shares redeemed | | | (1,249,742 | ) | | | (13,467,475 | ) | | | (551,695 | ) | | | (6,008,395 | ) |
| | | | (868,163 | ) | | | (9,255,593 | ) | | | 2,375,933 | | | | 26,109,650 | |
NET INCREASE (DECREASE) | | | (3,473,707 | ) | | $ | (36,268,176 | ) | | | 27,511,081 | | | $ | 309,386,524 | |
75
Report of Independent Registered Public
Accounting Firm
To the Board of Trustees and Shareholders of
Goldman Sachs Trust — Goldman Sachs Fundamental Emerging Markets Equity Funds:
In our opinion, the accompanying statements of assets and liabilities, including the schedules of investments, and the related statements of operations and of changes in net assets and the financial highlights present fairly, in all material respects, the financial position of Goldman Sachs Asia Equity Fund, Goldman Sachs BRIC Fund, Goldman Sachs Emerging Markets Equity Fund and Goldman Sachs N-11 Equity Fund (collectively the “Fundamental Emerging Markets Equity Funds”), Funds of the Goldman Sachs Trust, at October 31, 2014 and the results of each of their operations, the changes in each of their net assets and the financial highlights for each of the periods indicated, in conformity with accounting principles generally accepted in the United States of America. These financial statements and financial highlights (hereafter referred to as “financial statements”) are the responsibility of the Fundamental Emerging Markets Equity Funds’ management. Our responsibility is to express an opinion on these financial statements based on our audits. We conducted our audits of these financial statements in accordance with the standards of the Public Company Accounting Oversight Board (United States). Those standards require that we plan and perform the audits to obtain reasonable assurance about whether the financial statements are free of material misstatement. An audit includes examining, on a test basis, evidence supporting the amounts and disclosures in the financial statements, assessing the accounting principles used and significant estimates made by management, and evaluating the overall financial statement presentation. We believe that our audits, which included confirmation of securities at October 31, 2014 by correspondence with the custodian, brokers, and the application of alternative auditing procedures where securities purchased had not been received, provide a reasonable basis for our opinion.
PricewaterhouseCoopers LLP
Boston, Massachusetts
December 23, 2014
76
GOLDMAN SACHS FUNDAMENTAL EMERGING MARKETS EQUITY FUNDS
Fund Expenses — Six Month Period Ended October 31, 2014 (Unaudited)
As a shareholder of Class A, Class B, Class C, Institutional, Service or Class IR Shares of a Fund you incur two types of costs: (1) transaction costs, including sales charges on purchase payments (with respect to Class A Shares) and contingent deferred sales charges on redemptions (with respect to Class B and Class C Shares); and (2) ongoing costs, including management fees; distribution and service (12b-1) fees (with respect to Class A, Class B and Class C Shares); and other Fund expenses. This example is intended to help you understand your ongoing costs (in dollars) of investing in Class A, Class B, Class C, Institutional, Service and Class IR Shares of the Funds and to compare these costs with the ongoing costs of investing in other mutual funds.
The example is based on an investment of $1,000 invested at the beginning of the period and held for the entire period from May 1, 2014 through October 31, 2014.
Actual Expenses — The first line under each share class in the table below provides information about actual account values and actual expenses. You may use the information in this line, together with the amount you invested, to estimate the expenses that you paid over the period. Simply divide your account value by $1,000 (for example, an $8,600 account value divided by $1,000=8.6), then multiply the result by the number in the first line under the heading entitled “Expenses Paid” to estimate the expenses you paid on your account during this period.
Hypothetical Example for Comparison Purposes — The second line under each share class in the table below provides information about hypothetical account values and hypothetical expenses based on the Funds’ actual net expense ratio and an assumed rate of return of 5% per year before expenses, which is not the Funds’ actual return. The hypothetical account values and expenses may not be used to estimate the actual ending account balance or expenses you paid for the period. You may use this information to compare the ongoing costs of investing in the Funds and other funds. To do so, compare this 5% hypothetical example with the 5% hypothetical examples that appear in the shareholder reports of the other funds.
Please note that the expenses shown in the table are meant to highlight your ongoing costs only and do not reflect any transactional costs, such as sales charges, redemption fees, or exchange fees. Therefore, the second line of the table is useful in comparing ongoing costs only, and will not help you determine the relative total costs of owning different funds. In addition, if these transactional costs were included, your costs would have been higher.
| | | | | | | | | | | | | | | | | | | | | | | | | | | | | | | | | | | | | | | | | | | | | | | | |
| | | Asia Equity Fund | | | BRIC Fund | | | Emerging Markets Equity Fund | | | N-11 Equity Fund | |
| Share Class | | Beginning
Account
Value
05/01/14 | | | Ending Account Value 10/31/14 | | | Expenses
Paid for the
6 Months Ended
10/31/14* | | | Beginning
Account
Value
05/01/14 | | | Ending Account Value
10/31/14 | | | Expenses
Paid for the
6 Months Ended
10/31/14* | | | Beginning
Account
Value
05/01/14 | | | Ending Account
Value 10/31/14 | | | Expenses
Paid for the
6 Months Ended
10/31/14* | | | Beginning
Account
Value
05/01/14 | | | Ending Account Value 10/31/14 | | | Expenses
Paid for the
6 Months Ended
10/31/14* | |
| Class A | | | | | | | | | | | | | | | | | | | | | | | | | | | | | | | | | | | | | | | | | | | | | | | | |
Actual | | $ | 1,000 | | | $ | 1,043.20 | | | $ | 8.70 | | | $ | 1,000 | | | $ | 1,076.60 | | | $ | 9.32 | | | $ | 1,000 | | | $ | 1,054.70 | | | $ | 8.96 | | | $ | 1,000 | | | $ | 1,000.90 | | | $ | 8.78 | |
Hypothetical 5% return | | | 1,000 | | | | 1,016.69 | + | | | 8.59 | | | | 1,000 | | | | 1,016.23 | + | | | 9.05 | | | | 1,000 | | | | 1,016.48 | + | | | 8.79 | | | | 1,000 | | | | 1,016.43 | + | | | 8.84 | |
| Class B | | | | | | | | | | | | | | | | | | | | | | | | | | | | | | | | | | | | | | | | | | | | | | | | |
Actual | | | 1,000 | | | | 1,039.50 | | | | 12.54 | | | | N/A | | | | N/A | | | | N/A | | | | 1,000 | | | | 1,050.90 | | | | 12.82 | | | | N/A | | | | N/A | | | | N/A | |
Hypothetical 5% return | | | 1,000 | | | | 1,012.91 | + | | | 12.38 | | | | N/A | | | | N/A | | | | N/A | | | | 1,000 | | | | 1,012.70 | + | | | 12.58 | | | | N/A | | | | N/A | | | | N/A | |
| Class C | | | | | | | | | | | | | | | | | | | | | | | | | | | | | | | | | | | | | | | | | | | | | | | | |
Actual | | | 1,000 | | | | 1,039.40 | | | | 12.54 | | | | 1,000 | | | | 1,072.30 | | | | 13.22 | | | | 1,000 | | | | 1,051.30 | | | | 12.82 | | | | 1,000 | | | | 997.30 | | | | 12.54 | |
Hypothetical 5% return | | | 1,000 | | | | 1,012.91 | + | | | 12.38 | | | | 1,000 | | | | 1,012.45 | + | | | 12.83 | | | | 1,000 | | | | 1,012.70 | + | | | 12.58 | | | | 1,000 | | | | 1,012.65 | + | | | 12.63 | |
| Institutional | | | | | | | | | | | | | | | | | | | | | | | | | | | | | | | | | | | | | | | | | | | | | | | | |
Actual | | | 1,000 | | | | 1,045.30 | | | | 6.65 | | | | 1,000 | | | | 1,079.10 | | | | 7.23 | | | | 1,000 | | | | 1,056.90 | | | | 6.90 | | | | 1,000 | | | | 1,002.70 | | | | 6.76 | |
Hypothetical 5% return | | | 1,000 | | | | 1,018.70 | + | | | 6.56 | | | | 1,000 | | | | 1,018.25 | + | | | 7.02 | | | | 1,000 | | | | 1,018.50 | + | | | 6.77 | | | | 1,000 | | | | 1,018.45 | + | | | 6.82 | |
| Service | | | | | | | | | | | | | | | | | | | | | | | | | | | | | | | | | | | | | | | | | | | | | | | | |
Actual | | | N/A | | | | N/A | | | | N/A | | | | N/A | | | | N/A | | | | N/A | | | | 1,000 | | | | 1,054.30 | | | | 9.48 | | | | N/A | | | | N/A | | | | N/A | |
Hypothetical 5% return | | | N/A | | | | N/A | | | | N/A | | | | N/A | | | | N/A | | | | N/A | | | | 1,000 | | | | 1,015.98 | + | | | 9.30 | | | | N/A | | | | N/A | | | | N/A | |
| Class IR | | | | | | | | | | | | | | | | | | | | | | | | | | | | | | | | | | | | | | | | | | | | | | | | |
Actual | | | 1,000 | | | | 1,044.30 | | | | 7.42 | | | | 1,000 | | | | 1,077.70 | | | | 7.96 | | | | 1,000 | | | | 1,055.90 | | | | 7.67 | | | | 1,000 | | | | 1,001.80 | | | | 7.52 | |
Hypothetical 5% return | | | 1,000 | | | | 1,017.95 | + | | | 7.32 | | | | 1,000 | | | | 1,017.54 | + | | | 7.73 | | | | 1,000 | | | | 1,017.74 | + | | | 7.53 | | | | 1,000 | | | | 1,017.69 | + | | | 7.58 | |
| * | | Expenses are calculated using each Fund’s annualized net expense ratio for each class, which represents the ongoing expenses as a percentage of net assets for the six months ended October 31, 2014. Expenses are calculated by multiplying the annualized net expense ratio by the average account value for the period; then multiplying the result by the number of days in the most recent fiscal half year; and then dividing that result by the number of days in the fiscal year. The annualized net expense ratios for the period were as follows: |
| | | | | | | | | | | | | | | | | | | | | | | | |
| Fund | | Class A | | | Class B | | | Class C | | | Institutional | | | Service | | | Class IR | |
Asia Equity | | | 1.69 | % | | | 2.44 | % | | | 2.44 | % | | | 1.29 | % | | | N/A | | | | 1.44 | % |
BRIC | | | 1.78 | | | | N/A | | | | 2.53 | | | | 1.38 | | | | N/A | | | | 1.52 | |
Emerging Markets Equity | | | 1.73 | | | | 2.48 | | | | 2.48 | | | | 1.33 | | | | 1.48 | % | | | 1.83 | |
N-11 Equity | | | 1.74 | | | | N/A | | | | 2.49 | | | | 1.34 | | | | N/A | | | | 1.49 | |
| + | | Hypothetical expenses are based on each Fund's actual annualized net expense ratios and an assumed rate of return of 5% per year before expenses. |
77
GOLDMAN SACHS FUNDAMENTAL EMERGING MARKETS EQUITY FUNDS (2014)
Statement Regarding Basis for Approval of Management Agreement (Unaudited)
Background
The Goldman Sachs Asia Equity Fund, Goldman Sachs BRIC Fund, Goldman Sachs Emerging Markets Equity Fund, and Goldman Sachs N-11 Equity Fund (the “Funds”) are investment portfolios of Goldman Sachs Trust (the “Trust”). The Board of Trustees oversees the management of the Trust and reviews the investment performance and expenses of the Funds at regularly scheduled meetings held during the year. In addition, the Board of Trustees determines annually whether to approve the continuance of the Trust’s investment management agreement (the “Management Agreement”) with Goldman Sachs Asset Management International (the “Investment Adviser”) on behalf of the Funds.
The Management Agreement was most recently approved for continuation until June 30, 2015 by the Board of Trustees, including those Trustees who are not parties to the Management Agreement or “interested persons” (as defined in the Investment Company Act of 1940, as amended) of any party thereto (the “Independent Trustees”), at a meeting held on June 11-12, 2014 (the “Annual Meeting”).
The review process undertaken by the Trustees spans the course of the year and culminates with the Annual Meeting. To assist the Trustees in their deliberations, the Trustees have established a Contract Review Committee (the “Committee”), comprised of the Independent Trustees. The Committee held four meetings over the course of the year since the Management Agreement was last approved. At those Committee meetings, regularly scheduled Board or other committee meetings and/or the Annual Meeting, the Board, or the Independent Trustees, as applicable, considered matters relating to the Management Agreement, including:
| | (a) | | the nature and quality of the advisory, administrative and other services provided to the Funds by the Investment Adviser and its affiliates, including information about: |
| | (i) | | the structure, staff and capabilities of the Investment Adviser and its portfolio management teams; |
| | (ii) | | the groups within the Investment Adviser and its affiliates that support the portfolio management teams or provide other types of necessary services, including fund services groups (e.g., accounting and financial reporting, tax, shareholder services and operations), controls and risk management groups (e.g., legal, compliance, valuation oversight, credit risk management, internal audit, compliance testing, market risk analysis, finance and strategy and central funding), sales and distribution support groups and others (e.g., information technology and training); |
| | (iii) | | trends in headcount; |
| | (iv) | | the Investment Adviser’s financial resources and ability to hire and retain talented personnel and strengthen its operations; and |
| | (v) | | the parent company’s support of the Investment Adviser and its mutual fund business, as expressed by the firm’s senior management; |
| | (b) | | information on the investment performance of each Fund, including comparisons to the performance of similar mutual funds, as provided by a third party mutual fund data provider engaged as part of the contract review process (the “Outside Data Provider”), and benchmark performance indices, and general investment outlooks in the markets in which the Funds invest; |
| | (c) | | the terms of the Management Agreement and agreements with affiliated service providers entered into by the Trust on behalf of the Funds; |
| | (d) | | expense information for the Funds, including: |
| | (i) | | the relative management fee and expense levels of each Fund as compared to those of comparable funds managed by other advisers, as provided by the Outside Data Provider; |
| | (ii) | | each Fund’s expense trends over time; and |
| | (iii) | | to the extent the Investment Adviser manages institutional accounts or collective investment vehicles having investment objectives and policies similar to those of the Funds, comparative information on the advisory fees charged and services provided to those accounts by the Investment Adviser; |
| | (e) | | with respect to the extensive investment performance and expense comparison data provided by the Outside Data Provider, its processes in producing that data for the Funds; |
| | (f) | | the undertakings of the Investment Adviser to waive certain fees (with respect to each Fund other than the Asia Equity Fund) and to limit certain expenses of each Fund that exceed specified levels, and a summary of contractual fee reductions made by the Investment Adviser and/or its affiliates over the past several years with respect to the Funds; |
| | (g) | | information relating to the profitability of the Management Agreement and the transfer agency and distribution and service arrangements of each Fund and the Trust as a whole to the Investment Adviser and its affiliates; |
| | (h) | | whether each Fund’s existing management fee schedule adequately addressed any economies of scale; |
78
GOLDMAN SACHS FUNDAMENTAL EMERGING MARKETS EQUITY FUNDS (2014)
Statement Regarding Basis for Approval of Management Agreement (Unaudited) (continued)
| | (i) | | a summary of the “fall-out” benefits derived by the Investment Adviser and its affiliates from their relationships with the Funds, including the fees received by the Investment Adviser’s affiliates from the Funds for transfer agency, portfolio trading, distribution and other services; |
| | (j) | | a summary of potential benefits derived by the Funds as a result of their relationship with the Investment Adviser; |
| | (k) | | information regarding commissions paid by the Funds and broker oversight, an update on the Investment Adviser’s soft dollars practices, other information regarding portfolio trading and how the Investment Adviser carries out its duty to seek best execution; |
| | (l) | | portfolio manager ownership of Fund shares; the manner in which portfolio manager compensation is determined; and the number and types of accounts managed by the portfolio managers; |
| | (m) | | the nature and quality of the services provided to the Funds by their unaffiliated service providers, and the Investment Adviser’s general oversight and evaluation (including reports on due diligence) of those service providers as part of the administration services provided under the Management Agreement; and |
| | (n) | | the Investment Adviser’s processes and policies addressing various types of potential conflicts of interest; its approach to risk management; the annual review of the effectiveness of the Funds’ compliance program; and periodic compliance reports. |
The Trustees also received an overview of the Funds’ distribution arrangements. They received information regarding the Funds’ assets, share purchase and redemption activity and the payment of Rule 12b-1 distribution and service fees by the Funds and the payment of non-Rule 12b-1 shareholder service and/or administration fees with respect to the Emerging Markets Equity Fund’s Service Shares. Information was also provided to the Trustees relating to revenue sharing payments made by and services provided by the Investment Adviser and its affiliates to intermediaries that promote the sale, distribution and/or servicing of Fund shares.
The presentations made at the Board and Committee meetings and at the Annual Meeting encompassed the Funds and other mutual fund portfolios for which the Board of Trustees has responsibility. In evaluating the Management Agreement at the Annual Meeting, the Trustees relied upon their knowledge, resulting from their meetings and other interactions throughout the year, of the Investment Adviser, its affiliates, their services and the Funds. In conjunction with these meetings, the Trustees received written materials and oral presentations on the topics covered, and were advised by their independent legal counsel regarding their responsibilities and other regulatory requirements related to the approval and continuation of mutual fund investment management agreements under applicable law. In addition, the Investment Adviser and its affiliates provided the Independent Trustees with a written response to a formal request for information sent on behalf of the Independent Trustees by their independent legal counsel. During the course of their deliberations, the Independent Trustees met in executive sessions with their independent legal counsel, without representatives of the Investment Adviser or its affiliates present. The Independent Trustees also discussed the broad range of other investment choices that are available to Fund investors, including the availability of comparable funds managed by other advisers.
Nature, Extent and Quality of the Services Provided Under the Management Agreement
As part of their review, the Trustees considered the nature, extent and quality of the services provided by the Investment Adviser. In this regard, the Trustees considered both the investment advisory services and non-advisory services that are provided to the Funds by the Investment Adviser and its affiliates. The Trustees noted the transition in the leadership and changes in personnel of various of the Investment Adviser’s portfolio management teams that had occurred in recent periods, and the ongoing recruitment efforts aimed at bringing high quality investment talent to the Investment Adviser. They also noted the Investment Adviser’s commitment to maintaining high quality systems. The Trustees concluded that the Investment Adviser continued to commit substantial financial and operational resources to the Funds and expressed confidence that the Investment Adviser would continue to do so in the future. The Trustees also recognized that the Investment Adviser had made significant commitments to address regulatory compliance requirements applicable to the Funds and the Investment Adviser.
Investment Performance
The Trustees also considered the investment performance of the Funds. In this regard, they compared the investment performance of each Fund to its peers using rankings and ratings (rankings only for the N-11 Equity Fund) compiled by the Outside Data Provider as of December 31, 2013, and updated performance information prepared by the Investment Adviser using the peer groups identified by the Outside Data Provider as of March 31, 2014. The information on each Fund’s investment performance was provided for the one-, three-, five- and ten-year periods ending on the applicable dates, to the extent that each Fund had been in existence for those periods. The Trustees also reviewed each Fund’s investment performance over time
79
GOLDMAN SACHS FUNDAMENTAL EMERGING MARKETS EQUITY FUNDS (2014)
Statement Regarding Basis for Approval of Management Agreement (Unaudited) (continued)
(including on a year-by-year basis) relative to its performance benchmark. As part of this review, they considered the investment performance trends of the Funds over time, and reviewed the investment performance of each Fund in light of its investment objective and policies and market conditions.
In addition, the Trustees considered materials prepared and presentations made by the Investment Adviser’s senior management and portfolio management personnel, in which Fund performance was assessed. The Trustees also considered the Investment Adviser’s periodic reports with respect to the Funds’ risk profiles, and how the Investment Adviser’s approach to risk monitoring and management influences portfolio management.
The Trustees observed that the Asia Equity Fund’s Class A Shares had placed in the first quartile of the Fund’s peer group for the one-year period, in the third quartile for the three- and five-year periods, and in the fourth quartile for the ten-year period, and had outperformed the Fund’s benchmark index for the one-year period and underperformed for the three-, five-, and ten-year periods ended March 31, 2014. They noted that the BRIC Fund’s Class A Shares had placed in the second quartile of the Fund’s peer group for the one-year period and in the fourth quartile for the three- and five-year periods, and had outperformed the Fund’s benchmark index for the one- and five-year periods and underperformed for the three-year period ended March 31, 2014. They also considered that the BRIC Fund’s peer group (Diversified Emerging Markets) provides an imperfect performance comparison because it includes funds invested in diversified emerging market countries, while the Fund invests only in four emerging market countries. They noted that Emerging Markets Equity Fund’s Class A Shares had placed in the second quartile of the Fund’s peer group for the one-year period, in the third quartile for the three- and five-year periods, and in the fourth quartile for the ten-year period, and had outperformed the Fund’s benchmark index for the one-year period and underperformed for the three-, five-, and ten-year periods ended March 31, 2014. The Trustees observed that the N-11 Equity Fund’s Class A Shares had placed in the first quartile of the Fund’s peer group for the three-year period and in the fourth quartile for the one-year period, and had outperformed the Fund’s benchmark index for the one-year period and underperformed for the three-year period ended March 31, 2014. They also noted that the N-11 Equity Fund’s peer group (Diversified Emerging Markets) provides an imperfect performance comparison because it includes funds invested in diversified emerging market countries, while the Fund invests primarily in “N-11” emerging market countries.
The Trustees noted recent portfolio management changes to the Funds, including the departure of a portfolio manager to the Asia Equity, BRIC, and Emerging Markets Equity Funds.
Costs of Services Provided and Competitive Information
The Trustees considered the contractual terms of the Management Agreement and the fee rates payable by each Fund thereunder. In this regard, the Trustees considered information on the services rendered by the Investment Adviser to the Funds, which included both advisory and administrative services that were directed to the needs and operations of the Funds as registered mutual funds.
In particular, the Trustees reviewed analyses prepared by the Outside Data Provider regarding the expense rankings of the Funds. The analyses provided a comparison of the Funds’ management fees and breakpoints to those of relevant peer groups and category universes; an expense analysis which compared each Fund’s overall net and gross expenses to a peer group and a category universe; and a five-year history (or, in the case of Funds that commenced investment operations within a shorter period, since the year in which it commenced operations) comparing each Fund’s net expenses to the peer and category medians. The analyses also compared each Fund’s transfer agency, custody, and distribution fees, other expenses and fee waivers/reimbursements to those of the peer group and category medians. The Trustees concluded that the comparisons provided by the Outside Data Provider were useful in evaluating the reasonableness of the management fees and total expenses paid by the Funds.
In addition, the Trustees considered the Investment Adviser’s undertakings to waive a portion of the management fees payable by the Funds (with the exception of the Asia Equity Fund) and to limit certain expenses of the Funds that exceed specified levels. The Trustees also noted that certain changes were being made to existing fee waiver or expense limitation arrangements of the BRIC and Emerging Markets Equity Funds that would have the effect of lowering total Fund expenses, with such changes taking effect in connection with the Funds’ next annual registration statement update. They also considered, to the extent that the Investment Adviser manages institutional accounts or collective investment vehicles having investment objectives and policies similar to those of the Funds, comparative fee information for services provided by the Investment Adviser to those accounts, and information that indicated that services provided to the Funds differed in various significant respects from the services provided to institutional accounts, which generally operated under less stringent legal and regulatory structures, required fewer services from the Investment Adviser to a smaller number of client contact points, were less time-intensive and paid lower fees.
In addition, the Trustees noted that shareholders are able to redeem their Fund shares at any time if shareholders believe that the Fund fees and expenses are too high or if they are dissatisfied with the performance of the Fund.
80
GOLDMAN SACHS FUNDAMENTAL EMERGING MARKETS EQUITY FUNDS (2014)
Statement Regarding Basis for Approval of Management Agreement (Unaudited) (continued)
Profitability
The Trustees reviewed the Investment Adviser’s revenues and pre-tax profit margins with respect to the Trust and each of the Funds. In this regard the Trustees noted that they had received, among other things, profitability analyses and summaries, revenue and expense schedules by Fund and by function (i.e., investment management, transfer agency and distribution and service) and information on the Investment Adviser’s expense allocation methodology. They observed that the profitability and expense figures are substantially similar to those used by the Investment Adviser for many internal purposes, including compensation decisions among various business groups, and are thus subject to a vigorous internal debate about how certain revenue and expenses should be allocated. The Trustees also noted that the internal audit group within the Goldman Sachs organization had audited the expense allocation methodology and was satisfied with the reasonableness, consistency, and accuracy of the Investment Adviser’s expense allocation methodology and profitability analysis calculations. Profitability data for the Trust and each Fund were provided for 2013 and 2012, and the Trustees considered this information in relation to the Investment Adviser’s overall profitability. The Trustees considered the Investment Adviser’s revenues and pre-tax profit margins both in absolute terms and in comparison to information on the reported pre-tax profit margins earned by certain other asset management firms.
Economies of Scale
The Trustees considered the information that had been provided regarding the Investment Adviser’s profitability. The Trustees also considered the breakpoints in the fee rate payable under the Management Agreement for each of the Funds at the following annual percentage rates of the average daily net assets of the Funds:
| | | | | | | | | | | | | | | | |
Average Daily
Net Assets | | Asia
Equity
Fund | | | BRIC Fund | | | Emerging
Markets
Equity
Fund | | | N-11
Equity
Fund | |
| First $1 billion | | | 1.00 | % | | | 1.30 | % | | | 1.20 | % | | | 1.30 | % |
| Next $1 billion | | | 0.90 | | | | 1.30 | | | | 1.20 | | | | 1.30 | |
| Next $3 billion | | | 0.86 | | | | 1.17 | | | | 1.08 | | | | 1.24 | |
| Next $3 billion | | | 0.84 | | | | 1.11 | | | | 1.03 | | | | 1.21 | |
| Over $8 billion | | | 0.82 | | | | 1.09 | | | | 1.01 | | | | 1.19 | |
The Trustees noted that the breakpoints were meant to share potential economies of scale, if any, with the Funds and their shareholders as assets under management reach those asset levels. The Trustees considered the amounts of assets in the Funds; the Funds’ recent share purchase and redemption activity; the information provided by the Investment Adviser relating to the costs of the services provided by the Investment Adviser and its affiliates and their realized profits; information comparing fee rates charged by the Investment Adviser with fee rates charged to other funds in the peer groups; and the Investment Adviser’s undertakings to waive a portion of the management fees payable by the Funds (with the exception of the Asia Equity Fund) and to limit certain expenses of the Funds that exceed specified levels. Upon reviewing these matters at the Annual Meeting, the Trustees concluded that the fee breakpoints represented a means of assuring that benefits of scalability, if any, would be passed along to shareholders at the specified asset levels.
Other Benefits to the Investment Adviser and Its Affiliates
The Trustees also considered the other benefits derived by the Investment Adviser and its affiliates from their relationships with the Funds as stated above, including: (a) transfer agency fees received by Goldman, Sachs & Co. (“Goldman Sachs”); (b) brokerage and futures commissions earned by Goldman Sachs for executing securities and futures transactions on behalf of the Funds; (c) research received by the Investment Adviser from broker-dealers in exchange for executing certain transactions on behalf of the Funds; (d) trading efficiencies resulting from aggregation of orders of the Funds with those for other funds or accounts managed by the Investment Adviser; (e) the Investment Adviser’s ability to leverage the infrastructure designed to service the Funds on behalf of its other clients; (f) the Investment Adviser’s ability to cross-market other products and services to Fund shareholders; (g) Goldman Sachs’ retention of certain fees as Fund Distributor; (h) the Investment Adviser’s ability to negotiate better pricing with custodians on behalf of its other clients, as a result of the relationship with the Funds; and (i) the possibility that the working relationship between the Investment Adviser and the Funds’ third party service providers may cause those service providers to be more likely to do business with other areas of Goldman Sachs. In the course of considering the foregoing, the Independent Trustees requested and received further information quantifying certain of these fall-out benefits.
81
GOLDMAN SACHS FUNDAMENTAL EMERGING MARKETS EQUITY FUNDS (2014)
Statement Regarding Basis for Approval of Management Agreement (Unaudited) (continued)
Other Benefits to the Funds and Their Shareholders
The Trustees also noted that the Funds receive certain potential benefits as a result of their relationship with the Investment Adviser, including: (a) trading efficiencies resulting from aggregation of orders of the Funds with those of other funds or accounts managed by the Investment Adviser; (b) enhanced servicing from vendors because of the volume of business generated by the Investment Adviser and its affiliates; (c) enhanced servicing from broker-dealers because of the volume of business generated by the Investment Adviser and its affiliates; (d) the Investment Adviser’s ability to negotiate favorable terms with derivatives counterparties on behalf of the Funds as a result of the size and reputation of the Goldman Sachs organization; (e) the Investment Adviser’s knowledge and experience gained from managing other accounts and products; (f) the Investment Adviser’s ability to hire and retain qualified personnel to provide services to the Funds because of the reputation of the Goldman Sachs organization; (g) the Funds’ access, through the Investment Adviser, to certain firmwide resources (e.g., proprietary risk management systems and databases), subject to certain restrictions; and (h) the Funds’ access to certain affiliated distribution channels. In addition, the Trustees noted the competitive nature of the mutual fund marketplace, and considered that many of the Funds’ shareholders invested in the Funds in part because of the Funds’ relationship with the Investment Adviser and that those shareholders have a general expectation that the relationship will continue.
Conclusion
In connection with their consideration of the Management Agreement, the Trustees gave weight to each of the factors described above, but did not identify any particular factor as controlling their decision. After deliberation and consideration of all of the information provided, including the factors described above, the Trustees concluded, in the exercise of their business judgment, that the management fees paid by each of the Funds were reasonable in light of the services provided to it by the Investment Adviser, the Investment Adviser’s costs and each Fund’s current and reasonably foreseeable asset levels. The Trustees concluded that the Investment Adviser’s continued management likely would benefit each Fund and its shareholders and that the Management Agreement should be approved and continued with respect to each Fund until June 30, 2015.
82
GOLDMAN SACHS FUNDAMENTAL EMERGING MARKETS EQUITY FUNDS
Trustees and Officers (Unaudited)
Independent Trustees
| | | | | | | | | | |
Name,
Address and Age1 | | Position(s) Held with the Trust | | Term of Office and
Length of
Time Served2 | | Principal Occupation(s) During Past 5 Years | | Number of
Portfolios in
Fund Complex
Overseen by
Trustee3 | | Other Directorships Held by Trustee4 |
Ashok N. Bakhru Age: 72 | | Chairman of the Board of Trustees | | Since 1996 (Trustee since 1991) | | Mr. Bakhru is retired. He was formerly Director, Apollo Investment Corporation (a business development company) (2008-2013); President, ABN Associates (a management and financial consulting firm) (1994-1996 and 1998-2012); Trustee, Scholarship America (1998-2005); Trustee, Institute for Higher Education Policy (2003-2008); Director, Private Equity Investors — III and IV (1998-2007), and Equity-Linked Investors II (April 2002-2007). Chairman of the Board of Trustees — Goldman Sachs Fund Complex. | | 112 | | None |
John P. Coblentz, Jr. Age: 73 | | Trustee | | Since 2003 | | Mr. Coblentz is retired. Formerly, he was Partner, Deloitte & Touche LLP (1975-2003); Director, Emerging Markets Group, Ltd. (2004-2006); and Director, Elderhostel, Inc. (2006-2012). Trustee — Goldman Sachs Fund Complex. | | 112 | | None |
Diana M. Daniels Age: 65 | | Trustee | | Since 2007 | | Ms. Daniels is retired. Formerly, she was Vice President, General Counsel and Secretary, The Washington Post Company (1991-2006). Ms. Daniels serves as a Presidential Councillor of Cornell University (2013-Present); Member, Advisory Board, Psychology Without Borders (international humanitarian aid organization) (2007-Present), and former Member of the Legal Advisory Board, New York Stock Exchange (2003-2006) and of the Corporate Advisory Board, Standish Mellon Management Advisors (2006-2007). Trustee — Goldman Sachs Fund Complex. | | 108 | | None |
Joseph P. LoRusso Age: 57 | | Trustee | | Since 2010 | | Mr. LoRusso is retired. Formerly, he was President, Fidelity Investments Institutional Services Co. (“FIIS”) (2002-2008); Director, FIIS (2002-2008); Director, Fidelity Investments Institutional Operations Company (2003-2007); Executive Officer, Fidelity Distributors Corporation (2007-2008). Trustee — Goldman Sachs Fund Complex. | | 108 | | None |
Herbert J. Markley Age: 64 | | Trustee | | Since 2013 | | Mr. Markley is retired. Formerly, he was Executive Vice President, Deere & Company (an agricultural and construction equipment manufacturer) (2007-2009), and President, Agricultural Division, Deere & Company (2001-2007). Trustee — Goldman Sachs Fund Complex. | | 108 | | None |
Jessica Palmer Age: 65 | | Trustee | | Since 2007 | | Ms. Palmer is retired. She is Director, Emerson Center for the Arts and Culture (2011-Present); and was formerly a Consultant, Citigroup Human Resources Department (2007-2008); Managing Director, Citigroup Corporate and Investment Banking (previously, Salomon Smith Barney/Salomon Brothers) (1984-2006). Ms. Palmer was a Member of the Board of Trustees of Indian Mountain School (private elementary and secondary school) (2004-2009). Trustee — Goldman Sachs Fund Complex. | | 108 | | None |
Richard P. Strubel Age: 75 | | Trustee | | Since 1987 | | Mr. Strubel is retired. Formerly, he was Director, Cardean Learning Group (provider of educational services via the internet) (2003-2008); and Director, Gildan Activewear Inc. (a clothing marketing and manufacturing company) (2000-2014). He serves as Trustee, Emeritus, The University of Chicago (1987-Present). Trustee — Goldman Sachs Fund Complex. | | 112 | | The Northern Trust Mutual Fund Complex (56 Portfolios) (Chairman of the Board of Trustees) |
Roy W. Templin Age: 54 | | Trustee | | Since 2013 | | Mr. Templin is retired. He is Chairman of the Board of Directors, Con-Way Incorporated (2012-Present); and was formerly Executive Vice President and Chief Financial Officer, Whirlpool Corporation (an appliance manufacturer and marketer) (2004-2012). Trustee — Goldman Sachs Fund Complex | | 108 | | Con-Way Incorporated (a transportation, supply-chain management and logistics services company) |
| | | | | | | | | | |
83
GOLDMAN SACHS FUNDAMENTAL EMERGING MARKETS EQUITY FUNDS
Trustees and Officers (Unaudited) (continued)
Interested Trustees*
| | | | | | | | | | |
Name,
Address and Age1 | | Position(s) Held with the Trust | | Term of Office and
Length of
Time Served2 | | Principal Occupation(s) During Past 5 Years | | Number of
Portfolios in
Fund Complex
Overseen by
Trustee3 | | Other Directorships Held by Trustee4 |
James A. McNamara Age: 52 | | President and Trustee | | Since 2007 | | Managing Director, Goldman Sachs (December 1998-Present); Director of Institutional Fund Sales, GSAM (April 1998-December 2000); and Senior Vice President and Manager, Dreyfus Institutional Service Corporation (January 1993- April 1998). President — Goldman Sachs Fund Complex (November 2007-Present); Senior Vice President — Goldman Sachs Fund Complex (May 2007-November 2007); and Vice President — Goldman Sachs Fund Complex (2001-2007). Trustee — Goldman Sachs Fund Complex (November 2007-Present and December 2002-May 2004). | | 111 | | None |
Alan A. Shuch Age: 64 | | Trustee | | Since 1990 | | Advisory Director — GSAM (May 1999-Present); Consultant to GSAM (December 1994-May 1999); and Limited Partner, Goldman Sachs (December 1994-May 1999). Trustee — Goldman Sachs Fund Complex. | | 108 | | None |
| | | | | | | | | | |
| * | | These persons are considered to be “Interested Trustees” because they hold positions with Goldman Sachs and own securities issued by The Goldman Sachs Group, Inc. Each Interested Trustee holds comparable positions with certain other companies of which Goldman Sachs, GSAM or an affiliate thereof is the investment adviser, administrator and/or distributor. |
| 1 | | Each Trustee may be contacted by writing to the Trustee, c/o Goldman Sachs, 200 West Street, New York, New York, 10282, Attn: Caroline Kraus. Information is provided as of October 31, 2014. |
| 2 | | Each Trustee holds office for an indefinite term until the earliest of: (a) the election of his or her successor; (b) the date the Trustee resigns or is removed by the Board of Trustees or shareholders, in accordance with the Trust’s Declaration of Trust; (c) the conclusion of the first Board meeting held subsequent to the day the Trustee attains the age of 74 years, subject to a waiver by a majority of the Trustees (in accordance with the current resolutions of the Board of Trustees, which may be changed by the Trustees without shareholder vote); or (d) the termination of the Trust. By resolution of the Board of Trustees determining that an extension of service would be beneficial to the Trust, the retirement age has been extended with respect to Richard P. Strubel. |
| 3 | | The Goldman Sachs Fund Complex consists of the Trust, and Goldman Sachs Variable Insurance Trust (“GSVIT”). As of October 31, 2014, the Trust consisted of 94 portfolios (88 of which offered shares to the public) and GSVIT consisted of 14 portfolios. The Goldman Sachs Fund Complex also includes, with respect to Messrs. Bakhru, Coblentz and Strubel, Goldman Sachs Trust II (“GST II”), Goldman Sachs BDC. Inc. (“GSBDC”), Goldman Sachs MLP Income Opportunities Fund (“GSMLP”) and Goldman Sachs MLP and Energy Renaissance Fund (“GSMER”) and with respect to Mr. McNamara, GSTII, GSMLP and GSMER. GSTII, GSBDC, GSMLP and GSMER each consisted of one portfolio. As of October 31, 2014, GSBDC had not offered shares to the public. |
| 4 | | This column includes only directorships of companies required to report to the Securities and Exchange Commission under the Securities Exchange Act of 1934 (i.e., “public companies”) or other investment companies registered under the Act. |
Additional information about the Trustees is available in the Portfolios’ Statement of Additional Information, which can be obtained from Goldman Sachs free of charge by calling this toll-free number (in the United States of America): 1-800-292-4726.
84
GOLDMAN SACHS FUNDAMENTAL EMERGING MARKETS EQUITY FUNDS
Trustees and Officers (Unaudited) (continued)
Officers of the Trust*
| | | | | | |
Name, Address and Age1 | | Position(s) Held With the Trust | | Term of
Office and
Length of
Time Served2 | | Principal Occupation(s) During Past 5 Years |
James A. McNamara 200 West Street New York, NY 10282 Age: 52 | | President and Trustee | | Since 2007 | | Managing Director, Goldman Sachs (December 1998-Present); Director of Institutional Fund Sales, GSAM (April 1998-December 2000); and Senior Vice President and Manager, Dreyfus Institutional Service Corporation (January 1993-April 1998). President — Goldman Sachs Fund Complex (November 2007-Present); Senior Vice President — Goldman Sachs Fund Complex (May 2007-November 2007); and Vice President — Goldman Sachs Fund Complex (2001-2007). Trustee — Goldman Sachs Fund Complex (November 2007-Present and December 2002-May 2004). |
Caroline Kraus 200 West Street New York, NY 10282 Age: 37 | | Secretary | | Since 2012 | | Vice President, Goldman Sachs (August 2006-Present); Associate General Counsel, Goldman Sachs (2012-Present); Assistant General Counsel, Goldman Sachs (August 2006-December 2011) and Associate, Weil, Gotshal & Manges; LLP (2002-2006). Secretary — Goldman Sachs Fund Complex (August 2012-Present) and Assistant Secretary — Goldman Sachs Fund Complex (June 2012-August 2012). |
Scott M. McHugh 200 West Street New York, NY 10282 Age: 43 | | Principal Financial Officer, Senior Vice President and Treasurer | | Since 2009 (Principal Financial Officer since 2013) | | Vice President, Goldman Sachs (February 2007-Present); Assistant Treasurer of certain mutual funds administered by DWS Scudder (2005-2007); and Director (2005-2007), Vice President (2000-2005) and Assistant Vice President (1998-2000), Deutsche Asset Management or its predecessor (1998-2007). Principal Financial Officer — Goldman Sachs Fund Complex (November 2013-Present); Treasurer — Goldman Sachs Fund Complex (October 2009-Present); Senior Vice President — Goldman Sachs Fund Complex (November 2009-Present); and Assistant Treasurer — Goldman Sachs Fund Complex (May 2007-October 2009). |
| | | | | | |
| * | | Represents a partial list of officers of the Trust. Additional information about all the officers is available in the Portfolios’ Statement of Additional Information, which can be obtained from Goldman Sachs free of charge by calling this toll-free number (in the United States): 1-800-292-4726. |
| 1 | | Information is provided as of October 31, 2014. |
| 2 | | Officers hold office at the pleasure of the Board of Trustees or until their successors are duly elected and qualified. Each officer holds comparable positions with certain other companies of which Goldman Sachs, GSAM or an affiliate thereof is the investment adviser, administrator and/or distributor. |
85
GOLDMAN SACHS FUNDAMENTAL EMERGING MARKETS EQUITY FUNDS
Goldman Sachs Trust — Fundamental Emerging Markets Equity Funds — Tax Information (Unaudited)
From distributions paid during the year ended October 31, 2014, the total amount of income received by the Asia Equity, BRIC, Emerging Markets Equity, and N-11 Equity Funds from sources within foreign countries and possessions of the United States was $0.1643, $0.1675, $0.1493, and $0.630 per share, respectively, all of which is attributable to qualified passive income. The percentage of net investment income dividends paid from foreign sources by the Asia Equity, BRIC, Emerging Markets Equity and N-11 Equity Funds were 88.48%, 98.65%, 87.31%, and 84.79%, respectively. The total amount of taxes paid by the Asia Equity, BRIC, Emerging Markets Equity, and N-11 Equity Funds to such countries was $0.0467, $.0217, $0.0335, and $0.0216 per share, respectively.
For the year ended October 31, 2014, 96.12%, 100%, 100%, and 100% of the dividends paid from net investment company taxable income by the Asia Equity, BRIC, Emerging Markets Equity, and N-11 Equity Funds, respectively, qualify for the reduced tax rate under the Jobs and Growth Tax Relief and Reconciliation Act of 2003.
86
FUNDS PROFILE
Goldman Sachs Funds

Goldman Sachs is a premier financial services firm, known since 1869 for creating thoughtful and customized investment solutions in complex global markets.
Today, the Investment Management Division of Goldman Sachs serves a diverse set of clients worldwide, including private institutions, public entities and individuals. With approximately $999.2 billion in assets under supervision as of September 30, 2014, Goldman Sachs Asset Management (“GSAM”) has portfolio management teams located around the world and our investment professionals bring firsthand knowledge of local markets to every investment decision. Assets under supervision includes assets under management and other client assets for which Goldman Sachs does not have full discretion. GSAM leverages the resources of Goldman, Sachs & Co. subject to legal, internal and regulatory restrictions.

Money Market1
Financial Square FundsSM
| n | | Financial Square Tax-Exempt Funds |
| n | | Financial Square Federal Fund |
| n | | Financial Square Government Fund |
| n | | Financial Square Money Market Fund |
| n | | Financial Square Prime Obligations Fund |
| n | | Financial Square Treasury Instruments Fund |
| n | | Financial Square Treasury Obligations Fund |
Fixed Income
Short Duration and Government
| n | | High Quality Floating Rate Fund |
| n | | Limited Maturity Obligations Fund |
| n | | Short Duration Government Fund |
| n | | Short Duration Income Fund |
| n | | Inflation Protected Securities Fund |
Multi-Sector
Municipal and Tax-Free
| n | | High Yield Municipal Fund |
| n | | Short Duration Tax-Free Fund |
Single Sector
| n | | Investment Grade Credit Fund |
| n | | High Yield Floating Rate Fund |
| n | | Emerging Markets Debt Fund |
| n | | Local Emerging Markets Debt Fund |
| n | | Dynamic Emerging Markets Debt Fund |
Fixed Income Alternatives
| n | | Long Short Credit Strategies Fund3 |
| n | | Fixed Income Macro Strategies Fund |
Fundamental Equity
| n | | Small/Mid Cap Value Fund |
| n | | Small/Mid Cap Growth Fund |
| n | | Flexible Cap Growth Fund |
| n | | Concentrated Growth Fund |
| n | | Technology Tollkeeper Fund |
| n | | Growth Opportunities Fund |
| n | | Rising Dividend Growth Fund |
Tax-Advantaged Equity
| n | | U.S. Tax-Managed Equity Fund4 |
| n | | International Tax-Managed Equity Fund4 |
| n | | U.S. Equity Dividend and Premium Fund |
| n | | International Equity Dividend and Premium Fund |
Equity Insights
| n | | Small Cap Equity Insights Fund |
| n | | U.S. Equity Insights Fund |
| n | | Small Cap Growth Insights Fund |
| n | | Large Cap Growth Insights Fund |
| n | | Large Cap Value Insights Fund |
| n | | Small Cap Value Insights Fund |
| n | | International Small Cap Insights Fund |
| n | | International Equity Insights Fund |
| n | | Emerging Markets Equity Insights Fund |
Fundamental International Equity
| n | | Strategic International Equity Fund |
| n | | Focused International Equity Fund5 |
| n | | International Small Cap Fund |
| n | | Emerging Markets Equity Fund |
| n | | BRIC Fund (Brazil, Russia, India, China) |
Select Satellite6
| n | | Real Estate Securities Fund |
| n | | International Real Estate Securities Fund |
| n | | Commodity Strategy Fund |
| n | | Dynamic Commodity Strategy Fund |
| n | | Dynamic Allocation Fund |
| n | | Absolute Return Tracker Fund |
| n | | Managed Futures Strategy Fund |
| n | | MLP Energy Infrastructure Fund |
| n | | Multi-Manager Alternatives Fund |
| n | | Multi-Asset Real Return Fund |
| n | | Retirement Portfolio Completion Fund |
| n | | Tactical Tilt Implementation Fund |
Total Portfolio Solutions6
| n | | Balanced Strategy Portfolio |
| n | | Growth and Income Strategy Portfolio |
| n | | Growth Strategy Portfolio |
| n | | Equity Growth Strategy Portfolio |
| n | | Satellite Strategies Portfolio |
| n | | Enhanced Dividend Global Equity Portfolio |
| n | | Tax Advantaged Global Equity Portfolio |
| 1 | | An investment in a money market fund is neither insured nor guaranteed by the Federal Deposit Insurance Corporation (“FDIC”) or any other government agency. Although the Funds seek to preserve the value of your investment at $1.00 per share, it is possible to lose money by investing in the Funds. |
| 2 | | Effective on October 1, 2014, the Goldman Sachs Core Plus Fixed Income Fund was renamed the Goldman Sachs Bond Fund. |
| 3 | | Effective at the close of business on March 21, 2014, the Goldman Sachs Credit Strategies Fund was reorganized with and into the Goldman Sachs Long Short Credit Strategies Fund. |
| 4 | | Effective on April 30, 2014, the Goldman Sachs Structured Tax-Managed Equity and Structured International Tax-Managed Equity Funds were renamed the Goldman Sachs U.S. Tax-Managed Equity and International Tax-Managed Equity Funds, respectively. |
| 5 | | Effective at the close of business on February 28, 2014, the Goldman Sachs Concentrated International Equity Fund was renamed the Goldman Sachs Focused International Equity Fund. |
| 6 | | Individual Funds within the Total Portfolio Solutions and Select Satellite categories will have various placement on the risk/return spectrum and may have greater or lesser risk than that indicated by the placement of the general Total Portfolio Solutions or Select Satellite category. |
Financial Square FundsSM is a registered service mark of Goldman, Sachs & Co.
| *This | | list covers open-end funds only. Please visit our website at www.GSAMFUNDS.com to learn about our closed-end funds. |
| | |
TRUSTEES Ashok N. Bakhru, Chairman John P. Coblentz, Jr. Diana M. Daniels Joseph P. LoRusso Herbert J. Markley James A. McNamara Jessica Palmer Alan A. Shuch Richard P. Strubel Roy W. Templin | | OFFICERS James A. McNamara, President Scott M. McHugh, Principal Financial Officer and Treasurer Caroline L. Kraus, Secretary |
| |
GOLDMAN, SACHS & CO. Distributor and Transfer Agent | | GOLDMAN SACHS ASSET MANAGEMENT, INTERNATIONAL Investment Adviser |
Visit our website at www.GSAMFUNDS.com to obtain the most recent month-end returns.
Goldman Sachs Asset Management, L.P., 200 West Street, New York, New York 10282
The reports concerning the Funds included in this shareholder report may contain certain forward-looking statements about the factors that may affect the performance of the Funds in the future. These statements are based on Fund management’s predictions and expectations concerning certain future events and their expected impact on the Funds, such as performance of the economy as a whole and of specific industry sectors, changes in the levels of interest rates, the impact of developing world events, and other factors that may influence the future performance of the Funds. Management believes these forward-looking statements to be reasonable, although they are inherently uncertain and difficult to predict. Actual events may cause adjustments in portfolio management strategies from those currently expected to be employed.
A description of the policies and procedures that the Funds use to determine how to vote proxies relating to portfolio securities and information regarding how a Fund voted proxies relating to portfolio securities during the most recent 12-month period ended June 30 is available (i) without charge, upon request by calling 1-800-526-7384 (for Retail Shareholders) or 1-800-621-2550 (for Institutional Shareholders); and (ii) on the Securities and Exchange Commission (the “SEC”) web site at http://www.sec.gov.
The Funds file their complete schedule of portfolio holdings with the SEC for the first and third quarters of each fiscal year on Form N-Q. The Funds’ Forms N-Q are available on the SEC’s web site at http://www.sec.gov within 60 days after the Funds’ first and third fiscal quarters. The Funds’ Forms N-Q may be reviewed and copied at the SEC’s Public Reference Room in Washington, D.C., and information on the operation of the Public Reference Room may also be obtained by calling 1-800-SEC-0330. Forms N-Q may be obtained upon request and without charge by calling 1-800-526-7384 (for Retail Shareholders) or 1-800-621-2550 (for Institutional Shareholders).
Fund holdings and allocations shown are as of October 31, 2014 and may not be representative of future investments. Fund holdings should not be relied on in making investment decisions and should not be construed as research or investment advice regarding particular securities. Current and future holdings are subject to risk.
Economic and market forecasts presented herein reflect our judgment as of the date of this presentation and are subject to change without notice. These forecasts do not take into account the specific investment objectives, restrictions, tax and financial situation or other needs of any specific client. Actual data will vary and may not be reflected here. These forecasts are subject to high levels of uncertainty that may affect actual performance. Accordingly, these forecasts should be viewed as merely representative of a broad range of possible outcomes. These forecasts are estimated, based on assumptions, and are subject to significant revision and may change materially as economic and market conditions change. Goldman Sachs has no obligation to provide updates or changes to these forecasts. Case studies and examples are for illustrative purposes only.
The Global Industry Classification Standard (GICS) was developed by and is the exclusive property and a service mark of Morgan Stanley Capital International Inc. (MSCI) and Standard & Poor’s, a division of The McGraw-Hill Companies, Inc. (S&P) and is licensed for use by Goldman Sachs. Neither MSCI, S&P nor any other party involved in making or compiling the GICS or any GICS classifications makes any express or implied warranties or representations with respect to such standard or classification (or the results to be obtained by the use thereof), and all such parties hereby expressly disclaim all warranties of originality, accuracy, completeness, merchantability or fitness for a particular purpose with respect to any of such standard or classification. Without limiting any of the foregoing, in no event shall MSCI, S&P, any of their affiliates or any third party involved in making or compiling the GICS or any GICS classifications have any liability for any direct, indirect, special, punitive, consequential or any other damages (including lost profits) even if notified of the possibility of such damages.
The portfolio risk management process includes an effort to monitor and manage risk, but does not imply low risk.
This material is not authorized for distribution to prospective investors unless preceded or accompanied by a current Prospectus or summary prospectus, if applicable. Investors should consider a Fund’s objective, risks, and charges and expenses, and read the summary prospectus, if available, and/or the Prospectus carefully before investing or sending money. The summary prospectus, if available, and the Prospectus contain this and other information about a Fund and may be obtained from your authorized dealer or from Goldman, Sachs & Co. by calling (retail – 1-800-526-7384) (institutional – 1-800-621-2550).
© 2014 Goldman Sachs. All rights reserved. 148780.MF.MED.OTU / EMEAR-14 / 22K