UNITED STATES
SECURITIES AND EXCHANGE COMMISSION
Washington, D.C. 20549
FORM N-CSR
CERTIFIED SHAREHOLDER REPORT OF REGISTERED
MANAGEMENT INVESTMENT COMPANIES
Investment Company Act file number 811-05349
Goldman Sachs Trust
(Exact name of registrant as specified in charter)
71 South Wacker Drive, Chicago, Illinois 60606
(Address of principal executive offices) (Zip code)
| | |
| Caroline Kraus, Esq. | | Copies to: |
| Goldman, Sachs & Co. | | Geoffrey R.T. Kenyon, Esq. |
| 200 West Street | | Dechert LLP |
| New York, New York 10282 | | 100 Oliver Street |
| | 40th Floor |
| | Boston, MA 02110-2605 |
(Name and address of agents for service)
Registrant’s telephone number, including area code: (312) 655-4400
Date of fiscal year end: December 31
Date of reporting period: June 30, 2016
| ITEM 1. | REPORTS TO STOCKHOLDERS. |
| | The Semi-Annual Report to Shareholders is filed herewith. |
Goldman Sachs Funds

| | | | |
| | |
| Semi-Annual Report | | | | June 30, 2016 |
| | |
| | | | Fund of Funds Portfolios |
| | | | Balanced Strategy |
| | | | Equity Growth Strategy |
| | | | Growth and Income Strategy |
| | | | Growth Strategy |
| | | | Satellite Strategies |

Goldman Sachs Fund of Funds Portfolios
| n | | GROWTH AND INCOME STRATEGY |
| | | | |
TABLE OF CONTENTS | | | | |
| |
Market Review | | | 1 | |
| |
Investment Process | | | 7 | |
| |
Portfolio Management Discussions and Analysis | | | 9 | |
| |
Schedules of Investments | | | 34 | |
| |
Financial Statements | | | 40 | |
| |
Financial Highlights | | | 48 | |
| |
Notes to Financial Statements | | | 58 | |
| |
Other Information | | | 76 | |
| | | | |
| | | |
| NOT FDIC-INSURED | | May Lose Value | | No Bank Guarantee |
MARKET REVIEW
Fund of Funds Portfolios
Dear Shareholder:
This report provides an overview of regional and sector preferences of the Goldman Sachs Fund of Funds Portfolios (each, a “Portfolio,” and collectively, the “Portfolios”) during the six-month period ended June 30, 2016 (the “Reporting Period”).
Market Review
During the six months ended June 30, 2016 (the “Reporting Period”), U.S. equities recorded positive returns, while international equities suffered a decline. In broad terms, global spread (non-government bond) sectors posted solid gains.
U.S. Equities
As the Reporting Period began in January 2016, U.S. equities were embroiled in a global rout, triggered by investor concerns about an intensifying economic slowdown in China and exacerbated by an oil price plunge. Following a December 2015 interest rate hike, the January 2016 Federal Reserve (“Fed”) statement acknowledged these external risks and tightening financial conditions. U.S. equities stabilized in February 2016, as market sentiment improved on the more dovish tone set by global central banks. (Dovish language tends to suggest lower interest rates.) U.S. equities were also supported by stronger economic data, rallying as fourth quarter U.S. Gross Domestic Product (“GDP”) came in above consensus expectations. In March 2016, the Fed kept interest rates on hold and surprised on the dovish side, reducing its forecast to two interest rate hikes in 2016, down from four. Along with receding global economic concerns, this helped to drive a recovery in U.S. equities. Released in March 2016, February 2016 unemployment data came in ahead of market consensus, with unemployment steady at 4.9% in spite of higher participation rates and declining underemployment.
Following the rebound in March 2016, market sentiment appeared to remain sanguine in April 2016, as oil prices rose and China’s economic growth concerns abated. U.S. equities fell near the end of the month as investors were disappointed by a lack of additional stimulus from the Bank of Japan and by a weaker than consensus expected first quarter U.S. GDP growth rate of 0.5%. Hawkish Fed minutes released in May 2016 temporarily revived market expectations for a Fed interest rate hike in June 2016, but weaker than expected May 2016 payroll data subsequently drove such expectations lower. (Hawkish language tends to suggest higher interest rates; opposite of dovish.) The Fed ultimately held interest rates steady in June 2016 and signaled a slower pace of hikes, acknowledging the slowdown in the labor market. Markets were otherwise dominated in June 2016 by the U.K. referendum on membership in the European Union, popularly known as Brexit. U.S. equities sold off in the global risk-off, or heightened risk aversion, in June 2016 following the surprise “leave” result. Markets rebounded in the latter days of the month owing to improving risk sentiment as markets digested the Brexit vote outcome and on dovish remarks from Bank of England Governor Carney.
U.S. equities, as represented by the S&P 500® Index, gained 3.84% during the Reporting Period. Telecommunication services and utilities were the best performing sectors in the S&P 500® Index by a wide margin. Energy and consumer staples also posted double-digit gains. The energy sector was the largest positive contributor to S&P 500® Index returns, as measured by weight times performance. The weakest performing sectors in the S&P 500® Index during the Reporting Period were financials and information technology, the only two to post negative
1
MARKET REVIEW
absolute returns, followed by consumer discretionary and health care, which were also weak but generated modestly positive returns during the Reporting Period.
Within the U.S. equity market, there was significant disparity in performance not only among sectors but also among the various capitalization and style segments. While all capitalization segments posted positive returns, mid-cap stocks, as measured by the Russell Midcap® Index, performed best, followed by large-cap stocks, as measured by the Russell 1000® Index, and then, small-cap stocks, as measured by the Russell 2000® Index. From a style perspective, value-oriented stocks significantly outpaced growth-oriented stocks across the capitalization spectrum. Value outperformed relative to growth during the Reporting Period primarily due to weaker performance of the growth-oriented health care sector. (All as measured by the Russell Investments indices.)
International Equities
International equities suffered amid a global rout at the beginning of 2016, triggered by investor concerns of an intensifying economic slowdown in China and exacerbated by an oil price plunge. Sentiment improved following a dovish January European Central Bank (“ECB”) press conference on January 21, 2016, and the Bank of Japan’s (“BoJ”) introduction of negative interest rates. In turn, international equities stabilized a bit in February 2016. However, the MSCI EAFE Index still fell 1.83% in February 2016. In March 2016, further central bank dovishness, along with receding global economic concerns and oil price stabilization, helped to finally drive a global equity market recovery. Notably, the ECB implemented heavy easing, cutting its deposit rate to -40 basis points, raising its monthly quantitative easing purchases, including those of corporate bonds, and unveiling a new series of four-year loans to banks. (A basis point is 1/100th of a percentage point.) The BoJ left its monetary policy unchanged in March 2016, but its rhetoric about negative interest rates heightened expectations for further easing to come.
Market sentiment appeared to remain sanguine in April 2016, as oil prices rose and China economic growth concerns abated with modestly improving economic data. Both the ECB and BoJ were on hold, or did not make any monetary policy changes, in April 2016. BoJ inaction came as a major disappointment against expectations of further easing, causing international equities to sell off once again and the yen to appreciate. Relative currency appreciation was exacerbated by U.S. dollar weakness following a weaker than expected first quarter U.S. GDP release and an uneventful Fed meeting during which rates were left unchanged.
Hawkish Fed minutes released in May 2016 temporarily revived market expectations for a Fed interest rate hike in June 2016, but weaker than expected May 2016 payroll data subsequently drove such expectations lower. Equities rallied toward the end of May 2016 on anticipation of better economic data, rising oil prices and optimism that the economy could withstand rate hikes. Japanese equities also benefited from stronger than expected first quarter 2016 GDP growth and a weaker yen.
Markets were dominated in June 2016 by anticipation around the U.K. referendum on membership in the European Union, popularly known as the Brexit vote. International equities declined in the global risk-off sentiment that dominated the days following the June 23, 2016 vote given the surprise “leave” result. Markets rebounded in the latter days of June 2016 owing to improving risk appetite, as markets digested the outcome of the Brexit vote and on dovish remarks from Bank of England Governor Carney. Still, the MSCI EAFE Index declined 3.36% in the last month of the Reporting Period.
2
MARKET REVIEW
International equities, as measured by the MSCI EAFE Index, returned -4.04% in U.S. dollar terms for the Reporting Period. Energy, consumer staples, materials, utilities and industrials were the only sectors in the MSCI EAFE Index to post a positive return. The weakest performing sectors in the MSCI EAFE Index during the Reporting Period were financials and consumer discretionary, followed at some distance by information technology, health care and then telecommunication services.
From a country perspective, New Zealand, Singapore and Norway were the best performing equity markets in the MSCI EAFE Index during the Reporting Period. Italy was the weakest individual country constituent in the MSCI EAFE Index during the Reporting Period, followed at some distance by Ireland, Israel and Spain.
Fixed Income Markets
When the Reporting Period began, spread (or non-government bond) sectors retreated, selling off significantly from January to mid-February 2016. The selloff was driven by an increase in a number of perceived risks, such as slowing Chinese economic activity, the possibility of persistent oil oversupply and deteriorating corporate bond fundamentals, as the U.S. credit cycle entered its later stage. Some of these risks eased in the second half of the first calendar quarter, as economic news from China improved, U.S. oil production showed signs of slowing, and commodity prices appeared to stabilize. As a result, spread sectors largely retraced their losses by the end of March 2016. Global central banks remained accommodative. The Bank of Japan, in a surprise move at its January 2016 policy meeting, introduced a -0.1% interest rate, reaffirming its commitment to achieving a 2% inflation target. The ECB shifted its focus from currency depreciation to credit creation by leaving the deposit rate unchanged, expanding its asset purchase program to include purchases of non-financial corporate credit and announcing a new series of easing measures in the form of targeted long-term refinancing operations (“TLTRO II”). (TLTRO II is designed to offer attractive long-term funding conditions to Eurozone banks to further ease private sector credit conditions and to stimulate credit creation.) In the U.S., the Fed left interest rates unchanged and reduced its forecast to two rate hikes in 2016 from four. After a sustained period of appreciation, the U.S. dollar weakened during the first quarter of 2016 due to generally tighter financial conditions, mixed U.S. economic data and the Fed’s more dovish commentary.
During the second quarter of 2016, spread sectors rallied on stabilization of commodities prices as well as on declining fears about slowing Chinese economic growth and the potential for a U.S. economic recession. Global interest rates broadly declined amid continued accommodative monetary policy from the world’s central banks. In the U.S., minutes from the Fed’s April 2016 policy meeting, released in mid-May 2016, suggested Fed policymakers might raise interest rates in June 2016 if U.S. economic growth strengthened, employment data firmed and inflation rose toward the Fed’s 2% target. In early June 2016, however, the release of weak May 2016 employment data raised concerns about the health of the U.S. economy, pushing down expectations of a Fed rate hike. Indeed, the Fed did not raise interest rates at its June 2016 policy meeting. In the last week of June 2016, the unexpected “leave” vote in the U.K.’s referendum regarding Brexit renewed investor uncertainty about the path of global economic growth. Spread sectors withstood the Brexit vote relatively well, selling off at first but then recovering most of their losses afterwards. The U.S. dollar strengthened versus most global currencies during the second calendar quarter, though it weakened against the Japanese yen.
3
MARKET REVIEW
For the Reporting Period overall, sovereign emerging markets debt and high yield corporate bonds outperformed U.S Treasuries, followed at some distance by asset-backed securities and investment grade corporate bonds. Commercial mortgage-backed securities, agency securities and mortgage-backed securities generally performed in line with U.S. Treasuries. The U.S. Treasury yield curve, or spectrum of maturities, flattened during the Reporting Period as yields of six months and longer fell. The yield on the bellwether 10-year U.S. Treasury dropped approximately 80 basis points to end the Reporting Period at 1.47%. (A flattening yield curve is one wherein the differential in yields between longer-term and shorter-term maturities narrows.)
4
GOLDMAN SACHS FUND OF FUNDS PORTFOLIOS
Index Definitions
The MSCI ACWI captures large- and mid-cap representation across 23 developed markets and 23 emerging markets countries. With 2,483 constituents (as of June 30, 2016), the index covers approximately 85% of the global investable equity opportunity set.
The Barclays Global Aggregate Bond Index provides a broad-based measure of the global investment grade fixed income markets. The three major components of this index are the U.S. Aggregate, the Pan-European Aggregate, and the Asian-Pacific Aggregate Indices. The index also includes U.S. Treasury, Eurodollar, euro-yen, Canadian government, and U.S. dollar-denominated investment grade 144A securities not already represented in the three regional aggregate indices.
The Barclays U.S. Aggregate Bond Index represents an unmanaged diversified portfolio of fixed income securities, including U.S. Treasuries, investment grade corporate bonds, and mortgage-backed securities and asset-backed securities.
The Barclays U.S. Corporate High Yield Index measures the U.S. corporate market of non-investment grade fixed-rate corporate bonds. Securities are classified as high yield if the middle rating of Moody’s Investors Service, Fitch Ratings and Standard & Poor’s Ratings is, respectively, Ba1, BB+ and BB+ or below.
The S&P 500® Index is an unmanaged index of 500 stocks that is generally representative of the performance of larger companies in the U.S.
The MSCI EAFE Index is an equity index that captures large- and mid-cap representation across developed markets countries around the world, excluding the U.S. and Canada. With 930 constituents as of June 30, 2016, the index covers approximately 85% of the free float-adjusted market capitalization in each country. The developed markets countries in the MSCI EAFE Index include: Australia, Austria, Belgium, Denmark, Finland, France, Germany, Hong Kong, Ireland, Israel, Italy, Japan, the Netherlands, New Zealand, Norway, Portugal, Singapore, Spain, Sweden, Switzerland and the U.K.
The MSCI EAFE Small Cap Index is an equity index which captures small cap representation across developed markets countries around the world, excluding the U.S. and Canada. With 2,240 constituents as of June 30, 2016, the index covers approximately 14% of the free float-adjusted market capitalization in each country.
The Wilshire Real Estate Securities Index measures U.S. publicly-traded real estate securities. Designed to offer a market-based index that is more reflective of real estate held by pension funds, the Wilshire U.S. Real Estate Securities Index is composed of publicly-traded real estate equity securities and unencumbered by limitations of other appraisal-based indexes. It can serve as a proxy for direct real estate investing by excluding securities whose value is not always tied to the value of the underlying real estate. Exclusions include: mortgage REITs, net-lease REITs, real estate finance companies, mortgage brokers and bankers, commercial and residential real estate brokers, home builders, large landowners and sub-dividers of unimproved land, hybrid REITs and timber REITs. The rationale for the exclusions is that factors other than real estate supply and demand, such as interest rates, can influence the market value of these companies.
5
GOLDMAN SACHS FUND OF FUNDS PORTFOLIOS
The J.P. Morgan Government Bond Index – Emerging Markets Global Diversified Index is an unmanaged index of debt instruments of emerging countries. The index is positioned as the investable benchmark that includes only those countries that are accessible by most of the international investor base and is popular largely due to its diversification weighting scheme and country coverage.
The J.P. Morgan Government Bond Index – Emerging Markets Index tracks local currency bonds issued by emerging markets governments. As emerging markets governments look increasingly toward their domestic market for sources of finance, investors are looking more closely at local markets in search for higher yield and greater diversification.
6
GOLDMAN SACHS FUND OF FUNDS PORTFOLIO
What Differentiates Goldman Sachs’ Approach to Asset Allocation?
We believe that strong investment results through asset allocation are best achieved through teams of experts working together on a global scale:
| n | | Goldman Sachs’ Quantitative Investment Strategies Team determines the strategic and monthly tactical asset allocations. The team is comprised of over 90* professionals with significant academic and practitioner experience. |
| n | | Goldman Sachs’ Portfolio Management Teams offer expert management of the mutual funds that are contained within each Portfolio. These same teams manage portfolios for institutional and high net worth investors. |
Goldman Sachs Asset Allocation Investment Process

Quantitative Investment Strategies Team
Each Portfolio represents a diversified global portfolio on the efficient frontier.† The Portfolios differ in their long-term objective, and therefore, their asset allocation mix. The long-term strategic asset allocation is the primary source of risk and the corresponding primary determinant of total return. It therefore represents an anchor, or neutral starting point, from which tactical asset allocation decisions are made.

Quantitative Investment Strategies Team
For each Portfolio, the strategic asset allocation is combined with a measured amount of tactical risk. Changing market conditions create opportunities to capitalize on investing in different countries and asset classes relative to others over time. Within each strategy, we shift assets away from the strategic allocation (over and underweighting certain asset classes and countries) to seek to benefit from changing conditions in global capital markets.
Using proprietary portfolio construction models to maintain each Portfolio’s original risk/return profile over time, the team makes ten active decisions based on its current outlook on global equity, fixed income and currency markets.
| | |
n Asset class selection | | Are stocks, bonds or cash more attractive? |
n Regional equity selection | | Are U.S. or non-U.S. equities more attractive? |
n Regional bond selection | | Are U.S. or non-U.S. bonds more attractive? |
n U.S. equity style selection | | Are U.S. value or U.S. growth equities more attractive? |
n U.S. equity size selection | | Are U.S. large-cap or U.S. small-cap equities more attractive? |
n Emerging/developed equity selection | | Are emerging or developed equities more attractive? |
| †Portfolios | | on the efficient frontier are optimal in both the sense that they offer maximal expected return for some given level of risk and minimal risk for some given level of expected return. The efficient frontier is the line created from the risk-reward graph, comprised of optimal portfolios. The optimal portfolios plotted along the curve have the highest expected return possible for the given amount of risk. |
7
GOLDMAN SACHS FUND OF FUNDS PORTFOLIO

| | |
n Developed equity country selection | | Which international countries are more attractive? |
n Emerging equity country selection | | Which emerging market countries are more attractive? |
n High yield selection | | Are high yield or core fixed income securities more attractive? |
n Emerging/developed bond selection | | Are emerging or developed bonds more attractive? |

Mutual Fund Portfolio Management Teams
Each Portfolio is comprised of underlying Goldman Sachs Mutual Funds managed by broad, deep portfolio management teams. In addition to global tactical asset allocation, we seek to generate excess returns through security selection within each underlying mutual fund. Whether in the equity or fixed income arenas, these portfolio management teams share a commitment to firsthand fundamental research and seek performance driven by successful security selection.
8
PORTFOLIO RESULTS
Fund of Funds Portfolios – Asset Allocation
Investment Process and Principal Strategies
Each Portfolio seeks to achieve its investment objective by investing in a combination of underlying funds that currently exist or that may become available for investment in the future for which Goldman Sachs Asset Management (“GSAM”) or an affiliate, now or in the future, acts as investment adviser or principal underwriter (the “underlying funds”). Some of the Portfolios’ underlying funds invest primarily in fixed income or money market instruments, and some invest primarily in equity securities. Some underlying funds also invest dynamically across equity, fixed income, commodity and other markets through a managed volatility or trend-following approach.
The investment adviser allows the Portfolios’ strategic targets to shift with their respective market returns but continues to adjust tactical tilts on a monthly basis to reflect the investment adviser’s latest views. The investment adviser adjusts the overall asset allocation of the Portfolios based on current market conditions and the investment adviser’s economic and market forecasts.
Portfolio Management Discussion and Analysis
Below, the Goldman Sachs Quantitative Investment Strategies Team discusses the Portfolios’ performance and positioning for the six-month period ended June 30, 2016 (the “Reporting Period”).
| Q | | How did the Portfolios perform during the Reporting Period? |
| A | | Goldman Sachs Balanced Strategy Portfolio — During the Reporting Period, the Balanced Strategy Portfolio’s Class A, C, Institutional, Service, IR, R and R6 Shares generated cumulative total returns, without sales charges, of 2.42%, 1.93%, 2.51%, 3.12%, 2.55%, 2.51% and 2.61%, respectively. This compares to the 4.00% cumulative total return of the Portfolio’s blended benchmark, which is composed 60% of the Barclays Global Aggregate Bond Index (Gross, USD, Hedged) (“Barclays Global Index”) and 40% of the MSCI All Country World Index (Net, USD, Unhedged) (“MSCI ACWI Index”), during the same period. |
| | The components of the Portfolio’s blended benchmark, the Barclays Global Index and the MSCI ACWI Index, generated cumulative total returns of 5.87% and 1.23%, respectively, during the Reporting Period. |
| | Goldman Sachs Equity Growth Strategy Portfolio — During the Reporting Period, the Equity Growth Strategy Portfolio’s Class A, C, Institutional, Service, IR, R and R6 Shares generated cumulative total returns, without sales charges, of 0.35%, -0.07%, 0.55%, 0.28%, 0.42%, 0.21% and 0.48%, respectively. This compares to the 1.23% cumulative total return of the Portfolio’s benchmark, the MSCI ACWI Index, during the same period. |
| | Goldman Sachs Growth and Income Strategy Portfolio — During the Reporting Period, the Growth and Income Strategy Portfolio’s Class A, C, Institutional, Service, IR, R and R6 Shares generated cumulative total returns, without sales charges, of 1.55%, 1.14%, 1.74%, 1.44%, 1.68%, 1.32% and 1.65%, respectively. This compares to the 3.08% cumulative total return of the Portfolio’s blended benchmark, which is composed 40% of the Barclays Global Index and 60% of the MSCI ACWI Index, during the same period. |
| | The components of the Portfolio’s blended benchmark, the Barclays Global Index and the MSCI ACWI Index, generated cumulative total returns of 5.87% and 1.23%, respectively, during the Reporting Period. |
| | Goldman Sachs Growth Strategy Portfolio — During the Reporting Period, the Growth Strategy Portfolio’s Class A, C, Institutional, Service, IR, R and R6 Shares generated cumulative total returns, without sales charges, of 0.71%, 0.32%, 0.87%, 0.63%, 0.88%, 0.64% and 0.87%, respectively. This compares to the 2.15% cumulative total return of the Portfolio’s blended benchmark, which is composed 80% of the MSCI ACWI Index and 20% of the Barclays Global Index, during the same period. |
| | The components of the Portfolio’s blended benchmark, the Barclays Global Index and the MSCI ACWI Index, generated cumulative total returns of 5.87% and 1.23%, respectively, during the same period. |
9
PORTFOLIO RESULTS
| Q | | What key factors affected the Portfolios’ performance during the Reporting Period? |
| A | | During the Reporting Period, the Portfolios generated positive results on an absolute basis, with those having greater fixed income exposure performing best. However, these four Portfolios underperformed their respective benchmark indices. Overall, security selection within the underlying funds and the implementation of our monthly tactical views detracted from the performance of each of the Portfolios. The Portfolios benefited from our strategic, long-term asset allocation policy. |
| Q | | How did Global Tactical Asset Allocation decisions affect the Portfolios’ performance during the Reporting Period? |
| A | | The implementation of our monthly tactical views detracted from the performance of the Portfolios during the Reporting Period. |
| | Overall, the Portfolios were hurt by our preference for equities over fixed income. Within equity allocations, however, an overweight in U.S. equities versus international equities contributed positively. The Portfolios’ overweight positions in developed market stocks versus emerging markets stocks, U.S. small-cap stocks versus U.S. large-cap stocks and U.S. value stocks versus U.S. growth stocks had a relatively neutral impact on performance during the Reporting Period. |
| | Within fixed income allocations, an overweight in U.S. dollar-denominated emerging markets debt versus developed markets debt added to returns. In addition, an overweight position in high yield corporate bonds versus investment grade corporate bonds was advantageous. The Portfolios’ overweight positions in local emerging markets debt versus developed markets debt and in U.S. fixed income versus international fixed income had a rather neutral impact on returns during the Reporting Period. |
| | In terms of our country-level views, the Portfolios were hampered by our country selection strategy within emerging markets equities (accomplished through an investment in the Goldman Sachs Emerging Markets Equity Insights Fund) and within international equities (implemented through an investment in the Goldman Sachs International Equity Insights Fund) during the Reporting Period. |
| Q | | How did the Portfolios’ underlying funds perform relative to their respective benchmark indices during the Reporting Period? |
| A | | Of the Portfolios’ underlying equity funds, the Goldman Sachs International Equity Insights Fund and the Goldman Sachs Small Cap Equity Insights Fund outperformed their respective benchmark indices the most. The Goldman Sachs Large Cap Value Fund underperformed its benchmark index most during the Reporting Period. |
| | On the fixed income side, the Goldman Sachs Emerging Markets Debt Fund and the Goldman Sachs Local Emerging Markets Debt Fund outperformed their benchmark indices, though not to a significant extent. The Goldman Sachs High Yield Fund and the Goldman Sachs Global Income Fund underperformed their respective benchmark indices most during the Reporting Period. |
| | Among alternative and dynamic investment strategies, the Goldman Sachs Dynamic Allocation Fund outperformed its benchmark index. The Goldman Sachs International Real Estate Securities Fund and the Goldman Sachs Real Estate Securities Fund underperformed their respective benchmark indices during the Reporting Period. |
| Q | | How did the Portfolios use derivatives and similar instruments during the Reporting Period? |
| A | | The Portfolios do not directly invest in derivatives. However, some of the underlying funds used derivatives during the Reporting Period to apply their active investment views with greater versatility and to potentially afford greater risk management precision. As market conditions warranted during the Reporting Period, some of these underlying funds engaged in forward foreign currency exchange contracts, financial futures contracts, options, swap contracts and structured securities to attempt to enhance portfolio return and for hedging purposes. |
| Q | | What changes did you make during the Reporting Period within both the equity and fixed income portions of the Portfolios? |
| A | | In implementing our strategies, we held a slightly bearish view on equities versus fixed income at the start of the Reporting Period due to poor momentum in the global equity markets. We shifted to a neutral position during the first quarter of 2016 and to a slightly bullish view on stocks relative to bonds during the second calendar quarter. |
10
PORTFOLIO RESULTS
| | Within equities, at the beginning of the Reporting Period, we favored U.S. stocks over international stocks, a view driven by strong momentum in the U.S. stock market. We maintained this view during the first quarter of 2016, becoming neutral on U.S. stocks versus international stocks during the second calendar quarter. |
| | When the Reporting Period started, we had a slightly bearish view on emerging markets equities versus developed markets equities because of poor momentum, what we considered to be expensive valuations and weak macroeconomic conditions in the emerging markets. We continued to favor developed markets stocks over emerging markets stocks during the first quarter of 2016 due to poor momentum and weak macroeconomic conditions in the emerging markets. We were bullish on developed markets stocks versus emerging markets stocks during the second quarter of 2016 because of poor momentum and what we viewed as expensive valuations among emerging markets stocks. |
| | We implemented our country level views within the Goldman Sachs International Equity Insights Fund and the Goldman Sachs Emerging Markets Equity Insights Fund, which served as underlying funds during the Reporting Period. Among developed markets equities at the end of the Reporting Period, we were bullish on Australia and France due to what we considered to be low investor risk aversion and strong momentum in those markets. We held bearish views on Portugal and Hong Kong because of what we viewed as less attractive macroeconomic conditions and poor short-term momentum. Among emerging markets equities at the end of the Reporting Period, we favored Russia and Turkey, primarily as a result of what we saw as attractive long-term valuations and favorable inflation outlooks. We were bearish on the Philippines and India due to what we considered to be less attractive long-term valuations. |
| | Among U.S. equities, we began the Reporting Period bullish on growth stocks relative to value stocks because of improved market sentiment for growth stocks. We remained bullish on growth stocks relative to value stocks in the first quarter of 2016 due to continued positive market sentiment for growth stocks. During the second calendar quarter, we maintained our bullish view on growth stocks versus value stocks because of what we considered to be a higher risk appetite for growth stocks than for value stocks. At the beginning of the Reporting Period and through the end of the first calendar quarter, we were bullish on large-cap stocks versus small-cap stocks given heightened investor risk aversion. We maintained a bullish view, though to a lesser extent, on large-cap stocks versus small-cap stocks during the second quarter of 2016 due to what we viewed as improved valuations among small-cap stocks. |
| | Within fixed income, at the start of the Reporting Period, we had a bullish view on U.S. fixed income versus international fixed income due to what we considered to be more attractive yields in the U.S. fixed income market. During the first quarter of 2016, we shifted our view to slightly bearish on U.S. fixed income versus international fixed income because of what we saw as more attractive yields in the international fixed income market. We increased our bearish view on U.S. fixed income relative to international fixed income during the second calendar quarter as a result of weak cross-sector momentum within the U.S. fixed income market. At the beginning of the Reporting Period and through the first quarter of 2016, we were bullish on investment grade corporate bonds relative to high yield corporate bonds given heightened risk aversion and negative momentum in the high yield corporate bond market. During the second calendar quarter, we moderated our bullish view on investment grade fixed income versus high yield corporate bonds due to what we viewed as a reduced risk appetite in the high yield corporate bond market. |
| | When the Reporting Period started, we had a neutral view on U.S. dollar-denominated emerging markets debt versus developed markets debt as a result of negative momentum in U.S. dollar-denominated emerging markets debt. We grew bearish on U.S. dollar-denominated emerging markets debt versus developed markets debt during the first quarter of 2016. In the second calendar quarter, we shifted to a neutral view on U.S. dollar-denominated emerging markets debt versus developed markets debt because of improved momentum in U.S. dollar-denominated emerging markets debt. At the beginning of the Reporting Period and through the end of the first calendar quarter, we were bearish on local emerging markets debt versus developed markets debt, largely because of weak momentum in emerging markets currencies. We became neutral on local emerging markets debt relative to developed markets debt during the second calendar quarter as a result of improved momentum in local emerging markets debt. |
| | In addition, during the first quarter of 2016, there was a reorganization that affected two of the Portfolios’ underlying funds. Effective February 5, 2016, the Goldman Sachs International Small Cap Fund was closed and its corresponding shares were reorganized into the Goldman |
11
PORTFOLIO RESULTS
| | Sachs International Small Cap Insights Fund. There was no material impact on the Portfolios’ risk exposures. In an effort to further diversify our active risk within the international equity exposure of the Portfolios, we also introduced the Goldman Sachs Focused International Equity Fund, effective April 28, 2016. |
| Q | | What is the Portfolios’ tactical view and strategy for the months ahead? |
| A | | Global equilibrium is the foundation of our strategic asset allocation process — that is, we believe that a globally- diversified portfolio of asset classes, weighted by their market capitalization, provides economically intuitive, meaningful and balanced exposures to investment opportunities. We make 10 active decisions within the Portfolios based on our current outlook on global equity, fixed income and currency markets. On a monthly basis, we shift assets away from the strategic allocation (tilting our positions in certain asset classes and countries from their longer-term, strategic weights) in an effort to benefit from changing conditions in global capital markets. |
| | At the end of the Reporting Period, we were bullish on stocks relative to bonds. We favored U.S. equities over international equities and developed markets stocks over emerging markets stocks. Within U.S. equities, we had decreased our bullish view on growth stocks versus value stocks and had shifted to a neutral view on large-cap stocks versus small-cap stocks. |
| | In fixed income at the end of the Reporting Period, we had grown less bearish on U.S. fixed income relative to international fixed income. We had shifted to a bullish view on high yield corporate bonds versus investment grade corporate bonds. In addition, we were slightly bullish on local emerging markets debt versus developed markets debt and on U.S. dollar-denominated emerging markets debt versus developed markets debt. |
12
FUND BASICS
Balanced Strategy
as of June 30, 2016
| | | | | | | | | | | | | | | | | | |
| | PERFORMANCE REVIEW | |
| | | January 1, 2016– June 30, 2016 | | Portfolio Total Return (based on NAV)1 | | | Balanced Strategy
Composite Index2 | | | Barclays Global
Index | | | MSCI ACWI Index | |
| | Class A | | | 2.42 | % | | | 4.00 | % | | | 5.87 | % | | | 1.23 | % |
| | Class C | | | 1.93 | | | | 4.00 | | | | 5.87 | | | | 1.23 | |
| | Institutional | | | 2.51 | | | | 4.00 | | | | 5.87 | | | | 1.23 | |
| | Service | | | 3.12 | | | | 4.00 | | | | 5.87 | | | | 1.23 | |
| | Class IR | | | 2.55 | | | | 4.00 | | | | 5.87 | | | | 1.23 | |
| | Class R | | | 2.51 | | | | 4.00 | | | | 5.87 | | | | 1.23 | |
| | | Class R6 | | | 2.61 | | | | 4.00 | | | | 5.87 | | | | 1.23 | |
| | 1 | | The net asset value (“NAV”) represents the net assets of the class of the Portfolio (ex-dividend) divided by the total number of shares of the class outstanding. The Portfolio’s performance assumes the reinvestment of dividends and other distributions. The Portfolio’s performance does not reflect the deduction of any applicable sales charges. |
| | 2 | | The Balanced Strategy Composite Index (“Balanced Composite”) is a composite representation prepared by the investment adviser of the performance of the Portfolio’s asset classes weighted according to their respective weightings in the Portfolio’s target range. The Balanced Composite is comprised of a blend of the Barclays Global Aggregate Bond Index (Gross, USD, Hedged) (“Barclays Global Index”) (60%) and the MSCI All Country World Index (Net, USD, Unhedged) (“MSCI® ACWI Index”) (40%). The Barclays Global Index is an unmanaged index, provides a broad-based measure of the global investment grade fixed-rate debt markets and covers the most liquid portion of the global investment grade fixed-rate bond market, including government, credit and collateralized securities. The Index figures do not include any deduction for fees, expenses or taxes. It is not possible to invest directly in an unmanaged index. The MSCI® ACWI Index is a free float-adjusted market capitalization weighted index that is designed to measure the equity market performance of developed and emerging markets. The MSCI® ACWI Index consists of 46 country indices comprising 23 developed and 23 emerging market country indices. The developed market country indices included are: Australia, Austria, Belgium, Canada, Denmark, Finland, France, Germany, Hong Kong, Ireland, Israel, Italy, Japan, Netherlands, New Zealand, Norway, Portugal, Singapore, Spain, Sweden, Switzerland, the United Kingdom and the United States. The emerging market country indices are: Brazil, Chile, China, Colombia, Czech Republic, Egypt, Greece, Hungary, India, Indonesia, South Korea, Malaysia, Mexico, Peru, Philippines, Poland, Russia, Qatar, South Africa, Taiwan, Thailand, Turkey and the United Arab Emirates. The Index figures do not include any deduction for fees, expenses or taxes. It is not possible to invest directly in an unmanaged index. |
The returns set forth in the table above represent past performance. Past performance does not guarantee future results. The Portfolio’s investment return and principal value will fluctuate so that an investor’s shares, when redeemed, may be worth more or less than their original cost. Current performance may be lower or higher than the performance quoted above. Please visit our web site at www.gsamfunds.com to obtain the most recent month-end returns. Performance reflects applicable fee waivers and/or expense limitations in effect during the periods shown. In their absence, performance would be reduced. Returns do not reflect the deduction of taxes that a shareholder would pay on Portfolio distributions or the redemption of Portfolio shares.
13
FUND BASICS
| | | | | | | | | | | | | | | | | | | | |
| | STANDARDIZED TOTAL RETURNS3 |
| | | For the period ended 6/30/16 | | One Year | | | Five Years | | | Ten Years | | | Since Inception | | | Inception Date |
| | Class A | | | -4.55 | % | | | 2.06 | % | | | 2.87 | % | | | 3.95 | % | | 1/2/98 |
| | Class C | | | -0.91 | | | | 2.43 | | | | 2.68 | | | | 3.49 | | | 1/2/98 |
| | Institutional | | | 1.26 | | | | 3.61 | | | | 3.87 | | | | 4.68 | | | 1/2/98 |
| | Service | | | 1.60 | | | | 3.29 | | | | 3.43 | | | | 4.21 | | | 1/2/98 |
| | Class IR | | | 1.21 | | | | 3.48 | | | | N/A | | | | 2.89 | | | 11/30/07 |
| | Class R | | | 0.83 | | | | 3.00 | | | | N/A | | | | 2.43 | | | 11/30/07 |
| | | Class R6 | | | N/A | | | | N/A | | | | N/A | | | | 0.54 | | | 7/31/15 |
| | 3 | | The Standardized Total Returns are average annual or cumulative total returns (only if the performance period is one year or less) as of the most recent calendar quarter-end. They assume reinvestment of all distributions at NAV. These returns reflect a maximum initial sales charge of 5.5% for Class A Shares and the assumed contingent deferred sales charge for Class C Shares (1% if redeemed within 12 months of purchase). Because Institutional, Service, Class IR, Class R and Class R6 Shares do not involve a sales charge, such a charge is not applied to their Standardized Total Returns. |
The returns set forth in the table above represent past performance. Past performance does not guarantee future results. The Portfolio’s investment return and principal value will fluctuate so that an investor’s shares, when redeemed, may be worth more or less than their original cost. Current performance may be lower or higher than the performance quoted above. Please visit our web site at www.gsamfunds.com to obtain the most recent month-end returns. Performance reflects applicable fee waivers and/or expense limitations in effect during the periods shown. In their absence, performance would be reduced. Returns do not reflect the deduction of taxes that a shareholder would pay on Portfolio distributions or the redemption of Portfolio shares.
| | | | | | | | | | |
| | EXPENSE RATIOS4 | |
| | | | | Net Expense Ratio (Current) | | | Gross Expense Ratio (Before Waivers) | |
| | Class A | | | 1.34 | % | | | 1.40 | % |
| | Class C | | | 2.09 | | | | 2.15 | |
| | Institutional | | | 0.94 | | | | 1.00 | |
| | Service | | | 1.44 | | | | 1.50 | |
| | Class IR | | | 1.09 | | | | 1.15 | |
| | Class R | | | 1.59 | | | | 1.65 | |
| | | Class R6 | | | 0.92 | | | | 0.98 | |
| | 4 | | The expense ratios of the Portfolio, both current (net of applicable fee waivers and/or expense limitations) and before waivers (gross of applicable fee waivers and/or expense limitations) are as set forth above according to the most recent publicly available Prospectus for the Portfolio and may differ from the expense ratios disclosed in the Financial Highlights in this report. The Portfolio’s waivers and/or expense limitations will remain in place through at least April 29, 2017, and prior to such date the Investment Adviser may not terminate the arrangements without the approval of the Portfolio’s Board of Trustees. If these arrangements are discontinued in the future, the expense ratios may change without shareholder approval. |
14
FUND BASICS
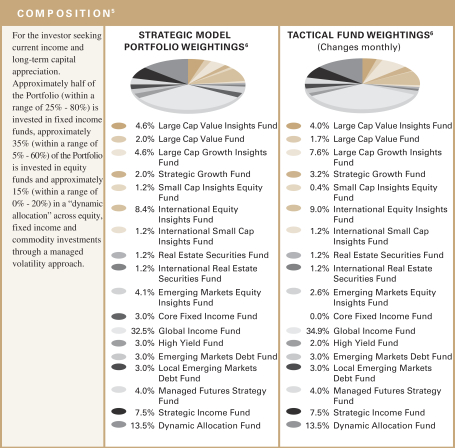
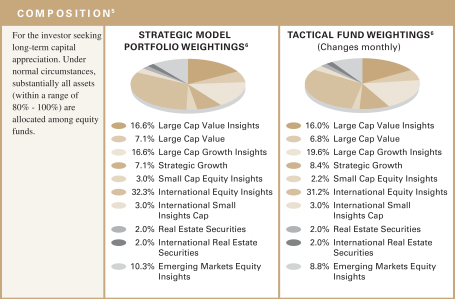
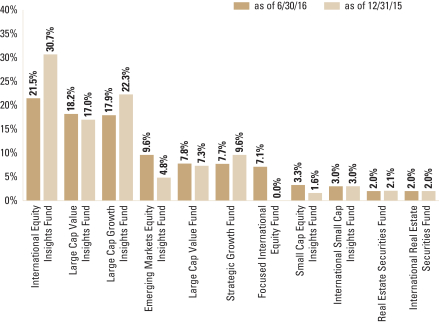
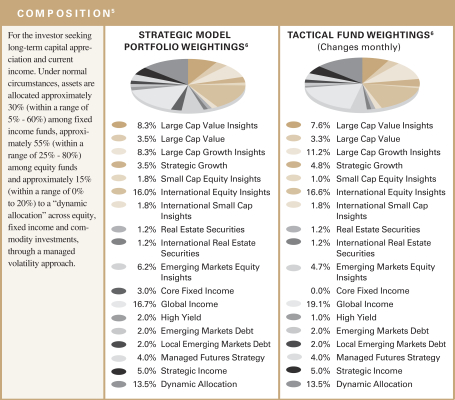
| | 5 | | The tactical fund weightings are set at the beginning of each calendar quarter. The weightings in the chart above reflect the allocations from March 31, 2016 to June 30, 2016. Actual Fund weighting in the Portfolios may differ from the figures shown above due to rounding, differences in returns of the Underlying Funds, or both. The above figures are not indicative of future allocations. |
| | 6 | | Strategic allocation is the process of determining the areas of the global markets in which to invest, and in what long-term proportion, for each underlying fund. Our global approach attempts to generate strong long-term returns across geographies and asset classes, and is determined through a careful review of market opportunities and risk/return tradeoffs. It is rebalanced annually. On a monthly basis, we shift assets around the strategic allocation, over and under-weighting asset classes and countries relative to the neutral starting point, seeking to benefit from changing short-term conditions in global capital markets. This is called tactical asset allocation. |
15
FUND BASICS
|
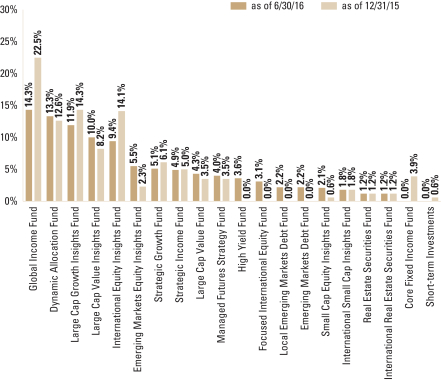
| OVERALL UNDERLYING FUND WEIGHTINGS7 |
| Percentage of Net Assets |
| | 7 | | The Portfolio is actively managed and, as such, its composition may differ over time. The percentage shown for each underlying fund reflects the value of that underlying fund as a percentage of net assets of the Portfolio. Short-Term Investments represent repurchase agreements. Figures in the above graph may not sum to 100% due to rounding and/or the exclusion of other assets and liabilities. |
16
FUND BASICS
Equity Growth Strategy
as of June 30, 2016
| | | | | | | | | | |
| | PERFORMANCE REVIEW | |
| | | January 1, 2016–June 30, 2016 | | Portfolio Total Return (based on NAV)1 | | | MSCI® ACWI Index2 | |
| | Class A | | | 0.35 | % | | | 1.23 | % |
| | Class C | | | -0.07 | | | | 1.23 | |
| | Institutional | | | 0.55 | | | | 1.23 | |
| | Service | | | 0.28 | | | | 1.23 | |
| | Class IR | | | 0.42 | | | | 1.23 | |
| | Class R | | | 0.21 | | | | 1.23 | |
| | | Class R6 | | | 0.48 | | | | 1.23 | |
| | 1 | | The net asset value (“NAV”) represents the net assets of the class of the Portfolio (ex-dividend) divided by the total number of shares of the class outstanding. The Portfolio’s performance assumes the reinvestment of dividends and other distributions. The Portfolio’s performance does not reflect the deduction of any applicable sales charges. |
| | 2 | | The Portfolio’s benchmark is the MSCI All Country World Index (Net, USD, Unhedged) (“MSCI® ACWI Index”). The MSCI® ACWI Index is a free float-adjusted market capitalization weighted index that is designed to measure the equity market performance of developed and emerging markets. The MSCI® ACWI Index consists of 46 country indices comprising 23 developed and 23 emerging market country indices. The developed market country indices included are: Australia, Austria, Belgium, Canada, Denmark, Finland, France, Germany, Hong Kong, Ireland, Israel, Italy, Japan, Netherlands, New Zealand, Norway, Portugal, Singapore, Spain, Sweden, Switzerland, the United Kingdom and the United States. The emerging market country indices are: Brazil, Chile, China, Colombia, Czech Republic, Egypt, Greece, Hungary, India, Indonesia, South Korea, Malaysia, Mexico, Peru, Philippines, Poland, Russia, Qatar, South Africa, Taiwan, Thailand, Turkey and the United Arab Emirates. The Index figures do not include any deduction for fees, expenses or taxes. It is not possible to invest directly in an unmanaged index. |
The returns set forth in the table above represent past performance. Past performance does not guarantee future results. The Portfolio’s investment return and principal value will fluctuate so that an investor’s shares, when redeemed, may be worth more or less than their original cost. Current performance may be lower or higher than the performance quoted above. Please visit our web site at www.gsamfunds.com to obtain the most recent month-end returns. Performance reflects applicable fee waivers and/or expense limitations in effect during the periods shown. In their absence, performance would be reduced. Returns do not reflect the deduction of taxes that a shareholder would pay on Portfolio distributions or the redemption of Portfolio shares.
17
FUND BASICS
| | | | | | | | | | | | | | | | | | | | |
| | STANDARDIZED TOTAL RETURNS3 |
| | | For the period ended 6/30/16 | | One Year | | | Five Years | | | Ten Years | | | Since Inception | | | Inception Date |
| | Class A | | | -7.97 | % | | | 4.43 | % | | | 2.70 | % | | | 4.00 | % | | 1/2/98 |
| | Class C | | | -4.39 | | | | 4.83 | | | | 2.51 | | | | 3.55 | | | 1/2/98 |
| | Institutional | | | -2.22 | | | | 6.05 | | | | 3.70 | | | | 4.72 | | | 1/2/98 |
| | Service | | | -2.78 | | | | 5.53 | | | | 3.18 | | | | 4.21 | | | 1/2/98 |
| | Class IR | | | -2.42 | | | | 5.89 | | | | N/A | | | | 1.87 | | | 11/30/07 |
| | Class R | | | -2.89 | | | | 5.36 | | | | N/A | | | | 1.42 | | | 11/30/07 |
| | | Class R6 | | | N/A | | | | N/A | | | | N/A | | | | -3.47 | | | 7/31/15 |
| | 3 | | The Standardized Total Returns are average annual or cumulative total returns (only if the performance period is one year or less) or cumulative as of the most recent calendar quarter-end. They assume reinvestment of all distributions at NAV. These returns reflect a maximum initial sales charge of 5.5% for Class A Shares and the assumed contingent deferred sales charge for Class C Shares (1% if redeemed within 12 months of purchase). Because Institutional, Service, Class IR, Class R and Class R6 Shares do not involve a sales charge, such a charge is not applied to their Standardized Total Returns. |
The returns set forth in the table above represent past performance. Past performance does not guarantee future results. The Portfolio’s investment return and principal value will fluctuate so that an investor’s shares, when redeemed, may be worth more or less than their original cost. Current performance may be lower or higher than the performance quoted above. Please visit our web site at www.gsamfunds.com to obtain the most recent month-end returns. Performance reflects applicable fee waivers and/or expense limitations in effect during the periods shown. In their absence, performance would be reduced. Returns do not reflect the deduction of taxes that a shareholder would pay on Portfolio distributions or the redemption of Portfolio shares.
| | | | | | | | | | |
| | EXPENSE RATIOS4 | |
| | | | | Net Expense Ratio (Current) | | | Gross Expense Ratio (Before Waivers) | |
| | Class A | | | 1.34 | % | | | 1.42 | % |
| | Class C | | | 2.09 | | | | 2.17 | |
| | Institutional | | | 0.94 | | | | 1.02 | |
| | Service | | | 1.44 | | | | 1.52 | |
| | Class IR | | | 1.09 | | | | 1.17 | |
| | Class R | | | 1.59 | | | | 1.67 | |
| | | Class R6 | | | 0.92 | | | | 1.00 | |
| | 4 | | The expense ratios of the Portfolio, both current (net of applicable fee waivers and/or expense limitations) and before waivers (gross of applicable fee waivers and/or expense limitations) are as set forth above according to the most recent publicly available Prospectus for the Portfolio and may differ from the expense ratios disclosed in the Financial Highlights in this report. The Portfolio’s waivers and/or expense limitations will remain in place through at least April 29, 2017, and prior to such date the Investment Adviser may not terminate the arrangements without the approval of the Portfolio’s Board of Trustees. If these arrangements are discontinued in the future, the expense ratios may change without shareholder approval. |
18
FUND BASICS
| | 5 | | The tactical fund weightings are set at the beginning of each calendar quarter. The weightings in the chart above reflect the allocations from March 31, 2016 to June 30, 2016. Actual underlying fund weighting in the Portfolios may differ from the figures shown above due to rounding, differences in returns of the underlying funds, or both. The above figures are not indicative of future allocations. |
| | 6 | | Strategic allocation is the process of determining the areas of the global markets in which to invest, and in what long-term proportion, for each underlying fund. Our global approach attempts to generate strong long-term returns across geographies and asset classes, and is determined through a careful review of market opportunities and risk/return tradeoffs. It is rebalanced annually. On a monthly basis, we shift assets around the strategic allocation, over and under-weighting asset classes and countries relative to the neutral starting point, seeking to benefit from changing short-term conditions in global capital markets. This is called tactical asset allocation. |
19
FUND BASICS
|
| OVERALL UNDERLYING FUND WEIGHTINGS7 |
| Percentage of Net Assets |
| | 7 | | The Portfolio is actively managed and, as such, its composition may differ over time. The percentage shown for each underlying fund reflects the value of that underlying fund as a percentage of net assets of the Portfolio. Figures in the above graph may not sum to 100% due to rounding and/or the exclusion of other assets and liabilities. |
20
FUND BASICS
Growth and Income Strategy
as of June 30, 2016
| | | | | | | | | | | | | | | | | | |
| | PERFORMANCE REVIEW | |
| | | January 1, 2016– June 30, 2016 | | Portfolio Total Return
(based on NAV)1 | | | Growth and Income
Strategy Composite Index2 | | | Barclays Global
Index | | | MSCI ACWI Index | |
| | Class A | | | 1.55 | % | | | 3.08 | % | | | 5.87 | % | | | 1.23 | % |
| | Class C | | | 1.14 | | | | 3.08 | | | | 5.87 | | | | 1.23 | |
| | Institutional | | | 1.74 | | | | 3.08 | | | | 5.87 | | | | 1.23 | |
| | Service | | | 1.44 | | | | 3.08 | | | | 5.87 | | | | 1.23 | |
| | Class IR | | | 1.68 | | | | 3.08 | | | | 5.87 | | | | 1.23 | |
| | Class R | | | 1.32 | | | | 3.08 | | | | 5.87 | | | | 1.23 | |
| | | Class R6 | | | 1.65 | | | | 3.08 | | | | 5.87 | | | | 1.23 | |
| | 1 | | The net asset value (“NAV”) represents the net assets of the class of the Portfolio (ex-dividend) divided by the total number of shares of the class outstanding. The Portfolio’s performance assumes the reinvestment of dividends and other distributions. The Portfolio’s performance does not reflect the deduction of any applicable sales charges. |
| | 2 | | The Growth and Income Strategy Composite Index (“Growth and Income Composite”) is a composite representation prepared by the investment adviser of the performance of the Portfolio’s asset classes weighted according to their respective weightings in the Portfolio’s target range. The Growth and Income Composite is comprised of a blend of the Barclays Global Aggregate Bond Index (Gross, USD, Hedged) (“Barclays Global Index”) (40%) and the MSCI All Country World Index (Net, USD, Unhedged) (“MSCI® ACWI Index”) (60%). The Growth and Income Composite figures do not reflect any deduction for fees, expenses or taxes. The Barclays Global Index is an unmanaged index, provides a broad-based measure of the global investment-grade fixed-rate debt markets and covers the most liquid portion of the global investment grade fixed-rate bond market, including government, credit and collateralized securities. The Index figures do not include any deduction for fees, expenses or taxes. It is not possible to invest directly in an unmanaged index. The MSCI® ACWI Index is a free float-adjusted market capitalization weighted index that is designed to measure the equity market performance of developed and emerging markets. The MSCI® ACWI Index consists of 46 country indices comprising 23 developed and 23 emerging market country indices. The developed market country indices included are: Australia, Austria, Belgium, Canada, Denmark, Finland, France, Germany, Hong Kong, Ireland, Israel, Italy, Japan, Netherlands, New Zealand, Norway, Portugal, Singapore, Spain, Sweden, Switzerland, the United Kingdom and the United States. The emerging market country indices are: Brazil, Chile, China, Colombia, Czech Republic, Egypt, Greece, Hungary, India, Indonesia, South Korea, Malaysia, Mexico, Peru, Philippines, Poland, Qatar, Russia, South Africa, Taiwan, Thailand, Turkey and the United Arab Emirates. The Index figures do not include any deduction for fees, expenses or taxes. It is not possible to invest directly in an unmanaged index. |
The returns set forth in the table above represent past performance. Past performance does not guarantee future results. The Portfolio’s investment return and principal value will fluctuate so that an investor’s shares, when redeemed, may be worth more or less than their original cost. Current performance may be lower or higher than the performance quoted above. Please visit our web site at www.gsamfunds.com to obtain the most recent month-end returns. Performance reflects applicable fee waivers and/or expense limitations in effect during the periods shown. In their absence, performance would be reduced. Returns do not reflect the deduction of taxes that a shareholder would pay on Portfolio distributions or the redemption of Portfolio shares.
21
FUND BASICS
| | | | | | | | | | | | | | | | | | | | |
| | STANDARDIZED TOTAL RETURNS3 |
| | | For the period ended 6/30/16 | | One Year | | | Five Years | | | Ten Years | | | Since Inception | | | Inception Date |
| | Class A | | | -6.19 | % | | | 2.73 | % | | | 2.62 | % | | | 4.11 | % | | 1/2/98 |
| | Class C | | | -2.50 | | | | 3.13 | | | | 2.43 | | | | 3.65 | | | 1/2/98 |
| | Institutional | | | -0.39 | | | | 4.32 | | | | 3.61 | | | | 4.85 | | | 1/2/98 |
| | Service | | | -0.86 | | | | 3.80 | | | | 3.10 | | | | 4.32 | | | 1/2/98 |
| | Class IR | | | -0.53 | | | | 4.15 | | | | N/A | | | | 2.22 | | | 11/30/07 |
| | Class R | | | -1.05 | | | | 3.63 | | | | N/A | | | | 1.74 | | | 11/30/07 |
| | | Class R6 | | | N/A | | | | N/A | | | | N/A | | | | -1.27 | | | 7/31/15 |
| | 3 | | The Standardized Total Returns are average annual or cumulative total returns (only if the performance period is one year or less) as of the most recent calendar quarter-end. They assume reinvestment of all distributions at NAV. These returns reflect a maximum initial sales charge of 5.5% for Class A Shares and the assumed contingent deferred sales charge for Class C Shares (1% if redeemed within 12 months of purchase). Because Institutional, Service, Class IR, Class R and Class R6 Shares do not involve a sales charge, such a charge is not applied to their Standardized Total Returns. |
The returns set forth in the table above represent past performance. Past performance does not guarantee future results. The Portfolio’s investment return and principal value will fluctuate so that an investor’s shares, when redeemed, may be worth more or less than their original cost. Current performance may be lower or higher than the performance quoted above. Please visit our web site at www.gsamfunds.com to obtain the most recent month-end returns. Performance reflects applicable fee waivers and/or expense limitations in effect during the periods shown. In their absence, performance would be reduced. Returns do not reflect the deduction of taxes that a shareholder would pay on Portfolio distributions or the redemption of Portfolio shares.
| | | | | | | | | | |
| | EXPENSE RATIOS4 | |
| | | | | Net Expense Ratio (Current) | | | Gross Expense Ratio (Before Waivers) | |
| | Class A | | | 1.33 | % | | | 1.37 | % |
| | Class C | | | 2.08 | | | | 2.12 | |
| | Institutional | | | 0.93 | | | | 0.97 | |
| | Service | | | 1.43 | | | | 1.47 | |
| | Class IR | | | 1.08 | | | | 1.12 | |
| | Class R | | | 1.58 | | | | 1.62 | |
| | | Class R6 | | | 0.91 | | | | 0.95 | |
| | 4 | | The expense ratios of the Portfolio, both current (net of applicable fee waivers and/or expense limitations) and before waivers (gross of applicable fee waivers and/or expense limitations) are as set forth above according to the most recent publicly available Prospectus for the Portfolio and may differ from the expense ratios disclosed in the Financial Highlights in this report. The Portfolio’s waivers and/or expense limitations will remain in place through at least April 29, 2017, and prior to such date the Investment Adviser may not terminate the arrangements without the approval of the Portfolio’s Board of Trustees. If these arrangements are discontinued in the future, the expense ratios may change without shareholder approval. |
22
FUND BASICS
| | 5 | | The tactical fund weightings are set at the beginning of each calendar quarter. The weightings in the chart above reflect the allocations from March 31, 2016 to June 30, 2016. Actual underlying fund weighting in the Portfolios may differ from the figures shown above due to rounding, differences in returns of the underlying funds, or both. The above figures are not indicative of future allocations. |
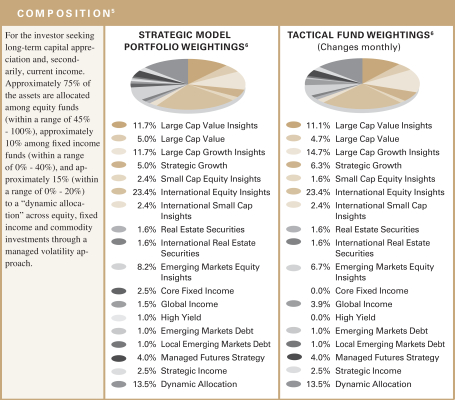
| | 6 | | Strategic allocation is the process of determining the areas of the global markets in which to invest, and in what long-term proportion, for each underlying fund. Our global approach attempts to generate strong long-term returns across geographies and asset classes, and is determined through a careful review of market opportunities and risk/return tradeoffs. It is rebalanced annually. On a monthly basis, we shift assets around the strategic allocation, over and under-weighting asset classes and countries relative to the neutral starting point, seeking to benefit from changing short-term conditions in global capital markets. This is called tactical asset allocation. |
23
FUND BASICS
|
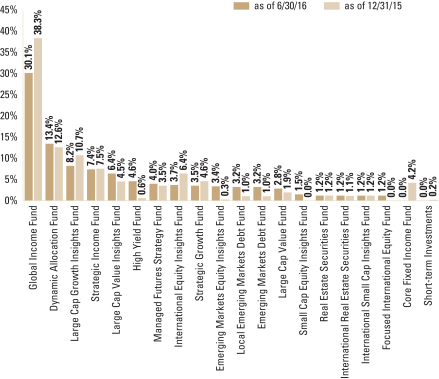
| OVERALL UNDERLYING FUND WEIGHTINGS7 |
| Percentage of Net Assets |
| | 7 | | The Portfolio is actively managed and, as such, its composition may differ over time. The percentage shown for each underlying fund reflects the value of that underlying fund as a percentage of net assets of the Portfolio. Short-term investments represent repurchase agreements. Figures in the above graph may not sum to 100% due to rounding and/or the exclusion of other assets and liabilities. |
24
FUND BASICS
Growth Strategy
as of June 30, 2016

| | | | | | | | | | | | | | | | | | |
| | PERFORMANCE REVIEW | |
| | | January 1, 2016– June 30, 2016 | | Portfolio Total Return
(based on NAV)1 | | | Growth Strategy
Composite Index2 | | | Barclays Global
Index | | | MSCI ACWI Index | |
| | Class A | | | 0.71 | % | | | 2.15 | % | | | 5.87 | % | | | 1.23 | % |
| | Class C | | | 0.32 | | | | 2.15 | | | | 5.87 | | | | 1.23 | |
| | Institutional | | | 0.87 | | | | 2.15 | | | | 5.87 | | | | 1.23 | |
| | Service | | | 0.63 | | | | 2.15 | | | | 5.87 | | | | 1.23 | |
| | Class IR | | | 0.88 | | | | 2.15 | | | | 5.87 | | | | 1.23 | |
| | Class R | | | 0.64 | | | | 2.15 | | | | 5.87 | | | | 1.23 | |
| | | Class R6 | | | 0.87 | | | | 2.15 | | | | 5.87 | | | | 1.23 | |
| | 1 | | The net asset value (“NAV”) represents the net assets of the class of the Portfolio (ex-dividend) divided by the total number of shares of the class outstanding. The Portfolio’s performance assumes the reinvestment of dividends and other distributions. The Portfolio’s performance does not reflect the deduction of any applicable sales charges. |
| | 2 | | The Growth Strategy Composite Index (“Growth Composite”) is a composite representation prepared by the investment adviser of the performance of the Portfolio’s asset classes weighted according to their respective weightings in the Portfolio’s target range. The Growth Composite is comprised of a blend of the Barclays Global Aggregate Bond Index (Gross, USD, Hedged) (“Barclays Global Index”) (20%) and the MSCI All Country World Index (Net, USD, Unhedged) (“MSCI® ACWI Index”) (80%). The Growth Strategy Composite figures do not reflect any deduction for fees, expenses or taxes. The Barclays Global Index is an unmanaged index, provides a broad-based measure of the global investment-grade fixed-rate debt markets and covers the most liquid portion of the global investment grade fixed-rate bond market, including government, credit and collateralized securities. The Index figures do not include any deduction for fees, expenses or taxes. It is not possible to invest directly in an unmanaged index. The MSCI® ACWI Index is a free float-adjusted market capitalization weighted index that is designed to measure the equity market performance of developed and emerging markets. The MSCI® ACWI Index consists of 46 country indices comprising 23 developed and 23 emerging market country indices. The developed market country indices included are: Australia, Austria, Belgium, Canada, Denmark, Finland, France, Germany, Hong Kong, Ireland, Israel, Italy, Japan, Netherlands, New Zealand, Norway, Portugal, Singapore, Spain, Sweden, Switzerland, the United Kingdom and the United States. The emerging market country indices are: Brazil, Chile, China, Colombia, Czech Republic, Egypt, Greece, Hungary, India, Indonesia, South Korea, Malaysia, Mexico, Peru, Philippines, Poland, Qatar, Russia, South Africa, Taiwan, Thailand, Turkey and the United Arab Emirates. The Index figures do not include any deduction for fees, expenses or taxes. It is not possible to invest directly in an unmanaged index. |
The returns set forth in the table above represent past performance. Past performance does not guarantee future results. The Portfolio’s investment return and principal value will fluctuate so that an investor’s shares, when redeemed, may be worth more or less than their original cost. Current performance may be lower or higher than the performance quoted above. Please visit our web site at www.gsamfunds.com to obtain the most recent month-end returns. Performance reflects applicable fee waivers and/or expense limitations in effect during the periods shown. In their absence, performance would be reduced. Returns do not reflect the deduction of taxes that a shareholder would pay on Portfolio distributions or the redemption of Portfolio shares.
25
FUND BASICS
| | | | | | | | | | | | | | | | | | | | |
| | STANDARDIZED TOTAL RETURNS3 |
| | | For the period ended 6/30/16 | | One Year | | | Five Years | | | Ten Years | | | Since Inception | | | Inception Date |
| | Class A | | | -7.65 | % | | | 3.28 | % | | | 2.24 | % | | | 3.79 | % | | 1/2/98 |
| | Class C | | | -4.02 | | | | 3.67 | | | | 2.06 | | | | 3.34 | | | 1/2/98 |
| | Institutional | | | -1.89 | | | | 4.85 | | | | 3.23 | | | | 4.52 | | | 1/2/98 |
| | Service | | | -2.42 | | | | 4.35 | | | | 2.72 | | | | 4.00 | | | 1/2/98 |
| | Class IR | | | -2.06 | | | | 4.73 | | | | N/A | | | | 1.64 | | | 11/30/07 |
| | Class R | | | -2.52 | | | | 4.20 | | | | N/A | | | | 1.14 | | | 11/30/07 |
| | | Class R6 | | | N/A | | | | N/A | | | | N/A | | | | -2.82 | | | 7/31/15 |
| | 3 | | The Standardized Total Returns are average annual or cumulative total returns (only if the performance period is one year or less) as of the most recent calendar quarter-end. They assume reinvestment of all distributions at NAV. These returns reflect a maximum initial sales charge of 5.5% for Class A Shares and the assumed contingent deferred sales charge for Class C Shares (1% if redeemed within 12 months of purchase). Because Institutional, Service, Class IR, Class R and Class R6 Shares do not involve a sales charge, such a charge is not applied to their Standardized Total Returns. |
The returns represent past performance. Past performance does not guarantee future results. The Portfolio’s investment return and principal value will fluctuate so that an investor’s shares, when redeemed, may be worth more or less than their original cost. Current performance may be lower or higher than the performance quoted above. Please visit our web site at www.GSAMFUNDS.com to obtain the most recent month-end returns. Performance reflects applicable fee waivers and/or expense limitations in effect during the periods shown. In their absence, performance would be reduced. Returns do not reflect the deduction of taxes that a shareholder would pay on Portfolio distributions or the redemption of Portfolio shares.
| | | | | | | | | | |
| | EXPENSE RATIOS4 | |
| | | | | Net Expense Ratio (Current) | | | Gross Expense Ratio (Before Waivers) | |
| | Class A | | | 1.35 | % | | | 1.40 | % |
| | Class C | | | 2.10 | | | | 2.15 | |
| | Institutional | | | 0.95 | | | | 0.99 | |
| | Service | | | 1.45 | | | | 1.50 | |
| | Class IR | | | 1.10 | | | | 1.15 | |
| | Class R | | | 1.60 | | | | 1.65 | |
| | | Class R6 | | | 0.93 | | | | 0.97 | |
| | 4 | | The expense ratios of the Portfolio, both current (net of applicable fee waivers and/or expense limitations) and before waivers (gross of applicable fee waivers and/or expense limitations) are as set forth above according to the most recent publicly available Prospectus for the Portfolio and may differ from the expense ratios disclosed in the Financial Highlights in this report. The Portfolio’s waivers and/or expense limitations will remain in place through at least April 29, 2017, and prior to such date the Investment Adviser may not terminate the arrangements without the approval of the Portfolio’s Board of Trustees. If these arrangements are discontinued in the future, the expense ratios may change without shareholder approval. |
26
FUND BASICS
| | 5 | | The tactical fund weightings are set at the beginning of each calendar quarter. The weightings in the chart above reflect the allocations from March 31, 2016 to June 30, 2016. Actual underlying fund weighting in the Portfolios may differ from the figures shown above due to rounding, differences in returns of the underlying funds, or both. The above figures are not indicative of future allocations. |
| | 6 | | Strategic allocation is the process of determining the areas of the global markets in which to invest, and in what long-term proportion, for each underlying fund. Our global approach attempts to generate strong long-term returns across geographies and asset classes, and is determined through a careful review of market opportunities and risk/return tradeoffs. It is rebalanced annually. On a monthly basis, we shift assets around the strategic allocation, over and under-weighting asset classes and countries relative to the neutral starting point, seeking to benefit from changing short-term conditions in global capital markets. This is called tactical asset allocation. |
27
FUND BASICS
|
| OVERALL UNDERLYING FUND WEIGHTINGS7 |
| Percentage of Net Assets |
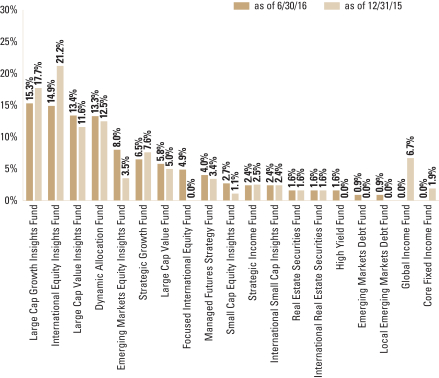
| | 7 | | The Portfolio is actively managed and, as such, its composition may differ over time. The percentage shown for each underlying fund reflects the value of that underlying fund as a percentage of net assets of the Portfolio. Figures in the above graph may not sum to 100% due to rounding and/or the exclusion of other assets and liabilities. |
28
PORTFOLIO RESULTS
Goldman Sachs Satellite Strategies Portfolio
Investment Process and Principal Strategy
The Portfolio seeks to achieve its investment objective by investing in a combination of underlying funds that currently exist or that may become available for investment in the future for which Goldman Sachs Asset Management (“GSAM”) or an affiliate, now or in the future, acts as investment adviser or principal underwriter (the “underlying funds”). Some of the Portfolios’ underlying funds invest primarily in fixed income or money market instruments, and some invest primarily in equity securities.
The Portfolio invests assets in a strategic mix of underlying funds, which the investment adviser considers to be invested in satellite asset classes. Satellite asset classes are those that historically have lower correlations to traditional market exposures such as large cap equities and investment grade fixed income. The investment adviser allows strategic targets to shift with their respective market returns but adjusts the overall asset allocation of the Portfolio based on current market conditions and the investment adviser’s economic and market forecasts.
Portfolio Management Discussion and Analysis
Below, the Goldman Sachs Quantitative Investment Strategies Team discusses the Goldman Sachs Satellite Strategies Portfolio’s (the “Portfolio”) performance and positioning for the six-month period ended June 30, 2016 (the “Reporting Period”).
| Q | | How did the Portfolio perform during the Reporting Period? |
| A | | During the Reporting Period, the Portfolio’s Class A, C, Institutional, Service, IR, R and R6 Shares generated cumulative total returns, without sales charges, of 4.99%, 4.65%, 5.34%, 5.04%, 5.27%, 4.90% and 5.21%, respectively. This compares to the 2.14% cumulative total return of the Fund’s blended benchmark, which is composed 40% of the Barclays U.S. Aggregate Bond Index, 30% of the Standard & Poor’s 500 Index (the “S&P 500® Index”) and 30% of the MSCI EAFE Index (Gross, USD, Unhedged), during the same period. |
| | The components of the blended benchmark, the Barclays U.S. Aggregate Bond Index, the S&P 500® Index and the MSCI EAFE Index, generated cumulative total returns of 5.31%, 3.84% and -4.04%, respectively, during the same period. |
| Q | | How did the various satellite asset classes perform during the Reporting Period? |
| A | | During the Reporting Period, with the exception of international small-cap stocks, all satellite asset classes generated positive absolute returns. Local emerging markets debt, as represented by the J.P. Morgan Government Bond Index — Emerging Markets, performed best. U.S. real estate securities, as represented by the Wilshire Real Estate Securities Index, performed well also, benefiting from improved investor sentiment about U.S. economic strength. U.S. dollar-denominated emerging market debt, as represented by the J.P. Morgan Government Bond Index — Emerging Markets Global Diversified Index, also realized gains, as crude oil prices rose during the Reporting Period. Brent crude oil began the Reporting Period at $36.43 per barrel and closed the Reporting Period at $49.71 per barrel — a more than 36% increase. High yield corporate bonds, as represented by the Barclays U.S. Corporate High Yield Index, also performed well, as interest rates fell during the Reporting Period and investor conviction about the strength of issuing companies improved on the back of an expanding U.S. economy and rising crude oil prices. |
| | International small-cap equities, as represented by the MSCI EAFE Small Cap Index, was the weakest performing satellite asset class during the Reporting Period and the only one to post a negative absolute return. This was driven largely by economic uncertainty related to the U.K. referendum on its membership in the European Union, popularly known as Brexit, which seemed likely to disproportionately affect international small-cap companies. |
| Q | | What key factors affected the Portfolio’s performance during the Reporting Period? |
| A | | The Portfolio outperformed its blended benchmark during the Reporting Period, largely because of its allocations to |
29
PORTFOLIO RESULTS
| | U.S. real estate securities, U.S. dollar-denominated emerging markets debt and high yield corporate bonds. |
| | Offsetting these results somewhat was the performance of the Portfolio’s underlying funds relative to their respective benchmark indices, which detracted overall from returns. In keeping with our investment approach, we dynamically adjusted Portfolio weights to ensure that overall risk and individual underlying fund contributions to risk remained within the ranges we feel are appropriate for a diversified satellite portfolio. The Portfolio’s allocation to international small-cap equities also dampened performance. |
| Q | | How did the Portfolio’s underlying funds perform relative to their respective benchmark indices during the Reporting Period? |
| A | | Overall, as mentioned earlier, the performance of the underlying funds relative to their respective benchmark indices detracted overall from the Portfolio’s performance. The Goldman Sachs International Real Estate Securities Fund and Goldman Sachs High Yield Fund underperformed their respective benchmark indices most during the Reporting Period. The Goldman Sachs Emerging Markets Equity Fund, the Goldman Sachs U.S. Equity Insights Fund, the Goldman Sachs Real Estate Securities Fund, the Goldman Sachs High Yield Floating Rate Fund and the Goldman Sachs International Small Cap Insights Fund also underperformed their respective benchmark indices, albeit to a lesser extent. On the positive side, the Goldman Sachs Commodity Strategy Fund, the Goldman Sachs Emerging Markets Debt Fund, the Goldman Sachs Local Emerging Markets Debt Fund and the Goldman Sachs Emerging Markets Equity Insights Fund slightly outperformed their respective benchmark indices during the Reporting Period. |
| Q | | How did the Portfolio use derivatives and similar instruments during the Reporting Period? |
| A | | The Portfolio does not directly invest in derivatives. However, some of the underlying funds used derivatives during the Reporting Period to apply their active investment views with greater versatility and to afford greater risk management precision. As market conditions warranted during the Reporting Period, some of these underlying funds engaged in forward foreign currency exchange contracts, financial futures contracts, options, swap contracts and structured securities to enhance portfolio return and for hedging purposes. |
| Q | | What changes did you make during the Reporting Period within both the equity and fixed income portions of the Portfolio? |
| A | | During the first quarter of 2016, through its underlying funds, we rebalanced the Portfolio to maintain our target risk objectives. More specifically, we significantly increased the Portfolio’s exposure to U.S. dollar-denominated emerging markets debt. We more modestly increased the Portfolio’s exposure to commodities, international real estate securities and international small-cap equities. Conversely, we decreased the Fund’s exposure to high yield corporate bonds, high yield loans and U.S. real estate securities. |
| | Also during the first calendar quarter, there was a reorganization that affected two of the Portfolio’s underlying funds. Effective February 5, 2016, the Goldman Sachs International Small Cap Fund was closed and its corresponding shares were reorganized into the Goldman Sachs International Small Cap Insights Fund. There was no material impact on the Portfolio’s risk exposures. |
| | In the second calendar quarter, through the underlying funds, we rebalanced the Portfolio to maintain our target risk objectives. We significantly increased its exposure to U.S. dollar-denominated emerging markets debt. In addition, we increased the Portfolio’s exposure to emerging markets equities and high yield loans. Conversely, we decreased the Portfolio’s exposure to high yield corporate bonds and international real estate securities. |
| Q | | What is the Portfolio’s tactical view and strategy for the months ahead? |
| A | | We manage the Portfolio using a dynamic, risk-responsive rebalancing process. Using our sophisticated, proprietary risk models, we evaluate the overall risk of the Portfolio each month as well as the portion of risk contributed by each individual asset class. |
| | At the end of the Reporting Period, through its underlying funds, the Portfolio had a larger allocation than it did at the beginning of the Reporting Period to U.S. dollar- denominated emerging markets debt. It also had modestly higher allocations to commodities, international small-cap equities and emerging markets equities. The Portfolio had lower exposure to high yield corporate bonds and U.S. real estate securities. |
| | We will continue to monitor risk on a monthly basis and adjust our allocation to the satellite asset classes as the underlying funds drift beyond our longer-term risk-related guidelines. |
30
FUND BASICS
Satellite Strategies Portfolio
as of June 30, 2016
| | | | | | | | | | | | | | | | | | | | | | |
| | PERFORMANCE REVIEW | |
| | | January 1, 2016– June 30, 2016 | | Fund Total
Return
(based on
NAV)1 | | | Satellite
Strategies
Composite Index2 | | | Barclays U.S.
Aggregate Bond
Index | | | MSCI® EAFE®
Index | | | S&P 500® Index | |
| | Class A | | | 4.99 | % | | | 2.14 | % | | | 5.31 | % | | | -4.04 | % | | | 3.84 | % |
| | Class C | | | 4.65 | | | | 2.14 | | | | 5.31 | | | | -4.04 | | | | 3.84 | |
| | Institutional | | | 5.34 | | | | 2.14 | | | | 5.31 | | | | -4.04 | | | | 3.84 | |
| | Service | | | 5.04 | | | | 2.14 | | | | 5.31 | | | | -4.04 | | | | 3.84 | |
| | Class IR | | | 5.27 | | | | 2.14 | | | | 5.31 | | | | -4.04 | | | | 3.84 | |
| | Class R | | | 4.90 | | | | 2.14 | | | | 5.31 | | | | -4.04 | | | | 3.84 | |
| | | Class R6 | | | 5.21 | | | | 2.14 | | | | 5.31 | | | | -4.04 | | | | 3.84 | |
| | 1 | | The net asset value (“NAV”) represents the net assets of the class of the Portfolio (ex-dividend) divided by the total number of shares of the class outstanding. The Portfolio’s performance reflects the reinvestment of dividends and other distributions. The Portfolio’s performance does not reflect the deduction of any applicable sales charges. |
| | 2 | | The Satellite Strategies Composite Index (“Satellite Composite”) is a composite representation prepared by the investment adviser of the performance of the Portfolio’s asset classes weighted according to their respective weightings in the Portfolio’s target range. The Satellite Composite is comprised of the S&P 500® Index (30%), the MSCI® EAFE® Index (Gross, USD, Unhedged) (30%) and the Barclays U.S. Aggregate Bond Index (40%). The Satellite Composite figures do not reflect any deduction for fees, expenses or taxes. The Barclays U.S. Aggregate Bond Index represents an unmanaged diversified portfolio of fixed income securities, including U.S. Treasuries, investment- grade corporate bonds, and mortgage-backed and asset-backed securities. The S&P 500® Index is the Standard & Poor’s 500 Composite Index of 500 stocks, an unmanaged index of common stock prices. The unmanaged MSCI® EAFE® Index is a market capitalization weighted composite of securities in 21 developed markets. The Index figures do not include any deduction for fees, expenses or taxes. It is not possible to invest directly in an unmanaged index. The S&P 500® Index is an unmanaged composite index of 500 common stock prices. The Index figures do not include any deduction for fees, expenses or taxes. It is not possible to invest directly in an index. |
| | | | | | | | | | | | | | | | |
| | STANDARDIZED TOTAL RETURNS3 |
| | | For the period ended 6/30/16 | | One Year | | | Five Years | | | Since Inception | | | Inception Date |
| | Class A | | | -5.58 | % | | | 1.20 | % | | | 0.64 | % | | 3/30/07 |
| | Class C | | | -1.74 | | | | 1.58 | | | | 0.50 | | | 3/30/07 |
| | Institutional | | | 0.41 | | | | 2.76 | | | | 1.64 | | | 3/30/07 |
| | Service | | | -0.19 | | | | 2.24 | | | | 1.73 | | | 8/29/08 |
| | Class IR | | | 0.26 | | | | 2.61 | | | | 0.92 | | | 11/30/07 |
| | Class R | | | -0.36 | | | | 2.10 | | | | 0.41 | | | 11/30/07 |
| | | Class R6 | | | N/A | | | | N/A | | | | 0.55 | | | 7/31/15 |
| | 3 | | The Standardized Total Returns are average annual or cumulative total returns (only if the performance period is one year or less) as of the most recent calendar quarter-end. They assume reinvestment of all distributions at NAV. These returns reflect a maximum initial sales charge of 5.5% for Class A Shares and the assumed contingent deferred sales charge for Class C Shares (1% if redeemed within 12 months of purchase). Because Institutional, Service, Class IR, Class R and Class R6 Shares do not involve a sales charge, such a charge is not applied to their Standardized Total Returns. |
The returns set forth in the tables above represent past performance. Past performance does not guarantee future results. The Portfolio’s investment return and principal value will fluctuate so that an investor’s shares, when redeemed, may be worth more or less than their original cost. Current performance may be lower or higher than the performance quoted above. Please visit our web site at www.GSAMFUNDS.com to obtain the most recent month-end returns. Performance reflects applicable fee waivers and/or expense limitations in effect during the periods shown. In their absence, performance would be reduced. Returns do not reflect the deduction of taxes that a shareholder would pay on Portfolio distributions or the redemption of Portfolio shares.
31
FUND BASICS
| | | | | | | | | | |
| | EXPENSE RATIOS4 | |
| | | | | Net Expense Ratio (Current) | | | Gross Expense Ratio (Before Waivers) | |
| | Class A | | | 1.43 | % | | | 1.46 | % |
| | Class C | | | 2.18 | | | | 2.21 | |
| | Institutional | | | 1.03 | | | | 1.06 | |
| | Service | | | 1.53 | | | | 1.56 | |
| | Class IR | | | 1.18 | | | | 1.21 | |
| | Class R | | | 1.68 | | | | 1.71 | |
| | | Class R6 | | | 1.01 | | | | 1.04 | |
| | 4 | | The expense ratios of the Portfolio, both current (net of applicable fee waivers and/or expense limitations) and before waivers (gross of applicable fee waivers and/or expense limitations) are as set forth above according to the most recent publicly available Prospectus for the Portfolio and may differ from the expense ratios disclosed in the Financial Highlights in this report. The Portfolio’s waivers and/or expense limitations will remain in place through at least April 29, 2017, and prior to such date the Investment Adviser may not terminate the arrangements without the approval of the Portfolio’s Board of Trustees. If these arrangements are discontinued in the future, the expense ratios may change without shareholder approval. |
|
| TARGET RISK-CONTRIBUTION INVESTMENT PORTFOLIO5 AS OF 6/30/15 |
| Percentage of Investment Portfolio |
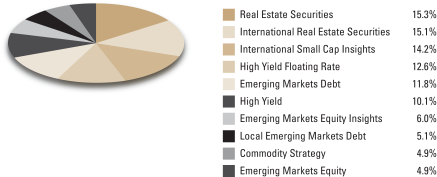
| | 5 | | The tactical fund weightings are set at the beginning of each calendar quarter. The weightings in the chart above reflect the allocations from March 31, 2016 to June 30, 2016. Actual underlying funds und weighting in the Portfolios may differ from the figures shown above due to rounding, differences in returns of the underlying funds, or both. The above figures are not indicative of future allocations. |
32
FUND BASICS
|
| OVERALL UNDERLYING FUND WEIGHTINGS6 |
| Percentage of Net Assets |
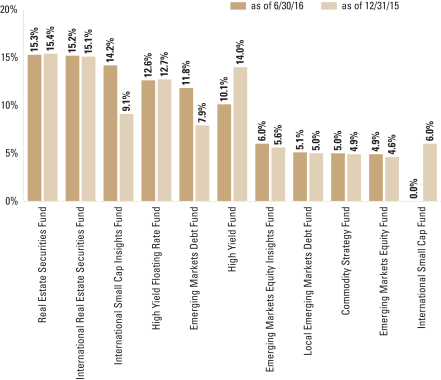
| | 6 | | The Portfolio is actively managed and, as such, its composition may differ over time. The percentage shown for each underlying fund reflects the value of that underlying fund as a percentage of net assets of the Portfolio. Figures in the above graph may not sum to 100% due to rounding and/or the exclusion of other assets and liabilities. |
33
GOLDMAN SACHS BALANCED STRATEGY PORTFOLIO
Schedule of Investments
June 30, 2016 (Unaudited)
| | | | | | | | |
Shares | | | Description | | Value | |
| | Underlying Funds (Institutional Shares)(a) – 100.2% | |
| | Equity – 34.3% | |
| | 1,552,617 | | | Goldman Sachs Large Cap Growth Insights Fund | | $ | 36,579,658 | |
| | 1,675,056 | | | Goldman Sachs Large Cap Value Insights Fund | | | 28,258,188 | |
| | 1,580,198 | | | Goldman Sachs International Equity Insights Fund | | | 16,355,052 | |
| | 1,294,550 | | | Goldman Sachs Strategic Growth Fund | | | 15,689,945 | |
| | 1,904,922 | | | Goldman Sachs Emerging Markets Equity Insights Fund | | | 15,010,787 | |
| | 781,762 | | | Goldman Sachs Large Cap Value Fund | | | 12,156,401 | |
| | 338,063 | | | Goldman Sachs Small Cap Equity Insights Fund | | | 6,676,744 | |
| | 252,794 | | | Goldman Sachs Real Estate Securities Fund | | | 5,483,100 | |
| | 910,520 | | | Goldman Sachs International Real Estate Securities Fund | | | 5,435,803 | |
| | 529,499 | | | Goldman Sachs International Small Cap Insights Fund | | | 5,353,238 | |
| | 322,027 | | | Goldman Sachs Focused International Equity Fund | | | 5,326,328 | |
| | | | | | | | |
| | | | | | | 152,325,244 | |
| | |
| | Fixed Income – 48.5% | |
| | 10,758,414 | | | Goldman Sachs Global Income Fund | | | 133,619,507 | |
| | 3,503,565 | | | Goldman Sachs Strategic Income Fund | | | 32,828,400 | |
| | 3,292,148 | | | Goldman Sachs High Yield Fund | | | 20,477,163 | |
| | 2,204,141 | | | Goldman Sachs Local Emerging Markets Debt Fund | | | 14,304,876 | |
| | 1,108,674 | | | Goldman Sachs Emerging Markets Debt Fund | | | 14,124,504 | |
| | | | | | | | |
| | | | | | | 215,354,450 | |
| | |
| | Dynamic – 17.4% | |
| | 6,194,708 | | | Goldman Sachs Dynamic Allocation Fund | | | 59,716,985 | |
| | 1,700,495 | | | Goldman Sachs Managed Futures Strategy Fund | | | 17,753,163 | |
| | | | | | | | |
| | | | | | | 77,470,148 | |
| | |
| | TOTAL UNDERLYING FUNDS – 100.2% | | | | |
| | (Cost $468,256,447) | | $ | 445,149,842 | |
| | |
| LIABILITIES IN EXCESS OF
OTHER ASSETS – (0.2)% | | | (815,343 | ) |
| | |
| | NET ASSETS – 100.0% | | $ | 444,334,499 | |
| | |
| | |
| The percentage shown for each investment category reflects the value of investments in that category as a percentage of net assets. |
(a) | | Represents Affiliated Funds. |
| | |
| 34 | | The accompanying notes are an integral part of these financial statements. |
GOLDMAN SACHS EQUITY GROWTH STRATEGY PORTFOLIO
Schedule of Investments
June 30, 2016 (Unaudited)
| | | | | | | | |
Shares | | | Description | | Value | |
| | Underlying Funds (Institutional Shares)(a) – 100.1% | |
| | Equity – 100.1% | |
| | 6,870,953 | | | Goldman Sachs International Equity Insights Fund | | $ | 71,114,362 | |
| | 3,565,229 | | | Goldman Sachs Large Cap Value Insights Fund | | | 60,145,408 | |
| | 2,506,277 | | | Goldman Sachs Large Cap Growth Insights Fund | | | 59,047,889 | |
| | 4,002,610 | | | Goldman Sachs Emerging Markets Equity Insights Fund | | | 31,540,563 | |
| | 1,664,023 | | | Goldman Sachs Large Cap Value Fund | | | 25,875,555 | |
| | 2,089,723 | | | Goldman Sachs Strategic Growth Fund | | | 25,327,442 | |
| | 1,408,042 | | | Goldman Sachs Focused International Equity Fund | | | 23,289,010 | |
| | 545,590 | | | Goldman Sachs Small Cap Equity Insights Fund | | | 10,775,400 | |
| | 967,589 | | | Goldman Sachs International Small Cap Insights Fund | | | 9,782,321 | |
| | 307,972 | | | Goldman Sachs Real Estate Securities Fund | | | 6,679,908 | |
| | 1,109,369 | | | Goldman Sachs International Real Estate Securities Fund | | | 6,622,935 | |
| | |
| | TOTAL UNDERLYING FUNDS – 100.1% | | | | |
| | (Cost $313,129,506) | | $ | 330,200,793 | |
| | |
| LIABILITIES IN EXCESS OF
OTHER ASSETS – (0.1)% | | | (365,999 | ) |
| | |
| | NET ASSETS – 100.0% | | $ | 329,834,794 | |
| | |
| | |
| The percentage shown for each investment category reflects the value of investments in that category as a percentage of net assets. |
(a) | | Represents Affiliated Funds. |
| | |
| The accompanying notes are an integral part of these financial statements. | | 35 |
GOLDMAN SACHS GROWTH AND INCOME STRATEGY PORTFOLIO
Schedule of Investments
June 30, 2016 (Unaudited)
| | | | | | | | |
Shares | | | Description | | Value | |
| | Underlying Funds (Institutional Shares)(a) – 100.1% | |
| | Equity – 55.6% | |
| | 4,513,724 | | | Goldman Sachs Large Cap Growth Insights Fund | | $ | 106,343,339 | |
| | 5,314,852 | | | Goldman Sachs Large Cap Value Insights Fund | | | 89,661,550 | |
| | 8,154,416 | | | Goldman Sachs International Equity Insights Fund | | | 84,398,209 | |
| | 6,284,357 | | | Goldman Sachs Emerging Markets Equity Insights Fund | | | 49,520,737 | |
| | 3,765,147 | | | Goldman Sachs Strategic Growth Fund | | | 45,633,576 | |
| | 2,484,162 | | | Goldman Sachs Large Cap Value Fund | | | 38,628,721 | |
| | 1,666,841 | | | Goldman Sachs Focused International Equity Fund | | | 27,569,549 | |
| | 951,334 | | | Goldman Sachs Small Cap Equity Insights Fund | | | 18,788,840 | |
| | 1,593,644 | | | Goldman Sachs International Small Cap Insights Fund | | | 16,111,738 | |
| | 507,109 | | | Goldman Sachs Real Estate Securities Fund | | | 10,999,186 | |
| | 1,826,865 | | | Goldman Sachs International Real Estate Securities Fund | | | 10,906,385 | |
| | | | | | | | |
| | | | | | | 498,561,830 | |
| | |
| | Fixed Income – 27.2% | |
| | 10,331,141 | | | Goldman Sachs Global Income Fund | | | 128,312,766 | |
| | 4,685,511 | | | Goldman Sachs Strategic Income Fund | | | 43,903,242 | |
| | 5,176,529 | | | Goldman Sachs High Yield Fund | | | 32,198,010 | |
| | 3,014,934 | | | Goldman Sachs Local Emerging Markets Debt Fund | | | 19,566,919 | |
| | 1,521,859 | | | Goldman Sachs Emerging Markets Debt Fund | | | 19,388,482 | |
| | | | | | | | |
| | | | | | | 243,369,419 | |
| | |
| | Dynamic – 17.3% | |
| | 12,426,985 | | | Goldman Sachs Dynamic Allocation Fund | | | 119,796,138 | |
| | 3,411,050 | | | Goldman Sachs Managed Futures Strategy Fund | | | 35,611,359 | |
| | | | | | | | |
| | | | | | | 155,407,497 | |
| | |
| | TOTAL UNDERLYING FUNDS – 100.1% | | | | |
| | (Cost $918,402,423) | | $ | 897,338,746 | |
| | |
| | | | | | | | | | | | | | |
Principal
Amount | | | Interest
Rate | | | Maturity
Date | | | Value | |
| | Short-term Investment(b) – 0.2% | |
| | Repurchase Agreements – 0.2% | | | | | |
| Joint Repurchase Agreement Account II | | | | | |
| $ | 1,300,000 | | | | 0.429 | % | | | 07/01/16 | | | $ | 1,300,000 | |
| | (Cost $1,300,000) | | | | | |
| | |
| | TOTAL INVESTMENTS – 100.3% | | | | | |
| | (Cost $919,702,423) | | | $ | 898,638,746 | |
| | |
| LIABILITIES IN EXCESS OF
OTHER ASSETS – (0.3)% |
| | | (2,508,296 | ) |
| | |
| | NET ASSETS – 100.0% | | | $ | 896,130,450 | |
| | |
| | |
| The percentage shown for each investment category reflects the value of investments in that category as a percentage of net assets. |
(a) | | Represents Affiliated Funds. |
(b) | | Joint repurchase agreement was entered into on June 30, 2016. Additional information appears on page 39. |
| | |
| 36 | | The accompanying notes are an integral part of these financial statements. |
GOLDMAN SACHS GROWTH STRATEGY PORTFOLIO
Schedule of Investments
June 30, 2016 (Unaudited)
| | | | | | | | |
Shares | | | Description | | Value | |
| | | | | | | | |
| | Underlying Funds (Institutional Shares)(a) – 100.1% | |
| | Equity – 77.1% | |
| | 5,005,364 | | | Goldman Sachs Large Cap Growth Insights Fund | | $ | 117,926,367 | |
| | 11,104,341 | | | Goldman Sachs International Equity Insights Fund | | | 114,929,926 | |
| | 6,157,920 | | | Goldman Sachs Large Cap Value Insights Fund | | | 103,884,111 | |
| | 7,884,986 | | | Goldman Sachs Emerging Markets Equity Insights Fund | | | 62,133,688 | |
| | 4,174,178 | | | Goldman Sachs Strategic Growth Fund | | | 50,591,036 | |
| | 2,876,888 | | | Goldman Sachs Large Cap Value Fund | | | 44,735,607 | |
| | 2,272,802 | | | Goldman Sachs Focused International Equity Fund | | | 37,592,153 | |
| | 1,050,416 | | | Goldman Sachs Small Cap Equity Insights Fund | | | 20,745,714 | |
| | 1,822,749 | | | Goldman Sachs International Small Cap Insights Fund | | | 18,427,988 | |
| | 580,117 | | | Goldman Sachs Real Estate Securities Fund | | | 12,582,746 | |
| | 2,089,709 | | | Goldman Sachs International Real Estate Securities Fund | | | 12,475,563 | |
| | | | | | | | |
| | | | | | | 596,024,899 | |
| | |
| | Fixed Income – 5.7% | |
| | 2,009,500 | | | Goldman Sachs Strategic Income Fund | | | 18,829,019 | |
| | 1,943,931 | | | Goldman Sachs High Yield Fund | | | 12,091,248 | |
| | 520,961 | | | Goldman Sachs Emerging Markets Debt Fund | | | 6,637,044 | |
| | 1,022,657 | | | Goldman Sachs Local Emerging Markets Debt Fund | | | 6,637,044 | |
| | | | | | | | |
| | | | | | | 44,194,355 | |
| | |
| | Dynamic – 17.3% | |
| | 10,659,896 | | | Goldman Sachs Dynamic Allocation Fund | | | 102,761,400 | |
| | 2,926,089 | | | Goldman Sachs Managed Futures Strategy Fund | | | 30,548,364 | |
| | | | | | | | |
| | | | | | | 133,309,764 | |
| | |
| | TOTAL UNDERLYING FUNDS – 100.1% | |
| | (Cost $773,035,407) | | $ | 773,529,018 | |
| | |
| | | | | | | | | | | | | | |
Principal
Amount | | | Interest
Rate | | | Maturity
Date | | | Value | |
| | | | | | | | | | | | | | |
| | Short-term Investment(b) – 0.0% | |
| | Repurchase Agreements – 0.0% | |
| Joint Repurchase Agreement Account II | |
| $ | 100,000 | | | | 0.429% | | | | 07/01/16 | | | $ | 100,000 | |
| | (Cost $100,000) | | | | | | | | | |
| | |
| | TOTAL INVESTMENTS – 100.1% | |
| | (Cost $773,135,407) | | | $ | 773,629,018 | |
| | |
| LIABILITIES IN EXCESS OF
OTHER ASSETS – (0.1)% |
| | | (985,610 | ) |
| | |
| | NET ASSETS – 100.0% | | | $ | 772,643,408 | |
| | |
| | |
| The percentage shown for each investment category reflects the value of investments in that category as a percentage of net assets. |
(a) | | Represents Affiliated Funds. |
(b) | | Joint repurchase agreement was entered into on June 30, 2016. Additional information appears on page 39. |
| | |
| The accompanying notes are an integral part of these financial statements. | | 37 |
GOLDMAN SACHS SATELLITE STRATEGIES PORTFOLIO
Schedule of Investments
June 30, 2016 (Unaudited)
| | | | | | | | |
Shares | | | Description | | Value | |
| | | | | | | | |
| | Underlying Funds (Institutional Shares)(a) – 100.2% | |
| | Equity – 55.6% | |
| | 5,725,150 | | | Goldman Sachs Real Estate Securities Fund | | $ | 124,178,510 | |
| | 20,637,938 | | | Goldman Sachs International Real Estate Securities Fund | | | 123,208,487 | |
| | 11,460,725 | | | Goldman Sachs International Small Cap Insights Fund | | | 115,867,931 | |
| | 6,202,460 | | | Goldman Sachs Emerging Markets Equity Insights Fund | | | 48,875,381 | |
| | 2,480,640 | | | Goldman Sachs Emerging Markets Equity Fund | | | 39,665,442 | |
| | | | | | | | |
| | | | | | | 451,795,751 | |
| | |
| | Fixed Income – 44.6% | |
| | 10,668,421 | | | Goldman Sachs High Yield Floating Rate Fund | | | 102,310,154 | |
| | 7,557,634 | | | Goldman Sachs Emerging Markets Debt Fund | | | 96,284,254 | |
| | 13,248,843 | | | Goldman Sachs High Yield Fund | | | 82,407,803 | |
| | 6,356,864 | | | Goldman Sachs Local Emerging Markets Debt Fund | | | 41,256,046 | |
| | 3,455,049 | | | Goldman Sachs Commodity Strategy Fund | | | 40,251,326 | |
| | | | | | | | |
| | | | | | | 362,509,583 | |
| | |
| | TOTAL UNDERLYING FUNDS – 100.2% | |
| | (Cost $744,806,596) | | $ | 814,305,334 | |
| | |
| LIABILITIES IN EXCESS OF
OTHER ASSETS – (0.2)% | | | (1,878,007 | ) |
| | |
| | NET ASSETS – 100.0% | | $ | 812,427,327 | |
| | |
| | |
| The percentage shown for each investment category reflects the value of investments in that category as a percentage of net assets. |
(a) | | Represents Affiliated Funds. |
| | |
| 38 | | The accompanying notes are an integral part of these financial statements. |
GOLDMAN SACHS FUND OF FUNDS PORTFOLIOS
Schedule of Investments
June 30, 2016 (Unaudited)
|
| ADDITIONAL INVESTMENT INFORMATION |
JOINT REPURCHASE AGREEMENT ACCOUNT II — At June 30, 2016, certain funds had undivided interests in the Joint Repurchase Agreement Account II, with a maturity date of July 1, 2016, as follows:
| | | | | | | | | | | | |
| Fund | | Principal Amount | | | Maturity Value | | | Collateral Allocation Value | |
Growth Strategy Portfolio | | $ | 100,000 | | | $ | 100,001 | | | $ | 102,000 | |
Growth and Income Strategy Portfolio | | | 1,300,000 | | | | 1,300,015 | | | | 1,326,000 | |
REPURCHASE AGREEMENTS — At June 30, 2016, the Principal Amount of certain funds’ interest in the Joint Repurchase Agreement Account II was as follows:
| | | | | | | | | | | | |
| Counterparty | | Interest Rate | | | Growth Strategy Portfolio | | | Growth Strategy Portfolio | |
BNP Paribas Securities Co. | | | 0.400 | % | | $ | 14,779 | | | $ | 192,124 | |
Citigroup Global Markets, Inc. | | | 0.440 | | | | 19,995 | | | | 259,932 | |
Merrill Lynch & Co., Inc. | | | 0.440 | | | | 37,407 | | | | 486,299 | |
Merrill Lynch & Co., Inc. | | | 0.420 | | | | 27,819 | | | | 361,645 | |
| TOTAL | | | | | | $ | 100,000 | | | $ | 1,300,000 | |
At June 30, 2016, the Joint Repurchase Agreement Account II was fully collateralized by:
| | | | | | | | |
| Issuer | | Interest Rates | | | Maturity Dates | |
Federal Farm Credit Banks | | | 0.499 | % | | | 09/14/16 | |
Federal Home Loan Mortgage Corp. | | | 2.000 to 7.500 | | | | 09/01/17 to 07/01/46 | |
Federal National Mortgage Association | | | 0.625 to 6.500 | | | | 08/26/16 to 07/01/46 | |
Government National Mortgage Association | | | 3.500 to 6.000 | | | | 01/20/37 to 05/20/46 | |
Tennessee Valley Authority | | | 4.250 | | | | 09/15/65 | |
United States Treasury Floating Rate Note | | | 0.488 | | | | 10/31/17 | |
United States Treasury Note | | | 0.375 to 4.250 | | | | 10/31/16 to 08/15/20 | |
United States Treasury Bond | | | 6.250 | | | | 05/15/30 | |
United States Treasury Stripped Securities | | | 0.000 | | | | 08/15/29 to 08/15/42 | |
| | |
| The accompanying notes are an integral part of these financial statements. | | 39 |
GOLDMAN SACHS FUND OF FUNDS PORTFOLIOS
Statements of Assets and Liabilities
June 30, 2016 (Unaudited)
| | | | | | |
| | | | |
Balanced Strategy
Portfolio | |
| | Assets: | |
| | Investments in Affiliated Underlying Funds, at value (cost $468,256,447, $313,129,506, $918,402,423, $773,035,407 and $744,806,596) | | $ | 445,149,842 | |
| | Repurchase agreement, at value which equals cost | | | — | |
| | Cash | | | — | |
| | Receivables: | | | | |
| | Investments sold | | | 24,457,091 | |
| | Dividends | | | 457,981 | |
| | Portfolio shares sold | | | 321,928 | |
| | Reimbursement from investment adviser | | | 25,862 | |
| | Other assets | | | 1,253 | |
| | Total assets | | | 470,413,957 | |
| | | | | | |
| | Liabilities: | |
| | Due to custodian | | | 522,154 | |
| | Payables: | | | | |
| | Investments purchased | | | 24,395,974 | |
| | Portfolio shares redeemed | | | 918,340 | |
| | Distribution and Service fees and Transfer Agency fees | | | 112,074 | |
| | Management fees | | | 54,796 | |
| | Accrued expenses | | | 76,120 | |
| | Total liabilities | | | 26,079,458 | |
| | | | | | |
| | Net Assets: | |
| | Paid-in capital | | | 477,458,670 | |
| | Undistributed (distributions in excess of) net investment income | | | 237,542 | |
| | Accumulated net realized loss | | | (10,255,108 | ) |
| | Net unrealized gain (loss) | | | (23,106,605 | ) |
| | | NET ASSETS | | $ | 444,334,499 | |
| | | Net Assets: | | | | |
| | | Class A | | $ | 141,085,124 | |
| | | Class C | | | 50,363,543 | |
| | | Institutional | | | 241,951,980 | |
| | | Service | | | 822,727 | |
| | | Class IR | | | 4,882,311 | |
| | | Class R | | | 5,218,763 | |
| | | Class R6 | | | 10,051 | |
| | | Total Net Assets | | $ | 444,334,499 | |
| | | Shares Outstanding $0.001 par value (unlimited number of shares authorized): | | | | |
| | | Class A | | | 13,270,175 | |
| | | Class C | | | 4,740,380 | |
| | | Institutional | | | 22,754,981 | |
| | | Service | | | 76,567 | |
| | | Class IR | | | 461,034 | |
| | | Class R | | | 492,228 | |
| | | Class R6 | | | 945 | |
| | | Net asset value, offering and redemption price per share:(a) | | | | |
| | | Class A | | | $10.63 | |
| | | Class C | | | 10.62 | |
| | | Institutional | | | 10.63 | |
| | | Service | | | 10.75 | |
| | | Class IR | | | 10.59 | |
| | | Class R | | | 10.60 | |
| | | Class R6 | | | 10.64 | |
| | (a) | | Maximum public offering price per share for Class A Shares of the Balanced Strategy, Equity Growth Strategy, Growth and Income Strategy, Growth Strategy and Satellite Strategies Portfolios is $11.25, $15.33, $12.48, $13.53 and $8.18, respectively. At redemption, Class C Shares may be subject to a contingent deferred sales charge, assessed on the amount equal to the lesser of the current net asset value (“NAV”) or the original purchase price of the shares. |
| | |
| 40 | | The accompanying notes are an integral part of these financial statements. |
GOLDMAN SACHS FUND OF FUNDS PORTFOLIOS
| | | | | | | | | | | | | | | | | | | | | | |
| | | Equity Growth
Strategy Portfolio | | | | | Growth and
Income Strategy
Portfolio | | | | | Growth Strategy
Portfolio | | | | | Satellite Strategies
Portfolio | |
| | | | | | | | | | | | | | | | | | | | | | |
| | $ | 330,200,793 | | | | | $ | 897,338,746 | | | | | $ | 773,529,018 | | | | | $ | 814,305,334 | |
| | | — | | | | | | 1,300,000 | | | | | | 100,000 | | | | | | — | |
| | | 57,376 | | | | | | 28,248 | | | | | | 42,804 | | | | | | — | |
| | | | | | | | | | | | | | | | | | | | | | |
| | | 5,077,853 | | | | | | 47,357,263 | | | | | | 35,379,995 | | | | | | 11,577,075 | |
| | | — | | | | | | 568,915 | | | | | | 189,305 | | | | | | 1,532,603 | |
| | | 264,800 | | | | | | 255,087 | | | | | | 117,110 | | | | | | 302,756 | |
| | | 24,928 | | | | | | 30,851 | | | | | | 29,698 | | | | | | 28,071 | |
| | | 961 | | | | | | 2,482 | | | | | | 2,108 | | | | | | 2,990 | |
| | | 335,626,711 | | | | | | 946,881,592 | | | | | | 809,390,038 | | | | | | 827,748,829 | |
| | | | | | | | | | | | | | | | | | | | | | |
| | | | | | | | | | | | | | | | | | | | | | |
| | | — | | | | | | — | | | | | | — | | | | | | 2,218,115 | |
| | | | | | | | | | | | | | | | | | | | | | |
| | | 5,065,856 | | | | | | 48,867,600 | | | | | | 35,233,690 | | | | | | 11,557,466 | |
| | | 457,829 | | | | | | 1,395,903 | | | | | | 1,034,459 | | | | | | 1,238,465 | |
| | | 128,613 | | | | | | 265,206 | | | | | | 276,463 | | | | | | 130,141 | |
| | | 40,833 | | | | | | 110,580 | | | | | | 95,819 | | | | | | 83,346 | |
| | | 98,786 | | | | | | 111,853 | | | | | | 106,199 | | | | | | 93,969 | |
| | | 5,791,917 | | | | | | 50,751,142 | | | | | | 36,746,630 | | | | | | 15,321,502 | |
| | | | | | | | | | | | | | | | | | | | | | |
| | | | | | | | | | | | | | | | | | | | | | |
| | | 538,121,252 | | | | | | 1,489,567,764 | | | | | | 1,416,806,141 | | | | | | 857,584,392 | |
| | | (281,088 | ) | | | | | 54,884 | | | | | | 146,705 | | | | | | 1,704,548 | |
| | | (225,076,657 | ) | | | | | (572,428,521 | ) | | | | | (644,803,049 | ) | | | | | (116,360,351 | ) |
| | | 17,071,287 | | | | | | (21,063,677 | ) | | | | | 493,611 | | | | | | 69,498,738 | |
| | | $ | 329,834,794 | | | | | $ | 896,130,450 | | | | | $ | 772,643,408 | | | | | $ | 812,427,327 | |
| | | | | | | | | | | | | | | | | | | | | | | |
| | | | $126,826,664 | | | | | $ | 323,631,741 | | | | | $ | 316,057,908 | | | | | $ | 105,810,275 | |
| | | | 78,005,222 | | | | | | 133,279,627 | | | | | | 152,260,243 | | | | | | 61,841,514 | |
| | | | 117,499,018 | | | | | | 428,828,545 | | | | | | 295,585,425 | | | | | | 576,762,661 | |
| | | | 467,447 | | | | | | 3,241,769 | | | | | | 2,161,769 | | | | | | 476,346 | |
| | | | 5,129,465 | | | | | | 4,333,090 | | | | | | 3,882,770 | | | | | | 64,539,173 | |
| | | | 1,897,324 | | | | | | 2,805,801 | | | | | | 2,685,576 | | | | | | 2,963,765 | |
| | | | 9,654 | | | | | | 9,877 | | | | | | 9,717 | | | | | | 33,593 | |
| | | | $329,834,794 | | | | | $ | 896,130,450 | | | | | $ | 772,643,408 | | | | | $ | 812,427,327 | |
| | | | | | | | | | | | | | | | | | | | | | | |
| | | | 8,752,710 | | | | | | 27,447,690 | | | | | | 24,711,535 | | | | | | 13,685,998 | |
| | | | 5,646,687 | | | | | | 11,543,157 | | | | | | 11,969,469 | | | | | | 8,043,164 | |
| | | | 8,023,012 | | | | | | 36,264,017 | | | | | | 23,089,049 | | | | | | 74,731,329 | |
| | | | 32,400 | | | | | | 275,603 | | | | | | 169,533 | | | | | | 61,712 | |
| | | | 358,352 | | | | | | 369,096 | | | | | | 307,502 | | | | | | 8,362,507 | |
| | | | 131,755 | | | | | | 239,525 | | | | | | 215,098 | | | | | | 384,873 | |
| | | | 659 | | | | | | 835 | | | | | | 759 | | | | | | 4,349 | |
| | | | | | | | | | | | | | | | | | | | | | | |
| | | | $14.49 | | | | | | $11.79 | | | | | | $12.79 | | | | | | $7.73 | |
| | | | 13.81 | | | | | | 11.55 | | | | | | 12.72 | | | | | | 7.69 | |
| | | | 14.65 | | | | | | 11.83 | | | | | | 12.80 | | | | | | 7.72 | |
| | | | 14.43 | | | | | | 11.76 | | | | | | 12.75 | | | | | | 7.72 | |
| | | | 14.31 | | | | | | 11.74 | | | | | | 12.63 | | | | | | 7.72 | |
| | | | 14.40 | | | | | | 11.71 | | | | | | 12.49 | | | | | | 7.70 | |
| | | | 14.64 | | | | | | 11.82 | | | | | | 12.80 | | | | | | 7.72 | |
| | |
| The accompanying notes are an integral part of these financial statements. | | 41 |
GOLDMAN SACHS FUND OF FUNDS PORTFOLIOS
Statements of Operations
For the Six Months Ended June 30, 2016 (Unaudited)
| | | | | | |
| | | | | Balanced Strategy
Portfolio | |
| | Investment income: | | | | |
| | Dividends from Affiliated Underlying Funds | | $ | 2,764,716 | |
| | Interest | | | 397 | |
| | Total investment income | | | 2,765,113 | |
| | | | | | |
| | Expenses: | | | | |
| | Distribution and Service fees(a) | | | 445,787 | |
| | Management fees | | | 333,220 | |
| | Transfer Agency fees(a) | | | 240,769 | |
| | Registration fees | | | 51,508 | |
| | Printing and mailing costs | | | 38,528 | |
| | Professional fees | | | 33,810 | |
| | Custody, accounting and administrative services | | | 23,726 | |
| | Trustee fees | | | 12,380 | |
| | Service Share fees — Service Plan | | | 1,048 | |
| | Service Share fees — Shareholder Administration Plan | | | 1,048 | |
| | Other | | | 5,806 | |
| | Total expenses | | | 1,187,630 | |
| | Less — expense reductions | | | (156,872 | ) |
| | Net expenses | | | 1,030,758 | |
| | NET INVESTMENT INCOME (LOSS) | | | 1,734,355 | |
| | | | | | |
| | Realized and unrealized gain (loss): | | | | |
| | Net realized gain (loss) from Affiliated Underlying Funds | | | 2,774,904 | |
| | Net change in unrealized gain (loss) on Affiliated Underlying Funds | | | 6,834,542 | |
| | Net realized and unrealized gain | | | 9,609,446 | |
| | NET INCREASE IN NET ASSETS RESULTING FROM OPERATIONS | | $ | 11,343,801 | |
| | (a) | | Class specific Distribution and Service and Transfer Agency fees were as follows: |
| | | | | | | | | | | | | | | | | | | | | | | | | | | | | | | | | | | | | | | | |
| | | Distribution and Service Fees | | | Transfer Agency Fees | |
Fund | | Class A | | | Class C | | | Class R | | | Class A | | | Class C | | | Institutional | | | Service | | | Class IR | | | Class R | | | Class R6 | |
Balanced Strategy | | $ | 177,106 | | | $ | 256,204 | | | $ | 12,477 | | | $ | 134,600 | | | $ | 48,679 | | | $ | 48,179 | | | $ | 168 | | | $ | 4,400 | | | $ | 4,741 | | | $ | 2 | |
Equity Growth Strategy | | | 158,392 | | | | 390,155 | | | | 4,242 | | | | 120,378 | | | | 74,130 | | | | 22,739 | | | | 91 | | | | 4,713 | | | | 1,612 | | | | 1 | |
Growth and Income Strategy | | | 408,287 | | | | 675,137 | | | | 6,552 | | | | 310,299 | | | | 128,276 | | | | 84,253 | | | | 634 | | | | 3,367 | | | | 2,490 | | | | 2 | |
Growth Strategy | | | 397,735 | | | | 764,621 | | | | 6,358 | | | | 302,279 | | | | 145,278 | | | | 58,951 | | | | 424 | | | | 3,881 | | | | 2,416 | | | | 1 | |
Satellite Strategies | | | 137,260 | | | | 315,023 | | | | 7,521 | | | | 104,318 | | | | 59,854 | | | | 119,698 | | | | 133 | | | | 60,894 | | | | 2,858 | | | | 2 | |
| | |
| 42 | | The accompanying notes are an integral part of these financial statements. |
GOLDMAN SACHS FUND OF FUNDS PORTFOLIOS
| | | | | | | | | | | | | | | | | | | | | | |
| | | Equity Growth
Strategy Portfolio | | | | | Growth and
Income Strategy
Portfolio | | | | | Growth Strategy
Portfolio | | | | | Satellite Strategies
Portfolio | |
| | | | | | | | | | | | | | | | | | | | | | |
| | $ | 646,970 | | | | | $ | 3,821,060 | | | | | $ | 1,977,353 | | | | | $ | 12,547,952 | |
| | | 103 | | | | | | 625 | | | | | | 295 | | | | | | 192 | |
| | | 647,073 | | | | | | 3,821,685 | | | | | | 1,977,648 | | | | | | 12,548,144 | |
| | | | | | | | | | | | | | | | | | | | | | |
| | | | | | | | | | | | | | | | | | | | | | |
| | | 552,789 | | | | | | 1,089,976 | | | | | | 1,168,714 | | | | | | 459,804 | |
| | | 244,172 | | | | | | 669,203 | | | | | | 580,971 | | | | | | 520,233 | |
| | | 223,664 | | | | | | 529,321 | | | | | | 513,230 | | | | | | 347,757 | |
| | | 48,084 | | | | | | 52,114 | | | | | | 50,889 | | | | | | 77,443 | |
| | | 35,797 | | | | | | 71,284 | | | | | | 65,691 | | | | | | 55,754 | |
| | | 37,310 | | | | | | 36,178 | | | | | | 37,121 | | | | | | 35,046 | |
| | | 20,195 | | | | | | 23,642 | | | | | | 21,691 | | | | | | 20,355 | |
| | | 12,228 | | | | | | 14,036 | | | | | | 12,978 | | | | | | 13,892 | |
| | | 568 | | | | | | 3,965 | | | | | | 2,651 | | | | | | 828 | |
| | | 568 | | | | | | 3,965 | | | | | | 2,651 | | | | | | 828 | |
| | | 4,221 | | | | | | 7,797 | | | | | | 7,300 | | | | | | 8,587 | |
| | | 1,179,596 | | | | | | 2,501,481 | | | | | | 2,463,887 | | | | | | 1,540,527 | |
| | | (151,325 | ) | | | | | (187,205 | ) | | | | | (180,179 | ) | | | | | (169,122 | ) |
| | | 1,028,271 | | | | | | 2,314,276 | | | | | | 2,283,708 | | | | | | 1,371,405 | |
| | | (381,198 | ) | | | | | 1,507,409 | | | | | | (306,060 | ) | | | | | 11,176,739 | |
| | | | | | | | | | | | | | | | | | | | | | |
| | | | | | | | | | | | | | | | | | | | | | |
| | | 21,563,135 | | | | | | 18,516,790 | | | | | | 28,377,710 | | | | | | (27,970,568 | ) |
| | | (20,478,758 | ) | | | | | (6,427,751 | ) | | | | | (23,130,335 | ) | | | | | 57,501,027 | |
| | | 1,084,377 | | | | | | 12,089,039 | | | | | | 5,247,375 | | | | | | 29,530,459 | |
| | $ | 703,179 | | | | | $ | 13,596,448 | | | | | $ | 4,941,315 | | | | | $ | 40,707,198 | |
| | |
| The accompanying notes are an integral part of these financial statements. | | 43 |
GOLDMAN SACHS FUND OF FUNDS PORTFOLIOS
Statements of Changes in Net Assets
| | | | | | | | | | |
| | | | | Balanced Strategy Portfolio | |
| | | | | For the
Six Months Ended
June 30, 2016
(Unaudited) | | | For the Fiscal
Year Ended
December 31, 2015 | |
| | From operations: | |
| | Net investment income (loss) | | $ | 1,734,355 | | | $ | 14,545,688 | |
| | Net realized gain (loss) | | | 2,774,904 | | | | 6,983,245 | |
| | Net change in unrealized gain (loss) | | | 6,834,542 | | | | (25,031,392 | ) |
| | Net increase (decrease) in net assets resulting from operations | | | 11,343,801 | | | | (3,502,459 | ) |
| | | | | | | | | | |
| | Distributions to shareholders: | |
| | From net investment income | | | | | | | | |
| | Class A Shares | | | (426,832 | ) | | | (5,095,512 | ) |
| | Class C Shares | | | (5,819 | ) | | | (1,565,196 | ) |
| | Institutional Shares | | | (1,179,971 | ) | | | (8,487,895 | ) |
| | Service Shares | | | (2,052 | ) | | | (44,435 | ) |
| | Class IR Shares | | | (19,841 | ) | | | (164,300 | ) |
| | Class R Shares | | | (9,861 | ) | | | (188,063 | ) |
| | Class R6 Shares(a) | | | (49 | ) | | | (310 | ) |
| | Return of capital | | | | | | | | |
| | Class A Shares | | | — | | | | (2,526,405 | ) |
| | Class C Shares | | | — | | | | (776,040 | ) |
| | Institutional Shares | | | — | | | | (4,208,383 | ) |
| | Service Shares | | | — | | | | (22,031 | ) |
| | Class IR Shares | | | — | | | | (81,461 | ) |
| | Class R Shares | | | — | | | | (93,243 | ) |
| | Class R6 Shares(a) | | | — | | | | (153 | ) |
| | Total distributions to shareholders | | | (1,644,425 | ) | | | (23,253,427 | ) |
| | | | | | | | | | |
| | From share transactions: | |
| | Proceeds from sales of shares | | | 50,317,012 | | | | 98,709,246 | |
| | Reinvestment of distributions | | | 1,606,625 | | | | 22,189,595 | |
| | Cost of shares redeemed | | | (61,907,064 | ) | | | (153,490,200 | ) |
| | Net decrease in net assets resulting from share transactions | | | (9,983,427 | ) | | | (32,591,359 | ) |
| | TOTAL DECREASE | | | (284,051 | ) | | | (59,347,245 | ) |
| | | | | | | | | | |
| | Net assets: | |
| | Beginning of period | | | 444,618,550 | | | | 503,965,795 | |
| | End of period | | $ | 444,334,499 | | | $ | 444,618,550 | |
| | Undistributed (distributions in excess of) net investment income | | $ | 237,542 | | | $ | 147,612 | |
| | (a) | | Commenced operations on July 31, 2015. |
| | |
| 44 | | The accompanying notes are an integral part of these financial statements. |
GOLDMAN SACHS FUND OF FUNDS PORTFOLIOS
| | | | | | | | | | | | | | | | | | | | | | |
| | | Equity Growth Strategy Portfolio | | | | | Growth and Income Strategy Portfolio | |
| | | For the
Six Months Ended
June 30, 2016
(Unaudited) | | | | | For the Fiscal
Year Ended
December 31, 2015 | | | | | For the
Six Months Ended
June 30, 2016
(Unaudited) | | | | | For the Fiscal
Year Ended
December 31, 2015 | |
| | | | | | | | | | | | | | | | | | | | | | |
| | $ | (381,198 | ) | | | | $ | 2,113,803 | | | | | $ | 1,507,409 | | | | | $ | 20,916,879 | |
| | | 21,563,135 | | | | | | 30,393,456 | | | | | | 18,516,790 | | | | | | 42,569,402 | |
| | | (20,478,758 | ) | | | | | (28,776,252 | ) | | | | | (6,427,751 | ) | | | | | (66,686,597 | ) |
| | | 703,179 | | | | | | 3,731,007 | | | | | | 13,596,448 | | | | | | (3,200,316 | ) |
| | | | | | | | | | | | | | | | | | | | | | |
| | | | | | | | | | | | | | | | | | | | | | |
| | | | | | | | | | | | | | | | | | | | | | |
| | | — | | | | | | (1,308,140 | ) | | | | | (281,325 | ) | | | | | (12,235,759 | ) |
| | | — | | | | | | (169,086 | ) | | | | | (330 | ) | | | | | (4,206,483 | ) |
| | | — | | | | | | (1,615,705 | ) | | | | | (1,164,518 | ) | | | | | (16,299,566 | ) |
| | | — | | | | | | (4,927 | ) | | | | | (1,819 | ) | | | | | (112,387 | ) |
| | | — | | | | | | (68,602 | ) | | | | | (8,270 | ) | | | | | (120,119 | ) |
| | | — | | | | | | (10,858 | ) | | | | | (526 | ) | | | | | (76,493 | ) |
| | | — | | | | | | (134 | ) | | | | | (27 | ) | | | | | (326 | ) |
| | | | | | | | | | | | | | | | | | | | | | |
| | | — | | | | | | — | | | | | | — | | | | | | — | |
| | | — | | | | | | — | | | | | | — | | | | | | — | |
| | | — | | | | | | — | | | | | | — | | | | | | — | |
| | | — | | | | | | — | | | | | | — | | | | | | — | |
| | | — | | | | | | — | | | | | | — | | | | | | — | |
| | | — | | | | | | — | | | | | | — | | | | | | — | |
| | | — | | | | | | — | | | | | | — | | | | | | — | |
| | | — | | | | | | (3,177,452 | ) | | | | | (1,456,815 | ) | | | | | (33,051,133 | ) |
| | | | | | | | | | | | | | | | | | | | | | |
| | | | | | | | | | | | | | | | | | | | | | |
| | | 10,188,314 | | | | | | 25,374,959 | | | | | | 52,008,688 | | | | | | 128,739,332 | |
| | | — | | | | | | 3,020,454 | | | | | | 1,422,659 | | | | | | 30,906,155 | |
| | | (24,661,331 | ) | | | | | (69,366,483 | ) | | | | | (92,077,210 | ) | | | | | (210,351,612 | ) |
| | | (14,473,017 | ) | | | | | (40,971,070 | ) | | | | | (38,645,863 | ) | | | | | (50,706,125 | ) |
| | | (13,769,838 | ) | | | | | (40,417,515 | ) | | | | | (26,506,230 | ) | | | | | (86,957,574 | ) |
| | | | | | | | | | | | | | | | | | | | | | |
| | | | | | | | | | | | | | | | | | | | | | |
| | | 343,604,632 | | | | | | 384,022,147 | | | | | | 922,636,680 | | | | | | 1,009,594,254 | |
| | $ | 329,834,794 | | | | | $ | 343,604,632 | | | | | $ | 896,130,450 | | | | | $ | 922,636,680 | |
| | $ | (281,088 | ) | | | | $ | 100,110 | | | | | $ | 54,884 | | | | | $ | 4,290 | |
| | |
| The accompanying notes are an integral part of these financial statements. | | 45 |
GOLDMAN SACHS FUND OF FUNDS PORTFOLIOS
Statements of Changes in Net Assets
| | | | | | | | | | |
| | | | | Growth Strategy Portfolio | |
| | | | | For the
Six Months Ended
June 30, 2016
(Unaudited) | | | For the Fiscal
Year Ended
December 31, 2015 | |
| | From operations: | | | | | | | | |
| | Net investment income (loss) | | $ | (306,060 | ) | | $ | 9,909,410 | |
| | Net realized gain (loss) | | | 28,377,710 | | | | 60,602,258 | |
| | Net change in unrealized gain (loss) | | | (23,130,335 | ) | | | (69,260,756 | ) |
| | Net increase (decrease) in net assets resulting from operations | | | 4,941,315 | | | | 1,250,912 | |
| | | | | | | | | | |
| | Distributions to shareholders: | | | | | | | | |
| | From net investment income | | | | | | | | |
| | Class A Shares | | | — | | | | (5,268,195 | ) |
| | Class C Shares | | | — | | | | (1,217,530 | ) |
| | Institutional Shares | | | — | | | | (6,012,695 | ) |
| | Service Shares | | | — | | | | (31,885 | ) |
| | Class IR Shares | | | — | | | | (77,652 | ) |
| | Class R Shares | | | — | | | | (31,649 | ) |
| | Class R6 Shares(a) | | | — | | | | (193 | ) |
| | Return of capital | | | | | | | | |
| | Class A Shares | | | — | | | | — | |
| | Class C Shares | | | — | | | | — | |
| | Institutional Shares | | | — | | | | — | |
| | Service Shares | | | — | | | | — | |
| | Class IR Shares | | | — | | | | — | |
| | Class R Shares | | | — | | | | — | |
| | Class R6 Shares(a) | | | — | | | | — | |
| | Total distributions to shareholders | | | — | | | | (12,639,799 | ) |
| | | | | | | | | | |
| | From share transactions: | | | | | | | | |
| | Proceeds from sales of shares | | | 25,995,115 | | | | 108,927,723 | |
| | Reinvestment of distributions | | | — | | | | 12,018,514 | |
| | Cost of shares redeemed | | | (68,723,844 | ) | | | (151,803,088 | ) |
| | Net decrease in net assets resulting from share transactions | | | (42,728,729 | ) | | | (30,856,851 | ) |
| | TOTAL DECREASE | | | (37,787,414 | ) | | | (42,245,738 | ) |
| | | | | | | | | | |
| | Net assets: | | | | | | | | |
| | Beginning of period | | | 810,430,822 | | | | 852,676,560 | |
| | End of period | | $ | 772,643,408 | | | $ | 810,430,822 | |
| | Undistributed net investment income | | $ | 146,705 | | | $ | 452,765 | |
| | (a) | | Commenced operations on July 31, 2015. |
| | |
| 46 | | The accompanying notes are an integral part of these financial statements. |
GOLDMAN SACHS FUND OF FUNDS PORTFOLIOS
| | | | | | | | | | |
| | | | | Satellite Strategies Portfolio | |
| | | | | For the Six Months Ended
June 30, 2016
(Unaudited) | | | For the Fiscal Year Ended
December 31, 2015 | |
| | From operations: | | | | | | | | |
| | Net investment income | | $ | 11,176,739 | | | $ | 29,825,060 | |
| | Net realized loss | | | (27,970,568 | ) | | | (14,905,989 | ) |
| | Net change in unrealized gain (loss) | | | 57,501,027 | | | | (41,621,460 | ) |
| | Net increase (decrease) in net assets resulting from operations | | | 40,707,198 | | | | (26,702,389 | ) |
| | | | | | | | | | |
| | Distributions to shareholders: | | | | | | | | |
| | From net investment income | | | | | | | | |
| | Class A Shares | | | (1,272,837 | ) | | | (3,402,921 | ) |
| | Class C Shares | | | (525,299 | ) | | | (1,351,435 | ) |
| | Institutional Shares | | | (8,125,602 | ) | | | (21,458,058 | ) |
| | Service Shares | | | (5,671 | ) | | | (71,931 | ) |
| | Class IR Shares | | | (846,141 | ) | | | (2,097,718 | ) |
| | Class R Shares | | | (32,829 | ) | | | (72,106 | ) |
| | Class R6 Shares(a) | | | (330 | ) | | | (152 | ) |
| | Total distributions to shareholders | | | (10,808,709 | ) | | | (28,454,321 | ) |
| | | | | | | | | | |
| | From share transactions: | | | | | | | | |
| | Proceeds from sales of shares | | | 62,359,003 | | | | 178,922,896 | |
| | Reinvestment of distributions | | | 9,048,858 | | | | 22,469,087 | |
| | Cost of shares redeemed | | | (202,920,073 | ) | | | (449,257,975 | ) |
| | Net decrease in net assets resulting from share transactions | | | (131,512,212 | ) | | | (247,865,992 | ) |
| | TOTAL DECREASE | | | (101,613,723 | ) | | | (303,022,702 | ) |
| | | | | | | | | | |
| | Net assets: | | | | | | | | |
| | Beginning of period | | | 914,041,050 | | | | 1,217,063,752 | |
| | End of period | | $ | 812,427,327 | | | $ | 914,041,050 | |
| | Undistributed net investment income | | $ | 1,704,548 | | | $ | 1,336,518 | |
| | (a) | | Commenced operations on July 31, 2015. |
| | |
| The accompanying notes are an integral part of these financial statements. | | 47 |
GOLDMAN SACHS BALANCED STRATEGY PORTFOLIO
Financial Highlights
Selected Data for a Share Outstanding Throughout Each Period
| | | | | | | | | | | | | | | | | | | | | | | | | | | | | | |
| | | | | | From
Investment Operations | | | Distributions
to shareholders | |
| | | Year - Share Class | | Net asset value, beginning of period | | | Net investment income
(loss)(a)(b) | | | Net realized
and unrealized
gain (loss) | | | Total from investment operations | | | From net investment income | | | From
capital | | | Total distributions | |
| | FOR THE SIX MONTHS ENDED JUNE 30, (Unaudited) | |
| | 2016 - A | | $ | 10.41 | | | $ | 0.03 | | | $ | 0.22 | | | $ | 0.25 | | | $ | (0.03 | ) | | $ | — | | | $ | (0.03 | ) |
| | 2016 - C | | | 10.41 | | | | (0.01 | ) | | | 0.22 | | | | 0.21 | | | | — | (g) | | | — | | | | — | (g) |
| | 2016 - Institutional | | | 10.42 | | | | 0.05 | | | | 0.21 | | | | 0.26 | | | | (0.05 | ) | | | — | | | | (0.05 | ) |
| | 2016 - Service | | | 10.45 | | | | 0.03 | | | | 0.30 | | | | 0.33 | | | | (0.03 | ) | | | — | | | | (0.03 | ) |
| | 2016 - IR | | | 10.37 | | | | 0.05 | | | | 0.21 | | | | 0.26 | | | | (0.04 | ) | | | — | | | | (0.04 | ) |
| | 2016 - R | | | 10.36 | | | | 0.02 | | | | 0.24 | | | | 0.26 | | | | (0.02 | ) | | | — | | | | (0.02 | ) |
| | 2016 - R6 | | | 10.42 | | | | 0.05 | | | | 0.22 | | | | 0.27 | | | | (0.05 | ) | | | — | | | | (0.05 | ) |
| | | | | | | | | | | | | | | | | | | | | | | | | | | | | | |
| | FOR THE FISCAL YEARS ENDED DECEMBER 31, | | | | | |
| | 2015 - A | | | 11.06 | | | | 0.33 | | | | (0.43 | ) | | | (0.10 | ) | | | (0.38 | ) | | | (0.17 | ) | | | (0.55 | ) |
| | 2015 - C | | | 11.07 | | | | 0.24 | | | | (0.43 | ) | | | (0.19 | ) | | | (0.32 | ) | | | (0.15 | ) | | | (0.47 | ) |
| | 2015 - Institutional | | | 11.07 | | | | 0.39 | | | | (0.44 | ) | | | (0.05 | ) | | | (0.40 | ) | | | (0.20 | ) | | | (0.60 | ) |
| | 2015 - Service | | | 11.10 | | | | 0.39 | | | | (0.50 | ) | | | (0.11 | ) | | | (0.36 | ) | | | (0.18 | ) | | | (0.54 | ) |
| | 2015 - IR | | | 11.03 | | | | 0.36 | | | | (0.44 | ) | | | (0.08 | ) | | | (0.39 | ) | | | (0.19 | ) | | | (0.58 | ) |
| | 2015 - R | | | 11.02 | | | | 0.36 | | | | (0.49 | ) | | | (0.13 | ) | | | (0.34 | ) | | | (0.19 | ) | | | (0.53 | ) |
| | 2015 - R6 (Commenced July 31, 2015) | | | 11.16 | | | | 0.30 | | | | (0.52 | ) | | | (0.22 | ) | | | (0.35 | ) | | | (0.17 | ) | | | (0.52 | ) |
| | 2014 - A | | | 11.13 | | | | 0.21 | | | | 0.06 | | | | 0.27 | | | | (0.34 | ) | | | — | | | | (0.34 | ) |
| | 2014 - C | | | 11.13 | | | | 0.12 | | | | 0.07 | | | | 0.19 | | | | (0.25 | ) | | | — | | | | (0.25 | ) |
| | 2014 - Institutional | | | 11.13 | | | | 0.25 | | | | 0.07 | | | | 0.32 | | | | (0.38 | ) | | | — | | | | (0.38 | ) |
| | 2014 - Service | | | 11.16 | | | | 0.19 | | | | 0.08 | | | | 0.27 | | | | (0.33 | ) | | | — | | | | (0.33 | ) |
| | 2014 - IR | | | 11.09 | | | | 0.25 | | | | 0.06 | | | | 0.31 | | | | (0.37 | ) | | | — | | | | (0.37 | ) |
| | 2014 - R | | | 11.08 | | | | 0.18 | | | | 0.07 | | | | 0.25 | | | | (0.31 | ) | | | — | | | | (0.31 | ) |
| | 2013 - A | | | 10.56 | | | | 0.25 | | | | 0.61 | | | | 0.86 | | | | (0.29 | ) | | | — | | | | (0.29 | ) |
| | 2013 - C | | | 10.56 | | | | 0.17 | | | | 0.61 | | | | 0.78 | | | | (0.21 | ) | | | — | | | | (0.21 | ) |
| | 2013 - Institutional | | | 10.56 | | | | 0.33 | | | | 0.58 | | | | 0.91 | | | | (0.34 | ) | | | — | | | | (0.34 | ) |
| | 2013 - Service | | | 10.59 | | | | 0.23 | | | | 0.62 | | | | 0.85 | | | | (0.28 | ) | | | — | | | | (0.28 | ) |
| | 2013 - IR | | | 10.53 | | | | 0.37 | | | | 0.51 | | | | 0.88 | | | | (0.32 | ) | | | — | | | | (0.32 | ) |
| | 2013 - R | | | 10.51 | | | | 0.23 | | | | 0.61 | | | | 0.84 | | | | (0.27 | ) | | | — | | | | (0.27 | ) |
| | 2012 - A | | | 9.86 | | | | 0.16 | | | | 0.82 | | | | 0.98 | | | | (0.28 | ) | | | — | | | | (0.28 | ) |
| | 2012 - C | | | 9.86 | | | | 0.09 | | | | 0.81 | | | | 0.90 | | | | (0.20 | ) | | | — | | | | (0.20 | ) |
| | 2012 - Institutional | | | 9.87 | | | | 0.23 | | | | 0.79 | | | | 1.02 | | | | (0.33 | ) | | | — | | | | (0.33 | ) |
| | 2012 - Service | | | 9.88 | | | | 0.15 | | | | 0.83 | | | | 0.98 | | | | (0.27 | ) | | | — | | | | (0.27 | ) |
| | 2012 - IR | | | 9.83 | | | | 0.22 | | | | 0.79 | | | | 1.01 | | | | (0.31 | ) | | | — | | | | (0.31 | ) |
| | 2012 - R | | | 9.82 | | | | 0.15 | | | | 0.80 | | | | 0.95 | | | | (0.26 | ) | | | — | | | | (0.26 | ) |
| | 2011 - A | | | 10.22 | | | | 0.15 | | | | (0.34 | ) | | | (0.19 | ) | | | (0.17 | ) | | | — | | | | (0.17 | ) |
| | 2011 - C | | | 10.22 | | | | 0.08 | | | | (0.35 | ) | | | (0.27 | ) | | | (0.09 | ) | | | — | | | | (0.09 | ) |
| | 2011 - Institutional | | | 10.23 | | | | 0.20 | | | | (0.35 | ) | | | (0.15 | ) | | | (0.21 | ) | | | — | | | | (0.21 | ) |
| | 2011 - Service | | | 10.25 | | | | 0.14 | | | | (0.35 | ) | | | (0.21 | ) | | | (0.16 | ) | | | — | | | | (0.16 | ) |
| | 2011 - IR | | | 10.21 | | | | 0.24 | | | | (0.42 | ) | | | (0.18 | ) | | | (0.20 | ) | | | — | | | | (0.20 | ) |
| | 2011 - R | | | 10.18 | | | | 0.14 | | | | (0.35 | ) | | | (0.21 | ) | | | (0.15 | ) | | | — | | | | (0.15 | ) |
| | (a) | | Calculated based on the average shares outstanding methodology. |
| | (b) | | Recognition of net investment income by the Portfolio is affected by the timing of declaration of dividends by the Underlying Funds in which the Portfolio invests. |
| | (c) | | Assumes investment at the NAV at the beginning of the period, reinvestment of all dividends and distributions, a complete redemption of the investment at the NAV at the end of the period and no sales or redemption charges. Total returns would be reduced if a sales or redemption charge was taken into account. Returns do not reflect the impact of taxes to shareholders relating to Portfolio distributions or the redemption of Portfolio shares. Total returns for periods less than one full year are not annualized. |
| | (d) | | Expense ratios exclude the expenses of the Underlying Funds in which the Portfolio invests. |
| | (e) | | The Portfolio’s portfolio turnover rate is calculated in accordance with regulatory requirements, without regard to transactions involving short term investments. If such transactions were included, the Portfolio’s portfolio turnover rate may be higher. |
| | (g) | | Amount is less than $0.005 per share. |
| | |
| 48 | | The accompanying notes are an integral part of these financial statements. |
GOLDMAN SACHS BALANCED STRATEGY PORTFOLIO
| | | | | | | | | | | | | | | | | | | | | | | | | | | | | | | | | | | | | | | | |
| | | | | | | | | | | | | | | | | | | | | | | | | | | | | | | | | | |
| | | Net asset
value, end
of period | | | | | Total return(c) | | | | | Net assets,
end of
period
(in 000s) | | | | | Ratio of
net expenses
to average net assets(d) | | | | | Ratio of
total expenses
to average net assets(d) | | | | | Ratio of
net investment
income (loss)
to average net assets(b) | | | | | Portfolio
turnover rate(e) | |
| | | | | | | | | | | | | | | | | | | | | | | | | | | | | | | | | | | | | | | | |
| | $ | 10.63 | | | | | | 2.42 | % | | | | $ | 141,085 | | | | | | 0.59 | %(f) | | | | | 0.66 | %(f) | | | | | 0.65 | %(f) | | | | | 39 | % |
| | | 10.62 | | | | | | 1.93 | | | | | | 50,364 | | | | | | 1.34 | (f) | | | | | 1.41 | (f) | | | | | (0.10 | )(f) | | | | | 39 | |
| | | 10.63 | | | | | | 2.51 | | | | | | 241,952 | | | | | | 0.19 | (f) | | | | | 0.26 | (f) | | | | | 1.05 | (f) | | | | | 39 | |
| | | 10.75 | | | | | | 3.12 | | | | | | 823 | | | | | | 0.69 | (f) | | | | | 0.76 | (f) | | | | | 0.54 | (f) | | | | | 39 | |
| | | 10.59 | | | | | | 2.55 | | | | | | 4,882 | | | | | | 0.34 | (f) | | | | | 0.41 | (f) | | | | | 0.91 | (f) | | | | | 39 | |
| | | 10.60 | | | | | | 2.51 | | | | | | 5,219 | | | | | | 0.84 | (f) | | | | | 0.91 | (f) | | | | | 0.41 | (f) | | | | | 39 | |
| | | 10.64 | | | | | | 2.61 | | | | | | 10 | | | | | | 0.20 | (f) | | | | | 0.27 | (f) | | | | | 1.04 | (f) | | | | | 39 | |
| | | | | | | | | | | | | | | | | | | | | | | | | | | | | | | | | | | | | | | | |
| | | | | | | | | | | | | | | | | | | | | | | | | | | | | | | | | | | | | | | | |
| | | 10.41 | | | | | | (0.90 | ) | | | | | 146,047 | | | | | | 0.59 | | | | | | 0.65 | | | | | | 2.95 | | | | | | 48 | |
| | | 10.41 | | | | | | (1.65 | ) | | | | | 53,734 | | | | | | 1.34 | | | | | | 1.40 | | | | | | 2.20 | | | | | | 48 | |
| | | 10.42 | | | | | | (0.49 | ) | | | | | 234,110 | | | | | | 0.19 | | | | | | 0.25 | | | | | | 3.48 | | | | | | 48 | |
| | | 10.45 | | | | | | (0.99 | ) | | | | | 967 | | | | | | 0.69 | | | | | | 0.75 | | | | | | 3.47 | | | | | | 48 | |
| | | 10.37 | | | | | | (0.73 | ) | | | | | 4,555 | | | | | | 0.34 | | | | | | 0.40 | | | | | | 3.29 | | | | | | 48 | |
| | | 10.36 | | | | | | (1.23 | ) | | | | | 5,196 | | | | | | 0.84 | | | | | | 0.90 | | | | | | 3.22 | | | | | | 48 | |
| | | 10.42 | | | | | | (2.01 | ) | | | | | 10 | | | | | | 0.19 | (f) | | | | | 0.23 | (f) | | | | | 6.52 | (f) | | | | | 48 | |
| | | 11.06 | | | | | | 2.40 | | | | | | 173,813 | | | | | | 0.60 | | | | | | 0.66 | | | | | | 1.85 | | | | | | 38 | |
| | | 11.07 | | | | | | 1.71 | | | | | | 63,726 | | | | | | 1.35 | | | | | | 1.41 | | | | | | 1.05 | | | | | | 38 | |
| | | 11.07 | | | | | | 2.90 | | | | | | 254,620 | | | | | | 0.20 | | | | | | 0.26 | | | | | | 2.22 | | | | | | 38 | |
| | | 11.10 | | | | | | 2.38 | | | | | | 1,391 | | | | | | 0.70 | | | | | | 0.75 | | | | | | 1.65 | | | | | | 38 | |
| | | 11.03 | | | | | | 2.76 | | | | | | 4,980 | | | | | | 0.35 | | | | | | 0.41 | | | | | | 2.23 | | | | | | 38 | |
| | | 11.02 | | | | | | 2.25 | | | | | | 5,436 | | | | | | 0.85 | | | | | | 0.90 | | | | | | 1.61 | | | | | | 38 | |
| | | 11.13 | | | | | | 8.23 | | | | | | 186,034 | | | | | | 0.60 | | | | | | 0.65 | | | | | | 2.29 | | | | | | 63 | |
| | | 11.13 | | | | | | 7.42 | | | | | | 74,053 | | | | | | 1.34 | | | | | | 1.40 | | | | | | 1.57 | | | | | | 63 | |
| | | 11.13 | | | | | | 8.67 | | | | | | 287,623 | | | | | | 0.20 | | | | | | 0.25 | | | | | | 2.99 | | | | | | 63 | |
| | | 11.16 | | | | | | 8.08 | | | | | | 1,736 | | | | | | 0.69 | | | | | | 0.75 | | | | | | 2.14 | | | | | | 63 | |
| | | 11.09 | | | | | | 8.45 | | | | | | 3,938 | | | | | | 0.35 | | | | | | 0.40 | | | | | | 3.37 | | | | | | 63 | |
| | | 11.08 | | | | | | 8.00 | | | | | | 5,615 | | | | | | 0.84 | | | | | | 0.90 | | | | | | 2.07 | | | | | | 63 | |
| | | 10.56 | | | | | | 9.96 | | | | | | 219,919 | | | | | | 0.59 | | | | | | 0.65 | | | | | | 1.55 | | | | | | 66 | |
| | | 10.56 | | | | | | 9.16 | | | | | | 81,123 | | | | | | 1.34 | | | | | | 1.40 | | | | | | 0.87 | | | | | | 66 | |
| | | 10.56 | | | | | | 10.32 | | | | | | 247,494 | | | | | | 0.19 | | | | | | 0.25 | | | | | | 2.23 | | | | | | 66 | |
| | | 10.59 | | | | | | 9.95 | | | | | | 2,022 | | | | | | 0.69 | | | | | | 0.75 | | | | | | 1.48 | | | | | | 66 | |
| | | 10.53 | | | | | | 10.29 | | | | | | 920 | | | | | | 0.34 | | | | | | 0.40 | | | | | | 2.14 | | | | | | 66 | |
| | | 10.51 | | | | | | 9.66 | | | | | | 8,237 | | | | | | 0.84 | | | | | | 0.90 | | | | | | 1.49 | | | | | | 66 | |
| | | 9.86 | | | | | | (1.88 | ) | | | | | 327,283 | | | | | | 0.59 | | | | | | 0.64 | | | | | | 1.49 | | | | | | 38 | |
| | | 9.86 | | | | | | (2.64 | ) | | | | | 94,041 | | | | | | 1.34 | | | | | | 1.39 | | | | | | 0.73 | | | | | | 38 | |
| | | 9.87 | | | | | | (1.48 | ) | | | | | 151,822 | | | | | | 0.19 | | | | | | 0.24 | | | | | | 1.96 | | | | | | 38 | |
| | | 9.88 | | | | | | (2.09 | ) | | | | | 2,466 | | | | | | 0.69 | | | | | | 0.74 | | | | | | 1.36 | | | | | | 38 | |
| | | 9.83 | | | | | | (1.79 | ) | | | | | 750 | | | | | | 0.34 | | | | | | 0.39 | | | | | | 2.38 | | | | | | 38 | |
| | | 9.82 | | | | | | (2.11 | ) | | | | | 7,288 | | | | | | 0.84 | | | | | | 0.89 | | | | | | 1.38 | | | | | | 38 | |
| | |
| The accompanying notes are an integral part of these financial statements. | | 49 |
GOLDMAN SACHS EQUITY GROWTH STRATEGY PORTFOLIO
Financial Highlights
Selected Data for a Share Outstanding Throughout Each Period
| | | | | | | | | | | | | | | | | | | | | | |
| | | | | | From
investment operations | | | | |
| | | Year - Share Class | | Net asset value, beginning of period | | | Net investment income (loss)(a)(b) | | | Net realized and unrealized gain (loss) | | | Total from investment operations | | | Distributions to shareholders from net investment income | |
| | FOR THE SIX MONTHS ENDED JUNE 30, (Unaudited) | | | | | | | | | | | | | | | | | |
| | 2016 - A | | $ | 14.44 | | | $ | (0.01 | ) | | $ | 0.06 | | | $ | 0.05 | | | $ | — | |
| | 2016 - C | | | 13.82 | | | | (0.06 | ) | | | 0.05 | | | | (0.01 | ) | | | — | |
| | 2016 - Institutional | | | 14.57 | | | | 0.01 | | | | 0.07 | | | | 0.08 | | | | — | |
| | 2016 - Service | | | 14.39 | | | | (0.02 | ) | | | 0.06 | | | | 0.04 | | | | — | |
| | 2016 - IR | | | 14.25 | | | | — | (g) | | | 0.06 | | | | 0.06 | | | | — | |
| | 2016 - R | | | 14.37 | | | | (0.03 | ) | | | 0.06 | | | | 0.03 | | | | — | |
| | 2016 - R6 | | | 14.57 | | | | 0.02 | | | | 0.05 | | | | 0.07 | | | | — | |
| | | | | | | | | | | | | | | | | | | | | | |
| | FOR THE FISCAL YEARS ENDED DECEMBER 31, | | | | | | | | | | | | | | | | | | | | |
| | 2015 - A | | | 14.46 | | | | 0.09 | | | | 0.03 | | | | 0.12 | | | | (0.14 | ) |
| | 2015 - C | | | 13.83 | | | | (0.02 | ) | | | 0.04 | | | | 0.02 | | | | (0.03 | ) |
| | 2015 - Institutional | | | 14.58 | | | | 0.16 | | | | 0.03 | | | | 0.19 | | | | (0.20 | ) |
| | 2015 - Service | | | 14.40 | | | | 0.08 | | | | 0.03 | | | | 0.11 | | | | (0.12 | ) |
| | 2015 - IR | | | 14.27 | | | | 0.13 | | | | 0.03 | | | | 0.16 | | | | (0.18 | ) |
| | 2015 - R | | | 14.37 | | | | 0.04 | | | | 0.05 | | | | 0.09 | | | | (0.09 | ) |
| | 2015 - R6 (Commenced July 31, 2015) | | | 15.38 | | | | 0.14 | | | | (0.74 | ) | | | (0.60 | ) | | | (0.21 | ) |
| | 2014 - A | | | 14.29 | | | | 0.23 | | | | 0.20 | | | | 0.43 | | | | (0.26 | ) |
| | 2014 - C | | | 13.68 | | | | 0.10 | | | | 0.20 | | | | 0.30 | | | | (0.15 | ) |
| | 2014 - Institutional | | | 14.41 | | | | 0.29 | | | | 0.20 | | | | 0.49 | | | | (0.32 | ) |
| | 2014 - Service | | | 14.22 | | | | 0.19 | | | | 0.23 | | | | 0.42 | | | | (0.24 | ) |
| | 2014 - IR | | | 14.11 | | | | 0.32 | | | | 0.14 | | | | 0.46 | | | | (0.30 | ) |
| | 2014 - R | | | 14.17 | | | | 0.13 | | | | 0.26 | | | | 0.39 | | | | (0.19 | ) |
| | 2013 - A | | | 11.75 | | | | 0.19 | | | | 2.57 | | | | 2.76 | | | | (0.22 | ) |
| | 2013 - C | | | 11.26 | | | | 0.08 | | | | 2.46 | | | | 2.54 | | | | (0.12 | ) |
| | 2013 - Institutional | | | 11.85 | | | | 0.27 | | | | 2.57 | | | | 2.84 | | | | (0.28 | ) |
| | 2013 - Service | | | 11.71 | | | | 0.19 | | | | 2.54 | | | | 2.73 | | | | (0.22 | ) |
| | 2013 - IR | | | 11.62 | | | | 0.47 | | | | 2.29 | | | | 2.76 | | | | (0.27 | ) |
| | 2013 - R | | | 11.64 | | | | 0.11 | | | | 2.59 | | | | 2.70 | | | | (0.17 | ) |
| | 2012 - A | | | 10.23 | | | | 0.21 | | | | 1.53 | | | | 1.74 | | | | (0.22 | ) |
| | 2012 - C | | | 9.82 | | | | 0.12 | | | | 1.46 | | | | 1.58 | | | | (0.14 | ) |
| | 2012 - Institutional | | | 10.33 | | | | 0.28 | | | | 1.52 | | | | 1.80 | | | | (0.28 | ) |
| | 2012 - Service | | | 10.14 | | | | 0.16 | | | | 1.55 | | | | 1.71 | | | | (0.14 | ) |
| | 2012 - IR | | | 10.13 | | | | 0.24 | | | | 1.51 | | | | 1.75 | | | | (0.26 | ) |
| | 2012 - R | | | 10.16 | | | | 0.20 | | | | 1.49 | | | | 1.69 | | | | (0.21 | ) |
| | 2011 - A | | | 11.33 | | | | 0.20 | | | | (1.05 | ) | | | (0.85 | ) | | | (0.25 | ) |
| | 2011 - C | | | 10.88 | | | | 0.11 | | | | (1.01 | ) | | | (0.90 | ) | | | (0.16 | ) |
| | 2011 - Institutional | | | 11.45 | | | | 0.25 | | | | (1.07 | ) | | | (0.82 | ) | | | (0.30 | ) |
| | 2011 - Service | | | 11.22 | | | | 0.16 | | | | (1.02 | ) | | | (0.86 | ) | | | (0.22 | ) |
| | 2011 - IR | | | 11.23 | | | | 0.27 | | | | (1.08 | ) | | | (0.81 | ) | | | (0.29 | ) |
| | 2011 - R | | | 11.26 | | | | 0.21 | | | | (1.08 | ) | | | (0.87 | ) | | | (0.23 | ) |
| | (a) | | Calculated based on the average shares outstanding methodology. |
| | (b) | | Recognition of net investment income by the Portfolio is affected by the timing of declaration of dividends by the Underlying Funds in which the Portfolio invests. |
| | (c) | | Assumes investment at the NAV at the beginning of the period, reinvestment of all dividends and distributions, a complete redemption of the investment at the NAV at the end of the period and no sales or redemption charges. Total returns would be reduced if a sales or redemption charge was taken into account. Returns do not reflect the impact of taxes to shareholders relating to Portfolio distributions or the redemption of Portfolio shares. Total returns for periods less than one full year are not annualized. |
| | (d) | | Expense ratios exclude the expenses of the Underlying Funds in which the Portfolio invests. |
| | (e) | | The Portfolio’s portfolio turnover rate is calculated in accordance with regulatory requirements, without regard to transactions involving short term investments. If such transactions were included, the Portfolio’s portfolio turnover rate may be higher. |
| | (g) | | Amount is less than $0.005 per share. |
| | |
| 50 | | The accompanying notes are an integral part of these financial statements. |
GOLDMAN SACHS EQUITY GROWTH STRATEGY PORTFOLIO
| | | | | | | | | | | | | | | | | | | | | | | | | | | | | | | | | | | | | | | | |
| | | | | | | | | | | | | | | | | | | | | | | | | | | | | | | | | | |
| | | Net asset value, end of period | | | | | Total return(c) | | | | | Net assets, end of period (in 000s) | | | | | Ratio of net expenses to average net assets(d) | | | | | Ratio of total expenses to average net assets(d) | | | | | Ratio of net investment income (loss) to average net assets(b) | | | | | Portfolio turnover rate(e) | |
| | | | | | | | | | | | | | | | | | | | | | | | | | | | | | | | | | | | | | | | |
| | $ | 14.49 | | | | | | 0.35 | % | | | | $ | 126,827 | | | | | | 0.59 | %(f) | | | | | 0.69 | %(f) | | | | | (0.20 | )%(f) | | | | | 23 | % |
| | | 13.81 | | | | | | (0.07 | ) | | | | | 78,005 | | | | | | 1.34 | (f) | | | | | 1.44 | (f) | | | | | (0.95 | )(f) | | | | | 23 | |
| | | 14.65 | | | | | | 0.55 | | | | | | 117,499 | | | | | | 0.19 | (f) | | | | | 0.29 | (f) | | | | | 0.21 | (f) | | | | | 23 | |
| | | 14.43 | | | | | | 0.28 | | | | | | 467 | | | | | | 0.69 | (f) | | | | | 0.79 | (f) | | | | | (0.30 | )(f) | | | | | 23 | |
| | | 14.31 | | | | | | 0.42 | | | | | | 5,129 | | | | | | 0.34 | (f) | | | | | 0.44 | (f) | | | | | 0.06 | (f) | | | | | 23 | |
| | | 14.40 | | | | | | 0.21 | | | | | | 1,897 | | | | | | 0.84 | (f) | | | | | 0.94 | (f) | | | | | (0.44 | )(f) | | | | | 23 | |
| | | 14.64 | | | | | | 0.48 | | | | | | 10 | | | | | | 0.19 | (f) | | | | | 0.28 | (f) | | | | | 0.22 | (f) | | | | | 23 | |
| | | | | | | | | | | | | | | | | | | | | | | | | | | | | | | | | | | | | | | | |
| | | | | | | | | | | | | | | | | | | | | | | | | | | | | | | | | | | | | | | | |
| | | 14.44 | | | | | | 0.83 | | | | | | 134,851 | | | | | | 0.59 | | | | | | 0.67 | | | | | | 0.63 | | | | | | 18 | |
| | | 13.82 | | | | | | 0.13 | | | | | | 83,743 | | | | | | 1.34 | | | | | | 1.42 | | | | | | (0.15 | ) | | | | | 18 | |
| | | 14.57 | | | | | | 1.31 | | | | | | 117,357 | | | | | | 0.19 | | | | | | 0.27 | | | | | | 1.05 | | | | | | 18 | |
| | | 14.39 | | | | | | 0.78 | | | | | | 577 | | | | | | 0.69 | | | | | | 0.77 | | | | | | 0.52 | | | | | | 18 | |
| | | 14.25 | | | | | | 1.11 | | | | | | 5,282 | | | | | | 0.34 | | | | | | 0.42 | | | | | | 0.91 | | | | | | 18 | |
| | | 14.37 | | | | | | 0.61 | | | | | | 1,785 | | | | | | 0.84 | | | | | | 0.92 | | | | | | 0.28 | | | | | | 18 | |
| | | 14.57 | | | | | | (3.93 | ) | | | | | 10 | | | | | | 0.18 | (f) | | | | | 0.29 | (f) | | | | | 2.32 | (f) | | | | | 18 | |
| | | 14.46 | | | | | | 3.01 | | | | | | 148,611 | | | | | | 0.60 | | | | | | 0.68 | | | | | | 1.56 | | | | | | 23 | |
| | | 13.83 | | | | | | 2.18 | | | | | | 96,667 | | | | | | 1.35 | | | | | | 1.42 | | | | | | 0.71 | | | | | | 23 | |
| | | 14.58 | | | | | | 3.38 | | | | | | 130,499 | | | | | | 0.20 | | | | | | 0.28 | | | | | | 1.96 | | | | | | 23 | |
| | | 14.40 | | | | | | 2.94 | | | | | | 626 | | | | | | 0.70 | | | | | | 0.77 | | | | | | 1.27 | | | | | | 23 | |
| | | 14.27 | | | | | | 3.27 | | | | | | 5,280 | | | | | | 0.35 | | | | | | 0.43 | | | | | | 2.19 | | | | | | 23 | |
| | | 14.37 | | | | | | 2.77 | | | | | | 2,339 | | | | | | 0.85 | | | | | | 0.92 | | | | | | 0.86 | | | | | | 23 | |
| | | 14.29 | | | | | | 23.51 | | | | | | 152,264 | | | | | | 0.60 | | | | | | 0.68 | | | | | | 1.45 | | | | | | 21 | |
| | | 13.68 | | | | | | 22.60 | | | | | | 106,208 | | | | | | 1.35 | | | | | | 1.43 | | | | | | 0.68 | | | | | | 21 | |
| | | 14.41 | | | | | | 23.96 | | | | | | 124,275 | | | | | | 0.20 | | | | | | 0.28 | | | | | | 2.07 | | | | | | 21 | |
| | | 14.22 | | | | | | 23.28 | | | | | | 715 | | | | | | 0.70 | | | | | | 0.78 | | | | | | 1.48 | | | | | | 21 | |
| | | 14.11 | | | | | | 23.77 | | | | | | 3,735 | | | | | | 0.35 | | | | | | 0.43 | | | | | | 3.55 | | | | | | 21 | |
| | | 14.17 | | | | | | 23.17 | | | | | | 3,740 | | | | | | 0.84 | | | | | | 0.93 | | | | | | 0.85 | | | | | | 21 | |
| | | 11.75 | | | | | | 16.95 | | | | | | 147,814 | | | | | | 0.59 | | | | | | 0.68 | | | | | | 1.85 | | | | | | 23 | |
| | | 11.26 | | | | | | 16.10 | | | | | | 102,156 | | | | | | 1.34 | | | | | | 1.43 | | | | | | 1.10 | | | | | | 23 | |
| | | 11.85 | | | | | | 17.45 | | | | | | 92,696 | | | | | | 0.19 | | | | | | 0.26 | | | | | | 2.45 | | | | | | 23 | |
| | | 11.71 | | | | | | 16.85 | | | | | | 488 | | | | | | 0.70 | | | | | | 0.78 | | | | | | 1.43 | | | | | | 23 | |
| | | 11.62 | | | | | | 17.30 | | | | | | 494 | | | | | | 0.34 | | | | | | 0.42 | | | | | | 2.20 | | | | | | 23 | |
| | | 11.64 | | | | | | 16.59 | | | | | | 4,946 | | | | | | 0.84 | | | | | | 0.92 | | | | | | 1.79 | | | | | | 23 | |
| | | 10.23 | | | | | | (7.52 | ) | | | | | 208,169 | | | | | | 0.59 | | | | | | 0.66 | | | | | | 1.77 | | | | | | 18 | |
| | | 9.82 | | | | | | (8.28 | ) | | | | | 112,247 | | | | | | 1.34 | | | | | | 1.41 | | | | | | 1.05 | | | | | | 18 | |
| | | 10.33 | | | | | | (7.16 | ) | | | | | 46,797 | | | | | | 0.19 | | | | | | 0.26 | | | | | | 2.20 | | | | | | 18 | |
| | | 10.14 | | | | | | (7.63 | ) | | | | | 1,246 | | | | | | 0.69 | | | | | | 0.76 | | | | | | 1.39 | | | | | | 18 | |
| | | 10.13 | | | | | | (7.25 | ) | | | | | 539 | | | | | | 0.34 | | | | | | 0.41 | | | | | | 2.45 | | | | | | 18 | |
| | | 10.16 | | | | | | (7.71 | ) | | | | | 5,073 | | | | | | 0.84 | | | | | | 0.91 | | | | | | 1.91 | | | | | | 18 | |
| | |
| The accompanying notes are an integral part of these financial statements. | | 51 |
GOLDMAN SACHS GROWTH AND INCOME STRATEGY PORTFOLIO
Financial Highlights
Selected Data for a Share Outstanding Throughout Each Period
| | | | | | | | | | | | | | | | | | | | | | |
| | | | | | From
investment operations | | | | |
| | | Year - Share Class | | Net asset value, beginning of period | | | Net investment income (loss)(a)(b) | | | Net realized and unrealized gain (loss) | | | Total from investment operations | | | Distributions to shareholders from net investment income | |
| | FOR THE SIX MONTHS ENDED JUNE 30, (Unaudited) | |
| | 2016 - A | | $ | 11.62 | | | $ | 0.01 | | | $ | 0.17 | | | $ | 0.18 | | | $ | (0.01 | ) |
| | 2016 - C | | | 11.42 | | | | (0.03 | ) | | | 0.16 | | | | 0.13 | | | | — | (g) |
| | 2016 - Institutional | | | 11.66 | | | | 0.04 | | | | 0.16 | | | | 0.20 | | | | (0.03 | ) |
| | 2016 - Service | | | 11.60 | | | | 0.01 | | | | 0.16 | | | | 0.17 | | | | (0.01 | ) |
| | 2016 - IR | | | 11.57 | | | | 0.03 | | | | 0.16 | | | | 0.19 | | | | (0.02 | ) |
| | 2016 - R | | | 11.56 | | | | — | (g) | | | 0.15 | | | | 0.15 | | | | — | (g) |
| | 2016 - R6 | | | 11.66 | | | | 0.04 | | | | 0.15 | | | | 0.19 | | | | (0.03 | ) |
| | | | | | | | | | | | | | | | | | | | | | |
| | FOR THE FISCAL YEARS ENDED DECEMBER 31, | |
| | 2015 - A | | | 12.10 | | | | 0.25 | | | | (0.31 | ) | | | (0.06 | ) | | | (0.42 | ) |
| | 2015 - C | | | 11.91 | | | | 0.16 | | | | (0.31 | ) | | | (0.15 | ) | | | (0.34 | ) |
| | 2015 - Institutional | | | 12.14 | | | | 0.32 | | | | (0.33 | ) | | | (0.01 | ) | | | (0.47 | ) |
| | 2015 - Service | | | 12.07 | | | | 0.25 | | | | (0.32 | ) | | | (0.07 | ) | | | (0.40 | ) |
| | 2015 - IR | | | 12.05 | | | | 0.29 | | | | (0.32 | ) | | | (0.03 | ) | | | (0.45 | ) |
| | 2015 - R | | | 12.03 | | | | 0.23 | | | | (0.31 | ) | | | (0.08 | ) | | | (0.39 | ) |
| | 2015 - R6 (Commenced July 31, 2015) | | | 12.42 | | | | 0.26 | | | | (0.62 | ) | | | (0.36 | ) | | | (0.40 | ) |
| | 2014 - A | | | 12.14 | | | | 0.20 | | | | 0.07 | | | | 0.27 | | | | (0.31 | ) |
| | 2014 - C | | | 11.99 | | | | 0.10 | | | | 0.08 | | | | 0.18 | | | | (0.26 | ) |
| | 2014 - Institutional | | | 12.18 | | | | 0.26 | | | | 0.06 | | | | 0.32 | | | | (0.36 | ) |
| | 2014 - Service | | | 12.11 | | | | 0.20 | | | | 0.06 | | | | 0.26 | | | | (0.30 | ) |
| | 2014 - IR | | | 12.09 | | | | 0.25 | | | | 0.05 | | | | 0.30 | | | | (0.34 | ) |
| | 2014 - R | | | 12.08 | | | | 0.16 | | | | 0.07 | | | | 0.23 | | | | (0.28 | ) |
| | 2013 - A | | | 10.95 | | | | 0.20 | | | | 1.23 | | | | 1.43 | | | | (0.24 | ) |
| | 2013 - C | | | 10.85 | | | | 0.12 | | | | 1.22 | | | | 1.34 | | | | (0.20 | ) |
| | 2013 - Institutional | | | 10.98 | | | | 0.28 | | | | 1.21 | | | | 1.49 | | | | (0.29 | ) |
| | 2013 - Service | | | 10.92 | | | | 0.20 | | | | 1.23 | | | | 1.43 | | | | (0.24 | ) |
| | 2013 - IR | | | 10.91 | | | | 0.29 | | | | 1.16 | | | | 1.45 | | | | (0.27 | ) |
| | 2013 - R | | | 10.90 | | | | 0.16 | | | | 1.24 | | | | 1.40 | | | | (0.22 | ) |
| | 2012 - A | | | 9.98 | | | | 0.17 | | | | 1.07 | | | | 1.24 | | | | (0.27 | ) |
| | 2012 - C | | | 9.92 | | | | 0.09 | | | | 1.04 | | | | 1.13 | | | | (0.20 | ) |
| | 2012 - Institutional | | | 10.02 | | | | 0.24 | | | | 1.03 | | | | 1.27 | | | | (0.31 | ) |
| | 2012 - Service | | | 9.97 | | | | 0.17 | | | | 1.04 | | | | 1.21 | | | | (0.26 | ) |
| | 2012 - IR | | | 9.95 | | | | 0.20 | | | | 1.05 | | | | 1.25 | | | | (0.29 | ) |
| | 2012 - R | | | 9.94 | | | | 0.16 | | | | 1.04 | | | | 1.20 | | | | (0.24 | ) |
| | 2011 - A | | | 10.55 | | | | 0.17 | | | | (0.53 | ) | | | (0.36 | ) | | | (0.21 | ) |
| | 2011 - C | | | 10.49 | | | | 0.10 | | | | (0.53 | ) | | | (0.43 | ) | | | (0.14 | ) |
| | 2011 - Institutional | | | 10.59 | | | | 0.22 | | | | (0.54 | ) | | | (0.32 | ) | | | (0.25 | ) |
| | 2011 - Service | | | 10.53 | | | | 0.17 | | | | (0.53 | ) | | | (0.36 | ) | | | (0.20 | ) |
| | 2011 - IR | | | 10.52 | | | | 0.40 | | | | (0.73 | ) | | | (0.33 | ) | | | (0.24 | ) |
| | 2011 - R | | | 10.52 | | | | 0.18 | | | | (0.57 | ) | | | (0.39 | ) | | | (0.19 | ) |
| | (a) | | Calculated based on the average shares outstanding methodology. |
| | (b) | | Recognition of net investment income by the Portfolio is affected by the timing of declaration of dividends by the Underlying Funds in which the Portfolio invests. |
| | (c) | | Assumes investment at the NAV at the beginning of the period, reinvestment of all dividends and distributions, a complete redemption of the investment at the NAV at the end of the period and no sales or redemption charges. Total returns would be reduced if a sales or redemption charge was taken into account. Returns do not reflect the impact of taxes to shareholders relating to Portfolio distributions or the redemption of Portfolio shares. Total returns for periods less than one full year are not annualized. |
| | (d) | | Expense ratios exclude the expenses of the Underlying Funds in which the Portfolio invests. |
| | (e) | | The Portfolio’s portfolio turnover rate is calculated in accordance with regulatory requirements, without regard to transactions involving short term investments. If such transactions were included, the Portfolio’s portfolio turnover rate may be higher. |
| | (g) | | Amount is less than $0.005 per share. |
| | |
| 52 | | The accompanying notes are an integral part of these financial statements. |
GOLDMAN SACHS GROWTH AND INCOME STRATEGY PORTFOLIO
| | | | | | | | | | | | | | | | | | | | | | | | | | | | | | | | | | | | | | | | |
| | | | | | | | | | | | | | | | | | | | | | | | | | | | | | | | | | |
| | | Net asset value, end of period | | | | | Total return(c) | | | | | Net assets, end of period (in 000s) | | | | | Ratio of net expenses to average net assets(d) | | | | | Ratio of total expenses to average net assets(d) | | | | | Ratio of net investment income (loss) to average net assets(b) | | | | | Portfolio turnover rate(e) | |
| | | | | | | | | | | | | | | | | | | | | | | | | | | | | | | | | | | | | | | | |
| | $ | 11.79 | | | | | | 1.55 | % | | | | $ | 323,632 | | | | | | 0.59 | %(f) | | | | | 0.64 | %(f) | | | | | 0.26 | %(f) | | | | | 37 | % |
| | | 11.55 | | | | | | 1.14 | | | | | | 133,280 | | | | | | 1.34 | (f) | | | | | 1.39 | (f) | | | | | (0.49 | )(f) | | | | | 37 | |
| | | 11.83 | | | | | | 1.74 | | | | | | 428,829 | | | | | | 0.19 | (f) | | | | | 0.24 | (f) | | | | | 0.66 | (f) | | | | | 37 | |
| | | 11.76 | | | | | | 1.44 | | | | | | 3,242 | | | | | | 0.69 | (f) | | | | | 0.74 | (f) | | | | | 0.17 | (f) | | | | | 37 | |
| | | 11.74 | | | | | | 1.68 | | | | | | 4,333 | | | | | | 0.34 | (f) | | | | | 0.39 | (f) | | | | | 0.55 | (f) | | | | | 37 | |
| | | 11.71 | | | | | | 1.32 | | | | | | 2,806 | | | | | | 0.84 | (f) | | | | | 0.89 | (f) | | | | | 0.03 | (f) | | | | | 37 | |
| | | 11.82 | | | | | | 1.65 | | | | | | 10 | | | | | | 0.19 | (f) | | | | | 0.23 | (f) | | | | | 0.68 | (f) | | | | | 37 | |
| | | | | | | | | | | | | | | | | | | | | | | | | | | | | | | | | | | | | | | | |
| | | | | | | | | | | | | | | | | | | | | | | | | | | | | | | | | | | | | | | | |
| | | 11.62 | | | | | | (0.54 | ) | | | | | 341,468 | | | | | | 0.59 | | | | | | 0.63 | | | | | | 2.08 | | | | | | 40 | |
| | | 11.42 | | | | | | (1.24 | ) | | | | | 143,257 | | | | | | 1.34 | | | | | | 1.38 | | | | | | 1.30 | | | | | | 40 | |
| | | 11.66 | | | | | | (0.13 | ) | | | | | 429,243 | | | | | | 0.19 | | | | | | 0.23 | | | | | | 2.59 | | | | | | 40 | |
| | | 11.60 | | | | | | (0.56 | ) | | | | | 3,246 | | | | | | 0.69 | | | | | | 0.73 | | | | | | 2.03 | | | | | | 40 | |
| | | 11.57 | | | | | | (0.29 | ) | | | | | 3,085 | | | | | | 0.34 | | | | | | 0.38 | | | | | | 2.42 | | | | | | 40 | |
| | | 11.56 | | | | | | (0.69 | ) | | | | | 2,330 | | | | | | 0.84 | | | | | | 0.88 | | | | | | 1.89 | | | | | | 40 | |
| | | 11.66 | | | | | | (2.87 | ) | | | | | 10 | | | | | | 0.19 | (f) | | | | | 0.21 | (f) | | | | | 5.04 | (f) | | | | | 40 | |
| | | 12.10 | | | | | | 2.22 | | | | | | 408,488 | | | | | | 0.60 | | | | | | 0.63 | | | | | | 1.64 | | | | | | 35 | |
| | | 11.91 | | | | | | 1.46 | | | | | | 169,745 | | | | | | 1.35 | | | | | | 1.38 | | | | | | 0.80 | | | | | | 35 | |
| | | 12.14 | | | | | | 2.62 | | | | | | 421,720 | | | | | | 0.20 | | | | | | 0.23 | | | | | | 2.11 | | | | | | 35 | |
| | | 12.07 | | | | | | 2.11 | | | | | | 3,725 | | | | | | 0.70 | | | | | | 0.73 | | | | | | 1.58 | | | | | | 35 | |
| | | 12.05 | | | | | | 2.49 | | | | | | 3,478 | | | | | | 0.35 | | | | | | 0.38 | | | | | | 2.00 | | | | | | 35 | |
| | | 12.03 | | | | | | 1.97 | | | | | | 2,438 | | | | | | 0.85 | | | | | | 0.88 | | | | | | 1.27 | | | | | | 35 | |
| | | 12.14 | | | | | | 13.10 | | | | | | 435,812 | | | | | | 0.60 | | | | | | 0.63 | | | | | | 1.74 | | | | | | 50 | |
| | | 11.99 | | | | | | 12.32 | | | | | | 196,121 | | | | | | 1.34 | | | | | | 1.38 | | | | | | 1.02 | | | | | | 50 | |
| | | 12.18 | | | | | | 13.63 | | | | | | 353,203 | | | | | | 0.20 | | | | | | 0.23 | | | | | | 2.36 | | | | | | 50 | |
| | | 12.11 | | | | | | 13.08 | | | | | | 3,917 | | | | | | 0.70 | | | | | | 0.73 | | | | | | 1.71 | | | | | | 50 | |
| | | 12.09 | | | | | | 13.36 | | | | | | 2,796 | | | | | | 0.35 | | | | | | 0.38 | | | | | | 2.46 | | | | | | 50 | |
| | | 12.08 | | | | | | 12.76 | | | | | | 3,430 | | | | | | 0.85 | | | | | | 0.88 | | | | | | 1.42 | | | | | | 50 | |
| | | 10.95 | | | | | | 12.40 | | | | | | 491,921 | | | | | | 0.59 | | | | | | 0.63 | | | | | | 1.61 | | | | | | 47 | |
| | | 10.85 | | | | | | 11.42 | | | | | | 210,201 | | | | | | 1.34 | | | | | | 1.38 | | | | | | 0.89 | | | | | | 47 | |
| | | 10.98 | | | | | | 12.69 | | | | | | 267,744 | | | | | | 0.19 | | | | | | 0.22 | | | | | | 2.21 | | | | | | 47 | |
| | | 10.92 | | | | | | 12.13 | | | | | | 3,848 | | | | | | 0.69 | | | | | | 0.73 | | | | | | 1.59 | | | | | | 47 | |
| | | 10.91 | | | | | | 12.62 | | | | | | 1,519 | | | | | | 0.34 | | | | | | 0.38 | | | | | | 1.90 | | | | | | 47 | |
| | | 10.90 | | | | | | 12.12 | | | | | | 4,068 | | | | | | 0.84 | | | | | | 0.88 | | | | | | 1.54 | | | | | | 47 | |
| | | 9.98 | | | | | | (3.46 | ) | | | | | 750,376 | | | | | | 0.59 | | | | | | 0.62 | | | | | | 1.62 | | | | | | 35 | |
| | | 9.92 | | | | | | (4.10 | ) | | | | | 250,381 | | | | | | 1.34 | | | | | | 1.37 | | | | | | 0.91 | | | | | | 35 | |
| | | 10.02 | | | | | | (3.04 | ) | | | | | 140,119 | | | | | | 0.19 | | | | | | 0.22 | | | | | | 2.12 | | | | | | 35 | |
| | | 9.97 | | | | | | (3.48 | ) | | | | | 4,073 | | | | | | 0.69 | | | | | | 0.72 | | | | | | 1.57 | | | | | | 35 | |
| | | 9.95 | | | | | | (3.18 | ) | | | | | 1,719 | | | | | | 0.34 | | | | | | 0.37 | | | | | | 3.99 | | | | | | 35 | |
| | | 9.94 | | | | | | (3.77 | ) | | | | | 4,384 | | | | | | 0.84 | | | | | | 0.87 | | | | | | 1.68 | | | | | | 35 | |
| | |
| The accompanying notes are an integral part of these financial statements. | | 53 |
GOLDMAN SACHS GROWTH STRATEGY PORTFOLIO
Financial Highlights
Selected Data for a Share Outstanding Throughout Each Period
| | | | | | | | | | | | | | | | | | | | | | |
| | | | | | From
investment operations | | | | |
| | | Year - Share Class | | Net asset value, beginning of period | | | Net investment income (loss)(a)(b) | | | Net realized and unrealized gain (loss) | | | Total from investment operations | | | Distributions to shareholders from net investment income | |
| | FOR THE SIX MONTHS ENDED JUNE 30, (Unaudited) | | | | | | | | | | | | | | | | | |
| | 2016 - A | | $ | 12.70 | | | $ | (0.01 | ) | | $ | 0.10 | | | $ | 0.09 | | | $ | — | |
| | 2016 - C | | | 12.68 | | | | (0.05 | ) | | | 0.09 | | | | 0.04 | | | | — | |
| | 2016 - Institutional | | | 12.69 | | | | 0.02 | | | | 0.09 | | | | 0.11 | | | | — | |
| | 2016 - Service | | | 12.67 | | | | (0.01 | ) | | | 0.09 | | | | 0.08 | | | | — | |
| | 2016 - IR | | | 12.52 | | | | 0.01 | | | | 0.10 | | | | 0.11 | | | | — | |
| | 2016 - R | | | 12.41 | | | | (0.02 | ) | | | 0.10 | | | | 0.08 | | | | — | |
| | 2016 - R6 | | | 12.68 | | | | 0.02 | | | | 0.10 | | | | 0.12 | | | | — | |
| | | | | | | | | | | | | | | | | | | | | | |
| | FOR THE FISCAL YEARS ENDED DECEMBER 31, | | | | | | | | | | | | | | | | | | | | |
| | 2015 - A | | | 12.91 | | | | 0.15 | | | | (0.16 | ) | | | (0.01 | ) | | | (0.20 | ) |
| | 2015 - C | | | 12.88 | | | | 0.05 | | | | (0.15 | ) | | | (0.10 | ) | | | (0.10 | ) |
| | 2015 - Institutional | | | 12.90 | | | | 0.22 | | | | (0.17 | ) | | | 0.05 | | | | (0.26 | ) |
| | 2015 - Service | | | 12.88 | | | | 0.14 | | | | (0.16 | ) | | | (0.02 | ) | | | (0.19 | ) |
| | 2015 - IR | | | 12.73 | | | | 0.19 | | | | (0.16 | ) | | | 0.03 | | | | (0.24 | ) |
| | 2015 - R | | | 12.62 | | | | 0.12 | | | | (0.16 | ) | | | (0.04 | ) | | | (0.17 | ) |
| | 2015 - R6 (Commenced July 31, 2015) | | | 13.44 | | | | 0.18 | | | | (0.68 | ) | | | (0.50 | ) | | | (0.26 | ) |
| | 2014 - A | | | 12.89 | | | | 0.19 | | | | 0.12 | | | | 0.31 | | | | (0.29 | ) |
| | 2014 - C | | | 12.85 | | | | 0.07 | | | | 0.13 | | | | 0.20 | | | | (0.17 | ) |
| | 2014 - Institutional | | | 12.88 | | | | 0.24 | | | | 0.12 | | | | 0.36 | | | | (0.34 | ) |
| | 2014 - Service | | | 12.84 | | | | 0.15 | | | | 0.15 | | | | 0.30 | | | | (0.26 | ) |
| | 2014 - IR | | | 12.72 | | | | 0.25 | | | | 0.08 | | | | 0.33 | | | | (0.32 | ) |
| | 2014 - R | | | 12.59 | | | | 0.11 | | | | 0.15 | | | | 0.26 | | | | (0.23 | ) |
| | 2013 - A | | | 11.05 | | | | 0.14 | | | | 1.88 | | | | 2.02 | | | | (0.18 | ) |
| | 2013 - C | | | 11.02 | | | | 0.05 | | | | 1.86 | | | | 1.91 | | | | (0.08 | ) |
| | 2013 - Institutional | | | 11.04 | | | | 0.21 | | | | 1.87 | | | | 2.08 | | | | (0.24 | ) |
| | 2013 - Service | | | 11.01 | | | | 0.14 | | | | 1.86 | | | | 2.00 | | | | (0.17 | ) |
| | 2013 - IR | | | 10.91 | | | | 0.26 | | | | 1.77 | | | | 2.03 | | | | (0.22 | ) |
| | 2013 - R | | | 10.80 | | | | 0.10 | | | | 1.84 | | | | 1.94 | | | | (0.15 | ) |
| | 2012 - A | | | 9.86 | | | | 0.18 | | | | 1.25 | | | | 1.43 | | | | (0.24 | ) |
| | 2012 - C | | | 9.83 | | | | 0.10 | | | | 1.25 | | | | 1.35 | | | | (0.16 | ) |
| | 2012 - Institutional | | | 9.87 | | | | 0.23 | | | | 1.24 | | | | 1.47 | | | | (0.30 | ) |
| | 2012 - Service | | | 9.83 | | | | 0.17 | | | | 1.25 | | | | 1.42 | | | | (0.24 | ) |
| | 2012 - IR | | | 9.75 | | | | 0.22 | | | | 1.22 | | | | 1.44 | | | | (0.28 | ) |
| | 2012 - R | | | 9.65 | | | | 0.17 | | | | 1.21 | | | | 1.38 | | | | (0.23 | ) |
| | 2011 - A | | | 10.75 | | | | 0.19 | | | | (0.84 | ) | | | (0.65 | ) | | | (0.24 | ) |
| | 2011 - C | | | 10.70 | | | | 0.11 | | | | (0.83 | ) | | | (0.72 | ) | | | (0.15 | ) |
| | 2011 - Institutional | | | 10.77 | | | | 0.22 | | | | (0.83 | ) | | | (0.61 | ) | | | (0.29 | ) |
| | 2011 - Service | | | 10.72 | | | | 0.18 | | | | (0.84 | ) | | | (0.66 | ) | | | (0.23 | ) |
| | 2011 - IR | | | 10.65 | | | | 0.30 | | | | (0.92 | ) | | | (0.62 | ) | | | (0.28 | ) |
| | 2011 - R | | | 10.55 | | | | 0.20 | | | | (0.87 | ) | | | (0.67 | ) | | | (0.23 | ) |
| | (a) | | Calculated based on the average shares outstanding methodology. |
| | (b) | | Recognition of net investment income by the Portfolio is affected by the timing of declaration of dividends by the Underlying Funds in which the Portfolio invests. |
| | (c) | | Assumes investment at the NAV at the beginning of the period, reinvestment of all dividends and distributions, a complete redemption of the investment at the NAV at the end of the period and no sales or redemption charges. Total returns would be reduced if a sales or redemption charge was taken into account. Returns do not reflect the impact of taxes to shareholders relating to Portfolio distributions or the redemption of Portfolio shares. Total returns for periods less than one full year are not annualized. |
| | (d) | | Expense ratios exclude the expenses of the Underlying Funds in which the Portfolio invests. |
| | (e) | | The Portfolio’s portfolio turnover rate is calculated in accordance with regulatory requirements, without regard to transactions involving short term investments. If such transactions were included, the Portfolio’s portfolio turnover rate may be higher. |
| | |
| 54 | | The accompanying notes are an integral part of these financial statements. |
GOLDMAN SACHS GROWTH STRATEGY PORTFOLIO
| | | | | | | | | | | | | | | | | | | | | | | | | | | | | | | | | | | | | | | | |
| | | | | | | | | | | | | | | | | | | | | | | | | | | | | | | | | | |
| | | Net asset value, end of period | | | | | Total return(c) | | | | | Net assets, end of period (in 000s) | | | | | Ratio of net expenses to average net assets(d) | | | | | Ratio of total expenses to average net assets(d) | | | | | Ratio of net investment income (loss) to average net assets(b) | | | | | Portfolio turnover rate(e) | |
| | | | | | | | | | | | | | | | | | | | | | | | | | | | | | | | | | | | | | | | |
| | $ | 12.79 | | | | | | 0.71 | % | | | | $ | 316,058 | | | | | | 0.59 | %(f) | | | | | 0.64 | %(f) | | | | | (0.08 | )%(f) | | | | | 34 | % |
| | | 12.72 | | | | | | 0.32 | | | | | | 152,260 | | | | | | 1.34 | (f) | | | | | 1.39 | (f) | | | | | (0.83 | )(f) | | | | | 34 | |
| | | 12.80 | | | | | | 0.87 | | | | | | 295,585 | | | | | | 0.19 | (f) | | | | | 0.24 | (f) | | | | | 0.32 | (f) | | | | | 34 | |
| | | 12.75 | | | | | | 0.63 | | | | | | 2,162 | | | | | | 0.69 | (f) | | | | | 0.74 | (f) | | | | | (0.18 | )(f) | | | | | 34 | |
| | | 12.63 | | | | | | 0.88 | | | | | | 3,883 | | | | | | 0.34 | (f) | | | | | 0.39 | (f) | | | | | 0.16 | (f) | | | | | 34 | |
| | | 12.49 | | | | | | 0.64 | | | | | | 2,686 | | | | | | 0.84 | (f) | | | | | 0.89 | (f) | | | | | (0.32 | )(f) | | | | | 34 | |
| | | 12.80 | | | | | | 0.87 | | | | | | 10 | | | | | | 0.19 | (f) | | | | | 0.24 | (f) | | | | | 0.33 | (f) | | | | | 34 | |
| | | | | | | | | | | | | | | | | | | | | | | | | | | | | | | | | | | | | | | | |
| | | | | | | | | | | | | | | | | | | | | | | | | | | | | | | | | | | | | | | | |
| | | 12.70 | | | | | | (0.08 | ) | | | | | 336,880 | | | | | | 0.59 | | | | | | 0.64 | | | | | | 1.15 | | | | | | 38 | |
| | | 12.68 | | | | | | (0.82 | ) | | | | | 161,733 | | | | | | 1.34 | | | | | | 1.39 | | | | | | 0.39 | | | | | | 38 | |
| | | 12.69 | | | | | | 0.35 | | | | | | 303,237 | | | | | | 0.19 | | | | | | 0.23 | | | | | | 1.68 | | | | | | 38 | |
| | | 12.67 | | | | | | (0.17 | ) | | | | | 2,135 | | | | | | 0.69 | | | | | | 0.74 | | | | | | 1.09 | | | | | | 38 | |
| | | 12.52 | | | | | | 0.20 | | | | | | 4,114 | | | | | | 0.34 | | | | | | 0.39 | | | | | | 1.50 | | | | | | 38 | |
| | | 12.41 | | | | | | (0.31 | ) | | | | | 2,323 | | | | | | 0.84 | | | | | | 0.89 | | | | | | 0.95 | | | | | | 38 | |
| | | 12.68 | | | | | | (3.66 | ) | | | | | 10 | | | | | | 0.21 | (f) | | | | | 0.25 | (f) | | | | | 3.22 | (f) | | | | | 38 | |
| | | 12.91 | | | | | | 2.36 | | | | | | 385,409 | | | | | | 0.60 | | | | | | 0.64 | | | | | | 1.46 | | | | | | 26 | |
| | | 12.88 | | | | | | 1.59 | | | | | | 190,125 | | | | | | 1.35 | | | | | | 1.39 | | | | | | 0.57 | | | | | | 26 | |
| | | 12.90 | | | | | | 2.76 | | | | | | 267,677 | | | | | | 0.20 | | | | | | 0.24 | | | | | | 1.84 | | | | | | 26 | |
| | | 12.88 | | | | | | 2.32 | | | | | | 2,509 | | | | | | 0.70 | | | | | | 0.74 | | | | | | 1.11 | | | | | | 26 | |
| | | 12.73 | | | | | | 2.58 | | | | | | 4,496 | | | | | | 0.35 | | | | | | 0.39 | | | | | | 1.92 | | | | | | 26 | |
| | | 12.62 | | | | | | 2.06 | | | | | | 2,461 | | | | | | 0.85 | | | | | | 0.89 | | | | | | 0.84 | | | | | | 26 | |
| | | 12.89 | | | | | | 18.31 | | | | | | 389,445 | | | | | | 0.60 | | | | | | 0.64 | | | | | | 1.19 | | | | | | 32 | |
| | | 12.85 | | | | | | 17.37 | | | | | | 218,776 | | | | | | 1.35 | | | | | | 1.39 | | | | | | 0.42 | | | | | | 32 | |
| | | 12.88 | | | | | | 18.81 | | | | | | 246,229 | | | | | | 0.20 | | | | | | 0.24 | | | | | | 1.77 | | | | | | 32 | |
| | | 12.84 | | | | | | 18.19 | | | | | | 3,419 | | | | | | 0.70 | | | | | | 0.74 | | | | | | 1.14 | | | | | | 32 | |
| | | 12.72 | | | | | | 18.65 | | | | | | 3,598 | | | | | | 0.35 | | | | | | 0.39 | | | | | | 2.17 | | | | | | 32 | |
| | | 12.59 | | | | | | 17.93 | | | | | | 4,208 | | | | | | 0.85 | | | | | | 0.89 | | | | | | 0.84 | | | | | | 32 | |
| | | 11.05 | | | | | | 14.49 | | | | | | 398,487 | | | | | | 0.59 | | | | | | 0.64 | | | | | | 1.65 | | | | | | 47 | |
| | | 11.02 | | | | | | 13.72 | | | | | | 224,471 | | | | | | 1.34 | | | | | | 1.39 | | | | | | 0.92 | | | | | | 47 | |
| | | 11.04 | | | | | | 14.89 | | | | | | 173,180 | | | | | | 0.19 | | | | | | 0.23 | | | | | | 2.10 | | | | | | 47 | |
| | | 11.01 | | | | | | 14.42 | | | | | | 3,185 | | | | | | 0.69 | | | | | | 0.74 | | | | | | 1.60 | | | | | | 47 | |
| | | 10.91 | | | | | | 14.79 | | | | | | 1,483 | | | | | | 0.34 | | | | | | 0.38 | | | | | | 2.05 | | | | | | 47 | |
| | | 10.80 | | | | | | 14.31 | | | | | | 4,885 | | | | | | 0.84 | | | | | | 0.88 | | | | | | 1.64 | | | | | | 47 | |
| | | 9.86 | | | | | | (6.08 | ) | | | | | 562,262 | | | | | | 0.59 | | | | | | 0.63 | | | | | | 1.73 | | | | | | 35 | |
| | | 9.83 | | | | | | (6.77 | ) | | | | | 257,778 | | | | | | 1.34 | | | | | | 1.38 | | | | | | 0.99 | | | | | | 35 | |
| | | 9.87 | | | | | | (5.69 | ) | | | | | 92,807 | | | | | | 0.19 | | | | | | 0.23 | | | | | | 2.08 | | | | | | 35 | |
| | | 9.83 | | | | | | (6.18 | ) | | | | | 3,644 | | | | | | 0.69 | | | | | | 0.73 | | | | | | 1.65 | | | | | | 35 | |
| | | 9.75 | | | | | | (5.85 | ) | | | | | 1,376 | | | | | | 0.34 | | | | | | 0.38 | | | | | | 2.90 | | | | | | 35 | |
| | | 9.65 | | | | | | (6.39 | ) | | | | | 4,413 | | | | | | 0.84 | | | | | | 0.88 | | | | | | 1.88 | | | | | | 35 | |
| | |
| The accompanying notes are an integral part of these financial statements. | | 55 |
GOLDMAN SACHS SATELLITE STRATEGIES PORTFOLIO
Financial Highlights
Selected Data for a Share Outstanding Throughout Each Period
| | | | | | | | | | | | | | | | | | | | | | | | | | | | | | |
| | | | | | From
investment operations | | | Distributions
to shareholders | |
| | | Year - Share Class | | Net asset value, beginning of period | | | Net investment income(a)(b) | | | Net realized and unrealized gain (loss) | | | Total from investment operations | | | From net investment income | | | From net realized gains | | | Total distributions | |
| | FOR THE SIX MONTHS ENDED JUNE 30, (Unaudited) | | | | | | | | | | | | | | | | | |
| | 2016 - A | | $ | 7.45 | | | $ | 0.09 | | | $ | 0.28 | | | $ | 0.37 | | | $ | (0.09 | ) | | $ | — | | | $ | (0.09 | ) |
| | 2016 - C | | | 7.41 | | | | 0.06 | | | | 0.28 | | | | 0.34 | | | | (0.06 | ) | | | — | | | | (0.06 | ) |
| | 2016 - Institutional | | | 7.43 | | | | 0.10 | | | | 0.30 | | | | 0.40 | | | | (0.11 | ) | | | — | | | | (0.11 | ) |
| | 2016 - Service | | | 7.43 | | | | 0.08 | | | | 0.29 | | | | 0.37 | | | | (0.08 | ) | | | — | | | | (0.08 | ) |
| | 2016 - IR | | | 7.43 | | | | 0.10 | | | | 0.29 | | | | 0.39 | | | | (0.10 | ) | | | — | | | | (0.10 | ) |
| | 2016 - R | | | 7.42 | | | | 0.08 | | | | 0.28 | | | | 0.36 | | | | (0.08 | ) | | | — | | | | (0.08 | ) |
| | 2016 - R6 | | | 7.44 | | | | 0.13 | | | | 0.26 | | | | 0.39 | | | | (0.11 | ) | | | — | | | | (0.11 | ) |
| | | | | | | | | | | | | | | | | | | | | | | | | | | | | | |
| | FOR THE FISCAL YEARS ENDED DECEMBER 31, | | | | | | | | | |
| | 2015 - A | | | 7.89 | | | | 0.19 | | | | (0.44 | ) | | | (0.25 | ) | | | (0.19 | ) | | | — | | | | (0.19 | ) |
| | 2015 - C | | | 7.84 | | | | 0.13 | | | | (0.43 | ) | | | (0.30 | ) | | | (0.13 | ) | | | — | | | | (0.13 | ) |
| | 2015 - Institutional | | | 7.87 | | | | 0.23 | | | | (0.45 | ) | | | (0.22 | ) | | | (0.22 | ) | | | — | | | | (0.22 | ) |
| | 2015 - Service | | | 7.84 | | | | 0.14 | | | | (0.40 | ) | | | (0.26 | ) | | | (0.15 | ) | | | — | | | | (0.15 | ) |
| | 2015 - IR | | | 7.87 | | | | 0.21 | | | | (0.44 | ) | | | (0.23 | ) | | | (0.21 | ) | | | — | | | | (0.21 | ) |
| | 2015 - R | | | 7.86 | | | | 0.18 | | | | (0.45 | ) | | | (0.27 | ) | | | (0.17 | ) | | | — | | | | (0.17 | ) |
| | 2015 - R6 (Commenced July 31, 2015) | | | 7.91 | | | | 0.11 | | | | (0.46 | ) | | | (0.35 | ) | | | (0.12 | ) | | | — | | | | (0.12 | ) |
| | 2014 - A | | | 8.16 | | | | 0.21 | | | | (0.23 | ) | | | (0.02 | ) | | | (0.21 | ) | | | (0.04 | ) | | | (0.25 | ) |
| | 2014 - C | | | 8.12 | | | | 0.15 | | | | (0.24 | ) | | | (0.09 | ) | | | (0.15 | ) | | | (0.04 | ) | | | (0.19 | ) |
| | 2014 - Institutional | | | 8.15 | | | | 0.25 | | | | (0.24 | ) | | | 0.01 | | | | (0.25 | ) | | | (0.04 | ) | | | (0.29 | ) |
| | 2014 - Service | | | 8.12 | | | | 0.19 | | | | (0.22 | ) | | | (0.03 | ) | | | (0.21 | ) | | | (0.04 | ) | | | (0.25 | ) |
| | 2014 - IR | | | 8.15 | | | | 0.23 | | | | (0.24 | ) | | | (0.01 | ) | | | (0.23 | ) | | | (0.04 | ) | | | (0.27 | ) |
| | 2014 - R | | | 8.13 | | | | 0.18 | | | | (0.22 | ) | | | (0.04 | ) | | | (0.19 | ) | | | (0.04 | ) | | | (0.23 | ) |
| | 2013 - A | | | 8.22 | | | | 0.25 | | | | (0.04 | ) | | | 0.21 | | | | (0.27 | ) | | | — | | | | (0.27 | ) |
| | 2013 - C | | | 8.18 | | | | 0.19 | | | | (0.04 | ) | | | 0.15 | | | | (0.21 | ) | | | — | | | | (0.21 | ) |
| | 2013 - Institutional | | | 8.21 | | | | 0.29 | | | | (0.04 | ) | | | 0.25 | | | | (0.31 | ) | | | — | | | | (0.31 | ) |
| | 2013 - Service | | | 8.19 | | | | 0.24 | | | | (0.04 | ) | | | 0.20 | | | | (0.27 | ) | | | — | | | | (0.27 | ) |
| | 2013 - IR | | | 8.21 | | | | 0.28 | | | | (0.04 | ) | | | 0.24 | | | | (0.30 | ) | | | — | | | | (0.30 | ) |
| | 2013 - R | | | 8.19 | | | | 0.24 | | | | (0.04 | ) | | | 0.20 | | | | (0.26 | ) | | | — | | | | (0.26 | ) |
| | 2012 - A | | | 7.39 | | | | 0.33 | | | | 0.86 | | | | 1.19 | | | | (0.34 | ) | | | (0.02 | ) | | | (0.36 | ) |
| | 2012 - C | | | 7.36 | | | | 0.26 | | | | 0.86 | | | | 1.12 | | | | (0.28 | ) | | | (0.02 | ) | | | (0.30 | ) |
| | 2012 - Institutional | | | 7.38 | | | | 0.36 | | | | 0.86 | | | | 1.22 | | | | (0.37 | ) | | | (0.02 | ) | | | (0.39 | ) |
| | 2012 - Service | | | 7.36 | | | | 0.32 | | | | 0.87 | | | | 1.19 | | | | (0.34 | ) | | | (0.02 | ) | | | (0.36 | ) |
| | 2012 - IR | | | 7.38 | | | | 0.35 | | | | 0.86 | | | | 1.21 | | | | (0.36 | ) | | | (0.02 | ) | | | (0.38 | ) |
| | 2012 - R | | | 7.37 | | | | 0.31 | | | | 0.86 | | | | 1.17 | | | | (0.33 | ) | | | (0.02 | ) | | | (0.35 | ) |
| | 2011 - A | | | 7.95 | | | | 0.28 | | | | (0.53 | ) | | | (0.25 | ) | | | (0.28 | ) | | | (0.03 | ) | | | (0.31 | ) |
| | 2011 - C | | | 7.92 | | | | 0.23 | | | | (0.53 | ) | | | (0.30 | ) | | | (0.23 | ) | | | (0.03 | ) | | | (0.26 | ) |
| | 2011 - Institutional | | | 7.94 | | | | 0.32 | | | | (0.53 | ) | | | (0.21 | ) | | | (0.32 | ) | | | (0.03 | ) | | | (0.35 | ) |
| | 2011 - Service | | | 7.92 | | | | 0.28 | | | | (0.53 | ) | | | (0.25 | ) | | | (0.28 | ) | | | (0.03 | ) | | | (0.31 | ) |
| | 2011 - IR | | | 7.94 | | | | 0.32 | | | | (0.54 | ) | | | (0.22 | ) | | | (0.31 | ) | | | (0.03 | ) | | | (0.34 | ) |
| | 2011 - R | | | 7.93 | | | | 0.26 | | | | (0.52 | ) | | | (0.26 | ) | | | (0.27 | ) | | | (0.03 | ) | | | (0.30 | ) |
| | (a) | | Calculated based on the average shares outstanding methodology. |
| | (b) | | Recognition of net investment income by the Portfolio is affected by the timing of declaration of dividends by the Underlying Funds in which the Portfolio invests. |
| | (c) | | Assumes investment at the NAV at the beginning of the period, reinvestment of all dividends and distributions, a complete redemption of the investment at the NAV at the end of the period and no sales or redemption charges. Total returns would be reduced if a sales or redemption charge was taken into account. Returns do not reflect the impact of taxes to shareholders relating to Portfolio distributions or the redemption of Portfolio shares. Total returns for periods less than one full year are not annualized. |
| | (d) | | Expense ratios exclude the expenses of the Underlying Funds in which the Portfolio invests. |
| | (e) | | The Portfolio’s portfolio turnover rate is calculated in accordance with regulatory requirements, without regard to transactions involving short term investments. If such transactions were included, the Portfolio’s portfolio turnover rate may be higher. |
| | (g) | | Amount is less than 0.005% per share. |
| | |
| 56 | | The accompanying notes are an integral part of these financial statements. |
GOLDMAN SACHS SATELLITE STRATEGIES PORTFOLIO
| | | | | | | | | | | | | | | | | | | | | | | | | | | | | | | | | | | | | | | | |
| | | | | | | | | | | | | | | | | | | | | | | | | | | | | | | | | | |
| | | Net asset value, end of period | | | | | Total return(c) | | | | | Net assets, end of period (in 000s) | | | | | Ratio of net expenses to average net assets(d) | | | | | Ratio of total expenses to average net assets(d) | | | | | Ratio of net investment income to average net assets(b) | | | | | Portfolio turnover rate(e) | |
| | | | | | | | | | | | | | | | | | | | | | | | | | | | | | | | | | | | | | | | |
| | $ | 7.73 | | | | | | 4.99 | % | | | | $ | 105,810 | | | | | | 0.57 | %(f) | | | | | 0.61 | %(f) | | | | | 2.41 | %(f) | | | | | 10 | % |
| | | 7.69 | | | | | | 4.65 | | | | | | 61,842 | | | | | | 1.32 | (f) | | | | | 1.36 | (f) | | | | | 1.67 | (f) | | | | | 10 | |
| | | 7.72 | | | | | | 5.34 | | | | | | 576,763 | | | | | | 0.17 | (f) | | | | | 0.21 | (f) | | | | | 2.81 | (f) | | | | | 10 | |
| | | 7.72 | | | | | | 5.04 | | | | | | 476 | | | | | | 0.67 | (f) | | | | | 0.71 | (f) | | | | | 2.16 | (f) | | | | | 10 | |
| | | 7.72 | | | | | | 5.27 | | | | | | 64,539 | | | | | | 0.32 | (f) | | | | | 0.36 | (f) | | | | | 2.69 | (f) | | | | | 10 | |
| | | 7.70 | | | | | | 4.90 | | | | | | 2,964 | | | | | | 0.82 | (f) | | | | | 0.86 | (f) | | | | | 2.18 | (f) | | | | | 10 | |
| | | 7.72 | | | | | | 5.21 | | | | | | 34 | | | | | | 0.16 | (f) | | | | | 0.20 | (f) | | | | | 3.57 | (f) | | | | | 10 | |
| | | | | | | | | | | | | | | | | | | | | | | | | | | | | | | | | | | | | | | | |
| | | | | | | | | | | | | | | | | | | | | | | | | | | | | | | | | | | | | | | | |
| | | 7.45 | | | | | | (3.24 | ) | | | | | 118,345 | | | | | | 0.57 | | | | | | 0.60 | | | | | | 2.43 | | | | | | 22 | |
| | | 7.41 | | | | | | (3.89 | ) | | | | | 68,765 | | | | | | 1.32 | | | | | | 1.35 | | | | | | 1.66 | | | | | | 22 | |
| | | 7.43 | | | | | | (2.84 | ) | | | | | 655,268 | | | | | | 0.17 | | | | | | 0.20 | | | | | | 2.85 | | | | | | 22 | |
| | | 7.43 | | | | | | (3.32 | ) | | | | | 988 | | | | | | 0.67 | | | | | | 0.70 | | | | | | 1.81 | | | | | | 22 | |
| | | 7.43 | | | | | | (2.99 | ) | | | | | 67,547 | | | | | | 0.32 | | | | | | 0.35 | | | | | | 2.69 | | | | | | 22 | |
| | | 7.42 | | | | | | (3.49 | ) | | | | | 3,119 | | | | | | 0.82 | | | | | | 0.85 | | | | | | 2.24 | | | | | | 22 | |
| | | 7.44 | | | | | | (4.43 | ) | | | | | 10 | | | | | | 0.15 | (f) | | | | | 0.18 | (f) | | | | | 3.58 | (f) | | | | | 22 | |
| | | 7.89 | | | | | | (0.28 | ) | | | | | 177,204 | | | | | | 0.58 | | | | | | 0.60 | | | | | | 2.50 | | | | | | 20 | |
| | | 7.84 | | | | | | (1.16 | ) | | | | | 102,605 | | | | | | 1.33 | | | | | | 1.35 | | | | | | 1.79 | | | | | | 20 | |
| | | 7.87 | | | | | | — | (g) | | | | | 833,657 | | | | | | 0.18 | | | | | | 0.20 | | | | | | 2.97 | | | | | | 20 | |
| | | 7.84 | | | | | | (0.39 | ) | | | | | 14,085 | | | | | | 0.68 | | | | | | 0.70 | | | | | | 2.30 | | | | | | 20 | |
| | | 7.87 | | | | | | (0.15 | ) | | | | | 86,018 | | | | | | 0.33 | | | | | | 0.35 | | | | | | 2.78 | | | | | | 20 | |
| | | 7.86 | | | | | | (0.54 | ) | | | | | 3,495 | | | | | | 0.83 | | | | | | 0.85 | | | | | | 2.23 | | | | | | 20 | |
| | | 8.16 | | | | | | 2.67 | | | | | | 231,868 | | | | | | 0.58 | | | | | | 0.60 | | | | | | 3.08 | | | | | | 36 | |
| | | 8.12 | | | | | | 1.91 | | | | | | 118,153 | | | | | | 1.33 | | | | | | 1.35 | | | | | | 2.35 | | | | | | 36 | |
| | | 8.15 | | | | | | 3.09 | | | | | | 853,543 | | | | | | 0.18 | | | | | | 0.20 | | | | | | 3.53 | | | | | | 36 | |
| | | 8.12 | | | | | | 2.45 | | | | | | 28,483 | | | | | | 0.68 | | | | | | 0.70 | | | | | | 2.96 | | | | | | 36 | |
| | | 8.15 | | | | | | 2.94 | | | | | | 91,493 | | | | | | 0.33 | | | | | | 0.35 | | | | | | 3.39 | | | | | | 36 | |
| | | 8.13 | | | | | | 2.44 | | | | | | 3,765 | | | | | | 0.83 | | | | | | 0.85 | | | | | | 2.91 | | | | | | 36 | |
| | | 8.22 | | | | | | 16.30 | | | | | | 250,407 | | | | | | 0.57 | | | | | | 0.60 | | | | | | 4.13 | | | | | | 14 | |
| | | 8.18 | | | | | | 15.37 | | | | | | 130,446 | | | | | | 1.32 | | | | | | 1.35 | | | | | | 3.32 | | | | | | 14 | |
| | | 8.21 | | | | | | 16.77 | | | | | | 803,541 | | | | | | 0.17 | | | | | | 0.20 | | | | | | 4.56 | | | | | | 14 | |
| | | 8.19 | | | | | | 16.26 | | | | | | 37,068 | | | | | | 0.67 | | | | | | 0.70 | | | | | | 4.04 | | | | | | 14 | |
| | | 8.21 | | | | | | 16.60 | | | | | | 74,216 | | | | | | 0.32 | | | | | | 0.35 | | | | | | 4.37 | | | | | | 14 | |
| | | 8.19 | | | | | | 15.96 | | | | | | 2,804 | | | | | | 0.82 | | | | | | 0.85 | | | | | | 3.86 | | | | | | 14 | |
| | | 7.39 | | | | | | (3.17 | ) | | | | | 201,416 | | | | | | 0.57 | | | | | | 0.61 | | | | | | 3.59 | | | | | | 35 | |
| | | 7.36 | | | | | | (3.88 | ) | | | | | 117,790 | | | | | | 1.32 | | | | | | 1.36 | | | | | | 2.88 | | | | | | 35 | |
| | | 7.38 | | | | | | (2.77 | ) | | | | | 590,521 | | | | | | 0.17 | | | | | | 0.21 | | | | | | 4.07 | | | | | | 35 | |
| | | 7.36 | | | | | | (3.26 | ) | | | | | 28,306 | | | | | | 0.67 | | | | | | 0.71 | | | | | | 3.54 | | | | | | 35 | |
| | | 7.38 | | | | | | (2.91 | ) | | | | | 58,940 | | | | | | 0.32 | | | | | | 0.36 | | | | | | 4.12 | | | | | | 35 | |
| | | 7.37 | | | | | | (3.42 | ) | | | | | 846 | | | | | | 0.82 | | | | | | 0.86 | | | | | | 3.33 | | | | | | 35 | |
| | |
| The accompanying notes are an integral part of these financial statements. | | 57 |
GOLDMAN SACHS FUND OF FUNDS PORTFOLIOS
Notes to Financial Statements
June 30, 2016 (Unaudited)
Goldman Sachs Trust (the “Trust”) is a Delaware statutory trust registered under the Investment Company Act of 1940, as amended (the “Act”), as an open-end management investment company. The following table lists those series of the Trust that are included in this report (collectively, the “Portfolios” or individually a “Portfolio”), along with their corresponding share classes and respective diversification status under the Act:
| | | | |
| Portfolio | | Share Classes Offered | | Diversified/
Non-diversified |
All Portfolios | | A, C, Institutional, Service, IR, R, R6 | | Diversified |
Class A Shares are sold with a front-end sales charge of up to 5.50%. Class C Shares are sold with a contingent deferred sales charge (“CDSC”) of 1.00%, which is imposed on redemptions made within 12 months of purchase. Institutional, Service, Class IR, Class R and Class R6 Shares are not subject to a sales charge.
Goldman Sachs Asset Management, L.P. (“GSAM”), an affiliate of Goldman, Sachs & Co. (“Goldman Sachs”), serves as investment adviser to the Portfolios pursuant to a management agreement (the “Agreement”) with the Trust.
The Portfolios are expected to invest primarily in a combination of domestic and international equity and fixed income underlying funds (“Underlying Funds”) which are registered under the Act, for which GSAM or Goldman Sachs Asset Management International (“GSAMI”), also an affiliate of Goldman Sachs, act as investment advisers.
|
| 2. SIGNIFICANT ACCOUNTING POLICIES |
The financial statements have been prepared in accordance with accounting principles generally accepted in the United States of America (“GAAP”) and require management to make estimates and assumptions that may affect the reported amounts and disclosures. Actual results may differ from those estimates and assumptions.
A. Investment Valuation — The valuation policy of the Portfolios and Underlying Funds is to value investments at fair value
B. Investment Income and Investments — Investment income includes interest income, dividend income, net of any foreign withholding taxes, less any amounts reclaimable, and securities lending income. Interest income is accrued daily and adjusted for amortization of premiums and accretion of discounts. Dividend income is recognized on ex-dividend date or, for certain foreign securities, as soon as such information is obtained subsequent to the ex-dividend date. Investment transactions are reflected on trade date. Realized gains and losses are calculated using identified cost. Investment transactions are recorded on the following business day for daily net asset value (“NAV”) calculations. Any foreign capital gains tax is accrued daily based upon net unrealized gains, and is payable upon sale of such investments. Income distributions are recognized as capital gains or income in the financial statements in accordance with the character that is distributed.
C. Class Allocations and Expenses — Investment income, realized and unrealized gain (loss), and non-class specific expenses of each Portfolio are allocated daily based upon the proportion of net assets of each class. Non-class specific expenses directly incurred by a Portfolio are charged to that Portfolio, while such expenses incurred by the Trust are allocated across the applicable Portfolios on a straight-line and/or pro-rata basis depending upon the nature of the expenses. Class specific expenses, where applicable, are borne by the respective share classes and include Distribution and Service, Transfer Agency and Service and Shareholder Administration fees.
Expenses included in the accompanying financial statements reflect the expenses of each Portfolio and do not include any expenses associated with the Underlying Funds. Because the Underlying Funds have varied expense and fee levels and the Portfolios may own different proportions of the Underlying Funds at different times, the amount of fees and expenses incurred indirectly by each Portfolio will vary.
D. Federal Taxes and Distributions to Shareholders — It is each Portfolio’s policy to comply with the requirements of the Internal Revenue Code of 1986, as amended (the “Code”), applicable to regulated investment companies (mutual funds) and to distribute each year substantially all of its investment company taxable income and capital gains to its shareholders. Accordingly,
58
GOLDMAN SACHS FUND OF FUNDS PORTFOLIOS
|
| 2. SIGNIFICANT ACCOUNTING POLICIES (continued) |
the Portfolios are not required to make any provisions for the payment of federal income tax. Distributions to shareholders are recorded on the ex-dividend date. Income and capital gains distributions, if any, are declared and paid according to the following schedule:
| | | | | | |
| Portfolio | | | | Income Distributions
Declared/Paid | | Capital Gains Distributions
Declared/Paid |
Balanced Strategy, Growth and Income Strategy and Satellite Strategies | | | | Quarterly | | Annually |
Equity Growth Strategy and Growth Strategy | | | | Annually | | Annually |
Net capital losses are carried forward to future fiscal years and may be used to the extent allowed by the Code to offset any future capital gains. Utilization of capital loss carryforwards will reduce the requirement of future capital gains distributions.
Under the Regulated Investment Company Modernization Act of 2010, the Portfolios are permitted to carry forward capital losses incurred in taxable years beginning after December 22, 2010 for an unlimited period. However, any losses incurred during those future taxable years will be required to be utilized prior to the losses incurred in pre-enactment taxable years. As a result of this ordering rule, pre-enactment capital loss carryforwards may be more likely to expire unused. Additionally, post-enactment capital losses that are carried forward will retain their character as either short-term or long term capital losses rather than being considered all short-term as under previous law.
The characterization of distributions to shareholders for financial reporting purposes is determined in accordance with federal income tax rules, which may differ from GAAP. The source of each Portfolio’s distributions may be shown in the accompanying financial statements as either from net investment income, net realized gain or capital. Certain components of the Portfolios’ net assets on the Statements of Assets and Liabilities reflect permanent GAAP/tax differences based on the appropriate tax character.
| | |
| 3. INVESTMENTS AND FAIR VALUE MEASUREMENTS | | |
The fair value of a financial instrument is the amount that would be received to sell an asset or paid to transfer a liability in an orderly transaction between market participants at the measurement date (i.e., the exit price). GAAP establishes a fair value hierarchy that prioritizes the inputs to valuation techniques used to measure fair value. The hierarchy gives the highest priority to unadjusted quoted prices in active markets for identical assets or liabilities (Level 1 measurements) and the lowest priority to unobservable inputs (Level 3 measurements). The levels used for classifying investments are not necessarily an indication of the risk associated with investing in these investments. The three levels of the fair value hierarchy are described below:
Level 1 — Unadjusted quoted prices in active markets that are accessible at the measurement date for identical, unrestricted assets or liabilities;
Level 2 — Quoted prices in markets that are not active or financial instruments for which significant inputs are observable (including, but not limited to, quoted prices for similar investments, interest rates, foreign exchange rates, volatility and credit spreads), either directly or indirectly;
Level 3 — Prices or valuations that require significant unobservable inputs (including GSAM’s assumptions in determining fair value measurement).
Changes in valuation techniques may result in transfers into or out of an assigned level within the hierarchy. In accordance with the Portfolios’ policy, transfers between different levels of the fair value hierarchy resulting from such changes are deemed to have occurred as of the beginning of the reporting period.
The Board of Trustees ( “Trustees”) has approved Valuation Procedures that govern the valuation of the portfolio investments held by the Portfolios, including investments for which market quotations are not readily available. The Trustees have delegated to GSAM day-to-day responsibility for implementing and maintaining internal controls and procedures related to the valuation of the Portfolios’ portfolio investments. To assess the continuing appropriateness of pricing sources and methodologies, GSAM regularly
59
GOLDMAN SACHS FUND OF FUNDS PORTFOLIOS
Notes to Financial Statements (continued)
June 30, 2016 (Unaudited)
|
| 3. INVESTMENTS AND FAIR VALUE MEASUREMENTS (continued) |
performs price verification procedures and issues challenges as necessary to third party pricing vendors or brokers, and any differences are reviewed in accordance with the Valuation Procedures.
A. Level 1 and Level 2 Fair Value Investments — The valuation techniques and significant inputs used in determining the fair values for investments classified as Level 1 and Level 2 are as follows:
Underlying Funds — Investments in the Underlying Funds are valued at the NAV per share of the Institutional Share class of each Underlying Fund on the day of valuation. Because each Portfolio invests primarily in other mutual funds that fluctuate in value, the Portfolios’ shares will correspondingly fluctuate in value. These investments are generally classified as Level 1 of the fair value hierarchy. For information regarding an Underlying Fund’s accounting policies and investment holdings, please see the Underlying Fund’s shareholder report.
Short Term Investments — Short-term investments having a maturity of 60 days or less are generally valued at amortized cost which approximates fair market value. These investments are classified as Level 2 of the fair value hierarchy.
Repurchase Agreements — Repurchase agreements involve the purchase of securities subject to the seller’s agreement to repurchase the securities at a mutually agreed upon date and price, under the terms of a Master Repurchase Agreement (“MRA”). During the term of a repurchase agreement, the value of the underlying securities held as collateral on behalf of a Portfolio, including accrued interest, is required to exceed the value of the repurchase agreement, including accrued interest. The gross value of repurchase agreements is included in the Statements of Assets and Liabilities for financial reporting purposes. The underlying securities for all repurchase agreements are held at the Portfolios’ custodian or designated sub-custodians under tri-party repurchase agreements.
An MRA governs transactions between a Portfolio and select counterparties. An MRA contains provisions for, among other things, initiation of the transaction, income payments, events of default and maintenance of securities for repurchase agreements. An MRA also permits offsetting with collateral to create one single net payment in the event of default or similar events, including the bankruptcy or insolvency of a counterparty.
If the seller defaults, a Portfolio could suffer a loss to the extent that the proceeds from the sale of the underlying securities and other collateral held by the Portfolio are less than the repurchase price and the Portfolio’s costs associated with delay and enforcement of the repurchase agreement. In addition, in the event of default or insolvency of the seller, a court could determine that a Portfolio’s interest in the collateral is not enforceable, resulting in additional losses to the Portfolio.
Pursuant to exemptive relief granted by the Securities and Exchange Commission (“SEC”) and terms and conditions contained therein, the Portfolios, together with other funds of the Trust and registered investment companies having management agreements with GSAM or its affiliates, may transfer uninvested cash into joint accounts, the daily aggregate balance of which is invested in one or more repurchase agreements. Under these joint accounts, the Portfolios maintain pro-rata credit exposure to the underlying repurchase agreements’ counterparties. With the exception of certain transaction fees, the Portfolios are not subject to any expenses in relation to these investments.
B. Level 3 Fair Value Investments — To the extent that significant inputs to valuation models and other alternative pricing sources are unobservable, or if quotations are not readily available, or if GSAM believes that such quotations do not accurately reflect fair value, the fair value of the Portfolios’ investments may be determined under Valuation Procedures approved by the Trustees. GSAM, consistent with its procedures and applicable regulatory guidance, may make an adjustment to the most recent valuation prices of either domestic or foreign securities in light of significant events to reflect what it believes to be the fair value of the securities at the time of determining a Portfolio’s NAV. Significant events which could affect a large number of securities in a particular market may include, but are not limited to: significant fluctuations in U.S. or foreign markets; market dislocations; market disruptions; or unscheduled market closings. Significant events which could also affect a single issuer may include, but are not limited to: corporate actions such as reorganizations, mergers and buy-outs; ratings downgrades; and bankruptcies.
60
GOLDMAN SACHS FUND OF FUNDS PORTFOLIOS
|
| 3. INVESTMENTS AND FAIR VALUE MEASUREMENTS (continued) |
C. Fair Value Hierarchy — The following is a summary of the Portfolios’ investments and derivatives classified in the fair value hierarchy as of June 30, 2016:
| | | | | | | | | | | | |
|
| BALANCED STRATEGY | |
| | | |
| Investment Type | | Level 1 | | | Level 2 | | | Level 3 | |
| Assets | | | | | | | | | | | | |
Equity Underlying Funds | | $ | 152,325,244 | | | $ | — | | | $ | — | |
Fixed Income Underlying Funds | | | 215,354,450 | | | | — | | | | — | |
Dynamic Underlying Funds | | | 77,470,148 | | | | — | | | | — | |
| Total | | $ | 445,149,842 | | | $ | — | | | $ | — | |
| | | |
| EQUITY GROWTH STRATEGY PORTFOLIO | | | | | | | | | | | | |
| | | |
| Investment Type | | Level 1 | | | Level 2 | | | Level 3 | |
| Assets | | | | | | | | | | | | |
Equity Underlying Funds | | $ | 330,200,793 | | | $ | — | | | $ | — | |
| Total | | $ | 330,200,793 | | | $ | — | | | $ | — | |
| | | |
| GROWTH AND INCOME STRATEGY PORTFOLIO | | | | | | | | | | | | |
| | | |
| Investment Type | | Level 1 | | | Level 2 | | | Level 3 | |
| Assets | | | | | | | | | | | | |
Equity Underlying Funds | | $ | 498,561,830 | | | $ | — | | | $ | — | |
Fixed Income Underlying Funds | | | 243,369,419 | | | | — | | | | — | |
Dynamic Underlying Funds | | | 155,407,497 | | | | — | | | | — | |
Short-term Investments | | | — | | | | 1,300,000 | | | | — | |
| Total | | $ | 897,338,746 | | | $ | 1,300,000 | | | $ | — | |
| | | |
| GROWTH STRATEGY PORTFOLIO | | | | | | | | | | | | |
| | | |
| Investment Type | | Level 1 | | | Level 2 | | | Level 3 | |
| Assets | | | | | | | | | | | | |
Equity Underlying Funds | | $ | 596,024,899 | | | $ | — | | | $ | — | |
Fixed Income Underlying Funds | | | 44,194,355 | | | | — | | | | — | |
Dynamic Underlying Funds | | | 133,309,764 | | | | — | | | | — | |
Short-term Investments | | | — | | | | 100,000 | | | | — | |
| Total | | $ | 773,529,018 | | | $ | 100,000 | | | $ | — | |
61
GOLDMAN SACHS FUND OF FUNDS PORTFOLIOS
Notes to Financial Statements (continued)
June 30, 2016 (Unaudited)
|
| 3. INVESTMENTS AND FAIR VALUE MEASUREMENTS (continued) |
| | | | | | | | | | | | |
| | | |
| SATELLITE STRATEGIES PORTFOLIO | | | | | | | | | | | | |
| | | |
| Investment Type | | Level 1 | | | Level 2 | | | Level 3 | |
| Assets | | | | | | | | | | | | |
Equity Underlying Funds | | $ | 451,795,751 | | | $ | — | | | $ | — | |
Fixed Income Underlying Funds | | | 362,509,583 | | | | — | | | | — | |
| Total | | $ | 814,305,334 | | | $ | — | | | $ | — | |
For further information regarding security characteristics, see the Schedules of Investments.
|
| 4. AGREEMENTS AND AFFILIATED TRANSACTIONS |
A. Management Agreement — Under the Agreement, GSAM manages the Portfolios, subject to the general supervision of the Trustees.
As compensation for the services rendered pursuant to the Agreement, the assumption of the expenses related thereto and administration of the Portfolios’ business affairs, including providing facilities, GSAM is entitled to a management fee, accrued daily and paid monthly, equal to an annual percentage rate of average daily net assets of 0.124% for the Satellite Strategies Portfolio and 0.15% for each of the other Portfolios.
B. Distribution and Service Plans — The Trust, on behalf of each Portfolio, has adopted Distribution and Service Plans (the “Plans”). Under the Plans, Goldman Sachs, which serves as distributor (the “Distributor”), is entitled to a fee accrued daily and paid monthly, for distribution services and personal and account maintenance services, which may then be paid by Goldman Sachs to authorized dealers, at the following annual rates calculated on a Portfolio’s average daily net assets of each respective share class:
| | | | | | | | | | | | |
| | | Distribution and Service Plan Rates | |
| | | Class A* | | | Class C | | | Class R* | |
Distribution Plan | | | 0.25 | % | | | 0.75 | % | | | 0.50 | % |
Service Plan | | | — | | | | 0.25 | | | | — | |
| * | | With respect to Class A and Class R Shares, the Distributor at its discretion may use compensation for distribution services paid under the Distribution Plan to compensate service organizations for personal and account maintenance services and expenses as long as such total compensation does not exceed the maximum cap on “service fees” imposed by the Financial Industry Regulatory Authority. |
C. Distribution Agreement — Goldman Sachs, as Distributor of the shares of the Portfolios pursuant to a Distribution Agreement, may retain a portion of the Class A Shares’ front end sales charge and Class C Shares’ CDSC. During the six months ended June 30, 2016, Goldman Sachs advised that it retained the following amounts:
| | | | | | | | | | |
| Fund | | | | Front End
Sales Charge
Class A | | | Contingent Deferred
Sales Charge
Class C | |
Balanced Strategy | | | | | 8,036 | | | | 32 | |
Equity Growth Strategy | | | | | 4,997 | | | | 267 | |
Growth and Income Strategy | | | | | 13,884 | | | | 411 | |
Growth Strategy | | | | | 12,725 | | | | 237 | |
Satellite Strategies | | | | | 1,550 | | | | — | |
62
GOLDMAN SACHS FUND OF FUNDS PORTFOLIOS
|
| 4. AGREEMENTS AND AFFILIATED TRANSACTIONS (continued) |
D. Service Plan and Shareholder Administration Plan — The Trust, on behalf of each Portfolio that offers Service Shares, has adopted a Service Plan and a Shareholder Administration Plan. These plans allow for service organizations to provide varying levels of personal and account maintenance and shareholder administration services to their customers who are beneficial owners of such shares. The Service Plan and Shareholder Administration Plan each provide for compensation to the service organizations which is accrued daily and paid monthly at an annual rate of 0.25% (0.50% in aggregate) of the average daily net assets of the Service Shares.
E. Transfer Agency Agreement — Goldman Sachs also serves as the transfer agent of the Portfolios for a fee pursuant to the Transfer Agency Agreement. The fees charged for such transfer agency services are accrued daily and paid monthly at annual rates as follows: 0.19% of the average daily net assets of Class A, Class C, Class IR and Class R Shares; 0.02% of the average daily net assets of Class R6 Shares; and 0.04% of the average daily net assets of Institutional and Service Shares.
F. Other Expense Agreements and Affiliated Transactions — GSAM has agreed to limit certain “Other Expenses” of the Portfolios (excluding acquired (underlying) fund fees and expenses, transfer agency fees and expenses, service fees, shareholder administration fees (as applicable), taxes, interest, brokerage fees, shareholder meeting, litigation, indemnification and extraordinary expenses) to the extent such expenses exceed, on an annual basis, a percentage rate of the average daily net assets of each Portfolio. Such Other Expense reimbursements, if any, are accrued daily and paid monthly. In addition, the Portfolios are not obligated to reimburse GSAM for prior fiscal year expense reimbursements, if any. The Other Expense limitations as an annual percentage rate of average daily net assets are 0.01% for the Satellite Strategies Portfolio and 0.004% for each other Portfolio. These Other Expense limitations will remain in place through at least April 29, 2017, and prior to such date GSAM may not terminate the arrangements without the approval of the Trustees. In addition, the Portfolios have entered into certain offset arrangements with the transfer agent, which may result in a reduction of the Portfolios’ expenses and are received irrespective of the application of the “Other Expense” limitations described above.
For the six months ended June 30, 2016, these expense reductions, including any fee waivers and Other Expense reimbursements, were as follows:
| | | | | | |
| Fund | | | | Other
Expense
Reimbursements | |
Balanced Strategy | | | | $ | 156,872 | |
Equity Growth Strategy | | | | | 151,325 | |
Growth and Income Strategy | | | | | 187,205 | |
Growth Strategy | | | | | 180,179 | |
Satellite Strategies | | | | | 169,122 | |
G. Line of Credit Facility — As of June 30, 2016, the Portfolios participated in a $1,100,000,000 committed, unsecured revolving line of credit facility (the “facility”) together with other funds of the Trust and certain registered investment companies having management agreements with GSAM or its affiliates (“Other Borrowers”). This facility is to be used for temporary emergency purposes, or to allow for an orderly liquidation of securities to meet redemption requests. The interest rate on borrowings is based on the federal funds rate. The facility also requires a fee to be paid by the Portfolios based on the amount of the commitment that has not been utilized. For the six months ended June 30, 2016, the Portfolios did not have any borrowings under the facility.
63
GOLDMAN SACHS FUND OF FUNDS PORTFOLIOS
Notes to Financial Statements (continued)
June 30, 2016 (Unaudited)
|
| 4. AGREEMENTS AND AFFILIATED TRANSACTIONS (continued) |
H. Other Transactions with Affiliates — The Portfolios invest primarily in the Institutional Shares of the Underlying Funds. These Underlying Funds are considered to be affiliated with the Portfolios. The tables below show the transactions in and earnings from investments in these Underlying Funds for the six months ended June 30, 2016 (in thousands):
| | | | | | | | | | | | | | | | | | | | | | | | | | | | |
|
| Balanced Strategy Portfolio | |
| Underlying Funds | | Market
Value
12/31/2015 | | | Purchases
at Cost* | | | Proceeds
from Sales | | | Net
Realized
Gain (Loss) | | | Change in
Unrealized
Gain (Loss) | | | Market
Value
6/30/2016 | | | Dividend
Income | |
Goldman Sachs Core Fixed Income Fund | | $ | 18,494 | | | $ | 591 | | | $ | (19,280 | ) | | $ | (9 | ) | | $ | 204 | | | $ | — | | | $ | 66 | |
Goldman Sachs Dynamic Allocation Fund | | | 56,135 | | | | 9,088 | | | | (6,228 | ) | | | 125 | | | | 597 | | | | 59,717 | | | | — | |
Goldman Sachs Emerging Markets Debt Fund | | | 4,416 | | | | 16,153 | | | | (7,196 | ) | | | 266 | | | | 486 | | | | 14,125 | | | | 324 | |
Goldman Sachs Emerging Markets Equity Insights Fund | | | 1,431 | | | | 16,625 | | | | (3,963 | ) | | | 445 | | | | 473 | | | | 15,011 | | | | — | |
Goldman Sachs Focused International Equity Fund | | | — | | | | 7,685 | | | | (1,940 | ) | | | (89 | ) | | | (330 | ) | | | 5,326 | | | | — | |
Goldman Sachs Global Income Fund | | | 170,177 | | | | 17,729 | | | | (60,270 | ) | | | (490 | ) | | | 6,474 | | | | 133,620 | | | | 1,020 | |
Goldman Sachs High Yield Fund | | | 2,698 | | | | 27,112 | | | | (9,608 | ) | | | 168 | | | | 107 | | | | 20,477 | | | | 238 | |
Goldman Sachs International Equity Insights Fund | | | 28,267 | | | | 14,326 | | | | (26,921 | ) | | | 719 | | | | (36 | ) | | | 16,355 | | | | — | |
Goldman Sachs International Real Estate Securities Fund | | | 5,000 | | | | 1,028 | | | | (685 | ) | | | 44 | | | | 49 | | | | 5,436 | | | | 60 | |
Goldman Sachs International Small Cap Insights Fund | | | 5,473 | | | | 753 | | | | (709 | ) | | | 140 | | | | (304 | ) | | | 5,353 | | | | — | |
Goldman Sachs Large Cap Growth Insights Fund | | | 47,687 | | | | 9,397 | | | | (20,486 | ) | | | 1,423 | | | | (1,441 | ) | | | 36,580 | | | | — | |
Goldman Sachs Large Cap Value Fund | | | 8,535 | | | | 5,888 | | | | (2,285 | ) | | | (280 | ) | | | 298 | | | | 12,156 | | | | — | |
Goldman Sachs Large Cap Value Insights Fund | | | 19,887 | | | | 13,347 | | | | (5,102 | ) | | | (231 | ) | | | 357 | | | | 28,258 | | | | 180 | |
Goldman Sachs Local Emerging Markets Debt Fund | | | 4,519 | | | | 15,423 | | | | (6,655 | ) | | | 375 | | | | 643 | | | | 14,305 | | | | 335 | |
Goldman Sachs Managed Futures Strategy Fund | | | 15,365 | | | | 4,901 | | | | (2,557 | ) | | | 169 | | | | (125 | ) | | | 17,753 | | | | — | |
Goldman Sachs Real Estate Securities Fund | | | 5,155 | | | | 945 | | | | (1,100 | ) | | | 155 | | | | 328 | | | | 5,483 | | | | 72 | |
Goldman Sachs Small Cap Equity Insights Fund | | | 179 | | | | 6,662 | | | | (332 | ) | | | 1 | | | | 167 | | | | 6,677 | | | | — | |
Goldman Sachs Strategic Growth Fund | | | 20,444 | | | | 4,044 | | | | (8,385 | ) | | | (165 | ) | | | (248 | ) | | | 15,690 | | | | — | |
Goldman Sachs Strategic Income Fund | | | 33,295 | | | | 4,269 | | | | (3,881 | ) | | | 9 | | | | (864 | ) | | | 32,828 | | | | 470 | |
Total | | $ | 447,157 | | | $ | 175,966 | | | $ | (187,583 | ) | | $ | 2,775 | | | $ | 6,835 | | | $ | 445,150 | | | $ | 2,765 | |
64
GOLDMAN SACHS FUND OF FUNDS PORTFOLIOS
|
| 4. AGREEMENTS AND AFFILIATED TRANSACTIONS (continued) |
| | | | | | | | | | | | | | | | | | | | | | | | | | | | |
|
| Equity Growth Strategy Portfolio | |
| Underlying Funds | | Market
Value
12/31/2015 | | | Purchases
at Cost* | | | Proceeds
from Sales | | | Net
Realized
Gain (Loss) | | | Change in
Unrealized
Gain (Loss) | | | Market
Value
6/30/2016 | | | Dividend
Income | |
Goldman Sachs Emerging Markets Equity Insights Fund | | $ | 16,567 | | | $ | 17,529 | | | $ | (4,637 | ) | | $ | 366 | | | $ | 1,716 | | | $ | 31,541 | | | $ | — | |
Goldman Sachs Focused International Equity Fund | | | — | | | | 25,677 | | | | (1,003 | ) | | | (38 | ) | | | (1,347 | ) | | | 23,289 | | | | — | |
Goldman Sachs International Equity Insights Fund | | | 105,633 | | | | 6,652 | | | | (40,682 | ) | | | 5,585 | | | | (6,074 | ) | | | 71,114 | | | | — | |
Goldman Sachs International Real Estate Securities Fund | | | 6,887 | | | | 361 | | | | (680 | ) | | | (17 | ) | | | 72 | | | | 6,623 | | | | 74 | |
Goldman Sachs International Small Cap Insights Fund | | | 10,420 | | | | 479 | | | | (785 | ) | | | 336 | | | | (668 | ) | | | 9,782 | | | | — | |
Goldman Sachs Large Cap Growth Insights Fund | | | 76,734 | | | | 2,081 | | | | (19,998 | ) | | | 9,379 | | | | (9,148 | ) | | | 59,048 | | | | — | |
Goldman Sachs Large Cap Value Fund | | | 25,032 | | | | 4,785 | | | | (4,039 | ) | | | 1,081 | | | | (983 | ) | | | 25,876 | | | | — | |
Goldman Sachs Large Cap Value Insights Fund | | | 58,422 | | | | 9,957 | | | | (8,811 | ) | | | 3,609 | | | | (3,032 | ) | | | 60,145 | | | | 486 | |
Goldman Sachs Real Estate Securities Fund | | | 7,028 | | | | 476 | | | | (1,379 | ) | | | 448 | | | | 107 | | | | 6,680 | | | | 87 | |
Goldman Sachs Small Cap Equity Insights Fund | | | 5,427 | | | | 5,905 | | | | (851 | ) | | | 102 | | | | 192 | | | | 10,775 | | | | — | |
Goldman Sachs Strategic Growth Fund | | | 32,901 | | | | 856 | | | | (7,827 | ) | | | 712 | | | | (1,314 | ) | | | 25,328 | | | | — | |
Total | | $ | 345,051 | | | $ | 74,758 | | | $ | (90,692 | ) | | $ | 21,563 | | | $ | (20,479 | ) | | $ | 330,201 | | | $ | 647 | |
65
GOLDMAN SACHS FUND OF FUNDS PORTFOLIOS
Notes to Financial Statements (continued)
June 30, 2016 (Unaudited)
|
| 4. AGREEMENTS AND AFFILIATED TRANSACTIONS (continued) |
| | | | | | | | | | | | | | | | | | | | | | | | | | | | |
|
| Growth and Income Strategy Portfolio | |
| Underlying Funds | | Market
Value
12/31/2015 | | | Purchases
at Cost* | | | Proceeds
from Sales | | | Net
Realized
Gain (Loss) | | | Change in
Unrealized
Gain (Loss) | | | Market
Value
6/30/2016 | | | Dividend
Income | |
Goldman Sachs Core Fixed Income Fund | | $ | 35,661 | | | $ | 421 | | | $ | (36,449 | ) | | $ | (30 | ) | | $ | 397 | | | $ | — | | | $ | 2 | |
Goldman Sachs Dynamic Allocation Fund | | | 116,323 | | | | 13,620 | | | | (11,485 | ) | | | 76 | | | | 1,262 | | | | 119,796 | | | | — | |
Goldman Sachs Emerging Markets Debt Fund | | | — | | | | 31,902 | | | | (13,348 | ) | | | 495 | | | | 339 | | | | 19,388 | | | | 311 | |
Goldman Sachs Emerging Markets Equity Insights Fund | | | 20,935 | | | | 33,580 | | | | (8,018 | ) | | | 833 | | | | 2,191 | | | | 49,521 | | | | — | |
Goldman Sachs Focused International Equity Fund | | | — | | | | 32,851 | | | | (3,501 | ) | | | (149 | ) | | | (1,631 | ) | | | 27,570 | | | | — | |
Goldman Sachs Global Income Fund | | | 207,619 | | | | 19,581 | | | | (105,600 | ) | | | (1,389 | ) | | | 8,102 | | | | 128,313 | | | | 1,585 | |
Goldman Sachs High Yield Fund | | | — | | | | 44,910 | | | | (13,093 | ) | | | 279 | | | | 102 | | | | 32,198 | | | | 311 | |
Goldman Sachs International Equity Insights Fund | | | 130,490 | | | | 28,138 | | | | (74,892 | ) | | | 5,431 | | | | (4,769 | ) | | | 84,398 | | | | — | |
Goldman Sachs International Real Estate Securities Fund | | | 11,242 | | | | 1,071 | | | | (1,512 | ) | | | 86 | | | | 19 | | | | 10,906 | | | | 121 | |
Goldman Sachs International Small Cap Insights Fund | | | 17,008 | | | | 1,376 | | | | (1,742 | ) | | | 747 | | | | (1,277 | ) | | | 16,112 | | | | — | |
Goldman Sachs Large Cap Growth Insights Fund | | | 132,366 | | | | 17,609 | | | | (43,723 | ) | | | 9,664 | | | | (9,573 | ) | | | 106,343 | | | | — | |
Goldman Sachs Large Cap Value Fund | | | 32,264 | | | | 12,773 | | | | (6,494 | ) | | | (492 | ) | | | 578 | | | | 38,629 | | | | — | |
Goldman Sachs Large Cap Value Insights Fund | | $ | 75,257 | | | $ | 28,136 | | | $ | (14,332 | ) | | $ | 1,038 | | | $ | (437 | ) | | $ | 89,662 | | | $ | 646 | |
Goldman Sachs Local Emerging Markets Debt Fund | | | — | | | | 31,078 | | | | (12,572 | ) | | | 701 | | | | 360 | | | | 19,567 | | | | 321 | |
Goldman Sachs Managed Futures Strategy Fund | | | 31,843 | | | | 8,985 | | | | (5,360 | ) | | | 374 | | | | (231 | ) | | | 35,611 | | | | — | |
Goldman Sachs Real Estate Securities Fund | | | 11,482 | | | | 767 | | | | (2,167 | ) | | | 1,428 | | | | (511 | ) | | | 10,999 | | | | 144 | |
Goldman Sachs Small Cap Equity Insights Fund | | | 5,190 | | | | 16,209 | | | | (2,954 | ) | | | (155 | ) | | | 499 | | | | 18,789 | | | | — | |
Goldman Sachs Strategic Growth Fund | | | 56,714 | | | | 7,637 | | | | (17,612 | ) | | | (412 | ) | | | (693 | ) | | | 45,634 | | | | — | |
Goldman Sachs Strategic Income Fund | | | 46,002 | | | | 4,340 | | | | (5,276 | ) | | | (8 | ) | | | (1,155 | ) | | | 43,903 | | | | 381 | |
Total | | $ | 930,396 | | | $ | 334,984 | | | $ | (380,130 | ) | | $ | 18,517 | | | $ | (6,428 | ) | | $ | 897,339 | | | $ | 3,822 | |
66
GOLDMAN SACHS FUND OF FUNDS PORTFOLIOS
|
| 4. AGREEMENTS AND AFFILIATED TRANSACTIONS (continued) |
| | | | | | | | | | | | | | | | | | | | | | | | | | | | |
|
| Growth Strategy Portfolio | |
| Underlying Funds | | Market
Value
12/31/2015 | | | Purchases
at Cost* | | | Proceeds
from Sales | | | Net
Realized
Gain (Loss) | | | Change in
Unrealized
Gain (Loss) | | | Market
Value
6/30/2016 | | | Dividend
Income | |
Goldman Sachs Core Fixed Income Fund | | $ | 15,854 | | | $ | 2,317 | | | $ | (18,341 | ) | | $ | (6 | ) | | $ | 176 | | | $ | — | | | $ | 70 | |
Goldman Sachs Dynamic Allocation Fund | | | 101,199 | | | | 11,729 | | | | (11,335 | ) | | | 119 | | | | 1,049 | | | | 102,761 | | | | — | |
Goldman Sachs Emerging Markets Debt Fund | | | — | | | | 15,223 | | | | (8,648 | ) | | | 62 | | | | (0 | ) | | | 6,637 | | | | 85 | |
Goldman Sachs Emerging Markets Equity Insights Fund | | | 28,542 | | | | 34,493 | | | | (4,850 | ) | | | 407 | | | | 3,542 | | | | 62,134 | | | | — | |
Goldman Sachs Global Income Fund | | | 54,415 | | | | 6,114 | | | | (61,701 | ) | | | (1,280 | ) | | | 2,452 | | | | — | | | | 197 | |
Goldman Sachs High Yield Fund | | | — | | | | 30,573 | | | | (18,580 | ) | | | 60 | | | | 38 | | | | 12,091 | | | | 152 | |
Goldman Sachs International Equity Insights Fund | | | 171,494 | | | | 24,214 | | | | (80,872 | ) | | | 8,693 | | | | (8,599 | ) | | | 114,930 | | | | — | |
Goldman Sachs International Real Estate Securities Fund | | | 13,042 | | | | 871 | | | | (1,561 | ) | | | 25 | | | | 99 | | | | 12,476 | | | | 140 | |
Goldman Sachs International Small Cap Insights Fund | | | 19,732 | | | | 1,148 | | | | (1,843 | ) | | | 799 | | | | (1,408 | ) | | | 18,428 | | | | — | |
Goldman Sachs Large Cap Growth Insights Fund | | | 143,303 | | | | 14,730 | | | | (40,383 | ) | | | 12,640 | | | | (12,364 | ) | | | 117,926 | | | | — | |
Goldman Sachs Large Cap Value Fund | | | 40,267 | | | | 10,774 | | | | (6,510 | ) | | | 1,378 | | | | (1,173 | ) | | | 44,736 | | | | 805 | |
Goldman Sachs Large Cap Value Insights Fund | | | 93,945 | | | | 23,172 | | | | (14,288 | ) | | | 5,090 | | | | (4,035 | ) | | | 103,884 | | | | — | |
Goldman Sachs Local Emerging Markets Debt Fund | | | — | | | | 15,187 | | | | (8,328 | ) | | | (222 | ) | | | (0 | ) | | | 6,637 | | | | 88 | |
Goldman Sachs Managed Futures Strategy Fund | | | 27,694 | | | | 7,930 | | | | (5,195 | ) | | | 349 | | | | (230 | ) | | | 30,548 | | | | — | |
Goldman Sachs Real Estate Securities Fund | | | 13,307 | | | | 820 | | | | (2,601 | ) | | | 623 | | | | 434 | | | | 12,583 | | | | 166 | |
Goldman Sachs Small Cap Equity Insights Fund | | | 8,701 | | | | 14,164 | | | | (2,624 | ) | | | (41 | ) | | | 546 | | | | 20,746 | | | | — | |
Goldman Sachs Strategic Growth Fund | | $ | 61,426 | | | $ | 6,282 | | | $ | (15,959 | ) | | $ | (305 | ) | | $ | (853 | ) | | $ | 50,591 | | | $ | — | |
Goldman Sachs Strategic Income Fund | | | 20,007 | | | | 1,869 | | | | (2,541 | ) | | | (13 | ) | | | (493 | ) | | | 18,829 | | | | 274 | |
Joint Repurchase Agreement Account II | | | — | | | | 25,800 | | | | (25,700 | ) | | | — | | | | — | | | | 100 | | | | — | |
Total | | $ | 812,928 | | | $ | 247,410 | | | $ | (331,860 | ) | | $ | 28,378 | | | $ | (20,819 | ) | | $ | 736,037 | | | $ | 1,977 | |
67
GOLDMAN SACHS FUND OF FUNDS PORTFOLIOS
Notes to Financial Statements (continued)
June 30, 2016 (Unaudited)
|
| 4. AGREEMENTS AND AFFILIATED TRANSACTIONS (continued) |
| | | | | | | | | | | | | | | | | | | | | | | | | | | | |
|
| Satellite Strategies Portfolio | |
| Underlying Funds | | Market
Value
12/31/2015 | | | Purchases
at Cost* | | | Proceeds
from Sales | | | Net
Realized
Gain (Loss) | | | Change in
Unrealized
Gain (Loss) | | | Market
Value
6/30/2016 | | | Dividend
Income | |
Goldman Sachs Commodity Strategy Fund | | $ | 44,717 | | | $ | 4,409 | | | $ | (12,787 | ) | | $ | (12,313 | ) | | $ | 16,225 | | | $ | 40,251 | | | $ | 160 | |
Goldman Sachs Emerging Markets Debt Fund | | | 72,276 | | | | 34,649 | | | | (16,705 | ) | | | 148 | | | | 5,916 | | | | 96,284 | | | | 2,647 | |
Goldman Sachs Emerging Markets Equity Fund | | | 41,835 | | | | 4,770 | | | | (8,291 | ) | | | (387 | ) | | | 1,739 | | | | 39,666 | | | | — | |
Goldman Sachs Emerging Markets Equity Insights Fund | | | 51,008 | | | | 6,446 | | | | (11,374 | ) | | | (2,244 | ) | | | 5,039 | | | | 48,875 | | | | — | |
Goldman Sachs High Yield Floating Rate Fund | | | 115,653 | | | | 3,646 | | | | (19,244 | ) | | | (1,022 | ) | | | 3,277 | | | | 102,310 | | | | 2,674 | |
Goldman Sachs High Yield Fund | | | 128,044 | | | | 3,863 | | | | (51,919 | ) | | | (8,161 | ) | | | 10,581 | | | | 82,408 | | | | 2,516 | |
Goldman Sachs International Real Estate Securities Fund | | | 137,763 | | | | 11,696 | | | | (27,279 | ) | | | (1,672 | ) | | | 2,700 | | | | 123,208 | | | | 1,368 | |
Goldman Sachs International Small Cap Fund | | | 55,236 | | | | 124 | | | | (46,084 | ) | | | (163 | ) | | | (9,113 | ) | | | — | | | | 125 | |
Goldman Sachs International Small Cap Insights Fund | | | 83,537 | | | | 49,384 | | | | (21,296 | ) | | | 323 | | | | 3,920 | | | | 115,868 | | | | — | |
Goldman Sachs Local Emerging Markets Debt Fund | | | 45,901 | | | | 2,630 | | | | (11,681 | ) | | | (4,740 | ) | | | 9,146 | | | | 41,256 | | | | 1,413 | |
Goldman Sachs Real Estate Securities Fund | | | 140,568 | | | | 6,366 | | | | (33,086 | ) | | | 2,260 | | | | 8,071 | | | | 124,179 | | | | 1,645 | |
Total | | $ | 916,538 | | | $ | 127,983 | | | $ | (259,746 | ) | | $ | (27,971 | ) | | $ | 57,501 | | | $ | 814,305 | | | $ | 12,548 | |
| * | | Includes reinvestment of distributions. |
68
GOLDMAN SACHS FUND OF FUNDS PORTFOLIOS
|
| 5. PORTFOLIO SECURITIES TRANSACTIONS |
The cost of purchases and proceeds from sales of the Underlying Funds for the six months ended June 30, 2016, were as follows:
| | | | | | | | | | |
Portfolio | | | | Purchases | | | Sales | |
Balanced Strategy | | | | | 175,966,271 | | | | 187,583,014 | |
Equity Growth Strategy | | | | | 74,756,974 | | | | 90,691,760 | |
Growth and Income Strategy | | | | | 334,983,645 | | | | 380,130,307 | |
Growth Strategy | | | | | 264,506,854 | | | | 309,152,909 | |
Satellite Strategies | | | | | 84,248,910 | | | | 216,011,538 | |
As of the Portfolios’ most recent fiscal year end, December 31, 2015, the Portfolios’ capital loss carryforwards and certain timing differences on a tax basis were as follows:
| | | | | | | | | | | | | | | | | | | | |
| | | Balanced Strategy | | | Equity Growth Strategy | | | Growth and Income Strategy | | | Growth Strategy | | | Satellite Strategies | |
Capital loss carryforwards:(1) | | | | | | | | | | | | | | | | | | | | |
Expiring 2016 | | $ | — | | | $ | (41,731,954 | ) | | $ | (31,174,303 | ) | | $ | (101,609,585 | ) | | $ | — | |
Expiring 2017 | | | — | | | | (109,415,161 | ) | | | (358,977,420 | ) | | | (372,899,651 | ) | | | (853,855 | ) |
Expiring 2018 | | | (9,648,959 | ) | | | (76,608,179 | ) | | | (187,607,636 | ) | | | (181,275,105 | ) | | | — | |
Perpetual Short-term | | | (524,476 | ) | | | — | | | | — | | | | — | | | | — | |
Perpetual Long-term | | | — | | | | — | | | | — | | | | — | | | | (20,757,413 | ) |
Total capital loss carryforwards | | $ | (10,173,435 | ) | | $ | (227,755,294 | ) | | $ | (577,759,359 | ) | | $ | (655,784,341 | ) | | $ | (21,611,268 | ) |
Timing Difference (Post October Loss Deferral) | | $ | — | | | $ | (7,969 | ) | | $ | (1,424,438 | ) | | $ | (54,183 | ) | | $ | — | |
| (1) | | With the exception of perpetual capital loss carryforwards, expiration occurs on December 31 of the year indicated. |
As of June 30, 2016, the Portfolios’ aggregate security unrealized gains and losses based on cost for U.S. federal income tax purposes were as follows:
| | | | | | | | | | | | | | | | | | | | |
| | | Balanced Strategy | | | Equity Growth Strategy | | | Growth and Income Strategy | | | Growth Strategy | | | Satellite Strategies | |
Tax Cost | | $ | 470,965,411 | | | $ | 332,005,873 | | | $ | 931,459,647 | | | $ | 790,475,437 | | | $ | 810,330,803 | |
Gross unrealized gain | | | 2,067,693 | | | | 21,974,498 | | | | 14,025,136 | | | | 23,120,209 | | | | 90,284,634 | |
Gross unrealized loss | | | (27,883,262 | ) | | | (23,779,578 | ) | | | (46,846,037 | ) | | | (39,966,628 | ) | | | (86,310,103 | ) |
Net unrealized security gain (loss) | | $ | (25,815,569 | ) | | $ | (1,805,080 | ) | | $ | (32,820,901 | ) | | $ | (16,846,419 | ) | | $ | 3,974,531 | |
The difference between GAAP-basis and tax-basis unrealized gains (losses) is attributable primarily to wash sales and differences in tax treatment of Underlying Fund investments.
GSAM has reviewed the Portfolios’ tax positions for all open tax years (the current and prior three years, as applicable) and has concluded that no provision for income tax is required in the Portfolios’ financial statements. Such open tax years remain subject to examination and adjustment by tax authorities.
69
GOLDMAN SACHS FUND OF FUNDS PORTFOLIOS
Notes to Financial Statements (continued)
June 30, 2016 (Unaudited)
The Portfolios’ risks include, but are not limited to, the following:
Investments in the Underlying Funds — The investments of a Portfolio are concentrated in the Underlying Funds, and the Portfolio’s investment performance is directly related to the investment performance of the Underlying Funds it holds. A Portfolio is subject to the risk factors associated with the investments of the Underlying Funds in direct proportion to the amount of assets allocated to each. A Portfolio that has a relative concentration of its portfolio in a single Underlying Fund may be more susceptible to adverse developments affecting that Underlying Fund, and may be more susceptible to losses because of these developments.
Large Shareholder Transactions Risk — A Portfolio or an Underlying Fund may experience adverse effects when certain large shareholders, such as other funds, institutional investors (including those trading by use of non-discretionary mathematical formulas), financial intermediaries (who may make investment decisions on behalf of underlying clients and/or include a Portfolio or an Underlying Fund in their investment model), individuals, accounts and Goldman Sachs affiliates, purchase or redeem large amounts of shares of a Portfolio or an Underlying Fund. Such large shareholder redemptions may cause a Portfolio or an Underlying Fund to sell portfolio securities at times when it would not otherwise do so, which may negatively impact the Portfolio’s or the Underlying Fund’s NAV and liquidity. These transactions may also accelerate the realization of taxable income to shareholders if such sales of investments resulted in gains, and may also increase transaction costs. In addition, a large redemption could result in a Portfolio’s or an Underlying Fund’s current expenses being allocated over a smaller asset base, leading to an increase in the expense ratio of the Portfolio or the Underlying Fund. Similarly, large Portfolio or Underlying Fund share purchases may adversely affect a Portfolio’s or an Underlying Fund’s performance to the extent that the Portfolio or the Underlying Fund is delayed in investing new cash and is required to maintain a larger cash position than it ordinarily would.
The Portfolios may be indirectly exposed to the following risks through their investments in the Underlying Funds. For more information regarding the risks of an Underlying Fund, please see the Underlying Fund’s shareholder report.
Derivatives Risk — Loss may result from an Underlying Fund’s investments in derivative instruments. These instruments may be illiquid, difficult to price and leveraged so that small changes in the value of the underlying instruments may produce disproportionate losses to the Underlying Funds. Derivatives are also subject to counterparty risk, which is the risk that the other party in the transaction will not fulfill its contractual obligation. Losses from investments in derivatives can result from a lack of correlation between changes in the value of derivative instruments and the portfolio assets (if any) being hedged.
Liquidity Risk — An Underlying Fund may make investments that are illiquid or that may become less liquid in response to market developments or adverse investor perceptions. Illiquid investments may be more difficult to value. Liquidity risk may also refer to the risk that an Underlying Fund will not be able to pay redemption proceeds within the allowable time period because of unusual market conditions, an unusually high volume of redemption requests, or other reasons. To meet redemption requests, an Underlying Fund may be forced to sell investments at an unfavorable time and/or under unfavorable conditions. Liquidity risk may be the result of, among other things, the reduced number and capacity of traditional market participants to make a market in fixed income securities or the lack of an active market. The potential for liquidity risk may be magnified by a rising interest rate environment or other circumstances where investor redemptions from fixed income mutual funds may be higher than normal, potentially causing increased supply in the market due to selling activity.
Market and Credit Risks — In the normal course of business, the Underlying Funds trade financial instruments and enter into financial transactions where risk of potential loss exists due to changes in the market (market risk). Additionally, the Underlying Funds may also be exposed to credit risk in the event that an issuer or guarantor fails to perform or that an institution or entity with which the Underlying Funds have unsettled or open transactions defaults.
Foreign and Emerging Countries Risk — Investing in foreign markets may involve special risks and considerations not typically associated with investing in the United States. Foreign securities may be subject to risk of loss because of more or less foreign government regulation, less public information and less economic, political and social stability in the countries in which the Underlying Funds invest. Loss may also result from the imposition of exchange controls, confiscations and other government restrictions by the United States or other governments, or from problems in registration, settlement or custody. Foreign risk also
70
GOLDMAN SACHS FUND OF FUNDS PORTFOLIOS
|
| 7. OTHER RISKS (continued) |
involves the risk of negative foreign currency rate fluctuations, which may cause the value of securities denominated in such foreign currency (or other instruments through which the Underlying Funds have exposure to foreign currencies) to decline in value. Currency exchange rates may fluctuate significantly over short periods of time. To the extent that the Underlying Funds also invest in securities of issuers located in emerging markets, these risks may be more pronounced.
Under the Trust’s organizational documents, its Trustees, officers, employees and agents are indemnified, to the extent permitted by the Act and state law, against certain liabilities that may arise out of performance of their duties to the Portfolios. Additionally, in the course of business, the Portfolios enter into contracts that contain a variety of indemnification clauses. The Portfolios’ maximum exposure under these arrangements is unknown, as this would involve future claims that may be made against the Portfolios that have not yet occurred. However, GSAM believes the risk of loss under these arrangements to be remote.
Subsequent events after the Statements of Assets and Liabilities date have been evaluated through the date the financial statements were issued. GSAM has concluded that there is no impact requiring adjustment or disclosure in the financial statements.
71
GOLDMAN SACHS BALANCED STRATEGY PORTFOLIO
Notes to Financial Statements (continued)
June 30, 2016 (Unaudited)
|
| 10. SUMMARY OF SHARE TRANSACTIONS |
Share activity is as follows:
| | | | | | | | | | | | | | | | |
| | | Balanced Strategy Portfolio | |
| | | | |
| | | For the Six Months Ended
June 30, 2016
(Unaudited) | | | For the Fiscal Year Ended
December 31, 2015
| |
| | | | |
| | | Shares | | | Dollars | | | Shares | | | Dollars | |
| | | | |
| Class A Shares | | | | | | | | | | | | | | | | |
Shares sold | | | 788,336 | | | $ | 8,207,183 | | | | 1,345,309 | | | $ | 14,904,278 | |
Reinvestment of distributions | | | 49,426 | | | | 406,005 | | | | 679,687 | | | | 7,264,620 | |
Shares redeemed | | | (1,594,355 | ) | | | (16,619,942 | ) | | | (3,706,738 | ) | | | (41,034,070 | ) |
| | | | (756,593 | ) | | | (8,006,754 | ) | | | (1,681,742 | ) | | | (18,865,172 | ) |
| Class C Shares | | | | | | | | | | | | | | | | |
Shares sold | | | 195,144 | | | | 2,016,812 | | | | 556,471 | | | | 6,110,029 | |
Reinvestment of distributions | | | 3,573 | | | | 4,827 | | | | 179,079 | | | | 1,907,051 | |
Shares redeemed | | | (617,622 | ) | | | (6,412,918 | ) | | | (1,334,753 | ) | | | (14,769,934 | ) |
| | | | (418,905 | ) | | | (4,391,279 | ) | | | (599,203 | ) | | | (6,752,854 | ) |
| Institutional Shares | | | | | | | | | | | | | | | | |
Shares sold | | | 3,747,746 | | | | 38,734,579 | | | | 6,772,216 | | | | 74,954,706 | |
Reinvestment of distributions | | | 127,665 | | | | 1,165,922 | | | | 1,170,862 | | | | 12,524,123 | |
Shares redeemed | | | (3,595,957 | ) | | | (37,466,953 | ) | | | (8,467,707 | ) | | | (94,040,907 | ) |
| | | | 279,454 | | | | 2,433,548 | | | | (524,629 | ) | | | (6,562,078 | ) |
| Service Shares | | | | | | | | | | | | | | | | |
Shares sold | | | 2,580 | | | | 32,529 | | | | 18,980 | | | | 209,103 | |
Reinvestment of distributions | | | 51 | | | | 420 | | | | 758 | | | | 8,110 | |
Shares redeemed | | | (18,658 | ) | | | (195,507 | ) | | | (52,460 | ) | | | (566,938 | ) |
| | | | (16,027 | ) | | | (162,558 | ) | | | (32,722 | ) | | | (349,725 | ) |
| Class IR Shares | | | | | | | | | | | | | | | | |
Shares sold | | | 75,785 | | | | 784,014 | | | | 48,053 | | | | 530,292 | |
Reinvestment of distributions | | | 2,251 | | | | 19,841 | | | | 23,069 | | | | 245,761 | |
Shares redeemed | | | (56,123 | ) | | | (577,073 | ) | | | (83,694 | ) | | | (926,159 | ) |
| | | | 21,913 | | | | 226,782 | | | | (12,572 | ) | | | (150,106 | ) |
| Class R Shares | | | | | | | | | | | | | | | | |
Shares sold | | | 51,001 | | | | 541,895 | | | | 182,472 | | | | 1,990,838 | |
Reinvestment of distributions | | | 1,276 | | | | 9,561 | | | | 22,552 | | | | 239,467 | |
Shares redeemed | | | (61,458 | ) | | | (634,671 | ) | | | (197,009 | ) | | | (2,152,192 | ) |
| | | | (9,181 | ) | | | (83,215 | ) | | | 8,015 | | | | 78,113 | |
| Class R6 Shares(a) | | | | | | | | | | | | | | | | |
Shares sold | | | — | | | | — | | | | 896 | | | | 10,000 | |
Reinvestment of distributions | | | 5 | | | | 49 | | | | 44 | | | | 463 | |
Shares redeemed | | | — | | | | — | | | | — | | | | — | |
| | | | 5 | | | | 49 | | | | 940 | | | | 10,463 | |
NET DECREASE | | | (899,334 | ) | | $ | (9,983,427 | ) | | | (2,841,913 | ) | | $ | (32,591,359 | ) |
| (a) | | Commenced operations on July 31, 2015. |
72
GOLDMAN SACHS BALANCED STRATEGY PORTFOLIO
| | | | | | | | | | | | | | | | | | | | | | | | | | | | | | |
| Equity Growth Strategy Portfolio | | | Growth and Income Strategy Portfolio | |
For the Six Months Ended
June 30, 2016
(Unaudited) | | | For the Fiscal Year Ended
December 31, 2015
| | | For the Six Months Ended
June 30, 2016
(Unaudited) | | | For the Fiscal Year Ended
December 31, 2015
| |
| Shares | | | Dollars | | | Shares | | | Dollars | | | Shares | | | Dollars | | | Shares | | | Dollars | |
| | | | | | | | | | | | | | | | | | | | | | | | | | | | | | |
| | 274,772 | | | $ | 3,841,508 | | | | 676,655 | | | $ | 9,974,657 | | | | 766,403 | | | $ | 8,882,487 | | | | 1,768,260 | | | $ | 21,602,904 | |
| | — | | | | — | | | | 82,676 | | | | 1,204,590 | | | | 31,777 | | | | 262,900 | | | | 953,718 | | | | 11,292,981 | |
| | (858,100 | ) | | | (12,083,903 | ) | | | (1,703,707 | ) | | | (25,116,148 | ) | | | (2,729,755 | ) | | | (31,539,364 | ) | | | (7,104,902 | ) | | | (86,365,538 | ) |
| | (583,328 | ) | | | (8,242,395 | ) | | | (944,376 | ) | | | (13,936,901 | ) | | | (1,931,575 | ) | | | (22,393,977 | ) | | | (4,382,924 | ) | | | (53,469,653 | ) |
| | | | | | | | | | | | | | | | | | | | | | | | | | | | | | |
| | 120,374 | | | | 1,610,571 | | | | 284,359 | | | | 4,016,390 | | | | 282,961 | | | | 3,196,941 | | | | 580,448 | | | | 6,940,989 | |
| | — | | | | — | | | | 10,509 | | | | 146,500 | | | | 3,070 | | | | 64 | | | | 292,948 | | | | 3,395,270 | |
| | (532,309 | ) | | | (7,148,839 | ) | | | (1,224,982 | ) | | | (17,302,688 | ) | | | (1,291,347 | ) | | | (14,529,274 | ) | | | (2,579,627 | ) | | | (31,019,966 | ) |
| | (411,935 | ) | | | (5,538,268 | ) | | | (930,114 | ) | | | (13,139,798 | ) | | | (1,005,316 | ) | | | (11,332,269 | ) | | | (1,706,231 | ) | | | (20,683,707 | ) |
| | | | | | | | | | | | | | | | | | | | | | | | | | | | | | |
| | 299,625 | | | | 4,145,392 | | | | 686,493 | | | | 10,239,123 | | | | 3,276,361 | | | | 37,602,878 | | | | 8,096,398 | | | | 98,631,039 | |
| | — | | | | — | | | | 108,006 | | | | 1,586,607 | | | | 110,301 | | | | 1,150,464 | | | | 1,345,558 | | | | 16,000,494 | |
| | (331,406 | ) | | | (4,675,552 | ) | | | (1,688,667 | ) | | | (25,135,152 | ) | | | (3,933,283 | ) | | | (45,250,739 | ) | | | (7,374,741 | ) | | | (90,550,667 | ) |
| | (31,781 | ) | | | (530,160 | ) | | | (894,168 | ) | | | (13,309,422 | ) | | | (546,621 | ) | | | (6,497,397 | ) | | | 2,067,215 | | | | 24,080,866 | |
| | | | | | | | | | | | | | | | | | | | | | | | | | | | | | |
| | 344 | | | | 4,950 | | | | 1,980 | | | | 29,181 | | | | 14,124 | | | | 163,402 | | | | 19,459 | | | | 237,746 | |
| | — | | | | — | | | | 227 | | | | 3,291 | | | | 65 | | | | 474 | | | | 2,595 | | | | 30,630 | |
| | (8,049 | ) | | | (114,129 | ) | | | (5,553 | ) | | | (80,960 | ) | | | (18,451 | ) | | | (213,838 | ) | | | (50,731 | ) | | | (622,650 | ) |
| | (7,705 | ) | | | (109,179 | ) | | | (3,346 | ) | | | (48,488 | ) | | | (4,262 | ) | | | (49,962 | ) | | | (28,677 | ) | | | (354,274 | ) |
| | | | | | | | | | | | | | | | | | | | | | | | | | | | | | |
| | 16,825 | | | | 235,019 | | | | 54,518 | | | | 797,164 | | | | 119,601 | | | | 1,394,385 | | | | 46,050 | | | | 561,646 | |
| | — | | | | — | | | | 4,774 | | | | 68,602 | | | | 805 | | | | 8,270 | | | | 10,181 | | | | 120,119 | |
| | (29,100 | ) | | | (397,209 | ) | | | (58,755 | ) | | | (842,269 | ) | | | (17,879 | ) | | | (204,516 | ) | | | (78,343 | ) | | | (948,958 | ) |
| | (12,275 | ) | | | (162,190 | ) | | | 537 | | | | 23,497 | | | | 102,527 | | | | 1,198,139 | | | | (22,112 | ) | | | (267,193 | ) |
| | | | | | | | | | | | | | | | | | | | | | | | | | | | | | |
| | 24,797 | | | | 350,874 | | | | 20,939 | | | | 308,444 | | | | 67,153 | | | | 768,595 | | | | 62,558 | | | | 755,003 | |
| | — | | | | — | | | | 740 | | | | 10,730 | | | | 93 | | | | 460 | | | | 5,640 | | | | 66,335 | |
| | (17,203 | ) | | | (241,699 | ) | | | (60,296 | ) | | | (889,266 | ) | | | (29,336 | ) | | | (339,479 | ) | | | (69,141 | ) | | | (843,828 | ) |
| | 7,594 | | | | 109,175 | | | | (38,617 | ) | | | (570,092 | ) | | | 37,910 | | | | 429,576 | | | | (943 | ) | | | (22,490 | ) |
| | | | | | | | | | | | | | | | | | | | | | | | | | | | | | |
| | — | | | | — | | | | 650 | | | | 10,000 | | | | — | | | | — | | | | 806 | | | | 10,005 | |
| | — | | | | — | | | | 9 | | | | 134 | | | | 2 | | | | 27 | | | | 28 | | | | 326 | |
| | — | | | | — | | | | — | | | | — | | | | — | | | | — | | | | (1 | ) | | | (5 | ) |
| | — | | | | — | | | | 659 | | | | 10,134 | | | | 2 | | | | 27 | | | | 833 | | | | 10,326 | |
| | (1,039,430 | ) | | $ | (14,473,017 | ) | | | (2,809,425 | ) | | $ | (40,971,070 | ) | | | (3,347,335 | ) | | $ | (38,645,863 | ) | | | (4,072,839 | ) | | $ | (50,706,125 | ) |
73
GOLDMAN SACHS BALANCED STRATEGY PORTFOLIO
Notes to Financial Statements (continued)
June 30, 2016 (Unaudited)
|
| 10. SUMMARY OF SHARE TRANSACTIONS (continued) |
Share activity is as follows:
| | | | | | | | | | | | | | | | |
| | | Growth Strategy Portfolio | |
| | | | |
| | | For the Six Months Ended
June 30, 2016
(Unaudited) | | | For the Fiscal Year Ended
December 31, 2015
| |
| | | | |
| | | Shares | | | Dollars | | | Shares | | | Dollars | |
| | | | |
| Class A Shares | | | | | | | | | | | | | | | | |
Shares sold | | | 691,132 | | | $ | 8,584,032 | | | | 1,511,876 | | | $ | 19,926,822 | |
Reinvestment of distributions | | | — | | | | — | | | | 386,955 | | | | 4,964,638 | |
Shares redeemed | | | (2,503,325 | ) | | | (31,319,565 | ) | | | (5,237,451 | ) | | | (68,894,549 | ) |
| | | | (1,812,193 | ) | | | (22,735,533 | ) | | | (3,338,620 | ) | | | (44,003,089 | ) |
| Class C Shares | | | | | | | | | | | | | | | | |
Shares sold | | | 248,364 | | | | 3,067,319 | | | | 548,668 | | | | 7,149,402 | |
Reinvestment of distributions | | | — | | | | — | | | | 79,160 | | | | 1,013,242 | |
Shares redeemed | | | (1,034,409 | ) | | | (12,824,200 | ) | | | (2,637,119 | ) | | | (34,481,265 | ) |
| | | | (786,045 | ) | | | (9,756,881 | ) | | | (2,009,291 | ) | | | (26,318,621 | ) |
| Institutional Shares | | | | | | | | | | | | | | | | |
Shares sold | | | 1,061,657 | | | | 13,031,465 | | | | 6,147,217 | | | | 79,984,554 | |
Reinvestment of distributions | | | — | | | | — | | | | 462,758 | | | | 5,927,936 | |
Shares redeemed | | | (1,872,785 | ) | | | (23,341,813 | ) | | | (3,465,050 | ) | | | (45,715,102 | ) |
| | | | (811,128 | ) | | | (10,310,348 | ) | | | 3,144,925 | | | | 40,197,388 | |
| Service Shares | | | | | | | | | | | | | | | | |
Shares sold | | | 17,879 | | | | 222,134 | | | | 30,816 | | | | 406,731 | |
Reinvestment of distributions | | | — | | | | — | | | | 534 | | | | 6,830 | |
Shares redeemed | | | (16,858 | ) | | | (214,210 | ) | | | (57,719 | ) | | | (752,000 | ) |
| | | | 1,021 | | | | 7,924 | | | | (26,369 | ) | | | (338,439 | ) |
| Class IR Shares | | | | | | | | | | | | | | | | |
Shares sold | | | 29,533 | | | | 362,426 | | | | 56,747 | | | | 740,404 | |
Reinvestment of distributions | | | — | | | | — | | | | 6,138 | | | | 77,652 | |
Shares redeemed | | | (50,580 | ) | | | (623,295 | ) | | | (87,431 | ) | | | (1,117,848 | ) |
| | | | (21,047 | ) | | | (260,869 | ) | | | (24,546 | ) | | | (299,792 | ) |
| Class R Shares | | | | | | | | | | | | | | | | |
Shares sold | | | 60,656 | | | | 727,739 | | | | 55,152 | | | | 709,805 | |
Reinvestment of distributions | | | — | | | | — | | | | 2,235 | | | | 28,023 | |
Shares redeemed | | | (32,664 | ) | | | (400,761 | ) | | | (65,230 | ) | | | (842,319 | ) |
| | | | 27,992 | | | | 326,978 | | | | (7,843 | ) | | | (104,491 | ) |
| Class R6 Shares(a) | | | | | | | | | | | | | | | | |
Shares sold | | | — | | | | — | | | | 745 | | | | 10,005 | |
Reinvestment of distributions | | | — | | | | — | | | | 15 | | | | 193 | |
Shares redeemed | | | — | | | | — | | | | (1 | ) | | | (5 | ) |
| | | | — | | | | — | | | | 759 | | | | 10,193 | |
NET DECREASE | | | (3,401,400 | ) | | $ | (42,728,729 | ) | | | (2,260,985 | ) | | $ | (30,856,851 | ) |
| (a) | | Commenced operations on July 31, 2015. |
74
GOLDMAN SACHS BALANCED STRATEGY PORTFOLIO
|
| 10. SUMMARY OF SHARE TRANSACTIONS (continued) |
Share activity is as follows:
| | | | | | | | | | | | | | | | |
| | | Satellite Strategies Portfolio | |
| | | For the Six Months Ended
June 30, 2016
(Unaudited) | | | For the Fiscal Year Ended
December 31, 2015 | |
| | | Shares | | | Dollars | | | Shares | | | Dollars | |
| | | | |
| Class A Shares | | | | | | | | | | | | | | | | |
Shares sold | | | 983,368 | | | $ | 7,369,110 | | | | 3,053,112 | | | $ | 24,160,171 | |
Reinvestment of distributions | | | 156,340 | | | | 1,197,159 | | | | 416,665 | | | | 3,217,214 | |
Shares redeemed | | | (3,346,449 | ) | | | (25,008,949 | ) | | | (10,046,496 | ) | | | (79,422,300 | ) |
| | | | (2,206,741 | ) | | | (16,442,680 | ) | | | (6,576,719 | ) | | | (52,044,915 | ) |
| Class C Shares | | | | | | | | | | | | | | | | |
Shares sold | | | 92,875 | | | | 686,509 | | | | 473,325 | | | | 3,696,702 | |
Reinvestment of distributions | | | 56,608 | | | | 430,786 | | | | 144,352 | | | | 1,108,594 | |
Shares redeemed | | | (1,388,728 | ) | | | (10,215,558 | ) | | | (4,416,585 | ) | | | (34,528,139 | ) |
| | | | (1,239,245 | ) | | | (9,098,263 | ) | | | (3,798,908 | ) | | | (29,722,843 | ) |
| Institutional Shares | | | | | | | | | | | | | | | | |
Shares sold | | | 6,055,731 | | | | 44,780,963 | | | | 16,547,453 | | | | 130,796,353 | |
Reinvestment of distributions | | | 856,731 | | | | 6,542,995 | | | | 2,074,866 | | | | 15,974,611 | |
Shares redeemed | | | (20,334,457 | ) | | | (151,191,063 | ) | | | (36,331,336 | ) | | | (285,068,382 | ) |
| | | | (13,421,995 | ) | | | (99,867,105 | ) | | | (17,709,017 | ) | | | (138,297,418 | ) |
| Service Shares | | | | | | | | | | | | | | | | |
Shares sold | | | 3,326 | | | | 24,593 | | | | 91,527 | | | | 720,762 | |
Reinvestment of distributions | | | 266 | | | | 2,030 | | | | 636 | | | | 4,902 | |
Shares redeemed | | | (74,825 | ) | | | (551,014 | ) | | | (1,755,150 | ) | | | (14,049,930 | ) |
| | | | (71,233 | ) | | | (524,391 | ) | | | (1,662,987 | ) | | | (13,324,266 | ) |
| Class IR Shares | | | | | | | | | | | | | | | | |
Shares sold | | | 1,215,969 | | | | 9,113,585 | | | | 2,415,950 | | | | 19,126,605 | |
Reinvestment of distributions | | | 110,698 | | | | 845,460 | | | | 272,144 | | | | 2,096,195 | |
Shares redeemed | | | (2,050,984 | ) | | | (15,290,625 | ) | | | (4,524,440 | ) | | | (35,516,369 | ) |
| | | | (724,317 | ) | | | (5,331,580 | ) | | | (1,836,346 | ) | | | (14,293,569 | ) |
| Class R Shares | | | | | | | | | | | | | | | | |
Shares sold | | | 49,279 | | | | 361,209 | | | | 52,342 | | | | 412,303 | |
Reinvestment of distributions | | | 3,949 | | | | 30,098 | | | | 8,789 | | | | 67,419 | |
Shares redeemed | | | (88,787 | ) | | | (662,864 | ) | | | (85,496 | ) | | | (672,855 | ) |
| | | | (35,559 | ) | | | (271,557 | ) | | | (24,365 | ) | | | (193,133 | ) |
| Class R6 Shares(a) | | | | | | | | | | | | | | | | |
Shares sold | | | 3,021 | | | | 23,034 | | | | 1,265 | | | | 10,000 | |
Reinvestment of distributions | | | 43 | | | | 330 | | | | 20 | | | | 152 | |
| | | | 3,064 | | | | 23,364 | | | | 1,285 | | | | 10,152 | |
NET DECREASE | | | (17,696,026 | ) | | $ | (131,512,212 | ) | | | (31,607,057 | ) | | $ | (247,865,992 | ) |
| (a) | | Commenced operations on July 31, 2015. |
75
GOLDMAN SACHS FUND OF FUNDS PORTFOLIOS
Portfolio Expenses — Six Month Period Ended June 30, 2016 (Unaudited)
As a shareholder of Class A, Class C, Institutional, Service, Class IR, Class R and Class R6 Shares of a Portfolio, you incur two types of costs: (1) transaction costs, including sales charges on purchase payments (with respect to Class A Shares), contingent deferred sales charges on redemptions (with respect to Class C Shares), and (2) ongoing costs, including management fees; distribution and service (12b-1) fees (with respect to Class A, Class C and Class R Shares); and other Portfolio expenses. This Example is intended to help you understand your ongoing costs (in dollars) of investing in Class A, Class C, Institutional, Service, Class IR, Class R or Class R6 Shares of the Portfolios and to compare these costs with the ongoing costs of investing in other mutual funds.
The Example is based on an investment of $1,000 invested at the beginning of the period and held for the entire period from January 1, 2016 through June 30, 2016, which represents a period of 183 days in a 366-day year.
Actual Expenses — The first line under each share class in the table below provides information about actual account values and actual expenses. You may use the information in this line, together with the amount you invested, to estimate the expenses that you paid over the period. Simply divide your account value by $1,000 (for example, an $8,600 account value divided by $1,000=8.6), then multiply the result by the number in the first line under the heading entitled “Expenses Paid” to estimate the expenses you paid on your account during this period.
Hypothetical Example for Comparison Purposes — The second line under each share class in the table below provides information about hypothetical account values and hypothetical expenses based on the Portfolios’ actual net expense ratios and an assumed rate of return of 5% per year before expenses, which is not the Portfolios’ actual return. The hypothetical account values and expenses may not be used to estimate the actual ending account balance or expenses you paid for the period. You may use this information to compare the ongoing costs of investing in the Portfolios and other funds. To do so, compare this 5% hypothetical example with the 5% hypothetical examples that appear in the shareholder reports of the other funds.
Please note that the expenses shown in the table are meant to highlight your ongoing costs only and do not reflect any transactional costs, such as sales charges, redemption fees, or exchange fees and do not include expenses of Underlying Funds in which the Portfolios invest. Therefore, the second line of the table is useful in comparing ongoing costs only, and will not help you determine the relative total costs of owning different funds. In addition, if these transactional costs were included, your costs would have been higher.
| | | | | | | | | | | | | | | | | | | | | | | | | | | | | | | | | | | | | | | | | | | | | | | | | | | | | | | | | | | | |
| | | Balanced Strategy Portfolio | | | Equity Growth Strategy Portfolio | | | Growth and Income Strategy Portfolio | | | Growth Strategy Portfolio | | | Satellite Strategies Portfolio | |
| Share Class | | Beginning
Account
Value
1/1/16 | | | Ending
Account
Value
6/30/16 | | | Expenses Paid for the
6 months
ended
6/30/16* | | | Beginning
Account
Value
1/1/16 | | | Ending
Account
Value
6/30/16 | | | Expenses Paid for the
6 months
ended
6/30/16* | | | Beginning
Account
Value
1/1/16 | | | Ending
Account
Value
6/30/16 | | | Expenses Paid for the
6 months
ended
6/30/16* | | | Beginning
Account
Value
1/1/16 | | | Ending
Account
Value
6/30/16 | | | Expenses Paid for the
6 months
ended
6/30/16* | | | Beginning
Account
Value
1/1/16 | | | Ending
Account
Value
6/30/16 | | | Expenses
Paid for the
6 months
ended
6/30/16* | |
| Class A | | | | | | | | | | | | | | | | | | | | | | | | | | | | | | | | | | | | | | | | | | | | | | | | | | | | | | | | | | | | |
Actual | | $ | 1,000.00 | | | $ | 1,024.20 | | | $ | 2.97 | | | $ | 1,000.00 | | | $ | 1,003.50 | | | $ | 2.94 | | | $ | 1,000.00 | | | $ | 1,015.50 | | | $ | 2.96 | | | $ | 1,000.00 | | | $ | 1,007.10 | | | $ | 2.94 | | | $ | 1,000.00 | | | $ | 1,049.90 | | | $ | 2.91 | |
Hypothetical 5% return | | | 1,000.00 | | | | 1,021.93 | + | | | 2.97 | | | | 1,000.00 | | | | 1,021.93 | + | | | 2.97 | | | | 1,000.00 | | | | 1,021.93 | + | | | 2.97 | | | | 1,000.00 | | | | 1,021.93 | + | | | 2.97 | | | | 1,000.00 | | | | 1,022.03 | + | | | 2.87 | |
| Class C | | | | | | | | | | | | | | | | | | | | | | | | | | | | | | | | | | | | | | | | | | | | | | | | | | | | | | | | | | | | |
Actual | | | 1,000.00 | | | | 1,019.30 | | | | 6.73 | | | | 1,000.00 | | | | 999.30 | | | | 6.66 | | | | 1,000.00 | | | | 1,011.40 | | | | 6.70 | | | | 1,000.00 | | | | 1,003.20 | | | | 6.67 | | | | 1,000.00 | | | | 1,046.50 | | | | 6.72 | |
Hypothetical 5% return | | | 1,000.00 | | | | 1,018.20 | + | | | 6.72 | | | | 1,000.00 | | | | 1,018.20 | + | | | 6.72 | | | | 1,000.00 | | | | 1,018.20 | + | | | 6.72 | | | | 1,000.00 | | | | 1,018.20 | + | | | 6.72 | | | | 1,000.00 | | | | 1,018.30 | + | | | 6.62 | |
| Institutional | | | | | | | | | | | | | | | | | | | | | | | | | | | | | | | | | | | | | | | | | | | | | | | | | | | | | | | | | | | | |
Actual | | | 1,000.00 | | | | 1,025.10 | | | | 0.96 | | | | 1,000.00 | | | | 1,005.50 | | | | 0.95 | | | | 1,000.00 | | | | 1,017.40 | | | | 0.95 | | | | 1,000.00 | | | | 1,008.70 | | | | 0.95 | | | | 1,000.00 | | | | 1,053.40 | | | | 0.87 | |
Hypothetical 5% return | | | 1,000.00 | | | | 1,023.92 | + | | | 0.96 | | | | 1,000.00 | | | | 1,023.92 | + | | | 0.96 | | | | 1,000.00 | | | | 1,023.92 | + | | | 0.96 | | | | 1,000.00 | | | | 1,023.92 | + | | | 0.96 | | | | 1,000.00 | | | | 1,024.02 | + | | | 0.86 | |
| Service | | | | | | | | | | | | | | | | | | | | | | | | | | | | | | | | | | | | | | | | | | | | | | | | | | | | | | | | | | | | |
Actual | | | 1,000.00 | | | | 1,031.20 | | | | 3.48 | | | | 1,000.00 | | | | 1,002.80 | | | | 3.44 | | | | 1,000.00 | | | | 1,014.40 | | | | 3.46 | | | | 1,000.00 | | | | 1,006.30 | | | | 3.44 | | | | 1,000.00 | | | | 1,050.40 | | | | 3.42 | |
Hypothetical 5% return | | | 1,000.00 | | | | 1,021.43 | + | | | 3.47 | | | | 1,000.00 | | | | 1,021.43 | + | | | 3.47 | | | | 1,000.00 | | | | 1,021.43 | + | | | 3.47 | | | | 1,000.00 | | | | 1,021.43 | + | | | 3.47 | | | | 1,000.00 | | | | 1,021.53 | + | | | 3.37 | |
| Class IR | | | | | | | | | | | | | | | | | | | | | | | | | | | | | | | | | | | | | | | | | | | | | | | | | | | | | | | | | | | | |
Actual | | | 1,000.00 | | | | 1,025.50 | | | | 1.71 | | | | 1,000.00 | | | | 1,004.20 | | | | 1.69 | | | | 1,000.00 | | | | 1,016.80 | | | | 1.70 | | | | 1,000.00 | | | | 1,008.80 | | | | 1.70 | | | | 1,000.00 | | | | 1,052.70 | | | | 1.63 | |
Hypothetical 5% return | | | 1,000.00 | | | | 1,023.17 | + | | | 1.71 | | | | 1,000.00 | | | | 1,023.17 | + | | | 1.71 | | | | 1,000.00 | | | | 1,023.17 | + | | | 1.71 | | | | 1,000.00 | | | | 1,023.17 | + | | | 1.71 | | | | 1,000.00 | | | | 1,023.27 | + | | | 1.61 | |
| Class R | | | | | | | | | | | | | | | | | | | | | | | | | | | | | | | | | | | | | | | | | | | | | | | | | | | | | | | | | | | | |
Actual | | | 1,000.00 | | | | 1,025.10 | | | | 4.23 | | | | 1,000.00 | | | | 1,002.10 | | | | 4.18 | | | | 1,000.00 | | | | 1,013.20 | | | | 4.20 | | | | 1,000.00 | | | | 1,006.40 | | | | 4.19 | | | | 1,000.00 | | | | 1,049.00 | | | | 4.18 | |
Hypothetical 5% return | | | 1,000.00 | | | | 1,020.69 | + | | | 4.22 | | | | 1,000.00 | | | | 1,020.69 | + | | | 4.22 | | | | 1,000.00 | | | | 1,020.69 | + | | | 4.22 | | | | 1,000.00 | | | | 1,020.69 | +�� | | | 4.22 | | | | 1,000.00 | | | | 1,020.79 | + | | | 4.12 | |
| Class R6 | | | | | | | | | | | | | | | | | | | | | | | | | | | | | | | | | | | | | | | | | | | | | | | | | | | | | | | | | | | | |
Actual | | | 1,000.00 | | | | 1,026.10 | | | | 1.01 | | | | 1,000.00 | | | | 1,004.80 | | | | 0.95 | | | | 1,000.00 | | | | 1,016.50 | | | | 0.95 | | | | 1,000.00 | | | | 1,008.70 | | | | 0.95 | | | | 1,000.00 | | | | 1,052.10 | | | | 0.82 | |
Hypothetical 5% return | | | 1,000.00 | | | | 1,023.87 | + | | | 1.01 | | | | 1,000.00 | | | | 1,023.92 | + | | | 0.96 | | | | 1,000.00 | | | | 1,023.92 | + | | | 0.96 | | | | 1,000.00 | | | | 1,023.92 | + | | | 0.96 | | | | 1,000.00 | | | | 1,024.07 | + | | | 0.81 | |
| * | | Expenses for each share class are calculated using each Portfolio’s annualized net expense ratio for each class, which represents the ongoing expenses as a percentage of net assets for the six months ended June 30, 2016. Expenses are calculated by multiplying the annualized net expense ratio by the average account value for the period; then multiplying the result by the number of days in the most recent fiscal half year; and then dividing that result by the number of days in the fiscal year. The annualized net expense ratios for the period were as follows: |
| | | | | | | | | | | | | | | | | | | | | | | | | | | | |
| Portfolio | | Class A | | | Class C | | | Institutional | | | Service | | | Class IR | | | Class R | | | Class R6 | |
Balanced Strategy | | | 0.59 | | | | 1.34 | | | | 0.19 | | | | 0.69 | | | | 0.34 | | | | 0.84 | | | | 0.20 | |
Equity Growth Strategy | | | 0.59 | | | | 1.34 | | | | 0.19 | | | | 0.69 | | | | 0.34 | | | | 0.84 | | | | 0.19 | |
Growth and Income Strategy | | | 0.59 | | | | 1.34 | | | | 0.19 | | | | 0.69 | | | | 0.34 | | | | 0.84 | | | | 0.19 | |
Growth Strategy | | | 0.59 | | | | 1.34 | | | | 0.19 | | | | 0.69 | | | | 0.34 | | | | 0.84 | | | | 0.19 | |
Satellite Strategies | | | 0.57 | | | | 1.32 | | | | 0.17 | | | | 0.67 | | | | 0.32 | | | | 0.82 | | | | 0.16 | |
| | + | | Hypothetical expenses are based on each Portfolio’s actual annualized net expense ratios and an assumed rate of return of 5% per year before expenses. | |
76
GOLDMAN SACHS FUND OF FUNDS PORTFOLIOS
Statement Regarding Basis for Approval of Management Agreement (Unaudited)
Background
The Goldman Sachs Balanced Strategy Portfolio, Goldman Sachs Equity Growth Strategy Portfolio, Goldman Sachs Growth and Income Strategy Portfolio, Goldman Sachs Growth Strategy Portfolio, and Goldman Sachs Satellite Strategies Portfolio (the “Portfolios”) are investment portfolios of Goldman Sachs Trust (the “Trust”). The Board of Trustees oversees the management of the Trust and reviews the investment performance and expenses of the Portfolios at regularly scheduled meetings held throughout the year. In addition, the Board of Trustees determines annually whether to approve the continuance of the Trust’s investment management agreement (the “Management Agreement”) with Goldman Sachs Asset Management, L.P. (the “Investment Adviser”) on behalf of the Portfolios.
The Management Agreement was most recently approved for continuation until June 30, 2017 by the Board of Trustees, including those Trustees who are not parties to the Management Agreement or “interested persons” (as defined in the Investment Company Act of 1940, as amended) of any party thereto (the “Independent Trustees”), at a meeting held on June 15-16, 2016 (the “Annual Meeting”).
The review process undertaken by the Trustees spans the course of the year and culminates with the Annual Meeting. To assist the Trustees in their deliberations, the Trustees have established a Contract Review Committee (the “Committee”), comprised of the Independent Trustees. The Committee held three meetings over the course of the year since the Management Agreement was last approved. At those Committee meetings, regularly scheduled Board or other committee meetings, and/or the Annual Meeting, matters relevant to the renewal of the Management Agreement were considered by the Board, or the Independent Trustees, as applicable. With respect to each Portfolio, such matters included:
| | (a) | | the nature and quality of the advisory, administrative, and other services provided to the Portfolio and the underlying funds in which it invests (the “Underlying Funds”) by the Investment Adviser and its affiliates, including information about: |
| | (i) | | the structure, staff, and capabilities of the Investment Adviser and its portfolio management teams; |
| | (ii) | | the groups within the Investment Adviser and its affiliates that support the portfolio management teams or provide other types of necessary services, including fund services groups (e.g., accounting and financial reporting, tax, shareholder services, and operations); controls and risk management groups (e.g., legal, compliance, valuation oversight, credit risk management, internal audit, compliance testing, market risk analysis, finance, and central funding); sales and distribution support groups, and others (e.g., information technology and training); |
| | (iii) | | trends in employee headcount; |
| | (iv) | | the Investment Adviser’s financial resources and ability to hire and retain talented personnel and strengthen its operations; and |
| | (v) | | the parent company’s support of the Investment Adviser and its mutual fund business, as expressed by the firm’s senior management; |
| | (b) | | information on the investment performance of the Portfolio and Underlying Funds, including comparisons to the performance of similar mutual funds, as provided by a third-party mutual fund data provider engaged as part of the contract review process (the ��Outside Data Provider”), and a benchmark performance index; and general investment outlooks in the markets in which the Underlying Funds invest; |
| | (c) | | information provided by the Investment Adviser indicating the Investment Adviser’s views on whether the Portfolio’s peer group and/or benchmark index had high, medium, or low relevance given the Portfolio’s particular investment strategy; |
| | (d) | | the terms of the Management Agreement and other agreements with affiliated service providers entered into by the Trust on behalf of the Portfolio; |
| | (e) | | fee and expense information for the Portfolio, including: |
| | (i) | | the relative management fee and expense level of the Portfolio as compared to those of comparable funds managed by other advisers, as provided by the Outside Data Provider; and |
| | (ii) | | the Portfolio’s expense trends over time; |
| | (f) | | with respect to the extensive investment performance and expense comparison data provided by the Outside Data Provider, its processes in producing that data for the Portfolio; |
| | (g) | | the undertaking of the Investment Adviser to limit certain expenses of the Portfolio and the Underlying Funds that exceed specified levels; |
| | (h) | | information relating to the profitability of the Management Agreement and the transfer agency and distribution and service arrangements of the Portfolio and the Trust as a whole to the Investment Adviser and its affiliates; |
| | (i) | | whether the Portfolio’s existing management fee schedule, together with the management fee schedules of the Underlying Funds, adequately addressed any economies of scale; |
| | (j) | | a summary of the “fall-out” benefits derived by the Investment Adviser and its affiliates from their relationships with the Portfolio and/or the Underlying Funds, including the fees received by the Investment Adviser’s affiliates from the Portfolio and/or the Underlying Funds for transfer agency, securities lending, portfolio trading, distribution and other services; |
77
GOLDMAN SACHS FUND OF FUNDS PORTFOLIOS
Statement Regarding Basis for Approval of Management Agreement (Unaudited) (continued)
| | (k) | | a summary of potential benefits derived by the Portfolio and/or the Underlying Funds as a result of their relationship with the Investment Adviser; |
| | (l) | | with respect to the applicable Underlying Funds, information regarding commissions paid by the Underlying Equity Funds and broker oversight, an update on the Investment Adviser’s soft dollars practices, other information regarding portfolio trading, and how the Investment Adviser carries out its duty to seek best execution; |
| | (m) | | portfolio manager ownership of Portfolio shares; the manner in which portfolio manager compensation is determined; and the number and types of accounts managed by the portfolio managers; |
| | (n) | | the nature and quality of the services provided to the Portfolio and the Underlying Funds by their unaffiliated service providers, and the Investment Adviser’s general oversight and evaluation (including reports on due diligence) of those service providers as part of the administration services provided under the Management Agreement; and |
| | (o) | | the Investment Adviser’s processes and policies addressing various types of potential conflicts of interest; its approach to risk management; the annual review of the effectiveness of the Portfolio’s compliance program; and periodic compliance reports. |
The Trustees also received an overview of the Portfolios’ distribution arrangements. They received information regarding the Portfolios’ assets, share purchase and redemption activity, and payment of distribution, service, and shareholder administration fees, as applicable. Information was also provided to the Trustees relating to revenue sharing payments made by and services provided by the Investment Adviser and its affiliates to intermediaries that promote the sale, distribution, and/or servicing of Portfolio shares. The Independent Trustees also discussed the broad range of other investment choices that are available to Portfolio investors, including the availability of comparable funds managed by other advisers.
The presentations made at the Board and Committee meetings and at the Annual Meeting encompassed the Portfolios and other mutual funds for which the Board of Trustees has responsibility. In evaluating the Management Agreement at the Annual Meeting, the Trustees relied upon their knowledge, resulting from their meetings and other interactions throughout the year, of the Investment Adviser and its affiliates, their services, and the Portfolios. In conjunction with these meetings, the Trustees received written materials and oral presentations on the topics covered, and the Investment Adviser addressed the questions and concerns of the Trustees, including concerns regarding the investment performance of certain of the funds they oversee. The Independent Trustees were advised by their independent legal counsel regarding their responsibilities and other regulatory requirements related to the approval and continuation of mutual fund investment management agreements under applicable law. In addition, the Investment Adviser and its affiliates provided the Independent Trustees with a written response to a formal request for information sent on behalf of the Independent Trustees by their independent legal counsel. During the course of their deliberations, the Independent Trustees met in executive sessions with their independent legal counsel, without representatives of the Investment Adviser or its affiliates present.
Nature, Extent, and Quality of the Services Provided Under the Management Agreement
As part of their review, the Trustees considered the nature, extent, and quality of the services provided to the Portfolios and the Underlying Funds by the Investment Adviser. In this regard, the Trustees considered both the investment advisory services and non-advisory services that are provided by the Investment Adviser and its affiliates. The Trustees noted the transition in the leadership and changes in personnel of various of the Investment Adviser’s portfolio management teams that had occurred in recent periods, and the ongoing recruitment efforts aimed at bringing high quality investment talent to the Investment Adviser. They also noted the Investment Adviser’s commitment to maintaining high quality systems and expending substantial resources to respond to ongoing changes to the regulatory and control environment in which the Portfolios and the Underlying Funds and their service providers operate, as well as the efforts of the Investment Adviser and its affiliates to combat cyber security risks. The Trustees concluded that the Investment Adviser continued to commit substantial financial and operational resources to the Portfolios and expressed confidence that the Investment Adviser would continue to do so in the future. The Trustees also recognized that the Investment Adviser had made significant commitments to address regulatory compliance requirements applicable to the Portfolios, the Underlying Funds, and the Investment Adviser and its affiliates.
Investment Performance
The Trustees also considered the investment performance of the Portfolios and the Underlying Funds. In this regard, they compared the investment performance of each Portfolio to its peers using rankings and ratings compiled by the Outside Data Provider as of December 31, 2015, and updated performance information prepared by the Investment Adviser using the peer group identified by the Outside Data Provider as of March 31, 2016. The information on each Portfolio’s investment performance was provided for the one-, three-, five-, and ten-year periods ending on the applicable dates, to the extent that each Portfolio had been in existence for those periods. The Trustees also reviewed each Portfolio’s investment performance relative to its performance benchmark. As part of this review, they considered the investment performance trends of the Portfolios over time, and reviewed the investment performance of each Portfolio in light of its investment objective and policies and market conditions.
In addition, the Trustees considered materials prepared and presentations made by the Investment Adviser’s senior management and portfolio management personnel in which Portfolio performance was assessed. The Trustees also considered the
78
GOLDMAN SACHS FUND OF FUNDS PORTFOLIOS
Statement Regarding Basis for Approval of Management Agreement (Unaudited) (continued)
Investment Adviser’s periodic reports with respect to the Underlying Funds’ risk profiles, and how the Investment Adviser’s approach to risk monitoring and management influences portfolio management. They noted the efforts of the Portfolios’ portfolio management team to continue to enhance the investment models used in managing the Portfolios.
The Trustees observed that the Balanced Strategy Portfolio’s Institutional Shares had placed in the top half of the Portfolio’s peer group for the one-, three-, and five-year periods, and in the third quartile for the ten-year period, and had underperformed the Portfolio’s benchmark index for the one-, three-, five-, and ten-year periods ended March 31, 2016. The Trustees further observed that the Equity Growth Strategy Portfolio’s Institutional Shares had placed in the top half of the Portfolio’s peer group for the one-, three-, and five-year periods and in the third quartile for the ten-year period, and had outperformed the Portfolio’s benchmark index for the one-, three- and five-year periods and underperformed for the ten-year period ended March 31, 2016. They noted that the Growth and Income Strategy Portfolio’s Institutional Shares had placed in the top half of the Portfolio’s peer group for the one-, three-, and five-year periods and in the third quartile for the ten-year period, and had underperformed the Portfolio’s benchmark index for the one-, three-, five-, and ten-year periods ended March 31, 2016. They observed that the Growth Strategy Portfolio’s Institutional Shares had placed in the top half of the Portfolio’s peer group for the one-, three-, and five-year periods and in the third quartile for the ten-year period, and had outperformed the Portfolio’s benchmark index for the one-year period and underperformed for the three-, five-, and ten-year periods ended March 31, 2016. They noted that the Satellite Strategies Portfolio’s Institutional Shares had placed in the top half of the Portfolio’s peer group for the one-year period, in the third quartile for the five-year period, and in the fourth quartile for the three-year period, and had underperformed the Portfolio’s benchmark index for the one-, three-, and five-year periods ended March 31, 2016. The Trustees noted that the Satellite Strategies Portfolio had certain significant differences from both the Portfolio’s peer group and benchmark index that caused the peer group and benchmark index to be imperfect bases for performance comparison. They also noted that the Portfolios had experienced certain portfolio management changes in 2015.
Costs of Services Provided and Competitive Information
The Trustees considered the contractual terms of the Management Agreement and the fee rates payable by each Portfolio thereunder. In this regard, the Trustees considered information on the services rendered by the Investment Adviser to the Portfolios, which included both advisory and administrative services that were directed to the needs and operations of the Portfolios as registered mutual funds.
In particular, the Trustees reviewed analyses prepared by the Outside Data Provider regarding the expense rankings of the Portfolios. The analyses provided a comparison of each Portfolio’s management fee to those of a relevant peer group and category universe; an expense analysis which compared each Portfolio’s overall net and gross expenses to a peer group and a category universe; and a five-year history comparing each Portfolio’s net expenses to the peer and category medians. The analyses also compared each Portfolio’s transfer agency, custody, and distribution fees, other expenses and fee waivers/reimbursements to those of the peer group and category medians. The Trustees concluded that the comparisons provided by the Outside Data Provider were useful in evaluating the reasonableness of the management fees and total expenses paid by the Portfolios.
In addition, the Trustees considered the Investment Adviser’s undertaking to limit certain expenses of the Portfolios and the Underlying Funds that exceed specified levels. They also noted that the Investment Adviser did not manage other types of accounts having investment objectives and policies similar to those of the Portfolios, and therefore this type of fee comparison was not possible.
In addition, the Trustees noted that shareholders are able to redeem their Portfolio shares at any time if shareholders believe that the Portfolio fees and expenses are too high or if they are dissatisfied with the performance of the Portfolio.
Profitability
The Trustees reviewed the Investment Adviser’s revenues and pre-tax profit margins with respect to the Trust and each of the Portfolios. In this regard the Trustees noted that they had received, among other things, profitability analyses and summaries, revenue and expense schedules by Portfolio and by function (i.e., investment management, transfer agency and distribution and service), and information on the Investment Adviser’s expense allocation methodology. They observed that the profitability and expense figures are substantially similar to those used by the Investment Adviser for many internal purposes, including compensation decisions among various business groups, and are thus subject to a vigorous internal debate about how certain revenue and expenses should be allocated. The Trustees also noted that the internal audit group within the Goldman Sachs organization had audited the expense allocation methodology and was satisfied with the reasonableness, consistency, and accuracy of the Investment Adviser’s expense allocation methodology and profitability analysis calculations. Profitability data for the Trust and each Portfolio were provided for 2015 and 2014, and the Trustees considered this information in relation to the Investment Adviser’s overall profitability. The Trustees considered the Investment Adviser’s revenues and pre-tax profit margins both in absolute terms and in comparison to information on the reported pre-tax profit margins earned by certain other asset management firms.
79
GOLDMAN SACHS FUND OF FUNDS PORTFOLIOS
Statement Regarding Basis for Approval of Management Agreement (Unaudited) (continued)
Economies of Scale
The Trustees considered the information that had been provided regarding the Investment Adviser’s profitability.
The Trustees noted that, although the Portfolios themselves do not have breakpoints in their management fee schedules, any benefits of the breakpoints in the management fee schedules of certain Underlying Funds, when reached, would pass through to the shareholders in the Portfolios at the specified asset levels. The Trustees considered the amounts of assets in the Portfolios; the Portfolios’ recent purchase and redemption activity; the information provided by the Investment Adviser relating to the costs of the services provided by the Investment Adviser and its affiliates and the profits realized by them; information comparing the fee rates charged by the Investment Adviser with fee rates charged to other funds in the peer groups; and the Investment Adviser’s undertaking to limit certain expenses of the Portfolios and Underlying Funds that exceed specified levels. They also considered the services provided to the Portfolios under the Management Agreement and the fees and expenses borne by the Underlying Funds, and determined that the management fees payable by the Portfolios were not duplicative of the management fees paid at the Underlying Fund level.
Other Benefits to the Investment Adviser and Its Affiliates
The Trustees also considered the other benefits derived by the Investment Adviser and its affiliates from their relationships with the Portfolios and/or the Underlying Funds as stated above, including: (a) transfer agency fees received by Goldman, Sachs & Co. (“Goldman Sachs”); (b) brokerage and futures commissions earned by Goldman Sachs for executing securities and futures transactions on behalf of certain Underlying Funds; (c) research received by the Investment Adviser from broker-dealers in exchange for executing certain transactions on behalf of certain Underlying Funds; (d) trading efficiencies resulting from aggregation of orders of the Underlying Funds with those for other funds or accounts managed by the Investment Adviser; (e) fees earned by Goldman Sachs Agency Lending (“GSAL”), an affiliate of the Investment Adviser, as securities lending agent for certain Underlying Funds (and fees earned by the Investment Adviser for managing the fund in which those Underlying Funds’ cash collateral is invested); (f) the Investment Adviser’s ability to leverage the infrastructure designed to service the Portfolios on behalf of its other clients; (g) the Investment Adviser’s ability to cross-market other products and services to Portfolio shareholders; (h) Goldman Sachs’ retention of certain fees as Portfolio Distributor; (i) the Investment Adviser’s ability to negotiate better pricing with custodians on behalf of its other clients, as a result of the relationship with the Portfolios and Underlying Funds; and (j) the possibility that the working relationship between the Investment Adviser and the Portfolios’ and Underlying Funds’ third-party service providers may cause those service providers to be more likely to do business with other areas of Goldman Sachs. In the course of considering the foregoing, the Independent Trustees requested and received further information quantifying certain of these fall-out benefits.
Other Benefits to the Portfolios and Their Shareholders
The Trustees also noted that the Portfolios and/or the Underlying Funds receive certain potential benefits as a result of their relationship with the Investment Adviser, including: (a) trading efficiencies resulting from aggregation of orders of the Underlying Funds with those of other funds or accounts managed by the Investment Adviser; (b) enhanced servicing from vendors because of the volume of business generated by the Investment Adviser and its affiliates; (c) with respect to the Underlying Funds, enhanced servicing from broker-dealers because of the volume of business generated by the Investment Adviser and its affiliates; (d) with respect to certain Underlying Funds, the Investment Adviser’s ability to negotiate favorable terms with derivatives counterparties as a result of the size and reputation of the Goldman Sachs organization; (e) the Investment Adviser’s knowledge and experience gained from managing other accounts and products; (f) the Investment Adviser’s ability to hire and retain qualified personnel to provide services to the Portfolios and the Underlying Funds because of the reputation of the Goldman Sachs organization; (g) the Portfolios’ and Underlying Funds’ access, through the Investment Adviser, to certain firmwide resources (e.g., proprietary risk management systems and databases), subject to certain restrictions; and (h) with respect to certain Underlying Funds, the ability to participate in the securities lending program administered by GSAL, as measured by the revenue received by the Underlying Funds in connection with the program; and (i) the Portfolios’ access to certain affiliated distribution channels. In addition, the Trustees noted the competitive nature of the mutual fund marketplace, and considered that many of the Portfolios’ shareholders invested in the Portfolios in part because of the Portfolios’ relationship with the Investment Adviser and that those shareholders have a general expectation that the relationship will continue.
Conclusion
In connection with their consideration of the Management Agreement, the Trustees gave weight to each of the factors described above, but did not identify any particular factor as controlling their decision. After deliberation and consideration of all of the information provided, including the factors described above, the Trustees concluded, in the exercise of their business judgment, that the management fees paid by each of the Portfolios were reasonable in light of the services provided to it by the Investment Adviser, the Investment Adviser’s costs and each Portfolio’s current and reasonably foreseeable asset levels. The Trustees unanimously concluded that the Investment Adviser’s continued management likely would benefit each Portfolio and its shareholders and that the Management Agreement should be approved and continued with respect to each Portfolio until June 30, 2017.
80
FUNDS PROFILE
Goldman Sachs Funds

Goldman Sachs is a premier financial services firm, known since 1869 for creating thoughtful and customized investment solutions in complex global markets.
Today, the Investment Management Division of Goldman Sachs serves a diverse set of clients worldwide, including private institutions, public entities and individuals. With approximately $1.12 trillion in assets under supervision as of June 30, 2016, Goldman Sachs Asset Management (“GSAM”) has portfolio management teams located around the world and our investment professionals bring firsthand knowledge of local markets to every investment decision. Assets under supervision includes assets under management and other client assets for which Goldman Sachs does not have full discretion. GSAM leverages the resources of Goldman, Sachs & Co. subject to legal, internal and regulatory restrictions.

Money Market1
Financial Square FundsSM
| n | | Financial Square Treasury Solutions Fund2 |
| n | | Financial Square Government Fund |
| n | | Financial Square Money Market Fund |
| n | | Financial Square Prime Obligations Fund |
| n | | Financial Square Treasury Instruments Fund |
| n | | Financial Square Treasury Obligations Fund |
| n | | Financial Square Federal Instruments Fund |
| n | | Financial Square Tax-Exempt Money Market Fund |
Investor FundsSM
| n | | Investor Money Market Fund |
| n | | Investor Tax-Exempt Money Market Fund3 |
Fixed Income
Short Duration and Government
| n | | High Quality Floating Rate Fund |
| n | | Short-Term Conservative Income Fund4 |
| n | | Short Duration Government Fund |
| n | | Short Duration Income Fund |
| n | | Inflation Protected Securities Fund |
Multi-Sector
Municipal and Tax-Free
| n | | High Yield Municipal Fund |
| n | | Dynamic Municipal Income Fund |
| n | | Short Duration Tax-Free Fund |
Single Sector
| n | | Investment Grade Credit Fund |
| n | | High Yield Floating Rate Fund |
| n | | Emerging Markets Debt Fund |
| n | | Local Emerging Markets Debt Fund |
| n | | Dynamic Emerging Markets Debt Fund |
Fixed Income Alternatives
| n | | Long Short Credit Strategies Fund |
| n | | Fixed Income Macro Strategies Fund |
Fundamental Equity
| n | | Small/Mid Cap Value Fund |
| n | | Small/Mid Cap Growth Fund |
| n | | Flexible Cap Growth Fund |
| n | | Concentrated Growth Fund |
| n | | Technology Opportunities Fund5 |
| n | | Growth Opportunities Fund |
| n | | Rising Dividend Growth Fund |
| n | | Dynamic U.S. Equity Fund |
Tax-Advantaged Equity
| n | | U.S. Tax-Managed Equity Fund |
| n | | International Tax-Managed Equity Fund |
| n | | U.S. Equity Dividend and Premium Fund |
| n | | International Equity Dividend and Premium Fund |
Equity Insights
| n | | Small Cap Equity Insights Fund |
| n | | U.S. Equity Insights Fund |
| n | | Small Cap Growth Insights Fund |
| n | | Large Cap Growth Insights Fund |
| n | | Large Cap Value Insights Fund |
| n | | Small Cap Value Insights Fund |
| n | | International Small Cap Insights Fund6 |
| n | | International Equity Insights Fund |
| n | | Emerging Markets Equity Insights Fund |
Fundamental Equity International
| n | | Strategic International Equity Fund |
| n | | Focused International Equity Fund |
| n | | Emerging Markets Equity Fund7 |
Select Satellite8
| n | | Real Estate Securities Fund |
| n | | International Real Estate Securities Fund |
| n | | Commodity Strategy Fund |
| n | | Global Real Estate Securities Fund |
| n | | Dynamic Commodity Strategy Fund |
| n | | Dynamic Allocation Fund |
| n | | Absolute Return Tracker Fund |
| n | | Managed Futures Strategy Fund |
| n | | MLP Energy Infrastructure Fund |
| n | | Multi-Manager Alternatives Fund |
| n | | Multi-Asset Real Return Fund |
| n | | Absolute Return Multi-Asset Fund |
| n | | Global Infrastructure Fund |
Total Portfolio Solutions8
| n | | Global Managed Beta Fund |
| n | | Multi-Manager Non-Core Fixed Income Fund |
| n | | Multi-Manager U.S. Dynamic Equity Fund |
| n | | Multi-Manager Global Equity Fund |
| n | | Multi-Manager International Equity Fund |
| n | | Tactical Tilt Overlay Fund9 |
| n | | Balanced Strategy Portfolio |
| n | | Multi-Manager U.S. Small Cap Equity Fund |
| n | | Multi-Manager Real Assets Strategy Fund |
| n | | Growth and Income Strategy Portfolio |
| n | | Growth Strategy Portfolio |
| n | | Equity Growth Strategy Portfolio |
| n | | Satellite Strategies Portfolio |
| n | | Enhanced Dividend Global Equity Portfolio |
| n | | Tax Advantaged Global Equity Portfolio |
| n | | Strategic Factor Allocation Fund |
| 1 | | An investment in a money market portfolio is not insured or guaranteed by the Federal Deposit Insurance Corporation or any other government agency. Although a money market portfolio seeks to preserve the value of an investment at $1.00 per share, it is possible to lose money by investing in a money market portfolio. The Fund’s sponsor has no legal obligation to provide financial support to a money market portfolio, and you should not expect that the sponsor will provide financial support to the money market portfolio at any time. |
| 2 | | Effective on September 30, 2015, the Goldman Sachs Financial Square Federal Fund was renamed the Goldman Sachs Financial Square Treasury Solutions Fund. |
| 3 | | Effective on March 31, 2016, the Goldman Sachs Financial Square Tax-Free Money Market Fund was renamed the Goldman Sachs Investor Tax-Exempt Money Market Fund. |
| 4 | | Effective on July 29, 2016, the Goldman Sachs Limited Maturity Obligations Fund was renamed the Goldman Sachs Short-Term Conservative Income Fund. |
| 5 | | Effective on July 31, 2015, the Goldman Sachs Technology Tollkeeper Fund was renamed the Goldman Sachs Technology Opportunities Fund. |
| 6 | | Effective at the close of business on February 5, 2016, the Goldman Sachs International Small Cap Fund was reorganized with and into the Goldman Sachs International Small Cap Insights Fund. |
| 7 | | Effective at the close of business on October 23, 2015, the Goldman Sachs BRIC Fund (Brazil, Russia, India, China) was reorganized with and into the Goldman Sachs Emerging Markets Equity Fund. |
| 8 | | Individual Funds within the Total Portfolio Solutions and Select Satellite categories will have various placement on the risk/return spectrum and may have greater or lesser risk than that indicated by the placement of the general Total Portfolio Solutions or Select Satellite category. |
| 9 | | Effective on June 1, 2016, the Goldman Sachs Tactical Tilt Implementation Fund was renamed the Goldman Sachs Tactical Tilt Overlay Fund. |
| | | Financial Square FundsSM and Investor FundsSM are registered service marks of Goldman, Sachs & Co. |
| * | | This list covers open-end funds only. Please visit our website at www.GSAMFUNDS.com to learn about our closed-end funds and exchange-traded funds. |
| | |
TRUSTEES Ashok N. Bakhru, Chairman Kathryn A. Cassidy Diana M. Daniels Herbert J. Markley James A. McNamara Jessica Palmer Alan A. Shuch Roy W. Templin Gregory G. Weaver | | OFFICERS James A. McNamara, President Scott M. McHugh, Principal Financial Officer, Senior Vice President and Treasurer Caroline L. Kraus, Secretary |
| |
GOLDMAN, SACHS & CO. Distributor and Transfer Agent | | GOLDMAN SACHS ASSET MANAGEMENT, L.P. Investment Adviser |
Visit our web site at www.GSAMFUNDS.com to obtain the most recent month-end returns.
Goldman Sachs Asset Management, L.P. 200 West Street, New York, New York 10282
The portfolio risk management process includes an effort to monitor and manage risk, but does not imply low risk.
The reports concerning the Portfolios included in this shareholder report may contain certain forward-looking statements about the factors that may affect the performance of the Portfolios in the future. These statements are based on Portfolio management’s predictions and expectations concerning certain future events and their expected impact on the Portfolios, such as performance of the economy as a whole and of specific industry sectors, changes in the levels of interest rates, the impact of developing world events, and other factors that may influence the future performance of the Portfolios. Management believes these forward-looking statements to be reasonable, although they are inherently uncertain and difficult to predict. Actual events may cause adjustments in portfolio management strategies from those currently expected to be employed.
Diversification does not protect an investor from market risk does not ensure a profit.
Views and opinions expressed are for informational purposes only and do not constitute a recommendation by GSAM to buy, sell, or hold any security. Views and opinions are current as of the date of this presentation and may be subject to change, they should not be construed as investment advice.
A description of the policies and procedures that the Portfolios use to determine how to vote proxies relating to portfolio securities and information regarding how a Portfolio voted proxies relating to portfolio securities during the most recent 12-month period ended June 30 is available (i) without charge, upon request by calling 1-800-526-7384 (for Retail Shareholders) or 1-800-621-2550 (for Institutional Shareholders); and (ii) on the Securities and Exchange Commission (“SEC”) web site at http://www.sec.gov.
References to indices, benchmarks or other measures of relative market performance over a specified period of time are provided for your information only and do not imply that the portfolio will achieve similar results. The index composition may not reflect the manner in which a portfolio is constructed. While an adviser seeks to design a portfolio which reflects appropriate risk and return features, portfolio characteristics may deviate from those of the benchmark.
The Portfolios file their complete schedule of portfolio holdings with the SEC for the first and third quarters of each fiscal year on Form N-Q. The Portfolios’ Forms N-Q are available on the SEC’s web site at http://www.sec.gov within 60 days after the Portfolios’ first and third fiscal quarters. When available, the Portfolios’ Forms N-Q may be reviewed and copied at the SEC’s Public Reference Room in Washington, D.C. and information on the operation of the Public Reference Room may also be obtained by calling 1-800-SEC-0330. Forms N-Q may be obtained upon request and without charge by calling 1-800-526-7384 (for Retail Shareholders) or 1-800-621-2550 (for Institutional Shareholders).
Holdings and allocations shown are as of June 30, 2016 and may not be representative of future investments. Portfolio holdings should not be relied on in making investment decisions and should not be construed as research or investment advice regarding particular securities. Current and future holdings are subject to risk.
This material is not authorized for distribution to prospective investors unless preceded or accompanied by a current Prospectus or summary prospectus, if applicable. Investors should consider a Portfolio’s objective, risks, and charges and expenses, and read the summary prospectus, if available, and/or the Prospectus carefully before investing or sending money. The summary prospectus, if available, and the Prospectus contain this and other information about a Portfolio and may be obtained from your Authorized Institution or from Goldman, Sachs & Co. by calling (retail – 1-800-526-7384) (institutional – 1-800-621-2550).
© 2016 Goldman Sachs. All rights reserved. 59036-TMPL-08/2016 FFSAR-16/63K
Goldman Sachs Funds

| | | | |
| | |
| Semi-Annual Report | | | | June 30, 2016 |
| | |
| | | | Global Infrastructure Fund |

Goldman Sachs Global Infrastructure Fund
| | | | |
TABLE OF CONTENTS | | | | |
| |
Portfolio Management Discussion and Analysis | | | 1 | |
| |
Schedule of Investments | | | 4 | |
| |
Financial Statements | | | 5 | |
| |
Financial Highlights | | | 8 | |
| |
Notes to Financial Statements | | | 10 | |
| |
Other Information | | | 18 | |
| | | | |
| | | |
| NOT FDIC-INSURED | | May Lose Value | | No Bank Guarantee |
PORTFOLIO RESULTS
Goldman Sachs Global Infrastructure Fund
Investment Objective
The Goldman Sachs Global Infrastructure Fund (“the Fund”) seeks total return comprised of long-term growth of capital and income.
Portfolio Management Discussion and Analysis
The Fund incepted on June 27, 2016 and, therefore, there is no Manager’s Discussion and Analysis for the period ended June 30, 2016.
1
FUND BASICS
Global Infrastructure Fund
as of June 30, 2016

| | | | | | | | | | |
| | EXPENSE RATIOS1 | |
| | | | | Net Expense Ratio (Current) | | | Gross Expense Ratio (Before Waivers) | |
| | Class A | | | 1.39 | % | | | 2.11 | % |
| | Class C | | | 2.14 | | | | 2.86 | |
| | Institutional | | | 0.99 | | | | 1.71 | |
| | Class IR | | | 1.14 | | | | 1.86 | |
| | Class R | | | 1.64 | | | | 2.36 | |
| | | Class R6 | | | 0.97 | | | | 1.69 | |
| | 1 | | The expense ratios of the Fund, both current (net of applicable fee waivers and/or expense limitations) and before waivers (gross of applicable fee waivers and/or expense limitations) are as set forth above according to the most recent publicly available Prospectus for the Fund and may differ from the expense ratios disclosed in the Financial Highlights in this report. Pursuant to a contractual arrangement, the Fund’s waivers and/or expense limitations will remain in place through at least June 27, 2017, and prior to such date the Investment Adviser may not terminate the arrangements without the approval of the Fund’s Board of Trustees. If these arrangements are discontinued in the future, the expense ratios may change without shareholder approval. |
| | | | | | | | | | |
| | TOP TEN HOLDINGS AS OF 6/30/162 |
| | | Holding | | % of Total
Net Assets | | | Line of Business | | Country |
| | National Grid PLC | | | 9.4 | % | | Multi-Utilities | | United Kingdom |
| | American Tower Corp. | | | 6.7 | | | Real Estate
Investment Trusts | | United States |
| | PG&E Corp. | | | 5.9 | | | Electric Utilities | | United States |
| | Sempra Energy | | | 5.7 | | | Multi-Utilities | | United States |
| | Crown Castle International Corp. | | | 4.7 | | | Real Estate
Investment Trusts | | United States |
| | Enbridge, Inc. | | | 3.9 | | | Oil, Gas &
Consumable Fuels | | Canada |
| | American Water Works Co., Inc. | | | 3.5 | | | Water Utilities | | United States |
| | Eversource Energy | | | 3.5 | | | Electric Utilities | | United States |
| | Consolidated Edison, Inc. | | | 3.4 | | | Multi-Utilities | | United States |
| | | SBA Communications Corp. Class A | | | 2.9 | | | Diversified
Telecommunication
Services | | United States |
| | 2 | | The top 10 holdings may not be representative of the Fund’s future investments. |
2
FUND BASICS
|
| FUND VS. BENCHMARK SECTOR ALLOCATION3 |
| As of June 30, 2016 |
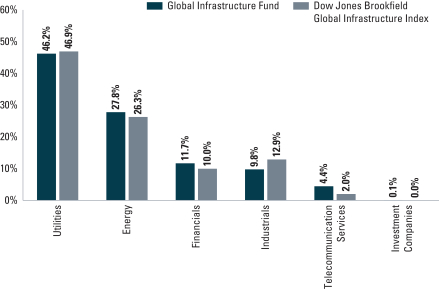
| | 3 | | The Fund is actively managed and, as such, its composition may differ over time. Consequently, the Fund’s overall sector allocations may differ from percentages contained in the graph above. The graph categorizes investments using Global Industry Classification Standard (“GICS”), however, the sector classifications used by the portfolio management team may differ from GICS. Underlying sector allocations of investment companies held by the Fund are not reflected in the graph above. The percentage shown for each investment category reflects the value of investments in that category as a percentage of market value. |
3
GOLDMAN SACHS GLOBAL INFRASTRUCTURE FUND
Schedule of Investments
June 30, 2016 (Unaudited)
| | | | | | | | |
Shares | | | Description | | Value | |
| | | | | | | | |
| | Common Stocks – 97.3% | |
| | Australia – 6.0% | |
| | 5,348 | | | APA Group (Gas Utilities) | | $ | 37,197 | |
| | 12,505 | | | Macquarie Atlas Roads Group (Transportation Infrastructure) | | | 48,770 | |
| | 9,955 | | | Sydney Airport (Transportation Infrastructure) | | | 51,981 | |
| | 5,851 | | | Transurban Group (Transportation Infrastructure) | | | 52,699 | |
| | | | | | | | |
| | | | | | | 190,647 | |
| | |
| | Canada – 9.3% | |
| | 2,888 | | | Enbridge, Inc. (Oil, Gas & Consumable Fuels) | | | 122,342 | |
| | 2,544 | | | Pembina Pipeline Corp. (Oil, Gas & Consumable Fuels) | | | 77,308 | |
| | 2,041 | | | TransCanada Corp. (Oil, Gas & Consumable Fuels) | | | 92,354 | |
| | | | | | | | |
| | | | | | | 292,004 | |
| | |
| | France – 1.3% | |
| | 563 | | | Vinci SA (Construction & Engineering) | | | 39,729 | |
| | |
| | Hong Kong – 4.1% | |
| | 52,000 | | | Beijing Enterprises Water Group Ltd. (Water Utilities) | | | 31,491 | |
| | 24,000 | | | China Gas Holdings Ltd. (Gas Utilities) | | | 36,736 | |
| | 33,000 | | | Hong Kong & China Gas Co. Ltd. (Gas Utilities) | | | 60,298 | |
| | | | | | | | |
| | | | | | | 128,525 | |
| | |
| | Italy – 2.5% | |
| | 3,197 | | | Atlantia SpA (Transportation Infrastructure) | | | 79,877 | |
| | |
| | Japan – 1.9% | |
| | 300 | | | East Japan Railway Co. (Road & Rail) | | | 27,802 | |
| | 8,000 | | | Tokyo Gas Co. Ltd. (Gas Utilities) | | | 33,030 | |
| | | | | | | | |
| | | | | | | 60,832 | |
| | |
| | Spain – 4.1% | |
| | 2,696 | | | Cellnex Telecom SAU(a) (Diversified Telecommunication Services) | | | 42,307 | |
| | 980 | | | Red Electrica Corp. SA (Electric Utilities) | | | 87,567 | |
| | | | | | | | |
| | | | | | | 129,874 | |
| | |
| | United Kingdom – 9.4% | |
| | 20,136 | | | National Grid PLC (Multi-Utilities) | | | 296,106 | |
| | |
| | United States – 58.7% | |
| | 1,855 | | | American Tower Corp. (Real Estate Investment Trusts) | | | 210,747 | |
| | 1,313 | | | American Water Works Co., Inc. (Water Utilities) | | | 110,962 | |
| | 2,225 | | | Archrock Partners LP (Energy Equipment & Services) | | | 30,127 | |
| | 988 | | | Atmos Energy Corp. (Gas Utilities) | | | 80,344 | |
| | 1,724 | | | Cheniere Energy, Inc.* (Oil, Gas & Consumable Fuels) | | | 64,736 | |
| | 1,339 | | | Consolidated Edison, Inc. (Multi-Utilities) | | | 107,709 | |
| | 1,459 | | | Crown Castle International Corp. (Real Estate Investment Trusts) | | | 147,986 | |
| | |
| | | | | | | | |
| | Common Stocks – (continued) | |
| | United States – (continued) | |
| | 1,539 | | | Energy Transfer Partners LP (Oil, Gas & Consumable Fuels) | | $ | 58,590 | |
| | 2,896 | | | Enterprise Products Partners LP (Oil, Gas & Consumable Fuels) | | | 84,737 | |
| | 1,835 | | | Eversource Energy (Electric Utilities) | | | 109,916 | |
| | 3,335 | | | Kinder Morgan, Inc. (Oil, Gas & Consumable Fuels) | | | 62,431 | |
| | 923 | | | MPLX LP (Oil, Gas & Consumable Fuels) | | | 31,040 | |
| | 2,920 | | | PG&E Corp. (Electric Utilities) | | | 186,646 | |
| | 856 | | | SBA Communications Corp. Class A* (Diversified Telecommunication Services) | | | 92,397 | |
| | 1,563 | | | Sempra Energy (Multi-Utilities) | | | 178,213 | |
| | 2,182 | | | Sunoco Logistics Partners LP (Oil, Gas & Consumable Fuels) | | | 62,733 | |
| | 1,825 | | | Targa Resources Corp. (Oil, Gas & Consumable Fuels) | | | 76,906 | |
| | 2,815 | | | The Williams Cos., Inc. (Oil, Gas & Consumable Fuels) | | | 60,888 | |
| | 658 | | | Valero Energy Partners LP (Oil, Gas & Consumable Fuels) | | | 30,933 | |
| | 881 | | | WGL Holdings, Inc. (Gas Utilities) | | | 62,366 | |
| | | | | | | | |
| | | | | | | 1,850,407 | |
| | |
| | TOTAL COMMON STOCKS | |
| | (Cost $2,916,609) | | $ | 3,068,001 | |
| | |
| | | | | | | | |
| Shares | | | Distribution Rate | | Value | |
| | | | | | | | |
| | Investment Company(b) – 0.1% | |
| Goldman Sachs Financial Square Government Fund – FST Shares | |
| | 3,689 | | | 0.290% | | $ | 3,689 | |
| | (Cost $3,689) | | | | |
| | |
| | TOTAL INVESTMENTS – 97.4% | |
| | (Cost $2,920,298) | | $ | 3,071,690 | |
| | |
| OTHER ASSETS IN EXCESS OF
LIABILITIES – 2.6% | | | 81,450 | |
| | |
| | NET ASSETS – 100.0% | | $ | 3,153,140 | |
| | |
| | |
| The percentage shown for each investment category reflects the value of investments in that category as a percentage of net assets. |
* | | Non-income producing security. |
(a) | | Exempt from registration under Rule 144A of the Securities Act of 1933. Under procedures approved by the Board of Trustees, such securities have been determined to be liquid by the investment adviser and may be resold, normally to qualified institutional buyers in transactions exempt from registration. Total market value of Rule 144A securities amounts to $ 42,307, which represents approximately 1.3% of net assets as of June 30, 2016. |
(b) | | Represents an affiliated Fund. |
| | |
|
Investment Abbreviations: |
LP | | —Limited Partnership |
PLC | | —Public Limited Company |
|
| | |
| 4 | | The accompanying notes are an integral part of these financial statements. |
GOLDMAN SACHS GLOBAL INFRASTRUCTURE FUND
Statement of Assets and Liabilities
June 30, 2016 (Unaudited)
| | | | | | |
| | | | | | |
| | Assets: | | | | |
| | Investments of unaffiliated issuers, at value (cost $2,916,609) | | $ | 3,068,001 | |
| | Investments of affiliated issuers, at value (cost $3,689) | | | 3,689 | |
| | Cash | | | 50,001 | |
| | Foreign currencies, at value (cost $120,746) | | | 120,746 | |
| | Receivables: | | | | |
| | Deferred offering costs | | | 161,017 | |
| | Investments sold | | | 32,090 | |
| | Reimbursement from investment adviser | | | 15,530 | |
| | Dividends and interest | | | 7,053 | |
| | Foreign tax reclaims | | | 101 | |
| | Total assets | | | 3,458,228 | |
| | | | | | |
| | Liabilities: | | | | |
| | Payables: | | | | |
| | Accrued offering costs | | | 162,351 | |
| | Investments purchased | | | 128,288 | |
| | Payable for organization costs | | | 12,000 | |
| | Management fees | | | 225 | |
| | Distribution and Service fees and Transfer Agency fees | | | 15 | |
| | Accrued expenses | | | 2,209 | |
| | Total liabilities | | | 305,088 | |
| | | | | | |
| | Net Assets: | | | | |
| | Paid-in capital | | | 3,000,000 | |
| | Undistributed net investment income | | | 6,878 | |
| | Accumulated net realized loss | | | (5,146 | ) |
| | Net unrealized gain | | | 151,408 | |
| | | NET ASSETS | | $ | 3,153,140 | |
| | | Net Assets: | | | | |
| | | Class A | | $ | 26,275 | |
| | | Class C | | | 26,274 | |
| | | Institutional | | | 3,021,764 | |
| | | Class IR | | | 26,276 | |
| | | Class R | | | 26,275 | |
| | | Class R6 | | | 26,276 | |
| | | Total Net Assets | | $ | 3,153,140 | |
| | | Shares Outstanding $0.001 par value (unlimited number of shares authorized): | | | | |
| | | Class A | | | 2,500 | |
| | | Class C | | | 2,500 | |
| | | Institutional | | | 287,500 | |
| | | Class IR | | | 2,500 | |
| | | Class R | | | 2,500 | |
| | | Class R6 | | | 2,500 | |
| | | Net asset value, offering and redemption price per share:(a) | | | | |
| | | Class A | | | $10.51 | |
| | | Class C | | | 10.51 | |
| | | Institutional | | | 10.51 | |
| | | Class IR | | | 10.51 | |
| | | Class R | | | 10.51 | |
| | | Class R6 | | | 10.51 | |
| | (a) | | Maximum public offering price per share for Class A Shares of the Fund is $11.12. At redemption, Class C Shares may be subject to a contingent deferred sales charge, assessed on the amount equal to the lesser of the current net asset value (“NAV”) or the original purchase price of the shares. |
| | |
| The accompanying notes are an integral part of these financial statements. | | 5 |
GOLDMAN SACHS GLOBAL INFRASTRUCTURE FUND
Statement of Operations
For the Period Ended June 30, 2016 (Unaudited)(a)
| | | | | | |
| | | | | | |
| | Investment income: | | | | |
| | Dividends — unaffiliated issuers (net of foreign withholding taxes of $1,923) | | $ | 7,089 | |
| | Dividends — affiliated issuers | | | 42 | |
| | Total investment income | | | 7,131 | |
| | | | | | |
| | Expenses: | | | | |
| | Organization Costs | | | 12,000 | |
| | Amortization of offering costs | | | 1,334 | |
| | Professional fees | | | 834 | |
| | Printing and mailing costs | | | 710 | |
| | Custody, accounting and administrative services | | | 380 | |
| | Management fees | | | 225 | |
| | Trustee fees | | | 205 | |
| | Transfer Agency fees(b) | | | 11 | |
| | Distribution and Service fees(b) | | | 4 | |
| | Other | | | 80 | |
| | Total expenses | | | 15,783 | |
| | Less — expense reductions | | | (15,530 | ) |
| | Net expenses | | | 253 | |
| | NET INVESTMENT INCOME | | | 6,878 | |
| | | | | | |
| | Realized and unrealized gain (loss): | | | | |
| | Net realized gain (loss) from: | | | | |
| | Investments — unaffiliated issuers | | | 1,053 | |
| | Foreign currency transactions | | | (6,199 | ) |
| | Net unrealized gain on: | | | | |
| | Investments | | | 151,392 | |
| | Foreign currency translations | | | 16 | |
| | Net realized and unrealized gain | | | 146,262 | |
| | NET INCREASE IN NET ASSETS RESULTING FROM OPERATIONS | | $ | 153,140 | |
| | (a) | | Commenced operations on June 27, 2016. |
| | (b) | | Class specific Distribution and Service and Transfer Agency fees were as follows: |
| | | | | | | | | | | | | | |
| Distribution and Service Fees | | | Transfer Agent Fees | |
Class A | | | Class C | | | Class R | | | Institutional | |
| $ | 1 | | | $ | 2 | | | $ | 1 | | | $ | 11 | |
| | |
| 6 | | The accompanying notes are an integral part of these financial statements. |
GOLDMAN SACHS GLOBAL INFRASTRUCTURE FUND
Statement of Changes in Net Assets
For the Period Ended June 30, 2016 (Unaudited)(a)
| | | | | | |
| | | | | | |
| | From operations: | | | | |
| | Net investment income | | $ | 6,878 | |
| | Net realized loss | | | (5,146 | ) |
| | Net unrealized gain | | | 151,408 | |
| | Net increase in net assets resulting from operations | | | 153,140 | |
| | | | | | |
| | From share transactions: | | | | |
| | Proceeds from sales of shares | | | 3,000,060 | |
| | Cost of shares redeemed | | | (60 | ) |
| | Net increase in net assets resulting from share transactions | | | 3,000,000 | |
| | TOTAL INCREASE | | | 3,153,140 | |
| | | | | | |
| | Net assets: | | | | |
| | Beginning of period | | | — | |
| | End of period | | $ | 3,153,140 | |
| | Undistributed net investment income | | $ | 6,878 | |
| | (a) | | Commenced operations on June 27, 2016. |
| | |
| The accompanying notes are an integral part of these financial statements. | | 7 |
GOLDMAN SACHS GLOBAL INFRASTRUCTURE FUND
Financial Highlights
Selected Data for a Share Outstanding Throughout The Period
| | | | | | | | | | | | | | | | | | |
| | | | | | From
investment operations | |
| | | Year - Share Class | | Net asset
value,
beginning
of period | | | Net
investment
income(a) | | | Net realized
and unrealized
gain | | | Total from
investment
operations | |
| | FOR THE PERIOD ENDED JUNE 30, (UNAUDITED) | | | | | | | | | | | | | | | | |
| | 2016 - A (Commenced on June 27, 2016) | | $ | 10.00 | | | $ | 0.02 | | | $ | 0.49 | | | $ | 0.51 | |
| | 2016 - C (Commenced on June 27, 2016) | | | 10.00 | | | | 0.02 | | | | 0.49 | | | | 0.51 | |
| | 2016 - Institutional (Commenced on June 27, 2016) | | | 10.00 | | | | 0.02 | | | | 0.49 | | | | 0.51 | |
| | 2016 - IR (Commenced on June 27, 2016) | | | 10.00 | | | | 0.02 | | | | 0.49 | | | | 0.51 | |
| | 2016 - R (Commenced on June 27, 2016) | | | 10.00 | | | | 0.02 | | | | 0.49 | | | | 0.51 | |
| | 2016 - R6 (Commenced on June 27, 2016) | | | 10.00 | | | | 0.02 | | | | 0.49 | | | | 0.51 | |
| | (a) | | Calculated based on the average shares outstanding methodology. |
| | (b) | | Assumes investment at the NAV at the beginning of the period, reinvestment of all dividends and distributions, a complete redemption of the investment at the NAV at the end of the period and no sales or redemption charges. Total returns would be reduced if a sales or redemption charge was taken into account. Returns do not reflect the impact of taxes to shareholders relating to Fund distributions or the redemption of Fund shares. Total returns for periods less than one full year are not annualized. |
| | (d) | | The Fund’s portfolio turnover rate is calculated in accordance with regulatory requirements, without regard to transactions involving short term investments. If such transactions were included, the Fund’s portfolio turnover rate may be higher. |
| | |
| 8 | | The accompanying notes are an integral part of these financial statements. |
GOLDMAN SACHS GLOBAL INFRASTRUCTURE FUND
| | | | | | | | | | | | | | | | | | | | | | | | | | | | | | | | | | | | | | | | |
| | | | | | | | | | | | | |
| | | Net asset
value, end
of period | | | | | Total
return(b) | | | | | Net assets,
end of
period
(in 000s) | | | | | Ratio of
net expenses
to average
net assets(c) | | | | | Ratio of
total expenses
to average
net assets(c) | | | | | Ratio of
net investment
income
to average
net assets(c) | | | | | Portfolio
turnover
rate(d) | |
| | | | | | | | | | | | | | | | | | | | | | | | | | | | | | | | | | | | | | | | |
| | $ | 10.51 | | | | | | 5.10 | % | | | | $ | 26 | | | | | | 1.37 | % | | | | | 10.25 | % | | | | | 26.68 | % | | | | | 1 | % |
| | | 10.51 | | | | | | 5.10 | | | | | | 26 | | | | | | 2.11 | | | | | | 10.98 | | | | | | 25.94 | | | | | | 1 | |
| | | 10.51 | | | | | | 5.10 | | | | | | 3,022 | | | | | | 0.98 | | | | | | 9.86 | | | | | | 27.07 | | | | | | 1 | |
| | | 10.51 | | | | | | 5.10 | | | | | | 26 | | | | | | 1.13 | | | | | | 10.00 | | | | | | 26.93 | | | | | | 1 | |
| | | 10.51 | | | | | | 5.10 | | | | | | 26 | | | | | | 1.62 | | | | | | 10.49 | | | | | | 26.44 | | | | | | 1 | |
| | | 10.51 | | | | | | 5.10 | | | | | | 26 | | | | | | 0.92 | | | | | | 9.82 | | | | | | 27.13 | | | | | | 1 | |
| | |
| The accompanying notes are an integral part of these financial statements. | | 9 |
GOLDMAN SACHS GLOBAL INFRASTRUCTURE FUND
Notes to Financial Statements
June 30, 2016 (Unaudited)
Goldman Sachs Trust (the “Trust”) is a Delaware statutory trust registered under the Investment Company Act of 1940, as amended (the “Act”), as an open-end management investment company. Global Infrastructure Fund (the “Fund”) is a non-diversified portfolio and currently offers six classes of shares: Class A, Class C, Institutional, Class IR, Class R, and Class R6 Shares. The Fund commenced operations on June 27, 2016.
Class A Shares are sold with a front-end sales charge of up to 5.50%. Class C Shares are sold with a contingent deferred sales charge (“CDSC”) of 1.00%, which is imposed on redemptions made within 12 months of purchase. Institutional, Class IR, Class R and Class R6 shares are not subject to a sales charge.
Goldman Sachs Asset Management, L.P. (“GSAM”), an affiliate of Goldman, Sachs & Co. (“Goldman Sachs”), serves as investment adviser to the Fund pursuant to a management agreement (the “Agreement”) with the Trust.
|
| 2. SIGNIFICANT ACCOUNTING POLICIES |
The financial statements have been prepared in accordance with accounting principles generally accepted in the United States of America (“GAAP”) and require management to make estimates and assumptions that may affect the reported amounts and disclosures. Actual results may differ from those estimates and assumptions.
A. Investment Valuation — The Fund’s valuation policy is to value investments at fair value.
B. Investment Income and Investments — Investment income includes interest income, dividend income, net of any foreign withholding taxes, less any amounts reclaimable, and securities lending income. Interest income is accrued daily and adjusted for amortization of premiums and accretion of discounts. Dividend income is recognized on ex-dividend date or, for certain foreign securities, as soon as such information is obtained subsequent to the ex-dividend date. Investment transactions are reflected on trade date. Realized gains and losses are calculated using identified cost. Investment transactions are recorded on the following business day for daily net asset value (“NAV”) calculations. Any foreign capital gains tax is accrued daily based upon net unrealized gains, and is payable upon sale of such investments. Distributions received from the Fund’s investments in U.S. real estate investment trusts (“REITs”) may be characterized as ordinary income, net capital gain or a return of capital. A return of capital is recorded by the Fund as a reduction to the cost basis of the REIT. Distributions from Master Limited Partnerships (“MLPs”) are generally recorded based on the characterization reported on the MLP’s tax return. The Fund records its pro-rata share of the income/loss and capital gains/losses, allocated from the underlying partnerships and adjusts the cost basis of the underlying partnerships accordingly.
C. Class Allocations and Expenses — Investment income, realized and unrealized gain (loss), and non-class specific expenses of the Fund are allocated daily based upon the proportion of net assets of each class. Non-class specific expenses directly incurred by the Fund are charged to the Fund, while such expenses incurred by the Trust are allocated across the Fund on a straight-line and/or pro-rata basis depending upon the nature of the expenses. Class specific expenses, where applicable, are borne by the respective share classes and include Distribution and Service, Transfer Agency and Service and Shareholder Administration fees.
D. Offering and Organization Costs — Offering costs paid in connection with the initial offering of shares of the Fund are being amortized on a straight-line basis over 12 months from the date of commencement of operations. Organization costs paid in connection with the organization of the Fund were expensed on the first day of operations.
E. Federal Taxes and Distributions to Shareholders — It is the Fund’s policy to comply with the requirements of the Internal Revenue Code of 1986, as amended (the “Code”), applicable to regulated investment companies (mutual funds) and to distribute each year substantially all of its investment company taxable income and capital gains to its shareholders. Accordingly, the Fund is not required to make any provisions for the payment of federal income tax. Distributions to shareholders are recorded on the ex-dividend date. Distributions from net investment income are declared and paid quarterly, and distributions from net capital gains, if any, are declared and paid annually.
10
GOLDMAN SACHS GLOBAL INFRASTRUCTURE FUND
|
| 2. SIGNIFICANT ACCOUNTING POLICIES (continued) |
Net capital losses are carried forward to future fiscal years and may be used to the extent allowed by the Code to offset any future capital gains. Losses that are carried forward will retain their character as either short-term or long-term capital losses. Utilization of capital loss carryforwards will reduce the requirement of future capital gains distributions.
The characterization of distributions to shareholders for financial reporting purposes is determined in accordance with federal income tax rules, which may differ from GAAP. The source of the Fund’s distributions may be shown in the accompanying financial statements as either from net investment income, net realized gain or capital. Certain components of the Fund’s net assets on the Statement of Assets and Liabilities reflect permanent GAAP/tax differences based on the appropriate tax character.
F. Foreign Currency Translation — The accounting records and reporting currency of the Fund is maintained in U.S. dollars. Assets and liabilities denominated in foreign currencies are translated into U.S. dollars using the current exchange rates at the close of each business day. The effect of changes in foreign currency exchange rates on investments is included within net realized and unrealized gain (loss) on investments. Changes in the value of other assets and liabilities as a result of fluctuations in foreign exchange rates are included in the Statement of Operations within net change in unrealized gain (loss) on foreign currency translations. Transactions denominated in foreign currencies are translated into U.S. dollars on the date the transaction occurred, the effects of which are included within net realized gain (loss) on foreign currency transactions.
| | |
| 3. INVESTMENTS AND FAIR VALUE MEASUREMENTS | | |
The fair value of a financial instrument is the amount that would be received to sell an asset or paid to transfer a liability in an orderly transaction between market participants at the measurement date (i.e., the exit price). GAAP establishes a fair value hierarchy that prioritizes the inputs to valuation techniques used to measure fair value. The hierarchy gives the highest priority to unadjusted quoted prices in active markets for identical assets or liabilities (Level 1 measurements) and the lowest priority to unobservable inputs (Level 3 measurements). The levels used for classifying investments are not necessarily an indication of the risk associated with investing in these investments. The three levels of the fair value hierarchy are described below:
Level 1 — Unadjusted quoted prices in active markets that are accessible at the measurement date for identical, unrestricted assets or liabilities;
Level 2 — Quoted prices in markets that are not active or financial instruments for which significant inputs are observable (including, but not limited to, quoted prices for similar investments, interest rates, foreign exchange rates, volatility and credit spreads), either directly or indirectly;
Level 3 — Prices or valuations that require significant unobservable inputs (including GSAM’s assumptions in determining fair value measurement).
Changes in valuation techniques may result in transfers into or out of an assigned level within the hierarchy. In accordance with the Fund’s policy, transfers between different levels of the fair value hierarchy resulting from such changes are deemed to have occurred as of the beginning of the reporting period.
The Board of Trustees (“Trustees”) has approved Valuation Procedures that govern the valuation of the portfolio investments held by the Fund, including investments for which market quotations are not readily available. The Trustees have delegated to GSAM day-to-day responsibility for implementing and maintaining internal controls and procedures related to the valuation of the Fund’s portfolio investments. To assess the continuing appropriateness of pricing sources and methodologies, GSAM regularly performs price verification procedures and issues challenges as necessary to third party pricing vendors or brokers, and any differences are reviewed in accordance with the Valuation Procedures.
A. Level 1 and Level 2 Fair Value Investments — The valuation techniques and significant inputs used in determining the fair values for investments classified as Level 1 and Level 2 are as follows:
Equity Securities — Equity securities traded on a United States (“U.S.”) securities exchange or the NASDAQ system, or those located on certain foreign exchanges, including but not limited to the Americas, are valued daily at their last sale price or official closing price on the principal exchange or system on which they are traded. If there is no sale or official closing price or such price
11
GOLDMAN SACHS GLOBAL INFRASTRUCTURE FUND
Notes to Financial Statements (continued)
June 30, 2016 (Unaudited)
|
| 3. INVESTMENTS AND FAIR VALUE MEASUREMENTS (continued) |
is believed by GSAM to not represent fair value, equity securities are valued at the last bid price for long positions and at the last ask price for short positions. To the extent these investments are actively traded, they are classified as Level 1 of the fair value hierarchy, otherwise they are generally classified as Level 2.
Unlisted equity securities for which market quotations are available are valued at the last sale price on the valuation date, or if no sale occurs, at the last bid price. Securities traded on certain foreign securities exchanges are valued daily at fair value determined by an independent fair value service (if available) under Valuation Procedures approved by the Trustees and consistent with applicable regulatory guidance. The independent fair value service takes into account multiple factors including, but not limited to, movements in the securities markets, certain depositary receipts, futures contracts and foreign currency exchange rates that have occurred subsequent to the close of the foreign securities exchange. These investments are generally classified as Level 2 of the fair value hierarchy.
Money Market Funds — Investments in the Goldman Sachs Financial Square Government Fund (“Underlying Fund”) are valued at the NAV of the FST Institutional Share class on the day of valuation. These investments are generally classified as Level 1 of the fair value hierarchy. For information regarding an Underlying Fund’s accounting policies and investment holdings, please see the Underlying Fund’s shareholder report.
B. Level 3 Fair Value Investments — To the extent that significant inputs to valuation models and other alternative pricing sources are unobservable, or if quotations are not readily available, or if GSAM believes that such quotations do not accurately reflect fair value, the fair value of the Fund’s investments may be determined under Valuation Procedures approved by the Trustees. GSAM, consistent with its procedures and applicable regulatory guidance, may make an adjustment to the most recent valuation prices of either domestic or foreign securities in light of significant events to reflect what it believes to be the fair value of the securities at the time of determining the Fund’s NAV. Significant events which could affect a large number of securities in a particular market may include, but are not limited to: significant fluctuations in U.S. or foreign markets; market dislocations; market disruptions; or unscheduled market closings. Significant events which could also affect a single issuer may include, but are not limited to: corporate actions such as reorganizations, mergers and buy-outs; ratings downgrades; and bankruptcies.
C. Fair Value Hierarchy — The following is a summary of the Fund’s investments and derivatives classified in the fair value hierarchy as of June 30, 2016:
| | | | | | | | | | | | |
| | | |
| Investment Type | | Level 1 | | | Level 2 | | | Level 3 | |
| Assets(a) | |
Common Stock and/or Other Equity Investments | | | | | | | | | | | | |
Asia | | $ | — | | | $ | 189,357 | | | $ | — | |
Australia and Oceania | | | — | | | | 190,647 | | | | | |
Europe | | | — | | | | 545,586 | | | | — | |
North America | | | 2,142,411 | | | | — | | | | — | |
Investment Company | | | 3,689 | | | | — | | | | — | |
| Total | | $ | 2,146,100 | | | $ | 925,590 | | | $ | — | |
| (a) | | Amount are disclosed by continent to highlight the impact of time zone differences between local market close and the calculation of NAV. Security valuations are based on the principle exchange or system on which they are traded, which may differ from country of domicile noted in table. |
| | |
| 4. AGREEMENTS AND AFFILIATED TRANSACTIONS | | |
A. Management Agreement — Under the Agreement, GSAM manages the Fund, subject to the general supervision of the Trustees.
12
GOLDMAN SACHS GLOBAL INFRASTRUCTURE FUND
|
| 4. AGREEMENTS AND AFFILIATED TRANSACTIONS (continued) |
As compensation for the services rendered pursuant to the Agreement, the assumption of the expenses related thereto and administration of the Fund’s business affairs, including providing facilities, GSAM is entitled to a management fee, accrued daily and paid monthly, equal to an annual percentage rate of the Fund’s average daily net assets.
For the period ended June 30, 2016, the contractual and effective net management fee with GSAM were at the following rates:
| | | | | | | | | | | | | | | | | | | | | | | | | | |
| Contractual Management Rate | | | Effective Net
Management
Rate^ | |
First $1 billion | | | Next
$1 billion | | | Next
$3 billion | | | Next
$3 billion | | | Over
$8 billion | | | Effective
Rate | | |
| | 0.90% | | | | 0.81% | | | | 0.77% | | | | 0.75% | | | | 0.74% | | | | 0.90% | | | | 0.80% | |
| ^ | | Effective Net Management Rate includes the impact of management fee waivers of affiliated underlying funds, if any. |
The Fund invests in FST Shares of Goldman Sachs Financial Square Financial Square Fund, which is an affiliated Underlying Fund. GSAM has agreed to waive a portion of its management fee payable by the Fund in an amount equal to the management fee it earns as an investment adviser to any of the affiliated Underlying Funds in which the Fund invests. During the period ended June 30, 2016, GSAM waived $22 of the Fund’s management fee.
B. Distribution and Service Plans — The Trust, on behalf of the Fund, has adopted Distribution and Service Plans (the “Plans”). Under the Plans, Goldman Sachs, which serves as distributor (the “Distributor”), is entitled to a fee accrued daily and paid monthly, for distribution services and personal and account maintenance services, which may then be paid by Goldman Sachs to authorized dealers, at the following annual rates calculated on the Fund’s average daily net assets of each respective share class:
| | | | | | | | | | | | |
| | | Distribution and Service Plan Rates | |
| | | Class A* | | | Class C | | | Class R* | |
Distribution Plan | | | 0.25 | % | | | 0.75 | % | | | 0.50 | % |
Service Plan | | | — | | | | 0.25 | | | | — | |
| * | | With respect to Class A and Class R Shares, the Distributor, at its discretion may use compensation for distribution services paid under the Distribution Plan to compensate service organizations for personal and account maintenance services and expenses as long as such total compensation does not exceed the maximum cap on “service fees” imposed by the Financial Industry Regulatory Authority. |
C. Distribution Agreement — Goldman Sachs, as Distributor of the shares of the Fund pursuant to a Distribution Agreement, may retain a portion of the Class A Shares’ front end sales charge and Class C Shares’ CDSC. During the period ended June 30, 2016, Goldman Sachs did not retain any portion of the sales charges nor CDSC for this fund.
D. Transfer Agency Agreement — Goldman Sachs also serves as the transfer agent of the Fund for a fee pursuant to the Transfer Agency Agreement. The fees charged for such transfer agency services are accrued daily and paid monthly at annual rates as follows: 0.19% of the average daily net assets of Class A, Class C, Class IR and Class R Shares; 0.02% of the average daily net assets of Class R6 Shares; and 0.04% of the average daily net assets of Institutional Shares.
E. Other Expense Agreements and Affiliated Transactions — GSAM has agreed to limit certain “Other Expenses” of the Fund (excluding acquired fund fees and expenses, transfer agency fees and expenses, service fees and shareholder administration fees (as applicable), taxes, interest, brokerage fees, shareholder meeting, litigation, indemnification and extraordinary expenses) to the extent such expenses exceed, on an annual basis, a percentage rate of the average daily net assets of the Fund. Such Other Expense reimbursements, if any, are accrued daily and paid monthly. In addition, the Fund is not obligated to reimburse GSAM for prior fiscal year expense reimbursements, if any. The Other Expense limitations as an annual percentage rate of average daily net assets for the Fund is 0.054%. These Other Expense limitations will remain in place through at least June 27, 2017 and prior to such date GSAM may not terminate the arrangements without the approval of the Trustees. In addition, the Fund has entered into certain offset arrangements with the custodian and the transfer agent, which may result in a reduction of the Fund’s expenses and are received irrespective of the application of the “Other Expense” limitations described above.
13
GOLDMAN SACHS GLOBAL INFRASTRUCTURE FUND
Notes to Financial Statements (continued)
June 30, 2016 (Unaudited)
|
| 4. AGREEMENTS AND AFFILIATED TRANSACTIONS (continued) |
For the period ended June 30, 2016, these expense reductions, including any fee waivers and Other Expense reimbursements, were as follows:
| | | | |
Other Expense Reimbursements | | Management Fee Waivers | | Total Expense Reductions |
$15,508 | | $22 | | $15,530 |
F. Other Transactions with Affiliates — For the period ended June 30, 2016, Goldman Sachs did not earn any brokerage commissions from portfolio transactions, on behalf of the Fund.
The table below shows the transaction in and earnings from investments in the Underlying Fund For the six months ended June 30, 2016:
| | | | | | | | | | | | | | | | | | | | | | |
| Underlying Fund | | | | Purchases at Cost | | | Proceeds
from Sales | | | Net
Change in
Unrealized
Gain (Loss) | | | Market
Value
6/30/2016 | | | Dividend
Income | |
Goldman Sachs Financial Square Government Fund | | | | $ | 2,850,042 | | | $ | (2,846,353 | ) | | $ | — | | | $ | 3,689 | | | $ | 42 | |
As of June 30, 2016, the Goldman Sachs Group, Inc. was the beneficial owner of 100% of Class A, Class C, Institutional, Class IR, Class R and Class R6 Shares of the Fund.
| | |
| 5. PORTFOLIO SECURITIES TRANSACTIONS | | |
The cost of purchases and proceeds from sales and maturities of long-term securities for the period ended June 30, 2016, were $2,947,656 and $32,100, respectively.
As of June 30, 2016, the Fund’s aggregate security unrealized gains and losses based on cost for U.S. federal income tax purposes were as follows:
| | | | |
| | | Global
Infrastructure | |
Tax Cost | | $ | 2,920,298 | |
Gross unrealized gain | | | 152,154 | |
Gross unrealized loss | | | (762 | ) |
Net unrealized security gain | | $ | 151,392 | |
There are no differences between GAAP basis and tax basis unrealized gains (losses).
GSAM has reviewed the Fund’s tax positions for the current open tax year and has concluded that no provision for income tax is required in the Fund’s financial statements. Such open tax year remains subject to examination and adjustment by tax authorities.
14
GOLDMAN SACHS GLOBAL INFRASTRUCTURE FUND
The Fund’s risks include, but are not limited to, the following:
Foreign Countries Risk — Investing in foreign markets may involve special risks and considerations not typically associated with investing in the United States. Foreign securities may be subject to risk of loss because of more or less foreign government regulation, less public information and less economic, political and social stability in the countries in which the Fund invests. Loss may also result from the imposition of exchange controls, confiscations and other government restrictions by the United States or other governments, or from problems in registration, settlement or custody. Foreign risk also involves the risk of negative foreign currency rate fluctuations, which may cause the value of securities denominated in such foreign currency (or other instruments through which the Fund has exposure to foreign currencies) to decline in value. Currency exchange rates may fluctuate significantly over short periods of time.
Foreign Custody Risk — The Fund that invests in foreign securities may hold such securities and cash with foreign banks, agents, and securities depositories appointed by the Fund’s custodian (each a “Foreign Custodian”). Some foreign custodians may be recently organized or new to the foreign custody business. In some countries, Foreign Custodians may be subject to little or no regulatory oversight over, or independent evaluation of, their operations. Further, the laws of certain countries may place limitations on the Fund’s ability to recover its assets if a Foreign Custodian enters bankruptcy.
Investments in Other Investment Companies — As a shareholder of another investment company, including an exchange-traded fund (“ETF”), the Fund will indirectly bear its proportionate share of any net management fees and other expenses paid by such other investment companies, in addition to the fees and expenses regularly borne by the Fund. ETFs are subject to risks that do not apply to conventional mutual funds, including but not limited to the following: (i) the market price of the ETF’s shares may trade at a premium or a discount to their NAV; and (ii) an active trading market for an ETF’s shares may not develop or be maintained.
Large Shareholder Transactions Risk — The Fund may experience adverse effects when certain large shareholders, such as other funds, institutional investors (including those trading by use of non-discretionary mathematical formulas), financial intermediaries (who may make investment decisions on behalf of underlying clients and/or include the Fund in their investment model), individuals, accounts and Goldman Sachs affiliates, purchase or redeem large amounts of shares of the Fund. Such large shareholder redemptions may cause the Fund to sell portfolio securities at times when it would not otherwise do so, which may negatively impact the Fund’s NAV and liquidity. These transactions may also accelerate the realization of taxable income to shareholders if such sales of investments resulted in gains, and may also increase transaction costs. In addition, a large redemption could result in the Fund’s current expenses being allocated over a smaller asset base, leading to an increase in the Fund’s expense ratio. Similarly, large Fund share purchases may adversely affect the Fund’s performance to the extent that the Fund is delayed in investing new cash and is required to maintain a larger cash position than it ordinarily would.
Liquidity Risk — The Fund may make investments that are illiquid or that may become less liquid in response to market developments or adverse investor perceptions. Illiquid investments may be more difficult to value. Liquidity risk may also refer to the risk that the Fund will not be able to pay redemption proceeds within the allowable time period because of unusual market conditions, an unusually high volume of redemption requests, or other reasons. To meet redemption requests, the Fund may be forced to sell investments at an unfavorable time and/or under unfavorable conditions.
Market and Credit Risks — In the normal course of business, the Fund trades financial instruments and enters into financial transactions where risk of potential loss exists due to changes in the market (market risk). Additionally, the Fund may also be exposed to credit risk in the event that an issuer or guarantor fails to perform or that an institution or entity with which the Fund has unsettled or open transactions defaults.
Master Limited Partnership Risk — Investments in securities of MLPs involve risks that differ from investments in common stock, including risks related to limited control and limited rights to vote on matters affecting the MLP, risks related to potential
15
GOLDMAN SACHS GLOBAL INFRASTRUCTURE FUND
Notes to Financial Statements (continued)
June 30, 2016 (Unaudited)
|
| 7. OTHER RISKS (continued) |
conflicts of interest between the MLP and the MLP’s general partner, cash flow risks, dilution risks, limited liquidity and risks related to the general partner’s right to require unit-holders to sell their common units at an undesirable time or price.
Non-Diversification Risk — The Fund is non-diversified, meaning that it is permitted to invest a larger percentage of its assets in fewer issuers than diversified mutual funds. Thus, the Fund may be more susceptible to adverse developments affecting any single issuer held in its portfolio, and may be more susceptible to greater losses because of these developments.
Portfolio Concentration Risk — As a result of the Fund’s ability to invest a large percentage of its assets in obligations of issuers within the same country, state, region, currency or economic sector, an adverse economic, business or political development may affect the value of the Fund’s investments more than if its investments were not so concentrated.
Under the Trust’s organizational documents, its Trustees, officers, employees and agents are indemnified, to the extent permitted by the Act and state law, against certain liabilities that may arise out of performance of their duties to the Fund. Additionally, in the course of business, the Fund enters into contracts that contain a variety of indemnification clauses. The Fund’s maximum exposure under these arrangements is unknown, as this would involve future claims that may be made against the Fund that have not yet occurred. However, GSAM believes the risk of loss under these arrangements to be remote.
Subsequent events after the Statement of Assets and Liabilities date have been evaluated through the date the financial statements were issued. GSAM has concluded that there is no impact requiring adjustment or disclosure in the financial statements.
16
GOLDMAN SACHS GLOBAL INFRASTRUCTURE FUND
|
| 10. SUMMARY OF SHARE TRANSACTIONS |
Share activity is as follows:
| | | | | | | | |
| | | For the Period Ended June 30, 2016 (Unaudited)(a) | |
| | | | |
| | | Shares | | | Dollars | |
| | | | |
| Class A Shares | | | | | | | | |
Shares sold | | | 2,501 | | | $ | 25,010 | |
Shares redeemed | | | (1 | ) | | | (10 | ) |
| | | | 2,500 | | | | 25,000 | |
| Class C Shares | | | | | | | | |
Shares sold | | | 2,501 | | | | 25,010 | |
Shares redeemed | | | (1 | ) | | | (10 | ) |
| | | | 2,500 | | | | 25,000 | |
| Institutional Shares | | | | | | | | |
Shares sold | | | 287,501 | | | | 2,875,010 | |
Shares redeemed | | | (1 | ) | | | (10 | ) |
| | | | 287,500 | | | | 2,875,000 | |
| Class IR Shares | | | | | | | | |
Shares sold | | | 2,501 | | | | 25,010 | |
Shares redeemed | | | (1 | ) | | | (10 | ) |
| | | | 2,500 | | | | 25,000 | |
| Class R Shares | | | | | | | | |
Shares sold | | | 2,501 | | | | 25,010 | |
Shares redeemed | | | (1 | ) | | | (10 | ) |
| | | | 2,500 | | | | 25,000 | |
| Class R6 Shares | | | | | | | | |
Shares sold | | | 2,501 | | | | 25,010 | |
Shares redeemed | | | (1 | ) | | | (10 | ) |
| | | | 2,500 | | | | 25,000 | |
NET INCREASE | | | 300,000 | | | $ | 3,000,000 | |
| (a) | | Commenced operations on June 27, 2016. |
17
GOLDMAN SACHS GLOBAL INFRASTRUCTURE FUND
| | |
Fund Expenses — Period Ended June 30, 2016 (Unaudited) | | |
As a shareholder of Class A, Class C, Institutional, Class IR, Class R and Class R6 Shares of the Fund, you incur two types of costs: (1) transaction costs, including sales charges on purchase payments (with respect to Class A Shares), contingent deferred sales charges on redemptions (with respect to Class C Shares), and (2) ongoing costs, including management fees; distribution and service (12b-1) fees (with respect to Class A, Class C and Class R Shares); and other Fund expenses. This Example is intended to help you understand your ongoing costs (in dollars) of investing in Class A, Class C, Institutional, Class IR, Class R or Class R6 Shares of the Fund and to compare these costs with the ongoing costs of investing in other mutual funds.
The Example is based on an investment of $1,000 invested at the beginning of the period and held for the entire period from June 27, 2016 through June 30, 2016, which represents a period of 3 days in a 366-day year.
Actual Expenses — The first line under each share class in the table below provides information about actual account values and actual expenses. You may use the information in this line, together with the amount you invested, to estimate the expenses that you paid over the period. Simply divide your account value by $1,000 (for example, an $8,600 account value divided by $1,000=8.6), then multiply the result by the number in the first line under the heading entitled “Expenses Paid” to estimate the expenses you paid on your account during this period.
Hypothetical Example for Comparison Purposes — The second line under each share class in the table below provides information about hypothetical account values and hypothetical expenses based on the Fund’s actual net expense ratios and an assumed rate of return of 5% per year before expenses, which is not the Fund’s actual return. The hypothetical account values and expenses may not be used to estimate the actual ending account balance or expenses you paid for the period. You may use this information to compare the ongoing costs of investing in the Fund and other funds. To do so, compare this 5% hypothetical example with the 5% hypothetical examples that appear in the shareholder reports of the other funds.
Please note that the expenses shown in the table are meant to highlight your ongoing costs only and do not reflect any transactional costs, such as sales charges, redemption fees, or exchange fees. Therefore, the second line of the table is useful in comparing ongoing costs only, and will not help you determine the relative total costs of owning different funds. In addition, if these transactional costs were included, your costs would have been higher.
| | | | | | | | | | | | |
| | | Global Infrastructure Fund(a) | |
| Share Class | | Beginning
Account Value
6/27/16 | | | Ending
Account Value
6/30/16 | | | Expenses
Paid for the
period
ended
6/30/16* | |
| Class A | | | | | | | | | | | | |
Actual | | $ | 1,000.00 | | | $ | 1,051.00 | | | $ | 0.12 | |
Hypothetical 5% return | | | 1,000.00 | | | | 1,000.30 | + | | | 0.11 | |
| Class C | | | | | | | | | | | | |
Actual | | | 1,000.00 | | | | 1,051.00 | | | | 0.18 | |
Hypothetical 5% return | | | 1,000.00 | | | | 1,000.24 | + | | | 0.17 | |
| Institutional | | | | | | | | | | | | |
Actual | | | 1,000.00 | | | | 1,051.00 | | | | 0.08 | |
Hypothetical 5% return | | | 1,000.00 | | | | 1,000.33 | + | | | 0.08 | |
| Class IR | | | | | | | | | | | | |
Actual | | | 1,000.00 | | | | 1,051.00 | | | | 0.09 | |
Hypothetical 5% return | | | 1,000.00 | | | | 1,000.32 | + | | | 0.09 | |
| Class R | | | | | | | | | | | | |
Actual | | | 1,000.00 | | | | 1,051.00 | | | | 0.14 | |
Hypothetical 5% return | | | 1,000.00 | | | | 1,000.28 | + | | | 0.13 | |
| Class R6 | | | | | | | | | | | | |
Actual | | | 1,000.00 | | | | 1,051.00 | | | | 0.08 | |
Hypothetical 5% return | | | 1,000.00 | | | | 1,000.33 | + | | | 0.08 | |
| | * | | Expenses for each share class are calculated using the Fund’s annualized net expense ratio for each class, which represents the ongoing expenses as a percentage of net assets for the period ended June 30, 2016. Expenses are calculated by multiplying the annualized net expense ratio by the average account value for the period; then multiplying the result by the number of days in the most recent fiscal half year; and then dividing that result by the number of days in the fiscal year. The annualized net expense ratios for the period were as follows: | |
| | | | | | | | | | | | | | | | | | | | | | | | |
| Fund | | Class A | | | Class C | | | Institutional | | | Class IR | | | Class R | | | R6 Shares | |
Global Infrastructure | | | 1.37 | % | | | 2.11 | % | | | 0.98 | % | | | 1.13 | % | | | 1.62 | % | | | 0.92 | % |
| | + | | Hypothetical expenses are based on the Fund’s actual annualized net expense ratios and an assumed rate of return of 5% per year before expenses. | |
| | (a) | | Commenced operations on June 27, 2016. | |
18
GOLDMAN SACHS GLOBAL INFRASTRUCTURE FUND
Statement Regarding Basis for Approval of Management Agreement (Unaudited)
Background
The Goldman Sachs Global Infrastructure Fund (the “Fund”) is a newly-organized investment portfolio of Goldman Sachs Trust (the “Trust”) that commenced investment operations on June 27, 2016. At a meeting held on August 12-13, 2015 (the “Meeting”) in connection with the Fund’s organization, the Trustees, including all of the Trustees present who are not parties to the Fund’s investment management agreement (the “Management Agreement”) or “interested persons” (as defined in the Investment Company Act of 1940, as amended) of any party thereto (the “Independent Trustees”) approved the Management Agreement with Goldman Sachs Asset Management, L.P. (the “Investment Adviser”).
At the Meeting, the Trustees reviewed the Management Agreement, including information regarding the terms of the Management Agreement; the nature, extent and quality of the Investment Adviser’s anticipated services; the fees and expenses to be paid by the Fund; a comparison of the Fund’s proposed management fees and anticipated expenses with those paid by other similar mutual funds; the Investment Adviser’s proposal to limit certain expenses of the Fund that exceed a specified level; and potential benefits to be derived by the Investment Adviser and its affiliates from their relationships with the Fund. Various information was also provided at a prior meeting at which the Fund was discussed.
In connection with the Meeting, the Trustees received written materials and oral presentations on the topics covered. The Independent Trustees were advised by their independent legal counsel regarding their responsibilities under applicable law. In evaluating the Management Agreement at the Meeting, the Trustees relied upon information included in a presentation made by the Investment Adviser at the Meeting and information received at prior Board meetings, as well as on their knowledge of the Investment Adviser resulting from their meetings and other interactions over time.
Nature, Extent, and Quality of the Services to be Provided Under the Management Agreement
As part of their review, the Trustees considered the nature, extent, and quality of the services to be provided by the Investment Adviser. In this regard, the Trustees considered both the investment advisory services and non-advisory services that would be provided to the Fund by the Investment Adviser and its affiliates. The Trustees also considered information about the Fund’s structure, investment objective, strategies, and other characteristics. The Trustees considered the experience and capabilities of the portfolio management team and noted that certain portfolio management personnel who would be managing the Fund were currently managing other series of the Trust. The Trustees concluded that the Investment Adviser would be able to commit substantial financial and other resources to the Fund. In this regard, the Trustees noted that, although the Fund was new (and therefore had no performance data to evaluate), the Investment Adviser had experience managing other funds and accounts that invest in equity securities in the utilities, energy, industrial, and real estate sectors. The Trustees also considered composite performance information for funds and accounts managed by the Investment Adviser that invest in similar securities. The Trustees concluded that the Investment Adviser’s management of the Fund likely would benefit the Fund and its shareholders.
Costs of Services to be Provided and Profitability
The Trustees considered the contractual terms of the Management Agreement and the fee rates payable by the Fund thereunder. In this regard, the Trustees considered information on the services to be rendered by the Investment Adviser to the Fund, which included both advisory and administrative services that were directed to the needs and operations of the Fund as a registered mutual fund.
In particular, the Trustees reviewed information on the proposed management fees and the Fund’s projected total operating expense ratios (both gross and net of expense limitations), and those were compared to similar information for comparable mutual funds advised by other, unaffiliated investment management firms, as well as the peer group and category medians. The comparisons of the Fund’s fee rates and total operating expense ratios were prepared by a third-party provider of mutual fund data. The Trustees believed that this information was useful in evaluating the reasonableness of the management fees and total expenses expected to be paid by the Fund.
The Trustees considered the Investment Adviser’s undertaking to limit certain expenses of the Fund that exceed a specified level. They also considered comparative fee information for services provided by the Investment Adviser to similarly managed funds and accounts. In addition, the Trustees recognized that there was not yet profitability data to evaluate for the Fund, but considered the Investment Adviser’s representations that (i) such data would be provided after the Fund commenced operations, and (ii) the Fund was not expected to be profitable to the Investment Adviser and its affiliates initially.
The Trustees noted the competitive nature of the fund marketplace, and that many of the Fund’s shareholders would be investing in the Fund in part because of the Fund’s relationship with the Investment Adviser. They also noted that shareholders would be able to redeem their Fund shares if they believe that the Fund fees and expenses are too high or if they are dissatisfied with the performance of the Fund.
19
GOLDMAN SACHS GLOBAL INFRASTRUCTURE FUND
Statement Regarding Basis for Approval of Management Agreement (Unaudited) (continued)
Economies of Scale
The Trustees considered the proposed breakpoints in the fee rate payable under the Management Agreement at the following annual percentage rates of the average daily net assets of the Fund:
| | | | |
| Average Daily Net Assets | | Management Fee Annual Rate | |
First $1 billion | | | 0.90 | % |
Next $1 billion | | | 0.81 | |
Next $3 billion | | | 0.77 | |
Next $3 billion | | | 0.75 | |
Over $8 billion | | | 0.74 | |
The Trustees noted that the breakpoints were meant to share potential economies of scale, if any, with the Fund and its shareholders as assets under management reach those asset levels. The Trustees considered the Fund’s projected asset levels and information comparing fee rates charged by the Investment Adviser with fee rates charged to other funds in the peer group, as well as the Investment Adviser’s undertaking to limit certain expenses of the Fund that exceed a specified level. Upon reviewing these matters, the Trustees concluded that the fee breakpoints represented a means of assuring that benefits of scalability, if any, would be passed along to shareholders at the specified asset levels.
Other Benefits to the Investment Adviser and Its Affiliates
The Trustees also considered the other benefits expected to be derived by the Investment Adviser and its affiliates from their relationship with the Fund, including: (a) transfer agency fees received by Goldman, Sachs & Co. (“Goldman Sachs”); (b) brokerage and futures commissions earned by Goldman Sachs for executing any securities and futures transactions on behalf of the Fund; (c) research received by the Investment Adviser from broker-dealers in exchange for executing certain transactions on behalf of the Fund; (d) trading efficiencies resulting from aggregation of orders of the Fund with those for other funds or accounts managed by the Investment Adviser; (e) the Investment Adviser’s ability to leverage the infrastructure designed to service the Fund on behalf of its other clients; (f) the Investment Adviser’s ability to cross-market other products and services to Fund shareholders; (g) Goldman Sachs’ retention of certain fees as Fund Distributor; (h) the Investment Adviser’s ability to negotiate better pricing with custodians on behalf of its other clients, as a result of the relationship with the Fund; and (i) the possibility that the working relationship between the Investment Adviser and the Fund’s third-party service providers may cause those service providers to be open to doing business with other areas of Goldman Sachs.
Conclusion
In connection with their consideration of the Management Agreement for the Fund at the Meeting, the Trustees gave weight to various factors, but did not identify any particular factor as controlling their decision. After deliberation and consideration of the information provided, including the factors described above, the Trustees concluded, in the exercise of their business judgment, that the management fee that would be payable by the Fund was reasonable in light of the services to be provided to it by the Investment Adviser, the Investment Adviser’s anticipated costs and the Fund’s reasonably anticipated asset levels. The Trustees concluded that the Investment Adviser’s management likely would benefit the Fund and its shareholders and that the Management Agreement should be approved with respect to the Fund.
20
FUNDS PROFILE
Goldman Sachs Funds

Goldman Sachs is a premier financial services firm, known since 1869 for creating thoughtful and customized investment solutions in complex global markets.
Today, the Investment Management Division of Goldman Sachs serves a diverse set of clients worldwide, including private institutions, public entities and individuals. With approximately $1.12 trillion in assets under supervision as of June 30, 2016, Goldman Sachs Asset Management (“GSAM”) has portfolio management teams located around the world and our investment professionals bring firsthand knowledge of local markets to every investment decision. Assets under supervision includes assets under management and other client assets for which Goldman Sachs does not have full discretion. GSAM leverages the resources of Goldman, Sachs & Co. subject to legal, internal and regulatory restrictions.

Money Market1
Financial Square FundsSM
| n | | Financial Square Treasury Solutions Fund2 |
| n | | Financial Square Government Fund |
| n | | Financial Square Money Market Fund |
| n | | Financial Square Prime Obligations Fund |
| n | | Financial Square Treasury Instruments Fund |
| n | | Financial Square Treasury Obligations Fund |
| n | | Financial Square Federal Instruments Fund |
| n | | Financial Square Tax-Exempt Money Market Fund |
Investor FundsSM
| n | | Investor Money Market Fund |
| n | | Investor Tax-Exempt Money Market Fund3 |
Fixed Income
Short Duration and Government
| n | | High Quality Floating Rate Fund |
| n | | Short-Term Conservative Income Fund4 |
| n | | Short Duration Government Fund |
| n | | Short Duration Income Fund |
| n | | Inflation Protected Securities Fund |
Multi-Sector
Municipal and Tax-Free
| n | | High Yield Municipal Fund |
| n | | Dynamic Municipal Income Fund |
| n | | Short Duration Tax-Free Fund |
Single Sector
| n | | Investment Grade Credit Fund |
| n | | High Yield Floating Rate Fund |
| n | | Emerging Markets Debt Fund |
| n | | Local Emerging Markets Debt Fund |
| n | | Dynamic Emerging Markets Debt Fund |
Fixed Income Alternatives
| n | | Long Short Credit Strategies Fund |
| n | | Fixed Income Macro Strategies Fund |
Fundamental Equity
| n | | Small/Mid Cap Value Fund |
| n | | Small/Mid Cap Growth Fund |
| n | | Flexible Cap Growth Fund |
| n | | Concentrated Growth Fund |
| n | | Technology Opportunities Fund5 |
| n | | Growth Opportunities Fund |
| n | | Rising Dividend Growth Fund |
| n | | Dynamic U.S. Equity Fund |
Tax-Advantaged Equity
| n | | U.S. Tax-Managed Equity Fund |
| n | | International Tax-Managed Equity Fund |
| n | | U.S. Equity Dividend and Premium Fund |
| n | | International Equity Dividend and Premium Fund |
Equity Insights
| n | | Small Cap Equity Insights Fund |
| n | | U.S. Equity Insights Fund |
| n | | Small Cap Growth Insights Fund |
| n | | Large Cap Growth Insights Fund |
| n | | Large Cap Value Insights Fund |
| n | | Small Cap Value Insights Fund |
| n | | International Small Cap Insights Fund6 |
| n | | International Equity Insights Fund |
| n | | Emerging Markets Equity Insights Fund |
Fundamental Equity International
| n | | Strategic International Equity Fund |
| n | | Focused International Equity Fund |
| n | | Emerging Markets Equity Fund7 |
Select Satellite8
| n | | Real Estate Securities Fund |
| n | | International Real Estate Securities Fund |
| n | | Commodity Strategy Fund |
| n | | Global Real Estate Securities Fund |
| n | | Dynamic Commodity Strategy Fund |
| n | | Dynamic Allocation Fund |
| n | | Absolute Return Tracker Fund |
| n | | Managed Futures Strategy Fund |
| n | | MLP Energy Infrastructure Fund |
| n | | Multi-Manager Alternatives Fund |
| n | | Multi-Asset Real Return Fund |
| n | | Absolute Return Multi-Asset Fund |
| n | | Global Infrastructure Fund |
Total Portfolio Solutions8
| n | | Global Managed Beta Fund |
| n | | Multi-Manager Non-Core Fixed Income Fund |
| n | | Multi-Manager U.S. Dynamic Equity Fund |
| n | | Multi-Manager Global Equity Fund |
| n | | Multi-Manager International Equity Fund |
| n | | Tactical Tilt Overlay Fund9 |
| n | | Balanced Strategy Portfolio |
| n | | Multi-Manager U.S. Small Cap Equity Fund |
| n | | Multi-Manager Real Assets Strategy Fund |
| n | | Growth and Income Strategy Portfolio |
| n | | Growth Strategy Portfolio |
| n | | Equity Growth Strategy Portfolio |
| n | | Satellite Strategies Portfolio |
| n | | Enhanced Dividend Global Equity Portfolio |
| n | | Tax Advantaged Global Equity Portfolio |
| n | | Strategic Factor Allocation Fund |
| 1 | | An investment in a money market portfolio is not insured or guaranteed by the Federal Deposit Insurance Corporation or any other government agency. Although a money market portfolio seeks to preserve the value of an investment at $1.00 per share, it is possible to lose money by investing in a money market portfolio. The Fund’s sponsor has no legal obligation to provide financial support to a money market portfolio, and you should not expect that the sponsor will provide financial support to the money market portfolio at any time. |
| 2 | | Effective on September 30, 2015, the Goldman Sachs Financial Square Federal Fund was renamed the Goldman Sachs Financial Square Treasury Solutions Fund. |
| 3 | | Effective on March 31, 2016, the Goldman Sachs Financial Square Tax-Free Money Market Fund was renamed the Goldman Sachs Investor Tax-Exempt Money Market Fund. |
| 4 | | Effective on July 29, 2016, the Goldman Sachs Limited Maturity Obligations Fund was renamed the Goldman Sachs Short-Term Conservative Income Fund. |
| 5 | | Effective on July 31, 2015, the Goldman Sachs Technology Tollkeeper Fund was renamed the Goldman Sachs Technology Opportunities Fund. |
| 6 | | Effective at the close of business on February 5, 2016, the Goldman Sachs International Small Cap Fund was reorganized with and into the Goldman Sachs International Small Cap Insights Fund. |
| 7 | | Effective at the close of business on October 23, 2015, the Goldman Sachs BRIC Fund (Brazil, Russia, India, China) was reorganized with and into the Goldman Sachs Emerging Markets Equity Fund. |
| 8 | | Individual Funds within the Total Portfolio Solutions and Select Satellite categories will have various placement on the risk/return spectrum and may have greater or lesser risk than that indicated by the placement of the general Total Portfolio Solutions or Select Satellite category. |
| 9 | | Effective on June 1, 2016, the Goldman Sachs Tactical Tilt Implementation Fund was renamed the Goldman Sachs Tactical Tilt Overlay Fund. |
Financial Square FundsSM and Investor FundsSM are registered service marks of Goldman, Sachs & Co.
| * | | This list covers open-end funds only. Please visit our website at www.GSAMFUNDS.com to learn about our closed-end funds and exchange-traded funds. |
| | |
TRUSTEES Ashok N. Bakhru, Chairman Kathryn A. Cassidy Diana M. Daniels Herbert J. Markley James A. McNamara Jessica Palmer Alan A. Shuch Roy W. Templin Gregory G. Weaver | | OFFICERS James A. McNamara, President Scott M. McHugh, Principal Financial Officer, Senior Vice President and Treasurer Caroline Kraus, Secretary |
| |
GOLDMAN, SACHS & CO. Distributor and Transfer Agent | | GOLDMAN SACHS ASSET MANAGEMENT, L.P. Investment Adviser |
Visit our web site at www.GSAMFUNDS.com to obtain the most recent month-end returns.
Goldman Sachs Asset Management, L.P. 200 West Street, New York, New York 10282
The report concerning the Fund included in this shareholder report may contain certain forward-looking statements about the factors that may affect the performance of the Fund in the future. These statements are based on Fund management’s predictions and expectations concerning certain future events and their expected impact on the Fund, such as performance of the economy as a whole and of specific industry sectors, changes in the levels of interest rates, the impact of developing world events, and other factors that may influence the future performance of the Fund. Management believes these forward-looking statements to be reasonable, although they are inherently uncertain and difficult to predict. Actual events may cause adjustments in portfolio management strategies from those currently expected to be employed.
A description of the policies and procedures that the Fund uses to determine how to vote proxies relating to portfolio securities and information regarding how the Fund voted proxies relating to portfolio securities during the most recent 12-month period ended June 30 is available (i) without charge, upon request by calling 1-800-526-7384 (for Retail Shareholders) or 1-800-621-2550 (for Institutional Shareholders); and (ii) on the Securities and Exchange Commission (“SEC”) web site at http://www.sec.gov.
The Global Industry Classification Standard (GICS) was developed by and is the exclusive property and a service mark of Morgan Stanley Capital International Inc. (MSCI) and Standard & Poor’s, a division of The McGraw-Hill Companies, Inc. (S&P) and is licensed for use by Goldman Sachs. Neither MSCI, S&P nor any other party involved in making or compiling the GICS or any GICS classifications makes any express or implied warranties or representations with respect to such standard or classification (or the results to be obtained by the use thereof), and all such parties hereby expressly disclaim all warranties of originality, accuracy, completeness, merchantability or fitness for a particular purpose with respect to any of such standard or classification. Without limiting any of the foregoing, in no event shall MSCI, S&P, any of their affiliates or any third party involved in making or compiling the GICS or any GICS classifications have any liability for any direct, indirect, special, punitive, consequential or any other damages (including lost profits) even if notified of the possibility of such damages.
The Fund files its complete schedule of portfolio holdings with the SEC for the first and third quarters of each fiscal year on Forms N-Q. The Fund’s Forms N-Q are available on the SEC’s web site at http://www.sec.gov within 60 days after the Fund’s first and third fiscal quarters. The Fund’s Forms N-Q may be reviewed and copied at the SEC’s Public Reference Room in Washington, D.C. and information on the operation of the Public Reference Room may also be obtained by calling 1-800-SEC-0330. Forms N-Q may be obtained upon request and without charge by calling 1-800-526-7384 (for Retail Shareholders) or 1-800-621-2550 (for Institutional Shareholders).
Holdings and allocations shown are as of June 30, 2016 and may not be representative of future investments. Fund holdings should not be relied on in making investment decisions and should not be construed as research or investment advice regarding particular securities. Current and future holdings are subject to risk.
This material is not authorized for distribution to prospective investors unless preceded or accompanied by a current Prospectus or summary prospectus, if applicable. Investors should consider the Fund’s objective, risks, and charges and expenses, and read the summary prospectus, if available, and/or the Prospectus carefully before investing or sending money. The summary prospectus, if available, and the Prospectus contain this and other information about the Fund and may be obtained from your Authorized Institution or from Goldman, Sachs & Co. by calling (retail – 1-800-526-7384) (institutional – 1-800-621-2550).
© 2016 Goldman Sachs. All rights reserved. 59082-TMPL-08/2016 GBLINFRASAR-16/163
Goldman Sachs Funds

| | | | |
| | |
| Semi-Annual Report | | | | June 30, 2016 |
| | |
| | | | Long Short Fund |

Goldman Sachs Long Short Fund
| | | | |
TABLE OF CONTENTS | | | | |
| |
Investment Process | | | 1 | |
| |
Portfolio Management Discussion and Performance Summaries | | | 2 | |
| |
Schedule of Investments | | | 12 | |
| |
Financial Statements | | | 18 | |
| |
Financial Highlights | | | 22 | |
| |
Notes to Financial Statements | | | 24 | |
| |
Other Information | | | 36 | |
| | | | |
| | | |
| NOT FDIC-INSURED | | May Lose Value | | No Bank Guarantee |
GOLDMAN SACHS LONG SHORT FUND
What Differentiates Goldman Sachs’ Long Short Fund Investment Process?
The Fund seeks long-term growth of capital. We pursue potentially attractive risk-adjusted returns through stock selection, market insights, and risk management. Investment ideas are generated from the deep industry knowledge of the GS Investment Strategies (“GSIS”) team and the top-down views of the team’s leadership. Deep fundamental bottom-up research is at the core of every investment in the Fund. Our team-based and opportunistic approach seeks to drive allocations to attractive investment opportunities.

| n | | The Fund pursues high conviction investments in global equity markets, focusing on North America and Europe. Investment ideas are generated through fundamental, bottom-up research, and generally based on secular changes that will positively or negatively impact companies. |
| n | | We seek to identify idiosyncratic investments with asymmetric risk/return profiles and identifiable catalysts. |

| n | | The Fund actively hedges the portfolio’s long positions against security specific and sector risk. We also dynamically adjusts the Fund’s exposure to the broad equity markets, seeking to be less exposed to broader equity market moves. |

| n | | Our investment team has a long history extending back four decades and has managed a global long/short strategy since 2008. The team has a global footprint with offices in New York, London, Hong Kong, Tokyo and Bangalore. |
GS Investment Strategies, LLC, the investment manager of the Funds, is a US-registered investment adviser and is a wholly-owned subsidiary of The Goldman Sachs Group, Inc.
1
PORTFOLIO RESULTS
Goldman Sachs Long Short Fund
Investment Objective And Principal Strategy
The Fund seeks long-term growth of capital.
Portfolio Management Discussion and Analysis
Below, the GS Investment Strategies (“GSIS”) Team (the “Team”) discusses the Goldman Sachs Long Short Fund’s (the “Fund”) performance and positioning for the six-month period ended June 30, 2016 (the “Reporting Period”).
| Q | | How did the Fund perform during the Reporting Period? |
| A | | During the Reporting Period, the Fund’s Class A, Class C, Institutional, Class IR and Class R Shares generated cumulative total returns of -8.70%, -8.99%, -8.45%, -8.56% and -8.82%, respectively. These returns compare to the 0.31% cumulative total return of the Fund’s primary benchmark, Bank of America Merrill Lynch U.S. Dollar Three-Month LIBOR Constant Maturity Index (the “Index”) during the same time period. |
| | References to the Fund’s benchmark and to other indices mentioned herein are for informational purposes only, and unless otherwise noted, are not an indication of how the Fund is managed. The use of the Index as the Fund’s benchmark does not imply the Fund is being managed like cash and does not imply low risk or low volatility. |
| Q | | What economic and market factors most influenced the financial markets as a whole during the Reporting Period? |
| A | | The Reporting Period was an uneven ride for investors, with the U.S. and global equity markets delivering underwhelming performances. During the first quarter of 2016, volatile oil prices, persistent worries about an economic slowdown in China, the introduction of negative interest rates by the Bank of Japan and indications of additional monetary stimulus by the European Central Bank were just some of the contributing factors to the markets’ choppy returns. The second quarter of 2016 was also characterized by significant volatility in global equity markets, specifically toward the end of June as the U.K. held its referendum about membership in the European Union, popularly known as Brexit. |
| | Overall, global equity markets generated divergent performance during the Reporting Period as a whole. The MSCI World Index® (with dividends), representing global equity markets, posted a return of 0.66%. However, the MSCI Emerging Markets Index®, representing emerging equity markets, returned 6.41%. European equity markets, as measured by the Stoxx Europe 600 Index®, posted a 9.82% loss during the Reporting Period, despite quantitative easing by the European Central Bank, dragged down by Britain’s decision to leave the European Union. Japanese equity markets returned -18.17%, as measured by the Nikkei 225 Index®, for the same period. Chinese equity markets generated an equally weak performance, as evidenced by the -17.22% return of the Shanghai Stock Exchange Composite Index, as China’s slowing economy raised expectations of additional stimulus by its government. The U.S. equity market managed to stay positive, with the S&P 500® Index (with dividends), representing the U.S. equity market, ending slightly up with a return of 3.84% for the Reporting Period. Within the U.S. equity market, there was relative consistency, with small-cap equities, as measured by the Russell 2000® Index, returning 2.22% during the Reporting Period, while large-cap equities, as measured by the Russell 1000® Index, returned 3.74%. Volatility and market swings were evident virtually throughout the Reporting Period —especially in January and June 2016, the beginning and end of the Reporting Period. (All returns are in U.S. dollar terms.) |
| Q | | What key factors were responsible for the Fund’s performance during the Reporting Period? |
| A | | In seeking to achieve its investment objective, the Fund primarily takes long and/or short positions in the global equity markets, with a focus on securities listed on North American and European exchanges. The Fund may also invest in global fixed income, commodity and currency instruments. The Team employs an opportunistic investment approach and pursues asymmetric risk-reward opportunities, which are those that the Team believes have a greater |
2
PORTFOLIO RESULTS
| | potential for gains than losses. While the Fund will not be limited to any predetermined investment strategies, the Fund will primarily employ long/short equity and event driven investment strategies. |
| | The Fund generated negative absolute returns for the Reporting Period overall. The Fund had a challenging beginning to 2016, with the first quarter of 2016 exhibiting negative performance throughout. Reflecting on the Fund’s performance in the first quarter of 2016, some of the negative return was due to us getting certain positions wrong — such as Valeant Pharmaceuticals International, Citizens Financial Group and Royal Bank of Scotland. We exited these Fund positions, either through owning put options that took us out of positions or through outright selling of the Fund’s positions. (Put options are options contracts giving the owner the right, but not the obligation, to sell a specified amount of an underlying security at a specified price within a specified time. This is the opposite of a call option, which gives the holder the right to buy shares.) However, for other names in the Fund that also had challenging performance, such as Shire and Liberty Global, our fundamental views have not changed. In fact, these companies released strong fundamental data for the fourth quarter of 2015 that further supported our investment theses. During the Reporting Period, the Fund’s market hedges performed as expected and helped mitigate some of the market volatility. However, it is important to highlight that the Fund’s hedges are generally not designed to manage negative alpha from the Fund’s portfolio position, as this is precisely the risk we are taking in the Fund and how we seek returns over the long term. (Alpha is defined as a measure of performance on a risk-adjusted basis or the differential in the return from the Fund’s benchmark.) While the Fund generated positive absolute returns in May 2016 and managed to preserve capital through the Brexit volatility, the Fund had negative absolute returns in the second quarter of 2016 as a whole. |
| | Overall, both long positions and short positions in equities detracted from Fund results during the Reporting Period. Several of the Fund’s positions had an event-driven component to them. During the Reporting Period, the Fund made no investments in fixed income and commodity instruments. The Fund used currency instruments to manage foreign currency risk. |
| Q | | Which equity market sectors most significantly affected Fund performance? |
| A | | Detracting most from the Fund’s performance were long positions in the health care and financials sectors. The two sectors that contributed most positively to the Fund’s results during the Reporting Period were long positions in telecommunication services and consumer discretionary. |
| Q | | Which stocks detracted significantly from the Fund’s performance during the Reporting Period? |
| A | | Detracting from the Fund’s results were long positions in specialty pharmaceuticals companies Endo International and Valeant Pharmaceuticals International and in cable services provider Liberty Global. |
| | Shares of Endo International lost almost 75% during the Reporting Period. Its stock was down 25% for the month of February 2016, caused largely by disappointing fourth quarter 2015 earnings and 2016 guidance. Endo International reported fourth quarter 2015 results that beat estimates and it raised 2016 earnings guidance. Both metrics were better than what the company had positively preannounced in mid-January 2016 at an industry conference. However, the composition of the results and the raised earnings guidance was disappointing to the market. The shortfall stemmed largely from the legacy generics business, where pricing pressure and/or rebating came in above plan, which was more than offset by lower taxes. But investor confidence was shaken by the change in commentary since mid-January 2016 and took the stock to a mid-single digit multiple on 2017 earnings per share. The company’s stock traded off another 32% in March 2016 following a confluence of events. These included: 1) the potential entry of generics for one of its drugs, Voltaren gel, which it had anticipated to be later in the year; 2) the disclosure that the Federal Trade Commission is suing Endo International for anti-competitive “pay for delay” agreements; and 3) general malaise in the biotechnology/ specialty pharmaceuticals industries, which underperformed broader equity markets in March 2016. We exited the Fund’s position in Endo International in May 2016 due to limited visibility into pricing trends for the specialty pharmaceuticals industry. |
| | Valeant Pharmaceuticals International’s shares declined almost 80% during the Reporting Period, most of which came during the first quarter of 2016. The company’s shares traded down 74% in the first quarter of 2016, as the company confirmed it would miss the deadline to file its 2015 10-K. (This issue has since been resolved. A Form 10-K is an |
3
PORTFOLIO RESULTS
| | annual report required by the U.S. Securities and Exchange Commission (“SEC”), that gives a comprehensive summary of a company’s financial performance.) In addition, the company issued disappointing 2016 guidance and Mike Pearson was asked to step down as Chief Executive Officer (“CEO”) even though he had returned from an extended sick- leave only weeks prior. An ad-hoc committee finalized its review and had no further findings, other than the previously announced earnings restatement related to specialty pharmacy Philidor, with which the company was affiliated, decreasing 2014 earnings by nine cents and increasing 2015 earnings by seven cents. While the Fund held put options that partially offset the losses from the Fund’s long stock position, Valeant Pharmaceuticals International was nevertheless a significant detractor during the first quarter of 2016. Due to the market move, the Fund’s put options kicked in and took the Fund out of the position. While we believe our bottom-up analysis on the company was thorough, we clearly misjudged the impact of negative public opinion on the stock sentiment and the follow-through on its business, including the reaction of the pharmaceuticals distribution chain. At the end of the Reporting Period, the Fund had no position in the company. |
| | Shares of Liberty Global declined almost 31% during the Reporting Period, with most of the underperformance occurring in June 2016. Following the closing of its Cable & Wireless acquisition, Liberty Global announced the distribution of its LiLAC stake, which are Latin American and Caribbean assets, to Liberty Global’s shareholders with a distribution date set for July 1, 2016. This created a temporary overhang on, or potential concern about, LiLAC stock, which sold off approximately 24% in June 2016 with a direct repercussion on the Fund’s Liberty Global position. At the end of the Reporting Period, we expected LiLAC’s stock to stabilize after the distribution, as the shareholder base stabilizes. Toward the end of June 2016, Liberty Global’s shares sold off as the British pound weakened following the Brexit vote and as concerns emerged regarding the outlook of the British economy and its impact on Liberty Global’s main asset, Virgin Media. The Fund’s Liberty Global position remained fully hedged for currency translational effects, which helped offset the impact of the British pound sell-off. |
| Q | | What were some of the Fund’s best-performing individual stocks? |
| A | | The Fund benefited most from long positions in U.S. cable company Time Warner Cable and biopharmaceutical company Anacor Pharmaceuticals and from our strategy in U.S. banks. |
| | Shares of Time Warner Cable were up double-digits during the Reporting Period, as the company benefited from strong fourth quarter 2015 results driven by the implementation of a new user interface, or set-up box, and a series of other initiatives. The company also was the beneficiary of cable companies generally gaining share of video subscribers compared with telecom operators. Additionally, the merger arbitrage spread, or yield differential, with Charter Communications, another cable services company, significantly decreased during the first quarter of 2016, as the merger review progressed into the negotiations phase, as indicated by filings at the Federal Communications Commission. New Jersey approved the deal in February, while California agreed to a faster approval process with a decision in May instead of June 2016. The merger closed in May 2016, and we exited the Fund’s position. |
| | Anacor Pharmaceuticals, a new purchase for the Fund during the Reporting Period, traded up approximately 58% following the announcement of Pfizer’s intention to buy the company in an all-cash deal for $99.25 per share of Anacor Pharmaceuticals. We had initially established the position based on the belief that the revenue potential for a drug for mild to moderate atopic dermatitis called Crisborole is significantly larger than then-current consensus expectations. Further, we felt that the company was a strong acquisition candidate, particularly for companies with a dermatology presence or ambitions to build one. When Pfizer made its announcement, we took profits for the Fund and reduced the Fund’s equity exposure in Anacor Pharmaceuticals. The deal closed on June 24, 2016, and we exited the Fund’s position. |
| | During April and May 2016, the Fund’s investments in U.S. banks advanced on the back of relatively stable economic data, reversing a large portion of the share price declines seen in early 2016. Furthermore, U.S. banks generally received a clean bill of health in the most recent round of stress tests and capital planning. As a result, many U.S. banks, including Bank of America, announced an increase in their dividend and buybacks over the coming year. Ahead of the June 23, 2016 U.K. referendum on European Union membership, we adjusted the Fund’s positioning by monetizing some gains and utilizing a greater level of optionality. (Optionality describes the gamma profile of the portfolio; gamma measures the rate of change of the portfolio’s net exposure (delta) given a change in equity markets.) This move ultimately preserved the Fund’s capital, as share prices declined following the unexpected vote to leave. The U.S. banks at the end of the Reporting Period were pricing in a significantly weaker economic environment |
4
PORTFOLIO RESULTS
| | and only a single interest rate hike by the Federal Reserve (the “Fed”) through 2017. We believe there is compelling upside for U.S. financials if the incoming economic data indeed does show some stabilization. |
| Q | | How did the Fund use derivatives and similar instruments during the Reporting Period? |
| A | | During the Reporting Period, the Fund used total return swaps, currency forwards and equivalents, futures and forward contracts, and options. Total return swaps were used to gain exposure in a tax-efficient manner to specific securities or a broad market that may be difficult to access. Currency forwards and equivalents were used to gain exposure to specific currencies or to hedge against currency risk. Futures and forward contracts were used primarily for hedging purposes or to gain exposure to specific securities, indices, sectors and geographies. Options were used primarily for hedging purposes either at a strategy level or portfolio level and to gain exposure to specific securities and indices synthetically. The use of total return swaps, currency forwards and equivalents and futures detracted from performance, while the use of listed equity options had a positive effect on performance during the Reporting Period. |
| Q | | Did the Fund make any significant purchases or sales during the Reporting Period? |
| A | | In addition to the purchase of Anacor Pharmaceuticals, already mentioned, we re-initiated a Fund investment in KPN, the Dutch incumbent telecom operator offering fixed and mobile telecommunication services in the Netherlands. KPN was one of the first incumbents to upgrade its footprint to fiber and its mobile network to 4G. After the network upgrade, KPN has the highest 4G mobile coverage of any European operator and is expected to offer 100 megabytes per second fixed-line speeds to 85% of households by the end of 2016, far ahead of other European incumbents. These significant network improvements have driven meaningful increases in customer loyalty metrics and allowed KPN to continue to take market share against the otherwise well-performing cable operator in the Netherlands. In our view, KPN is now in the distinct position among European incumbents of continuously gaining market share in both mobile and fixed services. Given KPN’s strong network, which is coming off years of heavy investments and the Netherlands’ upcoming market transformation, we believe KPN can offer an attractive risk/reward profile for investors. |
| | As mentioned earlier, we exited the Fund’s positions in Valeant Pharmaceuticals International and in Endo International as we lost confidence in their respective management teams or the ability to have a view on pricing of their products, or both. We similarly sold the Fund’s positions in banks Citizens Financial Group and Royal Bank of Scotland. |
| Q | | Were there any notable changes in the Fund’s allocations during the Reporting Period? |
| A | | Due both to active management decisions and stock appreciation or depreciation, the Fund’s exposure to the telecommunication services and information technology sectors increased and its exposure to the health care, consumer discretionary, industrials and financials sectors decreased during the Reporting Period. There were no notable shifts in allocation from a regional perspective. |
| Q | | How was the Fund positioned at the end of the Reporting Period? |
| A | | At the end of June 2016, the Fund had its greatest exposure, based on long market value, to the health care, information technology, telecommunication services and consumer discretionary sectors. (Long market value is the current market value of stocks held (i.e. having a long position) in an account, calculated on a daily basis.) The Fund had its most modest exposure, based on long market value, to the materials and consumer staples sectors. At the end of the Reporting Period, the Fund had no exposure to the utilities sector. |
| | By region, the Fund had its greatest exposure, based on long market value, to the Americas, followed by the EMEA (Europe, Middle East and Africa) region and then Asia as of June 30, 2016. |
| Q | | What is the Fund’s tactical view and strategy for the months ahead? |
| A | | The Reporting Period was a stark reminder of the macroeconomic uncertainties that investors may face in the current market environment. At the end of the Reporting Period, we remained focused on the risks arising from China’s economic slowdown, the path of the U.S. economy with regard to growth and inflation, the potential interest rate hikes by the Fed, and the outcome of the U.S. presidential elections. Around the world, we believe populist movements and politics pose a great risk for free trade and economic growth, and we are monitoring these developments closely. |
| | Given the uncertain market environment and what we view as the relatively expensive valuations for many equities, we believe that our low beta, or low volatility, strategy with the |
5
PORTFOLIO RESULTS
| | mandate to seek alpha, or added value, through long and short positions is well positioned to potentially generate attractive returns. The Fund continues to run low net and relatively low gross exposure with a significant amount of optionality. In addition to the low directional exposure to equity markets, we remain focused on long and short positions that we believe have the potential to generate attractive returns regardless of the macroeconomic outcome. (Net exposure is the percentage difference between a fund’s long and short exposure. Net exposure is a measure of the extent to which a fund’s trading book is exposed to market fluctuations. Gross exposure is the absolute level of a fund’s investments. Gross exposure equals the value of long positions and short positions, and can be expressed either in dollar terms or percentage terms. It is a measure that indicates total exposure to financial markets, thus providing an insight into the investment amount at risk from market fluctuations. The lower the gross exposure, the smaller the potential loss (or gain). Directional exposure can mean a basic strategy of going long if the market or security is perceived as heading higher, or taking short positions if the direction is downward.) |
| | On the long side, we like companies with pricing power and barriers to entry that are somewhat immune from attack by competitors, and we like industries that benefit from access to inexpensive and abundant capital. We also like disruptors that may benefit from this era of technology disintermediation driven by wireless broadband, robotics and logistical revolutions rapidly changing the world. We also like special situations that we believe are especially attractive at this point given the severe pain in the hedge fund industry. On the short side, we are focused on finding industries that are suffering from over-investment and over-supply, which are damaging the pricing of the underlying goods. We also like being short disrupted companies and are focusing our research on companies in rapidly changing industries based on the technological advances just mentioned. |
| | While the performance of the Fund during the Reporting Period was certainly disappointing, we believe it is important to highlight that our investment philosophy is centered on building and preserving capital over the long term. In the history of managing our equity long/short strategy,1 our team has navigated through similarly challenging periods, and we subsequently recovered from these drawdowns within what we would consider to be a reasonable time span. (A drawdown is the peak-to-trough decline during a specific recorded period of an investment, fund or commodity.) Certainly, past performance is no guarantee of future results, but for the portfolio holdings in the Fund that have struggled recently, we believe the underperformance has created the potential for attractive upside going forward. |
| | 1 | | The Team has a long history of implementing the same equity long/short strategy used in this Fund. The Fund has only been in operation since 2014. |
6
PORTFOLIO RESULTS
Index Definitions
The MSCI® World Index is a free float-adjusted market capitalization weighted index that is designed to measure the equity market performance of developed markets. The MSCI World Index consists of the following 23 developed market country indexes: Australia, Austria, Belgium, Canada, Denmark, Finland, France, Germany, Hong Kong, Ireland, Israel, Italy, Japan, Netherlands, New Zealand, Norway, Portugal, Singapore, Spain, Sweden, Switzerland, the United Kingdom, and the United States.
The S&P 500® Index is the Standard & Poor’s 500 Composite Index of 500 stocks, an unmanaged index of common stock prices.
The Russell 2000® Index measures the performance of the 2,000 smallest companies in the Russell 3000® Index, which represents approximately 8% of the total market capitalization of the Russell 3000 Index. It is not possible to invest directly in an index.
The Nikkei 225® Index is a price-weighted equity index, which consists of 225 stocks in the 1st section of the Tokyo Stock Exchange.
The STOXX® Europe 600 Index is derived from the STOXX Europe Total Market Index (TMI) and is a subset of the STOXX Global 1800 Index. With a fixed number of 600 components, the STOXX Europe 600 Index represents large, mid and small capitalization companies across 18 countries of the European region: Austria, Belgium, Czech Republic, Denmark, Finland, France, Germany, Greece, Ireland, Italy, Luxembourg, the Netherlands, Norway, Portugal, Spain, Sweden, Switzerland and the United Kingdom.
The MSCI Emerging Markets Index is a free float-adjusted market capitalization index that is designed to measure equity market performance of emerging markets. As of June 30, 2015, the MSCI Emerging Markets Index consisted of the following 23 emerging market country indices: Brazil, Chile, China, Colombia, Czech Republic, Egypt, Greece, Hungary, India, Indonesia, Korea, Malaysia, Mexico, Peru, Philippines, Poland, Qatar, Russia, South Africa, Taiwan, Thailand, Turkey and United Arab Emirates.
The Shanghai Stock Exchange Composite Index is a capitalization-weighted index. The index tracks the daily price performance of all A-shares and B-shares listed on the Shanghai Stock Exchange.
The Russell 1000 Index® is an unmanaged market capitalization weighted index of the 1000 largest U.S. companies.
7
FUND BASICS
Goldman Sachs Long Short Fund
as of June 30, 2016
| | | | | | | | | | |
| | PERFORMANCE REVIEW | |
| | | January 1, 2016–June 30, 2016 | | Fund Total Return
(based on NAV)1 | | | Bank of America Merrill
Lynch U.S. Dollar
Three-Month LIBOR
Constant Maturity Index2 | |
| | Class A | | | -8.70 | % | | | 0.31 | % |
| | Class C | | | -8.99 | | | | 0.31 | |
| | Institutional | | | -8.45 | | | | 0.31 | |
| | Class IR | | | -8.56 | | | | 0.31 | |
| | | Class R | | | -8.82 | | | | 0.31 | |
| | 1 | | The net asset value (“NAV”) represents the net assets of the class of the Fund (ex-dividend) divided by the total number of shares of the class outstanding. The Fund’s performance assumes the reinvestment of dividends and other distributions. The Fund’s performance does not reflect the deduction of any applicable sales charges. |
| | 2 | | The Bank of America Merrill Lynch U.S. Dollar Three-Month LIBOR Constant Maturity Index (the “Index”) tracks the performance of a synthetic asset paying LIBOR to a stated maturity. The Index is based on the assumed purchase at par of a synthetic instrument having exactly its stated maturity and with a coupon equal to that day’s fixing rate. That issue is assumed to be sold the following business day (priced at a yield equal to the current day fixing rate) and rolled into a new instrument. |
| | | | | | | | | | | | |
| | STANDARDIZED TOTAL RETURNS3 |
| | | For the period ended 6/30/16 | | One Year | | | Since Inception | | | Inception Date |
| | Class A | | | -24.49 | % | | | -12.21 | % | | 9/30/2014 |
| | Class C | | | -21.55 | | | | -9.99 | | | 9/30/2014 |
| | Institutional | | | -19.81 | | | | -8.93 | | | 9/30/2014 |
| | Class IR | | | -19.93 | | | | -9.06 | | | 9/30/2014 |
| | | Class R | | | -20.40 | | | | -9.56 | | | 9/30/2014 |
| | 3 | | The Standardized Total Returns are average annual total returns as of the most recent calendar quarter-end. They assume reinvestment of all distributions at net asset value. These returns reflect a maximum initial sales charge of 5.50% for Class A Shares and the contingent deferred sales charge for Class C Shares (1.00% if shares are redeemed within 12 months of purchase). Because Institutional, Class IR and Class R Shares do not involve a sales charge, such a charge is not applied to their Standardized Total Returns. |
The returns set forth in the tables above represent past performance. Past performance does not guarantee future results. The Fund’s investment return and principal value will fluctuate so that an investor’s shares, when redeemed, may be worth more or less than their original cost. Current performance may be lower or higher than the performance quoted above. Please visit our web site at www.GSAMFUNDS.com to obtain the most recent month-end returns. Performance reflects applicable fee waivers and/or expense limitations in effect during the periods shown. In their absence, performance would be reduced. Returns do not reflect the deduction of taxes that a shareholder would pay on Fund distributions or the redemption of Fund shares.
8
FUND BASICS
| | | | | | | | | | |
| | EXPENSE RATIOS4 | |
| | | | | Net Expense Ratios (current) | | | Gross Expense Ratios (before waiver) | |
| | Class A | | | 2.85 | % | | | 3.13 | % |
| | Class C | | | 3.60 | | | | 3.90 | |
| | Institutional | | | 2.45 | | | | 2.71 | |
| | Class IR | | | 2.60 | | | | 2.84 | |
| | | Class R | | | 3.10 | | | | 3.34 | |
| | 4 | | The expense ratios of the Fund, both current (net of applicable fee waivers and/or expense limitations) and before waivers (gross of applicable fee waivers and/or expense limitations) are as set forth above according to the most recent publicly available Prospectus for the Fund and may differ from the expense ratios disclosed in the Financial Highlights in this report. Pursuant to a contractual arrangement, the Fund’s waivers and/or expense limitations will remain in place through at least April 29, 2017, and prior to such date the Investment Adviser may not terminate the arrangements without the approval of the Fund’s Board of Trustees. If these arrangements are discontinued in the future, the expense ratios may change without shareholder approval. |
| | | | | | | | |
| | TOP TEN HOLDINGS AS OF 6/30/165 |
| | | Holding | | % of Net Assets | | | Line of Business |
| | Humana, Inc. | | | 6.6 | % | | Health Care Providers & Services |
| | Lamar Advertising Co. Class A | | | 6.4 | | | Real Estate Investment Trusts |
| | Liberty Global PLC Series C | | | 5.9 | | | Media |
| | Koninklijke KPN NV | | | 5.3 | | | Diversified Telecommunication
Services |
| | Broadcom Ltd. | | | 5.1 | | | Semiconductors & Semiconductor
Equipment |
| | Charter Communications, Inc. | | | 5.0 | | | Media |
| | Bank of America Corp. | | | 4.9 | | | Commercial Banks |
| | Dentsply Sirona, Inc. | | | 3.5 | | | Health Care Equipment & Supplies |
| | Alibaba Group Holding Ltd. ADR | | | 3.0 | | | Internet Software & Services |
| | | Comcast Corp. Class A | | | 2.7 | | | Media |
| 5 | | The top 10 holdings do not include the Fund’s short positions, if any, as listed in the Schedule of Investments and certain derivatives, if any, as listed in the Additional Investment Information section of the Schedule of Investments and may not be representative of the Fund’s future investments. |
9
FUND BASICS
|
| FUND COMPOSITION – LONG EXPOSURE6 |
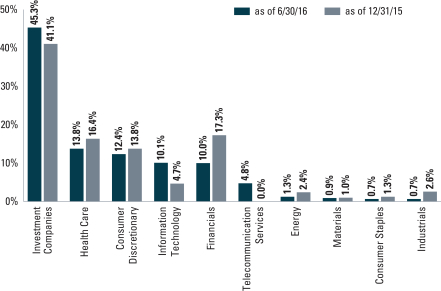
| | 6 | | The Fund is actively managed and, as such, its composition may differ over time. Consequently, the Fund’s overall sector allocations may differ from the percentages contained in the graph above. The graph categorizes investments using the Global Industry Classification Standard (“GICS”), however, the sector classifications used by the portfolio management team may differ from GICS. The percentage shown for each investment category reflects the value of investments in that category as a percentage of the total value of the Fund’s Long Equity Investments. Underlying sector allocations of Exchange Traded Funds and Investment Companies held by the Fund are not reflected in the graph above. The graph depicts the Fund’s long investments but may not represent the Fund’s market exposure due to the exclusion of the Fund’s short positions, if any, as listed in the Schedule of Investments and certain derivatives, if any, as listed in the Additional Investment Information section of the Schedule of Investments. |
10
FUND BASICS
|
| FUND COMPOSITION – SHORT EXPOSURE7 |
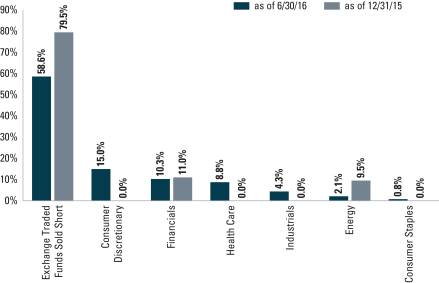
| | 7 | | The Fund is actively managed and, as such, its composition may differ over time. Consequently, the Fund’s overall sector allocations may differ from the percentages contained in the graph above. The graph categorizes investments using the Global Industry Classification Standard (“GICS”), however, the sector classifications used by the portfolio management team may differ from GICS. The percentage shown for each investment category reflects the value of investments in that category as a percentage of the total value of the Fund’s Short Equity Investments. |
11
GOLDMAN SACHS LONG SHORT FUND
Schedule of Investments
June 30, 2016 (Unaudited)
| | | | | | | | |
Shares | | | Description | | Value | |
| | | | | | | | |
| | Common Stocks – 63.5% | |
| | Beverages – 0.8% | |
| | 20,997 | | | Coca-Cola European Partners PLC | | $ | 749,383 | |
| | |
| | Chemicals – 1.0% | |
| | 2,448 | | | Syngenta AG | | | 939,661 | |
| | |
| | Commercial Banks(a) – 5.0% | |
| | 335,801 | | | Bank of America Corp. | | | 4,456,080 | |
| | 2,314 | | | Citigroup, Inc. | | | 93,578 | |
| | | | | | | | |
| | | | | | | 4,549,658 | |
| | |
| | Diversified Telecommunication Services – 5.3% | |
| | 1,336,055 | | | Koninklijke KPN NV | | | 4,762,280 | |
| | |
| | Financials – 0.2% | |
| | 5,217 | | | The Charles Schwab Corp. | | | 132,042 | |
| | |
| | Health Care Equipment & Supplies(a) – 4.4% | |
| | 51,707 | | | DENTSPLY SIRONA, Inc. | | | 3,207,902 | |
| | 9,587 | | | St. Jude Medical, Inc. | | | 747,786 | |
| | | | | | | | |
| | | | | | | 3,955,688 | |
| | |
| | Health Care Providers & Services(a) – 6.6% | |
| | 33,334 | | | Humana, Inc. | | | 5,996,120 | |
| | |
| | Health Care Technology* – 0.5% | |
| | 34,557 | | | Allscripts Healthcare Solutions, Inc. | | | 438,874 | |
| | |
| | Insurance* – 0.1% | |
| | 515 | | | Zurich Insurance Group AG | | | 115,492 | |
| | |
| | Internet – 0.1% | |
| | 5,241 | | | JD.com, Inc. ADR | | | 111,267 | |
| | |
| | Internet Software & Services* – 3.9% | |
| | 34,596 | | | Alibaba Group Holding Ltd. ADR | | | 2,751,420 | |
| | 3,920 | | | LinkedIn Corp. Class A(a) | | | 741,860 | |
| | | | | | | | |
| | | | | | | 3,493,280 | |
| | |
| | Media – 14.3% | |
| | 19,740 | | | Charter Communications, Inc. | | | 4,513,354 | |
| | 38,108 | | | Comcast Corp. Class A(a) | | | 2,484,260 | |
| | 18,573 | | | Liberty Global PLC LiLAC Class C* | | | 603,444 | |
| | 185,365 | | | Liberty Global PLC Series C*(a) | | | 5,310,707 | |
| | | | | | | | |
| | | | | | | 12,911,765 | |
| | |
| | Oil, Gas & Consumable Fuels(a) – 1.5% | |
| | 63,966 | | | The Williams Cos., Inc. | | | 1,383,585 | |
| | |
| | Pharmaceuticals – 4.5% | |
| | 4,243 | | | Allergan PLC*(a) | | | 980,515 | |
| | 38,373 | | | Mallinckrodt PLC*(a) | | | 2,332,311 | |
| | 15,670 | | | Teva Pharmaceutical Industries Ltd. ADR | | | 787,104 | |
| | | | | | | | |
| | | | | | | 4,099,930 | |
| | |
| | Real Estate Investment Trusts(a) – 6.4% | |
| | 87,167 | | | Lamar Advertising Co. Class A | | | 5,779,172 | |
| | |
| | | | | | | | |
| | Common Stocks – (continued) | |
| | Road & Rail(a) – 0.8% | |
| | 8,161 | | | Union Pacific Corp. | | $ | 712,047 | |
| | |
| | Semiconductors & Semiconductor Equipment(a) – 5.1% | |
| | 29,903 | | | Broadcom Ltd. | | | 4,646,926 | |
| | |
| | Software – 2.7% | |
| | 22,856 | | | Microsoft Corp.(a) | | | 1,169,542 | |
| | 34,912 | | | PTC, Inc.* | | | 1,311,993 | |
| | | | | | | | |
| | | | | | | 2,481,535 | |
| | |
| | Wireless Telecommunication Services(a) – 0.3% | |
| | 8,608 | | | Vodafone Group PLC ADR | | | 265,901 | |
| | |
| | TOTAL COMMON STOCKS | | | | |
| | (Cost $55,112,325) | | $ | 57,524,606 | |
| | |
| | | | | | | | |
| | Exchange Traded Funds – 5.7% | |
| | 125,684 | | | Financial Select Sector SPDR Fund | | $ | 2,625,539 | |
| | 65,418 | | | SPDR S&P Regional Banking ETF | | | 2,508,780 | |
| | |
| | TOTAL EXCHANGE TRADED FUNDS | | | | |
| | (Cost $5,195,732) | | $ | 5,134,319 | |
| | |
| | | | | | | | | | | | | | |
| Contracts | | | Exercise
Price | | | Expiration
Date | | | Value | |
| | | | | | | | | | | | | | |
| | | | | | | | | | | | | | |
| | Option Contracts Purchased – 2.3% | |
| | Options on Equities – 2.3% | |
| Citibank NA (London) Call – S&P 500 Index | |
| | 34 | | | $ | 2,085.00 | | | | 07/01/16 | | | $ | 53,040 | |
| Citibank NA (London) Put – S&P 500 Index | |
| | 17 | | | | 2,000.00 | | | | 07/15/16 | | | | 5,738 | |
| Credit Suisse International (London) Call – Vodafone Group PLC | |
| | 956 | | | | 2.30 | | | | 09/16/16 | | | | 106,586 | |
| Deutsche Bank AG Call – Bank of America Corp. | |
| | 802 | | | | 15.00 | | | | 09/16/16 | | | | 11,278 | |
| Deutsche Bank AG Call – Bank of America Corp. | |
| | 3,334 | | | | 15.00 | | | | 09/16/16 | | | | 46,883 | |
| Deutsche Bank AG Call – SPDR S&P Regional Banking ETF | |
| | 1,218 | | | | 42.00 | | | | 09/16/16 | | | | 56,529 | |
| Deutsche Bank AG Call – The Charles Schwab Corp. | |
| | 655 | | | | 30.00 | | | | 07/15/16 | | | | 23 | |
| Deutsche Bank AG Call – The Charles Schwab Corp. | |
| | 557 | | | | 28.00 | | | | 09/16/16 | | | | 30,891 | |
| Deutsche Bank AG Call – The Charles Schwab Corp. | |
| | 774 | | | | 28.00 | | | | 09/16/16 | | | | 42,925 | |
| Deutsche Bank AG Put – Bank of America Corp. | |
| | 2,223 | | | | 14.00 | | | | 07/01/16 | | | | 162,272 | |
| Deutsche Bank AG Put – Bank of America Corp. | |
| | 1,224 | | | | 14.00 | | | | 07/01/16 | | | | 90,576 | |
| Deutsche Bank AG Put – DAX Index | |
| | 103 | | | | 9,500.00 | | | | 07/15/16 | | | | 66,697 | |
| Deutsche Bank AG Put – Euro Stoxx 50 | |
| | 162 | | | | 2,800.00 | | | | 07/15/16 | | | | 62,833 | |
| | |
| | |
| 12 | | The accompanying notes are an integral part of these financial statements. |
GOLDMAN SACHS LONG SHORT FUND
| | | | | | | | | | | | | | |
| Contracts | | | Exercise
Price | | | Expiration
Date | | | Value | |
| | | | | | | | | | | | | | |
| | | | | | | | | | | | | | |
| | Option Contracts Purchased – (continued) | |
| | Options on Equities – (continued) | |
| Deutsche Bank AG Put – Humana, Inc. | |
| | 338 | | | $ | 170.00 | | | | 01/20/17 | | | $ | 652,293 | |
| Merrill Lynch International PLC Call – DAX Index | |
| | 86 | | | | 10,000.00 | | | | 08/19/16 | | | | 80,836 | |
| Merrill Lynch International PLC Call – S&P 500 Index | |
| | 34 | | | | 2,100.00 | | | | 07/15/16 | | | | 62,390 | |
| Merrill Lynch International PLC Put – Consumer Discretionary
Select Sector SPDR Fund |
|
| | 589 | | | | 74.00 | | | | 07/15/16 | | | | 9,129 | |
| Merrill Lynch International PLC Put – S&P 500 Index | |
| | 34 | | | | 2,080.00 | | | | 07/08/16 | | | | 32,640 | |
| Merrill Lynch International PLC Put – S&P 500 Index | |
| | 34 | | | | 2,050.00 | | | | 07/15/16 | | | | 28,050 | |
| Morgan Stanley & Co. International PLC Call – S&P 500 Index | |
| | 85 | | | | 2,140.00 | | | | 07/01/16 | | | | 1,063 | |
| Morgan Stanley & Co. International PLC Put – iShares PHLX
Semiconductor ETF |
|
| | 29 | | | | 87.00 | | | | 01/20/17 | | | | 12,355 | |
| Morgan Stanley & Co. International PLC Put – iShares PHLX
Semiconductor ETF |
|
| | 71 | | | | 87.00 | | | | 01/20/17 | | | | 30,247 | |
| Morgan Stanley & Co. International PLC Put – iShares PHLX
Semiconductor ETF |
|
| | 331 | | | | 87.00 | | | | 01/20/17 | | | | 141,012 | |
| Morgan Stanley & Co. International PLC Put – Microsoft Corp. | |
| | 194 | | | | 55.00 | | | | 01/19/18 | | | | 180,905 | |
| UBS AG (London) Call – S&P 500 Index | |
| | 57 | | | | 2,080.00 | | | | 07/08/16 | | | | 148,485 | |
| UBS AG (London) Call – S&P 500 Index | |
| | 40 | | | | 2,130.00 | | | | 07/15/16 | | | | 21,400 | |
| | |
| | TOTAL OPTIONS PURCHASED – 2.3% | |
| | (Cost $3,093,057) | | | $ | 2,137,076 | |
| | |
| | | | | | |
Shares | | Rate | | Value | |
| Investment Company(b)(c) – 52.6% | |
Goldman Sachs Financial Square Government Fund – FST Institutional Shares | |
| 47,651,693 | | 0.290% | | $ | 47,651,693 | |
| (Cost $47,651,693) | | | | |
| |
| TOTAL INVESTMENTS BEFORE SHORT POSITIONS – 124.0% | | | | |
| (Cost $111,052,807) | | $ | 112,447,694 | |
| |
| | | | | | | | |
Shares | | | Description | | Value | |
| | | | | | | | |
| | Common Stocks Sold Short – (19.3)% | |
| | Capital Markets – (0.8)% | |
| | 10,285 | | | T. Rowe Price Group, Inc. | | $ | (750,497 | ) |
| | |
| | | | | | | | |
| | Common Stocks Sold Short – (continued) | |
| | Commercial Banks – (0.8)% | |
| | 2,314 | | | Citigroup, Inc. | | $ | (93,578 | ) |
| | 11,432 | | | Royal Bank of Canada | | | (675,505 | ) |
| | | | | | | | |
| | | | | | | (769,083 | ) |
| | |
| | Diversified Financial Services – (0.7)% | |
| | 21,433 | | | TD Ameritrade Holding Corp. | | | (610,305 | ) |
| | |
| | Drugs – (0.4)% | |
| | 8,348 | | | Abbott Laboratories | | | (328,160 | ) |
| | |
| | Financials – (0.1)% | |
| | 5,217 | | | The Charles Schwab Corp. | | | (132,042 | ) |
| | |
| | Gas Utilities – (0.7)% | |
| | 7,033 | | | ONEOK, Inc. | | | (333,716 | ) |
| | 7,327 | | | Spectra Energy Corp. | | | (268,388 | ) |
| | | | | | | | |
| | | | | | | (602,104 | ) |
| | |
| | Health Care Providers & Services – (3.8)% | |
| | 27,917 | | | Aetna, Inc. | | | (3,409,503 | ) |
| | |
| | Insurance* – (0.1)% | |
| | 515 | | | Zurich Insurance Group AG | | | (115,492 | ) |
| | |
| | Internet* – (1.6)% | |
| | 26,411 | | | Ctrip.com International Ltd. ADR | | | (1,088,133 | ) |
| | 17,827 | | | JD.com, Inc. ADR | | | (378,467 | ) |
| | | | | | | | |
| | | | | | | (1,466,600 | ) |
| | |
| | Machinery – (0.4)% | |
| | 4,443 | | | Caterpillar, Inc. | | | (336,824 | ) |
| | |
| | Media – (5.4)% | |
| | 19,740 | | | Charter Communications, Inc.* | | | (4,513,445 | ) |
| | 3,840 | | | The Walt Disney Co. | | | (375,629 | ) |
| | | | | | | | |
| | | | | | | (4,889,074 | ) |
| | |
| | Oil & Gas* – (0.3)% | |
| | 7,785 | | | Cheniere Energy, Inc. | | | (292,327 | ) |
| | |
| | Pharmaceuticals – (0.4)% | |
| | 3,667 | | | Mead Johnson Nutrition Co. | | | (332,780 | ) |
| | |
| | Real Estate Investment Trusts – (2.2)% | |
| | 12,745 | | | CubeSmart | | | (393,566 | ) |
| | 7,248 | | | Extra Space Storage, Inc. | | | (670,730 | ) |
| | 3,662 | | | Public Storage | | | (935,970 | ) |
| | | | | | | | |
| | | | | | | (2,000,266 | ) |
| | |
| | Trading Companies & Distributors – (1.6)% | |
| | 6,606 | | | W.W. Grainger, Inc. | | | (1,501,214 | ) |
| | |
| | TOTAL COMMON STOCKS SOLD SHORT | | | | |
| | (Cost $(17,055,291)) | | $ | (17,536,271 | ) |
| | |
| | |
| The accompanying notes are an integral part of these financial statements. | | 13 |
GOLDMAN SACHS LONG SHORT FUND
Schedule of Investments (continued)
June 30, 2016 (Unaudited)
| | | | | | | | |
Shares | | | Description | | Value | |
| | Exchange Traded Funds Sold Short – (27.4)% | |
| | 119,059 | | | Consumer Discretionary Select Sector SPDR Fund | | $ | (9,292,555 | ) |
| | 51,480 | | | Consumer Staples Select Sector SPDR Fund | | | (2,839,122 | ) |
| | 125,684 | | | Financial Select Sector SPDR Fund | | | (2,625,539 | ) |
| | 12,364 | | | Health Care Select Sector SPDR Fund | | | (886,746 | ) |
| | 12,786 | | | iShares Nasdaq Biotechnology ETF | | | (3,290,349 | ) |
| | 5,290 | | | iShares PHLX Semiconductor ETF | | | (495,356 | ) |
| | 17,705 | | | iShares Russell 2000 ETF | | | (2,035,544 | ) |
| | 9,825 | | | iShares US Real Estate ETF | | | (808,597 | ) |
| | 48,428 | | | Utilities Select Sector SPDR Fund | | | (2,541,017 | ) |
| | |
| TOTAL EXCHANGE TRADED FUNDS
SOLD SHORT | | | | |
| | (Cost $(25,151,574)) | | $ | (24,814,825 | ) |
| | |
| | TOTAL SECURITIES SOLD SHORT – (46.7)% | |
| | (Cost $(42,206,865)) | | $ | (42,351,096 | ) |
| | |
| OTHER ASSETS IN EXCESS OF
OTHER LIABILITIES – 22.6% | | | 20,519,170 | |
| | |
| | NET ASSETS – 100.0% | | $ | 90,615,768 | |
| | |
| | |
| The percentage shown for each investment category reflects the value of investments in that category as a percentage of net assets. |
* | | Non-income producing security. |
(a) | | All or portion of security is pledged as collateral for short sales. Total market value of securities pledged as collateral on short sales amounts to $42,045,871, which represents approximately 46.4% of net assets as of June 30, 2016. |
(b) | | Represents an Affiliated Fund. |
(c) | | Variable rate security. Interest rate or distribution rate disclosed is that which is in effect on June 30, 2016. |
| | |
|
Currency Abbreviations: |
CAD | | —Canadian Dollar |
CHF | | —Swiss Franc |
EUR | | —Euro |
GBP | | —British Pound |
USD | | —U.S. Dollar |
| | |
Investment Abbreviations: |
ADR | | —American Depositary Receipt |
ETF | | —Exchange Traded Fund |
PLC | | —Public Limited Company |
|
| | |
| 14 | | The accompanying notes are an integral part of these financial statements. |
GOLDMAN SACHS LONG SHORT FUND
|
| ADDITIONAL INVESTMENT INFORMATION |
FORWARD FOREIGN CURRENCY EXCHANGE CONTRACTS — At June 30, 2016, the Fund had the following forward foreign currency exchange contracts:
FORWARD FOREIGN CURRENCY EXCHANGE CONTRACTS WITH UNREALIZED GAIN
| | | | | | | | | | | | | | | | | | | | | | | | |
| Counterparty | | Currency
Purchased | | | Currency
Sold | | | Current
Value | | | Settlement
Date | | | Unrealized
Gain | |
Morgan Stanley & Co. International PLC | | CHF | | | 250,000 | | | USD | | | 256,774 | | | $ | 257,240 | | | | 09/21/16 | | | $ | 467 | |
| | EUR | | | 775,000 | | | USD | | | 858,785 | | | | 862,678 | | | | 09/21/16 | | | | 3,893 | |
| | USD | | | 39,336 | | | CAD | | | 50,000 | | | | 38,707 | | | | 09/21/16 | | | | 629 | |
| | USD | | | 2,850,381 | | | CHF | | | 2,735,284 | | | | 2,814,501 | | | | 09/21/16 | | | | 35,880 | |
| | USD | | | 9,530,741 | | | EUR | | | 8,386,802 | | | | 9,335,631 | | | | 09/21/16 | | | | 195,109 | |
| | | USD | | | 582,204 | | | GBP | | | 402,194 | | | | 535,854 | | | | 09/21/16 | | | | 46,352 | |
| TOTAL | | | | | | | | | | | | | | | | | | | | | | $ | 282,330 | |
FORWARD FOREIGN CURRENCY EXCHANGE CONTRACTS WITH UNREALIZED LOSS
| | | | | | | | | | | | | | | | | | | | | | | | |
| Counterparty | | Currency
Purchased | | | Currency
Sold | | | Current
Value | | | Settlement
Date | | | Unrealized
Loss | |
Morgan Stanley & Co. International PLC | | CAD | | | 1,126,722 | | | USD | | | 884,601 | | | $ | 872,250 | | | | 09/21/16 | | | $ | (12,354 | ) |
| | USD | | | 152,940 | | | CAD | | | 200,000 | | | | 154,830 | | | | 09/21/16 | | | | (1,889 | ) |
| | | USD | | | 77,601 | | | EUR | | | 70,000 | | | | 77,919 | | | | 09/21/16 | | | | (318 | ) |
| TOTAL | | | | | | | | | | | | | | | | | | | | | | $ | (14,561 | ) |
| | |
| The accompanying notes are an integral part of these financial statements. | | 15 |
GOLDMAN SACHS LONG SHORT FUND
Schedule of Investments (continued)
June 30, 2016 (Unaudited)
|
| ADDITIONAL INVESTMENT INFORMATION (continued) |
FUTURES CONTRACTS — At June 30, 2016, the Fund had the following futures contracts:
| | | | | | | | | | | | | | |
| Type | | Number of
Contracts
Long (Short) | | | Expiration
Date | | Current
Value | | | Unrealized
Gain (Loss) | |
S&P 500 E-Mini Index | | | (210 | ) | | September 2016 | | $ | (21,947,100 | ) | | $ | (59,264 | ) |
DAX Index | | | (10 | ) | | September 2016 | | | (2,682,404 | ) | | | (14,854 | ) |
| TOTAL | | | $ | (74,118 | ) |
SWAP CONTRACTS — At June 30, 2016, the Fund had the following swap contracts:
OVER THE COUNTER TOTAL RETURN SWAP CONTRACTS
| | | | | | | | | | | | | | | | | | |
| Counterparty | | Notional
Amount
(000s) | | | Reference
Security | | Termination
Date | | Rates
Received (Paid)(a) | | | Unrealized
Gain (Loss)* | |
Credit Suisse International (London) | | EUR | | | 914 | | | Airpax Electronic Shanghai Co. Ltd. | | 12/20/17 | | | 0.300 | % | | $ | (18,889 | ) |
| | GBP | | | 137 | | | British Land Co. PLC | | 07/01/21 | | | 0.300 | | | | (2,167 | ) |
| | | | | 344 | | | BT Group PLC | | 11/07/17 | | | 0.300 | | | | (50,749 | ) |
| | | | | 12 | | | CRH PLC | | 06/29/21 | | | (0.300 | ) | | | 17,391 | |
| | EUR | | | 1,407 | | | Ferrovial SA | | 09/25/17 | | | (0.300 | ) | | | 8 | |
| | | | | 80 | | | Ferrovial SA | | 03/24/21 | | | 0.300 | | | | (7,710 | ) |
| | GBP | | | 92 | | | Shire PLC | | 10/03/19 | | | 0.300 | | | | 47,670 | |
| | | | | 1,479 | | | Vodafone Group PLC | | 11/22/16 | | | 0.300 | | | | 343,248 | |
| | | EUR | | | 61 | | | ZODIAC SA | | 12/29/17 | | | 0.300 | | | | 3,285 | |
| TOTAL | | | | | | | | | | | | | | | | $ | 332,087 | |
| | (a) | | The Fund receives quarterly coupon payments in accordance with the swap contract(s). On the termination date of the swap contract(s), the Fund will either receive from or pay to the counterparty an amount equal to the net of the accrued financing fees and the value of the reference security subtracted from the original notional cost (notional multiplied by the price change of the reference security, converted to U.S. Dollars). |
| | * | | There are no upfront payments on the swap contracts, therefore the unrealized gain (loss) of the swap contracts is equal to their market value |
| | |
| 16 | | The accompanying notes are an integral part of these financial statements. |
GOLDMAN SACHS LONG SHORT FUND
|
| ADDITIONAL INVESTMENT INFORMATION (continued) |
WRITTEN OPTIONS CONTRACTS — At June 30, 2016 the Fund had following written options:
OPTIONS ON EQUITIES CONTRACTS
| | | | | | | | | | | | | | | | | | |
| Counterparty | | Description | | Contracts | | | Expiration
Date | | | Strike
Price | | | Value | |
Citibank NA (London) | | Put - S&P 500 Index | | | 17 | | | | 07/15/16 | | | $ | 1,870 | | | $ | (1,062 | ) |
Deutsche Bank AG | | Put - Aetna, Inc. | | | 283 | | | | 10/21/16 | | | | 110 | | | | (80,572 | ) |
| | Put - Euro Stoxx 50 | | | 162 | | | | 07/15/16 | | | | 2,500 | | | | (4,045 | ) |
Merrill Lynch International PLC | | Put - Consumer Discretionary Select Sector SPDR Fund | | | 1178 | | | | 07/15/16 | | | | 70 | | | | (3,534 | ) |
| | Put - DAX Index | | | 86 | | | | 08/19/16 | | | | 9,000 | | | | (60,365 | ) |
| | Put - S&P 500 Index | | | 34 | | | | 07/15/16 | | | | 1,950 | | | | (5,185 | ) |
| | Put - S&P 500 Index | | | 34 | | | | 07/15/16 | | | | 1,920 | | | | (3,570 | ) |
Morgan Stanley & Co. International PLC | | Put - Vodafone Group PLC | | | 478 | | | | 09/16/16 | | | | 2 | | | | (7,159 | ) |
| | | Call - Vodafone Group PLC | | | 957 | | | | 09/16/16 | | | | 3 | | | | (28,665 | ) |
| TOTAL (Premium Received $491,820) | | | 3,229 | | | | | | | | | | | $ | (194,157 | ) |
For the six months ended June 30, 2016, the Fund had the following written options activity:
OPTIONS ON EQUITIES
| | | | | | | | |
| | | Contracts | | | Premiums
Received | |
Contracts Outstanding December 31, 2015 | | | 841 | | | $ | 363,885 | |
Contracts Written | | | 31,318 | | | | 8,395,762 | |
Contracts Bought to Close | | | (21,146 | ) | | | (3,480,313 | ) |
Contracts Expired | | | (7,234 | ) | | | (4,773,857 | ) |
Contracts Assigned | | | (550 | ) | | | (13,657 | ) |
Contracts Outstanding June 30, 2016 | | | 3,229 | | | $ | 491,820 | |
| | |
| The accompanying notes are an integral part of these financial statements. | | 17 |
GOLDMAN SACHS LONG SHORT FUND
Statement of Assets and Liabilities
June 30, 2016 (Unaudited)
| | | | | | |
| | | | | | |
| | Assets: | |
| | Investments of unaffiliated issuers, at value (cost $63,401,114) | | $ | 64,796,001 | |
| | Investments of affiliated issuers, at value (cost $47,651,693) | | | 47,651,693 | |
| | Cash | | | 6,941,323 | |
| | Foreign currencies, at value (cost $722,843) | | | 710,709 | |
| | Unrealized gain on swap contracts | | | 411,602 | |
| | Unrealized gain on forward foreign currency exchange contracts | | | 282,330 | |
| | Receivables: | | | | |
| | Investments sold | | | 12,544,651 | |
| | Collateral on certain derivative contracts(a) | | | 6,519,374 | |
| | Collateral on Short Sales | | | 911,322 | |
| | Fund shares sold | | | 113,402 | |
| | Dividends and interest | | | 40,131 | |
| | Reimbursement from investment adviser | | | 23,769 | |
| | Foreign tax reclaims | | | 3,473 | |
| | Other assets | | | 153 | |
| | Total assets | | | 140,949,933 | |
| | | | | | |
| | Liabilities: | |
| | Investments sold short, at value (proceeds received $42,206,865) | | | 42,351,096 | |
| | Variation margin on certain derivative contracts | | | 272,281 | |
| | Written option contracts, at value (premium received $491,820) | | | 194,157 | |
| | Unrealized loss on swap contracts | | | 79,515 | |
| | Unrealized loss on forward foreign currency exchange contracts | | | 14,561 | |
| | Payables: | | | | |
| | Investments purchased | | | 6,469,575 | |
| | Collateral on certain derivative contracts | | | 340,000 | |
| | Fund shares redeemed | | | 175,897 | |
| | Due to broker — upfront payment | | | 142,959 | |
| | Management fees | | | 112,651 | |
| | Dividend Payable Short Position | | | 16,765 | |
| | Distribution and Service fees and Transfer Agency fees | | | 10,997 | |
| | Accrued expenses | | | 153,711 | |
| | Total liabilities | | | 50,334,165 | |
| | | | | | |
| | Net Assets: | |
| | Paid-in capital | | | 128,350,380 | |
| | Distributions in excess of net investment loss | | | (997,549 | ) |
| | Accumulated net realized loss | | | (38,784,934 | ) |
| | Net unrealized gain | | | 2,047,871 | |
| | | NET ASSETS | | $ | 90,615,768 | |
| | | Net Assets: | | | | |
| | | Class A | | $ | 7,735,197 | |
| | | Class C | | | 4,975,299 | |
| | | Institutional | | | 72,807,105 | |
| | | Class IR | | | 5,077,206 | |
| | | Class R | | | 20,961 | |
| | | Total Net Assets | | $ | 90,615,768 | |
| | | Shares Outstanding $0.001 par value (unlimited number of shares authorized): | | | | |
| | | Class A | | | 920,641 | |
| | | Class C | | | 599,700 | |
| | | Institutional | | | 8,622,118 | |
| | | Class IR | | | 601,870 | |
| | | Class R | | | 2,504 | |
| | | Net asset value, offering and redemption price per share:(b) | | | | |
| | | Class A | | | $8.40 | |
| | | Class C | | | 8.30 | |
| | | Institutional | | | 8.44 | |
| | | Class IR | | | 8.44 | |
| | | Class R | | | 8.37 | |
| | (a) | | Includes amounts segregated for initial margin and/or collateral on futures transactions, swaps transactions and options transactions of $1,213,294, $2,580,000 and $2,726,080, respectively. |
| | (b) | | Maximum public offering price per share for Class A Shares is $8.89. At redemption, Class C Shares may be subject to a contingent deferred sales charge, assessed on the amount equal to the lesser of the current net asset value (“NAV”) or the original purchase price of the shares. |
| | |
| 18 | | The accompanying notes are an integral part of these financial statements. |
GOLDMAN SACHS LONG SHORT FUND
Statement of Operations
For the Six Months Ended June 30, 2016 (Unaudited)
| | | | | | |
| | | | | | |
| | Investment income: | | | | |
| | Dividends — unaffiliated issuers (net of foreign withholding taxes of $15,039) | | $ | 1,054,823 | |
| | Dividends — affiliated issuers | | | 99,294 | |
| | Total investment income | | | 1,154,117 | |
| | | | | | |
| | Expenses: | | | | |
| | Management fees | | | 1,065,411 | |
| | Dividends expenses on short positions | | | 437,308 | |
| | Brokerage fees | | | 383,556 | |
| | Custody, accounting and administrative services | | | 59,406 | |
| | Professional fees | | | 51,344 | |
| | Transfer Agency fees(a) | | | 48,533 | |
| | Distribution and Service fees(a) | | | 45,016 | |
| | Registration fees | | | 38,471 | |
| | Printing and mailing costs | | | 32,034 | |
| | Trustee fees | | | 12,873 | |
| | Interest expense | | | 7,583 | |
| | Other | | | 3,234 | |
| | Total expenses | | | 2,184,769 | |
| | Less — expense reductions | | | (182,565 | ) |
| | Net expenses | | | 2,002,204 | |
| | NET INVESTMENT LOSS | | | (848,087 | ) |
| | | | | | |
| | Realized and unrealized gain (loss): | | | | |
| | Net realized gain (loss) from: | | | | |
| | Investments — unaffiliated issuers | | | (9,062,156 | ) |
| | Investment sold short | | | 1,654,189 | |
| | Futures contracts | | | (6,113,380 | ) |
| | Written options | | | 5,193,201 | |
| | Swap contracts | | | (1,455,323 | ) |
| | Forward foreign currency exchange contracts | | | (254,978 | ) |
| | Foreign currency transactions | | | (54,813 | ) |
| | Net change in unrealized gain (loss) on: | | | | |
| | Investments — unaffiliated issuers | | | (2,803,076 | ) |
| | Futures contracts | | | (361,433 | ) |
| | Written options | | | 388,938 | |
| | Short sales | | | (1,169,617 | ) |
| | Swap contracts | | | 313,665 | |
| | Forward foreign currency exchange contracts | | | 140,129 | |
| | Foreign currency translation | | | (26,315 | ) |
| | Net realized and unrealized loss | | | (13,610,969 | ) |
| | NET DECREASE IN NET ASSETS RESULTING FROM OPERATIONS | | $ | (14,459,056 | ) |
| | (a) | | Class specific Distribution and Service and Transfer Agency fees were as follows: |
| | | | | | | | | | | | | | | | | | | | | | | | | | | | | | |
| Distribution and Service Fees | | | Transfer Agency Fees | |
Class A | | | Class C | | | Class R | | | Class A | | | Class C | | | Institutional | | | Class IR | | | Class R | |
| $ | 18,012 | | | $ | 26,951 | | | $ | 53 | | | $ | 13,689 | | | $ | 5,121 | | | $ | 20,796 | | | $ | 8,907 | | | $ | 20 | |
| | |
| The accompanying notes are an integral part of these financial statements. | | 19 |
GOLDMAN SACHS LONG SHORT FUND
Statements of Changes in Net Assets
| | | | | | | | | | |
| | | | | For the Six Months Ended June 30, 2016 (Unaudited) | | | For the Fiscal Year Ended December 31, 2015 | |
| | From operations: | | | | | | | | |
| | Net investment loss | | $ | (848,087 | ) | | $ | (1,830,419 | ) |
| | Net realized loss | | | (10,093,260 | ) | | | (27,025,166 | ) |
| | Net change in unrealized gain (loss) | | | (3,517,709 | ) | | | 4,042,214 | |
| | Net decrease in net assets resulting from operations | | | (14,459,056 | ) | | | (24,813,371 | ) |
| | | | | | | | | | |
| | Distributions to shareholders: | | | | | | | | |
| | From net investment income | | | | | | | | |
| | Class A Shares | | | — | | | | (14,566 | ) |
| | Institutional Shares | | | — | | | | (344,899 | ) |
| | Class IR Shares | | | — | | | | (12,204 | ) |
| | From net realized gains | | | | | | | | |
| | Class A Shares | | | — | | | | (33,483 | ) |
| | Class C Shares | | | — | | | | (9,146 | ) |
| | Institutional Shares | | | — | | | | (235,012 | ) |
| | Class IR Shares | | | — | | | | (17,246 | ) |
| | Class R Shares | | | — | | | | (39 | ) |
| | Total distributions to shareholders | | | — | | | | (666,595 | ) |
| | | | | | | | | | |
| | From share transactions: | | | | | | | | |
| | Proceeds from sales of shares | | | 21,916,114 | | | | 260,024,783 | |
| | Reinvestment of distributions | | | — | | | | 662,945 | |
| | Cost of shares redeemed | | | (81,178,571 | ) | | | (123,911,278 | ) |
| | Net increase (decrease) in net assets resulting from share transactions | | | (59,262,457 | ) | | | 136,776,450 | |
| | TOTAL INCREASE (DECREASE) | | | (73,721,513 | ) | | | 111,296,484 | |
| | | | | | | | | | |
| | Net assets: | | | | | | | | |
| | Beginning of period | | | 164,337,281 | | | | 53,040,797 | |
| | End of period | | $ | 90,615,768 | | | $ | 164,337,281 | |
| | Net investment loss | | $ | (997,549 | ) | | $ | (149,462 | ) |
| | |
| 20 | | The accompanying notes are an integral part of these financial statements. |
GOLDMAN SACHS LONG SHORT FUND
Statement of Cash Flows
For the Six Months Ended June 30, 2016 (Unaudited)
| | | | | | |
| | | | | | |
| | Increase/(Decrease) in cash – Cash flows provided by operating activities: | | | | |
| | Net decrease in net assets from operations | | $ | (14,459,056 | ) |
| | Adjustments to reconcile net increase in net assets from operations to net cash received from/(used in) operating activities: | | | | |
| | Payments for purchases of investments in securities | | | (210,504,752 | ) |
| | Proceeds from sales of investment securities | | | 254,828,469 | |
| | Payments for closing purchases of securities sold short | | | (114,080,386 | ) |
| | Proceeds from sales of securities sold short | | | 116,148,014 | |
| | Purchases of short-term investments securities, net | | | 33,678,773 | |
| | Payment for options purchased | | | (5,453,436 | ) |
| | Proceeds from options written | | | 8,395,762 | |
| | Proceeds from swaps, net | | | 479,325 | |
| | Proceeds from corporate actions, net | | | (4,036,600 | ) |
| | (Increase) Decrease in Assets: | | | | |
| | Variation margin on certain derivative contracts | | | 798,894 | |
| | Unrealized gain on swap contracts | | | 395,277 | |
| | Unrealized gain on forward foreign currency exchange contracts | | | (45,451 | ) |
| | Receivable for collateral on certain derivative contracts | | | (1,491,249 | ) |
| | Decrease in foreign tax reclaims | | | (911,322 | ) |
| | Receivable for investments sold | | | (10,819,136 | ) |
| | Receivable for reimbursement from investment adviser | | | 30,124 | |
| | Receivable for dividends and interest | | | 36,892 | |
| | Receivable for foreign tax reclaims | | | (72 | ) |
| | Other assets | | | 167 | |
| | Increase (Decrease) in Liabilities: | | | | |
| | Unrealized loss on swaps contracts | | | (708,942 | ) |
| | Unrealized loss on forward foreign currency contracts | | | (94,678 | ) |
| | Variation Margin on Certain Derivative Contracts | | | 272,281 | |
| | Payable for investments purchased | | | 2,953,613 | |
| | Management fees payable | | | (120,962 | ) |
| | Payable for dividend payable on short positions | | | 12,679 | |
| | Payable for collateral on certain derivative contracts | | | (80,000 | ) |
| | Due to broker — upfront payment | | | 142,959 | |
| | Accrued expenses and other liabilities | | | (11,531 | ) |
| | Net realized gain (loss) on: | | | | |
| | Net realized (gain) loss on investments in securities and securities sold short | | | 7,407,967 | |
| | Net realized loss from derivatives | | | (3,737,878 | ) |
| | Net change in unrealized gain (loss) on: | | | | |
| | Net change in unrealized (gain) loss on investments in securities and securities sold short | | | 3,972,693 | |
| | Net change in unrealized (gain) loss on derivatives | | | (702,603 | ) |
| | Net cash provided by operating activities | | | 62,295,835 | |
| | | | | | |
| | Cash flows used in financing activities: | | | | |
| | Proceeds from sales of common shares | | | 21,916,114 | |
| | Reinvestments of distributions | | | (81,178,571 | ) |
| | Net cash used in financing activities | | | (59,262,457 | ) |
| | NET INCREASE IN CASH | | $ | 3,033,378 | |
| | | | | | |
| | Cash: | | | | |
| | Beginning of year | | | 4,618,654 | |
| | End of year | | $ | 7,652,032 | |
| | |
| The accompanying notes are an integral part of these financial statements. | | 21 |
GOLDMAN SACHS LONG SHORT FUND
Financial Highlights
Selected Data for a Share Outstanding Throughout Each Period
| | | | | | | | | | | | | | | | | | | | | | | | | | | | | | |
| | | | | | From
investment Operations | | | Distributions
to shareholders | |
| | | Year - Share Class | | Net asset value, beginning of period | | | Net investment (loss)(a) | | | Net realized and unrealized gain (loss) | | | Total from investment operations | | | From net investment income | | | From net realized gains | | | Total distributions | |
| | FOR THE SIX MONTHS ENDED JUNE 30, (UNAUDITED) | |
| | 2016 - A | | $ | 9.20 | | | $ | (0.08 | ) | | $ | (0.72 | ) | | $ | (0.80 | ) | | $ | — | | | $ | — | | | $ | — | |
| | 2016 - C | | | 9.12 | | | | (0.08 | ) | | | (0.74 | ) | | | (0.82 | ) | | | — | | | | — | | | | — | |
| | 2016 - Institutional | | | 9.23 | | | | (0.05 | ) | | | (0.74 | ) | | | (0.79 | ) | | | — | | | | — | | | | — | |
| | 2016 - IR | | | 9.23 | | | | (0.07 | ) | | | (0.72 | ) | | | (0.79 | ) | | | — | | | | — | | | | — | |
| | 2016 - R | | | 9.18 | | | | (0.06 | ) | | | (0.75 | ) | | | (0.81 | ) | | | — | | | | — | | | | — | |
| | | | | | | | | | | | | | | | | | | | | | | | | | | | | | |
| | FOR THE FISCAL YEAR ENDED DECEMBER 31, | |
| | 2015 - A | | | 10.17 | | | | (0.18 | ) | | | (0.77 | ) | | | (0.95 | ) | | | — | (e) | | | (0.02 | ) | | | (0.02 | ) |
| | 2015 - C | | | 10.15 | | | | (0.25 | ) | | | (0.76 | ) | | | (1.01 | ) | | | — | | | | (0.02 | ) | | | (0.02 | ) |
| | 2015 - Institutional | | | 10.18 | | | | (0.13 | ) | | | (0.78 | ) | | | (0.91 | ) | | | (0.02 | ) | | | (0.02 | ) | | | (0.04 | ) |
| | 2015 - IR | | | 10.18 | | | | (0.14 | ) | | | (0.78 | ) | | | (0.92 | ) | | | (0.01 | ) | | | (0.02 | ) | | | (0.03 | ) |
| | 2015 - R | | | 10.16 | | | | (0.20 | ) | | | (0.76 | ) | | | (0.96 | ) | | | — | | | | (0.02 | ) | | | (0.02 | ) |
| | | | | | | | | | | | | | | | | | | | | | | | | | | | | | |
| | FOR THE PERIOD ENDED DECEMBER 31, | |
| | 2014 - A (Commenced September 30, 2014) | | | 10.00 | | | | (0.06 | ) | | | 0.23 | | | | 0.17 | | | | — | | | | — | | | | — | |
| | 2014 - C (Commenced September 30, 2014) | | | 10.00 | | | | (0.07 | ) | | | 0.22 | | | | 0.15 | | | | — | | | | — | | | | — | |
| | 2014 - Institutional (Commenced September 30, 2014) | | | 10.00 | | | | (0.04 | ) | | | 0.22 | | | | 0.18 | | | | — | | | | — | | | | — | |
| | 2014 - IR (Commenced September 30, 2014) | | | 10.00 | | | | (0.05 | ) | | | 0.23 | | | | 0.18 | | | | — | | | | — | | | | — | |
| | 2014 - R (Commenced September 30, 2014) | | | 10.00 | | | | (0.05 | ) | | | 0.21 | | | | 0.16 | | | | — | | | | — | | | | — | |
| | (a) | | Calculated based on the average shares outstanding methodology. |
| | (b) | | Assumes investment at the NAV at the beginning of the period, reinvestment of all dividends and distributions, a complete redemption of the investment at the NAV at the end of the period and no sales or redemption charges. Total returns would be reduced if a sales or redemption charge was taken into account. Returns do not reflect the impact of taxes to shareholders relating to Fund distributions or the redemption of Fund shares. Total returns for periods less than one full year are not annualized. |
| | (c) | | The Fund’s portfolio turnover rate is calculated in accordance with regulatory requirements, without regard to transactions involving short term investments and certain derivatives. If such transactions were included, the Fund’s portfolio turnover rate may be higher. |
| | (e) | | Amount is less than $0.005 per share. |
| | |
| 22 | | The accompanying notes are an integral part of these financial statements. |
GOLDMAN SACHS LONG SHORT FUND
| | | | | | | | | | | | | | | | | | | | | | | | | | | | | | | | | | | | | | | | | | | | | | | | | | | | | | | | |
| | | | | | | | | | | | | | | | | | | | | | | | | | | | | | | | | | | | | | | | | | | | | | |
| | | Net asset
value, end
of period | | | | | Total
return(b) | | | | | Net assets,
end of
period
(in 000s) | | | | | Ratio of
net expenses
to average
net assets
(including dividend
expenses for
securities
sold short | | | | | Ratio of
net expenses
to average
net assets
(excluding
dividend
expenses for
securities
sold short | | | | | Ratio of
total expenses
to average
net assets
(including
dividend
expenses for
securities
sold short | | | | | Ratio of
total expenses
to average
net assets
(excluding
dividend
expenses for
securities
sold short | | | | | | Ratio of
net investment
income (loss)
to average
net assets | | | | | | Portfolio
turnover
rate(c) | |
| | | | | | | | | | | | | | | | | | | | | | | | | | | | | | | | | | | | | | | | | | | | | | | | | | | | | | | | |
| | $ | 8.40 | | | | | | (8.70 | )% | | | | $ | 7,735 | | | | | | 3.29 | %(d) | | | | | 2.64 | %(d) | | | | | 3.56 | %(d) | | | | | 2.91 | %(d) | | | | | | | (1.77 | )%(d) | | | | | | | 237 | % |
| | | 8.30 | | | | | | (8.99 | ) | | | | | 4,975 | | | | | | 4.08 | (d) | | | | | 3.39 | (d) | | | | | 4.37 | (d) | | | | | 3.68 | (d) | | | | | | | (1.99 | )(d) | | | | | | | 237 | |
| | | 8.44 | | | | | | (8.45 | ) | | | | | 72,807 | | | | | | 2.91 | (d) | | | | | 2.24 | (d) | | | | | 3.18 | (d) | | | | | 2.51 | (d) | | | | | | | (1.15 | )(d) | | | | | | | 237 | |
| | | 8.44 | | | | | | (8.56 | ) | | | | | 5,077 | | | | | | 3.09 | (d) | | | | | 2.39 | (d) | | | | | 3.35 | (d) | | | | | 2.66 | (d) | | | | | | | (1.53 | )(d) | | | | | | | 237 | |
| | | 8.37 | | | | | | (8.82 | ) | | | | | 21 | | | | | | 3.58 | (d) | | | | | 2.88 | (d) | | | | | 3.87 | (d) | | | | | 3.17 | (d) | | | | | | | (1.41 | )(d) | | | | | | | 237 | |
| | | | | | | | | | | | | | | | | | | | | | | | | | | | | | | | | | | | | | | | | | | | | | | | | | | | | | | | |
| | | | | | | | | | | | | | | | | | | | | | | | | | | | | | | | | | | | | | | | | | | | | | | | | | | | | | | | |
| | | 9.20 | | | | | | (9.32 | ) | | | | | 20,235 | | | | | | 2.93 | | | | | | 2.43 | | | | | | 3.25 | | | | | | 2.75 | | | | | | | | (1.82 | ) | | | | | | | 468 | |
| | | 9.12 | | | | | | (9.99 | ) | | | | | 5,620 | | | | | | 3.70 | | | | | | 3.18 | | | | | | 4.01 | | | | | | 3.49 | | | | | | | | (2.58 | ) | | | | | | | 468 | |
| | | 9.23 | | | | | | (8.93 | ) | | | | | 129,206 | | | | | | 2.44 | | | | | | 1.99 | | | | | | 2.94 | | | | | | 2.49 | | | | | | | | (1.33 | ) | | | | | | | 468 | |
| | | 9.23 | | | | | | (9.06 | ) | | | | | 9,254 | | | | | | 2.65 | | | | | | 2.14 | | | | | | 2.99 | | | | | | 2.48 | | | | | | | | (1.43 | ) | | | | | | | 468 | |
| | | 9.18 | | | | | | (9.49 | ) | | | | | 23 | | | | | | 3.00 | | | | | | 2.61 | | | | | | 3.67 | | | | | | 3.28 | | | | | | | | (1.94 | ) | | | | | | | 468 | |
| | | | | | | | | | | | | | | | | | | | | | | | | | | | | | | | | | | | | | | | | | | | | | | | | | | | | | | | |
| | | | | | | | | | | | | | | | | | | | | | | | | | | | | | | | | | | | | | | | | | | | | | | | | | | | | | | | |
| | | 10.17 | | | | | | 1.70 | | | | | | 543 | | | | | | 3.43 | (d) | | | | | 2.80 | (d) | | | | | 5.58 | (d) | | | | | 4.95 | (d) | | | | | | | (2.40 | )(d) | | | | | | | 118 | |
| | | 10.15 | | | | | | 1.50 | | | | | | 62 | | | | | | 3.79 | (d) | | | | | 3.32 | (d) | | | | | 5.64 | (d) | | | | | 5.17 | (d) | | | | | | | (2.87 | )(d) | | | | | | | 118 | |
| | | 10.18 | | | | | | 1.80 | | | | | | 52,328 | | | | | | 2.18 | (d) | | | | | 1.94 | (d) | | | | | 3.74 | (d) | | | | | 3.51 | (d) | | | | | | | (1.47 | )(d) | | | | | | | 118 | |
| | | 10.18 | | | | | | 1.80 | | | | | | 82 | | | | | | 2.71 | (d) | | | | | 2.28 | (d) | | | | | 4.50 | (d) | | | | | 4.08 | (d) | | | | | | | (1.77 | )(d) | | | | | | | 118 | |
| | | 10.16 | | | | | | 1.60 | | | | | | 25 | | | | | | 2.82 | (d) | | | | | 2.59 | (d) | | | | | 4.38 | (d) | | | | | 4.15 | (d) | | | | | | | (2.11 | )(d) | | | | | | | 118 | |
| | |
| The accompanying notes are an integral part of these financial statements. | | 23 |
GOLDMAN SACHS LONG SHORT FUND
Notes to Financial Statements
June 30, 2016 (Unaudited)
Goldman Sachs Trust (the “Trust”) is a Delaware statutory trust registered under the Investment Company Act of 1940, as amended (the “Act”), as an open-end management investment company. The Trust includes the Goldman Sachs Long Short Fund (the “Fund”). The Fund is a non-diversified portfolio and currently offers five classes of shares: Class A, Class C, Institutional, Class IR and Class R Shares.
Class A Shares are sold with a front-end sales charge of up to 5.50%. Class C Shares are sold with a contingent deferred sales charge (“CDSC”) of 1.00%, which is imposed on redemptions made within 12 months of purchase. Institutional, Class IR and Class R are not subject to a sales charge.
GS Investment Strategies, LLC (“GSIS”), an affiliate of Goldman, Sachs & Co. (“Goldman Sachs”), serves as investment adviser to the Fund pursuant to a management agreement (the “Agreement”) with the Trust.
|
| 2. SIGNIFICANT ACCOUNTING POLICIES |
The financial statements have been prepared in accordance with accounting principles generally accepted in the United States of America (“GAAP”) and require management to make estimates and assumptions that may affect the reported amounts and disclosures. Actual results may differ from those estimates and assumptions.
A. Investment Valuation — The Fund’s valuation policy is to value investments at fair value.
B. Investment Income and Investments — Investment income includes interest income, dividend income, net of any foreign withholding taxes, less any amounts reclaimable, and securities lending income. Interest income is accrued daily and adjusted for amortization of premiums and accretion of discounts. Dividend income is recognized on ex-dividend date or, for certain foreign securities, as soon as such information is obtained subsequent to the ex-dividend date. Investment transactions are reflected on trade date. Realized gains and losses are calculated using identified cost. Investment transactions are recorded on the following business day for daily net asset value (“NAV”) calculations. Any foreign capital gains tax is accrued daily based upon net unrealized gains, and is payable upon sale of such investments.
For derivative contracts, realized gains and losses are recorded upon settlement of the contract. Upfront payments, if any, are made or received upon entering into a swap agreement and are reflected in the Statement of Assets and Liabilities. Upfront payments are recognized over the contract’s term/event as realized gains or losses, with the exception of forward starting interest rate swaps whose realized gains or losses are recognized from the effective start date.
C. Class Allocations and Expenses — Investment income, realized and unrealized gain (loss), and non-class specific expenses of the Fund are allocated daily based upon the proportion of net assets of each class. Non-class specific expenses directly incurred by the Fund are charged to the Fund, while such expenses incurred by the Trust are allocated across the Fund on a straight-line and/or pro-rata basis depending upon the nature of the expenses. Class specific expenses, where applicable, are borne by the respective share classes and include Distribution and Service, Transfer Agency and Service and Shareholder Administration fees.
D. Federal Taxes and Distributions to Shareholders — It is the Fund’s policy to comply with the requirements of the Internal Revenue Code of 1986, as amended (the “Code”), applicable to regulated investment companies (mutual funds) and to distribute each year substantially all of its investment company taxable income and capital gains to its shareholders. Accordingly, the Fund is not required to make any provisions for the payment of federal income tax. Distributions to shareholders are recorded on the ex-dividend date. Income and capital gains distributions, if any, are declared and paid annually.
Net capital losses are carried forward to future fiscal years and may be used to the extent allowed by the Code to offset any future capital gains. Losses that are carried forward will retain their character as either short-term or long-term capital losses. Utilization of capital loss carryforwards will reduce the requirement of future capital gains distributions.
The characterization of distributions to shareholders for financial reporting purposes is determined in accordance with federal income tax rules, which may differ from GAAP. The source of the Fund’s distributions may be shown in the accompanying financial statements as either from net investment income, net realized gain or capital. Certain components of the Fund’s net assets on the Statement of Assets and Liabilities reflect permanent GAAP/tax differences based on the appropriate tax character.
24
GOLDMAN SACHS LONG SHORT FUND
|
| 2. SIGNIFICANT ACCOUNTING POLICIES (continued) |
E. Foreign Currency Translation — The accounting records and reporting currency of the Fund is maintained in U.S. dollars. Assets and liabilities denominated in foreign currencies are translated into U.S. dollars using the current exchange rates at the close of each business day. The effect of changes in foreign currency exchange rates on investments is included within net realized and unrealized gain (loss) on investments. Changes in the value of other assets and liabilities as a result of fluctuations in foreign exchange rates are included in the Statement of Operations within net change in unrealized gain (loss) on foreign currency translations. Transactions denominated in foreign currencies are translated into U.S. dollars on the date the transaction occurred, the effects of which are included within net realized gain (loss) on foreign currency transactions.
|
| 3. INVESTMENTS AND FAIR VALUE MEASUREMENTS |
The fair value of a financial instrument is the amount that would be received to sell an asset or paid to transfer a liability in an orderly transaction between market participants at the measurement date (i.e., the exit price). GAAP establishes a fair value hierarchy that prioritizes the inputs to valuation techniques used to measure fair value. The hierarchy gives the highest priority to unadjusted quoted prices in active markets for identical assets or liabilities (Level 1 measurements) and the lowest priority to unobservable inputs (Level 3 measurements). The levels used for classifying investments are not necessarily an indication of the risk associated with investing in these investments. The three levels of the fair value hierarchy are described below:
Level 1 — Unadjusted quoted prices in active markets that are accessible at the measurement date for identical, unrestricted assets or liabilities;
Level 2 — Quoted prices in markets that are not active or financial instruments for which significant inputs are observable (including, but not limited to, quoted prices for similar investments, interest rates, foreign exchange rates, volatility and credit spreads), either directly or indirectly;
Level 3 — Prices or valuations that require significant unobservable inputs (including GSIS’s assumptions in determining fair value measurement).
Changes in valuation techniques may result in transfers into or out of an assigned level within the hierarchy. In accordance with the Fund’s policy, transfers between different levels of the fair value hierarchy resulting from such changes are deemed to have occurred as of the beginning of the reporting period.
The Board of Trustees (“Trustees”) has approved Valuation Procedures that govern the valuation of the portfolio investments held by the Fund, including investments for which market quotations are not readily available. The Trustees have delegated to GSIS day-to-day responsibility for implementing and maintaining internal controls and procedures related to the valuation of the Fund’s portfolio investments. To assess the continuing appropriateness of pricing sources and methodologies, GSIS regularly performs price verification procedures and issues challenges as necessary to third party pricing vendors or brokers, and any differences are reviewed in accordance with the Valuation Procedures.
A. Level 1 and Level 2 Fair Value Investments — The valuation techniques and significant inputs used in determining the fair values for investments classified as Level 1 and Level 2 are as follows:
Equity Securities — Equity securities traded on a United States (“U.S.”) securities exchange or the NASDAQ system, or those located on certain foreign exchanges, including but not limited to the Americas, are valued daily at their last sale price or official closing price on the principal exchange or system on which they are traded. If there is no sale or official closing price or such price is believed by GSIS to not represent fair value, equity securities are valued at the last bid price for long positions and at the last ask price for short positions. To the extent these investments are actively traded, they are classified as Level 1 of the fair value hierarchy, otherwise they are generally classified as Level 2.
Unlisted equity securities for which market quotations are available are valued at the last sale price on the valuation date, or if no sale occurs, at the last bid price. Securities traded on certain foreign securities exchanges are valued daily at fair value
25
GOLDMAN SACHS LONG SHORT FUND
Notes to Financial Statements (continued)
June 30, 2016 (Unaudited)
|
| 3. INVESTMENTS AND FAIR VALUE MEASUREMENTS (continued) |
determined by an independent fair value service (if available) under Valuation Procedures approved by the Trustees and consistent with applicable regulatory guidance. The independent fair value service takes into account multiple factors including, but not limited to, movements in the securities markets, certain depositary receipts, futures contracts and foreign currency exchange rates that have occurred subsequent to the close of the foreign securities exchange. These investments are generally classified as Level 2 of the fair value hierarchy.
Underlying Funds (including Money Market Funds) — Underlying Funds (“Underlying Funds”) include other investment companies and exchange-traded funds (“ETFs”). Investments in the Underlying Funds (except ETFs) are valued at the NAV per share of the Institutional Share class (the FST Institutional Share class for Money Market Funds) on the day of valuation. ETFs are valued daily at the last sale price or official closing price on the principal exchange or system on which the investment is traded. Because the Fund invests in Underlying Funds that fluctuate in value, the Fund’s shares will correspondingly fluctuate in value. To the extent these investments are actively traded, they are classified as Level 1 of the fair value hierarchy, otherwise they are generally classified as Level 2. For information regarding an Underlying Fund’s accounting policies and investment holdings, please see the Underlying Fund’s shareholder report
Derivative Contracts — A derivative is an instrument whose value is derived from underlying assets, indices, reference rates or a combination of these factors. The Fund enters into derivative transactions to hedge against changes in interest rates, securities prices, and/or currency exchange rates, to increase total return, or to gain access to certain markets or attain exposure to other underliers.
Exchange-traded derivatives, including futures and options contracts, are valued at the last sale or settlement price and typically fall within Level 1 of the fair value hierarchy. Over-the-counter (“OTC”) and centrally cleared derivatives are valued using market transactions and other market evidence, including market-based inputs to models, calibration to market-clearing transactions, broker or dealer quotations, or other alternative pricing sources. Where models are used, the selection of a particular model to value OTC and centrally cleared derivatives depends upon the contractual terms of, and specific risks inherent in, the instrument, as well as the availability of pricing information in the market. Valuation models require a variety of inputs, including contractual terms, market prices, yield curves, credit curves, measures of volatility, voluntary and involuntary prepayment rates, loss severity rates and correlations of such inputs. For OTC and centrally cleared derivatives that trade in liquid markets, model inputs can generally be verified and model selection does not involve significant management judgment. OTC and centrally cleared derivatives are classified within Level 2 of the fair value hierarchy when significant inputs are corroborated by market evidence.
i. Forward Contracts — A forward contract is a contract between two parties to buy or sell an asset at a specified price on a future date. A forward contract settlement can occur on a cash or delivery basis. Forward contracts are marked-to-market daily using independent vendor prices, and the change in value, if any, is recorded as an unrealized gain or loss. Cash and certain investments may be used to collateralize forward contracts.
A forward foreign currency contract is a forward contract in which a Fund agrees to receive or deliver a fixed quantity of one currency for another, at a pre-determined price at a future date. All forward foreign currency exchange contracts are marked-to-market daily at the applicable forward rate. Non-deliverable forward foreign currency exchange contracts are settled with the counterparty in cash without the delivery of foreign currency.
ii. Futures Contracts — Futures contracts are contracts to buy or sell a standardized quantity of a specified commodity or security and are valued based on exchanged settlement prices or independent market quotes. Futures contracts are valued at the last settlement price, or in the absence of a sale, the last bid price for long positions and at the last ask price for short positions, at the end of each day on the board of trade or exchange upon which they are traded. Upon entering into a futures contract, a Fund deposits cash or securities in an account on behalf of the broker in an amount sufficient to meet the initial margin requirement. Subsequent payments are made or received by a Fund equal to the daily change in the contract value and are recorded as variation margin receivable or payable with a corresponding offset to unrealized gains or losses.
26
GOLDMAN SACHS LONG SHORT FUND
|
| 3. INVESTMENTS AND FAIR VALUE MEASUREMENTS (continued) |
iii. Option Contracts — When a Fund writes call or put option contracts, an amount equal to the premium received is recorded as a liability and is subsequently marked-to-market to reflect the current value of the option written. Swaptions are options on interest rate swap contracts.
Upon the purchase of a call option or a put option by a Fund, the premium paid is recorded as an investment and subsequently marked-to-market to reflect the current value of the option. Certain options may be purchased with premiums to be determined on a future date. The premiums for these options are based upon implied volatility parameters at specified terms.
iv. Swap Contracts — Bilateral swap contracts are agreements in which the Fund and a counterparty agree to exchange periodic payments on a specified notional amount or make a net payment upon termination. Bilateral swap transactions are privately negotiated in the OTC market and payments are settled through direct payments between the Fund and the counterparty. By contrast, certain swap transactions are subject to mandatory central clearing. These swaps are executed through a derivatives clearing member (“DCM”), acting in an agency capacity, and submitted to a central counterparty (“CCP”) (“centrally cleared swaps”), in which case all payments are settled with the CCP through the DCM. Swaps are marked-to-market daily using pricing vendor quotations, counterparty or clearinghouse prices or model prices, and the change in value, if any, is recorded as an unrealized gain or loss. Upon entering into a swap contract, the Fund is required to satisfy an initial margin requirement by delivering cash or securities to the counterparty (or in some cases, segregated in a triparty account on behalf of the counterparty), which can be adjusted by any mark-to-market gains or losses pursuant to bilateral or centrally cleared arrangements. For centrally cleared swaps the daily change in valuation, if any, is recorded as a receivable or payable for variation margin.
A total return swap is an agreement that gives the Fund the right to receive the appreciation in the value of a specified security, index or other instrument in return for a fee paid to the counterparty, which will typically be an agreed upon interest rate. If the underlying asset declines in value over the term of the swap, the Fund may also be required to pay the dollar value of that decline to the counterparty.
Securities Sold Short — Securities sold short are those securities which the Fund has sold but which it does not own. When the Fund sells a security it does not own, it must borrow the position that was sold and deliver it to the broker through which it made the short sale. In addition, cash and certain investments in securities may be used to collateralize the securities sold short. Each day the securities sold short transaction is open, the liability to replace the borrowed security is marked to market and an unrealized gain or loss is recorded. While the transaction remains open, the Fund may also incur expenses for any dividends or interest which will be paid to the lender of the securities as well as a fee to borrow the delivered security. During the term of the short sale, the value of the securities pledged as collateral on short sales is required to exceed the value of the securities sold short. The market value of securities pledged as collateral is included in the Schedule of Investments.
B. Level 3 Fair Value Investments — To the extent that significant inputs to valuation models and other alternative pricing sources are unobservable, or if quotations are not readily available, or if GSIS believes that such quotations do not accurately reflect fair value, the fair value of the Fund’s investments may be determined under Valuation Procedures approved by the Trustees. GSIS, consistent with its procedures and applicable regulatory guidance, may make an adjustment to the most recent valuation prices of either domestic or foreign securities in light of significant events to reflect what it believes to be the fair value of the securities at the time of determining a Fund’s NAV. Significant events which could affect a large number of securities in a particular market may include, but are not limited to: significant fluctuations in U.S. or foreign markets; market dislocations; market disruptions; or unscheduled market closings. Significant events which could also affect a single issuer may include, but are not limited to: corporate actions such as reorganizations, mergers and buy-outs; ratings downgrades; and bankruptcies.
27
GOLDMAN SACHS LONG SHORT FUND
Notes to Financial Statements (continued)
June 30, 2016 (Unaudited)
|
| 3. INVESTMENTS AND FAIR VALUE MEASUREMENTS (continued) |
C. Fair Value Hierarchy — The following is a summary of the Fund’s investments and derivatives classified in the fair value hierarchy as of June 30, 2016:
| | | | | | | | | | | | |
| | | |
| Investment Type | | Level 1 | | | Level 2 | | | Level 3 | |
| Assets(a) | |
Common Stock and/or Other Equity Investments | | | | | | | | | | | | |
Asia | | $ | 8,296,717 | | | $ | — | | | $ | — | |
Europe | | | 7,044,927 | | | | 5,701,941 | | | | — | |
North America | | | 41,615,340 | | | | — | | | | — | |
Investment Company | | | 47,651,693 | | | | — | | | | — | |
| Total | | $ | 104,608,677 | | | $ | 5,701,941 | | | $ | — | |
| Liabilities(a) | | | | | | | | | | | | |
Common Stock and Exchange Traded Funds Sold Short | | | | | | | | | | | | |
Asia | | $ | (1,466,600 | ) | | $ | — | | | $ | — | |
Europe | | | (115,492 | ) | | | — | | | | — | |
North America | | | (40,769,004 | ) | | | — | | | | — | |
| Total | | $ | (42,351,096 | ) | | $ | — | | | $ | — | |
| | | |
| Derivative Type | | | | | | | | | |
| Assets | | | | | | | | | | | | |
Options Purchased | | $ | 950,368 | | | $ | 1,186,708 | | | $ | — | |
Forward Foreign Currency Exchange Contracts(b) | | | — | | | | 282,330 | | | | — | |
Total Return Swap Contracts(b) | | | — | | | | 411,602 | | | | — | |
| Total | | $ | 950,368 | | | $ | 1,880,640 | | | $ | — | |
| Liabilities | | | | | | | | | | | | |
Forward Foreign Currency Exchange Contracts(b) | | $ | — | | | $ | (14,561 | ) | | $ | — | |
Futures Contracts(b) | | | (74,118 | ) | | | — | | | | — | |
Total Return Swap Contracts(b) | | | — | | | | (79,515 | ) | | | — | |
Written Options Contracts | | | (113,585 | ) | | | (80,572 | ) | | | — | |
| Total | | $ | (187,703 | ) | | $ | (174,648 | ) | | $ | — | |
| (a) | | Amounts are disclosed by continent to highlight the impact of time zone differences between local market close and the calculation of net asset value. Security valuations are based on the principle exchange or system on which they are traded, which may differ from the country of domicile noted in table. |
| (b) | | Amount shown represents unrealized gain (loss) at period end. |
For further information regarding security characteristics, see the Schedules of Investments.
28
GOLDMAN SACHS LONG SHORT FUND
|
| 4. INVESTMENTS IN DERIVATIVES |
The following table sets forth, by certain risk types, the gross value of derivative contracts as of June 30, 2016. These instruments were used as part of the Fund’s investment strategies and to obtain and/or manage exposure related to the risks below. The values in the table below exclude the effects of cash collateral received or posted pursuant to these derivative contracts, and therefore are not representative of the Fund’s net exposure.
| | | | | | | | | | | | |
| Risk | | Statement of Assets and Liabilities | | Assets | | | Statement of Assets and Liabilities | | Liabilities | |
Equity | | Receivable for unrealized gain on swap contracts; Investments, at value | | $ | 2,548,678 | | | Payable for unrealized loss on swap contracts; Variation margin on certain derivative contracts; Written options, at value | | $ | (347,790) | (a) |
Currency | | Receivable for unrealized gain on forward foreign currency exchange contracts | | | 282,330 | | | Payable for unrealized loss on forward foreign currency exchange contracts | | | (14,561) | |
| Total | | | | $ | 2,831,008 | | | | | $ | (362,351) | |
| (a) | | Includes unrealized gain (loss) on futures contracts described in the Additional Investment Information sections of the Schedules of Investments. Only current day’s variation margin is reported within the Statement of Assets and Liabilities. |
The following table sets forth, by certain risk types, the Fund’s gains (losses) related to these derivatives and their indicative volumes for the six months ended June 30, 2016. These gains (losses) should be considered in the context that these derivative contracts may have been executed to create investment opportunities and/or economically hedge certain investments, and accordingly, certain gains (losses) on such derivative contracts may offset certain (losses) gains attributable to investments. These gains (losses) are included in “Net realized gain (loss)” or “Net change in unrealized gain (loss)” on the Statement of Operations:
| | | | | | | | | | | | | | |
| Risk | | Statement of Operations | | Net Realized
Gain (Loss) | | | Net Change in
Unrealized
Gain (Loss) | | | Average
Number of
Contracts(a) | |
| Equity | | Net realized gain (loss) from investments, futures contracts, swap contracts and written options/Net change in unrealized gain (loss) on investments, futures contracts, swap contracts and written options | | $ | (3,652,472 | ) | | $ | 720,290 | | | | 1,441 | |
| Currency | | Net realized gain (loss) from forward foreign currency exchange contracts/Net change in unrealized gain (loss) on forward foreign currency exchange contracts | | | (254,978 | ) | | | 140,129 | | | | 30 | |
| Total | | | | $ | (3,907,450 | ) | | $ | 860,419 | | | | 1,471 | |
| (a) | | Average number of contracts is based on the average of month end balances for the six months ended June 30, 2016. |
In order to better define its contractual rights and to secure rights that will help the Fund mitigate its counterparty risk, the Fund may enter into an International Swaps and Derivatives Association, Inc. Master Agreement (“ISDA Master Agreement”) or similar agreement with its derivatives’ counterparties. An ISDA Master Agreement is a bilateral agreement between the Fund and a counterparty that governs OTC derivatives (including forward foreign currency exchange contracts, and certain options and swaps) and typically contains, among other things, collateral posting terms and netting provisions in the event of a default and/or termination event. The provisions of the ISDA Master Agreement typically permit a single net payment in the event of a default (close-out netting) or similar event, including the bankruptcy or insolvency of the counterparty.
Collateral and margin requirements differ between exchange traded derivatives and OTC derivatives. Margin requirements are established by the broker or clearing house for exchange-traded and centrally cleared derivatives (financial futures contracts, options and centrally cleared swaps) pursuant to governing agreements for those instrument types. Brokers can ask for margin in excess of the minimum in certain circumstances. Collateral terms are contract-specific for OTC derivatives. For derivatives traded under an ISDA Master Agreement, the collateral requirements are typically calculated by netting the marked to market amount for each transaction under such agreement and comparing that amount to the value of any collateral currently pledged by the Fund and
29
GOLDMAN SACHS LONG SHORT FUND
Notes to Financial Statements (continued)
June 30, 2016 (Unaudited)
|
| 4. INVESTMENTS IN DERIVATIVES (continued) |
the counterparty. Additionally, the Fund may be required to post initial margin to the counterparty, the terms of which would be outlined in the confirmation of the OTC transaction.
For financial reporting purposes, cash collateral that has been pledged to cover obligations of the Fund and cash collateral received from the counterparty, if any, is reported separately on the Statement of Assets and Liabilities as receivables/payables for collateral on certain derivative contracts. Non-cash collateral pledged by the Fund, if any, is noted in the Schedule of Investments. Generally, the amount of collateral due from or to a counterparty must exceed a minimum transfer amount threshold before a transfer is required to be made. To the extent amounts due to the Fund from its counterparties are not fully collateralized, contractually or otherwise, the Fund bears the risk of loss from counterparty nonperformance. The Fund attempts to mitigate counterparty risk by only entering into agreements with counterparties that the Investment Adviser believes to be of good standing and by monitoring the financial stability of those counterparties.
Additionally, the netting of assets and liabilities and the offsetting of collateral pledged or received are based on contractual netting/set-off provisions in the ISDA Master Agreement or similar agreements. However, in the event of a default or insolvency of a counterparty, a court could determine that such rights are not enforceable due to the restrictions or prohibitions against the right of setoff that may be imposed in accordance with a particular jurisdiction’s bankruptcy or insolvency laws.
The following table sets forth the Fund’s net exposure for derivative instruments that are subject to enforceable master netting arrangements or similar agreements as of June 30, 2016:
| | | | | | | | | | | | | | | | | | | | | | | | | | | | | | | | | | | | | | | | | | | | |
| | | Derivative Assets(1) | | | Derivative Liabilities(1) | | | Net Derivative
Asset
(Liabilities) | | | Collateral
(Received)
Pledged(1) | | | Net
Amount(2) | |
| Counterparty | | Options
Purchased | | | Swaps | | | Forward
Currency
Contracts | | | Total | | | Swaps | | | Forward
Currency
Contracts | | | Options
Written | | | Total | | | | |
Credit Suisse International (London) | | $ | — | | | $ | 411,602 | | | $ | — | | | $ | 411,602 | | | $ | (79,515 | ) | | $ | — | | | $ | — | | | $ | (79,515 | ) | | $ | 332,087 | | | $ | — | | | $ | 332,087 | |
Deutsche Bank AG | | | 1,003,094 | | | | — | | | | — | | | | 1,003,094 | | | | — | | | | — | | | | (80,572 | ) | | | (80,572 | ) | | | 922,522 | | | | — | | | | 922,522 | |
Morgan Stanley & Co. International PLC | | | 183,614 | | | | — | | | | 282,330 | | | | 465,944 | | | | — | | | | (14,561 | ) | | | — | | | | (14,561 | ) | | | 451,383 | | | | (160,000 | ) | | | 291,383 | |
Total | | $ | 1,186,708 | | | $ | 411,602 | | | $ | 282,330 | | | $ | 1,880,640 | | | $ | (79,515 | ) | | $ | (14,561 | ) | | $ | (80,572 | ) | | $ | (174,648 | ) | | $ | 1,705,992 | | | $ | (160,000 | ) | | $ | 1,545,992 | |
| (1) | | Gross amounts available for offset but not netted in the Statement of Assets and Liabilities. |
| (2) | | Net amount represents the net amount due (to) from counterparty in the event of a default based on the contractual set-off rights under the agreement. Net amount excludes any over-collateralized amounts. |
|
| 5. AGREEMENTS AND AFFILIATED TRANSACTIONS |
A. Management Agreement — Under the Agreement, GSIS manages the Fund, subject to the general supervision of the Trustees.
As compensation for the services rendered pursuant to the Agreement, the assumption of the expenses related thereto and administration of the Fund’s business affairs, including providing facilities, GSIS is entitled to a management fee, accrued daily and paid monthly, equal to an annual percentage rate of the Fund’s average daily net assets.
30
GOLDMAN SACHS LONG SHORT FUND
|
| 5. AGREEMENTS AND AFFILIATED TRANSACTIONS (continued) |
For the six months ended June 30, 2016, the contractual and effective net management fee with GSIS were at the following rates:
| | | | | | | | | | | | | | | | | | | | | | |
| Contractual Management Rate | | | | |
First
$2 billion | | | Next
$3 billion | | | Next
$3 billion | | | Over
$8 billion | | | Effective
Management
Rate | | | Effective Net
Management
Rate*^ | |
| | 1.60% | | | | 1.44% | | | | 1.37% | | | | 1.34% | | | | 1.60% | | | | 1.51% | |
| * | | GSIS has agreed to waive a portion of its management fee payable by the Fund in an amount equal to any management fee it or an affiliate earns as an investment adviser to any of the affiliated funds in which the Fund invests through at least April 29, 2017, and prior to such date, GSIS may not terminate the arrangement without the approval of the Trustees. |
| ^ | | Effective Net Management Rate includes the impact of management fee waivers of affiliated underlying funds, if any. |
The Fund invests in FST Institutional Shares of the Goldman Sachs Financial Square Government Fund, which is an affiliated Underlying Fund. GSIS has agreed to waive a portion of its management fee payable by the Fund in an amount equal to the management fee it earns as an investment adviser to any of the affiliated Underlying Funds in which the Fund invests. For the six months ended June 30, 2016, GSIS waived $62,012 of the Fund’s management fee.
B. Distribution and Service Plans — The Trust, on behalf of the Fund, has adopted Distribution and Service Plans (the “Plans”). Under the Plans, Goldman Sachs, which serves as distributor (the “Distributor”), is entitled to a fee accrued daily and paid monthly, for distribution services and personal and account maintenance services, which may then be paid by Goldman Sachs to authorized dealers, at the following annual rates calculated on the Fund’s average daily net assets of each respective share class:
| | | | | | | | | | | | |
| | | Distribution and Service Plan Rates | |
| | | Class A* | | | Class C | | | Class R* | |
Distribution Plan | | | 0.25 | % | | | 0.75 | % | | | 0.50 | % |
Service Plan | | | — | | | | 0.25 | | | | — | |
| * | | With respect to Class A and Class R Shares, the Distributor, at its discretion may use compensation for distribution services paid under the Distribution Plan to compensate service organizations for personal and account maintenance services and expenses as long as such total compensation does not exceed the maximum cap on “service fees” imposed by the Financial Industry Regulatory Authority. |
C. Distribution Agreement — Goldman Sachs, as Distributor of the shares of the Funds pursuant to a Distribution Agreement, may retain a portion of the Class A Shares’ front end sales charge and Class C Shares’ CDSC. During the six months ended June 30, 2016, Goldman Sachs advised that it retained $199 of Class A Shares and $5 of Class C Shares.
D. Transfer Agency Agreement — Goldman Sachs also serves as the transfer agent of the Fund for a fee pursuant to the Transfer Agency Agreement. The fees charged for such transfer agency services are accrued daily and paid monthly at annual rates as follows: 0.19% of the average daily net assets of Class A, Class C, Class IR and Class R Shares; and 0.04% of the average daily net assets of Institutional Shares.
E. Other Expense Agreements and Affiliated Transactions — GSIS has agreed to limit certain “Other Expenses” of the Fund (excluding acquired fund fees and expenses, transfer agency fees and expenses, service fees and shareholder administration fees (as applicable), taxes, dividend and interest payments on securities sold short, interest, brokerage fees, shareholder meeting, litigation, indemnification and extraordinary expenses) to the extent such expenses exceed, on an annual basis, a percentage rate of the average daily net assets of the Fund. Such Other Expense reimbursements, if any, are accrued daily and paid monthly. In addition, the Fund is not obligated to reimburse GSIS for prior fiscal year expense reimbursements, if any. The Other Expense limitations as an annual percentage rate of average daily net assets for the Fund are 0.114%. These Other Expense limitations will remain in place through at least April 29, 2017 and prior to such date GSIS may not terminate the arrangements without the approval of the Trustees. In addition, the Fund has entered into certain offset arrangements with the transfer agent, which may
31
GOLDMAN SACHS LONG SHORT FUND
Notes to Financial Statements (continued)
June 30, 2016 (Unaudited)
|
| 5. AGREEMENTS AND AFFILIATED TRANSACTIONS (continued) |
result in a reduction of the Fund’s expenses and are received irrespective of the application of the “Other Expense” limitations described above.
For the six months ended June 30, 2016, these expense reductions, including any fee waivers and Other Expense reimbursements, were as follows:
| | | | | | | | | | |
Management
Fee Waiver | | | Other Expense
Reimbursements | | | Total Expense
Reductions | |
| $ | 62,012 | | | $ | 120,553 | | | $ | 182,565 | |
F. Line of Credit Facility — As of June 30, 2016, the Fund had entered into a committed revolving line of credit facility with a major financial institution. Pursuant to the terms of the facility, the Fund may borrow an aggregate amount of up to $10,000,000. The interest rate on borrowings is based on market rates. The facility also requires a fee to be paid by the Fund based on the amount of the commitment that has not been utilized. For the six months ended June 30, 2016, the Fund did not have any borrowings under the facility.
G. Other Transactions with Affiliates — For the six months ended June 30, 2016, Goldman Sachs did not earn any brokerage commissions from portfolio transactions on behalf of the Funds.
The table below shows the transactions in and earnings from investments in these affiliated Funds. For the six months ended June 30, 2016:
| | | | | | | | | | | | | | | | | | |
| Underlying Fund | | Market
Value
12/31/15 | | Purchases
at Cost | | | Proceeds
from Sales | | | Market
Value
6/30/16 | | | Dividend
Income | |
Goldman Sachs Financial Square Government Fund — FST Institutional Shares | | $81,330,466 | | $ | 260,502,291 | | | $ | (294,181,064 | ) | | $ | 47,651,693 | | | $ | 99,294 | |
As of June 30, 2016, the Goldman Sachs Group, Inc. was the beneficial owner of approximately 31% and 100% of Institutional and Class R Shares, respectively of the Fund.
|
| 6. PORTFOLIO SECURITIES TRANSACTIONS |
The cost of purchases and proceeds from sales and maturities of long-term securities for the six months ended June 30, 2016, were $217,133,998 and $260,458,937, respectively.
As of the Fund’s most recent fiscal year end, December 31, 2015, the Fund’s capital loss carryforwards and timing differences, on a tax-basis were as follows:
| | | | |
Capital loss carryforward | | | | |
Perpetual short-term | | $ | (2,525,339 | ) |
Timing differences (Post October Loss Deferral) | | $ | (8,775,892 | ) |
32
GOLDMAN SACHS LONG SHORT FUND
|
| 7. TAX INFORMATION (continued) |
As of June 30, 2016, the Fund’s aggregate security unrealized gains and losses based on cost for U.S. federal income tax purposes were as follows:
| | | | |
Tax Cost | | $ | 128,946,834 | |
Gross unrealized gain | | | 4,517,842 | |
Gross unrealized loss | | | (21,016,982 | ) |
Net unrealized gain | | $ | (16,499,140 | ) |
The difference between GAAP-basis and tax-basis unrealized gains (losses) is attributable primarily to wash sales, net mark to market gains (losses) on regulated futures and options contracts, net mark to market on foreign currency contracts and differences in the tax treatment of swap transactions.
GSIS has reviewed the Fund’s tax positions for all open tax years (as applicable) and has concluded that no provision for income tax is required in the Fund’s financial statements. Such open tax years remain subject to examination and adjustment by tax authorities.
The Fund’s risks include, but are not limited to, the following:
Derivatives Risk — Loss may result from the Fund investments in derivative instruments. These instruments may be illiquid, difficult to price and leveraged so that small changes in the value of the underlying instruments may produce disproportionate losses to the Fund. Derivatives are also subject to counterparty risk, which is the risk that the other party in the transaction will not fulfill its contractual obligation. Losses from investments in derivatives also can result from a lack of correlation between changes in the value of derivative instruments and the portfolio assets (if any) being hedged.
Foreign Countries Risk — Investing in foreign markets may involve special risks and considerations not typically associated with investing in the United States. Foreign securities may be subject to risk of loss because of more or less foreign government regulation, less public information and less economic, political and social stability in the countries in which the Fund invests. Loss may also result from the imposition of exchange controls, confiscations and other government restrictions by the United States or other governments, or from problems in registration, settlement or custody. Foreign risk also involves the risk of negative foreign currency rate fluctuations, which may cause the value of securities denominated in such foreign currency (or other instruments through which the Fund has exposure to foreign currencies) to decline in value. Currency exchange rates may fluctuate significantly over short periods of time.
Foreign Custody Risk — A Fund that invests in foreign securities may hold such securities and cash with foreign banks, agents, and securities depositories appointed by the Fund’s custodian (each a “Foreign Custodian”). Some foreign custodians may be recently organized or new to the foreign custody business. In some countries, Foreign Custodians may be subject to little or no regulatory oversight over, or independent evaluation of, their operations. Further, the laws of certain countries may place limitations on a Fund’s ability to recover its assets if a Foreign Custodian enters bankruptcy.
Investments in Other Investment Companies — As a shareholder of another investment company, including an exchange-traded fund (“ETF”), the Fund will indirectly bear its proportionate share of any net management fees and other expenses paid by such other investment companies, in addition to the fees and expenses regularly borne by the Fund. ETFs are subject to risks that do not apply to conventional mutual funds, including but not limited to the following: (i) the market price of the ETF’s shares may trade at a premium or a discount to their NAV; and (ii) an active trading market for an ETF’s shares may not develop or be maintained.
33
GOLDMAN SACHS LONG SHORT FUND
Notes to Financial Statements (continued)
June 30, 2016 (Unaudited)
|
| 8. OTHER RISKS (continued) |
Large Shareholder Transactions Risk — The Fund may experience adverse effects when certain large shareholders, such as other funds, institutional investors (including those trading by use of non-discretionary mathematical formulas), financial intermediaries (who may make investment decisions on behalf of underlying clients and/or include the Fund in their investment model), individuals, accounts and Goldman Sachs affiliates, purchase or redeem large amounts of shares of the Fund. Such large shareholder redemptions may cause the Fund to sell portfolio securities at times when it would not otherwise do so, which may negatively impact the Fund’s NAV and liquidity. These transactions may also accelerate the realization of taxable income to shareholders if such sales of investments resulted in gains, and may also increase transaction costs. In addition, a large redemption could result in the Fund’s current expenses being allocated over a smaller asset base, leading to an increase in the Fund’s expense ratio. Similarly, large Fund share purchases may adversely affect the Fund’s performance to the extent that the Fund is delayed in investing new cash and is required to maintain a larger cash position than it ordinarily would.
Liquidity Risk — The Fund may make investments that are illiquid or that may become less liquid in response to market developments or adverse investor perceptions. Illiquid investments may be more difficult to value. Liquidity risk may also refer to the risk that the Fund will not be able to pay redemption proceeds within the allowable time period because of unusual market conditions, an unusually high volume of redemption requests, or other reasons. To meet redemption requests, the Fund may be forced to sell investments at an unfavorable time and/or under unfavorable conditions
Market and Credit Risks — In the normal course of business, the Fund trades financial instruments and enters into financial transactions where risk of potential loss exists due to changes in the market (market risk). Additionally, the Fund may also be exposed to credit risk in the event that an issuer or guarantor fails to perform or that an institution or entity with which the Fund has unsettled or open transactions defaults.
Non-Diversification Risk — The Fund is non-diversified, meaning that it is permitted to invest a larger percentage of its assets in fewer issuers than diversified mutual funds. Thus, the Fund may be more susceptible to adverse developments affecting any single issuer held in its portfolio, and may be more susceptible to greater losses because of these developments.
Portfolio Concentration Risk — As a result of the Fund’s ability to invest a large percentage of its assets in obligations of issuers within the same country, state, region, currency or economic sector, an adverse economic, business or political development may affect the value of the Fund’s investments more than if its investments were not so concentrated.
Short Position Risk — The Fund may enter into a short position through a futures contract, an option or swap agreement or through short sales of any instrument that the Fund may purchase for investment. Taking short positions involves leverage of the Fund’s assets and presents various risks. If the value of the underlying instrument or market in which the Fund has taken a short position increases, then the Fund will incur a loss equal to the increase in value from the time that the short position was entered into plus any related interest payments or other fees. Taking short positions involves the risk that losses may be disproportionate, may exceed the amount invested, and may be unlimited.
Under the Trust’s organizational documents, its Trustees, officers, employees and agents are indemnified, to the extent permitted by the Act and state law, against certain liabilities that may arise out of performance of their duties to the Fund. Additionally, in the course of business, the Fund enters into contracts that contain a variety of indemnification clauses. The Fund’s maximum exposure under these arrangements is unknown, as this would involve future claims that may be made against the Fund that have not yet occurred. However, GSIS believes the risk of loss under these arrangements to be remote.
34
GOLDMAN SACHS LONG SHORT FUND
Subsequent events after the Statement of Assets and Liabilities date have been evaluated through the date the financial statements were issued. GSIS has concluded that there is no impact requiring adjustment or disclosure in the financial statements.
|
| 11. SUMMARY OF SHARE TRANSACTIONS |
Share activity is as follows:
| | | | | | | | | | | | | | | | |
| | | For the Six Months Ended
June 30, 2016
(Unaudited) | | | For the Fiscal Year Ended
December 31, 2015
| |
| | | Shares | | | Dollars | | | Shares | | | Dollars | |
| | | | |
| Class A Shares | | | | | | | | | | | | | | | | |
Shares sold | | | 221,763 | | | $ | 1,945,666 | | | | 3,093,006 | | | $ | 31,041,694 | |
Reinvestment of distributions | | | — | | | | — | | | | 5,248 | | | | 47,671 | |
Shares redeemed | | | (1,499,962 | ) | | | (12,730,915 | ) | | | (952,835 | ) | | | (8,873,843 | ) |
| | | | (1,278,199 | ) | | | (10,785,249 | ) | | | 2,145,419 | | | | 22,215,522 | |
| Class C Shares | | | | | | | | | | | | | | | | |
Shares sold | | | 94,084 | | | | 824,666 | | | | 732,249 | | | | 7,413,168 | |
Reinvestment of distributions | | | — | | | | — | | | | 1,020 | | | | 9,146 | |
Shares redeemed | | | (110,306 | ) | | | (943,045 | ) | | | (123,450 | ) | | | (1,138,389 | ) |
| | | | (16,222 | ) | | | (118,379 | ) | | | 609,819 | | | | 6,283,925 | |
| Institutional Shares | | | | | | | | | | | | | | | | |
Shares sold | | | 1,428,381 | | | | 12,554,969 | | | | 19,243,095 | | | | 197,141,958 | |
Reinvestment of distributions | | | — | | | | — | | | | 62,998 | | | | 576,639 | |
Shares redeemed | | | (6,800,336 | ) | | | (57,849,400 | ) | | | (10,452,796 | ) | | | (101,054,018 | ) |
| | | | (5,371,955 | ) | | | (45,294,431 | ) | | | 8,853,297 | | | | 96,664,579 | |
| Class IR Shares | | | | | | | | | | | | | | | | |
Shares sold | | | 729,702 | | | | 6,590,813 | | | | 2,360,467 | | | | 24,427,963 | |
Reinvestment of distributions | | | — | | | | — | | | | 3,229 | | | | 29,450 | |
Shares redeemed | | | (1,130,244 | ) | | | (9,655,211 | ) | | | (1,369,341 | ) | | | (12,845,028 | ) |
| | | | (400,542 | ) | | | (3,064,398 | ) | | | 994,355 | | | | 11,612,385 | |
| Class R Shares | | | | | | | | | | | | | | | | |
Reinvestment of distributions | | | — | | | | — | | | | 4 | | | | 39 | |
| | | | — | | | | — | | | | 4 | | | | 39 | |
NET INCREASE (DECREASE) | | | (7,066,918 | ) | | $ | (59,262,457 | ) | | | 12,602,894 | | | $ | 136,776,450 | |
35
GOLDMAN SACHS LONG SHORT FUND
| | |
Portfolio Expenses — Six Month Period Ended June 30, 2016 (Unaudited) | | |
As a shareholder of Class A, Class C, Institutional, Class IR and Class R Shares of the Fund, you incur two types of costs: (1) transaction costs, including sales charges on purchase payments (with respect to Class A Shares), contingent deferred sales charges on redemptions (with respect to Class C Shares), and (2) ongoing costs, including management fees; distribution and service (12b-1) fees (with respect to Class A and Class R Shares); and other Fund expenses. This Example is intended to help you understand your ongoing costs (in dollars) of investing in Class A, Class C, Institutional, Class IR and Class R Shares of the Funds and to compare these costs with the ongoing costs of investing in other mutual funds.
The Example is based on an investment of $1,000 invested at the beginning of the period and held for the entire period from January 1, 2016 through June 30, 2016, which represents a period of 182 days in a 366-day year.
Actual Expenses — The first line under each share class in the table below provides information about actual account values and actual expenses. You may use the information in this line, together with the amount you invested, to estimate the expenses that you paid over the period. Simply divide your account value by $1,000 (for example, an $8,600 account value divided by $1,000=8.6), then multiply the result by the number in the first line under the heading entitled “Expenses Paid” to estimate the expenses you paid on your account during this period.
Hypothetical Example for Comparison Purposes — The second line under each share class in the table below provides information about hypothetical account values and hypothetical expenses based on the Portfolios’ actual net expense ratios and an assumed rate of return of 5% per year before expenses, which is not the Portfolios’ actual return. The hypothetical account values and expenses may not be used to estimate the actual ending account balance or expenses you paid for the period. You may use this information to compare the ongoing costs of investing in the Portfolios and other funds. To do so, compare this 5% hypothetical example with the 5% hypothetical examples that appear in the shareholder reports of the other funds.
Please note that the expenses shown in the table are meant to highlight your ongoing costs only and do not reflect any transactional costs, such as sales charges, redemption fees, or exchange fees. Therefore, the second line of the table is useful in comparing ongoing costs only, and will not help you determine the relative total costs of owning different funds. In addition, if these transactional costs were included, your costs would have been higher.
| | | | | | | | | | | | |
| | | Long Short Fund | |
| Share Class | | Beginning
Account Value
1/1/16 | | | Ending
Account Value
6/30/16 | | | Expenses Paid for the
6 months ended
6/30/16* | |
| Class A | | | | | | | | | | | | |
Actual | | $ | 1,000.00 | | | $ | 913.00 | | | $ | 15.65 | |
Hypothetical 5% return | | | 1,000.00 | | | | 1,008.50 | + | | | 16.43 | |
| Class C | | | | | | | | | | | | |
Actual | | | 1,000.00 | | | | 910.10 | | | | 19.38 | |
Hypothetical 5% return | | | 1,000.00 | | | | 1,004.57 | + | | | 20.33 | |
| Institutional | | | | | | | | | | | | |
Actual | | | 1,000.00 | | | | 915.50 | | | | 13.86 | |
Hypothetical 5% return | | | 1,000.00 | | | | 1,010.39 | + | | | 14.55 | |
| Class IR | | | | | | | | | | | | |
Actual | | | 1,000.00 | | | | 911.80 | | | | 14.69 | |
Hypothetical 5% return | | | 1,000.00 | | | | 1,009.50 | + | | | 15.44 | |
| Class R | | | | | | | | | | | | |
Actual | | | 1,000.00 | | | | 914.40 | | | | 17.04 | |
Hypothetical 5% return | | | 1,000.00 | | | | 1,007.06 | + | | | 17.87 | |
| | * | | Expenses for each share class are calculated using the Fund’s annualized net expense ratio for each class, which represents the ongoing expenses as a percentage of net assets for the six months ended June 30, 2016. Expenses are calculated by multiplying the annualized net expense ratio by the average account value for the period; then multiplying the result by the number of days in the most recent fiscal half year; and then dividing that result by the number of days in the fiscal year. The annualized net expense ratios for the period were as follows: | |
| | | | | | | | | | | | | | | | | | | | |
| Fund | | Class A | | | Class C | | | Institutional | | | Class IR | | | Class R | |
Long Short | | | 3.29 | % | | | 4.08 | % | | | 2.91 | % | | | 3.09 | % | | | 3.58 | % |
| | + | | Hypothetical expenses are based on the Fund’s actual annualized net expense ratios and an assumed rate of return of 5% per year before expenses. | |
36
GOLDMAN SACHS LONG SHORT FUND
Statement Regarding Basis for Approval of Management Agreement (Unaudited)
Background
The Goldman Sachs Long Short Fund (the “Fund”) is an investment portfolio of Goldman Sachs Trust (the “Trust”). The Board of Trustees oversees the management of the Trust and reviews the investment performance and expenses of the Fund at regularly scheduled meetings held throughout the year. In addition, the Board of Trustees determines annually whether to approve the continuance of the Trust’s investment management agreement (the “Management Agreement”) with GS Investment Strategies, LLC (the “Investment Adviser”) on behalf of the Fund.
The Management Agreement was most recently approved for continuation until June 30, 2017 by the Board of Trustees, including those Trustees who are not parties to the Management Agreement or “interested persons” (as defined in the Investment Company Act of 1940, as amended) of any party thereto (the “Independent Trustees”), at a meeting held on June 15-16, 2016 (the “Annual Meeting”).
The review process undertaken by the Trustees spans the course of the year and culminates with the Annual Meeting. To assist the Trustees in their deliberations, the Trustees have established a Contract Review Committee (the “Committee”), comprised of the Independent Trustees. The Committee held three meetings over the course of the year since the Management Agreement was last approved. At those Committee meetings, regularly scheduled Board or other committee meetings, and/or the Annual Meeting, matters relevant to the renewal of the Management Agreement were considered by the Board, or the Independent Trustees, as applicable. With respect to the Fund, such matters included:
| | (a) | | the nature and quality of the advisory, administrative, and other services provided to the Fund by the Investment Adviser and its affiliates, including information about: |
| | (i) | | the structure, staff, and capabilities of the Investment Adviser and its portfolio management teams; |
| | (ii) | | the groups within the Investment Adviser and its affiliates that support the portfolio management teams or provide other types of necessary services, including fund services groups (e.g., accounting and financial reporting, tax, shareholder services, and operations); controls and risk management groups (e.g., legal, compliance, valuation oversight, credit risk management, internal audit, compliance testing, market risk analysis, finance, and central funding); sales and distribution support groups, and others (e.g., information technology and training); |
| | (iii) | | trends in employee headcount; |
| | (iv) | | the Investment Adviser’s financial resources and ability to hire and retain talented personnel and strengthen its operations; and |
| | (v) | | the parent company’s support of the Investment Adviser and its mutual fund business, as expressed by the firm’s senior management; |
| | (b) | | information on the investment performance of the Fund, including comparisons to the performance of similar mutual funds, as provided by a third-party mutual fund data provider engaged as part of the contract review process (the “Outside Data Provider”), a benchmark performance index, and general investment outlooks in the markets in which the Fund invests; |
| | (c) | | information provided by the Investment Adviser indicating the Investment Adviser’s views on whether the Fund’s peer group and/or benchmark index had high, medium, or low relevance given the Fund’s particular investment strategy; |
| | (d) | | the terms of the Management Agreement and other agreements with affiliated service providers entered into by the Trust on behalf of the Fund; |
| | (e) | | fee and expense information for the Fund, including: |
| | (i) | | the relative management fee and expense level of the Fund as compared to those of comparable funds managed by other advisers, as provided by the Outside Data Provider; |
| | (ii) | | the Fund’s expense trends over time; and |
| | (iii) | | to the extent the Investment Adviser manages other types of accounts (such as bank collective trusts, private wealth management accounts, institutional separate accounts, sub-advised mutual funds, and non-U.S. funds) having investment objectives and policies similar to those of the Fund, comparative information on the advisory fees charged and services provided to those accounts by the Investment Adviser; |
| | (f) | | with respect to the investment performance and expense comparison data provided by the Outside Data Provider, its processes in producing that data for the Fund; |
| | (g) | | the undertaking of the Investment Adviser to limit certain expenses of the Fund that exceed a specified level; |
| | (h) | | information relating to the profitability of the Management Agreement and the transfer agency and distribution and service arrangements of the Fund and the Trust as a whole to the Investment Adviser and its affiliates; |
| | (i) | | whether the Fund’s existing management fee schedule adequately addressed any economies of scale; |
37
GOLDMAN SACHS LONG SHORT FUND
Statement Regarding Basis for Approval of Management Agreement (Unaudited) (continued)
| | (j) | | a summary of the “fall-out” benefits derived by the Investment Adviser and its affiliates from their relationships with the Fund, including the fees received by the Investment Adviser’s affiliates from the Fund for transfer agency, portfolio trading, distribution and other services; |
| | (k) | | a summary of potential benefits derived by the Fund as a result of its relationship with the Investment Adviser; |
| | (l) | | information regarding commissions paid by the Fund and broker oversight, an update on the Investment Adviser’s soft dollars practices, other information regarding portfolio trading, and how the Investment Adviser carries out its duty to seek best execution; |
| | (m) | | portfolio manager ownership of Fund shares; the manner in which portfolio manager compensation is determined; and the number and types of accounts managed by the portfolio managers; |
| | (n) | | the nature and quality of the services provided to the Fund by its unaffiliated service providers, and the Investment Adviser’s general oversight and evaluation (including reports on due diligence) of those service providers as part of the administration services provided under the Management Agreement; and |
| | (o) | | the Investment Adviser’s processes and policies addressing various types of potential conflicts of interest; its approach to risk management; the annual review of the effectiveness of the Fund’s compliance program; and periodic compliance reports. |
The Trustees also received an overview of the Fund’s distribution arrangements. They received information regarding the Fund’s assets, share purchase and redemption activity, and payment of distribution and service fees. Information was also provided to the Trustees relating to revenue sharing payments made by and services provided by the Investment Adviser and its affiliates to intermediaries that promote the sale, distribution, and/or servicing of Fund shares. The Independent Trustees also discussed the broad range of other investment choices that are available to Fund investors, including the availability of comparable funds managed by other advisers.
The presentations made at the Board and Committee meetings and at the Annual Meeting encompassed the Fund and other mutual funds for which the Board of Trustees has responsibility. In evaluating the Management Agreement at the Annual Meeting, the Trustees relied upon their knowledge, resulting from their meetings and other interactions throughout the year, of the Investment Adviser and its affiliates, their services, and the Fund. In conjunction with these meetings, the Trustees received written materials and oral presentations on the topics covered, and the Investment Adviser addressed the questions and concerns of the Trustees, including concerns regarding the investment performance of certain of the funds they oversee. The Independent Trustees were advised by their independent legal counsel regarding their responsibilities and other regulatory requirements related to the approval and continuation of mutual fund investment management agreements under applicable law. In addition, the Investment Adviser and its affiliates provided the Independent Trustees with a written response to a formal request for information sent on behalf of the Independent Trustees by their independent legal counsel. During the course of their deliberations, the Independent Trustees met in executive sessions with their independent legal counsel, without representatives of the Investment Adviser or its affiliates present.
Nature, Extent, and Quality of the Services Provided Under the Management Agreement
As part of their review, the Trustees considered the nature, extent, and quality of the services provided to the Fund by the Investment Adviser. In this regard, the Trustees considered both the investment advisory services and non-advisory services that are provided by the Investment Adviser and its affiliates. The Trustees noted the transition in the leadership and changes in personnel of various of the Investment Adviser’s portfolio management teams that had occurred in recent periods, and the ongoing recruitment efforts aimed at bringing high quality investment talent to the Investment Adviser. They also noted the Investment Adviser’s commitment to maintaining high quality systems and expending substantial resources to respond to ongoing changes to the regulatory and control environment in which the Fund and its service providers operate, as well as the efforts of the Investment Adviser and its affiliates to combat cyber security risks. The Trustees concluded that the Investment Adviser continued to commit substantial financial and operational resources to the Fund and expressed confidence that the Investment Adviser would continue to do so in the future. The Trustees also recognized that the Investment Adviser had made significant commitments to address regulatory compliance requirements applicable to the Fund and the Investment Adviser and its affiliates.
Investment Performance
The Trustees also considered the investment performance of the Fund. In this regard, they compared the investment performance of the Fund to its peers using rankings compiled by the Outside Data Provider as of December 31, 2015, and updated performance information prepared by the Investment Adviser using the peer group identified by the Outside Data Provider as of March 31, 2016. The information on the Fund’s investment performance was provided for the one-year period ending on the applicable dates. The Trustees also reviewed the Fund’s investment performance relative to its performance benchmark. As part of
38
GOLDMAN SACHS LONG SHORT FUND
Statement Regarding Basis for Approval of Management Agreement (Unaudited) (continued)
this review, they considered the investment performance trends of the Fund over time, and reviewed the investment performance of the Fund in light of its investment objective and policies and market conditions.
In addition, the Trustees considered materials prepared and presentations made by the Investment Adviser’s senior management and portfolio management personnel in which Fund performance was assessed. The Trustees also considered the Investment Adviser’s periodic reports with respect to the Fund’s risk profile, and how the Investment Adviser’s approach to risk monitoring and management influences portfolio management.
The Trustees observed that the Long Short Fund’s Institutional Shares had placed in the fourth quartile of the Fund’s peer group, had underperformed the Fund’s benchmark index, and had underperformed the average performance of a group of competitor funds, as determined by the Investment Adviser, for the one-year period ended March 31, 2016.
Costs of Services Provided and Competitive Information
The Trustees considered the contractual terms of the Management Agreement and the fee rates payable by the Fund thereunder. In this regard, the Trustees considered information on the services rendered by the Investment Adviser to the Fund, which included both advisory and administrative services that were directed to the needs and operations of the Fund as a registered mutual fund.
In particular, the Trustees reviewed analyses prepared by the Outside Data Provider regarding the expense rankings of the Fund. The analyses provided a comparison of the Fund’s management fee and breakpoints to those of a relevant peer group and category universe; an expense analysis which compared the Fund’s overall net and gross expenses to a peer group and a category universe; and a two-year history comparing the Fund’s net expenses to the peer and category medians. The analyses also compared the Fund’s transfer agency, custody, and distribution fees, other expenses and fee waivers/reimbursements to those of the peer group and category medians. The Trustees concluded that the comparisons provided by the Outside Data Provider were useful in evaluating the reasonableness of the management fees and total expenses paid by the Fund.
In addition, the Trustees considered the Investment Adviser’s undertaking to limit certain expenses of the Fund that exceed a specified level. The Trustees also noted that certain changes were being made to existing fee waiver or expense limitation arrangements of the Fund that would have the effect of decreasing total Fund expenses, with such changes taking effect in connection with the Fund’s next annual registration statement update. They also considered, to the extent that the Investment Adviser manages other types of accounts having investment objectives and policies similar to those of the Fund, comparative fee information for services provided by the Investment Adviser to those accounts, and information that indicated that services provided to the Fund differed in various significant respects from the services provided to other types of accounts which, in many cases, operated under less stringent legal and regulatory structures, required fewer services from the Investment Adviser to a smaller number of client contact points, and were less time-intensive.
In addition, the Trustees noted that shareholders are able to redeem their Fund shares at any time if shareholders believe that the Fund fees and expenses are too high or if they are dissatisfied with the performance of the Fund.
Profitability
The Trustees reviewed the Investment Adviser’s revenues and pre-tax profit margins with respect to the Trust and the Fund. In this regard the Trustees noted that they had received, among other things, profitability analyses and summaries, revenue and expense schedules by Fund and by function (i.e., investment management, transfer agency and distribution and service), and information on the Investment Adviser’s expense allocation methodology. They observed that the profitability and expense figures are substantially similar to those used by the Investment Adviser for many internal purposes, including compensation decisions among various business groups, and are thus subject to a vigorous internal debate about how certain revenue and expenses should be allocated. The Trustees also noted that the internal audit group within the Goldman Sachs organization had audited the expense allocation methodology and was satisfied with the reasonableness, consistency, and accuracy of the Investment Adviser’s expense allocation methodology and profitability analysis calculations. Profitability data for the Trust and the Fund was provided for 2015 and 2014, and the Trustees considered this information in relation to the Investment Adviser’s overall profitability. The Trustees considered the Investment Adviser’s revenues and pre-tax profit margins both in absolute terms and in comparison to information on the reported pre-tax profit margins earned by certain other asset management firms.
39
GOLDMAN SACHS LONG SHORT FUND
Statement Regarding Basis for Approval of Management Agreement (Unaudited) (continued)
Economies of Scale
The Trustees considered the information that had been provided regarding the Investment Adviser’s profitability. The Trustees also considered the breakpoints in the fee rate payable under the Management Agreement for the Fund at the following annual percentage rates of the average daily net assets of the Fund:
| | | | |
First $2 billion | | | 1.60 | % |
Next $3 billion | | | 1.44 | |
Next $3 billion | | | 1.37 | |
Over $8 billion | | | 1.34 | |
The Trustees noted that the breakpoints were designed to share potential economies of scale, if any, with the Fund and its shareholders as assets under management reach those asset levels. The Trustees considered the amount of assets in the Fund; the Fund’s recent share purchase and redemption activity; the information provided by the Investment Adviser relating to the costs of the services provided by the Investment Adviser and its affiliates and their realized profits; information comparing fee rates charged by the Investment Adviser with fee rates charged to other funds in the peer group; and the Investment Adviser’s undertaking to limit certain expenses of the Fund that exceed a specified level. Upon reviewing these matters at the Annual Meeting, the Trustees concluded that the fee breakpoints represented a means of assuring that benefits of scalability, if any, would be passed along to shareholders at the specified asset levels.
Other Benefits to the Investment Adviser and Its Affiliates
The Trustees also considered the other benefits derived by the Investment Adviser and its affiliates from their relationships with the Fund as stated above, including: (a) transfer agency fees received by Goldman, Sachs & Co. (“Goldman Sachs”); (b) brokerage and futures commissions earned by Goldman Sachs for executing securities and futures transactions on behalf of the Fund; (c) research received by the Investment Adviser from broker-dealers in exchange for executing certain transactions on behalf of the Fund; (d) trading efficiencies resulting from aggregation of orders of the Fund with those for other funds or accounts managed by the Investment Adviser; (e) the Investment Adviser’s ability to leverage the infrastructure designed to service the Fund on behalf of its other clients; (f) the Investment Adviser’s ability to cross-market other products and services to Fund shareholders; (g) Goldman Sachs’ retention of certain fees as Fund Distributor; (h) the Investment Adviser’s ability to negotiate better pricing with custodians on behalf of its other clients, as a result of the relationship with the Fund; and (i) the possibility that the working relationship between the Investment Adviser and the Fund’s third-party service providers may cause those service providers to be more likely to do business with other areas of Goldman Sachs. In the course of considering the foregoing, the Independent Trustees requested and received further information quantifying certain of these fall-out benefits.
Other Benefits to the Fund and Its Shareholders
The Trustees also noted that the Fund receives certain potential benefits as a result of its relationship with the Investment Adviser, including: (a) trading efficiencies resulting from aggregation of orders of the Fund with those of other funds or accounts managed by the Investment Adviser; (b) enhanced servicing from vendors because of the volume of business generated by the Investment Adviser and its affiliates; (c) enhanced servicing from broker-dealers because of the volume of business generated by the Investment Adviser and its affiliates; (d) the Investment Adviser’s ability to negotiate favorable terms with derivatives counterparties on behalf of the Fund as a result of the size and reputation of the Goldman Sachs organization; (e) the Investment Adviser’s knowledge and experience gained from managing other accounts and products; (f) the Investment Adviser’s ability to hire and retain qualified personnel to provide services to the Fund because of the reputation of the Goldman Sachs organization; (g) the Fund’s access, through the Investment Adviser, to certain firmwide resources (e.g., proprietary risk management systems and databases), subject to certain restrictions; and (h) the Fund’s access to certain affiliated distribution channels. In addition, the Trustees noted the competitive nature of the mutual fund marketplace, and considered that many of the Fund’s shareholders invested in the Fund in part because of the Fund’s relationship with the Investment Adviser and that those shareholders have a general expectation that the relationship will continue.
Conclusion
In connection with their consideration of the Management Agreement, the Trustees gave weight to each of the factors described above, but did not identify any particular factor as controlling their decision. After deliberation and consideration of all of the information provided, including the factors described above, the Trustees concluded, in the exercise of their business judgment, that the management fees paid by the Fund were reasonable in light of the services provided to it by the Investment Adviser, the Investment Adviser’s costs and the Fund’s current and reasonably foreseeable asset levels. The Trustees unanimously concluded that the Investment Adviser’s continued management likely would benefit the Fund and its shareholders and that the Management Agreement should be approved and continued with respect to the Fund until June 30, 2017.
40
FUNDS PROFILE
Goldman Sachs Funds

Goldman Sachs is a premier financial services firm, known since 1869 for creating thoughtful and customized investment solutions in complex global markets.
Today, the Investment Management Division of Goldman Sachs serves a diverse set of clients worldwide, including private institutions, public entities and individuals. With approximately $1.12 trillion in assets under supervision as of June 30, 2016, Goldman Sachs Asset Management (“GSAM”) has portfolio management teams located around the world and our investment professionals bring firsthand knowledge of local markets to every investment decision. Assets under supervision includes assets under management and other client assets for which Goldman Sachs does not have full discretion. GSAM leverages the resources of Goldman, Sachs & Co. subject to legal, internal and regulatory restrictions.

Money Market1
Financial Square FundsSM
| n | | Financial Square Treasury Solutions Fund2 |
| n | | Financial Square Government Fund |
| n | | Financial Square Money Market Fund |
| n | | Financial Square Prime Obligations Fund |
| n | | Financial Square Treasury Instruments Fund |
| n | | Financial Square Treasury Obligations Fund |
| n | | Financial Square Federal Instruments Fund |
| n | | Financial Square Tax-Exempt Money Market Fund |
Investor FundsSM
| n | | Investor Money Market Fund |
| n | | Investor Tax-Exempt Money Market Fund3 |
Fixed Income
Short Duration and Government
| n | | High Quality Floating Rate Fund |
| n | | Short-Term Conservative Income Fund4 |
| n | | Short Duration Government Fund |
| n | | Short Duration Income Fund |
| n | | Inflation Protected Securities Fund |
Multi-Sector
Municipal and Tax-Free
| n | | High Yield Municipal Fund |
| n | | Dynamic Municipal Income Fund |
| n | | Short Duration Tax-Free Fund |
Single Sector
| n | | Investment Grade Credit Fund |
| n | | High Yield Floating Rate Fund |
| n | | Emerging Markets Debt Fund |
| n | | Local Emerging Markets Debt Fund |
| n | | Dynamic Emerging Markets Debt Fund |
Fixed Income Alternatives
| n | | Long Short Credit Strategies Fund |
| n | | Fixed Income Macro Strategies Fund |
Fundamental Equity
| n | | Small/Mid Cap Value Fund |
| n | | Small/Mid Cap Growth Fund |
| n | | Flexible Cap Growth Fund |
| n | | Concentrated Growth Fund |
| n | | Technology Opportunities Fund5 |
| n | | Growth Opportunities Fund |
| n | | Rising Dividend Growth Fund |
| n | | Dynamic U.S. Equity Fund |
Tax-Advantaged Equity
| n | | U.S. Tax-Managed Equity Fund |
| n | | International Tax-Managed Equity Fund |
| n | | U.S. Equity Dividend and Premium Fund |
| n | | International Equity Dividend and Premium Fund |
Equity Insights
| n | | Small Cap Equity Insights Fund |
| n | | U.S. Equity Insights Fund |
| n | | Small Cap Growth Insights Fund |
| n | | Large Cap Growth Insights Fund |
| n | | Large Cap Value Insights Fund |
| n | | Small Cap Value Insights Fund |
| n | | International Small Cap Insights Fund6 |
| n | | International Equity Insights Fund |
| n | | Emerging Markets Equity Insights Fund |
Fundamental Equity International
| n | | Strategic International Equity Fund |
| n | | Focused International Equity Fund |
| n | | Emerging Markets Equity Fund7 |
Select Satellite8
| n | | Real Estate Securities Fund |
| n | | International Real Estate Securities Fund |
| n | | Commodity Strategy Fund |
| n | | Global Real Estate Securities Fund |
| n | | Dynamic Commodity Strategy Fund |
| n | | Dynamic Allocation Fund |
| n | | Absolute Return Tracker Fund |
| n | | Managed Futures Strategy Fund |
| n | | MLP Energy Infrastructure Fund |
| n | | Multi-Manager Alternatives Fund |
| n | | Multi-Asset Real Return Fund |
| n | | Absolute Return Multi-Asset Fund |
| n | | Global Infrastructure Fund |
Total Portfolio Solutions8
| n | | Global Managed Beta Fund |
| n | | Multi-Manager Non-Core Fixed Income Fund |
| n | | Multi-Manager U.S. Dynamic Equity Fund |
| n | | Multi-Manager Global Equity Fund |
| n | | Multi-Manager International Equity Fund |
| n | | Tactical Tilt Overlay Fund9 |
| n | | Balanced Strategy Portfolio |
| n | | Multi-Manager U.S. Small Cap Equity Fund |
| n | | Multi-Manager Real Assets Strategy Fund |
| n | | Growth and Income Strategy Portfolio |
| n | | Growth Strategy Portfolio |
| n | | Equity Growth Strategy Portfolio |
| n | | Satellite Strategies Portfolio |
| n | | Enhanced Dividend Global Equity Portfolio |
| n | | Tax Advantaged Global Equity Portfolio |
| n | | Strategic Factor Allocation Fund |
| 1 | | An investment in a money market portfolio is not insured or guaranteed by the Federal Deposit Insurance Corporation or any other government agency. Although a money market portfolio seeks to preserve the value of an investment at $1.00 per share, it is possible to lose money by investing in a money market portfolio. The Fund’s sponsor has no legal obligation to provide financial support to a money market portfolio, and you should not expect that the sponsor will provide financial support to the money market portfolio at any time. |
| 2 | | Effective on September 30, 2015, the Goldman Sachs Financial Square Federal Fund was renamed the Goldman Sachs Financial Square Treasury Solutions Fund. |
| 3 | | Effective on March 31, 2016, the Goldman Sachs Financial Square Tax-Free Money Market Fund was renamed the Goldman Sachs Investor Tax-Exempt Money Market Fund. |
| 4 | | Effective on July 29, 2016, the Goldman Sachs Limited Maturity Obligations Fund was renamed the Goldman Sachs Short-Term Conservative Income Fund. |
| 5 | | Effective on July 31, 2015, the Goldman Sachs Technology Tollkeeper Fund was renamed the Goldman Sachs Technology Opportunities Fund. |
| 6 | | Effective at the close of business on February 5, 2016, the Goldman Sachs International Small Cap Fund was reorganized with and into the Goldman Sachs International Small Cap Insights Fund. |
| 7 | | Effective at the close of business on October 23, 2015, the Goldman Sachs BRIC Fund (Brazil, Russia, India, China) was reorganized with and into the Goldman Sachs Emerging Markets Equity Fund. |
| 8 | | Individual Funds within the Total Portfolio Solutions and Select Satellite categories will have various placement on the risk/return spectrum and may have greater or lesser risk than that indicated by the placement of the general Total Portfolio Solutions or Select Satellite category. |
| 9 | | Effective on June 1, 2016, the Goldman Sachs Tactical Tilt Implementation Fund was renamed the Goldman Sachs Tactical Tilt Overlay Fund. |
Financial Square FundsSM and Investor FundsSM are registered service marks of Goldman, Sachs & Co.
| * | | This list covers open-end funds only. Please visit our website at www.GSAMFUNDS.com to learn about our closed-end funds and exchange-traded funds. |
| | |
TRUSTEES Ashok N. Bakhru, Chairman Kathryn A. Cassidy Diana M. Daniels Herbert J. Markley James A. McNamara Jessica Palmer Alan A. Shuch Roy W. Templin Gregory G. Weaver | | OFFICERS James A. McNamara, President Scott M. McHugh, Principal Financial Officer, Senior Vice President and Treasurer Caroline L. Kraus, Secretary |
| |
GOLDMAN, SACHS & CO. Distributor and Transfer Agent | | GS INVESTMENT STRATEGIES, LLC Investment Adviser |
Visit our web site at www.GSAMFUNDS.com to obtain the most recent month-end returns.
Goldman Sachs Asset Management, L.P., 200 West Street, New York, New York 10282
The reports concerning the Fund included in this shareholder report may contain certain forward-looking statements about the factors that may affect the performance of the Fund in the future. These statements are based on Fund management’s predictions and expectations concerning certain future events and their expected impact on the Fund, such as performance of the economy as a whole and of specific industry sectors, changes in the levels of interest rates, the impact of developing world events, and other factors that may influence the future performance of the Fund. Management believes these forward-looking statements to be reasonable, although they are inherently uncertain and difficult to predict. Actual events may cause adjustments in portfolio management strategies from those currently expected to be employed.
A description of the policies and procedures that the Fund uses to determine how to vote proxies relating to portfolio securities and information regarding how the Fund voted proxies relating to portfolio securities for the most recent 12-month period ended June 30, are available (I) without charge, upon request by calling 1-800-526-7384; and (II) on the Securities and Exchange Commission (“SEC’’) web site at http://www.sec.gov.
The Funds file their complete schedule of portfolio holdings with the SEC for the first and third quarters of each fiscal year on Form N-Qs. The Fund’s Form N-Qs are available on the SEC’s web site at http://www.sec.gov within 60 days after the Funds’ first and third fiscal quarters. The Fund’s Form N-Qs may be reviewed and copied at the SEC’s Public Reference Room in Washington, D.C. and information on the operation of the Public Reference Room may also be obtained by calling 1-800-SEC-0330. Form N-Qs may be obtained upon request and without charge by calling 1-800-526-7384 (for Retail Shareholders) or 1-800-621-2550 (for Institutional Shareholders).
Fund holdings and allocations shown are as of June 30, 2016 and may not be representative of future investments. Fund holdings should not be relied on in making investment decisions and should not be construed as research or investment advice regarding particular securities. Current and future holdings are subject to risk.
The Global Industry Classification Standard (GICS) was developed by and is the exclusive property and a service mark of Morgan Stanley Capital International Inc. (MSCI) and Standard & Poor’s, a division of The McGraw-Hill Companies, Inc. (S&P) and is licensed for use by Goldman Sachs. Neither MSCI, S&P nor any other party involved in making or compiling the GICS or any GICS classifications makes any express or implied warranties or representations with respect to such standard or classification (or the results to be obtained by the use thereof), and all such parties hereby expressly disclaim all warranties of originality, accuracy, completeness, merchantability or fitness for a particular purpose with respect to any of such standard or classification. Without limiting any of the foregoing, in no event shall MSCI, S&P, any of their affiliates or any third party involved in making or compiling the GICS or any GICS classifications have any liability for any direct, indirect, special, punitive, consequential or any other damages (including lost profits) even if notified of the possibility of such damages.
Goldman Sachs does not provide legal, tax or accounting advice to its clients. All investors are strongly urged to consult with their legal, tax, or accounting advisors regarding any potential transactions or investments. There is no assurance that the tax status or treatment of a proposed transaction or investment will continue in the future. Tax treatment or status may be changed by law or government action in the future or on a retroactive basis.
Economic and market forecasts presented herein reflect our judgment as of the date of this presentation and are subject to change without notice. These forecasts do not take into account the specific investment objectives, restrictions, tax and financial situation or other needs of any specific client. Actual data will vary and may not be reflected here. These forecasts are subject to high levels of uncertainty that may affect actual performance. Accordingly, these forecasts should be viewed as merely representative of a broad range of possible outcomes. These forecasts are estimated, based on assumptions, and are subject to significant revision and may change materially as economic and market conditions change. Goldman Sachs has no obligation to provide updates or changes to these forecasts. Case studies and examples are for illustrative purposes only.
The portfolio risk management process includes an effort to monitor and manage risk, but does not imply low risk.
This material is not authorized for distribution to prospective investors unless preceded or accompanied by a current Prospectus or summary prospectus, if applicable. Investors should consider a Fund’s objective, risks, and charges and expenses, and read the summary prospectus, if available, and/or the Prospectus carefully before investing or sending money. The summary prospectus, if available, and the Prospectus contain this and other information about a Fund and may be obtained from your authorized dealer or from Goldman, Sachs & Co. by calling (retail – 1-800-526-7384) (institutional – 1-800-621-2550).
© 2016 Goldman Sachs. All rights reserved. 58897-TMPL-08/2016 LONGSHSAR-16/1K
Goldman Sachs Funds

| | | | |
| | |
| Semi-Annual Report | | | | June 30, 2016 |
| | |
| | | | Select Satellite Funds |
| | | | Absolute Return Tracker |
| | | | Commodity Strategy |
| | | | Dynamic Allocation |
| | | | Dynamic Commodity Strategy |
| | | | Managed Futures Strategy |

Goldman Sachs Select Satellite Funds
| n | | ABSOLUTE RETURN TRACKER |
| n | | DYNAMIC COMMODITY STRATEGY |
| n | | MANAGED FUTURES STRATEGY |
| | | | |
TABLE OF CONTENTS | | | | |
| |
Portfolio Management Discussions and Performance Summaries | | | 1 | |
| |
Index Definitions | | | 26 | |
| |
Schedules of Investments | | | 28 | |
| |
Financial Statements | | | 54 | |
| |
Financial Highlights | | | 62 | |
| |
Notes to Financial Statements | | | 72 | |
| |
Other Information | | | 101 | |
| | | | |
| | | |
| NOT FDIC-INSURED | | May Lose Value | | No Bank Guarantee |
PORTFOLIO RESULTS
Goldman Sachs Absolute Return Tracker Fund
Investment Objective
The Fund’s investment objective is to seek to deliver long-term total return consistent with investment results that approximate the return and risk patterns of a diversified universe of hedge funds.
Portfolio Management Discussion and Analysis
Below, the Goldman Sachs Quantitative Investment Strategies (“QIS”) Team discusses the Goldman Sachs Absolute Return Tracker Fund’s (the “Fund”) performance and positioning for the six-month period ended June 30, 2016 (“the Reporting Period”).
| Q | | How did the Fund perform during the Reporting Period? |
| A | | During the Reporting Period, the Fund’s Class A, C, Institutional, IR, R and R6 Shares generated cumulative total returns, without sales charges, of 1.04%, 0.61%, 1.24%, 1.25%, 0.94% and 1.24%, respectively. These returns compare to the -0.83% cumulative total return of the Fund’s benchmark, the HFRX Global Hedge Fund Index (net of management, administrative and performance/incentive fees) (the “HFRX Global Hedge Fund Index”)1, during the same time period. |
| Q | | What economic and market factors most influenced the hedge fund asset class as a whole during the Reporting Period? |
| A | | Hedge funds, as measured by the HFRX Global Hedge Fund Index, overall generated modestly negative returns during the Reporting Period. Equity long/short hedge funds, as measured by the HFRX Equity Hedge Index, lost ground during the Reporting Period, returning -3.92%. Within equity long/short hedge funds, fundamental growth and market neutral managers performed the worst, while short bias and energy managers gained. Relative value hedge funds also posted negative returns during the Reporting Period, with the HFRX Relative Value Arbitrage Index returning -1.75%. Multi-strategy and asset-backed funds lost most among relative value hedge funds, while energy infrastructure and yield alternative funds gained. Global macro hedge funds were also down, with the HFRX Macro/ CTA Index returning -0.33% for the Reporting Period. |
| | 1 | | The HFRX Global Hedge Fund Index is a trademark of Hedge Fund Research, Inc. (“HFR”). HFR has not participated in the formation of the Fund. HFR does not endorse or approve the Fund or make any recommendation with respect to investing in the Fund. |
| | Among macro hedge funds, multi-strategy managers were weakest, while managers in metals and other commodities posted gains. Event driven hedge funds performed best during the Reporting Period, with the HFRX Event Driven Index returning a positive 3.25%. Distressed restructuring and credit arbitrage managers gained, while activist managers posted losses. |
| | As the Reporting Period began, hedge funds were broadly down, with the HFRX Global Hedge Fund Index declining 2.76% for the first month of the new year. Risk assets, including global equities, energy and high yield credit, sold off in January 2016 amid investor concerns over slowing economic growth in China, over safe haven assets, such as sovereign government bonds, rallied over the month. Hedge funds were mixed across styles in January 2016, with equity long/short, event driven and relative value hedge funds generally declining, while global macro hedge funds posted gains for the month. Among equity long/short hedge funds, performance was particularly weak among fundamental value managers. Among relative value hedge funds, relative value arbitrage hedge funds declined most. Within the global macro sub-strategy, trend-following managers performed best amid strong price trends in fixed income, equities and currencies. Hedge funds remained challenged in February 2016, with the HFRX Global Hedge Fund Index declining 0.32% over the month. Risk assets, including most global equity markets and commodities, experienced continued volatility. Equity long/short hedge funds and relative value hedge funds declined, while global macro hedge funds and event driven hedge funds posted gains for the months. Among equity long/short hedge funds, performance was most weak for fundamental growth managers. Trend-following managers continued to do well within the global macro sub-strategy. Hedge funds posted positive results overall in March 2016, with the HFRX Global Hedge Fund |
1
PORTFOLIO RESULTS
| | Index gaining 1.24% for the month. Risk assets, including most global equity markets and credit, rebounded strongly in March 2016, while the U.S. dollar weakened and global fixed income was largely flat. Equity long/short hedge funds and event driven hedge funds posted gains; macro hedge funds declined; and relative value hedge funds were basically flat for the month. After a weak start to the year, fundamental growth managers posted solid gains within the equity long/short sub-strategy. Also in a reversal to the first two months of the calendar year, trend-following managers within the global macro sub-strategy were particularly challenged in March 2016 amid the rebound in equities and reversals in currency markets. |
| | Hedge funds posted positive results overall in April 2016. The HFRX Global Hedge Fund Index gained 0.41% over the month. Risky assets experienced positive performance, with most equity markets posting modest gains and commodities rallying over the month, led by gains in energy. Fixed income yields rose, and the U.S. dollar declined slightly against global currencies amid the risk-on environment. All four major hedge fund sub-strategies were up in April 2016, with relative value hedge funds posting the strongest performance. Hedge funds were mixed in May 2016, but posted positive results overall, with the HFRX Global Hedge Fund Index gaining 0.46% for the month. Global equity markets were bolstered by the rebound in oil prices and positive economic readings among many developed markets. Commodities posted mixed performance, with gains in oil and grains offset by declines in precious and industrial metals. The U.S. Treasury yield curve flattened, and the U.S. dollar rallied relative to global currencies in anticipation of an interest rate hike in the near term. Event driven hedge funds and equity long/short hedge funds posted gains, but macro hedge funds and relative value hedge funds declined over the month. Hedge funds were mixed across sub-strategies in June 2016 and posted flat results overall, with the HFRX Global Hedge Fund Index gaining 0.20% over the month. Brexit, or the U.K. referendum on membership in the European Union, dominated market focus in June 2016, as markets built up expectations of a remain vote in the U.K. and then abruptly reversed course upon news that the leave vote had won. Equity markets were mixed across regions, with U.K. equities up for the month, while European and Japanese equities declined, and U.S. equities were flat. Yields generally declined, while gold and the U.S. dollar rallied. Event driven, macro and relative value hedge funds generally posted gains for the month, while equity long/short hedge funds declined. |
| Q | | What key factors were responsible for the Fund’s performance during the Reporting Period? |
| A | | We believe hedge funds derive a large portion of their returns from exposure to sources of market risk. The Fund uses a quantitative methodology in combination with a qualitative overlay to seek to identify the Market Exposures, or sources of market risk, that approximate the return and risk patterns of specific hedge fund sub-strategies. The Fund’s quantitative methodology seeks to allocate the Fund’s exposure to each Hedge Fund Sub-Strategy such that the Fund’s investment results approximate the return and risk patterns of a diversified universe of hedge funds. During the Reporting Period, all four Hedge Fund Sub-Strategies employed by the Fund contributed positively to performance on an absolute basis. |
| | The Fund’s Relative Value Hedge Fund Sub-Strategy contributed most positively to the Fund’s performance on an absolute basis, followed by the Event Driven Hedge Fund Sub-Strategy. Within both of these Hedge Fund Sub-Strategies, long exposure to high yield credit and short exposure to put options on the S&P 500 Index contributed positively to returns. There were no significant detractors from returns within the Relative Value Hedge Fund Sub-Strategy during the Reporting Period. Within the Event Driven Hedge Fund Sub-Strategy, long exposure to European high yield credit detracted from returns. |
| | The Fund’s Macro Hedge Fund Sub-Strategy also contributed positively to the Fund’s return on an absolute basis. Long positions in the trend-following strategy and in commodities contributed most positively to returns. Within the trend-following strategy, long positions in 10-year German bunds and in 30-year U.S. Treasury bonds contributed the most to positive returns. Partially offsetting these positive contributors was long exposure to the commodities cross-market momentum strategy, which detracted from overall performance. |
| | The Fund’s Equity Long/Short Hedge Fund Sub-Strategy also contributed positively to the Fund’s absolute return during the Reporting Period. Long exposure to emerging markets equities and U.S. small cap equities contributed the most. Long positions in European and Japanese equities detracted. |
| | In addition to the asset classes mentioned above, the Fund was invested in a variety of developed and emerging market equities, short-term interest rates, developed market government bonds, currencies and commodities during the Reporting Period. |
2
PORTFOLIO RESULTS
| Q | | How did the Fund use derivatives and similar instruments during the Reporting Period? |
| A | | The Fund used exchange-traded index futures contracts to gain exposure to U.S. large-cap and small-cap equities, non-U.S. developed market equities including those in Europe, the U.K. and Japan, commodities, government bonds and short-term interest rates. The Fund used currency forward contracts to gain exposure to select developed and emerging market currencies of non-U.S. developed markets. The Fund trades exchange-traded securities and over-the-counter total return swaps to gain exposure to U.S. large-cap and small-cap equities. The Fund used total return swaps to get exposure to commodity indices. The Fund had used a total return swap to gain exposure to a basket of single-name stocks to which hedge funds had large investments according to 13F filings with the Securities and Exchange Commission (“SEC”). However, the Fund trades the individual underlying stocks outright. The Fund also used listed put options to gain exposure to U.S. large-cap equities. Lastly, the Fund used exchange-traded credit default swaps to gain exposure to North American high yield credit markets. Overall, the use of derivatives had a positive impact on the Fund’s performance during the Reporting Period. |
| Q | | Were there any changes made in the Fund’s investment strategy during the Reporting Period? |
| A | | During the Reporting Period, we enhanced the Event Driven Sub-Strategy employed by the Fund by adding exposures to European high yield credit and North American bank loans in an effort to more closely match the performance of the HFRX Event Driven Index. |
| Q | | How was the Fund positioned at the end of the Reporting Period? |
| A | | At the end of the Reporting Period, the Fund had a 47% allocation to the Equity Long/Short Hedge Fund Sub-Strategy, 23% to the Macro Hedge Fund Sub-Strategy, 20% to the Relative Value Hedge Fund Sub-Strategy and 10% to the Event Driven Hedge Fund Sub-Strategy. |
| Q | | Were there any changes to the Fund’s portfolio management team during the Reporting Period? |
| A | | In April 2016, Stephan Kessler was named a portfolio manager of the Fund. Stephan is head of research for the Alternative Investment Strategies team within Goldman Sachs Asset Management’s QIS platform and has been involved with the research effort for the Fund since he joined the firm in 2010. |
| Q | | What is the Fund’s tactical view and strategy going forward? |
| A | | In the coming months, we intend to remain focused on the Fund’s investment objective of seeking to deliver long-term total return consistent with investment results that approximate the return and risk patterns of a diversified universe of hedge funds. We understand that the hedge fund industry is dynamic, and to keep pace, we seek to understand trends in the hedge fund industry by digesting information from a number of sources, including hedge fund return databases, prime brokerage reports, hedge fund consultants, regulatory filings and other public sources. Additionally, we emphasize ongoing research and continued process and model enhancement, which we can implement through our scalable, robust technological platform. |
3
FUND BASICS
Absolute Return Tracker Fund
as of June 30, 2016
| | | | | | | | | | |
| | PERFORMANCE REVIEW | |
| | | January 1, 2016–June 30, 2016 | | Fund Total Return
(based on NAV)1 | | | HFRX Global
Hedge Fund Index2 | |
| | Class A | | | 1.04 | % | | | -0.83 | % |
| | Class C | | | 0.61 | | | | -0.83 | |
| | Institutional | | | 1.24 | | | | -0.83 | |
| | Class IR | | | 1.25 | | | | -0.83 | |
| | Class R | | | 0.94 | | | | -0.83 | |
| | | Class R6 | | | 1.24 | | | | -0.83 | |
| | 1 | | The net asset value (“NAV”) represents the net assets of the class of the Fund (ex-dividend) divided by the total number of shares of the class outstanding. The Fund’s performance reflects the reinvestment of dividends and other distributions. The Fund’s performance does not reflect the deduction of any applicable sales charges. |
| | 2 | | The HFRX Global Hedge Fund Index is designed to be representative of the overall composition of the hedge fund universe. It is comprised of all eligible hedge fund strategies, including but not limited to convertible arbitrage, distressed securities, equity hedge, equity market neutral, event driven, macro, merger arbitrage, and relative value arbitrage. The strategies are asset weighted based on the distribution of assets in the hedge fund industry. The index is investable through products managed by HFR Asset Management, LLC that track HFRX Indices. The HFRX Global Hedge Fund Index is a trademark of HFR. HFR has not participated in the formation of the Fund. HFR does not endorse or approve the Fund or make any recommendation with respect to investing in the Fund. |
| | | | | | | | | | | | | | | | |
| | STANDARDIZED TOTAL RETURNS3 |
| | | For the period ended 6/30/16 | | One Year | | | Five Years | | | Since Inception | | | Inception Date |
| | Class A | | | -7.57 | % | | | 0.22 | % | | | -0.68 | % | | 5/30/08 |
| | Class C | | | -3.91 | | | | 0.60 | | | | -0.73 | | | 5/30/08 |
| | Institutional | | | -1.91 | | | | 1.74 | | | | 0.41 | | | 5/30/08 |
| | Class IR | | | -1.97 | | | | 1.61 | | | | 0.27 | | | 5/30/08 |
| | Class R | | | -2.45 | | | | 1.11 | | | | -0.23 | | | 5/30/08 |
| | | Class R6 | | | N/A | | | | N/A | | | | -1.78 | | | 7/31/15 |
| | 3 | | The Standardized Total Returns are average annual or cumulative total returns (only if the performance period is one year or less) as of the most recent calendar quarter-end. They assume reinvestment of all distributions at NAV. These returns reflect a maximum initial sales charge of 5.5% for Class A Shares, and the assumed contingent deferred sales charge for Class C Shares (1% if redeemed within 12 months of purchase). Because Institutional, Class IR, Class R and Class R6 Shares do not involve a sales charge, such a charge is not applied to their Standardized Total Returns. |
The returns set forth in the tables above represent past performance. Past performance does not guarantee future results. The Fund’s investment return and principal value will fluctuate so that an investor’s shares, when redeemed, may be worth more or less than their original cost. Current performance may be lower or higher than the performance quoted above. Please visit our web site at www.GSAMFUNDS.com to obtain the most recent month-end returns. Performance reflects applicable fee waivers and/or expense limitations in effect during the periods shown. In their absence, performance would be reduced. Returns do not reflect the deduction of taxes that a shareholder would pay on Fund distributions or the redemption of Fund shares.
4
FUND BASICS
| | | | | | | | | | |
| | EXPENSE RATIOS4 | |
| | | | | Net Expense Ratio (Current) | | | Gross Expense Ratio (Before Waivers) | |
| | Class A | | | 1.17 | % | | | 1.71 | % |
| | Class C | | | 1.92 | | | | 2.46 | |
| | Institutional | | | 0.77 | | | | 1.31 | |
| | Class IR | | | 0.92 | | | | 1.46 | |
| | Class R | | | 1.42 | | | | 1.96 | |
| | | Class R6 | | | 0.75 | | | | 1.29 | |
| | 4 | | The expense ratios of the Fund, both current (net of applicable fee waivers and/or expense limitations) and before waivers (gross of applicable fee waivers and/or expense limitations) are as set forth above according to the most recent publicly available Prospectus for the Fund and may differ from the expense ratios disclosed in the Financial Highlights in this report. Pursuant to a contractual arrangement, the Fund’s waivers and/or expense limitations will remain in place through at least April 29, 2017, and prior to such date the Investment Adviser may not terminate the arrangements without the approval of the Fund’s Board of Trustees. If these arrangements are discontinued in the future, the expense ratios may change without shareholder approval. |
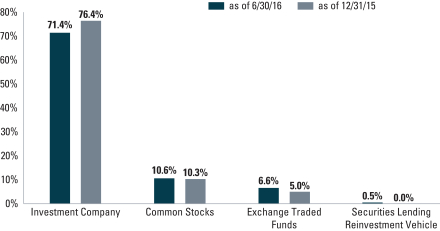
| | 5 | | The percentage shown for each investment category reflects the value of investments in that category as a percentage of net assets. Figures in the above graph may not sum to 100% due to the exclusion of other assets and liabilities. Underlying sector allocations of exchange traded funds and investment companies held by the Fund are not reflected in the graph above. Consequently, the Fund’s overall sector allocations may differ from the percentages contained in the graph above. The above graph depicts the Fund’s investments but may not represent the Fund’s market exposure due to the exclusion of certain derivatives, if any, as listed in the Additional Investment Information Section of the Schedule of Investments. |
5
GOLDMAN SACHS COMMODITY STRATEGY FUND
What Differentiates the Goldman Sachs
Commodity Investment Process?
At Goldman Sachs Asset Management, L.P. (“GSAM”), the goal of our commodity investment process is to provide consistent, strong performance by actively managing our portfolios within a research-intensive, risk-managed framework.
Goldman Sachs’ Commodity Investment Process
Our commodity investment process emphasizes the importance of both short-term, tactical opportunities and long-term investment views. Our team-based approach to managing the Fund ensures continuity and idea sharing among some of the industry’s most experienced fixed income specialists. We pursue strong, consistent performance across commodity markets through:

The Goldman Sachs Commodity Strategy Fund primarily gains exposure to the performance of the commodity markets through investment in a wholly-owned subsidiary of the Fund organized as a company under the laws of the Cayman Islands (the “Subsidiary”). The Subsidiary invests primarily in commodity-linked swaps (which may include total return swaps), as well as other commodity-linked securities and derivative instruments that provide exposure to the performance of the commodities markets, and in fixed income and debt instruments. The Fund’s portfolio is designed to provide exposure that corresponds to the investment return of assets that trade in the commodity markets without direct investment in physical commodities.
The Fund implements enhanced cash strategies that capitalize on GSAM’s global fixed income expertise. The Fixed Income Team will employ the full spectrum of capabilities offered, including bottom-up strategies (credit, mortgages, governments /municipals, high yield, and emerging markets debt) and top-down strategies (duration, cross-sector, currency and country) in an attempt to enhance the return of the Fund.

A Commodity Fund that:
| n | | Provides exposure to the commodity markets without direct investment in physical commodities |
| n | | Utilizes commodity-linked swaps that provide economic exposure to movements in commodity prices |
6
PORTFOLIO RESULTS
Goldman Sachs Commodity Strategy Fund
Investment Objective
The Fund seeks long-term total return.
Portfolio Management Discussion and Analysis
Below, the Goldman Sachs Commodities Team discusses the Goldman Sachs Commodity Strategy Fund’s (the
“Fund”) performance and positioning for the six-month period ended June 30, 2016 (the “Reporting Period”).
| Q | | How did the Fund perform during the Reporting Period? |
| A | | During the Reporting Period, the Fund’s Class A, C, Institutional, IR, R and R6 Shares generated cumulative total returns, without sales charges, of 10.19%, 9.76%, 10.44%, 10.31%, 10.05% and 10.35%, respectively. These returns compare to the 9.86% cumulative total return of the Fund’s benchmark, the S&P GSCI® Total Return Index (Gross, USD, Unhedged, formerly the Goldman Sachs Commodity Index) (the “S&P GSCI®”), during the same period. |
| Q | | What economic and market factors most influenced the commodities markets as a whole during the Reporting Period? |
| A | | Commodities markets, as measured by the S&P GSCI®, experienced a strong rebound during the Reporting Period from the challenges it faced during calendar year 2015. By comparison to the S&P GSCI® return of 9.86% for the Reporting Period, the S&P 500® Index and the U.S. Dollar Index (“DXY”) returned 3.84% and -2.52%, respectively.1 |
| | | We believe the rebound in the commodities markets during the Reporting Period can be attributed to several macro factors. First, the language of the Federal Reserve (the “Fed”) turned dovish to start 2016. (Dovish language tends to suggest lower interest rates.) At the end of 2015, most market participants expected the Fed to announce between three to four interest rate hikes in 2016. However, as the new calendar year began, market conditions and Fed posturing led many to believe that the likelihood of that many hikes was greatly reduced. This weakened the U.S. dollar and supported commodity prices across the sectors, particularly |
| | 1The | | S&P 500® Index is the Standard & Poor’s 500 Composite Index of 500 stocks, an unmanaged index of common stock prices. The DXY is a measure of the general international value of the U.S. dollar as calculated by averaging the exchange rates between the U.S. dollar and six major world currencies. |
| | prices of gold but also those of industrial metals. Second, unplanned production outages supported the oil markets. Nigeria and Canada both had large unplanned production outages during the Reporting Period, which supported oil prices. Nigerian outages were caused by infrastructure attacks by local militant groups, and the Canadian outages were caused by wildfires that temporarily shut down production. Third, the U.K. referendum on membership in the European Union, popularly known as Brexit, had a significant impact across financial markets. Specific to the commodity markets, its largest effect was on gold prices. The uncertainty in advance of the referendum and then the surprise vote to leave the European Union was supportive for gold prices, as investors looked for what are widely considered safe haven assets. Fourth, negative interest rates in many countries across the globe were an incentive for investors to look to add gold to their investment portfolios. Finally, within the agriculture subsector, soybeans performed especially well, with prices surging due primarily to rains in Argentina. A significant amount of soybean crop was destroyed from heavy rains, which tightened up global balances for soybeans. The amount of soybeans impacted by the rains was not as large as originally expected, but was still a bullish factor with which the market had to contend. |
| Q | | Which commodity subsectors were strongest during the Reporting Period? |
| A | | The precious metals and energy subsectors were the strongest performers during the Reporting Period. |
| | | The precious metals subsector of the S&P GSCI® returned 25.4% during the Reporting Period. Gold performed well based on the dovish shift by the Fed and the weaker U.S. dollar to start 2016. Additionally, the U.K. Brexit referendum and the flight to what are widely considered safe haven assets were additional boosts to the Fund’s performance later in the Reporting Period. |
7
PORTFOLIO RESULTS
| | | The energy component of the S&P GSCI® was also strong, returning 11.7% during the Reporting Period. Crude oil was up given the weaker U.S. dollar to start the year and given the unplanned outages but gave up some of those gains as the outages subsided and macro concerns following the U.K. referendum heightened. |
| Q | | Which commodity subsectors were weakest during the Reporting Period? |
| A | | Industrial metals and agriculture posted positive returns but lagged the broad S&P GSCI® during the Reporting Period. |
| | | The industrial metals subsector, as measured by the S&P GSCI® Industrial Metals Index, returned 7.3% for the Reporting Period overall. Zinc was the best performer within the subsector, supported by better supply and demand balances. Other base metals, such as copper and lead, were basically flat during the Reporting Period. We believe that this was due to concerns about subsiding demand from China, the largest consumer of industrial metals, amidst its slowing economy. |
| | | Agriculture was also up, with the S&P GSCI® Agriculture Index gaining 6.9% for the Reporting Period. This subsector’s positive return can be attributed primarily to soybeans, which rallied given the rains in Argentina. |
| | | The only subsector to post a negative return within the S&P GSCI® during the Reporting Period was livestock, with the S&P GSCI® Livestock Index declining 3.4%, given challenges within the cattle industry. |
| Q | | What key factors were responsible for the Fund’s performance during the Reporting Period? |
| A | | The Fund generated returns that generally outperformed the S&P GSCI® during the Reporting Period. The Fund extensively employed deferred positioning along the futures curves across the commodities markets in the first half of 2016. Our enhanced roll-timing strategies via exposure to commodity index-linked swaps contributed positively to returns during the Reporting Period. Our enhanced cash management strategy also added value during the Reporting Period. |
| Q | | How did the Fund’s enhanced roll-timing strategies impact performance during the Reporting Period? |
| A | | Our enhanced roll-timing strategies contributed positively to the Fund’s performance via exposure to commodity index-linked swaps. We employ an approach whereby we do not take active views on individual commodities but rather gain Fund exposure to commodities through investments whose performance is linked to commodity indices. |
| | | We often implement commodity roll-timing strategies by deviating from the S&P GSCI® roll convention, which typically calls for rolling forward exposure at the front, or near-month, end of the futures curve on a monthly basis. The roll occurs during business days 5 through 9. To the extent our team believes fundamental or technical developments will impact the futures roll-timing decision, we will incorporate those views into the portfolio by electing to roll positions earlier, later, forward or in different weights versus the S&P GSCI® roll. Roll-timing strategies employed may include 1) alternative roll date modifications, which avoid the market impact of plain vanilla S&P GSCI® rolls during business days 5 to 9; 2) forward exposure roll modifications, which avoid the market impact of plain vanilla S&P GSCI® rolls and move exposure out the curve to mitigate the returns impact often associated with persistent contango; and 3) seasonal roll modifications, which take advantage of seasonal relationships in commodity markets to increase returns. During most of the Reporting Period, we employed a forward roll-timing strategy that rolled commodity exposures underlying the S&P GSCI® a few months out on the futures curve instead of rolling at the very front of the futures curve. |
| | | The Fund’s performance was driven by its deferred positioning along the futures curve within energy, particularly on the West Texas Intermediate (“WTI”) crude oil and natural gas curves during the first quarter of 2016. The S&P GSCI®’s front month exposures, generally more sensitive to storage constraints, underperformed the Fund’s deferred exposures. Crude oil inventories remained quite elevated as the global surplus persisted. Global production remained elevated, and Iranian exports began to come to market. Additionally, U.S. shale production declines were slower than expected. U.S. natural gas inventories were further bolstered by strong production in the Northeast, coupled with an unusually mild start to the winter. |
8
PORTFOLIO RESULTS
| Q | | How did you implement the Fund’s enhanced cash management strategy? |
| A | | In addition to seeking value through management of the commodities portion of the Fund’s portfolio, we also attempt to add a modest amount of excess return through thoughtful management of collateral held in the Fund. The cash portion of the Fund’s portfolio is typically allocated to high-grade collateral that includes U.S. Treasury securities, agency debentures, mortgage-backed securities and short-term fixed income instruments. During the Reporting Period, we favored high quality government and agency securities for the Fund’s collateral allocation. |
| Q | | How did the Fund use derivatives and similar instruments during the Reporting Period? |
| A | | As mentioned earlier in some detail, the Fund used commodity index-linked total return swaps in implementing our enhanced roll-timing strategies in order to gain exposure to the commodities markets. In implementing our enhanced cash management strategy, the Fund used futures, interest rate swaps and forward sales contracts, which are agency mortgage-backed derivatives used in purchasing a future issuance of agency mortgage-backed securities. The use of these instrument is integral to the Fund’s investment strategy, which realized positive absolute returns during the Reporting Period. |
| Q | | Did you make any changes in the Fund’s strategy or allocations during the Reporting Period? |
| A | | The Fund continued to hold exposure to the commodities markets primarily in the form of swaps linked to the S&P GSCI®. During the Reporting Period, we shifted from being partially deferred six months forward across all commodities held in the S&P GSCI® to being fully deferred one month out across the S&P GSCI® commodities universe. |
| Q | | How was the Fund positioned at the end of the Reporting Period? |
| A | | At the end of the Reporting Period, the Fund was positioned one month forward across the stack of commodities curves. The Fund held exposure to the commodities underlying the S&P GSCI® through customized swaps in the Subsidiary. (The Subsidiary has the same objective as the Fund but unlike the Fund may invest without limitation in commodity index-linked securities, such as swaps and futures that provide exposure to the performance of the commodity markets.) |
| | | The cash portion of the Fund’s portfolio was allocated across various fixed income sectors, with an emphasis on the higher quality, lower volatility segments of the market, such as U.S. government and government-sponsored bonds. |
| Q | | Were there any changes to the Fund’s portfolio management team during the Reporting Period? |
| A | | There were no changes to the Fund’s portfolio management team during the Reporting Period. |
| Q | | What is the Fund’s view and strategy going forward? |
| A | | At the end of the Reporting Period, we were closely monitoring all commodities markets, but especially the oil markets. We believe oil is in a transitory phase moving from surplus to deficit, as driven primarily by reduced production in the U.S. In our view, this scenario could lead to higher oil prices during the second half of 2016. Also of particular interest to us at the end of the Reporting Period was the agriculture market. We believe soybeans are likely to trade lower as we get closer to harvest time this fall. There have been some warmer temperatures to start the summer and strong forecasted export data, which together have supported soybean prices. However, toward the end of the Reporting Period, the planted acreage showed increases, which we believe could increase supply at harvest time. |
| | | Irrespective of directionality, we believe the market will continue to hold opportunities for the active, relative value investor, especially amid a heightened volatility regime. Historically, volatility moves prices away from fundamentals and affords opportunities to the active investor. |
9
FUND BASICS
Commodity Strategy Fund
as of June 30, 2016
| | | | | | | | | | |
| | PERFORMANCE REVIEW | |
| | | January 1, 2016–June 30, 2016 | | Fund Total Return
(based on NAV)1 | | | S&P GSCI®2 | |
| | Class A | | | 10.19 | % | | | 9.86 | % |
| | Class C | | | 9.76 | | | | 9.86 | |
| | Institutional | | | 10.44 | | | | 9.86 | |
| | Class IR | | | 10.31 | | | | 9.86 | |
| | Class R | | | 10.05 | | | | 9.86 | |
| | | Class R6 | | | 10.35 | | | | 9.86 | |
| | 1 | | The net asset value (“NAV”) represents the net assets of the class of the Fund (ex-dividend) divided by the total number of shares of the class outstanding. The Fund’s performance reflects the reinvestment of dividends and other distributions. The Fund’s performance does not reflect the deduction of any applicable sales charges. |
| | 2 | | The S&P GSCI® is an unmanaged composite index of commodity sector returns, representing an unleveraged, long-only investment in commodity futures that is broadly diversified across the spectrum of commodities. Individual components qualify for inclusion in the S&P GSCI® on the basis of liquidity and are weighted by their respective world production quantities. The figures for the S&P GSCI® do not include any deduction for fees, expenses or taxes. It is not possible to invest directly in an index. |
| | | | | | | | | | | | | | | | |
| | STANDARDIZED TOTAL RETURNS3 |
| | | For the period ended 6/30/16 | | One Year | | | Five Years | | | Since Inception | | | Inception Date |
| | Class A | | | -27.93 | % | | | -14.87 | % | | | -10.00 | % | | 3/30/07 |
| | Class C | | | -25.20 | | | | -14.69 | | | | -10.23 | | | 3/30/07 |
| | Institutional | | | -24.41 | | | | -13.82 | | | | -9.29 | | | 3/30/07 |
| | Class IR | | | -24.23 | | | | -13.84 | | | | -11.68 | | | 11/30/07 |
| | Class R | | | -24.91 | | | | -14.33 | | | | -12.17 | | | 11/30/07 |
| | | Class R6 | | | N/A | | | | N/A | | | | -13.08 | | | 7/31/15 |
| | 3 | | The Standardized Total Returns are average annual or cumulative total returns (only if the performance period is one year or less) as of the most recent calendar quarter-end. They assume reinvestment of all distributions at NAV. These returns reflect a maximum initial sales charge of 4.5% for Class A Shares and the assumed contingent deferred sales charge for Class C Shares (1% if redeemed within 12 months of purchase). Because Institutional, Class IR, Class R and Class R6 Shares do not involve a sales charge, such a charge is not applied to their Standardized Total Returns. |
The returns set forth in the tables above represent past performance. Past performance does not guarantee future results. The Fund’s investment return and principal value will fluctuate so that an investor’s shares, when redeemed, may be worth more or less than their original cost. Current performance may be lower or higher than the performance quoted above. Please visit our web site at www.GSAMFUNDS.com to obtain the most recent month-end returns. Performance reflects applicable fee waivers and/or expense limitations in effect during the periods shown. In their absence, performance would be reduced. Returns do not reflect the deduction of taxes that a shareholder would pay on Fund distributions or the redemption of Fund shares.
10
FUND BASICS
| | | | | | | | | | |
| | EXPENSE RATIOS4 | |
| | | | | Net Expense Ratio (Current) | | | Gross Expense Ratio (Before Waivers) | |
| | Class A | | | 0.96 | % | | | 1.10 | % |
| | Class C | | | 1.71 | | | | 1.85 | |
| | Institutional | | | 0.62 | | | | 0.76 | |
| | Class IR | | | 0.71 | | | | 0.85 | |
| | Class R | | | 1.21 | | | | 1.36 | |
| | | Class R6 | | | 0.60 | | | | 0.74 | |
| | 4 | | The expense ratios of the Fund, both current (net of applicable fee waivers and/or expense limitations) and before waivers (gross of applicable fee waivers and/or expense limitations) are as set forth above according to the most recent publicly available Prospectus for the Fund and may differ from the expense ratios disclosed in the Financial Highlights in this report. Pursuant to a contractual arrangement, the Fund’s waivers and/or expense limitations will remain in place through at least April 29, 2017, and prior to such date the Investment Adviser may not terminate the arrangements without the approval of the Fund’s Board of Trustees. If these arrangements are discontinued in the future, the expense ratios may change without shareholder approval. |
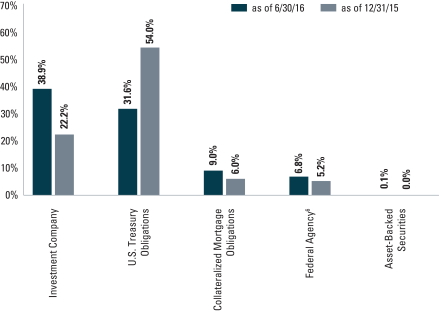
| | 5 | | The percentage shown for each investment category reflects the value of investments in that category as a percentage of net assets. Figures in the above graph may not sum to 100% due to the exclusion of other assets and liabilities. Underlying sector allocations of exchange traded funds and investment companies held by the Fund are not reflected in the graph above. Consequently, the Fund’s overall sector allocations may differ from the percentages contained in the graph above. The above graph depicts the Fund’s investments but may not represent the Fund’s market exposure due to the exclusion of certain derivatives, if any, as listed in the Additional Investment Information Section of the Schedule of Investments. |
| | 6 | | “Federal Agencies” are mortgage-backed securities guaranteed by the Government National Mortgage Association (“GNMA”), Federal National Mortgage Association (“FNMA”) or Federal Home Loan Mortgage Corp. (“FHLMC”). GNMA instruments are backed by the full faith and credit of the United States Government. |
11
PORTFOLIO RESULTS
Goldman Sachs Dynamic Allocation Fund
Investment Objective
The Fund seeks long-term capital appreciation.
Portfolio Management Discussion and Analysis
Below, the Goldman Sachs Quantitative Investment Strategies (“QIS”) Team discusses the Goldman Sachs Dynamic Allocation Fund’s (the “Fund”) performance and positioning for the six-month period ended June 30, 2016 (the “Reporting Period”).
| Q | | How did the Fund perform during the Reporting Period? |
| A | | During the Reporting Period, the Fund’s Class A, C, Institutional, IR, R and R6 Shares generated cumulative total returns, without sales charges, of 0.85%, 0.44%, 1.05%, 0.95%, 0.75% and 1.05%, respectively. These returns compare to the 0.20% cumulative total return of the Fund’s benchmark, the Bank of America Merrill Lynch USD LIBOR One-Month Constant Maturity Index (the “LIBOR One-Month Index”). The Dynamic Allocation Fund Composite Index, composed 60% of the MSCI All Country World Index Investable Market Index (net, USD, unhedged) (“MSCI ACWI IMI”) and 40% of the Barclays Global Aggregate Bond Index (gross, USD, hedged) (“Barclays Bond Index”), returned 3.28% during the same period. The MSCI ACWI IMI and Barclays Bond Index posted cumulative total returns of 1.36% and 5.87%, respectively, during the same period. |
| | The Fund’s overall annualized volatility was 10.07% during the Reporting Period. To compare, the overall annualized volatility of the S&P® 500 Index during the same time period was 15.84%. |
| Q | | What were the primary contributors to and detractors from the Fund’s performance based on your team’s asset allocation decisions during the Reporting Period? |
| A | | The Fund seeks to achieve its investment objective by investing primarily in exchange-traded funds (“ETFs”), futures, swaps and other derivatives that provide exposure to a broad spectrum of asset classes, including but not limited to equities (both in U.S. and non-U.S. companies), fixed income (U.S. and non-U.S., investment grade and high yield) and commodities. Our team manages the Fund dynamically by changing its allocations to these asset classes based on our tactical views and in response to changing market conditions. Our team uses a disciplined, rigorous and quantitative approach, in combination with a qualitative overlay, in allocation to and within the asset classes in which the Fund invests. Allocations are adjusted within the Fund at least monthly based on continuous analysis to help determine which investments are relatively attractive and provide the best opportunities for growth in any given period of time. Since the markets represented by each investment are constantly changing, so are the Fund’s allocations. |
| | Overall, the Fund realized positive returns during the Reporting Period. Allocations to U.S. fixed income, U.S. equities, mortgage real estate investment trusts (“REITs”), U.K. equities, U.K. fixed income and U.S. high yield credit contributed most positively to the Fund’s performance. These positive contributors were partially offset by allocations to Japanese equities, Italian equities, German equities, Dutch equities, French equities, Spanish equities and commodities (specifically, petroleum), which detracted most from performance, as these asset classes performed weakly during the Reporting Period. |
| Q | | How did the Goldman Sachs Market Sentiment Indicator factor into risk allocation decisions that were made during the Reporting Period? |
| A | | The Goldman Sachs Market Sentiment Indicator (“MSI”) is a proprietary tool that analyzes how the markets will potentially respond to future global changes in financial, |
12
PORTFOLIO RESULTS
| | economic and sociopolitical events. With the help of the MSI, the Fund seeks to mitigate risk in unstable markets by reducing volatility. |
| | In late June 2016, volatility in global markets spiked following an unexpected vote by the U.K. to exit the European Union, popularly known as Brexit. The MSI detected heightened levels of overall market distress, leading us to de-risk the Fund in late June. |
| Q | | How did the Fund use derivatives and similar instruments during the Reporting Period? |
| A | | The Fund invested in futures and total return swaps to achieve exposure to equities (both in U.S. and non-U.S. companies), and the Fund used futures, interest rate swaps, currency forwards and credit default and credit default swaps to achieve exposure to fixed income (U.S. and non-U.S., investment grade and high yield) during the Reporting Period. The Fund also used futures, total return swaps and commodity index-linked structured notes to gain exposure to commodities. The use of these instruments is integral to the Fund’s investment strategy, which realized positive absolute returns during the Reporting Period. |
| Q | | What changes did you make within the Fund during the Reporting Period? |
| A | | During the Reporting Period, the Fund adjusted its exposure to asset classes as market conditions shifted. Indeed, the Fund increased its exposure to asset classes in January 2016, decreased its exposure in February 2016, increased its exposure in March and April 2016, and decreased its exposure in May and June 2016. In particular, as mentioned earlier, the MSI spiked in late June 2016 and prompted an intra-month rebalance wherein the Fund reduced exposure to risky assets overall. The change in the Fund’s exposure during the Reporting Period was rather evenly allocated amongst U.S. equities, non-U.S. equities, fixed income and credit. On the other hand, exposure to Treasury inflation protected securities (“TIPS”) stayed relatively stable throughout the Reporting Period, and exposure to commodities increased steadily, albeit at a modest rate. |
| | In terms of its allocations at the beginning of the Reporting Period, the Fund had 40.7% of its total net assets invested in equity-related investments; 16.9% of its total net assets invested in fixed income investments; 14.6% of its total net assets invested in credit-related investments; 0.4% of its total net assets invested in commodity-related investments; and 4.9% of its total net assets invested in TIPS-related investments. The Fund did not have any of its total net assets invested in cash or cash equivalents as part of its strategic allocations at the beginning of the Reporting Period. However, the Fund maintained a position in cash and cash equivalents to cover the exposure of various derivative positions. The above sector breakout is inclusive of derivative exposure across all asset classes. |
| Q | | Were there any changes to the Fund’s portfolio management team during the Reporting Period? |
| A | | There were no changes to the Fund’s portfolio management team during the Reporting Period. |
| Q | | What is the Fund’s asset allocation view and strategy for the months ahead? |
| A | | At the end of June 2016, the Fund held the majority of its exposure in fixed income and global equities and held minimal exposure across credit and commodities. Going forward, we believe the Fund’s asset allocations are likely to remain fairly similar, absent major dislocations in the markets. |
| | We continue to believe the Fund’s dynamic allocation approach is important because it can adapt to changing markets, seeking what we believe are the best opportunities for investment and attempting to mitigate risk when the markets become unstable. There is no guarantee that the Fund’s dynamic management strategy will cause it to achieve its investment objective. |
13
FUND BASICS
Dynamic Allocation Fund
as of June 30, 2016
| | | | | | | | | | | | | | | | | | | | | | |
| | PERFORMANCE REVIEW | |
| | | January 1, 2016–
June 30, 2016 | | Fund Total
Return
(based on NAV)1 | | | BofA Merrill Lynch
USD LIBOR
One-Month
Constant
Maturity Index2 | | | Dynamic
Allocation Fund
Composite
Index5 | | | MSCI All
Country
World Index
Investable
Market Index3 | | | Barclays
Global
Aggregate
Bond Index4 | |
| | Class A | | | 0.85 | % | | | 0.20 | % | | | 3.28 | % | | | 1.36 | % | | | 5.87 | % |
| | Class C | | | 0.44 | | | | 0.20 | | | | 3.28 | | | | 1.36 | | | | 5.87 | |
| | Institutional | | | 1.05 | | | | 0.20 | | | | 3.28 | | | | 1.36 | | | | 5.87 | |
| | Class IR | | | 0.95 | | | | 0.20 | | | | 3.28 | | | | 1.36 | | | | 5.87 | |
| | Class R | | | 0.75 | | | | 0.20 | | | | 3.28 | | | | 1.36 | | | | 5.87 | |
| | | Class R6 | | | 1.05 | | | | 0.20 | | | | 3.28 | | | | 1.36 | | | | 5.87 | |
| | 1 | | The net asset value (“NAV”) represents the net assets of the class of the Fund (ex-dividend) divided by the total number of shares of the class outstanding. The Fund’s performance reflects the reinvestment of dividends and other distributions. The Fund’s performance does not reflect the deduction of any applicable sales charges. |
| | 2 | | The Bank of America Merrill Lynch USD LIBOR One-Month Constant Maturity Index tracks the performance of a synthetic asset paying Libor to a stated maturity. The Index is based on the assumed purchase at par of a synthetic instrument having exactly its stated maturity and with a coupon equal to that day’s fixing rate. That issue is assumed to be sold the following business day (priced at a yield equal to the current day fixing rate) and rolled into a new instrument. The Index figures do not reflect any deduction for fees, expenses or taxes. It is not possible to invest directly in an index. |
| | 3 | | The MSCI All Country World Index Investable Market Index (“MSCI ACWI IMI Index”) is a free float-adjusted market capitalization weighted index that is designed to measure the equity market performance of developed and emerging markets. The MSCI ACWI IMI Index consists of 45 country indices comprising 24 developed and 21 emerging market country indices. The developed market country indices included are: Australia, Austria, Belgium, Canada, Denmark, Finland, France, Germany, Greece, Hong Kong, Ireland, Israel, Italy, Japan, Netherlands, New Zealand, Norway, Portugal, Singapore, Spain, Sweden, Switzerland, the United Kingdom and the United States. The emerging market country indices included are: Brazil, Chile, China, Colombia, Czech Republic, Egypt, Hungary, India, Indonesia, Korea, Malaysia, Mexico, Morocco, Peru, Philippines, Poland, Russia, South Africa, Taiwan, Thailand, and Turkey. The Index figures do not reflect any deduction for fees, expenses or taxes. It is not possible to invest directly in an index. |
| | 4 | | The Barclays Global Aggregate Bond Index (the “Barclays Bond Index”) provides a broad-based measure of the global investment-grade fixed income markets. The three major components of the Barclays Bond Index are the U.S. Aggregate, the Pan-European Aggregate, and the Asian-Pacific Aggregate Indices. The Barclays Bond Index also includes Eurodollar and Euro-Yen corporate bonds, Canadian government, agency and corporate securities, and USD investment grade 144A securities. The Barclays Bond Index figures do not reflect any deduction for fees, expenses or taxes. It is not possible to invest directly in an index. |
| | 5 | | The Dynamic Allocation Fund Composite Index is comprised 60% of the MSCI ACWI IMI Index and 40% of the Barclays Global Aggregate Bond Index. |
The returns set forth in the table above represent past performance. Past performance does not guarantee future results. The Fund’s investment return and principal value will fluctuate so that an investor’s shares, when redeemed, may be worth more or less than their original cost. Current performance may be lower or higher than the performance quoted above. Please visit our web site at www.GSAMFUNDS.com to obtain the most recent month-end returns. Performance reflects applicable fee waivers and/or expense limitations in effect during the periods shown. In their absence, performance would be reduced. Returns do not reflect the deduction of taxes that a shareholder would pay on Fund distributions or the redemption of Fund shares.
14
FUND BASICS
| | | | | | | | | | | | | | | | |
| | STANDARDIZED TOTAL RETURNS6 |
| | | For the period ended 6/30/16 | | One Year | | | Five Years | | | Since Inception | | | Inception Date |
| | Class A | | | -10.78 | % | | | -0.41 | % | | | 1.20 | % | | 1/5/10 |
| | Class C | | | -7.32 | | | | -0.03 | | | | 1.32 | | | 1/5/10 |
| | Institutional | | | -5.22 | | | | 1.11 | | | | 2.48 | | | 1/5/10 |
| | Class IR | | | -5.38 | | | | 0.97 | | | | 2.33 | | | 1/5/10 |
| | Class R | | | -5.82 | | | | 0.48 | | | | 1.83 | | | 1/5/10 |
| | | Class R6 | | | N/A | | | | N/A | | | | -4.49 | | | 7/31/15 |
| | 6 | | The Standardized Total Returns are average annual or cumulative total returns (only if the performance period is one year or less) as of the most recent calendar quarter-end. They assume reinvestment of all distributions at NAV. These returns reflect a maximum initial sales charge of 5.5% for Class A Shares and the assumed contingent deferred sales charge for Class C Shares (1% if redeemed within 12 months of purchase). Because Institutional, Class IR, Class R and Class R6 Shares do not involve a sales charge, such a charge is not applied to their Standardized Total Returns. |
The returns set forth in the table above represent past performance. Past performance does not guarantee future results. The Fund’s investment return and principal value will fluctuate so that an investor’s shares, when redeemed, may be worth more or less than their original cost. Current performance may be lower or higher than the performance quoted above. Please visit our web site at www.GSAMFUNDS.com to obtain the most recent month-end returns. Performance reflects applicable fee waivers and/or expense limitations in effect during the periods shown. In their absence, performance would be reduced. Returns do not reflect the deduction of taxes that a shareholder would pay on Fund distributions or the redemption of Fund shares.
| | | | | | | | | | |
| | EXPENSE RATIOS7 | |
| | | | | Net Expense Ratio (Current) | | | Gross Expense Ratio (Before Waivers) | |
| | Class A | | | 1.24 | % | | | 1.49 | % |
| | Class C | | | 1.99 | | | | 2.24 | |
| | Institutional | | | 0.84 | | | | 1.09 | |
| | Class IR | | | 0.99 | | | | 1.24 | |
| | Class R | | | 1.49 | | | | 1.71 | |
| | | Class R6 | | | 0.82 | | | | 1.07 | |
| | 7 | | The expense ratios of the Fund, both current (net of applicable fee waivers and/or expense limitations) and before waivers (gross of applicable fee waivers and/or expense limitations) are as set forth above according to the most recent publicly available Prospectus for the Fund and may differ from the expense ratios disclosed in the Financial Highlights in this report. Pursuant to a contractual arrangement, the Fund’s waivers and/or expense limitations will remain in place through at least April 29, 2017, and prior to such date the Investment Adviser may not terminate the arrangements without the approval of the Fund’s Board of Trustees. If these arrangements are discontinued in the future, the expense ratios may change without shareholder approval. |
15
FUND BASICS
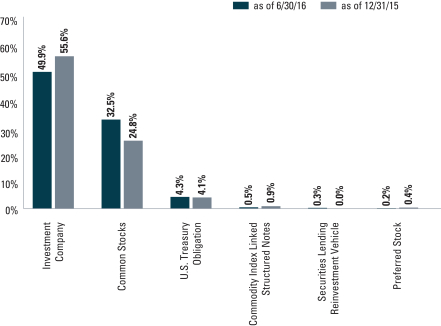
| | 8 | | The Fund is actively managed and, as such, its composition may differ over time. The percentage shown for each investment category reflects the value of investments in that category as a percentage of net assets. Figures in the above graph may not sum to 100% due to the exclusion of other assets and liabilities. Underlying sector allocations of Investment Companies held by the Fund are not reflected in the graph above. Consequently, the Fund’s overall sector allocations may differ from the percentages contained in the graph above. The above graph depicts the Fund’s investments but may not represent the Fund’s market exposure due to the exclusion of certain derivatives, if any, as listed in the Additional Investment Information section of the Schedule of Investments. |
16
PORTFOLIO RESULTS
Goldman Sachs Dynamic Commodity Strategy Fund
Investment Objective
The Fund seeks long-term total return.
Portfolio Management Discussion and Analysis
Below, the Goldman Sachs Commodities Team discusses the Goldman Sachs Dynamic Commodity Strategy Fund’s
(the “Fund”) performance and positioning for the six-month period ended June 30, 2016 (the “Reporting Period”).
| Q | | How did the Fund perform during the Reporting Period? |
| A | | During the Reporting Period, the Fund’s Class A, C, Institutional, IR and R Shares generated cumulative total returns, without sales charges, of 6.99%, 6.58%, 7.12%, 7.13% and 6.86%, respectively. These returns compare to the 13.25% cumulative total return of the Fund’s benchmark, the Bloomberg Commodity Index® Total Return (the “Commodity Index”) during the same period. |
| Q | | What economic and market factors most influenced the commodities markets as a whole during the Reporting Period? |
| A | | Commodities markets, as measured by the Commodity Index, experienced a strong rebound during the Reporting Period from the challenges it faced during calendar year 2015. By comparison to the Commodity Index return of 13.25% for the Reporting Period, the S&P 500® Index and the U.S. Dollar Index (“DXY”) returned 3.84% and -2.52%, respectively.1 |
| | We believe the rebound in the commodities markets during the Reporting Period can be attributed to several macro factors. First, the language of the Federal Reserve (the “Fed”) turned dovish to start 2016. (Dovish language tends to suggest lower interest rates.) At the end of 2015, most market participants expected the Fed to announce between three to four interest rate hikes in 2016. However, as the new calendar year began, market conditions and Fed posturing led many to believe that the likelihood of that many hikes was greatly reduced. This weakened the U.S. dollar and supported commodity prices across the sectors, particularly prices of gold but also those of industrial metals. Second, unplanned production outages supported the oil markets. Nigeria and Canada both had large unplanned production outages during the Reporting Period, which supported oil prices. Nigerian outages were caused by infrastructure attacks by local militant groups, and the Canadian outages were caused by wildfires that temporarily shut down production. Third, the U.K. referendum on membership in the European Union, popularly known as Brexit, had a significant impact across financial markets. Specific to the commodity markets, its largest effect was on gold prices. The uncertainty in advance of the referendum and then the surprise vote to leave the European Union was supportive for gold prices, as investors looked for what are widely considered safe haven assets, such as sovereign government bonds. Fourth, negative interest rates in many countries across the globe were an incentive for investors to look to add gold to their investment portfolios. Finally, within the agriculture subsector, soybeans performed especially well, with prices surging due primarily to rains in Argentina. A significant amount of soybean crop was destroyed from heavy rains, which tightened up global balances for soybeans. The amount of soybeans impacted by the rains was not as large as originally expected, but was still a bullish factor with which the market had to contend. |
| | The precious metals and agriculture subsectors were the strongest performers during the Reporting Period. Energy and industrial metals also posted positive returns, albeit to a lesser degree. |
| | The precious metals component of the Commodity Index retuned 27.1% during the Reporting Period. Gold outperformed based on the dovish shift by the Fed and weaker U.S. dollar to start 2016. Additionally, the U.K. Brexit referendum and the flight to what are widely considered safe haven assets were additional boosts to the Fund’s performance later in the Reporting Period. |
| | Agriculture was also up within the Commodity Index, gaining 13.5% for the Reporting Period. This subsector’s |
| | 1 | | The S&P 500® Index is the Standard & Poor’s 500 Composite Index of 500 stocks, an unmanaged index of common stock prices. The DXY is a measure of the general international value of the U.S. dollar as calculated by averaging the exchange rates between the U.S. dollar and six major world currencies. |
17
PORTFOLIO RESULTS
| | positive return can be attributed primarily to soybeans, which rallied given the rains in Argentina. |
| | The energy component of the Commodity Index was also positive, returning 9.1% during the Reporting Period. Crude oil was up given the weaker U.S. dollar to start the year and given the unplanned outages but gave up some of those gains as the outages subsided and macro concerns following the U.K. referendum heightened. |
| | The industrial metals subsector of the Commodity Index returned 8.5% for the Reporting Period overall. Zinc was the best performer within the subsector, supported by better supply and demand balances. Other base metals, such as copper, were basically flat during the Reporting Period. We believe that this was due to concerns about subsiding demand from China, the largest consumer of industrial metals, amidst its slowing economy. |
| | The only subsector to post a negative return within the Commodity Index during the Reporting Period was livestock, declining 0.7%, given challenges within the cattle industry. |
| Q | | What key factors were responsible for the Fund’s performance during the Reporting Period? |
| A | | The Fund is a long-only, actively managed fund that seeks to generate alpha, or added value, principally through overweight and underweight positioning in individual commodities relative to the Commodity Index. In addition, the Fund’s portfolio may be positioned on commodity curves at different nodes, or segments, from the Commodity Index. It may also include allocations to out-of-benchmark commodities, all with the intention of capturing active returns in excess of the Commodity Index. As such, we believe this strategy provides an efficient way to gain broad commodity exposure in a long-only, unlevered and actively managed portfolio by combining beta, or market, exposure with our ability to implement views on individual commodities and sectors. |
| | During the Reporting Period, the Fund posted positive absolute returns but underperformed the Commodity Index. The Fund’s underperformance was largely driven by its underweight positioning in grains, particularly in soybeans. |
| Q | | Which positions detracted significantly from the Fund’s performance during the Reporting Period? |
| A | | As mentioned, the Fund’s underweight position in grains and in particular soybeans detracted most significantly from the Fund’s performance during the Reporting Period. Generally speaking, the commodity complex rallied heading into the second quarter of 2016 due in part to a weaker U.S. dollar and increased investor interest in the asset class. Soybeans also performed well on this rally given a combination of supply, demand and technical factors. On the supply side, excessive rains in Argentina persisted through April 2016, although drying had been noted in the forecast. The main area of excess precipitation was well north of the key growing region for Argentine beans but likely impacted some of the secondary areas of acreage. Additional factors that had earlier helped to drive the bid for soybeans were the lower than expected prospective plantings by U.S. farmers and Chinese restocking of inventories. Momentum and trend-following traders also likely contributed to the performance of the soybean market during the Reporting Period. |
| Q | | Which positions contributed most positively to the Fund’s performance during the Reporting Period? |
| A | | The Fund’s underweighted exposure to natural gas contributed positively to its performance early in the Reporting Period, as strong production in the Northeast coupled with an unusually mild start to the winter helped sustain U.S. inventories at seasonally elevated levels. |
| | Also, the Fund invests a portion of its cash collateral in the Goldman Sachs Financial Square Government Fund — a subsiding demand money market portfolio that comprises U.S. government and U.S. Treasury securities, including bills, bonds, notes and repurchase agreements. |
| Q | | How did the Fund use derivatives and similar instruments during the Reporting Period? |
| A | | The Fund seeks to maintain substantial economic exposure to the performance of the commodities markets by investing in a wholly-owned subsidiary of the Fund organized as a company under the laws of the Cayman Islands (the “Subsidiary”) and in commodity index-linked notes. The Subsidiary primarily obtains its commodity exposure by investing in commodity-linked derivative instruments, including total return swaps. The Subsidiary also invests in other instruments, including fixed income securities, either as investments or to serve as margin or collateral for its swap positions. The use of these instruments is integral to the |
18
PORTFOLIO RESULTS
| | Fund’s investment strategy, which realized positive absolute returns during the Reporting Period. |
| Q | | Did you make any changes in the Fund’s strategy or allocations during the Reporting Period? |
| A | | During the Reporting Period, relative to the Commodity Index, we increased the Fund’s exposure to agriculture commodities, though we maintained an underweight position. |
| Q | | Were there any changes to the Fund’s portfolio management team during the Reporting Period? |
| A | | There were no changes to the portfolio management team during the Reporting Period. |
| Q | | How was the Fund positioned at the end of the Reporting Period? |
| A | | At the end of the Reporting Period, the Fund was underweight relative to the Commodity Index in grains, natural gas and industrial metals. |
| Q | | What is the Fund’s view and strategy going forward? |
| A | | At the end of the Reporting Period, we were closely monitoring all commodities markets, but especially the oil markets. We believe oil is in a transitory phase moving from surplus to deficit, as driven primarily by reduced production in the U.S. In our view, this scenario could lead to higher oil prices during the second half of 2016. Also of particular interest to us at the end of the Reporting Period was the agriculture market. We believe soybeans are likely to trade lower as we get closer to harvest time this fall. There have been some warmer temperatures to start the summer and strong forecasted export data, which together have supported soybean prices. However, toward the end of the Reporting Period, the planted acreage showed increases, which could increase supply at harvest time. |
| | Irrespective of directionality, we believe the market will continue to hold opportunities for the active, relative value investor, especially amid a heightened volatility regime. Historically, volatility moves prices away from fundamentals and affords opportunities to the active investor. |
19
FUND BASICS
Dynamic Commodity Strategy Fund
as of June 30, 2016
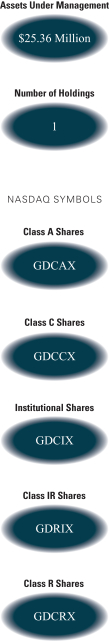
| | | | | | | | | | |
| | PERFORMANCE REVIEW | |
| | | January 1, 2016–June 30, 2016 | | Fund Total Return
(based on NAV)1 | | | Bloomberg Commodity Index
Total Return2 | |
| | Class A | | | 6.99 | % | | | 13.25 | % |
| | Class C | | | 6.58 | | | | 13.25 | |
| | Institutional | | | 7.12 | | | | 13.25 | |
| | Class IR | | | 7.13 | | | | 13.25 | |
| | | Class R | | | 6.86 | | | | 13.25 | |
| | 1 | | The net asset value (“NAV”) represents the net assets of the class of the Fund (ex-dividend) divided by the total number of shares of the class outstanding. The Fund’s performance reflects the reinvestment of dividends and other distributions. The Fund’s performance does not reflect the deduction of any applicable sales charges. |
| | 2 | | The Bloomberg Commodity Index Total Return (the “Index”) is designed to be a highly liquid and diversified benchmark for the commodity futures market. It is rules based and composed of futures contracts on physical commodities. The index is unhedged and expressed in USD. The Index is reweighted and rebalanced each year in January on a price-percentage basis. Rebalancing and reweighting means that, in general, the index may reallocate out of commodities that have appreciated in value and into commodities that have underperformed. To the extent that commodity markets exhibit mean-reverting characteristics over time, this approach may help enhance performance. |
| | | | | | | | | | | | |
| | STANDARDIZED TOTAL RETURNS3 |
| | | For the period ended 6/30/16 | | One Year | | | Since Inception | | | Inception Date |
| | Class A | | | -19.38 | % | | | -20.10 | % | | 4/30/14 |
| | Class C | | | -17.09 | | | | -19.04 | | | 4/30/14 |
| | Institutional | | | -15.39 | | | | -18.16 | | | 4/30/14 |
| | Class IR | | | -15.41 | | | | -18.22 | | | 4/30/14 |
| | | Class R | | | -15.88 | | | | -18.63 | | | 4/30/14 |
| | 3 | | The Standardized Total Returns are average annual total returns as of the most recent calendar quarter-end. They assume reinvestment of all distributions at NAV. These returns reflect a maximum initial sales charge of 4.5% for Class A Shares and the assumed contingent deferred sales charge for Class C Shares (1% if redeemed within 12 months of purchase). Because Institutional, Class IR and Class R Shares do not involve a sales charge, such a charge is not applied to their Standardized Total Returns. |
The returns set forth in the tables above represent past performance. Past performance does not guarantee future results. The Fund’s investment return and principal value will fluctuate so that an investor’s shares, when redeemed, may be worth more or less than their original cost. Current performance may be lower or higher than the performance quoted above. Please visit our web site at www.GSAMFUNDS.com to obtain the most recent month-end returns. Performance reflects applicable fee waivers and/or expense limitations in effect during the periods shown. In their absence, performance would be reduced. Returns do not reflect the deduction of taxes that a shareholder would pay on Fund distributions or the redemption of Fund shares.
20
FUND BASICS
| | | | | | | | | | |
| | EXPENSE RATIOS4 | |
| | | | | Net Expense Ratio (Current) | | | Gross Expense Ratio (Before Waivers) | |
| | Class A | | | 1.20 | % | | | 2.77 | % |
| | Class C | | | 1.95 | | | | 3.52 | |
| | Institutional | | | 0.86 | | | | 2.43 | |
| | Class IR | | | 0.95 | | | | 2.52 | |
| | | Class R | | | 1.45 | | | | 3.02 | |
| | 4 | | The expense ratios of the Fund, both current (net of applicable fee waivers and/or expense limitations) and before waivers (gross of applicable fee waivers and/or expense limitations) are as set forth above according to the most recent publicly available Prospectus for the Fund and may differ from the expense ratios disclosed in the Financial Highlights in this report. Pursuant to a contractual arrangement, the Fund’s waivers and/or expense limitations will remain in place through at least April 29, 2017, and prior to such date the Investment Adviser may not terminate the arrangements without the approval of the Fund’s Board of Trustees. If these arrangements are discontinued in the future, the expense ratios may change without shareholder approval. |
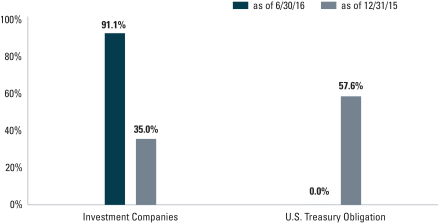
| | 5 | | The percentage shown for each investment category reflects the value of investments in that category as a percentage of net assets. Figures in the above graph may not sum to 100% due to the exclusion of other assets and liabilities. Underlying sector allocations of exchange traded funds and investment companies held by the Fund are not reflected in the graph above. Consequently, the Fund’s overall sector allocations may differ from the percentages contained in the graph above. The above graph depicts the Fund’s investments but may not represent the Fund’s market exposure due to the exclusion of certain derivatives, if any, as listed in the Additional Investment Information Section of the Schedule of Investments. |
21
PORTFOLIO RESULTS
Goldman Sachs Managed Futures Strategy Fund
Investment Objective
The Fund seeks to generate long-term absolute return.
Portfolio Management Discussion and Analysis
Below, the Goldman Sachs Quantitative Investment Strategies Team discusses the Goldman Sachs Managed
Futures Strategy Fund’s (the “Fund”) performance and positioning for the six-month period ended June 30, 2016 (the “Reporting Period”).
| Q | | How did the Fund perform during the Reporting Period? |
| A | | During the Reporting Period, the Fund’s Class A, C, Institutional, IR and R Shares generated cumulative total returns, without sales charges, of 0.69%, 0.30%, 0.77%, 0.68% and 0.49%, respectively. These returns compare to the 0.20% cumulative total return of the Fund’s benchmark, the Bank of America Merrill Lynch USD LIBOR One-Month Constant Maturity Index (the “LIBOR One-Month Index”), during the same time period. |
| | We note that the Fund’s benchmark being the LIBOR One-Month Index is a means of emphasizing that the Fund has an unconstrained strategy. That said, this Fund employs a benchmark agnostic strategy and thus comparisons to a benchmark index are not particularly relevant. |
| | The Fund’s overall annualized volatility was 9.07% during the Reporting Period, while the overall annualized volatility of the S&P® 500 Index during the same time period was 15.84%. |
| Q | | What were the primary contributors to and detractors from the Fund’s performance during the Reporting Period? |
| A | | The Fund implements a trend-following strategy that takes long and/or short positions in a wide range of asset classes, including equities, fixed income and currencies, among others, to seek long-term absolute return. The Fund seeks to achieve its investment objective by investing primarily in a portfolio of equities, equity index futures, bonds, bond futures, equity swaps, interest rate swaps, currency forwards and non-deliverable forwards, options, exchange-traded funds (“ETFs”) and structured securities. As a result of the Fund’s use of derivatives, the Fund may also hold significant amounts of U.S. Treasuries or short-term investments. The Fund’s investments are made without restriction as to issuer capitalization, country, currency, maturity or credit rating. |
| | Positive Fund performance for the Reporting Period overall can be attributed primarily to performance during January and June 2016, only partially offset by negative performance mostly concentrated in March, April and May 2016, when trend reversals occurred in many markets. |
| | During the Reporting Period, the primary positive contributors to Fund performance were long positions in developed market fixed income, with long positions in U.K. and European fixed income contributing the most to returns. Positions in short-term interest rate instruments also contributed positively to the Fund’s returns, with long positions in U.K. and Swedish short-term interest rate instruments contributing the most positively toward returns. |
| | Conversely, exposure to commodities detracted from the Fund’s returns during the Reporting Period. The Fund’s short positions in commodities during the first quarter of 2016 detracted from returns, as commodities rebounded sharply in February and March 2016. Although the Fund reversed its short positions in a broad range of commodities during the second quarter of 2016, total contribution from exposure to commodities remained negative for the Reporting Period overall, with positions in grains and industrial metals detracting most. |
22
PORTFOLIO RESULTS
| Q | | How did the Fund use derivatives and similar instruments during the Reporting Period? |
| A | | The Fund used derivatives, including futures, swaps and forwards, to implement long and short positions. The Fund invested in futures and currency forwards to achieve exposure to equities (both in U.S. and non-U.S. companies) and currencies (U.S. and non-U.S. currencies), respectively. The Fund used interest rate swaps and currency forwards to achieve exposure to fixed income. We used sector-based commodity-linked structured notes as a means of expressing momentum/trend views on various commodity assets. The use of these instruments is integral to the Fund’s investment strategy, which realized positive absolute returns during the Reporting Period. |
| Q | | What changes did you make within the Fund during the Reporting Period? |
| A | | In January 2016, the Fund was net long a broad basket of international developed market equities as well as long-term and short-term fixed income. The Fund was net short emerging market equities, developed and emerging market currencies and commodities. Due to the market reversal that took place in February 2016, during which emerging market equities and commodities rebounded, the Fund reduced its short exposure to emerging market equities, currencies and commodities in February 2016. Toward the end of March 2016, the Fund had reversed most of its positions to be net long, with the exception of commodities and some emerging market equities. |
| | Throughout the second quarter of 2016, the Fund maintained its long positions in fixed income, developed and emerging market currencies and developed equities. The Fund maintained relatively modest exposure to emerging market equities and commodities, which changed from month to month during the second quarter of 2016 due to our differing views on trends these assets exhibited. At the end of June 2016, the Fund was net long commodities for the first time in more than a year, driven by the late-month rallying trend in commodities such as crude oil and gold. |
| Q | | Were there any changes to the Fund’s portfolio management team during the Reporting Period? |
| A | | There were no changes to the Fund’s portfolio management team during the Reporting Period. |
| Q | | What is the Fund’s tactical asset allocation view and strategy for the months ahead? |
| A | | Going into the second half of 2016, we intend to continue to seek to identify price trends in various asset classes over short-, medium- and long-term horizons via a proprietary investment model. Upon identifying a trend in a given instrument or asset, the Fund will take a long or short position in the instrument or asset. Long positions benefit from an increase in price of the underlying instrument or asset, while short positions benefit from a decrease in price of the underlying instrument or asset. The size of the Fund’s position in an instrument or asset is primarily related to the strength of the overall trend identified by the investment model. |
| | We continue to believe that the Fund’s trend-following strategy is important because it seeks to adapt to changing markets, seeking what we believe are the best opportunities for investment and attempting to mitigate risk when the markets become unstable. There is no guarantee that the Fund’s trend-following strategy will cause it to achieve its investment objective. |
23
FUND BASICS
Managed Futures Strategy Fund
as of June 30, 2016
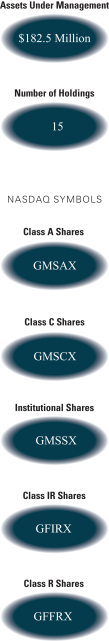
| | | | | | | | | | |
| | PERFORMANCE REVIEW | |
| | | January 1, 2016–June 30, 2016 | | Fund Total Return
(based on NAV)1 | | | BofA Merrill Lynch USD LIBOR
One-Month Constant Maturity Index2 | |
| | Class A | | | 0.69 | % | | | 0.20 | % |
| | Class C | | | 0.30 | | | | 0.20 | |
| | Institutional | | | 0.77 | | | | 0.20 | |
| | Class IR | | | 0.68 | | | | 0.20 | |
| | | Class R | | | 0.49 | | | | 0.20 | |
| | 1 | | The net asset value (“NAV”) represents the net assets of the class of the Fund (ex-dividend) divided by the total number of shares of the class outstanding. The Fund’s performance reflects the reinvestment of dividends and other distributions. The Fund’s performance does not reflect the deduction of any applicable sales charges. |
| | 2 | | The Bank of America Merrill Lynch US Dollar One-Month LIBOR Constant Maturity Index tracks the performance of a synthetic asset paying LIBOR to a stated maturity. The Index is based on the assumed purchase at par of a synthetic instrument having exactly its stated maturity and with a coupon equal to that day’s fixing rate. That issue is assumed to be sold the following business day (priced at a yield equal to the current day fixing rate) and rolled into a new instrument. The Index figures do not reflect any deduction for fees, expenses or taxes. It is not possible to invest directly in an index. |
| | | | | | | | | | | | |
| | STANDARDIZED TOTAL RETURNS3 |
| | | For the period ended 6/30/16 | | One Year | | | Since Inception | | | Inception Date |
| | Class A | | | -2.29 | % | | | 0.44 | % | | 2/29/12 |
| | Class C | | | 1.60 | | | | 0.97 | | | 2/29/12 |
| | Institutional | | | 3.76 | | | | 2.13 | | | 2/29/12 |
| | Class IR | | | 3.58 | | | | 1.98 | | | 2/29/12 |
| | | Class R | | | 3.02 | | | | 1.47 | | | 2/29/12 |
| | 3 | | The Standardized Total Returns are average annual total returns as of the most recent calendar quarter-end. They assume reinvestment of all distributions at NAV. These returns reflect a maximum initial sales charge of 5.5% for Class A Shares and the assumed contingent deferred sales charge for Class C Shares (1% if redeemed within 12 months of purchase). Because Institutional, Class IR and Class R Shares do not involve a sales charge, such a charge is not applied to their Standardized Total Returns. |
The returns set forth in the tables above represent past performance. Past performance does not guarantee future results. The Fund’s investment return and principal value will fluctuate so that an investor’s shares, when redeemed, may be worth more or less than their original cost. Current performance may be lower or higher than the performance quoted above. Please visit our web site at www.GSAMFUNDS.com to obtain the most recent month-end returns. Performance reflects applicable fee waivers and/or expense limitations in effect during the periods shown. In their absence, performance would be reduced. Returns do not reflect the deduction of taxes that a shareholder would pay on Fund distributions or the redemption of Fund shares.
24
FUND BASICS
| | | | | | | | | | |
| | EXPENSE RATIOS4 | |
| | | | | Net Expense Ratio (Current) | | | Gross Expense Ratio (Before Waivers) | |
| | Class A | | | 1.65 | % | | | 2.11 | % |
| | Class C | | | 2.40 | | | | 2.87 | |
| | Institutional | | | 1.25 | | | | 1.73 | |
| | Class IR | | | 1.40 | | | | 1.87 | |
| | | Class R | | | 1.90 | | | | 2.38 | |
| | 4 | | The expense ratios of the Fund, both current (net of applicable fee waivers and/or expense limitations) and before waivers (gross of applicable fee waivers and/or expense limitations) are as set forth above according to the most recent publicly available Prospectus for the Fund and may differ from the expense ratios disclosed in the Financial Highlights in this report. Pursuant to a contractual arrangement, the Fund’s waivers and/or expense limitations will remain in place through at least July 22, 2017, and prior to such date the Investment Adviser may not terminate the arrangements without the approval of the Fund’s Board of Trustees. If these arrangements are discontinued in the future, the expense ratios may change without shareholder approval. |
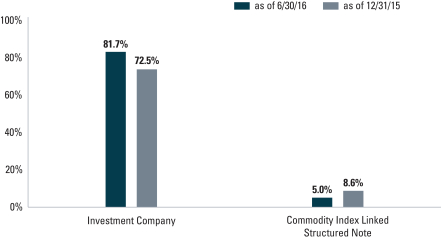
| | 5 | | The Fund is actively managed and, as such, its composition may differ over time. The percentage shown for each investment category reflects the value of investments in that category as a percentage of net assets. Figures in the above graph may not sum to 100% due to the exclusion of other assets and liabilities. Underlying sector allocations of investment companies held by the Fund, if any, are not reflected in the graph above. Consequently, the Fund’s overall sector allocations may differ from the percentages contained in the graph above. The graph depicts the Fund’s investments but may not represent the Fund’s market exposure due to the exclusion of certain derivatives, if any, as listed in the Additional Investment Information section of the Schedule of Investments. |
25
INDEX DEFINITIONS
Index Definitions:
HFRX Event Driven Index: Event Driven Managers maintain positions in companies currently or prospectively involved in corporate transactions of a wide variety including but not limited to mergers, restructurings, financial distress, tender offers, shareholder buybacks, debt exchanges, security issuance or other capital structure adjustments. Security types can range from most senior in the capital structure to most junior or subordinated, and frequently involve additional derivative securities. Event Driven exposure includes a combination of sensitivities to equity markets, credit markets and idiosyncratic, company specific developments. Investment theses are typically predicated on fundamental characteristics (as opposed to quantitative), with the realization of the thesis predicated on a specific development exogenous to the existing capital structure.*
HFRX Relative Value Arbitrage Index: Relative Value investment managers maintain positions in which the investment thesis is predicated on realization of a valuation discrepancy in the relationship between multiple securities. Managers employ a variety of fundamental and quantitative techniques to establish investment theses, and security types range broadly across equity, fixed income, derivative or other security types. Fixed income strategies are typically quantitatively driven to measure the existing relationship between instruments and, in some cases, identify attractive positions in which the risk adjusted spread between these instruments represents an attractive opportunity for the investment manager. Relative Value position may be involved in corporate transactions also, but as opposed to Event Driven exposures, the investment thesis is predicated on realization of a pricing discrepancy between related securities, as opposed to the outcome of the corporate transaction.*
HFRX Equity Hedge Index: Equity Hedge strategies maintain positions both long and short in primarily equity and equity derivative securities. A wide variety of investment processes can be employed to arrive at an investment decision, including both quantitative and fundamental techniques; strategies can be broadly diversified or narrowly focused on specific sectors and can range broadly in terms of levels of net exposure, leverage employed, holding period, concentrations of market capitalizations and valuation ranges of typical portfolios. Equity Hedge managers would typically maintain at least 50%, and may in some cases be substantially entirely invested in equities, both long and short.*
HFRX Macro/ CTA Index: Active Trading strategies utilize active trading methods, typically with high frequency position turnover or leverage; these may employ components of both Discretionary and Systematic Macro strategies. Strategies may contain distinct, identifiable sub-strategies, such as equity hedge or equity market neutral, or in some cases a number of sub-strategies are blended together without the capacity for portfolio level disaggregation. Strategies employ an investment process based on systematic, quantitative evaluation of macroeconomic variables in which the portfolio positioning is predicated on convergence of differentials between markets, not necessarily highly correlated with each other, but currently diverging from their historical levels of correlation. Strategies focus on fundamental relationships across geographic areas both inter and intra-asset classes, and typical holding periods are shorter than trend following or discretionary strategies. Active Trading strategies are distinct from other macro in that they characteristically emphasize rapid market response to new information and high volume of turnover in liquid but frequently volatile and unstable market positions.*
*Indicates index definition was sourced from Hedge Fund Research (HFR). The indexes are trademarks of HFR. HFR has not participated in the formation of the Funds. HFR does not endorse or approve the Funds or make any recommendation with respect to investing in the Funds.
S&P® 500 Index: The S&P 500 Index is the Standard & Poor’s 500 Composite Index of 500 stocks, an unmanaged index of common stock prices.
26
INDEX DEFINITIONS
S&P GSCI® Agriculture Index: The S&P GSCI® Agriculture Index, a sub-index of the S&P GSCI, provides investors with a reliable and publicly available benchmark for investment performance in the agricultural commodity markets.
S&P GSCI® Industrial Metals Index: The S&P GSCI® Industrial Metals Index provides investors with a reliable and publicly available benchmark for investment performance in the industrial metals market.
The Index figures do not include any deduction for fees, expenses or taxes. It is not possible to invest directly in an unmanaged index.
27
GOLDMAN SACHS ABSOLUTE RETURN TRACKER FUND
Consolidated Schedule of Investments
June 30, 2016 (Unaudited)
| | | | | | | | |
Shares | | | Description | | Value | |
| | Common Stocks – 10.6% | |
| | Automobiles & Components – 0.1% | |
| | 18,470 | | | General Motors Co. | | $ | 522,701 | |
| | 5,030 | | | Lear Corp. | | | 511,853 | |
| | | | | | | | |
| | | | | | | 1,034,554 | |
| | |
| | Banks – 0.5% | |
| | 23,600 | | | BB&T Corp. | | | 840,396 | |
| | 31,100 | | | Citizens Financial Group, Inc. | | | 621,378 | |
| | 21,300 | | | Comerica, Inc. | | | 876,069 | |
| | 72,400 | | | Regions Financial Corp. | | | 616,124 | |
| | 13,136 | | | SunTrust Banks, Inc. | | | 539,627 | |
| | 8,130 | | | Wells Fargo & Co. | | | 384,793 | |
| | 27,523 | | | Zions Bancorporation | | | 691,653 | |
| | | | | | | | |
| | | | | | | 4,570,040 | |
| | |
| | Capital Goods – 0.3% | |
| | 2,289 | | | 3M Co. | | | 400,849 | |
| | 4,030 | | | Danaher Corp. | | | 407,030 | |
| | 3,000 | | | Honeywell International, Inc. | | | 348,960 | |
| | 7,400 | | | Jacobs Engineering Group, Inc.* | | | 368,594 | |
| | 2,853 | | | The Boeing Co. | | | 370,519 | |
| | 11,983 | | | USG Corp.* | | | 323,062 | |
| | 5,847 | | | Wabtec Corp. | | | 410,635 | |
| | | | | | | | |
| | | | | | | 2,629,649 | |
| | |
| | Commercial & Professional Services – 0.3% | |
| | 26,946 | | | Clean Harbors, Inc.* | | | 1,404,156 | |
| | 8,900 | | | Copart, Inc.* | | | 436,189 | |
| | 13,164 | | | KAR Auction Services, Inc. | | | 549,466 | |
| | 10,662 | | | Waste Connections, Inc. | | | 768,197 | |
| | | | | | | | |
| | | | | | | 3,158,008 | |
| | |
| | Consumer Durables & Apparel – 0.1% | |
| | 15,400 | | | TopBuild Corp.* | | | 557,480 | |
| | 2,985 | | | Whirlpool Corp. | | | 497,420 | |
| | | | | | | | |
| | | | | | | 1,054,900 | |
| | |
| | Consumer Services – 0.2% | |
| | 1,100 | | | Chipotle Mexican Grill, Inc.* | | | 443,036 | |
| | 34,126 | | | H&R Block, Inc. | | | 784,898 | |
| | 3,907 | | | McDonald’s Corp. | | | 470,168 | |
| | 8,695 | | | Starbucks Corp. | | | 496,659 | |
| | | | | | | | |
| | | | | | | 2,194,761 | |
| | |
| | Diversified Financials – 0.5% | |
| | 24,689 | | | Ally Financial, Inc.* | | | 421,441 | |
| | 13,939 | | | Berkshire Hathaway, Inc. Class B* | | | 2,018,228 | |
| | 7,365 | | | Discover Financial Services | | | 394,690 | |
| | 16,172 | | | Interactive Brokers Group, Inc. Class A | | | 572,489 | |
| | 1,400 | | | Intercontinental Exchange, Inc. | | | 358,344 | |
| | 13,300 | | | OneMain Holdings, Inc.* | | | 303,506 | |
| | 3,244 | | | S&P Global, Inc. | | | 347,951 | |
| | 13,126 | | | Synchrony Financial* | | | 331,825 | |
| | 12,331 | | | Voya Financial, Inc. | | | 305,316 | |
| | | | | | | | |
| | | | | | | 5,053,790 | |
| | |
| | Common Stocks – (continued) | |
| | Energy – 0.6% | |
| | 15,500 | | | Antero Resources Corp.* | | $ | 402,690 | |
| | 34,463 | | | CONSOL Energy, Inc.* | | | 554,510 | |
| | 13,000 | | | Continental Resources, Inc.* | | | 588,510 | |
| | 11,100 | | | Devon Energy Corp. | | | 402,375 | |
| | 4,739 | | | Diamondback Energy, Inc.* | | | 432,244 | |
| | 8,900 | | | Energen Corp. | | | 429,069 | |
| | 5,575 | | | Exxon Mobil Corp. | | | 522,601 | |
| | 15,300 | | | Newfield Exploration Co.* | | | 675,954 | |
| | 9,684 | | | Noble Energy, Inc. | | | 347,365 | |
| | 11,400 | | | ONEOK, Inc. | | | 540,930 | |
| | 4,863 | | | Pioneer Natural Resources Co. | | | 735,334 | |
| | 8,900 | | | Targa Resources Corp. | | | 375,046 | |
| | 19,300 | | | The Williams Companies, Inc. | | | 417,459 | |
| | | | | | | | |
| | | | | | | 6,424,087 | |
| | |
| | Food & Staples Retailing – 0.1% | |
| | 3,200 | | | Costco Wholesale Corp. | | | 502,528 | |
| | 4,419 | | | CVS Health Corp. | | | 423,075 | |
| | 12,794 | | | Whole Foods Market, Inc. | | | 409,664 | |
| | | | | | | | |
| | | | | | | 1,335,267 | |
| | |
| | Food, Beverage & Tobacco – 0.0% | |
| | 9,374 | | | The Coca-Cola Co. | | | 424,923 | |
| | |
| | Health Care Equipment & Services – 0.6% | |
| | 9,127 | | | Alere, Inc.* | | | 380,413 | |
| | 26,392 | | | Brookdale Senior Living, Inc.* | | | 407,492 | |
| | 6,107 | | | Express Scripts Holding Co.* | | | 462,911 | |
| | 12,293 | | | HCA Holdings, Inc.* | | | 946,684 | |
| | 2,600 | | | Humana, Inc. | | | 467,688 | |
| | 2,800 | | | Laboratory Corp. of America Holdings* | | | 364,756 | |
| | 4,663 | | | McKesson Corp. | | | 870,349 | |
| | 5,700 | | | Medtronic PLC | | | 494,589 | |
| | 9,700 | | | Patterson Companies, Inc. | | | 464,533 | |
| | 11,550 | | | Quest Diagnostics, Inc. | | | 940,286 | |
| | | | | | | | |
| | | | | | | 5,799,701 | |
| | |
| | Household & Personal Products – 0.2% | |
| | 21,500 | | | Herbalife Ltd.* | | | 1,258,395 | |
| | 3,100 | | | Spectrum Brands Holdings, Inc. | | | 369,861 | |
| | | | | | | | |
| | | | | | | 1,628,256 | |
| | |
| | Insurance – 0.1% | |
| | 11,391 | | | American International Group, Inc. | | | 602,470 | |
| | 10,200 | | | FNF Group | | | 382,500 | |
| | 12,940 | | | MetLife, Inc. | | | 515,400 | |
| | | | | | | | |
| | | | | | | 1,500,370 | |
| | |
| | Materials – 0.5% | |
| | 5,500 | | | Celanese Corp. Series A | | | 359,975 | |
| | 12,022 | | | CF Industries Holdings, Inc. | | | 289,730 | |
| | 15,400 | | | Eagle Materials, Inc. | | | 1,188,110 | |
| | 8,100 | | | FMC Corp. | | | 375,111 | |
| | 45,792 | | | Owens-Illinois, Inc.* | | | 824,714 | |
| | 8,809 | | | Royal Gold, Inc. | | | 634,424 | |
| | |
| | |
| 28 | | The accompanying notes are an integral part of these financial statements. |
GOLDMAN SACHS ABSOLUTE RETURN TRACKER FUND
| | | | | | | | |
Shares | | | Description | | Value | |
| | Common Stocks – (continued) | |
| | Materials – (continued) | |
| | 5,770 | | | The Scotts Miracle-Gro Co. Class A | | $ | 403,381 | |
| | 1,723 | | | The Sherwin-Williams Co. | | | 505,993 | |
| | | | | | | | |
| | | | | | | 4,581,438 | |
| | |
| | Media – 0.4% | |
| | 12,261 | | | Comcast Corp. Class A | | | 799,295 | |
| | 9,666 | | | Liberty Broadband Corp.* | | | 579,960 | |
| | 7,226 | | | Time Warner, Inc. | | | 531,400 | |
| | 27,191 | | | Tribune Media Co. Class A | | | 1,065,343 | |
| | 13,000 | | | Viacom, Inc. Class B | | | 539,110 | |
| | | | | | | | |
| | | | | | | 3,515,108 | |
| | |
| | Pharmaceuticals, Biotechnology & Life Sciences – 1.2% | |
| | 21,037 | | | AbbVie, Inc. | | | 1,302,401 | |
| | 8,800 | | | Agilent Technologies, Inc. | | | 390,368 | |
| | 9,045 | | | Allergan PLC* | | | 2,090,209 | |
| | 3,453 | | | Amgen, Inc. | | | 525,374 | |
| | 7,568 | | | Bristol-Myers Squibb Co. | | | 556,626 | |
| | 9,232 | | | Celgene Corp.* | | | 910,552 | |
| | 10,132 | | | Gilead Sciences, Inc. | | | 845,211 | |
| | 4,192 | | | Jazz Pharmaceuticals PLC* | | | 592,372 | |
| | 5,949 | | | Johnson & Johnson | | | 721,614 | |
| | 9,500 | | | Medivation, Inc.* | | | 572,850 | |
| | 8,191 | | | Merck & Co., Inc. | | | 471,884 | |
| | 42,459 | | | Pfizer, Inc. | | | 1,494,981 | |
| | 1,252 | | | Shire PLC ADR | | | 230,413 | |
| | 2,949 | | | Thermo Fisher Scientific, Inc. | | | 435,744 | |
| | 3,700 | | | United Therapeutics Corp.* | | | 391,904 | |
| | 7,839 | | | Zoetis, Inc. | | | 372,039 | |
| | | | | | | | |
| | | | | | | 11,904,542 | |
| | |
| | Real Estate – 0.3% | |
| | 7,871 | | | American Tower Corp. (REIT) | | | 894,224 | |
| | 3,888 | | | Crown Castle International Corp. (REIT) | | | 394,360 | |
| | 27,110 | | | Four Corners Property Trust, Inc. (REIT) | | | 558,195 | |
| | 3,252 | | | Jones Lang LaSalle, Inc. | | | 316,907 | |
| | 5,300 | | | The Howard Hughes Corp.* | | | 605,896 | |
| | | | | | | | |
| | | | | | | 2,769,582 | |
| | |
| | Retailing – 1.1% | |
| | 2,384 | | | Amazon.com, Inc.* | | | 1,706,038 | |
| | 5,474 | | | Dollar General Corp. | | | 514,556 | |
| | 6,415 | | | Dollar Tree, Inc.* | | | 604,550 | |
| | 54,351 | | | DSW, Inc. Class A | | | 1,151,154 | |
| | 3,340 | | | Expedia, Inc. | | | 355,042 | |
| | 19,288 | | | GNC Holdings, Inc. Class A | | | 468,506 | |
| | 20,697 | | | Liberty Interactive Corp QVC Group Series A* | | | 525,083 | |
| | 27,027 | | | Liberty Ventures Series A* | | | 1,001,891 | |
| | 13,700 | | | LKQ Corp.* | | | 434,290 | |
| | 10,938 | | | Macy’s, Inc. | | | 367,626 | |
| | 140,500 | | | Sears Holdings Corp.*(a) | | | 1,912,205 | |
| | |
| | Common Stocks – (continued) | |
| | Retailing – (continued) | |
| | 4,100 | | | The Home Depot, Inc. | | $ | 523,529 | |
| | 640 | | | The Priceline Group, Inc.* | | | 798,982 | |
| | | | | | | | |
| | | | | | | 10,363,452 | |
| | |
| | Semiconductors & Semiconductor Equipment – 0.5% | |
| | 18,500 | | | Applied Materials, Inc. | | | 443,445 | |
| | 8,627 | | | Broadcom Ltd. | | | 1,340,636 | |
| | 21,382 | | | Lam Research Corp. | | | 1,797,371 | |
| | 48,318 | | | Micron Technology, Inc.* | | | 664,856 | |
| | 8,191 | | | QUALCOMM, Inc. | | | 438,792 | |
| | 8,198 | | | Skyworks Solutions, Inc. | | | 518,769 | |
| | | | | | | | |
| | | | | | | 5,203,869 | |
| | |
| | Software & Services – 2.0% | |
| | 4,294 | | | Alphabet, Inc. Class A* | | | 3,020,958 | |
| | 2,535 | | | Alphabet, Inc. Class C* | | | 1,754,473 | |
| | 6,385 | | | DST Systems, Inc. | | | 743,405 | |
| | 24,453 | | | eBay, Inc.* | | | 572,445 | |
| | 5,100 | | | Electronic Arts, Inc.* | | | 386,376 | |
| | 24,881 | | | Facebook, Inc. Class A* | | | 2,843,401 | |
| | 50,352 | | | FireEye, Inc.*(a) | | | 829,297 | |
| | 10,902 | | | MasterCard, Inc. Class A | | | 960,030 | |
| | 96,800 | | | Match Group, Inc.* | | | 1,459,260 | |
| | 44,357 | | | Microsoft Corp. | | | 2,269,748 | |
| | 34,251 | | | PayPal Holdings, Inc.* | | | 1,250,504 | |
| | 11,800 | | | PTC, Inc.* | | | 443,444 | |
| | 6,770 | | | salesforce.com, Inc.* | | | 537,606 | |
| | 11,300 | | | Splunk, Inc.* | | | 612,234 | |
| | 14,694 | | | Visa, Inc. Class A | | | 1,089,854 | |
| | 16,200 | | | Yahoo!, Inc.* | | | 608,472 | |
| | 16,067 | | | Yelp, Inc.* | | | 487,794 | |
| | | | | | | | |
| | | | | | | 19,869,301 | |
| | |
| | Technology Hardware & Equipment – 0.4% | |
| | 27,019 | | | Apple, Inc. | | | 2,583,017 | |
| | 11,580 | | | CommScope Holding Co., Inc.* | | | 359,327 | |
| | 13,500 | | | EMC Corp. | | | 366,795 | |
| | 33,400 | | | Fitbit, Inc. Class A*(a) | | | 408,148 | |
| | 4,509 | | | Palo Alto Networks, Inc.* | | | 552,984 | |
| | | | | | | | |
| | | | | | | 4,270,271 | |
| | |
| | Telecommunication Services – 0.1% | |
| | 12,746 | | | AT&T, Inc. | | | 550,755 | |
| | |
| | Transportation – 0.4% | |
| | 24,618 | | | Copa Holdings SA Class A(a) | | | 1,286,537 | |
| | 22,639 | | | Delta Air Lines, Inc. | | | 824,739 | |
| | 3,672 | | | FedEx Corp. | | | 557,336 | |
| | 11,427 | | | Macquarie Infrastructure Corp. | | | 846,169 | |
| | 5,300 | | | Ryder System, Inc. | | | 324,042 | |
| | 5,744 | | | Union Pacific Corp. | | | 501,164 | |
| | | | | | | | |
| | | | | | | 4,339,987 | |
| | |
| | Utilities – 0.1% | |
| | 7,052 | | | American Water Works Co., Inc. | | | 595,964 | |
| | |
| | TOTAL COMMON STOCKS | |
| | (Cost $100,120,013) | | $ | 104,772,575 | |
| | |
| | |
| The accompanying notes are an integral part of these financial statements. | | 29 |
GOLDMAN SACHS ABSOLUTE RETURN TRACKER FUND
Consolidated Schedule of Investments (continued)
June 30, 2016 (Unaudited)
| | | | | | | | |
Shares | | | Description | | Value | |
| | Exchange Traded Funds – 6.6% | |
| | 109,856 | | | Energy Select Sector SPDR Fund(a) | | $ | 7,496,573 | |
| | 292,883 | | | Health Care Select Sector SPDR Fund | | | 21,005,569 | |
| | 670,021 | | | Vanguard FTSE Emerging Markets Fund | | | 23,598,140 | |
| | 538,542 | | | PowerShares Senior Loan Portfolio Fund | | | 12,370,310 | |
| | |
| | TOTAL EXCHANGE TRADED FUNDS | |
| | (Cost $57,833,245) | | $ | 64,470,592 | |
| | |
| | | | | | |
Shares | | Distribution
Rate | | Value | |
| Investment Company(b)(c) – 71.4% | |
Goldman Sachs Financial Square Government Fund – FST Institutional Shares | |
| 702,903,210 | | 0.299% | | $ | 702,903,210 | |
| (Cost $702,903,210) | | | | |
| |
| TOTAL INVESTMENTS BEFORE SECURITIES LENDING REINVESTMENT VEHICLE | |
| (Cost $860,856,468) | | $ | 872,146,377 | |
| |
| |
| Securities Lending Reinvestment Vehicle(b)(c) – 0.5% | |
Goldman Sachs Financial Square Money Market Fund – FST Institutional Shares | |
| 5,009,650 | | 0.397% | | $ | 5,009,650 | |
| (Cost $5,009,650) | | | | |
| |
| TOTAL INVESTMENTS – 89.1% | |
| (Cost $865,866,118) | | $ | 877,156,027 | |
| |
OTHER ASSETS IN EXCESS OF LIABILITIES – 10.9% | | | 107,201,935 | |
| |
| NET ASSETS – 100.0% | | $ | 984,357,962 | |
| |
| | |
| The percentage shown for each investment category reflects the value of investments in that category as a percentage of net assets. |
* | | Non-income producing security. |
(a) | | All or a portion of security is on loan. |
(b) | | Represents an affiliated issuer. |
(c) | | Variable rate security. Interest rate or distribution rate disclosed is that which is in effect on June 30, 2016. |
| | |
|
Investment Abbreviations: |
REIT | | —Real Estate Investment Trust |
SPDR | | —Standard and Poor’s Depositary Receipts |
| | |
Currency Abbreviations: |
AUD | | —Australian Dollar |
BRL | | —Brazilian Real |
CAD | | —Canadian Dollar |
CZK | | —Czech Koruna |
EUR | | —Euro |
GBP | | —British Pound |
HUF | | —Hungarian Forint |
JPY | | —Japanese Yen |
MXN | | —Mexican Peso |
NZD | | —New Zealand Dollar |
PLN | | —Polish Zloty |
RUB | | —Russian Ruble |
SEK | | —Swedish Krona |
SGD | | —Singapore Dollar |
USD | | —United States Dollar |
|
| | |
| 30 | | The accompanying notes are an integral part of these financial statements. |
GOLDMAN SACHS ABSOLUTE RETURN TRACKER FUND
|
| ADDITIONAL INVESTMENT INFORMATION |
FORWARD FOREIGN CURRENCY EXCHANGE CONTRACTS — At June 30, 2016, the Fund had the following forward foreign currency exchange contracts:
FORWARD FOREIGN CURRENCY EXCHANGE CONTRACTS WITH UNREALIZED GAIN
| | | | | | | | | | | | | | | | | | | | | | | | |
| Counterparty | | Currency
Purchased | | | Currency
Sold | | | Settlement
Date | | | Current
Value | | | Unrealized
Gain | |
UBS AG | | AUD | | | 1,300,000 | | | USD | | | 958,166 | | | | 07/25/16 | | | $ | 968,805 | | | $ | 10,639 | |
| | BRL | | | 7,430,000 | | | USD | | | 2,173,471 | | | | 07/26/16 | | | | 2,297,565 | | | | 124,094 | |
| | JPY | | | 418,860,000 | | | USD | | | 4,012,278 | | | | 07/25/16 | | | | 4,058,684 | | | | 46,406 | |
| | NZD | | | 5,280,000 | | | USD | | | 3,757,127 | | | | 07/25/16 | | | | 3,765,944 | | | | 8,817 | |
| | RUB | | | 64,830,000 | | | USD | | | 1,000,823 | | | | 07/26/16 | | | | 1,007,832 | | | | 7,009 | |
| | USD | | | 11,706,606 | | | EUR | | | 10,380,000 | | | | 07/25/16 | | | | 11,527,742 | | | | 178,864 | |
| | USD | | | 3,924,259 | | | GBP | | | 2,670,000 | | | | 07/25/16 | | | | 3,555,027 | | | | 369,232 | |
| | USD | | | 1,777,873 | | | PLN | | | 6,960,000 | | | | 07/25/16 | | | | 1,763,225 | | | | 14,648 | |
| | | USD | | | 1,318,270 | | | SEK | | | 10,870,000 | | | | 07/25/16 | | | | 1,285,883 | | | | 32,387 | |
| TOTAL | | | | | | | | | | | | | | $ | 792,096 | |
FORWARD FOREIGN CURRENCY EXCHANGE CONTRACTS WITH UNREALIZED LOSS
| | | | | | | | | | | | | | | | | | | | | | | | |
| Counterparty | | Currency
Purchased | | | Currency
Sold | | | Settlement
Date | | | Current
Value | | | Unrealized
Loss | |
UBS AG | | AUD | | | 1,330,000 | | | USD | | | 1,006,628 | | | | 07/25/16 | | | $ | 991,162 | | | $ | (15,466 | ) |
| | CAD | | | 2,270,000 | | | USD | | | 1,770,469 | | | | 07/25/16 | | | | 1,757,180 | | | | (13,289 | ) |
| | EUR | | | 1,490,000 | | | USD | | | 1,658,264 | | | | 07/25/16 | | | | 1,654,753 | | | | (3,511 | ) |
| | GBP | | | 2,670,000 | | | USD | | | 3,954,123 | | | | 07/25/16 | | | | 3,555,027 | | | | (399,096 | ) |
| | SGD | | | 4,540,000 | | | USD | | | 3,380,978 | | | | 07/25/16 | | | | 3,369,670 | | | | (11,308 | ) |
| | USD | | | 1,146,784 | | | CZK | | | 28,000,000 | | | | 07/25/16 | | | | 1,148,897 | | | | (2,113 | ) |
| | USD | | | 4,037,673 | | | EUR | | | 3,640,000 | | | | 07/25/16 | | | | 4,042,484 | | | | (4,811 | ) |
| | USD | | | 1,192,181 | | | HUF | | | 340,110,000 | | | | 07/25/16 | | | | 1,195,362 | | | | (3,181 | ) |
| | | USD | | | 1,908,164 | | | MXN | | | 35,690,000 | | | | 07/25/16 | | | | 1,948,408 | | | | (40,244 | ) |
| TOTAL | | | | | | | | | | | | | | $ | (493,019 | ) |
| | |
| The accompanying notes are an integral part of these financial statements. | | 31 |
GOLDMAN SACHS ABSOLUTE RETURN TRACKER FUND
Consolidated Schedule of Investments (continued)
June 30, 2016 (Unaudited)
|
| ADDITIONAL INVESTMENT INFORMATION (continued) |
FUTURES CONTRACTS — At June 30, 2016, the Fund had the following futures contracts:
| | | | | | | | | | | | | | |
| Type | | Number of
Contracts
Long (Short) | | | Expiration
Date | | Current
Value | | | Unrealized
Gain (Loss) | |
90 Day Bank Bill | | | 51 | | | September 2016 | | $ | 37,860,292 | | | $ | 1,547 | |
90 Day Bank Bill | | | 51 | | | December 2016 | | | 37,868,657 | | | | 1,977 | |
90 Day Bank Bill | | | 51 | | | March 2017 | | | 37,872,375 | | | | (668 | ) |
90 Day Eurodollar | | | 84 | | | September 2016 | | | 20,864,550 | | | | 27,993 | |
90 Day Eurodollar | | | 89 | | | December 2016 | | | 22,099,813 | | | | 33,519 | |
90 Day Eurodollar | | | 94 | | | March 2017 | | | 23,336,675 | | | | 83,833 | |
90 Day Eurodollar | | | 98 | | | June 2017 | | | 24,321,150 | | | | 86,207 | |
90 Day Eurodollar | | | 98 | | | September 2017 | | | 24,311,350 | | | | 88,961 | |
90 Day Eurodollar | | | 78 | | | December 2017 | | | 19,339,125 | | | | 65,582 | |
90 Day Eurodollar | | | 78 | | | March 2018 | | | 19,331,325 | | | | 56,595 | |
90 Day Eurodollar | | | 78 | | | June 2018 | | | 19,322,550 | | | | 51,745 | |
90 Day Sterling | | | 23 | | | September 2016 | | | 3,812,991 | | | | 52,024 | |
90 Day Sterling | | | 24 | | | December 2016 | | | 3,980,171 | | | | 52,877 | |
90 Day Sterling | | | 18 | | | March 2017 | | | 2,985,428 | | | | 37,608 | |
90 Day Sterling | | | 18 | | | June 2017 | | | 2,985,428 | | | | 39,211 | |
90 Day Sterling | | | 23 | | | September 2017 | | | 3,815,097 | | | | 49,858 | |
90 Day Sterling | | | 21 | | | December 2017 | | | 3,483,000 | | | | 36,000 | |
90 Day Sterling | | | 20 | | | March 2018 | | | 3,316,809 | | | | 27,437 | |
90 Day Sterling | | | 20 | | | June 2018 | | | 3,316,144 | | | | 22,377 | |
CAC 40 Index | | | (21 | ) | | July 2016 | | | (986,723 | ) | | | 22,382 | |
Copper Futures | | | (32 | ) | | September 2016 | | | (1,756,400 | ) | | | (111,241 | ) |
Corn Futures | | | 58 | | | September 2016 | | | 1,059,950 | | | | (188,563 | ) |
DAX Index | | | (4 | ) | | September 2016 | | | (1,072,962 | ) | | | 38,984 | |
Euro CHF 3-Month ICE | | | (9 | ) | | September 2016 | | | (2,326,959 | ) | | | (3,319 | ) |
EURO STOXX 50 Index | | | 1,349 | | | September 2016 | | | 42,740,856 | | | | 542,283 | |
Euro-Bobl | | | 228 | | | September 2016 | | | 33,803,873 | | | | 256,468 | |
Euro-Bund | | | 136 | | | September 2016 | | | 25,222,753 | | | | 430,464 | |
Euro-Schatz | | | 261 | | | September 2016 | | | 32,459,039 | | | | 52,005 | |
Feeder Cattle Futures | | | (4 | ) | | August 2016 | | | (288,600 | ) | | | 10,188 | |
FTSE 100 Index | | | 289 | | | September 2016 | | | 24,709,364 | | | | 2,062,380 | |
Gold 100 oz. Futures | | | 29 | | | August 2016 | | | 3,829,740 | | | | 78,405 | |
IBEX 35 Index | | | (11 | ) | | July 2016 | | | (992,120 | ) | | | (1,224 | ) |
KOSPI 200 Index | | | 4 | | | September 2016 | | | 424,100 | | | | (10,097 | ) |
Live Cattle Futures | | | (6 | ) | | August 2016 | | | (275,580 | ) | | | 7,032 | |
LME Lead Futures | | | 29 | | | July 2016 | | | 1,294,669 | | | | 56,394 | |
LME Lead Futures | | | (29 | ) | | July 2016 | | | (1,294,669 | ) | | | (66,012 | ) |
LME Lead Futures | | | (24 | ) | | August 2016 | | | (1,072,650 | ) | | | (47,006 | ) |
LME Nickel Futures | | | 7 | | | July 2016 | | | 395,220 | | | | 35,631 | |
LME Nickel Futures | | | (7 | ) | | July 2016 | | | (395,220 | ) | | | (18,691 | ) |
LME Nickel Futures | | | (20 | ) | | August 2016 | | | (1,131,120 | ) | | | (101,455 | ) |
LME Primary Aluminum Futures | | | 34 | | | July 2016 | | | 1,398,888 | | | | 69,214 | |
LME Primary Aluminum Futures | | | (34 | ) | | July 2016 | | | (1,398,888 | ) | | | (87,755 | ) |
LME Primary Aluminum Futures | | | 55 | | | August 2016 | | | 2,266,000 | | | | 39,596 | |
LME Primary Aluminum Futures | | | (48 | ) | | August 2016 | | | (1,977,600 | ) | | | (107,657 | ) |
LME Zinc Futures | | | 12 | | | July 2016 | | | 630,600 | | | | 65,522 | |
LME Zinc Futures | | | (12 | ) | | July 2016 | | | (630,600 | ) | | | (38,603 | ) |
LME Zinc Futures | | | 20 | | | August 2016 | | | 1,052,250 | | | | 14,828 | |
Long Gilt | | | 47 | | | September 2016 | | | 8,039,458 | | | | 234,065 | |
NASDAQ 100 E-mini Index | | | 18 | | | September 2016 | | | 1,586,520 | | | | (3,781 | ) |
Russell 2000 Mini Index | | | 285 | | | September 2016 | | | 32,700,900 | | | | (334,134 | ) |
S&P 500 E-Mini Index | | | (145 | ) | | September 2016 | | | (15,153,950 | ) | | | (219,587 | ) |
| | |
| 32 | | The accompanying notes are an integral part of these financial statements. |
GOLDMAN SACHS ABSOLUTE RETURN TRACKER FUND
|
| ADDITIONAL INVESTMENT INFORMATION (continued) |
FUTURES CONTRACTS (continued)
| | | | | | | | | | | | | | | | |
| Type | | Number of
Contracts
Long (Short) | | | Expiration
Date | | | Current
Value | | | Unrealized
Gain (Loss) | |
S&P Mid Cap 400 E-mini Index | | | 21 | | | | September 2016 | | | $ | 3,135,300 | | | $ | (1,802 | ) |
S&P/TSX 60 Index | | | 27 | | | | September 2016 | | | | 3,410,240 | | | | 53,317 | |
Silver Futures | | | 12 | | | | September 2016 | | | | 1,117,380 | | | | 67,265 | |
Soybean Futures | | | 38 | | | | November 2016 | | | | 2,191,175 | | | | 68,896 | |
Sugar #11 (World) Futures | | | 63 | | | | September 2016 | | | | 1,434,485 | | | | 85,189 | |
TSE TOPIX Index | | | 34 | | | | September 2016 | | | | 4,100,809 | | | | (259,215 | ) |
U.S. Long Bond | | | 67 | | | | September 2016 | | | | 11,547,031 | | | | 636,671 | |
2 Year U.S. Treasury Notes | | | 258 | | | | September 2016 | | | | 56,586,656 | | | | 339,435 | |
5 Year U.S. Treasury Notes | | | 164 | | | | September 2016 | | | | 20,034,906 | | | | 309,874 | |
10 Year Canadian Government Bonds | | | 98 | | | | September 2016 | | | | 11,229,475 | | | | 280,883 | |
10 Year Japanese Government Bonds | | | 14 | | | | September 2016 | | | | 20,731,903 | | | | 80,598 | |
10 Year U.S. Treasury Notes | | | 190 | | | | September 2016 | | | | 25,267,031 | | | | 570,185 | |
| TOTAL | | | | | | | | | | | | | | $ | 5,722,695 | |
SWAP CONTRACTS — At June 30, 2016, the Fund had the following swap contracts:
CENTRALLY CLEARED CREDIT DEFAULT SWAP CONTRACTS
| | | | | | | | | | | | | | | | | | | | | | | | |
| | | | | | | | | Market Value | |
| Referenced Obligation | | Notional
Amount
(000’s) | | | Rates Received (Paid) | | | Termination
Date | | | Credit
Spread on
June 30,
2016(a) | | | Upfront
Payments
Made (Received) | | | Unrealized
Gain (Loss) | |
Protection Sold: | |
CDX North America High Yield Index | | $ | 159,460 | | | | 5.000 | % | | | 06/20/21 | | | | 4.263 | % | | $ | 3,438,511 | | | $ | 1,804,260 | |
iTraxx Europe Crossover Index | | | 11,350 | | | | 5.000 | | | | 06/20/21 | | | | 3.530 | | | | 898,219 | | | | (67,542 | ) |
| TOTAL | | | | | | | | | | $ | 4,336,730 | | | $ | 1,736,718 | |
| | (a) | | Credit spread on the Referenced Obligation, together with the period of expiration, are indicators of payment/performance risk. The likelihood of a credit event occurring which would require a fund to make a payment or otherwise be required to perform under the swap contract is generally greater as the credit spread and term of the swap contract increase. |
| | |
| The accompanying notes are an integral part of these financial statements. | | 33 |
GOLDMAN SACHS ABSOLUTE RETURN TRACKER FUND
Consolidated Schedule of Investments (continued)
June 30, 2016 (Unaudited)
|
| ADDITIONAL INVESTMENT INFORMATION (continued) |
OVER THE COUNTER TOTAL RETURN SWAP CONTRACTS(a)
| | | | | | | | | | | | | | | | | | |
| Counterparty | | Referenced Obligation | | Notional
Amount
(000’s) | | | Rate Received
(Paid) | | | Termination
Date | | | Unrealized
Gain (Loss)(b) | |
Deutsche Bank AG | | Russell Top 200 Growth Index Total Return | | $ | 41,847 | | | | 0.432 | % | | | 08/25/16 | | | $ | (1,180,171 | ) |
Deutsche Bank AG | | Russell Top 200 Value Index Total Return | | | 41,868 | | | | (0.432 | ) | | | 08/25/16 | | | | 1,402,796 | |
JPMorgan Chase Bank, N.A. | | Bloomberg Roll Select Commodity Total Return
Index | | | 9,565 | | | | (0.007 | ) | | | 08/24/16 | | | | 199,702 | |
| TOTAL | | | | | | | | | | | | | | | | $ | 422,327 | |
| | (a) | | The Fund receives weekly payments based on any positive weekly return of the Referenced Obligation. The Fund makes payments on any negative weekly return of such Referenced Obligation. |
| | (b) | | There are no upfront payments on the swap contracts listed above, therefore the unrealized gains (losses) on the swap contracts are equal to their market value. |
WRITTEN OPTIONS CONTRACTS — At June 30, 2016, the Fund had the following written options:
| | | | | | | | | | | | | | |
| Put Options | | Number of Contracts | | | Exercise
Price | | | Expiration
Month | | Value | |
S&P 500 Index | | | 53 | | | $ | 1,875 | | | July 2016 | | $ | (3,975 | ) |
| | | 51 | | | | 1,900 | | | July 2016 | | | (4,590 | ) |
| | | 50 | | | | 1,925 | | | July 2016 | | | (7,000 | ) |
| | | 49 | | | | 1,950 | | | July 2016 | | | (9,065 | ) |
| | | 48 | | | | 1,975 | | | July 2016 | | | (12,960 | ) |
| | | 46 | | | | 2,000 | | | July 2016 | | | (18,860 | ) |
| | | 45 | | | | 2,025 | | | July 2016 | | | (27,000 | ) |
| | | 44 | | | | 2,050 | | | July 2016 | | | (39,336 | ) |
| | | 43 | | | | 2,075 | | | July 2016 | | | (64,500 | ) |
| | | 40 | | | | 1,825 | | | August 2016 | | | (20,000 | ) |
| | | 38 | | | | 1,850 | | | August 2016 | | | (21,850 | ) |
| | | 37 | | | | 1,875 | | | August 2016 | | | (26,159 | ) |
| | | 36 | | | | 1,900 | | | August 2016 | | | (29,124 | ) |
| | | 35 | | | | 1,925 | | | August 2016 | | | (35,350 | ) |
| | | 35 | | | | 1,950 | | | August 2016 | | | (42,000 | ) |
| | | 34 | | | | 1,975 | | | August 2016 | | | (52,020 | ) |
| | | 33 | | | | 2,000 | | | August 2016 | | | (61,050 | ) |
| | | 32 | | | | 2,025 | | | August 2016 | | | (74,880 | ) |
| | | 31 | | | | 2,050 | | | August 2016 | | | (88,350 | ) |
| | | 39 | | | | 1,875 | | | September 2016 | | | (56,277 | ) |
| | | 38 | | | | 1,900 | | | September 2016 | | | (64,600 | ) |
| | | 37 | | | | 1,925 | | | September 2016 | | | (71,595 | ) |
| | | 36 | | | | 1,950 | | | September 2016 | | | (81,540 | ) |
| | | 35 | | | | 1,975 | | | September 2016 | | | (96,950 | ) |
| | | 34 | | | | 2,000 | | | September 2016 | | | (108,800 | ) |
| | | 33 | | | | 2,025 | | | September 2016 | | | (122,430 | ) |
| | | 33 | | | | 2,050 | | | September 2016 | | | (144,210 | ) |
| | | | 32 | | | | 2,075 | | | September 2016 | | | (166,400 | ) |
| Total (Premiums Received $4,072,623) | | | 1,097 | | | | | | | | | $ | (1,550,871 | ) |
| | |
| 34 | | The accompanying notes are an integral part of these financial statements. |
GOLDMAN SACHS ABSOLUTE RETURN TRACKER FUND
|
| ADDITIONAL INVESTMENT INFORMATION (continued) |
For the six months ended June 30, 2016, the Fund had the following written options activity:
| | | | | | | | |
| | | Number of Contracts | | | Premiums Received | |
Contracts Outstanding December 31, 2015 | | | 966 | | | $ | 3,800,048 | |
Contracts written | | | 2,114 | | | | 8,172,186 | |
Contracts bought to close | | | (673 | ) | | | (2,641,557 | ) |
Contracts expired | | | (1,310 | ) | | | (5,258,054 | ) |
Contracts Outstanding June 30, 2016 | | | 1,097 | | | $ | 4,072,623 | |
| | |
| The accompanying notes are an integral part of these financial statements. | | 35 |
GOLDMAN SACHS COMMODITY STRATEGY FUND
Consolidated Schedule of Investments
June 30, 2016 (Unaudited)
| | | | | | | | | | | | | | |
Principal
Amount | | | Interest
Rate | | | Maturity
Date | | | Value | |
| | Mortgage-Backed Obligations – 15.8% | |
| | Collateralized Mortgage Obligations – 9.0% | |
| | Agency Multi-Family(a) – 5.9% | |
| FHLMC Multifamily Structured Pass-Through Certificates
Series K011, Class A2 |
|
| $ | 500,000 | | | | 4.084 | % | | | 11/25/20 | | | $ | 6,093,997 | |
| FHLMC Multifamily Structured Pass-Through Certificates
Series K714, Class A2 |
|
| | 16,400,000 | | | | 3.034 | | | | 10/25/20 | | | | 17,463,640 | |
| | | | | | | | | | | | | | |
| | | | | | | | | | | | | 23,557,637 | |
| | |
| | Regular Floater(a)(c) – 1.4% | |
| FDIC Guaranteed Notes Trust Series 2010-S1, Class 1A(b) | |
| | 21,128 | | | | 1.007 | | | | 02/25/48 | | | | 21,120 | |
| FHLMC REMIC Series 3371, Class FA | |
| | 331,964 | | | | 1.042 | | | | 09/15/37 | | | | 334,292 | |
| National Credit Union Administration Guaranteed Notes
Series 2010-A1, Class A |
|
| | 385,004 | | | | 0.795 | | | | 12/07/20 | | | | 384,048 | |
| National Credit Union Administration Guaranteed Notes
Series 2010-R1, Class 1A |
|
| | 542,210 | | | | 0.915 | | | | 10/07/20 | | | | 542,930 | |
| National Credit Union Administration Guaranteed Notes
Series 2010-R2, Class 1A |
|
| | 689,671 | | | | 0.835 | | | | 11/06/17 | | | | 690,049 | |
| National Credit Union Administration Guaranteed Notes
Series 2011-R2, Class 1A |
|
| | 1,683,624 | | | | 0.865 | | | | 02/06/20 | | | | 1,684,940 | |
| National Credit Union Administration Guaranteed Notes
Series 2011-R3, Class 1A |
|
| | 1,079,645 | | | | 0.845 | | | | 03/11/20 | | | | 1,077,620 | |
| National Credit Union Administration Guaranteed Notes
Series 2011-R4, Class 1A |
|
| | 590,276 | | | | 0.845 | | | | 03/06/20 | | | | 590,483 | |
| National Credit Union Administration Guaranteed Notes
Series 2011-R5, Class 1A |
|
| | 163,599 | | | | 0.845 | | | | 04/06/20 | | | | 163,548 | |
| | | | | | | | | | | | | | |
| | | | | | | | | | | | | 5,489,030 | |
| | |
| | Sequential Fixed Rate – 1.7% | |
| FHLMC REMIC Series 2755, Class ZA | |
| | 692,516 | | | | 5.000 | | | | 02/15/34 | | | | 763,746 | |
| FHLMC REMIC Series 4273, Class PD(c) | |
| | 2,148,838 | | | | 6.500 | | | | 11/15/43 | | | | 2,487,097 | |
| FNMA REMIC Series 2012-111, Class B | |
| | 685,327 | | | | 7.000 | | | | 10/25/42 | | | | 793,419 | |
| FNMA REMIC Series 2012-153, Class B | |
| | 2,277,751 | | | | 7.000 | | | | 07/25/42 | | | | 2,689,109 | |
| | | | | | | | | | | | | | |
| | | | | | | | | | | | | 6,733,371 | |
| | |
| TOTAL COLLATERALIZED
MORTGAGE OBLIGATIONS |
| | $ | 35,780,038 | |
| | |
| | Federal Agencies – 6.8% | |
| | FHLMC – 2.9% | |
| $ | 35 | | | | 5.000 | % | | | 09/01/16 | | | $ | 36 | |
| | 297 | | | | 5.000 | | | | 11/01/16 | | | | 305 | |
| | 204 | | | | 5.000 | | | | 12/01/16 | | | | 209 | |
| | 672 | | | | 5.000 | | | | 01/01/17 | | | | 689 | |
| | |
| | Mortgage-Backed Obligations – (continued) | |
| | FHLMC – (continued) | |
| $ | 1,961 | | | | 5.000 | % | | | 01/01/18 | | | $ | 2,014 | |
| | 24,801 | | | | 5.000 | | | | 02/01/18 | | | | 25,476 | |
| | 18,860 | | | | 5.000 | | | | 03/01/18 | | | | 19,406 | |
| | 10,943 | | | | 5.000 | | | | 04/01/18 | | | | 11,266 | |
| | 8,328 | | | | 5.000 | | | | 05/01/18 | | | | 8,584 | |
| | 6,812 | | | | 5.000 | | | | 06/01/18 | | | | 7,022 | |
| | 14,681 | | | | 5.000 | | | | 07/01/18 | | | | 15,182 | |
| | 3,869 | | | | 5.000 | | | | 08/01/18 | | | | 3,995 | |
| | 2,430 | | | | 5.000 | | | | 10/01/18 | | | | 2,520 | |
| | 4,461 | | | | 5.000 | | | | 11/01/18 | | | | 4,620 | |
| | 472 | | | | 5.000 | | | | 02/01/19 | | | | 493 | |
| | 89,515 | | | | 5.500 | | | | 01/01/20 | | | | 94,158 | |
| | 78,059 | | | | 5.000 | | | | 11/01/25 | | | | 86,149 | |
| | 144,107 | | | | 5.000 | | | | 08/01/28 | | | | 159,041 | |
| | 16,518 | | | | 5.000 | | | | 01/01/33 | | | | 18,371 | |
| | 1,636 | | | | 5.000 | | | | 03/01/33 | | | | 1,815 | |
| | 9,521 | | | | 5.000 | | | | 04/01/33 | | | | 10,559 | |
| | 2,786 | | | | 5.000 | | | | 05/01/33 | | | | 3,089 | |
| | 7,155 | | | | 5.000 | | | | 06/01/33 | | | | 7,935 | |
| | 39,453 | | | | 5.000 | | | | 07/01/33 | | | | 43,751 | |
| | 54,468 | | | | 5.000 | | | | 08/01/33 | | | | 60,451 | |
| | 4,978 | | | | 5.000 | | | | 09/01/33 | | | | 5,521 | |
| | 11,781 | | | | 5.000 | | | | 10/01/33 | | | | 13,065 | |
| | 37,817 | | | | 5.000 | | | | 11/01/33 | | | | 41,937 | |
| | 13,269 | | | | 5.000 | | | | 12/01/33 | | | | 14,715 | |
| | 12,728 | | | | 5.000 | | | | 01/01/34 | | | | 14,114 | |
| | 40,691 | | | | 5.000 | | | | 02/01/34 | | | | 45,117 | |
| | 16,812 | | | | 5.000 | | | | 03/01/34 | | | | 18,634 | |
| | 29,859 | | | | 5.000 | | | | 04/01/34 | | | | 33,094 | |
| | 46,134 | | | | 5.000 | | | | 05/01/34 | | | | 51,159 | |
| | 603,484 | | | | 5.000 | | | | 06/01/34 | | | | 669,182 | |
| | 8,016 | | | | 5.000 | | | | 11/01/34 | | | | 8,885 | |
| | 160,684 | | | | 5.000 | | | | 04/01/35 | | | | 178,191 | |
| | 2,902,302 | | | | 5.000 | | | | 07/01/35 | | | | 3,216,770 | |
| | 12,873 | | | | 5.000 | | | | 11/01/35 | | | | 14,275 | |
| | 103,986 | | | | 5.000 | | | | 03/01/36 | | | | 116,399 | |
| | 47,700 | | | | 5.000 | | | | 03/01/37 | | | | 52,643 | |
| | 103,267 | | | | 5.000 | | | | 12/01/37 | | | | 113,969 | |
| | 234,213 | | | | 5.000 | | | | 02/01/38 | | | | 258,504 | |
| | 627,369 | | | | 5.000 | | | | 03/01/38 | | | | 692,435 | |
| | 312,236 | | | | 5.000 | | | | 07/01/38 | | | | 344,619 | |
| | 302,445 | | | | 5.000 | | | | 11/01/38 | | | | 333,813 | |
| | 698,145 | | | | 5.000 | | | | 12/01/38 | | | | 770,491 | |
| | 384,452 | | | | 5.000 | | | | 01/01/39 | | | | 424,325 | |
| | 88,249 | | | | 5.000 | | | | 02/01/39 | | | | 97,402 | |
| | 2,231,208 | | | | 7.000 | | | | 02/01/39 | | | | 2,634,570 | |
| | 637,418 | | | | 5.000 | | | | 06/01/41 | | | | 703,470 | |
| | | | | | | | | | | | | | |
| | | | | | | | | | | | | 11,454,435 | |
| | |
| | FNMA – 3.9% | |
| | 13,633 | | | | 5.000 | | | | 03/01/18 | | | | 14,008 | |
| | 50,050 | | | | 5.000 | | | | 04/01/18 | | | | 51,539 | |
| | 554 | | | | 5.500 | | | | 01/01/19 | | | | 578 | |
| | 18,091 | | | | 5.500 | | | | 02/01/19 | | | | 18,830 | |
| | 19,428 | | | | 5.500 | | | | 03/01/19 | | | | 20,283 | |
| | 11,545 | | | | 5.500 | | | | 04/01/19 | | | | 12,029 | |
| | |
| | |
| 36 | | The accompanying notes are an integral part of these financial statements. |
GOLDMAN SACHS COMMODITY STRATEGY FUND
| | | | | | | | | | | | | | |
Principal
Amount | | | Interest
Rate | | | Maturity
Date | | | Value | |
| | Mortgage-Backed Obligations – (continued) | |
| | FNMA – (continued) | |
| $ | 8,602 | | | | 5.500 | % | | | 05/01/19 | | | $ | 9,004 | |
| | 37,459 | | | | 5.500 | | | | 06/01/19 | | | | 39,047 | |
| | 115,781 | | | | 5.500 | | | | 07/01/19 | | | | 120,799 | |
| | 109,321 | | | | 5.500 | | | | 08/01/19 | | | | 114,471 | |
| | 95,252 | | | | 5.500 | | | | 09/01/19 | | | | 100,176 | |
| | 26,633 | | | | 5.500 | | | | 10/01/19 | | | | 28,027 | |
| | 32,411 | | | | 5.500 | | | | 11/01/19 | | | | 34,161 | |
| | 52,656 | | | | 5.500 | | | | 12/01/19 | | | | 55,445 | |
| | 3,764 | | | | 5.500 | | | | 01/01/20 | | | | 3,975 | |
| | 1,903 | | | | 5.500 | | | | 06/01/20 | | | | 1,986 | |
| | 592,790 | | | | 5.500 | | | | 07/01/20 | | | | 624,641 | |
| | 9,074 | | | | 6.000 | | | | 03/01/34 | | | | 10,496 | |
| | 32,834 | | | | 6.000 | | | | 08/01/34 | | | | 37,967 | |
| | 243,564 | | | | 6.000 | | | | 08/01/35 | | | | 280,937 | |
| | 135,045 | | | | 6.000 | | | | 09/01/35 | | | | 154,605 | |
| | 99,743 | | | | 6.000 | | | | 10/01/35 | | | | 114,189 | |
| | 209,611 | | | | 6.000 | | | | 11/01/35 | | | | 241,138 | |
| | 918,336 | | | | 6.000 | | | | 03/01/36 | | | | 1,049,933 | |
| | 7,410 | | | | 6.000 | | | | 06/01/36 | | | | 8,467 | |
| | 1,795,048 | | | | 6.000 | | | | 09/01/36 | | | | 2,054,732 | |
| | 296,324 | | | | 6.000 | | | | 12/01/36 | | | | 340,037 | |
| | 28,442 | | | | 6.000 | | | | 02/01/37 | | | | 32,614 | |
| | 2,363 | | | | 6.000 | | | | 04/01/37 | | | | 2,704 | |
| | 12,446 | | | | 6.000 | | | | 05/01/37 | | | | 14,218 | |
| | 168,848 | | | | 6.000 | | | | 06/01/37 | | | | 193,772 | |
| | 135,775 | | | | 6.000 | | | | 07/01/37 | | | | 155,778 | |
| | 426,272 | | | | 6.000 | | | | 08/01/37 | | | | 488,234 | |
| | 97,070 | | | | 6.000 | | | | 09/01/37 | | | | 110,892 | |
| | 24,877 | | | | 6.000 | | | | 10/01/37 | | | | 28,420 | |
| | 158,148 | | | | 5.000 | | | | 11/01/37 | | | | 178,096 | |
| | 107,602 | | | | 6.000 | | | | 11/01/37 | | | | 123,851 | |
| | 2,826 | | | | 6.000 | | | | 12/01/37 | | | | 3,268 | |
| | 474,322 | | | | 6.000 | | | | 01/01/38 | | | | 544,012 | |
| | 84,934 | | | | 6.000 | | | | 03/01/38 | | | | 97,707 | |
| | 14,421 | | | | 6.000 | | | | 04/01/38 | | | | 16,475 | |
| | 31,627 | | | | 6.000 | | | | 05/01/38 | | | | 36,134 | |
| | 3,667 | | | | 6.000 | | | | 09/01/38 | | | | 4,191 | |
| | 128,575 | | | | 6.000 | | | | 10/01/38 | | | | 147,399 | |
| | 4,399 | | | | 6.000 | | | | 12/01/38 | | | | 5,025 | |
| | 4,601 | | | | 6.000 | | | | 01/01/39 | | | | 5,256 | |
| | 1,327,512 | | | | 7.000 | | | | 03/01/39 | | | | 1,567,941 | |
| | 16,953 | | | | 4.000 | | | | 08/01/39 | | | | 18,173 | |
| | 39,620 | | | | 4.500 | | | | 02/01/40 | | | | 43,218 | |
| | 5,842 | | | | 6.000 | | | | 04/01/40 | | | | 6,674 | |
| | 257,031 | | | | 6.000 | | | | 06/01/40 | | | | 293,630 | |
| | 547,971 | | | | 6.000 | | | | 05/01/41 | | | | 625,997 | |
| | 378,044 | | | | 5.000 | | | | 07/01/41 | | | | 420,766 | |
| | 225,641 | | | | 4.500 | | | | 08/01/41 | | | | 247,596 | |
| | 108,918 | | | | 3.500 | | | | 01/01/45 | | | | 114,946 | |
| | 773,656 | | | | 3.500 | | | | 02/01/45 | | | | 816,472 | |
| | 629,275 | | | | 3.500 | | | | 03/01/45 | | | | 664,101 | |
| | 109,450 | | | | 3.500 | | | | 04/01/45 | | | | 115,507 | |
| | 575,614 | | | | 3.500 | | | | 05/01/45 | | | | 607,469 | |
| | |
| | Mortgage-Backed Obligations – (continued) | |
| | FNMA – (continued) | |
| $ | 1,123,384 | | | | 3.500 | % | | | 07/01/45 | | | $ | 1,185,555 | |
| | 953,510 | | | | 3.500 | | | | 09/01/45 | | | | 1,006,301 | |
| | | | | | | | | | | | | | |
| | | | | | | | | | | | | 15,463,892 | |
| | |
| | TOTAL FEDERAL AGENCIES | | | $ | 26,918,327 | |
| | |
| | TOTAL MORTGAGE-BACKED OBLIGATIONS | |
| | (Cost $61,221,471) | | | $ | 62,698,365 | |
| | |
| | |
| | Asset-Backed Securities(a)(c) – 0.1% | |
| | Home Equity – 0.1% | |
| GMAC Mortgage Corp. Loan Trust Series 2007-HE3, Class 1A1 | |
| $ | 52,482 | | | | 7.000 | % | | | 09/25/37 | | | $ | 52,076 | |
| GMAC Mortgage Corp. Loan Trust Series 2007-HE3, Class 2A1 | |
| | 105,524 | | | | 6.708 | | | | 09/25/37 | | | | 105,299 | |
| | |
| | TOTAL ASSET-BACKED SECURITIES | |
| | (Cost $158,302) | | | $ | 157,375 | |
| | |
| | |
| | U.S. Treasury Obligations – 31.6% | |
| United States Treasury Bonds | |
| $ | 1,100,000 | | | | 2.750 | % | | | 11/15/42 | | | $ | 1,207,470 | |
| | 4,900,000 | | | | 3.375 | (d) | | | 05/15/44 | | | | 6,027,930 | |
| | 7,700,000 | | | | 3.000 | | | | 11/15/44 | | | | 8,837,213 | |
| | 5,400,000 | | | | 3.000 | | | | 05/15/45 | | | | 6,196,392 | |
| | 340,000 | | | | 2.500 | | | | 05/15/46 | | | | 353,787 | |
| United States Treasury Inflation-Protected Securities | |
| | 17,948,811 | | | | 2.500 | | | | 07/15/16 | | | | 18,002,119 | |
| | 1,580,115 | | | | 0.125 | (d) | | | 04/15/17 | | | | 1,590,481 | |
| | 2,587,600 | | | | 0.125 | | | | 04/15/18 | | | | 2,627,216 | |
| United States Treasury Notes | |
| | 4,000,000 | | | | 1.250 | | | | 01/31/20 | | | | 4,058,560 | |
| | 9,000,000 | | | | 1.375 | | | | 02/29/20 | | | | 9,170,370 | |
| | 6,100,000 | | | | 1.375 | | | | 03/31/20 | | | | 6,215,901 | |
| | 3,600,000 | | | | 1.375 | | | | 04/30/20 | | | | 3,668,148 | |
| | 13,100,000 | | | | 1.625 | | | | 06/30/20 | | | | 13,472,433 | |
| | 4,200,000 | | | | 1.750 | | | | 12/31/20 | | | | 4,344,648 | |
| | 6,600,000 | | | | 2.250 | | | | 04/30/21 | | | | 6,986,166 | |
| | 6,600,000 | | | | 2.000 | | | | 10/31/21 | | | | 6,914,160 | |
| | 4,600,000 | | | | 2.125 | | | | 12/31/21 | | | | 4,850,240 | |
| | 3,000,000 | | | | 1.750 | | | | 02/28/22 | | | | 3,100,620 | |
| | 6,800,000 | | | | 1.875 | | | | 05/31/22 | | | | 7,073,020 | |
| | 800,000 | | | | 2.125 | | | | 06/30/22 | | | | 843,576 | |
| | 5,800,000 | | | | 1.750 | | | | 09/30/22 | | | | 5,983,802 | |
| | 3,700,000 | | | | 1.875 | | | | 10/31/22 | | | | 3,844,596 | |
| | |
| | TOTAL U.S. TREASURY OBLIGATIONS | |
| | (Cost $119,597,078) | | | $ | 125,368,848 | |
| | |
| | |
| The accompanying notes are an integral part of these financial statements. | | 37 |
GOLDMAN SACHS COMMODITY STRATEGY FUND
Consolidated Schedule of Investments (continued)
June 30, 2016 (Unaudited)
| | | | | | | | | | |
Shares | | | Distribution
Rate | | | Value | |
| | Investment Company(a)(e) – 38.9% | |
| Goldman Sachs Financial Square Government Fund –
FST Institutional Shares |
|
| | 154,503,042 | | | | 0.299 | % | | $ | 154,503,042 | |
| | (Cost $154,503,042) | |
| | |
| | TOTAL INVESTMENTS – 86.4% | |
| | (Cost $335,479,893) | | | $ | 342,727,630 | |
| | |
| OTHER ASSETS IN EXCESS OF
LIABILITIES – 13.6% |
| | | 54,158,211 | |
| | |
| | NET ASSETS – 100.0% | | | $ | 396,885,841 | |
| | |
| | |
| The percentage shown for each investment category reflects the value of investments in that category as a percentage of net assets. |
(a) | | Variable rate security. Interest rate or distribution rate disclosed is that which is in effect on June 30, 2016. |
(b) | | Exempt from registration under Rule 144A of the Securities Act of 1933. Under procedures approved by the Board of Trustees, such securities may be deemed liquid by the Investment Adviser and may be resold, normally to qualified institutional buyers in transactions exempt from registration. Total market value of Rule 144A securities amounts to $21,120, which represents approximately 0.0% of net assets as of June 30, 2016. |
(c) | | Securities with “Call” features. Maturity dates disclosed are the final maturity dates. |
(d) | | All or a portion of security is segregated as collateral for initial margin requirements on futures transactions. |
(e) | | Represents an affiliated issuer. |
| | |
|
Investment Abbreviations: |
FDIC | | —Federal Deposit Insurance Corp. |
FHLMC | | —Federal Home Loan Mortgage Corp. |
FNMA | | —Federal National Mortgage Association |
REMIC | | —Real Estate Mortgage Investment Conduit |
|
| | |
| 38 | | The accompanying notes are an integral part of these financial statements. |
GOLDMAN SACHS COMMODITY STRATEGY FUND
|
| ADDITIONAL INVESTMENT INFORMATION |
FORWARD SALES CONTRACTS — At June 30, 2016, the Fund had the following forward sales contracts:
| | | | | | | | | | | | | | | | | | |
| Description | | Interest
Rate | | | Maturity
Date(a) | | Settlement
Date | | | Principal
Amount | | | Value | |
FNMA (Proceeds Received: $4,184,063) | | | 3.500 | % | | TBA-30yr | | | 07/25/44 | | | $ | (4,000,000 | ) | | $ | (4,219,688 | ) |
| | (a) | | TBA (To Be Announced) Securities are sold on a forward commitment basis with an approximate principal amount and no defined maturity date. The actual principal and maturity date will be determined upon settlement when the specific mortgage pools are assigned. |
FUTURES CONTRACTS — At June 30, 2016, the Fund had the following futures contracts:
| | | | | | | | | | | | | | |
| Type | | Number of
Contracts
Long (Short) | | | Expiration
Date | | Current
Value | | | Unrealized
Gain (Loss) | |
U.S. Long Bond | | | 28 | | | September 2016 | | $ | 4,825,625 | | | $ | 223,758 | |
U.S. Ultra Long Treasury Bonds | | | (151 | ) | | September 2016 | | | (28,142,625 | ) | | | (1,781,635 | ) |
2 Year U.S. Treasury Notes | | | (209 | ) | | September 2016 | | | (45,839,578 | ) | | | (319,648 | ) |
5 Year U.S. Treasury Notes | | | (637 | ) | | September 2016 | | | (77,818,508 | ) | | | (1,359,154 | ) |
10 Year U.S. Treasury Notes | | | (145 | ) | | September 2016 | | | (19,282,734 | ) | | | (513,795 | ) |
| TOTAL | | | | | | | | | | | | $ | (3,750,474 | ) |
SWAP CONTRACTS — At June 30, 2016, the Fund had the following swap contracts
OVER THE COUNTER TOTAL RETURN SWAP CONTRACTS(a)
| | | | | | | | | | | | | | | | | | |
| Counterparty | | Referenced Obligation | | Notional
Amount
(000’s) | | | Rate Received
(Paid) | | | Termination
Date | | | Unrealized Gain (Loss)(b) | |
Macquarie Bank Ltd. | | S&P GSCI 1 Month Forward Index | | $ | 110,827 | | | | (0.17 | )% | | | 08/15/16 | | | $ | 648,877 | |
Merrill Lynch International | | S&P GSCI 1 Month Forward Index | | | 129,216 | | | | (0.18 | ) | | | 09/01/16 | | | | 654,346 | |
Societe Generale SA | | S&P GSCI 1 Month Forward Index | | | 110,812 | | | | (0.15 | ) | | | 12/28/16 | | | | 538,566 | |
UBS AG | | S&P GSCI 1 Month Forward Index | | | 24,867 | | | | (0.15 | ) | | | 01/11/17 | | | | (170,401 | ) |
| TOTAL | | | | | | | | | | | | | | | | | 1,671,388 | |
| | (a) | | The Fund receives monthly payments based on any positive monthly return of the Referenced Obligation. The Fund makes payments on any negative monthly return of such Referenced Obligation. |
| | (b) | | There are no upfront payments on the swap contracts listed above, therefore the unrealized gains (losses) on the swap contracts are equal to their market value. |
| | |
| The accompanying notes are an integral part of these financial statements. | | 39 |
GOLDMAN SACHS DYNAMIC ALLOCATION FUND
Consolidated Schedule of Investments
June 30, 2016 (Unaudited)
| | | | | | | | |
Shares | | | Description | | Value | |
| | Common Stocks – 32.5% | |
| | Automobiles & Components – 2.6% | |
| | 46,600 | | | Bridgestone Corp. | | $ | 1,497,582 | |
| | 4,603 | | | Continental AG | | | 871,011 | |
| | 44,600 | | | Fuji Heavy Industries Ltd. | | | 1,533,053 | |
| | 100,300 | | | Mazda Motor Corp. | | | 1,327,299 | |
| | 310,700 | | | Mitsubishi Motors Corp. | | | 1,434,295 | |
| | 11,212 | | | Renault SA | | | 846,478 | |
| | 113,400 | | | Sumitomo Rubber Industries Ltd. | | | 1,518,188 | |
| | 59,000 | | | Suzuki Motor Corp. | | | 1,597,598 | |
| | 118,700 | | | The Yokohama Rubber Co. Ltd. | | | 1,488,736 | |
| | 19,430 | | | Valeo SA | | | 862,577 | |
| | 98,900 | | | Yamaha Motor Co. Ltd. | | | 1,508,691 | |
| | | | | | | | |
| | | | | | | 14,485,508 | |
| | |
| | Banks – 2.3% | |
| | 131,388 | | | Commerzbank AG | | | 855,645 | |
| | 108,840 | | | Credit Agricole SA | | | 915,011 | |
| | 466,000 | | | Fukuoka Financial Group, Inc. | | | 1,536,518 | |
| | 133,800 | | | Japan Post Bank Co. Ltd. | | | 1,573,306 | |
| | 328,800 | | | Mitsubishi UFJ Financial Group, Inc. | | | 1,473,962 | |
| | 1,026,300 | | | Mizuho Financial Group, Inc. | | | 1,476,906 | |
| | 27,100 | | | Societe Generale SA | | | 847,848 | |
| | 51,900 | | | Sumitomo Mitsui Financial Group, Inc. | | | 1,498,616 | |
| | 419,000 | | | The Gunma Bank Ltd. | | | 1,521,589 | |
| | 379,260 | | | UniCredit SpA | | | 834,089 | |
| | | | | | | | |
| | | | | | | 12,533,490 | |
| | |
| | Capital Goods – 2.1% | |
| | 35,374 | | | Emerson Electric Co. | | | 1,845,108 | |
| | 160,600 | | | Hino Motors Ltd. | | | 1,599,570 | |
| | 214,900 | | | Minebea Co. Ltd. | | | 1,460,011 | |
| | 130,000 | | | Mitsubishi Electric Corp. | | | 1,551,986 | |
| | 25,291 | | | MSC Industrial Direct Co., Inc. Class A | | | 1,784,533 | |
| | 12,012 | | | Snap-on, Inc. | | | 1,895,734 | |
| | 33,298 | | | WESCO International, Inc.* | | | 1,714,514 | |
| | | | | | | | |
| | | | | | | 11,851,456 | |
| | |
| | Commercial & Professional Services – 0.8% | |
| | 25,088 | | | ManpowerGroup, Inc. | | | 1,614,162 | |
| | 19,705 | | | Randstad Holding NV | | | 788,022 | |
| | 48,051 | | | Robert Half International, Inc. | | | 1,833,626 | |
| | | | | | | | |
| | | | | | | 4,235,810 | |
| | |
| | Consumer Durables & Apparel – 1.7% | |
| | 24,751 | | | Harman International Industries, Inc. | | | 1,777,617 | |
| | 18,839 | | | Luxottica Group SpA | | | 918,169 | |
| | 6,075 | | | LVMH Moet Hennessy Louis Vuitton SE | | | 915,714 | |
| | 182,000 | | | Panasonic Corp. | | | 1,565,844 | |
| | 6,811 | | | Pandora A/S | | | 927,654 | |
| | 19,062 | | | PVH Corp. | | | 1,796,212 | |
| | 122,000 | | | Sekisui Chemical Co. Ltd. | | | 1,503,138 | |
| | | | | | | | |
| | | | | | | 9,404,348 | |
| | |
| | Common Stocks – (continued) | |
| | Diversified Financials – 0.5% | |
| | 62,747 | | | Deutsche Bank AG (Registered)* | | $ | 867,359 | |
| | 100,202 | | | Waddell & Reed Financial, Inc. Class A | | | 1,725,479 | |
| | | | | | | | |
| | | | | | | 2,592,838 | |
| | |
| | Energy – 1.3% | |
| | 74,463 | | | HollyFrontier Corp. | | | 1,769,985 | |
| | 199,900 | | | Inpex Corp. | | | 1,563,338 | |
| | 25,105 | | | Tesoro Corp. | | | 1,880,867 | |
| | 35,600 | | | Valero Energy Corp. | | | 1,815,600 | |
| | | | | | | | |
| | | | | | | 7,029,790 | |
| | |
| | Food & Staples Retailing – 1.3% | |
| | 37,823 | | | Carrefour SA | | | 930,281 | |
| | 19,300 | | | CVS Health Corp. | | | 1,847,782 | |
| | 43,856 | | | Koninklijke Ahold NV | | | 968,453 | |
| | 29,200 | | | Matsumotokiyoshi Holdings Co. Ltd. | | | 1,427,515 | |
| | 59,822 | | | Whole Foods Market, Inc. | | | 1,915,501 | |
| | | | | | | | |
| | | | | | | 7,089,532 | |
| | |
| | Health Care Equipment & Services – 1.3% | |
| | 13,938 | | | Anthem, Inc. | | | 1,830,617 | |
| | 27,543 | | | Centene Corp.* | | | 1,965,744 | |
| | 9,857 | | | Humana, Inc. | | | 1,773,077 | |
| | 23,913 | | | Quest Diagnostics, Inc. | | | 1,946,757 | |
| | | | | | | | |
| | | | | | | 7,516,195 | |
| | |
| | Household & Personal Products – 0.4% | |
| | 5,187 | | | L’Oreal SA | | | 993,069 | |
| | 21,737 | | | Unilever NV CVA | | | 1,010,980 | |
| | | | | | | | |
| | | | | | | 2,004,049 | |
| | |
| | Insurance – 0.2% | |
| | 32,773 | | | NN Group NV | | | 902,189 | |
| | |
| | Materials – 2.4% | |
| | 14,693 | | | Akzo Nobel NV | | | 912,741 | |
| | 244,000 | | | Asahi Kasei Corp. | | | 1,698,004 | |
| | 140,700 | | | Daicel Corp. | | | 1,457,943 | |
| | 11,714 | | | HeidelbergCement AG | | | 882,440 | |
| | 85,000 | | | Hitachi Chemical Co. Ltd. | | | 1,587,494 | |
| | 148,400 | | | Hitachi Metals Ltd. | | | 1,507,621 | |
| | 52,965 | | | Ingevity Corp.* | | | 1,802,929 | |
| | 365,000 | | | Sumitomo Chemical Co. Ltd. | | | 1,506,012 | |
| | 39,925 | | | Westlake Chemical Corp. | | | 1,713,581 | |
| | | | | | | | |
| | | | | | | 13,068,765 | |
| | |
| | Media – 0.3% | |
| | 29,700 | | | CyberAgent, Inc. | | | 1,797,776 | |
| | |
| | Pharmaceuticals, Biotechnology & Life Sciences – 2.2% | |
| | 107,100 | | | Astellas Pharma, Inc. | | | 1,679,579 | |
| | 9,454 | | | Bayer AG (Registered) | | | 949,511 | |
| | 7,613 | | | Biogen, Inc.* | | | 1,840,976 | |
| | 22,078 | | | Gilead Sciences, Inc. | | | 1,841,747 | |
| | 26,200 | | | Kaken Pharmaceutical Co. Ltd. | | | 1,717,726 | |
| | |
| | |
| 40 | | The accompanying notes are an integral part of these financial statements. |
GOLDMAN SACHS DYNAMIC ALLOCATION FUND
| | | | | | | | |
Shares | | | Description | | Value | |
| | Common Stocks – (continued) | |
| | Pharmaceuticals, Biotechnology & Life Sciences – (continued) | |
| | 18,367 | | | Novo Nordisk A/S Class B | | $ | 989,116 | |
| | 102,600 | | | Santen Pharmaceutical Co. Ltd. | | | 1,612,583 | |
| | 17,348 | | | United Therapeutics Corp.* | | | 1,837,500 | |
| | | | | | | | |
| | | | | | | 12,468,738 | |
| | |
| | Retailing – 3.4% | |
| | 81,906 | | | Aaron’s, Inc. | | | 1,792,922 | |
| | 43,433 | | | Bed Bath & Beyond, Inc.* | | | 1,877,174 | |
| | 62,141 | | | Best Buy Co., Inc. | | | 1,901,515 | |
| | 32,655 | | | Dillard’s, Inc. Class A | | | 1,978,893 | |
| | 89,370 | | | DSW, Inc. Class A | | | 1,892,857 | |
| | 34,591 | | | Foot Locker, Inc. | | | 1,897,662 | |
| | 562,107 | | | Office Depot, Inc.* | | | 1,860,574 | |
| | 211,921 | | | Staples, Inc. | | | 1,826,759 | |
| | 227,000 | | | Takashimaya Co. Ltd. | | | 1,625,898 | |
| | 95,332 | | | The Gap, Inc.(a) | | | 2,022,945 | |
| | | | | | | | |
| | | | | | | 18,677,199 | |
| | |
| | Semiconductors & Semiconductor Equipment – 1.7% | |
| | 58,180 | | | Intel Corp. | | | 1,908,304 | |
| | 178,828 | | | Marvell Technology Group Ltd. | | | 1,704,231 | |
| | 154,286 | | | Micron Technology, Inc.* | | | 2,122,975 | |
| | 34,513 | | | QUALCOMM, Inc. | | | 1,848,862 | |
| | 28,461 | | | Skyworks Solutions, Inc. | | | 1,801,012 | |
| | | | | | | | |
| | | | | | | 9,385,384 | |
| | |
| | Software & Services – 1.4% | |
| | 10,907 | | | Atos SE | | | 899,271 | |
| | 55,904 | | | CA, Inc. | | | 1,835,328 | |
| | 410,000 | | | Fujitsu Ltd. | | | 1,507,700 | |
| | 35,105 | | | Synopsys, Inc.* | | | 1,898,479 | |
| | 190,073 | | | Xerox Corp. | | | 1,803,793 | |
| | | | | | | | |
| | | | | | | 7,944,571 | |
| | |
| | Technology Hardware & Equipment – 4.4% | |
| | 43,919 | | | Avnet, Inc. | | | 1,779,159 | |
| | 204,176 | | | Brocade Communications Systems, Inc. | | | 1,874,336 | |
| | 144,200 | | | Brother Industries Ltd. | | | 1,546,737 | |
| | 298,500 | | | Citizen Holdings Co. Ltd. | | | 1,452,867 | |
| | 66,608 | | | EMC Corp. | | | 1,809,739 | |
| | 15,489 | | | F5 Networks, Inc.* | | | 1,763,268 | |
| | 80,266 | | | Juniper Networks, Inc. | | | 1,805,182 | |
| | 201,900 | | | Konica Minolta, Inc. | | | 1,470,753 | |
| | 75,346 | | | NetApp, Inc. | | | 1,852,758 | |
| | 45,700 | | | Omron Corp. | | | 1,491,683 | |
| | 181,700 | | | Ricoh Co. Ltd. | | | 1,575,064 | |
| | 93,100 | | | Seiko Epson Corp. | | | 1,492,544 | |
| | 123,639 | | | Telefonaktiebolaget LM Ericsson Class B | | | 949,863 | |
| | 39,718 | | | Western Digital Corp. | | | 1,877,073 | |
| | 143,700 | | | Yokogawa Electric Corp. | | | 1,620,519 | |
| | | | | | | | |
| | | | | | | 24,361,545 | |
| | |
| | Common Stocks – (continued) | |
| | Telecommunication Services – 0.5% | |
| | 58,088 | | | Orange SA | | $ | 944,540 | |
| | 1,129,580 | | | Telecom Italia SpA* | | | 927,735 | |
| | 53,446 | | | Vivendi SA | | | 999,906 | |
| | | | | | | | |
| | | | | | | 2,872,181 | |
| | |
| | Transportation – 1.7% | |
| | 75,177 | | | Deutsche Lufthansa AG (Registered) | | | 883,895 | |
| | 32,962 | | | Deutsche Post AG (Registered) | | | 928,622 | |
| | 142,327 | | | International Consolidated Airlines Group SA | | | 704,701 | |
| | 47,900 | | | Japan Airlines Co. Ltd. | | | 1,541,068 | |
| | 111,944 | | | JetBlue Airways Corp.* | | | 1,853,793 | |
| | 43,556 | | | Spirit Airlines, Inc.* | | | 1,954,358 | |
| | 44,076 | | | United Continental Holdings, Inc.* | | | 1,808,879 | |
| | | | | | | | |
| | | | | | | 9,675,316 | |
| | |
| | TOTAL COMMON STOCKS | |
| | (Cost $187,686,265) | | $ | 179,896,680 | |
| | |
| | | | | | | | | | |
Shares | | Description | | Rate | | | Value | |
| Preferred Stock – 0.2% | | | | | |
| Household & Personal Products – 0.2% | | | | | |
| 8,235 | | Henkel AG & Co.
KGaA | | | 1.470 | % | | $ | 1,006,404 | |
| (Cost $843,193) | | | | | | | | |
| |
| | | | | | | | | | | | | | |
Principal
Amount | | | Interest
Rate | | | Maturity
Date | | | Value | |
| | Commodity Index Linked Structured Notes(b)(c)(d)(e)(f) – 0.5% | |
| UBS AG | | | | | |
| $ | 500,000 | | | | 0.285 | % | | | 10/31/16 | | | $ | 725,627 | |
| | 1,130,000 | | | | 0.301 | | | | 06/23/17 | | | | 1,170,609 | |
| | 690,000 | | | | 0.296 | | | | 07/10/17 | | | | 743,286 | |
| | |
| TOTAL COMMODITY INDEX LINKED
STRUCTURED NOTES |
| | | | |
| | (Cost $2,320,000) | | | | | | | $ | 2,639,522 | |
| | |
| | | | | | |
| | U.S. Treasury Obligation – 4.3% | |
| United States Treasury Inflation-Protected Securities | |
| $ | 22,460,804 | | | | 0.625 | % | | | 01/15/26 | | | $ | 23,664,478 | |
| | (Cost $22,842,339) | | | | | | | | | |
| | |
| | |
| The accompanying notes are an integral part of these financial statements. | | 41 |
GOLDMAN SACHS DYNAMIC ALLOCATION FUND
Consolidated Schedule of Investments (continued)
June 30, 2016 (Unaudited)
| | | | | | | | |
Shares | | Distribution
Rate | | | Value | |
| Investment Company(f)(g) – 49.9% | |
Goldman Sachs Financial Square Government Fund – FST Institutional Shares | |
| 276,024,420 | | | 0.299 | % | | $ | 276,024,420 | |
| (Cost $276,024,420) | | | | | |
| |
TOTAL INVESTMENTS BEFORE SECURITIES LENDING REINVESTMENT VEHICLE | |
| (Cost $489,716,217) | | | $ | 483,231,504 | |
| |
| | | | | | | | |
| Securities Lending Reinvestment Vehicle(f)(g) – 0.3% | |
Goldman Sachs Financial Square Money Market Fund – FST Institutional Shares | |
| 1,887,700 | | | 0.397 | % | | $ | 1,887,700 | |
| (Cost $1,887,700) | | | | | |
| |
| TOTAL INVESTMENTS – 87.7% | |
| (Cost $491,603,917) | | | $ | 485,119,204 | |
| |
OTHER ASSETS IN EXCESS OF LIABILITIES – 12.3% | | | | 67,814,932 | |
| |
| NET ASSETS – 100.0% | | | $ | 552,934,136 | |
| |
| | |
| The percentage shown for each investment category reflects the value of investments in that category as a percentage of net assets. |
* | | Non-income producing security. |
(a) | | All or a portion of security is on loan. |
| | |
(b) | | Exempt from registration under Rule 144A of the Securities Act of 1933. Under procedures approved by the Board of Trustees, such securities may be deemed liquid by the Investment Adviser and may be resold, normally to qualified institutional buyers in transactions exempt from registration. Total market value of Rule 144A securities amounts to $2,639,522, which represents approximately 0.5% of net assets as of June 30, 2016. |
(c) | | Interest rate is LIBOR as of June 30, 2016 minus a spread. |
(d) | | Security is linked to the Bloomberg Petroleum Sub Index Total Return (the “BCOMPETR”). The BCOMPETR is a commodity group sub index of the Bloomberg Commodity Index Total Return. The BCOMPETR is composed of futures contracts on crude oil, heating oil, and unleaded gasoline. |
(e) | | These Structured Notes take into consideration a leverage factor of 300% on the return of the underlying linked index. |
(f) | | Variable rate security. Interest rate or distribution rate disclosed is that which is in effect on June 30, 2016. |
(g) | | Represents an affiliated issuer. |
| | |
|
Investment Abbreviations: |
CVA | | —Dutch Certification |
LIBOR | | —London Interbank Offered Rate |
| | |
Currency Abbreviations: |
CHF | | —Swiss Franc |
DKK | | —Denmark krone |
EUR | | —Euro Dollar |
JPY | | —Japanese Yen |
NOK | | —Norwegian Krone |
SEK | | —Swedish Krona |
USD | | —United States Dollar |
|
| | |
| 42 | | The accompanying notes are an integral part of these financial statements. |
GOLDMAN SACHS DYNAMIC ALLOCATION FUND
|
| ADDITIONAL INVESTMENT INFORMATION |
FORWARD FOREIGN CURRENCY EXCHANGE CONTRACTS — At June 30, 2016, the Fund had the following forward foreign currency exchange contracts:
FORWARD FOREIGN CURRENCY EXCHANGE CONTRACTS WITH UNREALIZED GAIN
| | | | | | | | | | | | | | | | | | | | | | | | |
| Counterparty | | Currency
Purchased | | | Currency
Sold | | | Settlement
Date | | | Current
Value | | | Unrealized
Gain | |
Morgan Stanley Co., Inc. | | CHF | | | 24,771 | | | USD | | | 25,289 | | | | 07/05/16 | | | $ | 25,367 | | | $ | 78 | |
| | CHF | | | 30,000 | | | USD | | | 30,762 | | | | 09/21/16 | | | | 30,863 | | | | 101 | |
| | DKK | | | 530,000 | | | USD | | | 79,180 | | | | 09/21/16 | | | | 79,317 | | | | 137 | |
| | EUR | | | 1,580,000 | | | USD | | | 1,755,002 | | | | 09/21/16 | | | | 1,758,535 | | | | 3,533 | |
| | JPY | | | 834,000,000 | | | USD | | | 7,989,308 | | | | 09/21/16 | | | | 8,098,411 | | | | 109,103 | |
| | NOK | | | 200,000 | | | USD | | | 23,579 | | | | 09/21/16 | | | | 23,895 | | | | 316 | |
| | SEK | | | 600,000 | | | USD | | | 70,834 | | | | 09/21/16 | | | | 71,164 | | | | 330 | |
| | USD | | | 7,354,669 | | | DKK | | | 48,701,093 | | | | 09/21/16 | | | | 7,288,394 | | | | 66,275 | |
| | USD | | | 387,931 | | | EUR | | | 349,000 | | | | 07/05/16 | | | | 387,303 | | | | 628 | |
| | USD | | | 56,864,262 | | | EUR | | | 50,620,000 | | | | 09/21/16 | | | | 56,339,907 | | | | 524,355 | |
| | USD | | | 637,012 | | | JPY | | | 65,443,411 | | | | 07/05/16 | | | | 633,743 | | | | 3,269 | |
| | USD | | | 2,861,332 | | | NOK | | | 23,900,000 | | | | 09/21/16 | | | | 2,855,427 | | | | 5,905 | |
| | | USD | | | 6,800,485 | | | SEK | | | 56,250,000 | | | | 09/21/16 | | | | 6,671,657 | | | | 128,828 | |
| TOTAL | | | | | | | | | | | | | | $ | 842,858 | |
FORWARD FOREIGN CURRENCY EXCHANGE CONTRACTS WITH UNREALIZED LOSS
| | | | | | | | | | | | | | | | | | | | | | | | |
| Counterparty | | Currency
Purchased | | | Currency
Sold | | | Settlement
Date | | | Current
Value | | | Unrealized
Loss | |
Morgan Stanley Co., Inc. | | CHF | | | 70,000 | | | USD | | | 73,239 | | | | 09/21/16 | | | $ | 72,015 | | | $ | (1,224 | ) |
| | DKK | | | 51,944 | | | USD | | | 7,762 | | | | 07/05/16 | | | | 7,751 | | | | (11 | ) |
| | DKK | | | 17,330,000 | | | USD | | | 2,656,631 | | | | 09/21/16 | | | | 2,593,533 | | | | (63,098 | ) |
| | EUR | | | 25,060,000 | | | USD | | | 28,540,333 | | | | 09/21/16 | | | | 27,891,704 | | | | (648,629 | ) |
| | JPY | | | 254,000,000 | | | USD | | | 2,484,726 | | | | 09/21/16 | | | | 2,466,423 | | | | (18,303 | ) |
| | NOK | | | 300,000 | | | USD | | | 36,862 | | | | 09/21/16 | | | | 35,842 | | | | (1,020 | ) |
| | SEK | | | 24,900,000 | | | USD | | | 3,029,809 | | | | 09/21/16 | | | | 2,953,320 | | | | (76,489 | ) |
| | USD | | | 2,838,976 | | | CHF | | | 2,790,000 | | | | 09/21/16 | | | | 2,870,298 | | | | (31,322 | ) |
| | USD | | | 72,012,534 | | | JPY | | | 7,802,000,000 | | | | 09/21/16 | | | | 75,759,956 | | | | (3,747,422 | ) |
| | USD | | | 3,327 | | | NOK | | | 27,917 | | | | 07/05/16 | | | | 3,336 | | | | (9 | ) |
| | USD | | | 37,869 | | | SEK | | | 320,538 | | | | 07/05/16 | | | | 37,885 | | | | (16 | ) |
| | | USD | | | 53,333 | | | SEK | | | 450,000 | | | | 09/21/16 | | | | 53,373 | | | | (40 | ) |
| TOTAL | | | | | | | | | | | | | | $ | (4,587,583 | ) |
| | |
| The accompanying notes are an integral part of these financial statements. | | 43 |
GOLDMAN SACHS DYNAMIC ALLOCATION FUND
Consolidated Schedule of Investments (continued)
June 30, 2016 (Unaudited)
|
| ADDITIONAL INVESTMENT INFORMATION (continued) |
FUTURES CONTRACTS — At June 30, 2016, the Fund had the following futures contracts:
| | | | | | | | | | | | | | |
| Type | | Number of
Contracts
Long (Short) | | | Expiration
Date | | Current
Value | | | Unrealized
Gain (Loss) | |
Amsterdam Index | | | 26 | | | July 2016 | | $ | 2,511,986 | | | $ | 38,892 | |
Brent Crude Futures | | | (2 | ) | | July 2016 | | | (99,420 | ) | | | 2,658 | |
CAC 40 Index | | | 25 | | | July 2016 | | | 1,174,670 | | | | 16,118 | |
CBOE Volatility Index | | | (73 | ) | | July 2016 | | | (1,239,175 | ) | | | 7,497 | |
Cocoa Futures | | | (12 | ) | | September 2016 | | | (355,560 | ) | | | 10,788 | |
Coffee ‘C’ Futures | | | 4 | | | September 2016 | | | 218,475 | | | | 18,671 | |
Corn Futures | | | 1 | | | September 2016 | | | 18,275 | | | | (2,739 | ) |
Cotton No. 2 Futures | | | 3 | | | December 2016 | | | 96,255 | | | | (1,533 | ) |
DAX Index | | | 10 | | | September 2016 | | | 2,682,404 | | | | 3,637 | |
Euro-BTP | | | 199 | | | September 2016 | | | 31,494,028 | | | | 362,785 | |
Euro-Bund | | | 58 | | | September 2016 | | | 10,756,762 | | | | 165,215 | |
Euro-Oat | | | 118 | | | September 2016 | | | 21,055,531 | | | | 343,382 | |
FTSE 100 Index | | | 273 | | | September 2016 | | | 23,341,371 | | | | 1,226,352 | |
FTSE/MIB Index | | | 17 | | | September 2016 | | | 1,527,277 | | | | 32,212 | |
Gasoline RBOB Futures | | | (9 | ) | | July 2016 | | | (567,491 | ) | | | 41,140 | |
Gold 100 oz. Futures | | | (1 | ) | | August 2016 | | | (132,060 | ) | | | (4,611 | ) |
Hang Seng Index | | | (29 | ) | | July 2016 | | | (3,915,024 | ) | | | (71,109 | ) |
IBEX 35 Index | | | (4 | ) | | July 2016 | | | (360,771 | ) | | | 4,682 | |
Lean Hogs Futures | | | 1 | | | August 2016 | | | 33,310 | | | | (1,331 | ) |
Live Cattle Futures | | | 1 | | | August 2016 | | | 45,930 | | | | (351 | ) |
LME Lead Futures | | | 2 | | | July 2016 | | | 89,288 | | | | 2,136 | |
LME Lead Futures | | | (2 | ) | | July 2016 | | | (89,288 | ) | | | (2,139 | ) |
LME Lead Futures | | | 2 | | | August 2016 | | | 89,388 | | | | 2,136 | |
LME Zinc Futures | | | 3 | | | July 2016 | | | 157,650 | | | | 5,548 | |
LME Zinc Futures | | | (3 | ) | | July 2016 | | | (157,650 | ) | | | (16,764 | ) |
LME Zinc Futures | | | (3 | ) | | August 2016 | | | (157,838 | ) | | | (5,627 | ) |
Long Gilt | | | 43 | | | September 2016 | | | 7,355,249 | | | | 191,136 | |
Low Sulphur Gas Oil Futures | | | (5 | ) | | August 2016 | | | (223,125 | ) | | | 1,994 | |
mini MSCI Emerging Markets Index Futures | | | 484 | | | September 2016 | | | 20,199,740 | | | | 99,362 | |
Natural Gas Futures | | | (20 | ) | | July 2016 | | | (584,800 | ) | | | (89,826 | ) |
OMX Stockholm 30 Index | | | 69 | | | July 2016 | | | 1,075,283 | | | | 7,412 | |
Russell 2000 Mini Index | | | (3 | ) | | September 2016 | | | (344,220 | ) | | | (6,816 | ) |
S&P 500 E-Mini Index | | | 270 | | | September 2016 | | | 28,217,700 | | | | 299,830 | |
S&P/TSX 60 Index | | | 80 | | | September 2016 | | | 10,104,416 | | | | 53,213 | |
Silver Futures | | | 1 | | | September 2016 | | | 93,115 | | | | 11,039 | |
Soybean Futures | | | 15 | | | November 2016 | | | 864,938 | | | | 45,664 | |
SPI 200 Index | | | 68 | | | September 2016 | | | 6,562,443 | | | | (110,007 | ) |
Sugar #11 (World) Futures | | | 41 | | | September 2016 | | | 933,554 | | | | 52,577 | |
TSE TOPIX Index | | | (470 | ) | | September 2016 | | | (56,687,648 | ) | | | 3,853,415 | |
Wheat Futures | | | (2 | ) | | September 2016 | | | (42,250 | ) | | | 6,747 | |
Wheat Futures | | | (16 | ) | | September 2016 | | | (356,400 | ) | | | 48,983 | |
WTI Crude Oil Futures | | | (5 | ) | | July 2016 | | | (241,650 | ) | | | 3,794 | |
10 Year Australian Government Bonds | | | 33 | | | September 2016 | | | 3,352,061 | | | | 16,439 | |
10 Year Canadian Government Bonds | | | 34 | | | September 2016 | | | 3,895,940 | | | | 29,031 | |
10 Year Japanese Government Bonds | | | 41 | | | September 2016 | | | 60,714,860 | | | | 283,656 | |
| TOTAL | | | | | | | | | $ | 6,975,288 | |
| | |
| 44 | | The accompanying notes are an integral part of these financial statements. |
GOLDMAN SACHS DYNAMIC ALLOCATION FUND
|
| ADDITIONAL INVESTMENT INFORMATION (continued) |
SWAP CONTRACTS — At June 30, 2016, the Fund had the following swap contracts:
CENTRALLY CLEARED CREDIT DEFAULT SWAP CONTRACTS
| | | | | | | | | | | | | | | | | | | | | | | | |
| | | | | | | | | | | | | | | Market Value | |
| Referenced Obligation | | Notional
Amount
(000’s) | | | Rates Received (Paid) | | | Termination
Date | | | Credit
Spread on
June 30,
2016(a) | | | Upfront
Payments
Made (Received) | | | Unrealized
Gain (Loss) | |
Protection Sold: | | | | | | | | | | | | | | | | | | | | | | | | |
Markit CDX North America High Yield Index | | $ | 59,490 | | | | 5.000 | % | | | 06/20/21 | | | | 4.263 | % | | $ | 1,447,982 | | | $ | 448,339 | |
Markit CDX North America Investment Grade Index | | | 39,690 | | | | 1.000 | | | | 06/20/21 | | | | 0.783 | | | | 421,268 | | | | (14,430 | ) |
| TOTAL | | | | | | | | | | | | | | | | | | $ | 1,869,250 | | | $ | 433,909 | |
| | (a) | | Credit spread on the Referenced Obligation, together with the period of expiration, are indicators of payment/performance risk. The likelihood of a credit event occurring which would require a fund to make a payment or otherwise be required to perform under the swap contract is generally greater as the credit spread and term of the swap contract increase. |
CENTRALLY CLEARED INTEREST RATE SWAP CONTRACT
| | | | | | | | | | | | | | | | | | |
| | | | | | Rates Exchanged | | Market Value | |
Notional
Amount (000’s)(a) | | | Termination
Date | | Payments Received | | | Payments Made | | Upfront
Payments Made (Received) | | | Unrealized
Gain (Loss) | |
| $ | 64,600 | | | 09/21/26 | | | 1.750 | % | | 3 Month LIBOR | | $ | 885,691 | | | $ | 1,069,022 | |
| | (a) | | Represents forward starting interest rate swaps whose effective dates of commencement of accruals and cash flows occur subsequent to June 30, 2016. |
| | |
| The accompanying notes are an integral part of these financial statements. | | 45 |
GOLDMAN SACHS DYNAMIC ALLOCATION FUND
Consolidated Schedule of Investments (continued)
June 30, 2016 (Unaudited)
|
| ADDITIONAL INVESTMENT INFORMATION (continued) |
OVER THE COUNTER TOTAL RETURN SWAP CONTRACTS
| | | | | | | | | | | | | | | | | | |
| Counterparty | | Referenced Obligation | | Notional
Amount
(000’s) | | | Rate Received
(Paid) | | | Termination
Date | | | Unrealized Gain (Loss)(a) | |
Barclays Bank PLC | | S&P GSCI Total Return Index(b) | | $ | 3,912 | | | | 0.013 | % | | | 02/16/17 | | | $ | (92,530 | ) |
Deutsche Bank AG | | FTSE NAREIT Mortgage Index(c) | | | 25,124 | | | | 0.642 | | | | 06/23/17 | | | | 762,680 | |
JPMorgan Chase Bank, N.A. | | S&P GSCI Total Return Index(b) | | | 7,388 | | | | 0.000 | | | | 02/02/17 | | | | 4,099 | |
| TOTAL | | | | | | | | | | | | | | | | $ | 674,249 | |
| | (a) | | There are no upfront payments on the swap contracts listed above, therefore the unrealized gains (losses) on the swap contracts are equal to their market value. |
| | (b) | | The Fund receives monthly payments based on any positive monthly return of the Referenced Obligation. The Fund makes payments on any negative monthly return of such Referenced Obligation. |
| | (c) | | The Fund receives quarterly payments based on any positive monthly return of the Referenced Obligation. The Fund makes payments on any negative monthly return of such Referenced Obligation. |
| | |
| 46 | | The accompanying notes are an integral part of these financial statements. |
GOLDMAN SACHS DYNAMIC COMMODITY STRATEGY FUND
Consolidated Schedule of Investments
June 30, 2016 (Unaudited)
| | | | | | | | |
Shares | | Distribution
Rate | | | Value | |
| Investment Company(a)(b) – 91.1% | |
Goldman Sachs Financial Square Government Fund – FST Institutional Shares | |
| 23,094,416 | | | 0.299 | % | | $ | 23,094,416 | |
| |
| TOTAL INVESTMENTS – 91.1% | |
| (Cost $23,094,416) | | | $ | 23,094,416 | |
| |
OTHER ASSETS IN EXCESS OF LIABILITIES – 8.9% | | | | 2,268,581 | |
| |
| NET ASSETS – 100.0% | | | $ | 25,362,997 | |
| |
| | |
| The percentage shown for each investment category reflects the value of investments in that category as a percentage of net assets. |
(a) | | Represents an affiliated issuer. |
(b) | | Variable rate security. Interest rate or distribution rate disclosed is that which is in effect on June 30, 2016. |
|
| ADDITIONAL INVESTMENT INFORMATION |
SWAP CONTRACTS — At June 30, 2016, the Fund had the following swap contracts:
OVER THE COUNTER TOTAL RETURN SWAP CONTRACTS(a)
| | | | | | | | | | | | | | | | | | |
| Counterparty | | Referenced Obligation | | Notional
Amount
(000’s) | | | Rate Received
(Paid) | | | Termination
Date | | | Unrealized
Gain (Loss)(b) | |
Merrill Lynch International | | Bloomberg Aluminum Subindex | | $ | 108 | | | | (0.180 | )% | | | 10/28/16 | | | $ | 6,204 | |
| | Bloomberg Brent Crude Subindex | | | 162 | | | | (0.150 | ) | | | 10/28/16 | | | | (1,867 | ) |
| | Bloomberg Coffee Subindex | | | 493 | | | | (0.180 | ) | | | 10/28/16 | | | | 75,552 | |
| | Bloomberg Corn Subindex | | | 1,781 | | | | (0.180 | ) | | | 10/28/16 | | | | (253,751 | ) |
| | Bloomberg Cotton Subindex | | | 353 | | | | (0.180 | ) | | | 10/28/16 | | | | 47 | |
| | Bloomberg Gold Subindex | | | 2,770 | | | | (0.180 | ) | | | 10/28/16 | | | | 208,567 | |
| | Bloomberg Heating Oil Subindex | | | 226 | | | | (0.150 | ) | | | 06/30/16 | | | | (7,882 | ) |
| | Bloomberg Heating Oil Subindex | | | 637 | | | | (0.130 | ) | | | 10/28/16 | | | | (2,572 | ) |
| | Bloomberg Kansas Wheat Subindex | | | 230 | | | | (0.180 | ) | | | 10/28/16 | | | | (9,651 | ) |
| | Bloomberg Lean Hogs Subindex | | | 545 | | | | (0.200 | ) | | | 10/28/16 | | | | 7,992 | |
| | Bloomberg Live Cattle Subindex | | | 658 | | | | (0.200 | ) | | | 10/28/16 | | | | (18,007 | ) |
| | Bloomberg Natural Gas Subindex | | | 500 | | | | (0.150 | ) | | | 10/28/16 | | | | 56,671 | |
| | Bloomberg Nickel Subindex | | | 510 | | | | (0.180 | ) | | | 10/28/16 | | | | 54,486 | |
| | Bloomberg Silver Subindex | | | 1,102 | | | | (0.180 | ) | | | 10/28/16 | | | | 149,807 | |
| | Bloomberg Soybean Meal Subindex | | | 355 | | | | (0.180 | ) | | | 06/30/16 | | | | 9,918 | |
| | Bloomberg Soybean Oil Subindex | | | 630 | | | | (0.180 | ) | | | 06/30/16 | | | | 12,621 | |
| | Bloomberg Sugar Subindex | | | 891 | | | | (0.180 | ) | | | 10/28/16 | | | | 146,514 | |
| | Bloomberg Unleaded Gasoline Subindex | | | 932 | | | | (0.150 | ) | | | 10/28/16 | | | | (52,980 | ) |
| | Bloomberg Wheat Subindex | | | 700 | | | | (0.180 | ) | | | 10/28/16 | | | | (29,364 | ) |
| | Bloomberg Zinc Subindex | | | 1,160 | | | | (0.180 | ) | | | 10/28/16 | | | | 109,679 | |
| | |
| The accompanying notes are an integral part of these financial statements. | | 47 |
GOLDMAN SACHS DYNAMIC COMMODITY STRATEGY FUND
Consolidated Schedule of Investments (continued)
June 30, 2016 (Unaudited)
|
| ADDITIONAL INVESTMENT INFORMATION (continued) |
OVER THE COUNTER TOTAL RETURN SWAP CONTRACTS(a) (continued)
| | | | | | | | | | | | | | | | | | |
| Counterparty | | Referenced Obligation | | Notional
Amount
(000’s) | | | Rate Received
(Paid) | | | Termination
Date | | | Unrealized Gain (Loss)(b) | |
UBS AG | | Bloomberg Brent Crude Subindex | | $ | 675 | | | | (0.150 | )% | | | 09/19/16 | | | $ | (7,834 | ) |
| | Bloomberg Brent Crude Subindex | | | 1,479 | | | | (0.130 | ) | | | 09/19/16 | | | | (32,292 | ) |
| | Bloomberg Copper Subindex | | | 1,247 | | | | (0.160 | ) | | | 09/19/16 | | | | 52,885 | |
| | Bloomberg Heating Oil Subindex | | | 210 | | | | (0.150 | ) | | | 09/19/16 | | | | (1,031 | ) |
| | Bloomberg Natural Gas Subindex | | | 975 | | | | (0.180 | ) | | | 09/19/16 | | | | 233,699 | |
| | Bloomberg Unleaded Gasoline Subindex | | | 110 | | | | (0.150 | ) | | | 09/19/16 | | | | (8,520 | ) |
| | Bloomberg WTI Crude Oil Subindex | | | 750 | | | | (0.130 | ) | | | 06/30/16 | | | | 6,477 | |
| | | Bloomberg WTI Crude Oil Subindex | | | 1,093 | | | | (0.130 | ) | | | 09/19/16 | | | | (35,758 | ) |
| TOTAL | | | | | | | | | | | | | | | | $ | 669,610 | |
| | (a) | | The Fund receives monthly payments based on any positive monthly return of the Referenced Obligation. The Fund makes payments on any negative monthly return of such Referenced Obligation. |
| | (b) | | There are no upfront payments on the swap contracts listed above, therefore the unrealized gains (losses) on the swap contracts are equal to their market value. |
| | |
| 48 | | The accompanying notes are an integral part of these financial statements. |
GOLDMAN SACHS MANAGED FUTURES STRATEGY FUND
Schedule of Investments
June 30, 2016 (Unaudited)
| | | | | | | | | | | | | | |
Principal
Amount | | | Interest
Rate | | | Maturity
Date | | | Value | |
| | | | | | | | | | | | | | |
| | Commodity Index Linked Structured Notes(a)(b)(c)(d) – 5.0% | |
| JPMorgan Chase Bank, N.A.(e) | |
| $ | 1,003,000 | | | | 0.379 | % | | | 04/03/17 | | | $ | 1,355,625 | |
| | 502,000 | | | | 0.326 | | | | 05/15/17 | | | | 643,258 | |
| | 708,000 | | | | 0.297 | | | | 07/17/17 | | | | 782,503 | |
| UBS AG(f) | |
| | 129,000 | | | | 0.284 | | | | 11/15/16 | | | | 154,343 | |
| | 710,000 | | | | 0.288 | | | | 04/28/17 | | | | 1,143,948 | |
| | 17,000 | | | | 0.284 | | | | 05/15/17 | | | | 16,326 | |
| | 780,000 | | | �� | 0.319 | | | | 05/02/17 | | | | 953,053 | |
| | 510,000 | | | | 0.298 | | | | 06/19/17 | | | | 569,989 | |
| | 390,000 | | | | 0.302 | | | | 06/26/17 | | | | 341,918 | |
| | 60,000 | | | | 0.295 | | | | 07/03/17 | | | | 46,861 | |
| | 20,000 | | | | 0.297 | | | | 07/03/17 | | | | 28,377 | |
| | 250,000 | | | | 0.298 | | | | 07/17/17 | | | | 187,286 | |
| | 280,000 | | | | 0.303 | | | | 07/20/17 | | | | 226,161 | |
| | 2,830,000 | | | | 0.000 | | | | 07/28/17 | | | | 2,784,093 | |
| | |
| TOTAL COMMODITY INDEX LINKED
STRUCTURED NOTES |
|
| | (Cost $8,189,000) | | | $ | 9,233,741 | |
| | |
| | | | | | | | |
| Shares | | Distribution
Rate | | | Value | |
| Investment Company(d)(g) – 81.7% | |
Goldman Sachs Financial Square Government Fund – FST Institutional Shares | |
| $149,064,637 | | | 0.299 | % | | $ | 149,064,637 | |
| (Cost $149,064,637) | |
| |
| TOTAL INVESTMENTS – 86.7% | |
| (Cost $157,253,637) | | | $ | 158,298,378 | |
| |
| OTHER ASSETS IN EXCESS OF LIABILITIES – 13.3% | | | | 24,205,833 | |
| |
| NET ASSETS – 100.0% | | | $ | 182,504,211 | |
| |
| | |
| The percentage shown for each investment category reflects the value of investments in that category as a percentage of net assets. |
(a) | | Exempt from registration under Rule 144A of the Securities Act of 1933. Under procedures approved by the Board of Trustees, such securities may be deemed liquid by the Investment Adviser and may be resold, normally to qualified institutional buyers in transactions exempt from registration. Total market value of Rule 144A securities amounts to $9,233,741, which represents approximately 5.0% of net assets as of June 30, 2016. |
(b) | | Interest rate is LIBOR as of June 30, 2016 minus a spread. |
(c) | | These Structured Notes take into consideration a leverage factor of 300% on the return of the underlying linked index. |
(d) | | Variable rate security. Interest rate or distribution rate disclosed is that which is in effect on June 30, 2016. |
(e) | | Security is linked to the Bloomberg Precious Metals Sub Index Total Return (the “BCOMPRTR”). The BCOMPRTR is commodity group sub-index of the Bloomberg Commodity Index Total Return. The BCOMPRTR is composed of futures contracts on gold and silver. |
| | |
(f) | | Security is linked to the Bloomberg Grains Sub Index Total Return (the “BCOMGRTR”), the Bloomberg Livestock Sub Index Total Return (the “BCOMLITR”), and Bloomberg Softs Sub Index Total Return (the “BCOMSOTR”). The BCOMGRTR, BCOMLITR and BCOMSOTR are commodity group sub-indices of the Bloomberg Commodity Index Total Return. The BCOMGRTR is composed of futures contracts on corn, soybeans and wheat. The BCOMLITR is composed of futures contracts on live cattle and lean hogs. The BCOMSOTR is composed of futures contracts on coffee, cotton and sugar. |
(g) | | Represents an affiliated issuer. |
| | |
|
Investment Abbreviations: |
BA | | —Banker Acceptance Rate |
BUBOR | | —Budapest Interbank Offered Rate |
EURIBOR | | —Euro Interbank Offered Rate |
JIBAR | | —Johannesburg Interbank Agreed Rate |
LIBOR | | —London Interbank Offered Rate |
PRIBOR | | —Prague Interbank Offered Rate |
STIBOR | | —Stockholm Interbank Offered Rate |
TIIE | | —Interbank Equilibrium Interest Rate |
WIBOR | | —Warsaw Interbank Offered Rate |
| | |
Currency Abbreviations: |
AUD | | —Australian Dollar |
BRL | | —Brazilian Real |
CAD | | —Canadian Dollar |
CHF | | —Swiss Franc |
CLP | | —Chilean Peso |
COP | | —Colombian Peso |
CZK | | —Czech Koruna |
EUR | | —Euro |
GBP | | —British Pound |
HUF | | —Hungarian Forint |
IDR | | —Indonesian Rupiah |
INR | | —Indian Rupee |
JPY | | —Japanese Yen |
KRW | | —South Korean Won |
MXN | | —Mexican Peso |
MYR | | —Malaysian Ringgit |
NOK | | —Norwegian Krone |
NZD | | —New Zealand Dollar |
PLN | | —Polish Zloty |
RUB | | —Russian Ruble |
SEK | | —Swedish Krona |
TRY | | —Turkish Lira |
USD | | —United States Dollar |
ZAR | | —South African Rand |
|
| | |
| The accompanying notes are an integral part of these financial statements. | | 49 |
GOLDMAN SACHS MANAGED FUTURES STRATEGY FUND
Schedule of Investments (continued)
June 30, 2016 (Unaudited)
|
| ADDITIONAL INVESTMENT INFORMATION |
FORWARD FOREIGN CURRENCY EXCHANGE CONTRACTS — At June 30, 2016, the Fund had the following forward foreign currency exchange contracts:
FORWARD FOREIGN CURRENCY EXCHANGE CONTRACTS WITH UNREALIZED GAIN
| | | | | | | | | | | | | | | | | | | | | | | | |
| Counterparty | | Currency Purchased | | | Currency Sold | | | Settlement Date | | | Current Value | | | Unrealized Gain | |
Morgan Stanley Co., Inc. | | AUD | | | 2,900,000 | | | USD | | | 2,126,995 | | | | 09/21/16 | | | $ | 2,156,573 | | | $ | 29,578 | |
| | BRL | | | 12,700,000 | | | USD | | | 3,547,115 | | | | 07/05/16 | | | | 3,953,555 | | | | 406,440 | |
| | BRL | | | 11,420,000 | | | USD | | | 3,380,619 | | | | 08/02/16 | | | | 3,523,263 | | | | 142,644 | |
| | CAD | | | 33,500 | | | USD | | | 25,795 | | | | 07/05/16 | | | | 25,930 | | | | 135 | |
| | CAD | | | 8,099,000 | | | USD | | | 6,193,861 | | | | 09/21/16 | | | | 6,269,804 | | | | 75,943 | |
| | CHF | | | 483,000 | | | USD | | | 491,344 | | | | 09/21/16 | | | | 496,901 | | | | 5,557 | |
| | CLP | | | 3,030,000,000 | | | USD | | | 4,377,763 | | | | 09/21/16 | | | | 4,545,311 | | | | 167,548 | |
| | COP | | | 7,194,000,000 | | | USD | | | 2,288,959 | | | | 09/21/16 | | | | 2,421,932 | | | | 132,973 | |
| | CZK | | | 760,000 | | | USD | | | 31,140 | | | | 09/21/16 | | | | 31,239 | | | | 99 | |
| | EUR | | | 11,000 | | | USD | | | 12,203 | | | | 09/21/16 | | | | 12,243 | | | | 40 | |
| | IDR | | | 90,000,000,000 | | | USD | | | 6,564,498 | | | | 09/21/16 | | | | 6,752,251 | | | | 187,753 | |
| | INR | | | 18,000,000 | | | USD | | | 261,578 | | | | 09/21/16 | | | | 263,059 | | | | 1,481 | |
| | JPY | | | 1,089,738,000 | | | USD | | | 10,011,850 | | | | 09/21/16 | | | | 10,581,709 | | | | 569,859 | |
| | KRW | | | 7,320,000,000 | | | USD | | | 6,217,016 | | | | 09/21/16 | | | | 6,344,419 | | | | 127,403 | |
| | MXN | | | 22,750,000 | | | USD | | | 1,197,148 | | | | 09/21/16 | | | | 1,234,459 | | | | 37,311 | |
| | MYR | | | 14,880,000 | | | USD | | | 3,631,926 | | | | 09/21/16 | | | | 3,722,421 | | | | 90,495 | |
| | NZD | | | 8,760,000 | | | USD | | | 6,112,373 | | | | 09/21/16 | | | | 6,229,428 | | | | 117,055 | |
| | RUB | | | 202,500,000 | | | USD | | | 2,964,361 | | | | 09/21/16 | | | | 3,100,515 | | | | 136,154 | |
| | SEK | | | 3,187,000 | | | USD | | | 374,996 | | | | 07/05/16 | | | | 376,683 | | | | 1,687 | |
| | SEK | | | 3,540,000 | | | USD | | | 415,814 | | | | 09/21/16 | | | | 419,869 | | | | 4,055 | |
| | TRY | | | 15,770,000 | | | USD | | | 5,265,827 | | | | 09/21/16 | | | | 5,381,833 | | | | 116,006 | |
| | USD | | | 59,594 | | | AUD | | | 80,000 | | | | 09/21/16 | | | | 59,491 | | | | 103 | |
| | USD | | | 222,286 | | | BRL | | | 720,000 | | | | 08/02/16 | | | | 222,132 | | | | 154 | |
| | USD | | | 74,152 | | | COP | | | 220,000,000 | | | | 09/21/16 | | | | 74,065 | | | | 87 | |
| | USD | | | 3,125,978 | | | CZK | | | 74,642,000 | | | | 09/21/16 | | | | 3,068,091 | | | | 57,887 | |
| | USD | | | 4,903,553 | | | EUR | | | 4,332,000 | | | | 09/21/16 | | | | 4,821,502 | | | | 82,051 | |
| | USD | | | 6,954,335 | | | GBP | | | 4,831,250 | | | | 09/21/16 | | | | 6,436,569 | | | | 517,766 | |
| | USD | | | 2,424,158 | | | HUF | | | 679,396,000 | | | | 09/21/16 | | | | 2,387,460 | | | | 36,698 | |
| | USD | | | 27,060 | | | IDR | | | 360,000,000 | | | | 09/21/16 | | | | 27,009 | | | | 51 | |
| | USD | | | 292,383 | | | INR | | | 20,000,000 | | | | 09/21/16 | | | | 292,289 | | | | 94 | |
| | USD | | | 860,600 | | | JPY | | | 88,000,000 | | | | 09/21/16 | | | | 854,508 | | | | 6,092 | |
| | USD | | | 244,504 | | | MXN | | | 4,500,000 | | | | 09/21/16 | | | | 244,179 | | | | 325 | |
| | USD | | | 611,986 | | | NOK | | | 5,100,000 | | | | 09/21/16 | | | | 609,317 | | | | 2,669 | |
| | USD | | | 4,316,847 | | | PLN | | | 16,909,000 | | | | 09/21/16 | | | | 4,278,104 | | | | 38,743 | |
| | USD | | | 6,831,579 | | | SEK | | | 56,356,600 | | | | 09/21/16 | | | | 6,684,302 | | | | 147,277 | |
| | | ZAR | | | 57,530,000 | | | USD | | | 3,693,129 | | | | 09/21/16 | | | | 3,843,304 | | | | 150,175 | |
| TOTAL | | | | | | | | | | | | | | | | | | | | | | $ | 3,390,388 | |
| | |
| 50 | | The accompanying notes are an integral part of these financial statements. |
GOLDMAN SACHS MANAGED FUTURES STRATEGY FUND
|
| ADDITIONAL INVESTMENT INFORMATION (continued) |
FORWARD FOREIGN CURRENCY EXCHANGE CONTRACTS WITH UNREALIZED LOSS
| | | | | | | | | | | | | | | | | | | | | | | | |
| Counterparty | | Currency Purchased | | | Currency Sold | | | Settlement Date | | | Current Value | | | Unrealized Loss | |
Morgan Stanley Co., Inc. | | AUD | | | 7,620,000 | | | USD | | | 5,710,093 | | | | 09/21/16 | | | $ | 5,666,582 | | | $ | (43,511 | ) |
| | CAD | | | 1,153,000 | | | USD | | | 900,991 | | | | 09/21/16 | | | | 892,590 | | | | (8,401 | ) |
| | CHF | | | 29,000 | | | USD | | | 30,060 | | | | 09/21/16 | | | | 29,835 | | | | (225 | ) |
| | CZK | | | 121,720,000 | | | USD | | | 5,096,340 | | | | 09/21/16 | | | | 5,003,188 | | | | (93,152 | ) |
| | EUR | | | 8,573,000 | | | USD | | | 9,666,155 | | | | 09/21/16 | | | | 9,541,723 | | | | (124,432 | ) |
| | GBP | | | 1,171,000 | | | USD | | | 1,659,356 | | | | 09/21/16 | | | | 1,560,098 | | | | (99,258 | ) |
| | HUF | | | 1,661,363,000 | | | USD | | | 6,031,428 | | | | 09/21/16 | | | | 5,838,184 | | | | (193,244 | ) |
| | IDR | | | 360,000,000 | | | USD | | | 27,056 | | | | 09/21/16 | | | | 27,009 | | | | (47 | ) |
| | INR | | | 624,000,000 | | | USD | | | 9,133,641 | | | | 09/21/16 | | | | 9,119,386 | | | | (14,255 | ) |
| | JPY | | | 98,000,000 | | | USD | | | 956,098 | | | | 09/21/16 | | | | 951,612 | | | | (4,486 | ) |
| | KRW | | | 1,300,000,000 | | | USD | | | 1,129,355 | | | | 09/21/16 | | | | 1,126,741 | | | | (2,614 | ) |
| | NOK | | | 33,000,000 | | | USD | | | 3,966,541 | | | | 09/21/16 | | | | 3,942,639 | | | | (23,902 | ) |
| | NZD | | | 640,000 | | | USD | | | 457,556 | | | | 09/21/16 | | | | 455,118 | | | | (2,438 | ) |
| | PLN | | | 16,230,000 | | | USD | | | 4,172,663 | | | | 09/21/16 | | | | 4,106,311 | | | | (66,352 | ) |
| | SEK | | | 56,709,000 | | | USD | | | 6,953,527 | | | | 09/21/16 | | | | 6,726,098 | | | | (227,429 | ) |
| | USD | | | 3,091,297 | | | AUD | | | 4,280,000 | | | | 09/21/16 | | | | 3,182,805 | | | | (91,508 | ) |
| | USD | | | 3,767,484 | | | BRL | | | 12,700,000 | | | | 07/05/16 | | | | 3,953,553 | | | | (186,069 | ) |
| | USD | | | 423,774 | | | CAD | | | 554,000 | | | | 09/21/16 | | | | 428,877 | | | | (5,103 | ) |
| | USD | | | 937,938 | | | CHF | | | 914,000 | | | | 09/21/16 | | | | 940,306 | | | | (2,368 | ) |
| | USD | | | 460,240 | | | CLP | | | 310,000,000 | | | | 09/21/16 | | | | 465,031 | | | | (4,791 | ) |
| | USD | | | 668,291 | | | COP | | | 2,068,000,000 | | | | 09/21/16 | | | | 696,213 | | | | (27,922 | ) |
| | USD | | | 31,064 | | | CZK | | | 760,000 | | | | 07/07/16 | | | | 31,168 | | | | (104 | ) |
| | USD | | | 2,488,664 | | | CZK | | | 60,866,000 | | | | 09/21/16 | | | | 2,501,842 | | | | (13,178 | ) |
| | USD | | | 6,795,908 | | | EUR | | | 6,119,000 | | | | 09/21/16 | | | | 6,810,429 | | | | (14,521 | ) |
| | USD | | | 127,404 | | | GBP | | | 96,000 | | | | 09/21/16 | | | | 127,899 | | | | (495 | ) |
| | USD | | | 5,536,224 | | | HUF | | | 1,584,000,000 | | | | 09/21/16 | | | | 5,566,324 | | | | (30,100 | ) |
| | USD | | | 354,751 | | | IDR | | | 4,860,000,000 | | | | 09/21/16 | | | | 364,621 | | | | (9,870 | ) |
| | USD | | | 102,197 | | | INR | | | 7,000,000 | | | | 09/21/16 | | | | 102,301 | | | | (104 | ) |
| | USD | | | 2,360,976 | | | JPY | | | 252,517,000 | | | | 09/21/16 | | | | 2,452,022 | | | | (91,046 | ) |
| | USD | | | 4,280,030 | | | KRW | | | 5,060,000,000 | | | | 09/21/16 | | | | 4,385,624 | | | | (105,594 | ) |
| | USD | | | 5,397,191 | | | MXN | | | 101,403,000 | | | | 09/21/16 | | | | 5,502,328 | | | | (105,137 | ) |
| | USD | | | 2,887,138 | | | MYR | | | 11,760,000 | | | | 09/21/16 | | | | 2,941,912 | | | | (54,774 | ) |
| | USD | | | 3,383,844 | | | NOK | | | 28,600,000 | | | | 09/21/16 | | | | 3,416,953 | | | | (33,109 | ) |
| | USD | | | 108,443 | | | NZD | | | 160,000 | | | | 09/21/16 | | | | 113,780 | | | | (5,337 | ) |
| | USD | | | 4,809,409 | | | PLN | | | 19,260,000 | | | | 09/21/16 | | | | 4,872,925 | | | | (63,516 | ) |
| | USD | | | 53,135 | | | RUB | | | 3,500,000 | | | | 09/21/16 | | | | 53,589 | | | | (454 | ) |
| | USD | | | 8,627,873 | | | SEK | | | 73,237,000 | | | | 09/21/16 | | | | 8,686,439 | | | | (58,566 | ) |
| | USD | | | 162,522 | | | TRY | | | 480,000 | | | | 09/21/16 | | | | 163,809 | | | | (1,287 | ) |
| | USD | | | 3,609,167 | | | ZAR | | | 57,458,000 | | | | 09/21/16 | | | | 3,838,494 | | | | (229,327 | ) |
| | | ZAR | | | 420,000 | | | USD | | | 28,124 | | | | 09/21/16 | | | | 28,058 | | | | (66 | ) |
| TOTAL | | | | | | | | | | | | | | | | | | | | | | $ | (2,038,092 | ) |
| | |
| The accompanying notes are an integral part of these financial statements. | | 51 |
GOLDMAN SACHS MANAGED FUTURES STRATEGY FUND
Schedule of Investments (continued)
June 30, 2016 (Unaudited)
|
| ADDITIONAL INVESTMENT INFORMATION (continued) |
FUTURES CONTRACTS — At June 30, 2016, the Fund had the following futures contracts:
| | | | | | | | | | | | | | |
| Type | | Number of Contracts
Long (Short) | | | Expiration Date | | Current Value | | | Unrealized
Gain (Loss) | |
Amsterdam Index | | | 5 | | | July 2016 | | $ | 483,074 | | | $ | 10,095 | |
BIST 30 Index | | | (1,449 | ) | | August 2016 | | | (4,825,802 | ) | | | (56,421 | ) |
CAC 40 Index | | | (35 | ) | | July 2016 | | | (1,644,539 | ) | | | 19,680 | |
DAX Index | | | (6 | ) | | September 2016 | | | (1,609,443 | ) | | | 22,850 | |
DJIA Mini E-CBOT | | | 33 | | | September 2016 | | | 2,940,135 | | | | 12,717 | |
FTSE 100 Index | | | 16 | | | September 2016 | | | 1,367,992 | | | | 68,866 | |
FTSE/JSE Top 40 Index | | | 52 | | | September 2016 | | | 1,639,864 | | | | (44,446 | ) |
FTSE/MIB Index | | | (14 | ) | | September 2016 | | | (1,257,757 | ) | | | 10,806 | |
Hang Seng Index | | | (4 | ) | | July 2016 | | | (540,003 | ) | | | (4,880 | ) |
H-Shares Index | | | (46 | ) | | July 2016 | | | (2,586,651 | ) | | | (33,100 | ) |
IBEX 35 Index | | | (15 | ) | | July 2016 | | | (1,352,891 | ) | | | 3,620 | |
KOSPI 200 Index | | | (34 | ) | | September 2016 | | | (3,604,853 | ) | | | (41,011 | ) |
MSCI Taiwan Index | | | 115 | | | July 2016 | | | 3,651,250 | | | | 28,628 | |
NASDAQ 100 E-mini Index | | | 8 | | | September 2016 | | | 705,120 | | | | (6,322 | ) |
Nikkei 225 Index | | | (9 | ) | | September 2016 | | | (1,356,994 | ) | | | 68,147 | |
OMX Stockholm 30 Index | | | (117 | ) | | July 2016 | | | (1,823,307 | ) | | | (44,882 | ) |
Russell 2000 Mini Index | | | 19 | | | September 2016 | | | 2,180,060 | | | | (13,340 | ) |
S&P 500 E-Mini Index | | | 26 | | | September 2016 | | | 2,717,260 | | | | 7,816 | |
S&P/TSX 60 Index | | | 22 | | | September 2016 | | | 2,778,714 | | | | 17,130 | |
SET50 Index | | | 1,073 | | | September 2016 | | | 5,512,789 | | | | 114,590 | |
SGX S&P CNX Nifty Index | | | 182 | | | July 2016 | | | 3,034,122 | | | | 68,356 | |
SPI 200 Index | | | 15 | | | September 2016 | | | 1,447,598 | | | | (28,712 | ) |
TSE TOPIX Index | | | (11 | ) | | September 2016 | | | (1,326,732 | ) | | | 95,574 | |
| TOTAL | | | | | | | | | | | | $ | 275,761 | |
| | |
| 52 | | The accompanying notes are an integral part of these financial statements. |
GOLDMAN SACHS MANAGED FUTURES STRATEGY FUND
|
| ADDITIONAL INVESTMENT INFORMATION (continued) |
SWAP CONTRACTS — At June 30, 2016, the Fund had the following swap contracts:
CENTRALLY CLEARED INTEREST RATE SWAP CONTRACTS
| | | | | | | | | | | | | | | | |
| | | | | | Rates Exchanged | | Market Value | |
Notional Amount (000’s)(a) | | | Termination Date | | Payments Received | | Payments Made | | Upfront
Payments
Made (Received) | | | Unrealized
Gain (Loss) | |
| EUR | 474,580 | | | 09/21/17 | | 0.000% | | 6 Month EURIBOR | | $ | 62,902 | | | $ | 994,205 | |
| GBP | 273,690 | | | 09/21/17 | | 0.750 | | 6 Month LIBOR | | | 112,352 | | | | 821,346 | |
| SEK | 3,959,870 | | | 09/21/17 | | 0.000 | | 3 Month STIBOR | | | 232,673 | | | | 2,151,804 | |
| $ | 380,240 | | | 09/21/17 | | 0.900 | | 3 Month LIBOR | | | 141,621 | | | | 637,107 | |
| EUR | 115,130 | | | 09/21/18 | | 6 Month EURIBOR | | 0.000% | | | 5,338 | | | | (538,921 | ) |
| GBP | 73,600 | | | 09/21/18 | | 6 Month LIBOR | | 1.000 | | | 41,015 | | | | (1,099,622 | ) |
| JPY | 15,444,510 | | | 09/21/18 | | 6 Month LIBOR | | 0.000 | | | 323 | | | | (490,177 | ) |
| $ | 139,350 | | | 09/21/18 | | 3 Month LIBOR | | 1.000 | | | (624,567 | ) | | | (20,407 | ) |
| CZK | 368,080 | | | 09/21/21 | | 0.500 | | 6 Month PRIBOR | | | 129,299 | | | | 34,159 | |
| HUF | 5,136,700 | | | 09/21/21 | | 1.500 | | 6 Month BUBOR | | | (498,258 | ) | | | 668,440 | |
| MXN | 12,290 | | | 09/21/21 | | 5.750 | | 1 Month TIIE | | | (7,879 | ) | | | 11,490 | |
| PLN | 14,390 | | | 09/21/21 | | 6 Month WIBOR | | 2.000 | | | 39 | | | | (30,541 | ) |
| ZAR | 170,000 | | | 09/21/21 | | 8.750 | | 3 Month JIBAR | | | 238,387 | | | | 126,890 | |
| CAD | 13,980 | | | 09/21/26 | | 1.500 | | 3 Month BA | | | (10,818 | ) | | | 195,021 | |
| CHF | 10,940 | | | 09/21/26 | | 0.000 | | 6 Month LIBOR | | | (29,698 | ) | | | 488,698 | |
| EUR | 28,610 | | | 09/21/26 | | 0.500 | | 6 Month EURIBOR | | | (187,312 | ) | | | 331,183 | |
| GBP | 54,560 | | | 09/21/26 | | 1.500 | | 6 Month LIBOR | | | (234,370 | ) | | | 3,747,997 | |
| JPY | 1,538,060 | | | 09/21/26 | | 0.250 | | 6 Month LIBOR | | | 220,503 | | | | 194,207 | |
| SEK | 97,140 | | | 09/21/26 | | 1.000 | | 3 Month STIBOR | | | (499,554 | ) | | | 730,296 | |
| $ | 89,400 | | | 09/21/26 | | 1.750 | | 3 Month LIBOR | | | 1,116,123 | | | | 1,590,933 | |
| EUR | 1,910 | | | 09/21/46 | | 1.000 | | 6 Month EURIBOR | | | 37,991 | | | | 10,665 | |
| GBP | 12,100 | | | 09/21/46 | | 6 Month LIBOR | | 1.750 | | | (41,225 | ) | | | (2,243,882 | ) |
| JPY | 830,080 | | | 09/21/46 | | 0.500 | | 6 Month LIBOR | | | (527,110 | ) | | | 1,236,342 | |
| $ | 20,500 | | | 09/21/46 | | 3 Month LIBOR | | 2.000 | | | (61,904 | ) | | | (511,521 | ) |
| | | | | | | | | | | | | | | | |
| | TOTAL | | $ | (384,129 | ) | | $ | 9,035,712 | |
| | | | | | | | | | | | | | | | |
| | (a) | | Represents forward starting interest rate swaps whose effective dates of commencement of accruals and cash flows occur subsequent to June 30, 2016. |
| | |
| The accompanying notes are an integral part of these financial statements. | | 53 |
GOLDMAN SACHS SELECT SATELLITE FUNDS
Statements of Assets and Liabilities
June 30, 2016 (Unaudited)
| | | | | | |
| | | | | Absolute Return
Tracker Fund(a) | |
| | Assets: | |
| | Investments in unaffiliated issuers, at value (cost $157,953,258, $180,976,851, $213,691,797, $0 and $8,189,000)(b) | | $ | 169,243,167 | |
| | Investments in affiliated issuers, at value (cost $702,903,210, $154,503,042, $276,024,420, $23,094,416 and $149,064,637) | | | 702,903,210 | |
| | Investments in affiliated securities lending reinvestment vehicle, at value which equals cost | | | 5,009,650 | |
| | Cash | | | 55,518,824 | |
| | Foreign currencies, at value (cost $141,154, $0, $14,634,972, $0, and $2,637,167 ) | | | 137,632 | |
| | Receivables: | | | | |
| | Collateral on certain derivative contracts(c) | | | 50,304,754 | |
| | Fund shares sold | | | 5,324,547 | |
| | Due from broker | | | 990,000 | |
| | Dividends and interest | | | 232,489 | |
| | Reimbursement from investment adviser | | | 44,279 | |
| | Securities lending income | | | 39,395 | |
| | Investments sold | | | — | |
| | Investments sold on an extended-settlement basis | | | — | |
| | Foreign tax reclaims | | | — | |
| | Unrealized gain on forward foreign currency exchange contracts | | | 792,096 | |
| | Variation margin on certain derivative contracts | | | 2,639,719 | |
| | Unrealized gain on swap contracts | | | 1,602,498 | |
| | Total assets | | | 994,782,260 | |
| | | | | | |
| | Liabilities: | | | | |
| | Written options, at value (premiums received $4,072,623, $0, $0, $0 and $0) | | | 1,550,871 | |
| | Unrealized loss on swap contracts | | | 1,180,171 | |
| | Unrealized loss on forward foreign currency exchange contracts | | | 493,019 | |
| | Variation margin on certain derivative contracts | | | — | |
| | Payables: | | | | |
| | Payable upon return of securities loaned | | | 5,009,650 | |
| | Fund shares redeemed | | | 1,328,493 | |
| | Management fees | | | 471,554 | |
| | Distribution and Service fees and Transfer Agency fees | | | 61,662 | |
| | Collateral on certain derivative contracts(c) | | | 50,000 | |
| | Investments purchased | | | — | |
| | Investments purchased on an extended-settlement basis | | | — | |
| | Forward sale contracts, at value (proceeds received $0, $4,184,063, $0, $0 and $0) | | | — | |
| | Accrued expenses | | | 278,878 | |
| | Total liabilities | | | 10,424,298 | |
| | | | | | |
| | Net Assets: | | | | |
| | Paid-in capital | | | 991,941,484 | |
| | Undistributed (distributions in excess of) net investment income (loss) | | | 135,949 | |
| | Accumulated net realized gain (loss) | | | (29,569,733 | ) |
| | Net unrealized gain (loss) | | | 21,850,262 | |
| | | NET ASSETS | | $ | 984,357,962 | |
| | | Net Assets: | | | | |
| | | Class A | | $ | 39,623,933 | |
| | | Class C | | | 14,914,448 | |
| | | Institutional | | | 915,400,614 | |
| | | Class IR | | | 12,280,518 | |
| | | Class R | | | 2,128,624 | |
| | | Class R6 | | | 9,825 | |
| | | Total Net Assets | | $ | 984,357,962 | |
| | | Shares outstanding $0.001 par value (unlimited shares authorized): | | | | |
| | | Class A | | | 4,524,182 | |
| | | Class C | | | 1,814,594 | |
| | | Institutional | | | 102,018,906 | |
| | | Class IR | | | 1,378,705 | |
| | | Class R | | | 248,203 | |
| | | Class R6 | | | 1,095 | |
| | | Net asset value, offering and redemption price per share:(d) | | | | |
| | | Class A | | | $8.76 | |
| | | Class C | | | 8.22 | |
| | | Institutional | | | 8.97 | |
| | | Class IR | | | 8.91 | |
| | | Class R | | | 8.58 | |
| | | Class R6 | | | 8.97 | |
| | (a) | | Statements of Assets and Liabilities for Absolute Return Tracker, Commodity Strategy, Dynamic Allocation and Dynamic Commodity Strategy Funds are consolidated and include the balances of Cayman Commodity-ART, Ltd., Cayman Commodity-CSF, Ltd., Cayman Commodity-DAF, Ltd. and Cayman Commodity-DCS, Ltd. (wholly-owned subsidiaries), respectively. Accordingly, all interfund balances and transactions have been eliminated. |
| | (b) | | Includes loaned securities having a market value of 4,964,152 and 1,863,116 for the Absolute Return Tracker and Dynamic Allocation Funds, respectively. |
| | (c) | | Segregated for initial margin and/or collateral on transactions as follows: |
| | | | | | | | | | | | | | | | |
Fund | | Forwards | | | Futures | | | Options | | | Swaps | |
Absolute Return Tracker | | $ | — | | | $ | 12,598,784 | | | $ | 26,719,048 | | | $ | 10,936,922 | |
Commodity Strategy | | | — | | | | — | | | | — | | | | 31,845,953 | |
Dynamic Allocation | | | 4,160,000 | | | | 9,440,113 | | | | | | | | 18,739,074 | |
Dynamic Commodity Strategy | | | — | | | | — | | | | — | | | | 1,620,000 | |
Managed Futures Strategy | | | 1,740,000 | | | | 3,220,868 | | | | — | | | | 9,353,448 | |
| | (d) | | Maximum public offering price per share for Class A Shares of the Absolute Return Tracker, Commodity Strategy, Dynamic Allocation, Dynamic Commodity Strategy and Managed Futures Strategy Funds is $9.27, $12.07, $10.10, $6.73 and $10.87 respectively. At redemption, Class C Shares may be subject to a contingent deferred sales charge assessed on the amount equal to the lesser of the current NAV or the original purchase price of the shares. |
| | |
| 54 | | The accompanying notes are an integral part of these financial statements. |
GOLDMAN SACHS SELECT SATELLITE FUNDS
| | | | | | | | | | | | | | | | | | | | | | |
| | | Commodity Strategy Fund(a) | | | | | Dynamic Allocation
Fund(a) | | | | | Dynamic
Commodity
Strategy Fund(a) | | | | | Managed Futures
Strategy Fund | |
| | | | | | | | | | | | | | | | | | | | | | |
| | $ | 188,224,588 | | | | | $ | 207,207,084 | | | | | $ | — | | | | | $ | 9,233,741 | |
| | | 154,503,042 | | | | | | 276,024,420 | | | | | | 23,094,416 | | | | | | 149,064,637 | |
| | | — | | | | | | 1,887,700 | | | | | | — | | | | | | — | |
| | | 21,138,225 | | | | | | 27,924,901 | | | | | | 334,769 | | | | | | 9,901,266 | |
| | | — | | | | | | 14,704,566 | | | | | | — | | | | | | 2,656,635 | |
| | | | | | | | | | | | | | | | | | | | | | |
| | | 31,845,953 | | | | | | 32,339,187 | | | | | | 1,620,000 | | | | | | 14,314,316 | |
| | | 472,449 | | | | | | 143,921 | | | | | | — | | | | | | 246,869 | |
| | | — | | | | | | 1,270,000 | | | | | | — | | | | | | — | |
| | | 727,478 | | | | | | 384,756 | | | | | | 3,085 | | | | | | 33,367 | |
| | | 37,689 | | | | | | 48,595 | | | | | | 30,636 | | | | | | — | |
| | | — | | | | | | 4,229 | | | | | | — | | | | | | — | |
| | | — | | | | | | 844,591 | | | | | | — | | | | | | 657 | |
| | | 4,210,914 | | | | | | — | | | | | | — | | | | | | 1,334,091 | |
| | | — | | | | | | 150,580 | | | | | | — | | | | | | — | |
| | | — | | | | | | 842,858 | | | | | | — | | | | | | 3,390,388 | |
| | | 52,096 | | | | | | 1,270,479 | | | | | | — | | | | | | 76,217 | |
| | | 1,841,789 | | | | | | 766,779 | | | | | | 1,131,119 | | | | | | — | |
| | | 403,054,223 | | | | | | 565,814,646 | | | | | | 26,214,025 | | | | | | 190,252,184 | |
| | | | | | | | | | | | | | | | | | | | | | |
| | | | | | | | | | | | | | | | | | | | | | |
| | | — | | | | | | — | | | | | | — | | | | | | — | |
| | | 170,401 | | | | | | 92,530 | | | | | | 461,509 | | | | | | — | |
| | | — | | | | | | 4,587,583 | | | | | | — | | | | | | 2,038,092 | |
| | | — | | | | | | 1,453,322 | | | | | | — | | | | | | — | |
| | | | | | | | | | | | | | | | | | | | | | |
| | | — | | | | | | 1,887,700 | | | | | | — | | | | | | — | |
| | | 1,295,267 | | | | | | 4,192,128 | | | | | | — | | | | | | 2,554,906 | |
| | | 170,523 | | | | | | 331,434 | | | | | | 14,904 | | | | | | 131,703 | |
| | | 38,949 | | | | | | 53,280 | | | | | | 891 | | | | | | 27,673 | |
| | | — | | | | | | — | | | | | | — | | | | | | — | |
| | | — | | | | | | — | | | | | | 182,477 | | | | | | 36 | |
| | | — | | | | | | — | | | | | | — | | | | | | 2,863,914 | |
| | | 4,219,688 | | | | | | — | | | | | | — | | | | | | — | |
| | | 273,554 | | | | | | 282,533 | | | | | | 191,247 | | | | | | 131,649 | |
| | | 6,168,382 | | | | | | 12,880,510 | | | | | | 851,028 | | | | | | 7,747,973 | |
| | | | | | | | | | | | | | | | | | | | | | |
| | | | | | | | | | | | | | | | | | | | | | |
| | | 504,160,441 | | | | | | 581,043,293 | | | | | | 24,081,849 | | | | | | 179,190,547 | |
| | | (11,844,805 | ) | | | | | 4,709,379 | | | | | | (479,032 | ) | | | | | (2,174,032 | ) |
| | | (100,562,821 | ) | | | | | (31,795,763 | ) | | | | | 1,090,570 | | | | | | (6,302,693 | ) |
| | | 5,133,026 | | | | | | (1,022,773 | ) | | | | | 669,610 | | | | | | 11,790,389 | |
| | | $ | 396,885,841 | | | | | $ | 552,934,136 | | | | | $ | 25,362,997 | | | | | $ | 182,504,211 | |
| | | | | | | | | | | | | | | | | | | | | | | |
| | | $ | 61,099,294 | | | | | $ | 33,122,096 | | | | | $ | 112,843 | | | | | $ | 44,567,377 | |
| | | | 4,813,562 | | | | | | 24,002,328 | | | | | | 20,642 | | | | | | 4,876,382 | |
| | | | 318,191,389 | | | | | | 489,134,145 | | | | | | 25,197,391 | | | | | | 112,835,231 | |
| | | | 8,546,774 | | | | | | 6,654,744 | | | | | | 16,148 | | | | | | 19,896,985 | |
| | | | 2,630,299 | | | | | | 11,261 | | | | | | 15,973 | | | | | | 328,236 | |
| | | | 1,604,523 | | | | | | 9,562 | | | | | | — | | | | | | — | |
| | | $ | 396,885,841 | | | | | $ | 552,934,136 | | | | | $ | 25,362,997 | | | | | $ | 182,504,211 | |
| | | | | | | | | | | | | | | | | | | | | | | |
| | | | 5,297,330 | | | | | | 3,471,979 | | | | | | 17,558 | | | | | | 4,338,143 | |
| | | | 436,835 | | | | | | 2,628,027 | | | | | | 3,266 | | | | | | 488,904 | |
| | | | 27,319,042 | | | | | | 50,675,195 | | | | | | 3,893,059 | | | | | | 10,805,885 | |
| | | | 733,544 | | | | | | 691,529 | | | | | | 2,500 | | | | | | 1,918,377 | |
| | | | 231,374 | | | | | | 1,193 | | | | | | 2,500 | | | | | | 32,270 | |
| | | | 137,709 | | | | | | 991 | | | | | | — | | | | | | — | |
| | | | | | | | | | | | | | | | | | | | | | | |
| | | | $11.53 | | | | | | $9.54 | | | | | | $6.43 | | | | | | $10.27 | |
| | | | 11.02 | | | | | | 9.13 | | | | | | 6.32 | | | | | | 9.97 | |
| | | | 11.65 | | | | | | 9.65 | | | | | | 6.47 | | | | | | 10.44 | |
| | | | 11.65 | | | | | | 9.62 | | | | | | 6.46 | | | | | | 10.37 | |
| | | | 11.37 | | | | | | 9.44 | | | | | | 6.39 | | | | | | 10.17 | |
| | | | 11.65 | | | | | | 9.65 | | | | | | — | | | | | | — | |
| | |
| The accompanying notes are an integral part of these financial statements. | | 55 |
GOLDMAN SACHS SELECT SATELLITE FUNDS
Statements of Operations
For the Six Months Ended June 30, 2016 (Unaudited)
| | | | | | |
| | | | |
Absolute Return
Tracker Fund(a) | |
| | Investment income: | | | | |
| | Dividends — unaffiliated issuers (net of foreign taxes withheld of $151, $0, $0, $0 and $0) | | $ | 1,332,868 | |
| | Dividends — affiliated issuers (net of foreign taxes withheld of $2,316, $5,014, $1,938, $213 and $0) | | | 978,041 | |
| | Securities lending income — affiliated issuer | | | 41,528 | |
| | Interest | | | — | |
| | Total investment income | | | 2,352,437 | |
| | | | | | |
| | Expenses: | | | | |
| | Management fees | | | 5,826,901 | |
| | Transfer Agency fees(b) | | | 252,773 | |
| | Distribution and Service fees(b) | | | 136,310 | |
| | Professional fees | | | 108,370 | |
| | Printing and mailing costs | | | 99,374 | |
| | Registration fees | | | 57,108 | |
| | Custody, accounting and administrative services | | | 43,294 | |
| | Trustee fees | | | 14,968 | |
| | Other | | | 15,455 | |
| | Total expenses | | | 6,554,553 | |
| | Less — expense reductions | | | (3,169,614 | ) |
| | Net expenses | | | 3,384,939 | |
| | NET INVESTMENT INCOME (LOSS) | | | (1,032,502 | ) |
| | | | | | |
| | Realized and unrealized gain (loss): | | | | |
| | Net realized gain (loss) from: | | | | |
| | Investments | | | (9,664,638 | ) |
| | Futures contracts | | | (4,904,005 | ) |
| | Swap contracts | | | 8,494,166 | |
| | Forward foreign currency exchange contracts | | | (1,594,940 | ) |
| | Foreign currency transactions | | | 490,734 | |
| | Written options | | | 2,954,079 | |
| | Net change in unrealized gain (loss) on: | | | | |
| | Investments | | | 10,063,575 | |
| | Futures contracts | | | 3,073,448 | |
| | Swap contracts | | | 54,250 | |
| | Forward foreign currency exchange contracts | | | 121,822 | |
| | Foreign currency translation | | | (206,757 | ) |
| | Written options | | | 1,061,718 | |
| | Net realized and unrealized gain (loss) | | | 9,943,452 | |
| | NET INCREASE (DECREASE) IN NET ASSETS RESULTING FROM OPERATIONS | | $ | 8,910,950 | |
| | (a) | | Statements of Operations for Absolute Return Tracker, Commodity Strategy, Dynamic Allocation and Dynamic Commodity Strategy Funds are consolidated and include the balances of Cayman Commodity-ART, Ltd., Cayman Commodity-CSF Ltd., Cayman Commodity-DAF, Ltd. and Cayman Commodity-DCS Ltd. (wholly-owned subsidiaries), respectively. Accordingly, all interfund balances and transactions have been eliminated. |
| | (b) | | Class specific Distribution and Service, and Transfer Agency fees were as follows: |
| | | | | | | | | | | | | | | | | | | | | | | | | | | | | | | | | | | | |
| | | Distribution and Service Fees | | | Transfer Agency Fees | |
Fund | | Class A | | | Class C | | | Class R | | | Class A | | | Class C | | | Institutional | | | Class IR | | | Class R | | | Class R6 | |
Absolute Return Tracker | | $ | 52,198 | | | $ | 79,062 | | | $ | 5,050 | | | $ | 39,671 | | | $ | 15,022 | | | $ | 189,881 | | | $ | 6,278 | | | $ | 1,919 | | | $ | 2 | |
Commodity Strategy | | | 72,359 | | | | 22,565 | | | | 5,561 | | | | 37,627 | | | | 2,933 | | | | 96,723 | | | | 4,457 | | | | 1,446 | | | | 139 | |
Dynamic Allocation | | | 46,403 | | | | 127,770 | | | | 28 | | | | 35,267 | | | | 24,276 | | | | 99,461 | | | | 7,332 | | | | 11 | | | | 2 | |
Dynamic Commodity Strategy | | | 159 | | | | 47 | | | | 38 | | | | 83 | | | | 5 | | | | 4,763 | | | | 10 | | | | 10 | | | | — | |
Managed Futures Strategy | | | 52,331 | | | | 22,508 | | | | 658 | | | | 39,772 | | | | 4,276 | | | | 21,111 | | | | 15,898 | | | | 250 | | | | — | |
| | |
| 56 | | The accompanying notes are an integral part of these financial statements. |
GOLDMAN SACHS SELECT SATELLITE FUNDS
| | | | | | | | | | | | | | | | | | | | | | |
| | | Commodity
Strategy Fund(a) | | | | | Dynamic Allocation
Fund(a) | | | | | Dynamic
Commodity
Strategy Fund(a) | | | | | Managed Futures
Strategy Fund | |
| | | | | | | | | | | | | | | | | | | | | | |
| | $ | — | | | | | $ | 3,202,069 | | | | | $ | — | | | | | $ | — | |
| | | 165,734 | | | | | | 332,341 | | | | | | 10,998 | | | | | | 172,312 | |
| | | — | | | | | | 29,129 | | | | | | — | | | | | | — | |
| | | 2,940,462 | | | | | | 197,340 | | | | | | 29,373 | | | | | | — | |
| | | 3,106,196 | | | | | | 3,760,879 | | | | | | 40,371 | | | | | | 172,312 | |
| | | | | | | | | | | | | | | | | | | | | | |
| | | | | | | | | | | | | | | | | | | | | | |
| | | 1,391,040 | | | | | | 2,554,745 | | | | | | 95,928 | | | | | | 844,582 | |
| | | 143,325 | | | | | | 166,349 | | | | | | 4,871 | | | | | | 81,307 | |
| | | 100,485 | | | | | | 174,201 | | | | | | 244 | | | | | | 75,497 | |
| | | 98,750 | | | | | | 105,394 | | | | | | 83,957 | | | | | | 65,382 | |
| | | 129,007 | | | | | | 60,340 | | | | | | 17,472 | | | | | | 20,490 | |
| | | 80,742 | | | | | | 53,089 | | | | | | 30,310 | | | | | | 43,771 | |
| | | 68,996 | | | | | | 63,008 | | | | | | 41,674 | | | | | | 24,619 | |
| | | 13,075 | | | | | | 13,590 | | | | | | 11,699 | | | | | | 12,103 | |
| | | 10,964 | | | | | | 10,812 | | | | | | 2,604 | | | | | | 46,483 | |
| | | 2,036,384 | | | | | | 3,201,528 | | | | | | 288,759 | | | | | | 1,214,234 | |
| | | (310,199 | ) | | | | | (815,066 | ) | | | | | (193,142 | ) | | | | | (108,134 | ) |
| | | 1,726,185 | | | | | | 2,386,462 | | | | | | 95,617 | | | | | | 1,106,100 | |
| | | 1,380,011 | | | | | | 1,374,417 | | | | | | (55,246 | ) | | | | | (933,788 | ) |
| | | | | | | | | | | | | | | | | | | | | | |
| | | | | | | | | | | | | | | | | | | | | | |
| | | | | | | | | | | | | | | | | | | | | | |
| | | 6,536,253 | | | | | | (377,584 | ) | | | | | 81 | | | | | | (1,514,581 | ) |
| | | (8,396,349 | ) | | | | | 3,606,386 | | | | | | (3,222 | ) | | | | | (3,854,829 | ) |
| | | 5,127,913 | | | | | | 10,586,027 | | | | | | 1,093,711 | | | | | | 4,448,821 | |
| | | — | | | | | | (12,870,881 | ) | | | | | — | | | | | | (5,313,239 | ) |
| | | — | | | | | | 1,881,184 | | | | | | — | | | | | | (12,300 | ) |
| | | — | | | | | | — | | | | | | — | | | | | | — | |
| | | | | | | | | | | | | | | | | | | | | | |
| | | 4,002,023 | | | | | | (7,189,986 | ) | | | | | 1,962 | | | | | | (977,399 | ) |
| | | (3,798,046 | ) | | | | | 6,414,123 | | | | | | — | | | | | | 357,113 | |
| | | 50,945,982 | | | | | | 3,104,967 | | | | | | 614,450 | | | | | | 5,542,392 | |
| | | — | | | | | | 83,857 | | | | | | — | | | | | | 1,173,174 | |
| | | — | | | | | | (363,723 | ) | | | | | — | | | | | | (17,717 | ) |
| | | — | | | | | | — | | | | | | — | | | | | | — | |
| | | 54,417,776 | | | | | | 4,874,370 | | | | | | 1,706,982 | | | | | | (168,565 | ) |
| | $ | 55,797,787 | | | | | $ | 6,248,787 | | | | | $ | 1,651,736 | | | | | $ | (1,102,353 | ) |
| | |
| The accompanying notes are an integral part of these financial statements. | | 57 |
GOLDMAN SACHS SELECT SATELLITE FUNDS
Statements of Changes in Net Assets
| | | | | | | | | | |
| | | | | Absolute Return Tracker Fund(a) | |
| | | | | For the
Six Months Ended
June 30, 2016
(Unaudited) | | | For the Fiscal
Year Ended
December 31, 2015 | |
| | From operations: | |
| | Net investment income (loss) | | $ | (1,032,502 | ) | | $ | (5,958,065 | ) |
| | Net realized gain (loss) | | | (4,224,604 | ) | | | (11,107,119 | ) |
| | Net change in unrealized gain (loss) | | | 14,168,056 | | | | 1,562,213 | |
| | Net increase (decrease) in net assets resulting from operations | | | 8,910,950 | | | | (15,502,971 | ) |
| | | | | | | | | | |
| | Distributions to shareholders: | | | | | | | | |
| | From net investment income | | | | | | | | |
| | Class A Shares | | | — | | | | (115,078 | ) |
| | Class C Shares | | | — | | | | — | |
| | Institutional Shares | | | — | | | | (7,926,420 | ) |
| | Class IR Shares | | | — | | | | (37,462 | ) |
| | Class R Shares | | | — | | | | (3,919 | ) |
| | Class R6 Shares | | | — | | | | (71 | ) |
| | From net realized gains | | | | | | | | |
| | Class A Shares | | | — | | | | (494,138 | ) |
| | Class C Shares | | | — | | | | (214,987 | ) |
| | Institutional Shares | | | — | | | | (12,340,757 | ) |
| | Class IR Shares | | | — | | | | (71,185 | ) |
| | Class R Shares | | | — | | | | (27,242 | ) |
| | Class R6 Shares | | | — | | | | (104 | ) |
| | Total distributions to shareholders | | | — | | | | (21,231,363 | ) |
| | | | | | | | | | |
| | From share transactions: | | | | | | | | |
| | Proceeds from sales of shares | | | 113,680,213 | | | | 712,929,377 | |
| | Reinvestment of distributions | | | — | | | | 11,712,590 | |
| | Cost of shares redeemed | | | (321,906,081 | ) | | | (1,482,138,840 | ) |
| | Net increase (decrease) in net assets resulting from share transactions | | | (208,225,868 | ) | | | (757,496,873 | ) |
| | TOTAL INCREASE (DECREASE) | | | (199,314,918 | ) | | | (794,231,207 | ) |
| | | | | | | | | | |
| | Net assets: | | | | | | | | |
| | Beginning of period | | | 1,183,672,880 | | | | 1,977,904,087 | |
| | End of period | | $ | 984,357,962 | | | $ | 1,183,672,880 | |
| | Undistributed (distributions in excess of) net investment income (loss) | | $ | 135,949 | | | $ | 1,168,451 | |
| | (a) | | Statements of Changes in Net Assets for Absolute Return Tracker, Commodity Strategy, Dynamic Allocation and Dynamic Commodity Strategy Funds are consolidated and include the balances of Cayman Commodity-ART Fund, Ltd., Cayman Commodity-CSF, Ltd., Cayman Commodity-DAF, Ltd., and Cayman Commodity-DCS, Ltd. (wholly-owned subsidiaries), respectively. Accordingly, all interfund balances and transactions have been eliminated. |
| | |
| 58 | | The accompanying notes are an integral part of these financial statements. |
GOLDMAN SACHS SELECT SATELLITE FUNDS
| | | | | | | | | | | | | | | | | | | | | | |
| | | Commodity Strategy Fund(a) | | | | | Dynamic Allocation Fund(a) | |
| | | For the
Six Months Ended
June 30, 2016
(Unaudited) | | | | | For the Fiscal
Year Ended
December 31, 2015 | | | | | For the
Six Months Ended
June 30, 2016
(Unaudited) | | | | | For the Fiscal
Year Ended
December 31, 2015 | |
| | | | | | | | | | | | | | | | | | | | | | |
| | $ | 1,380,011 | | | | | $ | 704,441 | | | | | $ | 1,374,417 | | | | | $ | (658,521 | ) |
| | | 3,267,817 | | | | | | (368,533,265 | ) | | | | | 2,825,132 | | | | | | (31,485,484 | ) |
| | | 51,149,959 | | | | | | 56,187,324 | | | | | | 2,049,238 | | | | | | (13,184,799 | ) |
| | | 55,797,787 | | | | | | (311,641,500 | ) | | | | | 6,248,787 | | | | | | (45,328,804 | ) |
| | | | | | | | | | | | | | | | | | | | | | |
| | | | | | | | | | | | | | | | | | | | | | |
| | | | | | | | | | | | | | | | | | | | | | |
| | | (159,303 | ) | | | | | (112,173 | ) | | | | | — | | | | | | (55,579 | ) |
| | | — | | | | | | — | | | | | | — | | | | | | — | |
| | | (1,262,670 | ) | | | | | (2,960,017 | ) | | | | | — | | | | | | (3,645,142 | ) |
| | | (31,767 | ) | | | | | (33,309 | ) | | | | | — | | | | | | (46,536 | ) |
| | | (4,752 | ) | | | | | (675 | ) | | | | | — | | | | | | — | |
| | | (6,610 | ) | | | | | (4,381 | ) | | | | | — | | | | | | (70 | ) |
| | | | | | | | | | | | | | | | | | | | | | |
| | | — | | | | | | — | | | | | | — | | | | | | (1,318,906 | ) |
| | | — | | | | | | — | | | | | | — | | | | | | (857,180 | ) |
| | | — | | | | | | — | | | | | | — | | | | | | (14,259,852 | ) |
| | | — | | | | | | — | | | | | | — | | | | | | (292,606 | ) |
| | | — | | | | | | — | | | | | | — | | | | | | (321 | ) |
| | | — | | | | | | — | | | | | | — | | | | | | (264 | ) |
| | | (1,465,102 | ) | | | | | (3,110,555 | ) | | | | | — | | | | | | (20,476,456 | ) |
| | | | | | | | | | | | | | | | | | | | | | |
| | | | | | | | | | | | | | | | | | | | | | |
| | | 120,745,802 | | | | | | 635,770,625 | | | | | | 47,159,563 | | | | | | 86,161,534 | |
| | | 940,304 | | | | | | 2,250,361 | | | | | | — | | | | | | 20,186,598 | |
| | | (397,308,397 | ) | | | | | (572,533,764 | ) | | | | | (92,297,458 | ) | | | | | (240,278,577 | ) |
| | | (275,622,291 | ) | | | | | 65,487,222 | | | | | | (45,137,895 | ) | | | | | (133,930,445 | ) |
| | | (221,289,606 | ) | | | | | (249,264,833 | ) | | | | | (38,889,108 | ) | | | | | (199,735,705 | ) |
| | | | | | | | | | | | | | | | | | | | | | |
| | | | | | | | | | | | | | | | | | | | | | |
| | | 618,175,447 | | | | | | 867,440,280 | | | | | | 591,823,244 | | | | | | 791,558,949 | |
| | $ | 396,885,841 | | | | | $ | 618,175,447 | | | | | $ | 552,934,136 | | | | | $ | 591,823,244 | |
| | $ | (11,844,805 | ) | | | | $ | (11,759,714 | ) | | | | $ | 4,709,379 | | | | | $ | 3,334,962 | |
| | |
| The accompanying notes are an integral part of these financial statements. | | 59 |
GOLDMAN SACHS SELECT SATELLITE FUNDS
Statements of Changes in Net Assets (continued)
| | | | | | | | | | |
| | | | | Dynamic Commodity Strategy Fund(a) | |
| | | | | For the
Six Months Ended
June 30, 2016
(Unaudited) | | | For the Fiscal
Year Ended
December 31, 2015 | |
| | From operations: | |
| | Net investment income (loss) | | $ | (55,246 | ) | | $ | (197,997 | ) |
| | Net realized gain (loss) | | | 1,090,570 | | | | (9,194,380 | ) |
| | Net change in unrealized gain (loss) | | | 616,412 | | | | 2,140,356 | |
| | Net increase (decrease) in net assets resulting from operations | | | 1,651,736 | | | | (7,252,021 | ) |
| | | | | | | | | | |
| | Distributions to shareholders: | | | | | | | | |
| | From net investment income | | | | | | | | |
| | Class A Shares | | | — | | | | — | |
| | Class C Shares | | | — | | | | — | |
| | Institutional Shares | | | — | | | | — | |
| | Class IR Shares | | | — | | | | — | |
| | Class R Shares | | | — | | | | — | |
| | Class R6 Shares | | | — | | | | — | |
| | From net realized gains | | | | | | | | |
| | Class A Shares | | | — | | | | — | |
| | Class C Shares | | | — | | | | — | |
| | Institutional Shares | | | — | | | | — | |
| | Class IR Shares | | | — | | | | — | |
| | Class R Shares | | | — | | | | — | |
| | Class R6 Shares | | | — | | | | — | |
| | Total distributions to shareholders | | | — | | | | — | |
| | | | | | | | | | |
| | From share transactions: | | | | | | | | |
| | Proceeds from sales of shares | | | 25,891 | | | | 764,188 | |
| | Reinvestment of distributions | | | — | | | | — | |
| | Cost of shares redeemed | | | (530,751 | ) | | | (45,551 | ) |
| | Net increase (decrease) in net assets resulting from share transactions | | | (504,860 | ) | | | 718,637 | |
| | TOTAL INCREASE (DECREASE) | | | 1,146,876 | | | | (6,533,384 | ) |
| | | | | | | | | | |
| | Net assets: | | | | | | | | |
| | Beginning of period | | | 24,216,121 | | | | 30,749,505 | |
| | End of period | | $ | 25,362,997 | | | $ | 24,216,121 | |
| | Undistributed (distributions in excess of) net investment income (loss) | | $ | (479,032 | ) | | $ | (423,786 | ) |
| | (a) | | Statements of Changes in Net Assets for Absolute Return Tracker, Commodity Strategy, Dynamic Allocation and Dynamic Commodity Strategy Funds are consolidated and include the balances of Cayman Commodity-ART Fund, Ltd., Cayman Commodity-CSF, Ltd., Cayman Commodity-DAF, Ltd., and Cayman Commodity-DCS, Ltd. (wholly-owned subsidiaries), respectively. Accordingly, all interfund balances and transactions have been eliminated. |
| | |
| 60 | | The accompanying notes are an integral part of these financial statements. |
GOLDMAN SACHS SELECT SATELLITE FUNDS
| | | | | | | | | | |
| | Managed Futures Strategy Fund | |
| | | For the
Six Months Ended
June 30, 2016
(Unaudited) | | | | | For the Fiscal
Year Ended
December 31, 2015 | |
| | | | | | | | | | |
| | $ | (933,788 | ) | | | | $ | (1,186,825 | ) |
| | | (6,246,128 | ) | | | | | 8,798,854 | |
| | | 6,077,563 | | | | | | 1,731,517 | |
| | | (1,102,353 | ) | | | | | 9,343,546 | |
| | | | | | | | | | |
| | | | | | | | | | |
| | | | | | | | | | |
| | | — | | | | | | (874,511 | ) |
| | | — | | | | | | (101,551 | ) |
| | | — | | | | | | (3,314,600 | ) |
| | | — | | | | | | (244,828 | ) |
| | | — | | | | | | (7,072 | ) |
| | | — | | | | | | — | |
| | | | | | | | | | |
| | | — | | | | | | — | |
| | | — | | | | | | — | |
| | | — | | | | | | — | |
| | | — | | | | | | — | |
| | | — | | | | | | — | |
| | | — | | | | | | — | |
| | | — | | | | | | (4,542,562 | ) |
| | | | | | | | | | |
| | | | | | | | | | |
| | | 113,328,454 | | | | | | 56,406,462 | |
| | | — | | | | | | 4,539,441 | |
| | | (51,285,014 | ) | | | | | (36,635,075 | ) |
| | | 62,043,440 | | | | | | 24,310,828 | |
| | | 60,941,087 | | | | | | 29,111,812 | |
| | | | | | | | | | |
| | | | | | | | | | |
| | | 121,563,124 | | | | | | 92,451,312 | |
| | $ | 182,504,211 | | | | | $ | 121,563,124 | |
| | $ | (2,174,032 | ) | | | | $ | (1,240,244 | ) |
| | |
| The accompanying notes are an integral part of these financial statements. | | 61 |
GOLDMAN SACHS ABSOLUTE RETURN TRACKER FUND
Financial Highlights
Selected Data for a Share Outstanding Throughout Each Period
| | | | | | | | | | | | | | | | | | | | | | | | | | | | | | |
| | | | | | | | Income (loss) from
investment operations | | | Distributions
to shareholders | |
| | | Year - Share Class | |
Net asset
value,
beginning
of period | | | Net
investment
loss(a) | | | Net realized
and unrealized
gain (loss) | | | Total from
investment
operations | | | From net
investment
income | | | From net
realized
gains | | | Total
distributions | |
| | FOR THE SIX MONTHS ENDED JUNE 30, (UNAUDITED) | |
| | 2016 - A | | $ | 8.67 | | | $ | (0.02 | ) | | $ | 0.11 | | | $ | 0.09 | | | $ | — | | | $ | — | | | $ | — | |
| | 2016 - C | | | 8.17 | | | | (0.05 | ) | | | 0.10 | | | | 0.05 | | | | — | | | | — | | | | — | |
| | 2016 - Institutional | | | 8.86 | | | | (0.01 | ) | | | 0.12 | | | | 0.11 | | | | — | | | | — | | | | — | |
| | 2016 - IR | | | 8.80 | | | | (0.01 | ) | | | 0.12 | | | | 0.11 | | | | — | | | | — | | | | — | |
| | 2016 - R | | | 8.50 | | | | (0.03 | ) | | | 0.11 | | | | 0.08 | | | | — | | | | — | | | | — | |
| | 2016 - R6 | | | 8.86 | | | | (0.01 | ) | | | 0.12 | | | | 0.11 | | | | — | | | | — | | | | — | |
| | | | | | | | | | | | | | | | | | | | | | | | | | | | | | |
| | FOR THE FISCAL YEARS ENDED DECEMBER 31, | |
| | 2015 - A | | | 9.01 | | | | (0.07 | ) | | | (0.15 | ) | | | (0.22 | ) | | | (0.02 | ) | | | (0.10 | ) | | | (0.12 | ) |
| | 2015 - C | | | 8.54 | | | | (0.13 | ) | | | (0.14 | ) | | | (0.27 | ) | | | — | | | | (0.10 | ) | | | (0.10 | ) |
| | 2015 - Institutional | | | 9.22 | | | | (0.03 | ) | | | (0.17 | ) | | | (0.20 | ) | | | (0.06 | ) | | | (0.10 | ) | | | (0.16 | ) |
| | 2015 - IR | | | 9.15 | | | | (0.04 | ) | | | (0.16 | ) | | | (0.20 | ) | | | (0.05 | ) | | | (0.10 | ) | | | (0.15 | ) |
| | 2015 - R | | | 8.85 | | | | (0.09 | ) | | | (0.15 | ) | | | (0.24 | ) | | | (0.01 | ) | | | (0.10 | ) | | | (0.11 | ) |
| | 2015 - R6 (Commenced July 31, 2015) | | | 9.30 | | | | (0.01 | ) | | | (0.26 | ) | | | (0.27 | ) | | | (0.07 | ) | | | (0.10 | ) | | | (0.17 | ) |
| | 2014 - A | | | 9.12 | | | | (0.09 | ) | | | 0.33 | | | | 0.24 | | | | — | | | | (0.35 | ) | | | (0.35 | ) |
| | 2014 - C | | | 8.72 | | | | (0.15 | ) | | | 0.32 | | | | 0.17 | | | | — | | | | (0.35 | ) | | | (0.35 | ) |
| | 2014 - Institutional | | | 9.32 | | | | (0.05 | ) | | | 0.34 | | | | 0.29 | | | | (0.04 | ) | | | (0.35 | ) | | | (0.39 | ) |
| | 2014 - IR | | | 9.24 | | | | (0.07 | ) | | | 0.34 | | | | 0.27 | | | | (0.01 | ) | | | (0.35 | ) | | | (0.36 | ) |
| | 2014 - R | | | 8.98 | | | | (0.11 | ) | | | 0.33 | | | | 0.22 | | | | — | | | | (0.35 | ) | | | (0.35 | ) |
| | 2013 - A | | | 8.95 | | | | (0.12 | ) | | | 0.82 | | | | 0.70 | | | | — | | | | (0.53 | ) | | | (0.53 | ) |
| | 2013 - C | | | 8.65 | | | | (0.18 | ) | | | 0.78 | | | | 0.60 | | | | — | | | | (0.53 | ) | | | (0.53 | ) |
| | 2013 - Institutional | | | 9.10 | | | | (0.09 | ) | | | 0.84 | | | | 0.75 | | | | — | | | | (0.53 | ) | | | (0.53 | ) |
| | 2013 - IR | | | 9.04 | | | | (0.10 | ) | | | 0.83 | | | | 0.73 | | | | — | | | | (0.53 | ) | | | (0.53 | ) |
| | 2013 - R | | | 8.85 | | | | (0.14 | ) | | | 0.80 | | | | 0.66 | | | | — | | | | (0.53 | ) | | | (0.53 | ) |
| | 2012 - A | | | 8.79 | | | | (0.13 | ) | | | 0.33 | | | | 0.20 | | | | — | | | | (0.04 | ) | | | (0.04 | ) |
| | 2012 - C | | | 8.56 | | | | (0.19 | ) | | | 0.32 | | | | 0.13 | | | | — | | | | (0.04 | ) | | | (0.04 | ) |
| | 2012 - Institutional | | | 8.90 | | | | (0.09 | ) | | | 0.33 | | | | 0.24 | | | | — | | | | (0.04 | ) | | | (0.04 | ) |
| | 2012 - IR | | | 8.86 | | | | (0.11 | ) | | | 0.33 | | | | 0.22 | | | | — | | | | (0.04 | ) | | | (0.04 | ) |
| | 2012 - R | | | 8.72 | | | | (0.15 | ) | | | 0.32 | | | | 0.17 | | | | — | | | | (0.04 | ) | | | (0.04 | ) |
| | 2011 - A | | | 9.25 | | | | (0.12 | ) | | | (0.23 | ) | | | (0.35 | ) | | | — | | | | (0.11 | ) | | | (0.11 | ) |
| | 2011 - C | | | 9.08 | | | | (0.18 | ) | | | (0.23 | ) | | | (0.41 | ) | | | — | | | | (0.11 | ) | | | (0.11 | ) |
| | 2011 - Institutional | | | 9.34 | | | | (0.08 | ) | | | (0.25 | ) | | | (0.33 | ) | | | — | | | | (0.11 | ) | | | (0.11 | ) |
| | 2011 - IR | | | 9.31 | | | | (0.09 | ) | | | (0.25 | ) | | | (0.34 | ) | | | — | | | | (0.11 | ) | | | (0.11 | ) |
| | 2011 - R | | | 9.20 | | | | (0.14 | ) | | | (0.23 | ) | | | (0.37 | ) | | | — | | | | (0.11 | ) | | | (0.11 | ) |
| | (a) | | Calculated based on the average shares outstanding methodology. |
| | (b) | | Assumes investment at the net asset value at the beginning of the period, reinvestment of all distributions, a complete redemption of the investment at the net asset value at the end of the period and no sales or redemption charges. Total returns would be reduced if a sales or redemption charge was taken into account. Returns do not reflect the impact of taxes to shareholders relating to Fund distributions or the redemption of Fund shares. Total returns for periods less than one full year are not annualized. |
| | (c) | | The Fund’s portfolio turnover rate is calculated in accordance with regulatory requirements, without regard to transactions involving short term investments and certain derivatives. If such transactions were included, the Fund’s portfolio turnover rate may be higher. |
| | |
| 62 | | The accompanying notes are an integral part of these financial statements. |
GOLDMAN SACHS ABSOLUTE RETURN TRACKER FUND
| | | | | | | | | | | | | | | | | | | | | | | | | | | | | | | | | | | | | | | | |
| | | | | | | | | | | | | | | | | | | | | | | | | | | | | | | | | | |
| | | Net asset
value, end
of period | | | | | Total
return(b) | | | | | Net assets,
end of
period
(in 000s) | | | | | Ratio of
net expenses
to average
net assets | | | | | Ratio of
total expenses
to average
net assets | | | | | Ratio of
net investment
loss
to average
net assets | | | | | Portfolio
turnover
rate(c) | |
| | | | | | | | | | | | | | | | | | | | | | | | | | | | | | | | | | | | | | | | |
| | $ | 8.76 | | | | | | 1.04 | % | | | | $ | 39,624 | | | | | | 1.03 | %(d) | | | | | 1.65 | %(d) | | | | | (0.57 | )%(d) | | | | | 68 | % |
| | | 8.22 | | | | | | 0.61 | | | | | | 14,914 | | | | | | 1.78 | (d) | | | | | 2.40 | (d) | | | | | (1.32 | )(d) | | | | | 68 | |
| | | 8.97 | | | | | | 1.24 | | | | | | 915,401 | | | | | | 0.63 | (d) | | | | | 1.25 | (d) | | | | | (0.17 | )(d) | | | | | 68 | |
| | | 8.91 | | | | | | 1.25 | | | | | | 12,281 | | | | | | 0.78 | (d) | | | | | 1.40 | (d) | | | | | (0.30 | )(d) | | | | | 68 | |
| | | 8.58 | | | | | | 0.94 | | | | | | 2,129 | | | | | | 1.28 | (d) | | | | | 1.90 | (d) | | | | | (0.81 | )(d) | | | | | 68 | |
| | | 8.97 | | | | | | 1.24 | | | | | | 10 | | | | | | 0.64 | (d) | | | | | 1.23 | (d) | | | | | (0.20 | )(d) | | | | | 68 | |
| | | | | | | | | | | | | | | | | | | | | | | | | | | | | | | | | | | | | | | | |
| | | | | | | | | | | | | | | | | | | | | | | | | | | | | | | | | | | | | | | | |
| | | 8.67 | | | | | | (2.45 | ) | | | | | 45,207 | | | | | | 1.04 | | | | | | 1.60 | | | | | | (0.74 | ) | | | | | 213 | |
| | | 8.17 | | | | | | (3.20 | ) | | | | �� | 18,329 | | | | | | 1.79 | | | | | | 2.35 | | | | | | (1.51 | ) | | | | | 213 | |
| | | 8.86 | | | | | | (2.18 | ) | | | | | 1,111,353 | | | | | | 0.64 | | | | | | 1.20 | | | | | | (0.36 | ) | | | | | 213 | |
| | | 8.80 | | | | | | (2.23 | ) | | | | | 6,755 | | | | | | 0.79 | | | | | | 1.35 | | | | | | (0.49 | ) | | | | | 213 | |
| | | 8.50 | | | | | | (2.71 | ) | | | | | 2,019 | | | | | | 1.29 | | | | | | 1.85 | | | | | | (0.97 | ) | | | | | 213 | |
| | | 8.86 | | | | | | (2.98 | ) | | | | | 10 | | | | | | 0.64 | (d) | | | | | 1.21 | (d) | | | | | (0.22 | )(d) | | | | | 213 | |
| | | 9.01 | | | | | | 2.61 | | | | | | 64,120 | | | | | | 1.05 | | | | | | 1.59 | | | | | | (0.96 | ) | | | | | 134 | |
| | | 8.54 | | | | | | 1.92 | | | | | | 28,736 | | | | | | 1.80 | | | | | | 2.34 | | | | | | (1.69 | ) | | | | | 134 | |
| | | 9.22 | | | | | | 3.09 | | | | | | 1,874,703 | | | | | | 0.65 | | | | | | 1.19 | | | | | | (0.54 | ) | | | | | 134 | |
| | | 9.15 | | | | | | 2.85 | | | | | | 8,046 | | | | | | 0.81 | | | | | | 1.34 | | | | | | (0.73 | ) | | | | | 134 | |
| | | 8.85 | | | | | | 2.42 | | | | | | 2,299 | | | | | | 1.30 | | | | | | 1.84 | | | | | | (1.19 | ) | | | | | 134 | |
| | | 9.12 | | | | | | 7.90 | | | | | | 105,432 | | | | | | 1.55 | | | | | | 1.59 | | | | | | (1.33 | ) | | | | | 163 | |
| | | 8.72 | | | | | | 7.02 | | | | | | 29,942 | | | | | | 2.30 | | | | | | 2.34 | | | | | | (2.08 | ) | | | | | 163 | |
| | | 9.32 | | | | | | 8.33 | | | | | | 1,589,475 | | | | | | 1.15 | | | | | | 1.19 | | | | | | (0.92 | ) | | | | | 163 | |
| | | 9.24 | | | | | | 8.15 | | | | | | 21,565 | | | | | | 1.30 | | | | | | 1.34 | | | | | | (1.08 | ) | | | | | 163 | |
| | | 8.98 | | | | | | 7.54 | | | | | | 1,729 | | | | | | 1.80 | | | | | | 1.84 | | | | | | (1.57 | ) | | | | | 163 | |
| | | 8.95 | | | | | | 2.30 | | | | | | 133,654 | | | | | | 1.55 | | | | | | 1.59 | | | | | | (1.44 | ) | | | | | 79 | |
| | | 8.65 | | | | | | 1.55 | | | | | | 37,525 | | | | | �� | 2.30 | | | | | | 2.34 | | | | | | (2.19 | ) | | | | | 79 | |
| | | 9.10 | | | | | | 2.72 | | | | | | 1,355,193 | | | | | | 1.15 | | | | | | 1.19 | | | | | | (1.04 | ) | | | | | 79 | |
| | | 9.04 | | | | | | 2.51 | | | | | | 17,085 | | | | | | 1.30 | | | | | | 1.34 | | | | | | (1.19 | ) | | | | | 79 | |
| | | 8.85 | | | | | | 1.98 | | | | | | 1,988 | | | | | | 1.80 | | | | | | 1.84 | | | | | | (1.69 | ) | | | | | 79 | |
| | | 8.79 | | | | | | (3.77 | ) | | | | | 493,429 | | | | | | 1.56 | | | | | | 1.59 | | | | | | (1.31 | ) | | | | | 105 | |
| | | 8.56 | | | | | | (4.50 | ) | | | | | 60,598 | | | | | | 2.31 | | | | | | 2.34 | | | | | | (2.06 | ) | | | | | 105 | |
| | | 8.90 | | | | | | (3.51 | ) | | | | | 1,314,751 | | | | | | 1.16 | | | | | | 1.19 | | | | | | (0.88 | ) | | | | | 105 | |
| | | 8.86 | | | | | | (3.63 | ) | | | | | 16,341 | | | | | | 1.31 | | | | | | 1.34 | | | | | | (1.02 | ) | | | | | 105 | |
| | | 8.72 | | | | | | (4.00 | ) | | | | | 1,258 | | | | | | 1.81 | | | | | | 1.84 | | | | | | (1.54 | ) | | | | | 105 | |
| | |
| The accompanying notes are an integral part of these financial statements. | | 63 |
GOLDMAN SACHS COMMODITY STRATEGY FUND
Financial Highlights
Selected Data for a Share Outstanding Throughout Each Period
| | | | | | | | | | | | | | | | | | | | | | |
| | | | | | | | Income (loss) from
investment operations | | | | |
| | | Year - Share Class | | Net asset
value,
beginning
of period | | | Net
investment
income (loss)(a) | | | Net realized
and unrealized
gain (loss) | | | Total from
investment
operations | | | Distributions
to shareholders
from net
investment
income | |
| | FOR THE SIX MONTHS ENDED JUNE 30, (UNAUDITED) | |
| | 2016 - A | | $ | 10.49 | | | $ | 0.01 | | | $ | 1.06 | | | $ | 1.07 | | | $ | (0.03 | ) |
| | 2016 - C | | | 10.04 | | | | (0.03 | ) | | | 1.01 | | | | 0.98 | | | | — | |
| | 2016 - Institutional | | | 10.59 | | | | 0.03 | | | | 1.08 | | | | 1.11 | | | | (0.05 | ) |
| | 2016 - IR | | | 10.60 | | | | 0.02 | | | | 1.07 | | | | 1.09 | | | | (0.04 | ) |
| | 2016 - R | | | 10.35 | | | | — | (e) | | | 1.04 | | | | 1.04 | | | | (0.02 | ) |
| | 2016 - R6 | | | 10.60 | | | | 0.03 | | | | 1.07 | | | | 1.10 | | | | (0.05 | ) |
| | | | | | | | | | | | | | | | | | | | | | |
| | FOR THE FISCAL YEARS ENDED DECEMBER 31,* | |
| | 2015 - A | | | 15.58 | | | | (0.03 | ) | | | (5.04 | ) | | | (5.07 | ) | | | (0.02 | ) |
| | 2015 - C | | | 14.99 | | | | (0.13 | ) | | | (4.82 | ) | | | (4.95 | ) | | | — | |
| | 2015 - Institutional | | | 15.72 | | | | 0.02 | | | | (5.10 | ) | | | (5.08 | ) | | | (0.05 | ) |
| | 2015 - IR | | | 15.74 | | | | — | (e) | | | (5.08 | ) | | | (5.08 | ) | | | (0.06 | ) |
| | 2015 - R | | | 15.38 | | | | (0.06 | ) | | | (4.97 | ) | | | (5.03 | ) | | | — | (e) |
| | 2015 - R6 (Commenced July 31, 2015) | | | 13.48 | | | | 0.02 | | | | (2.86 | ) | | | (2.84 | ) | | | (0.04 | ) |
| | 2014 - A | | | 22.54 | | | | (0.13 | ) | | | (6.83 | ) | | | (6.96 | ) | | | — | |
| | 2014 - C | | | 21.85 | | | | (0.26 | ) | | | (6.60 | ) | | | (6.86 | ) | | | — | |
| | 2014 - Institutional | | | 22.69 | | | | (0.04 | ) | | | (6.91 | ) | | | (6.95 | ) | | | (0.02 | ) |
| | 2014 - IR | | | 22.72 | | | | (0.05 | ) | | | (6.93 | ) | | | (6.98 | ) | | | — | (e) |
| | 2014 - R | | | 22.31 | | | | (0.16 | ) | | | (6.77 | ) | | | (6.93 | ) | | | — | |
| | 2013 - A | | | 22.94 | | | | (0.21 | ) | | | (0.19 | ) | | | (0.40 | ) | | | — | |
| | 2013 - C | | | 22.40 | | | | (0.36 | ) | | | (0.19 | ) | | | (0.55 | ) | | | — | |
| | 2013 - Institutional | | | 23.01 | | | | (0.13 | ) | | | (0.19 | ) | | | (0.32 | ) | | | — | |
| | 2013 - IR | | | 23.06 | | | | (0.15 | ) | | | (0.19 | ) | | | (0.34 | ) | | | — | |
| | 2013 - R | | | 22.76 | | | | (0.25 | ) | | | (0.20 | ) | | | (0.45 | ) | | | — | |
| | 2012 - A | | | 23.53 | | | | (0.14 | ) | | | (0.29 | ) | | | (0.43 | ) | | | (0.16 | ) |
| | 2012 - C | | | 23.12 | | | | (0.32 | ) | | | (0.28 | ) | | | (0.60 | ) | | | (0.12 | ) |
| | 2012 - Institutional | | | 23.56 | | | | (0.07 | ) | | | (0.28 | ) | | | (0.35 | ) | | | (0.20 | ) |
| | 2012 - IR | | | 23.63 | | | | (0.11 | ) | | | (0.28 | ) | | | (0.39 | ) | | | (0.18 | ) |
| | 2012 - R | | | 23.38 | | | | (0.20 | ) | | | (0.27 | ) | | | (0.47 | ) | | | (0.15 | ) |
| | 2011 - A | | | 24.14 | | | | (0.15 | ) | | | 0.02 | | | | (0.13 | ) | | | (0.48 | ) |
| | 2011 - C | | | 23.81 | | | | (0.33 | ) | | | 0.04 | | | | (0.29 | ) | | | (0.40 | ) |
| | 2011 - Institutional | | | 24.15 | | | | (0.07 | ) | | | — | | | | (0.07 | ) | | | (0.52 | ) |
| | 2011 - IR | | | 24.20 | | | | (0.09 | ) | | | 0.04 | | | | (0.05 | ) | | | (0.52 | ) |
| | 2011 - R | | | 24.03 | | | | (0.21 | ) | | | 0.04 | | | | (0.17 | ) | | | (0.48 | ) |
| | * | | All per share amounts representing data prior to November 6, 2015 have been restated to reflect a 4 to 1 reverse stock split which occurred on that date. |
| | (a) | | Calculated based on the average shares outstanding methodology. |
| | (b) | | Assumes investment at the net asset value at the beginning of the period, reinvestment of all distributions, a complete redemption of the investment at the net asset value at the end of the period and no sales or redemption charges. Total returns would be reduced if a sales or redemption charge was taken into account. Returns do not reflect the impact of taxes to shareholders relating to Fund distributions or the redemption of Fund shares. Total returns for periods less than one full year are not annualized. |
| | (c) | | The Fund’s portfolio turnover rate is calculated in accordance with regulatory requirements, without regard to transactions involving short term investments and certain derivatives. If such transactions were included, the Fund’s portfolio turnover rate may be higher. |
| | (e) | | Amount is less than $0.005 per share. |
| | |
| 64 | | The accompanying notes are an integral part of these financial statements. |
GOLDMAN SACHS COMMODITY STRATEGY FUND
| | | | | | | | | | | | | | | | | | | | | | | | | | | | | | | | | | | | | | | | |
| | | | | | | | | | | | | | | | | | | | | | | | | | | | | | | | | | |
| | | Net asset
value, end
of period | | | | | Total
return(b) | | | | | Net assets,
end of
period
(in 000s) | | | | | Ratio of
net expenses
to average
net assets | | | | | Ratio of
total expenses
to average
net assets | | | | | Ratio of
net investment
income (loss)
to average
net assets | | | | | Portfolio
turnover
rate(c) | |
| | | | | | | | | | | | | | | | | | | | | | | | | | | | | | | | | | | | | | | | |
| | $ | 11.53 | | | | | | 10.19 | % | | | | $ | 61,099 | | | | | | 0.91 | %(d) | | | | | 1.03 | %(d) | | | | | 0.18 | %(d) | | | | | 96 | % |
| | | 11.02 | | | | | | 9.76 | | | | | | 4,814 | | | | | | 1.66 | (d) | | | | | 1.78 | (d) | | | | | (0.57 | )(d) | | | | | 96 | |
| | | 11.65 | | | | | | 10.44 | | | | | | 318,191 | | | | | | 0.57 | (d) | | | | | 0.69 | (d) | | | | | 0.55 | (d) | | | | | 96 | |
| | | 11.65 | | | | | | 10.31 | | | | | | 8,547 | | | | | | 0.66 | (d) | | | | | 0.78 | (d) | | | | | 0.42 | (d) | | | | | 96 | |
| | | 11.37 | | | | | | 10.05 | | | | | | 2,630 | | | | | | 1.16 | (d) | | | | | 1.28 | (d) | | | | | (0.08 | )(d) | | | | | 96 | |
| | | 11.65 | | | | | | 10.35 | | | | | | 1,605 | | | | | | 0.55 | (d) | | | | | 0.67 | (d) | | | | | 0.54 | (d) | | | | | 96 | |
| | | | | | | | | | | | | | | | | | | | | | | | | | | | | | | | | | | | | | | | |
| | | | | | | | | | | | | | | | | | | | | | | | | | | | | | | | | | | | | | | | |
| | | 10.49 | | | | | | (32.43 | ) | | | | | 58,901 | | | | | | 0.85 | | | | | | 0.97 | | | | | | (0.21 | ) | | | | | 506 | |
| | | 10.04 | | | | | | (32.95 | ) | | | | | 4,578 | | | | | | 1.60 | | | | | | 1.72 | | | | | | (0.97 | ) | | | | | 506 | |
| | | 10.59 | | | | | | (32.38 | ) | | | | | 544,699 | | | | | | 0.51 | | | | | | 0.63 | | | | | | 0.12 | | | | | | 506 | |
| | | 10.60 | | | | | | (32.15 | ) | | | | | 6,699 | | | | | | 0.60 | | | | | | 0.72 | | | | | | 0.03 | | | | | | 506 | |
| | | 10.35 | | | | | | (32.88 | ) | | | | | 1,963 | | | | | | 1.10 | | | | | | 1.23 | | | | | | (0.44 | ) | | | | | 506 | |
| | | 10.60 | | | | | | (21.23 | ) | | | | | 1,336 | | | | | | 0.51 | (d) | | | | | 0.64 | (d) | | | | | 0.35 | (d) | | | | | 506 | |
| | | 15.58 | | | | | | (31.03 | ) | | | | | 85,200 | | | | | | 0.88 | | | | | | 0.95 | | | | | | (0.59 | ) | | | | | 234 | |
| | | 14.99 | | | | | | (31.32 | ) | | | | | 8,149 | | | | | | 1.62 | | | | | | 1.71 | | | | | | (1.27 | ) | | | | | 234 | |
| | | 15.72 | | | | | | (30.62 | ) | | | | | 764,809 | | | | | | 0.53 | | | | | | 0.62 | | | | | | (0.17 | ) | | | | | 234 | |
| | | 15.74 | | | | | | (30.80 | ) | | | | | 7,740 | | | | | | 0.61 | | | | | | 0.71 | | | | | | (0.24 | ) | | | | | 234 | |
| | | 15.38 | | | | | | (31.00 | ) | | | | | 1,542 | | | | | | 1.12 | | | | | | 1.21 | | | | | | (0.77 | ) | | | | | 234 | |
| | | 22.54 | | | | | | (1.57 | ) | | | | | 401,248 | | | | | | 0.92 | | | | | | 0.95 | | | | | | (0.91 | ) | | | | | 266 | |
| | | 21.85 | | | | | | (2.50 | ) | | | | | 11,444 | | | | | | 1.67 | | | | | | 1.70 | | | | | | (1.64 | ) | | | | | 266 | |
| | | 22.69 | | | | | | (1.39 | ) | | | | | 1,039,008 | | | | | | 0.58 | | | | | | 0.61 | | | | | | (0.56 | ) | | | | | 266 | |
| | | 22.72 | | | | | | (1.39 | ) | | | | | 7,991 | | | | | | 0.67 | | | | | | 0.70 | | | | | | (0.64 | ) | | | | | 266 | |
| | | 22.31 | | | | | | (1.93 | ) | | | | | 1,528 | | | | | | 1.17 | | | | | | 1.20 | | | | | | (1.13 | ) | | | | | 266 | |
| | | 22.94 | | | | | | (1.91 | ) | | | | | 353,082 | | | | | | 0.92 | | | | | | 0.96 | | | | | | (0.59 | ) | | | | | 690 | |
| | | 22.40 | | | | | | (2.64 | ) | | | | | 13,994 | | | | | | 1.67 | | | | | | 1.71 | | | | | | (1.39 | ) | | | | | 690 | |
| | | 23.01 | | | | | | (1.57 | ) | | | | | 742,974 | | | | | | 0.58 | | | | | | 0.62 | | | | | | (0.29 | ) | | | | | 690 | |
| | | 23.06 | | | | | | (1.81 | ) | | | | | 7,045 | | | | | | 0.67 | | | | | | 0.71 | | | | | | (0.45 | ) | | | | | 690 | |
| | | 22.76 | | | | | | (2.14 | ) | | | | | 1,450 | | | | | | 1.17 | | | | | | 1.21 | | | | | | (0.86 | ) | | | | | 690 | |
| | | 23.53 | | | | | | (0.56 | ) | | | | | 205,561 | | | | | | 0.92 | | | | | | 0.95 | | | | | | (0.61 | ) | | | | | 581 | |
| | | 23.12 | | | | | | (1.26 | ) | | | | | 15,273 | | | | | | 1.67 | | | | | | 1.70 | | | | | | (1.36 | ) | | | | | 581 | |
| | | 23.56 | | | | | | (0.41 | ) | | | | | 668,618 | | | | | | 0.58 | | | | | | 0.61 | | | | | | (0.27 | ) | | | | | 581 | |
| | | 23.63 | | | | | | (0.28 | ) | | | | | 19,007 | | | | | | 0.67 | | | | | | 0.70 | | | | | | (0.37 | ) | | | | | 581 | |
| | | 23.38 | | | | | | (0.83 | ) | | | | | 1,063 | | | | | | 1.17 | | | | | | 1.20 | | | | | | (0.87 | ) | | | | | 581 | |
| | |
| The accompanying notes are an integral part of these financial statements. | | 65 |
GOLDMAN SACHS DYNAMIC ALLOCATION FUND
Financial Highlights
Selected Data for a Share Outstanding Throughout Each Period
| | | | | | | | | | | | | | | | | | | | | | | | | | | | | | |
| | | | | | | | Income (loss) from
investment operations | | | Distributions
to shareholders | |
| | | Year - Share Class | |
Net asset
value,
beginning
of period | | | Net
investment
income (loss)(a) | | | Net realized
and unrealized
gain (loss) | | | Total from
investment
operations | | | From net
investment
income | | | From net
realized
gains | | | Total
distributions | |
| | FOR THE SIX MONTHS ENDED JUNE 30, (UNAUDITED) | |
| | 2016 - A | | $ | 9.45 | | | $ | 0.01 | | | $ | 0.08 | | | $ | 0.09 | | | $ | — | | | $ | — | | | $ | — | |
| | 2016 - C | | | 9.08 | | | | (0.03 | ) | | | 0.08 | | | | 0.05 | | | | — | | | | — | | | | — | |
| | 2016 - Institutional | | | 9.54 | | | | 0.03 | | | | 0.08 | | | | 0.11 | | | | — | | | | — | | | | — | |
| | 2016 - IR | | | 9.52 | | | | 0.02 | | | | 0.08 | | | | 0.10 | | | | — | | | | — | | | | — | |
| | 2016 - R | | | 9.36 | | | | — | (e) | | | 0.08 | | | | 0.08 | | | | — | | | | — | | | | — | |
| | 2016 - R6 | | | 9.54 | | | | 0.03 | | | | 0.08 | | | | 0.11 | | | | — | | | | — | | | | — | |
| | | | | | | | | | | | | | | | | | | | | | | | | | | | | | |
| | FOR THE FISCAL YEARS ENDED DECEMBER 31, | |
| | 2015 - A | | | 10.49 | | | | (0.04 | ) | | | (0.71 | ) | | | (0.75 | ) | | | (0.01 | ) | | | (0.28 | ) | | | (0.29 | ) |
| | 2015 - C | | | 10.15 | | | | (0.11 | ) | | | (0.68 | ) | | | (0.79 | ) | | | — | | | | (0.28 | ) | | | (0.28 | ) |
| | 2015 - Institutional | | | 10.61 | | | | — | (e) | | | (0.72 | ) | | | (0.72 | ) | | | (0.07 | ) | | | (0.28 | ) | | | (0.35 | ) |
| | 2015 - IR | | | 10.57 | | | | (0.01 | ) | | | (0.72 | ) | | | (0.73 | ) | | | (0.04 | ) | | | (0.28 | ) | | | (0.32 | ) |
| | 2015 - R | | | 10.40 | | | | (0.05 | ) | | | (0.71 | ) | | | (0.76 | ) | | | — | | | | (0.28 | ) | | | (0.28 | ) |
| | 2015 - R6 (Commenced July 31, 2015) | | | 10.46 | | | | (0.01 | ) | | | (0.56 | ) | | | (0.57 | ) | | | (0.07 | ) | | | (0.28 | ) | | | (0.35 | ) |
| | 2014 - A | | | 10.89 | | | | (0.08 | ) | | | 0.32 | | | | 0.24 | | | | (0.05 | ) | | | (0.59 | ) | | | (0.64 | ) |
| | 2014 - C | | | 10.60 | | | | (0.15 | ) | | | 0.29 | | | | 0.14 | | | | — | | | | (0.59 | ) | | | (0.59 | ) |
| | 2014 - Institutional | | | 11.02 | | | | (0.03 | ) | | | 0.32 | | | | 0.29 | | | | (0.11 | ) | | | (0.59 | ) | | | (0.70 | ) |
| | 2014 - IR | | | 10.99 | | | | (0.05 | ) | | | 0.31 | | | | 0.26 | | | | (0.09 | ) | | | (0.59 | ) | | | (0.68 | ) |
| | 2014 - R | | | 10.83 | | | | (0.10 | ) | | | 0.30 | | | | 0.20 | | | | (0.04 | ) | | | (0.59 | ) | | | (0.63 | ) |
| | 2013 - A | | | 10.70 | | | | (0.13 | ) | | | 0.68 | | | | 0.55 | | | | — | | | | (0.36 | ) | | | (0.36 | ) |
| | 2013 - C | | | 10.50 | | | | (0.20 | ) | | | 0.66 | | | | 0.46 | | | | — | | | | (0.36 | ) | | | (0.36 | ) |
| | 2013 - Institutional | | | 10.78 | | | | (0.08 | ) | | | 0.68 | | | | 0.60 | | | | — | (e) | | | (0.36 | ) | | | (0.36 | ) |
| | 2013 - IR | | | 10.76 | | | | (0.10 | ) | | | 0.69 | | | | 0.59 | | | | — | | | | (0.36 | ) | | | (0.36 | ) |
| | 2013 - R | | | 10.67 | | | | (0.15 | ) | | | 0.67 | | | | 0.52 | | | | — | | | | (0.36 | ) | | | (0.36 | ) |
| | 2012 - A | | | 10.29 | | | | (0.07 | ) | | | 0.86 | | | | 0.79 | | | | — | | | | (0.38 | ) | | | (0.38 | ) |
| | 2012 - C | | | 10.18 | | | | (0.14 | ) | | | 0.84 | | | | 0.70 | | | | — | | | | (0.38 | ) | | | (0.38 | ) |
| | 2012 - Institutional | | | 10.35 | | | | (0.04 | ) | | | 0.88 | | | | 0.84 | | | | (0.03 | ) | | | (0.38 | ) | | | (0.41 | ) |
| | 2012 - IR | | | 10.33 | | | | (0.03 | ) | | | 0.85 | | | | 0.82 | | | | (0.01 | ) | | | (0.38 | ) | | | (0.39 | ) |
| | 2012 - R | | | 10.28 | | | | (0.09 | ) | | | 0.86 | | | | 0.77 | | | | — | | | | (0.38 | ) | | | (0.38 | ) |
| | 2011 - A | | | 10.54 | | | | (0.03 | ) | | | (0.15 | ) | | | (0.18 | ) | | | (0.04 | ) | | | (0.03 | ) | | | (0.07 | ) |
| | 2011 - C | | | 10.47 | | | | (0.13 | ) | | | (0.12 | ) | | | (0.25 | ) | | | (0.01 | ) | | | (0.03 | ) | | | (0.04 | ) |
| | 2011 - Institutional | | | 10.59 | | | | 0.01 | | | | (0.16 | ) | | | (0.15 | ) | | | (0.06 | ) | | | (0.03 | ) | | | (0.09 | ) |
| | 2011 - IR | | | 10.57 | | | | (0.02 | ) | | | (0.14 | ) | | | (0.16 | ) | | | (0.05 | ) | | | (0.03 | ) | | | (0.08 | ) |
| | 2011 - R | | | 10.52 | | | | (0.05 | ) | | | (0.16 | ) | | | (0.21 | ) | | | — | | | | (0.03 | ) | | | (0.03 | ) |
| | (a) | | Calculated based on the average shares outstanding methodology. |
| | (b) | | Assumes investment at the net asset value at the beginning of the period, reinvestment of all distributions, a complete redemption of the investment at the net asset value at the end of the period and no sales or redemption charges. Total returns would be reduced if a sales or redemption charge was taken into account. Returns do not reflect the impact of taxes to shareholders relating to Fund distributions or the redemption of Fund shares. Total returns for periods less than one full year are not annualized. |
| | (c) | | The Fund’s portfolio turnover rate is calculated in accordance with regulatory requirements, without regard to transactions involving short term investments and certain derivatives. If such transactions were included, the Fund’s portfolio turnover rate may be higher. |
| | (e) | | Amount is less than $0.005 per share. |
| | (f) | | Amount is less than 0.005% |
| | |
| 66 | | The accompanying notes are an integral part of these financial statements. |
GOLDMAN SACHS DYNAMIC ALLOCATION FUND
| | | | | | | | | | | | | | | | | | | | | | | | | | | | | | | | | | | | | | | | |
| | | | | | | | | | | | | | | | | | | | | | | | | | | | | | | | | | |
| | | Net asset
value, end
of period | | | | | Total
return(b) | | | | | Net assets,
end of
period
(in 000s) | | | | | Ratio of
net expenses
to average
net assets | | | | | Ratio of
total expenses
to average
net assets | | | | | Ratio of
net investment
income (loss)
to average
net assets | | | | | Portfolio
turnover
rate(c) | |
| | | | | | | | | | | | | | | | | | | | | | | | | | | | | | | | | | | | | | | | |
| | $ | 9.54 | | | | | | 0.85 | % | | | | $ | 33,122 | | | | | | 1.16 | %(d) | | | | | 1.45 | %(d) | | | | | 0.12 | %(d) | | | | | 124 | % |
| | | 9.13 | | | | | | 0.44 | | | | | | 24,002 | | | | | | 1.91 | (d) | | | | | 2.20 | (d) | | | | | (0.61 | )(d) | | | | | 124 | |
| | | 9.65 | | | | | | 1.05 | | | | | | 489,134 | | | | | | 0.76 | (d) | | | | | 1.05 | (d) | | | | | 0.57 | (d) | | | | | 124 | |
| | | 9.62 | | | | | | 0.95 | | | | | | 6,655 | | | | | | 0.91 | (d) | | | | | 1.20 | (d) | | | | | 0.33 | (d) | | | | | 124 | |
| | | 9.44 | | | | | | 0.75 | | | | | | 11 | | | | | | 1.41 | (d) | | | | | 1.70 | (d) | | | | | (0.08 | )(d) | | | | | 124 | |
| | | 9.65 | | | | | | 1.05 | | | | | | 10 | | | | | | 0.76 | (d) | | | | | 0.98 | (d) | | | | | 0.58 | (d) | | | | | 124 | |
| | | | | | | | | | | | | | | | | | | | | | | | | | | | | | | | | | | | | | | | |
| | | | | | | | | | | | | | | | | | | | | | | | | | | | | | | | | | | | | | | | |
| | | 9.45 | | | | | | (7.17 | ) | | | | | 43,167 | | | | | | 1.13 | | | | | | 1.43 | | | | | | (0.39 | ) | | | | | 241 | |
| | | 9.08 | | | | | | (7.82 | ) | | | | | 27,914 | | | | | | 1.88 | | | | | | 2.18 | | | | | | (1.14 | ) | | | | | 241 | |
| | | 9.54 | | | | | | (6.84 | ) | | | | | 510,789 | | | | | | 0.73 | | | | | | 1.03 | | | | | | — | (f) | | | | | 241 | |
| | | 9.52 | | | | | | (6.90 | ) | | | | | 9,933 | | | | | | 0.88 | | | | | | 1.18 | | | | | | (0.14 | ) | | | | | 241 | |
| | | 9.36 | | | | | | (7.35 | ) | | | | | 11 | | | | | | 1.33 | | | | | | 1.65 | | | | | | (0.49 | ) | | | | | 241 | |
| | | 9.54 | | | | | | (5.48 | ) | | | | | 9 | | | | | | 0.77 | (d) | | | | | 0.97 | (d) | | | | | (0.21 | )(d) | | | | | 241 | |
| | | 10.49 | | | | | | 2.19 | | | | | | 78,100 | | | | | | 1.23 | | | | | | 1.42 | | | | | | (0.70 | ) | | | | | 211 | |
| | | 10.15 | | | | | | 1.29 | | | | | | 41,299 | | | | | | 1.97 | | | | | | 2.17 | | | | | | (1.42 | ) | | | | | 211 | |
| | | 10.61 | | | | | | 2.61 | | | | | | 645,286 | | | | | | 0.81 | | | | | | 1.02 | | | | | | (0.25 | ) | | | | | 211 | |
| | | 10.57 | | | | | | 2.33 | | | | | | 26,862 | | | | | | 0.97 | | | | | | 1.17 | | | | | | (0.43 | ) | | | | | 211 | |
| | | 10.40 | | | | | | 1.85 | | | | | | 12 | | | | | | 1.49 | | | | | | 1.62 | | | | | | (0.92 | ) | | | | | 211 | |
| | | 10.89 | | | | | | 5.21 | | | | | | 169,197 | | | | | | 1.30 | | | | | | 1.37 | | | | | | (1.18 | ) | | | | | 311 | |
| | | 10.60 | | | | | | 4.45 | | | | | | 66,543 | | | | | | 2.05 | | | | | | 2.12 | | | | | | (1.89 | ) | | | | | 311 | |
| | | 11.02 | | | | | | 5.65 | | | | | | 756,409 | | | | | | 0.90 | | | | | | 0.97 | | | | | | (0.74 | ) | | | | | 311 | |
| | | 10.99 | | | | | | 5.55 | | | | | | 46,709 | | | | | | 1.05 | | | | | | 1.12 | | | | | | (0.88 | ) | | | | | 311 | |
| | | 10.83 | | | | | | 4.94 | | | | | | 12 | | | | | | 1.55 | | | | | | 1.59 | | | | | | (1.40 | ) | | | | | 311 | |
| | | 10.70 | | | | | | 7.66 | | | | | | 291,432 | | | | | | 1.38 | | | | | | 1.38 | | | | | | (0.61 | ) | | | | | 177 | |
| | | 10.50 | | | | | | 6.86 | | | | | | 76,580 | | | | | | 2.13 | | | | | | 2.13 | | | | | | (1.32 | ) | | | | | 177 | |
| | | 10.78 | | | | | | 8.06 | | | | | | 853,273 | | | | | | 0.97 | | | | | | 0.97 | | | | | | (0.37 | ) | | | | | 177 | |
| | | 10.76 | | | | | | 7.89 | | | | | | 59,935 | | | | | | 1.13 | | | | | | 1.14 | | | | | | (0.31 | ) | | | | | 177 | |
| | | 10.67 | | | | | | 7.48 | | | | | | 11 | | | | | | 1.63 | | | | | | 1.64 | | | | | | (0.84 | ) | | | | | 177 | |
| | | 10.29 | | | | | | (1.72 | ) | | | | | 165,877 | | | | | | 1.39 | | | | | | 1.47 | | | | | | (0.32 | ) | | | | | 297 | |
| | | 10.18 | | | | | | (2.43 | ) | | | | | 56,025 | | | | | | 2.14 | | | | | | 2.22 | | | | | | (1.22 | ) | | | | | 297 | |
| | | 10.35 | | | | | | (1.38 | ) | | | | | 199,083 | | | | | | 0.99 | | | | | | 1.07 | | | | | | 0.08 | | | | | | 297 | |
| | | 10.33 | | | | | | (1.47 | ) | | | | | 56,972 | | | | | | 1.14 | | | | | | 1.22 | | | | | | (0.22 | ) | | | | | 297 | |
| | | 10.28 | | | | | | (2.04 | ) | | | | | 10 | | | | | | 1.64 | | | | | | 1.72 | | | | | | (0.49 | ) | | | | | 297 | |
| | |
| The accompanying notes are an integral part of these financial statements. | | 67 |
GOLDMAN SACHS DYNAMIC COMMODITY STRATEGY FUND
Financial Highlights
Selected Data for a Share Outstanding Throughout Each Period
| | | | | | | | | | | | | | | | | | |
| | | | | | | | Income (loss) from
investment operations | |
| | | Year - Share Class | |
Net asset
value,
beginning
of period | | | Net
investment
loss(a) | | | Net realized
and unrealized
gain (loss) | | | Total from
investment
operations | |
| | FOR THE SIX MONTHS ENDED JUNE 30, (UNAUDITED) | |
| | 2016 - A | | $ | 6.02 | | | $ | (0.02 | ) | | $ | 0.43 | | | $ | 0.41 | |
| | 2016 - C | | | 5.94 | | | | (0.05 | ) | | | 0.43 | | | | 0.38 | |
| | 2016 - Institutional | | | 6.05 | | | | (0.01 | ) | | | 0.43 | | | | 0.42 | |
| | 2016 - IR | | | 6.04 | | | | (0.02 | ) | | | 0.44 | | | | 0.42 | |
| | 2016 - R | | | 5.99 | | | | (0.03 | ) | | | 0.43 | | | | 0.40 | |
| | | | | | | | | | | | | | | | | | |
| | FOR THE FISCAL YEAR ENDED DECEMBER 31, | |
| | 2015 - A | | | 7.86 | | | | (0.07 | ) | | | (1.77 | ) | | | (1.84 | ) |
| | 2015 - C | | | 7.82 | | | | (0.13 | ) | | | (1.75 | ) | | | (1.88 | ) |
| | 2015 - Institutional | | | 7.88 | | | | (0.05 | ) | | | (1.78 | ) | | | (1.83 | ) |
| | 2015 - IR | | | 7.87 | | | | (0.06 | ) | | | (1.77 | ) | | | (1.83 | ) |
| | 2015 - R | | | 7.84 | | | | (0.09 | ) | | | (1.76 | ) | | | (1.85 | ) |
| | 2014 - A (Commenced April 30, 2014) | | | 10.00 | | | | (0.06 | ) | | | (2.08 | ) | | | (2.14 | ) |
| | 2014 - C (Commenced April 30, 2014) | | | 10.00 | | | | (0.12 | ) | | | (2.06 | ) | | | (2.18 | ) |
| | 2014 - Institutional (Commenced April 30, 2014) | | | 10.00 | | | | (0.05 | ) | | | (2.07 | ) | | | (2.12 | ) |
| | 2014 - IR (Commenced April 30, 2014) | | | 10.00 | | | | (0.05 | ) | | | (2.08 | ) | | | (2.13 | ) |
| | 2014 - R (Commenced April 30, 2014) | | | 10.00 | | | | (0.08 | ) | | | (2.08 | ) | | | (2.16 | ) |
| | (a) | | Calculated based on the average shares outstanding methodology. |
| | (b) | | Assumes investment at the net asset value at the beginning of the period, reinvestment of all distributions, a complete redemption of the investment at the net asset value at the end of the period and no sales or redemption charges. Total returns would be reduced if a sales or redemption charge was taken into account. Returns do not reflect the impact of taxes to shareholders relating to Fund distributions or the redemption of Fund shares. Total returns for periods less than one full year are not annualized. |
| | (c) | | The Fund’s portfolio turnover rate is calculated in accordance with regulatory requirements, without regard to transactions involving short term investments and certain derivatives. If such transactions were included, the Fund’s portfolio turnover rate may be higher. |
| | |
| 68 | | The accompanying notes are an integral part of these financial statements. |
GOLDMAN SACHS DYNAMIC COMMODITY STRATEGY FUND
| | | | | | | | | | | | | | | | | | | | | | | | | | | | | | | | | | | | | | | | |
| | | | | | | | | | | | | | | | | | | | | | | | | | | | | | | | | | |
| | | Net asset
value, end
of period | | | | | Total
return(b) | | | | | Net assets,
end of
period
(in 000s) | | | | | Ratio of
net expenses
to average
net assets | | | | | Ratio of
total expenses
to average
net assets | | | | | Ratio of
net investment
loss
to average
net assets | | | | | Portfolio
turnover
rate(c) | |
| | | | | | | | | | | | | | | | | | | | | | | | | | | | | | | | | | | | | | | | |
| | $ | 6.43 | | | | | | 6.99 | % | | | | $ | 113 | | | | | | 1.14 | %(d) | | | | | 2.75 | %(d) | | | | | (0.82 | )%(d) | | | | | — | % |
| | | 6.32 | | | | | | 6.58 | | | | | | 21 | | | | | | 1.89 | (d) | | | | | 3.47 | (d) | | | | | (1.57 | )(d) | | | | | — | |
| | | 6.47 | | | | | | 7.12 | | | | | | 25,197 | | | | | | 0.80 | (d) | | | | | 2.41 | (d) | | | | | (0.46 | )(d) | | | | | — | |
| | | 6.46 | | | | | | 7.13 | | | | | | 16 | | | | | | 0.88 | (d) | | | | | 2.50 | (d) | | | | | (0.56 | )(d) | | | | | — | |
| | | 6.39 | | | | | | 6.86 | | | | | | 16 | | | | | | 1.39 | (d) | | | | | 2.99 | (d) | | | | | (1.07 | )(d) | | | | | — | |
| | | | | | | | | | | | | | | | | | | | | | | | | | | | | | | | | | | | | | | | |
| | | | | | | | | | | | | | | | | | | | | | | | | | | | | | | | | | | | | | | | |
| | | 6.02 | | | | | | (23.54 | ) | | | | | 135 | | | | | | 1.06 | | | | | | 2.68 | | | | | | (1.02 | ) | | | | | — | |
| | | 5.94 | | | | | | (24.17 | ) | | | | | 6 | | | | | | 1.82 | | | | | | 3.71 | | | | | | (1.81 | ) | | | | | — | |
| | | 6.05 | | | | | | (23.35 | ) | | | | | 24,045 | | | | | | 0.72 | | | | | | 2.61 | | | | | | (0.70 | ) | | | | | — | |
| | | 6.04 | | | | | | (23.38 | ) | | | | | 15 | | | | | | 0.81 | | | | | | 2.70 | | | | | | (0.80 | ) | | | | | — | |
| | | 5.99 | | | | | | (23.72 | ) | | | | | 15 | | | | | | 1.31 | | | | | | 3.20 | | | | | | (1.30 | ) | | | | | — | |
| | | 7.86 | | | | | | (21.40 | ) | | | | | 53 | | | | | | 1.08 | (d) | | | | | 2.50 | (d) | | | | | (1.07 | )(d) | | | | | — | |
| | | 7.82 | | | | | | (21.80 | ) | | | | | 8 | | | | | | 1.87 | (d) | | | | | 3.48 | (d) | | | | | (1.87 | )(d) | | | | | — | |
| | | 7.88 | | | | | | (21.20 | ) | | | | | 30,649 | | | | | | 0.76 | (d) | | | | | 2.38 | (d) | | | | | (0.76 | )(d) | | | | | — | |
| | | 7.87 | | | | | | (21.30 | ) | | | | | 20 | | | | | | 0.86 | (d) | | | | | 2.47 | (d) | | | | | (0.86 | )(d) | | | | | — | |
| | | 7.84 | | | | | | (21.60 | ) | | | | | 20 | | | | | | 1.36 | (d) | | | | | 2.97 | (d) | | | | | (1.36 | )(d) | | | | | — | |
| | |
| The accompanying notes are an integral part of these financial statements. | | 69 |
GOLDMAN SACHS MANAGED FUTURES STRATEGY FUND
Financial Highlights
Selected Data for a Share Outstanding Throughout Each Period
| | | | | | | | | | | | | | | | | | | | | | | | | | | | | | |
| | | | | | | | Income (loss) from
investment operations | | | Distributions
to shareholders | |
| | | Year - Share Class | |
Net asset
value,
beginning
of period | | | Net
investment
loss(a) | | | Net realized
and unrealized
gain (loss) | | | Total from
investment
operations | | | From net
investment
income | | | From net
realized
gains | | | Total
distributions | |
| | FOR THE SIX MONTHS ENDED JUNE 30, (UNAUDITED) | |
| | 2016 - A | | $ | 10.21 | | | $ | (0.07 | ) | | $ | 0.13 | | | $ | 0.06 | | | $ | — | | | $ | — | | | $ | — | |
| | 2016 - C | | | 9.95 | | | | (0.10 | ) | | | 0.12 | | | | 0.02 | | | | — | | | | — | | | | — | |
| | 2016 - Institutional | | | 10.36 | | | | (0.05 | ) | | | 0.13 | | | | 0.08 | | | | — | | | | — | | | | — | |
| | 2016 - IR | | | 10.30 | | | | (0.05 | ) | | | 0.12 | | | | 0.07 | | | | — | | | | — | | | | — | |
| | 2016 - R | | | 10.12 | | | | (0.08 | ) | | | 0.13 | | | | 0.05 | | | | — | | | | — | | | | — | |
| | | | | | | | | | | | | | | | | | | | | | | | | | | | | | |
| | FOR THE FISCAL YEARS ENDED DECEMBER 31, | |
| | 2015 - A | | | 9.67 | | | | (0.16 | ) | | | 1.10 | | | | 0.94 | | | | (0.40 | ) | | | — | | | | (0.40 | ) |
| | 2015 - C | | | 9.45 | | | | (0.23 | ) | | | 1.07 | | | | 0.84 | | | | (0.34 | ) | | | — | | | | (0.34 | ) |
| | 2015 - Institutional | | | 9.77 | | | | (0.12 | ) | | | 1.12 | | | | 1.00 | | | | (0.41 | ) | | | — | | | | (0.41 | ) |
| | 2015 - IR | | | 9.73 | | | | (0.13 | ) | | | 1.11 | | | | 0.98 | | | | (0.41 | ) | | | — | | | | (0.41 | ) |
| | 2015 - R | | | 9.59 | | | | (0.18 | ) | | | 1.09 | | | | 0.91 | | | | (0.38 | ) | | | — | | | | (0.38 | ) |
| | 2014 - A | | | 10.04 | | | | (0.14 | ) | | | (0.14 | ) | | | (0.28 | ) | | | — | | | | (0.09 | ) | | | (0.09 | ) |
| | 2014 - C | | | 9.89 | | | | (0.21 | ) | | | (0.14 | ) | | | (0.35 | ) | | | — | | | | (0.09 | ) | | | (0.09 | ) |
| | 2014 - Institutional | | | 10.11 | | | | (0.11 | ) | | | (0.14 | ) | | | (0.25 | ) | | | — | | | | (0.09 | ) | | | (0.09 | ) |
| | 2014 - IR | | | 10.08 | | | | (0.12 | ) | | | (0.14 | ) | | | (0.26 | ) | | | — | | | | (0.09 | ) | | | (0.09 | ) |
| | 2014 - R | | | 9.99 | | | | (0.17 | ) | | | (0.14 | ) | | | (0.31 | ) | | | — | | | | (0.09 | ) | | | (0.09 | ) |
| | 2013 - A | | | 10.56 | | | | (0.15 | ) | | | (0.37 | ) | | | (0.52 | ) | | | — | | | | — | | | | — | |
| | 2013 - C | | | 10.48 | | | | (0.22 | ) | | | (0.37 | ) | | | (0.59 | ) | | | — | | | | — | | | | — | |
| | 2013 - Institutional | | | 10.59 | | | | (0.11 | ) | | | (0.37 | ) | | | (0.48 | ) | | | — | | | | — | | | | — | |
| | 2013 - IR | | | 10.58 | | | | (0.13 | ) | | | (0.37 | ) | | | (0.50 | ) | | | — | | | | — | | | | — | |
| | 2013 - R | | | 10.53 | | | | (0.17 | ) | | | (0.37 | ) | | | (0.54 | ) | | | — | | | | — | | | | — | |
| | 2012 - A (Commenced February 29, 2012) | | | 10.00 | | | | (0.12 | ) | | | 0.68 | | | | 0.56 | | | | — | | | | — | | | | — | |
| | 2012 - C (Commenced February 29, 2012) | | | 10.00 | | | | (0.19 | ) | | | 0.67 | | | | 0.48 | | | | — | | | | — | | | | — | |
| | 2012 - Institutional (Commenced February 29, 2012) | | | 10.00 | | | | (0.09 | ) | | | 0.68 | | | | 0.59 | | | | — | | | | — | | | | — | |
| | 2012 - IR (Commenced February 29, 2012) | | | 10.00 | | | | (0.10 | ) | | | 0.68 | | | | 0.58 | | | | — | | | | — | | | | — | |
| | 2012 - R (Commenced February 29, 2012) | | | 10.00 | | | | (0.15 | ) | | | 0.68 | | | | 0.53 | | | | — | | | | — | | | | — | |
| | (a) | | Calculated based on the average shares outstanding methodology. |
| | (b) | | Assumes investment at the net asset value at the beginning of the period, reinvestment of all distributions, a complete redemption of the investment at the net asset value at the end of the period and no sales or redemption charges. Total returns would be reduced if a sales or redemption charge was taken into account. Returns do not reflect the impact of taxes to shareholders relating to Fund distributions or the redemption of Fund shares. Total returns for periods less than one full year are not annualized. |
| | (c) | | The Fund’s portfolio turnover rate is calculated in accordance with regulatory requirements, without regard to transactions involving short term investments and certain derivatives. If such transactions were included, the Fund’s portfolio turnover rate may be higher. |
| | |
| 70 | | The accompanying notes are an integral part of these financial statements. |
GOLDMAN SACHS MANAGED FUTURES STRATEGY FUND
| | | | | | | | | | | | | | | | | | | | | | | | | | | | | | | | | | | | | | | | |
| | | | | | | | | | | | | | | | | | | | | | | | | | | | | | | | | | |
| | | Net asset
value, end
of period | | | | | Total
return(b) | | | | | Net assets,
end of
period
(in 000s) | | | | | Ratio of
net expenses
to average
net assets | | | | | Ratio of
total expenses
to average
net assets | | | | | Ratio of
net investment
loss
to average
net assets | | | | | Portfolio
turnover
rate(c) | |
| | | | | | | | | | | | | | | | | | | | | | | | | | | | | | | | | | | | | | | | |
| | $ | 10.27 | | | | | | 0.69 | % | | | | $ | 44,567 | | | | | | 1.51 | %(d) | | | | | 1.64 | %(d) | | | | | (1.30 | )%(d) | | | | | 254 | % |
| | | 9.97 | | | | | | 0.30 | | | | | | 4,876 | | | | | | 2.26 | (d) | | | | | 2.39 | (d) | | | | | (2.06 | )(d) | | | | | 254 | |
| | | 10.44 | | | | | | 0.77 | | | | | | 112,835 | | | | | | 1.19 | (d) | | | | | 1.32 | (d) | | | | | (0.99 | )(d) | | | | | 254 | |
| | | 10.37 | | | | | | 0.68 | | | | | | 19,897 | | | | | | 1.26 | (d) | | | | | 1.39 | (d) | | | | | (1.06 | )(d) | | | | | 254 | |
| | | 10.17 | | | | | | 0.49 | | | | | | 328 | | | | | | 1.76 | (d) | | | | | 1.89 | (d) | | | | | (1.56 | )(d) | | | | | 254 | |
| | | | | | | | | | | | | | | | | | | | | | | | | | | | | | | | | | | | | | | | |
| | | | | | | | | | | | | | | | | | | | | | | | | | | | | | | | | | | | | | | | |
| | | 10.21 | | | | | | 9.69 | | | | | | 24,000 | | | | | | 1.56 | | | | | | 1.84 | | | | | | (1.53 | ) | | | | | 196 | |
| | | 9.95 | | | | | | 8.93 | | | | | | 3,056 | | | | | | 2.30 | | | | | | 2.60 | | | | | | (2.28 | ) | | | | | 196 | |
| | | 10.36 | | | | | | 10.24 | | | | | | 87,820 | | | | | | 1.14 | | | | | | 1.46 | | | | | | (1.12 | ) | | | | | 196 | |
| | | 10.30 | | | | | | 10.08 | | | | | | 6,489 | | | | | | 1.31 | | | | | | 1.60 | | | | | | (1.26 | ) | | | | | 196 | |
| | | 10.12 | | | | | | 9.47 | | | | | | 197 | | | | | | 1.79 | | | | | | 2.11 | | | | | | (1.77 | ) | | | | | 196 | |
| | | 9.67 | | | | | | (2.75 | ) | | | | | 2,698 | | | | | | 1.51 | | | | | | 1.96 | | | | | | (1.50 | ) | | | | | 343 | |
| | | 9.45 | | | | | | (3.50 | ) | | | | | 897 | | | | | | 2.26 | | | | | | 2.69 | | | | | | (2.26 | ) | | | | | 343 | |
| | | 9.77 | | | | | | (2.43 | ) | | | | | 88,381 | | | | | | 1.11 | | | | | | 1.54 | | | | | | (1.10 | ) | | | | | 343 | |
| | | 9.73 | | | | | | (2.54 | ) | | | | | 391 | | | | | | 1.26 | | | | | | 1.69 | | | | | | (1.25 | ) | | | | | 343 | |
| | | 9.59 | | | | | | (3.06 | ) | | | | | 85 | | | | | | 1.76 | | | | | | 2.20 | | | | | | (1.75 | ) | | | | | 343 | |
| | | 10.04 | | | | | | (4.83 | ) | | | | | 1,344 | | | | | | 1.46 | | | | | | 2.64 | | | | | | (1.54 | ) | | | | | — | |
| | | 9.89 | | | | | | (5.63 | ) | | | | | 1,536 | | | | | | 2.21 | | | | | | 3.34 | | | | | | (2.28 | ) | | | | | — | |
| | | 10.11 | | | | | | (4.44 | ) | | | | | 106,635 | | | | | | 1.07 | | | | | | 2.18 | | | | | | (1.12 | ) | | | | | — | |
| | | 10.08 | | | | | | (4.64 | ) | | | | | 384 | | | | | | 1.21 | | | | | | 2.32 | | | | | | (1.27 | ) | | | | | — | |
| | | 9.99 | | | | | | (5.13 | ) | | | | | 89 | | | | | | 1.69 | | | | | | 2.82 | | | | | | (1.79 | ) | | | | | — | |
| | | 10.56 | | | | | | 5.50 | | | | | | 272 | | | | | | 1.44 | (d) | | | | | 8.63 | (d) | | | | | (1.47 | )(d) | | | | | — | |
| | | 10.48 | | | | | | 4.80 | | | | | | 339 | | | | | | 2.15 | (d) | | | | | 7.43 | (d) | | | | | (2.18 | )(d) | | | | | — | |
| | | 10.59 | | | | | | 5.80 | | | | | | 19,401 | | | | | | 1.06 | (d) | | | | | 8.04 | (d) | | | | | (1.09 | )(d) | | | | | — | |
| | | 10.58 | | | | | | 5.70 | | | | | | 410 | | | | | | 1.20 | (d) | | | | | 5.65 | (d) | | | | | (1.21 | )(d) | | | | | — | |
| | | 10.53 | | | | | | 5.30 | | | | | | 11 | | | | | | 1.72 | (d) | | | | | 8.98 | (d) | | | | | (1.75 | )(d) | | | | | — | |
| | |
| The accompanying notes are an integral part of these financial statements. | | 71 |
GOLDMAN SACHS SELECT SATELLITE FUNDS
Notes to Financial Statements
June 30, 2016 (Unaudited)
Goldman Sachs Trust (the “Trust”) is a Delaware statutory trust registered under the Investment Company Act of 1940, as amended (the “Act”), as an open-end management investment company. The following table lists those series of the Trust that are included in this report (collectively, the “Funds” or individually a “Fund”), along with their corresponding share classes and respective diversification status under the Act:
| | | | |
| Fund | | Share Classes Offered | | Diversified/ Non-diversified |
Absolute Return Tracker | | A, C, Institutional, IR, R and R6 | | Diversified |
Commodity Strategy and Dynamic Allocation | | A, C, Institutional, IR, R and R6 | | Non-diversified |
Dynamic Commodity Strategy and Managed Futures Strategy | | A, C, Institutional, IR and R | | Non-diversified |
Class A Shares of the Absolute Return Tracker, Dynamic Allocation and Managed Futures Strategy Funds are sold with a front-end sales charge of up to 5.50%. Class A Shares of the Commodity Strategy and Dynamic Commodity Strategy Funds are sold with a front-end sales charge of up to 4.50%. Class C Shares are sold with a contingent deferred sales charge (“CDSC”) of 1.00%, which is imposed on redemptions made within 12 months of purchase. Institutional, Class IR, Class R and Class R6 Shares are not subject to a sales charge.
Goldman Sachs Asset Management, L.P. (“GSAM”), an affiliate of Goldman, Sachs & Co. (“Goldman Sachs”), serves as Investment Adviser to the Funds pursuant to management agreements (the “Agreements”) with the Trust.
|
| 2. SIGNIFICANT ACCOUNTING POLICIES |
The financial statements have been prepared in accordance with accounting principles generally accepted in the United States of America (“GAAP”) and require management to make estimates and assumptions that may affect the reported amounts and disclosures. Actual results may differ from those estimates and assumptions.
A. Basis for Consolidation for Absolute Return Tracker, Commodity Strategy, Dynamic Allocation and Dynamic Commodity Strategy Funds — Cayman Commodity-ART, Ltd., Cayman Commodity-CSF, Ltd., Cayman Commodity-DAF, Ltd. and Cayman Commodity-DCS, Ltd. (each a “Subsidiary” and collectively, the “Subsidiaries”), Cayman Islands exempted companies, were incorporated on September 11, 2013, April 2, 2009, September 11, 2014 and March 10, 2014, respectively and are currently wholly-owned subsidiaries of the Absolute Return Tracker, Commodity Strategy, Dynamic Allocation and Dynamic Commodity Strategy Funds, respectively. The Subsidiaries act as an investment vehicle for the Funds to enable the Funds to gain exposure to certain types of commodity-linked derivative instruments. The Funds are the sole shareholders of the Subsidiaries pursuant to subscription agreements dated as of June 20, 2014, June 17, 2009, November 17, 2014 and April 30, 2014, respectively, and it is intended that each Fund will remain the sole shareholder and will continue to control its respective Subsidiary. Under the Memorandum and Articles of Association of each Subsidiary, shares issued by the Subsidiary confer upon a shareholder the right to vote at general meetings of the Subsidiary and certain rights in connection with any winding-up or repayment of capital, as well as the right to participate in the profits or assets of the Subsidiary. All inter-fund balances and transactions have been eliminated in consolidation.
72
GOLDMAN SACHS SELECT SATELLITE FUNDS
|
| 2. SIGNIFICANT ACCOUNTING POLICIES (continued) |
As of June 30, 2016, the Fund and Subsidiary net assets were as follows:
| | | | | | | | | | | | | | |
| Fund | | | | Fund Net Assets | | | Subsidiary Net Assets | | | % Represented by
Subsidiary’s Net Assets | |
Absolute Return Tracker | | | | | $984,357,962 | | | | $18,731,302 | | | | 2% | |
Commodity Strategy | | | | | 396,885,841 | | | | 66,118,857 | | | | 17 | |
Dynamic Allocation | | | | | 552,934,136 | | | | 13,179,139 | | | | 2 | |
Dynamic Commodity Strategy | | | | | 25,362,997 | | | | 4,263,551 | | | | 17 | |
B. Investment Valuation — The Funds’ valuation policy is to value investments at fair value.
C. Investment Income and Investments — Investment income includes interest income, dividend income, net of any foreign withholding taxes, less any amounts reclaimable, and securities lending income. Interest income is accrued daily and adjusted for amortization of premiums and accretion of discounts. Dividend income is recognized on ex-dividend date or, for certain foreign securities, as soon as such information is obtained subsequent to the ex-dividend date. Investment transactions are reflected on trade date. Realized gains and losses are calculated using identified cost. Investment transactions are recorded on the following business day for daily net asset value (“NAV”) calculations. Any foreign capital gains tax is accrued daily based upon net unrealized gains, and is payable upon sale of such investments. Distributions received from the Funds’ investments in United States (“U.S.”) real estate investment trusts (“REITs”) may be characterized as ordinary income, net capital gain or a return of capital. A return of capital is recorded by the Funds as a reduction to the cost basis of the REIT.
For derivative contracts, realized gains and losses are recorded upon settlement of the contract. Upfront payments, if any, are made or received upon entering into a swap agreement and are reflected in the Statement of Assets and Liabilities. Upfront payments are recognized over the contract’s term/event as realized gains or losses, with the exception of forward starting interest rate swaps whose realized gains or losses are recognized from the effective start date. For securities with paydown provisions, principal payments received are treated as a proportionate reduction to the cost basis of the securities, and excess or shortfall amounts are recorded as income. For treasury inflation protected securities (“TIPS”), adjustments to principal due to inflation/deflation are reflected as increases/decreases to interest income with a corresponding adjustment to cost.
D. Class Allocations and Expenses — Investment income, realized and unrealized gain (loss), and non-class specific expenses of each Fund are allocated daily based upon the proportion of net assets of each class. Non-class specific expenses directly incurred by a Fund are charged to that Fund, while such expenses incurred by the Trust are allocated across the applicable Funds on a straight-line and/or pro-rata basis depending upon the nature of the expenses. Class specific expenses, where applicable, are borne by the respective share classes and include Distribution and Service and Transfer Agency fees.
E. Federal Taxes and Distributions to Shareholders — It is each Fund’s policy to comply with the requirements of the Internal Revenue Code of 1986, as amended (the “Code”), applicable to regulated investment companies (mutual funds) and to distribute each year substantially all of its investment company taxable income and capital gains to its shareholders. Accordingly, the Funds are not required to make any provisions for the payment of federal income tax. Distributions to shareholders are recorded on the ex-dividend date. Income and capital gains distributions, if any, are declared and paid according to the following schedule:
| | | | | | |
| Fund | | | | Income Distributions Declared/Paid | | Capital Gains Distributions
Declared/Paid |
Absolute Return Tracker, Dynamic Allocation and Managed Futures Strategy | | | | Annually | | Annually |
Commodity Strategy and
Dynamic Commodity Strategy | | | | Semi-Annually | | Annually |
73
GOLDMAN SACHS SELECT SATELLITE FUNDS
Notes to Financial Statements (continued)
June 30, 2016 (Unaudited)
|
| 2. SIGNIFICANT ACCOUNTING POLICIES (continued) |
Net capital losses are carried forward to future fiscal years and may be used to the extent allowed by the Code to offset any future capital gains. Utilization of capital loss carryforwards will reduce the requirement of future capital gains distributions.
The Subsidiaries are classified as controlled foreign corporations under the Code. Therefore, the Absolute Return Tracker, Commodity Strategy, Dynamic Allocation and Dynamic Commodity Strategy Funds are required to increase their taxable income by their share of their Subsidiary’s income. Net losses of a Subsidiary cannot be deducted by the Funds in the current period nor carried forward to offset taxable income in future periods.
Under the Regulated Investment Company Modernization Act of 2010, the Funds are permitted to carry forward capital losses incurred in taxable years beginning after December 22, 2010 for an unlimited period. However, any losses incurred during those future taxable years will be required to be utilized prior to the losses incurred in pre-enactment taxable years. As a result of this ordering rule, pre-enactment capital loss carryforwards may be more likely to expire unused. Additionally, post-enactment capital losses that are carried forward will retain their character as either short-term or long-term capital losses rather than being considered all short-term as under previous law.
The characterization of distributions to shareholders for financial reporting purposes is determined in accordance with federal income tax rules, which may differ from GAAP. The source of each Fund’s distributions may be shown in the accompanying financial statements as either from net investment income, net realized gain or capital. Certain components of the Funds’ net assets on the Statements of Assets and Liabilities reflect permanent GAAP/tax differences based on the appropriate tax character.
F. Foreign Currency Translation — The accounting records and reporting currency of the Funds are maintained in U.S. dollars. Assets and liabilities denominated in foreign currencies are translated into U.S. dollars using the current exchange rates at the close of each business day. The effect of changes in foreign currency exchange rates on investments is included within net realized and unrealized gain (loss) on investments. Changes in the value of other assets and liabilities as a result of fluctuations in foreign exchange rates are included in the Statements of Operations within net change in unrealized gain (loss) on foreign currency translations. Transactions denominated in foreign currencies are translated into U.S. dollars on the date the transaction occurred, the effects of which are included within net realized gain (loss) on foreign currency transactions.
|
| 3. INVESTMENTS AND FAIR VALUE MEASUREMENTS |
The fair value of a financial instrument is the amount that would be received to sell an asset or paid to transfer a liability in an orderly transaction between market participants at the measurement date (i.e., the exit price). GAAP establishes a fair value hierarchy that prioritizes the inputs to valuation techniques used to measure fair value. The hierarchy gives the highest priority to unadjusted quoted prices in active markets for identical assets or liabilities (Level 1 measurements) and the lowest priority to unobservable inputs (Level 3 measurements). The levels used for classifying investments are not necessarily an indication of the risk associated with investing in these investments. The three levels of the fair value hierarchy are described below:
Level 1 — Unadjusted quoted prices in active markets that are accessible at the measurement date for identical, unrestricted assets or liabilities;
Level 2 — Quoted prices in markets that are not active or financial instruments for which significant inputs are observable (including, but not limited to, quoted prices for similar investments, interest rates, foreign exchange rates, volatility and credit spreads), either directly or indirectly;
Level 3 — Prices or valuations that require significant unobservable inputs (including GSAM’s assumptions in determining fair value measurement).
Changes in valuation techniques may result in transfers into or out of an assigned level within the hierarchy. In accordance with the Funds’ policy, transfers between different levels of the fair value hierarchy resulting from such changes are deemed to have occurred as of the beginning of the reporting period.
The Board of Trustees (“Trustees”) has approved Valuation Procedures that govern the valuation of the portfolio investments held by the Funds, including investments for which market quotations are not readily available. The Trustees have delegated to GSAM day-to-day responsibility for implementing and maintaining internal controls and procedures related to the valuation of the
74
GOLDMAN SACHS SELECT SATELLITE FUNDS
|
| 3. INVESTMENTS AND FAIR VALUE MEASUREMENTS (continued) |
Funds’ portfolio investments. To assess the continuing appropriateness of pricing sources and methodologies, GSAM regularly performs price verification procedures and issues challenges as necessary to third party pricing vendors or brokers, and any differences are reviewed in accordance with the Valuation Procedures.
A. Level 1 and Level 2 Fair Value Investments — The valuation techniques and significant inputs used in determining the fair values for investments classified as Level 1 and Level 2 are as follows:
Equity Securities — Equity securities traded on a U.S. securities exchange or the NASDAQ system, or those located on certain foreign exchanges, including but not limited to the Americas, are valued daily at their last sale price or official closing price on the principal exchange or system on which they are traded. If there is no sale or official closing price or such price is believed by GSAM to not represent fair value, equity securities are valued at the last bid price for long positions and at the last ask price for short positions. To the extent these investments are actively traded, they are classified as Level 1 of the fair value hierarchy, otherwise they are generally classified as Level 2.
Unlisted equity securities for which market quotations are available are valued at the last sale price on the valuation date, or if no sale occurs, at the last bid price. Securities traded on certain foreign securities exchanges are valued daily at fair value determined by an independent fair value service (if available) under Valuation Procedures approved by the Trustees and consistent with applicable regulatory guidance. The independent fair value service takes into account multiple factors including, but not limited to, movements in the securities markets, certain depositary receipts, futures contracts and foreign currency exchange rates that have occurred subsequent to the close of the foreign securities exchange. These investments are generally classified as Level 2 of the fair value hierarchy.
Underlying Funds (including Money Market Funds) — Underlying Funds (“Underlying Funds”) include other investment companies and exchange traded funds (“ETFs”). Investments in Underlying Funds (except ETFs) are valued at the NAV per share of the Institutional Share class (the FST Institutional Share class for Money Market Funds) on the day of valuation. ETFs are valued daily at the last sale price or official closing price on the principal exchange or system on which the investment is traded. Because the Funds invest in Underlying Funds that fluctuate in value, the Funds’ shares will correspondingly fluctuate in value. To the extent these investments are actively traded, they are classified as Level 1 of the fair value hierarchy, otherwise they are generally classified as Level 2. For information regarding an Underlying Fund’s accounting policies and investment holdings, please see the Underlying Fund’s shareholder report.
Debt Securities — Debt securities for which market quotations are readily available are valued daily on the basis of quotations supplied by dealers or an independent pricing service approved by the Trustees. The pricing services may use valuation models or matrix pricing, which consider: (i) yield or price with respect to bonds that are considered comparable in characteristics such as rating, interest rate and maturity date or (ii) quotations from securities dealers to determine current value. Short-term debt obligations that mature in sixty days or less and that do not exhibit signs of credit deterioration are valued at amortized cost, which approximates fair value. With the exception of treasury securities of G8 countries (not held in money market funds), which are generally classified as Level 1, these investments are generally classified as Level 2 of the fair value hierarchy.
i. Commodity Index-Linked Structured Notes — The value of a commodity index-linked structured note is based on the price movements of a commodity index. The value of these notes will rise and fall in response to changes in the underlying commodity index. These notes are often leveraged, increasing the volatility of each note’s value relative to the change in the underlying index. Commodity index-linked investments may be more volatile and less liquid than the underlying index, and their value may be affected by the performance of commodities as well as other factors including liquidity, quality, maturity and other economic variables. These notes are subject to prepayment, credit and interest rate risks. These notes have an automatic redemption feature if the underlying index declines from the purchase date by the amount specified in the agreement. A Fund has the option to request prepayment from the issuer at any time. Interim payments received (paid) are recorded as net realized gains (losses), and at maturity, or when a structured note is sold, a Fund records a realized gain or loss.
75
GOLDMAN SACHS SELECT SATELLITE FUNDS
Notes to Financial Statements (continued)
June 30, 2016 (Unaudited)
|
| 3. INVESTMENTS AND FAIR VALUE MEASUREMENTS (continued) |
ii. Mortgage-Backed and Asset-Backed Securities — Mortgage-backed securities represent direct or indirect participations in, or are collateralized by and payable from, mortgage loans secured by residential and/or commercial real estate property. Asset-backed securities include securities whose principal and interest payments are collateralized by pools of other assets or receivables. The value of certain mortgage-backed and asset-backed securities (including adjustable rate mortgage loans) may be particularly sensitive to changes in prevailing interest rates. The value of these securities may also fluctuate in response to the market’s perception of the creditworthiness of the issuers.
Asset-backed securities may present credit risks that are not presented by mortgage-backed securities because they generally do not have the benefit of a security interest in collateral that is comparable to mortgage assets. Some asset-backed securities may only have a subordinated claim on collateral.
Stripped mortgage-backed securities are usually structured with two different classes: one that receives substantially all interest payments (interest-only, or “IO” and/or high coupon rate with relatively low principal amount, or “IOette”), and the other that receives substantially all principal payments (principal-only, or “PO”) from a pool of mortgage loans. Little to no principal will be received at the maturity of an IO; as a result, periodic adjustments are recorded to reduce the cost of the security until maturity. These adjustments are included in interest income.
iii. Mortgage Dollar Rolls — Mortgage dollar rolls are transactions whereby a Fund sells mortgage-backed securities and simultaneously contracts with the same counterparty to repurchase similar securities on a specified future date. During the settlement period, a Fund will not be entitled to accrue interest and receive principal payments on the securities sold. The Funds account for mortgage dollar roll transactions as purchases and sales and realize gains and losses on these transactions.
iv. Treasury Inflation Protected Securities — TIPS are treasury securities in which the principal amount is adjusted daily to keep pace with inflation, as measured by the U.S. Consumer Pricing Index for Urban Consumers. The repayment of the original bond principal upon maturity is guaranteed by the full faith and credit of the U.S. Government.
v. When-Issued Securities and Forward Commitments — When-issued securities, including TBA (“To Be Announced”) securities, are securities that are authorized but not yet issued in the market and purchased in order to secure what is considered to be an advantageous price or yield to a Fund. A forward commitment involves entering into a contract to purchase or sell securities, typically on an extended settlement basis, for a fixed price at a future date. The purchase of securities on a when-issued or forward commitment basis involves a risk of loss if the value of the security to be purchased declines before the settlement date. Conversely, the sale of securities on a forward commitment basis involves the risk that the value of the securities sold may increase before the settlement date. Although a Fund will generally purchase securities on a when-issued or forward commitment basis with the intention of acquiring the securities for its portfolio, the Fund may dispose of when-issued securities or forward commitments prior to settlement which may result in a realized gain or loss.
Derivative Contracts — A derivative is an instrument whose value is derived from underlying assets, indices, reference rates or a combination of these factors. The Funds enter into derivative transactions to hedge against changes in interest rates, securities prices, and/or currency exchange rates, to increase total return, or to gain access to certain markets or attain exposure to other underliers.
Exchange-traded derivatives, including futures and options contracts, are valued at the last sale or settlement price and typically fall within Level 1 of the fair value hierarchy. Over-the-counter (“OTC”) and centrally cleared derivatives are valued using market transactions and other market evidence, including market-based inputs to models, calibration to market-clearing transactions, broker or dealer quotations, or other alternative pricing sources. Where models are used, the selection of a particular model to value OTC and centrally cleared derivatives depends upon the contractual terms of, and specific risks inherent in, the instrument, as well as the availability of pricing information in the market. Valuation models require a variety of inputs, including contractual terms, market prices, yield curves, credit curves, measures of volatility, voluntary and involuntary prepayment rates, loss severity rates and correlations of such inputs. For OTC and centrally cleared derivatives that trade in liquid markets, model inputs can generally be verified and model selection does not involve significant management judgment. OTC and centrally cleared derivatives are classified within Level 2 of the fair value hierarchy when significant inputs are corroborated by market evidence.
76
GOLDMAN SACHS SELECT SATELLITE FUNDS
|
| 3. INVESTMENTS AND FAIR VALUE MEASUREMENTS (continued) |
i. Forward Contracts — A forward contract is a contract between two parties to buy or sell an asset at a specified price on a future date. A forward contract settlement can occur on a cash or delivery basis. Forward contracts are marked-to-market daily using independent vendor prices, and the change in value, if any, is recorded as an unrealized gain or loss. Cash and certain investments may be used to collateralize forward contracts.
A forward foreign currency contract is a forward contract in which a Fund agrees to receive or deliver a fixed quantity of one currency for another, at a pre-determined price at a future date. All forward foreign currency exchange contracts are marked-to-market daily at the applicable forward rate. Non-deliverable forward foreign currency exchange contracts are settled with the counterparty in cash without the delivery of foreign currency.
ii. Futures Contracts — Futures contracts are contracts to buy or sell a standardized quantity of a specified commodity or security and are valued based on exchanged settlement prices or independent market quotes. Futures contracts are valued at the last settlement price, or in the absence of a sale, the last bid price for long positions and at the last ask price for short positions, at the end of each day on the board of trade or exchange upon which they are traded. Upon entering into a futures contract, a Fund deposits cash or securities in an account on behalf of the broker in an amount sufficient to meet the initial margin requirement. Subsequent payments are made or received by a Fund equal to the daily change in the contract value and are recorded as variation margin receivable or payable with a corresponding offset to unrealized gains or losses.
iii. Option Contracts — When a Fund writes call or put option contracts, an amount equal to the premium received is recorded as a liability and is subsequently marked-to-market to reflect the current value of the option written. Swaptions are options on interest rate swap contracts.
Upon the purchase of a call option or a put option by a Fund, the premium paid is recorded as an investment and subsequently marked-to-market to reflect the current value of the option. Certain options may be purchased with premiums to be determined on a future date. The premiums for these options are based upon implied volatility parameters at specified terms.
iv. Swap Contracts — Bilateral swap contracts are agreements in which a Fund and a counterparty agree to exchange periodic payments on a specified notional amount or make a net payment upon termination. Bilateral swap transactions are privately negotiated in the OTC market and payments are settled through direct payments between a Fund and the counterparty. By contrast, certain swap transactions are subject to mandatory central clearing. These swaps are executed through a derivatives clearing member (“DCM”), acting in an agency capacity, and submitted to a central counterparty (“CCP”) (“centrally cleared swaps”), in which case all payments are settled with the CCP through the DCM. Swaps are marked-to-market daily using pricing vendor quotations, counterparty or clearinghouse prices or model prices, and the change in value, if any, is recorded as an unrealized gain or loss. Upon entering into a swap contract, a Fund is required to satisfy an initial margin requirement by delivering cash or securities to the counterparty (or in some cases, segregated in a triparty account on behalf of the counterparty), which can be adjusted by any mark-to-market gains or losses pursuant to bilateral or centrally cleared arrangements. For centrally cleared swaps the daily change in valuation, if any, is recorded as a receivable or payable for variation margin.
An interest rate swap is an agreement that obligates two parties to exchange a series of cash flows at specified intervals, based upon or calculated by reference to changes in interest rates on a specified notional principal amount. The payment flows are usually netted against each other, with the difference being paid by one party to the other.
A credit default swap is an agreement that involves one party (the buyer of protection) making a stream of payments to another party (the seller of protection) in exchange for the right to receive protection on a reference security or obligation, including a group of assets or exposure to the performance of an index. A Fund’s investment in credit default swaps may involve greater risks than if the Fund had invested in the referenced obligation directly. Credit events are contract specific but may include bankruptcy, failure to pay, restructuring and obligation acceleration. If a Fund buys protection through a credit default swap and no credit event occurs, its payments are limited to the periodic payments previously made to the counterparty. Upon the occurrence of a specified credit event, a Fund, as a buyer of credit protection, is entitled to receive an amount equal to the notional amount of the swap and deliver to the seller the defaulted reference obligation in a physically
77
GOLDMAN SACHS SELECT SATELLITE FUNDS
Notes to Financial Statements (continued)
June 30, 2016 (Unaudited)
|
| 3. INVESTMENTS AND FAIR VALUE MEASUREMENTS (continued) |
settled trade. A Fund may also receive a net settlement amount in the form of cash or securities equal to the notional amount of the swap reduced by the recovery value of the reference obligation in a cash settled trade.
As a seller of protection, a Fund generally receives a payment stream throughout the term of the swap, provided that there is no credit event. In addition, if a Fund sells protection through a credit default swap, a Fund could suffer a loss because the value of the referenced obligation and the premium payments received may be less than the notional amount of the swap paid to the buyer of protection. Upon the occurrence of a specified credit event, a Fund, as a seller of credit protection, may be required to take possession of the defaulted reference obligation and pay the buyer an amount equal to the notional amount of the swap in a physically settled trade. A Fund may also pay a net settlement amount in the form of cash or securities equal to the notional amount of the swap reduced by the recovery value of the reference obligation in a cash settled trade. Recovery values are at times established through the credit event auction process in which market participants are ensured that a transparent price has been set for the defaulted security or obligation. In addition, a Fund is entitled to a return of any assets, which have been pledged as collateral to the counterparty upon settlement.
The maximum potential amount of future payments (undiscounted) that a Fund as seller of protection could be required to make under a credit default swap would be an amount equal to the notional amount of the agreement. These potential amounts would be partially offset by any recovery values of the respective referenced obligations or net amounts received from a settlement of a credit default swap for the same reference security or obligation where a Fund bought credit protection.
A total return swap is an agreement that gives a Fund the right to receive the appreciation in the value of a specified security, index or other instrument in return for a fee paid to the counterparty, which will typically be an agreed upon interest rate. If the underlying asset declines in value over the term of the swap, a Fund may also be required to pay the dollar value of that decline to the counterparty.
Short Term Investments — Short-term investments having a maturity of 60 days or less are generally valued at amortized cost which approximates fair market value. These investments are classified as Level 2 of the fair value hierarchy.
B. Level 3 Fair Value Investments —To the extent that significant inputs to valuation models and other alternative pricing sources are unobservable, or if quotations are not readily available, or if GSAM believes that such quotations do not accurately reflect fair value, the fair value of the Funds’ investments may be determined under Valuation Procedures approved by the Trustees. GSAM, consistent with its procedures and applicable regulatory guidance, may make an adjustment to the most recent valuation prices of either domestic or foreign securities in light of significant events to reflect what it believes to be the fair value of the securities at the time of determining a Fund’s NAV. Significant events which could affect a large number of securities in a particular market may include, but are not limited to: significant fluctuations in U.S. or foreign markets; market dislocations; market disruptions; or unscheduled market closings. Significant events which could also affect a single issuer may include, but are not limited to: corporate actions such as reorganizations, mergers and buy-outs; ratings downgrades; and bankruptcies.
C. Fair Value Hierarchy — The following is a summary of the Funds’ investments and derivatives classified in the fair value hierarchy as of June 30, 2016:
| | | | | | | | | | | | |
| | | |
| ABSOLUTE RETURN TRACKER | | | | | | | | | | | | |
| | | |
| Investment Type | | Level 1 | | | Level 2 | | | Level 3 | |
| Assets | | | | | | | | | | | | |
Common Stock and/or Other Equity Investments(a) | | | | | | | | | | | | |
North America | | $ | 104,772,575 | | | $ | — | | | $ | — | |
Exchange Traded Funds | | | 64,470,592 | | | | — | | | | — | |
Investment Company | | | 702,903,210 | | | | — | | | | — | |
Securities Lending Reinvestment Vehicle | | | 5,009,650 | | | | — | | | | — | |
| Total | | $ | 877,156,027 | | | $ | — | | | $ | — | |
78
GOLDMAN SACHS SELECT SATELLITE FUNDS
|
| 3. INVESTMENTS AND FAIR VALUE MEASUREMENTS (continued) |
| | | | | | | | | | | | |
| | | |
| ABSOLUTE RETURN TRACKER (continued) | | | | | | | | | | | | |
| | | |
| Derivative Type | | Level 1 | | | Level 2 | | | Level 3 | |
| Assets(b) | | | | | | | | | | | | |
Forward Foreign Currency Exchange Contracts | | $ | — | | | $ | 792,096 | | | $ | — | |
Futures Contracts | | | 7,323,505 | | | | — | | | | — | |
Credit Default Swap Contracts | | | — | | | | 1,804,260 | | | | — | |
Total Return Swap Contracts | | | — | | | | 1,602,498 | | | | — | |
| Total | | $ | 7,323,505 | | | $ | 4,198,854 | | | $ | — | |
| Liabilities | | | | | | | | | | | | |
Forward Foreign Currency Exchange Contracts(b) | | $ | — | | | $ | (493,019 | ) | | $ | — | |
Futures Contracts(b) | | | (1,600,810 | ) | | | — | | | | — | |
Credit Default Swap Contracts(b) | | | — | | | | (67,542 | ) | | | — | |
Total Return Swap Contracts(b) | | | — | | | | (1,180,171 | ) | | | — | |
Written Options Contracts | | | (1,550,871 | ) | | | — | | | | — | |
| Total | | $ | (3,151,681 | ) | | $ | (1,740,732 | ) | | $ | — | |
| | | |
| COMMODITY STRATEGY | | | | | | | | | | | | |
| | | |
| Investment Type | | Level 1 | | | Level 2 | | | Level 3 | |
| Assets | | | | | | | | | | | | |
Fixed Income | | | | | | | | | | | | |
Mortgage-Backed Obligations | | $ | — | | | $ | 62,698,365 | | | $ | — | |
Asset-Backed Securities | | | — | | | | 157,375 | | | | — | |
U.S. Treasury Obligations and/or Other U.S. Government Agencies | | | 125,368,848 | | | | — | | | | — | |
Investment Company | | | 154,503,042 | | | | — | | | | — | |
| Total | | $ | 279,871,890 | | | $ | 62,855,740 | | | $ | — | |
| Liabilities | | | | | | | | | | | | |
Mortgage-Backed Obligations — Forward Sales Contracts | | $ | — | | | $ | (4,219,688 | ) | | $ | — | |
| | | |
| Derivative Type | | | | | | | | | |
| Assets(b) | | | | | | | | | | | | |
Futures Contracts | | $ | 223,758 | | | $ | — | | | $ | — | |
Total Return Swap Contracts | | | — | | | | 1,841,789 | | | | — | |
| Total | | $ | 223,758 | | | $ | 1,841,789 | | | $ | — | |
| Liabilities(b) | | | | | | | | | | | | |
Futures Contracts | | $ | (3,974,232 | ) | | $ | — | | | $ | — | |
Total Return Swap Contracts | | | — | | | | (170,401 | ) | | | — | |
| Total | | $ | (3,974,232 | ) | | $ | (170,401 | ) | | $ | — | |
79
GOLDMAN SACHS SELECT SATELLITE FUNDS
Notes to Financial Statements (continued)
June 30, 2016 (Unaudited)
|
| 3. INVESTMENTS AND FAIR VALUE MEASUREMENTS (continued) |
| | | | | | | | | | | | |
| | | |
| DYNAMIC ALLOCATION | | | | | | | | | | | | |
| | | |
| Investment Type | | Level 1 | | | Level 2 | | | Level 3 | |
| Assets | | | | | | | | | | | | |
Common Stock and/or Other Equity Investments(a) | | | | | | | | | | | | |
Asia | | $ | — | | | $ | 61,547,312 | | | $ | — | |
Europe | | | — | | | | 27,233,294 | | | | — | |
North America | | | 92,122,478 | | | | — | | | | — | |
Investment Company | | | 276,024,420 | | | | — | | | | — | |
Fixed Income | | | | | | | | | | | | |
U.S. Treasury Obligations and/or Other U.S. Government Agencies | | | 23,664,478 | | | | — | | | | — | |
Commodity Index Linked Structured Notes | | | — | | | | 2,639,522 | | | | — | |
Securities Lending Reinvestment Vehicle | | | 1,887,700 | | | | — | | | | — | |
| Total | | $ | 391,811,376 | | | $ | 91,420,128 | | | $ | — | |
| | | |
| Derivative Type | | | | | | | | | |
| Assets(b) | | | | | | | | | | | | |
Forward Foreign Currency Exchange Contracts | | $ | — | | | $ | 842,858 | | | $ | — | |
Futures Contracts | | | 7,288,141 | | | | — | | | | — | |
Credit Default Swap Contracts | | | — | | | | 448,339 | | | | — | |
Interest Rate Swap Contracts | | | — | | | | 1,069,022 | | | | — | |
Total Return Swap Contracts | | | — | | | | 766,779 | | | | — | |
| Total | | $ | 7,288,141 | | | $ | 3,126,998 | | | $ | — | |
| Liabilities(b) | | | | | | | | | | | | |
Forward Foreign Currency Exchange Contracts | | $ | — | | | $ | (4,587,583 | ) | | $ | — | |
Futures Contracts | | | (312,853 | ) | | | — | | | | — | |
Credit Default Swap Contracts | | | — | | | | (14,430 | ) | | | — | |
Total Return Swap Contracts | | | — | | | | (92,530 | ) | | | — | |
| Total | | $ | (312,853 | ) | | $ | (4,694,543 | ) | | $ | — | |
| | | |
| DYNAMIC COMMODITY STRATEGY | | | | | | | | | | | | |
| | | |
| Investment Type | | Level 1 | | | Level 2 | | | Level 3 | |
| Assets | | | | | | | | | | | | |
Investment Company | | $ | 23,094,416 | | | $ | — | | | $ | — | |
| | | |
| Derivative Type | | | | | | | | | |
| Assets(b) | | | | | | | | | | | | |
Total Return Swap Contracts | | $ | — | | | $ | 1,131,119 | | | $ | — | |
| Liabilities(b) | | | | | | | | | | | | |
Total Return Swap Contracts | | $ | — | | | $ | (461,509 | ) | | $ | — | |
80
GOLDMAN SACHS SELECT SATELLITE FUNDS
|
| 3. INVESTMENTS AND FAIR VALUE MEASUREMENTS (continued) |
| | | | | | | | | | | | |
| | | |
| MANAGED FUTURES STRATEGY | | | | | | | | | | | | |
| | | |
| Investment Type | | Level 1 | | | Level 2 | | | Level 3 | |
| Assets | | | | | | | | | | | | |
Fixed Income | | | | | | | | | | | | |
Commodity Index-Linked Structured Notes | | $ | — | | | $ | 9,233,741 | | | $ | — | |
Investment Company | | | 149,064,637 | | | | — | | | | — | |
| Total | | $ | 149,064,637 | | | $ | 9,233,741 | | | $ | — | |
| | | |
| Derivative Type | | | | | | | | | |
| Assets(b) | | | | | | | | | | | | |
Forward Foreign Currency Exchange Contracts | | $ | — | | | $ | 3,390,388 | | | $ | — | |
Futures Contracts | | | 548,875 | | | | — | | | | — | |
Interest Rate Swap Contracts | | | — | | | | 13,970,783 | | | | — | |
| Total | | $ | 548,875 | | | $ | 17,361,171 | | | $ | — | |
| Liabilities(b) | | | | | | | | | | | | |
Forward Foreign Currency Exchange Contracts | | $ | — | | | $ | (2,038,092 | ) | | $ | — | |
Futures Contracts | | | (273,114 | ) | | | — | | | | — | |
Interest Rate Swap Contracts | | | — | | | | (4,935,071 | ) | | | — | |
| Total | | $ | (273,114 | ) | | $ | (6,973,163 | ) | | $ | — | |
| (a) | | Amounts are disclosed by continent to highlight the impact of time zone differences between local market close and the calculation of NAV. Security valuations are based on the principal exchange or system on which they are traded, which may differ from country of domicile noted in the table. The Funds utilize fair value model prices provided by an independent fair value service for certain international equity securities, resulting in a Level 2 classification. |
| (b) | | Amount shown represents unrealized gain (loss) at period end. |
For further information regarding security characteristics, see the Schedules of Investments.
81
GOLDMAN SACHS SELECT SATELLITE FUNDS
Notes to Financial Statements (continued)
June 30, 2016 (Unaudited)
|
| 4. INVESTMENTS IN DERIVATIVES |
The following tables set forth, by certain risk types, the gross value of derivative contracts as of June 30, 2016. These instruments were used as part of the Funds’ investment strategies and to obtain and/or manage exposure related to the risks below. The values in the tables below exclude the effects of cash collateral received or posted pursuant to these derivative contracts, and therefore are not representative of the Funds’ net exposure.
| | | | | | | | | | | | |
| | |
| ABSOLUTE RETURN TRACKER | | | | | | | |
| Risk | | Statements of Assets
and Liabilities | | Assets | | | Statements of Assets
and Liabilities | | Liabilities | |
Commodity | | Receivable for unrealized gain on swap contracts and variation margin on certain derivative contracts | | $ | 797,862 | (a) | | Variation margin on certain derivative contracts | | $ | (766,983) | (a) |
Credit | | Variation margin on certain derivative contracts | | | 1,804,260 | (a) | | Variation margin on certain derivative contracts | | | (67,542) | (a) |
Currency | | Receivable for unrealized gain on forward foreign currency exchange contracts | | | 792,096 | | | Payable for unrealized loss on forward foreign currency exchange contracts | | | (493,019) | |
Equity | | Receivable for unrealized gain on swap contracts and variation margin on certain derivative contracts | | | 4,122,142 | (a) | | Payable for unrealized loss on swap contracts, Written options, at value and variation margin on certain derivative contracts | | | (3,560,882) | (a)(b) |
Interest Rate | | Variation margin on certain derivative contracts | | | 4,005,999 | (a) | | Variation margin on certain derivative contracts | | | (3,987) | (a) |
| Total | | | | $ | 11,522,359 | | | | | $ | (4,892,413) | |
| | |
| COMMODITY STRATEGY | | | | | | | |
| Risk | | Statements of Assets
and Liabilities | | Assets | | | Statements of Assets
and Liabilities | | Liabilities | |
Commodity | | Receivable for unrealized gain on swap contracts | | $ | 1,841,789 | | | Payable for unrealized loss on swap contracts | | $ | (170,401) | (b) |
Interest Rate | | Variation margin on certain derivative contracts | | | 223,758 | (a) | | Variation margin on certain derivative contracts | | | (3,974,232) | (a) |
| Total | | | | $ | 2,065,547 | | | | | $ | (4,144,633) | |
82
GOLDMAN SACHS SELECT SATELLITE FUNDS
|
| 4. INVESTMENTS IN DERIVATIVES (continued) |
| | | | | | | | | | | | |
| | |
| DYNAMIC ALLOCATION | | | | | | | |
| Risk | | Statements of Assets
and Liabilities | | Assets | | | Statements of Assets
and Liabilities | | Liabilities | |
Commodity | | Receivable for unrealized gain on swap contracts and Variation margin on certain derivative contracts | | $ | 257,974 | (a) | | Payable for unrealized loss on swap contracts and Variation margin on certain derivative contracts | | $ | (217,451) | (a)(b) |
Credit | | Variation margin on certain derivative contracts | | | 448,339 | (a) | | Variation margin on certain derivative contracts | | | (14,430) | (a) |
Currency | | Receivable for unrealized gain on forward foreign currency exchange contracts | | | 842,858 | | | Payable for unrealized loss on forward foreign currency exchange contracts | | | (4,587,583) | |
Equity | | Receivable for unrealized gain on swap contracts and Variation margin on certain derivative contracts | | | 6,405,302 | (a) | | Variation margin on certain derivative contracts | | | (187,932) | (a) |
Interest Rate | | Receivable for unrealized gain on swap contracts and Variation margin on certain derivative contracts | | | 2,460,666 | (a) | | — | | | — | |
| Total | | | | $ | 10,415,139 | | | | | $ | (5,007,396) | |
| | |
| DYNAMIC COMMODITY STRATEGY | | | | | | | |
| Risk | | Statements of Assets
and Liabilities | | Assets | | | Statements of Assets
and Liabilities | | Liabilities | |
Commodity | | Receivable for unrealized gain on swap contracts | | $ | 1,131,119 | | | Payable for unrealized loss on swap contracts | | $ | (461,509) | (b) |
| | |
| MANAGED FUTURES STRATEGY | | | | | | | |
| Risk | | Statements of Assets
and Liabilities | | Assets | | | Statements of Assets
and Liabilities | | Liabilities | |
Currency | | Receivable for unrealized gain on forward foreign currency exchange contracts | | $ | 3,390,388 | | | Payable for unrealized loss on forward foreign currency exchange contracts | | $ | (2,038,092) | |
Equity | | Variation margin on certain derivative contracts | | | 548,875 | (a) | | Variation margin on certain derivative contracts | | | (273,114) | (a) |
Interest Rate | | Variation margin on certain derivative contracts | | | 13,970,783 | (a) | | Variation margin on certain derivative contracts | | | (4,935,071) | (a) |
| Total | | | | $ | 17,910,046 | | | | | $ | (7,246,277) | |
| (a) | | Includes unrealized gain (loss) on futures contracts and centrally cleared swap contracts described in the Additional Investment Information sections of the Schedules of Investments. Only current day’s variation margin is reported within the Statements of Assets and Liabilities. |
| (b) | | Aggregate of amounts include $1,180,171, $170,401, $92,530 and $461,509 for the Absolute Return Tracker, Commodity Strategy, Dynamic Allocation and Dynamic Commodity Strategy Funds, respectively, which represent the payments to be made pursuant to bilateral agreements should counterparties exercise their “right to terminate” provisions based on, among others, the Funds’ performance, their failure to pay on its obligations or failure to pledge collateral. Such amounts do not include incremental charges directly associated with the close-out of the agreements. They also do not reflect the fair value of any assets pledged as collateral which, through the daily margining process, substantially offsets the aforementioned amounts and for which the Funds are entitled to a full return. |
83
GOLDMAN SACHS SELECT SATELLITE FUNDS
Notes to Financial Statements (continued)
June 30, 2016 (Unaudited)
|
| 4. INVESTMENTS IN DERIVATIVES (continued) |
The following tables set forth, by certain risk types, the Funds’ gains (losses) related to these derivatives and their indicative volumes for the six months ended June 30, 2016. These gains (losses) should be considered in the context that these derivative contracts may have been executed to create investment opportunities and/or economically hedge certain investments, and accordingly, certain gains (losses) on such derivative contracts may offset certain (losses) gains attributable to investments. These gains (losses) are included in “Net realized gain (loss)” or “Net change in unrealized gain (loss)” on the Statements of Operations:
| | | | | | | | | | | | | | |
| | |
| ABSOLUTE RETURN TRACKER | | | | | | | | | |
| Risk | | Statements of Operations | | Net Realized
Gain (Loss) | | | Net Change in
Unrealized
Gain (Loss) | | | Average
Number of
Contracts(a) | |
| Commodity | | Net realized gain (loss) from futures contracts and swap contracts/Net change in unrealized gain (loss) on futures contracts and swap contracts | | $ | 603,513 | | | $ | (1,028,185 | ) | | | 749 | |
| Currency | | Net realized gain (loss) from forward foreign currency exchange contracts/Net change in unrealized gain (loss) on forward foreign currency exchange contracts | | | (1,594,940 | ) | | | 121,822 | | | | 66 | |
| Credit | | Net realized gain (loss) from swap contracts/Net change in unrealized gain (loss) on swap contracts | | | 5,964,482 | | | | (214,991 | ) | | | 1 | |
| Equity | | Net realized gain (loss) from futures contracts, swap contracts and written options/Net change in unrealized gain (loss) on futures contracts, swap contracts and written options | | | (2,947,086 | ) | | | 1,659,732 | | | | 2,984 | |
| Interest rate | | Net realized gain (loss) from futures contracts/Net change in unrealized gain (loss) on futures contracts | | | 2,923,331 | | | | 3,772,860 | | | | 2,500 | |
| Total | | | | $ | 4,949,300 | | | $ | 4,311,238 | | | | 6,300 | |
| | |
| COMMODITY STRATEGY | | | | | | | | | |
| Risk | | Statements of Operations | | Net Realized
Gain (Loss) | | | Net Change in
Unrealized
Gain (Loss) | | | Average
Number of
Contracts(a) | |
| Commodity | | Net realized gain (loss) from swap contracts/Net change in unrealized gain (loss) on swap contracts | | $ | 5,103,916 | | | $ | 50,958,119 | | | | 6 | |
| Interest rate | | Net realized gain (loss) from futures contracts and swap contracts/Net change in unrealized gain (loss) on futures contracts and swap contracts | | | (8,372,352 | ) | | | (3,810,183 | ) | | | 1,417 | |
| Total | | | | $ | (3,268,436 | ) | | $ | 47,147,936 | | | | 1,423 | |
84
GOLDMAN SACHS SELECT SATELLITE FUNDS
|
| 4. INVESTMENTS IN DERIVATIVES (continued) |
| | | | | | | | | | | | | | |
| | |
| DYNAMIC ALLOCATION | | | | | | | | | |
| Risk | | Statements of Operations | | Net Realized
Gain (Loss) | | | Net Change in
Unrealized
Gain (Loss) | | | Average
Number of
Contracts(a) | |
| Commodity | | Net realized gain (loss) from futures contracts and swap contracts/Net change in unrealized gain (loss) on futures contracts and swap contracts | | $ | 1,337,104 | | | $ | (90,041 | ) | | | 128 | |
| Credit | | Net realized gain (loss) from swap contracts/Net change in unrealized gain (loss) on swap contracts | | | 1,941,578 | | | | 420,375 | | | | 2 | |
| Currency | | Net realized gain (loss) from forward foreign currency exchange contracts/Net change in unrealized gain (loss) on forward foreign currency exchange contracts | | | (12,870,881 | ) | | | 83,857 | | | | 34 | |
| Equity | | Net realized gain (loss) from futures contracts and swap contracts/Net change in unrealized gain (loss) on futures contracts and swap contracts | | | 1,882,592 | | | | 6,445,163 | | | | 2,330 | |
| Interest rate | | Net realized gain (loss) from futures contracts and swap contracts/Net change in unrealized gain (loss) on futures contracts and swap contracts | | | 9,031,139 | | | | 2,743,593 | | | | 432 | |
| Total | | | | $ | 1,321,532 | | | $ | 9,602,947 | | | | 2,926 | |
| | |
| DYNAMIC COMMODITY STRATEGY | | | | | | | | | |
| Risk | | Statements of Operations | | Net Realized
Gain (Loss) | | | Net Change in
Unrealized
Gain (Loss) | | | Average
Number of
Contracts(a) | |
| Interest rate | | Net realized gain (loss) from futures contracts and swap contracts | | $ | (3,222 | ) | | $ | — | | | | 1 | |
| Commodity | | Net realized gain (loss) from swap contracts/Net change in unrealized gain (loss) on swap contracts | | | 1,093,711 | | | | 614,450 | | | | 30 | |
| Total | | | | $ | 1,090,489 | | | $ | 614,450 | | | | 31 | |
| | |
| MANAGED FUTURES STRATEGY | | | | | | | | | |
| Risk | | Statements of Operations | | Net Realized
Gain (Loss) | | | Net Change in
Unrealized
Gain (Loss) | | | Average
Number of
Contracts(a) | |
| Currency | | Net realized gain (loss) from forward foreign currency exchange contracts/Net change in unrealized gain (loss) on forward foreign currency exchange contracts | | $ | (5,313,239 | ) | | $ | 1,173,174 | | | | 326 | |
| Equity | | Net realized gain (loss) from futures contracts/Net change in unrealized gain (loss) on futures contracts | | | (4,237,095 | ) | | | 357,113 | | | | 2,533 | |
| Interest rate | | Net realized gain (loss) from futures contracts and swap contracts/Net change in unrealized gain (loss) on swap contracts | | | 4,831,087 | | | | 5,542,392 | | | | 251 | |
| Total | | | | $ | (4,719,247 | ) | | $ | 7,072,679 | | | | 3,110 | |
| (a) | | Average number of contracts is based on the average of month end balances for the six months ended June 30, 2016. |
85
GOLDMAN SACHS SELECT SATELLITE FUNDS
Notes to Financial Statements (continued)
June 30, 2016 (Unaudited)
|
| 4. INVESTMENTS IN DERIVATIVES (continued) |
In order to better define its contractual rights and to secure rights that will help a Fund mitigate its counterparty risk, a Fund may enter into an International Swaps and Derivatives Association, Inc. Master Agreement (“ISDA Master Agreement”) or similar agreement with its derivatives counterparties. An ISDA Master Agreement is a bilateral agreement between a Fund and a counterparty that governs OTC derivatives (including forward foreign currency exchange contracts and certain options and swaps), and typically contains, among other things, collateral posting terms and netting provisions in the event of a default and/or termination event. The provisions of the ISDA Master Agreement typically permit a single net payment in the event of a default (close-out netting) or similar event, including the bankruptcy or insolvency of the counterparty.
Collateral and margin requirements differ between exchange traded derivatives and OTC derivatives. Margin requirements are established by the broker or clearing house for exchange-traded and centrally cleared derivatives (financial futures contracts, options and centrally cleared swaps) pursuant to governing agreements for those instrument types. Brokers can ask for margin in excess of the minimum in certain circumstances. Collateral terms are contract-specific for OTC derivatives. For derivatives traded under an ISDA Master Agreement, the collateral requirements are typically calculated by netting the marked to market amount for each transaction under such agreement and comparing that amount to the value of any collateral currently pledged by a Fund and the counterparty. Additionally, a Fund may be required to post initial margin to the counterparty, the terms of which would be outlined in the confirmation of the OTC transaction.
For financial reporting purposes, cash collateral that has been pledged to cover obligations of a Fund and cash collateral received from the counterparty, if any, is reported separately on the Statements of Assets and Liabilities as receivables/payables for collateral on certain derivative contracts. Non-cash collateral pledged by a Fund, if any, is noted in the Schedules of Investments. Generally, the amount of collateral due from or to a counterparty must exceed a minimum transfer amount threshold before a transfer is required to be made. To the extent amounts due to a Fund from its counterparties are not fully collateralized, contractually or otherwise, the Fund bears the risk of loss from counterparty nonperformance. A Fund attempts to mitigate counterparty risk by only entering into agreements with counterparties that the Investment Adviser believes to be of good standing and by monitoring the financial stability of those counterparties.
Additionally, the netting of assets and liabilities and the offsetting of collateral pledged or received are based on contractual netting/set-off provisions in the ISDA Master Agreement or similar agreements. However, in the event of a default or insolvency of a counterparty, a court could determine that such rights are not enforceable due to the restrictions or prohibitions against the right of setoff that may be imposed in accordance with a particular jurisdiction’s bankruptcy or insolvency laws.
The following tables set forth the Funds’ net exposure for derivative instruments that are subject to enforceable master netting arrangements or similar agreements as of June 30, 2016:
| | | | | | | | | | | | | | | | | | | | | | |
| | | | |
| DYNAMIC COMMODITY STRATEGY | | | | | | | | | | | | | | | | | |
| | | | | Derivative Assets(1) | | | Derivative Liabilities(1) | | | Net Derivative
Assets
(Liabilities) | | | Collateral
(Received)
Pledged(1) | | | Net
Amount(2) | |
| Counterparty | | | | Swaps | | | Swaps | | | | |
| Merrill Lynch International | | | | $ | 838,058 | | | $ | (376,074 | ) | | $ | 461,984 | | | $ | 376,074 | | | $ | 838,058 | |
| UBS AG | | | | | 293,061 | | | | (85,435 | ) | | | 207,626 | | | | 85,435 | | | | 293,061 | |
| Total | | | | $ | 1,131,119 | | | $ | (461,509 | ) | | $ | 669,610 | | | $ | 461,509 | | | $ | 1,131,119 | |
| | | | |
| MANAGED FUTURES STRATEGY | | | | | | | | | | | | | | | | | |
| | | | | Derivative Assets(1) | | | Derivative Liabilities(1) | | | Net Derivative
Assets
(Liabilities) | | | Collateral
(Received)
Pledged(1) | | | Net
Amount(2) | |
| Counterparty | | | | Forwards | | | Forwards | | | | |
| Morgan Stanley Co., Inc. | | | | $ | 3,390,388 | | | $ | (2,038,092 | ) | | $ | 1,352,296 | | | $ | 1,740,000 | | | $ | 3,092,296 | |
| (1) | | Gross amounts available for offset but not netted in the Statement of Assets and Liabilities. |
| (2) | | Net amount represents the net amount due (to) from counterparty in the event of a default based on the contractual set-off rights under the agreement. |
86
GOLDMAN SACHS SELECT SATELLITE FUNDS
|
| 5. AGREEMENTS AND AFFILIATED TRANSACTIONS |
A. Management Agreement — Under the Agreement, GSAM manages the Funds, subject to the general supervision of the Trustees.
As compensation for the services rendered pursuant to the Agreement, the assumption of the expenses related thereto and administration of the Funds’ business affairs, including providing facilities, GSAM is entitled to a management fee, accrued daily and paid monthly, equal to an annual percentage rate of each Fund’s average daily net assets.
For the six months ended June 30, 2016, contractual and effective net management fees with GSAM were at the following rates:
| | | | | | | | | | | | | | | | | | | | | | | | | | | | | | |
| | | | | Contractual Management Rate | | | Effective Net
Management
Rate^ | |
| Fund | | | | First
$1 billion | | | Next
$1 billion | | | Next
$3 billion | | | Next
$3 billion | | | Over
$8 billion | | | Effective
Rate | | |
Absolute Return Tracker | | | | | 1.15 | % | | | 1.04 | % | | | 0.99 | % | | | 0.97 | % | | | 0.95 | % | | | 1.15 | % | | | 0.58 | %(1)(2)(3) |
Commodity Strategy | | | | | 0.50 | | | | 0.50 | | | | 0.45 | | | | 0.43 | | | | 0.42 | | | | 0.50 | | | | 0.46 | (1)(2) |
Dynamic Allocation | | | | | 0.90 | | | | 0.81 | | | | 0.77 | | | | 0.75 | | | | 0.74 | | | | 0.90 | | | | 0.72 | (1)(2)(3) |
Dynamic Commodity Strategy | | | | | 0.80 | | | | 0.80 | | | | 0.72 | | | | 0.68 | | | | 0.67 | | | | 0.80 | | | | 0.74 | (1)(2) |
Managed Futures Strategy | | | | | 1.00 | | | | 0.90 | | | | 0.86 | | | | 0.84 | | | | 0.82 | | | | 1.00 | | | | 0.88 | (1) |
| ^ | | Effective Net Management Rate includes the impact of management fee waivers of affiliated underlying funds, if any. |
| (1) | | GSAM agreed to waive a portion of its management fee payable by the Funds in an amount equal to any management fees it earns as an investment adviser to any of the affiliated funds in which they invest through at least April 29, 2017. Prior to such date GSAM may not terminate the arrangement without the approval of the Trustees. |
| (2) | | Reflects combined management fees paid to GSAM under the Agreement and the Funds’ Subsidiary Agreement (as defined below) after the waivers. |
| (3) | | GSAM agreed to waive a portion of its management fee in order to achieve net management rates, as defined in the Funds’ most recent prospectuses. These waivers will be effective through at least April 29, 2017, and prior to such date GSAM may not terminate the arrangements without the approval of the Trustees. |
GSAM also provides management services to the Subsidiaries pursuant to a Subsidiary Management Agreement (each a “Subsidiary Agreement”) and is entitled to a management fee accrued daily and paid monthly, equal to an annual percentage rate of 0.42% of each Subsidiary’s average daily net assets. In consideration of the Subsidiary’s management fee, and for as long as the Subsidiary Agreement remains in effect, GSAM has contractually agreed to waive irrevocably a portion of each Fund’s management fee in an amount equal to the management fee accrued and paid to GSAM by the Subsidiary under the Subsidiary Agreement. For the six months ended June 30, 2016, GSAM waived $42,223, $219,719, $24,257 and $9,115 of each Fund’s management fee for Absolute Return Tracker, Commodity Strategy, Dynamic Allocation and Dynamic Commodity Strategy Funds, respectively. This waiver represents an inter-fund transaction and, accordingly, has been eliminated in consolidation.
The Absolute Return Tracker, Commodity Strategy, Dynamic Allocation, Dynamic Commodity Strategy and Managed Futures Strategy Funds invest in FST Institutional Shares of the Goldman Sachs Financial Square Government Fund, which is an affiliated Underlying Fund. GSAM has agreed to waive a portion of its management fee payable by the Funds in an amount equal to the management fee it earns as an investment adviser to any of the affiliated Underlying Funds in which the Funds invest. For the six months ended June 30, 2016, GSAM waived $607,189, $111,945, $208,169, $7,135, and $104,754 of the Funds’ management fees, respectively.
B. Distribution and Service Plans — The Trust, on behalf of each Fund, has adopted Distribution and Service Plans (the “Plans”). Under the Plans, Goldman Sachs, which serves as distributor (the “Distributor”), is entitled to a fee accrued daily and
87
GOLDMAN SACHS SELECT SATELLITE FUNDS
Notes to Financial Statements (continued)
June 30, 2016 (Unaudited)
|
| 5. AGREEMENTS AND AFFILIATED TRANSACTIONS (continued) |
paid monthly, for distribution services and personal and account maintenance services, which may then be paid by Goldman Sachs to authorized dealers, at the following annual rates calculated on a Fund’s average daily net assets of each respective share class:
| | | | | | | | | | | | |
| | | Distribution and Service Plan Rates | |
| | | Class A* | | | Class C | | | Class R* | |
Distribution Plan | | | 0.25 | % | | | 0.75 | % | | | 0.50 | % |
Service Plan | | | — | | | | 0.25 | | | | — | |
| * | | With respect to Class A and Class R Shares, the Distributor at its discretion may use compensation for distribution services paid under the Distribution Plan to compensate service organizations for personal and account maintenance services and expenses as long as such total compensation does not exceed the maximum cap on “service fees” imposed by the Financial Industry Regulatory Authority. |
C. Distribution Agreement — Goldman Sachs, as Distributor of the shares of the Funds pursuant to a Distribution Agreement, may retain a portion of the Class A Shares’ front end sales charge and Class C Shares’ CDSC. During the six months ended June 30, 2016, Goldman Sachs advised that it retained front end sales charges of $1,034, $7,862, $442, and $4,416 for the Absolute Return Tracker, Commodity Strategy, Dynamic Allocation, and Managed Futures Strategy Funds, respectively.
E. Transfer Agency Agreement — Goldman Sachs also serves as the transfer agent of the Funds for a fee pursuant to the Transfer Agency Agreement. The fees charged for such transfer agency services are accrued daily and paid monthly at annual rates as follows: 0.19% (except for the Commodity Strategy and Dynamic Commodity Strategy Funds, which charge at an annual rate of 0.13%) of the average daily net assets of Class A, Class C, Class IR and Class R Shares; 0.02% of the average daily net assets of Class R6 Shares; and 0.04% of the average daily net assets of Institutional Shares.
F. Other Expense Agreements and Affiliated Transactions — GSAM has agreed to limit certain “Other Expenses” of the Funds (excluding acquired fund fees and expenses, transfer agency fees and expenses, service fees and shareholder administration fees (as applicable), taxes, interest, brokerage fees, shareholder meeting, litigation, indemnification and extraordinary expenses) to the extent such expenses exceed, on an annual basis, a percentage rate of the average daily net assets of each Fund. Such Other Expense reimbursements, if any, are accrued daily and paid monthly. In addition, the Funds are not obligated to reimburse GSAM for prior fiscal year expense reimbursements, if any. The Other Expense limitations as an annual percentage rate of average daily net assets for the Absolute Return Tracker, Commodity Strategy, Dynamic Allocation, Dynamic Commodity Strategy and Managed Futures Strategy Funds are 0.014%, 0.074%, 0.004%, 0.014% and 0.204%, respectively. These Other Expense limitations will remain in place through at least April 29, 2017, and prior to such date GSAM may not terminate the arrangements without the approval of the Trustees. The Subsidiaries also pay certain other expenses, including service and custody fees. GSAM has agreed to reduce or limit each Subsidiary’s expenses (excluding management fees) to 0.004% of the Subsidiary’s average daily net assets for the Absolute Return Tracker, Commodity Strategy, Dynamic Allocation and Dynamic Commodity Strategy Funds. In addition, the Funds have entered into certain offset arrangements with the custodian and the transfer agent, which may result in a reduction of the Funds’ expenses and are received irrespective of the application of the “Other Expense” limitations described above.
88
GOLDMAN SACHS SELECT SATELLITE FUNDS
|
| 5. AGREEMENTS AND AFFILIATED TRANSACTIONS (continued) |
For the six months ended June 30, 2016, these expense reductions, including any fee waivers and Other Expense reimbursements, were as follows:
| | | | | | | | | | | | | | | | | | |
| Fund | | | | Management
Fee Waiver | | | Other
Expense
Reimbursement | | | Custody Fee
Credits | | | Total
Expense
Reductions | |
Absolute Return Tracker | | | | $ | 2,879,452 | | | $ | 267,071 | | | $ | 23,091 | | | $ | 3,169,614 | |
Commodity Strategy | | | | | 111,945 | | | | 193,415 | | | | 4,839 | | | | 310,199 | |
Dynamic Allocation | | | | | 520,419 | | | | 294,647 | | | | — | | | | 815,066 | |
Dynamic Commodity Strategy | | | | | 7,135 | | | | 185,950 | | | | 57 | | | | 193,142 | |
Managed Futures Strategy | | | | | 104,754 | | | | — | | | | 3,380 | | | | 108,134 | |
G. Line of Credit Facility — As of June 30, 2016, the Funds participated in a $1,100,000,000 committed, unsecured revolving line of credit facility (the “facility”) together with other funds of the Trust and registered investment companies having management agreements with GSAM or its affiliates (“Other Borrowers”). This facility is to be used for temporary or emergency purposes, or to allow for an orderly liquidation of securities to meet redemption requests. The interest rate on borrowings is based on the federal funds rate. The facility also requires a fee to be paid by the Funds based on the amount of the commitment that has not been utilized. For the six months ended June 30, 2016, the Funds did not have any borrowings under the facility.
H. Other Transactions with Affiliates — For the six months ended June 30, 2016, Goldman Sachs earned $3,469 and $6,315 in brokerage commissions from portfolio transactions, including futures transactions executed with Goldman Sachs as the Futures Commission Merchant, on behalf of the Absolute Return Tracker and Dynamic Allocation Funds, respectively.
The following table provides information about the Funds’ investment in the Goldman Sachs Financial Square Government Fund as of and for the six months ended June 30, 2016:
| | | | | | | | | | | | | | | | | | | | | | |
| Fund | | | | Market
Value
12/31/15 | | | Purchases
at Cost | | | Proceeds
from Sales | | | Market
Value
06/30/16 | | | Dividend
Interest
Income | |
Absolute Return Tracker | | | | $ | 904,143,179 | | | $ | 151,321,387 | | | $ | (352,561,356 | ) | | $ | 702,903,210 | | | $ | 978,041 | |
Commodity Strategy | | | | | 137,213,970 | | | | 1,048,208,834 | | | | (1,030,919,762 | ) | | | 154,503,042 | | | | 165,734 | |
Dynamic Allocation | | | | | 329,041,062 | | | | 132,457,727 | | | | (185,474,369 | ) | | | 276,024,420 | | | | 332,341 | |
Dynamic Commodity Strategy | | | | | 8,464,763 | | | | 21,845,024 | | | | (7,215,371 | ) | | | 23,094,416 | | | | 10,998 | |
Managed Futures Strategy | | | | | 88,106,078 | | | | 135,670,086 | | | | (74,711,527 | ) | | | 149,064,637 | | | | 172,312 | |
As of June 30, 2016, the following Goldman Sachs Fund of Funds Portfolios were beneficial owners of 5% or more of total outstanding shares of the following Funds:
| | | | | | | | | | | | | | | | | | |
| Fund | | | | Goldman Sachs
Balanced Strategy
Portfolio | | | Goldman Sachs
Growth and Income
Strategy Portfolio | | | Goldman Sachs
Growth Strategy
Portfolio | | | Goldman Sachs
Satellite Strategies
Portfolio | |
Commodity Strategy | | | | | — | % | | | — | % | | | — | % | | | 10 | % |
Dynamic Allocation | | | | | 11 | | | | 22 | | | | 19 | | | | — | |
Managed Futures Strategy | | | | | 10 | | | | 20 | | | | 17 | | | | — | |
89
GOLDMAN SACHS SELECT SATELLITE FUNDS
Notes to Financial Statements (continued)
June 30, 2016 (Unaudited)
|
| 5. AGREEMENTS AND AFFILIATED TRANSACTIONS (continued) |
As of June 30, 2016, the Goldman Sachs Group, Inc. was the beneficial owner of the following Funds:
| | | | | | | | | | | | | | | | | | | | | | | | | | |
| | | | | Percent of Share Class owned by Goldman Sachs Group, Inc. | |
| Fund | | | | Class A | | | Class C | | | Institutional | | | Class IR | | | Class R | | | Class R6 | |
Absolute Return Tracker | | | | | — | % | | | — | % | | | — | % | | | — | % | | | — | % | | | 100 | % |
Dynamic Allocation | | | | | — | | | | — | | | | — | | | | — | | | | 100 | | | | 100 | |
Dynamic Commodity Strategy | | | | | 6 | | | | 31 | | | | 100 | | | | 100 | | | | 100 | | | | — | |
|
| 6. PORTFOLIO SECURITIES TRANSACTIONS |
The cost of purchases and proceeds from sales and maturities of long-term securities for the six months ended June 30, 2016, were as follows:
| | | | | | | | | | | | | | | | | | |
| Fund | | | | Purchases of
U.S. Government and
Agency Obligations | | | Purchases (Excluding
U.S. Government and
Agency Obligations) | | | Sales and
Maturities of
U.S. Government and
Agency Obligations | | | Sales and
Maturities (Excluding
U.S. Government and
Agency Obligations) | |
Absolute Return Tracker | | | | $ | — | | | $ | 113,761,963 | | | $ | — | | | $ | 125,872,449 | |
Commodity Strategy | | | | | 377,156,669 | | | | — | | | | 460,553,073 | | | | 932,655 | |
Dynamic Allocation | | | | | 27,856,578 | | | | 289,354,402 | | | | 30,149,366 | | | | 247,380,877 | |
Managed Futures Strategy | | | | | — | | | | 26,130,000 | | | | — | | | | 24,792,750 | |
Pursuant to exemptive relief granted by the Securities and Exchange Commission (“SEC”) and the terms and conditions contained therein, the Absolute Return Tracker and Dynamic Allocation Funds may lend their securities through a securities lending agent, Goldman Sachs Agency Lending (“GSAL”), a wholly-owned subsidiary of Goldman Sachs, to certain qualified borrowers including Goldman Sachs and affiliates. In accordance with the Funds’ securities lending procedures, the Funds receive cash collateral at least equal to the market value of the securities on loan. The market value of the loaned securities is determined at the close of business of the Funds, at their last sale price or official closing price on the principal exchange or system on which they are traded, and any additional required collateral is delivered to the Funds on the next business day. As with other extensions of credit, the Funds may experience delay in the recovery of their securities or incur a loss should the borrower of the securities breach its agreement with the Funds or become insolvent at a time when the collateral is insufficient to cover the cost of repurchasing securities on loan. Dividend income received from securities on loan may not be subject to withholding taxes and therefore withholding taxes paid may differ from the amounts listed in the Statements of Operations. Loans of securities are terminable at any time and as such 1) the remaining contractual maturities of the outstanding securities lending transactions are considered to be overnight and continuous and 2) the borrower, after notice, is required to return borrowed securities within the standard time period for settlement of securities transactions.
The Absolute Return Tracker and Dynamic Allocation Funds invest the cash collateral received in connection with securities lending transactions in the Goldman Sachs Financial Square Money Market Fund (“Money Market Fund”), an affiliated series of the Trust. The Money Market Fund is registered under the Act as an open end investment company, is subject to Rule 2a-7 under the Act, and is managed by GSAM, for which GSAM may receive an investment advisory fee of up to 0.205% on an annualized basis of the average daily net assets of the Money Market Fund.
90
GOLDMAN SACHS SELECT SATELLITE FUNDS
|
| 7. SECURITIES LENDING (continued) |
In the event of a default by a borrower with respect to any loan, GSAL will exercise any and all remedies provided under the applicable borrower agreement to make the Funds whole. These remedies include purchasing replacement securities by applying the collateral held from the defaulting broker against the purchase cost of the replacement securities. If, despite such efforts by GSAL to exercise these remedies, the Funds sustain losses as a result of a borrower’s default, GSAL indemnifies the Funds by purchasing replacement securities at GSAL’s expense, or paying the Funds an amount equal to the market value of the replacement securities, subject to an exclusion for any shortfalls resulting from a loss of value in the cash collateral pool due to reinvestment risk and a requirement that the Funds agree to assign rights to the collateral to GSAL for purpose of using the collateral to cover purchase of replacement securities as more fully described in the Securities Lending Agency Agreement. The Funds’ loaned securities were all subject to enforceable Securities Lending Agreements and the value of the collateral is at least equal to the value of the cash received. The value of loaned securities and cash collateral at period end are disclosed in the Funds’ Statement of Assets and Liabilities.
Both the Funds and GSAL received compensation relating to the lending of the Funds’ securities. The amounts earned by the Funds for the six months ended June 30, 2016, are reported under Investment Income on the Statements of Operations.
The table below details securities lending activity with affiliates of Goldman Sachs:
| | | | | | | | | | | | | | |
| | | | | For the Six Months ended June 30, 2016 | | | Amounts Payable to
Goldman Sachs
Upon Return of
Securities Loaned as of
June 30, 2016 | |
| Fund | | | | Earnings of GSAL
Relating to
Securities
Loaned | | | Amounts Received
by the Funds
from Lending to
Goldman Sachs | | |
Absolute Return Tracker | | | | $ | 4,713 | | | $ | 445 | | | $ | 787,266 | |
Dynamic Allocation | | | | | 3,239 | | | | 1,610 | | | | 1,691,234 | |
The following table provides information about the Funds’ investment in the Money Market Fund for the six months ended June 30, 2016:
| | | | | | | | | | | | | | | | | | |
| Fund | | | | Market
Value
12/31/15 | | | Purchases
at Cost | | | Proceeds
from Sales | | | Market
Value
6/30/16 | |
Absolute Return Tracker | | | | $ | — | | | $ | 102,462,175 | | | $ | (97,452,525 | ) | | $ | 5,009,650 | |
Dynamic Allocation | | | | | — | | | | 13,108,565 | | | | (11,220,865 | ) | | | 1,887,700 | |
91
GOLDMAN SACHS SELECT SATELLITE FUNDS
Notes to Financial Statements (continued)
June 30, 2016 (Unaudited)
As of the Funds’ most recent fiscal year end, December 31, 2015, the Funds’ capital loss carryforwards and certain timing differences, on a tax-basis were as follows:
| | | | | | | | | | | | | | | | | | | | |
| | | Absolute
Return
Tracker | | | Commodity
Strategy | | | Dynamic
Allocation | | | Dynamic
Commodity
Strategy | | | Managed
Futures
Strategy | |
Capital loss carryforwards:(1) | | | | | | | | | | | | | | | | | | | | |
Expiring 2016 | | $ | — | | | $ | (16,303,834 | ) | | $ | — | | | $ | — | | | $ | — | |
Expiring 2017 | | | — | | | | (67,560,179 | ) | | | — | | | | — | | | | — | |
Perpetual Short-term | | | (2,466,351 | ) | | | (9,976,477 | ) | | | (17,878,052 | ) | | | — | | | | — | |
Perpetual Long-term | | | — | | | | (5,928,633 | ) | | | (2,327,721 | ) | | | — | | | | (12,787 | ) |
Total capital loss carryforwards | | $ | (2,466,351 | ) | | $ | (99,769,123 | ) | | $ | (20,205,773 | ) | | $ | — | | | $ | (12,787 | ) |
Timing differences (Qualified Late Year Loss Deferral/certain REIT dividends/straddle loss deferral/Post October Loss Deferral) | | | (7,160,548 | ) | | | (4,091,744 | ) | | | (12,654,226 | ) | | | — | | | | (1,318,465 | ) |
| (1) | | Expiration occurs on December 31 of the year indicated. |
As of June 30, 2016, the Funds’ aggregate security unrealized gains and losses based on cost for U.S. federal income tax purposes were as follows:
| | | | | | | | | | | | | | | | | | | | |
| | | Absolute
Return
Tracker | | | Commodity
Strategy | | | Dynamic
Allocation | | | Dynamic
Commodity
Strategy | | | Managed
Futures
Strategy | |
Tax cost | | $ | 879,181,839 | | | $ | 335,520,355 | | | $ | 493,135,211 | | | $ | 23,094,416 | | | $ | 157,253,637 | |
Gross unrealized gain | | | 15,005,086 | | | | 7,510,386 | | | | 7,976,288 | | | | — | | | | 18,477,543 | |
Gross unrealized loss | | | (17,030,898 | ) | | | (303,111 | ) | | | (15,992,295 | ) | | | — | | | | (17,432,802 | ) |
Net unrealized security gain (loss) | | $ | (2,025,812 | ) | | $ | 7,207,275 | | | $ | (8,016,007 | ) | | $ | — | | | $ | 1,044,741 | |
The difference between GAAP-basis and tax-basis unrealized gains (losses) is attributable primarily to wash sales, net mark to market gains (losses) on regulated futures, options and foreign currency contracts, and differences related to the tax treatment of swap transactions, inflation protected securities, underlying fund investments, passive foreign investment companies and REIT investments.
GSAM has reviewed the Funds’ tax positions for all open tax years (the current and prior three years, as applicable) and has concluded that no provision for income tax is required in the Funds’ financial statements. Such open tax years remain subject to examination and adjustment by tax authorities.
The Funds’ risks include, but are not limited to, the following:
Derivatives Risk — Loss may result from the Funds’ investments in derivative instruments. These instruments may be illiquid, difficult to price and leveraged so that small changes in the value of the underlying instruments may produce disproportionate losses to the Funds. Derivatives are also subject to counterparty risk, which is the risk that the other party in the transaction will not fulfill its contractual obligation. Losses from investments in derivatives can also result from a lack of correlation between changes in the value of derivative instruments and the portfolio assets (if any) being hedged.
92
GOLDMAN SACHS SELECT SATELLITE FUNDS
|
| 9. OTHER RISKS (continued) |
Foreign and Emerging Countries Risk — Investing in foreign markets may involve special risks and considerations not typically associated with investing in the U.S. Foreign securities may be subject to risk of loss because of more or less foreign government regulation, less public information and less economic, political and social stability in the countries in which a Fund invests. Loss may also result from the imposition of exchange controls, confiscations and other government restrictions by the U.S. or other governments, or from problems in registration, settlement or custody. Foreign risk also involves the risk of negative foreign currency rate fluctuations, which may cause the value of securities denominated in such foreign currency (or other instruments through which a Fund has exposure to foreign currencies) to decline in value. Currency exchange rates may fluctuate significantly over short periods of time. To the extent that a Fund also invests in securities of issuers located in emerging markets, these risks may be more pronounced.
Foreign Custody Risk — A Fund that invests in foreign securities may hold such securities and cash with foreign banks, agents, and securities depositories appointed by the Fund’s custodian (each a “Foreign Custodian”). Some foreign custodians may be recently organized or new to the foreign custody business. In some countries, Foreign Custodians may be subject to little or no regulatory oversight over, or independent evaluation of, their operations. Further, the laws of certain countries may place limitations on a Fund’s ability to recover its assets if a Foreign Custodian enters bankruptcy. Investments in emerging markets may be subject to even greater custody risks than investments in more developed markets. Custody services in emerging market countries are very often undeveloped and may be considerably less well regulated than in more developed countries, and thus may not afford the same level of investor protection as would apply in developed countries.
Interest Rate Risk — When interest rates increase, fixed income securities or instruments held by a Fund will generally decline in value. Long-term fixed income securities or instruments will normally have more price volatility because of this risk than short-term fixed income securities or instruments. The risks associated with increasing rates are heightened given that interest rates are near historic lows, but may be expected to increase in the future with unpredictable effects on the markets and the Funds’ investments.
Investments in Other Investment Companies — As a shareholder of another investment company, including an exchange traded fund (“ETF”), a Fund will indirectly bear its proportionate share of any net management fees and other expenses paid by such other investment companies, in addition to the fees and expenses regularly borne by the Fund. ETFs are subject to risks that do not apply to conventional mutual funds, including but not limited to the following: (i) the market price of the ETF’s shares may trade at a premium or a discount to their NAV; and (ii) an active trading market for an ETF’s shares may not develop or be maintained.
Large Shareholder Transactions Risk — A Fund may experience adverse effects when certain large shareholders, such as other funds, institutional investors (including those trading by use of non-discretionary mathematical formulas), financial intermediaries (who may make investment decisions on behalf of underlying clients and/or include a Fund in their investment model), individuals, accounts and Goldman Sachs affiliates, purchase or redeem large amounts of shares of a Fund. Such large shareholder redemptions may cause a Fund to sell portfolio securities at times when it would not otherwise do so, which may negatively impact a Fund’s NAV and liquidity. These transactions may also accelerate the realization of taxable income to shareholders if such sales of investments resulted in gains, and may also increase transaction costs. In addition, a large redemption could result in a Fund’s current expenses being allocated over a smaller asset base, leading to an increase in the Fund’s expense ratio. Similarly, large Fund share purchases may adversely affect a Fund’s performance to the extent that the Fund is delayed in investing new cash and is required to maintain a larger cash position than it ordinarily would.
Liquidity Risk — A Fund may make investments that are illiquid or that may become less liquid in response to market developments or adverse investor perceptions. Illiquid investments may be more difficult to value. Liquidity risk may also refer to the risk that a Fund will not be able to pay redemption proceeds within the allowable time period because of unusual market conditions, an unusually high volume of redemption requests, or other reasons. To meet redemption requests, a Fund may be forced to sell investments at an unfavorable time and/or under unfavorable conditions. Liquidity risk may be the result of, among other things, the reduced number and capacity of traditional market participants to make a market in fixed income securities or the lack of an active market. The potential for liquidity risk may be magnified by a rising interest rate environment or other
93
GOLDMAN SACHS SELECT SATELLITE FUNDS
Notes to Financial Statements (continued)
June 30, 2016 (Unaudited)
|
| 9. OTHER RISKS (continued) |
circumstances where investor redemptions from fixed income mutual funds may be higher than normal, potentially causing increased supply in the market due to selling activity.
Market and Credit Risks — In the normal course of business, a Fund trades financial instruments and enters into financial transactions where risk of potential loss exists due to changes in the market (market risk). Additionally, a Fund may also be exposed to credit risk in the event that an issuer or guarantor fails to perform or that an institution or entity with which the Fund has unsettled or open transactions defaults.
Non-Diversification Risk — The Funds (except for the Absolute Return Tracker Fund) are non-diversified, meaning that they are permitted to invest a larger percentage of their assets in fewer issuers than diversified mutual funds. Thus, each Fund (except for the Absolute Return Tracker Fund) may be more susceptible to adverse developments affecting any single issuer held in its portfolio, and may be more susceptible to greater losses because of these developments.
Short Position Risk — A Fund may enter into a short position through a futures contract, an option or swap agreement or through short sales of any instrument that a Fund may purchase for investment. Taking short positions involves leverage of a Fund’s assets and presents various risks. If the value of the underlying instrument or market in which a Fund has taken a short position increases, then the Fund will incur a loss equal to the increase in value from the time that the short position was entered into plus any related interest payments or other fees. Taking short positions involves the risk that losses may be disproportionate, may exceed the amount invested, and may be unlimited.
Tax Risk — The Funds will seek to gain exposure to the commodity markets primarily through investments in the Subsidiaries and/or commodity index-linked structured notes. Historically, the Internal Revenue Service (“IRS”) issued private letter rulings (“PLRs”) in which the IRS specifically concluded that income and gains from investments in commodity index-linked structured notes or a wholly-owned foreign subsidiary that invests in commodity-linked instruments are “qualifying income” for purposes of compliance with Subchapter M of the Code. The IRS has issued such PLRs to the Absolute Return Tracker, Commodity Strategy, and Dynamic Allocation Funds. Based on such rulings, these Funds may seek to gain exposure to the commodity markets through investments in commodity-linked notes and/or subsidiaries. The Dynamic Commodity Strategy and Managed Futures Strategy Funds have not received a PLR, and are not able to rely on PLRs issued to other taxpayers. Additionally, the IRS has suspended the granting of such PLRs, pending review of its position on this matter. In light of this, the Dynamic Commodity Strategy and Managed Futures Strategy Funds have obtained an opinion of counsel that the Funds’ income from such investments should constitute “qualifying income.” However, no assurances can be provided that the IRS would not be able to successfully assert that a Fund’s income from such investments was not “qualifying income”, in which case the Fund would fail to qualify as regulated investment company (“RIC”) under Subchapter M of the Code if over 10% of its gross income was derived from these investments. If a Fund failed to qualify as a RIC, it would be subject to federal and state income tax on all of its taxable income at regular corporate tax rates. This would significantly adversely affect the returns to, and could cause substantial losses for, Fund shareholders.
Under the Trust’s organizational documents, its Trustees, officers, employees and agents are indemnified, to the extent permitted by the Act and state law, against certain liabilities that may arise out of performance of their duties to the Funds. Additionally, in the course of business, the Funds enter into contracts that contain a variety of indemnification clauses. The Funds’ maximum exposure under these arrangements is unknown, as this would involve future claims that may be made against the Funds that have not yet occurred. However, GSAM believes the risk of loss under these arrangements to be remote.
94
GOLDMAN SACHS SELECT SATELLITE FUNDS
At a meeting held on June 16, 2016, the Trustees approved the Managed Futures Strategy Fund (the “Fund”) to invest in a wholly-owned subsidiary, Cayman Commodity — MFS, Ltd. (the “MFS Subsidiary”), a Cayman Islands exempted company. The Fund is the sole shareholder of the MFS Subsidiary pursuant to a subscription agreement dated July 18, 2016 and it is intended that the Fund will remain the sole shareholder and will continue to control the MFS Subsidiary. The MFS Subsidiary acts as an investment vehicle for the Fund to enable the Fund to gain exposure to certain types of commodity-linked derivative instruments. The MFS Subsidiary commenced operations on July 22, 2016.
Subsequent events other than the above item have been evaluated through the date the financial statements were issued. GSAM has concluded that there is no impact requiring adjustment or disclosure in the financial statements.
95
GOLDMAN SACHS SELECT SATELLITE FUNDS
Notes to Financial Statements (continued)
June 30, 2016 (Unaudited)
|
| 12. SUMMARY OF SHARE TRANSACTIONS |
Share activity is as follows:
| | | | | | | | | | | | | | | | |
| | | Absolute Return Tracker Fund | |
| | | | |
| | | For the Six Months Ended June 30, 2016 (Unaudited) | | | For the Fiscal Year Ended December 31, 2015 | |
| | | | |
| | | Shares | | | Dollars | | | Shares | | | Dollars | |
| | | | |
| Class A Shares | | | | | | | | | | | | | | | | |
Shares sold | | | 394,267 | | | $ | 3,393,467 | | | | 1,847,575 | | | $ | 16,563,412 | |
Reinvestment of distributions | | | — | | | | — | | | | 60,594 | | | | 526,947 | |
Shares redeemed | | | (1,085,184 | ) | | | (9,335,849 | ) | | | (3,809,052 | ) | | | (34,389,999 | ) |
| | | | (690,917 | ) | | | (5,942,382 | ) | | | (1,900,883 | ) | | | (17,299,640 | ) |
| Class C Shares | | | | | | | | | | | | | | | | |
Shares sold | | | 50,964 | | | | 416,006 | | | | 447,480 | | | | 3,743,293 | |
Reinvestment of distributions | | | — | | | | — | | | | 19,156 | | | | 156,508 | |
Shares redeemed | | | (481,037 | ) | | | (3,868,880 | ) | | | (1,588,503 | ) | | | (13,595,931 | ) |
| | | | (430,073 | ) | | | (3,452,874 | ) | | | (1,121,867 | ) | | | (9,696,130 | ) |
| Institutional Shares | | | | | | | | | | | | | | | | |
Shares sold | | | 11,759,682 | | | | 103,243,015 | | | | 75,029,251 | | | | 690,031,697 | |
Reinvestment of distributions | | | — | | | | — | | | | 1,222,896 | | | | 10,892,096 | |
Shares redeemed | | | (35,128,270 | ) | | | (307,609,278 | ) | | | (154,271,524 | ) | | | (1,430,199,546 | ) |
| | | | (23,368,588 | ) | | | (204,366,263 | ) | | | (78,019,377 | ) | | | (729,275,753 | ) |
| Class IR Shares | | | | | | | | | | | | | | | | |
Shares sold | | | 717,813 | | | | 6,374,394 | | | | 147,709 | | | | 1,342,665 | |
Reinvestment of distributions | | | — | | | | — | | | | 12,287 | | | | 108,647 | |
Shares redeemed | | | (106,464 | ) | | | (929,770 | ) | | | (271,629 | ) | | | (2,492,261 | ) |
| | | | 611,349 | | | | 5,444,624 | | | | (111,633 | ) | | | (1,040,949 | ) |
| Class R Shares | | | | | | | | | | | | | | | | |
Shares sold | | | 29,946 | | | | 253,331 | | | | 141,186 | | | | 1,238,305 | |
Reinvestment of distributions | | | — | | | | — | | | | 3,312 | | | | 28,217 | |
Shares redeemed | | | (19,336 | ) | | | (162,304 | ) | | | (166,665 | ) | | | (1,461,098 | ) |
| | | | 10,610 | | | | 91,027 | | | | (22,167 | ) | | | (194,576 | ) |
| Class R6 Shares(a) | | | | | | | | | | | | | | | | |
Shares sold | | | — | | | | — | | | | 1,076 | | | | 10,005 | |
Reinvestment of distributions | | | — | | | | — | | | | 20 | | | | 175 | |
Shares redeemed | | | — | | | | — | | | | (1 | ) | | | (5 | ) |
| | | | — | | | | — | | | | 1,095 | | | | 10,175 | |
NET DECREASE | | | (23,867,619 | ) | | $ | (208,225,868 | ) | | | (81,174,832 | ) | | $ | (757,496,873 | ) |
| (a) | | Commenced operations on July 31, 2015. |
96
GOLDMAN SACHS SELECT SATELLITE FUNDS
|
| 12. SUMMARY OF SHARE TRANSACTIONS (continued) |
Share activity is as follows:
| | | | | | | | | | | | | | | | |
| | | Commodity Strategy Fund | |
| | | | |
| | | For the Six Months Ended June 30, 2016 (Unaudited) | | | For the Fiscal Year Ended December 31, 2015 | |
| | | | |
| | | Shares | | | Dollars | | | Shares | | | Dollars | |
| | | | |
| Class A Shares | | | | | | | | | | | | | | | | |
Shares sold | | | 999,167 | | | $ | 10,318,740 | | | | 15,777,633 | | | $ | 60,858,137 | |
Reinvestment of distributions | | | 11,362 | | | | 133,276 | | | | 16,703 | | | | 91,097 | |
Shares redeemed | | | (1,326,864 | ) | | | (14,007,048 | ) | | | (32,059,716 | ) | | | (55,857,410 | ) |
| | | | (316,335 | ) | | | (3,555,032 | ) | | | (16,265,380 | ) | | | 5,091,824 | |
| Class C Shares | | | | | | | | | | | | | | | | |
Shares sold | | | 54,157 | | | | 531,893 | | | | 660,998 | | | | 2,545,945 | |
Shares redeemed | | | (73,425 | ) | | | (734,847 | ) | | | (2,379,704 | ) | | | (3,685,351 | ) |
| | | | (19,268 | ) | | | (202,954 | ) | | | (1,718,706 | ) | | | (1,139,406 | ) |
| Institutional Shares | | | | | | | | | | | | | | | | |
Shares sold | | | 10,173,199 | | | | 105,912,066 | | | | 138,190,452 | | | | 560,027,434 | |
Reinvestment of distributions | | | 64,567 | | | | 765,117 | | | | 336,102 | | | | 2,121,062 | |
Shares redeemed | | | (34,334,967 | ) | | | (380,271,841 | ) | | | (281,722,880 | ) | | | (505,178,505 | ) |
| | | | (24,097,201 | ) | | | (273,594,658 | ) | | | (143,196,326 | ) | | | 56,969,991 | |
| Class IR Shares | | | | | | | | | | | | | | | | |
Shares sold | | | 275,396 | | | | 3,018,957 | | | | 2,054,712 | | | | 9,039,056 | |
Reinvestment of distributions | | | 2,681 | | | | 31,767 | | | | 5,006 | | | | 33,309 | |
Shares redeemed | | | (176,685 | ) | | | (1,873,214 | ) | | | (3,394,503 | ) | | | (7,237,812 | ) |
| | | | 101,392 | | | | 1,177,510 | | | | (1,334,785 | ) | | | 1,834,553 | |
| Class R Shares | | | | | | | | | | | | | | | | |
Shares sold | | | 73,863 | | | | 762,832 | | | | 433,008 | | | | 1,676,370 | |
Reinvestment of distributions | | | 306 | | | | 3,534 | | | | 57 | | | | 512 | |
Shares redeemed | | | (32,501 | ) | | | (339,718 | ) | | | (644,435 | ) | | | (529,740 | ) |
| | | | 41,668 | | | | 426,648 | | | | (211,370 | ) | | | 1,147,142 | |
| Class R6 Shares(a) | | | | | | | | | | | | | | | | |
Shares sold | | | 19,019 | | | | 201,314 | | | | 507,090 | | | | 1,623,683 | |
Reinvestment of distributions | | | 557 | | | | 6,610 | | | | 417 | | | | 4,381 | |
Shares redeemed | | | (7,909 | ) | | | (81,729 | ) | | | (381,465 | ) | | | (44,946 | ) |
| | | | 11,667 | | | | 126,195 | | | | 126,042 | | | | 1,583,118 | |
NET INCREASE (DECREASE) | | | (24,278,077 | ) | | $ | (275,622,291 | ) | | | (162,600,525 | ) | | $ | 65,487,222 | |
| (a) | | Commenced operations on July 31, 2015. |
97
GOLDMAN SACHS SELECT SATELLITE FUNDS
Notes to Financial Statements (continued)
June 30, 2016 (Unaudited)
|
| 12. SUMMARY OF SHARE TRANSACTIONS (continued) |
Share activity is as follows:
| | | | | | | | | | | | | | | | |
| | | Dynamic Allocation Fund | |
| | | | |
| | | For the Six Months Ended June 30, 2016 (Unaudited) | | | For the Fiscal Year Ended December 31, 2015 | |
| | | | |
| | | Shares | | | Dollars | | | Shares | | | Dollars | |
| | | | |
| Class A Shares | | | | | | | | | | | | | | | | |
Shares sold | | | 95,760 | | | $ | 899,683 | | | | 750,022 | | | $ | 7,855,574 | |
Reinvestment of distributions | | | — | | | | — | | | | 142,722 | | | | 1,354,380 | |
Shares redeemed | | | (1,193,142 | ) | | | (11,159,257 | ) | | | (3,769,594 | ) | | | (38,882,367 | ) |
| | | | (1,097,382 | ) | | | (10,259,574 | ) | | | (2,876,850 | ) | | | (29,672,413 | ) |
| Class C Shares | | | | | | | | | | | | | | | | |
Shares sold | | | 108,061 | | | | 959,418 | | | | 153,384 | | | | 1,513,060 | |
Reinvestment of distributions | | | — | | | | — | | | | 90,071 | | | | 820,546 | |
Shares redeemed | | | (554,869 | ) | | | (4,981,868 | ) | | | (1,235,995 | ) | | | (12,149,296 | ) |
| | | | (446,808 | ) | | | (4,022,450 | ) | | | (992,540 | ) | | | (9,815,690 | ) |
| Institutional Shares | | | | | | | | | | | | | | | | |
Shares sold | | | 4,745,662 | | | | 44,766,396 | | | | 7,376,472 | | | | 76,080,653 | |
Reinvestment of distributions | | | — | | | | — | | | | 1,837,452 | | | | 17,672,094 | |
Shares redeemed | | | (7,617,332 | ) | | | (72,319,758 | ) | | | (16,507,674 | ) | | | (172,589,919 | ) |
| | | | (2,871,670 | ) | | | (27,553,362 | ) | | | (7,293,750 | ) | | | (78,837,172 | ) |
| Class IR Shares | | | | | | | | | | | | | | | | |
Shares sold | | | 55,735 | | | | 534,066 | | | | 63,902 | | | | 681,900 | |
Reinvestment of distributions | | | — | | | | — | | | | 35,362 | | | | 338,923 | |
Shares redeemed | | | (407,853 | ) | | | (3,836,575 | ) | | | (1,596,497 | ) | | | (16,636,857 | ) |
| | | | (352,118 | ) | | | (3,302,509 | ) | | | (1,497,233 | ) | | | (15,616,034 | ) |
| Class R Shares | | | | | | | | | | | | | | | | |
Shares sold | | | — | | | | — | | | | 1,890 | | | | 20,341 | |
Reinvestment of distributions | | | — | | | | — | | | | 34 | | | | 321 | |
Shares redeemed | | | — | | | | — | | | | (1,890 | ) | | | (20,133 | ) |
| | | | — | | | | — | | | | 34 | | | | 529 | |
| Class R6 Shares(a) | | | | | | | | | | | | | | | | |
Shares sold | | | — | | | | — | | | | 956 | | | | 10,006 | |
Reinvestment of distributions | | | — | | | | — | | | | 35 | | | | 334 | |
Shares redeemed | | | — | | | | — | | | | — | | | | (5 | ) |
| | | | — | | | | — | | | | 991 | | | | 10,335 | |
NET DECREASE | | | (4,767,978 | ) | | $ | (45,137,895 | ) | | | (12,659,348 | ) | | $ | (133,930,445 | ) |
| (a) | | Commenced operations on July 31, 2015. |
98
GOLDMAN SACHS SELECT SATELLITE FUNDS
|
| 12. SUMMARY OF SHARE TRANSACTIONS (continued) |
Share activity is as follows:
| | | | | | | | | | | | | | | | |
| | | Dynamic Commodity Strategy Fund | |
| | | | |
| | | For the Six Months Ended June 30, 2016 (Unaudited) | | | For the Fiscal Year Ended December 31, 2015 | |
| | | | |
| | | Shares | | | Dollars | | | Shares | | | Dollars | |
| | | | |
| Class A Shares | | | | | | | | | | | | | | | | |
Shares sold | | | 2,000 | | | $ | 11,928 | | | | 18,211 | | | $ | 122,262 | |
Shares redeemed | | | (6,861 | ) | | | (42,595 | ) | | | (2,559 | ) | | | (15,429 | ) |
| | | | (4,861 | ) | | | (30,667 | ) | | | 15,652 | | | | 106,833 | |
| Class C Shares | | | | | | | | | | | | | | | | |
Shares sold | | | 2,266 | | | | 13,963 | | | | — | | | | — | |
| | | | 2,266 | | | | 13,963 | | | | — | | | | — | |
| Institutional Shares | | | | | | | | | | | | | | | | |
Shares sold | | | — | | | | — | | | | 86,965 | | | | 641,926 | |
Shares redeemed | | | (83,020 | ) | | | (488,156 | ) | | | (3,886 | ) | | | (30,122 | ) |
| | | | (83,020 | ) | | | (488,156 | ) | | | 83,079 | | | | 611,804 | |
NET INCREASE (DECREASE) | | | (85,615 | ) | | $ | (504,860 | ) | | | 98,731 | | | $ | 718,637 | |
99
GOLDMAN SACHS SELECT SATELLITE FUNDS
Notes to Financial Statements (continued)
June 30, 2016 (Unaudited)
|
| 12. SUMMARY OF SHARE TRANSACTIONS (continued) |
Share activity is as follows:
| | | | | | | | | | | | | | | | |
| | | Managed Futures Strategy Fund | |
| | | | |
| | | For the Six Months Ended June 30, 2016 (Unaudited) | | | For the Fiscal Year Ended December 31, 2015 | |
| | | | |
| | | Shares | | | Dollars | | | Shares | | | Dollars | |
| | | | |
| Class A Shares | | | | | | | | | | | | | | | | |
Shares sold | | | 4,366,985 | | | $ | 45,633,575 | | | | 2,665,760 | | | $ | 28,258,440 | |
Reinvestment of distributions | | | — | | | | — | | | | 85,521 | | | | 871,464 | |
Shares redeemed | | | (2,378,859 | ) | | | (24,289,513 | ) | | | (680,290 | ) | | | (7,190,542 | ) |
| | | | 1,988,126 | | | | 21,344,062 | | | | 2,070,991 | | | | 21,939,362 | |
| Class C Shares | | | | | | | | | | | | | | | | |
Shares sold | | | 253,363 | | | | 2,586,422 | | | | 227,775 | | | | 2,350,890 | |
Reinvestment of distributions | | | — | | | | — | | | | 10,227 | | | | 101,551 | |
Shares redeemed | | | (71,554 | ) | | | (709,013 | ) | | | (25,775 | ) | | | (259,704 | ) |
| | | | 181,809 | | | | 1,877,409 | | | | 212,227 | | | | 2,192,737 | |
| Institutional Shares | | | | | | | | | | | | | | | | |
Shares sold | | | 4,328,560 | | | | 45,892,243 | | | | 1,773,788 | | | | 18,961,451 | |
Reinvestment of distributions | | | — | | | | — | | | | 320,554 | | | | 3,314,526 | |
Shares redeemed | | | (1,999,818 | ) | | | (20,945,019 | ) | | | (2,660,604 | ) | | | (28,531,911 | ) |
| | | | 2,328,742 | | | | 24,947,224 | | | | (566,262 | ) | | | (6,255,934 | ) |
| Class IR Shares | | | | | | | | | | | | | | | | |
Shares sold | | | 1,806,489 | | | | 19,084,501 | | | | 628,007 | | | | 6,730,109 | |
Reinvestment of distributions | | | — | | | | — | | | | 23,839 | | | | 244,828 | |
Shares redeemed | | | (518,365 | ) | | | (5,340,609 | ) | | | (61,745 | ) | | | (652,304 | ) |
| | | | 1,288,124 | | | | 13,743,892 | | | | 590,101 | | | | 6,322,633 | |
| Class R Shares | | | | | | | | | | | | | | | | |
Shares sold | | | 12,888 | | | | 131,713 | | | | 10,014 | | | | 105,572 | |
Reinvestment of distributions | | | — | | | | — | | | | 700 | | | | 7,072 | |
Shares redeemed | | | (87 | ) | | | (860 | ) | | | (58 | ) | | | (614 | ) |
| | | | 12,801 | | | | 130,853 | | | | 10,656 | | | | 112,030 | |
NET INCREASE | | | 5,799,602 | | | $ | 62,043,440 | | | | 2,317,713 | | | $ | 24,310,828 | |
100
GOLDMAN SACHS SELECT SATELLITE FUNDS
Fund Expenses — Six Month Period Ended June 30, 2016 (Unaudited)
As a shareholder of Class A, Class C, Institutional, Class IR, Class R or Class R6 Shares of a Fund you incur two types of costs: (1) transaction costs, including sales charges on purchase payments (with respect to Class A Shares) and contingent deferred sales charges on redemptions (with respect to Class C Shares); and (2) ongoing costs, including management fees; distribution and service (12b-1) fees (with respect to Class A, Class C and Class R Shares); and other Fund expenses. This example is intended to help you understand your ongoing costs (in dollars) of investing in Class A, Class C, Institutional, Class IR, Class R and Class R6 Shares of the Funds and to compare these costs with the ongoing costs of investing in other mutual funds.
The example is based on an investment of $1,000 invested at the beginning of the period and held for the entire period from January 1, 2016 through June 30, 2016, which represents a period of 182 days of a 366 day year.
Actual Expenses — The first line under each share class in the table below provides information about actual account values and actual expenses. You may use the information in this line, together with the amount you invested, to estimate the expenses that you paid over the period. Simply divide your account value by $1,000 (for example, an $8,600 account value divided by $1,000=8.6), then multiply the result by the number in the first line under the heading entitled “Expenses Paid” to estimate the expenses you paid on your account during this period.
Hypothetical Example for Comparison Purposes — The second line under each share class in the table below provides information about hypothetical account values and hypothetical expenses based on the Funds’ actual net expense ratio and an assumed rate of return of 5% per year before expenses, which is not the Funds’ actual return. The hypothetical account values and expenses may not be used to estimate the actual ending account balance or expenses you paid for the period. You may use this information to compare the ongoing costs of investing in the Funds and other funds. To do so, compare this 5% hypothetical example with the 5% hypothetical examples that appear in the shareholder reports of the other funds.
Please note that the expenses shown in the table are meant to highlight your ongoing costs only and do not reflect any transactional costs, such as sales charges, redemption fees, or exchange fees. Therefore, the second line of the table is useful in comparing ongoing costs only, and will not help you determine the relative total costs of owning different funds. In addition, if these transactional costs were included, your costs would have been higher.
| | | | | | | | | | | | | | | | | | | | | | | | | | | | | | | | | | | | | | | | | | | | | | | | | | | | | | | | | | | | | | | | | | | | | | | | | | | |
| | | Absolute Return Tracker Fund | | Commodity Strategy Fund | | Dynamic Allocation Fund | | Dynamic Commodity Strategy Fund | | Managed Futures Strategy Fund |
| Share Class | | Beginning
Account
Value
01/01/16 | | Ending
Account
Value
06/30/16 | | Expenses
Paid for the
6 Months Ended
06/30/16* | | Beginning
Account
Value
01/01/16 | | Ending
Account
Value
06/30/16 | | Expenses
Paid for the
6 Months Ended
06/30/16* | | Beginning
Account
Value
01/01/16 | | Ending
Account
Value
06/30/16 | | Expenses
Paid for the
6 Months Ended
06/30/16* | | Beginning
Account
Value
01/01/16 | | Ending
Account
Value
06/30/16 | | Expenses
Paid for the
6 Months Ended
06/30/16* | | Beginning
Account
Value
01/01/16 | | Ending
Account
Value
06/30/16 | | Expenses
Paid for the
6 Months Ended
06/30/16* |
| Class A | | | | | | | | | | | | | | | | | | | | | | | | | | | | | | | | | | | | | | | | | | | | | | | | | | | | | | | | | | | | | | | | | | | | | | | | | | | |
Actual | | | $ | 1,000 | | | | $ | 1,010.40 | | | | $ | 5.15 | | | | $ | 1,000 | | | | $ | 1,101.90 | | | | $ | 4.76 | | | | $ | 1,000 | | | | $ | 1,008.50 | | | | $ | 5.79 | | | | $ | 1,000 | | | | $ | 1,069.90 | | | | $ | 5.87 | | | | $ | 1,000 | | | | $ | 1,006.90 | | | | $ | 7.53 | |
Hypothetical 5% return | | | | 1,000 | | | | | 1,019.74 | + | | | | 5.17 | | | | | 1,000 | | | | | 1,020.34 | + | | | | 4.57 | | | | | 1,000 | | | | | 1,019.10 | + | | | | 5.82 | | | | | 1,000 | | | | | 1,019.19 | + | | | | 5.72 | | | | | 1,000 | | | | | 1,017.35 | + | | | | 7.57 | |
| Class C | | | | | | | | | | | | | | | | | | | | | | | | | | | | | | | | | | | | | | | | | | | | | | | | | | | | | | | | | | | | | | | | | | | | | | | | | | | |
Actual | | | | 1,000 | | | | | 1,006.10 | | | | | 8.88 | | | | | 1,000 | | | | | 1,097.60 | | | | | 8.66 | | | | | 1,000 | | | | | 1,004.40 | | | | | 9.52 | | | | | 1,000 | | | | | 1,065.80 | | | | | 9.71 | | | | | 1,000 | | | | | 1,003.00 | | | | | 11.26 | |
Hypothetical 5% return | | | | 1,000 | | | | | 1,016.01 | + | | | | 8.92 | | | | | 1,000 | | | | | 1,016.61 | + | | | | 8.32 | | | | | 1,000 | | | | | 1,015.37 | + | | | | 9.57 | | | | | 1,000 | | | | | 1,015.47 | + | | | | 9.47 | | | | | 1,000 | | | | | 1,013.63 | + | | | | 11.31 | |
| Institutional | | | | | | | | | | | | | | | | | | | | | | | | | | | | | | | | | | | | | | | | | | | | | | | | | | | | | | | | | | | | | | | | | | | | | | | | | | | |
Actual | | | | 1,000 | | | | | 1,012.40 | | | | | 3.15 | | | | | 1,000 | | | | | 1,104.40 | | | | | 2.98 | | | | | 1,000 | | | | | 1,010.50 | | | | | 3.80 | | | | | 1,000 | | | | | 1,071.20 | | | | | 4.12 | | | | | 1,000 | | | | | 1,007.70 | | | | | 5.94 | |
Hypothetical 5% return | | | | 1,000 | | | | | 1,021.73 | + | | | | 3.17 | | | | | 1,000 | | | | | 1,022.03 | + | | | | 2.87 | | | | | 1,000 | | | | | 1,021.08 | + | | | | 3.82 | | | | | 1,000 | | | | | 1,020.89 | + | | | | 4.02 | | | | | 1,000 | | | | | 1,018.95 | + | | | | 5.97 | |
| Class IR | | | | | | | | | | | | | | | | | | | | | | | | | | | | | | | | | | | | | | | | | | | | | | | | | | | | | | | | | | | | | | | | | | | | | | | | | | | |
Actual | | | | 1,000 | | | | | 1,012.50 | | | | | 3.90 | | | | | 1,000 | | | | | 1,103.10 | | | | | 3.45 | | | | | 1,000 | | | | | 1,009.50 | | | | | 4.55 | | | | | 1,000 | | | | | 1,071.30 | | | | | 4.53 | | | | | 1,000 | | | | | 1,006.80 | | | | | 6.29 | |
Hypothetical 5% return | | | | 1,000 | | | | | 1,020.98 | + | | | | 3.92 | | | | | 1,000 | | | | | 1,021.58 | + | | | | 3.32 | | | | | 1,000 | | | | | 1,020.34 | + | | | | 4.57 | | | | | 1,000 | | | | | 1,020.49 | + | | | | 4.42 | | | | | 1,000 | | | | | 1,018.60 | + | | | | 6.32 | |
| Class R | | | | | | | | | | | | | | | | | | | | | | | | | | | | | | | | | | | | | | | | | | | | | | | | | | | | | | | | | | | | | | | | | | | | | | | | | | | |
Actual | | | | 1,000 | | | | | 1,009.40 | | | | | 6.39 | | | | | 1,000 | | | | | 1,100.50 | | | | | 6.06 | | | | | 1,000 | | | | | 1,007.50 | | | | | 7.04 | | | | | 1,000 | | | | | 1,068.60 | | | | | 7.15 | | | | | 1,000 | | | | | 1,004.90 | | | | | 8.77 | |
Hypothetical 5% return | | | | 1,000 | | | | | 1,018.50 | + | | | | 6.42 | | | | | 1,000 | | | | | 1,019.10 | + | | | | 5.82 | | | | | 1,000 | | | | | 1,017.85 | + | | | | 7.07 | | | | | 1,000 | | | | | 1,017.95 | + | | | | 6.97 | | | | | 1,000 | | | | | 1,016.11 | + | | | | 8.82 | |
| Class R6 | | | | | | | | | | | | | | | | | | | | | | | | | | | | | | | | | | | | | | | | | | | | | | | | | | | | | | | | | | | | | | | | | | | | | | | | | | | |
Actual | | | | 1,000 | | | | | 1,012.40 | | | | | 3.20 | | | | | 1,000 | | | | | 1,103.50 | | | | | 2.88 | | | | | 1,000 | | | | | 1,010.50 | | | | | 3.80 | | | | | N/A | | | | | N/A | | | | | N/A | | | | | N/A | | | | | N/A | | | | | N/A | |
Hypothetical 5% return | | | | 1,000 | | | | | 1,021.68 | + | | | | 3.22 | | | | | 1,000 | | | | | 1,022.13 | + | | | | 2.77 | | | | | 1,000 | | | | | 1,021.08 | + | | | | 3.82 | | | | | N/A | | | | | N/A | | | | | N/A | | | | | N/A | | | | | N/A | | | | | N/A | |
| * | | Expenses are calculated using each Fund’s annualized net expense ratio for each class, which represents the ongoing expenses as a percentage of net assets for the six months ended June 30, 2016. Expenses are calculated by multiplying the annualized net expense ratio by the average account value for the period; then multiplying the result by the number of days in the most recent fiscal half year; and then dividing that result by the number of days in the fiscal year. The annualized net expense ratios for the period were as follows: |
| | | | | | | | | | | | | | | | | | | | | | | | |
| Fund | | Class A | | | Class C | | | Institutional | | | Class IR | | | Class R | | | Class R6 | |
Absolute Return Tracker | | | 1.03 | % | | | 1.78 | % | | | 0.63 | % | | | 0.78 | % | | | 1.28 | % | | | 0.64 | % |
Commodity Strategy | | | 0.91 | | | | 1.66 | | | | 0.57 | | | | 0.66 | | | | 1.16 | | | | 0.5 | |
Dynamic Allocation | | | 1.16 | | | | 1.91 | | | | 0.76 | | | | 0.91 | | | | 1.41 | | | | 0.76 | |
Dynamic Commodity | | | 1.14 | | | | 1.89 | | | | 0.8 | | | | 0.88 | | | | 1.39 | | | | N/A | |
Managed Futures Strategy | | | 1.51 | | | | 2.26 | | | | 1.19 | | | | 1.26 | | | | 1.76 | | | | N/A | |
| + | | Hypothetical expenses are based on each Fund’s actual annualized net expense ratios and an assumed rate of return of 5% per year before expenses. |
101
GOLDMAN SACHS SELECT SATELLITE FUNDS
Statement Regarding Basis for Approval of Management Agreement (Unaudited)
Background
The Goldman Sachs Absolute Return Tracker Fund, Goldman Sachs Commodity Strategy Fund, Goldman Sachs Dynamic Allocation Fund, Goldman Sachs Dynamic Commodity Strategy Fund, and Goldman Sachs Managed Futures Strategy Fund (the “Funds”) are investment portfolios of Goldman Sachs Trust (the “Trust”). The Board of Trustees oversees the management of the Trust and reviews the investment performance and expenses of the Funds at regularly scheduled meetings held throughout the year. In addition, the Board of Trustees determines annually whether to approve the continuance of the Trust’s investment management agreement (the “Management Agreement”) with Goldman Sachs Asset Management, L.P. (the “Investment Adviser”) on behalf of the Funds.
The Management Agreement was most recently approved for continuation until June 30, 2017 by the Board of Trustees, including those Trustees who are not parties to the Management Agreement or “interested persons” (as defined in the Investment Company Act of 1940, as amended) of any party thereto (the “Independent Trustees”), at a meeting held on June 15-16, 2016 (the “Annual Meeting”).
The review process undertaken by the Trustees spans the course of the year and culminates with the Annual Meeting. To assist the Trustees in their deliberations, the Trustees have established a Contract Review Committee (the “Committee”), comprised of the Independent Trustees. The Committee held three meetings over the course of the year since the Management Agreement was last approved. At those Committee meetings, regularly scheduled Board or other committee meetings, and/or the Annual Meeting, matters relevant to the renewal of the Management Agreement were considered by the Board, or the Independent Trustees, as applicable. With respect to each Fund, such matters included:
| | (a) | | the nature and quality of the advisory, administrative, and other services provided to the Fund by the Investment Adviser and its affiliates, including information about: |
| | (i) | | the structure, staff, and capabilities of the Investment Adviser and its portfolio management teams; |
| | (ii) | | the groups within the Investment Adviser and its affiliates that support the portfolio management teams or provide other types of necessary services, including fund services groups (e.g., accounting and financial reporting, tax, shareholder services, and operations); controls and risk management groups (e.g., legal, compliance, valuation oversight, credit risk management, internal audit, compliance testing, market risk analysis, finance, and central funding); sales and distribution support groups, and others (e.g., information technology and training); |
| | (iii) | | trends in employee headcount; |
| | (iv) | | the Investment Adviser’s financial resources and ability to hire and retain talented personnel and strengthen its operations; and |
| | (v) | | the parent company’s support of the Investment Adviser and its mutual fund business, as expressed by the firm’s senior management; |
102
GOLDMAN SACHS SELECT SATELLITE FUNDS
Statement Regarding Basis for Approval of Management Agreement (Unaudited) (continued)
| | (b) | | information on the investment performance of the Fund, including comparisons to the performance of similar mutual funds, as provided by a third-party mutual fund data provider engaged as part of the contract review process (the “Outside Data Provider”), a benchmark performance index, and a composite of accounts with comparable investment strategies managed by the Investment Adviser (in the case of the Dynamic Commodity Strategy Fund); and general investment outlooks in the markets in which the Fund invests; |
| | (c) | | information provided by the Investment Adviser indicating the Investment Adviser’s views on whether the Fund’s peer group and/or benchmark index had high, medium, or low relevance given the Fund’s particular investment strategy; |
| | (d) | | the terms of the Management Agreement and other agreements with affiliated service providers entered into by the Trust on behalf of the Fund; |
| | (e) | | fee and expense information for the Fund, including: |
| | (i) | | the relative management fee and expense levels of the Fund as compared to those of comparable funds managed by other advisers, as provided by the Outside Data Provider; |
| | (ii) | | the Fund’s expense trends over time; and |
| | (iii) | | to the extent the Investment Adviser manages other types of accounts (such as bank collective trusts, private wealth management accounts, institutional separate accounts, sub-advised mutual funds, and non-U.S. funds) having investment objectives and policies similar to those of the Fund, comparative information on the advisory fees charged and services provided to those accounts by the Investment Adviser; |
| | (f) | | with respect to the extensive investment performance and expense comparison data provided by the Outside Data Provider, its processes in producing that data for the Fund; |
| | (g) | | the undertaking of the Investment Adviser to waive certain fees (with respect to the Absolute Return Tracker and Dynamic Allocation Funds) and to limit certain expenses of the Fund that exceed a specified level; |
| | (h) | | information relating to the profitability of the Management Agreement and the transfer agency and distribution and service arrangements of the Fund and the Trust as a whole to the Investment Adviser and its affiliates; |
| | (i) | | whether the Fund’s existing management fee schedule adequately addressed any economies of scale; |
| | (j) | | a summary of the “fall-out” benefits derived by the Investment Adviser and its affiliates from their relationships with the Fund, including the fees received by the Investment Adviser’s affiliates from the Fund for transfer agency, portfolio trading, distribution and other services; |
| | (k) | | a summary of potential benefits derived by the Fund as a result of its relationship with the Investment Adviser; |
| | (l) | | information regarding commissions paid by the Fund and broker oversight, an update on the Investment Adviser’s soft dollars practices, other information regarding portfolio trading, and how the Investment Adviser carries out its duty to seek best execution; |
103
GOLDMAN SACHS SELECT SATELLITE FUNDS
Statement Regarding Basis for Approval of Management Agreement (Unaudited) (continued)
| | (m) | | portfolio manager ownership of Fund shares; the manner in which portfolio manager compensation is determined; and the number and types of accounts managed by the portfolio managers; |
| | (n) | | the nature and quality of the services provided to the Fund by its unaffiliated service providers, and the Investment Adviser’s general oversight and evaluation (including reports on due diligence) of those service providers as part of the administration services provided under the Management Agreement; and |
| | (o) | | the Investment Adviser’s processes and policies addressing various types of potential conflicts of interest; its approach to risk management; the annual review of the effectiveness of the Fund’s compliance program; and periodic compliance reports. |
The Trustees also received an overview of the Funds’ distribution arrangements. They received information regarding the Funds’ assets, share purchase and redemption activity, and payment of distribution and service fees. Information was also provided to the Trustees relating to revenue sharing payments made by and services provided by the Investment Adviser and its affiliates to intermediaries that promote the sale, distribution, and/or servicing of Fund shares. The Independent Trustees also discussed the broad range of other investment choices that are available to Fund investors, including the availability of comparable funds managed by other advisers.
The presentations made at the Board and Committee meetings and at the Annual Meeting encompassed the Funds and other mutual funds for which the Board of Trustees has responsibility. In evaluating the Management Agreement at the Annual Meeting, the Trustees relied upon their knowledge, resulting from their meetings and other interactions throughout the year, of the Investment Adviser and its affiliates, their services, and the Funds. In conjunction with these meetings, the Trustees received written materials and oral presentations on the topics covered, and the Investment Adviser addressed the questions and concerns of the Trustees, including concerns regarding the investment performance of certain of the funds they oversee. The Independent Trustees were advised by their independent legal counsel regarding their responsibilities and other regulatory requirements related to the approval and continuation of mutual fund investment management agreements under applicable law. In addition, the Investment Adviser and its affiliates provided the Independent Trustees with a written response to a formal request for information sent on behalf of the Independent Trustees by their independent legal counsel. During the course of their deliberations, the Independent Trustees met in executive sessions with their independent legal counsel, without representatives of the Investment Adviser or its affiliates present.
Nature, Extent, and Quality of the Services Provided Under the Management Agreement
As part of their review, the Trustees considered the nature, extent, and quality of the services provided to the Funds by the Investment Adviser. In this regard, the Trustees considered both the investment advisory services and non-advisory services that are provided by the Investment Adviser and its affiliates. The Trustees noted the transition in the leadership and changes in personnel of various of the Investment Adviser’s portfolio management teams that had occurred in recent periods, and the ongoing recruitment efforts aimed at bringing high quality investment talent to the Investment Adviser. They also noted the Investment Adviser’s commitment to maintaining high quality systems and expending substantial resources to respond to ongoing changes to
104
GOLDMAN SACHS SELECT SATELLITE FUNDS
Statement Regarding Basis for Approval of Management Agreement (Unaudited) (continued)
the regulatory and control environment in which the Funds and their service providers operate, as well as the efforts of the Investment Adviser and its affiliates to combat cyber security risks. The Trustees concluded that the Investment Adviser continued to commit substantial financial and operational resources to the Funds and expressed confidence that the Investment Adviser would continue to do so in the future. The Trustees also recognized that the Investment Adviser had made significant commitments to address regulatory compliance requirements applicable to the Funds and the Investment Adviser and its affiliates.
Investment Performance
The Trustees also considered the investment performance of the Funds. In this regard, they compared the investment performance of each Fund to its peers using rankings and (except with respect to the Dynamic Commodity Strategy Fund) ratings compiled by the Outside Data Provider as of December 31, 2015, and updated performance information prepared by the Investment Adviser using the peer group identified by the Outside Data Provider as of March 31, 2016. The information on each Fund’s investment performance was provided for the one-, three-, and five-year periods ending on the applicable dates, to the extent that each Fund had been in existence for those periods. The Trustees also reviewed each Fund’s investment performance relative to its performance benchmark. As part of this review, they considered the investment performance trends of the Funds over time, and reviewed the investment performance of each Fund in light of its investment objective and policies and market conditions. The Trustees also received information comparing the Dynamic Commodity Strategy Fund’s performance to that of a composite of accounts with comparable investment strategies managed by the Investment Adviser.
In addition, the Trustees considered materials prepared and presentations made by the Investment Adviser’s senior management and portfolio management personnel in which Fund performance was assessed. The Trustees also considered the Investment Adviser’s periodic reports with respect to the Funds’ risk profiles, and how the Investment Adviser’s approach to risk monitoring and management influences portfolio management. They noted the efforts of the Absolute Return Tracker, Dynamic Allocation, and Managed Futures Strategy Funds’ portfolio management team to continue to enhance the investment models used in managing the Funds.
The Trustees observed that the Absolute Return Tracker Fund’s Institutional Shares had placed in the top half of the Fund’s peer group for the one- and three-year periods and in the third quartile for the five-year period; had outperformed the Fund’s benchmark index for the one-, three-, and five-year periods; and had outperformed the average performance of a group of competitor funds, as determined by the Investment Adviser (the “Competitor Fund Average”), for the three- and five-year periods and had underperformed for the one-year period ended March 31, 2016. They observed that the Commodity Strategy Fund’s Institutional Shares had placed in the fourth quartile of the Fund’s peer group for the one-, three-, and five-year periods, and had outperformed the Fund’s benchmark index for the three- and five-year periods and underperformed for the one-year period ended March 31, 2016. The Trustees noted that the Dynamic Allocation Fund’s Institutional Shares had placed in the third quartile of the Fund’s peer group for the one-, three-, and five-year periods; had outperformed the Fund’s LIBOR-based benchmark index by 0.91% for the one-year period and had underperformed by 7.88% and 0.76%, respectively, for the three- and five-year periods; and had outperformed the Fund’s Competitor Fund Average for the three- and five-year periods and had underperformed for the one-year period ended March 31, 2016. They noted that the Dynamic Allocation Fund had certain significant differences from the
105
GOLDMAN SACHS SELECT SATELLITE FUNDS
Statement Regarding Basis for Approval of Management Agreement (Unaudited) (continued)
Fund’s benchmark index that caused it to be an imperfect basis for comparison. They noted that the Dynamic Commodity Strategy Fund’s Institutional Shares had placed in the second quartile of the Fund’s peer group and had outperformed the Fund’s benchmark index for the one-year period ended March 31, 2016. The Trustees noted that the Managed Futures Strategy Fund’s Institutional Shares had placed in the top half of the Fund’s peer group for the one-year period and in the third quartile for the three-year period; had outperformed the Fund’s LIBOR-based benchmark index by 0.60% and 1.23%, respectively, for the one- and three-year periods; and had outperformed the Fund’s Competitor Fund Average for the three-year period and had underperformed for the one-year period ended March 31, 2016. They also noted that the Absolute Return Tracker, Dynamic Allocation, and Managed Futures Strategy Funds had experienced certain portfolio management changes in 2015.
Costs of Services Provided and Competitive Information
The Trustees considered the contractual terms of the Management Agreement and the fee rates payable by each Fund thereunder. In this regard, the Trustees considered information on the services rendered by the Investment Adviser to the Funds, which included both advisory and administrative services that were directed to the needs and operations of the Funds as registered mutual funds.
In particular, the Trustees reviewed analyses prepared by the Outside Data Provider regarding the expense rankings of the Funds. The analyses provided a comparison of each Fund’s management fee and breakpoints to those of a relevant peer group and category universe; an expense analysis which compared each Fund’s overall net and gross expenses to a peer group and a category universe; and a five-year history (or, in the case of Funds that commenced investment operations within a shorter period, since the year in which it commenced operations) comparing each Fund’s net expenses to the peer and category medians. The analyses also compared each Fund’s transfer agency, custody, and distribution fees, other expenses and fee waivers/reimbursements to those of the peer group and category medians. The Trustees concluded that the comparisons provided by the Outside Data Provider were useful in evaluating the reasonableness of the management fees and total expenses paid by the Funds.
In addition, the Trustees considered the Investment Adviser’s undertaking to waive a portion of its management fees (with respect to the Absolute Return Tracker and Dynamic Allocation Funds) and to limit certain expenses of the Funds that exceed specified levels. The Trustees noted that the Investment Adviser had agreed to waive a portion of its management fee in an amount equal to the entire management fee paid to the Investment Adviser as the investment adviser to each Fund’s wholly-owned subsidiary. The Trustees also noted that certain changes were being made to existing fee waiver or expense limitation arrangements of the Managed Futures Strategy Fund that would have the effect of increasing total Fund expenses, with such changes taking effect in connection with the Fund’s next annual registration statement update. They also considered, to the extent that the Investment Adviser manages other types of accounts having investment objectives and policies similar to those of the Funds, comparative fee information for services provided by the Investment Adviser to those accounts, and information that indicated that services provided to the Funds differed in various significant respects from the services provided to other types of accounts which, in many cases, operated under less stringent legal and regulatory structures, required fewer services from the Investment Adviser to a smaller number of client contact points, and were less time-sensitive.
106
GOLDMAN SACHS SELECT SATELLITE FUNDS
Statement Regarding Basis for Approval of Management Agreement (Unaudited) (continued)
In addition, the Trustees noted that shareholders are able to redeem their Fund shares at any time if shareholders believe that the Fund fees and expenses are too high or if they are dissatisfied with the performance of the Fund.
Profitability
The Trustees reviewed the Investment Adviser’s revenues and pre-tax profit margins with respect to the Trust and each of the Funds. In this regard the Trustees noted that they had received, among other things, profitability analyses and summaries, revenue and expense schedules by Fund and by function (i.e., investment management, transfer agency and distribution and service), and information on the Investment Adviser’s expense allocation methodology. They observed that the profitability and expense figures are substantially similar to those used by the Investment Adviser for many internal purposes, including compensation decisions among various business groups, and are thus subject to a vigorous internal debate about how certain revenue and expenses should be allocated. The Trustees also noted that the internal audit group within the Goldman Sachs organization had audited the expense allocation methodology and was satisfied with the reasonableness, consistency, and accuracy of the Investment Adviser’s expense allocation methodology and profitability analysis calculations. Profitability data for the Trust and each Fund were provided for 2015 and 2014, and the Trustees considered this information in relation to the Investment Adviser’s overall profitability. The Trustees considered the Investment Adviser’s revenues and pre-tax profit margins both in absolute terms and in comparison to information on the reported pre-tax profit margins earned by certain other asset management firms.
Economies of Scale
The Trustees considered the information that had been provided regarding the Investment Adviser’s profitability. The Trustees also considered the breakpoints in the fee rate payable under the Management Agreement for each of the Funds at the following annual percentage rates of the average daily net assets of the Funds:
| | | | | | | | | | | | | | | | | | | | |
| | | Absolute
Return
Tracker Fund | | | Commodity
Strategy Fund | | | Dynamic
Allocation
Fund | | | Dynamic
Commodity
Strategy Fund | | | Managed
Futures
Strategy
Fund | |
| First $1 billion | | | 1.15 | % | | | 0.50 | % | | | 0.90 | % | | | 0.80 | % | | | 1.00 | % |
| Next $1 billion | | | 1.04 | | | | 0.50 | | | | 0.81 | | | | 0.80 | | | | 0.90 | |
| Next $3 billion | | | 0.99 | | | | 0.45 | | | | 0.77 | | | | 0.72 | | | | 0.86 | |
| Next $3 billion | | | 0.97 | | | | 0.43 | | | | 0.75 | | | | 0.68 | | | | 0.84 | |
| Over $8 billion | | | 0.95 | | | | 0.42 | | | | 0.74 | | | | 0.67 | | | | 0.82 | |
The Trustees noted that the breakpoints were designed to share potential economies of scale, if any, with the Funds and their shareholders as assets under management reach those asset levels. The Trustees considered the amounts of assets in the Funds; the Funds’ recent share purchase and redemption activity; the information provided by the Investment Adviser relating to the costs of the services provided by the Investment Adviser and its affiliates and their realized profits; information comparing fee rates charged by the Investment Adviser with fee rates charged to other funds in the peer groups; and the Investment Adviser’s undertaking to waive a portion of its management fees (with respect to the Absolute Return Tracker and Dynamic Allocation
107
GOLDMAN SACHS SELECT SATELLITE FUNDS
Statement Regarding Basis for Approval of Management Agreement (Unaudited) (continued)
Funds and to limit certain expenses of the Funds that exceed specified levels. Upon reviewing these matters at the Annual Meeting, the Trustees concluded that the fee breakpoints represented a means of assuring that benefits of scalability, if any, would be passed along to shareholders at the specified asset levels. They also noted that the Investment Adviser had passed along savings to shareholders of the Absolute Return Tracker Fund, which had asset levels above at least the first breakpoint during the prior fiscal year.
Other Benefits to the Investment Adviser and Its Affiliates
The Trustees also considered the other benefits derived by the Investment Adviser and its affiliates from their relationships with the Funds as stated above, including: (a) transfer agency fees received by Goldman, Sachs & Co. (“Goldman Sachs”); (b) brokerage and futures commissions earned by Goldman Sachs for executing securities and futures transactions on behalf of the Funds; (c) trading efficiencies resulting from aggregation of orders of the Funds with those for other funds or accounts managed by the Investment Adviser; (d) the Investment Adviser’s ability to leverage the infrastructure designed to service the Funds on behalf of its other clients; (e) the Investment Adviser’s ability to cross-market other products and services to Fund shareholders; (f) Goldman Sachs’ retention of certain fees as Fund Distributor; (g) the Investment Adviser’s ability to negotiate better pricing with custodians on behalf of its other clients, as a result of the relationship with the Funds; and (h) the possibility that the working relationship between the Investment Adviser and the Funds’ third-party service providers may cause those service providers to be more likely to do business with other areas of Goldman Sachs. In the course of considering the foregoing, the Independent Trustees requested and received further information quantifying certain of these fall-out benefits.
Other Benefits to the Funds and Their Shareholders
The Trustees also noted that the Funds receive certain potential benefits as a result of their relationship with the Investment Adviser, including: (a) trading efficiencies resulting from aggregation of orders of the Funds with those of other funds or accounts managed by the Investment Adviser; (b) enhanced servicing from vendors because of the volume of business generated by the Investment Adviser and its affiliates; (c) enhanced servicing from broker-dealers because of the volume of business generated by the Investment Adviser and its affiliates; (d) the Investment Adviser’s ability to negotiate favorable terms with derivatives counterparties on behalf of the Funds as a result of the size and reputation of the Goldman Sachs organization; (e) the Investment Adviser’s knowledge and experience gained from managing other accounts and products; (f) the Investment Adviser’s ability to hire and retain qualified personnel to provide services to the Funds because of the reputation of the Goldman Sachs organization; (g) the Funds’ access, through the Investment Adviser, to certain firmwide resources (e.g., proprietary risk management systems and databases), subject to certain restrictions; and (h) the Funds’ access to certain affiliated distribution channels. In addition, the Trustees noted the competitive nature of the mutual fund marketplace, and considered that many of the Funds’ shareholders invested in the Funds in part because of the Funds’ relationship with the Investment Adviser and that those shareholders have a general expectation that the relationship will continue.
Conclusion
In connection with their consideration of the Management Agreement, the Trustees gave weight to each of the factors described above, but did not identify any particular factor as controlling their decision. After deliberation and consideration of all of the information provided, including the factors described above, the Trustees concluded, in the exercise of their business judgment, that the management fees paid by each of the Funds were reasonable in light of the services provided to it by the Investment Adviser, the Investment Adviser’s costs and each Fund’s current and reasonably foreseeable asset levels. The Trustees unanimously concluded that the Investment Adviser’s continued management likely would benefit each Fund and its shareholders and that the Management Agreement should be approved and continued with respect to each Fund until June 30, 2017.
108
FUNDS PROFILE
Goldman Sachs Funds

Goldman Sachs is a premier financial services firm, known since 1869 for creating thoughtful and customized investment solutions in complex global markets.
Today, the Investment Management Division of Goldman Sachs serves a diverse set of clients worldwide, including private institutions, public entities and individuals. With approximately $1.12 trillion in assets under supervision as of June 30, 2016, Goldman Sachs Asset Management (“GSAM”) has portfolio management teams located around the world and our investment professionals bring firsthand knowledge of local markets to every investment decision. Assets under supervision includes assets under management and other client assets for which Goldman Sachs does not have full discretion. GSAM leverages the resources of Goldman, Sachs & Co. subject to legal, internal and regulatory restrictions.

Money Market1
Financial Square FundsSM
| n | | Financial Square Treasury Solutions Fund2 |
| n | | Financial Square Government Fund |
| n | | Financial Square Money Market Fund |
| n | | Financial Square Prime Obligations Fund |
| n | | Financial Square Treasury Instruments Fund |
| n | | Financial Square Treasury Obligations Fund |
| n | | Financial Square Federal Instruments Fund |
| n | | Financial Square Tax-Exempt Money Market Fund |
Investor FundsSM
| n | | Investor Money Market Fund |
| n | | Investor Tax-Exempt Money Market Fund3 |
Fixed Income
Short Duration and Government
| n | | High Quality Floating Rate Fund |
| n | | Short-Term Conservative Income Fund4 |
| n | | Short Duration Government Fund |
| n | | Short Duration Income Fund |
| n | | Inflation Protected Securities Fund |
Multi-Sector
Municipal and Tax-Free
| n | | High Yield Municipal Fund |
| n | | Dynamic Municipal Income Fund |
| n | | Short Duration Tax-Free Fund |
Single Sector
| n | | Investment Grade Credit Fund |
| n | | High Yield Floating Rate Fund |
| n | | Emerging Markets Debt Fund |
| n | | Local Emerging Markets Debt Fund |
| n | | Dynamic Emerging Markets Debt Fund |
Fixed Income Alternatives
| n | | Long Short Credit Strategies Fund |
| n | | Fixed Income Macro Strategies Fund |
Fundamental Equity
| n | | Small/Mid Cap Value Fund |
| n | | Small/Mid Cap Growth Fund |
| n | | Flexible Cap Growth Fund |
| n | | Concentrated Growth Fund |
| n | | Technology Opportunities Fund5 |
| n | | Growth Opportunities Fund |
| n | | Rising Dividend Growth Fund |
| n | | Dynamic U.S. Equity Fund |
Tax-Advantaged Equity
| n | | U.S. Tax-Managed Equity Fund |
| n | | International Tax-Managed Equity Fund |
| n | | U.S. Equity Dividend and Premium Fund |
| n | | International Equity Dividend and Premium Fund |
Equity Insights
| n | | Small Cap Equity Insights Fund |
| n | | U.S. Equity Insights Fund |
| n | | Small Cap Growth Insights Fund |
| n | | Large Cap Growth Insights Fund |
| n | | Large Cap Value Insights Fund |
| n | | Small Cap Value Insights Fund |
| n | | International Small Cap Insights Fund6 |
| n | | International Equity Insights Fund |
| n | | Emerging Markets Equity Insights Fund |
Fundamental Equity International
| n | | Strategic International Equity Fund |
| n | | Focused International Equity Fund |
| n | | Emerging Markets Equity Fund7 |
Select Satellite8
| n | | Real Estate Securities Fund |
| n | | International Real Estate Securities Fund |
| n | | Commodity Strategy Fund |
| n | | Global Real Estate Securities Fund |
| n | | Dynamic Commodity Strategy Fund |
| n | | Dynamic Allocation Fund |
| n | | Absolute Return Tracker Fund |
| n | | Managed Futures Strategy Fund |
| n | | MLP Energy Infrastructure Fund |
| n | | Multi-Manager Alternatives Fund |
| n | | Multi-Asset Real Return Fund |
| n | | Absolute Return Multi-Asset Fund |
| n | | Global Infrastructure Fund |
Total Portfolio Solutions8
| n | | Global Managed Beta Fund |
| n | | Multi-Manager Non-Core Fixed Income Fund |
| n | | Multi-Manager U.S. Dynamic Equity Fund |
| n | | Multi-Manager Global Equity Fund |
| n | | Multi-Manager International Equity Fund |
| n | | Tactical Tilt Overlay Fund9 |
| n | | Balanced Strategy Portfolio |
| n | | Multi-Manager U.S. Small Cap Equity Fund |
| n | | Multi-Manager Real Assets Strategy Fund |
| n | | Growth and Income Strategy Portfolio |
| n | | Growth Strategy Portfolio |
| n | | Equity Growth Strategy Portfolio |
| n | | Satellite Strategies Portfolio |
| n | | Enhanced Dividend Global Equity Portfolio |
| n | | Tax Advantaged Global Equity Portfolio |
| n | | Strategic Factor Allocation Fund |
| 1 | | An investment in a money market portfolio is not insured or guaranteed by the Federal Deposit Insurance Corporation or any other government agency. Although a money market portfolio seeks to preserve the value of an investment at $1.00 per share, it is possible to lose money by investing in a money market portfolio. The Fund’s sponsor has no legal obligation to provide financial support to a money market portfolio, and you should not expect that the sponsor will provide financial support to the money market portfolio at any time. |
| 2 | | Effective on September 30, 2015, the Goldman Sachs Financial Square Federal Fund was renamed the Goldman Sachs Financial Square Treasury Solutions Fund. |
| 3 | | Effective on March 31, 2016, the Goldman Sachs Financial Square Tax-Free Money Market Fund was renamed the Goldman Sachs Investor Tax-Exempt Money Market Fund. |
| 4 | | Effective on July 29, 2016, the Goldman Sachs Limited Maturity Obligations Fund was renamed the Goldman Sachs Short-Term Conservative Income Fund. |
| 5 | | Effective on July 31, 2015, the Goldman Sachs Technology Tollkeeper Fund was renamed the Goldman Sachs Technology Opportunities Fund. |
| 6 | | Effective at the close of business on February 5, 2016, the Goldman Sachs International Small Cap Fund was reorganized with and into the Goldman Sachs International Small Cap Insights Fund. |
| 7 | | Effective at the close of business on October 23, 2015, the Goldman Sachs BRIC Fund (Brazil, Russia, India, China) was reorganized with and into the Goldman Sachs Emerging Markets Equity Fund. |
| 8 | | Individual Funds within the Total Portfolio Solutions and Select Satellite categories will have various placement on the risk/return spectrum and may have greater or lesser risk than that indicated by the placement of the general Total Portfolio Solutions or Select Satellite category. |
| 9 | | Effective on June 1, 2016, the Goldman Sachs Tactical Tilt Implementation Fund was renamed the Goldman Sachs Tactical Tilt Overlay Fund. |
Financial Square FundsSM and Investor FundsSM are registered service marks of Goldman, Sachs & Co.
| * | | This list covers open-end funds only. Please visit our website at www.GSAMFUNDS.com to learn about our closed-end funds and exchange-traded funds. |
| | |
TRUSTEES Ashok N. Bakhru, Chairman Kathryn A. Cassidy Diana M. Daniels Herbert J. Markley James A. McNamara Jessica Palmer Alan A. Shuch Roy W. Templin Gregory G. Weaver | | OFFICERS James A. McNamara, President Scott M. McHugh, Principal Financial Officer, Senior Vice President, and Treasurer Caroline L. Kraus, Secretary |
| |
GOLDMAN, SACHS & CO. Distributor and Transfer Agent | | GOLDMAN SACHS ASSET MANAGEMENT, L.P. Investment Adviser |
Visit our web site at www.GSAMFUNDS.com to obtain the most recent month-end returns.
Goldman Sachs Asset Management, L.P. 200 West Street, New York, New York 10282
Economic and market forecasts presented herein reflect our judgment as of the date of this presentation and are subject to change without notice. These forecasts do not take into account the specific investment objectives, restrictions, tax and financial situation or other needs of any specific client. Actual data will vary and may not be reflected here. These forecasts are subject to high levels of uncertainty that may affect actual performance. Accordingly, these forecasts should be viewed as merely representative of a broad range of possible outcomes. These forecasts are estimated, based on assumptions, and are subject to significant revision and may change materially as economic and market conditions change. Goldman Sachs has no obligation to provide updates or changes to these forecasts. Case studies and examples are for illustrative purposes only.
The portfolio risk management process includes an effort to monitor and manage risk, but does not imply low risk.
The reports concerning the Funds included in this shareholder report may contain certain forward-looking statements about the factors that may affect the performance of the Funds in the future. These statements are based on Fund management’s predictions and expectations concerning certain future events and their expected impact on the Funds, such as performance of the economy as a whole and of specific industry sectors, changes in the levels of interest rates, the impact of developing world events, and other factors that may influence the future performance of the Funds. Management believes these forward-looking statements to be reasonable, although they are inherently uncertain and difficult to predict. Actual events may cause adjustments in portfolio management strategies from those currently expected to be employed.
A description of the policies and procedures that the Funds use to determine how to vote proxies relating to portfolio securities and information regarding how a Fund voted proxies relating to portfolio securities during the most recent 12-month period ended June 30 is available (i) without charge, upon request by calling 1-800-526-7384 (for Retail Shareholders) or 1-800-621-2550 (for Institutional Shareholders); and (ii) on the Securities and Exchange Commission (“SEC”) web site at http://www. sec.gov.
The Global Industry Classification Standard (GICS) was developed by and is the exclusive property and a service mark of Morgan Stanley Capital International Inc. (MSCI) and Standard & Poor’s, a division of The McGraw-Hill Companies, Inc. (S&P) and is licensed for use by Goldman Sachs. Neither MSCI, S&P nor any other party involved in making or compiling the GICS or any GICS classifications makes any express or implied warranties or representations with respect to such standard or classification (or the results to be obtained by the use thereof), and all such parties hereby expressly disclaim all warranties of originality, accuracy, completeness, merchantability or fitness for a particular purpose with respect to any of such standard or classification. Without limiting any of the foregoing, in no event shall MSCI, S&P, any of their affiliates or any third party involved in making or compiling the GICS or any GICS classifications have any liability for any direct, indirect, special, punitive, consequential or any other damages (including lost profits) even if notified of the possibility of such damages.
The Funds file their complete schedule of portfolio holdings with the SEC for the first and third quarters of each fiscal year on Form N-Q. The Funds’ Form N-Qs are available on the SEC’s web site at http://www.sec.gov within 60 days after the Funds’ first and third fiscal quarters. The Funds’ Form N-Qs may be reviewed and copied at the SEC’s Public Reference Room in Washington, D.C., and information on the operation of the Public Reference Room may also be obtained by calling 1-800-SEC-0330. Form N-Qs may be obtained upon request and without charge by calling 1-800-526-7384 (for Retail Shareholders) or 1-800-621-2550 (for Institutional Shareholders).
Holdings and allocations shown are as of June 30, 2016 and may not be representative of future investments. Fund holdings should not be relied on in making investment decisions and should not be construed as research or investment advice regarding particular securities. Current and future holdings are subject to risk.
This material is not authorized for distribution to prospective investors unless preceded or accompanied by a current Prospectus or summary prospectus, if applicable. Investors should consider a Fund’s objective, risks, and charges and expenses, and read the summary prospectus, if available, and/or the Prospectus carefully before investing or sending money. The summary prospectus, if available, and the Prospectus contain this and other information about a Fund and may be obtained from your Authorized Institution or from Goldman, Sachs & Co. by calling (retail – 1-800-526-7384) (institutional – 1-800-621-2550).
© 2016 Goldman Sachs. All rights reserved. 59104-TMPL-08/2016 SELSATSAR-16 / 31K
Goldman Sachs Funds

| | | | |
| | |
| Semi-Annual Report | | | | June 30, 2016 |
| | |
| | | | Real Estate Securities Funds |
| | | | Global Real Estate Securities |
| | | | International Real Estate Securities |
| | | | Real Estate Securities |

Goldman Sachs Real Estate Securities Funds
| n | | GLOBAL REAL ESTATE SECURITIES |
| n | | INTERNATIONAL REAL ESTATE SECURITIES |
| | | | |
TABLE OF CONTENTS | | | | |
| |
Portfolio Management Discussions and Performance Summaries | | | 1 | |
| |
Index Definitions | | | 20 | |
| |
Schedules of Investments | | | 21 | |
| |
Financial Statements | | | 26 | |
| |
Financial Highlights | | | 30 | |
| |
Notes to Financial Statements | | | 36 | |
| |
Other Information | | | 48 | |
| | | | |
| | | |
| NOT FDIC-INSURED | | May Lose Value | | No Bank Guarantee |
GOLDMAN SACHS REAL ESTATE SECURITIES FUNDS
What Differentiates the Goldman Sachs
Real Estate Securities Investment Process?
The Goldman Sachs Global Real Estate Securities, International Real Estate Securities and Real Estate Securities Funds seek to generate long-term growth of capital and dividend income by investing primarily in real estate industry companies, including REITs, on an international or domestic basis, respectively. REITs which offer daily liquidity have historically strong returns, low volatility and low correlation to traditional asset classes.
Goldman Sachs’ Real Estate Securities Investment Process

Buy high quality companies.
We seek to purchase those companies that combine strong market exposures, management teams, capital structures and growth prospects.
Buy at a reasonable price.
We seek to consistently select securities that are trading at discounts to their intrinsic value.
Diversification reduces risk.
We seek to diversify the portfolio holdings based on property type and geographic markets to manage risk without compromising returns.

Team Based:
Portfolio decisions are made by the entire team.
Continuous Scrutiny:
Market, industry and company developments are reviewed daily.
Fundamental Analysis:
Portfolio holdings are determined by the risk/reward characteristics of an issuer and the team’s conviction in the overall business and management’s ability to create value.

Real estate securities portfolio that:
| n | | is a high quality portfolio that is strategically positioned for long-term growth potential |
| n | | is a result of bottom-up stock selection with a focus on long-term investing |
1
PORTFOLIO RESULTS
Goldman Sachs Global Real Estate Securities Fund
Investment Objective
The Fund seeks total return comprised of long-term growth of capital and dividend income.
Portfolio Management Discussion and Analysis
The Goldman Sachs Global Real Estate Securities Fund (the “Fund’) launched on August 31, 2015. Below, the Goldman Sachs Real Estate Securities Investment Team discusses the Fund’s performance and positioning for the six-month period ended June 30, 2016 (the “Reporting Period”).
| Q | | How did the Fund perform during the Reporting Period? |
| A | | During the Reporting Period, the Fund’s Class A, C, Institutional, IR, R and R6 Shares generated cumulative total returns, without sales charges, of 6.19%, 5.84%, 6.39%, 6.31%, 5.98% and 6.39%, respectively. These returns compare to the 9.38% cumulative total return of the Fund’s benchmark, the FTSE EPRA/NAREIT Developed Index (total return, Gross USD, unhedged) (the “FTSE Index”) during the same period. |
| Q | | What economic and market factors most influenced the global real estate securities market as a whole during the Reporting Period? |
| A | | For the Reporting Period overall, the global real estate securities market, as measured by the FTSE Index, gained 9.38%. Despite volatility driven by global macroeconomic concerns, U.S. real estate investment trusts (“REITs”) outperformed broader U.S. equities during the first half of 2016, as investors appreciated the asset class’ healthy operating fundamentals. At the company level, limited new supply across most property types, stable demand, and an accommodative financing environment provided a supportive backdrop for the asset class. Internationally, accommodative global monetary policies were supportive of the real estate securities market. |
| | Canada and Australia were the top performing markets within the FTSE Index, while the U.K. was by far the weakest performer. Canada benefited from a rebound in commodity prices, and both Canada and Australia benefited from relatively stable rental rates and positive yield outlooks. For much of the Reporting Period, investors were cautious on the U.K. given concerns about the then-upcoming referendum about membership in the European Union, popularly known as the Brexit vote, and the uncertainty that referendum had created for businesses. Then, after the late-June 2016 vote, investors were surprised by the outcome of the U.K.’s Brexit vote to leave the European Union, driving its real estate securities market down further. |
| Q | | What key factors were responsible for the Fund’s performance during the Reporting Period? |
| A | | The Fund underperformed the FTSE Index during the Reporting Period. Stock selection in the U.K. and Canada contributed positively. Having an underweighted allocation to the U.K., the worst performer in the FTSE Index during the Reporting Period, also buoyed relative results. Offsetting these positive contributors was stock selection in the United States (U.S.), Japan and Continental Europe, which detracted most from the Fund’s relative results. Having a modestly overweighted allocation to Japan, which lagged the FTSE Index during the Reporting Period, and having a position in cash when the FTSE Index rallied also hurt performance. |
| Q | | What were some of the Fund’s best-performing individual holdings? |
| A | | Data center provider CyrusOne was the top positive contributor to the Fund’s performance. At the end of February 2016, its shares gained after CyrusOne reported fourth quarter 2015 earnings that exceeded consensus expectations. Later in the first quarter of 2016, the company announced plans to acquire a data center facility from CME Group, which we believe should be accretive to shareholder value. In addition, investors were constructive on its management’s description of a five-year plan to double both revenue and earnings before interest, taxes, depreciation and amortization (“EBITDA”). At the beginning of May 2016, CyrusOne reported first quarter 2016 results that were better than consensus expectations and raised the company’s full-year guidance. In our view, as cloud-based technology gains momentum, enterprises and cloud service providers will likely be required to lease additional space at data |
2
PORTFOLIO RESULTS
| | centers. As a result, we believe CyrusOne is likely to benefit from continued demand growth. In addition, at the end of the Reporting Period, we viewed the strength of CyrusOne’s sales force and customer penetration among Fortune 1000 companies as meaningful competitive advantages. We were also optimistic on the company’s opportunity to increasingly provide its services to small and mid-size customers. Overall, at the end of the Reporting Period, we believed its stock presented a compelling risk/reward opportunity given what we view as its prospects for future growth. |
| | A position in Japan Retail Fund Investment, a large Japan-based retail REIT, was also a top contributor to the Fund’s relative returns during the Reporting Period. Its shares gained after the Bank of Japan introduced negative interest rates at the end of January 2016. Despite market volatility seen during the Reporting Period and despite a gradual strengthening of the Japanese yen, each of which typically has an adverse effect on the sector, Japanese REITs, known as J-REITs, appreciated broadly given what many consider to be their attractive relative yield and ability to provide income in a lower yielding, uncertain environment. Indeed, this dynamic led to strong performance for large-cap J-REITs and in particular for Japan Retail Fund Investment during the Reporting Period. Overall, we remained positive at the end of the Reporting Period on the increase in investor demand for J-REITs, and we continued to be confident in Japan Retail Fund Investment’s high quality management team and portfolio of assets. However, following the stock’s substantial gains, its shares reached our price target, and so we exited the position in favor of opportunities where we saw greater risk-adjusted return potential. |
| Q | | Which positions detracted significantly from the Fund’s performance during the Reporting Period? |
| A | | Hongkong Land Holdings, an owner and operator of office properties in Hong Kong, was the top detractor from the Fund’s results during the Reporting Period. Its shares declined largely due to concerns about the potential for cost rationalization to drive tenants from offices in central Hong Kong to offices located in the fringe areas of the city. Despite these concerns, at the end of the Reporting Period, we remained constructive on our outlook for rental rates and occupancy levels in the Hong Kong central business district. Additionally, we believe Hongkong Land Holdings is supported by the potential for meaningful pricing power given what we see as the strength of the company’s assets. Lastly, we remained positive on the company’s management team as well as, in our view, its distinguished status in the industry, earned from more than a century of dedicated focus on real estate operations. |
| | Hammerson, a mall-owning REIT, was also a top detractor from the Fund’s performance during the Reporting Period. With the majority of its portfolio being located in the U.K. (with the remainder in France), Hammerson fell victim to the widespread selloff in the U.K. real estate securities market amidst the Brexit vote in late June 2016, which caused economic uncertainty and thus impacted stocks levered to the economy. We believe the mall subsector is not as exposed to tenant relocation as some of the other sectors in the U.K. REIT space. |
| Q | | How did the Fund use derivatives and similar instruments during the Reporting Period? |
| A | | The Fund did not use derivatives during the Reporting Period. |
| Q | | Did the Fund make any significant purchases or sales during the Reporting Period? |
| A | | We initiated a Fund position in Orix J-REIT, a diversified Japanese holding company. In our view, at the time of purchase, Orix J-REIT was reasonably valued based on our forward growth expectations for the company. Additionally, we are constructive on the company’s management team, and we have been encouraged by its focus on improving the company’s portfolio of assets. |
| | We established a Fund position in Sumitomo Realty & Development, a Japan-based owner and developer of houses and condominiums. The company released its full fiscal year earnings in early May 2016 with revised earnings guidance for the next two years showing a more modest growth rate compared to its peers. Its lower growth guidance was generally attributed to its management’s conservative stance, including no rental growth for the subsector. We expect Sumitomo Realty to handily exceed its own expectations and to deliver its above-peer return on equity for the next one to two years. |
| | In addition to the sale of Japan Retail Fund Investment, already mentioned, we sold the Fund’s position in Mitsui Fudosan during the Reporting Period. We had originally initiated the position in Mitsui Fudosan as we believed the company was well positioned to benefit from its Tokyo-based developments. Occupancy recovery and demand growth in the Japanese office market had been rather steady. However, following a broad pullback in Japanese C corporations, we eliminated the Fund’s position in Mitsui Fudosan and reallocated assets to ideas where we had higher conviction. |
3
PORTFOLIO RESULTS
| | (A C corporation is a legal structure that businesses can choose to organize themselves under to limit their owners’ legal and financial liabilities. C corporations are an alternative to S corporations, where profits pass through to owners and are only taxed at the individual level, and limited liability companies, which provide the legal protections of corporations but are taxed like sole proprietorships.) |
| Q | | Were there any changes made in the Fund’s investment strategy during the Reporting Period? |
| A | | In constructing the Fund’s portfolio, we focus on picking securities rather than on making regional, country or subsector bets. We seek to outpace the benchmark index by overweighting stocks that we expect to outperform and underweighting those that we think may lag. Consequently, changes in its regional or subsector weights are generally the direct result of individual stock selection or of real estate securities’ appreciation or depreciation. That said, the Fund’s exposure to Continental Europe increased relative to the FTSE Index during the Reporting Period and its relative exposures to the U.K. and U.S. decreased. We also eliminated the Fund’s position in China during the Reporting Period, which is not a component of the FTSE Index. |
| Q | | How was the Fund positioned relative to its benchmark index at the end of the Reporting Period? |
| A | | From a country perspective, the Fund was not overweighted relative to the FTSE Index in any real estate market and was underweighted relative to the FTSE Index only in the U.S. The Fund was rather neutrally weighted compared to the FTSE Index in the other constituent countries of the FTSE Index at the end of June 2016. |
| Q | | What is the Fund’s tactical view and strategy for the months ahead? |
| A | | At the end of the Reporting Period, we believed that global REITs can continue to generate positive returns during the second half of 2016 given reasonable demand in most subsectors and the industry’s overall favorable supply picture. |
| | In the U.S., while new supply is growing due to the attractive spread, or differential, between development yields and cap rates, it is still below demand, and we believe this could lead to further increases in occupancy levels and rental rates as well as higher re-leasing spreads on expiring leases. (Cap rate, or capitalization rate, is a rate of return on a real estate investment property based on the expected income that the property will generate. Capitalization rate is used to estimate the investor’s potential return on his or her investment.) In our view, this encouraging fundamental backdrop coupled with both a solid financing environment and a healthy transaction market could support additional gains by the REIT asset class. Furthermore, we believed at the end of the Reporting Period that a number of U.S. REITs were trading below their private market values, presenting management teams with a variety of strategic options to increase shareholder value. Separately, while we do expect interest rates to gradually move higher in the U.S., they remain low by historical standards, and we believe investors will likely continue to appreciate the yield and growth attributes of the REIT asset class. Unlike fixed income, the majority of REITs operate dynamic businesses, which can still create value and growth even with rising interest rates. |
| | Outside of the U.S., policy makers and central bankers have enacted supportive measures to sustain growth and combat low inflation, in our view. We believe this dynamic may well continue through the second half of 2016, and consequently, it is our opinion that interest rates in many developed and emerging markets could remain low for an extended period of time. In our view, this favorable backdrop can benefit REITs in securing financing and deploying capital towards high quality projects, which could potentially drive future growth. In addition, the subdued environment in 2015 kept new real estate development at lower levels, leading the consensus to a rather stable yield and growth outlook for the asset class going forward. |
| | As fundamental, bottom-up investors, we believe we are seeing opportunities that go beyond the headline risks associated with certain regions. We intend to continue to focus our approach on those companies that have well-capitalized balance sheets and that possess quality attributes, such as a robust business model, a high quality asset exposure and a strong management team with a sound reinvestment strategy. Overall, we believe that global REITs can continue to offer attractive risk-adjusted returns, relative to fixed income in particular, given their potential yield, diversification and inflation hedge benefits. |
4
FUND BASICS
Global Real Estate Securities Fund
as of June 30, 2016
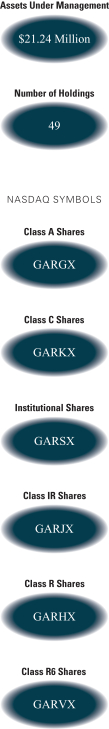
| | | | | | | | | | |
| | PERFORMANCE REVIEW | |
| | | January 1, 2016–June 30, 2016 | | Fund Total Return
(based on NAV)1 | | | FTSE EPRA-NAREIT Developed Index
(Gross, USD, Unhedged)2 | |
| | Class A | | | 6.19 | % | | | 9.38 | % |
| | Class C | | | 5.84 | | | | 9.38 | |
| | Institutional | | | 6.39 | | | | 9.38 | |
| | Class IR | | | 6.31 | | | | 9.38 | |
| | Class R | | | 5.98 | | | | 9.38 | |
| | | Class R6 | | | 6.39 | | | | 9.38 | |
| | 1 | | The net asset value (“NAV”) represents the net assets of the class of the Fund (ex-dividend) divided by the total number of shares of the class outstanding. The Fund’s performance reflects the reinvestment of dividends and other distributions. The Fund’s performance does not reflect the deduction of any applicable sales charges. |
| | 2 | | The FTSE EPRA/NAREIT Developed Index is designed to measure the stock performance of companies engaged in specific real estate activities of the North American, European and Asian real estate markets. Relevant real estate activities are defined as the ownership, trading and development of income-producing real estate. |
| | | | | | | | |
| | STANDARDIZED TOTAL RETURNS3 |
| | | For the period ended 6/30/16 | | Since Inception | | | Inception Date |
| | Class A | | | 6.10 | % | | 8/31/15 |
| | Class C | | | 10.55 | | | 8/31/15 |
| | Institutional | | | 12.57 | | | 8/31/15 |
| | Class IR | | | 12.46 | | | 8/31/15 |
| | Class R | | | 11.96 | | | 8/31/15 |
| | | Class R6 | | | 12.59 | | | 8/31/15 |
| | 3 | | The Standardized Total Returns are cumulative total returns as of the most recent calendar quarter-end. They assume reinvestment of all distributions at NAV. These returns reflect a maximum initial sales charge of 5.5% for Class A Shares, and the assumed contingent deferred sales charge for Class C Shares (1% if redeemed within 12 months of purchase). Because Institutional, Service, Class IR, Class R and Class R6 Shares do not involve a sales charge, such a charge is not applied to their Standardized Total Returns. |
The returns set forth in the tables above represent past performance. Past performance does not guarantee future results. The Fund’s investment return and principal value will fluctuate so that an investor’s shares, when redeemed, may be worth more or less than their original cost. Current performance may be lower or higher than the performance quoted above. Please visit our web site at www.GSAMFUNDS.com to obtain the most recent month-end returns. Performance reflects applicable fee waivers and/or expense limitations in effect during the periods shown. In their absence, performance would be reduced. Returns do not reflect the deduction of taxes that a shareholder would pay on Fund distributions or the redemption of Fund shares.
5
FUND BASICS
| | | | | | | | | | |
| | EXPENSE RATIOS4 | |
| | | | | Net Expense Ratio (Current) | | | Gross Expense Ratio (Before Waivers) | |
| | Class A | | | 1.40 | % | | | 13.61 | % |
| | Class C | | | 2.15 | | | | 14.38 | |
| | Institutional | | | 1.00 | | | | 13.24 | |
| | Class IR | | | 1.15 | | | | 13.39 | |
| | Class R | | | 1.65 | | | | 13.87 | |
| | | Class R6 | | | 0.98 | | | | 13.22 | |
| | 4 | | The expense ratios of the Fund, both current (net of applicable fee waivers and/or expense limitations) and before waivers (gross of applicable fee waivers and/or expense limitations) are as set forth above according to the most recent publicly available Prospectus for the Fund and may differ from the expense ratios disclosed in the Financial Highlights in this report. Pursuant to a contractual arrangement, the Fund’s waivers and/or expense limitations will remain in place through at least April 29, 2017, and prior to such date the Investment Adviser may not terminate the arrangements without the approval of the Fund’s Board of Trustees. If these arrangements are discontinued in the future, the expense ratios may change without shareholder approval. |
| | | | | | | | | | |
| | TOP TEN HOLDINGS AS OF 6/30/165 |
| | | Holding | | % of Total Net Assets | | | Subsectors | | Country |
| | Simon Property Group, Inc. (REIT) | | | 6.4 | % | | Retail | | United States |
| | AvalonBay Communities, Inc. (REIT) | | | 3.7 | | | Residential | | United States |
| | Public Storage (REIT) | | | 3.7 | | | Industrial | | United States |
| | Boston Properties, Inc. (REIT) | | | 3.4 | | | Office | | United States |
| | Vonovia SE | | | 3.4 | | | Residential | | Germany |
| | Ventas, Inc. (REIT) | | | 3.3 | | | Health Care | | United States |
| | Orix JREIT, Inc. (REIT) | | | 3.2 | �� | | Diversified | | Japan |
| | Vornado Realty Trust (REIT) | | | 3.0 | | | Diversified | | United States |
| | Klepierre (REIT) | | | 2.9 | | | Retail | | France |
| | | Sumitomo Realty & Development Co. Ltd. | | | 2.7 | | | Office | | Japan |
| | 5 | | The top 10 holdings may not be representative of the Fund’s future investments. |
6
FUND BASICS
|
| FUND VS. BENCHMARK SECTOR ALLOCATION6 |
| As of June 30, 2016 |
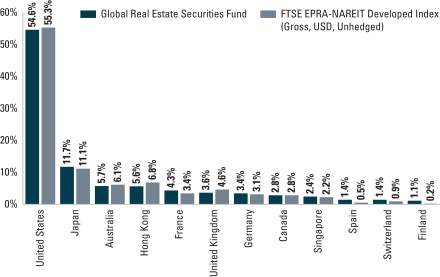
| | 6 | | The Fund is actively managed and, as such, its composition may differ over time. Consequently, the Fund’s overall country allocations may differ from percentages contained in the graph above. The percentage shown for each investment category reflects the value of investments in that category as a percentage of market value. |
7
PORTFOLIO RESULTS
Goldman Sachs International Real Estate Securities Fund
Investment Objective
The Fund seeks total return comprised of long-term growth of capital and dividend income.
Portfolio Management Discussion and Analysis
Below, the Goldman Sachs Real Estate Securities Investment Team discusses the Goldman Sachs International Real Estate Securities Fund’s (the “Fund”) performance and positioning for the six-month period ended June 30, 2016 (the “Reporting Period”).
| Q | | How did the Fund perform during the Reporting Period? |
| A | | During the Reporting Period, the Fund’s Class A, C, Institutional, IR and R6 Shares generated cumulative total returns, without sales charges, of 1.92%, 1.57%, 2.19%, 2.09% and 2.03%, respectively. These returns compare to the 5.91% cumulative total return of the Fund’s benchmark, the FTSE EPRA/NAREIT Developed ex US Real Estate Index (Gross, USD, Unhedged) (the “Real Estate Index”) during the same period. |
| Q | | What economic and market factors most influenced the international real estate securities market as a whole during the Reporting Period? |
| A | | For the Reporting Period overall, the international real estate securities market, as measured by the Real Estate Index, underperformed the U.S. real estate securities market, as measured by the Wilshire Real Estate Securities Index (with dividends reinvested), by nearly five percentage points, but outperformed the broad international equity market, as measured by the MSCI EAFE® Index (net), by more than ten percentage points. |
| | During the first quarter of 2016, the Real Estate Index increased solidly. Accommodative global monetary policies were supportive of the international real estate securities market. During the first quarter of 2016, Canada and Australia were the top performing markets in the Real Estate Index, while Hong Kong and the U.K. underperformed. Canada benefited from a rebound in commodity prices, while investors were cautious on the U.K. given concerns about the then-upcoming referendum about membership in the European Union, popularly known as the Brexit vote, and the uncertainty that referendum had created for businesses. |
| | The Real Estate Index then posted virtually flat, albeit modestly positive, returns during the second quarter of 2016. |
| | For the second quarter of 2016, Canada and Australia were again the top performing markets, and the U.K. was among the weakest markets in the Real Estate Index. Continental Europe also underperformed the Real Estate Index during the second quarter of 2016. Canada and Australia each benefited from relatively stable rental rates and positive yield outlooks, providing support and stability during the volatile quarter, while investors were surprised by the outcome of the U.K.’s Brexit vote to leave the European Union. |
| | For the Reporting Period overall, the strongest markets in the Real Estate Index were Canada, Australia, New Zealand and Israel. Conversely, the only country within the Real Estate Index to post negative returns during the Reporting Period as a whole was the U.K. |
| Q | | What key factors were responsible for the Fund’s performance during the Reporting Period? |
| A | | While absolute returns were positive, the Fund underperformed the Real Estate Index on a relative basis during the Reporting Period. Stock selection in Japan detracted most from the Fund’s relative results. Stock selection in Continental Europe, Australia, the U.K. and Hong Kong also was weak, albeit less so. Having an underweighted allocation to Canada, the strongest performer in the Real Estate Index during the Reporting Period, and having exposure to China, which is not a component of the Real Estate Index and which underperformed the Real Estate Index, also hurt. Having a position in cash when the Real Estate Index rallied further dampened relative results. Partially offsetting these detractors was stock selection in Singapore and Canada, which contributed positively but modestly. Having an underweighted allocation to the U.K., the weakest constituent of the Real Estate Index during the Reporting Period, also buoyed results. |
8
PORTFOLIO RESULTS
| Q | | Which positions detracted significantly from the Fund’s performance during the Reporting Period? |
| A | | Kennedy Wilson Real Estate, which owns assets in the U.K., Ireland and Spain, was the top detractor from the Fund’s performance during the Reporting Period. We believe its stock performed poorly primarily because of its association with the U.K. economy. Approximately 60% of its portfolio is in the U.K., and the Brexit referendum led to uncertainty that brushed broadly many companies with ties to the U.K. economy. At the end of the Reporting Period, we were concerned about the U.K. economy post-Brexit, but we believed the Kennedy Wilson Real Estate’s portfolio of assets has long leases, i.e. more than seven years on average, and is well leased, with approximately 96% occupancy, and thus provides some level of security. We also remained positive on the company’s prospects in Spain and Ireland, as both economies, in our view, have been doing well and should continue to grow. |
| | Shares of Derwent London, a real estate investment trust (“REIT”) with a focus on the central London commercial, residential and office development market, declined significantly during the Reporting Period largely due to negative investor sentiment surrounding the Brexit referendum. In our view, these concerns were being overly discounted into the stock’s valuation, and we believed investors were not fully appreciating what we considered to be the company’s attractive fundamentals. In addition, we were encouraged that vacancy rates remained low, and rental rates were strong for Derwent London during the Reporting Period. Nevertheless, following the market volatility after the U.K. referendum vote, we decided to exit the position in favor of opportunities with what we felt presented greater upside potential. |
| Q | | What were some of the Fund’s best-performing individual holdings? |
| A | | During the Reporting Period, a position in Japan Retail Fund Investment, a large Japan-based retail REIT, was the top contributor to the Fund’s relative returns. Its shares gained after the Bank of Japan introduced negative interest rates at the end of January 2016. Despite market volatility seen during the Reporting Period and despite a gradual strengthening of the Japanese yen, each of which typically has an adverse effect on the sector, Japanese REITs, known as J-REITs, appreciated broadly given what many consider to be their attractive relative yield and ability to provide income in a lower yielding, uncertain environment. Indeed, this dynamic led to strong performance for large-cap J-REITs and in particular for Japan Retail Fund Investment during the Reporting Period. Overall, we remained positive at the end of the Reporting Period on the increase in investor demand for J-REITs, and we continued to be confident in Japan Retail Fund Investment’s high quality management team and portfolio of assets. |
| | Comforia Residential REIT, a multifamily REIT in Tokyo, was also a top contributor to the Fund’s relative returns. It performed well given a scenario in Japan of relatively little supply risk and demand that remained strong. Strong demand in the Tokyo market was largely a reflection of the spring season wage uplift, while the broader working age group in Tokyo remained favorable toward renting due to the flexibility it affords. |
| Q | | How did the Fund use derivatives and similar instruments during the Reporting Period? |
| A | | The Fund did not use derivatives during the Reporting Period. |
| Q | | Did the Fund make any significant purchases or sales during the Reporting Period? |
| A | | We established a new Fund position in Cheung Kong Property Holdings, a diversified property development company in China, at what we viewed as a compelling valuation following a period of weakness. Looking forward, we are positive on the business’ strong potential for recurring cash flow and healthy balance sheets. In addition, we believe the company’s management team is likely to make accretive investment and development decisions in the years ahead. |
| | We initiated a Fund position in Dexus Property Group, an Australian-based office REIT. In our view, Sydney’s office down-cycle has come to an end given that the office inventory has been reduced due to residential conversion. In addition, we are positive on Dexus Property Group as demand has sequentially improved for several quarters driven largely by a broad spectrum of tenants. |
| | In addition to the sale of Derwent London already mentioned, we exited the Fund’s position in Link Real Estate Investment Trust, a shopping center REIT based in Hong Kong. Following the stock’s gains during the Reporting Period, its shares reached our price target, and so we decided to sell the position in favor of opportunities with what we believed to have greater upside potential. |
9
PORTFOLIO RESULTS
| Q | | Were there any changes made in the Fund’s investment strategy during the Reporting Period? |
| A | | In constructing the Fund’s portfolio, we focus on picking securities rather than on making regional, country or subsector bets. We seek to outpace the benchmark index by overweighting stocks that we expect to outperform and underweighting those that we think may lag. Consequently, changes in its regional or subsector weights are generally the direct result of individual stock selection or of real estate securities’ appreciation or depreciation. That said, during the Reporting Period, the Fund’s exposure to Continental Europe increased relative to the Real Estate Index, and its exposure to the U.K. and Singapore decreased relative to the Real Estate Index. We also eliminated the Fund’s position in China during the Reporting Period, which is not a component of the Real Estate Index. The Fund’s position in cash increased during the Reporting Period. |
| Q | | How was the Fund positioned relative to its benchmark index at the end of the Reporting Period? |
| A | | From a country perspective, the Fund was overweight relative to the Real Estate Index in Continental Europe and was underweighted relative to the Real Estate Index in Singapore and the U.K. The Fund was rather neutrally weighted compared to the Real Estate Index in the other constituent countries of the Real Estate Index at the end of June 2016. |
| Q | | What is the Fund’s tactical view and strategy for the months ahead? |
| A | | At the end of the Reporting Period, we believed that international REITs can continue to generate positive returns during the second half of 2016 given reasonable demand in most subsectors and the industry’s overall favorable supply picture. In addition, overall, we believe the global environment remains supportive of REIT fundamentals. A macroeconomic backdrop of low economic growth and interest rates that will likely be “lower for even longer” should, in our view, have a positive effect on investor appetite and on the financing environment, which is particularly important given the capital intensive nature of the real estate asset class. We believe this favorable backdrop can benefit REITs in securing financing and deploying capital towards high quality projects, which could potentially drive future growth. While there are some headwinds stemming from the Brexit news impacting international REITs, especially for the European exposed names, we believe the positives will likely outweigh the negatives. Additionally, the upcoming sector reclassification in the broad equity indices that will break out real estate from the financials sector into its own independent sector, anticipated changes in the Foreign Investment in Real Property Tax Act (“FIRPTA”), and a wall of capital, or large amount of money available for investment, in the private market should provide additional support, in our opinion. |
| | Looking ahead, we believe REITs can continue to offer attractive risk-adjusted returns, relative to fixed income in particular, given their potential yield, growth, diversification and inflation hedge benefits. On a stock by stock basis, we believe opportunities abound around the world, as both listed and unlisted real estate offer high and stable income for REITs to capture. As fundamental, bottom-up investors, we believe we are seeing opportunities that go beyond the headline risks associated with certain regions. We intend to continue to focus our approach on those companies that have well-capitalized balance sheets and that possess quality attributes, such as a robust business model, a high quality asset exposure and a strong management team with a sound reinvestment strategy. |
10
FUND BASICS
International Real Estate Securities Fund
as of June 30, 2016
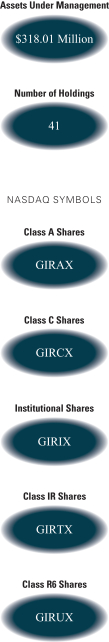
| | | | | | | | | | |
| | PERFORMANCE REVIEW | |
| | | January 1, 2016–June 30, 2016 | | Fund Total Return
(based on NAV)1 | | | FTSE EPRA/NAREIT Developed
ex US Real Estate Index (Gross,
USD, Unhedged)2 | |
| | Class A | | | 1.92 | % | | | 5.91 | % |
| | Class C | | | 1.57 | | | | 5.91 | |
| | Institutional | | | 2.19 | | | | 5.91 | |
| | Class IR | | | 2.09 | | | | 5.91 | |
| | | Class R6 | | | 2.03 | | | | 5.91 | |
| | 1 | | The net asset value (“NAV”) represents the net assets of the class of the Fund (ex-dividend) divided by the total number of shares of the class outstanding. The Fund’s performance reflects the reinvestment of dividends and other distributions. The Fund’s performance does not reflect the deduction of any applicable sales charges. |
| | 2 | | The FTSE EPRA/NAREIT Developed ex US Real Estate Index (Gross, USD, Unhedged) is a market capitalization weighted index comprised of REITs and non-REITs within the international (global ex U.S.) real estate securities market. The market capitalization for each constituent is adjusted for free float. It is not possible to invest directly in an index. |
| | | | | | | | | | | | | | | | |
| | STANDARDIZED TOTAL RETURNS3 |
| | | For the period ended 6/30/16 | | One Year | | | Five Year | | | Since Inception | | | Inception Date |
| | Class A | | | -7.92 | % | | | 2.49 | % | | | -0.18 | % | | 7/31/06 |
| | Class C | | | -4.21 | | | | 2.91 | | | | -0.33 | | | 7/31/06 |
| | Institutional | | | -2.01 | | | | 4.08 | | | | 0.66 | | | 7/31/06 |
| | Class IR | | | -2.40 | | | | 3.92 | | | | -1.92 | | | 11/30/07 |
| | | Class R6 | | | N/A | | | | N/A | | | | -3.10 | | | 7/31/15 |
| | 3 | | The Standardized Total Returns are average annual total returns as of the most recent calendar quarter-end or cumulative total returns for periods of 1 year or less. They assume reinvestment of all distributions at NAV. These returns reflect a maximum initial sales charge of 5.5% for Class A Shares and the assumed contingent deferred sales charge for Class C Shares (1% if redeemed within 12 months of purchase). Because Institutional, Class IR and Class R6 Shares do not involve a sales charge, such a charge is not applied to their Standardized Total Returns. |
The returns set forth in the tables above represent past performance. Past performance does not guarantee future results. The Fund’s investment return and principal value will fluctuate so that an investor’s shares, when redeemed, may be worth more or less than their original cost. Current performance may be lower or higher than the performance quoted above. Please visit our web site at www.GSAMFUNDS.com to obtain the most recent month-end returns. Performance reflects applicable fee waivers and/or expense limitations in effect during the periods shown. In their absence, performance would be reduced. Returns do not reflect the deduction of taxes that a shareholder would pay on Fund distributions or the redemption of Fund shares.
11
FUND BASICS
| | | | | | | | | | |
| | EXPENSE RATIOS4 | |
| | | | | Net Expense Ratio (Current) | | | Gross Expense Ratio (Before Waivers) | |
| | Class A | | | 1.39 | % | | | 1.62 | % |
| | Class C | | | 2.14 | | | | 2.37 | |
| | Institutional | | | 0.99 | | | | 1.22 | |
| | Class IR | | | 1.14 | | | | 1.37 | |
| | | Class R6 | | | 0.97 | | | | 1.15 | |
| | 4 | | The expense ratios of the Fund, both current (net of applicable fee waivers and/or expense limitations) and before waivers (gross of applicable fee waivers and/or expense limitations) are as set forth above according to the most recent publicly available Prospectus for the Fund and may differ from the expense ratios disclosed in the Financial Highlights in this report. Pursuant to a contractual arrangement, the Fund’s waivers and/or expense limitations will remain in place through at least April 29, 2017, and prior to such date the Investment Adviser may not terminate the arrangements without the approval of the Fund’s Board of Trustees. If these arrangements are discontinued in the future, the expense ratios may change without shareholder approval. |
| | | | | | | | | | |
| | TOP TEN HOLDINGS AS OF 6/30/165 |
| | | Holding | | % of Total
Net Assets | | | Line of Business | | Country |
| | Mitsubishi Estate Co. Ltd. | | | 6.3 | % | | Diversified | | Japan |
| | Unibail-Rodamco SE (REIT) | | | 5.8 | | | Retail | | France |
| | Vonovia SE | | | 5.7 | | | Residential | | Germany |
| | Sun Hung Kai Properties Ltd. | | | 5.4 | | | Diversified | | Hong Kong |
| | Sumitomo Realty & Development Co. Ltd. | | | 4.8 | | | Office | | Japan |
| | Cheung Kong Property Holdings Ltd. | | | 4.7 | | | Diversified | | Hong Kong |
| | Klepierre (REIT) | | | 4.2 | | | Retail | | France |
| | Dexus Property Group (REIT) | | | 3.5 | | | Diversified | | Australia |
| | Orix JREIT, Inc. (REIT) | | | 3.4 | | | Diversified | | Japan |
| | | Mitsui Fudosan Co. Ltd. | | | 3.0 | | | Office | | Japan |
| | 5 | | The top 10 holdings may not be representative of the Fund’s future investments. |
12
FUND BASICS
|
| FUND VS. BENCHMARK COUNTRY ALLOCATION6 |
| As of June 30, 2016 |
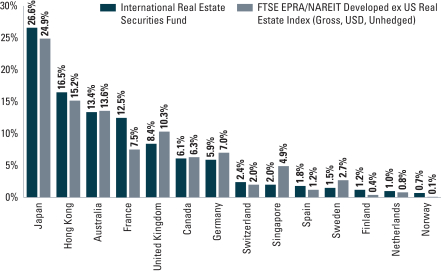
| | 6 | | The Fund is actively managed and, as such, its composition may differ over time. Consequently, the Fund’s overall country allocations may differ from percentages contained in the graph above. The percentage shown for each investment category reflects the value of investments in that category as a percentage of market value. |
13
PORTFOLIO RESULTS
Goldman Sachs Real Estate Securities Fund
Investment Objective
The Fund seeks total return comprised of long-term growth of capital and dividend income.
Portfolio Management Discussion and Analysis
Below, the Goldman Sachs Real Estate Securities Investment Team discusses the Goldman Sachs Real Estate Securities Fund’s (the “Fund”) performance and positioning for the six-month period ended June 30, 2016 (the “Reporting Period”).
| Q | | How did the Fund perform during the Reporting Period? |
| A | | During the Reporting Period, the Fund’s Class A, C, Institutional, Service, IR, R and R6 Shares generated cumulative total returns, without sales charges, of 9.73%, 9.34%, 9.99%, 9.63%, 9.86%, 9.59% and 9.93%, respectively. These returns compare to the 11.61% cumulative total return of the Fund’s benchmark, the Wilshire Real Estate Securities Index (the “Wilshire Index”) during the same period. |
| Q | | What economic and market factors most influenced the U.S. real estate securities market as a whole during the Reporting Period? |
| A | | The U.S. real estate securities market, as represented by the Wilshire Index, posted robust positive absolute returns during the Reporting Period that significantly outperformed the broad U.S. equity market, as represented by the S&P 500® Index, which was up 3.84% for the same period. |
| | Throughout the first half of 2016, the Wilshire Index increased solidly. Despite volatility driven by global macroeconomic concerns, U.S. real estate investment trusts (“REITs”) outperformed broader U.S. equities during the Reporting Period, as investors appreciated the asset class’ healthy operating fundamentals. At the company level, limited new supply across most property types, stable demand, and an accommodative financing environment provided a supportive backdrop for the asset class. |
| | For the first quarter of 2016, self-storage and retail were the top performing subsectors, while the office and health care subsectors underperformed the broader REIT market most but still finished in positive territory. Self-storage performed well as investors were positive on the subsector’s strong fundamentals, while concerns about new supply and softer employment growth in certain markets impacted valuations in the office subsector. For the second quarter of 2016, industrial and health care were the top performing subsectors, while self-storage and leisure underperformed the Wilshire Index most. The industrial subsector benefited from e-commerce trends that have supported demand in a number of key markets nationally. Following a span of strong performance, investor concerns about potentially weaker fundamentals in self-storage negatively affected valuations in that subsector. |
| | For the Reporting Period overall, the strongest subsector in the Wilshire Index by a wide margin was industrial. Conversely, the leisure subsector was the weakest performer within the Wilshire Index during the Reporting Period, though still posting a positive absolute return. |
| Q | | What key factors were responsible for the Fund’s performance during the Reporting Period? |
| A | | The Fund posted solid positive absolute returns during the Reporting Period but underperformed the return of the Wilshire Index. Detracting most from the Fund’s relative results was stock selection in the retail and leisure subsectors. Stock selection in the self-storage and health care subsectors was also weak, albeit less so. Having an underweighted exposure to the industrial subsector, the strongest in the Wilshire Index during the Reporting Period, and an overweighted exposure to the self-storage subsector, which was the second-weakest performer in the Wilshire Index during the Reporting Period, also hurt. Having a position in cash during a Reporting Period when the Wilshire Index rallied further dampened relative results. Partially offsetting these detractors was effective individual stock selection in the office subsector, which contributed positively to relative returns. Having an underweighted allocation to the multifamily subsector, which significantly lagged the Wilshire Index during the Reporting Period, also boosted the Fund’s relative results. |
14
PORTFOLIO RESULTS
| Q | | What were some of the Fund’s weakest-performing individual holdings? |
| A | | Chesapeake Lodging Trust, an owner of upscale hotels in key gateway markets in the U.S., was the top detractor from the Fund’s relative returns during the Reporting Period. In our view, Chesapeake Lodging Trust’s underperformance of the Wilshire Index was largely driven by the broad-based headwinds impacting the entire lodging industry. These headwinds included fears of new supply as well as concerns about the recent strength of the U.S. dollar and its potential impact on international travelers. Chesapeake Lodging Trust has long been speculated as a potential acquisition candidate; the fact that an acquisition has not occurred has disappointed investors. At the end of the Reporting Period, we maintained high conviction in Chesapeake Lodging Trust’s strategy and assets over the remainder of this hotel cycle. We believe its hotels are located in attractive locations, and the company has completed several large-scale renovations, which we view as value enhancing. |
| | AvalonBay Communities, a residential REIT, was a top detractor from the Fund’s results during the Reporting Period. In our opinion, its weak performance was caused by investor concerns about AvalonBay Communities’ competitor, Equity Residential, and its revisions to guidance, which were based on a possible slowdown in their shared markets, New York and San Francisco. Despite its recent weakness, we continued to view AvalonBay Communities favorably at the end of the Reporting Period due to what we see as its balanced suburban/urban mix within the coastal markets. We view this balanced portfolio as less exposed to the markets where rent fatigue concerns are most prevalent. Longer term, we believe AvalonBay Communities may well benefit from what we perceive as its high quality portfolio, strong balance sheet and ability to grow net asset value through accretive development. |
| Q | | What were some of the Fund’s best-performing individual holdings? |
| A | | Data center provider CyrusOne was the top positive contributor to the Fund’s performance. At the end of February 2016, its shares gained after CyrusOne reported fourth quarter 2015 earnings that exceeded consensus expectations. Later in the first quarter of 2016, the company announced plans to acquire a data center facility from CME Group, which we believe should be accretive to shareholder value. In addition, investors were constructive on its management’s description of a five-year plan to double both revenue and earnings before interest, taxes, depreciation and amortization (“EBITDA”). At the beginning of May 2016, CyrusOne reported first quarter 2016 results that were better than consensus expectations and raised the company’s full-year guidance. In our view, as cloud-based technology gains momentum, enterprises and cloud service providers will likely be required to lease additional space at data centers. As a result, we believe CyrusOne is likely to benefit from continued demand growth. In addition, at the end of the Reporting Period, we viewed the strength of CyrusOne’s sales force and customer penetration among Fortune 1000 companies as meaningful competitive advantages. We were also optimistic on the company’s opportunity to increasingly provide its services to small and mid-size customers. Overall, at the end of the Reporting Period, we believed its stock presented a compelling risk/reward opportunity given what we view as its prospects for future growth. |
| | Equity Residential, a multifamily REIT, was also a top contributor to the Fund’s performance during the Reporting Period. Its strong contribution can be attributed to the Fund’s underweighted position in its stock relative to the Wilshire Index. Equity Residential posted negative returns during the Reporting Period, attributable to its heavy exposure to the New York and San Francisco markets, which have had an influx of new, first-class product coming online. Equity Residential’s upper management also revised guidance downward, explaining the revision as an underestimation of supply pressure, causing Equity Residential to offer concessions to new leases and renewals. |
| Q | | How did the Fund use derivatives and similar instruments during the Reporting Period? |
| A | | The Fund did not use derivatives during the Reporting Period. |
| Q | | Did the Fund make any significant purchases or sales during the Reporting Period? |
| A | | During the Reporting Period, we established a Fund position in Equinix, a data center provider REIT. In our view, Equinix is well positioned to benefit from what we believe will be continued demand for data storage. We see global scale as an additional positive as it is widely thought that international markets are behind the U.S. in terms of cloud adoption. Further, we believe Equinix has assets that are expected to be well protected from new supply. |
| | We initiated a Fund position in Taubman Centers, an owner of regional malls and shopping centers. In our view, shares of Taubman Centers had been under pressure due to concerns about the company’s development pipeline and a large |
15
PORTFOLIO RESULTS
| | redevelopment that may come at low initial returns. We believe these fears were being overly discounted into the stock’s valuation and investors were not fully appreciating what we see as Taubman Center’s high quality assets and its embedded net operating income growth from developments. Additionally, among malls, we view Taubman Centers as more insulated than many of its peers from persistent retailer and department store concerns given the company’s greater exposure to the high-end consumer. |
| | During the Reporting Period, we exited the Fund’s position in Highwoods Properties, an owner of office properties. While there continued to be strength in demand in its Sunbelt markets and we were observing faster employment growth relative to other parts of the country, the rent growth over the last 18 to 24 months was starting to attract new supply, especially in its two largest markets, Raleigh and Atlanta. As a result, we exited the position and transitioned capital into higher conviction ideas. |
| | We eliminated the Fund’s position in American Tower, a provider of wireless communications infrastructure. We still believe its fundamentals are healthy overall. However, after a period of strong performance, its shares were nearing our long-term price target and so we opted to sell. |
| Q | | Were there any changes made in the Fund’s investment strategy during the Reporting Period? |
| A | In constructing the Fund’s portfolio, we focus on picking securities rather than on making real estate subsector bets. We seek to outpace the benchmark index by overweighting stocks that we expect to outperform and underweighting those that we think may lag. Consequently, changes in its real estate subsector weights are generally the direct result of individual stock selection or of real estate securities’ appreciation or depreciation. That said, during the Reporting Period, the Fund’s exposure to the retail subsector increased relative to the Wilshire Index and its exposure to the health care, industrials and what is termed as the “other” subsectors decreased relative to the Wilshire Index. The Fund’s position in cash also increased during the Reporting Period. |
| Q | | How was the Fund positioned relative to its benchmark index at the end of the Reporting Period? |
| A | | From a subsector perspective, the Fund had an overweighted exposure compared to the Wilshire Index in the self-storage, leisure, retail and commercial subsectors at the end of the Reporting Period. The Fund was underweighted compared to its benchmark index in the multifamily, healthcare and in the “other” subsectors within the Wilshire Index. |
| Q | | What is the Fund’s tactical view and strategy for the months ahead? |
| A | | At the end of the Reporting Period, we believed that U.S. REITs can continue to generate positive returns during the second half of 2016 given reasonable demand in most subsectors. While new supply is growing due to the attractive spread, or differential, between development yields and cap rates, it is still below demand, and we believe this could lead to further increases in occupancy levels and rental rates as well as higher re-leasing spreads on expiring leases. (Cap rate, or capitalization rate, is a rate of return on a real estate investment property based on the expected income that the property will generate. Capitalization rate is used to estimate the investor’s potential return on his or her investment.) |
| | In our view, this encouraging fundamental backdrop coupled with both a solid financing environment and a healthy transaction market could support additional gains by the REIT asset class. Furthermore, we believed at the end of the Reporting Period that a number of REITs could experience increased investor demand due to record levels of private capital that has yet to be invested, foreign and institutional investors increasing their allocations to the space, and the upcoming sector reclassification in the broad U.S. equity indices that will break out real estate from the financials sector into its own independent sector. In addition, we believe in the current low economic growth and low interest rate environment that the investment attributes of the asset class should continue to be viewed favorably by investors, especially relative to fixed income. Overall, we believe that REITs can continue to provide investors with attractive risk-adjusted returns given the potential yield, growth, diversification and inflation hedge benefits the REIT asset class can provide. |
| | As fundamental, bottom-up investors, we intend to continue to focus our approach on those companies that have strong balance sheets and that possess quality attributes, such as a robust business model, a high quality asset exposure and a strong management team. |
16
FUND BASICS
Real Estate Securities Fund
as of June 30, 2016
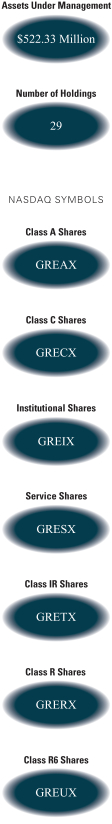
| | | | | | | | | | |
| | PERFORMANCE REVIEW | |
| | | January 1, 2016–June 30, 2016 | | Fund Total Return
(based on NAV)1 | | | Wilshire U.S. Real Estate
Securities Index2 | |
| | Class A | | | 9.73 | % | | | 11.61 | % |
| | Class C | | | 9.34 | | | | 11.61 | |
| | Institutional | | | 9.99 | | | | 11.61 | |
| | Service | | | 9.63 | | | | 11.61 | |
| | Class IR | | | 9.86 | | | | 11.61 | |
| | Class R | | | 9.59 | | | | 11.61 | |
| | | Class R6 | | | 9.93 | | | | 11.61 | |
| | 1 | | The net asset value (“NAV”) represents the net assets of the class of the Fund (ex-dividend) divided by the total number of shares of the class outstanding. The Fund’s performance reflects the reinvestment of dividends and other distributions. The Fund’s performance does not reflect the deduction of any applicable sales charges. |
| | 2 | | The Wilshire U.S. Real Estate Securities Index is an unmanaged market capitalization-weighted index comprised of publicly traded REITs and real estate operating companies. The figures do not reflect any fees or expenses. It is not possible to invest directly in an index. |
| | | | | | | | | | | | | | | | | | | | |
| | STANDARDIZED TOTAL RETURNS3 |
| | | For the period ended 6/30/16 | | One Year | | | Five Years | | | Ten Years | | | Since Inception | | | Inception Date |
| | Class A | | | 13.63 | % | | | 10.37 | % | | | 5.34 | % | | | 9.86 | % | | 7/27/98 |
| | Class C | | | 18.30 | | | | 10.79 | | | | 5.16 | | | | 9.41 | | | 7/27/98 |
| | Institutional | | | 20.71 | | | | 12.07 | | | | 6.38 | | | | 10.67 | | | 7/27/98 |
| | Service | | | 20.05 | | | | 11.50 | | | | 5.82 | | | | 10.13 | | | 7/27/98 |
| | Class IR | | | 20.50 | | | | 11.89 | | | | N/A | | | | 6.71 | | | 11/30/07 |
| | Class R | | | 19.91 | | | | 11.35 | | | | N/A | | | | 6.20 | | | 11/30/07 |
| | | Class R6 | | | N/A | | | | N/A | | | | N/A | | | | 13.94 | | | 7/31/15 |
| | 3 | | The Standardized Total Returns are average annual total returns as of the most recent calendar quarter-end or cumulative total returns for periods of 1 year or less. They assume reinvestment of all distributions at NAV. These returns reflect a maximum initial sales charge of 5.5% for Class A Shares and the assumed contingent deferred sales charge for Class C Shares (1% if redeemed within 12 months of purchase). Because Institutional, Service, Class IR, Class R and Class R6 Shares do not involve a sales charge, such a charge is not applied to their Standardized Total Returns. |
The returns set forth in the tables above represent past performance. Past performance does not guarantee future results. The Fund’s investment return and principal value will fluctuate so that an investor’s shares, when redeemed, may be worth more or less than their original cost. Current performance may be lower or higher than the performance quoted above. Please visit our web site at www.GSAMFUNDS.com to obtain the most recent month-end returns. Performance reflects applicable fee waivers and/or expense limitations in effect during the periods shown. In their absence, performance would be reduced. Returns do not reflect the deduction of taxes that a shareholder would pay on Fund distributions or the redemption of Fund shares.
17
FUND BASICS
| | | | | | | | | | |
| | EXPENSE RATIOS4 | |
| | | | | Net Expense Ratio (Current) | | | Gross Expense Ratio (Before Waivers) | |
| | Class A | | | 1.31 | % | | | 1.51 | % |
| | Class C | | | 2.06 | | | | 2.26 | |
| | Institutional | | | 0.91 | | | | 1.11 | |
| | Service | | | 1.41 | | | | 1.61 | |
| | Class IR | | | 1.06 | | | | 1.26 | |
| | Class R | | | 1.56 | | | | 1.77 | |
| | | Class R6 | | | 0.89 | | | | 1.07 | |
| | 4 | | The expense ratios of the Fund, both current (net of applicable fee waivers and/or expense limitations) and before waivers (gross of applicable fee waivers and/or expense limitations) are as set forth above according to the most recent publicly available Prospectus for the Fund and may differ from the expense ratios disclosed in the Financial Highlights in this report. Pursuant to a contractual arrangement, the Fund’s waivers and/or expense limitations will remain in place through at least April 29, 2017, and prior to such date the Investment Adviser may not terminate the arrangements without the approval of the Fund’s Board of Trustees. If these arrangements are discontinued in the future, the expense ratios may change without shareholder approval. |
| | | | | | | | |
| | TOP TEN HOLDINGS AS OF 6/30/165 |
| | | Holding | | % of Total Net Assets | | | Subsectors |
| | Simon Property Group, Inc. (REIT) | | | 11.5 | % | | Retail |
| | Public Storage (REIT) | | | 7.2 | | | Self Storage |
| | AvalonBay Communities, Inc. (REIT) | | | 6.3 | | | Multifamily |
| | Vornado Realty Trust (REIT) | | | 5.5 | | | Commercial |
| | Boston Properties, Inc. (REIT) | | | 5.3 | | | Commercial |
| | Ventas, Inc. (REIT) | | | 4.7 | | | Health Care |
| | Equinix, Inc. (REIT) | | | 4.2 | | | Commercial |
| | Mid-America Apartment Communities, Inc. (REIT) | | | 4.2 | | | Multifamily |
| | Brixmor Property Group, Inc. (REIT) | | | 3.8 | | | Retail |
| | | Post Properties, Inc. (REIT) | | | 3.5 | | | Multifamily |
| | 5 | | The top 10 holdings may not be representative of the Fund’s future investments. |
18
FUND BASICS
|
| FUND VS. BENCHMARK SECTOR ALLOCATION6 |
| As of June 30, 2016 |
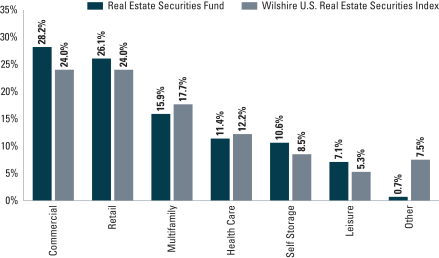
| | 6 | | The Fund is actively managed and, as such, its composition may differ over time. Consequently, the Fund’s overall industry sector allocations may differ from percentages contained in the graph above. The graph categorizes investments using Global Industry Classification Standard (“GICS”), however, the sector classifications used by the portfolio management team may differ from GICS. The percentage shown for each investment category reflects the value of investments in that category as a percentage of market value. |
19
INDEX DEFINITIONS
Index Definitions:
S&P® 500 Index: The S&P 500 Index is the Standard & Poor’s 500 Composite Index of 500 stocks, an unmanaged index of common stock prices.
MSCI EAFE® Index: The MSCI EAFE Index (Europe, Australasia, Far East) is a free float-adjusted market capitalization index that is designed to measure the equity market performance of developed markets, excluding the US & Canada. As of June 2, 2014, the MSCI EAFE Index consists of the following 21 developed market country indexes: Australia, Austria, Belgium, Denmark, Finland, France, Germany, Hong Kong, Ireland, Israel, Italy, Japan, the Netherlands, New Zealand, Norway, Portugal, Singapore, Spain, Sweden, Switzerland, and the United Kingdom.
The Index figures do not include any deduction for fees, expenses or taxes. It is not possible to invest directly in an unmanaged index.
20
GOLDMAN SACHS GLOBAL REAL ESTATE SECURITIES FUND
Schedule of Investments
June 30, 2016 (Unaudited)
| | | | | | | | |
Shares | | | Description | | Value | |
| | Common Stocks – 96.5% | |
| | Australia – 5.8% | |
| | 72,680 | | | Charter Hall Group (REIT) (Diversified) | | $ | 276,901 | |
| | 73,022 | | | Dexus Property Group (REIT) (Diversified) | | | 495,503 | |
| | 99,372 | | | Mirvac Group (REIT) (Diversified) | | | 151,130 | |
| | 121,951 | | | Vicinity Centres (REIT) (Retail) | | | 304,249 | |
| | | | | | | | |
| | | | | | | 1,227,783 | |
| | |
| | Canada – 2.8% | |
| | 15,277 | | | RioCan Real Estate Investment Trust (REIT) (Retail) | | | 346,820 | |
| | 8,517 | | | Smart Real Estate Investment Trust (REIT) (Retail) | | | 251,828 | |
| | | | | | | | |
| | | | | | | 598,648 | |
| | |
| | Finland – 1.1% | |
| | 100,661 | | | Citycon OYJ (Retail) | | | 229,286 | |
| | |
| | France – 4.4% | |
| | 3,576 | | | Fonciere Des Regions (REIT) (Diversified) | | | 316,069 | |
| | 13,865 | | | Klepierre (REIT) (Retail) | | | 611,796 | |
| | | | | | | | |
| | | | | | | 927,865 | |
| | |
| | Germany – 3.4% | |
| | 19,683 | | | Vonovia SE (Residential) | | | 718,704 | |
| | |
| | Hong Kong – 5.6% | |
| | 47,500 | | | Cheung Kong Property Holdings Ltd. (Diversified) | | | 299,281 | |
| | 63,500 | | | Hongkong Land Holdings Ltd. (Office) | | | 381,141 | |
| | 43,000 | | | Sun Hung Kai Properties Ltd. (Diversified) | | | 518,963 | |
| | | | | | | | |
| | | | | | | 1,199,385 | |
| | |
| | Japan – 11.8% | |
| | 144 | | | Comforia Residential REIT, Inc. (REIT) (Residential) | | | 323,872 | |
| | 27,000 | | | Mitsubishi Estate Co. Ltd. (Diversified) | | | 495,255 | |
| | 389 | | | Orix JREIT, Inc. (REIT) (Diversified) | | | 669,930 | |
| | 25,800 | | | Sekisui House Ltd. (Residential) | | | 451,812 | |
| | 21,000 | | | Sumitomo Realty & Development Co. Ltd. (Office) | | | 569,465 | |
| | | | | | | | |
| | | | | | | 2,510,334 | |
| | |
| | Singapore – 2.5% | |
| | 46,700 | | | City Developments Ltd. (Diversified) | | | 283,789 | |
| | 199,000 | | | Fortune Real Estate Investment Trust (REIT) (Retail) | | | 237,797 | |
| | | | | | | | |
| | | | | | | 521,586 | |
| | |
| | Spain – 1.4% | |
| | 28,133 | | | Merlin Properties Socimi SA (REIT) (Diversified) | | | 296,885 | |
| | |
| | Switzerland – 1.4% | |
| | 2,998 | | | PSP Swiss Property AG (Registered) (Office) | | | 290,885 | |
| | |
| | Common Stocks – (continued) | |
| | United Kingdom – 3.6% | |
| | 26,135 | | | Big Yellow Group PLC (REIT) (Industrial) | | $ | 272,143 | |
| | 39,599 | | | Hammerson PLC (REIT) (Retail) | | | 285,215 | |
| | 26,239 | | | The UNITE Group PLC (Other) | | | 217,062 | |
| | | | | | | | |
| | | | | | | 774,420 | |
| | |
| | United States – 52.7% | |
| | 11,721 | | | Acadia Realty Trust (REIT) (Retail) | | | 416,330 | |
| | 4,372 | | | AvalonBay Communities, Inc. (REIT) (Residential) | | | 788,665 | |
| | 5,462 | | | Boston Properties, Inc. (REIT) (Office) | | | 720,438 | |
| | 18,606 | | | Brixmor Property Group, Inc. (REIT) (Retail) | | | 492,315 | |
| | 6,490 | | | Care Capital Properties, Inc. (REIT) (Health Care) | | | 170,103 | |
| | 11,654 | | | Chesapeake Lodging Trust (REIT) (Hotels) | | | 270,955 | |
| | 9,608 | | | CyrusOne, Inc. (REIT) (Office) | | | 534,781 | |
| | 21,871 | | | DDR Corp. (REIT) (Retail) | | | 396,740 | |
| | 3,494 | | | EastGroup Properties, Inc. (REIT) (Industrial) | | | 240,806 | |
| | 2,455 | | | Federal Realty Investment Trust (REIT) (Retail) | | | 406,425 | |
| | 5,306 | | | HCP, Inc. (REIT) (Health Care) | | | 187,726 | |
| | 6,501 | | | Highwoods Properties, Inc. (REIT) (Office) | | | 343,253 | |
| | 5,337 | | | Mid-America Apartment Communities, Inc. (REIT) (Residential) | | | 567,857 | |
| | 5,579 | | | Pebblebrook Hotel Trust (REIT) (Hotels) | | | 146,449 | |
| | 7,863 | | | Post Properties, Inc. (REIT) (Residential) | | | 480,036 | |
| | 3,614 | | | Prologis, Inc. (REIT) (Industrial) | | | 177,231 | |
| | 3,068 | | | Public Storage (REIT) (Industrial) | | | 784,150 | |
| | 14,210 | | | RLJ Lodging Trust (REIT) (Hotels) | | | 304,805 | |
| | 6,282 | | | Simon Property Group, Inc. (REIT) (Retail) | | | 1,362,566 | |
| | 4,284 | | | Sovran Self Storage, Inc. (REIT) (Industrial) | | | 449,477 | |
| | 2,995 | | | Taubman Centers, Inc. (REIT) (Retail) | | | 222,229 | |
| | 9,611 | | | Ventas, Inc. (REIT) (Health Care) | | | 699,873 | |
| | 6,425 | | | Vornado Realty Trust (REIT) (Diversified) | | | 643,271 | |
| | 4,981 | | | Welltower, Inc. (REIT) (Health Care) | | | 379,403 | |
| | | | | | | | |
| | | | | | | 11,185,884 | |
| | |
| | TOTAL COMMON STOCKS | |
| | (Cost $18,893,826) | | $ | 20,481,665 | |
| | |
| | |
| The accompanying notes are an integral part of these financial statements. | | 21 |
GOLDMAN SACHS GLOBAL REAL ESTATE SECURITIES FUND
Schedule of Investments (continued)
June 30, 2016 (Unaudited)
| | | | | | |
Shares | | Distribution
Rate | | Value | |
| Investment Company(a)(b) – 4.4% | |
Goldman Sachs Financial Square Government Fund – FST Institutional Shares | |
| 937,607 | | 0.299% | | $ | 937,607 | |
| (Cost $937,607) | |
| |
| TOTAL INVESTMENTS – 100.9% | |
| (Cost $19,831,433) | | $ | 21,419,272 | |
| |
LIABILITIES IN EXCESS OF OTHER ASSETS – (0.9)% | | | (180,723 | ) |
| |
| NET ASSETS – 100.0% | | $ | 21,238,549 | |
| |
| | |
| The percentage shown for each investment category reflects the value of investments in that category as a percentage of net assets. |
(a) | | Represents an affiliated issuer. |
(b) | | Variable rate security. Interest rate or distribution rate disclosed is that which is in effect on June 30, 2016. |
| | |
|
Investment Abbreviation: |
REIT | | —Real Estate Investment Trust |
|
| | |
| 22 | | The accompanying notes are an integral part of these financial statements. |
GOLDMAN SACHS INTERNATIONAL REAL ESTATE SECURITIES FUND
Schedule of Investments
June 30, 2016 (Unaudited)
| | | | | | | | |
Shares | | | Description | | Value | |
| | Common Stocks – 96.6% | |
| | Australia – 12.9% | |
| | 1,603,694 | | | Charter Hall Group (REIT) (Diversified) | | $ | 6,109,860 | |
| | 1,640,558 | | | Dexus Property Group (REIT) (Diversified) | | | 11,132,273 | |
| | 5,012,683 | | | Mirvac Group (REIT) (Diversified) | | | 7,623,517 | |
| | 1,914,264 | | | The GPT Group (REIT) (Diversified) | | | 7,784,641 | |
| | 3,422,742 | | | Vicinity Centres (REIT) (Retail) | | | 8,539,225 | |
| | | | | | | | |
| | | | | | | 41,189,516 | |
| | |
| | Canada – 5.9% | |
| | 87,474 | | | Allied Properties Real Estate Investment Trust (REIT) (Office) | | | 2,618,905 | |
| | 60,603 | | | Canadian Real Estate Investment Trust (REIT) (Diversified) | | | 2,265,664 | |
| | 45,669 | | | Granite Real Estate Investment Trust (REIT) (Industrial) | | | 1,369,770 | |
| | 201,990 | | | H&R Real Estate Investment Trust (REIT) (Diversified) | | | 3,519,327 | |
| | 243,942 | | | RioCan Real Estate Investment Trust (REIT) (Retail) | | | 5,538,000 | |
| | 119,186 | | | Smart Real Estate Investment Trust (REIT) (Retail) | | | 3,524,057 | |
| | | | | | | | |
| | | | | | | 18,835,723 | |
| | |
| | Finland – 1.2% | |
| | 1,643,245 | | | Citycon OYJ (Retail) | | | 3,742,997 | |
| | |
| | France – 12.1% | |
| | 76,442 | | | Fonciere Des Regions (REIT) (Diversified) | | | 6,756,412 | |
| | 299,671 | | | Klepierre (REIT) (Retail) | | | 13,223,059 | |
| | 71,368 | | | Unibail-Rodamco SE (REIT) (Retail) | | | 18,462,478 | |
| | | | | | | | |
| | | | | | | 38,441,949 | |
| | |
| | Germany – 5.7% | |
| | 495,228 | | | Vonovia SE (Residential) | | | 18,082,739 | |
| | |
| | Hong Kong – 15.9% | |
| | 2,357,000 | | | Cheung Kong Property Holdings Ltd. (Diversified) | | | 14,850,638 | |
| | 2,977,000 | | | Fortune Real Estate Investment Trust (REIT) (Retail) | | | 3,557,391 | |
| | 1,519,100 | | | Hongkong Land Holdings Ltd. (Office) | | | 9,257,449 | |
| | 7,451,400 | | | Mapletree Greater China Commercial Trust (REIT) (Retail) | | | 5,605,614 | |
| | 1,434,475 | | | Sun Hung Kai Properties Ltd. (Diversified) | | | 17,312,521 | |
| | | | | | | | |
| | | | | | | 50,583,613 | |
| | |
| | Japan – 25.7% | |
| | 3,378 | | | Comforia Residential REIT, Inc. (REIT) (Residential) | | | 7,597,494 | |
| | 3,333 | | | Japan Retail Fund Investment Corp. (REIT) (Retail) | | | 8,510,707 | |
| | |
| | Common Stocks – (continued) | |
| | Japan – (continued) | |
| | 1,099,000 | | | Mitsubishi Estate Co. Ltd. (Diversified) | | $ | 20,158,731 | |
| | 418,000 | | | Mitsui Fudosan Co. Ltd. (Office) | | | 9,593,429 | |
| | 6,278 | | | Orix JREIT, Inc. (REIT) (Diversified) | | | 10,811,882 | |
| | 375,200 | | | Sekisui House Ltd. (Residential) | | | 6,570,534 | |
| | 558,000 | | | Sumitomo Realty & Development Co. Ltd. (Office) | | | 15,131,490 | |
| | 811 | | | Top REIT, Inc. (REIT) (Diversified) | | | 3,278,096 | |
| | | | | | | | |
| | | | | | | 81,652,363 | |
| | |
| | Netherlands – 1.0% | |
| | 68,872 | | | Wereldhave NV (REIT) (Diversified) | | | 3,111,392 | |
| | |
| | Norway – 0.6% | |
| | 211,495 | | | Entra ASA (Office)(a) | | | 1,992,707 | |
| | |
| | Singapore – 1.9% | |
| | 982,600 | | | City Developments Ltd. (Diversified) | | | 5,971,111 | |
| | |
| | Spain – 1.8% | |
| | 529,375 | | | Merlin Properties Socimi SA (REIT) (Diversified) | | | 5,586,446 | |
| | |
| | Sweden – 1.5% | |
| | 296,423 | | | Hufvudstaden AB Class A (Diversified) | | | 4,652,498 | |
| | |
| | Switzerland – 2.3% | |
| | 76,182 | | | PSP Swiss Property AG (Registered) (Office) | | | 7,391,653 | |
| | |
| | United Kingdom – 8.1% | |
| | 394,285 | | | Big Yellow Group PLC (REIT) (Industrial) | | | 4,105,677 | |
| | 884,794 | | | Hammerson PLC (REIT) (Retail) | | | 6,372,797 | |
| | 327,127 | | | Helical Bar PLC (Diversified) | | | 1,238,963 | |
| | 368,850 | | | Kennedy Wilson Europe Real Estate PLC (Other) | | | 4,736,323 | |
| | 666,907 | | | The British Land Co. PLC (REIT) (Diversified) | | | 5,414,813 | |
| | 480,876 | | | The UNITE Group PLC (Other) | | | 3,978,046 | |
| | | | | | | | |
| | | | | | | 25,846,619 | |
| | |
| | TOTAL INVESTMENTS – 96.6% | |
| | (Cost $313,634,040) | | $ | 307,081,326 | |
| | |
| OTHER ASSETS IN EXCESS OF
LIABILITIES – 3.4% | | | 10,931,687 | |
| | |
| | NET ASSETS – 100.0% | | $ | 318,013,013 | |
| | |
| | |
| The accompanying notes are an integral part of these financial statements. | | 23 |
GOLDMAN SACHS INTERNATIONAL REAL ESTATE SECURITIES FUND
Schedule of Investments (continued)
June 30, 2016 (Unaudited)
| | |
| The percentage shown for each investment category reflects the value of investments in that category as a percentage of net assets. |
(a) | | Exempt from registration under Rule 144A of the Securities Act of 1933. Under procedures approved by the Board of Trustees, such securities may be deemed liquid by the Investment Adviser and may be resold, normally to qualified institutional buyers in transactions exempt from registration. Total market value of Rule 144A securities amounts to $1,992,707, which represents approximately 0.6% of net assets as of June 30, 2016. |
| | |
|
Investment Abbreviation: |
REIT | | —Real Estate Investment Trust |
|
| | |
| 24 | | The accompanying notes are an integral part of these financial statements. |
GOLDMAN SACHS REAL ESTATE SECURITIES FUND
Schedule of Investments
June 30, 2016 (Unaudited)
| | | | | | | | |
Shares | | | Description | | Value | |
| | Common Stocks – 97.0% | |
| | Commercial – 27.3% | |
| | 90,773 | | | Alexandria Real Estate Equities, Inc. (REIT) | | $ | 9,396,821 | |
| | 209,641 | | | Boston Properties, Inc. (REIT) | | | 27,651,648 | |
| | 280,425 | | | CyrusOne, Inc. (REIT) | | | 15,608,456 | |
| | 108,957 | | | EastGroup Properties, Inc. (REIT) | | | 7,509,316 | |
| | 56,865 | | | Equinix, Inc. (REIT) | | | 22,048,266 | |
| | 237,344 | | | Liberty Property Trust (REIT) | | | 9,427,304 | |
| | 278,574 | | | Prologis, Inc. (REIT) | | | 13,661,269 | |
| | 82,969 | | | SL Green Realty Corp. (REIT) | | | 8,833,709 | |
| | 285,490 | | | Vornado Realty Trust (REIT) | | | 28,583,259 | |
| | | | | | | | |
| | | | | | | 142,720,048 | |
| | |
| | Health Care – 11.1% | |
| | 245,305 | | | Care Capital Properties, Inc. (REIT) | | | 6,429,444 | |
| | 284,689 | | | HCP, Inc. (REIT) | | | 10,072,297 | |
| | 333,677 | | | Ventas, Inc. (REIT) | | | 24,298,359 | |
| | 221,592 | | | Welltower, Inc. (REIT) | | | 16,878,663 | |
| | | | | | | | |
| | | | | | | 57,678,763 | |
| | |
| | Leisure – 6.9% | |
| | 603,082 | | | Chesapeake Lodging Trust (REIT) | | | 14,021,657 | |
| | 345,977 | | | Pebblebrook Hotel Trust (REIT) | | | 9,081,896 | |
| | 599,869 | | | RLJ Lodging Trust (REIT) | | | 12,867,190 | |
| | | | | | | | |
| | | | | | | 35,970,743 | |
| | |
| | Multifamily – 15.4% | |
| | 181,666 | | | AvalonBay Communities, Inc. (REIT) | | | 32,770,730 | |
| | 113,197 | | | Equity Residential (REIT) | | | 7,797,009 | |
| | 204,791 | | | Mid-America Apartment Communities, Inc. (REIT) | | | 21,789,762 | |
| | 296,790 | | | Post Properties, Inc. (REIT) | | | 18,119,030 | |
| | | | | | | | |
| | | | | | | 80,476,531 | |
| | |
| | Other – 0.7% | |
| | 142,618 | | | Toll Brothers, Inc.* | | | 3,837,850 | |
| | |
| | Retail – 25.3% | |
| | 247,118 | | | Acadia Realty Trust (REIT) | | | 8,777,631 | |
| | 755,264 | | | Brixmor Property Group, Inc. (REIT) | | | 19,984,286 | |
| | 881,020 | | | DDR Corp. (REIT) | | | 15,981,703 | |
| | 102,544 | | | Federal Realty Investment Trust (REIT) | | | 16,976,159 | |
| | 277,978 | | | Simon Property Group, Inc. (REIT) | | | 60,293,428 | |
| | 134,941 | | | Taubman Centers, Inc. (REIT) | | | 10,012,622 | |
| | | | | | | | |
| | | | | | | 132,025,829 | |
| | |
| | Self Storage – 10.3% | |
| | 147,479 | | | Public Storage (REIT) | | | 37,694,158 | |
| | 153,598 | | | Sovran Self Storage, Inc. (REIT) | | | 16,115,502 | |
| | | | | | | | |
| | | | | | | 53,809,660 | |
| | |
| | TOTAL INVESTMENTS – 97.0% | |
| | (Cost $337,748,139) | | $ | 506,519,424 | |
| | |
| OTHER ASSETS IN EXCESS OF
LIABILITIES – 3.0% | | | 15,813,987 | |
| | |
| | NET ASSETS – 100.0% | | $ | 522,333,411 | |
| | |
| | |
| The percentage shown for each investment category reflects the value of investments in that category as a percentage of net assets. |
* | | Non-income producing security. |
| | |
|
Investment Abbreviation: |
REIT | | —Real Estate Investment Trust |
|
| | |
| The accompanying notes are an integral part of these financial statements. | | 25 |
GOLDMAN SACHS REAL ESTATE SECURITIES FUNDS
Statements of Assets and Liabilities
June 30, 2016 (Unaudited)
| | | | | | | | | | | | | | |
| | | | | Global
Real Estate
Securities Fund | | | International
Real Estate
Securities Fund | | | Real Estate
Securities
Fund | |
| | Assets: | |
| | Investments in unaffiliated issuers, at value (cost $18,893,826, $313,634,040 and $337,748,139) | | $ | 20,481,665 | | | $ | 307,081,326 | | | $ | 506,519,424 | |
| | Investments in affiliated issuers, at value (cost $937,607, $0 and $0) | | | 937,607 | | | | — | | | | — | |
| | Cash | | | 126,591 | | | | 6,244,469 | | | | — | |
| | Foreign currencies, at value (cost $27,330, $340,816 and $0 ) | | | 27,316 | | | | 340,295 | | | | — | |
| | Receivables: | | | | | | | | | | | | |
| | Investments sold | | | 112,305 | | | | — | | | | 22,084,059 | |
| | Dividends | | | 70,260 | | | | 1,112,233 | | | | 1,913,712 | |
| | Due from custodian | | | 14,936 | | | | — | | | | — | |
| | Fund shares sold | | | 7,100 | | | | 4,296,316 | | | | 732,436 | |
| | Foreign tax reclaims | | | 767 | | | | 207,726 | | | | — | |
| | Reimbursement from investment adviser | | | — | | | | 36,790 | | | | 32,085 | |
| | Deferred offering costs | | | 25,521 | | | | — | | | | — | |
| | Total assets | | | 21,804,068 | | | | 319,319,155 | | | | 531,281,716 | |
| | | | | | | | | | | | | | |
| | Liabilities: | | | | | | | | | | | | |
| | Payables: | | | | | | | | | | | | |
| | Investments purchased | | | 347,099 | | | | — | | | | — | |
| | Management fees | | | 123,190 | | | | 248,194 | | | | 377,990 | |
| | Distribution and Service fees and Transfer Agency fees | | | 721 | | | | 14,246 | | | | 56,567 | |
| | Fund shares redeemed | | | — | | | | 914,933 | | | | 6,377,212 | |
| | Due to custodian | | | — | | | | — | | | | 1,994,969 | |
| | Accrued expenses | | | 94,509 | | | | 128,769 | | | | 141,567 | |
| | Total liabilities | | | 565,519 | | | | 1,306,142 | | | | 8,948,305 | |
| | | | | | | | | | | | | | |
| | Net Assets: | | | | | | | | | | | | |
| | Paid-in capital | | | 19,421,876 | | | | 904,193,372 | | | | 325,751,628 | |
| | Undistributed (distributions in excess of) net investment income | | | 4,578 | | | | (4,177,644 | ) | | | 848,324 | |
| | Accumulated net realized gain (loss) | | | 224,586 | | | | (575,451,347 | ) | | | 26,962,174 | |
| | Net unrealized gain (loss) | | | 1,587,509 | | | | (6,551,368 | ) | | | 168,771,285 | |
| | | NET ASSETS | | $ | 21,238,549 | | | $ | 318,013,013 | | | $ | 522,333,411 | |
| | | Net Assets: | | | | | | | | | | | | |
| | | Class A | | $ | 28,061 | | | $ | 6,789,128 | | | $ | 62,103,302 | |
| | | Class C | | | 27,880 | | | | 1,532,655 | | | | 15,976,468 | |
| | | Institutional | | | 21,098,346 | | | | 309,562,711 | | | | 424,592,250 | |
| | | Service | | | — | | | | — | | | | 3,296,815 | |
| | | Class IR | | | 28,113 | | | | 118,824 | | | | 11,558,783 | |
| | | Class R | | | 27,996 | | | | — | | | | 4,794,403 | |
| | | Class R6 | | | 28,153 | | | | 9,695 | | | | 11,390 | |
| | | Total Net Assets | | $ | 21,238,549 | | | $ | 318,013,013 | | | $ | 522,333,411 | |
| | | Shares outstanding $0.001 par value (unlimited shares authorized): | | | | | | | | | | | | |
| | | Class A | | | 2,549 | | | | 1,103,295 | | | | 2,922,221 | |
| | | Class C | | | 2,536 | | | | 249,103 | | | | 774,579 | |
| | | Institutional | | | 1,916,016 | | | | 51,892,405 | | | | 19,586,551 | |
| | | Service | | | — | | | | — | | | | 154,237 | |
| | | Class IR | | | 2,553 | | | | 19,466 | | | | 541,330 | |
| | | Class R | | | 2,545 | | | | — | | | | 227,079 | |
| | | Class R6 | | | 2,556 | | | | 1,626 | | | | 525 | |
| | | Net asset value, offering and redemption price per share:(a) | | | | | | | | | | | | |
| | | Class A | | | $11.01 | | | | $6.15 | | | | $21.25 | |
| | | Class C | | | 11.00 | | | | 6.15 | | | | 20.63 | |
| | | Institutional | | | 11.01 | | | | 5.97 | | | | 21.68 | |
| | | Service | | | — | | | | — | | | | 21.38 | |
| | | Class IR | | | 11.01 | | | | 6.10 | | | | 21.35 | |
| | | Class R | | | 11.00 | | | | — | | | | 21.11 | |
| | | Class R6 | | | 11.01 | | | | 5.96 | | | | 21.68 | (b) |
| | (a) | | Maximum public offering price per share for Class A Shares of the Global Real Estate Securities, International Real Estate Securities and Real Estate Securities Funds is 11.65, 6.51 and 22.49, respectively. At redemption, Class C Shares may be subject to a contingent deferred sales charge assessed on the amount equal to the lesser of the current NAV or the original purchase price of the shares. |
| | |
| 26 | | The accompanying notes are an integral part of these financial statements. |
GOLDMAN SACHS REAL ESTATE SECURITIES FUNDS
Statements of Operations
For the Six Months Ended June 30, 2016 (Unaudited)
| | | | | | | | | | | | | | |
| | | | | Global
Real Estate
Securities Fund | | | International
Real Estate
Securities Fund | | | Real Estate
Securities
Fund | |
| | Investment income: | |
| | Dividends — unaffiliated issuers (net of foreign taxes withheld of $22,003, $564,498 and $0) | | $ | 269,225 | | | $ | 6,149,675 | | | $ | 8,714,378 | |
| | Dividends — affiliated issuer | | | 702 | | | | — | | | | — | |
| | Total investment income | | | 269,927 | | | | 6,149,675 | | | | 8,714,378 | |
| | | | | | | | | | | | | | |
| | Expenses: | | | | | | | | | | | | |
| | Management fees | | | 77,727 | | | | 1,685,337 | | | | 2,601,002 | |
| | Amortization of offering costs | | | 77,416 | | | | — | | | | — | |
| | Professional fees | | | 47,066 | | | | 49,566 | | | | 50,998 | |
| | Registration fees | | | 13,366 | | | | 36,298 | | | | 61,980 | |
| | Printing and mailing costs | | | 9,988 | | | | 19,065 | | | | 27,105 | |
| | Trustee fees | | | 8,317 | | | | 12,691 | | | | 12,795 | |
| | Custody, accounting and administrative services | | | 5,000 | | | | 99,774 | | | | 40,111 | |
| | Transfer Agency fees(a) | | | 3,036 | | | | 70,907 | | | | 167,148 | |
| | Distribution and Service fees(a) | | | 230 | | | | 16,769 | | | | 155,244 | |
| | Service share fees — Service Plan | | | — | | | | — | | | | 3,693 | |
| | Service share fees — Shareholder Administration Plan | | | — | | | | — | | | | 3,693 | |
| | Other | | | 1,243 | | | | 12,130 | | | | 12,216 | |
| | Total expenses | | | 243,389 | | | | 2,002,537 | | | | 3,135,985 | |
| | Less — expense reductions | | | (169,195 | ) | | | (384,845 | ) | | | (535,329 | ) |
| | Net expenses | | | 74,194 | | | | 1,617,692 | | | | 2,600,656 | |
| | NET INVESTMENT INCOME | | | 195,733 | | | | 4,531,983 | | | | 6,113,722 | |
| | | | | | | | | | | | | | |
| | Realized and unrealized gain (loss): | | | | | | | | | | | | |
| | Net realized gain (loss) from: | | | | | | | | | | | | |
| | Investments | | | 211,489 | | | | 2,470,075 | | | | 19,535,616 | |
| | Foreign currency transactions | | | 5,900 | | | | (96,319 | ) | | | — | |
| | Net change in unrealized gain (loss) on: | | | | | | | | | | | | |
| | Investments | | | 1,443,961 | | | | (1,222,466 | ) | | | 22,498,027 | |
| | Foreign currency translation | | | (240 | ) | | | 108,379 | | | | — | |
| | Net realized and unrealized gain | | | 1,661,110 | | | | 1,259,669 | | | | 42,033,643 | |
| | NET INCREASE IN NET ASSETS RESULTING FROM OPERATIONS | | $ | 1,856,843 | | | $ | 5,791,652 | | | $ | 48,147,365 | |
| | (a) | | Class specific Distribution and Service, and Transfer Agency fees were as follows: |
| | | | | | | | | | | | | | | | | | | | | | | | | | | | | | | | | | | | | | | | |
| | | Distribution and Service Fees | | | Transfer Agency Fees | |
Fund | | Class A | | | Class C | | | Class R | | | Class A | | | Class C | | | Institutional | | | Service | | | Class IR | | | Class R | | | Class R6 | |
Global Real Estate Securities | | $ | 33 | | | $ | 131 | | | $ | 66 | | | $ | 25 | | | $ | 25 | | | $ | 2,934 | | | $ | — | | | $ | 25 | | | $ | 25 | | | $ | 2 | |
International Real Estate Securities | | | 9,147 | | | | 7,622 | | | | — | | | | 6,952 | | | | 1,448 | | | | 62,414 | | | | — | | | | 91 | | | | — | | | | 2 | |
Real Estate Securities | | | 71,930 | | | | 73,326 | | | | 9,988 | | | | 54,667 | | | | 13,932 | | | | 86,619 | | | | 591 | | | | 7,541 | | | | 3,796 | | | | 2 | |
| | |
| The accompanying notes are an integral part of these financial statements. | | 27 |
GOLDMAN SACHS REAL ESTATE SECURITIES FUNDS
Statements of Changes in Net Assets
| | | | | | | | | | |
| | | | | Global Real Estate Securities Fund | |
| | | | | For the
Six Months Ended
June 30, 2016
(Unaudited) | | | For the Fiscal Year Ended
December 31, 2015(a) | |
| | From operations: | | | | | | | | |
| | Net investment income | | $ | 195,733 | | | $ | 18,850 | |
| | Net realized gain | | | 217,389 | | | | 12,376 | |
| | Net change in unrealized gain (loss) | | | 1,443,721 | | | | 143,788 | |
| | Net increase (decrease) in net assets resulting from operations | | | 1,856,843 | | | | 175,014 | |
| | | | | | | | | | |
| | Distributions to shareholders: | | | | | | | | |
| | From net investment income | | | | | | | | |
| | Class A Shares | | | (192 | ) | | | (291 | ) |
| | Class C Shares | | | (98 | ) | | | (242 | ) |
| | Institutional Shares | | | (172,163 | ) | | | (36,563 | ) |
| | Service Shares | | | — | | | | — | |
| | Class IR Shares | | | (223 | ) | | | (309 | ) |
| | Class R Shares | | | (161 | ) | | | (276 | ) |
| | Class R6 Shares | | | (244 | ) | | | (320 | ) |
| | From net realized gains | | | | | | | | |
| | Class A Shares | | | — | | | | (36 | ) |
| | Class C Shares | | | — | | | | (36 | ) |
| | Institutional Shares | | | — | | | | (4,140 | ) |
| | Service Shares | | | — | | | | — | |
| | Class IR Shares | | | — | | | | (36 | ) |
| | Class R Shares | | | — | | | | (36 | ) |
| | Class R6 Shares | | | — | | | | (36 | ) |
| | Total distributions to shareholders | | | (173,081 | ) | | | (42,321 | ) |
| | | | | | | | | | |
| | From share transactions: | | | | | | | | |
| | Proceeds from sales of shares | | | 17,935,933 | | | | 3,000,035 | |
| | Reinvestment of distributions | | | 173,081 | | | | 42,321 | |
| | Cost of shares redeemed | | | (1,729,252 | ) | | | (24 | ) |
| | Net increase (decrease) in net assets resulting from share transactions | | | 16,379,762 | | | | 3,042,332 | |
| | TOTAL INCREASE (DECREASE) | | | 18,063,524 | | | | 3,175,025 | |
| | | | | | | | | | |
| | Net assets: | | | | | | | | |
| | Beginning of period | | | 3,175,025 | | | | — | |
| | End of period | | $ | 21,238,549 | | | $ | 3,175,025 | |
| | Undistributed (distributions in excess of ) net investment income | | $ | 4,578 | | | $ | (18,074 | ) |
| | (a) | | Commenced operations on August 31, 2015. |
| | |
| 28 | | The accompanying notes are an integral part of these financial statements. |
GOLDMAN SACHS REAL ESTATE SECURITIES FUNDS
| | | | | | | | | | | | | | | | | | | | | | |
| | | International Real Estate Securities Fund | | | | | Real Estate Securities Fund | |
| | | For the
Six Months Ended
June 30, 2016
(Unaudited) | | | | | For the Fiscal Year Ended
December 31, 2015 | | | | | For the
Six Months Ended
June 30, 2016
(Unaudited) | | | | | For the Fiscal
Year Ended
December 31, 2015 | |
| | | | | | | | | | | | | | | | | | | | | | |
| | $ | 4,531,983 | | | | | $ | 7,271,765 | | | | | $ | 6,113,722 | | | | | $ | 10,302,087 | |
| | | 2,373,756 | | | | | | 15,187,051 | | | | | | 19,535,616 | | | | | | 36,915,981 | |
| | | (1,114,087 | ) | | | | | (26,912,146 | ) | | | | | 22,498,027 | | | | | | (26,336,406 | ) |
| | | 5,791,652 | | | | | | (4,453,330 | ) | | | | | 48,147,365 | | | | | | 20,881,662 | |
| | | | | | | | | | | | | | | | | | | | | | |
| | | | | | | | | | | | | | | | | | | | | | |
| | | | | | | | | | | | | | | | | | | | | | |
| | | (61,744 | ) | | | | | (204,270 | ) | | | | | (672,653 | ) | | | | | (991,073 | ) |
| | | (8,777 | ) | | | | | (26,951 | ) | | | | | (125,455 | ) | | | | | (176,162 | ) |
| | | (3,497,760 | ) | | | | | (10,065,205 | ) | | | | | (5,657,193 | ) | | | | | (8,967,061 | ) |
| | | — | | | | | | — | | | | | | (33,556 | ) | | | | | (45,878 | ) |
| | | (1,261 | ) | | | | | (2,423 | ) | | | | | (118,678 | ) | | | | | (114,572 | ) |
| | | — | | | | | | — | | | | | | (45,827 | ) | | | | | (35,673 | ) |
| | | (111 | ) | | | | | (163 | ) | | | | | (140 | ) | | | | | (65 | ) |
| | | | | | | | | | | | | | | | | | | | | | |
| | | — | | | | | | — | | | | | | — | | | | | | (1,499,743 | ) |
| | | — | | | | | | — | | | | | | — | | | | | | (395,839 | ) |
| | | — | | | | | | — | | | | | | — | | | | | | (12,016,644 | ) |
| | | — | | | | | | — | | | | | | — | | | | | | (70,772 | ) |
| | | — | | | | | | — | | | | | | — | | | | | | (186,101 | ) |
| | | — | | | | | | — | | | | | | — | | | | | | (78,474 | ) |
| | | — | | | | | | — | | | | | | — | | | | | | (261 | ) |
| | | (3,569,653 | ) | | | | | (10,299,012 | ) | | | | | (6,653,502 | ) | | | | | (24,578,318 | ) |
| | | | | | | | | | | | | | | | | | | | | | |
| | | | | | | | | | | | | | | | | | | | | | |
| | | 22,802,021 | | | | | | 61,041,148 | | | | | | 38,267,798 | | | | | | 123,309,287 | |
| | | 3,563,886 | | | | | | 10,282,846 | | | | | | 6,496,747 | | | | | | 23,792,030 | |
| | | (53,598,639 | ) | | | | | (105,370,720 | ) | | | | | (113,207,644 | ) | | | | | (198,432,801 | ) |
| | | (27,232,732 | ) | | | | | (34,046,726 | ) | | | | | (68,443,099 | ) | | | | | (51,331,484 | ) |
| | | (25,010,733 | ) | | | | | (48,799,068 | ) | | | | | (26,949,236 | ) | | | | | (55,028,140 | ) |
| | | | | | | | | | | | | | | | | | | | | | |
| | | | | | | | | | | | | | | | | | | | | | |
| | | 343,023,746 | | | | | | 391,822,814 | | | | | | 549,282,647 | | | | | | 604,310,787 | |
| | $ | 318,013,013 | | | | | $ | 343,023,746 | | | | | $ | 522,333,411 | | | | | $ | 549,282,647 | |
| | $ | (4,177,644 | ) | | | | $ | (5,139,974 | ) | | | | $ | 848,324 | | | | | $ | 1,388,104 | |
| | |
| The accompanying notes are an integral part of these financial statements. | | 29 |
GOLDMAN SACHS GLOBAL REAL ESTATE SECURITIES FUNDS
Financial Highlights
Selected Data for a Share Outstanding Throughout Each Period
| | | | | | | | | | | | | | | | | | | | | | | | | | | | | | |
| | | | | | | | Income from
investment operations | | | Distributions
to shareholders | |
| | | Year - Share Class | | Net asset
value,
beginning
of period | | | Net
investment
income(a) | | | Net realized
and unrealized
gain | | | Total from
investment
operations | | | From net
investment
income | | | From net
realized
gains | | | Total
distributions | |
| | FOR THE SIX MONTHS ENDED JUNE 30, (UNAUDITED) | |
| | 2016 - A | | $ | 10.44 | | | $ | 0.10 | | | $ | 0.55 | | | $ | 0.65 | | | $ | (0.08 | ) | | $ | — | | | $ | (0.08 | ) |
| | 2016 - C | | | 10.43 | | | | 0.06 | | | | 0.55 | | | | 0.61 | | | | (0.04 | ) | | | — | | | | (0.04 | ) |
| | 2016 - Institutional | | | 10.44 | | | | 0.14 | | | | 0.53 | | | | 0.67 | | | | (0.10 | ) | | | — | | | | (0.10 | ) |
| | 2016 - IR | | | 10.44 | | | | 0.11 | | | | 0.55 | | | | 0.66 | | | | (0.09 | ) | | | — | | | | (0.09 | ) |
| | 2016 - R | | | 10.44 | | | | 0.08 | | | | 0.54 | | | | 0.62 | | | | (0.06 | ) | | | — | | | | (0.06 | ) |
| | 2016 - R6 | | | 10.44 | | | | 0.12 | | | | 0.55 | | | | 0.67 | | | | (0.10 | ) | | | — | | | | (0.10 | ) |
| | | | | | | | | | | | | | | | | | | | | | | | | | | | | | |
| | FOR THE PERIOD ENDED DECEMBER 31, | |
| | 2015 - A (Commenced August 31, 2015) | | | 10.00 | | | | 0.05 | | | | 0.52 | | | | 0.57 | | | | (0.12 | ) | | | (0.01 | ) | | | (0.13 | ) |
| | 2015 - C (Commenced August 31, 2015) | | | 10.00 | | | | 0.02 | | | | 0.52 | | | | 0.54 | | | | (0.10 | ) | | | (0.01 | ) | | | (0.11 | ) |
| | 2015 - Institutional (Commenced August 31, 2015) | | | 10.00 | | | | 0.06 | | | | 0.52 | | | | 0.58 | | | | (0.13 | ) | | | (0.01 | ) | | | (0.14 | ) |
| | 2015 - IR (Commenced August 31, 2015) | | | 10.00 | | | | 0.06 | | | | 0.51 | | | | 0.57 | | | | (0.12 | ) | | | (0.01 | ) | | | (0.13 | ) |
| | 2015 - R (Commenced August 31, 2015) | | | 10.00 | | | | 0.04 | | | | 0.52 | | | | 0.56 | | | | (0.11 | ) | | | (0.01 | ) | | | (0.12 | ) |
| | 2015 - R6 (Commenced August 31, 2015) | | | 10.00 | | | | 0.06 | | | | 0.52 | | | | 0.58 | | | | (0.13 | ) | | | (0.01 | ) | | | (0.14 | ) |
| | (a) | | Calculated based on the average shares outstanding methodology. |
| | (b) | | Assumes investment at the net asset value at the beginning of the period, reinvestment of all distributions, a complete redemption of the investment at the net asset value at the end of the period and no sales or redemption charges. Total returns would be reduced if a sales or redemption charge was taken into account. Returns do not reflect the deduction of taxes that a shareholder would pay on Fund distributions or the redemption of Fund shares. Total returns for periods less than one full year are not annualized. |
| | (c) | | The Fund’s portfolio turnover rate is calculated in accordance with regulatory requirements, without regard to transactions involving short term investments. If such transactions were included, the Fund’s portfolio turnover rate may be higher. |
| | |
| 30 | | The accompanying notes are an integral part of these financial statements. |
GOLDMAN SACHS GLOBAL REAL ESTATE SECURITIES FUNDS
| | | | | | | | | | | | | | | | | | | | | | | | | | | | | | | | | | | | | | | | |
| | | | | | | | | | | | | |
| | | Net asset
value, end
of period | | | | | Total
return(b) | | | | | Net assets,
end of
period (in 000s) | | | | | Ratio of
net expenses
to average
net assets | | | | | Ratio of
total expenses
to average
net assets | | | | | Ratio of
net investment
income to average net assets | | | | | Portfolio
turnover
rate(c) | |
| | | | | | | | | | | | | | | | | | | | | | | | | | | | | | | | | | | | | | | | |
| | $ | 11.01 | | | | | | 6.19 | % | | | | $ | 28 | | | | | | 1.39 | %(d) | | | | | 5.62 | %(d) | | | | | 1.88 | %(d) | | | | | 37 | % |
| | | 11.00 | | | | | | 5.84 | | | | | | 28 | | | | | | 2.14 | (d) | | | | | 6.38 | (d) | | | | | 1.12 | (d) | | | | | 37 | |
| | | 11.01 | | | | | | 6.39 | | | | | | 21,098 | | | | | | 0.99 | (d) | | | | | 2.73 | (d) | | | | | 2.65 | (d) | | | | | 37 | |
| | | 11.01 | | | | | | 6.31 | | | | | | 28 | | | | | | 1.14 | (d) | | | | | 5.37 | (d) | | | | | 2.12 | (d) | | | | | 37 | |
| | | 11.00 | | | | | | 5.98 | | | | | | 28 | | | | | | 1.64 | (d) | | | | | 5.87 | (d) | | | | | 1.62 | (d) | | | | | 37 | |
| | | 11.01 | | | | | | 6.39 | | | | | | 28 | | | | | | 0.97 | (d) | | | | | 5.20 | (d) | | | | | 2.29 | (d) | | | | | 37 | |
| | | | | | | | | | | | | | | | | | | | | | | | | | | | | | | | | | | | | | | | |
| | | | | | | | | | | | | | | | | | | | | | | | | | | | | | | | | | | | | | | | |
| | | 10.44 | | | | | | 5.71 | | | | | | 26 | | | | | | 1.40 | (d) | | | | | 15.24 | (d) | | | | | 1.43 | (d) | | | | | 14 | |
| | | 10.43 | | | | | | 5.41 | | | | | | 26 | | | | | | 2.15 | (d) | | | | | 16.01 | (d) | | | | | 0.68 | (d) | | | | | 14 | |
| | | 10.44 | | | | | | 5.81 | | | | | | 3,043 | | | | | | 1.00 | (d) | | | | | 14.86 | (d) | | | | | 1.83 | (d) | | | | | 14 | |
| | | 10.44 | | | | | | 5.78 | | | | | | 26 | | | | | | 1.16 | (d) | | | | | 15.02 | (d) | | | | | 1.68 | (d) | | | | | 14 | |
| | | 10.44 | | | | | | 5.65 | | | | | | 26 | | | | | | 1.65 | (d) | | | | | 15.51 | (d) | | | | | 1.18 | (d) | | | | | 14 | |
| | | 10.44 | | | | | | 5.82 | | | | | | 26 | | | | | | 0.98 | (d) | | | | | 14.85 | (d) | | | | | 1.85 | (d) | | | | | 14 | |
| | |
| The accompanying notes are an integral part of these financial statements. | | 31 |
GOLDMAN SACHS INTERNATIONAL REAL ESTATE SECURITIES FUNDS
Financial Highlights
Selected Data for a Share Outstanding Throughout Each Period
| | | | | | | | | | | | | | | | | | | | | | |
| | | | | | | | Income from
investment operations | | | | |
| | | Year - Share Class | | Net asset
value,
beginning
of period | | | Net
investment
income(a) | | | Net realized
and unrealized
gain (loss) | | | Total from
investment
operations | | | Distributions
to shareholders
from net
investment
income | |
| | FOR THE SIX MONTHS ENDED JUNE 30, (UNAUDITED) | |
| | 2016 - A | | $ | 6.09 | | | $ | 0.07 | | | $ | 0.05 | | | $ | 0.12 | | | $ | (0.06 | ) |
| | 2016 - C | | | 6.09 | | | | 0.05 | | | | 0.05 | | | | 0.10 | | | | (0.04 | ) |
| | 2016 - Institutional | | | 5.91 | | | | 0.08 | | | | 0.05 | | | | 0.13 | | | | (0.07 | ) |
| | 2016 - IR | | | 6.04 | | | | 0.08 | | | | 0.05 | | | | 0.13 | | | | (0.07 | ) |
| | 2016 - R6 | | | 5.91 | | | | 0.09 | | | | 0.03 | | | | 0.12 | | | | (0.07 | ) |
| | | | | | | | | | | | | | | | | | | | | | |
| | FOR THE FISCAL YEARS ENDED DECEMBER 31, | | | | | | | | | | | | | | | | | | | | |
| | 2015 - A | | | 6.38 | | | | 0.10 | | | | (0.24 | ) | | | (0.14 | ) | | | (0.15 | ) |
| | 2015 - C | | | 6.38 | | | | 0.05 | | | | (0.24 | ) | | | (0.19 | ) | | | (0.10 | ) |
| | 2015 - Institutional | | | 6.19 | | | | 0.12 | | | | (0.22 | ) | | | (0.10 | ) | | | (0.18 | ) |
| | 2015 - IR | | | 6.33 | | | | 0.11 | | | | (0.24 | ) | | | (0.13 | ) | | | (0.16 | ) |
| | 2015 - R6 (Commenced July 31, 2015) | | | 6.33 | | | | 0.05 | | | | (0.37 | ) | | | (0.32 | ) | | | (0.10 | ) |
| | 2014 - A | | | 6.54 | | | | 0.21 | (e) | | | (0.14 | ) | | | 0.07 | | | | (0.23 | ) |
| | 2014 - C | | | 6.53 | | | | 0.16 | | | | (0.13 | ) | | | 0.03 | | | | (0.18 | ) |
| | 2014 - Institutional | | | 6.35 | | | | 0.22 | (e) | | | (0.12 | ) | | | 0.10 | | | | (0.26 | ) |
| | 2014 - IR | | | 6.48 | | | | 0.20 | (e) | | | (0.11 | ) | | | 0.09 | | | | (0.24 | ) |
| | 2013 - A | | | 6.46 | | | | 0.15 | (f) | | | 0.22 | | | | 0.37 | | | | (0.29 | ) |
| | 2013 - C | | | 6.46 | | | | 0.11 | (f) | | | 0.20 | | | | 0.31 | | | | (0.24 | ) |
| | 2013 - Institutional | | | 6.29 | | | | 0.18 | (f) | | | 0.20 | | | | 0.38 | | | | (0.32 | ) |
| | 2013 - IR | | | 6.40 | | | | 0.18 | (f) | | | 0.20 | | | | 0.38 | | | | (0.30 | ) |
| | 2012 - A | | | 4.94 | | | | 0.12 | | | | 1.95 | | | | 2.07 | | | | (0.55 | ) |
| | 2012 - C | | | 4.95 | | | | 0.07 | | | | 1.96 | | | | 2.03 | | | | (0.52 | ) |
| | 2012 - Institutional | | | 4.84 | | | | 0.14 | | | | 1.91 | | | | 2.05 | | | | (0.60 | ) |
| | 2012 - IR | | | 4.92 | | | | 0.14 | | | | 1.93 | | | | 2.07 | | | | (0.59 | ) |
| | 2011 - A | | | 6.32 | | | | 0.13 | | | | (1.34 | ) | | | (1.21 | ) | | | (0.17 | ) |
| | 2011 - C | | | 6.34 | | | | 0.08 | | | | (1.35 | ) | | | (1.27 | ) | | | (0.12 | ) |
| | 2011 - Institutional | | | 6.20 | | | | 0.15 | | | | (1.32 | ) | | | (1.17 | ) | | | (0.19 | ) |
| | 2011 - IR | | | 6.30 | | | | 0.15 | | | | (1.35 | ) | | | (1.20 | ) | | | (0.18 | ) |
| | (a) | | Calculated based on the average shares outstanding methodology. |
| | (b) | | Assumes investment at the net asset value at the beginning of the period, reinvestment of all distributions, a complete redemption of the investment at the net asset value at the end of the period and no sales or redemption charges. Total returns would be reduced if a sales or redemption charge was taken into account. Returns do not reflect the deduction of taxes that a shareholder would pay on Fund distributions or the redemption of Fund shares. Total returns for periods less than one full year are not annualized. |
| | (c) | | The Fund’s portfolio turnover rate is calculated in accordance with regulatory requirements, without regard to transactions involving short term investments. If such transactions were included, the Fund’s portfolio turnover rate may be higher. |
| | (e) | | Reflects income recognized from a corporate action which amounted to $0.10 per share and 1.50% of average net assets. |
| | (f) | | Reflects income recognized from special dividends which amounted to $0.04 per share and 0.65% of average net assets. |
| | |
| 32 | | The accompanying notes are an integral part of these financial statements. |
GOLDMAN SACHS INTERNATIONAL REAL ESTATE SECURITIES FUNDS
| | | | | | | | | | | | | | | | | | | | | | | | | | | | | | | | | | | | | | | | |
| | | | | | | | | | | | | |
| | | Net asset
value, end
of period | | | | | Total
return(b) | | | | | Net assets,
end of
period
(in 000s) | | | | | Ratio of
net expenses
to average
net assets | | | | | Ratio of
total expenses
to average
net assets | | | | | Ratio of
net investment
income to
average
net assets | | | | | Portfolio
turnover
rate(c) | |
| | | | | | | | | | | | | | | | | | | | | | | | | | | | | | | | | | | | | | | | |
| | $ | 6.15 | | | | | | 1.92 | % | | | | $ | 6,789 | | | | | | 1.39 | %(d) | | | | | 1.63 | %(d) | | | | | 2.44 | %(d) | | | | | 18 | % |
| | | 6.15 | | | | | | 1.57 | | | | | | 1,533 | | | | | | 2.14 | (d) | | | | | 2.38 | (d) | | | | | 1.71 | (d) | | | | | 18 | |
| | | 5.97 | | | | | | 2.19 | | | | | | 309,563 | | | | | | 0.99 | (d) | | | | | 1.23 | (d) | | | | | 2.84 | (d) | | | | | 18 | |
| | | 6.10 | | | | | | 2.09 | | | | | | 119 | | | | | | 1.14 | (d) | | | | | 1.38 | (d) | | | | | 2.75 | (d) | | | | | 18 | |
| | | 5.96 | | | | | | 2.03 | | | | | | 10 | | | | | | 0.98 | (d) | | | | | 1.16 | (d) | | | | | 2.91 | (d) | | | | | 18 | |
| | | | | | | | | | | | | | | | | | | | | | | | | | | | | | | | | | | | | | | | |
| | | | | | | | | | | | | | | | | | | | | | | | | | | | | | | | | | | | | | | | |
| | | 6.09 | | | | | | (2.25 | ) | | | | | 7,702 | | | | | | 1.41 | | | | | | 1.62 | | | | | | 1.50 | | | | | | 45 | |
| | | 6.09 | | | | | | (3.03 | ) | | | | | 1,622 | | | | | | 2.16 | | | | | | 2.37 | | | | | | 0.76 | | | | | | 45 | |
| | | 5.91 | | | | | | (1.73 | ) | | | | | 333,601 | | | | | | 1.01 | | | | | | 1.22 | | | | | | 1.92 | | | | | | 45 | |
| | | 6.04 | | | | | | (2.04 | ) | | | | | 88 | | | | | | 1.17 | | | | | | 1.37 | | | | | | 1.64 | | | | | | 45 | |
| | | 5.91 | | | | | | (5.03 | ) | | | | | 9 | | | | | | 0.99 | (d) | | | | | 1.15 | (d) | | | | | 1.91 | (d) | | | | | 45 | |
| | | 6.38 | | | | | | 1.05 | | | | | | 10,017 | | | | | | 1.46 | | | | | | 1.61 | | | | | | 3.13 | (e) | | | | | 50 | |
| | | 6.38 | | | | | | 0.44 | | | | | | 1,962 | | | | | | 2.21 | | | | | | 2.36 | | | | | | 2.42 | (e) | | | | | 50 | |
| | | 6.19 | | | | | | 1.53 | | | | | | 379,651 | | | | | | 1.05 | | | | | | 1.21 | | | | | | 3.42 | (e) | | | | | 50 | |
| | | 6.33 | | | | | | 1.38 | | | | | | 193 | | | | | | 1.21 | | | | | | 1.35 | | | | | | 2.98 | (e) | | | | | 50 | |
| | | 6.54 | | | | | | 5.81 | | | | | | 14,542 | | | | | | 1.48 | | | | | | 1.60 | | | | | | 2.24 | (f) | | | | | 45 | |
| | | 6.53 | | | | | | 4.90 | | | | | | 2,514 | | | | | | 2.23 | | | | | | 2.35 | | | | | | 1.65 | (f) | | | | | 45 | |
| | | 6.35 | | | | | | 6.15 | | | | | | 387,178 | | | | | | 1.08 | | | | | | 1.20 | | | | | | 2.79 | (f) | | | | | 45 | |
| | | 6.48 | | | | | | 6.11 | | | | | | 944 | | | | | | 1.23 | | | | | | 1.35 | | | | | | 2.70 | (f) | | | | | 45 | |
| | | 6.46 | | | | | | 42.31 | | | | | | 23,019 | | | | | | 1.52 | | | | | | 1.63 | | | | | | 2.01 | | | | | | 55 | |
| | | 6.46 | | | | | | 41.43 | | | | | | 2,253 | | | | | | 2.27 | | | | | | 2.37 | | | | | | 1.23 | | | | | | 55 | |
| | | 6.29 | | | | | | 42.78 | | | | | | 314,518 | | | | | | 1.12 | | | | | | 1.22 | | | | | | 2.35 | | | | | | 55 | |
| | | 6.40 | | | | | | 42.62 | | | | | | 2,043 | | | | | | 1.27 | | | | | | 1.36 | | | | | | 2.25 | | | | | | 55 | |
| | | 4.94 | | | | | | (19.46 | ) | | | | | 83,295 | | | | | | 1.53 | | | | | | 1.64 | | | | | | 2.15 | | | | | | 67 | |
| | | 4.95 | | | | | | (20.20 | ) | | | | | 1,980 | | | | | | 2.28 | | | | | | 2.39 | | | | | | 1.37 | | | | | | 67 | |
| | | 4.84 | | | | | | (19.14 | ) | | | | | 183,167 | | | | | | 1.13 | | | | | | 1.24 | | | | | | 2.56 | | | | | | 67 | |
| | | 4.92 | | | | | | (19.26 | ) | | | | | 16 | | | | | | 1.28 | | | | | | 1.39 | | | | | | 2.59 | | | | | | 67 | |
| | |
| The accompanying notes are an integral part of these financial statements. | | 33 |
GOLDMAN SACHS REAL ESTATE SECURITIES FUNDS
Financial Highlights
Selected Data for a Share Outstanding Throughout Each Period
| | | | | | | | | | | | | | | | | | | | | | | | | | | | | | |
| | | | | | | | Income from
investment operations | | | Distributions
to shareholders | |
| | | Year - Share Class | | Net asset
value,
beginning
of period | | | Net
investment
income(a) | | | Net realized
and unrealized
gain | | | Total from
investment
operations | | | From net
investment
income | | | From net
realized
gains | | | Total
distributions | |
| | FOR THE SIX MONTHS ENDED JUNE 30, (UNAUDITED) | |
| | 2016 - A | | $ | 19.59 | | | $ | 0.20 | (d) | | $ | 1.69 | | | $ | 1.89 | | | $ | (0.23 | ) | | $ | — | | | $ | (0.23 | ) |
| | 2016 - C | | | 19.03 | | | | 0.12 | (d) | | | 1.64 | | | | 1.76 | | | | (0.16 | ) | | | — | | | | (0.16 | ) |
| | 2016 - Institutional | | | 19.97 | | | | 0.24 | (d) | | | 1.74 | | | | 1.98 | | | | (0.27 | ) | | | — | | | | (0.27 | ) |
| | 2016 - Service | | | 19.71 | | | | 0.19 | (d) | | | 1.70 | | | | 1.89 | | | | (0.22 | ) | | | — | | | | (0.22 | ) |
| | 2016 - IR | | | 19.68 | | | | 0.24 | (d) | | | 1.69 | | | | 1.93 | | | | (0.26 | ) | | | — | | | | (0.26 | ) |
| | 2016 - R | | | 19.47 | | | | 0.19 | (d) | | | 1.66 | | | | 1.85 | | | | (0.21 | ) | | | — | | | | (0.21 | ) |
| | 2016 - R6 | | | 19.98 | | | | 0.25 | (d) | | | 1.72 | | | | 1.97 | | | | (0.27 | ) | | | — | | | | (0.27 | ) |
| | | | | | | | | | | | | | | | | | | | | | | | | | | | | | |
| | FOR THE FISCAL YEARS ENDED DECEMBER 31, | |
| | 2015 - A | | | 19.83 | | | | 0.29 | | | | 0.30 | | | | 0.59 | | | | (0.31 | ) | | | (0.52 | ) | | | (0.83 | ) |
| | 2015 - C | | | 19.32 | | | | 0.14 | | | | 0.30 | | | | 0.44 | | | | (0.21 | ) | | | (0.52 | ) | | | (0.73 | ) |
| | 2015 - Institutional | | | 20.18 | | | | 0.38 | | | | 0.30 | | | | 0.68 | | | | (0.37 | ) | | | (0.52 | ) | | | (0.89 | ) |
| | 2015 - Service | | | 19.94 | | | | 0.27 | | | | 0.32 | | | | 0.59 | | | | (0.30 | ) | | | (0.52 | ) | | | (0.82 | ) |
| | 2015 - IR | | | 19.90 | | | | 0.35 | | | | 0.30 | | | | 0.65 | | | | (0.35 | ) | | | (0.52 | ) | | | (0.87 | ) |
| | 2015 - R | | | 19.73 | | | | 0.27 | | | | 0.27 | | | | 0.54 | | | | (0.28 | ) | | | (0.52 | ) | | | (0.80 | ) |
| | 2015 - R6 (Commenced July 31, 2015) | | | 19.93 | | | | 0.22 | | | | 0.48 | | | | 0.70 | | | | (0.13 | ) | | | (0.52 | ) | | | (0.65 | ) |
| | 2014 - A | | | 15.54 | | | | 0.21 | (f) | | | 4.36 | | | | 4.57 | | | | (0.28 | ) | | | — | | | | (0.28 | ) |
| | 2014 - C | | | 15.18 | | | | 0.07 | (f) | | | 4.25 | | | | 4.32 | | | | (0.18 | ) | | | — | | | | (0.18 | ) |
| | 2014 - Institutional | | | 15.80 | | | | 0.27 | (f) | | | 4.44 | | | | 4.71 | | | | (0.33 | ) | | | — | | | | (0.33 | ) |
| | 2014 - Service | | | 15.63 | | | | 0.18 | (f) | | | 4.39 | | | | 4.57 | | | | (0.26 | ) | | | — | | | | (0.26 | ) |
| | 2014 - IR | | | 15.59 | | | | 0.31 | (f) | | | 4.31 | | | | 4.62 | | | | (0.31 | ) | | | — | | | | (0.31 | ) |
| | 2014 - R | | | 15.48 | | | | 0.19 | (f) | | | 4.31 | | | | 4.50 | | | | (0.25 | ) | | | — | | | | (0.25 | ) |
| | 2013 - A | | | 15.44 | | | | 0.16 | | | | 0.18 | | | | 0.34 | | | | (0.24 | ) | | | — | | | | (0.24 | ) |
| | 2013 - C | | | 15.12 | | | | 0.05 | | | | 0.16 | | | | 0.21 | | | | (0.15 | ) | | | — | | | | (0.15 | ) |
| | 2013 - Institutional | | | 15.68 | | | | 0.24 | | | | 0.17 | | | | 0.41 | | | | (0.29 | ) | | | — | | | | (0.29 | ) |
| | 2013 - Service | | | 15.53 | | | | 0.14 | | | | 0.18 | | | | 0.32 | | | | (0.22 | ) | | | — | | | | (0.22 | ) |
| | 2013 - IR | | | 15.49 | | | | 0.22 | | | | 0.15 | | | | 0.37 | | | | (0.27 | ) | | | — | | | | (0.27 | ) |
| | 2013 - R | | | 15.39 | | | | 0.14 | | | | 0.16 | | | | 0.30 | | | | (0.21 | ) | | | — | | | | (0.21 | ) |
| | 2012 - A | | | 13.48 | | | | 0.12 | | | | 2.05 | | | | 2.17 | | | | (0.21 | ) | | | — | | | | (0.21 | ) |
| | 2012 - C | | | 13.22 | | | | 0.04 | | | | 1.99 | | | | 2.03 | | | | (0.13 | ) | | | — | | | | (0.13 | ) |
| | 2012 - Institutional | | | 13.67 | | | | 0.21 | | | | 2.05 | | | | 2.26 | | | | (0.25 | ) | | | — | | | | (0.25 | ) |
| | 2012 - Service | | | 13.57 | | | | 0.14 | | | | 2.02 | | | | 2.16 | | | | (0.20 | ) | | | — | | | | (0.20 | ) |
| | 2012 - IR | | | 13.51 | | | | 0.19 | | | | 2.03 | | | | 2.22 | | | | (0.24 | ) | | | — | | | | (0.24 | ) |
| | 2012 - R | | | 13.45 | | | | 0.13 | | | | 2.00 | | | | 2.13 | | | | (0.19 | ) | | | — | | | | (0.19 | ) |
| | 2011 - A | | | 12.47 | | | | 0.13 | | | | 1.08 | | | | 1.21 | | | | (0.20 | ) | | | — | | | | (0.20 | ) |
| | 2011 - C | | | 12.26 | | | | 0.03 | | | | 1.06 | | | | 1.09 | | | | (0.13 | ) | | | — | | | | (0.13 | ) |
| | 2011 - Institutional | | | 12.62 | | | | 0.18 | | | | 1.11 | | | | 1.29 | | | | (0.24 | ) | | | — | | | | (0.24 | ) |
| | 2011 - Service | | | 12.55 | | | | 0.11 | | | | 1.10 | | | | 1.21 | | | | (0.19 | ) | | | — | | | | (0.19 | ) |
| | 2011 - IR | | | 12.50 | | | | 0.20 | | | | 1.04 | | | | 1.24 | | | | (0.23 | ) | | | — | | | | (0.23 | ) |
| | 2011 - R | | | 12.44 | | | | 0.10 | | | | 1.08 | | | | 1.18 | | | | (0.17 | ) | | | — | | | | (0.17 | ) |
| | (a) | | Calculated based on the average shares outstanding methodology. |
| | (b) | | Assumes investment at the net asset value at the beginning of the period, reinvestment of all distributions, a complete redemption of the investment at the net asset value at the end of the period and no sales or redemption charges. Total returns would be reduced if a sales or redemption charge was taken into account. Returns do not reflect the deduction of taxes that a shareholder would pay on Fund distributions or the redemption of Fund shares. Total returns for periods less than one full year are not annualized. |
| | (c) | | The Fund’s portfolio turnover rate is calculated in accordance with regulatory requirements, without regard to transactions involving short term investments. If such transactions were included, the Fund’s portfolio turnover rate may be higher. |
| | (d) | | Reflects income recognized from special dividends which amounted to $0.02 per share and 0.23% of average net assets. |
| | (f) | | Reflects income recognized from special dividends which amounted to $0.07 per share and 0.37% of average net assets. |
| | |
| 34 | | The accompanying notes are an integral part of these financial statements. |
GOLDMAN SACHS REAL ESTATE SECURITIES FUNDS
| | | | | | | | | | | | | | | | | | | | | | | | | | | | | | | | | | | | | | | | |
| | | | | | | | | | | | | |
| | | Net asset
value, end
of period | | | | | Total
return(b) | | | | | Net assets,
end of
period
(in 000s) | | | | | Ratio of
net expenses
to average
net assets | | | | | Ratio of
total expenses
to average
net assets | | | | | Ratio of
net investment
income
to average
net assets | | | | | Portfolio
turnover
rate(c) | |
| | | | | | | | | | | | | | | | | | | | | | | | | | | | | | | | | | | | | | | | |
| | $ | 21.25 | | | | | | 9.73 | % | | | | $ | 62,103 | | | | | | 1.31 | %(e) | | | | | 1.52 | %(e) | | | | | 2.03 | %(d)(e) | | | | | 14 | % |
| | | 20.63 | | | | | | 9.34 | | | | | | 15,976 | | | | | | 2.06 | (e) | | | | | 2.27 | (e) | | | | | 1.30 | (d)(e) | | | | | 14 | |
| | | 21.68 | | | | | | 9.99 | | | | | | 424,592 | | | | | | 0.91 | (e) | | | | | 1.12 | (e) | | | | | 2.43 | (d)(e) | | | | | 14 | |
| | | 21.38 | | | | | | 9.63 | | | | | | 3,297 | | | | | | 1.41 | (e) | | | | | 1.62 | (e) | | | | | 1.97 | (d)(e) | | | | | 14 | |
| | | 21.35 | | | | | | 9.86 | | | | | | 11,559 | | | | | | 1.06 | (e) | | | | | 1.27 | (e) | | | | | 2.46 | (d)(e) | | | | | 14 | |
| | | 21.11 | | | | | | 9.59 | | | | | | 4,794 | | | | | | 1.56 | (e) | | | | | 1.77 | (e) | | | | | 1.93 | (d)(e) | | | | | 14 | |
| | | 21.68 | | | | | | 9.93 | | | | | | 11 | | | | | | 0.91 | (e) | | | | | 1.07 | (e) | | | | | 2.46 | (d)(e) | | | | | 14 | |
| | | | | | | | | | | | | | | | | | | | | | | | | | | | | | | | | | | | | | | | |
| | | | | | | | | | | | | | | | | | | | | | | | | | | | | | | | | | | | | | | | |
| | | 19.59 | | | | | | 3.14 | | | | | | 57,936 | | | | | | 1.26 | | | | | | 1.51 | | | | | | 1.44 | | | | | | 41 | |
| | | 19.03 | | | | | | 2.39 | | | | | | 15,056 | | | | | | 2.01 | | | | | | 2.26 | | | | | | 0.73 | | | | | | 41 | |
| | | 19.97 | | | | | | 3.56 | | | | | | 463,105 | | | | | | 0.86 | | | | | | 1.11 | | | | | | 1.88 | | | | | | 41 | |
| | | 19.71 | | | | | | 3.09 | | | | | | 2,744 | | | | | | 1.36 | | | | | | 1.61 | | | | | | 1.35 | | | | | | 41 | |
| | | 19.68 | | | | | | 3.44 | | | | | | 7,283 | | | | | | 1.01 | | | | | | 1.26 | | | | | | 1.77 | | | | | | 41 | |
| | | 19.47 | | | | | | 2.89 | | | | | | 3,149 | | | | | | 1.50 | | | | | | 1.77 | | | | | | 1.38 | | | | | | 41 | |
| | | 19.98 | | | | | | 3.64 | | | | | | 10 | | | | | | 0.91 | (e) | | | | | 1.07 | (e) | | | | | 2.65 | (e) | | | | | 41 | |
| | | 19.83 | | | | | | 29.63 | | | | | | 73,103 | | | | | | 1.39 | | | | | | 1.52 | | | | | | 1.15 | (f) | | | | | 52 | |
| | | 19.32 | | | | | | 28.64 | | | | | | 16,497 | | | | | | 2.14 | | | | | | 2.26 | | | | | | 0.39 | (f) | | | | | 52 | |
| | | 20.18 | | | | | | 30.10 | | | | | | 502,407 | | | | | | 0.99 | | | | | | 1.11 | | | | | | 1.49 | (f) | | | | | 52 | |
| | | 19.94 | | | | | | 29.49 | | | | | | 3,527 | | | | | | 1.49 | | | | | | 1.61 | | | | | | 0.98 | (f) | | | | | 52 | |
| | | 19.90 | | | | | | 29.94 | | | | | | 6,900 | | | | | | 1.14 | | | | | | 1.27 | | | | | | 1.70 | (f) | | | | | 52 | |
| | | 19.73 | | | | | | 29.29 | | | | | | 1,877 | | | | | | 1.64 | | | | | | 1.77 | | | | | | 1.05 | (f) | | | | | 52 | |
| | | 15.54 | | | | | | 2.13 | | | | | | 51,599 | | | | | | 1.41 | | | | | | 1.51 | | | | | | 0.99 | | | | | | 61 | |
| | | 15.18 | | | | | | 1.35 | | | | | | 12,375 | | | | | | 2.16 | | | | | | 2.26 | | | | | | 0.29 | | | | | | 61 | |
| | | 15.80 | | | | | | 2.54 | | | | | | 419,564 | | | | | | 1.01 | | | | | | 1.11 | | | | | | 1.46 | | | | | | 61 | |
| | | 15.63 | | | | | | 2.03 | | | | | | 3,342 | | | | | | 1.51 | | | | | | 1.61 | | | | | | 0.88 | | | | | | 61 | |
| | | 15.59 | | | | | | 2.33 | | | | | | 808 | | | | | | 1.16 | | | | | | 1.26 | | | | | | 1.33 | | | | | | 61 | |
| | | 15.48 | | | | | | 1.90 | | | | | | 802 | | | | | | 1.66 | | | | | | 1.76 | | | | | | 0.90 | | | | | | 61 | |
| | | 15.44 | | | | | | 16.11 | | | | | | 63,171 | | | | | | 1.44 | | | | | | 1.51 | | | | | | 0.80 | | | | | | 40 | |
| | | 15.12 | | | | | | 15.34 | | | | | | 12,403 | | | | | | 2.19 | | | | | | 2.26 | | | | | | 0.25 | | | | | | 40 | |
| | | 15.68 | | | | | | 16.59 | | | | | | 381,641 | | | | | | 1.04 | | | | | | 1.11 | | | | | | 1.40 | | | | | | 40 | |
| | | 15.53 | | | | | | 15.93 | | | | | | 4,694 | | | | | | 1.54 | | | | | | 1.61 | | | | | | 0.91 | | | | | | 40 | |
| | | 15.49 | | | | | | 16.45 | | | | | | 540 | | | | | | 1.19 | | | | | | 1.26 | | | | | | 1.26 | | | | | | 40 | |
| | | 15.39 | | | | | | 15.90 | | | | | | 521 | | | | | | 1.69 | | | | | | 1.76 | | | | | | 0.88 | | | | | | 40 | |
| | | 13.48 | | | | | | 9.79 | | | | | | 166,917 | | | | | | 1.44 | | | | | | 1.51 | | | | | | 0.98 | | | | | | 46 | |
| | | 13.22 | | | | | | 8.91 | | | | | | 10,954 | | | | | | 2.19 | | | | | | 2.26 | | | | | | 0.22 | | | | | | 46 | |
| | | 13.67 | | | | | | 10.32 | | | | | | 402,103 | | | | | | 1.04 | | | | | | 1.11 | | | | | | 1.38 | | | | | | 46 | |
| | | 13.57 | | | | | | 9.71 | | | | | | 4,670 | | | | | | 1.54 | | | | | | 1.61 | | | | | | 0.83 | | | | | | 46 | |
| | | 13.51 | | | | | | 9.99 | | | | | | 443 | | | | | | 1.19 | | | | | | 1.26 | | | | | | 1.57 | | | | | | 46 | |
| | | 13.45 | | | | | | 9.51 | | | | | | 245 | | | | | | 1.69 | | | | | | 1.76 | | | | | | 0.74 | | | | | | 46 | |
| | |
| The accompanying notes are an integral part of these financial statements. | | 35 |
GOLDMAN SACHS REAL ESTATE SECURITIES FUNDS
Notes to Financial Statements
June 30, 2016 (Unaudited)
Goldman Sachs Trust (the “Trust”) is a Delaware statutory trust registered under the Investment Company Act of 1940, as amended (the “Act”), as an open-end management investment company. The following table lists those series of the Trust that are included in this report (collectively, the “Funds” or individually a “Fund”), along with their corresponding share classes and respective diversification status under the Act:
| | | | |
| Fund | | Share Classes Offered | | Diversified/ Non-diversified |
Global Real Estate Securities | | A, C, Institutional, IR, R and R6 | | Non-diversified |
International Real Estate Securities | | A, C, Institutional, IR and R6 | | Non-diversified |
Real Estate Securities | | A, C, Institutional, Service, IR, R and R6 | | Non-diversified |
Class A Shares of the Global Real Estate Securities, International Real Estate Securities, and Real Estate Securities Funds are sold with a front-end sales charge of up to 5.50%. Class C Shares are sold with a contingent deferred sales charge (“CDSC”) of 1.00%, which is imposed on redemptions made within 12 months of purchase. Institutional, Service, Class IR, Class R and Class R6 Shares are not subject to a sales charge.
Goldman Sachs Asset Management, L.P. (“GSAM”), an affiliate of Goldman, Sachs & Co. (“Goldman Sachs”), serves as Investment Adviser to the Funds pursuant to management agreements (the “Agreements”) with the Trust.
|
| 2. SIGNIFICANT ACCOUNTING POLICIES |
The financial statements have been prepared in accordance with accounting principles generally accepted in the United States of America (“GAAP”) and require management to make estimates and assumptions that may affect the reported amounts and disclosures. Actual results may differ from those estimates and assumptions.
A. Investment Valuation — The Funds’ valuation policy is to value investments at fair value.
B. Investment Income and Investments — Investment income includes interest income, dividend income, net of any foreign withholding taxes, less any amounts reclaimable, and securities lending income. Interest income is accrued daily and adjusted for amortization of premiums and accretion of discounts. Dividend income is recognized on ex-dividend date or, for certain foreign securities, as soon as such information is obtained subsequent to the ex-dividend date. Investment transactions are reflected on trade date. Realized gains and losses are calculated using identified cost. Investment transactions are recorded on the following business day for daily net asset value (“NAV”) calculations. Any foreign capital gains tax is accrued daily based upon net unrealized gains, and is payable upon sale of such investments. Distributions received from the Funds’ investments in United States (“U.S.”) real estate investment trusts (“REITs”) may be characterized as ordinary income, net capital gain or a return of capital. A return of capital is recorded by the Funds as a reduction to the cost basis of the REIT.
C. Class Allocations and Expenses — Investment income, realized and unrealized gain (loss), and non-class specific expenses of each Fund are allocated daily based upon the proportion of net assets of each class. Non-class specific expenses directly incurred by a Fund are charged to that Fund, while such expenses incurred by the Trust are allocated across the applicable Funds on a straight-line and/or pro-rata basis depending upon the nature of the expenses. Class specific expenses, where applicable, are borne by the respective share classes and include Distribution and Service, Transfer Agency and Service and Shareholder Administration fees.
D. Offering and Organization Costs — Offering costs paid in connection with the offering of shares of the Global Real Estate Securities Fund are being amortized on a straight-line basis over 12 months from the date of commencement of operations. Organization costs paid in connection with the organization of the Global Real Estate Securities Fund were expensed on the first day of operations.
36
GOLDMAN SACHS REAL ESTATE SECURITIES FUNDS
|
| 2. SIGNIFICANT ACCOUNTING POLICIES (continued) |
E. Federal Taxes and Distributions to Shareholders — It is each Fund’s policy to comply with the requirements of the Internal Revenue Code of 1986, as amended (the “Code”), applicable to regulated investment companies (mutual funds) and to distribute each year substantially all of its investment company taxable income and capital gains to its shareholders. Accordingly, the Funds are not required to make any provisions for the payment of federal income tax. Distributions to shareholders are recorded on the ex-dividend date. Income and capital gains distributions, if any, are declared and paid according to the following schedule:
| | | | | | |
| Fund | | | | Income Distributions Declared/Paid | | Capital Gains Distributions
Declared/Paid |
Global Real Estate Securities and Real Estate Securities | | | | Quarterly | | Annually |
International Real Estate Securities | | | | Semi-Annually | | Annually |
Net capital losses are carried forward to future fiscal years and may be used to the extent allowed by the Code to offset any future capital gains. Utilization of capital loss carryforwards will reduce the requirement of future capital gains distributions.
Under the Regulated Investment Company Modernization Act of 2010, the Funds are permitted to carry forward capital losses incurred in taxable years beginning after December 22, 2010 for an unlimited period. However, any losses incurred during those future taxable years will be required to be utilized prior to the losses incurred in pre-enactment taxable years. As a result of this ordering rule, pre-enactment capital loss carryforwards may be more likely to expire unused. Additionally, post-enactment capital losses that are carried forward will retain their character as either short-term or long-term capital losses rather than being considered all short-term as under previous law.
The characterization of distributions to shareholders for financial reporting purposes is determined in accordance with federal income tax rules, which may differ from GAAP. The source of each Fund’s distributions may be shown in the accompanying financial statements as either from net investment income, net realized gain or capital. Certain components of the Funds’ net assets on the Statements of Assets and Liabilities reflect permanent GAAP/tax differences based on the appropriate tax character.
F. Foreign Currency Translation — The accounting records and reporting currency of the Funds are maintained in U.S. dollars. Assets and liabilities denominated in foreign currencies are translated into U.S. dollars using the current exchange rates at the close of each business day. The effect of changes in foreign currency exchange rates on investments is included within net realized and unrealized gain (loss) on investments. Changes in the value of other assets and liabilities as a result of fluctuations in foreign exchange rates are included in the Statements of Operations within net change in unrealized gain (loss) on foreign currency translations. Transactions denominated in foreign currencies are translated into U.S. dollars on the date the transaction occurred, the effects of which are included within net realized gain (loss) on foreign currency transactions.
| | |
| 3. INVESTMENTS AND FAIR VALUE MEASUREMENTS | | |
The fair value of a financial instrument is the amount that would be received to sell an asset or paid to transfer a liability in an orderly transaction between market participants at the measurement date (i.e., the exit price). GAAP establishes a fair value hierarchy that prioritizes the inputs to valuation techniques used to measure fair value. The hierarchy gives the highest priority to unadjusted quoted prices in active markets for identical assets or liabilities (Level 1 measurements) and the lowest priority to unobservable inputs (Level 3 measurements). The levels used for classifying investments are not necessarily an indication of the risk associated with investing in these investments. The three levels of the fair value hierarchy are described below:
Level 1 — Unadjusted quoted prices in active markets that are accessible at the measurement date for identical, unrestricted assets or liabilities;
Level 2 — Quoted prices in markets that are not active or financial instruments for which significant inputs are observable (including, but not limited to, quoted prices for similar investments, interest rates, foreign exchange rates, volatility and credit spreads), either directly or indirectly;
37
GOLDMAN SACHS REAL ESTATE SECURITIES FUNDS
Notes to Financial Statements (continued)
June 30, 2016 (Unaudited)
|
| 3. INVESTMENTS AND FAIR VALUE MEASUREMENTS (continued) |
Level 3 — Prices or valuations that require significant unobservable inputs (including GSAM’s assumptions in determining fair value measurement).
Changes in valuation techniques may result in transfers into or out of an assigned level within the hierarchy. In accordance with the Funds’ policy, transfers between different levels of the fair value hierarchy resulting from such changes are deemed to have occurred as of the beginning of the reporting period.
The Board of Trustees (“Trustees”) has approved Valuation Procedures that govern the valuation of the portfolio investments held by the Funds, including investments for which market quotations are not readily available. The Trustees have delegated to GSAM day-to-day responsibility for implementing and maintaining internal controls and procedures related to the valuation of the Funds’ portfolio investments. To assess the continuing appropriateness of pricing sources and methodologies, GSAM regularly performs price verification procedures and issues challenges as necessary to third party pricing vendors or brokers, and any differences are reviewed in accordance with the Valuation Procedures.
A. Level 1 and Level 2 Fair Value Investments — The valuation techniques and significant inputs used in determining the fair values for investments classified as Level 1 and Level 2 are as follows:
Equity Securities — Equity securities traded on a U.S. securities exchange or the NASDAQ system, or those located on certain foreign exchanges, including but not limited to the Americas, are valued daily at their last sale price or official closing price on the principal exchange or system on which they are traded. If there is no sale or official closing price or such price is believed by GSAM to not represent fair value, equity securities are valued at the last bid price for long positions and at the last ask price for short positions. To the extent these investments are actively traded, they are classified as Level 1 of the fair value hierarchy, otherwise they are generally classified as Level 2.
Unlisted equity securities for which market quotations are available are valued at the last sale price on the valuation date, or if no sale occurs, at the last bid price. Securities traded on certain foreign securities exchanges are valued daily at fair value determined by an independent fair value service (if available) under Valuation Procedures approved by the Trustees and consistent with applicable regulatory guidance. The independent fair value service takes into account multiple factors including, but not limited to, movements in the securities markets, certain depositary receipts, futures contracts and foreign currency exchange rates that have occurred subsequent to the close of the foreign securities exchange. These investments are generally classified as Level 2 of the fair value hierarchy.
Money Market Funds — Investments in the Goldman Sachs Financial Square Government Fund (“Underlying Fund”) are valued at the NAV of the FST Institutional Share class on the day of valuation. These investments are generally classified as Level 1 of the fair value hierarchy. For information regarding an Underlying Fund’s accounting policies and investment holdings, please see the Underlying Fund’s shareholder report.
B. Level 3 Fair Value Investments — To the extent that significant inputs to valuation models and other alternative pricing sources are unobservable, or if quotations are not readily available, or if GSAM believes that such quotations do not accurately reflect fair value, the fair value of the Funds’ investments may be determined under Valuation Procedures approved by the Trustees. GSAM, consistent with its procedures and applicable regulatory guidance, may make an adjustment to the most recent valuation prices of either domestic or foreign securities in light of significant events to reflect what it believes to be the fair value of the securities at the time of determining a Fund’s NAV. Significant events which could affect a large number of securities in a particular market may include, but are not limited to: significant fluctuations in U.S. or foreign markets; market dislocations; market disruptions; or unscheduled market closings. Significant events which could also affect a single issuer may include, but are not limited to: corporate actions such as reorganizations, mergers and buy-outs; ratings downgrades; and bankruptcies.
38
GOLDMAN SACHS REAL ESTATE SECURITIES FUNDS
|
| 3. INVESTMENTS AND FAIR VALUE MEASUREMENTS (continued) |
C. Fair Value Hierarchy — The following is a summary of the Funds’ investments classified in the fair value hierarchy as of June 30, 2016:
| | | | | | | | | | | | |
| | | |
| GLOBAL REAL ESTATE SECURITIES | | | | | | | | | | | | |
| | | |
| Investment Type | | Level 1 | | | Level 2 | | | Level 3 | |
| Assets | | | | | | | | | | | | |
Common Stock and/or Other Equity Investments(a) | | | | | | | | | | | | |
Asia | | $ | 168,768 | | | $ | 4,062,537 | | | $ | — | |
Australia and Oceania | | | — | | | | 1,227,783 | | | | — | |
Europe | | | — | | | | 3,238,045 | | | | — | |
North America | | | 11,784,532 | | | | — | | | | — | |
Investment Company | | | 937,607 | | | | — | | | | — | |
| Total | | $ | 12,890,907 | | | $ | 8,528,365 | | | $ | — | |
| | | |
| INTERNATIONAL REAL ESTATE SECURITIES | | | | | | | | | | | | |
| | | |
| Investment Type | | Level 1 | | | Level 2 | | | Level 3 | |
| Assets | | | | | | | | | | | | |
Common Stock and/or Other Equity Investments(a) | | | | | | | | | | | | |
Asia | | $ | 897,166 | | | $ | 137,309,921 | | | $ | — | |
Australia and Oceania | | | — | | | | 41,189,516 | | | | — | |
Europe | | | — | | | | 108,849,000 | | | | — | |
North America | | | 18,835,723 | | | | ��� | | | | — | |
| Total | | $ | 19,732,889 | | | $ | 287,348,437 | | | $ | — | |
| | | |
| REAL ESTATE SECURITIES | | | | | | | | | | | | |
| | | |
| Investment Type | | Level 1 | | | Level 2 | | | Level 3 | |
| Assets | | | | | | | | | | | | |
Common Stock and/or Other Equity Investments(a) | | | | | | | | | | | | |
North America | | $ | 506,519,424 | | | $ | — | | | $ | — | |
| (a) | | Amounts are disclosed by continent to highlight the impact of time zone differences between local market close and the calculation of NAV. Security valuations are based on the principal exchange or system on which they are traded, which may differ from country of domicile noted in the table. The Funds utilize fair value model prices provided by an independent fair value service for certain international equity securities, resulting in a Level 2 classification. |
For further information regarding security characteristics, see the Schedules of Investments.
| | |
| 4. AGREEMENTS AND AFFILIATED TRANSACTIONS | | |
A. Management Agreement — Under the Agreement, GSAM manages the Funds, subject to the general supervision of the Trustees.
As compensation for the services rendered pursuant to the Agreement, the assumption of the expenses related thereto and administration of the Funds’ business affairs, including providing facilities, GSAM is entitled to a management fee, accrued daily and paid monthly, equal to an annual percentage rate of each Fund’s average daily net assets.
39
GOLDMAN SACHS REAL ESTATE SECURITIES FUNDS
Notes to Financial Statements (continued)
June 30, 2016 (Unaudited)
|
| 4. AGREEMENTS AND AFFILIATED TRANSACTIONS (continued) |
For the six months ended June 30, 2016, contractual and effective net management fees with GSAM were at the following rates:
| | | | | | | | | | | | | | | | | | | | | | | | | | | | | | |
| | | | | Contractual Management Rate | | | Effective Net
Management
Rate^ | |
| Fund | | | | First
$1 billion | | | Next
$1 billion | | | Next
$3 billion | | | Next
$3 billion | | | Over
$8 billion | | | Effective
Rate | | |
Global Real Estate Securities | | | | | 1.05 | % | | | 0.95 | % | | | 0.90 | % | | | 0.88 | % | | | 0.86 | % | | | 1.05 | % | | | 0.92 | %(1) |
International Real Estate Securities | | | | | 1.05 | | | | 1.05 | | | | 0.95 | | | | 0.90 | | | | 0.88 | | | | 1.05 | | | | 0.95 | (1) |
Real Estate Securities | | | | | 1.00 | | | | 0.90 | | | | 0.86 | | | | 0.84 | | | | 0.82 | | | | 1.00 | | | | 0.87 | (1) |
| ^ | | Effective Net Management Rate includes the impact of management fee waivers of affiliated underlying funds, if any. |
| (1) | | GSAM agreed to waive a portion of its management fee in order to achieve net management rates, as defined in the Funds’ most recent prospectuses. These waivers will be effective through at least April 29, 2017, and prior to such date GSAM may not terminate the arrangements without approval of the Trustees. |
The Global Real Estate Securities Fund invests in FST Institutional Shares of the Goldman Sachs Financial Square Government Fund, which is an affiliated Underlying Fund. GSAM has agreed to waive a portion of its management fee payable by the Fund in an amount equal to the management fee it earns as an investment adviser to any of the affiliated Underlying Funds in which the Fund invests. For the six months ended June 30, 2016, GSAM waived $434 of the Fund’s management fee.
B. Distribution and Service Plans — The Trust, on behalf of each Fund, has adopted Distribution and Service Plans (the “Plans”). Under the Plans, Goldman Sachs, which serves as distributor (the “Distributor”), is entitled to a fee accrued daily and paid monthly, for distribution services and personal and account maintenance services, which may then be paid by Goldman Sachs to authorized dealers, at the following annual rates calculated on a Fund’s average daily net assets of each respective share class:
| | | | | | | | | | | | |
| | | Distribution and Service Plan Rates | |
| | | Class A* | | | Class C | | | Class R* | |
Distribution Plan | | | 0.25 | % | | | 0.75 | % | | | 0.50 | % |
Service Plan | | | — | | | | 0.25 | | | | — | |
| * | | With respect to Class A and Class R Shares, the Distributor at its discretion may use compensation for distribution services paid under the Distribution Plan to compensate service organizations for personal and account maintenance services and expenses as long as such total compensation does not exceed the maximum cap on “service fees” imposed by the Financial Industry Regulatory Authority. |
C. Distribution Agreement — Goldman Sachs, as Distributor of the shares of the Funds pursuant to a Distribution Agreement, may retain a portion of the Class A Shares’ front end sales charge and Class C Shares’ CDSC. During the six months ended June 30, 2016, Goldman Sachs advised that it retained front end sales charges of $61 and $3,407 for the International Real Estate Securities and Real Estate Securities Funds, respectively.
D. Service Plan and Shareholder Administration Plan — The Trust, on behalf of each Fund that offers Service Shares, has adopted a Service Plan and a Shareholder Administration Plan. These plans allow for service organizations to provide varying levels of personal and account maintenance and shareholder administration services to their customers who are beneficial owners of such shares. The Service Plan and Shareholder Administration Plan each provide for compensation to the service organizations which is accrued daily and paid monthly at an annual rate of 0.25% (0.50% in aggregate) of the average daily net assets of the Service Shares.
E. Transfer Agency Agreement — Goldman Sachs also serves as the transfer agent of the Funds for a fee pursuant to the Transfer Agency Agreement. The fees charged for such transfer agency services are accrued daily and paid monthly at annual rates as follows: 0.19% of the average daily net assets of Class A, Class C, Class IR and Class R Shares; 0.02% of the average daily net assets of Class R6 Shares; and 0.04% of the average daily net assets of Institutional and Service Shares.
40
GOLDMAN SACHS REAL ESTATE SECURITIES FUNDS
|
| 4. AGREEMENTS AND AFFILIATED TRANSACTIONS (continued) |
F. Other Expense Agreements and Affiliated Transactions — GSAM has agreed to limit certain “Other Expenses” of the Funds (excluding acquired fund fees and expenses, transfer agency fees and expenses, service fees and shareholder administration fees (as applicable), taxes, interest, brokerage fees, shareholder meeting, litigation, indemnification and extraordinary expenses) to the extent such expenses exceed, on an annual basis, a percentage rate of the average daily net assets of each Fund. Such Other Expense reimbursements, if any, are accrued daily and paid monthly. In addition, the Funds are not obligated to reimburse GSAM for prior fiscal year expense reimbursements, if any. The Other Expense limitations as an annual percentage rate of average daily net assets for the Global Real Estate Securities, International Real Estate Securities and Real Estate Securities Funds are 0.034%, 0.004% and 0.004%, respectively. These Other Expense limitations will remain in place through at least April 29, 2017, and prior to such date GSAM may not terminate the arrangements without the approval of the Trustees. In addition, the Funds have entered into certain offset arrangements with the custodian and the transfer agent, which may result in a reduction of the Funds’ expenses and are received irrespective of the application of the “Other Expense” limitations described above.
For the six months ended June 30, 2016, these expense reductions, including any fee waivers and Other Expense reimbursements, were as follows:
| | | | | | | | | | | | | | | | | | |
| Fund | | | | Management
Fee Waiver | | | Other Expense
Reimbursement | | | Custody
Fee
Credits | | | Total
Expense
Reductions | |
Global Real Estate Securities | | | | $ | 9,317 | | | $ | 159,878 | | | $ | — | | | $ | 169,195 | |
International Real Estate Securities | | | | | 160,506 | | | | 223,104 | | | | 1,235 | | | | 384,845 | |
Real Estate Securities | | | | | 338,129 | | | | 194,797 | | | | 2,403 | | | | 535,329 | |
G. Line of Credit Facility — As of June 30, 2016, the Funds participated in a $1,100,000,000 committed, unsecured revolving line of credit facility (the “facility”) together with other funds of the Trust and registered investment companies having management agreements with GSAM or its affiliates (“Other Borrowers”). This facility is to be used for temporary or emergency purposes, or to allow for an orderly liquidation of securities to meet redemption requests. The interest rate on borrowings is based on the federal funds rate. The facility also requires a fee to be paid by the Funds based on the amount of the commitment that has not been utilized. For the six months ended June 30, 2016, the Funds did not have any borrowings under the facility.
H. Other Transactions with Affiliates — The following table provides information about the Global Real Estate Securities Fund’s investment in the Goldman Sachs Financial Square Government Fund as of and for the six months ended June 30, 2016:
| | | | | | | | | | | | | | | | | | | | | | |
| Fund | | | | Market
Value
12/31/15 | | | Purchases at Cost | | | Proceeds from Sales | | | Market
Value
06/30/16 | | | Dividend
Interest
Income | |
Goldman Sachs Financial Square Government Fund | | | | $ | 42,195 | | | $ | 14,820,675 | | | $ | (13,925,263 | ) | | $ | 937,607 | | | $ | 702 | |
As of June 30, 2016, the Goldman Sachs Group, Inc. was the beneficial owner of the following Funds:
| | | | | | | | | | | | | | | | | | | | | | | | | | |
| | | | | Percent of Share Class owned by Goldman Sachs Group, Inc. | |
| Fund | | | | Class A | | | Class C | | | Institutional | | | Class IR | | | Class R | | | Class R6 | |
Global Real Estate Securities | | | | | 100 | % | | | 100 | % | | | 15 | % | | | 100 | % | | | 100 | % | | | 100 | % |
International Real Estate Securities | | | | | — | | | | — | | | | — | | | | 7 | | | | — | | | | 100 | |
Real Estate Securities | | | | | — | | | | — | | | | — | | | | — | | | | 35 | | | | 100 | |
As of June 30, 2016, the Goldman Sachs Satellite Strategies Portfolio was the beneficial owner of approximately 38% of the International Real Estate Securities Fund and approximately 24% of the Real Estate Securities Fund.
41
GOLDMAN SACHS REAL ESTATE SECURITIES FUNDS
Notes to Financial Statements (continued)
June 30, 2016 (Unaudited)
|
| 5. PORTFOLIO SECURITIES TRANSACTIONS |
The cost of purchases and proceeds from sales and maturities of long-term securities for the six months ended June 30, 2016, were as follows:
| | | | | | | | | | |
| Fund | | | | Purchases | | | Sales | |
Global Real Estate Securities | | | | $ | 20,759,423 | | | $ | 4,935,155 | |
International Real Estate Securities | | | | | 56,347,866 | | | | 92,917,708 | |
Real Estate Securities | | | | | 74,802,091 | | | | 151,222,732 | |
As of the Funds’ most recent fiscal year end, December 31, 2015, the Funds’ capital loss carryforwards and certain timing differences, on a tax-basis were as follows:
| | | | | | | | | | | | |
| | | Global Real
Estate
Securities | | | International
Real Estate
Securities | | | Real Estate
Securities | |
Capital loss carryforwards:(1) | | | | | | | | | | | | |
Expiring 2016 | | $ | — | | | $ | (315,734,034 | ) | | $ | — | |
Expiring 2017 | | | �� | | | | (239,206,981 | ) | | | — | |
Expiring 2018 | | | — | | | | (18,621,372 | ) | | | — | |
Total capital loss carryforwards | | $ | — | | | $ | (573,562,387 | ) | | $ | — | |
Timing differences (Qualified Late Year Loss Deferral/certain REIT dividends/straddle loss deferral/Post October Loss Deferral) | | | 2,969 | | | | (645,764 | ) | | | 1,121,620 | |
| (1) | | Expiration occurs on December 31 of the year indicated. |
As of June 30, 2016, the Funds’ aggregate security unrealized gains and losses based on cost for U.S. federal income tax purposes were as follows:
| | | | | | | | | | | | |
| | | Global Real
Estate
Securities | | | International
Real Estate
Securities | | | Real Estate
Securities | |
Tax cost | | $ | 19,854,183 | | | $ | 322,924,902 | | | $ | 338,732,678 | |
Gross unrealized gain | | | 5,508,159 | | | | 20,278,830 | | | | 170,564,676 | |
Gross unrealized loss | | | (3,943,070 | ) | | | (36,122,406 | ) | | | (2,777,930 | ) |
Net unrealized security gain (loss) | | $ | 1,565,089 | | | $ | (15,843,576 | ) | | $ | 167,786,746 | |
The difference between GAAP-basis and tax-basis unrealized gains (losses) is attributable primarily to wash sales and differences related to the tax treatment of passive foreign investment companies and real estate investment trust investments.
GSAM has reviewed the Funds’ tax positions for all open tax years (the current and prior three years, as applicable) and has concluded that no provision for income tax is required in the Funds’ financial statements. Such open tax years remain subject to examination and adjustment by tax authorities.
42
GOLDMAN SACHS REAL ESTATE SECURITIES FUNDS
The Funds’ risks include, but are not limited to, the following:
Foreign and Emerging Countries Risk — Investing in foreign markets may involve special risks and considerations not typically associated with investing in the U.S. Foreign securities may be subject to risk of loss because of more or less foreign government regulation, less public information and less economic, political and social stability in the countries in which a Fund invests. Loss may also result from the imposition of exchange controls, confiscations and other government restrictions by the U.S. or other governments, or from problems in registration, settlement or custody. Foreign risk also involves the risk of negative foreign currency rate fluctuations, which may cause the value of securities denominated in such foreign currency (or other instruments through which a Fund has exposure to foreign currencies) to decline in value. Currency exchange rates may fluctuate significantly over short periods of time. To the extent that a Fund also invests in securities of issuers located in emerging markets, these risks may be more pronounced.
Foreign Custody Risk — A Fund that invests in foreign securities may hold such securities and cash with foreign banks, agents, and securities depositories appointed by the Fund’s custodian (each a “Foreign Custodian”). Some foreign custodians may be recently organized or new to the foreign custody business. In some countries, Foreign Custodians may be subject to little or no regulatory oversight over, or independent evaluation of, their operations. Further, the laws of certain countries may place limitations on a Fund’s ability to recover its assets if a Foreign Custodian enters bankruptcy. Investments in emerging markets may be subject to even greater custody risks than investments in more developed markets. Custody services in emerging market countries are very often undeveloped and may be considerably less well regulated than in more developed countries, and thus may not afford the same level of investor protection as would apply in developed countries.
Investments in Other Investment Companies — As a shareholder of another investment company, including an exchange-traded fund (“ETF”), a Fund will indirectly bear its proportionate share of any net management fees and other expenses paid by such other investment companies, in addition to the fees and expenses regularly borne by the Fund. ETFs are subject to risks that do not apply to conventional mutual funds, including but not limited to the following: (i) the market price of the ETF’s shares may trade at a premium or a discount to their NAV; and (ii) an active trading market for an ETF’s shares may not develop or be maintained.
Large Shareholder Transactions Risk — A Fund may experience adverse effects when certain large shareholders, such as other funds, institutional investors (including those trading by use of non-discretionary mathematical formulas), financial intermediaries (who may make investment decisions on behalf of underlying clients and/or include a Fund in their investment model), individuals, accounts and Goldman Sachs affiliates, purchase or redeem large amounts of shares of a Fund. Such large shareholder redemptions may cause a Fund to sell portfolio securities at times when it would not otherwise do so, which may negatively impact a Fund’s NAV and liquidity. These transactions may also accelerate the realization of taxable income to shareholders if such sales of investments resulted in gains, and may also increase transaction costs. In addition, a large redemption could result in a Fund’s current expenses being allocated over a smaller asset base, leading to an increase in the Fund’s expense ratio. Similarly, large Fund share purchases may adversely affect a Fund’s performance to the extent that the Fund is delayed in investing new cash and is required to maintain a larger cash position than it ordinarily would.
Liquidity Risk — A Fund may make investments that are illiquid or that may become less liquid in response to market developments or adverse investor perceptions. Illiquid investments may be more difficult to value. Liquidity risk may also refer to the risk that a Fund will not be able to pay redemption proceeds within the allowable time period because of unusual market conditions, an unusually high volume of redemption requests, or other reasons. To meet redemption requests, a Fund may be forced to sell investments at an unfavorable time and/or under unfavorable conditions.
Market and Credit Risks — In the normal course of business, a Fund trades financial instruments and enters into financial transactions where risk of potential loss exists due to changes in the market (market risk). Additionally, a Fund may also be exposed to credit risk in the event that an issuer or guarantor fails to perform or that an institution or entity with which the Fund has unsettled or open transactions defaults.
43
GOLDMAN SACHS REAL ESTATE SECURITIES FUNDS
Notes to Financial Statements (continued)
June 30, 2016 (Unaudited)
|
| 7. OTHER RISKS (continued) |
Non-Diversification Risk — The Funds are non-diversified, meaning that they are permitted to invest a larger percentage of their assets in fewer issuers than diversified mutual funds. Thus, a Fund may be more susceptible to adverse developments affecting any single issuer held in its portfolio, and may be more susceptible to greater losses because of these developments.
Portfolio Concentration Risk — As a result of the Funds’ ability to invest a large percentage of its assets in obligations of issuers within the same country, state, region, currency or economic sector, an adverse economic, business or political development may affect the value of a Fund’s investments more than if its investments were not so concentrated.
Under the Trust’s organizational documents, its Trustees, officers, employees and agents are indemnified, to the extent permitted by the Act and state law, against certain liabilities that may arise out of performance of their duties to the Funds. Additionally, in the course of business, the Funds enter into contracts that contain a variety of indemnification clauses. The Funds’ maximum exposure under these arrangements is unknown, as this would involve future claims that may be made against the Funds that have not yet occurred. However, GSAM believes the risk of loss under these arrangements to be remote.
Subsequent events after the Statements of Assets and Liabilities date have been evaluated through the date the financial statements were issued. GSAM has concluded that there is no impact requiring adjustment or disclosure in the financial statements.
44
GOLDMAN SACHS REAL ESTATE SECURITIES FUNDS
|
| 10. SUMMARY OF SHARE TRANSACTIONS |
Share activity is as follows:
| | | | | | | | | | | | | | | | |
| | | Global Real Estate Securities Fund | |
| | | For the Six Months Ended
June 30, 2016
(Unaudited) | | | For the Period Ended
December 31, 2015(a) | |
| | | Shares | | | Dollars | | | Shares | | | Dollars | |
| | | | |
| Class A Shares | | | | | | | | | | | | | | | | |
Shares sold | | | — | | | $ | 5 | | | | 2,501 | | | $ | 25,005 | |
Reinvestment of distributions | | | 17 | | | | 192 | | | | 31 | | | | 327 | |
Shares redeemed | | | — | | | | (5 | ) | | | — | | | | — | |
| | | | 17 | | | | 192 | | | | 2,532 | | | | 25,332 | |
| Class C Shares | | | | | | | | | | | | | | | | |
Shares sold | | | — | | | | — | | | | 2,499 | | | | 25,005 | |
Reinvestment of distributions | | | 10 | | | | 98 | | | | 27 | | | | 278 | |
Shares redeemed | | | — | | | | — | | | | — | | | | (4 | ) |
| | | | 10 | | | | 98 | | | | 2,526 | | | | 25,279 | |
| Institutional Shares | | | | | | | | | | | | | | | | |
Shares sold | | | 1,782,667 | | | | 17,935,928 | | | | 287,501 | | | | 2,875,010 | |
Reinvestment of distributions | | | 15,809 | | | | 172,163 | | | | 3,892 | | | | 40,703 | |
Shares redeemed | | | (173,853 | ) | | | (1,729,247 | ) | | | — | | | | (5 | ) |
| | | | 1,624,623 | | | | 16,378,844 | | | | 291,393 | | | | 2,915,708 | |
| Class IR Shares | | | | | | | | | | | | | | | | |
Shares sold | | | — | | | | — | | | | 2,500 | | | | 25,005 | |
Reinvestment of distributions | | | 20 | | | | 223 | | | | 33 | | | | 345 | |
Shares redeemed | | | — | | | | — | | | | — | | | | (5 | ) |
| | | | 20 | | | | 223 | | | | 2,533 | | | | 25,345 | |
| Class R Shares | | | | | | | | | | | | | | | | |
Shares sold | | | — | | | | — | | | | 2,501 | | | | 25,005 | |
Reinvestment of distributions | | | 15 | | | | 161 | | | | 30 | | | | 312 | |
Shares redeemed | | | — | | | | — | | | | (1 | ) | | | (5 | ) |
| | | | 15 | | | | 161 | | | | 2,530 | | | | 25,312 | |
| Class R6 Shares | | | | | | | | | | | | | | | | |
Shares sold | | | — | | | | — | | | | 2,501 | | | | 25,005 | |
Reinvestment of distributions | | | 22 | | | | 244 | | | | 34 | | | | 356 | |
Shares redeemed | | | — | | | | — | | | | (1 | ) | | | (5 | ) |
| | | | 22 | | | | 244 | | | | 2,534 | | | | 25,356 | |
NET INCREASE | | | 1,624,707 | | | $ | 16,379,762 | | | | 304,048 | | | $ | 3,042,332 | |
| (a) | | Commenced operations on August 31, 2015. |
45
GOLDMAN SACHS REAL ESTATE SECURITIES FUNDS
Notes to Financial Statements (continued)
June 30, 2016 (Unaudited)
|
| 10. SUMMARY OF SHARE TRANSACTIONS (continued) |
Share activity is as follows:
| | | | | | | | | | | | | | | | |
| | | International Real Estate Securities Fund | |
| | | For the Six Months Ended
June 30, 2016
(Unaudited) | | | For the Fiscal Year Ended
December 31, 2015 | |
| | | Shares | | | Dollars | | | Shares | | | Dollars | |
| | | | |
| Class A Shares | | | | | | | | | | | | | | | | |
Shares sold | | | 87,807 | | | $ | 532,920 | | | | 235,165 | | | $ | 1,545,606 | |
Reinvestment of distributions | | | 10,043 | | | | 61,160 | | | | 32,208 | | | | 201,988 | |
Shares redeemed | | | (258,993 | ) | | | (1,590,597 | ) | | | (573,005 | ) | | | (3,716,305 | ) |
| | | | (161,143 | ) | | | (996,517 | ) | | | (305,632 | ) | | | (1,968,711 | ) |
| Class C Shares | | | | | | | | | | | | | | | | |
Shares sold | | | 1,096 | | | | 6,667 | | | | 14,440 | | | | 92,546 | |
Reinvestment of distributions | | | 1,318 | | | | 8,028 | | | | 3,945 | | | | 24,718 | |
Shares redeemed | | | (19,586 | ) | | | (117,125 | ) | | | (59,706 | ) | | | (382,082 | ) |
| | | | (17,172 | ) | | | (102,430 | ) | | | (41,321 | ) | | | (264,818 | ) |
| Institutional Shares | | | | | | | | | | | | | | | | |
Shares sold | | | 3,817,558 | | | | 22,231,306 | | | | 9,612,020 | | | | 59,364,280 | |
Reinvestment of distributions | | | 592,089 | | | | 3,493,326 | | | | 1,650,869 | | | | 10,053,554 | |
Shares redeemed | | | (8,980,535 | ) | | | (51,887,910 | ) | | | (16,094,291 | ) | | | (101,134,181 | ) |
| | | | (4,570,888 | ) | | | (26,163,278 | ) | | | (4,831,402 | ) | | | (31,716,347 | ) |
| Class IR Shares | | | | | | | | | | | | | | | | |
Shares sold | | | 5,184 | | | | 31,128 | | | | 4,678 | | | | 28,711 | |
Reinvestment of distributions | | | 209 | | | | 1,261 | | | | 390 | | | | 2,423 | |
Shares redeemed | | | (510 | ) | | | (3,007 | ) | | | (21,002 | ) | | | (138,147 | ) |
| | | | 4,883 | | | | 29,382 | | | | (15,934 | ) | | | (107,013 | ) |
| Class R6 Shares(a) | | | | | | | | | | | | | | | | |
Shares sold | | | — | | | | — | | | | 1,581 | | | | 10,005 | |
Reinvestment of distributions | | | 19 | | | | 111 | | | | 27 | | | | 163 | |
Shares redeemed | | | — | | | | — | | | | (1 | ) | | | (5 | ) |
| | | | 19 | | | | 111 | | | | 1,607 | | | | 10,163 | |
NET DECREASE | | | (4,744,301 | ) | | $ | (27,232,732 | ) | | | (5,192,682 | ) | | $ | (34,046,726 | ) |
| (a) | | Commenced operations on July 31, 2015. |
46
GOLDMAN SACHS REAL ESTATE SECURITIES FUNDS
|
| 10. SUMMARY OF SHARE TRANSACTIONS (continued) |
Share activity is as follows:
| | | | | | | | | | | | | | | | |
| | | Real Estate Securities Fund | |
| | | For the Six Months Ended
June 30, 2016
(Unaudited) | | | For the Fiscal Year Ended
December 31, 2015 | |
| | | Shares | | | Dollars | | | Shares | | | Dollars | |
| | | | |
| Class A Shares | | | | | | | | | | | | | | | | |
Shares sold | | | 504,790 | | | $ | 10,039,414 | | | | 1,006,054 | | | $ | 20,162,437 | |
Reinvestment of distributions | | | 28,419 | | | | 591,210 | | | | 110,637 | | | | 2,112,841 | |
Shares redeemed | | | (568,177 | ) | | | (11,166,849 | ) | | | (1,846,694 | ) | | | (37,000,156 | ) |
| | | | (34,968 | ) | | | (536,225 | ) | | | (730,003 | ) | | | (14,724,878 | ) |
| Class C Shares | | | | | | | | | | | | | | | | |
Shares sold | | | 52,497 | | | | 1,009,595 | | | | 139,919 | | | | 2,753,523 | |
Reinvestment of distributions | | | 5,598 | | | | 113,035 | | | | 27,256 | | | | 504,925 | |
Shares redeemed | | | (74,726 | ) | | | (1,408,545 | ) | | | (230,035 | ) | | | (4,407,019 | ) |
| | | | (16,631 | ) | | | (285,915 | ) | | | (62,860 | ) | | | (1,148,571 | ) |
| Institutional Shares | | | | | | | | | | | | | | | | |
Shares sold | | | 1,027,910 | | | | 20,591,585 | | | | 4,760,677 | | | | 94,751,120 | |
Reinvestment of distributions | | | 265,174 | | | | 5,625,966 | | | | 1,067,838 | | | | 20,746,124 | |
Shares redeemed | | | (4,891,194 | ) | | | (98,867,717 | ) | | | (7,540,815 | ) | | | (151,932,009 | ) |
| | | | (3,598,110 | ) | | | (72,650,166 | ) | | | (1,712,300 | ) | | | (36,434,765 | ) |
| Service Shares | | | | | | | | | | | | | | | | |
Shares sold | | | 27,513 | | | | 544,282 | | | | 40,767 | | | | 807,285 | |
Reinvestment of distributions | | | 723 | | | | 15,141 | | | | 2,316 | | | | 44,342 | |
Shares redeemed | | | (13,228 | ) | | | (265,004 | ) | | | (80,757 | ) | | | (1,603,897 | ) |
| | | | 15,008 | | | | 294,419 | | | | (37,674 | ) | | | (752,270 | ) |
| Class IR Shares | | | | | | | | | | | | | | | | |
Shares sold | | | 207,305 | | | | 4,199,493 | | | | 111,670 | | | | 2,221,821 | |
Reinvestment of distributions | | | 5,662 | | | | 118,677 | | | | 15,718 | | | | 300,673 | |
Shares redeemed | | | (41,697 | ) | | | (826,072 | ) | | | (104,014 | ) | | | (2,118,190 | ) |
| | | | 171,270 | | | | 3,492,098 | | | | 23,374 | | | | 404,304 | |
| Class R Shares | | | | | | | | | | | | | | | | |
Shares sold | | | 98,472 | | | | 1,883,429 | | | | 132,636 | | | | 2,603,096 | |
Reinvestment of distributions | | | 1,576 | | | | 32,578 | | | | 4,378 | | | | 82,799 | |
Shares redeemed | | | (34,701 | ) | | | (673,457 | ) | | | (70,413 | ) | | | (1,371,525 | ) |
| | | | 65,347 | | | | 1,242,550 | | | | 66,601 | | | | 1,314,370 | |
| Class R6 Shares(a) | | | | | | | | | | | | | | | | |
Shares sold | | | — | | | | — | | | | 502 | | | | 10,005 | |
Reinvestment of distributions | | | 6 | | | | 140 | | | | 17 | | | | 326 | |
Shares redeemed | | | — | | | | — | | | | — | | | | (5 | ) |
| | | | 6 | | | | 140 | | | | 519 | | | | 10,326 | |
NET DECREASE | | | (3,398,078 | ) | | | (68,443,099 | ) | | | (2,452,343 | ) | | | (51,331,484 | ) |
| (a) | | Commenced operations on July 31, 2015. |
47
GOLDMAN SACHS REAL ESTATE SECURITIES FUNDS
Fund Expenses — Six Month Period Ended June 30, 2016 (Unaudited)
As a shareholder of Class A, Class C, Institutional, Service, Class IR, Class R or Class R6 Shares of a Fund you incur two types of costs: (1) transaction costs, including sales charges on purchase payments (with respect to Class A Shares) and contingent deferred sales charges on redemptions (with respect to Class C Shares); and (2) ongoing costs, including management fees; distribution and service (12b-1) fees (with respect to Class A, Class C and Class R Shares); and other Fund expenses.
This example is intended to help you understand your ongoing costs (in dollars) of investing in Class A, Class C, Institutional, Service, Class IR and Class R Shares of the Funds and to compare these costs with the ongoing costs of investing in other mutual funds. The example is based on an investment of $1,000 invested at the beginning of the period and held for the entire period from January 1, 2016 through June 30, 2016, which represents a period of 182 days of a 366 day year.
Actual Expenses — The first line under each share class in the table below provides information about actual account values and actual expenses. You may use the information in this line, together with the amount you invested, to estimate the expenses that you paid over the period. Simply divide your account value by $1,000 (for example, an $8,600 account value divided by $1,000=8.6), then multiply the result by the number in the first line under the heading entitled “Expenses Paid” to estimate the expenses you paid on your account during this period.
Hypothetical Example for Comparison Purposes — The second line under each share class in the table below provides information about hypothetical account values and hypothetical expenses based on the Funds’ actual net expense ratio and an assumed rate of return of 5% per year before expenses, which is not the Funds’ actual return. The hypothetical account values and expenses may not be used to estimate the actual ending account balance or expenses you paid for the period. You may use this information to compare the ongoing costs of investing in the Funds and other funds. To do so, compare this 5% hypothetical example with the 5% hypothetical examples that appear in the shareholder reports of the other funds.
Please note that the expenses shown in the table are meant to highlight your ongoing costs only and do not reflect any transactional costs, such as sales charges, redemption fees, or exchange fees. Therefore, the second line of the table is useful in comparing ongoing costs only, and will not help you determine the relative total costs of owning different funds. In addition, if these transactional costs were included, your costs would have been higher.
| | | | | | | | | | | | | | | | | | | | | | | | | | | | | | | | | | | | |
| | | Global Real Estate Securities Fund | | | International Real Estate Securities Fund | | | Real Estate Securities Fund | |
| Share Class | | Beginning
Account
Value
01/01/16 | | | Ending
Account
Value
06/30/16 | | | Expenses Paid for the
6 Months Ended
06/30/16* | | | Beginning
Account
Value
01/01/16 | | | Ending
Account
Value
06/30/16 | | | Expenses Paid for the
6 Months Ended
06/30/16* | | | Beginning
Account
Value
01/01/16 | | | Ending
Account
Value
06/30/16 | | | Expenses Paid for the
6 Months Ended
06/30/16* | |
| Class A | | | | | | | | | | | | | | | | | | | | | | | | | | | | | | | | | | | | |
Actual | | $ | 1,000 | | | $ | 1,061.90 | | | $ | 7.18 | | | $ | 1,000 | | | $ | 1,019.20 | | | $ | 6.98 | | | $ | 1,000 | | | $ | 1,097.30 | | | $ | 6.83 | |
Hypothetical 5% return | | | 1,000 | | | | 1,017.90 | + | | | 7.02 | | | | 1,000 | | | | 1,017.95 | + | | | 6.97 | | | | 1,000 | | | | 1,018.35 | + | | | 6.57 | + |
| Class C | | | | | | | | | | | | | | | | | | | | | | | | | | | | | | | | | | | | |
Actual | | | 1,000 | | | | 1,058.40 | | | | 11.00 | | | | 1,000 | | | | 1,015.70 | | | | 10.73 | | | | 1,000 | | | | 1,093.40 | | | | 10.72 | |
Hypothetical 5% return | | | 1,000 | | | | 1,014.17 | + | | | 10.77 | | | | 1,000 | | | | 1,014.22 | + | | | 10.72 | | | | 1,000 | | | | 1,014.62 | + | | | 10.32 | + |
| Institutional | | | | | | | | | | | | | | | | | | | | | | | | | | | | | | | | | | | | |
Actual | | | 1,000 | | | | 1,063.90 | | | | 5.13 | | | | 1,000 | | | | 1,021.90 | | | | 4.98 | | | | 1,000 | | | | 1,099.90 | | | | 4.75 | |
Hypothetical 5% return | | | 1,000 | | | | 1,019.89 | + | | | 5.02 | | | | 1,000 | | | | 1,019.94 | + | | | 4.97 | | | | 1,000 | | | | 1,020.34 | + | | | 4.57 | + |
| Service | | | | | | | | | | | | | | | | | | | | | | | | | | | | | | | | | | | | |
Actual | | | N/A | | | | N/A | | | | N/A | | | | N/A | | | | N/A | | | | N/A | | | | 1,000 | | | | 1,096.30 | | | | 7.35 | |
Hypothetical 5% return | | | N/A | | | | N/A | + | | | N/A | | | | N/A | | | | N/A | | | | N/A | | | | 1,000 | | | | 1,017.85 | + | | | 7.07 | + |
| Class IR | | | | | | | | | | | | | | | | | | | | | | | | | | | | | | | | | | | | |
Actual | | | 1,000 | | | | 1,063.10 | | | | 5.90 | | | | 1,000 | | | | 1,020.90 | | | | 5.73 | | | | 1,000 | | | | 1,098.60 | | | | 5.53 | |
Hypothetical 5% return | | | 1,000 | | | | 1,019.14 | + | | | 5.77 | | | | 1,000 | | | | 1,019.19 | + | | | 5.72 | | | | 1,000 | | | | 1,019.59 | + | | | 5.32 | + |
| Class R | | | | | | | | | | | | | | | | | | | | | | | | | | | | | | | | | | | | |
Actual | | | 1,000 | | | | 1,059.80 | | | | 8.45 | | | | N/A | | | | N/A | | | | N/A | | | | 1,000 | | | | 1,095.90 | | | | 8.13 | |
Hypothetical 5% return | | | 1,000 | | | | 1,016.66 | + | | | 8.27 | | | | N/A | | | | N/A | | | | N/A | | | | 1,000 | | | | 1,017.11 | + | | | 7.82 | + |
| Class R6 | | | | | | | | | | | | | | | | | | | | | | | | | | | | | | | | | | | | |
Actual | | | 1,000 | | | | 1,063.90 | | | | 5.03 | | | | 1,000 | | | | 1,020.30 | | | | 4.92 | | | | 1,000 | | | | 1,099.30 | | | | 4.75 | |
Hypothetical 5% return | | | 1,000 | | | | 1,019.99 | + | | | 4.92 | | | | 1,000 | | | | 1,019.99 | + | | | 4.92 | | | | 1,000 | | | | 1,020.34 | + | | | 4.57 | + |
| * | | Expenses are calculated using each Fund’s annualized net expense ratio for each class, which represents the ongoing expenses as a percentage of net assets for the six months ended June 30, 2016. Expenses are calculated by multiplying the annualized net expense ratio by the average account value for the period; then multiplying the result by the number of days in the most recent fiscal half year; and then dividing that result by the number of days in the fiscal year. The annualized net expense ratios for the period were as follows: |
| | | | | | | | | | | | | | | | | | | | | | | | | | | | |
| Fund | | Class A | | | Class C | | | Institutional | | | Service | | | Class IR | | | Class R | | | Class R6 | |
Global Real Estate Securities | | | 1.40 | % | | | 2.15 | % | | | 1.00 | % | | | N/A | | | | 1.15 | % | | | 1.65 | % | | | 0.98 | % |
International Real Estate Securities | | | 1.39 | | | | 2.14 | | | | 0.99 | | | | N/A | | | | 1.14 | | | | N/A | | | | 0.98 | |
Real Estate Securities | | | 1.31 | | | | 2.06 | | | | 0.91 | | | | 141 | % | | | 1.06 | | | | 1.56 | | | | 0.91 | |
| + | | Hypothetical expenses are based on the Fund’s actual annualized net expense ratios and an assumed rate of return of 5% per year before expenses. |
48
GOLDMAN SACHS REAL ESTATE SECURITIES FUNDS
Statement Regarding Basis for Approval of Management Agreement (Unaudited)
Background
The Goldman Sachs Global Real Estate Securities Fund, Goldman Sachs International Real Estate Securities Fund, and Goldman Sachs Real Estate Securities Fund (the “Funds”) are investment portfolios of Goldman Sachs Trust (the “Trust”). The Board of Trustees oversees the management of the Trust and reviews the investment performance and expenses of the Funds at regularly scheduled meetings held throughout the year. In addition, the Board of Trustees determines annually whether to approve the continuance of the Trust’s investment management agreement (the “Management Agreement”) with Goldman Sachs Asset Management, L.P. (the “Investment Adviser”) on behalf of the Funds.
The Management Agreement was most recently approved for continuation until June 30, 2017 by the Board of Trustees, including those Trustees who are not parties to the Management Agreement or “interested persons” (as defined in the Investment Company Act of 1940, as amended) of any party thereto (the “Independent Trustees”), at a meeting held on June 15-16, 2016 (the “Annual Meeting”).
The review process undertaken by the Trustees spans the course of the year and culminates with the Annual Meeting. To assist the Trustees in their deliberations, the Trustees have established a Contract Review Committee (the “Committee”), comprised of the Independent Trustees. The Committee held three meetings over the course of the year since the Management Agreement was last approved. At those Committee meetings, regularly scheduled Board or other committee meetings, and/or the Annual Meeting, matters relevant to the renewal of the Management Agreement were considered by the Board, or the Independent Trustees, as applicable. With respect to each Fund, such matters included:
| | (a) | | the nature and quality of the advisory, administrative, and other services provided to the Fund by the Investment Adviser and its affiliates, including information about: |
| | (i) | | the structure, staff, and capabilities of the Investment Adviser and its portfolio management teams; |
| | (ii) | | the groups within the Investment Adviser and its affiliates that support the portfolio management teams or provide other types of necessary services, including fund services groups (e.g., accounting and financial reporting, tax, shareholder services, and operations); controls and risk management groups (e.g., legal, compliance, valuation oversight, credit risk management, internal audit, compliance testing, market risk analysis, finance, and central funding); sales and distribution support groups, and others (e.g., information technology and training); |
| | (iii) | | trends in employee headcount; |
| | (iv) | | the Investment Adviser’s financial resources and ability to hire and retain talented personnel and strengthen its operations; and |
| | (v) | | the parent company’s support of the Investment Adviser and its mutual fund business, as expressed by the firm’s senior management; |
| | (b) | | information on the investment performance of the Fund (except the Global Real Estate Securities Fund, which commenced operations on August 31, 2015), including comparisons to the performance of similar mutual funds, as provided by a third-party mutual fund data provider engaged as part of the contract review process (the “Outside Data Provider”), a benchmark performance index, and a composite of accounts with comparable investment strategies managed by the Investment Adviser; and general investment outlooks in the markets in which the Fund invests; |
| | (c) | | information provided by the Investment Adviser indicating the Investment Adviser’s views on whether the Fund’s peer group and/or benchmark index had high, medium, or low relevance given the Fund’s particular investment strategy; |
| | (d) | | the terms of the Management Agreement and other agreements with affiliated service providers entered into by the Trust on behalf of the Fund; |
| | (e) | | fee and expense information for the Fund, including: |
| | (i) | | the relative management fee and expense level of the Fund as compared to those of comparable funds managed by other advisers, as provided by the Outside Data Provider; |
| | (ii) | | the Fund’s expense trends over time (except for the Global Real Estate Securities Fund); and |
| | (iii) | | to the extent the Investment Adviser manages other types of accounts (such as bank collective trusts, private wealth management, accounts, institutional separate accounts, sub-advised mutual funds, and non-U.S. funds) having investment objectives and policies similar to those of the Fund, comparative information on the advisory fees charged and services provided to those accounts by the Investment Adviser; |
| | (f) | | with respect to the extensive investment performance and expense comparison data provided by the Outside Data Provider, its processes in producing that data for the Fund; |
| | (g) | | the undertaking of the Investment Adviser to waive certain fees and to limit certain expenses of the Fund that exceed a specified level; |
| | (h) | | information relating to the profitability of the Management Agreement and the transfer agency and distribution and service arrangements of the Fund and the Trust as a whole to the Investment Adviser and its affiliates; |
| | (i) | | whether the Fund’s existing management fee schedule adequately addressed any economies of scale; |
| | (j) | | a summary of the “fall-out” benefits derived by the Investment Adviser and its affiliates from their relationships with the Fund, including the fees received by the Investment Adviser’s affiliates from the Fund for transfer agency, portfolio trading, distribution and other services; |
| | (k) | | a summary of potential benefits derived by the Fund as a result of its relationship with the Investment Adviser; |
49
GOLDMAN SACHS REAL ESTATE SECURITIES FUNDS
Statement Regarding Basis for Approval of Management Agreement (Unaudited) (continued)
| | (l) | | information regarding commissions paid by the Fund and broker oversight, an update on the Investment Adviser’s soft dollars practices, other information regarding portfolio trading, and how the Investment Adviser carries out its duty to seek best execution; |
| | (m) | | portfolio manager ownership of Fund shares; the manner in which portfolio manager compensation is determined; and the number and types of accounts managed by the portfolio managers; |
| | (n) | | the nature and quality of the services provided to the Fund by its unaffiliated service providers, and the Investment Adviser’s general oversight and evaluation (including reports on due diligence) of those service providers as part of the administration services provided under the Management Agreement; and |
| | (o) | | the Investment Adviser’s processes and policies addressing various types of potential conflicts of interest; its approach to risk management; the annual review of the effectiveness of the Fund’s compliance program; and periodic compliance reports. |
The Trustees also received an overview of the Funds’ distribution arrangements. They received information regarding the Funds’ assets, share purchase and redemption activity, and payment of distribution, service, and shareholder administration fees, as applicable. Information was also provided to the Trustees relating to revenue sharing payments made by and services provided by the Investment Adviser and its affiliates to intermediaries that promote the sale, distribution, and/or servicing of Fund shares. The Independent Trustees also discussed the broad range of other investment choices that are available to Fund investors, including the availability of comparable funds managed by other advisers.
The presentations made at the Board and Committee meetings and at the Annual Meeting encompassed the Funds and other mutual funds for which the Board of Trustees has responsibility. In evaluating the Management Agreement at the Annual Meeting, the Trustees relied upon their knowledge, resulting from their meetings and other interactions throughout the year, of the Investment Adviser and its affiliates, their services, and the Funds. In conjunction with these meetings, the Trustees received written materials and oral presentations on the topics covered, and the Investment Adviser addressed the questions and concerns of the Trustees, including concerns regarding the investment performance of certain of the funds they oversee. The Independent Trustees were advised by their independent legal counsel regarding their responsibilities and other regulatory requirements related to the approval and continuation of mutual fund investment management agreements under applicable law. In addition, the Investment Adviser and its affiliates provided the Independent Trustees with a written response to a formal request for information sent on behalf of the Independent Trustees by their independent legal counsel. During the course of their deliberations, the Independent Trustees met in executive sessions with their independent legal counsel, without representatives of the Investment Adviser or its affiliates present.
Nature, Extent, and Quality of the Services Provided Under the Management Agreement
As part of their review, the Trustees considered the nature, extent, and quality of the services provided to the Funds by the Investment Adviser. In this regard, the Trustees considered both the investment advisory services and non-advisory services that are provided by the Investment Adviser and its affiliates. The Trustees noted the transition in the leadership and changes in personnel of various of the Investment Adviser’s portfolio management teams that had occurred in recent periods, and the ongoing recruitment efforts aimed at bringing high quality investment talent to the Investment Adviser. They also noted the Investment Adviser’s commitment to maintaining high quality systems and expending substantial resources to respond to ongoing changes to the regulatory and control environment in which the Funds and their service providers operate, as well as the efforts of the Investment Adviser and its affiliates to combat cyber security risks. The Trustees concluded that the Investment Adviser continued to commit substantial financial and operational resources to the Funds and expressed confidence that the Investment Adviser would continue to do so in the future. The Trustees also recognized that the Investment Adviser had made significant commitments to address regulatory compliance requirements applicable to the Funds and the Investment Adviser and its affiliates.
Investment Performance
The Trustees also considered the investment performance of the Funds. In this regard, they compared the investment performance of each Fund (except the Global Real Estate Securities Fund) to its peers using rankings and ratings compiled by the Outside Data Provider as of December 31, 2015, and updated performance information prepared by the Investment Adviser using the peer group identified by the Outside Data Provider as of March 31, 2016. The information on each Fund’s investment performance was provided for the one-, three-, five-, and ten-year periods ending on the applicable dates, to the extent that each Fund had been in existence for those periods. The Trustees also reviewed each Fund’s investment performance relative to its performance benchmark. As part of this review, they considered the investment performance trends of the Funds over time, and reviewed the investment performance of each Fund in light of its investment objective and policies and market conditions. The Trustees also received information comparing the Funds’ performance to that of composites of accounts with comparable investment strategies managed by the Investment Adviser.
In addition, the Trustees considered materials prepared and presentations made by the Investment Adviser’s senior management and portfolio management personnel in which Fund performance was assessed. The Trustees also considered the Investment Adviser’s periodic reports with respect to the Funds’ risk profiles, and how the Investment Adviser’s approach to risk monitoring and management influences portfolio management.
The Trustees noted that the International Real Estate Securities Fund’s Institutional Shares had placed in the fourth quartile of the Fund’s peer group and had underperformed the Fund’s benchmark index for the one-, three-, and five-year periods ended
50
GOLDMAN SACHS REAL ESTATE SECURITIES FUNDS
Statement Regarding Basis for Approval of Management Agreement (Unaudited) (continued)
March 31, 2016. They considered that the International Real Estate Securities Fund has a “global” peer group and benchmark that contemplates investments in U.S. and non-U.S. securities, whereas the Fund invests only in non-U.S. securities. The Trustees observed that the Real Estate Securities Fund’s Institutional Shares had placed in the first quartile of the Fund’s peer group for the one-, three-, and five-year periods and in the third quartile for the ten-year period, and had underperformed the Fund’s benchmark index for the one-, three-, five-, and ten-year periods ended March 31, 2016.
The Trustees noted that the Global Real Estate Securities Fund had launched on August 31, 2015 and did not yet have a meaningful performance history.
Costs of Services Provided and Competitive Information
The Trustees considered the contractual terms of the Management Agreement and the fee rates payable by each Fund thereunder. In this regard, the Trustees considered information on the services rendered by the Investment Adviser to the Funds, which included both advisory and administrative services that were directed to the needs and operations of the Funds as registered mutual funds.
In particular, the Trustees reviewed analyses prepared by the Outside Data Provider regarding the expense rankings of the Funds. The analyses provided a comparison of each Fund’s management fee and breakpoints to those of a relevant peer group and category universe; an expense analysis which compared each Fund’s overall net and gross expenses to a peer group and a category universe; and a five-year history (or, in the case of Funds that commenced investment operations within a shorter period, since the year in which it commenced operations) comparing each Fund’s net expenses to the peer and category medians. The analyses also compared each Fund’s transfer agency, custody, and distribution fees, other expenses and fee waivers/reimbursements to those of the peer group and category medians. The Trustees concluded that the comparisons provided by the Outside Data Provider were useful in evaluating the reasonableness of the management fees and total expenses paid by the Funds.
In addition, the Trustees considered the Investment Adviser’s undertaking to waive a portion of its management fees and to limit certain expenses of the Funds that exceed specified levels. They also considered, to the extent that the Investment Adviser manages other types of accounts having investment objectives and policies similar to those of the Funds, comparative fee information for services provided by the Investment Adviser to those accounts, and information that indicated that services provided to the Funds differed in various significant respects from the services provided to other types of accounts which, in many cases, operated under less stringent legal and regulatory structures, required fewer services from the Investment Adviser to a smaller number of client contact points, and were less time-intensive.
In addition, the Trustees noted that shareholders are able to redeem their Fund shares at any time if shareholders believe that the Fund fees and expenses are too high or if they are dissatisfied with the performance of each Fund.
Profitability
The Trustees reviewed the Investment Adviser’s revenues and pre-tax profit margins with respect to the Trust and each of the Funds. In this regard the Trustees noted that they had received, among other things, profitability analyses and summaries, revenue and expense schedules by Fund and by function (i.e., investment management, transfer agency and distribution and service), and information on the Investment Adviser’s expense allocation methodology. They observed that the profitability and expense figures are substantially similar to those used by the Investment Adviser for many internal purposes, including compensation decisions among various business groups, and are thus subject to a vigorous internal debate about how certain revenue and expenses should be allocated. The Trustees also noted that the internal audit group within the Goldman Sachs organization had audited the expense allocation methodology and was satisfied with the reasonableness, consistency, and accuracy of the Investment Adviser’s expense allocation methodology and profitability analysis calculations. Profitability data for the Trust and each Fund were provided for 2015 and 2014 (2015 only for the Global Real Estate Securities Fund), and the Trustees considered this information in relation to the Investment Adviser’s overall profitability. The Trustees considered the Investment Adviser’s revenues and pre-tax profit margins both in absolute terms and in comparison to information on the reported pre-tax profit margins earned by certain other asset management firms.
Economies of Scale
The Trustees considered the information that had been provided regarding the Investment Adviser’s profitability. The Trustees also considered the breakpoints in the fee rate payable under the Management Agreement for each of the Funds at the following annual percentage rates of the average daily net assets of the Funds:
| | | | | | | | | | | | |
| | | Real Estate
Securities Fund | | | International Real
Estate Securities
Fund | | | Global Real Estate
Securities Fund | |
| First $1 billion | | | 1.00 | % | | | 1.05 | % | | | 1.05 | % |
| Next $1 billion | | | 0.90 | | | | 1.05 | | | | 0.95 | |
| Next $3 billion | | | 0.86 | | | | 0.95 | | | | 0.90 | |
| Next $3 billion | | | 0.84 | | | | 0.90 | | | | 0.88 | |
| Over $8 billion | | | 0.82 | | | | 0.88 | | | | 0.86 | |
51
GOLDMAN SACHS REAL ESTATE SECURITIES FUNDS
Statement Regarding Basis for Approval of Management Agreement (Unaudited) (continued)
The Trustees noted that the breakpoints were designed to share potential economies of scale, if any, with the Funds and their shareholders as assets under management reach those asset levels. The Trustees considered the amounts of assets in the Funds; the Funds’ recent share purchase and redemption activity; the information provided by the Investment Adviser relating to the costs of the services provided by the Investment Adviser and its affiliates and their realized profits; information comparing fee rates charged by the Investment Adviser with fee rates charged to other funds in the peer groups; and the Investment Adviser’s undertaking to waive a portion of its management fees and to limit certain expenses of the Funds that exceed specified levels. Upon reviewing these matters at the Annual Meeting, the Trustees concluded that the fee breakpoints represented a means of assuring that benefits of scalability, if any, would be passed along to shareholders at the specified asset levels.
Other Benefits to the Investment Adviser and Its Affiliates
The Trustees also considered the other benefits derived by the Investment Adviser and its affiliates from their relationships with the Funds as stated above, including: (a) transfer agency fees received by Goldman, Sachs & Co. (“Goldman Sachs”); (b) brokerage and futures commissions earned by Goldman Sachs for executing securities and futures transactions on behalf of the Funds; (c) research received by the Investment Adviser from broker-dealers in exchange for executing certain transactions on behalf of the Funds; (d) trading efficiencies resulting from aggregation of orders of the Funds with those for other funds or accounts managed by the Investment Adviser; (e) the Investment Adviser’s ability to leverage the infrastructure designed to service the Funds on behalf of its other clients; (f) the Investment Adviser’s ability to cross-market other products and services to Fund shareholders; (g) Goldman Sachs’ retention of certain fees as Fund Distributor; (h) the Investment Adviser’s ability to negotiate better pricing with custodians on behalf of its other clients, as a result of the relationship with the Funds; and (i) the possibility that the working relationship between the Investment Adviser and the Funds’ third-party service providers may cause those service providers to be more likely to do business with other areas of Goldman Sachs. In the course of considering the foregoing, the Independent Trustees requested and received further information quantifying certain of these fall-out benefits.
Other Benefits to the Funds and Their Shareholders
The Trustees also noted that the Funds receive certain potential benefits as a result of their relationship with the Investment Adviser, including: (a) trading efficiencies resulting from aggregation of orders of the Funds with those of other funds or accounts managed by the Investment Adviser; (b) enhanced servicing from vendors because of the volume of business generated by the Investment Adviser and its affiliates; (c) enhanced servicing from broker-dealers because of the volume of business generated by the Investment Adviser and its affiliates; (d) the Investment Adviser’s ability to negotiate favorable terms with derivatives counterparties on behalf of the Funds as a result of the size and reputation of the Goldman Sachs organization; (e) the Investment Adviser’s knowledge and experience gained from managing other accounts and products; (f) the Investment Adviser’s ability to hire and retain qualified personnel to provide services to the Funds because of the reputation of the Goldman Sachs organization; (g) the Funds’ access, through the Investment Adviser, to certain firmwide resources (e.g., proprietary risk management systems and databases), subject to certain restrictions; and (h) the Funds’ access to certain affiliated distribution channels. In addition, the Trustees noted the competitive nature of the mutual fund marketplace, and considered that many of the Funds’ shareholders invested in the Funds in part because of the Funds’ relationship with the Investment Adviser and that those shareholders have a general expectation that the relationship will continue.
Conclusion
In connection with their consideration of the Management Agreement, the Trustees gave weight to each of the factors described above, but did not identify any particular factor as controlling their decision. After deliberation and consideration of all of the information provided, including the factors described above, the Trustees concluded, in the exercise of their business judgment, that the management fees paid by each of the Funds were reasonable in light of the services provided to it by the Investment Adviser, the Investment Adviser’s costs and each Fund’s current and reasonably foreseeable asset levels. The Trustees unanimously concluded that the Investment Adviser’s continued management likely would benefit each Fund and its shareholders and that the Management Agreement should be approved and continued with respect to each Fund until June 30, 2017.
52
FUNDS PROFILE
Goldman Sachs Funds

Goldman Sachs is a premier financial services firm, known since 1869 for creating thoughtful and customized investment solutions in complex global markets.
Today, the Investment Management Division of Goldman Sachs serves a diverse set of clients worldwide, including private institutions, public entities and individuals. With approximately $1.12 trillion in assets under supervision as of June 30, 2016, Goldman Sachs Asset Management (“GSAM”) has portfolio management teams located around the world and our investment professionals bring firsthand knowledge of local markets to every investment decision. Assets under supervision includes assets under management and other client assets for which Goldman Sachs does not have full discretion. GSAM leverages the resources of Goldman, Sachs & Co. subject to legal, internal and regulatory restrictions.

Money Market1
Financial Square FundsSM
| n | | Financial Square Treasury Solutions Fund2 |
| n | | Financial Square Government Fund |
| n | | Financial Square Money Market Fund |
| n | | Financial Square Prime Obligations Fund |
| n | | Financial Square Treasury Instruments Fund |
| n | | Financial Square Treasury Obligations Fund |
| n | | Financial Square Federal Instruments Fund |
| n | | Financial Square Tax-Exempt Money Market Fund |
Investor FundsSM
| n | | Investor Money Market Fund |
| n | | Investor Tax-Exempt Money Market Fund3 |
Fixed Income
Short Duration and Government
| n | | High Quality Floating Rate Fund |
| n | | Short-Term Conservative Income Fund4 |
| n | | Short Duration Government Fund |
| n | | Short Duration Income Fund |
| n | | Inflation Protected Securities Fund |
Multi-Sector
Municipal and Tax-Free
| n | | High Yield Municipal Fund |
| n | | Dynamic Municipal Income Fund |
| n | | Short Duration Tax-Free Fund |
Single Sector
| n | | Investment Grade Credit Fund |
| n | | High Yield Floating Rate Fund |
| n | | Emerging Markets Debt Fund |
| n | | Local Emerging Markets Debt Fund |
| n | | Dynamic Emerging Markets Debt Fund |
Fixed Income Alternatives
| n | | Long Short Credit Strategies Fund |
| n | | Fixed Income Macro Strategies Fund |
Fundamental Equity
| n | | Small/Mid Cap Value Fund |
| n | | Small/Mid Cap Growth Fund |
| n | | Flexible Cap Growth Fund |
| n | | Concentrated Growth Fund |
| n | | Technology Opportunities Fund5 |
| n | | Growth Opportunities Fund |
| n | | Rising Dividend Growth Fund |
| n | | Dynamic U.S. Equity Fund |
Tax-Advantaged Equity
| n | | U.S. Tax-Managed Equity Fund |
| n | | International Tax-Managed Equity Fund |
| n | | U.S. Equity Dividend and Premium Fund |
| n | | International Equity Dividend and Premium Fund |
Equity Insights
| n | | Small Cap Equity Insights Fund |
| n | | U.S. Equity Insights Fund |
| n | | Small Cap Growth Insights Fund |
| n | | Large Cap Growth Insights Fund |
| n | | Large Cap Value Insights Fund |
| n | | Small Cap Value Insights Fund |
| n | | International Small Cap Insights Fund6 |
| n | | International Equity Insights Fund |
| n | | Emerging Markets Equity Insights Fund |
Fundamental Equity International
| n | | Strategic International Equity Fund |
| n | | Focused International Equity Fund |
| n | | Emerging Markets Equity Fund7 |
Select Satellite8
| n | | Real Estate Securities Fund |
| n | | International Real Estate Securities Fund |
| n | | Commodity Strategy Fund |
| n | | Global Real Estate Securities Fund |
| n | | Dynamic Commodity Strategy Fund |
| n | | Dynamic Allocation Fund |
| n | | Absolute Return Tracker Fund |
| n | | Managed Futures Strategy Fund |
| n | | MLP Energy Infrastructure Fund |
| n | | Multi-Manager Alternatives Fund |
| n | | Multi-Asset Real Return Fund |
| n | | Absolute Return Multi-Asset Fund |
| n | | Global Infrastructure Fund |
Total Portfolio Solutions8
| n | | Global Managed Beta Fund |
| n | | Multi-Manager Non-Core Fixed Income Fund |
| n | | Multi-Manager U.S. Dynamic Equity Fund |
| n | | Multi-Manager Global Equity Fund |
| n | | Multi-Manager International Equity Fund |
| n | | Tactical Tilt Overlay Fund9 |
| n | | Balanced Strategy Portfolio |
| n | | Multi-Manager U.S. Small Cap Equity Fund |
| n | | Multi-Manager Real Assets Strategy Fund |
| n | | Growth and Income Strategy Portfolio |
| n | | Growth Strategy Portfolio |
| n | | Equity Growth Strategy Portfolio |
| n | | Satellite Strategies Portfolio |
| n | | Enhanced Dividend Global Equity Portfolio |
| n | | Tax Advantaged Global Equity Portfolio |
| n | | Strategic Factor Allocation Fund |
| 1 | | An investment in a money market portfolio is not insured or guaranteed by the Federal Deposit Insurance Corporation or any other government agency. Although a money market portfolio seeks to preserve the value of an investment at $1.00 per share, it is possible to lose money by investing in a money market portfolio. The Fund’s sponsor has no legal obligation to provide financial support to a money market portfolio, and you should not expect that the sponsor will provide financial support to the money market portfolio at any time. |
| 2 | | Effective on September 30, 2015, the Goldman Sachs Financial Square Federal Fund was renamed the Goldman Sachs Financial Square Treasury Solutions Fund. |
| 3 | | Effective on March 31, 2016, the Goldman Sachs Financial Square Tax-Free Money Market Fund was renamed the Goldman Sachs Investor Tax-Exempt Money Market Fund. |
| 4 | | Effective on July 29, 2016, the Goldman Sachs Limited Maturity Obligations Fund was renamed the Goldman Sachs Short-Term Conservative Income Fund. |
| 5 | | Effective on July 31, 2015, the Goldman Sachs Technology Tollkeeper Fund was renamed the Goldman Sachs Technology Opportunities Fund. |
| 6 | | Effective at the close of business on February 5, 2016, the Goldman Sachs International Small Cap Fund was reorganized with and into the Goldman Sachs International Small Cap Insights Fund. |
| 7 | | Effective at the close of business on October 23, 2015, the Goldman Sachs BRIC Fund (Brazil, Russia, India, China) was reorganized with and into the Goldman Sachs Emerging Markets Equity Fund. |
| 8 | | Individual Funds within the Total Portfolio Solutions and Select Satellite categories will have various placement on the risk/return spectrum and may have greater or lesser risk than that indicated by the placement of the general Total Portfolio Solutions or Select Satellite category. |
| 9 | | Effective on June 1, 2016, the Goldman Sachs Tactical Tilt Implementation Fund was renamed the Goldman Sachs Tactical Tilt Overlay Fund. Financial Square FundsSM and Investor FundsSM are registered service marks of Goldman, Sachs & Co. |
| * | | This list covers open-end funds only. Please visit our website at www.GSAMFUNDS.com to learn about our closed-end funds and exchange-traded funds. |
| | |
TRUSTEES Ashok N. Bakhru, Chairman Kathryn A. Cassidy Diana M. Daniels Herbert J. Markley James A. McNamara Jessica Palmer Alan A. Shuch Roy W. Templin Gregory G. Weaver | | OFFICERS James A. McNamara, President Scott M. McHugh, Principal Financial Officer, Senior Vice President and Treasurer Caroline L. Kraus, Secretary |
| |
GOLDMAN, SACHS & CO. Distributor and Transfer Agent | | GOLDMAN SACHS ASSET MANAGEMENT, L.P. Investment Adviser |
Visit our web site at www.GSAMFUNDS.com to obtain the most recent month-end returns.
Goldman Sachs Asset Management, L.P. 200 West Street, New York, New York 10282
Economic and market forecasts presented herein reflect our judgment as of the date of this presentation and are subject to change without notice. These forecasts do not take into account the specific investment objectives, restrictions, tax and financial situation or other needs of any specific client. Actual data will vary and may not be reflected here. These forecasts are subject to high levels of uncertainty that may affect actual performance. Accordingly, these forecasts should be viewed as merely representative of a broad range of possible outcomes. These forecasts are estimated, based on assumptions, and are subject to significant revision and may change materially as economic and market conditions change. Goldman Sachs has no obligation to provide updates or changes to these forecasts. Case studies and examples are for illustrative purposes only.
The portfolio risk management process includes an effort to monitor and manage risk, but does not imply low risk.
The reports concerning the Funds included in this shareholder report may contain certain forward-looking statements about the factors that may affect the performance of the Funds in the future. These statements are based on Fund management’s predictions and expectations concerning certain future events and their expected impact on the Funds, such as performance of the economy as a whole and of specific industry sectors, changes in the levels of interest rates, the impact of developing world events, and other factors that may influence the future performance of the Funds. Management believes these forward-looking statements to be reasonable, although they are inherently uncertain and difficult to predict. Actual events may cause adjustments in portfolio management strategies from those currently expected to be employed.
A description of the policies and procedures that the Funds use to determine how to vote proxies relating to portfolio securities and information regarding how a Fund voted proxies relating to portfolio securities during the most recent 12-month period ended June 30 is available (i) without charge, upon request by calling 1-800-526-7384 (for Retail Shareholders) or 1-800-621-2550 (for Institutional Shareholders); and (ii) on the Securities and Exchange Commission (“SEC”) web site at http://www. sec.gov.
The Global Industry Classification Standard (GICS) was developed by and is the exclusive property and a service mark of Morgan Stanley Capital International Inc. (MSCI) and Standard & Poor’s, a division of The McGraw-Hill Companies, Inc. (S&P) and is licensed for use by Goldman Sachs. Neither MSCI, S&P nor any other party involved in making or compiling the GICS or any GICS classifications makes any express or implied warranties or representations with respect to such standard or classification (or the results to be obtained by the use thereof), and all such parties hereby expressly disclaim all warranties of originality, accuracy, completeness, merchantability or fitness for a particular purpose with respect to any of such standard or classification. Without limiting any of the foregoing, in no event shall MSCI, S&P, any of their affiliates or any third party involved in making or compiling the GICS or any GICS classifications have any liability for any direct, indirect, special, punitive, consequential or any other damages (including lost profits) even if notified of the possibility of such damages.
The Funds file their complete schedule of portfolio holdings with the SEC for the first and third quarters of each fiscal year on Forms N-Q. The Funds’ Forms N-Q are available on the SEC’s web site at http://www.sec.gov within 60 days after the Funds’ first and third fiscal quarters. The Funds’ Forms N-Q may be reviewed and copied at the SEC’s Public Reference Room in Washington, D.C. and information on the operation of the Public Reference Room may also be obtained by calling 1-800-SEC-0330. Forms N-Q may be obtained upon request and without charge by calling 1-800-526-7384 (for Retail Shareholders) or 1-800-621-2550 (for Institutional Shareholders).
Holdings and allocations shown are as of June 30, 2016 and may not be representative of future investments. Fund holdings should not be relied on in making investment decisions and should not be construed as research or investment advice regarding particular securities. Current and future holdings are subject to risk.
This material is not authorized for distribution to prospective investors unless preceded or accompanied by a current Prospectus or summary prospectus, if applicable. Investors should consider a Fund’s objective, risks, and charges and expenses, and read the summary prospectus, if available, and/or the Prospectus carefully before investing or sending money. The summary prospectus, if available, and the Prospectus contain this and other information about a Fund and may be obtained from your Authorized Institution or from Goldman, Sachs & Co. by calling (retail – 1-800-526-7384) (institutional – 1-800-621-2550).
© 2016 Goldman Sachs. All rights reserved. 59297.MF.TMPL/06/2016 RESSAR-16/5.7K
Goldman Sachs Funds

| | | | |
| | |
| Semi-Annual Report | | | | June 30, 2016 |
| | |
| | | | Tax-Advantaged Equity Funds |
| | | | U.S. Equity Dividend and Premium |
| | | | International Equity Dividend and Premium |
| | | | U.S. Tax-Managed Equity |
| | | | International Tax-Managed Equity |

Goldman Sachs Tax-Advantaged
Equity Funds
| n | | U.S. EQUITY DIVIDEND AND PREMIUM |
| n | | INTERNATIONAL EQUITY DIVIDEND AND PREMIUM |
| n | | U.S. TAX-MANAGED EQUITY |
| n | | INTERNATIONAL TAX-MANAGED EQUITY |
| | | | |
TABLE OF CONTENTS | | | | |
| |
Market Review | | | 1 | |
| |
Investment Process — Equity Dividend and Premium Funds | | | 4 | |
| |
Portfolio Management Discussion and Analysis — Equity Dividend and Premium Funds | | | 5 | |
| |
Investment Process — Global Tax-Managed Funds | | | 15 | |
| |
Portfolio Management Discussion and Analysis — Global
Tax-Managed Funds | | | 16 | |
| |
Schedules of Investments | | | 27 | |
| |
Financial Statements | | | 52 | |
| |
Financial Highlights | | | 56 | |
| |
Notes to the Financial Statements | | | 64 | |
| |
Other Information | | | 81 | |
| | | | |
| | | |
| NOT FDIC-INSURED | | May Lose Value | | No Bank Guarantee |
MARKET REVIEW
Goldman Sachs U.S. Tax-Advantaged Equity Funds
Market Review
During the six months ended June 30, 2016 (the “Reporting Period”), U.S. equities recorded positive returns, while international equities suffered a decline.
U.S. Equities
As the Reporting Period began in January 2016, U.S. equities were embroiled in a global rout, triggered by investor concerns about an intensifying economic slowdown in China and exacerbated by an oil price plunge. Following a December 2015 interest rate hike, the January 2016 Federal Reserve (“Fed”) statement acknowledged these external risks and tightening financial conditions. U.S. equities stabilized in February 2016, as market sentiment improved on the more dovish tone set by global central banks. (Dovish language tends to suggest lower interest rates.) U.S. equities were also supported by stronger economic data, rallying as fourth quarter U.S. Gross Domestic Product (“GDP”) came in above consensus expectations. In March 2016, the Fed kept interest rates on hold and surprised on the dovish side, reducing its forecast to two interest rate hikes in 2016, down from four. Along with receding global economic concerns, this helped to drive a recovery in U.S. equities. Released in March 2016, February 2016 unemployment data came in ahead of market consensus, with unemployment steady at 4.9% in spite of higher participation rates and declining underemployment.
Following the rebound in March 2016, market sentiment appeared to remain sanguine in April 2016, as oil prices rose and China’s economic growth concerns abated. U.S. equities fell near the end of the month as investors were disappointed by a lack of additional stimulus from the Bank of Japan and by a weaker than consensus expected first quarter U.S. GDP growth rate of 0.5%. Hawkish Fed minutes released in May 2016 temporarily revived market expectations for a Fed interest rate hike in June 2016, but weaker than expected May 2016 payroll data subsequently drove such expectations lower. (Hawkish language tends to suggest higher interest rates; opposite of dovish.) The Fed ultimately held interest rates steady in June 2016 and signaled a slower pace of hikes, acknowledging the slowdown in the labor market. Markets were otherwise dominated in June 2016 by the U.K. referendum on membership in the European Union, popularly known as Brexit. U.S. equities sold off in the global risk-off in June 2016 following the surprise “leave” result. Markets rebounded in the latter days of the month owing to improving risk sentiment as markets digested the Brexit vote outcome and on dovish remarks from Bank of England Governor Carney.
U.S. equities, as represented by the S&P 500® Index, gained 3.84% during the Reporting Period. Telecommunication services and utilities were the best performing sectors in the S&P 500® Index by a wide margin. Energy and consumer staples also posted double-digit gains. The energy sector was the largest positive contributor to S&P 500® Index returns, as measured by weight times performance. The weakest performing sectors in the S&P 500®
1
MARKET REVIEW
Index during the Reporting Period were financials and information technology, the only two to post negative absolute returns, followed by consumer discretionary and health care, which were also weak but generated modestly positive returns during the Reporting Period.
Within the U.S. equity market, there was significant disparity in performance not only among sectors but also among the various capitalization and style segments. While all capitalization segments posted positive returns, mid-cap stocks, as measured by the Russell Midcap® Index, performed best, followed by large-cap stocks, as measured by the Russell 1000® Index, and then, small-cap stocks, as measured by the Russell 2000® Index. From a style perspective, value-oriented stocks significantly outpaced growth-oriented stocks across the capitalization spectrum. Value outperformed relative to growth during the Reporting Period primarily due to weaker performance of the growth-oriented health care sector. (All as measured by the Russell Investments indices.)
International Equities
International equities suffered amid a global rout at the beginning of 2016, triggered by investor concerns of an intensifying economic slowdown in China and exacerbated by an oil price plunge. Sentiment improved following a dovish January European Central Bank (“ECB”) press conference on January 21, 2016, and the Bank of Japan’s (“BoJ”) introduction of negative interest rates. In turn, international equities stabilized in February 2016. However, the MSCI EAFE Index still fell 1.83% in February 2016. In March 2016, further central bank dovishness, along with receding global economic concerns and oil price stabilization, helped to finally drive a global equity market recovery. Notably, the ECB implemented heavy quantitative easing, cutting its deposit rate to -40 basis points, raising its monthly quantitative easing purchases, including those of corporate bonds, and unveiling a new series of four-year loans to banks. (A basis point is 1/100th of a percentage point.) The BoJ left its monetary policy unchanged in March 2016, but its rhetoric about negative interest rates heightened expectations for further easing to come.
Market sentiment appeared to remain sanguine in April 2016, as oil prices rose and China’s economic growth concerns abated with modestly improving economic data. Both the ECB and BoJ were on hold, or did not make any monetary policy changes, in April 2016. BoJ inaction came as a major disappointment against expectations of further easing, causing international equities to sell off once again and the yen to appreciate. Relative currency appreciation was exacerbated by U.S. dollar weakness following a weaker than expected first quarter U.S. GDP growth rate release and an uneventful Fed meeting during which rates were left unchanged.
Hawkish Fed minutes released in May 2016 temporarily revived market expectations for a Fed interest rate hike in June 2016, but weaker than expected May 2016 payroll data subsequently drove such expectations lower. Equities rallied toward the end of May 2016 in anticipation of better economic data, rising oil prices and optimism that the economy could withstand rate hikes. Japanese equities also benefited from stronger than expected first quarter 2016 GDP growth and a weaker yen.
Markets were dominated in June 2016 by anticipation around the U.K. referendum on membership in the European Union, popularly known as the Brexit vote. International equities
2
MARKET REVIEW
declined in the global risk-off sentiment that dominated the days following the June 23, 2016 vote given the surprise “leave” result. Markets rebounded in the latter days of June 2016 owing to improving risk appetite, as markets digested the outcome of the Brexit vote and on dovish remarks from Bank of England Governor Carney. Still, the MSCI EAFE Index declined 3.36% in the last month of the Reporting Period.
International equities, as measured by the MSCI EAFE Index, returned -4.42% in U.S. dollar terms for the Reporting Period. Energy, consumer staples, materials, utilities and industrials were the only sectors in the MSCI EAFE Index to post a positive return. The weakest performing sectors in the MSCI EAFE Index during the Reporting Period were financials and consumer discretionary, followed at some distance by information technology, health care and then telecommunication services.
From a country perspective, New Zealand, Singapore and Norway were the best performing equity markets in the MSCI EAFE Index during the Reporting Period. Italy was the weakest individual country constituent in the MSCI EAFE Index during the Reporting Period, followed at some distance by Ireland, Israel and Spain.
Looking Ahead
In the months ahead, we expect less expensive stocks to outpace more expensive stocks. We also believe that stocks with good momentum are likely to outperform those with poor momentum. Our plan is to seek profitable companies with positive fundamentals, sustainable earnings and a track record of using capital to enhance shareholder value. To that end, we anticipate remaining fully invested, with long-term performance likely to be the result of stock selection rather than sector or capitalization allocations.
We stand behind our investment philosophy that sound economic investment principles, coupled with a disciplined quantitative approach, can provide potentially strong, uncorrelated returns over the long term. Our research agenda is robust, and we continue to enhance our existing models, add new proprietary forecasting signals and improve our trading execution as we seek to provide the most value to our shareholders.
3
INVESTMENT PROCESS
What Differentiates the Goldman Sachs
U.S. Equity Dividend and Premium and
Goldman Sachs International Equity Dividend
and Premium Funds’ Investment Process?
The Goldman Sachs U.S. Equity Dividend and Premium Fund seeks to maximize income and total return. The Goldman Sachs International Equity Dividend and Premium Fund seeks to maximize total return with an emphasis on income. Their portfolios consist primarily of large-cap, dividend-paying stocks.1 By investing in these securities, and through the use of option call writing, the Funds seek to generate an attractive after-tax cash flow.

A diversified portfolio:
| n | | Create a diversified large-cap equity portfolio that participates in all industries and sectors. |
| n | | Emphasize higher dividend-paying stocks within each industry and sector. |
Written call options:
| n | | The Funds utilize index call writing to seek to enhance their cash flow. |

| n | | We use proprietary quantitative techniques, including optimization tools, a risk model and a transactions cost model, in identifying a portfolio of stocks that we believe may enhance expected dividend yield while limiting deviations when compared to the S&P 500® Index or MSCI EAFE Index, as applicable. |

| n | | A fully invested, style-consistent portfolio. |
| n | | The Funds seek attractive after-tax cash flow from qualified dividends, long-term capital gains and option call writing. |
| n | | The Funds seek to enhance after-tax returns by generating distributions primarily from qualified dividends and long-term capital gains. |
| 1 | | Dividends are not guaranteed and a company’s future ability to pay dividends may be limited.
There is no guarantee that these objectives will be met. |
4
PORTFOLIO RESULTS
U.S. Equity Dividend and Premium Fund
Investment Objective
The Fund seeks to maximize income and total return.
Portfolio Management Discussion and Analysis
Below, the Goldman Sachs Quantitative Investment Strategies Team discusses the Goldman Sachs U.S. Equity Dividend and Premium Fund’s (the “Fund”) performance and positioning for the six-month period ended June 30, 2016 (the “Reporting Period”).
| Q | | How did the Fund perform during the Reporting Period? |
| A | | During the Reporting Period, the Fund’s Class A, C, Institutional and IR Shares generated cumulative total returns, without sales charges, of 5.55%, 5.14%, 5.76% and 5.60%, respectively. These returns compare to the 3.84% cumulative total return of the Fund’s primary benchmark, the Standard & Poor’s 500® Index (with dividends reinvested) (the “S&P 500® Index”), during the same period. The Barclays U.S. Aggregate Bond Index, the secondary benchmark, returned 5.31%. Although the Fund does not invest in fixed income securities, maximizing income is part of the Fund’s investment objective, and therefore we believe that a comparison of the Fund’s performance to that of the Barclays U.S. Aggregate Bond Index is useful to investors. |
| Q | | What key factors were most responsible for the Fund’s performance during the Reporting Period? |
| A | | The sale of call options on the S&P 500® Index contributed positively to the Fund’s total return during the Reporting Period. (A call option is an option that gives the holder the right to buy a certain quantity of an underlying security at an agreed-upon price at any time up to an agreed-upon date.) |
| | Security selection overall also bolstered performance, with the Fund especially benefiting from its bias towards stocks with higher dividend yields. More specifically, positions in the industrials, health care and telecommunication services sectors added to results. Conversely, positions in the utilities, materials and financials sectors detracted from relative returns. |
| Q | | How did the Fund’s call writing affect its performance? |
| A | | Consistent with our investment approach, we wrote index call options on a portion of the stock portfolio’s market value. When the Fund sells an index call option, it retains the premium it receives from the sale. However, if the purchaser exercises the option, the Fund is obligated to pay the purchaser the difference between the price of the index and the exercise price of the option. Although the Fund retains the premium it receives from the sale of the option, the premium may not exceed the difference in the value of the index as call options are exercised. This is what happened during the Reporting Period for certain of the Fund’s options positions; however, our call writing overall contributed positively to performance. |
| | Call option writing also has the potential to reduce Fund volatility. Since its inception, the realized daily volatility of the Fund has been 18.58% compared to the realized volatility of the S&P 500® Index of 20.14%. During the Reporting Period, the realized daily volatility of the Fund was 14.86%1 compared to the realized volatility of the S&P 500® Index of 15.97%. |
| Q | | What was the Fund’s dividend yield during the Reporting Period? |
| A | | While maintaining industry and sector weights consistent with the S&P 500® Index, we favor stocks with higher dividend yields. The dividend yield of the Fund’s Institutional Share class during the Reporting Period was 2.81% compared to 2.19% for the S&P 500® Index. (Dividend yield is a ratio that shows how much a company pays out in dividends in a year divided by its share price.) The Fund’s dividend yield served to enhance its quarterly net income distributions. As of June 30, 2016, the Standardized 30-Day Subsidized Yield was 2.07% and the Standardized 30-Day Unsubsidized Yield was 2.05%.2 |
| | 1 | | The realized daily volatility of the Fund quoted herein is for Institutional Shares, net of fees. Based on GSAM calculations. |
| | 2 | | The Standardized 30-Day Subsidized Yield and Standardized 30-Day Unsubsidized Yield of the Fund quoted herein is for Institutional Shares, net of fees. Based on GSAM calculations. |
5
PORTFOLIO RESULTS
| Q | | Among individual holdings, which stocks contributed most to the Fund’s results? |
| A | | Relative to the S&P 500® Index, the Fund benefited from an underweight position in financial services company Citigroup and overweight positions in AT&T and CenturyLink, each a telecommunications firms. The Fund was underweight Citigroup because of that stock’s unattractive yield and/ or risk metrics. It was overweight AT&T and CenturyLink because of those stocks’ attractive dividend yields and/or risk metrics. |
| Q | | Which individual stock holdings detracted significantly from relative performance during the Reporting Period? |
| A | | The Fund was hurt by overweight positions relative to the S&P 500® Index in Waddell & Reed Financial, an asset management and financial planning firm; Invesco, an investment management company; and L Brands, a fashion retailer. The Fund held these stocks largely because of their attractive dividend yields and/or risk metrics. |
| Q | | How did the Fund use derivatives and similar instruments during the Reporting Period? |
| A | | During the Reporting Period, we used equity index futures, on an opportunistic basis, to equitize the Fund’s excess cash holdings. In other words, we put the Fund’s excess cash holdings to work by using them as collateral for the purchase of equity index futures. Equity index futures did not have a significant impact on Fund performance during the Reporting Period. Consistent with our investment approach, we also wrote equity index options on a portion of the portfolio’s market value in an effort to generate premiums. Equity index options had a positive impact on performance during the Reporting Period. |
| Q | | What changes or enhancements did you make to your quantitative model during the Reporting Period? |
| A | | We made no changes to our quantitative model during the Reporting Period. |
6
FUND BASICS
U.S. Equity Dividend and Premium Fund
as of June 30, 2016
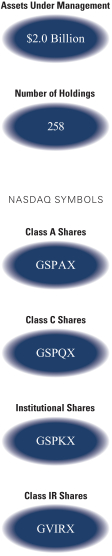
| | | | | | | | | | | | | | |
| | PERFORMANCE REVIEW | |
| | | January 1, 2016–June 30, 2016 | | Fund Total Return
(based on NAV)1 | | | S&P 500® Index2 | | | Barclays U.S. Aggregate
Bond Index3 | |
| | Class A | | | 5.55 | % | | | 3.84 | % | | | 5.31 | % |
| | Class C | | | 5.14 | | | | 3.84 | | | | 5.31 | |
| | Institutional | | | 5.76 | | | | 3.84 | | | | 5.31 | |
| | | Class IR | | | 5.60 | | | | 3.84 | | | | 5.31 | |
| | 1 | | The net asset value (“NAV”) represents the net assets of the class of the Fund (ex-dividend) divided by the total number of shares of the class outstanding. The Fund’s performance reflects the reinvestment of dividends and other distributions. The Fund’s performance does not reflect the deduction of any applicable sales charges. |
| | 2 | | The S&P 500® Index is an unmanaged composite index of 500 common stock prices. The Index figures do not include any deduction for fees, expenses or taxes. It is not possible to invest directly in an index. |
| | 3 | | The Barclays U.S. Aggregate Bond Index represents an unmanaged diversified portfolio of fixed income securities, including U.S. Treasuries, investment-grade corporate bonds, and mortgage-backed and asset-backed securities. The Index figures do not reflect any deduction for fees, expenses or taxes. It is not possible to invest directly in an index. |
| | | | | | | | | | | | | | | | | | | | | | |
| | STANDARDIZED TOTAL RETURNS4 | |
| | | For the period ended 6/30/16 | | One Year | | | Five Years | | | Ten Years | | | Since Inception | | | Inception Date | |
| | Class A | | | -0.78 | % | | | 8.91 | % | | | 6.02 | % | | | 6.00 | % | | | 8/31/05 | |
| | Class C | | | 3.10 | | | | 9.32 | | | | 5.81 | | | | 5.75 | | | | 8/31/05 | |
| | Institutional | | | 5.43 | | | | 10.57 | | | | 7.04 | | | | 6.97 | | | | 8/31/05 | |
| | | Class IR | | | 5.20 | | | | 10.41 | | | | N/A | | | | 13.01 | | | | 8/31/10 | |
| | 4 | | The Standardized Total Returns are average annual total returns as of the most recent calendar quarter-end. They assume reinvestment of all distributions at NAV. These returns reflect a maximum initial sales charge of 5.5% for Class A Shares and the assumed contingent deferred sales charge for Class C Shares (1% if redeemed within 12 months of purchase). Because Institutional and Class IR Shares do not involve a sales charge, such a charge is not applied to their Standardized Total Returns. |
The returns set forth in the tables above represent past performance. Past performance does not guarantee future results. The Fund’s investment return and principal value will fluctuate so that an investor’s shares, when redeemed, may be worth more or less than their original cost. Current performance may be lower or higher than the performance quoted above. Please visit our web site at www.GSAMFUNDS.com to obtain the most recent month-end returns. Performance reflects applicable fee waivers and/or expense limitations in effect during the periods shown. In their absence, performance would be reduced. Returns do not reflect the deduction of taxes that a shareholder would pay on Fund distributions or the redemption of Fund shares.
7
FUND BASICS
| | | | | | | | | | |
| | EXPENSE RATIOS5 | |
| | | | | Net Expense Ratio (Current) | | | Gross Expense Ratio (Before Waivers) | |
| | Class A | | | 1.17 | % | | | 1.20 | % |
| | Class C | | | 1.92 | | | | 1.95 | |
| | Institutional | | | 0.77 | | | | 0.80 | |
| | | Class IR | | | 0.92 | | | | 0.95 | |
| | 5 | | The expense ratios of the Fund, both current (net of applicable fee waivers and/or expense limitations) and before waivers (gross of applicable fee waivers and/or expense limitations) are as set forth above according to the most recent publicly available Prospectus for the Fund and may differ from the expense ratios disclosed in the Financial Highlights in this report. Pursuant to a contractual arrangement, the Fund’s waivers and/or expense limitations will remain in place through at least April 29, 2017, and prior to such date the Investment Adviser may not terminate the arrangements without the approval of the Fund’s Board of Trustees. If these arrangements are discontinued in the future, the expense ratios may change without shareholder approval. |
| | | | | | | | | | | | | | | | | | |
| | STANDARDIZED AFTER-TAX PERFORMANCE AS OF 6/30/166 | |
| | | Class A Shares | | One Year | | | Five Years | | | Ten Years | | | Since Inception
(8/31/05) | |
| | Returns before taxes* | | | -0.78 | % | | | 8.91 | % | | | 6.02 | % | | | 6.00 | % |
| | Returns after taxes on distributions** | | | -2.28 | | | | 7.53 | | | | 5.03 | | | | 5.06 | |
| | | Returns after taxes on distributions***
and sale of Fund shares | | | 0.40 | | | | 6.91 | | | | 4.78 | | | | 4.79 | |
| 6 | | The after-tax returns are calculated using the historically highest individual federal marginal income tax rates at the time of distributions (currently 23.8% for qualifying ordinary income dividends and long-term capital gain distributions and 43.4% for non-qualifying ordinary income dividends) and do not reflect state and local taxes. Actual after-tax returns will be calculated at calendar year-end and depend on an investor’s tax situation and may differ from those shown. In addition, the after-tax returns shown are not relevant to investors who hold Fund shares through tax-deferred arrangements such as 401(k) plans or individual retirement accounts. Under certain circumstances, the addition of the tax benefits from capital losses resulting from redemptions may cause the Returns After Taxes on Distributions and Sale of Fund Shares to be greater than the Returns After Taxes on Distributions or even Returns Before Taxes. Standardized after-tax returns assume reinvestment of all distributions at NAV and reflect a maximum initial sales charge of 5.5% for Class A Shares. |
| * | | Returns Before Taxes do not reflect taxes on distributions on the Fund’s Class A Shares nor do they show how performance can be impacted by taxes when shares are redeemed. |
| ** | | Returns After Taxes on Distributions assume that taxes are paid on distributions on the Fund’s Class A Shares (i.e., dividends and capital gains) but do not reflect taxes that may be incurred upon redemption of the Class A Shares at the end of the performance period. |
| *** | | Returns After Taxes on Distributions and Sale of Fund Shares reflect taxes paid on distributions on the Fund’s Class A Shares and taxes applicable when the shares are redeemed. |
8
FUND BASICS
| | | | | | | | |
| | TOP TEN HOLDINGS AS OF 6/30/167 |
| | | Holding | | % of Net Assets | | | Line of Business |
| | Apple, Inc. | | | 2.8 | % | | Technology Hardware & Equipment |
| | Microsoft Corp. | | | 2.5 | | | Software & Services |
| | AT&T, Inc. | | | 2.3 | | | Telecommunication Services |
| | Exxon Mobil Corp. | | | 1.9 | | | Energy |
| | Pfizer, Inc. | | | 1.9 | | | Pharmaceuticals, Biotechnology & Life Sciences |
| | General Electric Co. | | | 1.8 | | | Capital Goods |
| | Johnson & Johnson | | | 1.5 | | | Pharmaceuticals, Biotechnology & Life Sciences |
| | Wells Fargo & Co. | | | 1.5 | | | Banks |
| | Amazon.com, Inc. | | | 1.4 | | | Retailing |
| | | The Procter & Gamble Co. | | | 1.4 | | | Household & Personal Products |
| | 7 | | The top 10 holdings may not be representative of the Fund’s future investments. |
|
| FUND VS. BENCHMARK SECTOR ALLOCATIONS8 |
| As of June 30, 2016 |
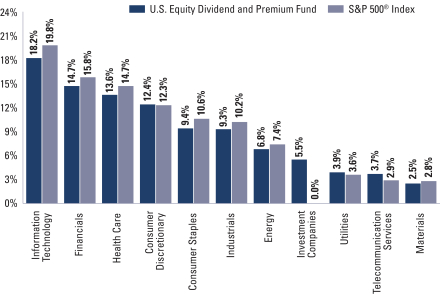
| | 8 | | The Fund is actively managed and, as such, its composition may differ over time. Consequently, the Fund’s overall sector allocations may differ from percentages contained in the graph above. The graph categorizes investments using Global Industry Classification Standard (“GICS”), however, the sector classifications used by the portfolio management team may differ from GICS. The percentage shown for each investment category reflects the value of investments in that category as a percentage of market value (excluding investments in the securities lending reinvestment vehicle, if any). Underlying sector allocations of Exchange Traded Funds and Investment Companies held by the Fund are not reflected in the graph above. Investments in the securities lending reinvestment vehicle represented 0.7% of the Fund’s net assets at June 30, 2016. The graph depicts the Fund’s investments but may not represent the Fund’s market exposure due to the exclusion of certain derivatives, if any, as listed in the Additional Investment Information section of the Schedule of Investments. |
9
PORTFOLIO RESULTS
International Equity Dividend and Premium Fund
Investment Objective
The Fund seeks to maximize total return with an emphasis on income.
Portfolio Management Discussion and Analysis
Below, the Goldman Sachs Quantitative Investment Strategies Team discusses the Goldman Sachs International Equity Dividend and Premium Fund’s (the “Fund”) performance and positioning for the six-month period ended June 30, 2016 (the “Reporting Period”).
| Q | | How did the Fund perform during the Reporting Period? |
| A | | During the Reporting Period, the Fund’s Class A, C, Institutional and IR Shares generated cumulative total returns, without sales charges, of -2.44%, -2.88%, -2.29% and -2.35%, respectively. These returns compare to the -4.42% cumulative total return of the Fund’s primary benchmark, the MSCI EAFE Index (net, USD, unhedged). The Barclays Global Aggregate Bond Index (Gross, USD, Unhedged), the secondary benchmark, returned 8.96%. Although the Fund does not invest in fixed income securities, maximizing income is part of the Fund’s investment objective, and therefore we believe that a comparison of the Fund’s performance to that of the Barclays Global Aggregate Bond Index is useful to investors. |
| Q | | What key factors were most responsible for the Fund’s performance during the Reporting Period? |
| A | | The sale of index call options added to the Fund’s total return during the Reporting Period. (A call option is an option that gives the holder the right to buy a certain quantity of an underlying security at an agreed-upon price at any time up to an agreed-upon date.) |
| | Conversely, security selection overall detracted from returns, although the Fund benefited from its bias towards stocks with higher dividend yields. More specifically, the Fund was hurt by stock selection in the industrials, materials and utilities sectors. On the positive side, the Fund’s holdings in the financials, consumer staples and health care sectors contributed positively. |
| Q | | How did the Fund’s call writing affect its performance? |
| A | | Consistent with our investment approach, we wrote index call options on a portion of the stock portfolio’s market value, primarily on the Japanese, United Kingdom and European indices. When the Fund sells an index call option, it retains the premium it receives from the sale. However, if the purchaser exercises the option, the Fund is obligated to pay the purchaser the difference between the price of the index and the exercise price of the option. While the Fund retains the premium it receives from the sale of the option, the premium may not exceed the difference in the value of the index as call options are exercised. The Fund’s call writing added positively to performance during the Reporting Period, as global stock indices generally declined. |
| | Call option writing also has the potential to reduce Fund volatility. However, since its inception, the realized daily volatility of the Fund has been 22.46% compared to the realized volatility of the MSCI EAFE Index of 20.68%. During the Reporting Period, realized daily volatility of the Fund was 20.73%1 compared to the realized volatility of the MSCI EAFE Index of 21.18%. |
| Q | | What was the Fund’s dividend yield during the Reporting Period? |
| A | | While maintaining industry and sector weights consistent with the MSCI EAFE Index, we favor stocks with higher dividend yields. The dividend yield of the Fund’s Institutional Share class during the Reporting Period was 4.57% compared to 3.60% for the MSCI EAFE Index. (Dividend yield is a ratio that shows how much a company pays out in dividends in a year divided by its share price.) The Fund’s dividend yield served to enhance its quarterly net income distributions. As of June 30, 2016, the Standardized 30-Day Subsidized Yield was 3.23% and the Standardized 30-Day Unsubsidized Yield was 3.22%.2 |
| | 1 | | The realized daily volatility of the Fund quoted herein is for Institutional Shares, net of fees. Based on GSAM calculations. |
| | 2 | | The Standardized 30-Day Subsidized Yield and Standardized 30-Day Unsubsidized Yield of the Fund quoted herein is for Institutional Shares, net of fees. Based on GSAM calculations. |
10
PORTFOLIO RESULTS
| Q | | Among individual holdings, which stocks contributed most to the Fund’s results? |
| A | | During the Reporting Period, the Fund benefited from overweight positions in U.K.-based pharmaceutical company GlaxoSmithKline and U.K.-Dutch consumer goods company Unilever. An underweight in Lloyds, a U.K. retail and commercial bank, also added to performance. The Fund held these stocks largely because of their attractive dividend yields and/or risk metrics. |
| Q | | Which individual stock holdings detracted significantly from relative performance during the Reporting Period? |
| A | | The largest detractors from Fund performance were HSBC, a U.K. bank and financial services firm; Daimler, a German automaker; and Legal & General Group, a U.K.-based financial services company. The Fund held these stocks largely because of their attractive dividend yields and/or risk metrics. |
| Q | | How did the Fund use derivatives and similar instruments during the Reporting Period? |
| A | | During the Reporting Period, we used equity index futures, on an opportunistic basis, to equitize the Fund’s excess cash holdings. In other words, we put the Fund’s excess cash holdings to work by using them as collateral for the purchase of equity index futures. Equity index futures did not have a significant impact on Fund performance during the Reporting Period. Consistent with our investment approach, we also wrote equity index options on a portion of the portfolio’s market value in an effort to generate premiums. Equity index options had a positive impact on performance during the Reporting Period. |
| Q | | What changes or enhancements did you make to your quantitative model during the Reporting Period? |
| A | | We made no changes to our quantitative model during the Reporting Period. |
11
FUND BASICS
International Equity Dividend and Premium Fund
as of June 30, 2016
| | | | | | | | | | | | | | |
| | PERFORMANCE REVIEW | |
| | | January 1, 2016–June 30, 2016 | | Fund Total Return
(based on NAV)1 | | | MSCI EAFE Index
(net, USD, unhedged)2 | | | Barclays Global Aggregate
Bond Index3 | |
| | Class A | | | -2.44 | % | | | -4.42 | % | | | 8.96 | % |
| | Class C | | | -2.88 | | | | -4.42 | | | | 8.96 | |
| | Institutional | | | -2.29 | | | | -4.42 | | | | 8.96 | |
| | | Class IR | | | -2.35 | | | | -4.42 | | | | 8.96 | |
| | 1 | | The net asset value (“NAV”) represents the net assets of the class of the Fund (ex-dividend) divided by the total number of shares of the class outstanding. The Fund’s performance reflects the reinvestment of dividends and other distributions. The Fund’s performance does not reflect the deduction of any applicable sales charges. |
| | 2 | | The MSCI EAFE Index (net, USD, unhedged) is an unmanaged market capitalization-weighted composite of securities in 21 developed markets. The Index figures do not include any deduction for fees or expenses. It is not possible to invest directly in an index. |
| | 3 | | The Barclays Global Aggregate Bond Index represents an unmanaged diversified portfolio of fixed income securities, including U.S. Treasuries, investment-grade corporate bonds, and mortgage-backed and asset-backed securities. The Index figures do not reflect any deduction for fees, expenses or taxes. It is not possible to invest directly in an index. |
| | | | | | | | | | | | | | | | | | |
| | STANDARDIZED TOTAL RETURNS4 | |
| | | For the period ended 6/30/16 | | One Year | | | Five Years | | | Since Inception | | | Inception Date | |
| | Class A | | | -14.11 | % | | | -1.78 | % | | | -1.84 | % | | | 1/31/08 | |
| | Class C | | | -10.78 | | | | -1.42 | | | | -2.08 | | | | 1/31/08 | |
| | Institutional | | | -8.69 | | | | -0.26 | | | | -0.93 | | | | 1/31/08 | |
| | | Class IR | | | -8.93 | | | | -0.46 | | | | 3.16 | | | | 8/31/10 | |
| | 4 | | The Standardized Total Returns are average annual total returns as of the most recent calendar quarter-end. They assume reinvestment of all distributions at NAV. These returns reflect a maximum initial sales charge of 5.5% for Class A Shares and the assumed contingent deferred sales charge for Class C Shares (1% if redeemed within 12 months of purchase). Because Institutional and Class IR Shares do not involve a sales charge, such a charge is not applied to their Standardized Total Returns. |
The returns set forth in the tables above represent past performance. Past performance does not guarantee future results. The Fund’s investment return and principal value will fluctuate so that an investor’s shares, when redeemed, may be worth more or less than their original cost. Current performance may be lower or higher than the performance quoted above. Please visit our web site at www.GSAMFUNDS.com to obtain the most recent month-end returns. Performance reflects applicable fee waivers and/or expense limitations in effect during the periods shown. In their absence, performance would be reduced. Returns do not reflect the deduction of taxes that a shareholder would pay on Fund distributions or the redemption of Fund shares.
12
FUND BASICS
| | | | | | | | | | |
| | EXPENSE RATIOS5 | |
| | | | | Net Expense Ratio (Current) | | | Gross Expense Ratio (Before Waivers) | |
| | Class A | | | 1.37 | % | | | 1.37 | % |
| | Class C | | | 2.12 | | | | 2.12 | |
| | Institutional | | | 0.97 | | | | 0.97 | |
| | | Class IR | | | 1.12 | | | | 1.12 | |
| | 5 | | The expense ratios of the Fund, both current (net of applicable fee waivers and/or expense limitations) and before waivers (gross of applicable fee waivers and/or expense limitations), are as set forth above according to the most recent publicly available Prospectus. |
| | | | | | | | | | | | | | |
| | STANDARDIZED AFTER-TAX PERFORMANCE AS OF 6/30/166 | |
| | | Class A Shares | | One Year | | | Five Years | | | Since Inception
(1/31/08) | |
| | Returns before taxes* | | | -14.11 | % | | | -1.78 | % | | | -1.84 | % |
| | Returns after taxes on distributions** | | | -14.97 | | | | -2.69 | | | | -2.47 | |
| | | Returns after taxes on distributions***
and sale of Fund shares | | | -7.48 | | | | -1.05 | | | | -1.05 | |
| 6 | | The after-tax returns are calculated using the historically highest individual federal marginal income tax rates at the time of distributions (currently 23.8% for qualifying ordinary income dividends and long-term capital gain distributions and 43.4% for non-qualifying ordinary income dividends) and do not reflect state and local taxes. Actual after-tax returns will be calculated at calendar year-end and depend on an investor’s tax situation and may differ from those shown. In addition, the after-tax returns shown are not relevant to investors who hold Fund shares through tax-deferred arrangements such as 401(k) plans or individual retirement accounts. Under certain circumstances, the addition of the tax benefits from capital losses resulting from redemptions may cause the Returns After Taxes on Distributions and Sale of Fund Shares to be greater than the Returns After Taxes on Distributions or even Returns Before Taxes. Standardized after-tax returns assume reinvestment of all distributions at NAV and reflect a maximum initial sales charge of 5.5% for Class A Shares. |
| * | | Returns Before Taxes do not reflect taxes on distributions on the Fund’s Class A Shares nor do they show how performance can be impacted by taxes when shares are redeemed. |
| ** | | Returns After Taxes on Distributions assume that taxes are paid on distributions on the Fund’s Class A Shares (i.e., dividends and capital gains) but do not reflect taxes that may be incurred upon redemption of the Class A Shares at the end of the performance period. |
| *** | | Returns After Taxes on Distributions and Sale of Fund Shares reflect taxes paid on distributions on the Fund’s Class A Shares and taxes applicable when the shares are redeemed. |
13
FUND BASICS
| | | | | | | | |
| | TOP TEN HOLDINGS AS OF 6/30/167 |
| | | Company | | % of Net Assets | | | Line of Business |
| | GlaxoSmithKline PLC ADR | | | 2.4 | % | | Pharmaceuticals, Biotechnology & Life Sciences |
| | HSBC Holdings PLC | | | 2.1 | | | Banks |
| | Novartis AG (Registered) | | | 1.8 | | | Pharmaceuticals, Biotechnology & Life Sciences |
| | Anheuser-Busch InBev NV | | | 1.6 | | | Food, Beverage & Tobacco |
| | Unilever NV CVA | | | 1.5 | | | Household & Personal Products |
| | Roche Holding AG | | | 1.4 | | | Pharmaceuticals, Biotechnology & Life Sciences |
| | Zurich Insurance Group AG | | | 1.4 | | | Insurance |
| | Vodafone Group PLC ADR | | | 1.4 | | | Telecommunication Services |
| | National Australia Bank Ltd. | | | 1.3 | | | Banks |
| | | Engie SA | | | 1.2 | | | Utilities |
| | 7 | | The top 10 holdings may not be representative of the Fund’s future investments. |
|
| FUND VS. BENCHMARK SECTOR ALLOCATIONS8 |
| As of June 30, 2016 |
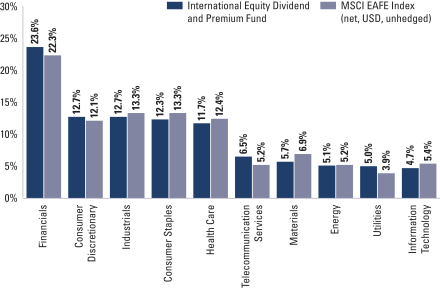
| | 8 | | The Fund is actively managed and, as such, its composition may differ over time. Consequently, the Fund’s overall sector allocations may differ from percentages contained in the graph above. The graph categorizes investments using Global Industry Classification Standard (“GICS”), however, the sector classifications used by the portfolio management team may differ from GICS. The percentage shown for each investment category reflects the value of investments in that category as a percentage of market value (excluding investments in the securities lending reinvestment vehicle, if any). Underlying sector allocations of Exchange Traded Funds and Investment Companies held by the Fund are not reflected in the graph above. Investments in the securities lending reinvestment vehicle represented 1.0% of the Fund’s net assets at June 30, 2016. The graph depicts the Fund’s investments but may not represent the Fund’s market exposure due to the exclusion of certain derivatives, if any, as listed in the Additional Investment Information section of the Schedule of Investments. |
14
INVESTMENT PROCESS
What Differentiates the Goldman Sachs Global Tax-Management Investment Process?
In managing money for many of the world’s wealthiest taxable investors, Goldman Sachs often constructs a diversified investment portfolio around a tax-managed core. With the Goldman Sachs Tax-Managed Equity Fund and Goldman Sachs International Tax-Managed Equity Fund, investors can access Goldman Sachs’ tax-smart investment expertise while capitalizing on this same strategic approach to portfolio construction.
Goldman Sachs Global Tax-Management Investment Process
The Goldman Sachs Global Tax-Management investment process is a disciplined quantitative approach that has been consistently applied since 1989. With the Goldman Sachs Tax-Managed Equity Fund and the Goldman Sachs International Tax-Managed Equity Fund, the investment process is enhanced with an additional layer that seeks to maximize after-tax returns.
| | |
n Comprehensive | | n Extensive |
| |
n Rigorous | | n Fundamental |
| |
n Objective | | n Insightful |
Advantage: Daily analysis of approximately 3,000 U.S. and international equity securities using a proprietary model.
| n | | Sector and size neutral |
Tax optimization is an additional layer that is built into the existing investment process — a distinct advantage. While other managers may simply seek to minimize taxable distributions through a low turnover strategy, this extension of the investment process seeks to maximize after-tax returns — the true objective of every taxable investor.
Advantage: Value added through stock selection — not market timing, industry rotation or style bias.
| n | | A fully invested, style-consistent portfolio |
| n | | Broad access to the total U.S. and international equity markets |
| n | | A consistent goal of seeking to maximize after-tax risk-adjusted returns |
15
PORTFOLIO RESULTS
U.S. Tax-Managed Equity Fund
Investment Objective
The Fund seeks to provide long-term after-tax growth of capital through tax-sensitive participation in a broadly diversified portfolio of U.S. equity securities.
Portfolio Management Discussion and Analysis
Below, the Goldman Sachs Quantitative Investment Strategies Team discusses the Goldman Sachs U.S. Tax-Managed Equity Fund’s (the “Fund”) performance and positioning for the six-month period ended June 30, 2016 (the “Reporting Period”).
| Q | | How did the Fund perform during the Reporting Period? |
| A | | During the Reporting Period, the Fund’s Class A, C, Institutional, Service and IR Shares generated cumulative total returns, without sales charges, of -0.12%, -0.49%, 0.11%, -0.12% and 0.00%, respectively. These returns compare to the 3.62% cumulative total return of the Fund’s benchmark, the Russell 3000® Index (the “Index”), over the same time period. |
| Q | | What key factors were most responsible for the Fund’s performance during the Reporting Period? |
| A | | During the Reporting Period, the Fund benefited from stock selection driven by our quantitative model, with four of the quantitative model’s six investment themes contributing positively to relative returns. However, the Fund underperformed the Index, largely due to the underperformance of our Momentum and Management investment themes. |
| Q | | What impact did the Fund’s investment themes have on performance during the Reporting Period? |
| A | | In keeping with our investment approach, we use our quantitative model and its six investment themes to take a long-term view of market patterns and look for inefficiencies, selecting stocks for the Fund and overweighting or underweighting the ones chosen by the model. Over time and by design, the performance of any one of the model’s investment themes tends to have a low correlation with the model’s other themes, demonstrating the diversification benefit of the Fund’s theme-driven quantitative model. The variance in performance supports our research indicating that the diversification provided by the Fund’s different investment themes is a significant investment advantage over the long term, even though the Fund may experience underperformance in the short term. Of course, diversification does not protect an investor from market risk nor does it ensure a profit. |
| | During the Reporting Period, our Momentum and Management themes detracted from the Fund’s relative performance. The Momentum theme seeks to predict drifts in stock prices caused by delayed investor reaction to company-specific information and information about related companies. The Management theme assesses the characteristics, policies and strategic decisions of company management. |
| | On the positive side, Sentiment, Quality, Profitability and Valuation added to the Fund’s relative results. The Sentiment theme reflects selected investment views and decisions of individuals and financial intermediaries. The Quality theme seeks to assess both firm and management quality. The Profitability theme assesses whether a company is earning more than its cost of capital. The Valuation theme attempts to capture potential mispricings of securities, typically by comparing a measure of the company’s intrinsic value to its market value. |
| Q | | How did the Fund’s sector and industry allocations affect relative performance? |
| A | | In constructing the Fund’s portfolio, we focus on picking stocks rather than on making sector or industry bets. Consequently, the Fund is similar to the Index in terms of its sector and industry allocations and its style. Changes in its sector or industry weights generally do not have a meaningful impact on relative performance. |
| Q | | How successful was your stock selection during the Reporting Period? |
| A | | The Fund seeks to provide investors with a tax-efficient means for maintaining broadly diversified exposure to the |
16
PORTFOLIO RESULTS
| | entire U.S. equity market, ranging from large- to small-cap stocks. During the Reporting Period, our stock selection contributed positively to the Fund’s relative returns. |
| Q | | Among individual holdings, which stocks contributed most to the Fund’s results? |
| A | | Holdings in the information technology, consumer staples and utilities sectors bolstered the Fund’s relative performance during the Reporting Period. More specifically, the Fund benefited from overweight positions in Williams Companies, Tyson Foods and Altria Group. We chose to overweight energy firm Williams Companies because of our positive views on Sentiment, Momentum and Valuation. The Fund was overweight food maker Tyson Foods as a result of our positive views on Quality, Valuation and Sentiment. The overweight in tobacco company Altria Group was due to our positive views on Momentum and Quality. |
| Q | | Which individual stock holdings detracted significantly from relative performance during the Reporting Period? |
| A | | Stock picks in the energy, health care and industrials sectors detracted from relative returns. The Fund was hurt by overweight positions in petroleum refiners Marathon Petroleum and Valero Energy and in cruise line operator Royal Caribbean Cruises. We adopted the overweight in Marathon Petroleum based on our positive views on Sentiment and Valuation. The overweight in Valero Energy was the result of our positive views on Valuation and Momentum. The Fund was overweight Royal Caribbean Cruises due to our positive views on Valuation and Profitability. |
| Q | | How did the Fund use derivatives and similar instruments during the Reporting Period? |
| A | | During the Reporting Period, we did not use derivatives as part of an active management strategy to add value to the Fund’s results. However, we used equity index futures, on an opportunistic basis, to equitize the Fund’s excess cash holdings. In other words, we put the Fund’s excess cash holdings to work by using them as collateral for the purchase of equity index futures. Equity index futures did not have a significant impact on the Fund’s relative performance during the Reporting Period. |
| Q | | What changes or enhancements did you make to your quantitative model during the Reporting Period? |
| A | | During the Reporting Period, we made a number of enhancements to our quantitative model. Within developed markets investment regions, we introduced a factor into our Profitability theme for stocks that evaluates the geographic exposure of companies by tracking the physical locations of their branches, outlets and subsidiaries. In our view, a company with a footprint in growing parts of the world is better positioned relative to a company with a footprint in parts of the world that are contracting. We are able to estimate this factor for more than 5,500 companies globally that have more than one million subsidiaries spread across more than 47,000 cities in more than 200 countries. This enhancement extends our analysis of a company’s global footprint, which has focused historically on the revenue mix across markets. |
| | In addition, we enhanced our Momentum theme by introducing a signal that evaluates linkages embedded within companies’ web pages. Embedded linkages are effective indicators of the similarity of the underlying businesses of companies across a variety of industries, such as retail, media, hospitality, software, banks and airlines. |
| | Also during the Reporting Period, we undertook research of various environmental, social and governance (“ESG”) metrics and their ability to forecast returns. We subsequently enhanced our Quality theme by introducing an environmental impact factor. The factor measures the amount of environmental resources consumed to produce a unit of output for more than 2,000 companies, which we expect to help us in our efforts to strategically tilt portfolios toward companies with favorable environmental profiles. Furthermore, within our Momentum theme, we introduced an ESG topic signal. We use natural language processing techniques to read through more than 24,000 articles, collected since 1999, on corporate social responsibility activities to identify economic linkages among more than 1,000 companies. The signal aims to identify companies linked to each other by common corporate social responsibility themes, and we expect it to help us to adjust portfolio positions dynamically. |
| Q | | How was the Fund positioned relative to the Index at the end of the Reporting Period? |
| A | | In constructing the Fund’s portfolio, we focus on picking stocks rather than on making industry or sector bets. Consequently, the Fund is similar to the Index in terms of its sector allocation and style. That said, at the end of the Reporting Period, the Fund was overweight relative to the Index in the health care, materials and utilities sectors. It was underweight compared to the Index in the information technology, telecommunication services and financials sectors. The Fund was relatively neutral in the industrials, consumer discretionary, consumer staples and energy sectors at the end of the Reporting Period. |
17
FUND BASICS
U.S. Tax-Managed Equity Fund
as of June 30, 2016
| | | | | | | | | | |
| | PERFORMANCE REVIEW | |
| | | January 1, 2016–June 30, 2016 | | Fund Total Return
(based on NAV)1 | | | Russell 3000® Index2 | |
| | Class A | | | -0.12 | % | | | 3.62 | % |
| | Class C | | | -0.49 | | | | 3.62 | |
| | Institutional | | | 0.11 | | | | 3.62 | |
| | Service | | | -0.12 | | | | 3.62 | |
| | | Class IR | | | 0.00 | | | | 3.62 | |
| | 1 | | The net asset value (“NAV”) represents the net assets of the class of the Fund (ex-dividend) divided by the total number of shares of the class outstanding. The Fund’s performance assumes the reinvestment of dividends and other distributions. The Fund’s performance does not reflect the deduction of any applicable sales charges. |
| | 2 | | The Russell 3000® Index is an unmanaged index that measures the performance of the 3,000 largest U.S. companies based on total market capitalization, which represents approximately 98% of the investable U.S. equity market. Index figures do not reflect any deduction for fees, expenses or taxes. It is not possible to invest directly in an index. |
| | | | | | | | | | | | | | | | | | | | |
| | STANDARDIZED TOTAL RETURNS3 |
| | | For the period ended 6/30/16 | | One Year | | | Five Years | | | Ten Years | | | Since Inception | | | Inception Date |
| | Class A | | | -5.94 | % | | | 10.04 | % | | | 5.18 | % | | | 3.69 | % | | 4/3/00 |
| | Class C | | | -2.22 | | | | 10.46 | | | | 4.99 | | | | 3.27 | | | 4/3/00 |
| | Institutional | | | -0.07 | | | | 11.75 | | | | 6.21 | | | | 4.47 | | | 4/3/00 |
| | Service | | | -0.58 | | | | 11.19 | | | | 5.68 | | | | 3.95 | | | 4/3/00 |
| | | Class IR | | | -0.25 | | | | 11.57 | | | | 0.00 | | | | 15.37 | | | 8/31/10 |
| | 3 | | The Standardized Total Returns are average annual total returns as of the most recent calendar quarter-end. They assume reinvestment of all distributions at NAV. These returns reflect a maximum initial sales charge of 5.5% for Class A Shares and the assumed contingent deferred sales charge for Class C Shares (1% if redeemed within 12 months of purchase). Because Institutional, Service and Class IR Shares do not involve a sales charge, such a charge is not applied to their Standardized Total Returns. |
The returns set forth in the tables above represent past performance. Past performance does not guarantee future results. The Fund’s investment return and principal value will fluctuate so that an investor’s shares, when redeemed, may be worth more or less than their original cost. Current performance may be lower or higher than the performance quoted above. Please visit our web site at www.GSAMFUNDS.com to obtain the most recent month-end returns. Performance reflects applicable fee waivers and/or expense limitations in effect during the periods shown. In their absence, performance would be reduced. Returns do not reflect the deduction of taxes that a shareholder would pay on Fund distributions or the redemption of Fund shares.
18
FUND BASICS
| | | | | | | | | | |
| | EXPENSE RATIOS4 | |
| | | | | Net Expense Ratio (Current) | | | Gross Expense Ratio (Before Waivers) | |
| | Class A | | | 1.17 | % | | | 1.17 | % |
| | Class C | | | 1.92 | | | | 1.92 | |
| | Institutional | | | 0.77 | | | | 0.77 | |
| | Service | | | 1.27 | | | | 1.27 | |
| | | Class IR | | | 0.92 | | | | 0.92 | |
| | 4 | | The expense ratios of the Fund, both current (net of applicable fee waivers and/or expense limitations) and before waivers (gross of applicable fee waivers and/or expense limitations), are as set forth above according to the most recent publicly available Prospectus. |
| | | | | | | | | | | | | | | | | | |
| | STANDARDIZED AFTER-TAX PERFORMANCE AS OF 6/30/165 | |
| | | Class A Shares | | One Year | | | Five Years | | | Ten Years | | | Since Inception
(4/3/00) | |
| | Returns before taxes* | | | -5.94 | % | | | 10.04 | % | | | 5.18 | % | | | 3.69 | % |
| | Returns after taxes on distributions** | | | -6.08 | | | | 9.83 | | | | 5.01 | | | | 3.58 | |
| | | Returns after taxes on distributions***
and sale of Fund shares | | | -3.24 | | | | 7.96 | | | | 4.14 | | | | 2.97 | |
| 5 | | The after-tax returns are calculated using the historically highest individual federal marginal income tax rates at the time of distributions (currently 23.8% for qualifying ordinary income dividends and long-term capital gain distributions and 43.4% for non-qualifying ordinary income dividends) and do not reflect state and local taxes. Actual after-tax returns will be calculated at calendar year-end and depend on an investor’s tax situation and may differ from those shown. In addition, the after-tax returns shown are not relevant to investors who hold Fund shares through tax-deferred arrangements such as 401(k) plans or individual retirement accounts. Under certain circumstances, the addition of the tax benefits from capital losses resulting from redemptions may cause the Returns After Taxes on Distributions and Sale of Fund Shares to be greater than the Returns After Taxes on Distributions or even Returns Before Taxes. Standardized after-tax returns assume reinvestment of all distributions at NAV and reflect a maximum initial sales charge of 5.5% for Class A Shares. |
| * | | Returns Before Taxes do not reflect taxes on distributions on the Fund’s Class A Shares nor do they show how performance can be impacted by taxes when shares are redeemed. |
| ** | | Returns After Taxes on Distributions assume that taxes are paid on distributions on the Fund’s Class A Shares (i.e., dividends and capital gains) but do not reflect taxes that may be incurred upon redemption of the Class A Shares at the end of the performance period. |
| *** | | Returns After Taxes on Distributions and Sale of Fund Shares reflect taxes paid on distributions on the Fund’s Class A Shares and taxes applicable when the shares are redeemed. |
19
FUND BASICS
| | | | | | | | |
| | TOP TEN HOLDINGS AS OF 6/30/166 |
| | | Holding | | % of Net Assets | | | Line of Business |
| | Microsoft Corp. | | | 2.0 | % | | Software & Services |
| | Altria Group, Inc. | | | 1.8 | | | Food, Beverage & Tobacco |
| | PepsiCo, Inc. | | | 1.7 | | | Food, Beverage & Tobacco |
| | Amgen, Inc. | | | 1.5 | | | Pharmaceuticals, Biotechnology &
Life Sciences |
| | ConAgra Foods, Inc. | | | 1.3 | | | Food, Beverage & Tobacco |
| | Tyson Foods, Inc. Class A | | | 1.3 | | | Food, Beverage & Tobacco |
| | Pfizer, Inc. | | | 1.3 | | | Pharmaceuticals, Biotechnology &
Life Sciences |
| | General Electric Co. | | | 1.3 | | | Capital Goods |
| | Apple, Inc. | | | 1.3 | | | Technology Hardware & Equipment |
| | | McKesson Corp. | | | 1.2 | | | Health Care Equipment & Services |
| | 6 | | The top 10 holdings may not be representative of the Fund’s future investments. |
| | |
| FUND VS. BENCHMARK SECTOR ALLOCATIONS7 | | |
| As of June 30, 2016 | | |
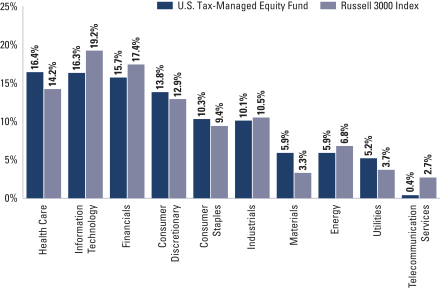
| | 7 | | The Fund is actively managed and, as such, its composition may differ over time. Consequently, the Fund’s overall sector allocations may differ from percentages contained in the graph above. The graph categorizes investments using Global Industry Classification Standard (“GICS”), however, the sector classifications used by the portfolio management team may differ from GICS. The percentage shown for each investment category reflects the value of investments in that category as a percentage of market value (excluding investments in the securities lending reinvestment vehicle, if any). Underlying sector allocations of Exchange Traded Funds and Investment Companies held by the Fund are not reflected in the graph above. Investments in the securities lending reinvestment vehicle represented 0.7% of the Fund’s net assets at June 30, 2016. The graph depicts the Fund’s investments but may not represent the Fund’s market exposure due to the exclusion of certain derivatives, if any, as listed in the Additional Investment Information section of the Schedule of Investments. |
20
PORTFOLIO RESULTS
International Tax-Managed Equity Fund
Investment Objective
The Fund seeks to provide long-term after-tax growth of capital through tax-sensitive participation in a broadly diversified portfolio of international equity securities.
Portfolio Management Discussion and Analysis
Below, the Goldman Sachs Quantitative Investment Strategies Team discusses the Goldman Sachs International Tax-Managed Equity Fund’s (the “Fund”) performance and positioning for the six-month period ended June 30, 2016 (the “Reporting Period”).
| Q | | How did the Fund perform during the Reporting Period? |
| A | | During the Reporting Period, the Fund’s Class A, C, Institutional and IR Shares generated cumulative total returns, without sales charges, of -2.42%, -2.84%, -2.21% and -2.31%, respectively. These returns compare to the -4.42% cumulative total return of the Fund’s benchmark, the MSCI EAFE Index (net, USD, unhedged) (the “Index”), during the same time period. |
| Q | | What key factors were most responsible for the Fund’s performance during the Reporting Period? |
| A | | During the Reporting Period, the Fund benefited from stock selection driven by our quantitative model, with three of the quantitative model’s six investment themes contributing positively to relative returns. |
| Q | | What impact did the Fund’s investment themes have on performance during the Reporting Period? |
| A | | In keeping with our investment approach, we use our quantitative model and its six investment themes to take a long-term view of market patterns and look for inefficiencies, selecting stocks for the Fund and overweighting or underweighting the ones chosen by the model. Over time and by design, the performance of any one of the model’s investment themes tends to have a low correlation with the model’s other themes, demonstrating the diversification benefit of the Fund’s theme-driven quantitative model. The variance in performance supports our research indicating that the diversification provided by the Fund’s different investment themes is a significant investment advantage over the long term, even though the Fund may experience underperformance in the short term. Of course, diversification does not protect an investor from market risk nor does it ensure a profit. |
| | During the Reporting Period, three of our quantitative model’s six investment themes buoyed the Fund’s results. Momentum, Sentiment and Quality contributed positively. The Momentum theme seeks to predict drifts in stock prices caused by delayed investor reaction to company-specific information and information about related companies. The Sentiment theme reflects selected investment views and decisions of individuals and financial intermediaries. The Quality theme seeks to assess both firm and management quality. |
| | Our Management, Valuation and Profitability themes detracted from relative returns. The Management theme assesses the characteristics, policies and strategic decisions of company management. The Valuation theme attempts to capture potential mispricings of securities, typically by comparing a measure of the company’s intrinsic value to its market value. The Profitability theme assesses whether a company is earning more than its cost of capital. |
| Q | | How did the Fund sector and industry allocations affect relative performance? |
| A | | In constructing the Fund’s portfolio, we focus on picking stocks rather than on making sector or industry bets. Consequently, the Fund is similar to the Index in terms of its sector and industry allocations and its style. Changes in its sector or industry weights generally do not have a meaningful impact on relative performance. |
| Q | | How successful was your stock selection during the Reporting Period? |
| A | | The Fund seeks to provide investors with a tax-efficient means for maintaining broadly diversified exposure to the entire EAFE equity market. During the Reporting Period, security selection bolstered the Fund’s relative returns. |
21
PORTFOLIO RESULTS
| Q | | Among individual holdings, which stocks contributed most to the Fund’s results? |
| A | | During the Reporting Period, stock choices in the health care, information technology and financials sectors added most positively to the Fund’s relative results. The Fund benefited from overweight positions in Subsea 7, a U.K.-headquartered subsea engineering, construction and services company serving the offshore energy industry; Fresnillo, a Mexico-based precious metals mining company; and Hochtief, a German construction company. We adopted the overweight in Subsea 7 because of our positive views on Valuation and Sentiment. The overweight in Fresnillo was due to our positive views on Momentum and Sentiment, while the Fund was overweight Hochtief as a result of our positive views on Momentum and Valuation. |
| Q | | Which individual stock holdings detracted significantly from relative performance during the Reporting Period? |
| A | | Security selection in the industrials, energy and consumer discretionary sectors detracted from relative performance. The Fund was hurt by underweight positions in the A shares and B shares of Royal Dutch Shell, a U.K.-Dutch multinational oil and gas company. We assumed the underweight in Royal Dutch Shell’s A shares due to our negative views on Sentiment and Quality. The underweight in Royal Dutch Shell’s B shares was the result of our negative view on Quality. An underweight position in Nestle, a Switzerland-based food and beverage company, also dampened the Fund’s results. We adopted the underweight in Nestle because of our negative views on Management and Momentum. |
| Q | | How did the Fund use derivatives and similar instruments during the Reporting Period? |
| A | | During the Reporting Period, we did not use derivatives as part of an active management strategy to add value to the Fund’s results. However, we used equity index futures, on an opportunistic basis, to equitize the Fund’s excess cash holdings. In other words, we put the Fund’s excess cash holdings to work by using them as collateral for the purchase of equity index futures. Equity index futures did not have a significant impact on the Fund’s relative performance during the Reporting Period. |
| Q | | What changes or enhancements did you make to your quantitative model during the Reporting Period? |
| A | | During the Reporting Period, we made a number of enhancements to our quantitative model. Within developed markets investment regions, we introduced a factor into our Profitability theme for stocks that evaluates the geographic exposure of companies by tracking the physical locations of their branches, outlets and subsidiaries. In our view, a company with a footprint in growing parts of the world is better positioned relative to a company with a footprint in parts of the world that are contracting. We are able to estimate this factor for more than 5,500 companies globally that have more than one million subsidiaries spread across more than 47,000 cities in more than 200 countries. This enhancement extends our analysis of a company’s global footprint, which has focused historically on the revenue mix across markets. |
| | Within the Japan investment region, we enhanced our Sentiment theme by introducing a signal to measure sentiment about a company as revealed through event analysis contained in news articles. We use natural language processing techniques to read through hundreds of articles daily. We have a repository of more than 1.2 million news articles collated over a five-year period and analyze approximately 2,000 stocks in Japan using feeds of Japanese-language news articles. |
| | In addition, during the Reporting Period, we undertook research of various environmental, social and governance metrics and their ability to forecast returns. We subsequently enhanced our Quality theme within the European investment region by introducing an environmental impact factor. The factor measures the amount of environmental resources consumed to produce a unit of output for more than 2,000 companies, which we expect to help us in our efforts to strategically tilt portfolios toward companies with favorable environmental profiles. |
22
PORTFOLIO RESULTS
| Q | | How was the Fund positioned relative to the Index at the end of the Reporting Period? |
| A | | In constructing the Fund’s portfolio, we focus on picking stocks rather than on country weightings. Consequently, the Fund is similar to the Index in terms of its sector and country allocations. That said, at the end of the Reporting Period, the Fund was overweight the materials, health care, and information technology sectors relative to the Index. It was underweight the financials, consumer discretionary and industrials sectors. The Fund was relatively neutrally weighted in the consumer staples, energy, telecommunications services and utilities sectors at end of the Reporting Period. |
| | At the end of the Reporting Period, the Fund was overweight relative to the Index in Norway, Japan, Italy, the Netherlands, Portugal, Germany, Denmark, Hong Kong and New Zealand. Compared to the Index, it was underweight Australia, Switzerland, France, Spain, Singapore, Israel, the U.K., Ireland and Belgium. The Fund was rather neutrally weighted relative to the Index in Finland, Austria and Sweden at the end of the Reporting Period. |
23
FUND BASICS
International Tax-Managed Equity Fund
as of June 30, 2016
| | | | | | | | | | |
| | PERFORMANCE REVIEW | |
| | | January 1, 2016–June 30, 2016 | | Fund Total Return
(based on NAV)1 | | | MSCI EAFE Index
(net, USD, unhedged)2 | |
| | Class A | | | -2.42 | % | | | -4.42 | % |
| | Class C | | | -2.84 | | | | -4.42 | |
| | Institutional | | | -2.21 | | | | -4.42 | |
| | | Class IR | | | -2.31 | | | | -4.42 | |
| | 1 | | The net asset value (“NAV”) represents the net assets of the class of the Fund (ex-dividend) divided by the total number of shares of the class outstanding. The Fund’s performance reflects the reinvestment of dividends and other distributions. The Fund’s performance does not reflect the deduction of any applicable sales charges. |
| | 2 | | The unmanaged MSCI EAFE Index (net, USD, unhedged) is a market capitalization-weighted composite of securities in 21 developed markets. The Index figures do not include any deduction for fees or expenses. It is not possible to invest directly in an index. |
| | | | | | | | | | | | | | | | | | |
| | STANDARDIZED TOTAL RETURNS3 | |
| | | For the period ended 6/30/16 | | One Year | | | Five Years | | | Since Inception | | | Inception Date | |
| | Class A | | | -11.30 | % | | | 1.32 | % | | | -0.70 | % | | | 1/31/08 | |
| | Class C | | | -7.76 | | | | 1.71 | | | | -0.78 | | | | 1/31/08 | |
| | Institutional | | | -5.70 | | | | 2.88 | | | | 0.37 | | | | 1/31/08 | |
| | | Class IR | | | -5.94 | | | | 2.73 | | | | 6.19 | | | | 8/31/10 | |
| | 3 | | The Standardized Total Returns are average annual total returns as of the most recent calendar quarter-end. They assume reinvestment of all distributions at NAV. These returns reflect a maximum initial sales charge of 5.5% for Class A Shares and the assumed contingent deferred sales charge for Class C Shares (1% if redeemed within 12 months of purchase). Because Institutional and Class IR Shares do not involve a sales charge, such a charge is not applied to their Standardized Total Returns. |
The returns set forth in the tables above represent past performance. Past performance does not guarantee future results. The Fund’s investment return and principal value will fluctuate so that an investor’s shares, when redeemed, may be worth more or less than their original cost. Current performance may be lower or higher than the performance quoted above. Please visit our web site at www.GSAMFUNDS.com to obtain the most recent month-end returns. Performance reflects applicable fee waivers and/or expense limitations in effect during the periods shown. In their absence, performance would be reduced. Returns do not reflect the deduction of taxes that a shareholder would pay on Fund distributions or the redemption of Fund shares.
24
FUND BASICS
| | | | | | | | | | |
| | EXPENSE RATIOS4 | |
| | | | | Net Expense Ratio (Current) | | | Gross Expense Ratio (Before Waivers) | |
| | Class A | | | 1.38 | % | | | 1.39 | % |
| | Class C | | | 2.13 | | | | 2.13 | |
| | Institutional | | | 0.98 | | | | 0.99 | |
| | | Class IR | | | 1.13 | | | | 1.13 | |
| | 4 | | The expense ratios of the Fund, both current (net of applicable fee waivers and/or expense limitations) and before waivers (gross of applicable fee waivers and/or expense limitations) are as set forth above according to the most recent publicly available Prospectus for the Fund and may differ from the expense ratios disclosed in the Financial Highlights in this report. Pursuant to a contractual arrangement, the Fund’s waivers and/or expense limitations will remain in place through at least April 29, 2017, and prior to such date the Investment Adviser may not terminate the arrangements without the approval of the Fund’s Board of Trustees. If these arrangements are discontinued in the future, the expense ratios may change without shareholder approval. |
| | | | | | | | | | | | | | |
| | STANDARDIZED AFTER-TAX PERFORMANCE AS OF 6/30/165 | |
| | | Class A Shares | | One Year | | | Five Years | | | Since Inception (1/31/08) | |
| | Returns before taxes* | | | -11.30 | % | | | 1.32 | % | | | -0.70 | % |
| | Returns after taxes on distributions** | | | -11.47 | | | | 0.99 | | | | -0.98 | |
| | | Returns after taxes on distributions***
and sale of Fund shares | | | -6.12 | | | | 1.12 | | | | -0.43 | |
| 5 | | The after-tax returns are calculated using the historically highest individual federal marginal income tax rates at the time of distributions (currently 23.8% for qualifying ordinary income dividends and long-term capital gain distributions and 43.4% for non-qualifying ordinary income dividends) and do not reflect state and local taxes. Actual after-tax returns will be calculated at calendar year-end and depend on an investor’s tax situation and may differ from those shown. In addition, the after-tax returns shown are not relevant to investors who hold Fund shares through tax-deferred arrangements such as 401(k) plans or individual retirement accounts. Under certain circumstances, the addition of the tax benefits from capital losses resulting from redemptions may cause the Returns After Taxes on Distributions and Sale of Fund Shares to be greater than the Returns After Taxes on Distributions or even Returns Before Taxes. Standardized after-tax returns assume reinvestment of all distributions at NAV and reflect a maximum initial sales charge of 5.5% for Class A Shares. |
| * | | Returns Before Taxes do not reflect taxes on distributions on the Fund’s Class A Shares nor do they show how performance can be impacted by taxes when shares are redeemed. |
| ** | | Returns After Taxes on Distributions assume that taxes are paid on distributions on the Fund’s Class A Shares (i.e., dividends and capital gains) but do not reflect taxes that may be incurred upon redemption of the Class A Shares at the end of the performance period. |
| *** | | Returns After Taxes on Distributions and Sale of Fund Shares reflect taxes paid on distributions on the Fund’s Class A Shares and taxes applicable when the shares are redeemed. |
25
FUND BASICS
| | | | | | | | |
| | TOP TEN HOLDINGS AS OF 6/30/166 |
| | | Holding | | % of Total Net Assets | | | Line of Business |
| | Roche Holding AG | | | 2.3 | % | | Pharmaceuticals, Biotechnology & Life Sciences |
| | British American Tobacco PLC | | | 1.7 | | | Food, Beverage & Tobacco |
| | BP PLC ADR | | | 1.7 | | | Energy |
| | HSBC Holdings PLC | | | 1.2 | | | Banks |
| | BASF SE | | | 1.2 | | | Materials |
| | Reckitt Benckiser Group PLC | | | 1.1 | | | Household & Personal Products |
| | National Grid PLC | | | 1.1 | | | Utilities |
| | Mitsubishi UFJ Financial Group, Inc. | | | 1.0 | | | Banks |
| | Eni SpA | | | 1.0 | | | Energy |
| | | Imperial Brands PLC | | | 1.0 | | | Food, Beverage & Tobacco |
| | 6 | | The top 10 holdings may not be representative of the Fund’s future investments. |
|
| FUND VS. BENCHMARK SECTOR ALLOCATIONS7 |
| As of June 30, 2016 |
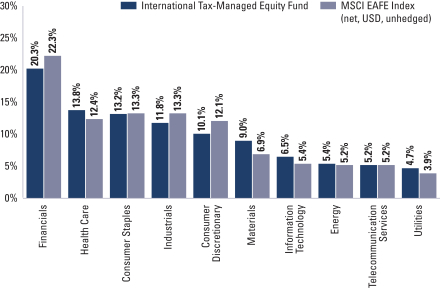
| | 7 | | The Fund is actively managed and, as such, its composition may differ over time. Consequently, the Fund’s overall sector allocations may differ from percentages contained in the graph above. The graph categorizes investments using Global Industry Classification Standard (“GICS”), however, the sector classifications used by the portfolio management team may differ from GICS. The percentage shown for each investment category reflects the value of investments in that category as a percentage of market value (excluding investments in the securities lending reinvestment vehicle, if any). Underlying sector allocations of Exchange Traded Funds and Investment Companies held by the Fund are not reflected in the graph above. Investments in the securities lending reinvestment vehicle represented 1.6% of the Fund’s net assets at June 30, 2016. The graph depicts the Fund’s investments but may not represent the Fund’s market exposure due to the exclusion of certain derivatives, if any, as listed in the Additional Investment Information section of the Schedule of Investments. |
26
GOLDMAN SACHS U.S. EQUITY DIVIDEND AND PREMIUM FUND
Schedule of Investments
June 30, 2016 (Unaudited)
| | | | | | | | |
Shares | | | Description | | Value | |
| | | | | | | | |
| | Common Stocks – 93.9% | |
| | Automobiles & Components – 1.2% | |
| | 908,800 | | | Ford Motor Co. | | $ | 11,423,616 | |
| | 438,600 | | | General Motors Co. | | | 12,412,380 | |
| | | | | | | | |
| | | | | | | 23,835,996 | |
| | |
| | Banks – 5.6% | |
| | 601,381 | | | Bank of America Corp. | | | 7,980,326 | |
| | 2,000 | | | Bank of Hawaii Corp. | | | 137,600 | |
| | 181,900 | | | BB&T Corp. | | | 6,477,459 | |
| | 31,200 | | | Cullen/Frost Bankers, Inc.(a) | | | 1,988,376 | |
| | 5,901 | | | East West Bancorp, Inc. | | | 201,676 | |
| | 183,400 | | | First Niagara Financial Group, Inc. | | | 1,786,316 | |
| | 415,229 | | | JPMorgan Chase & Co. | | | 25,802,330 | |
| | 650,200 | | | New York Community Bancorp, Inc.(a)(b) | | | 9,746,498 | |
| | 158,900 | | | PacWest Bancorp | | | 6,321,042 | |
| | 1,083,300 | | | People’s United Financial, Inc. | | | 15,881,178 | |
| | 134,700 | | | U.S. Bancorp | | | 5,432,451 | |
| | 610,700 | | | Wells Fargo & Co.(c) | | | 28,904,431 | |
| | | | | | | | |
| | | | | | | 110,659,683 | |
| | |
| | Capital Goods – 6.1% | |
| | 62,800 | | | 3M Co. | | | 10,997,536 | |
| | 1,200 | | | A.O. Smith Corp. | | | 105,732 | |
| | 140,000 | | | Caterpillar, Inc. | | | 10,613,400 | |
| | 185,100 | | | Eaton Corp. PLC | | | 11,056,023 | |
| | 135,900 | | | Emerson Electric Co. | | | 7,088,544 | |
| | 1,112,463 | | | General Electric Co. | | | 35,020,335 | |
| | 64,800 | | | Honeywell International, Inc. | | | 7,537,536 | |
| | 21,900 | | | KBR, Inc. | | | 289,956 | |
| | 19,800 | | | Kennametal, Inc. | | | 437,778 | |
| | 82,251 | | | Lockheed Martin Corp. | | | 20,412,231 | |
| | 124,700 | | | The Boeing Co. | | | 16,194,789 | |
| | 21,600 | | | The Timken Co. | | | 662,256 | |
| | | | | | | | |
| | | | | | | 120,416,116 | |
| | |
| | Commercial & Professional Services – 1.0% | |
| | 605,000 | | | Covanta Holding Corp. | | | 9,952,250 | |
| | 137,300 | | | KAR Auction Services, Inc. | | | 5,730,902 | |
| | 25,800 | | | ManpowerGroup, Inc. | | | 1,659,972 | |
| | 104,200 | | | R.R. Donnelley & Sons Co. | | | 1,763,064 | |
| | | | | | | | |
| | | | | | | 19,106,188 | |
| | |
| | Consumer Durables & Apparel – 1.7% | |
| | 167,800 | | | Coach, Inc. | | | 6,836,172 | |
| | 170,600 | | | Garmin Ltd. | | | 7,236,852 | |
| | 246,000 | | | Mattel, Inc. | | | 7,697,340 | |
| | 118,800 | | | NIKE, Inc. Class B | | | 6,557,760 | |
| | 30,175 | | | Skechers U.S.A., Inc. Class A* | | | 896,801 | |
| | 59,300 | | | Tupperware Brands Corp. | | | 3,337,404 | |
| | | | | | | | |
| | | | | | | 32,562,329 | |
| | |
| | Consumer Services – 2.3% | |
| | 9,400 | | | Brinker International, Inc. | | | 427,982 | |
| | 8,000 | | | Dunkin’ Brands Group, Inc. | | | 348,960 | |
| | 146,547 | | | International Game Technology PLC | | | 2,746,291 | |
| | 192,400 | | | Las Vegas Sands Corp. | | | 8,367,476 | |
| | 153,000 | | | McDonald’s Corp. | | | 18,412,020 | |
| | |
| | | | | | | | |
| | Common Stocks – (continued) | |
| | Consumer Services – (continued) | |
| | 1,300 | | | Service Corp. International | | $ | 35,152 | |
| | 99,400 | | | Six Flags Entertainment Corp. | | | 5,760,230 | |
| | 156,197 | | | Starbucks Corp. | | | 8,921,972 | |
| | 131,500 | | | The Wendy’s Co. | | | 1,265,030 | |
| | | | | | | | |
| | | | | | | 46,285,113 | |
| | |
| | Diversified Financials – 3.5% | |
| | 229,900 | | | Artisan Partners Asset Management, Inc. Class A | | | 6,363,632 | |
| | 52,596 | | | Berkshire Hathaway, Inc. Class B* | | | 7,615,375 | |
| | 32,600 | | | BlackRock, Inc. | | | 11,166,478 | |
| | 52,300 | | | Capital One Financial Corp. | | | 3,321,573 | |
| | 96,300 | | | CME Group, Inc. | | | 9,379,620 | |
| | 32,300 | | | Eaton Vance Corp. | | | 1,141,482 | |
| | 102,000 | | | Federated Investors, Inc. Class B | | | 2,935,560 | |
| | 309,700 | | | Invesco Ltd. | | | 7,909,738 | |
| | 16,800 | | | LPL Financial Holdings, Inc.(a) | | | 378,504 | |
| | 160,421 | | | Morgan Stanley | | | 4,167,737 | |
| | 16,400 | | | MSCI, Inc. | | | 1,264,768 | |
| | 435,800 | | | Navient Corp. | | | 5,207,810 | |
| | 2,503 | | | NorthStar Asset Management Group, Inc. | | | 25,601 | |
| | 499,200 | | | Waddell & Reed Financial, Inc. Class A | | | 8,596,224 | |
| | | | | | | | |
| | | | | | | 69,474,102 | |
| | |
| | Energy – 6.8% | |
| | 22,500 | | | Antero Resources Corp.* | | | 584,550 | |
| | 3,337 | | | California Resources Corp.*(a) | | | 40,708 | |
| | 16,800 | | | Cheniere Energy, Inc.* | | | 630,840 | |
| | 197,600 | | | Chevron Corp. | | | 20,714,408 | |
| | 144,300 | | | ConocoPhillips | | | 6,291,480 | |
| | 43,800 | | | CONSOL Energy, Inc.*(a) | | | 704,742 | |
| | 49,458 | | | Continental Resources, Inc.* | | | 2,238,963 | |
| | 600 | | | Core Laboratories NV | | | 74,334 | |
| | 17,700 | | | CVR Energy, Inc.(a) | | | 274,350 | |
| | 44,800 | | | Denbury Resources, Inc.*(a) | | | 160,832 | |
| | 43,500 | | | Diamondback Energy, Inc. | | | 3,967,635 | |
| | 2,100 | | | Dril-Quip, Inc.* | | | 122,703 | |
| | 27,100 | | | Energen Corp. | | | 1,306,491 | |
| | 98,000 | | | EOG Resources, Inc. | | | 8,175,160 | |
| | 8,900 | | | EP Energy Corp. Class A*(a) | | | 46,102 | |
| | 409,700 | | | Exxon Mobil Corp. | | | 38,405,278 | |
| | 30,900 | | | Golar LNG Ltd.(a) | | | 478,950 | |
| | 55,700 | | | Gulfport Energy Corp.* | | | 1,741,182 | |
| | 149,700 | | | Halliburton Co. | | | 6,779,913 | |
| | 17,900 | | | HollyFrontier Corp. | | | 425,483 | |
| | 262,800 | | | Kinder Morgan, Inc. | | | 4,919,616 | |
| | 35,800 | | | Kosmos Energy Ltd.* | | | 195,110 | |
| | 19,800 | | | Laredo Petroleum, Inc.*(a) | | | 207,504 | |
| | 30,500 | | | Memorial Resource Development Corp.* | | | 484,340 | |
| | 8,000 | | | Nabors Industries Ltd. | | | 80,400 | |
| | 103,900 | | | Occidental Petroleum Corp. | | | 7,850,684 | |
| | 3,700 | | | Patterson-UTI Energy, Inc. | | | 78,884 | |
| | 12,700 | | | PBF Energy, Inc. Class A | | | 302,006 | |
| | |
| | |
| The accompanying notes are an integral part of these financial statements. | | 27 |
GOLDMAN SACHS U.S. EQUITY DIVIDEND AND PREMIUM FUND
Schedule of Investments (continued)
June 30, 2016 (Unaudited)
| | | | | | | | |
Shares | | | Description | | Value | |
| | | | | | | | |
| | Common Stocks – (continued) | |
| | Energy – (continued) | |
| | 70,502 | | | Phillips 66 | | $ | 5,593,629 | |
| | 33,800 | | | QEP Resources, Inc. | | | 595,894 | |
| | 53,400 | | | Rice Energy, Inc.* | | | 1,176,936 | |
| | 16,200 | | | Rowan Companies PLC Class A | | | 286,092 | |
| | 152,900 | | | Schlumberger Ltd. | | | 12,091,332 | |
| | 3,600 | | | Seadrill Ltd.*(a) | | | 11,664 | |
| | 32,748 | | | SM Energy Co. | | | 884,196 | |
| | 44,000 | | | Targa Resources Corp. | | | 1,854,160 | |
| | 16,500 | | | Teekay Corp.(a) | | | 117,645 | |
| | 75,500 | | | Weatherford International PLC* | | | 419,025 | |
| | 107,435 | | | Whiting Petroleum Corp.* | | | 994,848 | |
| | 29,500 | | | World Fuel Services Corp. | | | 1,400,955 | |
| | 81,300 | | | WPX Energy, Inc.* | | | 756,903 | |
| | | | | | | | |
| | | | | | | 133,465,927 | |
| | |
| | Food & Staples Retailing – 2.0% | |
| | 116,678 | | | CVS Health Corp. | | | 11,170,752 | |
| | 166,300 | | | Sysco Corp. | | | 8,438,062 | |
| | 120,900 | | | Walgreens Boots Alliance, Inc. | | | 10,067,343 | |
| | 145,900 | | | Wal-Mart Stores, Inc. | | | 10,653,618 | |
| | | | | | | | |
| | | | | | | 40,329,775 | |
| | |
| | Food, Beverage & Tobacco – 5.4% | |
| | 187,300 | | | Altria Group, Inc.(c) | | | 12,916,208 | |
| | 26,700 | | | Flowers Foods, Inc. | | | 500,625 | |
| | 166,000 | | | General Mills, Inc. | | | 11,839,120 | |
| | 81,500 | | | Kellogg Co. | | | 6,654,475 | |
| | 166,800 | | | PepsiCo, Inc. | | | 17,670,792 | |
| | 173,400 | | | Philip Morris International, Inc. | | | 17,638,248 | |
| | 24,800 | | | Pinnacle Foods, Inc. | | | 1,147,992 | |
| | 99,800 | | | Reynolds American, Inc. | | | 5,382,214 | |
| | 472,900 | | | The Coca-Cola Co.(c) | | | 21,436,557 | |
| | 123,900 | | | The Kraft Heinz Co. | | | 10,962,672 | |
| | | | | | | | |
| | | | | | | 106,148,903 | |
| | |
| | Health Care Equipment & Services – 4.0% | |
| | 400,241 | | | Abbott Laboratories | | | 15,733,474 | |
| | 17,100 | | | Acadia Healthcare Co., Inc.* | | | 947,340 | |
| | 65,100 | | | Anthem, Inc. | | | 8,550,234 | |
| | 98,100 | | | Cardinal Health, Inc. | | | 7,652,781 | |
| | 20,991 | | | Centene Corp.* | | | 1,498,128 | |
| | 11,023 | | | DexCom, Inc.* | | | 874,455 | |
| | 11,700 | | | Envision Healthcare Holdings, Inc.* | | | 296,829 | |
| | 100 | | | Hill-Rom Holdings, Inc. | | | 5,045 | |
| | 244,454 | | | Medtronic PLC | | | 21,211,273 | |
| | 152,500 | | | UnitedHealth Group, Inc. | | | 21,533,000 | |
| | | | | | | | |
| | | | | | | 78,302,559 | |
| | |
| | Household & Personal Products – 1.9% | |
| | 66,000 | | | Kimberly-Clark Corp. | | | 9,073,680 | |
| | 13,400 | | | Nu Skin Enterprises, Inc. Class A(a) | | | 618,946 | |
| | 325,099 | | | The Procter & Gamble Co. | | | 27,526,132 | |
| | | | | | | | |
| | | | | | | 37,218,758 | |
| | |
| | Insurance – 2.7% | |
| | 123,400 | | | American International Group, Inc. | | | 6,526,626 | |
| | 5,700 | | | American National Insurance Co. | | | 644,955 | |
| | |
| | | | | | | | |
| | Common Stocks – (continued) | |
| | Insurance – (continued) | |
| | 175,400 | | | Arthur J. Gallagher & Co. | | $ | 8,349,040 | |
| | 191,500 | | | Mercury General Corp. | | | 10,180,140 | |
| | 212,800 | | | MetLife, Inc. | | | 8,475,824 | |
| | 385,001 | | | Old Republic International Corp. | | | 7,426,669 | |
| | 151,700 | | | Prudential Financial, Inc. | | | 10,822,278 | |
| | | | | | | | |
| | | | | | | 52,425,532 | |
| | |
| | Materials – 2.5% | |
| | 5,619 | | | Albemarle Corp. | | | 445,643 | |
| | 35,100 | | | Domtar Corp. | | | 1,228,851 | |
| | 90,200 | | | E.I. du Pont de Nemours & Co. | | | 5,844,960 | |
| | 69,200 | | | Huntsman Corp. | | | 930,740 | |
| | 212,500 | | | International Paper Co. | | | 9,005,750 | |
| | 90,700 | | | LyondellBasell Industries NV Class A | | | 6,749,894 | |
| | 53,501 | | | Newmont Mining Corp. | | | 2,092,945 | |
| | 65,400 | | | Packaging Corp. of America | | | 4,377,222 | |
| | 8,601 | | | Sonoco Products Co. | | | 427,103 | |
| | 355,402 | | | The Dow Chemical Co. | | | 17,667,033 | |
| | | | | | | | |
| | | | | | | 48,770,141 | |
| | |
| | Media – 2.4% | |
| | 15,128 | | | Charter Communications, Inc. Class A* | | | 3,458,866 | |
| | 55,900 | | | Cinemark Holdings, Inc. | | | 2,038,114 | |
| | 205,858 | | | Comcast Corp. Class A | | | 13,419,883 | |
| | 65,300 | | | Gannett Co., Inc. | | | 901,793 | |
| | 205,300 | | | Regal Entertainment Group Class A(a) | | | 4,524,812 | |
| | 200,100 | | | Thomson Reuters Corp. | | | 8,088,042 | |
| | 129,300 | | | Time Warner, Inc. | | | 9,508,722 | |
| | 3,400 | | | Viacom, Inc. Class A | | | 157,828 | |
| | 118,200 | | | Viacom, Inc. Class B | | | 4,901,754 | |
| | | | | | | | |
| | | | | | | 46,999,814 | |
| | |
| | Pharmaceuticals, Biotechnology & Life Sciences – 9.6% | |
| | 309,185 | | | AbbVie, Inc.(b)(c) | | | 19,141,643 | |
| | 32,239 | | | Allergan PLC* | | | 7,450,111 | |
| | 10,300 | | | Alnylam Pharmaceuticals, Inc.* | | | 571,547 | |
| | 127,900 | | | Amgen, Inc. | | | 19,459,985 | |
| | 5,382 | | | BioMarin Pharmaceutical, Inc.* | | | 418,720 | |
| | 5,400 | | | Bluebird Bio, Inc.*(a) | | | 233,766 | |
| | 184,400 | | | Bristol-Myers Squibb Co. | | | 13,562,620 | |
| | 24,800 | | | Bruker Corp. | | | 563,952 | |
| | 63,099 | | | Celgene Corp.* | | | 6,223,454 | |
| | 2,500 | | | Charles River Laboratories International, Inc.* | | | 206,100 | |
| | 163,400 | | | Eli Lilly & Co. | | | 12,867,750 | |
| | 160,200 | | | Gilead Sciences, Inc. | | | 13,363,884 | |
| | 12,400 | | | Incyte Corp.* | | | 991,752 | |
| | 226 | | | Intercept Pharmaceuticals, Inc.*(a) | | | 32,246 | |
| | 6,700 | | | Intrexon Corp.*(a) | | | 164,887 | |
| | 16,200 | | | Ionis Pharmaceuticals, Inc.* | | | 377,298 | |
| | 247,100 | | | Johnson & Johnson | | | 29,973,230 | |
| | 100 | | | Juno Therapeutics, Inc.* | | | 3,844 | |
| | 1,200 | | | Medivation, Inc.* | | | 72,360 | |
| | 429,150 | | | Merck & Co., Inc. | | | 24,723,331 | |
| | |
| | |
| 28 | | The accompanying notes are an integral part of these financial statements. |
GOLDMAN SACHS U.S. EQUITY DIVIDEND AND PREMIUM FUND
| | | | | | | | |
Shares | | | Description | | Value | |
| | | | | | | | |
| | Common Stocks – (continued) | |
| | Pharmaceuticals, Biotechnology & Life Sciences – (continued) | |
| | 1,084,400 | | | Pfizer, Inc. | | $ | 38,181,724 | |
| | | | | | | | |
| | | | | | | 188,584,204 | |
| | |
| | Real Estate Investment Trusts – 2.8% | |
| | 24,300 | | | American Campus Communities, Inc. | | | 1,284,741 | |
| | 99,301 | | | American Tower Corp. | | | 11,281,482 | |
| | 3,800 | | | Communications Sales & Leasing, Inc. | | | 109,820 | |
| | 52,300 | | | Crown Castle International Corp. | | | 5,304,789 | |
| | 26,500 | | | Duke Realty Corp. | | | 706,490 | |
| | 400 | | | Equity LifeStyle Properties, Inc. | | | 32,020 | |
| | 73,300 | | | Equity Residential | | | 5,048,904 | |
| | 22,600 | | | Essex Property Trust, Inc. | | | 5,154,834 | |
| | 63,500 | | | Extra Space Storage, Inc. | | | 5,876,290 | |
| | 31,101 | | | Healthcare Trust of America, Inc. Class A | | | 1,005,790 | |
| | 18,800 | | | Kilroy Realty Corp. | | | 1,246,252 | |
| | 3,200 | | | Mid-America Apartment Communities, Inc. | | | 340,480 | |
| | 41,200 | | | Omega Healthcare Investors, Inc. | | | 1,398,740 | |
| | 4,000 | | | Paramount Group, Inc. | | | 63,760 | |
| | 5,500 | | | Post Properties, Inc. | | | 335,775 | |
| | 19,100 | | | Public Storage | | | 4,881,769 | |
| | 6,900 | | | Regency Centers Corp. | | | 577,737 | |
| | 48,301 | | | Simon Property Group, Inc. | | | 10,476,356 | |
| | | | | | | | |
| | | | | | | 55,126,029 | |
| | |
| | Retailing – 4.7% | |
| | 39,400 | | | Amazon.com, Inc.* | | | 28,195,428 | |
| | 102,600 | | | DSW, Inc. Class A | | | 2,173,068 | |
| | 29,800 | | | Foot Locker, Inc. | | | 1,634,828 | |
| | 70,600 | | | GameStop Corp. Class A(a) | | | 1,876,548 | |
| | 7,200 | | | GNC Holdings, Inc. Class A | | | 174,888 | |
| | 108,300 | | | L Brands, Inc. | | | 7,270,179 | |
| | 69,000 | | | Lowe’s Companies, Inc. | | | 5,462,730 | |
| | 162,000 | | | Macy’s, Inc. | | | 5,444,820 | |
| | 46,986 | | | Netflix, Inc.* | | | 4,298,279 | |
| | 24,700 | | | Penske Automotive Group, Inc. | | | 777,062 | |
| | 100,600 | | | Target Corp. | | | 7,023,892 | |
| | 167,900 | | | The Home Depot, Inc. | | | 21,439,151 | |
| | 5,365 | | | The Priceline Group, Inc.* | | | 6,697,720 | |
| | 13,100 | | | Williams-Sonoma, Inc. | | | 682,903 | |
| | | | | | | | |
| | | | | | | 93,151,496 | |
| | |
| | Semiconductors & Semiconductor Equipment – 3.1% | |
| | 99,700 | | | Analog Devices, Inc. | | | 5,647,008 | |
| | 542,600 | | | Cypress Semiconductor Corp.(a) | | | 5,724,430 | |
| | 584,800 | | | Intel Corp. | | | 19,181,440 | |
| | 122,900 | | | Maxim Integrated Products, Inc. | | | 4,386,301 | |
| | 302,400 | | | QUALCOMM, Inc. | | | 16,199,568 | |
| | 167,649 | | | Texas Instruments, Inc. | | | 10,503,210 | |
| | | | | | | | |
| | | | | | | 61,641,957 | |
| | |
| | | | | | | | |
| | Common Stocks – (continued) | |
| | Software & Services – 10.7% | |
| | 135,300 | | | Accenture PLC Class A | | $ | 15,328,137 | |
| | 26,290 | | | Alphabet, Inc. Class A* | | | 18,495,804 | |
| | 26,759 | | | Alphabet, Inc. Class C* | | | 18,519,904 | |
| | 7,100 | | | Broadridge Financial Solutions, Inc. | | | 462,920 | |
| | 335,400 | | | CA, Inc. | | | 11,011,182 | |
| | 1,701 | | | CDK Global, Inc. | | | 94,389 | |
| | 240,600 | | | Facebook, Inc. Class A* | | | 27,495,768 | |
| | 4,200 | | | FireEye, Inc.* | | | 69,174 | |
| | 52,300 | | | IAC/InterActiveCorp | | | 2,944,490 | |
| | 104,500 | | | International Business Machines Corp. | | | 15,861,010 | |
| | 9,900 | | | LinkedIn Corp. Class A* | | | 1,873,575 | |
| | 57,300 | | | MasterCard, Inc. Class A | | | 5,045,838 | |
| | 969,951 | | | Microsoft Corp.(b)(c) | | | 49,632,393 | |
| | 247,879 | | | Oracle Corp. | | | 10,145,687 | |
| | 700 | | | Pandora Media, Inc.* | | | 8,715 | |
| | 329,600 | | | Paychex, Inc. | | | 19,611,200 | |
| | 6,600 | | | Sabre Corp. | | | 176,814 | |
| | 12,260 | | | ServiceNow, Inc.* | | | 814,064 | |
| | 28,252 | | | Splunk, Inc.* | | | 1,530,693 | |
| | 800 | | | SS&C Technologies Holdings, Inc. | | | 22,464 | |
| | 8,400 | | | Tableau Software, Inc. Class A* | | | 410,928 | |
| | 836 | | | The Ultimate Software Group, Inc.* | | | 175,802 | |
| | 3,400 | | | Twitter, Inc.* | | | 57,494 | |
| | 143,089 | | | Visa, Inc. Class A | | | 10,612,911 | |
| | 8,030 | | | Workday, Inc. Class A* | | | 599,600 | |
| | 8,500 | | | Yelp, Inc.* | | | 258,060 | |
| | 3,900 | | | Zillow Group, Inc. Class C*(a) | | | 141,492 | |
| | | | | | | | |
| | | | | | | 211,400,508 | |
| | |
| | Technology Hardware & Equipment – 4.2% | |
| | 572,400 | | | Apple, Inc.(b) | | | 54,721,440 | |
| | 828,148 | | | Cisco Systems, Inc. | | | 23,759,566 | |
| | 71,600 | | | Lexmark International, Inc. Class A | | | 2,702,900 | |
| | 74,100 | | | National Instruments Corp. | | | 2,030,340 | |
| | | | | | | | |
| | | | | | | 83,214,246 | |
| | |
| | Telecommunication Services – 3.7% | |
| | 1,045,828 | | | AT&T, Inc.(b)(c) | | | 45,190,228 | |
| | 316,400 | | | CenturyLink, Inc. | | | 9,178,764 | |
| | 338,700 | | | Verizon Communications, Inc. | | | 18,913,008 | |
| | | | | | | | |
| | | | | | | 73,282,000 | |
| | |
| | Transportation – 2.2% | |
| | 187,200 | | | Macquarie Infrastructure Corp. | | | 13,862,160 | |
| | 154,600 | | | Union Pacific Corp. | | | 13,488,850 | |
| | 148,800 | | | United Parcel Service, Inc. Class B | | | 16,028,736 | |
| | | | | | | | |
| | | | | | | 43,379,746 | |
| | |
| | Utilities – 3.8% | |
| | 10,800 | | | Avangrid, Inc. | | | 497,448 | |
| | 282,200 | | | CenterPoint Energy, Inc. | | | 6,772,800 | |
| | 173,600 | | | Dominion Resources, Inc. | | | 13,528,648 | |
| | 202,400 | | | Duke Energy Corp. | | | 17,363,896 | |
| | 308,000 | | | PPL Corp. | | | 11,627,000 | |
| | |
| | |
| The accompanying notes are an integral part of these financial statements. | | 29 |
GOLDMAN SACHS U.S. EQUITY DIVIDEND AND PREMIUM FUND
Schedule of Investments (continued)
June 30, 2016 (Unaudited)
| | | | | | | | |
Shares | | | Description | | Value | |
| | | | | | | | |
| | Common Stocks – (continued) | |
| | Utilities – (continued) | |
| | 156,600 | | | TECO Energy, Inc. | | $ | 4,328,424 | |
| | 403,100 | | | The Southern Co. | | | 21,618,253 | |
| | | | | | | | |
| | | | | | | 75,736,469 | |
| | |
| | TOTAL COMMON STOCKS | | | | |
| | (Cost $1,636,754,141) | | $ | 1,851,517,591 | |
| | |
| | | | | | | | |
| | Investment Company(c)(d) – 5.4% | |
| Goldman Sachs Financial Square Government Fund –
FST Institutional Shares |
|
| | 106,958,518 | | | 0.299% | | $ | 106,958,518 | |
| | (Cost $106,958,518) | | | | |
| | |
| TOTAL INVESTMENTS BEFORE SECURITIES
LENDING REINVESTMENT VEHICLE |
|
| | (Cost $1,743,712,659) | | $ | 1,958,476,109 | |
| | |
| Shares | | | Distribution
Rate | | Value | |
| | Securities Lending Reinvestment Vehicle(c)(d) – 0.7% | |
| Goldman Sachs Financial Square Money Market Fund –
FST Institutional Shares |
|
| | 13,703,790 | | | 0.397% | | $ | 13,703,790 | |
| | (Cost $13,703,790) | | | | |
| | |
| | TOTAL INVESTMENTS – 100.0% | | | | |
| | (Cost $1,757,416,449) | | $ | 1,972,179,899 | |
| | |
| LIABILITIES IN EXCESS OF
OTHER ASSETS – (0.0)% | | | (100,425 | ) |
| | |
| | NET ASSETS – 100.0% | | $ | 1,972,079,474 | |
| | |
| | |
| The percentage shown for each investment category reflects the value of investments in that category as a percentage of net assets. |
* | | Non-income producing security. |
(a) | | All or a portion of security is on loan. |
(b) | | All or a portion of security is segregated as collateral for initial margin requirements on futures transactions. |
(c) | | Represents an affiliated issuer. |
(d) | | Variable rate security. Interest rate or distribution rate disclosed is that which is in effect on June 30, 2016. |
|
| ADDITIONAL INVESTMENT INFORMATION |
FUTURES CONTRACTS — At June 30, 2016, the Fund had the following futures contracts:
| | | | | | | | | | | | | | |
| Type | | Number of
Contracts
Long (Short) | | | Expiration
Date | | Current
Value | | | Unrealized
Gain (Loss) | |
S&P 500 E-Mini Index | | | 1,127 | | | September 2016 | | $ | 117,782,770 | | | $ | 2,737,278 | |
WRITTEN OPTIONS CONTRACTS — At June 30, 2016, the Fund had the following written options:
| | | | | | | | | | | | | | |
| Call Options | | Number of
Contracts | | | Exercise
Price | | | Expiration
Month | | Value | |
S&P 500 Index | | | 1,128 | | | $ | 2,090 | | | July 2016 | | $ | (3,637,800 | ) |
S&P 500 Index | | | 1,096 | | | | 2,125 | | | August 2016 | | | (3,014,000 | ) |
S&P 500 Index | | | 1,155 | | | | 2,125 | | | September 2016 | | | (4,596,900 | ) |
| TOTAL (Premiums Received $13,517,662) | | | 3,379 | | | | | | | | | $ | (11,248,700 | ) |
For the six months ended June 30, 2016, the Fund had the following written options activity:
| | | | | | | | |
| | | Number of
Contracts | | | Premiums
Received | |
Contracts Outstanding December 31, 2015 | | | 3,071 | | | $ | 10,810,872 | |
Contracts written | | | 4,328 | | | | 16,951,144 | |
Contracts bought to close | | | (4,020 | ) | | | (14,244,354 | ) |
Contracts Outstanding June 30, 2016 | | | 3,379 | | | $ | 13,517,662 | |
| | |
| 30 | | The accompanying notes are an integral part of these financial statements. |
GOLDMAN SACHS INTERNATIONAL EQUITY DIVIDEND AND PREMIUM FUND
Schedule of Investments
June 30, 2016 (Unaudited)
| | | | | | | | |
Shares | | | Description | | Value | |
| | | | | | | | |
| | Common Stocks – 95.2% | |
| | Australia – 8.2% | |
| | 31,127 | | | ALS Ltd. (Commercial & Professional Services) | | $ | 115,224 | |
| | 63,826 | | | Alumina Ltd. (Materials) | | | 62,739 | |
| | 323,365 | | | Aurizon Holdings Ltd. (Transportation) | | | 1,173,262 | |
| | 152,999 | | | Australia & New Zealand Banking Group Ltd. (Banks) | | | 2,787,649 | |
| | 68,467 | | | Bendigo and Adelaide Bank Ltd. (Banks) | | | 495,734 | |
| | 50,669 | | | BHP Billiton PLC (Materials) | | | 641,315 | |
| | 146,068 | | | Coca-Cola Amatil Ltd. (Food, Beverage & Tobacco) | | | 901,678 | |
| | 12,140 | | | Commonwealth Bank of Australia (Banks) | | | 681,420 | |
| | 721,786 | | | DUET Group (Utilities) | | | 1,353,785 | |
| | 274,113 | | | Harvey Norman Holdings Ltd. (Retailing) | | | 953,800 | |
| | 10,311 | | | Iluka Resources Ltd. (Materials) | | | 50,832 | |
| | 472,787 | | | Insurance Australia Group Ltd. (Insurance) | | | 1,947,536 | |
| | 564,746 | | | Metcash Ltd. (Food & Staples Retailing)*(b) | | | 809,429 | |
| | 210,850 | | | National Australia Bank Ltd. (Banks) | | | 4,048,198 | |
| | 105,522 | | | Orica Ltd. (Materials) | | | 981,620 | |
| | 19,903 | | | Platinum Asset Management Ltd. (Diversified Financials) | | | 86,440 | |
| | 120,376 | | | Suncorp Group Ltd. (Insurance) | | | 1,103,838 | |
| | 204,610 | | | Tabcorp Holdings Ltd. (Consumer Services) | | | 704,835 | |
| | 545,543 | | | Telstra Corp. Ltd. (Telecommunication Services) | | | 2,280,225 | |
| | 655,162 | | | Vicinity Centres (REIT) | | | 1,634,531 | |
| | 13,750 | | | Wesfarmers Ltd. (Food & Staples Retailing) | | | 414,657 | |
| | 22,071 | | | Woodside Petroleum Ltd. (Energy) | | | 447,539 | |
| | 98,001 | | | Woolworths Ltd. (Food & Staples Retailing) | | | 1,541,414 | |
| | | | | | | | |
| | | | | | | 25,217,700 | |
| | |
| | Austria – 0.0% | |
| | 2,800 | | | Voestalpine AG (Materials) | | | 94,235 | |
| | |
| | Belgium – 1.8% | |
| | 36,348 | | | Anheuser-Busch InBev NV (Food, Beverage & Tobacco) | | | 4,806,530 | |
| | 15,274 | | | Proximus SADP (Telecommunication Services) | | | 485,384 | |
| | 3,951 | | | Solvay SA (Materials) | | | 369,055 | |
| | | | | | | | |
| | | | | | | 5,660,969 | |
| | |
| | Denmark – 1.4% | |
| | 5,109 | | | Chr. Hansen Holding A/S (Materials) | | | 335,535 | |
| | 10,547 | | | Coloplast A/S Class B (Health Care Equipment & Services) | | | 789,492 | |
| | 39,584 | | | Novo Nordisk A/S Class B (Pharmaceuticals, Biotechnology & Life Sciences) | | | 2,131,713 | |
| | |
| | | | | | | | |
| | Common Stocks – (continued) | |
| | Denmark – (continued) | |
| | 1,490 | | | Pandora A/S (Consumer Durables & Apparel) | | $ | 202,937 | |
| | 35,429 | | | Tryg A/S (Insurance) | | | 634,339 | |
| | 3,337 | | | Vestas Wind Systems A/S (Capital Goods) | | | 226,814 | |
| | | | | | | | |
| | | | | | | 4,320,830 | |
| | |
| | Finland – 2.0% | |
| | 46,214 | | | Fortum OYJ (Utilities) | | | 742,495 | |
| | 23,393 | | | Kone OYJ Class B (Capital Goods) | | | 1,079,595 | |
| | 12,595 | | | Metso OYJ (Capital Goods) | | | 296,107 | |
| | 18,027 | | | Neste OYJ (Energy) | | | 646,429 | |
| | 58,816 | | | Nokia OYJ (Technology Hardware & Equipment) | | | 334,983 | |
| | 17,071 | | | Nokian Renkaat OYJ (Automobiles & Components) | | | 611,857 | |
| | 19,484 | | | Orion OYJ Class B (Pharmaceuticals, Biotechnology & Life Sciences) | | | 756,560 | |
| | 14,927 | | | Sampo OYJ Class A (Insurance) | | | 610,459 | |
| | 74,290 | | | Stora Enso OYJ Class R (Materials) | | | 597,446 | |
| | 22,129 | | | UPM-Kymmene OYJ (Materials) | | | 406,527 | |
| | | | | | | | |
| | | | | | | 6,082,458 | |
| | |
| | France – 7.6% | |
| | 15,140 | | | Accor SA (Consumer Services) | | | 580,106 | |
| | 11,970 | | | Airbus Group SE (Capital Goods) | | | 686,120 | |
| | 31,802 | | | AXA SA (Insurance) | | | 628,809 | |
| | 24,706 | | | BNP Paribas SA (Banks) | | | 1,083,495 | |
| | 36,142 | | | Bouygues SA (Capital Goods) | | | 1,035,407 | |
| | 8,909 | | | Capgemini SA (Software & Services) | | | 768,783 | |
| | 26,476 | | | Casino Guichard Perrachon SA (Food & Staples Retailing)(a)(b) | | | 1,469,643 | |
| | 36,180 | | | Credit Agricole SA (Banks) | | | 304,163 | |
| | 10,779 | | | Danone SA (Food, Beverage & Tobacco) | | | 754,343 | |
| | 33,851 | | | Edenred (Commercial & Professional Services) | | | 693,137 | |
| | 26,765 | | | Electricite de France SA (Utilities)(b) | | | 324,532 | |
| | 237,980 | | | Engie SA (Utilities) | | | 3,821,164 | |
| | 6,368 | | | Eutelsat Communications SA (Media) | | | 120,197 | |
| | 2,079 | | | Kering (Consumer Durables & Apparel) | | | 334,682 | |
| | 2,358 | | | Klepierre (REIT) | | | 104,047 | |
| | 24,354 | | | Lagardere SCA (Media) | | | 529,749 | |
| | 746 | | | L’Oreal SA (Household & Personal Products) | | | 142,824 | |
| | 9,353 | | | LVMH Moet Hennessy Louis Vuitton SE (Consumer Durables & Apparel) | | | 1,409,822 | |
| | 5,546 | | | Orange SA (Telecommunication Services) | | | 90,181 | |
| | 71,573 | | | Rexel SA (Capital Goods)* | | | 899,844 | |
| | 35,412 | | | Sanofi (Pharmaceuticals, Biotechnology & Life Sciences) | | | 2,942,126 | |
| | 7,358 | | | Schneider Electric SE (Capital Goods) | | | 429,271 | |
| | 22,267 | | | Societe Generale SA (Banks) | | | 696,643 | |
| | 2,283 | | | Technip SA (Energy) | | | 123,567 | |
| | |
| | |
| The accompanying notes are an integral part of these financial statements. | | 31 |
GOLDMAN SACHS INTERNATIONAL EQUITY DIVIDEND AND PREMIUM FUND
Schedule of Investments (continued)
June 30, 2016 (Unaudited)
| | | | | | | | |
Shares | | | Description | | Value | |
| | | | | | | | |
| | Common Stocks – (continued) | |
| | France – (continued) | |
| | 34,734 | | | Total SA (Energy)(c) | | $ | 1,665,705 | |
| | 2,770 | | | Unibail-Rodamco SE (REIT)* | | | 716,582 | |
| | 50,727 | | | Vivendi SA (Telecommunication Services)(c) | | | 949,037 | |
| | | | | | | | |
| | | | | | | 23,303,979 | |
| | |
| | Germany – 6.6% | |
| | 9,286 | | | Allianz SE (Registered) (Insurance) | | | 1,324,717 | |
| | 12,698 | | | Axel Springer SE (Media) | | | 666,692 | |
| | 20,984 | | | BASF SE (Materials) | | | 1,609,027 | |
| | 20,057 | | | Bayer AG (Registered) (Pharmaceuticals, Biotechnology & Life Sciences) | | | 2,014,423 | |
| | 1,635 | | | Bayerische Motoren Werke AG (Automobiles & Components) | | | 118,987 | |
| | 59,981 | | | Daimler AG (Registered) (Automobiles & Components)(c) | | | 3,589,163 | |
| | 10,926 | | | Deutsche Boerse AG (Diversified Financials) | | | 897,623 | |
| | 39,106 | | | Deutsche Post AG (Registered) (Transportation) | | | 1,101,714 | |
| | 40,069 | | | E.ON SE (Utilities) | | | 404,489 | |
| | 7,001 | | | Evonik Industries AG (Materials) | | | 208,690 | |
| | 11,651 | | | Fresenius SE & Co. KGaA (Health Care Equipment & Services) | | | 856,087 | |
| | 20,247 | | | Hugo Boss AG (Consumer Durables & Apparel) | | | 1,151,084 | |
| | 18,783 | | | K+S AG (Registered) (Materials)(b) | | | 384,529 | |
| | 5,575 | | | MAN SE (Capital Goods) | | | 568,779 | |
| | 6,232 | | | ProSiebenSat.1 Media SE (Registered) (Media)* | | | 272,601 | |
| | 13,120 | | | SAP SE (Software & Services) | | | 985,380 | |
| | 18,669 | | | Siemens AG (Registered) (Capital Goods) | | | 1,915,835 | |
| | 4,311 | | | Symrise AG (Materials) | | | 294,058 | |
| | 130,261 | | | Telefonica Deutschland Holding AG (Telecommunication Services) | | | 536,557 | |
| | 5,335 | | | TUI AG (Consumer Services) | | | 60,723 | |
| | 10,360 | | | United Internet AG (Registered) (Software & Services) | | | 430,654 | |
| | 872 | | | Volkswagen AG (Automobiles & Components) | | | 115,595 | |
| | 21,374 | | | Vonovia SE (Real Estate) | | | 780,450 | |
| | | | | | | | |
| | | | | | | 20,287,857 | |
| | |
| | Hong Kong – 2.9% | |
| | 137,000 | | | AIA Group Ltd. (Insurance) | | | 823,880 | |
| | 88,500 | | | BOC Hong Kong Holdings Ltd. (Banks) | | | 266,682 | |
| | 52,000 | | | Cheung Kong Infrastructure Holdings Ltd. (Utilities) | | | 448,347 | |
| | 49,408 | | | Cheung Kong Property Holdings Ltd. (Real Estate) | | | 311,303 | |
| | 53,408 | | | CK Hutchison Holdings Ltd. (Capital Goods) | | | 587,513 | |
| | |
| | | | | | | | |
| | Common Stocks – (continued) | |
| | Hong Kong – (continued) | |
| | 59,000 | | | Galaxy Entertainment Group Ltd. (Consumer Services) | | $ | 176,529 | |
| | 111,000 | | | Hang Lung Properties Ltd. (Real Estate) | | | 224,253 | |
| | 34,900 | | | Hang Seng Bank Ltd. (Banks) | | | 598,633 | |
| | 858,771 | | | Hong Kong & China Gas Co. Ltd. (Utilities) | | | 1,569,164 | |
| | 27,600 | | | Hong Kong Exchanges and Clearing Ltd. (Diversified Financials) | | | 672,490 | |
| | 27,000 | | | Hysan Development Co. Ltd. (Real Estate) | | | 120,407 | |
| | 2,700 | | | Jardine Matheson Holdings Ltd. (Capital Goods) | | | 157,852 | |
| | 88,000 | | | MGM China Holdings Ltd. (Consumer Services) | | | 114,902 | |
| | 137,189 | | | New World Development Co. Ltd. (Real Estate) | | | 139,709 | |
| | 56,000 | | | Power Assets Holdings Ltd. (Utilities) | | | 514,893 | |
| | 155,600 | | | Sands China Ltd. (Consumer Services) | | | 526,537 | |
| | 135,261 | | | Sino Land Co. Ltd. (Real Estate) | | | 222,705 | |
| | 29,000 | | | Sun Hung Kai Properties Ltd. (Real Estate) | | | 349,998 | |
| | 58,200 | | | Swire Properties Ltd. (Real Estate) | | | 155,068 | |
| | 24,000 | | | Techtronic Industries Co. Ltd. (Consumer Durables & Apparel) | | | 100,224 | |
| | 107,000 | | | The Wharf Holdings Ltd. (Real Estate) | | | 652,971 | |
| | 141,200 | | | Wynn Macau Ltd. (Consumer Services) | | | 204,611 | |
| | | | | | | | |
| | | | | | | 8,938,671 | |
| | |
| | Ireland – 0.2% | |
| | 24,569 | | | CRH PLC (Materials) | | | 715,949 | |
| | |
| | Israel – 0.7% | |
| | 562,979 | | | Bezeq The Israeli Telecommunication Corp. Ltd. (Telecommunication Services) | | | 1,115,221 | |
| | 63,751 | | | Israel Chemicals Ltd. (Materials) | | | 248,379 | |
| | 13,548 | | | Teva Pharmaceutical Industries Ltd. ADR (Pharmaceuticals, Biotechnology & Life Sciences) | | | 680,516 | |
| | | | | | | | |
| | | | | | | 2,044,116 | |
| | |
| | Italy – 1.4% | |
| | 54,886 | | | Atlantia SpA (Transportation) | | | 1,371,324 | |
| | 121,624 | | | Eni SpA (Energy) | | | 1,959,019 | |
| | 368,564 | | | Intesa Sanpaolo SpA RNC (Banks) | | | 659,800 | |
| | 172,049 | | | Intesa Sanpaolo SpA (Banks) | | | 327,704 | |
| | 11,781 | | | Saipem SpA (Energy)* | | | 4,710 | |
| | 66,542 | | | UnipolSai SpA (Insurance) | | | 100,420 | |
| | | | | | | | |
| | | | | | | 4,422,977 | |
| | |
| | Japan – 21.4% | |
| | 2,400 | | | ABC-Mart, Inc. (Retailing) | | | 161,068 | |
| | 29,300 | | | Alfresa Holdings Corp. (Health Care Equipment & Services) | | | 612,138 | |
| | |
| | |
| 32 | | The accompanying notes are an integral part of these financial statements. |
GOLDMAN SACHS INTERNATIONAL EQUITY DIVIDEND AND PREMIUM FUND
| | | | | | | | |
Shares | | | Description | | Value | |
| | | | | | | | |
| | Common Stocks – (continued) | |
| | Japan – (continued) | |
| | 3,500 | | | Alps Electric Co. Ltd. (Technology Hardware & Equipment) | | $ | 66,494 | |
| | 109,000 | | | ANA Holdings, Inc. (Transportation) | | | 310,607 | |
| | 146,000 | | | Aozora Bank Ltd. (Banks) | | | 506,472 | |
| | 148,000 | | | Asahi Glass Co. Ltd. (Capital Goods) | | | 803,180 | |
| | 41,000 | | | Asahi Kasei Corp. (Materials) | | | 285,320 | |
| | 66,700 | | | Astellas Pharma, Inc. (Pharmaceuticals, Biotechnology & Life Sciences) | | | 1,046,012 | |
| | 64,000 | | | Bridgestone Corp. (Automobiles & Components) | | | 2,056,764 | |
| | 89,400 | | | Canon, Inc. (Technology Hardware & Equipment) | | | 2,552,389 | |
| | 18,200 | | | Casio Computer Co. Ltd. (Consumer Durables & Apparel) | | | 262,084 | |
| | 12,100 | | | Chugai Pharmaceutical Co. Ltd. (Pharmaceuticals, Biotechnology & Life Sciences) | | | 431,222 | |
| | 39,200 | | | Daicel Corp. (Materials) | | | 406,193 | |
| | 37,000 | | | Daihatsu Motor Co. Ltd. (Automobiles & Components) | | | 481,963 | |
| | 6,600 | | | Daito Trust Construction Co. Ltd. (Real Estate) | | | 1,071,592 | |
| | 15,800 | | | Daiwa House Industry Co. Ltd. (Real Estate) | | | 463,999 | |
| | 106,000 | | | Daiwa Securities Group, Inc. (Diversified Financials) | | | 558,447 | |
| | 2,100 | | | Dentsu, Inc. (Media) | | | 98,439 | |
| | 14,700 | | | Eisai Co. Ltd. (Pharmaceuticals, Biotechnology & Life Sciences) | | | 820,791 | |
| | 12,000 | | | FANUC Corp. (Capital Goods) | | | 1,952,079 | |
| | 500 | | | Fast Retailing Co. Ltd. (Retailing) | | | 134,240 | |
| | 34,400 | | | Fuji Heavy Industries Ltd. (Automobiles & Components) | | | 1,182,445 | |
| | 5,200 | | | Hamamatsu Photonics K.K. (Technology Hardware & Equipment) | | | 145,907 | |
| | 48,300 | | | Hino Motors Ltd. (Capital Goods) | | | 481,066 | |
| | 1,825 | | | Hirose Electric Co. Ltd. (Technology Hardware & Equipment) | | | 224,413 | |
| | 6,000 | | | Hitachi Chemical Co. Ltd. (Materials) | | | 112,058 | |
| | 10,000 | | | Hitachi Construction Machinery Co., Ltd. (Capital Goods) | | | 145,960 | |
| | 93,000 | | | Hitachi Ltd. (Technology Hardware & Equipment) | | | 389,657 | |
| | 2,900 | | | Hitachi Metals Ltd. (Materials) | | | 29,462 | |
| | 27,500 | | | Honda Motor Co. Ltd. (Automobiles & Components) | | | 689,845 | |
| | 12,900 | | | Hulic Co. Ltd. (Real Estate) | | | 135,935 | |
| | 11,800 | | | Isuzu Motors Ltd. (Automobiles & Components) | | | 145,340 | |
| | 117,500 | | | ITOCHU Corp. (Capital Goods) | | | 1,437,402 | |
| | 4,200 | | | ITOCHU Techno-Solutions Corp. (Software & Services) | | | 90,482 | |
| | 13,900 | | | Japan Airlines Co. Ltd. (Transportation) | | | 447,199 | |
| | |
| | | | | | | | |
| | Common Stocks – (continued) | |
| | Japan – (continued) | |
| | 19,200 | | | Japan Exchange Group, Inc. (Diversified Financials) | | $ | 221,059 | |
| | 34,100 | | | Japan Tobacco, Inc. (Food, Beverage & Tobacco) | | | 1,374,305 | |
| | 11,800 | | | JFE Holdings, Inc. (Materials) | | | 153,933 | |
| | 50,000 | | | Kaneka Corp. (Materials) | | | 333,613 | |
| | 24,000 | | | Kao Corp. (Household & Personal Products) | | | 1,397,812 | |
| | 91,000 | | | Kawasaki Heavy Industries Ltd. (Capital Goods) | | | 256,588 | |
| | 29,600 | | | KDDI Corp. (Telecommunication Services) | | | 900,128 | |
| | 8,000 | | | Kikkoman Corp. (Food, Beverage & Tobacco) | | | 295,200 | |
| | 80,000 | | | Kintetsu Group Holdings Co. Ltd. (Transportation) | | | 342,355 | |
| | 45,500 | | | Kirin Holdings Co. Ltd. (Food, Beverage & Tobacco) | | | 767,411 | |
| | 43,600 | | | Komatsu Ltd. (Capital Goods) | | | 757,405 | |
| | 6,000 | | | Kose Corp. (Household & Personal Products) | | | 508,439 | |
| | 8,000 | | | Kubota Corp. (Capital Goods) | | | 108,203 | |
| | 16,500 | | | LIXIL Group Corp. (Capital Goods) | | | 270,961 | |
| | 3,900 | | | M3, Inc. (Health Care Equipment & Services) | | | 136,110 | |
| | 3,000 | | | Makita Corp. (Capital Goods) | | | 199,191 | |
| | 179,100 | | | Marubeni Corp. (Capital Goods) | | | 809,126 | |
| | 16,100 | | | Marui Group Co. Ltd. (Retailing) | | | 216,737 | |
| | 800 | | | Maruichi Steel Tube Ltd. (Materials) | | | 27,960 | |
| | 2,800 | | | MEIJI Holdings Co. Ltd. (Food, Beverage & Tobacco) | | | 287,715 | |
| | 22,000 | | | Mitsubishi Estate Co. Ltd. (Real Estate) | | | 403,541 | |
| | 27,000 | | | Mitsubishi Materials Corp. (Materials) | | | 64,648 | |
| | 243,200 | | | Mitsubishi UFJ Financial Group, Inc. (Banks) | | | 1,090,230 | |
| | 123,900 | | | Mitsui & Co. Ltd. (Capital Goods) | | | 1,479,016 | |
| | 13,000 | | | Mitsui Fudosan Co. Ltd. (Real Estate) | | | 298,360 | |
| | 1,700 | | | Mixi, Inc. (Software & Services) | | | 70,287 | |
| | 794,100 | | | Mizuho Financial Group, Inc. (Banks) | | | 1,142,757 | |
| | 5,200 | | | MS&AD Insurance Group Holdings, Inc. (Insurance) | | | 134,733 | |
| | 9,000 | | | Murata Manufacturing Co. Ltd. (Technology Hardware & Equipment) | | | 1,009,032 | |
| | 39,000 | | | NEC Corp. (Technology Hardware & Equipment) | | | 90,865 | |
| | 10,200 | | | NGK Spark Plug Co. Ltd. (Automobiles & Components) | | | 153,967 | |
| | 2,800 | | | Nidec Corp. (Capital Goods) | | | 213,144 | |
| | 83,000 | | | Nippon Express Co. Ltd. (Transportation) | | | 379,286 | |
| | 2,401 | | | Nippon Paint Holdings Co. Ltd. (Materials) | | | 59,352 | |
| | 341,000 | | | Nippon Yusen Kabushiki Kaisha (Transportation) | | | 599,900 | |
| | |
| | |
| The accompanying notes are an integral part of these financial statements. | | 33 |
GOLDMAN SACHS INTERNATIONAL EQUITY DIVIDEND AND PREMIUM FUND
Schedule of Investments (continued)
June 30, 2016 (Unaudited)
| | | | | | | | |
Shares | | | Description | | Value | |
| | Common Stocks – (continued) | |
| | Japan – (continued) | |
| | 34,200 | | | Nissan Motor Co. Ltd. (Automobiles & Components) | | $ | 305,212 | |
| | 11,600 | | | Nisshin Seifun Group, Inc. (Food, Beverage & Tobacco) | | | 186,469 | |
| | 7,100 | | | Nitto Denko Corp. (Materials) | | | 450,383 | |
| | 98,700 | | | Nomura Holdings, Inc. (Diversified Financials) | | | 351,032 | |
| | 9,000 | | | Nomura Research Institute Ltd. (Software & Services) | | | 330,078 | |
| | 32,300 | | | NSK Ltd. (Capital Goods) | | | 236,434 | |
| | 62,300 | | | NTT DoCoMo, Inc. (Telecommunication Services) | | | 1,680,141 | |
| | 25,000 | | | NTT Urban Development Corp. (Real Estate) | | | 268,766 | |
| | 4,200 | | | Obic Co. Ltd. (Software & Services) | | | 231,195 | |
| | 49,000 | | | Odakyu Electric Railway Co. Ltd. (Transportation) | | | 574,571 | |
| | 500 | | | Ono Pharmaceutical Co. Ltd. (Pharmaceuticals, Biotechnology & Life Sciences) | | | 21,781 | |
| | 2,800 | | | Oracle Corp. Japan (Software & Services) | | | 149,305 | |
| | 9,500 | | | ORIX Corp. (Diversified Financials) | | | 122,934 | |
| | 2,700 | | | Otsuka Corp. (Software & Services) | | | 126,256 | |
| | 3,400 | | | Otsuka Holdings Co. Ltd. (Pharmaceuticals, Biotechnology & Life Sciences) | | | 156,682 | |
| | 55,400 | | | Panasonic Corp. (Consumer Durables & Apparel) | | | 476,636 | |
| | 12,900 | | | Rakuten, Inc. (Retailing) | | | 140,008 | |
| | 35,300 | | | Resona Holdings, Inc. (Banks) | | | 129,018 | |
| | 44,100 | | | Ricoh Co. Ltd. (Technology Hardware & Equipment) | | | 382,280 | |
| | 1,000 | | | Ryohin Keikaku Co. Ltd. (Retailing) | | | 243,698 | |
| | 24,500 | | | Sankyo Co. Ltd. (Consumer Durables & Apparel) | | | 918,579 | |
| | 12,700 | | | Sanrio Co. Ltd. (Retailing) | | | 226,128 | |
| | 14,600 | | | SBI Holdings, Inc. (Diversified Financials) | | | 145,389 | |
| | 13,200 | | | Sega Sammy Holdings, Inc. (Consumer Durables & Apparel) | | | 142,165 | |
| | 34,400 | | | Seiko Epson Corp. (Technology Hardware & Equipment) | | | 551,488 | |
| | 75,400 | | | Sekisui House Ltd. (Consumer Durables & Apparel) | | | 1,320,411 | |
| | 136,800 | | | Seven Bank Ltd. (Banks) | | | 424,615 | |
| | 7,000 | | | Shimadzu Corp. (Technology Hardware & Equipment) | | | 105,233 | |
| | 9,400 | | | Shin-Etsu Chemical Co. Ltd. (Materials) | | | 550,732 | |
| | 8,400 | | | Shionogi & Co. Ltd. (Pharmaceuticals, Biotechnology & Life Sciences) | | | 459,195 | |
| | 38,500 | | | Showa Shell Sekiyu KK (Energy) | | | 359,346 | |
| | 8,600 | | | SoftBank Group Corp. (Telecommunication Services) | | | 486,348 | |
| | |
| | | | | | | | |
| | Common Stocks – (continued) | |
| | Japan – (continued) | |
| | 3,800 | | | Sompo Japan Nipponkoa Holdings, Inc. (Insurance) | | $ | 101,126 | |
| | 19,500 | | | Sony Corp. (Consumer Durables & Apparel) | | | 574,509 | |
| | 35,000 | | | Sumitomo Chemical Co. Ltd. (Materials) | | | 144,412 | |
| | 129,600 | | | Sumitomo Corp. (Capital Goods) | | | 1,306,355 | |
| | 11,000 | | | Sumitomo Metal Mining Co. Ltd. (Materials) | | | 111,896 | |
| | 62,000 | | | Sumitomo Mitsui Financial Group, Inc. (Banks) | | | 1,790,254 | |
| | 281,000 | | | Sumitomo Mitsui Trust Holdings, Inc. (Banks) | | | 914,321 | |
| | 7,000 | | | Sumitomo Realty & Development Co. Ltd. (Real Estate) | | | 189,822 | |
| | 9,700 | | | Sysmex Corp. (Health Care Equipment & Services) | | | 667,927 | |
| | 42,000 | | | Takeda Pharmaceutical Co. Ltd. (Pharmaceuticals, Biotechnology & Life Sciences) | | | 1,811,384 | |
| | 8,200 | | | Terumo Corp. (Health Care Equipment & Services) | | | 349,938 | |
| | 5,900 | | | The Dai-ichi Life Insurance Co. Ltd. (Insurance) | | | 66,047 | |
| | 55,300 | | | Tohoku Electric Power Co., Inc. (Utilities) | | | 697,915 | |
| | 14,800 | | | Tokio Marine Holdings, Inc. (Insurance) | | | 492,708 | |
| | 8,800 | | | Tokyo Electron Ltd. (Semiconductors & Semiconductor Equipment) | | | 743,677 | |
| | 96,000 | | | Tokyo Gas Co. Ltd. (Utilities) | | | 396,361 | |
| | 57,700 | | | Tokyu Fudosan Holdings Corp. (Real Estate) | | | 359,965 | |
| | 4,600 | | | TOTO Ltd. (Capital Goods) | | | 183,812 | |
| | 3,800 | | | Toyoda Gosei Co. Ltd. (Automobiles & Components) | | | 67,675 | |
| | 61,400 | | | Toyota Motor Corp. (Automobiles & Components) | | | 3,026,930 | |
| | 18,400 | | | Trend Micro, Inc. (Software & Services) | | | 658,057 | |
| | 61,200 | | | USS Co. Ltd. (Retailing) | | | 1,011,427 | |
| | 4,000 | | | Yamaha Corp. (Consumer Durables & Apparel) | | | 107,814 | |
| | 22,600 | | | Yamaha Motor Co. Ltd. (Automobiles & Components) | | | 344,756 | |
| | 13,300 | | | Yamato Holdings Co. Ltd. (Transportation) | | | 305,381 | |
| | | | | | | | |
| | | | | | | 65,969,010 | |
| | |
| | Luxembourg – 0.8% | |
| | 16,699 | | | RTL Group SA (Media) | | | 1,363,790 | |
| | 55,346 | | | SES SA FDR (Media) | | | 1,184,822 | |
| | | | | | | | |
| | | | | | | 2,548,612 | |
| | |
| | |
| 34 | | The accompanying notes are an integral part of these financial statements. |
GOLDMAN SACHS INTERNATIONAL EQUITY DIVIDEND AND PREMIUM FUND
| | | | | | | | |
Shares | | | Description | | Value | |
| | | | | | | | |
| | Common Stocks – (continued) | |
| | Netherlands – 3.9% | |
| | 7,381 | | | Boskalis Westminster (Capital Goods) | | $ | 251,859 | |
| | 126,193 | | | ING Groep NV CVA (Banks) | | | 1,305,582 | |
| | 12,676 | | | Koninklijke DSM NV (Materials) | | | 731,284 | |
| | 43,599 | | | Koninklijke Philips NV (Capital Goods) | | | 1,082,836 | |
| | 3,755 | | | Koninklijke Vopak NV (Energy) | | | 186,922 | |
| | 70,146 | | | NN Group NV (Insurance) | | | 1,931,009 | |
| | 1,920 | | | NXP Semiconductors NV (Semiconductors & Semiconductor Equipment)* | | | 150,413 | |
| | 133,282 | | | Royal Dutch Shell PLC Class A (Energy)(c) | | | 3,657,364 | |
| | 91,973 | | | Royal Dutch Shell PLC Class B (Energy) | | | 2,541,084 | |
| | | | | | | | |
| | | | | | | 11,838,353 | |
| | |
| | New Zealand – 0.1% | |
| | 16,542 | | | Fletcher Building Ltd. (Materials) | | | 101,751 | |
| | 73,086 | | | Mighty River Power Ltd. (Utilities) | | | 157,734 | |
| | 52,305 | | | Spark New Zealand Ltd. (Telecommunication Services) | | | 132,941 | |
| | | | | | | | |
| | | | | | | 392,426 | |
| | |
| | Norway – 0.7% | |
| | 215,934 | | | Orkla ASA (Food, Beverage & Tobacco) | | | 1,920,421 | |
| | 9,023 | | | Yara International ASA (Materials) | | | 286,632 | |
| | | | | | | | |
| | | | | | | 2,207,053 | |
| | |
| | Portugal – 0.2% | |
| | 37,978 | | | EDP – Energias de Portugal SA (Utilities) | | | 116,272 | |
| | 24,385 | | | Galp Energia SGPS SA (Energy) | | | 339,155 | |
| | | | | | | | |
| | | | | | | 455,427 | |
| | |
| | Singapore – 1.3% | |
| | 48,200 | | | ComfortDelGro Corp. Ltd. (Transportation) | | | 98,985 | |
| | 254,000 | | | Genting Singapore PLC (Consumer Services) | | | 137,784 | |
| | 743,600 | | | Global Logistic Properties Ltd. (Real Estate) | | | 1,003,897 | |
| | 69,000 | | | Keppel Corp. Ltd. (Capital Goods) | | | 284,646 | |
| | 107,300 | | | Sembcorp Marine Ltd. (Capital Goods) | | | 124,860 | |
| | 22,900 | | | Singapore Exchange Ltd. (Diversified Financials) | | | 130,445 | |
| | 211,000 | | | Singapore Press Holdings Ltd. (Media) | | | 621,771 | |
| | 202,000 | | | Singapore Technologies Engineering Ltd. (Capital Goods) | | | 475,486 | |
| | 93,000 | | | StarHub Ltd. (Telecommunication Services) | | | 262,417 | |
| | 55,000 | | | United Overseas Bank Ltd. (Banks) | | | 757,788 | |
| | | | | | | | |
| | | | | | | 3,898,079 | |
| | |
| | | | | | | | |
| | Common Stocks – (continued) | |
| | Spain – 3.3% | |
| | 83,558 | | | Abertis Infraestructuras SA (Transportation) | | $ | 1,234,786 | |
| | 3,306 | | | ACS Actividades de Construccion y Servicios SA (Capital Goods) | | | 90,681 | |
| | 209,830 | | | Banco Bilbao Vizcaya Argentaria SA (Banks) | | | 1,202,211 | |
| | 426,473 | | | Banco Santander SA (Banks) | | | 1,655,005 | |
| | 90,136 | | | Distribuidora Internacional de Alimentacion SA (Food & Staples Retailing) | | | 526,114 | |
| | 26,882 | | | Enagas SA (Utilities) | | | 821,253 | |
| | 34,755 | | | Ferrovial SA (Capital Goods) | | | 680,432 | |
| | 402,121 | | | Telefonica SA (Telecommunication Services)(c) | | | 3,817,662 | |
| | | | | | | | |
| | | | | | | 10,028,144 | |
| | |
| | Sweden – 3.5% | |
| | 33,237 | | | Hennes & Mauritz AB Class B (Retailing) | | | 977,860 | |
| | 49,766 | | | Husqvarna AB Class B (Consumer Durables & Apparel) | | | 370,581 | |
| | 12,283 | | | Lundin Petroleum AB (Energy)* | | | 223,834 | |
| | 352,747 | | | Nordea Bank AB (Banks) | | | 2,992,581 | |
| | 50,455 | | | Sandvik AB (Capital Goods) | | | 505,152 | |
| | 235,610 | | | Skandinaviska Enskilda Banken AB Class A (Banks) | | | 2,058,213 | |
| | 11,970 | | | Swedbank AB Class A (Banks) | | | 251,407 | |
| | 62,148 | | | Tele2 AB Class B (Telecommunication Services) | | | 545,619 | |
| | 161,424 | | | Telefonaktiebolaget LM Ericsson Class B (Technology Hardware & Equipment) | | | 1,240,149 | |
| | 334,966 | | | Telia Co. AB (Telecommunication Services) | | | 1,586,224 | |
| | 15,913 | | | Volvo AB Class B (Capital Goods) | | | 158,085 | |
| | | | | | | | |
| | | | | | | 10,909,705 | |
| | |
| | Switzerland – 9.5% | |
| | 43,589 | | | ABB Ltd. (Registered) (Capital Goods)* | | | 862,718 | |
| | 11,418 | | | Adecco Group AG (Registered) (Commercial & Professional Services) | | | 575,902 | |
| | 3,206 | | | Compagnie Financiere Richemont SA (Registered) (Consumer Durables & Apparel) | | | 187,662 | |
| | 73,030 | | | Credit Suisse Group AG (Registered) (Diversified Financials)* | | | 777,946 | |
| | 2,590 | | | EMS-Chemie Holding AG (Registered) (Materials) | | | 1,337,237 | |
| | 1,736 | | | Geberit AG (Registered) (Capital Goods) | | | 657,532 | |
| | 926 | | | Givaudan SA (Registered) (Materials) | | | 1,864,524 | |
| | 207,676 | | | Glencore PLC (Materials)* | | | 428,045 | |
| | 1,812 | | | Julius Baer Group Ltd. (Diversified Financials)* | | | 72,930 | |
| | |
| | |
| The accompanying notes are an integral part of these financial statements. | | 35 |
GOLDMAN SACHS INTERNATIONAL EQUITY DIVIDEND AND PREMIUM FUND
Schedule of Investments (continued)
June 30, 2016 (Unaudited)
| | | | | | | | |
Shares | | | Description | | Value | |
| | | | | | | | |
| | Common Stocks – (continued) | |
| | Switzerland – (continued) | |
| | 3,263 | | | Kuehne + Nagel International AG (Registered) (Transportation) | | $ | 457,178 | |
| | 7,142 | | | LafargeHolcim Ltd. (Registered) (Materials)* | | | 298,804 | |
| | 42,334 | | | Nestle SA (Registered) (Food, Beverage & Tobacco) | | | 3,279,968 | |
| | 68,534 | | | Novartis AG (Registered) (Pharmaceuticals, Biotechnology & Life Sciences) | | | 5,656,697 | |
| | 1,958 | | | Partners Group Holding AG (Diversified Financials) | | | 839,131 | |
| | 16,411 | | | Roche Holding AG (Pharmaceuticals, Biotechnology & Life Sciences) | | | 4,330,532 | |
| | 178 | | | SGS SA (Registered) (Commercial & Professional Services) | | | 407,754 | |
| | 337,023 | | | STMicroelectronics NV (Semiconductors & Semiconductor Equipment) | | | 1,967,675 | |
| | 1,987 | | | Syngenta AG (Registered) (Materials) | | | 762,707 | |
| | 17,457 | | | UBS Group AG (Registered) (Diversified Financials) | | | 226,515 | |
| | 17,426 | | | Zurich Insurance Group AG (Insurance)* | | | 4,310,892 | |
| | | | | | | | |
| | | | | | | 29,302,349 | |
| | |
| | United Kingdom – 17.7% | |
| | 204,174 | | | Aberdeen Asset Management PLC (Diversified Financials) | | | 766,039 | |
| | 27,116 | | | Anglo American PLC (Materials) | | | 265,798 | |
| | 18,715 | | | AstraZeneca PLC ADR (Pharmaceuticals, Biotechnology & Life Sciences)(b) | | | 564,931 | |
| | 250,161 | | | BAE Systems PLC (Capital Goods) | | | 1,751,268 | |
| | 331,374 | | | Barclays PLC (Banks) | | | 616,318 | |
| | 17,837 | | | Berkeley Group Holdings PLC (Consumer Durables & Apparel) | | | 602,314 | |
| | 78,278 | | | BP PLC ADR (Energy)(c) | | | 2,779,652 | |
| | 52,689 | | | British American Tobacco PLC (Food, Beverage & Tobacco) | | | 3,415,778 | |
| | 23,343 | | | Capita PLC (Commercial & Professional Services) | | | 300,787 | |
| | 108,358 | | | Centrica PLC (Utilities) | | | 327,674 | |
| | 366,173 | | | Cobham PLC (Capital Goods) | | | 771,465 | |
| | 16,241 | | | Compass Group PLC (Consumer Services) | | | 308,991 | |
| | 13,945 | | | Diageo PLC (Food, Beverage & Tobacco) | | | 389,563 | |
| | 18,746 | | | easyJet PLC (Transportation) | | | 272,410 | |
| | 130,365 | | | G4S PLC (Commercial & Professional Services) | | | 319,441 | |
| | 167,076 | | | GlaxoSmithKline PLC ADR (Pharmaceuticals, Biotechnology & Life Sciences)(a)(c) | | | 7,241,074 | |
| | 1,024,775 | | | HSBC Holdings PLC (Banks) | | | 6,349,048 | |
| | 115,961 | | | ICAP PLC (Diversified Financials) | | | 652,478 | |
| | |
| | | | | | | | |
| | Common Stocks – (continued) | |
| | United Kingdom – (continued) | |
| | 21,808 | | | Imperial Brands PLC (Food, Beverage & Tobacco) | | $ | 1,182,708 | |
| | 118,879 | | | J Sainsbury PLC (Food & Staples Retailing) | | | 370,331 | |
| | 24,945 | | | Land Securities Group PLC (REIT) | | | 347,122 | |
| | 852,286 | | | Legal & General Group PLC (Insurance) | | | 2,181,935 | |
| | 170,571 | | | Marks & Spencer Group PLC (Retailing) | | | 730,475 | |
| | 1,017 | | | Next PLC (Retailing) | | | 67,199 | |
| | 132,053 | | | Pearson PLC (Media) | | | 1,717,762 | |
| | 47,617 | | | Persimmon PLC (Consumer Durables & Apparel) | | | 923,374 | |
| | 28,433 | | | Provident Financial PLC (Diversified Financials) | | | 876,699 | |
| | 1,916 | | | Reckitt Benckiser Group PLC (Household & Personal Products) | | | 192,121 | |
| | 12,668 | | | Rio Tinto PLC (Materials) | | | 393,551 | |
| | 3,497 | | | Rio Tinto PLC ADR (Materials) | | | 109,456 | |
| | 27,422 | | | Royal Mail PLC (Transportation) | | | 184,235 | |
| | 148,325 | | | SSE PLC (Utilities) | | | 3,087,098 | |
| | 101,080 | | | Standard Life PLC (Insurance) | | | 398,797 | |
| | 145,942 | | | Tate & Lyle PLC (Food, Beverage & Tobacco) | | | 1,304,861 | |
| | 24,262 | | | The British Land Co. PLC (REIT) | | | 196,990 | |
| | 98,827 | | | Unilever NV CVA (Household & Personal Products)(c) | | | 4,596,406 | |
| | 66,166 | | | Unilever PLC ADR (Household & Personal Products)(c) | | | 3,170,013 | |
| | 138,945 | | | Vodafone Group PLC ADR (Telecommunication Services)(a)(c) | | | 4,292,011 | |
| | 55,944 | | | William Hill PLC (Consumer Services) | | | 192,702 | |
| | 61,537 | | | Wm Morrison Supermarkets PLC (Food & Staples Retailing) | | | 154,483 | |
| | | | | | | | |
| | | | | | | 54,365,358 | |
| | |
| | TOTAL COMMON STOCKS | | | | |
| | (Cost $358,379,704) | | $ | 293,004,257 | |
| | |
| | | | | | | | | | | | |
Shares | | Description | | | Rate | | | Value | |
| | | | | | | | | | | | |
| Preferred Stocks – 0.6% | |
| Germany – 0.6% | |
| 6,948 | |
| Bayerische Motoren
Werke AG
(Automobiles &
Components) |
| | | 3.220 | % | | $ | 442,911 | |
| 12,634 | |
| Fuchs Petrolub SE
(Materials) |
| | | 0.820 | | | | 497,033 | |
| 3,771 | |
| Porsche Automobil
Holding SE
(Automobiles &
Components) |
| | | 1.010 | | | | 174,303 | |
| |
| | |
| 36 | | The accompanying notes are an integral part of these financial statements. |
GOLDMAN SACHS INTERNATIONAL EQUITY DIVIDEND AND PREMIUM FUND
| | | | | | | | | | | | |
Shares | | Description | | | Rate | | | Value | |
| | | | | | | | | | | | |
| Preferred Stocks – (continued) | |
| 4,570 | |
| Volkswagen AG
(Automobiles &
Components) |
| | | 0.170 | % | | $ | 553,520 | |
| |
| TOTAL PREFERRED STOCKS | | | | | |
| (Cost $2,711,238) | | | $ | 1,667,767 | |
| |
| | | | | | | | |
| Units | | | Description | | Value | |
| | Right* – 0.0% | |
| | Spain – 0.0% | |
| | 3,306 | | | ACS Actividades de Construccion y Servicios SA (Capital Goods) | | $ | 2,323 | |
| | (Cost $2,345) | | | | |
| | |
| TOTAL INVESTMENTS BEFORE SECURITIES
LENDING REINVESTMENT VEHICLE |
|
| | (Cost $361,093,287) | | $ | 294,674,347 | |
| | |
| | | | | | | | |
| Shares | | | Distribution
Rate | | Value | |
| | Securities Lending Reinvestment Vehicle(d)(e) – 1.0% | |
| Goldman Sachs Financial Square Money Market Fund –
FST Institutional Shares |
|
| | 3,101,464 | | | 0.397% | | $ | 3,101,464 | |
| | (Cost $3,101,464) | | | | |
| | |
| | TOTAL INVESTMENTS – 96.8% | | | | |
| | (Cost $$364,194,751) | | $ | 297,775,811 | |
| | |
| OTHER ASSETS IN EXCESS OF
LIABILITIES – 3.2% | | | 9,986,834 | |
| | |
| | NET ASSETS – 100.0% | | $ | 307,762,645 | |
| | |
| | |
| The percentage shown for each investment category reflects the value of investments in that category as a percentage of net assets. |
* | | Non-income producing security. |
(a) | | All or a portion of security is segregated as collateral for initial margin requirements on futures transactions. |
(b) | | All or a portion of security is on loan. |
(c) | | All or a portion of this security is held as collateral for call options written. |
(d) | | Represents an affiliated issuer. |
(e) | | Variable rate security. Interest rate or distribution rate disclosed is that which is in effect on June 30, 2016. |
| | |
|
Investment Abbreviations: |
ADR | | — American Depositary Receipt |
CVA | | — Dutch Certification |
FDR | | — Fiduciary Depositary Receipt |
REIT | | — Real Estate Investment Trust |
|
| | |
| The accompanying notes are an integral part of these financial statements. | | 37 |
GOLDMAN SACHS INTERNATIONAL EQUITY DIVIDEND AND PREMIUM FUND
Schedule of Investments (continued)
June 30, 2016 (Unaudited)
|
| ADDITIONAL INVESTMENT INFORMATION |
FUTURES CONTRACTS — At June 30, 2016, the Fund had the following futures contracts:
| | | | | | | | | | | | | | |
| Type | | Number of
Contracts
Long (Short) | | | Expiration
Date | | Current
Value | | | Unrealized
Gain (Loss) | |
EURO STOXX 50 Index | | | 133 | | | September 2016 | | $ | 4,213,887 | | | $ | 79,845 | |
FTSE 100 Index | | | 23 | | | September 2016 | | | 1,966,489 | | | | 166,762 | |
TSE TOPIX Index | | | 17 | | | September 2016 | | | 2,050,404 | | | | (150,512 | ) |
| TOTAL | | | | | | | | | | | | $ | 96,095 | |
WRITTEN OPTIONS CONTRACTS — At June 30, 2016, the Fund had the following written options:
| | | | | | | | | | | | | | | | | | |
| Call Options | | Number of Contracts | | | Exercise
Price | | | Expiration
Month | | Value | |
EURO STOXX 50 Index | | | 1275 | | | | EUR | | | | 2,925 | | | September 2016 | | $ | (1,283,343 | ) |
FTSE 100 Index | | | 208 | | | | GBP | | | | 6,125 | | | September 2016 | | | (1,174,056 | ) |
Nikkei-225 Stock Average | | | 182 | | | | JPY | | | | 17,250 | | | September 2016 | | | (237,931 | ) |
| TOTAL (Premiums Received $3,045,475) | | | 1,665 | | | | | | | | | | | | | $ | (2,695,330 | ) |
For the six months ended June 30, 2016, the Fund had the following written options activity:
| | | | | | | | |
| | | Number of
Contracts | | | Premiums
Received | |
Contracts Outstanding December 31, 2015 | | | 2,181 | | | $ | 2,745,815 | |
Contracts written | | | 3,721 | | | | 5,746,028 | |
Contracts expired | | | (2,056 | ) | | | (2,700,553 | ) |
Contracts bought to close | | | (2,181 | ) | | | (2,745,815 | ) |
Contracts Outstanding June 30, 2016 | | | 1,665 | | | $ | 3,045,475 | |
| | |
| 38 | | The accompanying notes are an integral part of these financial statements. |
GOLDMAN SACHS U.S. TAX-MANAGED EQUITY FUND
Schedule of Investments
June 30, 2016 (Unaudited)
| | | | | | | | |
Shares | | | Description | | Value | |
| | | | | | | | |
| | Common Stocks – 99.1% | |
| | Automobiles & Components – 0.4% | |
| | 21,887 | | | Gentex Corp. | | $ | 338,154 | |
| | 38,844 | | | Lear Corp. | | | 3,952,766 | |
| | 3,773 | | | Standard Motor Products, Inc. | | | 150,090 | |
| | | | | | | | |
| | | | | | | 4,441,010 | |
| | |
| | Banks – 3.6% | |
| | 15,971 | | | Berkshire Hills Bancorp, Inc. | | | 429,939 | |
| | 49,492 | | | CenterState Banks, Inc. | | | 779,499 | |
| | 19,853 | | | Central Pacific Financial Corp. | | | 468,531 | |
| | 27,810 | | | East West Bancorp, Inc. | | | 950,546 | |
| | 11,376 | | | FCB Financial Holdings, Inc. Class A* | | | 386,784 | |
| | 160,029 | | | Fifth Third Bancorp | | | 2,814,910 | |
| | 3,267 | | | First Citizens BancShares, Inc. Class A | | | 845,859 | |
| | 8,596 | | | Hilltop Holdings, Inc.* | | | 180,430 | |
| | 17,443 | | | IBERIABANK Corp. | | | 1,041,870 | |
| | 153,495 | | | JPMorgan Chase & Co. | | | 9,538,179 | |
| | 208,520 | | | KeyCorp | | | 2,304,146 | |
| | 23,512 | | | Prosperity Bancshares, Inc. | | | 1,198,877 | |
| | 37,634 | | | Radian Group, Inc. | | | 392,146 | |
| | 233,240 | | | Regions Financial Corp. | | | 1,984,873 | |
| | 6,649 | | | SVB Financial Group* | | | 632,719 | |
| | 7,370 | | | Synovus Financial Corp. | | | 213,656 | |
| | 75,821 | | | TCF Financial Corp. | | | 959,136 | |
| | 64,124 | | | The PNC Financial Services Group, Inc. | | | 5,219,052 | |
| | 15,761 | | | U.S. Bancorp | | | 635,641 | |
| | 16,683 | | | Umpqua Holdings Corp. | | | 258,086 | |
| | 34,664 | | | United Community Banks, Inc. | | | 634,005 | |
| | 116,733 | | | Wells Fargo & Co. | | | 5,524,973 | |
| | 22,699 | | | Western Alliance Bancorp* | | | 741,122 | |
| | | | | | | | |
| | | | | | | 38,134,979 | |
| | |
| | Capital Goods – 7.4% | |
| | 14,958 | | | Allison Transmission Holdings, Inc. | | | 422,264 | |
| | 40,875 | | | Applied Industrial Technologies, Inc. | | | 1,845,098 | |
| | 8,716 | | | Astec Industries, Inc. | | | 489,403 | |
| | 28,363 | | | Babcock & Wilcox Enterprises, Inc.* | | | 416,653 | |
| | 28,536 | | | BWX Technologies, Inc. | | | 1,020,733 | |
| | 36,739 | | | Comfort Systems USA, Inc. | | | 1,196,589 | |
| | 11,974 | | | Continental Building Products, Inc.* | | | 266,182 | |
| | 4,835 | | | Curtiss-Wright Corp. | | | 407,349 | |
| | 30,694 | | | Danaher Corp. | | | 3,100,094 | |
| | 26,656 | | | DigitalGlobe, Inc.* | | | 570,172 | |
| | 11,432 | | | Eaton Corp. PLC | | | 682,833 | |
| | 4,919 | | | Esterline Technologies Corp.* | | | 305,175 | |
| | 24,790 | | | Federal Signal Corp. | | | 319,295 | |
| | 3,246 | | | Flowserve Corp. | | | 146,622 | |
| | 425,250 | | | General Electric Co. | | | 13,386,870 | |
| | 6,702 | | | Granite Construction, Inc. | | | 305,276 | |
| | 9,561 | | | H&E Equipment Services, Inc. | | | 181,946 | |
| | 94,135 | | | HD Supply Holdings, Inc.* | | | 3,277,781 | |
| | 9,481 | | | Honeywell International, Inc. | | | 1,102,830 | |
| | 10,455 | | | Hubbell, Inc. | | | 1,102,689 | |
| | 21 | | | Hyster-Yale Materials Handling, Inc. | | | 1,249 | |
| | |
| | | | | | | | |
| | Common Stocks – (continued) | |
| | Capital Goods – (continued) | |
| | 114,094 | | | Illinois Tool Works, Inc. | | $ | 11,884,031 | |
| | 5,320 | | | Ingersoll-Rand PLC | | | 338,775 | |
| | 29,272 | | | Lockheed Martin Corp. | | | 7,264,432 | |
| | 45,496 | | | NOW, Inc.* | | | 825,297 | |
| | 31,608 | | | Orbital ATK, Inc. | | | 2,691,105 | |
| | 64,168 | | | Raytheon Co. | | | 8,723,640 | |
| | 37,020 | | | Spirit AeroSystems Holdings, Inc. Class A* | | | 1,591,860 | |
| | 55,021 | | | The Boeing Co. | | | 7,145,577 | |
| | 11,074 | | | Trex Co., Inc.* | | | 497,444 | |
| | 8,619 | | | United Rentals, Inc.* | | | 578,335 | |
| | 8,601 | | | Valmont Industries, Inc. | | | 1,163,457 | |
| | 21,794 | | | WABCO Holdings, Inc.* | | | 1,995,677 | |
| | 3,709 | | | Wabtec Corp. | | | 260,483 | |
| | 23,184 | | | Watsco, Inc. | | | 3,261,757 | |
| | | | | | | | |
| | | | | | | 78,768,973 | |
| | |
| | Commercial & Professional Services – 0.9% | |
| | 59,972 | | | ABM Industries, Inc. | | | 2,187,779 | |
| | 48,254 | | | Brady Corp. Class A | | | 1,474,642 | |
| | 29,156 | | | Cintas Corp. | | | 2,861,078 | |
| | 11,520 | | | Essendant, Inc. | | | 352,051 | |
| | 17,718 | | | ManpowerGroup, Inc. | | | 1,139,976 | |
| | 14,452 | | | McGrath RentCorp | | | 442,087 | |
| | 58,286 | | | Steelcase, Inc. Class A | | | 790,941 | |
| | | | | | | | |
| | | | | | | 9,248,554 | |
| | |
| | Consumer Durables & Apparel – 2.1% | |
| | 18,478 | | | Carter’s, Inc. | | | 1,967,353 | |
| | 19,685 | | | Columbia Sportswear Co. | | | 1,132,675 | |
| | 3,479 | | | Harman International Industries, Inc. | | | 249,862 | |
| | 33,386 | | | Hasbro, Inc. | | | 2,804,090 | |
| | 3,878 | | | Helen of Troy Ltd.* | | | 398,813 | |
| | 163,278 | | | NIKE, Inc. Class B | | | 9,012,945 | |
| | 1,156 | | | NVR, Inc.* | | | 2,058,073 | |
| | 63,216 | | | Vista Outdoor, Inc.* | | | 3,017,300 | |
| | 9,823 | | | Whirlpool Corp. | | | 1,636,905 | |
| | | | | | | | |
| | | | | | | 22,278,016 | |
| | |
| | Consumer Services – 3.4% | |
| | 122,733 | | | Bloomin’ Brands, Inc. | | | 2,193,239 | |
| | 49,807 | | | Bob Evans Farms, Inc./DE | | | 1,890,176 | |
| | 38,745 | | | Boyd Gaming Corp.* | | | 712,908 | |
| | 51,446 | | | Carnival Corp. | | | 2,273,913 | |
| | 49,552 | | | Darden Restaurants, Inc. | | | 3,138,624 | |
| | 31,989 | | | Denny’s Corp.* | | | 343,242 | |
| | 46,924 | | | Domino’s Pizza, Inc. | | | 6,164,875 | |
| | 11,608 | | | Krispy Kreme Doughnuts, Inc.* | | | 243,304 | |
| | 6,048 | | | Marriott International, Inc. Class A(a) | | | 401,950 | |
| | 8,688 | | | McDonald’s Corp. | | | 1,045,514 | |
| | 62,281 | | | Papa John’s International, Inc. | | | 4,235,108 | |
| | 1,874 | | | Six Flags Entertainment Corp. | | | 108,598 | |
| | 71,064 | | | Sonic Corp. | | | 1,922,281 | |
| | 35,270 | | | Starbucks Corp. | | | 2,014,622 | |
| | 17,719 | | | Vail Resorts, Inc. | | | 2,449,297 | |
| | |
| | |
| The accompanying notes are an integral part of these financial statements. | | 39 |
GOLDMAN SACHS U.S. TAX-MANAGED EQUITY FUND
Schedule of Investments (continued)
June 30, 2016 (Unaudited)
| | | | | | | | |
Shares | | | Description | | Value | |
| | | | | | | | |
| | Common Stocks – (continued) | |
| | Consumer Services – (continued) | |
| | 5,310 | | | Wyndham Worldwide Corp. | | $ | 378,231 | |
| | 87,531 | | | Yum! Brands, Inc. | | | 7,258,071 | |
| | | | | | | | |
| | | | | | | 36,773,953 | |
| | |
| | Diversified Financials – 3.9% | |
| | 60,343 | | | Ameriprise Financial, Inc. | | | 5,421,819 | |
| | 40,517 | | | Berkshire Hathaway, Inc. Class B* | | | 5,866,456 | |
| | 4,505 | | | Capital One Financial Corp. | | | 286,113 | |
| | 23,016 | | | Cohen & Steers, Inc. | | | 930,767 | |
| | 137,041 | | | E*TRADE Financial Corp.* | | | 3,219,093 | |
| | 5,249 | | | GAMCO Investors, Inc. Class A | | | 172,010 | |
| | 13,256 | | | Morgan Stanley | | | 344,391 | |
| | 38,271 | | | MSCI, Inc. | | | 2,951,460 | |
| | 135,647 | | | Nasdaq, Inc. | | | 8,772,291 | |
| | 34,290 | | | OM Asset Management PLC | | | 457,771 | |
| | 171,359 | | | Synchrony Financial* | | | 4,331,956 | |
| | 163,531 | | | TD Ameritrade Holding Corp. | | | 4,656,545 | |
| | 96,718 | | | The Bank of New York Mellon Corp. | | | 3,757,494 | |
| | | | | | | | |
| | | | | | | 41,168,166 | |
| | |
| | Energy – 5.8% | |
| | 160,652 | | | Anadarko Petroleum Corp. | | | 8,554,719 | |
| | 39,012 | | | Callon Petroleum Co.* | | | 438,105 | |
| | 152,331 | | | Chesapeake Energy Corp.*(a) | | | 651,977 | |
| | 37,035 | | | Cimarex Energy Co. | | | 4,419,016 | |
| | 56,157 | | | Columbia Pipeline Group, Inc. | | | 1,431,442 | |
| | 39,820 | | | Devon Energy Corp. | | | 1,443,475 | |
| | 61,715 | | | Energen Corp. | | | 2,975,280 | |
| | 12,027 | | | EOG Resources, Inc. | | | 1,003,292 | |
| | 87,280 | | | Exxon Mobil Corp. | | | 8,181,627 | |
| | 127,204 | | | FMC Technologies, Inc.* | | | 3,392,531 | |
| | 78,991 | | | Kinder Morgan, Inc. | | | 1,478,711 | |
| | 32,063 | | | Marathon Oil Corp. | | | 481,266 | |
| | 168,719 | | | Newfield Exploration Co.* | | | 7,454,005 | |
| | 31,788 | | | Noble Energy, Inc. | | | 1,140,236 | |
| | 92,479 | | | Oasis Petroleum, Inc.* | | | 863,754 | |
| | 9,923 | | | Occidental Petroleum Corp. | | | 749,782 | |
| | 93,971 | | | Oceaneering International, Inc. | | | 2,805,974 | |
| | 18,970 | | | Oil States International, Inc.* | | | 623,734 | |
| | 43,816 | | | Pioneer Natural Resources Co. | | | 6,625,417 | |
| | 7,136 | | | Range Resources Corp.(a) | | | 307,847 | |
| | 8,552 | | | Superior Energy Services, Inc. | | | 157,442 | |
| | 256,705 | | | The Williams Companies, Inc. | | | 5,552,529 | |
| | 13,354 | | | Valero Energy Corp. | | | 681,054 | |
| | 38,826 | | | Whiting Petroleum Corp.* | | | 359,529 | |
| | | | | | | | |
| | | | | | | 61,772,744 | |
| | |
| | Food & Staples Retailing – 2.0% | |
| | 123,232 | | | CVS Health Corp. | | | 11,798,232 | |
| | 62,608 | | | Safeway PDC LLC* | | | 33,298 | |
| | 110,311 | | | Walgreens Boots Alliance, Inc. | | | 9,185,597 | |
| | | | | | | | |
| | | | | | | 21,017,127 | |
| | |
| | Food, Beverage & Tobacco – 7.2% | |
| | 284,076 | | | Altria Group, Inc. | | | 19,589,881 | |
| | 67,825 | | | Archer-Daniels-Midland Co. | | | 2,909,014 | |
| | |
| | | | | | | | |
| | Common Stocks – (continued) | |
| | Food, Beverage & Tobacco – (continued) | |
| | 286,791 | | | ConAgra Foods, Inc. | | $ | 13,711,478 | |
| | 4,908 | | | General Mills, Inc. | | | 350,038 | |
| | 53,570 | | | Hormel Foods Corp. | | | 1,960,662 | |
| | 13,685 | | | Lancaster Colony Corp. | | | 1,746,343 | |
| | 166,716 | | | PepsiCo, Inc. | | | 17,661,893 | |
| | 95,122 | | | Pilgrim’s Pride Corp.(a) | | | 2,423,708 | |
| | 28,740 | | | Sanderson Farms, Inc.(a) | | | 2,490,034 | |
| | 204,944 | | | Tyson Foods, Inc. Class A | | | 13,688,210 | |
| | | | | | | | |
| | | | | | | 76,531,261 | |
| | |
| | Health Care Equipment & Services – 6.2% | |
| | 64,076 | | | Abbott Laboratories | | | 2,518,828 | |
| | 9,683 | | | Aetna, Inc. | | | 1,182,585 | |
| | 24,038 | | | Allscripts Healthcare Solutions, Inc.* | | | 305,283 | |
| | 18,807 | | | Anthem, Inc. | | | 2,470,111 | |
| | 70,159 | | | Baxter International, Inc. | | | 3,172,590 | |
| | 12,250 | | | Becton Dickinson and Co. | | | 2,077,478 | |
| | 244,916 | | | Boston Scientific Corp.* | | | 5,723,687 | |
| | 27,433 | | | C. R. Bard, Inc. | | | 6,451,144 | |
| | 1,795 | | | Cantel Medical Corp. | | | 123,370 | |
| | 20,463 | | | Cardinal Health, Inc. | | | 1,596,319 | |
| | 5,312 | | | CorVel Corp.* | | | 229,372 | |
| | 82,259 | | | Express Scripts Holding Co.* | | | 6,235,232 | |
| | 40,526 | | | Hologic, Inc.* | | | 1,402,200 | |
| | 37,074 | | | IDEXX Laboratories, Inc.* | | | 3,442,692 | |
| | 28,495 | | | Magellan Health, Inc.* | | | 1,874,116 | |
| | 68,956 | | | McKesson Corp. | | | 12,870,637 | |
| | 60,503 | | | Medtronic PLC | | | 5,249,845 | |
| | 60,379 | | | St. Jude Medical, Inc. | | | 4,709,562 | |
| | 11,134 | | | Universal Health Services, Inc. Class B | | | 1,493,069 | |
| | 23,524 | | | WellCare Health Plans, Inc.* | | | 2,523,655 | |
| | | | | | | | |
| | | | | | | 65,651,775 | |
| | |
| | Household & Personal Products – 1.1% | |
| | 75,060 | | | Kimberly-Clark Corp. | | | 10,319,249 | |
| | 8,185 | | | The Procter & Gamble Co. | | | 693,024 | |
| | 4,862 | | | USANA Health Sciences, Inc.* | | | 541,772 | |
| | | | | | | | |
| | | | | | | 11,554,045 | |
| | |
| | Insurance – 4.1% | |
| | 122,226 | | | Allied World Assurance Co. Holdings AG | | | 4,295,022 | |
| | 45,168 | | | AmTrust Financial Services, Inc. | | | 1,106,616 | |
| | 24,694 | | | Argo Group International Holdings Ltd. | | | 1,281,618 | |
| | 36,301 | | | Aspen Insurance Holdings Ltd. | | | 1,683,640 | |
| | 13,710 | | | Endurance Specialty Holdings Ltd. | | | 920,764 | |
| | 98,971 | | | Lincoln National Corp. | | | 3,837,106 | |
| | 17,026 | | | Marsh & McLennan Companies, Inc. | | | 1,165,600 | |
| | 55,298 | | | Principal Financial Group, Inc. | | | 2,273,301 | |
| | 64,085 | | | Prudential Financial, Inc. | | | 4,571,824 | |
| | 107,660 | | | Reinsurance Group of America, Inc. | | | 10,441,943 | |
| | 84,924 | | | The Travelers Companies, Inc. | | | 10,109,353 | |
| | 18,889 | | | Unum Group | | | 600,481 | |
| | |
| | |
| 40 | | The accompanying notes are an integral part of these financial statements. |
GOLDMAN SACHS U.S. TAX-MANAGED EQUITY FUND
| | | | | | | | |
Shares | | | Description | | Value | |
| | | | | | | | |
| | Common Stocks – (continued) | |
| | Insurance – (continued) | |
| | 17,455 | | | W.R. Berkley Corp. | | $ | 1,045,904 | |
| | | | | | | | |
| | | | | | | 43,333,172 | |
| | |
| | Materials – 5.8% | |
| | 5,254 | | | Air Products & Chemicals, Inc. | | | 746,278 | |
| | 85,563 | | | AK Steel Holding Corp.*(a) | | | 398,724 | |
| | 125,196 | | | Axalta Coating Systems Ltd.* | | | 3,321,450 | |
| | 15,470 | | | Crown Holdings, Inc.* | | | 783,865 | |
| | 22,311 | | | HB Fuller Co. | | | 981,461 | |
| | 66,105 | | | LyondellBasell Industries NV Class A | | | 4,919,534 | |
| | 17,318 | | | Minerals Technologies, Inc. | | | 983,662 | |
| | 17,081 | | | Newmont Mining Corp. | | | 668,209 | |
| | 109,469 | | | Nucor Corp. | | | 5,408,863 | |
| | 60,894 | | | PPG Industries, Inc. | | | 6,342,110 | |
| | 11,574 | | | Praxair, Inc. | | | 1,300,802 | |
| | 137,201 | | | Reliance Steel & Aluminum Co. | | | 10,550,757 | |
| | 448,526 | | | Steel Dynamics, Inc. | | | 10,988,887 | |
| | 4,173 | | | The Scotts Miracle-Gro Co. Class A | | | 291,734 | |
| | 31,204 | | | The Sherwin-Williams Co. | | | 9,163,679 | |
| | 33,803 | | | Vulcan Materials Co. | | | 4,068,529 | |
| | 16,559 | | | W.R. Grace & Co. | | | 1,212,284 | |
| | | | | | | | |
| | | | | | | 62,130,828 | |
| | |
| | Media – 1.3% | |
| | 135,579 | | | Comcast Corp. Class A | | | 8,838,395 | |
| | 28,618 | | | Liberty Global PLC Series C* | | | 819,906 | |
| | 6,922 | | | Liberty Global PLC LiLAC* | | | 224,889 | |
| | 14,896 | | | Regal Entertainment Group Class A(a) | | | 328,308 | |
| | 13,467 | | | Thomson Reuters Corp. | | | 544,336 | |
| | 127,717 | | | Twenty-First Century Fox, Inc. Class A | | | 3,454,745 | |
| | | | | | | | |
| | | | | | | 14,210,579 | |
| | |
| | Pharmaceuticals, Biotechnology & Life Sciences – 10.1% | |
| | 117,983 | | | AbbVie, Inc. | | | 7,304,328 | |
| | 7,407 | | | Akorn, Inc.* | | | 210,988 | |
| | 28,864 | | | Alexion Pharmaceuticals, Inc.* | | | 3,370,161 | |
| | 15,723 | | | Allergan PLC* | | | 3,633,428 | |
| | 105,407 | | | Amgen, Inc. | | | 16,037,675 | |
| | 19,753 | | | Biogen, Inc.* | | | 4,776,671 | |
| | 48,696 | | | Cambrex Corp.* | | | 2,519,044 | |
| | 13,570 | | | Celgene Corp.* | | | 1,338,409 | |
| | 21,872 | | | Cepheid, Inc.* | | | 672,564 | |
| | 30,470 | | | Gilead Sciences, Inc. | | | 2,541,807 | |
| | 10,726 | | | Impax Laboratories, Inc.* | | | 309,123 | |
| | 12,001 | | | Incyte Corp.* | | | 959,840 | |
| | 33,539 | | | Ironwood Pharmaceuticals, Inc.* | | | 438,523 | |
| | 101,303 | | | Johnson & Johnson | | | 12,288,054 | |
| | 177,672 | | | Merck & Co., Inc. | | | 10,235,684 | |
| | 145,432 | | | Mylan NV* | | | 6,288,480 | |
| | 123,720 | | | Myriad Genetics, Inc.* | | | 3,785,832 | |
| | 383,215 | | | Pfizer, Inc. | | | 13,493,000 | |
| | 11,644 | | | Regeneron Pharmaceuticals, Inc.* | | | 4,066,434 | |
| | 23,062 | | | Repligen Corp.* | | | 630,976 | |
| | 3,494 | | | Thermo Fisher Scientific, Inc. | | | 516,274 | |
| | 50,283 | | | United Therapeutics Corp.* | | | 5,325,975 | |
| | |
| | | | | | | | |
| | Common Stocks – (continued) | |
| | Pharmaceuticals, Biotechnology & Life Sciences – (continued) | |
| | 28,865 | | | Vertex Pharmaceuticals, Inc.* | | $ | 2,482,967 | |
| | 96,535 | | | Zoetis, Inc. | | | 4,581,551 | |
| | | | | | | | |
| | | | | | | 107,807,788 | |
| | |
| | Real Estate – 4.1% | |
| | 53,031 | | | American Tower Corp. (REIT) | | | 6,024,852 | |
| | 74,814 | | | Apartment Investment & Management Co. Class A (REIT) | | | 3,303,786 | |
| | 7,629 | | | Camden Property Trust (REIT) | | | 674,556 | |
| | 6,702 | | | CBRE Group, Inc. Class A* | | | 177,469 | |
| | 18,849 | | | CoreSite Realty Corp. (REIT) | | | 1,671,718 | |
| | 110,153 | | | CubeSmart (REIT) | | | 3,401,525 | |
| | 19,282 | | | CyrusOne, Inc. (REIT) | | | 1,073,236 | |
| | 42,346 | | | DCT Industrial Trust, Inc. (REIT) | | | 2,034,302 | |
| | 7,822 | | | DuPont Fabros Technology, Inc. (REIT) | | | 371,858 | |
| | 32,064 | | | Equity Commonwealth (REIT)* | | | 934,024 | |
| | 61,273 | | | Equity LifeStyle Properties, Inc. (REIT) | | | 4,904,904 | |
| | 11,456 | | | First Industrial Realty Trust, Inc. (REIT) | | | 318,706 | |
| | 18,168 | | | Hudson Pacific Properties, Inc. (REIT) | | | 530,142 | |
| | 31,576 | | | Iron Mountain, Inc. (REIT) | | | 1,257,672 | |
| | 21,608 | | | Kite Realty Group Trust (REIT) | | | 605,672 | |
| | 12,458 | | | Lamar Advertising Co. Class A (REIT) | | | 825,966 | |
| | 66,161 | | | Mack-Cali Realty Corp. (REIT) | | | 1,786,347 | |
| | 19,514 | | | Pennsylvania Real Estate Investment Trust (REIT) | | | 418,575 | |
| | 48,968 | | | Post Properties, Inc. (REIT) | | | 2,989,496 | |
| | 33,614 | | | Prologis, Inc. (REIT) | | | 1,648,431 | |
| | 10,025 | | | PS Business Parks, Inc. (REIT) | | | 1,063,452 | |
| | 21,407 | | | Public Storage (REIT) | | | 5,471,182 | |
| | 180,579 | | | WP Glimcher, Inc. (REIT) | | | 2,020,679 | |
| | | | | | | | |
| | | | | | | 43,508,550 | |
| | |
| | Retailing – 6.4% | |
| | 8,259 | | | Abercrombie & Fitch Co. Class A | | | 147,093 | |
| | 17,587 | | | Amazon.com, Inc.* | | | 12,585,609 | |
| | 10,896 | | | AutoZone, Inc.* | | | 8,649,681 | |
| | 124,846 | | | Chico’s FAS, Inc. | | | 1,337,133 | |
| | 3,106 | | | Expedia, Inc. | | | 330,168 | |
| | 11,337 | | | Group 1 Automotive, Inc. | | | 559,594 | |
| | 42,663 | | | HSN, Inc. | | | 2,087,501 | |
| | 178,063 | | | Liberty Interactive Corp QVC Group Series A* | | | 4,517,458 | |
| | 30,821 | | | Liberty TripAdvisor Holdings, Inc. Class A* | | | 674,364 | |
| | 141,850 | | | Lowe’s Companies, Inc. | | | 11,230,265 | |
| | 17,336 | | | Netflix, Inc.* | | | 1,585,897 | |
| | 37,334 | | | O’Reilly Automotive, Inc.* | | | 10,121,247 | |
| | 8,522 | | | Sally Beauty Holdings, Inc.* | | | 250,632 | |
| | 87,609 | | | The Home Depot, Inc. | | | 11,186,793 | |
| | 2,240 | | | The Priceline Group, Inc.* | | | 2,796,438 | |
| | 1,960 | | | TripAdvisor, Inc.* | | | 126,028 | |
| | | | | | | | |
| | | | | | | 68,185,901 | |
| | |
| | |
| The accompanying notes are an integral part of these financial statements. | | 41 |
GOLDMAN SACHS U.S. TAX-MANAGED EQUITY FUND
Schedule of Investments (continued)
June 30, 2016 (Unaudited)
| | | | | | | | |
Shares | | | Description | | Value | |
| | | | | | | | |
| | Common Stocks – (continued) | |
| | Semiconductors & Semiconductor Equipment – 2.9% | |
| | 30,458 | | | Advanced Energy Industries, Inc.* | | $ | 1,156,186 | |
| | 31,784 | | | Intel Corp. | | | 1,042,515 | |
| | 150,885 | | | KLA-Tencor Corp. | | | 11,052,326 | |
| | 42,708 | | | Lam Research Corp. | | | 3,590,035 | |
| | 86,810 | | | Maxim Integrated Products, Inc. | | | 3,098,249 | |
| | 19,373 | | | MKS Instruments, Inc. | | | 834,201 | |
| | 6,989 | | | NXP Semiconductors NV* | | | 547,518 | |
| | 100,646 | | | ON Semiconductor Corp.* | | | 887,698 | |
| | 65,145 | | | Photronics, Inc.* | | | 580,442 | |
| | 50,405 | | | QUALCOMM, Inc. | | | 2,700,196 | |
| | 100,492 | | | Teradyne, Inc. | | | 1,978,687 | |
| | 63,128 | | | Texas Instruments, Inc. | | | 3,954,969 | |
| | | | | | | | |
| | | | | | | 31,423,022 | |
| | |
| | Software & Services – 10.3% | |
| | 11,165 | | | Adobe Systems, Inc.* | | | 1,069,495 | |
| | 1,031 | | | Alliance Data Systems Corp.* | | | 201,994 | |
| | 14,531 | | | Alphabet, Inc. Class A* | | | 10,222,994 | |
| | 14,692 | | | Alphabet, Inc. Class C* | | | 10,168,333 | |
| | 31,238 | | | Amdocs Ltd. | | | 1,803,057 | |
| | 14,690 | | | Aspen Technology, Inc.* | | | 591,126 | |
| | 10,242 | | | Bottomline Technologies de, Inc.* | | | 220,510 | |
| | 21,888 | | | Cadence Design Systems, Inc.* | | | 531,878 | |
| | 15,958 | | | CDK Global, Inc. | | | 885,509 | |
| | 96,260 | | | Citrix Systems, Inc.* | | | 7,709,463 | |
| | 10,304 | | | CoreLogic, Inc.* | | | 396,498 | |
| | 1,354 | | | CoStar Group, Inc.* | | | 296,066 | |
| | 101,929 | | | CSRA, Inc. | | | 2,388,196 | |
| | 47,429 | | | Cvent, Inc.* | | | 1,694,164 | |
| | 54,254 | | | EarthLink Holdings Corp. | | | 347,226 | |
| | 49,384 | | | eBay, Inc.* | | | 1,156,079 | |
| | 50,031 | | | Electronic Arts, Inc.* | | | 3,790,349 | |
| | 66,896 | | | EVERTEC, Inc. | | | 1,039,564 | |
| | 99,472 | | | Facebook, Inc. Class A* | | | 11,367,660 | |
| | 2,034 | | | Global Payments, Inc. | | | 145,187 | |
| | 30,278 | | | Intuit, Inc. | | | 3,379,328 | |
| | 3,344 | | | LinkedIn Corp. Class A* | | | 632,852 | |
| | 421,098 | | | Microsoft Corp.(b) | | | 21,547,585 | |
| | 9,824 | | | MicroStrategy, Inc. Class A* | | | 1,719,396 | |
| | 113,302 | | | Nuance Communications, Inc.* | | | 1,770,910 | |
| | 212,943 | | | Oracle Corp. | | | 8,715,757 | |
| | 72,095 | | | Rackspace Hosting, Inc.* | | | 1,503,902 | |
| | 22,899 | | | Synopsys, Inc.* | | | 1,238,378 | |
| | 89,564 | | | Take-Two Interactive Software, Inc.* | | | 3,396,267 | |
| | 36,907 | | | Teradata Corp.* | | | 925,258 | |
| | 12,350 | | | Twitter, Inc.* | | | 208,839 | |
| | 91,433 | | | Vantiv, Inc. Class A* | | | 5,175,108 | |
| | 12,293 | | | VeriSign, Inc.* | | | 1,062,853 | |
| | 9,516 | | | WEX, Inc.* | | | 843,784 | |
| | 36,120 | | | Yahoo!, Inc.* | | | 1,356,667 | |
| | | | | | | | |
| | | | | | | 109,502,232 | |
| | |
| | Technology Hardware & Equipment – 2.8% | |
| | 139,458 | | | Apple, Inc. | | | 13,332,185 | |
| | 3,639 | | | Avnet, Inc. | | | 147,416 | |
| | |
| | | | | | | | |
| | Common Stocks – (continued) | |
| | Technology Hardware & Equipment – (continued) | |
| | 108,682 | | | Brocade Communications Systems, Inc. | | $ | 997,701 | |
| | 26,644 | | | CDW Corp./DE | | | 1,067,891 | |
| | 62,301 | | | Cray, Inc.* | | | 1,864,046 | |
| | 12,846 | | | EchoStar Corp. Class A* | | | 509,986 | |
| | 93,228 | | | EMC Corp. | | | 2,533,005 | |
| | 21,781 | | | Flextronics International Ltd.* | | | 257,016 | |
| | 110,504 | | | HP, Inc. | | | 1,386,825 | |
| | 10,319 | | | Juniper Networks, Inc. | | | 232,074 | |
| | 18,594 | | | Methode Electronics, Inc. | | | 636,504 | |
| | 45,067 | | | NCR Corp.* | | | 1,251,511 | |
| | 72,064 | | | NetApp, Inc. | | | 1,772,054 | |
| | 54,137 | | | NETGEAR, Inc.* | | | 2,573,673 | |
| | 19,725 | | | Polycom, Inc.* | | | 221,906 | |
| | 7,842 | | | Tech Data Corp.* | | | 563,448 | |
| | 150,234 | | | Viavi Solutions, Inc.* | | | 996,058 | |
| | | | | | | | |
| | | | | | | 30,343,299 | |
| | |
| | Telecommunication Services – 0.4% | |
| | 53,229 | | | AT&T, Inc. | | | 2,300,025 | |
| | 55,954 | | | CenturyLink, Inc. | | | 1,623,201 | |
| | 11,270 | | | Verizon Communications, Inc. | | | 629,317 | |
| | | | | | | | |
| | | | | | | 4,552,543 | |
| | |
| | Transportation – 1.7% | |
| | 24,642 | | | Alaska Air Group, Inc. | | | 1,436,382 | |
| | 4,135 | | | Allegiant Travel Co. | | | 626,452 | |
| | 33,622 | | | American Airlines Group, Inc. | | | 951,839 | |
| | 11,928 | | | ArcBest Corp. | | | 193,830 | |
| | 284,775 | | | CSX Corp. | | | 7,426,932 | |
| | 28,966 | | | Delta Air Lines, Inc. | | | 1,055,231 | |
| | 3,220 | | | FedEx Corp. | | | 488,732 | |
| | 5,744 | | | Saia, Inc.* | | | 144,404 | |
| | 63,265 | | | Southwest Airlines Co. | | | 2,480,621 | |
| | 19,226 | | | Union Pacific Corp. | | | 1,677,469 | |
| | 16,477 | | | United Parcel Service, Inc. Class B | | | 1,774,902 | |
| | | | | | | | |
| | | | | | | 18,256,794 | |
| | |
| | Utilities – 5.2% | |
| | 545,590 | | | AES Corp. | | | 6,808,963 | |
| | 36,954 | | | Ameren Corp. | | | 1,979,995 | |
| | 9,873 | | | American Water Works Co., Inc. | | | 834,367 | |
| | 207,188 | | | CenterPoint Energy, Inc. | | | 4,972,512 | |
| | 113,422 | | | Edison International | | | 8,809,487 | |
| | 2,440 | | | Entergy Corp. | | | 198,494 | |
| | 122,915 | | | FirstEnergy Corp. | | | 4,290,963 | |
| | 352,497 | | | Great Plains Energy, Inc. | | | 10,715,909 | |
| | 247,714 | | | NiSource, Inc. | | | 6,569,375 | |
| | 429,297 | | | NRG Energy, Inc. | | | 6,435,162 | |
| | 3,942 | | | Questar Corp. | | | 100,009 | |
| | 30,047 | | | Sempra Energy | | | 3,425,959 | |
| | | | | | | | |
| | | | | | | 55,141,195 | |
| | |
| TOTAL INVESTMENTS BEFORE SECURITIES
LENDING REINVESTMENT VEHICLE |
|
| | (Cost $816,659,521) | | $ | 1,055,736,506 | |
| | |
| | |
| 42 | | The accompanying notes are an integral part of these financial statements. |
GOLDMAN SACHS U.S. TAX-MANAGED EQUITY FUND
| | | | | | | | |
| Shares | | | Distribution
Rate | | Value | |
| | Securities Lending Reinvestment Vehicle(c)(d) – 0.7% | |
| Goldman Sachs Financial Square Money Market Fund –
FST Institutional Shares |
|
| | 7,374,800 | | | 0.397% | | $ | 7,374,800 | |
| | (Cost $7,374,800) | | | | |
| | |
| | TOTAL INVESTMENTS – 99.8% | | | | |
| | (Cost $824,034,321) | | $ | 1,063,111,306 | |
| | |
| OTHER ASSETS IN EXCESS OF
LIABILITIES – 0.2% | | | 1,748,803 | |
| | |
| | NET ASSETS – 100.0% | | $ | 1,064,860,109 | |
| | |
| | |
| The percentage shown for each investment category reflects the value of investments in that category as a percentage of net assets. |
* | | Non-income producing security. |
(a) | | All or a portion of security is on loan. |
(b) | | All or a portion of security is segregated as collateral for initial margin requirements on futures transactions. |
(c) | | Represents an affiliated issuer. |
(d) | | Variable rate security. Interest rate or distribution rate disclosed is that which is in effect on June 30, 2016. |
| | |
|
Investment Abbreviation: |
REIT | | —Real Estate Investment Trust |
|
|
| ADDITIONAL INVESTMENT INFORMATION |
FUTURES CONTRACTS — At June 30, 2016, the Fund had the following futures contracts:
| | | | | | | | | | | | | | |
| Type | | Number of
Contracts
Long (Short) | | | Expiration
Date | | Current
Value | | | Unrealized
Gain (Loss) | |
Russell 2000 Mini Index | | | 6 | | | September 2016 | | $ | 688,440 | | | $ | 1,888 | |
S&P 500 E-Mini Index | | | 69 | | | September 2016 | | | 7,211,190 | | | | 69,887 | |
| TOTAL | | | | | | | | | | | | $ | 71,775 | |
| | |
| The accompanying notes are an integral part of these financial statements. | | 43 |
GOLDMAN SACHS INTERNATIONAL TAX-MANAGED EQUITY FUND
Schedule of Investments
June 30, 2016 (Unaudited)
| | | | | | | | |
Shares | | | Description | | Value | |
| | | | | | | | |
| | Common Stocks – 98.6% | |
| | Australia – 4.5% | |
| | 23,424 | | | Astro Japan Property Group (REIT) | | $ | 120,016 | |
| | 7,853 | | | ASX Ltd. (Diversified Financials) | | | 270,383 | |
| | 71,044 | | | BHP Billiton PLC (Materials) | | | 899,200 | |
| | 6,131 | | | Blackmores Ltd. (Household & Personal Products)(a) | | | 605,133 | |
| | 6,291 | | | CSL Ltd. (Pharmaceuticals, Biotechnology & Life Sciences) | | | 530,536 | |
| | 33,790 | | | Domino’s Pizza Enterprises Ltd. (Consumer Services) | | | 1,738,749 | |
| | 4,830 | | | Event Hospitality and Entertainment Ltd. (Media) | | | 52,595 | |
| | 133,721 | | | Fortescue Metals Group Ltd. (Materials) | | | 357,843 | |
| | 23,321 | | | Harvey Norman Holdings Ltd. (Retailing) | | | 81,147 | |
| | 36,105 | | | Magellan Financial Group Ltd. (Diversified Financials) | | | 608,607 | |
| | 1,372,498 | | | Medibank Pvt Ltd. (Insurance) | | | 3,043,597 | |
| | 117,376 | | | Newcrest Mining Ltd. (Materials)* | | | 2,034,342 | |
| | 22,980 | | | nib holdings Ltd. (Insurance) | | | 72,759 | |
| | 75,831 | | | OZ Minerals Ltd. (Materials) | | | 325,423 | |
| | 324,879 | | | Qantas Airways Ltd. (Transportation)* | | | 688,198 | |
| | 38,948 | | | Ramsay Health Care Ltd. (Health Care Equipment & Services) | | | 2,104,965 | |
| | 14,793 | | | The Reject Shop Ltd. (Retailing) | | | 135,375 | |
| | 269,446 | | | The Star Entertainment Grp Ltd. (Consumer Services) | | | 1,097,919 | |
| | 468,658 | | | Treasury Wine Estates Ltd. (Food, Beverage & Tobacco) | | | 3,256,645 | |
| | 480,690 | | | Vicinity Centres (REIT) | | | 1,199,249 | |
| | 73,957 | | | Woodside Petroleum Ltd. (Energy) | | | 1,499,644 | |
| | | | | | | | |
| | | | | | | 20,722,325 | |
| | |
| | Austria – 0.0% | |
| | 7,790 | | | CA Immobilien Anlagen AG (Real Estate)* | | | 130,097 | |
| | |
| | Belgium – 1.0% | |
| | 6,916 | | | Anheuser-Busch InBev NV (Food, Beverage & Tobacco) | | | 914,547 | |
| | 5,583 | | | Befimmo SA (REIT) | | | 359,349 | |
| | 23,452 | | | Bekaert SA (Materials) | | | 1,021,572 | |
| | 9,980 | | | Delhaize Group (Food & Staples Retailing) | | | 1,054,231 | |
| | 20,399 | | | KBC Group NV (Banks)* | | | 1,003,241 | |
| | 6,720 | | | Melexis NV (Semiconductors & Semiconductor Equipment) | | | 422,273 | |
| | | | | | | | |
| | | | | | | 4,775,213 | |
| | |
| | Denmark – 2.5% | |
| | 6,024 | | | Chr. Hansen Holding A/S (Materials) | | | 395,628 | |
| | 134,452 | | | Danske Bank A/S (Banks) | | | 3,538,828 | |
| | 6,806 | | | Dfds A/S (Transportation) | | | 298,744 | |
| | 9,877 | | | GN Store Nord A/S (Health Care Equipment & Services) | | | 178,421 | |
| | |
| | | | | | | | |
| | Common Stocks – (continued) | |
| | Denmark – (continued) | |
| | 5,510 | | | Novo Nordisk A/S Class B (Pharmaceuticals, Biotechnology & Life Sciences) | | $ | 296,730 | |
| | 8,582 | | | Pandora A/S (Consumer Durables & Apparel) | | | 1,168,864 | |
| | 2,963 | | | Royal Unibrew A/S (Food, Beverage & Tobacco) | | | 132,548 | |
| | 437,983 | | | TDC A/S (Telecommunication Services) | | | 2,146,323 | |
| | 50,930 | | | Vestas Wind Systems A/S (Capital Goods) | | | 3,461,684 | |
| | | | | | | | |
| | | | | | | 11,617,770 | |
| | |
| | Finland – 0.8% | |
| | 14,677 | | | Cramo OYJ (Capital Goods) | | | 302,376 | |
| | 40,960 | | | Neste OYJ (Energy) | | | 1,468,782 | |
| | 13,382 | | | Ramirent OYJ (Capital Goods) | | | 102,556 | |
| | 24,949 | | | Technopolis OYJ (Real Estate) | | | 98,289 | |
| | 87,694 | | | UPM-Kymmene OYJ (Materials) | | | 1,611,006 | |
| | 1,494 | | | Vaisala OYJ (Technology Hardware & Equipment) | | | 47,003 | |
| | | | | | | | |
| | | | | | | 3,630,012 | |
| | |
| | France – 7.5% | |
| | 172,496 | | | AXA SA (Insurance) | | | 3,410,697 | |
| | 87,434 | | | BNP Paribas SA (Banks)(b) | | | 3,834,464 | |
| | 1,636 | | | Capgemini SA (Software & Services) | | | 141,175 | |
| | 34,869 | | | Compagnie Generale des Etablissements Michelin Class B (Automobiles & Components) | | | 3,286,076 | |
| | 19,275 | | | Credit Agricole SA (Banks) | | | 162,044 | |
| | 3,936 | | | Gecina SA (REIT) | | | 533,124 | |
| | 26,388 | | | Klepierre (REIT) | | | 1,164,377 | |
| | 54,053 | | | Legrand SA (Capital Goods) | | | 2,767,046 | |
| | 20,614 | | | Natixis SA (Banks) | | | 77,568 | |
| | 127,845 | | | Orange SA (Telecommunication Services) | | | 2,078,825 | |
| | 29,559 | | | Renault SA (Automobiles & Components) | | | 2,231,631 | |
| | 15,554 | | | Safran SA (Capital Goods) | | | 1,047,434 | |
| | 9,301 | | | Schneider Electric SE (Capital Goods) | | | 542,627 | |
| | 117,595 | | | Societe Generale SA (Banks) | | | 3,679,067 | |
| | 41,297 | | | Thales SA (Capital Goods) | | | 3,429,479 | |
| | 52,890 | | | UBISOFT Entertainment (Software & Services)* | | | 1,926,832 | |
| | 771 | | | Unibail-Rodamco SE (REIT) | | | 199,453 | |
| | 5,064 | | | Valeo SA (Automobiles & Components) | | | 224,812 | |
| | 56,426 | | | Vinci SA (Capital Goods) | | | 3,981,806 | |
| | | | | | | | |
| | | | | | | 34,718,537 | |
| | |
| | Germany – 8.5% | |
| | 6,330 | | | Allianz SE (Registered) (Insurance) | | | 903,022 | |
| | 71,621 | | | BASF SE (Materials) | | | 5,491,809 | |
| | |
| | |
| 44 | | The accompanying notes are an integral part of these financial statements. |
GOLDMAN SACHS INTERNATIONAL TAX-MANAGED EQUITY FUND
| | | | | | | | |
Shares | | | Description | | Value | |
| | | | | | | | |
| | Common Stocks – (continued) | |
| | Germany – (continued) | |
| | 41,359 | | | Bayer AG (Registered) (Pharmaceuticals, Biotechnology & Life Sciences) | | $ | 4,153,887 | |
| | 2,306 | | | CENIT AG (Software & Services) | | | 48,903 | |
| | 9,796 | | | Continental AG (Automobiles & Components) | | | 1,853,665 | |
| | 259,144 | | | Deutsche Telekom AG (Registered) (Telecommunication Services) | | | 4,418,994 | |
| | 47,591 | | | Freenet AG (Telecommunication Services) | | | 1,225,636 | |
| | 3,968 | | | Fresenius Medical Care AG & Co. KGaA (Health Care Equipment & Services) | | | 345,638 | |
| | 54,600 | | | Fresenius SE & Co. KGaA (Health Care Equipment & Services) | | | 4,011,873 | |
| | 4,332 | | | H&R AG (Materials)* | | | 58,831 | |
| | 26,453 | | | Hannover Rueck SE (Insurance) | | | 2,771,678 | |
| | 706 | | | Henkel AG & Co. KGaA (Household & Personal Products) | | | 76,366 | |
| | 21,679 | | | Hochtief AG (Capital Goods) | | | 2,798,993 | |
| | 7,805 | | | Hugo Boss AG (Consumer Durables & Apparel) | | | 443,730 | |
| | 235,261 | | | Infineon Technologies AG (Semiconductors & Semiconductor Equipment) | | | 3,405,735 | |
| | 8,067 | | | Koenig & Bauer AG (Capital Goods)* | | | 410,705 | |
| | 1,971 | | | KUKA AG (Capital Goods) | | | 233,783 | |
| | 4,970 | | | Merck KGaA (Pharmaceuticals, Biotechnology & Life Sciences) | | | 505,166 | |
| | 4,248 | | | Nemetschek SE (Software & Services) | | | 230,402 | |
| | 24,382 | | | Nordex SE (Capital Goods)* | | | 692,105 | |
| | 41,360 | | | ProSiebenSat.1 Media SE (Registered) (Media)* | | | 1,809,172 | |
| | 41,273 | | | STADA Arzneimittel AG (Pharmaceuticals, Biotechnology & Life Sciences)* | | | 2,139,063 | |
| | 10,431 | | | Stroeer SE & Co KGaA (Media) | | | 479,818 | |
| | 8,694 | | | Suess MicroTec AG (Semiconductors & Semiconductor Equipment)* | | | 65,483 | |
| | 13,751 | | | Symrise AG (Materials) | | | 937,972 | |
| | | | | | | | |
| | | | | | | 39,512,429 | |
| | |
| | Hong Kong – 3.6% | |
| | 168,000 | | | AIA Group Ltd. (Insurance) | | | 1,010,306 | |
| | 863,500 | | | BOC Hong Kong Holdings Ltd. (Banks) | | | 2,602,032 | |
| | 115,000 | | | Cheung Kong Infrastructure Holdings Ltd. (Utilities) | | | 991,537 | |
| | 20,464 | | | Cheung Kong Property Holdings Ltd. (Real Estate) | | | 128,937 | |
| | 116,964 | | | CK Hutchison Holdings Ltd. (Capital Goods) | | | 1,286,658 | |
| | 380,000 | | | CLP Holdings Ltd. (Utilities) | | | 3,881,772 | |
| | 16,100 | | | Hang Seng Bank Ltd. (Banks) | | | 276,160 | |
| | |
| | | | | | | | |
| | Common Stocks – (continued) | |
| | Hong Kong – (continued) | |
| | 211,200 | | | Henderson Land Development Co. Ltd. (Real Estate) | | $ | 1,193,019 | |
| | 230,967 | | | Hong Kong & China Gas Co. Ltd. (Utilities) | | | 422,028 | |
| | 1,100 | | | Jardine Matheson Holdings Ltd. (Capital Goods) | | | 64,310 | |
| | 138,000 | | | New World Development Co. Ltd. (Real Estate) | | | 140,534 | |
| | 140,000 | | | Sino Land Co. Ltd. (Real Estate) | | | 230,508 | |
| | 218,000 | | | Swire Pacific Ltd. Class A (Real Estate) | | | 2,463,669 | |
| | 288,000 | | | Wheelock & Co. Ltd. (Real Estate) | | | 1,352,921 | |
| | 191,500 | | | Yue Yuen Industrial Holdings Ltd. (Consumer Durables & Apparel) | | | 758,976 | |
| | | | | | | | |
| | | | | | | 16,803,367 | |
| | |
| | India – 0.2% | |
| | 155,801 | | | Vedanta Resources PLC (Materials)* | | | 870,618 | |
| | |
| | Ireland – 0.5% | |
| | 5,943 | | | DCC PLC (Capital Goods) | | | 522,982 | |
| | 24,922 | | | Shire PLC (Pharmaceuticals, Biotechnology & Life Sciences) | | | 1,540,242 | |
| | 41,047 | | | Total Produce PLC (Food & Staples Retailing) | | | 65,367 | |
| | | | | | | | |
| | | | | | | 2,128,591 | |
| | |
| | Israel – 0.1% | |
| | 79,015 | | | Bank Hapoalim B.M. (Banks) | | | 398,069 | |
| | 6,854 | | | Mizrahi Tefahot Bank Ltd. (Banks) | | | 79,032 | |
| | | | | | | | |
| | | | | | | 477,101 | |
| | |
| | Italy – 3.4% | |
| | 6,147 | | | ASTM SpA (Transportation) | | | 67,040 | |
| | 8,855 | | | Biesse SpA (Capital Goods) | | | 111,480 | |
| | 14,158 | | | Buzzi Unicem SpA (Materials) | | | 248,105 | |
| | 2,751 | | | De’ Longhi SpA (Consumer Durables & Apparel) | | | 65,555 | |
| | 3,686 | | | DiaSorin SpA (Health Care Equipment & Services) | | | 225,410 | |
| | 969,250 | | | Enel SpA (Utilities) | | | 4,302,935 | |
| | 296,582 | | | Eni SpA (Energy) | | | 4,777,097 | |
| | 90,450 | | | Immobiliare Grande Distribuzione SIIQ SpA (REIT) | | | 74,052 | |
| | 17,349 | | | Infrastrutture Wireless Italiane SpA (Telecommunication Services)(c) | | | 76,613 | |
| | 257,891 | | | Intesa Sanpaolo SpA RNC (Banks) | | | 461,675 | |
| | 1,626,754 | | | Intesa Sanpaolo SpA (Banks) | | | 3,098,497 | |
| | 157,320 | | | Iren SpA (Utilities) | | | 242,490 | |
| | 10,076 | | | La Doria SpA (Food, Beverage & Tobacco)* | | | 126,385 | |
| | 555,569 | | | Mediaset SpA (Media) | | | 1,942,854 | |
| | 3,444 | | | Recordati SpA (Pharmaceuticals, Biotechnology & Life Sciences) | | | 103,594 | |
| | | | | | | | |
| | | | | | | 15,923,782 | |
| | |
| | |
| The accompanying notes are an integral part of these financial statements. | | 45 |
GOLDMAN SACHS INTERNATIONAL TAX-MANAGED EQUITY FUND
Schedule of Investments (continued)
June 30, 2016 (Unaudited)
| | | | | | | | |
Shares | | | Description | | Value | |
| | | | | | | | |
| | Common Stocks – (continued) | |
| | Japan – 25.6% | |
| | 92,000 | | | Ajinomoto Co., Inc. (Food, Beverage & Tobacco) | | $ | 2,167,609 | |
| | 37,200 | | | Amada Holdings Co. Ltd. (Capital Goods) | | | 377,659 | |
| | 21,600 | | | Amano Corp. (Technology Hardware & Equipment) | | | 376,258 | |
| | 3,500 | | | Asahi Group Holdings Ltd. (Food, Beverage & Tobacco) | | | 113,172 | |
| | 3,500 | | | ASKUL Corp. (Retailing) | | | 129,398 | |
| | 177,400 | | | Astellas Pharma, Inc. (Pharmaceuticals, Biotechnology & Life Sciences) | | | 2,782,048 | |
| | 14,400 | | | Bandai Namco Holdings, Inc. (Consumer Durables & Apparel) | | | 371,614 | |
| | 1,500 | | | BML, Inc. (Health Care Equipment & Services) | | | 68,704 | |
| | 4,100 | | | Central Japan Railway Co. (Transportation) | | | 729,241 | |
| | 90,600 | | | Chubu Electric Power Co., Inc. (Utilities) | | | 1,289,331 | |
| | 2,100 | | | cocokara fine, Inc. (Food & Staples Retailing) | | | 108,836 | |
| | 8,600 | | | COLOPL, Inc. (Software & Services) | | | 171,063 | |
| | 157,800 | | | Daiichi Sankyo Co. Ltd. (Pharmaceuticals, Biotechnology & Life Sciences) | | | 3,833,769 | |
| | 3,740 | | | Daito Pharmaceutical Co. Ltd. (Pharmaceuticals, Biotechnology & Life Sciences) | | | 102,734 | |
| | 22,600 | | | Daito Trust Construction Co. Ltd. (Real Estate) | | | 3,669,390 | |
| | 130,400 | | | Daiwa House Industry Co. Ltd. (Real Estate) | | | 3,829,458 | |
| | 64,000 | | | Daiwabo Holdings Co. Ltd. (Technology Hardware & Equipment) | | | 135,724 | |
| | 109,200 | | | DeNA Co. Ltd. (Software & Services) | | | 2,554,571 | |
| | 14,800 | | | Doshisha Co. Ltd. (Retailing) | | | 284,330 | |
| | 4,000 | | | Electric Power Development Co. Ltd. (Utilities) | | | 93,193 | |
| | 6,100 | | | EPS Holdings, Inc. (Pharmaceuticals, Biotechnology & Life Sciences) | | | 76,638 | |
| | 25,400 | | | Fancl Corp. (Household & Personal Products) | | | 351,941 | |
| | 24,000 | | | Fuji Heavy Industries Ltd. (Automobiles & Components) | | | 824,961 | |
| | 90,500 | | | FUJIFILM Holdings Corp. (Technology Hardware & Equipment) | | | 3,511,438 | |
| | 3,840 | | | Hiday Hidaka Corp. (Consumer Services) | | | 93,243 | |
| | 13,000 | | | Hisamitsu Pharmaceutical Co., Inc. (Pharmaceuticals, Biotechnology & Life Sciences) | | | 749,599 | |
| | 3,400 | | | Hoshizaki Electric Co. Ltd. (Capital Goods) | | | 332,840 | |
| | 52,000 | | | IHI Corp. (Capital Goods) | | | 140,166 | |
| | |
| | | | | | | | |
| | Common Stocks – (continued) | |
| | Japan – (continued) | |
| | 63,200 | | | IT Holdings Corp. (Software & Services) | | $ | 1,455,554 | |
| | 295,900 | | | ITOCHU Corp. (Capital Goods) | | | 3,619,808 | |
| | 39,600 | | | ITOCHU Techno-Solutions Corp. (Software & Services) | | | 853,113 | |
| | 61,900 | | | Japan Airlines Co. Ltd. (Transportation) | | | 1,991,485 | |
| | 73,400 | | | Kao Corp. (Household & Personal Products) | | | 4,274,974 | |
| | 108,400 | | | KDDI Corp. (Telecommunication Services) | | | 3,296,415 | |
| | 7,000 | | | Kinden Corp. (Capital Goods) | | | 75,774 | |
| | 89,000 | | | Kirin Holdings Co. Ltd. (Food, Beverage & Tobacco) | | | 1,501,089 | |
| | 8,100 | | | Koei Tecmo Holdings Co. Ltd. (Software & Services) | | | 149,268 | |
| | 5,300 | | | Komeri Co. Ltd. (Retailing) | | | 138,199 | |
| | 80,900 | | | Konami Holdings Corp. (Software & Services) | | | 3,086,322 | |
| | 15,000 | | | Konica Minolta, Inc. (Technology Hardware & Equipment) | | | 109,268 | |
| | 11,000 | | | Lion Corp. (Household & Personal Products) | | | 181,495 | |
| | 43,900 | | | Marvelous, Inc. (Software & Services)(a) | | | 360,554 | |
| | 12,000 | | | Matsumotokiyoshi Holdings Co. Ltd. (Food & Staples Retailing) | | | 586,650 | |
| | 13,900 | | | Micronics Japan Co. Ltd. (Semiconductors & Semiconductor Equipment)* | | | 123,718 | |
| | 27,700 | | | Miraca Holdings, Inc. (Health Care Equipment & Services) | | | 1,201,296 | |
| | 316,100 | | | Mitsubishi Chemical Holdings Corp. (Materials) | | | 1,448,999 | |
| | 35,700 | | | Mitsubishi Corp. (Capital Goods) | | | 628,582 | |
| | 92,500 | | | Mitsubishi Tanabe Pharma Corp. (Pharmaceuticals, Biotechnology & Life Sciences) | | | 1,671,307 | |
| | 1,073,700 | | | Mitsubishi UFJ Financial Group, Inc. (Banks) | | | 4,813,240 | |
| | 402,000 | | | Mitsui Engineering & Shipbuilding Co. Ltd. (Capital Goods) | | | 553,969 | |
| | 74,000 | | | Mitsui Fudosan Co. Ltd. (Real Estate) | | | 1,698,358 | |
| | 2,000 | | | Mochida Pharmaceutical Co. Ltd. (Pharmaceuticals, Biotechnology & Life Sciences) | | | 161,615 | |
| | 8,600 | | | Modec, Inc. (Energy) | | | 132,016 | |
| | 87,100 | | | MS&AD Insurance Group Holdings, Inc. (Insurance) | | | 2,256,772 | |
| | 12,200 | | | Mugen Estate Co. Ltd. (Real Estate)* | | | 116,686 | |
| | 40,500 | | | Nexon Co. Ltd. (Software & Services) | | | 599,402 | |
| | 24,000 | | | Nichirei Corp. (Food, Beverage & Tobacco) | | | 221,420 | |
| | 84,200 | | | Nippon Light Metal Holdings Co. Ltd. (Materials) | | | 186,973 | |
| | |
| | |
| 46 | | The accompanying notes are an integral part of these financial statements. |
GOLDMAN SACHS INTERNATIONAL TAX-MANAGED EQUITY FUND
| | | | | | | | |
Shares | | | Description | | Value | |
| | | | | | | | |
| | Common Stocks – (continued) | |
| | Japan – (continued) | |
| | 2,700 | | | Nippon Shokubai Co. Ltd. (Materials) | | $ | 155,294 | |
| | 54,900 | | | Nippon Telegraph & Telephone Corp. (Telecommunication Services) | | | 2,574,531 | |
| | 73,000 | | | Nipro Corp. (Health Care Equipment & Services) | | | 906,923 | |
| | 59,300 | | | Nisshin Steel Co. Ltd. (Materials) | | | 760,321 | |
| | 16,000 | | | Nittetsu Mining Co. Ltd. (Materials) | | | 51,857 | |
| | 13,100 | | | Noritz Corp. (Capital Goods) | | | 233,962 | |
| | 5,000 | | | NS Solutions Corp. (Software & Services) | | | 77,060 | |
| | 5,700 | | | NTT Data Corp. (Software & Services) | | | 269,202 | |
| | 104,500 | | | NTT DoCoMo, Inc. (Telecommunication Services) | | | 2,818,213 | |
| | 7,500 | | | Otsuka Holdings Co. Ltd. (Pharmaceuticals, Biotechnology & Life Sciences) | | | 345,622 | |
| | 27,100 | | | Pola Orbis Holdings, Inc. (Household & Personal Products) | | | 2,550,385 | |
| | 6,300 | | | Qol Co. Ltd. (Food & Staples Retailing)* | | | 82,936 | |
| | 6,000 | | | Riso Kagaku Corp. (Technology Hardware & Equipment) | | | 79,187 | |
| | 12,000 | | | Ryohin Keikaku Co. Ltd. (Retailing) | | | 2,924,371 | |
| | 23,600 | | | Sankyo Co. Ltd. (Consumer Durables & Apparel) | | | 884,836 | |
| | 37,500 | | | Santen Pharmaceutical Co. Ltd. (Pharmaceuticals, Biotechnology & Life Sciences) | | | 589,394 | |
| | 44,800 | | | Secom Co. Ltd. (Commercial & Professional Services) | | | 3,312,189 | |
| | 145,000 | | | Sekisui Chemical Co. Ltd. (Consumer Durables & Apparel) | | | 1,786,516 | |
| | 190,900 | | | Sekisui House Ltd. (Consumer Durables & Apparel) | | | 3,343,057 | |
| | 28,900 | | | Seven & I Holdings Co. Ltd. (Food & Staples Retailing) | | | 1,211,722 | |
| | 6,900 | | | Shibuya Corp. (Capital Goods) | | | 113,783 | |
| | 65,800 | | | Shionogi & Co. Ltd. (Pharmaceuticals, Biotechnology & Life Sciences) | | | 3,597,027 | |
| | 25,300 | | | Shiseido Co. Ltd. (Household & Personal Products) | | | 659,261 | |
| | 37,000 | | | SMK Corp. (Technology Hardware & Equipment) | | | 127,425 | |
| | 60,500 | | | SoftBank Group Corp. (Telecommunication Services) | | | 3,421,401 | |
| | 9,900 | | | Space Co. Ltd. (Commercial & Professional Services) | | | 114,721 | |
| | 29,800 | | | Square Enix Holdings Co. Ltd. (Software & Services) | | | 967,397 | |
| | 4,100 | | | St. Marc Holdings Co. Ltd. (Consumer Services) | | | 124,066 | |
| | 81,700 | | | Sumitomo Dainippon Pharma Co. Ltd. (Pharmaceuticals, Biotechnology & Life Sciences) | | | 1,416,092 | |
| | |
| | | | | | | | |
| | Common Stocks – (continued) | |
| | Japan – (continued) | |
| | 59,700 | | | Sumitomo Electric Industries Ltd. (Automobiles & Components) | | $ | 790,156 | |
| | 7,500 | | | Sumitomo Forestry Co. Ltd. (Consumer Durables & Apparel) | | | 101,791 | |
| | 6,700 | | | Sumitomo Mitsui Financial Group, Inc. (Banks) | | | 193,463 | |
| | 6,300 | | | Sysmex Corp. (Health Care Equipment & Services) | | | 433,808 | |
| | 8,800 | | | Systena Corp. (Software & Services) | | | 119,953 | |
| | 6,400 | | | Tanseisha Co. Ltd. (Commercial & Professional Services) | | | 47,495 | |
| | 449,000 | | | Teijin Ltd. (Materials) | | | 1,487,783 | |
| | 167,000 | | | Toho Zinc Co. Ltd. (Materials) | | | 508,418 | |
| | 19,900 | | | Tohoku Electric Power Co., Inc. (Utilities) | | | 251,148 | |
| | 46,000 | | | Tokyo Electron Ltd. (Semiconductors & Semiconductor Equipment) | | | 3,887,400 | |
| | 9,000 | | | Tokyo Tatemono Co. Ltd. (Real Estate) | | | 107,931 | |
| | 186,000 | | | Toppan Printing Co. Ltd. (Commercial & Professional Services) | | | 1,599,364 | |
| | 13,200 | | | Tosei Corp. (Real Estate) | | | 94,849 | |
| | 13,500 | | | Toyota Motor Corp. (Automobiles & Components) | | | 665,530 | |
| | 13,100 | | | Tsuruha Holdings, Inc. (Food & Staples Retailing) | | | 1,586,261 | |
| | 48,100 | | | West Japan Railway Co. (Transportation) | | | 3,048,256 | |
| | 267,700 | | | Yamada Denki Co. Ltd. (Retailing) | | | 1,413,141 | |
| | 5,900 | | | Yodogawa Steel Works Ltd. (Materials) | | | 143,887 | |
| | | | | | | | |
| | | | | | | 118,742,634 | |
| | |
| | Luxembourg – 0.5% | |
| | 43,245 | | | Aperam SA (Materials) | | | 1,513,795 | |
| | 2,493 | | | Eurofins Scientific SE (Pharmaceuticals, Biotechnology & Life Sciences) | | | 923,588 | |
| | | | | | | | |
| | | | | | | 2,437,383 | |
| | |
| | Mexico – 0.9% | |
| | 181,098 | | | Fresnillo PLC (Materials) | | | 3,988,049 | |
| | |
| | Netherlands – 3.9% | |
| | 36,352 | | | Aalberts Industries NV (Capital Goods) | | | 1,089,770 | |
| | 39,012 | | | Akzo Nobel NV (Materials) | | | 2,423,457 | |
| | 19,582 | | | AMG Advanced Metallurgical Group NV (Materials) | | | 267,104 | |
| | 3,767 | | | ASM International NV (Semiconductors & Semiconductor Equipment) | | | 145,400 | |
| | 53,002 | | | BE Semiconductor Industries NV (Semiconductors & Semiconductor Equipment) | | | 1,434,074 | |
| | 4,247 | | | Boskalis Westminster (Capital Goods) | | | 144,919 | |
| | |
| | |
| The accompanying notes are an integral part of these financial statements. | | 47 |
GOLDMAN SACHS INTERNATIONAL TAX-MANAGED EQUITY FUND
Schedule of Investments (continued)
June 30, 2016 (Unaudited)
| | | | | | | | |
Shares | | | Description | | Value | |
| | | | | | | | |
| | Common Stocks – (continued) | |
| | Netherlands – (continued) | |
| | 12,145 | | | Corbion NV (Materials) | | $ | 291,697 | |
| | 34,371 | | | Heineken Holding NV (Food, Beverage & Tobacco) | | | 2,784,795 | |
| | 27,138 | | | Heineken NV (Food, Beverage & Tobacco) | | | 2,489,147 | |
| | 127,308 | | | ING Groep NV CVA (Banks)(b) | | | 1,317,117 | |
| | 58,645 | | | Koninklijke Ahold NV (Food & Staples Retailing) | | | 1,295,033 | |
| | 28,812 | | | NSI NV (REIT) | | | 114,946 | |
| | 11,931 | | | NXP Semiconductors NV (Semiconductors & Semiconductor Equipment)*(b) | | | 934,675 | |
| | 1,565 | | | Sligro Food Group NV (Food & Staples Retailing) | | | 60,042 | |
| | 87,149 | | | Wolters Kluwer NV (Media) | | | 3,528,770 | |
| | | | | | | | |
| | | | | | | 18,320,946 | |
| | |
| | New Zealand – 0.6% | |
| | 105,296 | | | Auckland International Airport Ltd. (Transportation) | | | 489,825 | |
| | 144,409 | | | Fisher & Paykel Healthcare Corp. Ltd. (Health Care Equipment & Services) | | | 1,037,535 | |
| | 76,290 | | | Nuplex Industries Ltd. (Materials) | | | 286,484 | |
| | 157,069 | | | Z Energy Ltd. (Energy) | | | 908,699 | |
| | | | | | | | |
| | | | | | | 2,722,543 | |
| | |
| | Norway – 2.6% | |
| | 239,869 | | | DNB ASA (Banks) | | | 2,871,183 | |
| | 47,005 | | | Gjensidige Forsikring ASA (Insurance) | | | 783,144 | |
| | 56,481 | | | Kvaerner ASA (Energy)* | | | 51,807 | |
| | 4,535 | | | Leroy Seafood Group ASA (Food, Beverage & Tobacco) | | | 213,971 | |
| | 813,698 | | | Norsk Hydro ASA (Materials) | | | 2,978,811 | |
| | 334,352 | | | Orkla ASA (Food, Beverage & Tobacco) | | | 2,973,579 | |
| | 112,886 | | | Statoil ASA (Energy) | | | 1,950,496 | |
| | 5,650 | | | Tomra Systems ASA (Commercial & Professional Services) | | | 60,187 | |
| | | | | | | | |
| | | | | | | 11,883,178 | |
| | |
| | Portugal – 0.8% | |
| | 979,786 | | | EDP – Energias de Portugal SA (Utilities) | | | 2,999,685 | |
| | 38,327 | | | Galp Energia SGPS SA (Energy) | | | 533,065 | |
| | | | | | | | |
| | | | | | | 3,532,750 | |
| | |
| | Russia – 0.5% | |
| | 158,928 | | | Polymetal International PLC (Materials) | | | 2,227,166 | |
| | |
| | Singapore – 0.6% | |
| | 355,100 | | | CapitaLand Ltd. (Real Estate) | | | 815,302 | |
| | 75,000 | | | CapitaLand Retail China Trust (REIT) | | | 83,715 | |
| | 55,004 | | | DBS Group Holdings Ltd. (Banks) | | | 648,548 | |
| | |
| | | | | | | | |
| | Common Stocks – (continued) | |
| | Singapore – (continued) | |
| | 3,000 | | | Jardine Cycle & Carriage Ltd. (Retailing) | | $ | 82,068 | |
| | 145,100 | | | SATS Ltd. (Transportation) | | | 443,628 | |
| | 79,900 | | | Singapore Telecommunications Ltd. (Telecommunication Services) | | | 246,780 | |
| | 69,000 | | | UOL Group Ltd. (Real Estate) | | | 281,262 | |
| | 14,700 | | | Venture Corp. Ltd. (Technology Hardware & Equipment) | | | 90,447 | |
| | | | | | | | |
| | | | | | | 2,691,750 | |
| | |
| | South Africa – 0.5% | |
| | 131,988 | | | Mondi PLC (Materials) | | | 2,471,142 | |
| | 54,733 | | | Petra Diamonds Ltd. (Materials) | | | 84,471 | |
| | | | | | | | |
| | | | | | | 2,555,613 | |
| | |
| | Spain – 1.4% | |
| | 76,966 | | | ACS Actividades de Construccion y Servicios SA (Capital Goods) | | | 2,111,115 | |
| | 506,279 | | | Banco Santander SA (Banks) | | | 1,964,706 | |
| | 7,739 | | | Bankinter SA (Banks) | | | 49,956 | |
| | 11,314 | | | Gamesa Corp. Tecnologica SA (Capital Goods) | | | 225,421 | |
| | 93,447 | | | Iberdrola SA (Utilities) | | | 637,455 | |
| | 23,745 | | | Mediaset Espana Comunicacion SA (Media) | | | 268,048 | |
| | 13,784 | | | Papeles y Cartones de Europa SA (Materials) | | | 73,182 | |
| | 14,336 | | | Red Electrica Corp. SA (Utilities) | | | 1,280,975 | |
| | | | | | | | |
| | | | | | | 6,610,858 | |
| | |
| | Sweden – 2.7% | |
| | 25,717 | | | Axfood AB (Food & Staples Retailing) | | | 493,955 | |
| | 16,245 | | | Betsson AB (Consumer Services)* | | | 135,874 | |
| | 97,244 | | | Boliden AB (Materials) | | | 1,900,546 | |
| | 11,597 | | | Bure Equity AB (Diversified Financials) | | | 98,683 | |
| | 25,061 | | | Electrolux AB Series B (Consumer Durables & Apparel) | | | 683,284 | |
| | 8,055 | | | Fabege AB (Real Estate) | | | 136,997 | |
| | 38,304 | | | Fastighets AB Balder Class B (Real Estate)* | | | 970,674 | |
| | 32,058 | | | Granges AB (Materials) | | | 279,249 | |
| | 140,036 | | | Husqvarna AB Class B (Consumer Durables & Apparel) | | | 1,042,775 | |
| | 41,175 | | | Intrum Justitia AB (Commercial & Professional Services) | | | 1,291,354 | |
| | 93,287 | | | Klovern AB Class B (Real Estate) | | | 107,800 | |
| | 24,497 | | | Kungsleden AB (Real Estate) | | | 159,402 | |
| | 2,133 | | | Svenska Cellulosa AB SCA Class A (Household & Personal Products) | | | 68,480 | |
| | 45,630 | | | Svenska Cellulosa AB SCA Class B (Household & Personal Products) | | | 1,466,122 | |
| | 86,379 | | | Swedish Match AB (Food, Beverage & Tobacco) | | | 3,014,464 | |
| | |
| | |
| 48 | | The accompanying notes are an integral part of these financial statements. |
GOLDMAN SACHS INTERNATIONAL TAX-MANAGED EQUITY FUND
| | | | | | | | |
Shares | | | Description | | Value | |
| | | | | | | | |
| | Common Stocks – (continued) | |
| | Sweden – (continued) | |
| | 9,526 | | | Tethys Oil AB (Energy) | | $ | 72,310 | |
| | 8,097 | | | Vitrolife AB (Pharmaceuticals, Biotechnology & Life Sciences) | | | 448,499 | |
| | | | | | | | |
| | | | | | | 12,370,468 | |
| | |
| | Switzerland – 7.7% | |
| | 23,423 | | | Actelion Ltd. (Registered) (Pharmaceuticals, Biotechnology & Life Sciences)* | | | 3,944,377 | |
| | 1,906 | | | Autoneum Holding AG (Automobiles & Components) | | | 447,145 | |
| | 2,864 | | | Bachem Holding AG (Registered) Class B (Pharmaceuticals, Biotechnology & Life Sciences) | | | 232,141 | |
| | 745 | | | Banque Cantonale Vaudoise (Registered) (Banks) | | | 498,764 | |
| | 2,034 | | | Bobst Group SA (Registered) (Capital Goods) | | | 101,023 | |
| | 3,009 | | | dorma+kaba Holding AG (Registered) Class B (Commercial & Professional Services) | | | 2,102,137 | |
| | 3,524 | | | EMS-Chemie Holding AG (Registered) (Materials) | | | 1,819,469 | |
| | 5,030 | | | Flughafen Zuerich AG (Registered) (Transportation) | | | 890,164 | |
| | 428 | | | Forbo Holding AG (Registered) (Consumer Durables & Apparel)* | | | 508,314 | |
| | 692 | | | Geberit AG (Registered) (Capital Goods) | | | 262,103 | |
| | 1,884 | | | Georg Fischer AG (Registered) (Capital Goods) | | | 1,506,085 | |
| | 20,071 | | | Lonza Group AG (Registered) (Pharmaceuticals, Biotechnology & Life Sciences)* | | | 3,334,030 | |
| | 96 | | | Metall Zug AG (Registered) Class B (Consumer Durables & Apparel) | | | 273,991 | |
| | 9,857 | | | Nestle SA (Registered) (Food, Beverage & Tobacco) | | | 763,704 | |
| | 14,028 | | | Novartis AG (Registered) (Pharmaceuticals, Biotechnology & Life Sciences) | | | 1,157,851 | |
| | 854 | | | Orior AG (Food, Beverage & Tobacco)* | | | 57,633 | |
| | 4,081 | | | Partners Group Holding AG (Diversified Financials) | | | 1,748,976 | |
| | 2,000 | | | Rieter Holding AG (Registered) (Capital Goods)* | | | 409,394 | |
| | 39,616 | | | Roche Holding AG (Pharmaceuticals, Biotechnology & Life Sciences) | | | 10,453,863 | |
| | 167,037 | | | STMicroelectronics NV (Semiconductors & Semiconductor Equipment) | | | 980,945 | |
| | 41,515 | | | Swiss Re AG (Insurance) | | | 3,625,937 | |
| | 2,109 | | | Zurich Insurance Group AG (Insurance)* | | | 521,730 | |
| | | | | | | | |
| | | | | | | 35,639,776 | |
| | |
| | | | | | | | |
| | Common Stocks – (continued) | |
| | United Kingdom – 17.7% | |
| | 4,294 | | | Admiral Group PLC (Insurance) | | $ | 116,754 | |
| | 264,170 | | | Amec Foster Wheeler PLC (Energy) | | | 1,736,945 | |
| | 15,643 | | | AstraZeneca PLC (Pharmaceuticals, Biotechnology & Life Sciences) | | | 935,194 | |
| | 71,864 | | | AstraZeneca PLC ADR (Pharmaceuticals, Biotechnology & Life Sciences)(a) | | | 2,169,574 | |
| | 69,647 | | | BAE Systems PLC (Capital Goods) | | | 487,568 | |
| | 1,925 | | | Berkeley Group Holdings PLC (Consumer Durables & Apparel) | | | 65,003 | |
| | 218,190 | | | BP PLC ADR (Energy) | | | 7,747,927 | |
| | 123,477 | | | British American Tobacco PLC (Food, Beverage & Tobacco) | | | 8,004,896 | |
| | 27,422 | | | BT Group PLC (Telecommunication Services) | | | 150,728 | |
| | 162,290 | | | CNH Industrial NV (Capital Goods) | | | 1,177,196 | |
| | 18,475 | | | Derwent London PLC (REIT) | | | 644,548 | |
| | 15,032 | | | Diageo PLC (Food, Beverage & Tobacco) | | | 419,929 | |
| | 36,267 | | | Dialog Semiconductor PLC (Semiconductors & Semiconductor Equipment)* | | | 1,086,684 | |
| | 642,166 | | | Direct Line Insurance Group PLC (Insurance) | | | 2,968,832 | |
| | 16,809 | | | DS Smith PLC (Materials) | | | 86,965 | |
| | 78,621 | | | easyJet PLC (Transportation) | | | 1,142,490 | |
| | 98,069 | | | GlaxoSmithKline PLC ADR (Pharmaceuticals, Biotechnology & Life Sciences) | | | 4,250,310 | |
| | 37,709 | | | Greene King PLC (Consumer Services) | | | 392,697 | |
| | 57,804 | | | Hammerson PLC (REIT) | | | 416,338 | |
| | 186,562 | | | Henderson Group PLC (Diversified Financials) | | | 530,387 | |
| | 53,513 | | | Hill & Smith Holdings PLC (Materials) | | | 633,672 | |
| | 898,674 | | | HSBC Holdings PLC (Banks) | | | 5,567,783 | |
| | 78,307 | | | IG Group Holdings PLC (Diversified Financials) | | | 847,930 | |
| | 84,244 | | | Imperial Brands PLC (Food, Beverage & Tobacco) | | | 4,568,786 | |
| | 39,763 | | | Indivior PLC (Pharmaceuticals, Biotechnology & Life Sciences) | | | 133,795 | |
| | 102,044 | | | Informa PLC (Media) | | | 995,066 | |
| | 335,607 | | | Intu Properties PLC (REIT) | | | 1,304,770 | |
| | 113,351 | | | ITV PLC (Media) | | | 271,779 | |
| | 15,909 | | | JD Sports Fashion PLC (Retailing) | | | 245,276 | |
| | 43,411 | | | John Wood Group PLC (Energy) | | | 399,605 | |
| | 48,327 | | | Land Securities Group PLC (REIT) | | | 672,494 | |
| | 3,366,170 | | | Lloyds Banking Group PLC (Banks) | | | 2,438,085 | |
| | 62,439 | | | Meggitt PLC (Capital Goods) | | | 339,383 | |
| | 337,165 | | | National Grid PLC (Utilities) | | | 4,958,122 | |
| | 9,667 | | | Next PLC (Retailing) | | | 638,756 | |
| | 162,528 | | | Pantheon Resources PLC (Energy)*(a) | | | 314,812 | |
| | 200,916 | | | Prudential PLC (Insurance) | | | 3,409,325 | |
| | |
| | |
| The accompanying notes are an integral part of these financial statements. | | 49 |
GOLDMAN SACHS INTERNATIONAL TAX-MANAGED EQUITY FUND
Schedule of Investments (continued)
June 30, 2016 (Unaudited)
| | | | | | | | |
Shares | | | Description | | Value | |
| | | | | | | | |
| | Common Stocks – (continued) | |
| | United Kingdom – (continued) | |
| | 52,390 | | | Reckitt Benckiser Group PLC (Household & Personal Products) | | $ | 5,253,232 | |
| | 100,923 | | | RELX NV (Media) | | | 1,746,032 | |
| | 40,445 | | | Rentokil Initial PLC (Commercial & Professional Services) | | | 104,446 | |
| | 8,695 | | | Rio Tinto PLC (Materials) | | | 270,124 | |
| | 15,360 | | | Rio Tinto PLC ADR (Materials)(a) | | | 480,768 | |
| | 22,655 | | | Safestore Holdings PLC (REIT) | | | 111,929 | |
| | 160,714 | | | Soco International PLC (Energy) | | | 305,701 | |
| | 313,285 | | | Subsea 7 SA (Energy)*(a) | | | 3,079,432 | |
| | 60,608 | | | Tate & Lyle PLC (Food, Beverage & Tobacco) | | | 541,894 | |
| | 36,085 | | | Unilever PLC (Household & Personal Products) | | | 1,729,018 | |
| | 16,500 | | | Unilever PLC ADR (Household & Personal Products) | | | 790,515 | |
| | 47,010 | | | Vodafone Group PLC ADR (Telecommunication Services) | | | 1,452,139 | |
| | 180,918 | | | WPP PLC (Media) | | | 3,770,586 | |
| | | | | | | | |
| | | | | | | 81,906,220 | |
| | |
| | TOTAL COMMON STOCKS | | | | |
| | (Cost $390,681,971) | | $ | 456,939,176 | |
| | |
| | | | | | | | | | |
Shares | | Description | | Rate | | | Value | |
| Preferred Stocks – 0.5% | |
| Germany – 0.5% | |
| 14,255 | | Henkel AG & Co.
KGaA (Household &
Personal Products) | | | 1.470 | % | | $ | 1,742,112 | |
| 4,614 | | Sixt SE
(Transportation) | | | 0.600 | | | | 182,074 | |
| |
| TOTAL PREFERRED STOCKS | | | | | |
| (Cost $1,212,181) | | | $ | 1,924,186 | |
| |
| | | | | | | | |
Units | | | Description | | Value | |
| | Right* – 0.0% | |
| | Spain – 0.0% | |
| | 74,218 | | | ACS Actividades de Construccion y Servicios SA (Capital Goods) | | $ | 52,136 | |
| | (Cost $52,650) | | | | |
| | |
| TOTAL INVESTMENTS BEFORE SECURITIES
LENDING REINVESTMENT VEHICLE |
|
| | (Cost $391,946,802) | | $ | 458,915,498 | |
| | |
| | | | | | | | |
| Shares | | | Distribution
Rate | | Value | |
| | Securities Lending Reinvestment Vehicle(d)(e) – 1.6% | |
| Goldman Sachs Financial Square Money Market Fund –
FST Institutional Shares |
|
| | 7,569,180 | | | 0.397% | | $ | 7,569,180 | |
| | (Cost $7,569,180) | | | | |
| | |
| | TOTAL INVESTMENTS – 100.7% | | | | |
| | (Cost $399,515,982) | | $ | 466,484,678 | |
| | |
| LIABILITIES IN EXCESS OF
OTHER ASSETS – (0.7)% | | | (3,118,815 | ) |
| | |
| | NET ASSETS – 100.0% | | $ | 463,365,863 | |
| | |
| | |
| The percentage shown for each investment category reflects the value of investments in that category as a percentage of net assets. |
* | | Non-income producing security. |
(a) | | All or a portion of security is on loan. |
(b) | | All or a portion of security is segregated as collateral for initial margin requirements on futures transactions. |
(c) | | Exempt from registration under Rule 144A of the Securities Act of 1933. Under procedures approved by the Board of Trustees, such securities may be deemed liquid by the Investment Adviser and may be resold, normally to qualified institutional buyers in transactions exempt from registration. Total market value of Rule 144A securities amounts to $76,613, which represents approximately 0.0% of net assets as of June 30, 2016. |
(d) | | Represents an affiliated issuer. |
(e) | | Variable rate security. Interest rate or distribution rate disclosed is that which is in effect on June 30, 2016. |
| | |
|
Investment Abbreviations: |
ADR | | —American Depositary Receipt |
CVA | | —Dutch Certification |
REIT | | —Real Estate Investment Trust |
|
| | |
| 50 | | The accompanying notes are an integral part of these financial statements. |
GOLDMAN SACHS INTERNATIONAL TAX-MANAGED EQUITY FUND
|
| ADDITIONAL INVESTMENT INFORMATION |
FUTURES CONTRACTS — At June 30, 2016, the Fund had the following futures contracts:
| | | | | | | | | | | | | | |
| Type | | Number of
Contracts
Long (Short) | | | Expiration
Date | | Current
Value | | | Unrealized
Gain (Loss) | |
EURO STOXX 50 Index | | | (92 | ) | | September 2016 | | $ | (2,914,869 | ) | | $ | (71,490 | ) |
FTSE 100 Index | | | (16 | ) | | September 2016 | | | (1,367,992 | ) | | | (55,090 | ) |
Hang Seng Index | | | (1 | ) | | July 2016 | | | (135,001 | ) | | | (4,569 | ) |
MSCI Singapore Index | | | (4 | ) | | July 2016 | | | (94,217 | ) | | | (2,879 | ) |
SPI 200 Index | | | (6 | ) | | September 2016 | | | (579,039 | ) | | | (10,685 | ) |
TSE TOPIX Index | | | (11 | ) | | September 2016 | | | (1,326,732 | ) | | | (14,911 | ) |
| TOTAL | | | | | | | | | | | | $ | (159,624 | ) |
| | |
| The accompanying notes are an integral part of these financial statements. | | 51 |
GOLDMAN SACHS TAX-ADVANTAGED EQUITY FUNDS
Statements of Assets and Liabilities
| | | | | | | | | | | | | | | | | | |
| | | | | U.S. Equity
Dividend and
Premium Fund | | | International Equity
Dividend and
Premium Fund | | | U.S. Tax-Managed
Equity Fund | | | International
Tax-Managed
Equity Fund | |
| | Assets: | |
| | Investments in unaffiliated issuers, at value (cost $1,636,754,141, $361,093,287, $816,659,521 and $391,946,802)(a) | | $ | 1,851,517,591 | | | $ | 294,674,347 | | | $ | 1,055,736,506 | | | $ | 458,915,498 | |
| | Investments in affiliated issuer, at value (cost $106,958,518, $0, $0 and $0) | | | 106,958,518 | | | | — | | | | — | | | | — | |
| | Investments in affiliated securities lending reinvestment vehicle, at value which equals cost | | | 13,703,790 | | | | 3,101,464 | | | | 7,374,800 | | | | 7,569,180 | |
| | Cash | | | 14,179,589 | | | | 1,019,758 | | | | 625,275 | | | | 1,313,076 | |
| | Foreign currencies, at value (cost $0, $10,618,829, $0 and $453,451) | | | — | | | | 10,616,046 | | | | — | | | | 452,863 | |
| | Receivables: | | | — | | | | — | | | | — | | | | — | |
| | Fund shares sold | | | 7,660,477 | | | | 3,970,909 | | | | 7,269,378 | | | | 11,483,334 | |
| | Investments sold | | | 4,594,590 | | | | — | | | | 92,880,959 | | | | 55,910,372 | |
| | Dividends | | | 2,422,662 | | | | 1,034,433 | | | | 1,003,729 | | | | 500,722 | |
| | Securities lending income | | | 17,504 | | | | 5,230 | | | | 13,063 | | | | 31,098 | |
| | Reimbursement from investment adviser | | | 17,388 | | | | 2,293 | | | | — | | | | — | |
| | Foreign tax reclaims | | | — | | | | 1,471,491 | | | | — | | | | 617,112 | |
| | Variation margin on certain derivative contracts | | | 1,318,593 | | | | 98,021 | | | | 91,719 | | | | — | |
| | Total assets | | | 2,002,390,702 | | | | 315,993,992 | | | | 1,164,995,429 | | | | 536,793,255 | |
| | | | | | | | | | | | | | | | | | |
| | Liabilities: | | | | | | | | | | | | | | | | |
| | Written options, at value (premiums received $13,517,662, $3,045,475, $0 and $0) | | | 11,248,700 | | | | 2,695,330 | | | | — | | | | — | |
| | Variation margin on certain derivative contracts | | | — | | | | — | | | | — | | | | 156,413 | |
| | Payables: | | | | | | | | | | | | | | | | |
| | Payable upon return of securities loaned | | | 13,703,790 | | | | 3,101,464 | | | | 7,374,800 | | | | 7,569,180 | |
| | Fund shares redeemed | | | 3,061,202 | | | | 2,111,335 | | | | 1,793,121 | | | | 21,047,651 | |
| | Management fees | | | 1,115,732 | | | | 204,098 | | | | 604,142 | | | | 333,475 | |
| | Investments purchased | | | 840,814 | | | | — | | | | 90,111,157 | | | | 44,237,304 | |
| | Distribution and Service fees and Transfer Agency fees | | | 244,699 | | | | 15,743 | | | | 72,650 | | | | 17,940 | |
| | Accrued expenses and other liabilities | | | 96,291 | | | | 103,377 | | | | 179,450 | | | | 65,429 | |
| | Total liabilities | | | 30,311,228 | | | | 8,231,347 | | | | 100,135,320 | | | | 73,427,392 | |
| | | | | | | | | | | | | | | | | | |
| | Net Assets: | | | | | | | | | | | | | | | | |
| | Paid-in capital | | | 1,715,617,518 | | | | 391,185,405 | | | | 866,360,345 | | | | 493,532,280 | |
| | Undistributed net investment income | | | 1,296,486 | | | | 115,793 | | | | 7,001,547 | | | | 7,098,490 | |
| | Accumulated net realized gain (loss) | | | 35,395,780 | | | | (17,477,653 | ) | | | (47,650,543 | ) | | | (104,062,447 | ) |
| | Net unrealized gain (loss) | | | 219,769,690 | | | | (66,060,900 | ) | | | 239,148,760 | | | | 66,797,540 | |
| | | NET ASSETS | | $ | 1,972,079,474 | | | $ | 307,762,645 | | | $ | 1,064,860,109 | | | $ | 463,365,863 | |
| | | Net Assets: | | | | | | | | | | | | | | | | |
| | | Class A | | $ | 217,183,638 | | | $ | 8,838,759 | | | $ | 50,204,060 | | | $ | 4,011,954 | |
| | | Class C | | | 109,272,254 | | | | 2,622,109 | | | | 20,891,967 | | | | 947,661 | |
| | | Institutional | | | 1,542,152,544 | | | | 294,504,829 | | | | 982,137,361 | | | | 457,176,673 | |
| | | Service | | | — | | | | — | | | | 1,199,027 | | | | — | |
| | | Class IR | | | 103,471,038 | | | | 1,796,948 | | | | 10,427,694 | | | | 1,229,575 | |
| | | Total Net Assets | | $ | 1,972,079,474 | | | $ | 307,762,645 | | | $ | 1,064,860,109 | | | $ | 463,365,863 | |
| | | Shares outstanding $0.001 par value (unlimited shares authorized): | | | | | | | | | | | | | |
| | | Class A | | | 18,331,362 | | | | 1,408,386 | | | | 2,908,813 | | | | 474,214 | |
| | | Class C | | | 9,249,231 | | | | 431,781 | | | | 1,273,629 | | | | 115,442 | |
| | | Institutional | | | 130,460,455 | | | | 47,680,371 | | | | 55,964,583 | | | | 54,457,535 | |
| | | Service | | | — | | | | — | | | | 69,279 | | | | — | |
| | | Class IR | | | 8,743,754 | | | | 291,633 | | | | 594,443 | | | | 145,525 | |
| | | Net asset value, offering and redemption price per share:(b) | | | | | | | | | | | | | | | | |
| | | Class A | | | $11.85 | | | | $6.28 | | | | $17.26 | | | | $8.46 | |
| | | Class C | | | 11.81 | | | | 6.07 | | | | 16.40 | | | | 8.21 | |
| | | Institutional | | | 11.82 | | | | 6.18 | | | | 17.55 | | | | 8.40 | |
| | | Service | | | — | | | | — | | | | 17.31 | | | | — | |
| | | Class IR | | | 11.83 | | | | 6.16 | | | | 17.54 | | | | 8.45 | |
| (a) | | Includes loaned securities having a market value of $13,451,548, $3,006,548, $7,479,224 and $7,308,736 for the U.S. Equity Dividend and Premium, International Equity Dividend and Premium, U.S. Tax-Managed Equity and International Tax-Managed Equity Funds, respectively. |
| (b) | | Maximum public offering price per share for Class A Shares of the U.S. Equity Dividend & Premium, International Equity Dividend and Premium, U.S. Tax-Managed Equity and International Tax-Managed Equity Funds is $12.54, $6.65, $18.26 and $8.95, respectively. At redemption, Class C Shares may be subject to a contingent deferred sales charge assessed on the amount equal to the lesser of the current NAV or the original purchase price of the shares. |
| | |
| 52 | | The accompanying notes are an integral part of these financial statements. |
GOLDMAN SACHS TAX-ADVANTAGED EQUITY FUNDS
Statements of Operations
For the Six Months Ended June 30, 2016 (Unaudited)
| | | | | | | | | | | | | | | | | | |
| | | | | U.S. Equity
Dividend and
Premium Fund | | | International Equity
Dividend and
Premium Fund | | | U.S. Tax-Managed
Equity Fund | | | International
Tax-Managed
Equity Fund | |
| | Investment income: | |
| | Dividends (net of foreign taxes withheld of $30,665, $774,328, $347 and $1,025,939) | | $ | 25,211,482 | | | $ | 7,982,040 | | | $ | 10,039,526 | | | $ | 9,142,191 | |
| | Dividends — affiliated issuer | | | 83,917 | | | | — | | | | — | | | | — | |
| | Securities lending income — affiliated issuer | | | 26,836 | | | | 19,060 | | | | 146,102 | | | | 234,142 | |
| | Total investment income | | | 25,322,235 | | | | 8,001,100 | | | | 10,185,628 | | | | 9,376,333 | |
| | | | | | | | | | | | | | | | | | |
| | Expenses: | |
| | Management fees | | | 6,156,598 | | | | 1,195,239 | | | | 3,562,119 | | | | 1,922,788 | |
| | Distribution and Service fees(a) | | | 719,908 | | | | 25,809 | | | | 165,821 | | | | 8,747 | |
| | Transfer Agency fees(a) | | | 613,492 | | | | 68,772 | | | | 264,015 | | | | 94,649 | |
| | Registration fees | | | 67,282 | | | | 27,710 | | | | 39,481 | | | | 28,146 | |
| | Custody, accounting and administrative services | | | 55,842 | | | | 89,155 | | | | 32,926 | | | | 86,374 | |
| | Professional fees | | | 41,491 | | | | 54,163 | | | | 38,551 | | | | 43,376 | |
| | Printing and mailing costs | | | 38,488 | | | | 13,439 | | | | 17,428 | | | | 11,701 | |
| | Trustee fees | | | 14,331 | | | | 12,826 | | | | 13,648 | | | | 12,576 | |
| | Service share fees — Service Plan | | | — | | | | — | | | | 1,448 | | | | — | |
| | Service share fees — Shareholder Administration Plan | | | — | | | | — | | | | 1,448 | | | | — | |
| | Other | | | 17,568 | | | | 5,821 | | | | 12,713 | | | | 7,192 | |
| | Total expenses | | | 7,725,000 | | | | 1,492,934 | | | | 4,149,598 | | | | 2,215,549 | |
| | Less — expense reductions | | | (171,267 | ) | | | (20,977 | ) | | | (4,495 | ) | | | (2,349 | ) |
| | Net expenses | | | 7,553,733 | | | | 1,471,957 | | | | 4,145,103 | | | | 2,213,200 | |
| | NET INVESTMENT INCOME | | | 17,768,502 | | | | 6,529,143 | | | | 6,040,525 | | | | 7,163,133 | |
| | | | | | | | | | | | | | | | | | |
| | Realized and unrealized gain (loss): | |
| | Net realized gain (loss) from: | | | | | | | | | | | | | | | | |
| | Investments | | | 18,823,406 | | | | (19,553,186 | ) | | | 4,323,535 | | | | (13,494,725 | ) |
| | Futures contracts | | | 1,871,535 | | | | 266,374 | | | | 379,391 | | | | (13,337 | ) |
| | Foreign currency transactions | | | — | | | | 577,430 | | | | — | | | | 197,790 | |
| | Written options | | | 2,630,092 | | | | 5,382,165 | | | | — | | | | — | |
| | Net change in unrealized gain (loss) on: | | | | | | | | | | | | | | | | |
| | Investments | | | 51,679,396 | | | | 278,835 | | | | (7,371,143 | ) | | | (1,967,460 | ) |
| | Futures contracts | | | 2,771,991 | | | | 108,199 | | | | 78,941 | | | | (273,913 | ) |
| | Foreign currency translation | | | — | | | | 33,261 | | | | — | | | | 15,732 | |
| | Written options | | | 2,268,010 | | | | 63,148 | | | | — | | | | — | |
| | Net realized and unrealized gain (loss) | | | 80,044,430 | | | | (12,843,774 | ) | | | (2,589,276 | ) | | | (15,535,913 | ) |
| | NET INCREASE (DECREASE) IN NET ASSETS RESULTING FROM OPERATIONS | | $ | 97,812,932 | | | $ | (6,314,631 | ) | | $ | 3,451,249 | | | $ | (8,372,780 | ) |
| | (a) | | Class specific Distribution and Service, and Transfer Agency fees were as follows: |
| | | | | | | | | | | | | | | | | | | | | | | | | | | | |
| | | Distribution and Service Fees | | | Transfer Agency Fees | |
Fund | | Class A | | | Class C | | | Class A | | | Class C | | | Institutional | | | Service | | | Class IR | |
U.S. Equity Dividend and Premium | | $ | 249,428 | | | $ | 470,480 | | | $ | 189,567 | | | $ | 89,392 | | | $ | 269,195 | | | $ | — | | | $ | 65,338 | |
International Equity Dividend and Premium | | | 11,228 | | | | 14,581 | | | | 8,534 | | | | 2,770 | | | | 56,425 | | | | — | | | | 1,043 | |
U.S. Tax-Managed Equity | | | 64,317 | | | | 101,504 | | | | 48,882 | | | | 19,286 | | | | 188,138 | | | | 232 | | | | 7,477 | |
International Tax-Managed Equity | | | 4,487 | | | | 4,260 | | | | 3,410 | | | | 810 | | | | 89,374 | | | | — | | | | 1,055 | |
| | |
| The accompanying notes are an integral part of these financial statements. | | 53 |
GOLDMAN SACHS TAX-ADVANTAGED EQUITY FUNDS
Statements of Changes in Net Assets
| | | | | | | | | | |
| | | | | U.S. Equity Dividend and Premium Fund | |
| | | | | For the
Six Months Ended
June 30, 2016
(Unaudited) | | | For the Fiscal
Year Ended
December 31, 2015 | |
| | From operations: | |
| | Net investment income | | $ | 17,768,502 | | | $ | 30,436,136 | |
| | Net realized gain (loss) | | | 23,325,033 | | | | 64,323,573 | |
| | Net change in unrealized gain (loss) | | | 56,719,397 | | | | (60,263,481 | ) |
| | Net increase (decrease) in net assets resulting from operations | | | 97,812,932 | | | | 34,496,228 | |
| | | | | | | | | | |
| | Distributions to shareholders: | | | | | | | | |
| | From net investment income | | | | | | | | |
| | Class A Shares | | | (1,732,588 | ) | | | (2,983,321 | ) |
| | Class C Shares | | | (516,762 | ) | | | (762,284 | ) |
| | Institutional Shares | | | (14,635,426 | ) | | | (24,952,520 | ) |
| | Service Shares | | | — | | | | — | |
| | Class IR Shares | | | (788,312 | ) | | | (884,725 | ) |
| | From net realized gains | | | | | | | | |
| | Class A Shares | | | — | | | | (7,493,842 | ) |
| | Class C Shares | | | — | | | | (3,387,824 | ) |
| | Institutional Shares | | | — | | | | (49,625,833 | ) |
| | Class IR Shares | | | — | | | | (2,043,525 | ) |
| | Total distributions to shareholders | | | (17,673,088 | ) | | | (92,133,874 | ) |
| | | | | | | | | | |
| | From share transactions: | | | | | | | | |
| | Proceeds from sales of shares | | | 460,172,395 | | | | 434,055,698 | |
| | Reinvestment of distributions | | | 15,639,834 | | | | 81,914,708 | |
| | Cost of shares redeemed | | | (185,282,753 | ) | | | (293,200,186 | ) |
| | Net increase (decrease) in net assets resulting from share transactions | | | 290,529,476 | | | | 222,770,220 | |
| | TOTAL INCREASE (DECREASE) | | | 370,669,320 | | | | 165,132,574 | |
| | | | | | | | | | |
| | Net assets: | | | | | | | | |
| | Beginning of period | | | 1,601,410,154 | | | | 1,436,277,580 | |
| | End of period | | $ | 1,972,079,474 | | | $ | 1,601,410,154 | |
| | Undistributed (distributions in excess of) net investment income | | $ | 1,296,486 | | | $ | 1,201,072 | |
| | |
| 54 | | The accompanying notes are an integral part of these financial statements. |
GOLDMAN SACHS TAX-ADVANTAGED EQUITY FUNDS
| | | | | | | | | | | | | | | | | | | | | | | | | | | | | | | | | | |
| | | International Equity Dividend and Premium Fund | | | | | U.S. Tax-Managed Equity Fund | | | | | International Tax-Managed Equity Fund | |
| | | For the
Six Months Ended
June 30, 2016
(Unaudited) | | | | | For the Fiscal
Year Ended
December 31, 2015 | | | | | For the
Six Months Ended
June 30, 2016
(Unaudited) | | | | | For the Fiscal
Year Ended
December 31, 2015 | | | | | For the
Six Months Ended
June 30, 2016
(Unaudited) | | | | | For the Fiscal
Year Ended
December 31, 2015 | |
| | | | | | | | | | | | | | | | | | | | | | | | | | | | | | | | | | |
| | $ | 6,529,143 | | | | | $ | 9,829,754 | | | | | $ | 6,040,525 | | | | | $ | 10,734,060 | | | | | $ | 7,163,133 | | | | | $ | 6,812,822 | |
| | | (13,327,217 | ) | | | | | 7,029,169 | | | | | | 4,702,926 | | | | | | (48,095,820 | ) | | | | | (13,310,272 | ) | | | | | (29,777,509 | ) |
| | | 483,443 | | | | | | (31,882,934 | ) | | | | | (7,292,202 | ) | | | | | 31,164,973 | | | | | | (2,225,641 | ) | | | | | 34,448,855 | |
| | | (6,314,631 | ) | | | | | (15,024,011 | ) | | | | | 3,451,249 | | | | | | (6,196,787 | ) | | | | | (8,372,780 | ) | | | | | 11,484,168 | |
| | | | | | | | | | | | | | | | | | | | | | | | | | | | | | | | | | |
| | | | | | | | | | | | | | | | | | | | | | | | | | | | | | | | | | |
| | | | | | | | | | | | | | | | | | | | | | | | | | | | | | | | | | |
| | | (167,141 | ) | | | | | (187,384 | ) | | | | | — | | | | | | (368,040 | ) | | | | | — | | | | | | — | |
| | | (42,488 | ) | | | | | (44,943 | ) | | | | | — | | | | | | (19,448 | ) | | | | | — | | | | | | (7,200 | ) |
| | | (6,077,608 | ) | | | | | (7,913,955 | ) | | | | | — | | | | | | (9,925,748 | ) | | | | | — | | | | | | (6,266,165 | ) |
| | | — | | | | | | — | | | | | | — | | | | | | (9,114 | ) | | | | | — | | | | | | — | |
| | | (32,618 | ) | | | | | (14,810 | ) | | | | | — | | | | | | (59,966 | ) | | | | | — | | | | | | (20,104 | ) |
| | | | | | | | | | | | | | | | | | | | | | | | | | | | | | | | | | |
| | | — | | | | | | (152,285 | ) | | | | | — | | | | | | — | | | | | | — | | | | | | — | |
| | | — | | | | | | (52,312 | ) | | | | | — | | | | | | — | | | | | | — | | | | | | — | |
| | | — | | | | | | (5,346,252 | ) | | | | | — | | | | | | — | | | | | | — | | | | | | — | |
| | | — | | | | | | (12,537 | ) | | | | | — | | | | | | — | | | | | | — | | | | | | — | |
| | | (6,319,855 | ) | | | | | (13,724,478 | ) | | | | | — | | | | | | (10,382,316 | ) | | | | | — | | | | | | (6,331,497 | ) |
| | | | | | | | | | | | | | | | | | | | | | | | | | | | | | | | | | |
| | | | | | | | | | | | | | | | | | | | | | | | | | | | | | | | | | |
| | | 53,974,064 | | | | | | 104,320,071 | | | | | | 103,772,776 | | | | | | 389,850,321 | | | | | | 97,675,287 | | | | | | 179,753,113 | |
| | | 6,259,650 | | | | | | 13,554,512 | | | | | | — | | | | | | 10,087,140 | | | | | | — | | | | | | 6,331,416 | |
| | | (34,650,780 | ) | | | | | (223,876,777 | ) | | | | | (87,778,429 | ) | | | | | (144,600,334 | ) | | | | | (57,768,948 | ) | | | | | (78,004,097 | ) |
| | | 25,582,934 | | | | | | (106,002,194 | ) | | | | | 15,994,347 | | | | | | 255,337,127 | | | | | | 39,906,339 | | | | | | 108,080,432 | |
| | | 12,948,448 | | | | | | (134,750,683 | ) | | | | | 19,445,596 | | | | | | 238,758,024 | | | | | | 31,533,559 | | | | | | 113,233,103 | |
| | | | | | | | | | | | | | | | | | | | | | | | | | | | | | | | | | |
| | | | | | | | | | | | | | | | | | | | | | | | | | | | | | | | | | |
| | | 294,814,197 | | | | | | 429,564,880 | | | | | | 1,045,414,513 | | | | | | 806,656,489 | | | | | | 431,832,304 | | | | | | 318,599,201 | |
| | $ | 307,762,645 | | | | | $ | 294,814,197 | | | | | $ | 1,064,860,109 | | | | | $ | 1,045,414,513 | | | | | $ | 463,365,863 | | | | | $ | 431,832,304 | |
| | $ | 115,793 | | | | | $ | (93,495 | ) | | | | $ | 7,001,547 | | | | | $ | 961,022 | | | | | $ | 7,098,490 | | | | | $ | (64,643 | ) |
| | |
| The accompanying notes are an integral part of these financial statements. | | 55 |
GOLDMAN SACHS U.S. EQUITY DIVIDEND AND PREMIUM FUND
Financial Highlights
Selected Data for a Share Outstanding Throughout Each Period
| | | | | | | | | | | | | | | | | | | | | | | | | | | | | | |
| | | | | | | | Income from
investment operations | | | Distributions
to shareholders | |
| | | Year - Share Class | | Net asset
value,
beginning
of period | | | Net
investment
income(a) | | | Net realized
and unrealized
gain | | | Total from
investment
operations | | | From net
investment
income | | | From net
realized
gains | | | Total
distributions | |
| | FOR THE SIX MONTHS ENDED JUNE 30, (UNAUDITED) | |
| | 2016 - A | | $ | 11.34 | | | $ | 0.10 | | | $ | 0.51 | | | $ | 0.61 | | | $ | (0.10 | ) | | $ | — | | | $ | (0.10 | ) |
| | 2016 - C | | | 11.31 | | | | 0.06 | | | | 0.50 | | | | 0.56 | | | | (0.06 | ) | | | — | | | | (0.06 | ) |
| | 2016 - Institutional | | | 11.31 | | | | 0.12 | | | | 0.51 | | | | 0.63 | | | | (0.12 | ) | | | — | | | | (0.12 | ) |
| | 2016 - IR | | | 11.33 | | | | 0.12 | | | | 0.49 | | | | 0.61 | | | | (0.11 | ) | | | — | | | | (0.11 | ) |
| | | | | | | | | | | | | | | | | | | | | | | | | | | | | | |
| | FOR THE FISCAL YEARS ENDED DECEMBER 31, | |
| | 2015 - A | | | 11.76 | | | | 0.21 | | | | 0.04 | | | | 0.25 | | | | (0.20 | ) | | | (0.47 | ) | | | (0.67 | ) |
| | 2015 - C | | | 11.74 | | | | 0.12 | | | | 0.03 | | | | 0.15 | | | | (0.11 | ) | | | (0.47 | ) | | | (0.58 | ) |
| | 2015 - Institutional | | | 11.73 | | | | 0.25 | | | | 0.04 | | | | 0.29 | | | | (0.24 | ) | | | (0.47 | ) | | | (0.71 | ) |
| | 2015 - IR | | | 11.75 | | | | 0.24 | | | | 0.04 | | | | 0.28 | | | | (0.23 | ) | | | (0.47 | ) | | | (0.70 | ) |
| | 2014 - A | | | 11.26 | | | | 0.23 | | | | 0.95 | | | | 1.18 | | | | (0.22 | ) | | | (0.46 | ) | | | (0.68 | ) |
| | 2014 - C | | | 11.24 | | | | 0.14 | | | | 0.96 | | | | 1.10 | | | | (0.14 | ) | | | (0.46 | ) | | | (0.60 | ) |
| | 2014 - Institutional | | | 11.24 | | | | 0.27 | | | | 0.95 | | | | 1.22 | | | | (0.27 | ) | | | (0.46 | ) | | | (0.73 | ) |
| | 2014 - IR | | | 11.25 | | | | 0.26 | | | | 0.95 | | | | 1.21 | | | | (0.25 | ) | | | (0.46 | ) | | | (0.71 | ) |
| | 2013 - A | | | 9.60 | | | | 0.20 | | | | 2.12 | | | | 2.32 | | | | (0.20 | ) | | | (0.46 | ) | | | (0.66 | ) |
| | 2013 - C | | | 9.59 | | | | 0.13 | | | | 2.11 | | | | 2.24 | | | | (0.13 | ) | | | (0.46 | ) | | | (0.59 | ) |
| | 2013 - Institutional | | | 9.58 | | | | 0.25 | | | | 2.12 | | | | 2.37 | | | | (0.25 | ) | | | (0.46 | ) | | | (0.71 | ) |
| | 2013 - IR | | | 9.59 | | | | 0.23 | | | | 2.12 | | | | 2.35 | | | | (0.23 | ) | | | (0.46 | ) | | | (0.69 | ) |
| | 2012 - A | | | 9.39 | | | | 0.25 | | | | 0.71 | | | | 0.96 | | | | (0.24 | ) | | | (0.51 | ) | | | (0.75 | ) |
| | 2012 - C | | | 9.38 | | | | 0.18 | | | | 0.71 | | | | 0.89 | | | | (0.17 | ) | | | (0.51 | ) | | | (0.68 | ) |
| | 2012 - Institutional | | | 9.37 | | | | 0.28 | | | | 0.72 | | | | 1.00 | | | | (0.28 | ) | | | (0.51 | ) | | | (0.79 | ) |
| | 2012 - IR | | | 9.38 | | | | 0.29 | | | | 0.70 | | | | 0.99 | | | | (0.27 | ) | | | (0.51 | ) | | | (0.78 | ) |
| | 2011 - A | | | 9.38 | | | | 0.18 | (e) | | | 0.27 | | | | 0.45 | | | | (0.19 | ) | | | (0.25 | ) | | | (0.44 | ) |
| | 2011 - C | | | 9.38 | | | | 0.11 | (e) | | | 0.27 | | | | 0.38 | | | | (0.13 | ) | | | (0.25 | ) | | | (0.38 | ) |
| | 2011 - Institutional | | | 9.36 | | | | 0.22 | (e) | | | 0.27 | | | | 0.49 | | | | (0.23 | ) | | | (0.25 | ) | | | (0.48 | ) |
| | 2011 - IR | | | 9.38 | | | | 0.21 | (e) | | | 0.26 | | | | 0.47 | | | | (0.22 | ) | | | (0.25 | ) | | | (0.47 | ) |
| | (a) | | Calculated based on the average shares outstanding methodology. |
| | (b) | | Assumes investment at the net asset value at the beginning of the period, reinvestment of all distributions, a complete redemption of the investment at the net asset value at the end of the period and no sales or redemption charges. Total returns would be reduced if a sales or redemption charge was taken into account. Returns do not reflect the impact of taxes to shareholders relating to Fund distributions or the redemption of Fund shares. Total returns for periods less than one full year are not annualized. |
| | (c) | | The Fund's portfolio turnover rate is calculated in accordance with regulatory requirements, without regard to transactions involving short term investments and certain derivatives. If such transactions were included, the Fund's portfolio turnover rate may be higher. |
| | (e) | | Reflects income recognized from special dividends which amounted to $0.01 per share and 0.12% of average net assets. |
| | |
| 56 | | The accompanying notes are an integral part of these financial statements. |
GOLDMAN SACHS U.S. EQUITY DIVIDEND AND PREMIUM FUND
| | | | | | | | | | | | | | | | | | | | | | | | | | | | | | | | | | | | | | | | |
| | | | | | | | | | | | | | | | | | | | | | | | | | | | | | | | | | |
| | | Net asset
value, end
of period | | | | | Total
return(b) | | | | | Net assets,
end of
period
(in 000s) | | | | | Ratio of
net expenses
to average
net assets | | | | | Ratio of
total expenses
to average
net assets | | | | | Ratio of
net investment
income
to average
net assets | | | | | Portfolio
turnover
rate(c) | |
| | | | | | | | | | | | | | | | | | | | | | | | | | | | | | | | | | | | | | | | |
| | $ | 11.85 | | | | | | 5.55 | % | | | | $ | 217,184 | | | | | | 1.17 | %(d) | | | | | 1.19 | %(d) | | | | | 1.80 | %(d) | | | | | 8 | % |
| | | 11.81 | | | | | | 5.14 | | | | | | 109,272 | | | | | | 1.92 | (d) | | | | | 1.94 | (d) | | | | | 1.04 | (d) | | | | | 8 | |
| | | 11.82 | | | | | | 5.76 | | | | | | 1,542,153 | | | | | | 0.77 | (d) | | | | | 0.79 | (d) | | | | | 2.20 | (d) | | | | | 8 | |
| | | 11.83 | | | | | | 5.60 | | | | | | 103,471 | | | | | | 0.92 | (d) | | | | | 0.94 | (d) | | | | | 2.04 | (d) | | | | | 8 | |
| | | | | | | | | | | | | | | | | | | | | | | | | | | | | | | | | | | | | | | | |
| | | | | | | | | | | | | | | | | | | | | | | | | | | | | | | | | | | | | | | | |
| | | 11.34 | | | | | | 2.08 | | | | | | 194,237 | | | | | | 1.17 | | | | | | 1.20 | | | | | | 1.75 | | | | | | 39 | |
| | | 11.31 | | | | | | 1.26 | | | | | | 90,091 | | | | | | 1.92 | | | | | | 1.95 | | | | | | 1.01 | | | | | | 39 | |
| | | 11.31 | | | | | | 2.49 | | | | | | 1,262,977 | | | | | | 0.77 | | | | | | 0.80 | | | | | | 2.15 | | | | | | 39 | |
| | | 11.33 | | | | | | 2.34 | | | | | | 54,106 | | | | | | 0.92 | | | | | | 0.95 | | | | | | 2.03 | | | | | | 39 | |
| | | 11.76 | | | | | | 10.47 | | | | | | 172,832 | | | | | | 1.19 | | | | | | 1.20 | | | | | | 1.96 | | | | | | 53 | |
| | | 11.74 | | | | | | 9.68 | | | | | | 74,125 | | | | | | 1.94 | | | | | | 1.95 | | | | | | 1.21 | | | | | | 53 | |
| | | 11.73 | | | | | | 10.83 | | | | | | 1,149,361 | | | | | | 0.79 | | | | | | 0.80 | | | | | | 2.36 | | | | | | 53 | |
| | | 11.75 | | | | | | 10.75 | | | | | | 39,960 | | | | | | 0.94 | | | | | | 0.95 | | | | | | 2.21 | | | | | | 53 | |
| | | 11.26 | | | | | | 24.58 | | | | | | 167,149 | | | | | | 1.19 | | | | | | 1.21 | | | | | | 1.92 | | | | | | 69 | |
| | | 11.24 | | | | | | 23.61 | | | | | | 66,872 | | | | | | 1.94 | | | | | | 1.96 | | | | | | 1.17 | | | | | | 69 | |
| | | 11.24 | | | | | | 25.14 | | | | | | 1,072,965 | | | | | | 0.79 | | | | | | 0.81 | | | | | | 2.32 | | | | | | 69 | |
| | | 11.25 | | | | | | 24.93 | | | | | | 35,480 | | | | | | 0.94 | | | | | | 0.96 | | | | | | 2.18 | | | | | | 69 | |
| | | 9.60 | | | | | | 10.30 | | | | | | 145,184 | | | | | | 1.21 | | | | | | 1.22 | | | | | | 2.48 | | | | | | 67 | |
| | | 9.59 | | | | | | 9.57 | | | | | | 45,243 | | | | | | 1.96 | | | | | | 1.97 | | | | | | 1.83 | | | | | | 67 | |
| | | 9.58 | | | | | | 10.74 | | | | | | 895,258 | | | | | | 0.81 | | | | | | 0.82 | | | | | | 2.83 | | | | | | 67 | |
| | | 9.59 | | | | | | 10.60 | | | | | | 19,787 | | | | | | 0.96 | | | | | | 0.97 | | | | | | 2.90 | | | | | | 67 | |
| | | 9.39 | | | | | | 4.90 | | | | | | 70,499 | | | | | | 1.24 | | | | | | 1.25 | | | | | | 1.94 | (e) | | | | | 90 | |
| | | 9.38 | | | | | | 4.03 | | | | | | 17,378 | | | | | | 1.99 | | | | | | 2.00 | | | | | | 1.14 | (e) | | | | | 90 | |
| | | 9.37 | | | | | | 5.31 | | | | | | 688,194 | | | | | | 0.84 | | | | | | 0.85 | | | | | | 2.29 | (e) | | | | | 90 | |
| | | 9.38 | | | | | | 5.05 | | | | | | 1,425 | | | | | | 0.99 | | | | | | 1.00 | | | | | | 2.20 | (e) | | | | | 90 | |
| | |
| The accompanying notes are an integral part of these financial statements. | | 57 |
GOLDMAN SACHS INTERNATIONAL EQUITY DIVIDEND AND PREMIUM FUND
Financial Highlights
Selected Data for a Share Outstanding Throughout Each Period
| | | | | | | | | | | | | | | | | | | | | | | | | | | | | | |
| | | | | | | | Income (loss) from
investment operations | | | Distributions
to shareholders | |
| | | Year - Share Class | | Net asset
value,
beginning
of period | | | Net
investment
income | | | Net realized
and unrealized
gain (loss) | | | Total from
investment
operations | | | From net
investment
income | | | From net
realized
gains | | | Total
distributions | |
| | FOR THE SIX MONTHS ENDED JUNE 30, (UNAUDITED) | |
| | 2016 - A | | $ | 6.56 | | | $ | 0.13 | (d) | | $ | (0.29 | ) | | $ | (0.16 | ) | | $ | (0.12 | ) | | $ | — | | | $ | (0.12 | ) |
| | 2016 - C | | | 6.35 | | | | 0.10 | (d) | | | (0.28 | ) | | | (0.18 | ) | | | (0.10 | ) | | | — | | | | (0.10 | ) |
| | 2016 - Institutional | | | 6.46 | | | | 0.14 | (d) | | | (0.29 | ) | | | (0.15 | ) | | | (0.13 | ) | | | — | | | | (0.13 | ) |
| | 2016 - IR | | | 6.44 | | | | 0.14 | (d) | | | (0.29 | ) | | | (0.15 | ) | | | (0.13 | ) | | | — | | | | (0.13 | ) |
| | | | | | | | | | | | | | | | | | | | | | | | | | | | | | |
| | FOR THE FISCAL YEARS ENDED DECEMBER 31, | |
| | 2015 - A | | | 7.14 | | | | 0.16 | (d)(e) | | | (0.49 | ) | | | (0.33 | ) | | | (0.14 | ) | | | (0.11 | ) | | | (0.25 | ) |
| | 2015 - C | | | 6.94 | | | | 0.09 | (d)(e) | | | (0.47 | ) | | | (0.38 | ) | | | (0.10 | ) | | | (0.11 | ) | | | (0.21 | ) |
| | 2015 - Institutional | | | 7.03 | | | | 0.18 | (d)(e) | | | (0.48 | ) | | | (0.30 | ) | | | (0.16 | ) | | | (0.11 | ) | | | (0.27 | ) |
| | 2015 - IR | | | 7.02 | | | | 0.16 | (d)(e) | | | (0.48 | ) | | | (0.32 | ) | | | (0.15 | ) | | | (0.11 | ) | | | (0.26 | ) |
| | 2014 - A | | | 8.00 | | | | 0.25 | (d)(f) | | | (0.64 | ) | | | (0.39 | ) | | | (0.23 | ) | | | (0.24 | ) | | | (0.47 | ) |
| | 2014 - C | | | 7.80 | | | | 0.18 | (d)(f) | | | (0.62 | ) | | | (0.44 | ) | | | (0.18 | ) | | | (0.24 | ) | | | (0.42 | ) |
| | 2014 - Institutional | | | 7.89 | | | | 0.27 | (d)(f) | | | (0.63 | ) | | | (0.36 | ) | | | (0.26 | ) | | | (0.24 | ) | | | (0.50 | ) |
| | 2014 - IR | | | 7.88 | | | | 0.28 | (d)(f) | | | (0.66 | ) | | | (0.38 | ) | | | (0.24 | ) | | | (0.24 | ) | | | (0.48 | ) |
| | 2013 - A | | | 7.31 | | | | 0.19 | (d) | | | 0.92 | | | | 1.11 | | | | (0.18 | ) | | | (0.24 | ) | | | (0.42 | ) |
| | 2013 - C | | | 7.15 | | | | 0.12 | (d) | | | 0.90 | | | | 1.02 | | | | (0.13 | ) | | | (0.24 | ) | | | (0.37 | ) |
| | 2013 - Institutional | | | 7.21 | | | | 0.2 | (d) | | | 0.93 | | | | 1.13 | | | | (0.21 | ) | | | (0.24 | ) | | | (0.45 | ) |
| | 2013 - IR | | | 7.20 | | | | 0.21 | (d) | | | 0.91 | | | | 1.12 | | | | (0.20 | ) | | | (0.24 | ) | | | (0.44 | ) |
| | 2012 - A | | | 6.60 | | | | 0.16 | | | | 0.78 | | | | 0.94 | | | | (0.17 | ) | | | (0.06 | ) | | | (0.23 | ) |
| | 2012 - C | | | 6.47 | | | | 0.13 | | | | 0.74 | | | | 0.87 | | | | (0.13 | ) | | | (0.06 | ) | | | (0.19 | ) |
| | 2012 - Institutional | | | 6.52 | | | | 0.21 | | | | 0.74 | | | | 0.95 | | | | (0.20 | ) | | | (0.06 | ) | | | (0.26 | ) |
| | 2012 - IR | | | 6.52 | | | | 0.26 | | | | 0.67 | | | | 0.93 | | | | (0.19 | ) | | | (0.06 | ) | | | (0.25 | ) |
| | 2011 - A | | | 8.17 | | | | 0.21 | (g) | | | (1.20 | ) | | | (0.99 | ) | | | (0.23 | ) | | | (0.35 | ) | | | (0.58 | ) |
| | 2011 - C | | | 8.02 | | | | 0.16 | (g) | | | (1.19 | ) | | | (1.03 | ) | | | (0.17 | ) | | | (0.35 | ) | | | (0.52 | ) |
| | 2011 - Institutional | | | 8.07 | | | | 0.24 | (g) | | | (1.18 | ) | | | (0.94 | ) | | | (0.26 | ) | | | (0.35 | ) | | | (0.61 | ) |
| | 2011 - IR | | | 8.06 | | | | 0.24 | (g) | | | (1.18 | ) | | | (0.94 | ) | | | (0.25 | ) | | | (0.35 | ) | | | (0.60 | ) |
| | (a) | | Assumes investment at the net asset value at the beginning of the period, reinvestment of all distributions, a complete redemption of the investment at the net asset value at the end of the period and no sales or redemption charges. Total returns would be reduced if a sales or redemption charge was taken into account. Returns do not reflect the impact of taxes to shareholders relating to Fund distributions or the redemption of Fund shares. Total returns for periods less than one full year are not annualized. |
| | (b) | | The Fund's portfolio turnover rate is calculated in accordance with regulatory requirements, without regard to transactions involving short term investments and certain derivatives. If such transactions were included, the Fund's portfolio turnover rate may be higher. |
| | (d) | | Calculated based on the average shares outstanding methodology. |
| | (e) | | Reflects income recognized from a corporate action which amounted to $0.03 per share and 0.38% of average net assets. |
| | (f) | | Reflects income recognized from a corporate action which amounted to $0.05 per share and 0.69% of average net assets. |
| | (g) | | Reflects income recognized from a corporate action which amounted to $0.01 per share and 0.13% of average net assets. |
| | |
| 58 | | The accompanying notes are an integral part of these financial statements. |
GOLDMAN SACHS INTERNATIONAL EQUITY DIVIDEND AND PREMIUM FUND
| | | | | | | | | | | | | | | | | | | | | | | | | | | | | | | | | | | | | | | | |
| | | | | | | | | | | | | | | | | | | | | | | | | | | | | | | | | | |
| | | Net asset
value, end
of period | | | | | Total
return(a) | | | | | Net assets,
end of
period
(in 000s) | | | | | Ratio of
net expenses
to average
net assets | | | | | Ratio of
total expenses
to average
net assets | | | | | Ratio of
net investment
income
to average
net assets | | | | | Portfolio
turnover
rate(b) | |
| | | | | | | | | | | | | | | | | | | | | | | | | | | | | | | | | | | | | | | | |
| | $ | 6.28 | | | | | | (2.44 | )% | | | | $ | 8,839 | | | | | | 1.37 | %(c) | | | | | 1.39 | %(c) | | | | | 4.01 | %(c) | | | | | 14 | % |
| | | 6.07 | | | | | | (2.88 | ) | | | | | 2,622 | | | | | | 2.12 | (c) | | | | | 2.14 | (c) | | | | | 3.20 | (c) | | | | | 14 | |
| | | 6.18 | | | | | | (2.29 | ) | | | | | 294,505 | | | | | | 0.97 | (c) | | | | | 0.99 | (c) | | | | | 4.45 | (c) | | | | | 14 | |
| | | 6.16 | | | | | | (2.35 | ) | | | | | 1,797 | | | | | | 1.12 | (c) | | | | | 1.14 | (c) | | | | | 4.53 | (c) | | | | | 14 | |
| | | | | | | | | | | | | | | | | | | | | | | | | | | | | | | | | | | | | | | | |
| | | | | | | | | | | | | | | | | | | | | | | | | | | | | | | | | | | | | | | | |
| | | 6.56 | | | | | | (4.80 | ) | | | | | 9,532 | | | | | | 1.37 | | | | | | 1.37 | | | | | | 2.26 | (e) | | | | | 100 | |
| | | 6.35 | | | | | | (5.59 | ) | | | | | 3,329 | | | | | | 2.12 | | | | | | 2.12 | | | | | | 1.38 | (e) | | | | | 100 | |
| | | 6.46 | | �� | | | | (4.42 | ) | | | | | 281,204 | | | | | | 0.97 | | | | | | 0.97 | | | | | | 2.65 | (e) | | | | | 100 | |
| | | 6.44 | | | | | | (4.69 | ) | | | | | 749 | | | | | | 1.12 | | | | | | 1.12 | | | | | | 2.33 | (e) | | | | | 100 | |
| | | 7.14 | | | | | | (5.30 | ) | | | | | 10,565 | | | | | | 1.35 | | | | | | 1.35 | | | | | | 3.13 | (f) | | | | | 44 | |
| | | 6.94 | | | | | | (6.04 | ) | | | | | 2,634 | | | | | | 2.10 | | | | | | 2.10 | | | | | | 2.32 | (f) | | | | | 44 | |
| | | 7.03 | | | | | | (4.99 | ) | | | | | 415,503 | | | | | | 0.95 | | | | | | 0.95 | | | | | | 3.45 | (f) | | | | | 44 | |
| | | 7.02 | | | | | | (5.16 | ) | | | | | 862 | | | | | | 1.09 | | | | | | 1.09 | | | | | | 3.52 | (f) | | | | | 44 | |
| | | 8.00 | | | | | | 15.57 | | | | | | 10,323 | | | | | | 1.34 | | | | | | 1.36 | | | | | | 2.56 | | | | | | 97 | |
| | | 7.80 | | | | | | 14.68 | | | | | | 2,582 | | | | | | 2.10 | | | | | | 2.11 | | | | | | 1.54 | | | | | | 97 | |
| | | 7.89 | | | | | | 16.14 | | | | | | 403,776 | | | | | | 0.94 | | | | | | 0.96 | | | | | | 2.71 | | | | | | 97 | |
| | | 7.88 | | | | | | 15.98 | | | | | | 1,547 | | | | | | 1.09 | | | | | | 1.11 | | | | | | 2.74 | | | | | | 97 | |
| | | 7.31 | | | | | | 14.48 | | | | | | 14,952 | | | | | | 1.30 | | | | | | 1.37 | | | | | | 3.51 | | | | | | 60 | |
| | | 7.15 | | | | | | 13.71 | | | | | | 1,640 | | | | | | 2.05 | | | | | | 2.11 | | | | | | 1.99 | | | | | | 60 | |
| | | 7.21 | | | | | | 14.93 | | | | | | 366,136 | | | | | | 0.90 | | | | | | 0.95 | | | | | | 2.68 | | | | | | 60 | |
| | | 7.20 | | | | | | 14.56 | | | | | | 2,133 | | | | | | 1.05 | | | | | | 1.10 | | | | | | 4.06 | | | | | | 60 | |
| | | 6.60 | | | | | | (12.44 | ) | | | | | 171,063 | | | | | | 1.30 | | | | | | 1.38 | | | | | | 2.74 | (g) | | | | | 51 | |
| | | 6.47 | | | | | | (13.06 | ) | | | | | 1,502 | | | | | | 2.05 | | | | | | 2.13 | | | | | | 1.87 | (g) | | | | | 51 | |
| | | 6.52 | | | | | | (11.99 | ) | | | | | 116,023 | | | | | | 0.90 | | | | | | 0.98 | | | | | | 3.17 | (g) | | | | | 51 | |
| | | 6.52 | | | | | | (12.01 | ) | | | | | 1,315 | | | | | | 1.05 | | | | | | 1.13 | | | | | | 0.54 | (g) | | | | | 51 | |
| | |
| The accompanying notes are an integral part of these financial statements. | | 59 |
GOLDMAN SACHS U.S. TAX-MANAGED EQUITY FUND
Financial Highlights
Selected Data for a Share Outstanding Throughout Each Period
| | | | | | | | | | | | | | | | | | | | | | | | | | | | | | |
| | | | | | | | Income (loss) from
investment operations | | | Distributions
to shareholders | |
| | | Year - Share Class | | Net asset
value,
beginning
of period | | | Net
investment
income (loss)(a) | | | Net realized
and unrealized
gain (loss) | | | Total from
investment
operations | | | From net
investment
income | | | From net
realized
gains | | | Total
distributions | |
| | FOR THE SIX MONTHS ENDED JUNE 30, (UNAUDITED) | |
| | 2016 - A | | $ | 17.28 | | | $ | 0.07 | | | $ | (0.09 | ) | | $ | (0.02 | ) | | $ | — | | | $ | — | | | $ | — | |
| | 2016 - C | | | 16.48 | | | | 0.01 | | | | (0.09 | ) | | | (0.08 | ) | | | — | | | | — | | | | — | |
| | 2016 - Institutional | | | 17.53 | | | | 0.10 | | | | (0.08 | ) | | | 0.02 | | | | — | | | | — | | | | — | |
| | 2016 - Service | | | 17.33 | | | | 0.06 | | | | (0.08 | ) | | | (0.02 | ) | | | — | | | | — | | | | — | |
| | 2016 - IR | | | 17.54 | | | | 0.09 | | | | (0.09 | ) | | | — | (e) | | | — | | | | — | | | | — | |
| | | | | | | | | | | | | | | | | | | | | | | | | | | | | | |
| | FOR THE FISCAL YEARS ENDED DECEMBER 31, | |
| | 2015 - A | | | 17.44 | | | | 0.13 | | | | (0.18 | ) | | | (0.05 | ) | | | (0.11 | ) | | | — | | | | (0.11 | ) |
| | 2015 - C | | | 16.67 | | | | — | (e) | | | (0.18 | ) | | | (0.18 | ) | | | (0.01 | ) | | | — | | | | (0.01 | ) |
| | 2015 - Institutional | | | 17.69 | | | | 0.20 | | | | (0.18 | ) | | | 0.02 | | | | (0.18 | ) | | | — | | | | (0.18 | ) |
| | 2015 - Service | | | 17.53 | | | | 0.12 | | | | (0.19 | ) | | | (0.07 | ) | | | (0.13 | ) | | | — | | | | (0.13 | ) |
| | 2015 - IR | | | 17.70 | | | | 0.18 | | | | (0.18 | ) | | | — | (e) | | | (0.16 | ) | | | — | | | | (0.16 | ) |
| | 2014 - A | | | 15.45 | | | | 0.09 | | | | 1.97 | | | | 2.06 | | | | (0.07 | ) | | | — | | | | (0.07 | ) |
| | 2014 - C | | | 14.82 | | | | (0.04 | ) | | | 1.89 | | | | 1.85 | | | | — | | | | — | | | | — | |
| | 2014 - Institutional | | | 15.66 | | | | 0.15 | | | | 2.01 | | | | 2.16 | | | | (0.13 | ) | | | — | | | | (0.13 | ) |
| | 2014 - Service | | | 15.49 | | | | 0.04 | | | | 2.00 | | | | 2.04 | | | | — | | | | — | | | | — | |
| | 2014 - IR | | | 15.68 | | | | 0.13 | | | | 2.00 | | | | 2.13 | | | | (0.11 | ) | | | — | | | | (0.11 | ) |
| | 2013 - A | | | 11.38 | | | | 0.11 | | | | 4.22 | | | | 4.33 | | | | (0.08 | ) | | | (0.18 | ) | | | (0.26 | ) |
| | 2013 - C | | | 10.95 | | | | — | (e) | | | 4.05 | | | | 4.05 | | | | — | | | | (0.18 | ) | | | (0.18 | ) |
| | 2013 - Institutional | | | 11.54 | | | | 0.16 | | | | 4.28 | | | | 4.44 | | | | (0.14 | ) | | | (0.18 | ) | | | (0.32 | ) |
| | 2013 - Service | | | 11.46 | | | | 0.12 | | | | 4.22 | | | | 4.34 | | | | (0.13 | ) | | | (0.18 | ) | | | (0.31 | ) |
| | 2013 - IR | | | 11.55 | | | | 0.14 | | | | 4.29 | | | | 4.43 | | | | (0.12 | ) | | | (0.18 | ) | | | (0.30 | ) |
| | 2012 - A | | | 9.94 | | | | 0.12 | | | | 1.44 | (f) | | | 1.56 | | | | (0.12 | ) | | | — | | | | (0.12 | ) |
| | 2012 - C | | | 9.57 | | | | 0.05 | | | | 1.38 | (f) | | | 1.43 | | | | (0.05 | ) | | | — | | | | (0.05 | ) |
| | 2012 - Institutional | | | 10.08 | | | | 0.18 | | | | 1.46 | (f) | | | 1.64 | | | | (0.18 | ) | | | — | | | | (0.18 | ) |
| | 2012 - Service | | | 10.01 | | | | 0.12 | | | | 1.45 | (f) | | | 1.57 | | | | (0.12 | ) | | | — | | | | (0.12 | ) |
| | 2012 - IR | | | 10.09 | | | | 0.16 | | | | 1.46 | (f) | | | 1.62 | | | | (0.16 | ) | | | — | | | | (0.16 | ) |
| | 2011 - A | | | 9.73 | | | | 0.09 | (g) | | | 0.20 | | | | 0.29 | | | | (0.08 | ) | | | — | | | | (0.08 | ) |
| | 2011 - C | | | 9.39 | | | | 0.01 | (g) | | | 0.20 | | | | 0.21 | | | | (0.03 | ) | | | — | | | | (0.03 | ) |
| | 2011 - Institutional | | | 9.89 | | | | 0.13 | (g) | | | 0.21 | | | | 0.34 | | | | (0.15 | ) | | | — | | | | (0.15 | ) |
| | 2011 - Service | | | 9.81 | | | | 0.07 | (g) | | | 0.22 | | | | 0.29 | | | | (0.09 | ) | | | — | | | | (0.09 | ) |
| | 2011 - IR | | | 9.89 | | | | 0.10 | (g) | | | 0.23 | | | | 0.33 | | | | (0.13 | ) | | | — | | | | (0.13 | ) |
| | (a) | | Calculated based on the average shares outstanding methodology. |
| | (b) | | Assumes investment at the net asset value at the beginning of the period, reinvestment of all distributions, a complete redemption of the investment at the net asset value at the end of the period and no sales or redemption charges. Total returns would be reduced if a sales or redemption charge was taken into account. Returns do not reflect the impact of taxes to shareholders relating to Fund distributions or the redemption of Fund shares. Total returns for periods less than one full year are not annualized. |
| | (c) | | The Fund's portfolio turnover rate is calculated in accordance with regulatory requirements, without regard to transactions involving short term investments and certain derivatives. If such transactions were included, the Fund's portfolio turnover rate may be higher. |
| | (e) | | Amount is less than $0.005 per share. |
| | (f) | | Reflects payment from affiliate relating to certain investment transactions which amounted to $0.02 per share. Excluding such payment, the total return would have been 15.49%, 14.68%, 15.92%, 15.36% and 15.80%, respectively. |
| | (g) | | Reflects income recognized from special dividends which amounted to $0.02 per share and 0.18% of average net assets. |
| | |
| 60 | | The accompanying notes are an integral part of these financial statements. |
GOLDMAN SACHS U.S. TAX-MANAGED EQUITY FUND
| | | | | | | | | | | | | | | | | | | | | | | | | | | | | | | | | | | | | | | | |
| | | | | | | | | | | | | | | | | | | | | | | | | | | | | | | | | | |
| | | Net asset
value, end
of period | | | | | Total
return(b) | | | | | Net assets,
end of
period
(in 000s) | | | | | Ratio of
net expenses
to average
net assets | | | | | Ratio of
total expenses
to average
net assets | | | | | Ratio of
net investment
income (loss)
to average
net assets | | | | | Portfolio
turnover
rate(c) | |
| | | | | | | | | | | | | | | | | | | | | | | | | | | | | | | | | | | | | | | | |
| | $ | 17.26 | | | | | | (0.12 | )% | | | | $ | 50,204 | | | | | | 1.17 | %(d) | | | | | 1.17 | %(d) | | | | | 0.82 | %(d) | | | | | 66 | % |
| | | 16.40 | | | | | | (0.49 | ) | | | | | 20,892 | | | | | | 1.92 | (d) | | | | | 1.92 | (d) | | | | | 0.07 | (d) | | | | | 66 | |
| | | 17.55 | | | | | | 0.11 | | | | | | 982,137 | | | | | | 0.77 | (d) | | | | | 0.77 | (d) | | | | | 1.23 | (d) | | | | | 66 | |
| | | 17.31 | | | | | | (0.12 | ) | | | | | 1,199 | | | | | | 1.27 | (d) | | | | | 1.27 | (d) | | | | | 0.72 | (d) | | | | | 66 | |
| | | 17.54 | | | | | | 0.00 | | | | | | 10,428 | | | | | | 0.92 | (d) | | | | | 0.92 | (d) | | | | | 1.10 | (d) | | | | | 66 | |
| | | | | | | | | | | | | | | | | | | | | | | | | | | | | | | | | | | | | | | | |
| | | | | | | | | | | | | | | | | | | | | | | | | | | | | | | | | | | | | | | | |
| | | 17.28 | | | | | | (0.28 | ) | | | | | 57,913 | | | | | | 1.17 | | | | | | 1.17 | | | | | | 0.73 | | | | | | 96 | |
| | | 16.48 | | | | | | (1.05 | ) | | | | | 22,194 | | | | | | 1.92 | | | | | | 1.92 | | | | | | (0.02 | ) | | | | | 96 | |
| | | 17.53 | | | | | | 0.10 | | | | | | 957,273 | | | | | | 0.77 | | | | | | 0.77 | | | | | | 1.12 | | | | | | 96 | |
| | | 17.33 | | | | | | (0.41 | ) | | | | | 1,236 | | | | | | 1.27 | | | | | | 1.27 | | | | | | 0.67 | | | | | | 96 | |
| | | 17.54 | | | | | | (0.03 | ) | | | | | 6,799 | | | | | | 0.92 | | | | | | 0.92 | | | | | | 0.99 | | | | | | 96 | |
| | | 17.44 | | | | | | 13.32 | | | | | | 51,253 | | | | | | 1.18 | | | | | | 1.19 | | | | | | 0.52 | | | | | | 57 | |
| | | 16.67 | | | | | | 12.48 | | | | | | 15,750 | | | | | | 1.93 | | | | | | 1.94 | | | | | | (0.22 | ) | | | | | 57 | |
| | | 17.69 | | | | | | 13.78 | | | | | | 735,421 | | | | | | 0.78 | | | | | | 0.79 | | | | | | 0.93 | | | | | | 57 | |
| | | 17.53 | | | | | | 13.17 | | | | | | 58 | | | | | | 1.28 | | | | | | 1.29 | | | | | | 0.25 | | | | | | 57 | |
| | | 17.70 | | | | | | 13.57 | | | | | | 4,175 | | | | | | 0.93 | | | | | | 0.94 | | | | | | 0.78 | | | | | | 57 | |
| | | 15.45 | | | | | | 38.17 | | | | | | 34,792 | | | | | | 1.15 | | | | | | 1.21 | | | | | | 0.80 | | | | | | 95 | |
| | | 14.82 | | | | | | 37.07 | | | | | | 10,648 | | | | | | 1.90 | | | | | | 1.96 | | | | | | 0.04 | | | | | | 95 | |
| | | 15.66 | | | | | | 38.73 | | | | | | 493,729 | | | | | | 0.75 | | | | | | 0.81 | | | | | | 1.17 | | | | | | 95 | |
| | | 15.49 | | | | | | 38.08 | | | | | | 411 | | | | | | 1.27 | | | | | | 1.29 | | | | | | 0.81 | | | | | | 95 | |
| | | 15.68 | | | | | | 38.48 | | | | | | 843 | | | | | | 0.91 | | | | | | 0.96 | | | | | | 1.02 | | | | | | 95 | |
| | | 11.38 | | | | | | 15.69 | (f) | | | | | 35,890 | | | | | | 1.09 | | | | | | 1.23 | | | | | | 1.13 | | | | | | 184 | |
| | | 10.95 | | | | | | 14.89 | (f) | | | | | 8,228 | | | | | | 1.84 | | | | | | 1.97 | | | | | | 0.44 | | | | | | 184 | |
| | | 11.54 | | | | | | 16.12 | (f) | | | | | 304,435 | | | | | | 0.69 | | | | | | 0.82 | | | | | | 1.65 | | | | | | 184 | |
| | | 11.46 | | | | | | 15.56 | (f) | | | | | 40 | | | | | | 1.19 | | | | | | 1.32 | | | | | | 1.11 | | | | | | 184 | |
| | | 11.55 | | | | | | 16.01 | (f) | | | | | 476 | | | | | | 0.84 | | | | | | 0.97 | | | | | | 1.42 | | | | | | 184 | |
| | | 9.94 | | | | | | 3.02 | | | | | | 51,064 | | | | | | 1.09 | | | | | | 1.24 | | | | | | 0.85 | (g) | | | | | 99 | |
| | | 9.57 | | | | | | 2.22 | | | | | | 7,964 | | | | | | 1.84 | | | | | | 1.99 | | | | | | 0.14 | (g) | | | | | 99 | |
| | | 10.08 | | | | | | 3.43 | | | | | | 227,070 | | | | | | 0.69 | | | | | | 0.84 | | | | | | 1.31 | (g) | | | | | 99 | |
| | | 10.01 | | | | | | 2.92 | | | | | | 36 | | | | | | 1.19 | | | | | | 1.34 | | | | | | 0.72 | (g) | | | | | 99 | |
| | | 10.09 | | | | | | 3.35 | | | | | | 494 | | | | | | 0.84 | | | | | | 0.99 | | | | | | 1.01 | (g) | | | | | 99 | |
| | |
| The accompanying notes are an integral part of these financial statements. | | 61 |
GOLDMAN SACHS INTERNATIONAL TAX-MANAGED EQUITY FUND
Financial Highlights
Selected Data for a Share Outstanding Throughout Each Period
| | | | | | | | | | | | | | | | | | | | | | |
| | | | | | | | Income (loss) from
investment operations | | | | |
| | | Year - Share Class | | Net asset
value,
beginning
of period | | | Net
investment
income(a) | | | Net realized
and unrealized
gain (loss) | | | Total from
investment
operations | | | Distributions
to shareholders
from net
investment
income | |
| | FOR THE SIX MONTHS ENDED JUNE 30, (UNAUDITED) | |
| | 2016 - A | | $ | 8.67 | | | $ | 0.11 | | | $ | (0.32 | ) | | $ | (0.21 | ) | | $ | — | |
| | 2016 - C | | | 8.45 | | | | 0.08 | | | | (0.32 | ) | | | (0.24 | ) | | | — | |
| | 2016 - Institutional | | | 8.59 | | | | 0.13 | | | | (0.32 | ) | | | (0.19 | ) | | | — | |
| | 2016 - IR | | | 8.65 | | | | 0.12 | | | | (0.32 | ) | | | (0.20 | ) | | | — | |
| | | | | | | | | | | | | | | | | | | | | | |
| | FOR THE FISCAL YEARS ENDED DECEMBER 31, | |
| | 2015 - A | | | 8.45 | | | | 0.11 | | | | 0.21 | | | | 0.32 | | | | (0.10 | ) |
| | 2015 - C | | | 8.27 | | | | 0.02 | | | | 0.23 | | | | 0.25 | | | | (0.07 | ) |
| | 2015 - Institutional | | | 8.36 | | | | 0.15 | | | | 0.21 | | | | 0.36 | | | | (0.13 | ) |
| | 2015 - IR | | | 8.43 | | | | 0.07 | | | | 0.27 | | | | 0.34 | | | | (0.12 | ) |
| | 2014 - A | | | 9.18 | | | | 0.27 | (e) | | | (0.80 | ) | | | (0.53 | ) | | | (0.20 | ) |
| | 2014 - C | | | 9.03 | | | | 0.15 | (e) | | | (0.74 | ) | | | (0.59 | ) | | | (0.17 | ) |
| | 2014 - Institutional | | | 9.10 | | | | 0.28 | (e) | | | (0.77 | ) | | | (0.49 | ) | | | (0.25 | ) |
| | 2014 - IR | | | 9.17 | | | | 0.29 | (e) | | | (0.80 | ) | | | (0.51 | ) | | | (0.23 | ) |
| | 2013 - A | | | 7.62 | | | | 0.15 | | | | 1.54 | | | | 1.69 | | | | (0.13 | )(f) |
| | 2013 - C | | | 7.55 | | | | 0.10 | | | | 1.51 | | | | 1.61 | | | | (0.13 | )(f) |
| | 2013 - Institutional | | | 7.59 | | | | 0.19 | | | | 1.53 | | | | 1.72 | | | | (0.21 | )(f) |
| | 2013 - IR | | | 7.66 | | | | 0.20 | | | | 1.51 | | | | 1.71 | | | | (0.20 | )(f) |
| | 2012 - A | | | 6.65 | | | | 0.17 | | | | 0.98 | | | | 1.15 | | | | (0.18 | ) |
| | 2012 - C | | | 6.64 | | | | 0.11 | | | | 0.96 | | | | 1.07 | | | | (0.16 | ) |
| | 2012 - Institutional | | | 6.64 | | | | 0.19 | | | | 0.98 | | | | 1.17 | | | | (0.22 | ) |
| | 2012 - IR | | | 6.64 | | | | 0.35 | | | | 0.82 | | | | 1.17 | | | | (0.15 | ) |
| | 2011 - A | | | 7.90 | | | | 0.20 | (g) | | | (1.25 | ) | | | (1.05 | ) | | | (0.20 | ) |
| | 2011 - C | | | 7.88 | | | | 0.13 | (g) | | | (1.23 | ) | | | (1.10 | ) | | | (0.14 | ) |
| | 2011 - Institutional | | | 7.90 | | | | 0.21 | (g) | | | (1.23 | ) | | | (1.02 | ) | | | (0.24 | ) |
| | 2011 - IR | | | 7.90 | | | | 0.20 | (g) | | | (1.24 | ) | | | (1.04 | ) | | | (0.22 | ) |
| | (a) | | Calculated based on the average shares outstanding methodology. |
| | (b) | | Assumes investment at the net asset value at the beginning of the period, reinvestment of all distributions, a complete redemption of the investment at the net asset value at the end of the period and no sales or redemption charges. Total returns would be reduced if a sales or redemption charge was taken into account. Returns do not reflect the impact of taxes to shareholders relating to Fund distributions or the redemption of Fund shares. Total returns for periods less than one full year are not annualized. |
| | (c) | | The Fund's portfolio turnover rate is calculated in accordance with regulatory requirements, without regard to transactions involving short term investments and certain derivatives. If such transactions were included, the Fund's portfolio turnover rate may be higher. |
| | (e) | | Reflects income recognized from special dividends which amounted to $0.06 per share and 0.71% of average net assets. |
| | (f) | | Includes a distribution from capital of less than $0.01 per share. |
| | (g) | | Reflects income recognized from special dividends which amounted to $0.01 per share and 0.16% of average net assets. |
| | |
| 62 | | The accompanying notes are an integral part of these financial statements. |
GOLDMAN SACHS INTERNATIONAL TAX-MANAGED EQUITY FUND
| | | | | | | | | | | | | | | | | | | | | | | | | | | | | | | | | | | | | | | | |
| | | | | | | | | | | | | | | | | | | | | | | | | | | | | | | | | | |
| | | Net asset
value, end
of period | | | | | Total
return(b) | | | | | Net assets,
end of
period
(in 000s) | | | | | Ratio of
net expenses
to average
net assets | | | | | Ratio of
total expenses
to average
net assets | | | | | Ratio of
net investment
income
to average
net assets | | | | | Portfolio
turnover
rate(c) | |
| | | | | | | | | | | | | | | | | | | | | | | | | | | | | | | | | | | | | | | | |
| | $ | 8.46 | | | | | | (2.42 | )% | | | | $ | 4,012 | | | | | | 1.37 | %(d) | | | | | 1.37 | %(d) | | | | | 2.76 | %(d) | | | | | 57 | % |
| | | 8.21 | | | | | | (2.84 | ) | | | | | 948 | | | | | | 2.12 | (d) | | | | | 2.12 | (d) | | | | | 1.99 | (d) | | | | | 57 | |
| | | 8.40 | | | | | | (2.21 | ) | | | | | 457,177 | | | | | | 0.97 | (d) | | | | | 0.97 | (d) | | | | | 3.17 | (d) | | | | | 57 | |
| | | 8.45 | | | | | | (2.31 | ) | | | | | 1,230 | | | | | | 1.12 | (d) | | | | | 1.12 | (d) | | | | | 2.99 | (d) | | | | | 57 | |
| | | | | | | | | | | | | | | | | | | | | | | | | | | | | | | | | | | | | | | | |
| | | | | | | | | | | | | | | | | | | | | | | | | | | | | | | | | | | | | | | | |
| | | 8.67 | | | | | | 3.77 | | | | | | 3,408 | | | | | | 1.38 | | | | | | 1.39 | | | | | | 1.22 | | | | | | 113 | |
| | | 8.45 | | | | | | 3.07 | | | | | | 812 | | | | | | 2.13 | | | | | | 2.13 | | | | | | 0.20 | | | | | | 113 | |
| | | 8.59 | | | | | | 4.26 | | | | | | 426,168 | | | | | | 0.98 | | | | | | 0.99 | | | | | | 1.71 | | | | | | 113 | |
| | | 8.65 | | | | | | 4.04 | | | | | | 1,444 | | | | | | 1.13 | | | | | | 1.13 | | | | | | 0.84 | | | | | | 113 | |
| | | 8.45 | | | | | | (5.79 | ) | | | | | 2,151 | | | | | | 1.38 | | | | | | 1.42 | | | | | | 2.98 | (e) | | | | | 106 | |
| | | 8.27 | | | | | | (6.55 | ) | | | | | 181 | | | | | | 2.13 | | | | | | 2.17 | | | | | | 1.71 | (e) | | | | | 106 | |
| | | 8.36 | | | | | | (5.48 | ) | | | | | 316,062 | | | | | | 0.98 | | | | | | 1.02 | | | | | | 3.12 | (e) | | | | | 106 | |
| | | 8.43 | | | | | | (5.59 | ) | | | | | 205 | | | | | | 1.13 | | | | | | 1.17 | | | | | | 3.12 | (e) | | | | | 106 | |
| | | 9.18 | | | | | | 22.23 | | | | | | 3,388 | | | | | | 1.31 | | | | | | 1.51 | | | | | | 1.79 | | | | | | 95 | |
| | | 9.03 | | | | | | 21.38 | | | | | | 70 | | | | | | 2.10 | | | | | | 2.23 | | | | | | 1.15 | | | | | | 95 | |
| | | 9.10 | | | | | | 22.70 | | | | | | 228,410 | | | | | | 0.95 | | | | | | 1.08 | | | | | | 2.27 | | | | | | 95 | |
| | | 9.17 | | | | | | 22.36 | | | | | | 217 | | | | | | 1.12 | | | | | | 1.21 | | | | | | 2.34 | | | | | | 95 | |
| | | 7.62 | | | | | | 17.25 | | | | | | 15,384 | | | | | | 1.26 | | | | | | 1.59 | | | | | | 2.44 | | | | | | 182 | |
| | | 7.55 | | | | | | 16.20 | | | | | | 32 | | | | | | 2.01 | | | | | | 2.30 | | | | | | 1.52 | | | | | | 182 | |
| | | 7.59 | | | | | | 17.71 | | | | | | 134,290 | | | | | | 0.86 | | | | | | 1.17 | | | | | | 2.69 | | | | | | 182 | |
| | | 7.66 | | | | | | 17.68 | | | | | | 1 | | | | | | 1.02 | | | | | | 1.36 | | | | | | 5.14 | | | | | | 182 | |
| | | 6.65 | | | | | | (13.33 | ) | | | | | 40,837 | | | | | | 1.26 | | | | | | 1.57 | | | | | | 2.60 | (g) | | | | | 88 | |
| | | 6.64 | | | | | | (13.88 | ) | | | | | 19 | | | | | | 2.01 | | | | | | 2.32 | | | | | | 1.72 | (g) | | | | | 88 | |
| | | 6.64 | | | | | | (12.92 | ) | | | | | 101,165 | | | | | | 0.86 | | | | | | 1.17 | | | | | | 2.81 | (g) | | | | | 88 | |
| | | 6.64 | | | | | | (13.11 | ) | | | | | 1 | | | | | | 1.01 | | | | | | 1.32 | | | | | | 2.68 | (g) | | | | | 88 | |
| | |
| The accompanying notes are an integral part of these financial statements. | | 63 |
GOLDMAN SACHS TAX-ADVANTAGED EQUITY FUNDS
Notes to Financial Statements
June 30, 2016 (Unaudited)
Goldman Sachs Trust (the “Trust”) is a Delaware statutory trust registered under the Investment Company Act of 1940, as amended (the “Act”), as an open-end management investment company. The following table lists those series of the Trust that are included in this report (collectively, the “Funds” or individually a “Fund”), along with their corresponding share classes and respective diversification status under the Act:
| | | | |
| Fund | | Share Classes Offered | | Diversified/ Non-diversified |
U.S. Equity Dividend and Premium, International Equity Dividend and Premium, International Tax-Managed Equity | | A, C, Institutional and IR | | Diversified |
U.S. Tax-Managed Equity | | A, C, Institutional, Service and IR | | Diversified |
Class A Shares are sold with a front-end sales charge of up to 5.50%. Class C Shares are sold with a contingent deferred sales charge (“CDSC”) of 1.00%, which is imposed on redemptions made within 12 months of purchase. Institutional, Service and Class IR Shares are not subject to a sales charge.
Goldman Sachs Asset Management, L.P. (“GSAM”), an affiliate of Goldman, Sachs & Co. (“Goldman Sachs”), serves as investment adviser to the Funds pursuant to a management agreement (the “Agreement”) with the Trust.
|
| 2. SIGNIFICANT ACCOUNTING POLICIES |
The financial statements have been prepared in accordance with accounting principles generally accepted in the United States of America (“GAAP”) and require management to make estimates and assumptions that may affect the reported amounts and disclosures. Actual results may differ from those estimates and assumptions.
A. Investment Valuation — The Funds’ valuation policy is to value investments at fair value.
B. Investment Income and Investments — Investment income includes interest income, dividend income, net of any foreign withholding taxes, less any amounts reclaimable, and securities lending. Interest income is accrued daily and adjusted for amortization of premiums and accretion of discounts. Dividend income is recognized on ex-dividend date or, for certain foreign securities, as soon as such information is obtained subsequent to the ex-dividend date. Investment transactions are reflected on trade date. Realized gains and losses are calculated using identified cost. Investment transactions are recorded on the following business day for daily net asset value (“NAV”) calculations. Any foreign capital gains tax is accrued daily based upon net unrealized gains, and is payable upon sale of such investments. Distributions received from the Funds’ investments in United States (“U.S.”) real estate investment trusts (“REITs”) may be characterized as ordinary income, net capital gain or a return of capital. A return of capital is recorded by the Funds as a reduction to the cost basis of the REIT.
For derivative contracts, realized gains and losses are recorded upon settlement of the contract.
C. Class Allocations and Expenses — Investment income, realized and unrealized gain (loss), and non-class specific expenses of each Fund are allocated daily based upon the proportion of net assets of each class. Non-class specific expenses directly incurred by a Fund are charged to that Fund, while such expenses incurred by the Trust are allocated across the applicable Funds on a straight-line and/or pro-rata basis depending upon the nature of the expenses. Class specific expenses, where applicable, are borne by the respective share classes and include Distribution and Service, Transfer Agency and Service and Shareholder Administration fees.
D. Federal Taxes and Distributions to Shareholders — It is each Fund’s policy to comply with the requirements of the Internal Revenue Code of 1986, as amended (the “Code”), applicable to regulated investment companies (mutual funds) and to distribute each year substantially all of its investment company taxable income and capital gains to its shareholders. Accordingly, the Funds are not required to make any provisions for the payment of federal income tax. Distributions to shareholders are
64
GOLDMAN SACHS TAX-ADVANTAGED EQUITY FUNDS
|
| 2. SIGNIFICANT ACCOUNTING POLICIES (continued) |
recorded on the ex-dividend date. Income and capital gains distributions, if any, are declared and paid according to the following schedule:
| | | | |
| Fund | | Income Distributions Declared/Paid | | Capital Gains Distributions Declared/Paid |
U.S. Equity Dividend and Premium International Equity Dividend and Premium | | Quarterly | | Annually |
U.S. Tax-Managed Equity International Tax-Managed Equity | | Annually | | Annually |
Net capital losses are carried forward to future fiscal years and may be used to the extent allowed by the Code to offset any future capital gains. Utilization of capital loss carryforwards will reduce the requirement of future capital gains distributions.
Under the Regulated Investment Company Modernization Act of 2010, the Funds are permitted to carry forward capital losses incurred in taxable years beginning after December 22, 2010 for an unlimited period. However, any losses incurred during those future taxable years will be required to be utilized prior to the losses incurred in pre-enactment taxable years. As a result of this ordering rule, pre-enactment capital loss carryforwards may be more likely to expire unused. Additionally, post-enactment capital losses that are carried forward will retain their character as either short-term or long-term capital losses rather than being considered all short-term as under previous law.
The characterization of distributions to shareholders for financial reporting purposes is determined in accordance with federal income tax rules, which may differ from GAAP. The source of each Fund’s distributions may be shown in the accompanying financial statements as either from net investment income, net realized gain or capital. Certain components of the Funds’ net assets on the Statements of Assets and Liabilities reflect permanent GAAP/tax differences based on the appropriate tax character.
E. Foreign Currency Translation — The accounting records and reporting currency of the Funds are maintained in U.S. dollars. Assets and liabilities denominated in foreign currencies are translated into U.S. dollars using the current exchange rates at the close of each business day. The effect of changes in foreign currency exchange rates on investments is included within net realized and unrealized gain (loss) on investments. Changes in the value of other assets and liabilities as a result of fluctuations in foreign exchange rates are included in the Statements of Operations within net change in unrealized gain (loss) on foreign currency translations. Transactions denominated in foreign currencies are translated into U.S. dollars on the date the transaction occurred, the effects of which are included within net realized gain (loss) on foreign currency transactions.
| | |
| 3. INVESTMENTS AND FAIR VALUE MEASUREMENTS | | |
The fair value of a financial instrument is the amount that would be received to sell an asset or paid to transfer a liability in an orderly transaction between market participants at the measurement date (i.e., the exit price). GAAP establishes a fair value hierarchy that prioritizes the inputs to valuation techniques used to measure fair value. The hierarchy gives the highest priority to unadjusted quoted prices in active markets for identical assets or liabilities (Level 1 measurements) and the lowest priority to unobservable inputs (Level 3 measurements). The levels used for classifying investments are not necessarily an indication of the risk associated with investing in these investments. The three levels of the fair value hierarchy are described below:
Level 1— Unadjusted quoted prices in active markets that are accessible at the measurement date for identical, unrestricted assets or liabilities;
Level 2 — Quoted prices in markets that are not active or financial instruments for which significant inputs are observable (including, but not limited to, quoted prices for similar investments, interest rates, foreign exchange rates, volatility and credit spreads), either directly or indirectly;
Level 3 — Prices or valuations that require significant unobservable inputs (including GSAM’s assumptions in determining fair value measurement).
65
GOLDMAN SACHS TAX-ADVANTAGED EQUITY FUNDS
Notes to Financial Statements (continued)
June 30, 2016 (Unaudited)
|
| 3. INVESTMENTS AND FAIR VALUE MEASUREMENTS (continued) |
Changes in valuation techniques may result in transfers into or out of an assigned level within the hierarchy. In accordance with the Funds’ policy, transfers between different levels of the fair value hierarchy resulting from such changes are deemed to have occurred as of the beginning of the reporting period. The Board of Trustees (“Trustees”) has approved Valuation Procedures that govern the valuation of the portfolio investments held by the Funds, including investments for which market quotations are not readily available. The Trustees have delegated to GSAM day-to-day responsibility for implementing and maintaining internal controls and procedures related to the valuation of the Funds’ portfolio investments. To assess the continuing appropriateness of pricing sources and methodologies, GSAM regularly performs price verification procedures and issues challenges as necessary to third party pricing vendors or brokers, and any differences are reviewed in accordance with the Valuation Procedures.
A. Level 1 and Level 2 Fair Value Investments—The valuation techniques and significant inputs used in determining the fair values for investments classified as Level 1 and Level 2 are as follows:
Equity Securities — Equity securities traded on a U.S. securities exchange or the NASDAQ system, or those located on certain foreign exchanges, including but not limited to the Americas, are valued daily at their last sale price or official closing price on the principal exchange or system on which they are traded. If there is no sale or official closing price or such price is believed by GSAM to not represent fair value, equity securities are valued at the last bid price for long positions and at the last ask price for short positions. To the extent these investments are actively traded, they are classified as Level 1 of the fair value hierarchy, otherwise they are generally classified as Level 2.
Unlisted equity securities for which market quotations are available are valued at the last sale price on the valuation date, or if no sale occurs, at the last bid price. Securities traded on certain foreign securities exchanges are valued daily at fair value determined by an independent fair value service (if available) under Valuation Procedures approved by the Trustees and consistent with applicable regulatory guidance. The independent fair value service takes into account multiple factors including, but not limited to, movements in the securities markets, certain depositary receipts, futures contracts and foreign currency exchange rates that have occurred subsequent to the close of the foreign securities exchange. These investments are generally classified as Level 2 of the fair value hierarchy.
Money Market Funds — Investments in the Goldman Sachs Financial Square Government and Goldman Sachs Financial Square Money Market Funds (“Underlying Funds”) are valued at the NAV of the FST Institutional Share class on the day of valuation. These investments are generally classified as Level 1 of the fair value hierarchy. For information regarding an Underlying Fund’s accounting policies and investment holdings, please see the Underlying Fund’s shareholder report.
Derivative Contracts — A derivative is an instrument whose value is derived from underlying assets, indices, reference rates or a combination of these factors. The Funds enter into derivative transactions to hedge against changes in interest rates, securities prices, and/or currency exchange rates, to increase total return, or to gain access to certain markets or attain exposure to other underliers.
Exchange-traded derivatives, including futures and options contracts, are valued at the last sale or settlement price and typically fall within Level 1 of the fair value hierarchy. Over-the-counter (“OTC”) and centrally cleared derivatives are valued using market transactions and other market evidence, including market-based inputs to models, calibration to market-clearing transactions, broker or dealer quotations, or other alternative pricing sources. Where models are used, the selection of a particular model to value OTC and centrally cleared derivatives depends upon the contractual terms of, and specific risks inherent in, the instrument, as well as the availability of pricing information in the market. Valuation models require a variety of inputs, including contractual terms, market prices, yield curves, credit curves, measures of volatility, voluntary and involuntary prepayment rates, loss severity rates and correlations of such inputs. For OTC and centrally cleared derivatives that trade in liquid markets, model inputs can generally be verified and model selection does not involve significant management judgment. OTC and centrally cleared derivatives are classified within Level 2 of the fair value hierarchy when significant inputs are corroborated by market evidence.
i. Futures Contracts — Futures contracts are contracts to buy or sell a standardized quantity of a specified commodity or security and are valued based on exchanged settlement prices or independent market quotes. Futures contracts are valued at the last settlement price, or in the absence of a sale, the last bid price for long positions and at the last ask price for short
66
GOLDMAN SACHS TAX-ADVANTAGED EQUITY FUNDS
|
| 3. INVESTMENTS AND FAIR VALUE MEASUREMENTS (continued) |
positions, at the end of each day on the board of trade or exchange upon which they are traded. Upon entering into a futures contract, a Fund deposits cash or securities in an account on behalf of the broker in an amount sufficient to meet the initial margin requirement. Subsequent payments are made or received by a Fund equal to the daily change in the contract value and are recorded as variation margin receivable or payable with a corresponding offset to unrealized gains or losses.
ii. Option Contracts — When a Fund writes call or put option contracts, an amount equal to the premium received is recorded as a liability and is subsequently marked-to-market to reflect the current value of the option written. Swaptions are options on interest rate swap contracts.
Upon the purchase of a call option or a put option by a Fund, the premium paid is recorded as an investment and subsequently marked-to-market to reflect the current value of the option. Certain options may be purchased with premiums to be determined on a future date. The premiums for these options are based upon implied volatility parameters at specified terms.
B. Level 3 Fair Value Investments — To the extent that significant inputs to valuation models and other alternative pricing sources are unobservable, or if quotations are not readily available, or if GSAM believes that such quotations do not accurately reflect fair value, the fair value of the Funds’ investments may be determined under Valuation Procedures approved by the Trustees. GSAM, consistent with its procedures and applicable regulatory guidance, may make an adjustment to the most recent valuation prices of either domestic or foreign securities in light of significant events to reflect what it believes to be the fair value of the securities at the time of determining a Fund’s NAV. Significant events which could affect a large number of securities in a particular market may include, but are not limited to: significant fluctuations in U.S. or foreign markets; market dislocations; market disruptions; or unscheduled market closings. Significant events which could also affect a single issuer may include, but are not limited to: corporate actions such as reorganizations, mergers and buy-outs; ratings downgrades; and bankruptcies.
C. Fair Value Hierarchy — The following is a summary of the Funds’ investments and derivatives classified in the fair value hierarchy as of June 30, 2016:
| | | | | | | | | | | | |
| | | |
| U.S. EQUITY DIVIDEND AND PREMIUM | | | | | | | | | | | | |
| | | |
| Investment Type | | Level 1 | | | Level 2 | | | Level 3 | |
| Assets | | | | | | | | | | | | |
Common Stock and/or Other Equity Investments(a) | | | | | | | | | | | | |
North America | | $ | 1,851,517,591 | | | $ | — | | | $ | — | |
Investment Company | | | 106,958,518 | | | | — | | | | — | |
Securities Lending Reinvestment Vehicle | | | 13,703,790 | | | | — | | | | — | |
| Total | | $ | 1,972,179,899 | | | $ | — | | | $ | — | |
| | | |
| Derivative Type | | | | | | | | | |
| Assets(b) | | | | | | | | | | | | |
Futures Contracts | | $ | 2,737,278 | | | $ | — | | | $ | — | |
| Liabilities | | | | | | | | | | | | |
Written Options | | $ | (11,248,700 | ) | | $ | — | | | $ | — | |
67
GOLDMAN SACHS TAX-ADVANTAGED EQUITY FUNDS
Notes to Financial Statements (continued)
June 30, 2016 (Unaudited)
|
| 3. INVESTMENTS AND FAIR VALUE MEASUREMENTS (continued) |
| | | | | | | | | | | | |
| | | |
| INTERNATIONAL EQUITY DIVIDEND AND PREMIUM | | | | | | | | | | | | |
| | | |
| Investment Type | | Level 1 | | | Level 2 | | | Level 3 | |
| Assets | | | | | | | | | | | | |
Common Stock and/or Other Equity Investments(a) | | | | | | | | | | | | |
Asia | | $ | 680,516 | | | $ | 80,169,360 | | | $ | — | |
Australia and Oceania | | | — | | | | 25,610,126 | | | | — | |
Europe | | | 18,307,550 | | | | 169,906,795 | | | | — | |
Securities Lending Reinvestment Vehicle | | | 3,101,464 | | | | — | | | | — | |
| Total | | $ | 22,089,530 | | | $ | 275,686,281 | | | $ | — | |
| | | |
| Derivative Type | | | | | | | | | |
| Assets(b) | | | | | | | | | | | | |
Futures Contracts | | $ | 246,607 | | | $ | — | | | $ | — | |
| Liabilities | | | | | | | | | | | | |
Futures Contracts(b) | | $ | (150,512 | ) | | $ | — | | | $ | — | |
Written Options | | | (2,695,330 | ) | | | — | | | | — | |
| Total | | $ | (2,845,842 | ) | | $ | — | | | $ | — | |
| | | |
| U.S. TAX-MANAGED EQUITY | | | | | | | | | | | | |
| | | |
| Investment Type | | Level 1 | | | Level 2 | | | Level 3 | |
| Assets | | | | | | | | | | | | |
Common Stock and/or Other Equity Investments(a) | | | | | | | | | | | | |
North America | | $ | 1,055,703,208 | | �� | $ | 33,298 | | | $ | — | |
Securities Lending Reinvestment Vehicle | | | 7,374,800 | | | | — | | | | — | |
| Total | | $ | 1,063,078,008 | | | $ | 33,298 | | | $ | — | |
| | | |
| Derivative Type | | | | | | | | | |
| Assets(b) | | | | | | | | | | | | |
Futures Contracts | | $ | 71,775 | | | $ | — | | | $ | — | |
68
GOLDMAN SACHS TAX-ADVANTAGED EQUITY FUNDS
|
| 3. INVESTMENTS AND FAIR VALUE MEASUREMENTS (continued) |
| | | | | | | | | | | | |
| | | |
| INTERNATIONAL TAX-MANAGED EQUITY | | | | | | | | | | | | |
| | | |
| Investment Type | | Level 1 | | | Level 2 | | | Level 3 | |
| Assets | | | | | | | | | | | | |
Common Stock and/or Other Equity Investments(a) | | | | | | | | | | | | |
Africa | | $ | — | | | $ | 2,555,613 | | | $ | — | |
Asia | | | — | | | | 141,812,636 | | | | — | |
Australia and Oceania | | | — | | | | 23,444,868 | | | | — | |
Europe | | | 17,825,908 | | | | 269,288,424 | | | | — | |
North America | | | — | | | | 3,988,049 | | | | — | |
Securities Lending Reinvestment Vehicle | | | 7,569,180 | | | | — | | | | — | |
| Total | | $ | 25,395,088 | | | $ | 441,089,590 | | | $ | — | |
| | | |
| Derivative Type | | | | | | | | | |
| Liabilities(b) | | | | | | | | | | | | |
Futures Contracts | | $ | (159,624 | ) | | $ | — | | | $ | — | |
| (a) | | Amounts are disclosed by continent to highlight the impact of time zone differences between local market close and the calculation of net asset value. Security valuations are based on the principal exchange or system on which they are traded, which may differ from country of domicile noted in the table. The Funds utilize fair value model prices provided by an independent fair value service for certain international equity securities, resulting in a Level 2 classification. |
| (b) | | Amount shown represents unrealized gain (loss) at period end. |
For further information regarding security characteristics, see the Schedules of Investments.
| | |
| 4. INVESTMENTS IN DERIVATIVES | | |
The following table sets forth, by certain risk types, the gross value of derivative contracts as of June 30, 2016. These instruments were used as part of the Funds’ investment strategies and to obtain and/or manage exposure related to the risks below. The values in the tables below exclude the effects of cash collateral received or posted pursuant to these derivative contracts, and therefore are not representative of the Funds’ net exposure.
| | | | | | | | | | | | | | |
| Fund | | Risk | | Statements of Assets and Liabilities | | Assets(a) | | | Statements of Assets and Liabilities | | Liabilities(a) | |
U.S. Equity Dividend and Premium | | Equity | | Variation margin on certain derivative contracts | | $ | 2,737,278 | | | Payable for written options, at value | | $ | (11,248,700) | |
International Equity Dividend and Premium | | Equity | | Variation margin on certain derivative contracts | | | 246,607 | | | Variation margin on certain derivative contracts, Payable for written options at value | | | (2,845,842) | (a) |
U.S. Tax-Managed Equity | | Equity | | Variation margin on certain derivative contracts | | | 71,775 | | | — | | | — | |
International Tax-Managed Equity | | Equity | | — | | | — | | | Variation margin on certain derivative contracts | | | (159,624) | (a) |
| Total | | | | | | $ | 3,055,660 | | | | | $ | (14,254,166) | |
| (a) | | Includes cumulative appreciation (depreciation) on futures contracts described in the Additional Investment Information sections of the Schedules of Investments. Only current day’s variation margin is reported within the Statements of Assets and Liabilities. |
69
GOLDMAN SACHS TAX-ADVANTAGED EQUITY FUNDS
Notes to Financial Statements (continued)
June 30, 2016 (Unaudited)
|
| 4. INVESTMENTS IN DERIVATIVES (continued) |
The following table sets forth, by certain risk types, the Funds’ gains (losses) related to these derivatives and their indicative volumes for the six months ended June 30, 2016. These gains (losses) should be considered in the context that these derivative contracts may have been executed to create investment opportunities and/or economically hedge certain investments, and accordingly, certain gains (losses) on such derivative contracts may offset certain (losses) gains attributable to investments. These gains (losses) are included in “Net realized gain (loss)” or “Net change in unrealized gain (loss)” on the Statements of Operations:
| | | | | | | | | | | | | | | | |
| Fund | | Risk | | Statements of Operations | | Net Realized
Gain (Loss) | | | Net Change in
Unrealized
Gain (Loss) | | | Average
Number of
Contracts(a) | |
U.S. Equity Dividend and Premium | | Equity | | Net realized gain (loss) from futures contracts and written options/Net change in unrealized gain (loss) on futures contracts and written options | | $ | 4,501,627 | | | $ | 5,040,001 | | | | 2,400 | |
International Equity Dividend and Premium | | Equity | | Net realized gain (loss) from futures contracts and written options/Net change in unrealized gain (loss) on futures contracts and written options | | | 5,648,539 | | | | 171,347 | | | | 1,898 | |
U.S. Tax-Managed Equity | | Equity | | Net realized gain (loss) from futures contracts/Net change in unrealized gain (loss) on futures contracts | | | 379,391 | | | | 78,941 | | | | 82 | |
International Tax-Managed Equity | | Equity | | Net realized gain (loss) from futures contracts/Net change in unrealized gain (loss) on futures contracts | | | (13,337 | ) | | | (273,913 | ) | | | 136 | |
| Total | | | | | | $ | 10,516,220 | | | $ | 5,016,376 | | | | 4,516 | |
| (a) | | Average number of contracts is based on the average of month end balances for the six months ended June 30, 2016. |
| | |
| 5. AGREEMENTS AND AFFILIATED TRANSACTIONS | | |
A. Management Agreement — Under the Agreement, GSAM manages the Funds, subject to the general supervision of the Trustees.
As compensation for the services rendered pursuant to the Agreement, the assumption of the expenses related thereto and administration of the Funds’ business affairs, including providing facilities, GSAM is entitled to a management fee, accrued daily and paid monthly, equal to an annual percentage rate of each Fund’s average daily net assets.
For the six months ended June 30, 2016, contractual and effective net management fees with GSAM were at the following rates:
| | | | | | | | | | | | | | | | | | | | | | | | | | | | | | |
| | | | | Contractual Management Rate | | | Effective Net
Management
Rate^ | |
| Fund | | | | First
$1 billion | | | Next
$1 billion | | | Next
$3 billion | | | Next
$3 billion | | | Over
$8 billion | | | Effective
Rate | | |
U.S. Equity Dividend and Premium | | | | | 0.75 | % | | | 0.68 | % | | | 0.65 | % | | | 0.64 | % | | | 0.63 | % | | | 0.72 | % | | | 0.71 | % |
International Equity Dividend and Premium | | | | | 0.81 | | | | 0.73 | | | | 0.69 | | | | 0.68 | | | | 0.67 | | | | 0.81 | | | | 0.81 | |
U.S. Tax-Managed Equity | | | | | 0.70 | | | | 0.63 | | | | 0.60 | | | | 0.59 | | | | 0.58 | | | | 0.70 | | | | 0.70 | |
International Tax-Managed Equity | | | | | 0.85 | | | | 0.77 | | | | 0.73 | | | | 0.72 | | | | 0.71 | | | | 0.85 | | | | 0.85 | |
| ^ | | Effective Net Management Rate includes the impact of management fee waivers of affiliated underlying funds, if any. |
70
GOLDMAN SACHS TAX-ADVANTAGED EQUITY FUNDS
|
| 5. AGREEMENTS AND AFFILIATED TRANSACTIONS (continued) |
The U.S. Equity Dividend and Premium Fund invests in FST Institutional Shares of the Goldman Sachs Financial Square Government Fund, which is an affiliated Underlying Fund. GSAM has agreed to waive a portion of its management fee payable by the Fund in an amount equal to the management fee it earns as an investment adviser to any of the affiliated Underlying Funds in which the Fund invests. For the six months ended June 30, 2016, GSAM waived $52,070 of the Fund’s management fee.
B. Distribution and Service Plans — The Trust, on behalf of each Fund, has adopted Distribution and Service Plans (the “Plans”). Under the Plans, Goldman Sachs, which serves as distributor (the “Distributor”), is entitled to a fee accrued daily and paid monthly, for distribution services and personal and account maintenance services, which may then be paid by Goldman Sachs to authorized dealers, at the following annual rates calculated on a Fund’s average daily net assets of each respective share class:
| | | | | | | | |
| | | Distribution and Service Plan Rates | |
| | | Class A* | | | Class C | |
Distribution Plan | | | 0.25 | % | | | 0.75 | % |
Service Plan | | | — | | | | 0.25 | |
| * | | With respect to Class A Shares, the Distributor at its discretion may use compensation for distribution services paid under the Distribution Plan to compensate service organizations for personal and account maintenance services and expenses as long as such total compensation does not exceed the maximum cap on “service fees” imposed by the Financial Industry Regulatory Authority. |
C. Distribution Agreement — Goldman Sachs, as Distributor of the shares of the Funds pursuant to a Distribution Agreement, may retain a portion of the Class A Shares’ front end sales charge and Class C Shares’ CDSC. During the six months ended June 30, 2016, Goldman Sachs advised that it retained the front end sales charges of $26,018, $767, $2,954, and $451 for the U.S. Equity Dividend and Premium, International Equity Dividend and Premium, U.S. Tax-Managed Equity and International Tax-Managed Equity Funds, respectively.
D. Service Plan and Shareholder Administration Plan —The Trust, on behalf of each Fund that offers Service Shares, has adopted a Service Plan and a Shareholder Administration Plan. These plans allow for service organizations to provide varying levels of personal and account maintenance and shareholder administration services to their customers who are beneficial owners of such shares. The Service Plan and Shareholder Administration Plan each provide for compensation to the service organizations which is accrued daily and paid monthly at an annual rate of 0.25% (0.50% in aggregate) of the average daily net assets of the Service Shares.
E. Transfer Agency Agreement — Goldman Sachs also serves as the transfer agent of the Funds for a fee pursuant to the Transfer Agency Agreement. The fees charged for such transfer agency services are accrued daily and paid monthly at annual rates as follows: 0.19% of the average daily net assets of Class A, Class C and Class IR Shares; and 0.04% of the average daily net assets of Institutional and Service Shares.
F. Other Expense Agreements and Affiliated Transactions — GSAM has agreed to limit certain “Other Expenses” of the Funds (excluding acquired fund fees and expenses, transfer agency fees and expenses, service fees and shareholder administration fees (as applicable), taxes, interest, brokerage fees, shareholder meeting, litigation, indemnification and extraordinary expenses) to the extent such expenses exceed, on an annual basis, a percentage rate of the average daily net assets of each Fund. Such Other Expense reimbursements, if any, are accrued daily and paid monthly. In addition, the Funds are not obligated to reimburse GSAM for prior fiscal year expense reimbursements, if any. The Other Expense limitations as an annual percentage rate of average daily net assets for the U.S. Equity Dividend and Premium, International Equity Dividend and Premium, U.S. Tax-Managed Equity and International Tax-Managed Equity Funds are 0.014%, 0.124%, 0.044% and 0.094%, respectively. These Other Expense limitations will remain in place through at least April 29, 2017, and prior to such date GSAM may not terminate the arrangements without the approval of the Trustees. In addition, the Funds have entered into certain offset arrangements with the custodian and the transfer agent, which may result in a reduction of the Funds’ expenses and are received irrespective of the application of the “Other Expense” limitations described above.
71
GOLDMAN SACHS TAX-ADVANTAGED EQUITY FUNDS
Notes to Financial Statements (continued)
June 30, 2016 (Unaudited)
|
| 5. AGREEMENTS AND AFFILIATED TRANSACTIONS (continued) |
For the six months ended June 30, 2016, these expense reductions, including any fee waivers and Other Expense reimbursements, were as follows:
| | | | | | | | | | | | | | | | | | |
| Fund | | | | Management
Fee Waiver | | | Other Expense
Reimbursement | | | Custody
Fee
Credits | | | Total
Expense
Reductions | |
U.S. Equity Dividend and Premium | | | | $ | 52,070 | | | $ | 115,393 | | | $ | 3,804 | | | $ | 171,267 | |
International Equity Dividend and Premium | | | | | — | | | | 20,195 | | | | 782 | | | | 20,977 | |
U.S. Tax-Managed Equity | | | | | — | | | | — | | | | 4,495 | | | | 4,495 | |
International Tax-Managed Equity | | | | | — | | | | — | | | | 2,349 | | | | 2,349 | |
G. Line of Credit Facility — As of June 30, 2016, the Funds participated in a $1,100,000,000 committed, unsecured revolving line of credit facility (the “facility”) together with other funds of the Trust and registered investment companies having management agreements with GSAM or its affiliates (“Other Borrowers”). This facility is to be used for temporary or emergency purposes, or to allow for an orderly liquidation of securities to meet redemption requests. The interest rate on borrowings is based on the federal funds rate. The facility also requires a fee to be paid by the Funds based on the amount of the commitment that has not been utilized. For the six months ended June 30, 2016, the Funds did not have any borrowings under the facility.
H. Other Transactions with Affiliates— For the six months ended June 30, 2016, Goldman Sachs earned $1,259 and $3,836 in brokerage commissions from portfolio transactions, including futures transactions executed with Goldman Sachs as the Futures Commission Merchant, on behalf of the International Equity Dividend and Premium and International Tax-Managed Equity Funds, respectively.
The following table provides information about the U.S. Equity Dividend and Premium Fund’s investment in the Goldman Sachs Financial Square Government Fund as of and for the six months ended June 30, 2016:
| | | | | | | | | | | | | | | | | | | | |
| Underlying Fund | | Market Value
12/31/15 | | | Purchases at Cost | | | Proceeds from Sales | | | Market Value 6/30/16 | | | Dividend
Income | |
Goldman Sachs Financial Square Government Fund | | $ | 76,057,604 | | | $ | 338,473,570 | | | $ | (307,572,656 | ) | | $ | 106,958,518 | | | $ | 83,917 | |
As of June 30, 2016, the following Goldman Sachs Fund of Funds Portfolios were the beneficial owners of 5% or more of total outstanding shares of the following Funds:
| | | | | | | | | | |
| Fund | | | | Goldman Sachs
Enhanced Dividend
Global Equity
Portfolio | | | Goldman Sachs
Tax-Advantaged
Global Equity
Portfolio | |
U.S. Equity Dividend & Premium | | | | | 11 | % | | | — | % |
International Equity Dividend & Premium | | | | | 36 | | | | — | |
U.S. Tax-Managed Equity | | | | | — | | | | 85 | |
International Tax-Managed Equity | | | | | — | | | | 88 | |
72
GOLDMAN SACHS TAX-ADVANTAGED EQUITY FUNDS
|
| 6. PORTFOLIO SECURITIES TRANSACTIONS |
The cost of purchases and proceeds from sales and maturities of long-term securities for the six months ended June 30, 2016, were as follows:
| | | | | | | | | | |
| Fund | | | | Purchases | | | Sales | |
U.S. Equity Dividend & Premium | | | | $ | 383,133,502 | | | $ | 131,333,983 | |
International Equity Dividend & Premium | | | | | 57,927,515 | | | | 39,345,925 | |
U.S. Tax-Managed Equity | | | | | 681,984,331 | | | | 680,104,132 | |
International Tax-Managed Equity | | | | | 301,217,663 | | | | 254,938,148 | |
Pursuant to exemptive relief granted by the Securities and Exchange Commission (“SEC”) and the terms and conditions contained therein, the Funds may lend their securities through a securities lending agent, Goldman Sachs Agency Lending (“GSAL”), a wholly-owned subsidiary of Goldman Sachs, to certain qualified borrowers including Goldman Sachs and affiliates. In accordance with the Funds’ securities lending procedures, the Funds receive cash collateral at least equal to the market value of the securities on loan. The market value of the loaned securities is determined at the close of business of the Funds, at their last sale price or official closing price on the principal exchange or system on which they are traded, and any additional required collateral is delivered to the Funds on the next business day. As with other extensions of credit, the Funds may experience delay in the recovery of their securities or incur a loss should the borrower of the securities breach its agreement with the Funds or become insolvent at a time when the collateral is insufficient to cover the cost of repurchasing securities on loan. Dividend income received from securities on loan may not be subject to withholding taxes and therefore withholding taxes paid may differ from the amounts listed in the Statements of Operations. Loans of securities are terminable at any time and as such 1) the remaining contractual maturities of the outstanding securities lending transactions are considered to be overnight and continuous and 2) the borrower, after notice, is required to return borrowed securities within the standard time period for settlement of securities transactions.
The Funds invest the cash collateral received in connection with securities lending transactions in the Goldman Sachs Financial Square Money Market Fund (“Money Market Fund”), an affiliated series of the Trust. The Money Market Fund is registered under the Act as an open end investment company, is subject to Rule 2a-7 under the Act, and is managed by GSAM, for which GSAM may receive an investment advisory fee of up to 0.205% on an annualized basis of the average daily net assets of the Money Market Fund.
In the event of a default by a borrower with respect to any loan, GSAL will exercise any and all remedies provided under the applicable borrower agreement to make the Funds whole. These remedies include purchasing replacement securities by applying the collateral held from the defaulting broker against the purchase cost of the replacement securities. If, despite such efforts by GSAL to exercise these remedies, the Funds sustain losses as a result of a borrower’s default, GSAL indemnifies the Funds by purchasing replacement securities at GSAL’s expense, or paying the Funds an amount equal to the market value of the replacement securities, subject to an exclusion for any shortfalls resulting from a loss of value in the cash collateral pool due to reinvestment risk and a requirement that the Funds agree to assign rights to the collateral to GSAL for purpose of using the collateral to cover purchase of replacement securities as more fully described in the Securities Lending Agency Agreement. The Funds’ loaned securities were all subject to enforceable Securities Lending Agreements and the value of the collateral is at least equal to the value of the cash received. The value of loaned securities and cash collateral at period end are disclosed in the Funds’ Statements of Assets and Liabilities.
Both the Funds and GSAL received compensation relating to the lending of the Funds’ securities. The amounts earned by the Funds for the six months ended June 30, 2016, are reported under Investment Income on the Statements of Operations.
73
GOLDMAN SACHS TAX-ADVANTAGED EQUITY FUNDS
Notes to Financial Statements (continued)
June 30, 2016 (Unaudited)
|
| 7. SECURITIES LENDING (continued) |
The table below details securities lending activity with affiliates of Goldman Sachs:
| | | | | | | | | | | | | | |
| | | | | For the Six Months ended June 30, 2016 | | | Amounts Payable to
Goldman Sachs
Upon Return of
Securities Loaned as of
June 30, 2016 | |
| Fund | | | | Earnings of GSAL
Relating to
Securities
Loaned | | | Amounts Received
by the Funds from Lending to
Goldman Sachs | | |
U.S. Equity Dividend & Premium | | | | $ | 3,044 | | | $ | 800 | | | $ | 421,175 | |
International Equity Dividend & Premium | | | | | 2,125 | | | | 479 | | | | 1,097,360 | |
U.S. Tax-Managed Equity | | | | | 16,106 | | | | 15,623 | | | | 1,574,575 | |
International Tax-Managed Equity | | | | | 26,050 | | | | 66,911 | | | | 3,078,920 | |
The following table provides information about the Funds’ investment in the Money Market Fund for the six months ended June 30, 2016:
| | | | | | | | | | | | | | | | | | |
| Fund | | | | Market Value
12/31/15 | | | Purchases at Cost | | | Proceeds from Sales | | | Market Value 6/30/16 | |
U.S. Equity Dividend & Premium | | | | $ | — | | | $ | 33,905,135 | | | $ | (20,201,345 | ) | | $ | 13,703,790 | |
International Equity Dividend & Premium | | | | | — | | | | 9,351,992 | | | | (6,250,528 | ) | | | 3,101,464 | |
U.S. Tax-Managed Equity | | | | | 19,803,509 | | | | 63,508,854 | | | | (75,937,563 | ) | | | 7,374,800 | |
International Tax-Managed Equity | | | | | 3,320,125 | | | | 96,590,941 | | | | (92,341,886 | ) | | | 7,569,180 | |
As of the Funds’ most recent fiscal year end, December 31, 2015, the Funds’ capital loss carryforwards and certain timing differences, on a tax-basis were as follows:
| | | | | | | | | | | | | | | | |
| | | U.S. Equity
Dividend and
Premium | | | International
Equity Dividend
and Premium | | | U.S. Tax-Managed
Equity | | | International
Tax-Managed
Equity | |
Capital loss carryforwards:(1) | | | | | | | | | | | | | | | | |
Expiring 2016 | | $ | — | | | $ | — | | | $ | — | | | $ | (2,078,605 | ) |
Expiring 2017 | | | — | | | | — | | | | — | | | | (31,387,420 | ) |
Perpetual Long-term | | | — | | | | — | | | | — | | | | (7,421,630 | ) |
Perpetual Short-term | | | — | | | | — | | | | (50,600,875 | ) | | | (42,227,380 | ) |
Total capital loss carryforwards | | $ | — | | | $ | — | | | $ | (50,600,875 | ) | | $ | (83,115,035 | ) |
Timing differences (Qualified Late Year Loss Deferral/Post October Loss Deferral and Deferred Dividends from REIT Distributions) | | | 29,333 | | | | (4,163,651 | ) | | | (1,705,994 | ) | | | (7,543,878 | ) |
| (1) | | Expiration occurs on December 31 of the year indicated. |
74
GOLDMAN SACHS TAX-ADVANTAGED EQUITY FUNDS
|
| 8. TAX INFORMATION (continued) |
As of June 30, 2016, the Funds’ aggregate security unrealized gains and losses based on cost for U.S. federal income tax purposes were as follows:
| | | | | | | | | | | | | | | | |
| | | U.S. Equity
Dividend and
Premium | | | International
Equity Dividend
and Premium | | | U.S.
Tax-Managed
Equity | | | International
Tax-Managed
Equity | |
Tax cost | | $ | 1,758,237,074 | | | $ | 364,311,113 | | | $ | 823,888,897 | | | $ | 399,594,736 | |
Gross unrealized gain | | | 276,641,451 | | | | 7,865,216 | | | | 241,376,072 | | | | 70,413,052 | |
Gross unrealized loss | | | (62,698,626 | ) | | | (74,400,518 | ) | | | (2,153,663 | ) | | | (3,523,110 | ) |
Net unrealized security gain (loss) | | $ | 213,942,825 | | | $ | (66,535,302 | ) | | $ | 239,222,409 | | | $ | 66,889,942 | |
The difference between GAAP-basis and tax-basis unrealized gains (losses) is attributable primarily to wash sales, net mark to market gains (losses) on regulated futures, foreign currency and options contracts and differences related to the tax treatment of underlying fund investments and passive foreign investment company investments.
GSAM has reviewed the Funds’ tax positions for all open tax years (the current and prior three years, as applicable) and has concluded that no provision for income tax is required in the Funds’ financial statements. Such open tax years remain subject to examination and adjustment by tax authorities.
The Funds’ risks include, but are not limited to, the following:
Derivatives Risk — Loss may result from the Funds’ investments in derivative instruments. These instruments may be illiquid, difficult to price and leveraged so that small changes in the value of the underlying instruments may produce disproportionate losses to the Funds. Derivatives are also subject to counterparty risk, which is the risk that the other party in the transaction will not fulfill its contractual obligation. Losses from investments in derivatives can also result from a lack of correlation between changes in the value of derivative instruments and the portfolio assets (if any) being hedged.
Foreign and Emerging Countries Risk — Investing in foreign markets may involve special risks and considerations not typically associated with investing in the U.S. Foreign securities may be subject to risk of loss because of more or less foreign government regulation, less public information and less economic, political and social stability in the countries in which a Fund invests. Loss may also result from the imposition of exchange controls, confiscations and other government restrictions by the U.S. or other governments, or from problems in registration, settlement or custody. Foreign risk also involves the risk of negative foreign currency rate fluctuations, which may cause the value of securities denominated in such foreign currency (or other instruments through which a Fund has exposure to foreign currencies) to decline in value. Currency exchange rates may fluctuate significantly over short periods of time. To the extent that a Fund also invests in securities of issuers located in emerging markets, these risks may be more pronounced.
Foreign Custody Risk — A Fund that invests in foreign securities may hold such securities and cash with foreign banks, agents, and securities depositories appointed by the Fund’s custodian (each a “Foreign Custodian”). Some foreign custodians may be recently organized or new to the foreign custody business. In some countries, Foreign Custodians may be subject to little or no regulatory oversight over, or independent evaluation of, their operations. Further, the laws of certain countries may place limitations on a Fund’s ability to recover its assets if a Foreign Custodian enters bankruptcy. Investments in emerging markets may be subject to even greater custody risks than investments in more developed markets. Custody services in emerging market countries are very often undeveloped and may be considerably less well regulated than in more developed countries, and thus may not afford the same level of investor protection as would apply in developed countries.
75
GOLDMAN SACHS TAX-ADVANTAGED EQUITY FUNDS
Notes to Financial Statements (continued)
June 30, 2016 (Unaudited)
|
| 9. OTHER RISKS (continued) |
Investments in Other Investment Companies — As a shareholder of another investment company, including an exchange-traded fund (“ETF”), a Fund will indirectly bear its proportionate share of any net management fees and other expenses paid by such other investment companies, in addition to the fees and expenses regularly borne by the Fund. ETFs are subject to risks that do not apply to conventional mutual funds, including but not limited to the following: (i) the market price of the ETF’s shares may trade at a premium or a discount to their NAV; and (ii) an active trading market for an ETF’s shares may not develop or be maintained.
Large Shareholder Transactions Risk — A Fund may experience adverse effects when certain large shareholders, such as other funds, institutional investors (including those trading by use of non-discretionary mathematical formulas), financial intermediaries (who may make investment decisions on behalf of underlying clients and/or include a Fund in their investment model), individuals, accounts and Goldman Sachs affiliates, purchase or redeem large amounts of shares of a Fund. Such large shareholder redemptions may cause a Fund to sell portfolio securities at times when it would not otherwise do so, which may negatively impact a Fund’s NAV and liquidity. These transactions may also accelerate the realization of taxable income to shareholders if such sales of investments resulted in gains, and may also increase transaction costs. In addition, a large redemption could result in a Fund’s current expenses being allocated over a smaller asset base, leading to an increase in the Fund’s expense ratio. Similarly, large Fund share purchases may adversely affect a Fund’s performance to the extent that the Fund is delayed in investing new cash and is required to maintain a larger cash position than it ordinarily would.
Liquidity Risk — A Fund may make investments that are illiquid or that may become less liquid in response to market developments or adverse investor perceptions. Illiquid investments may be more difficult to value. Liquidity risk may also refer to the risk that a Fund will not be able to pay redemption proceeds within the allowable time period because of unusual market conditions, an unusually high volume of redemption requests, or other reasons. To meet redemption requests, a Fund may be forced to sell investments at an unfavorable time and/or under unfavorable conditions.
Market and Credit Risks — In the normal course of business, a Fund trades financial instruments and enters into financial transactions where risk of potential loss exists due to changes in the market (market risk). Additionally, a Fund may also be exposed to credit risk in the event that an issuer or guarantor fails to perform or that an institution or entity with which the Fund has unsettled or open transactions defaults.
Short Position Risk — A Fund may enter into a short position through a futures contract, an option or swap agreement or through short sales of any instrument that a Fund may purchase for investment. Taking short positions involves leverage of a Fund’s assets and presents various risks. If the value of the underlying instrument or market in which a Fund has taken a short position increases, then the Fund will incur a loss equal to the increase in value from the time that the short position was entered into plus any related interest payments or other fees. Taking short positions involves the risk that losses may be disproportionate, may exceed the amount invested, and may be unlimited.
Under the Trust’s organizational documents, its Trustees, officers, employees and agents are indemnified, to the extent permitted by the Act and state law, against certain liabilities that may arise out of performance of their duties to the Funds. Additionally, in the course of business, the Funds enter into contracts that contain a variety of indemnification clauses. The Funds’ maximum exposure under these arrangements is unknown, as this would involve future claims that may be made against the Funds that have not yet occurred. However, GSAM believes the risk of loss under these arrangements to be remote.
Subsequent events after the Statements of Assets and Liabilities date have been evaluated through the date the financial statements were issued. GSAM has concluded that there is no impact requiring adjustment or disclosure in the financial statements.
76
GOLDMAN SACHS TAX-ADVANTAGED EQUITY FUNDS
|
| 12. SUMMARY OF SHARE TRANSACTIONS |
Share activity is as follows:
| | | | | | | | | | | | | | | | |
| | | U.S. Equity Dividend and Premium | |
| | | For the Six Months Ended
June 30, 2016
(Unaudited) | | | For the Fiscal Year Ended
December 31, 2015 | |
| | | Shares | | | Dollars | | | Shares | | | Dollars | |
| | | | |
| Class A Shares | | | | | | | | | | | | | | | | |
Shares sold | | | 4,317,580 | | | $ | 49,185,593 | | | | 5,648,342 | | | $ | 66,635,723 | |
Reinvestment of distributions | | | 143,419 | | | | 1,673,790 | | | | 886,965 | | | | 10,161,450 | |
Shares redeemed | | | (3,259,953 | ) | | | (37,119,821 | ) | | | (4,099,843 | ) | | | (48,396,195 | ) |
| | | | 1,201,046 | | | | 13,739,562 | | | | 2,435,464 | | | | 28,400,978 | |
| Class C Shares | | | | | | | | | | | | | | | | |
Shares sold | | | 2,321,994 | | | | 26,553,484 | | | | 2,459,310 | | | | 28,711,644 | |
Reinvestment of distributions | | | 36,079 | | | | 419,982 | | | | 290,568 | | | | 3,313,646 | |
Shares redeemed | | | (1,072,802 | ) | | | (12,099,933 | ) | | | (1,100,675 | ) | | | (12,980,500 | ) |
| | | | 1,285,271 | | | | 14,873,533 | | | | 1,649,203 | | | | 19,044,790 | |
| Institutional Shares | | | | | | | | | | | | | | | | |
Shares sold | | | 28,407,480 | | | | 323,362,301 | | | | 26,692,822 | | | | 313,680,662 | |
Reinvestment of distributions | | | 1,095,338 | | | | 12,757,750 | | | | 5,726,581 | | | | 65,517,369 | |
Shares redeemed | | | (10,699,015 | ) | | | (120,604,265 | ) | | | (18,711,344 | ) | | | (220,010,222 | ) |
| | | | 18,803,803 | | | | 215,515,786 | | | | 13,708,059 | | | | 159,187,809 | |
| Class IR Shares | | | | | | | | | | | | | | | | |
Shares sold | | | 5,272,467 | | | | 61,071,017 | | | | 2,115,858 | | | | 25,027,669 | |
Reinvestment of distributions | | | 67,566 | | | | 788,312 | | | | 255,381 | | | | 2,922,243 | |
Shares redeemed | | | (1,373,569 | ) | | | (15,458,734 | ) | | | (995,108 | ) | | | (11,813,269 | ) |
| | | | 3,966,464 | | | | 46,400,595 | | | | 1,376,131 | | | | 16,136,643 | |
NET INCREASE | | | 25,256,584 | | | $ | 290,529,476 | | | | 19,168,857 | | | $ | 222,770,220 | |
77
GOLDMAN SACHS TAX-ADVANTAGED EQUITY FUNDS
Notes to Financial Statements (continued)
June 30, 2016 (Unaudited)
|
| 12. SUMMARY OF SHARE TRANSACTIONS (continued) |
Share activity is as follows:
| | | | | | | | | | | | | | | | |
| | | International Equity Dividend and Premium | |
| | | For the Six Months Ended
June 30, 2016
(Unaudited) | | | For the Fiscal Year Ended
December 31, 2015 | |
| | | Shares | | | Dollars | | | Shares | | | Dollars | |
| | | | |
| Class A Shares | | | | | | | | | | | | | | | | |
Shares sold | | | 98,870 | | | $ | 631,141 | | | | 460,543 | | | $ | 3,244,830 | |
Reinvestment of distributions | | | 26,677 | | | | 166,940 | | | | 49,576 | | | | 339,539 | |
Shares redeemed | | | (170,685 | ) | | | (1,084,976 | ) | | | (535,757 | ) | | | (3,867,932 | ) |
| | | | (45,138 | ) | | | (286,895 | ) | | | (25,638 | ) | | | (283,563 | ) |
| Class C Shares | | | | | | | | | | | | | | | | |
Shares sold | | | 28,675 | | | | 175,128 | | | | 168,721 | | | | 1,164,830 | |
Reinvestment of distributions | | | 6,995 | | | | 42,329 | | | | 14,737 | | | | 97,255 | |
Shares redeemed | | | (128,097 | ) | | | (783,824 | ) | | | (38,961 | ) | | | (264,726 | ) |
| | | | (92,427 | ) | | | (566,367 | ) | | | 144,497 | | | | 997,359 | |
| Institutional Shares | | | | | | | | | | | | | | | | |
Shares sold | | | 8,399,752 | | | | 51,618,166 | | | | 14,258,529 | | | | 99,454,195 | |
Reinvestment of distributions | | | 976,949 | | | | 6,017,763 | | | | 1,940,053 | | | | 13,090,371 | |
Shares redeemed | | | (5,255,707 | ) | | | (32,263,995 | ) | | | (31,735,854 | ) | | | (219,209,892 | ) |
| | | | 4,120,994 | | | | 25,371,934 | | | | (15,537,272 | ) | | | (106,665,326 | ) |
| Class IR Shares | | | | | | | | | | | | | | | | |
Shares sold | | | 253,095 | | | | 1,549,629 | | | | 65,058 | | | | 456,216 | |
Reinvestment of distributions | | | 5,318 | | | | 32,618 | | | | 4,096 | | | | 27,347 | |
Shares redeemed | | | (83,071 | ) | | | (517,985 | ) | | | (75,696 | ) | | | (534,227 | ) |
| | | | 175,342 | | | | 1,064,262 | | | | (6,542 | ) | | | (50,664 | ) |
NET INCREASE (DECREASE) | | | 4,158,771 | | | $ | 25,582,934 | | | | (15,424,955 | ) | | $ | (106,002,194 | ) |
78
GOLDMAN SACHS TAX-ADVANTAGED EQUITY FUNDS
|
| 12. SUMMARY OF SHARE TRANSACTIONS (continued) |
Share activity is as follows:
| | | | | | | | | | | | | | | | |
| | | U.S. Tax-Managed Equity | |
| | | For the Six Months Ended
June 30, 2016
(Unaudited) | | | For the Fiscal Year Ended
December 31, 2015 | |
| | | Shares | | | Dollars | | | Shares | | | Dollars | |
| | | | |
| Class A Shares | | | | | | | | | | | | | | | | |
Shares sold | | | 185,304 | | | $ | 3,083,041 | | | | 928,541 | | | $ | 16,271,859 | |
Reinvestment of distributions | | | — | | | | — | | | | 18,794 | | | | 327,578 | |
Shares redeemed | | | (628,810 | ) | | | (10,324,919 | ) | | | (533,922 | ) | | | (9,231,821 | ) |
| | | | (443,506 | ) | | | (7,241,878 | ) | | | 413,413 | | | | 7,367,616 | |
| Class C Shares | | | | | | | | | | | | | | | | |
Shares sold | | | 109,966 | | | | 1,762,560 | | | | 506,895 | | | | 8,465,057 | |
Reinvestment of distributions | | | — | | | | — | | | | 1,000 | | | | 16,633 | |
Shares redeemed | | | (182,989 | ) | | | (2,861,573 | ) | | | (106,063 | ) | | | (1,763,817 | ) |
| | | | (73,023 | ) | | | (1,099,013 | ) | | | 401,832 | | | | 6,717,873 | |
| Institutional Shares | | | | | | | | | | | | | | | | |
Shares sold | | | 5,673,531 | | | | 93,849,530 | | | | 20,043,930 | | | | 358,131,887 | |
Reinvestment of distributions | | | — | | | | — | | | | 546,854 | | | | 9,673,849 | |
Shares redeemed | | | (4,312,524 | ) | | | (72,992,114 | ) | | | (7,555,225 | ) | | | (130,444,037 | ) |
| | | | 1,361,007 | | | | 20,857,416 | | | | 13,035,559 | | | | 237,361,699 | |
| Service Shares | | | | | | | | | | | | | | | | |
Shares sold | | | — | | | | — | | | | 70,382 | | | | 1,230,818 | |
Reinvestment of distributions | | | — | | | | — | | | | 521 | | | | 9,114 | |
Shares redeemed | | | (2,003 | ) | | | (30,114 | ) | | | (2,915 | ) | | | (48,692 | ) |
| | | | (2,003 | ) | | | (30,114 | ) | | | 67,988 | | | | 1,191,240 | |
| Class IR Shares | | | | | | | | | | | | | | | | |
Shares sold | | | 302,186 | | | | 5,077,645 | | | | 322,157 | | | | 5,750,700 | |
Reinvestment of distributions | | | — | | | | — | | | | 3,390 | | | | 59,966 | |
Shares redeemed | | | (95,452 | ) | | | (1,569,709 | ) | | | (173,705 | ) | | | (3,111,967 | ) |
| | | | 206,734 | | | | 3,507,936 | | | | 151,842 | | | | 2,698,699 | |
NET INCREASE | | | 1,049,209 | | | $ | 15,994,347 | | | | 14,070,634 | | | | 255,337,127 | |
79
GOLDMAN SACHS TAX-ADVANTAGED EQUITY FUNDS
Notes to Financial Statements (continued)
June 30, 2016 (Unaudited)
|
| 12. SUMMARY OF SHARE TRANSACTIONS (continued) |
Share activity is as follows:
| | | | | | | | | | | | | | | | |
| | | International Tax-Managed Equity | |
| | | For the Six Months Ended
June 30, 2016
(Unaudited) | | | For the Fiscal Year Ended
December 31, 2015 | |
| | | Shares | | | Dollars | | | Shares | | | Dollars | |
| | | | |
| Class A Shares | | | | | | | | | | | | | | | | |
Shares sold | | | 125,666 | | | $ | 1,040,992 | | | | 200,716 | | | $ | 1,797,112 | |
Reinvestment of distributions | | | — | | | | — | | | | 4,352 | | | | 37,947 | |
Shares redeemed | | | (44,432 | ) | | | (373,707 | ) | | | (66,808 | ) | | | (598,755 | ) |
| | | | 81,234 | | | | 667,285 | | | | 138,260 | | | | 1,236,304 | |
| Class C Shares | | | | | | | | | | | | | | | | |
Shares sold | | | 23,962 | | | | 194,866 | | | | 85,633 | | | | 754,418 | |
Reinvestment of distributions | | | — | | | | — | | | | 848 | | | | 7,200 | |
Shares redeemed | | | (4,603 | ) | | | (37,734 | ) | | | (12,292 | ) | | | (104,836 | ) |
| | | | 19,359 | | | | 157,132 | | | | 74,189 | | | | 656,782 | |
| Institutional Shares | | | | | | | | | | | | | | | | |
Shares sold | | | 11,750,156 | | | | 96,021,418 | | | | 19,886,852 | | | | 175,872,655 | |
Reinvestment of distributions | | | — | | | | — | | | | 726,091 | | | | 6,266,165 | |
Shares redeemed | | | (6,906,952 | ) | | | (56,772,214 | ) | | | (8,815,046 | ) | | | (77,228,789 | ) |
| | | | 4,843,204 | | | | 39,249,204 | | | | 11,797,897 | | | | 104,910,031 | |
| Class IR Shares | | | | | | | | | | | | | | | | |
Shares sold | | | 50,602 | | | | 418,011 | | | | 148,014 | | | | 1,328,928 | |
Reinvestment of distributions | | | — | | | | — | | | | 2,311 | | | | 20,104 | |
Shares redeemed | | | (71,964 | ) | | | (585,293 | ) | | | (7,787 | ) | | | (71,717 | ) |
| | | | (21,362 | ) | | | (167,282 | ) | | | 142,538 | | | | 1,277,315 | |
NET INCREASE | | | 4,922,435 | | | $ | 39,906,339 | | | | 12,152,884 | | | $ | 108,080,432 | |
80
GOLDMAN SACHS TAX-ADVANTAGED EQUITY FUNDS
Fund Expenses — Six Month Period Ended June 30, 2016 (Unaudited)
As a shareholder of Class A, Class C, Institutional, Service or Class IR Shares of a Fund you incur types of costs: (1) transaction costs, including sales charges on purchase payments (with respect to Class A Shares), contingent deferred sales charges on redemptions (with respect to Class C Shares), (if any); and (2) ongoing costs, including management fees; distribution and service (12b-1) fees (with respect to Class A, Class C Shares); and other Fund expenses. This example is intended to help you understand your ongoing costs (in dollars) of investing in Class A, Class C, Institutional, Service or Class IR Shares of the Funds and to compare these costs with the ongoing costs of investing in other mutual funds.
The example is based on an investment of $1,000 invested at the beginning of the period and held for the entire period from January 1, 2016 through June 30, 2016, which represents a period of 182 days of a 366 day year.
Actual Expenses — The first line under each share class in the table below provides information about actual account values and actual expenses. You may use the information in this line, together with the amount you invested, to estimate the expenses that you paid over the period. Simply divide your account value by $1,000 (for example, an $8,600 account value divided by $1,000=8.6), then multiply the result by the number in the first line under the heading entitled “Expenses Paid” to estimate the expenses you paid on your account during this period.
Hypothetical Example for Comparison Purposes — The second line under each share class in the table below provides information about hypothetical account values and hypothetical expenses based on the Funds' actual net expense ratio and an assumed rate of return of 5% per year before expenses, which is not the Funds' actual return. The hypothetical account values and expenses may not be used to estimate the actual ending account balance or expenses you paid for the period. You may use this information to compare the ongoing costs of investing in the Funds and other funds. To do so, compare this 5% hypothetical example with the 5% hypothetical examples that appear in the shareholder reports of the other funds.
Please note that the expenses shown in the table are meant to highlight your ongoing costs only and do not reflect any transactional costs, such as sales charges, redemption fees, or exchange fees. Therefore, the second line of the table is useful in comparing ongoing costs only, and will not help you determine the relative total costs of owning different funds. In addition, if these transactional costs were included, your costs would have been higher.
| | | | | | | | | | | | | | | | | | | | | | | | | | | | | | | | | | | | | | | | | | | | | | | | |
| | | U.S. Equity Dividend and Premium Fund | | | International Equity Dividend and Premium Fund | | | U.S. Tax-Managed Equity Fund | | | International Tax-Managed Equity Fund | |
| Share Class | | Beginning
Account
Value
01/01/16 | | | Ending
Account
Value
06/30/16 | | | Expenses
Paid for the
6 Months Ended
06/30/16* | | | Beginning
Account
Value
01/01/16 | | | Ending
Account
Value
06/30/16 | | | Expenses
Paid for the
6 Months Ended
06/30/16* | | | Beginning
Account
Value
01/01/16 | | | Ending
Account
Value
06/30/16 | | | Expenses
Paid for the
6 Months Ended
06/30/16* | | | Beginning
Account
Value
01/01/16 | | | Ending
Account
Value
06/30/16 | | | Expenses
Paid for the
6 Months Ended
06/30/16* | |
| Class A | | | | | | | | | | | | | | | | | | | | | | | | | | | | | | | | | | | | | | | | | | | | | | | | |
Actual | | $ | 1,000 | | | $ | 1,055.50 | | | $ | 5.98 | | | $ | 1,000 | | | $ | 975.60 | | | $ | 6.73 | | | $ | 1,000 | | | $ | 998.80 | | | $ | 5.81 | | | $ | 1,000 | | | $ | 975.80 | | | $ | 6.73 | |
Hypothetical 5% return | | | 1,000 | | | | 1,019.05 | + | | | 5.87 | | | | 1,000 | | | | 1,018.05 | + | | | 6.87 | | | | 1,000 | | | | 1,019.05 | + | | | 5.87 | | | | 1,000 | | | | 1,018.05 | + | | | 6.87 | |
| Class C | | | | | | | | | | | | | | | | | | | | | | | | | | | | | | | | | | | | | | | | | | | | | | | | |
Actual | | | 1,000 | | | | 1,051.50 | | | | 9.79 | | | | 1,000 | | | | 971.20 | | | | 10.39 | | | | 1,000 | | | | 995.10 | | | | 9.52 | | | | 1,000 | | | | 971.60 | | | | 10.39 | |
Hypothetical 5% return | | | 1,000 | | | | 1,015.32 | + | | | 9.62 | | | | 1,000 | | | | 1,014.32 | + | | | 10.62 | | | | 1,000 | | | | 1,015.32 | + | | | 9.62 | | | | 1,000 | | | | 1,014.32 | + | | | 10.62 | |
| Institutional | | | | | | | | | | | | | | | | | | | | | | | | | | | | | | | | | | | | | | | | | | | | | | | | |
Actual | | | 1,000 | | | | 1,057.60 | | | | 3.94 | | | | 1,000 | | | | 977.10 | | | | 4.77 | | | | 1,000 | | | | 1,001.10 | | | | 3.83 | | | | 1,000 | | | | 977.90 | | | | 4.77 | |
Hypothetical 5% return | | | 1,000 | | | | 1,021.03 | + | | | 3.87 | | | | 1,000 | | | | 1,020.04 | + | | | 4.87 | | | | 1,000 | | | | 1,021.03 | + | | | 3.87 | | | | 1,000 | | | | 1,020.04 | + | | | 4.87 | |
| Service | | | | | | | | | | | | | | | | | | | | | | | | | | | | | | | | | | | | | | | | | | | | | | | | |
Actual | | | N/A | | | | N/A | | | | N/A | | | | N/A | | | | N/A | | | | N/A | | | | 1,000 | | | | 998.80 | | | | 6.31 | | | | N/A | | | | N/A | | | | N/A | |
Hypothetical 5% return | | | N/A | | | | N/A | | | | N/A | | | | N/A | | | | N/A | | | | N/A | | | | 1,000 | | | | 1,018.55 | + | | | 6.37 | | | | N/A | | | | N/A | | | | N/A | |
| Class IR | | | | | | | | | | | | | | | | | | | | | | | | | | | | | | | | | | | | | | | | | | | | | | | | |
Actual | | | 1,000 | | | | 1,056.00 | | | | 4.70 | | | | 1,000 | | | | 976.50 | | | | 5.50 | | | | 1,000 | | | | 1,000.00 | | | | 4.57 | | | | 1,000 | | | | 976.90 | | | | 5.51 | |
Hypothetical 5% return | | | 1,000 | | | | 1,020.29 | + | | | 4.62 | | | | 1,000 | | | | 1,019.29 | + | | | 5.62 | | | | 1,000 | | | | 1,020.29 | + | | | 4.62 | | | | 1,000 | | | | 1,019.29 | + | | | 5.62 | |
| * | | Expenses are calculated using each Fund’s annualized net expense ratio for each class, which represents the ongoing expenses as a percentage of net assets for the six months ended June 30, 2016. Expenses are calculated by multiplying the annualized net expense ratio by the average account value for the period; then multiplying the result by the number of days in the most recent fiscal half year; and then dividing that result by the number of days in the fiscal year. The annualized net expense ratios for the period were as follows: |
| | | | | | | | | | | | | | | | | | | | |
| Fund | | Class A | | | Class C | | | Institutional | | | Service | | | Class IR | |
U.S. Equity Dividend and Premium | | | 1.17 | % | | | 1.92 | % | | | 0.77 | % | | | N/A | | | | 0.92 | % |
International Equity Dividend and Premium | | | 1.37 | | | | 2.12 | | | | 0.97 | | | | N/A | | | | 1.12 | |
U.S. Tax-Managed Equity | | | 1.17 | | | | 1.92 | | | | 0.77 | | | | 1.27 | % | | | 0.92 | |
International Tax-Managed Equity | | | 1.37 | | | | 2.12 | | | | 0.97 | | | | N/A | | | | 1.12 | |
| + | | Hypothetical expenses are based on each Fund’s actual annualized net expense ratios and an assumed rate of return of 5% per year before expenses. |
81
GOLDMAN SACHS TAX-ADVANTAGED EQUITY FUNDS
Statement Regarding Basis for Approval of Management Agreement (Unaudited)
Background
The Goldman Sachs International Equity Dividend and Premium Fund, Goldman Sachs International Tax-Managed Equity Fund, Goldman Sachs U.S. Tax-Managed Equity Fund, and Goldman Sachs U.S. Equity Dividend and Premium Fund (the “Funds”) are investment portfolios of Goldman Sachs Trust (the “Trust”). The Board of Trustees oversees the management of the Trust and reviews the investment performance and expenses of the Funds at regularly scheduled meetings held throughout the year. In addition, the Board of Trustees determines annually whether to approve the continuance of the Trust’s investment management agreement (the “Management Agreement”) with Goldman Sachs Asset Management, L.P. (the “Investment Adviser”) on behalf of the Funds.
The Management Agreement was most recently approved for continuation until June 30, 2017 by the Board of Trustees, including those Trustees who are not parties to the Management Agreement or “interested persons” (as defined in the Investment Company Act of 1940, as amended) of any party thereto (the “Independent Trustees”), at a meeting held on June 15-16, 2016 (the “Annual Meeting”).
The review process undertaken by the Trustees spans the course of the year and culminates with the Annual Meeting. To assist the Trustees in their deliberations, the Trustees have established a Contract Review Committee (the “Committee”), comprised of the Independent Trustees. The Committee held three meetings over the course of the year since the Management Agreement was last approved. At those Committee meetings, regularly scheduled Board or other committee meetings, and/or the Annual Meeting, matters relevant to the renewal of the Management Agreement were considered by the Board, or the Independent Trustees, as applicable. With respect to each Fund, such matters included:
| | (a) | | the nature and quality of the advisory, administrative, and other services provided to the Fund by the Investment Adviser and its affiliates, including information about: |
| | (i) | | the structure, staff, and capabilities of the Investment Adviser and its portfolio management teams; |
| | (ii) | | the groups within the Investment Adviser and its affiliates that support the portfolio management teams or provide other types of necessary services, including fund services groups (e.g., accounting and financial reporting, tax, shareholder services, and operations); controls and risk management groups (e.g., legal, compliance, valuation oversight, credit risk management, internal audit, compliance testing, market risk analysis, finance, and central funding); sales and distribution support groups, and others (e.g., information technology and training); |
| | (iii) | | trends in employee headcount; |
| | (iv) | | the Investment Adviser’s financial resources and ability to hire and retain talented personnel and strengthen its operations; and |
| | (v) | | the parent company’s support of the Investment Adviser and its mutual fund business, as expressed by the firm’s senior management; |
| | (b) | | information on the investment performance of the Fund, including comparisons to the performance of similar mutual funds, as provided by a third-party mutual fund data provider engaged as part of the contract review process (the “Outside Data Provider”), a benchmark performance index; and general investment outlooks in the markets in which the Fund invests; |
82
GOLDMAN SACHS TAX-ADVANTAGED EQUITY FUNDS
Statement Regarding Basis for Approval of Management Agreement (Unaudited) (continued)
| | (c) | | information provided by the Investment Adviser indicating the Investment Adviser’s views on whether the Fund’s peer group and/or benchmark index had high, medium, or low relevance given the Fund’s particular investment strategy; |
| | (d) | | the terms of the Management Agreement and other agreements with affiliated service providers entered into by the Trust on behalf of the Fund; |
| | (e) | | fee and expense information for the Fund, including: |
| | (i) | | the relative management fee and expense level of the Fund as compared to those of comparable funds managed by other advisers, as provided by the Outside Data Provider; |
| | (ii) | | the Fund’s expense trends over time; and |
| | (iii) | | to the extent the Investment Adviser manages other types of accounts (such as bank collective trusts, private wealth management accounts, institutional separate accounts, sub-advised mutual funds, and non-U.S. funds) having investment objectives and policies similar to those of the Fund, comparative information on the advisory fees charged and services provided to those accounts by the Investment Adviser; |
| | (f) | | with respect to the extensive investment performance and expense comparison data provided by the Outside Data Provider, its processes in producing that data for the Fund; |
| | (g) | | the undertaking of the Investment Adviser to limit certain expenses of the Fund that exceed a specified level; |
| | (h) | | information relating to the profitability of the Management Agreement and the transfer agency and distribution and service arrangements of the Fund and the Trust as a whole to the Investment Adviser and its affiliates; |
| | (i) | | whether the Fund’s existing management fee schedule adequately addressed any economies of scale; |
| | (j) | | a summary of the “fall-out” benefits derived by the Investment Adviser and its affiliates from their relationships with the Fund, including the fees received by the Investment Adviser’s affiliates from the Fund for transfer agency, securities lending, portfolio trading, distribution and other services; |
| | (k) | | a summary of potential benefits derived by the Fund as a result of its relationship with the Investment Adviser; |
| | (l) | | information regarding commissions paid by the Fund and broker oversight, other information regarding portfolio trading, and how the Investment Adviser carries out its duty to seek best execution; |
| | (m) | | portfolio manager ownership of Fund shares; the manner in which portfolio manager compensation is determined; and the number and types of accounts managed by the portfolio managers; |
| | (n) | | the nature and quality of the services provided to the Fund by its unaffiliated service providers, and the Investment Adviser’s general oversight and evaluation (including reports on due diligence) of those service providers as part of the administration services provided under the Management Agreement; and |
| | (o) | | the Investment Adviser’s processes and policies addressing various types of potential conflicts of interest; its approach to risk management; the annual review of the effectiveness of the Fund’s compliance program; and periodic compliance reports. |
The Trustees also received an overview of the Funds’ distribution arrangements. They received information regarding the Funds’ assets, share purchase and redemption activity, and payment of distribution, service, and shareholder administration fees, as applicable. Information was also provided to the Trustees relating to revenue sharing payments made by and services provided by the Investment Adviser and its affiliates to intermediaries that promote the sale, distribution, and/or servicing of Fund shares. The
83
GOLDMAN SACHS TAX-ADVANTAGED EQUITY FUNDS
Statement Regarding Basis for Approval of Management Agreement (Unaudited) (continued)
Independent Trustees also discussed the broad range of other investment choices that are available to Fund investors, including the availability of comparable funds managed by other advisers.
The presentations made at the Board and Committee meetings and at the Annual Meeting encompassed the Funds and other mutual funds for which the Board of Trustees has responsibility. In evaluating the Management Agreement at the Annual Meeting, the Trustees relied upon their knowledge, resulting from their meetings and other interactions throughout the year, of the Investment Adviser and its affiliates, their services, and the Funds. In conjunction with these meetings, the Trustees received written materials and oral presentations on the topics covered, and the Investment Adviser addressed the questions and concerns of the Trustees, including concerns regarding the investment performance of certain of the funds they oversee. The Independent Trustees were advised by their independent legal counsel regarding their responsibilities and other regulatory requirements related to the approval and continuation of mutual fund investment management agreements under applicable law. In addition, the Investment Adviser and its affiliates provided the Independent Trustees with a written response to a formal request for information sent on behalf of the Independent Trustees by their independent legal counsel. During the course of their deliberations, the Independent Trustees met in executive sessions with their independent legal counsel, without representatives of the Investment Adviser or its affiliates present.
Nature, Extent, and Quality of the Services Provided Under the Management Agreement
As part of their review, the Trustees considered the nature, extent, and quality of the services provided to the Funds by the Investment Adviser. In this regard, the Trustees considered both the investment advisory services and non-advisory services that are provided by the Investment Adviser and its affiliates. The Trustees noted the transition in the leadership and changes in personnel of various of the Investment Adviser’s portfolio management teams that had occurred in recent periods, and the ongoing recruitment efforts aimed at bringing high quality investment talent to the Investment Adviser. They also noted the Investment Adviser’s commitment to maintaining high quality systems and expending substantial resources to respond to ongoing changes to the regulatory and control environment in which the Funds and their service providers operate, as well as the efforts of the Investment Adviser and its affiliates to combat cyber security risks. The Trustees concluded that the Investment Adviser continued to commit substantial financial and operational resources to the Funds and expressed confidence that the Investment Adviser would continue to do so in the future. The Trustees also recognized that the Investment Adviser had made significant commitments to address regulatory compliance requirements applicable to the Funds and the Investment Adviser and its affiliates.
Investment Performance
The Trustees also considered the investment performance of the Funds. In this regard, they compared the investment performance of each Fund to its peers using rankings and ratings compiled by the Outside Data Provider as of December 31, 2015, and updated performance information prepared by the Investment Adviser using the peer group identified by the Outside Data Provider as of March 31, 2016. The information on each Fund’s investment performance was provided for the one-, three-, five-, and ten-year periods ending on the applicable dates, to the extent that each Fund had been in existence for those periods. The Trustees also reviewed each Fund’s investment performance relative to its performance benchmark. As part of this review, they considered the investment performance trends of the Funds over time, and reviewed the investment performance of each Fund in light of its investment objective and policies and market conditions.
84
GOLDMAN SACHS TAX-ADVANTAGED EQUITY FUNDS
Statement Regarding Basis for Approval of Management Agreement (Unaudited) (continued)
In addition, the Trustees considered materials prepared and presentations made by the Investment Adviser’s senior management and portfolio management personnel in which Fund performance was assessed. The Trustees also considered the Investment Adviser’s periodic reports with respect to the Funds’ risk profiles, and how the Investment Adviser’s approach to risk monitoring and management influences portfolio management. They noted the efforts of the Funds’ portfolio management team to continue to enhance the investment models used in managing the Funds.
The Trustees observed that the U.S. Tax-Managed Equity Fund’s Institutional Shares had placed in the first quartile of the Fund’s peer group for the three- and five-year periods and in the third quartile for the one- and ten-year periods, and had outperformed the Fund’s benchmark index for the three- and five-year periods and underperformed for the one- and ten-year periods ended March 31, 2016. They noted that the International Tax-Managed Equity Fund’s Institutional Shares had placed in the first quartile of the Fund’s peer group and had outperformed the Fund’s benchmark index for the one-, three-, and five-year periods ended March 31, 2016. They also noted that the U.S. Tax-Managed Equity Fund and International Tax-Managed Equity Fund had experienced certain portfolio management changes in the first quarter of 2016. The Trustees observed that the U.S. Equity Dividend and Premium Fund’s Institutional Shares had placed in the top half of the Fund’s peer group for the one-, three-, five-, and ten-year periods, and had outperformed the Fund’s benchmark index for the one-year period and underperformed for the three-, five-, and ten-year periods ended March 31, 2016. They noted that the International Equity Dividend and Premium Fund’s Institutional Shares had placed in the top half of the Fund’s peer group for the one-year period and in the third quartile for the three- and five-year periods, and had outperformed the Fund’s benchmark index for the one-year period and underperformed for the three- and five-year periods ended March 31, 2016.
Costs of Services Provided and Competitive Information
The Trustees considered the contractual terms of the Management Agreement and the fee rates payable by each Fund thereunder. In this regard, the Trustees considered information on the services rendered by the Investment Adviser to the Funds, which included both advisory and administrative services that were directed to the needs and operations of the Funds as registered mutual funds.
In particular, the Trustees reviewed analyses prepared by the Outside Data Provider regarding the expense rankings of the Funds. The analyses provided a comparison of each Fund’s management fee and breakpoints to those of a relevant peer group and category universe; an expense analysis which compared each Fund’s overall net and gross expenses to a peer group and a category universe; and a five-year history comparing each Fund’s net expenses to the peer and category medians. The analyses also compared each Fund’s transfer agency, custody, and distribution fees, other expenses and fee waivers/reimbursements to those of the peer group and category medians. The Trustees concluded that the comparisons provided by the Outside Data Provider were useful in evaluating the reasonableness of the management fees and total expenses paid by the Funds.
In addition, the Trustees considered the Investment Adviser’s undertaking to limit certain expenses of the Funds that exceed specified levels. The Trustees also noted that certain changes were being made to existing fee waiver or expense limitation arrangements of the International Tax-Managed Equity Fund and the U.S. Equity Dividend and Premium Fund that would have the effect of decreasing total Fund expenses, with such changes taking effect in connection with the Funds’ next annual registration statement update. They also considered, to the extent that the Investment Adviser manages other types of accounts having investment objectives and policies similar to those of the Funds, comparative fee information for services provided by the
85
GOLDMAN SACHS TAX-ADVANTAGED EQUITY FUNDS
Statement Regarding Basis for Approval of Management Agreement (Unaudited) (continued)
Investment Adviser to those accounts, and information that indicated that services provided to the Funds differed in various significant respects from the services provided to other types of accounts which, in many cases, operated under less stringent legal and regulatory structures, required fewer services from the Investment Adviser to a smaller number of client contact points, and were less time-intensive.
In addition, the Trustees noted that shareholders are able to redeem their Fund shares at any time if shareholders believe that the Fund fees and expenses are too high or if they are dissatisfied with the performance of a Fund.
Profitability
The Trustees reviewed the Investment Adviser’s revenues and pre-tax profit margins with respect to the Trust and each of the Funds. In this regard the Trustees noted that they had received, among other things, profitability analyses and summaries, revenue and expense schedules by Fund and by function (i.e., investment management, transfer agency and distribution and service), and information on the Investment Adviser’s expense allocation methodology. They observed that the profitability and expense figures are substantially similar to those used by the Investment Adviser for many internal purposes, including compensation decisions among various business groups, and are thus subject to a vigorous internal debate about how certain revenue and expenses should be allocated. The Trustees also noted that the internal audit group within the Goldman Sachs organization had audited the expense allocation methodology and was satisfied with the reasonableness, consistency, and accuracy of the Investment Adviser’s expense allocation methodology and profitability analysis calculations. Profitability data for the Trust and each Fund were provided for 2015 and 2014, and the Trustees considered this information in relation to the Investment Adviser’s overall profitability. The Trustees considered the Investment Adviser’s revenues and pre-tax profit margins both in absolute terms and in comparison to information on the reported pre-tax profit margins earned by certain other asset management firms.
Economies of Scale
The Trustees considered the information that had been provided regarding the Investment Adviser’s profitability. The Trustees also considered the breakpoints in the fee rate payable under the Management Agreement for each of the Funds at the following annual percentage rates of the average daily net assets of the Funds:
| | | | | | | | | | | | | | | | |
| | | International
Equity Dividend
and Premium
Fund | | | International
Tax-Managed
Equity Fund | | | U.S. Tax-
Managed Equity
Fund | | | U.S. Equity
Dividend and
Premium Fund | |
| First $1 billion | | | 0.81 | % | | | 0.85 | % | | | 0.70 | % | | | 0.75 | % |
| Next $1 billion | | | 0.73 | | | | 0.77 | | | | 0.63 | | | | 0.68 | |
| Next $3 billion | | | 0.69 | | | | 0.73 | | | | 0.60 | | | | 0.65 | |
| Next $3 billion | | | 0.68 | | | | 0.72 | | | | 0.59 | | | | 0.64 | |
| Over $8 billion | | | 0.67 | | | | 0.71 | | | | 0.58 | | | | 0.63 | |
86
GOLDMAN SACHS TAX-ADVANTAGED EQUITY FUNDS
Statement Regarding Basis for Approval of Management Agreement (Unaudited) (continued)
The Trustees noted that the breakpoints were designed to share potential economies of scale, if any, with the Funds and their shareholders as assets under management reach those asset levels. The Trustees considered the amounts of assets in the Funds; the Funds’ recent share purchase and redemption activity; the information provided by the Investment Adviser relating to the costs of the services provided by the Investment Adviser and its affiliates and their realized profits; information comparing fee rates charged by the Investment Adviser with fee rates charged to other funds in the peer groups; and the Investment Adviser’s undertaking to limit certain expenses of the Funds that exceed specified levels. Upon reviewing these matters at the Annual Meeting, the Trustees concluded that the fee breakpoints represented a means of assuring that benefits of scalability, if any, would be passed along to shareholders at the specified asset levels. They also noted that the Investment Adviser had passed along savings to shareholders of the U.S. Equity Dividend and Premium Fund and the U.S. Tax-Managed Equity Fund, which had asset levels above at least the first breakpoint during the prior fiscal year.
Other Benefits to the Investment Adviser and Its Affiliates
The Trustees also considered the other benefits derived by the Investment Adviser and its affiliates from their relationships with the Funds as stated above, including: (a) transfer agency fees received by Goldman, Sachs & Co. (“Goldman Sachs”); (b) brokerage and futures commissions earned by Goldman Sachs for executing securities and futures transactions on behalf of the Funds; (c) trading efficiencies resulting from aggregation of orders of the Funds with those for other funds or accounts managed by the Investment Adviser; (d) fees earned by Goldman Sachs Agency Lending (“GSAL”), an affiliate of the Investment Adviser, as securities lending agent (and fees earned by the Investment Adviser for managing the fund in which the Funds’ cash collateral is invested); (e) the Investment Adviser’s ability to leverage the infrastructure designed to service the Funds on behalf of its other clients; (f) the Investment Adviser’s ability to cross-market other products and services to Fund shareholders; (g) Goldman Sachs’ retention of certain fees as Fund Distributor; (h) the Investment Adviser’s ability to negotiate better pricing with custodians on behalf of its other clients, as a result of the relationship with the Funds; and (i) the possibility that the working relationship between the Investment Adviser and the Funds’ third-party service providers may cause those service providers to be more likely to do business with other areas of Goldman Sachs. In the course of considering the foregoing, the Independent Trustees requested and received further information quantifying certain of these fall-out benefits.
Other Benefits to the Funds and Their Shareholders
The Trustees also noted that the Funds receive certain potential benefits as a result of their relationship with the Investment Adviser, including: (a) trading efficiencies resulting from aggregation of orders of the Funds with those of other funds or accounts managed by the Investment Adviser; (b) enhanced servicing from vendors because of the volume of business generated by the Investment Adviser and its affiliates; (c) enhanced servicing from broker-dealers because of the volume of business generated by the Investment Adviser and its affiliates; (d) the Investment Adviser’s ability to negotiate favorable terms with derivatives counterparties on behalf of the Funds as a result of the size and reputation of the Goldman Sachs organization; (e) the Investment Adviser’s knowledge and experience gained from managing other accounts and products; (f) the Investment Adviser’s ability to hire and retain qualified personnel to provide services to the Funds because of the reputation of the Goldman Sachs organization; (g) the Funds’ access, through the Investment Adviser, to certain firmwide resources (e.g., proprietary risk management systems
87
GOLDMAN SACHS TAX-ADVANTAGED EQUITY FUNDS
Statement Regarding Basis for Approval of Management Agreement (Unaudited) (continued)
and databases), subject to certain restrictions; (h) the International Tax-Managed Equity Fund and U.S. Tax-Managed Equity Fund’s ability to participate in the securities lending program administered by GSAL, as measured by the revenue received by the Funds in connection with the program; and (i) the Funds’ access to certain affiliated distribution channels. In addition, the Trustees noted the competitive nature of the mutual fund marketplace, and considered that many of the Funds’ shareholders invested in the Funds in part because of the Funds’ relationship with the Investment Adviser and that those shareholders have a general expectation that the relationship will continue.
Conclusion
In connection with their consideration of the Management Agreement, the Trustees gave weight to each of the factors described above, but did not identify any particular factor as controlling their decision. After deliberation and consideration of all of the information provided, including the factors described above, the Trustees concluded, in the exercise of their business judgment, that the management fees paid by each of the Funds were reasonable in light of the services provided to it by the Investment Adviser, the Investment Adviser’s costs and each Fund’s current and reasonably foreseeable asset levels. The Trustees unanimously concluded that the Investment Adviser’s continued management likely would benefit each Fund and its shareholders and that the Management Agreement should be approved and continued with respect to each Fund until June 30, 2017.
88
FUNDS PROFILE
Goldman Sachs Funds

Goldman Sachs is a premier financial services firm, known since 1869 for creating thoughtful and customized investment solutions in complex global markets.
Today, the Investment Management Division of Goldman Sachs serves a diverse set of clients worldwide, including private institutions, public entities and individuals. With approximately $1.12 trillion in assets under supervision as of June 30, 2016, Goldman Sachs Asset Management (“GSAM”) has portfolio management teams located around the world and our investment professionals bring firsthand knowledge of local markets to every investment decision. Assets under supervision includes assets under management and other client assets for which Goldman Sachs does not have full discretion. GSAM leverages the resources of Goldman, Sachs & Co. subject to legal, internal and regulatory restrictions.

Money Market1
Financial Square FundsSM
| n | | Financial Square Treasury Solutions Fund2 |
| n | | Financial Square Government Fund |
| n | | Financial Square Money Market Fund |
| n | | Financial Square Prime Obligations Fund |
| n | | Financial Square Treasury Instruments Fund |
| n | | Financial Square Treasury Obligations Fund |
| n | | Financial Square Federal Instruments Fund |
| n | | Financial Square Tax-Exempt Money Market Fund |
Investor FundsSM
| n | | Investor Money Market Fund |
| n | | Investor Tax-Exempt Money Market Fund3 |
Fixed Income
Short Duration and Government
| n | | High Quality Floating Rate Fund |
| n | | Short-Term Conservative Income Fund4 |
| n | | Short Duration Government Fund |
| n | | Short Duration Income Fund |
| n | | Inflation Protected Securities Fund |
Multi-Sector
Municipal and Tax-Free
| n | | High Yield Municipal Fund |
| n | | Dynamic Municipal Income Fund |
| n | | Short Duration Tax-Free Fund |
Single Sector
| n | | Investment Grade Credit Fund |
| n | | High Yield Floating Rate Fund |
| n | | Emerging Markets Debt Fund |
| n | | Local Emerging Markets Debt Fund |
| n | | Dynamic Emerging Markets Debt Fund |
Fixed Income Alternatives
| n | | Long Short Credit Strategies Fund |
| n | | Fixed Income Macro Strategies Fund |
Fundamental Equity
| n | | Small/Mid Cap Value Fund |
| n | | Small/Mid Cap Growth Fund |
| n | | Flexible Cap Growth Fund |
| n | | Concentrated Growth Fund |
| n | | Technology Opportunities Fund5 |
| n | | Growth Opportunities Fund |
| n | | Rising Dividend Growth Fund |
| n | | Dynamic U.S. Equity Fund |
Tax-Advantaged Equity
| n | | U.S. Tax-Managed Equity Fund |
| n | | International Tax-Managed Equity Fund |
| n | | U.S. Equity Dividend and Premium Fund |
| n | | International Equity Dividend and Premium Fund |
Equity Insights
| n | | Small Cap Equity Insights Fund |
| n | | U.S. Equity Insights Fund |
| n | | Small Cap Growth Insights Fund |
| n | | Large Cap Growth Insights Fund |
| n | | Large Cap Value Insights Fund |
| n | | Small Cap Value Insights Fund |
| n | | International Small Cap Insights Fund6 |
| n | | International Equity Insights Fund |
| n | | Emerging Markets Equity Insights Fund |
Fundamental Equity International
| n | | Strategic International Equity Fund |
| n | | Focused International Equity Fund |
| n | | Emerging Markets Equity Fund7 |
Select Satellite8
| n | | Real Estate Securities Fund |
| n | | International Real Estate Securities Fund |
| n | | Commodity Strategy Fund |
| n | | Global Real Estate Securities Fund |
| n | | Dynamic Commodity Strategy Fund |
| n | | Dynamic Allocation Fund |
| n | | Absolute Return Tracker Fund |
| n | | Managed Futures Strategy Fund |
| n | | MLP Energy Infrastructure Fund |
| n | | Multi-Manager Alternatives Fund |
| n | | Multi-Asset Real Return Fund |
| n | | Absolute Return Multi-Asset Fund |
| n | | Global Infrastructure Fund |
Total Portfolio Solutions8
| n | | Global Managed Beta Fund |
| n | | Multi-Manager Non-Core Fixed Income Fund |
| n | | Multi-Manager U.S. Dynamic Equity Fund |
| n | | Multi-Manager Global Equity Fund |
| n | | Multi-Manager International Equity Fund |
| n | | Tactical Tilt Overlay Fund9 |
| n | | Balanced Strategy Portfolio |
| n | | Multi-Manager U.S. Small Cap Equity Fund |
| n | | Multi-Manager Real Assets Strategy Fund |
| n | | Growth and Income Strategy Portfolio |
| n | | Growth Strategy Portfolio |
| n | | Equity Growth Strategy Portfolio |
| n | | Satellite Strategies Portfolio |
| n | | Enhanced Dividend Global Equity Portfolio |
| n | | Tax Advantaged Global Equity Portfolio |
| n | | Strategic Factor Allocation Fund |
| 1 | | An investment in a money market portfolio is not insured or guaranteed by the Federal Deposit Insurance Corporation or any other government agency. Although a money market portfolio seeks to preserve the value of an investment at $1.00 per share, it is possible to lose money by investing in a money market portfolio. The Fund’s sponsor has no legal obligation to provide financial support to a money market portfolio, and you should not expect that the sponsor will provide financial support to the money market portfolio at any time. |
| 2 | | Effective on September 30, 2015, the Goldman Sachs Financial Square Federal Fund was renamed the Goldman Sachs Financial Square Treasury Solutions Fund. |
| 3 | | Effective on March 31, 2016, the Goldman Sachs Financial Square Tax-Free Money Market Fund was renamed the Goldman Sachs Investor Tax-Exempt Money Market Fund. |
| 4 | | Effective on July 29, 2016, the Goldman Sachs Limited Maturity Obligations Fund was renamed the Goldman Sachs Short-Term Conservative Income Fund. |
| 5 | | Effective on July 31, 2015, the Goldman Sachs Technology Tollkeeper Fund was renamed the Goldman Sachs Technology Opportunities Fund. |
| 6 | | Effective at the close of business on February 5, 2016, the Goldman Sachs International Small Cap Fund was reorganized with and into the Goldman Sachs International Small Cap Insights Fund. |
| 7 | | Effective at the close of business on October 23, 2015, the Goldman Sachs BRIC Fund (Brazil, Russia, India, China) was reorganized with and into the Goldman Sachs Emerging Markets Equity Fund. |
| 8 | | Individual Funds within the Total Portfolio Solutions and Select Satellite categories will have various placement on the risk/return spectrum and may have greater or lesser risk than that indicated by the placement of the general Total Portfolio Solutions or Select Satellite category. |
| 9 | | Effective on June 1, 2016, the Goldman Sachs Tactical Tilt Implementation Fund was renamed the Goldman Sachs Tactical Tilt Overlay Fund. Financial Square FundsSM and Investor FundsSM are registered service marks of Goldman, Sachs & Co. |
| * | | This list covers open-end funds only. Please visit our website at www.GSAMFUNDS.com to learn about our closed-end funds and exchange-traded funds. |
| | |
TRUSTEES Ashok N. Bakhru, Chairman Kathryn A. Cassidy Diana M. Daniels Herbert J. Markley James A. McNamara Jessica Palmer Alan A. Shuch Roy W. Templin Gregory G. Weaver | | OFFICERS James A. McNamara, President Scott M. McHugh, Principal Financial Officer, Senior Vice President and Treasurer Caroline L. Kraus, Secretary |
| |
GOLDMAN, SACHS & CO. Distributor and Transfer Agent | | GOLDMAN SACHS ASSET MANAGEMENT, L.P. Investment Adviser |
Visit our web site at www.GSAMFUNDS.com to obtain the most recent month-end returns.
Goldman Sachs Asset Management, L.P. 200 West Street, New York, New York 10282
The reports concerning the Funds included in this shareholder report may contain certain forward-looking statements about the factors that may affect the performance of the Funds in the future. These statements are based on Fund management’s predictions and expectations concerning certain future events and their expected impact on the Funds, such as performance of the economy as a whole and of specific industry sectors, changes in the levels of interest rates, the impact of developing world events, and other factors that may influence the future performance of the Funds. Management believes these forward-looking statements to be reasonable, although they are inherently uncertain and difficult to predict. Actual events may cause adjustments in portfolio management strategies from those currently expected to be employed.
A description of the policies and procedures that the Funds use to determine how to vote proxies relating to portfolio securities and information regarding how a Fund voted proxies relating to portfolio securities during the most recent 12-month period ended June 30 is available (i) without charge, upon request by calling 1-800-526-7384 (for Retail Shareholders) or 1-800-621-2550 (for Institutional Shareholders); and (ii) on the Securities and Exchange Commission (“SEC”) web site at http://www.sec.gov.
The Funds file their complete schedule of portfolio holdings with the SEC for the first and third quarters of each fiscal year on Form N-Q. The Funds’ Forms N-Q are available on the SEC’s web site at http://www.sec.gov within 60 days after the Funds’ first and third fiscal quarters. The Funds’ Forms N-Q may be reviewed and copied at the SEC’s Public Reference Room in Washington, D.C. and information on the operation of the Public Reference Room may also be obtained by calling 1-800-SEC-0330. Forms N-Q may be obtained upon request and without charge by calling 1-800-526-7384 (for Retail Shareholders) or 1-800-621-2550 (for Institutional Shareholders).
Goldman, Sachs & Co. (‘‘Goldman Sachs’’) does not provide legal, tax or accounting advice. Any statement contained in this communication (including any attachments) concerning U.S. tax matters was not intended or written to be used, and cannot be used, for the purpose of avoiding penalties under the Internal Revenue Code, and was written to support the promotion or marketing of the transaction(s) or matter(s) addressed. Clients of Goldman Sachs should obtain their own independent tax advice based on their particular circumstances.
Holdings and allocations shown are as of June 30, 2016 and may not be representative of future investments. Fund holdings should not be relied on in making investment decisions and should not be construed as research or investment advice regarding particular securities. Current and future holdings are subject to risk.
The Global Industry Classification Standard (GICS) was developed by and is the exclusive property and a service mark of Morgan Stanley Capital International Inc. (MSCI) and Standard & Poor’s, a division of The McGraw-Hill Companies, Inc. (S&P) and is licensed for use by Goldman Sachs. Neither MSCI, S&P nor any other party involved in making or compiling the GICS or any GICS classifications makes any express or implied warranties or representations with respect to such standard or classification (or the results to be obtained by the use thereof), and all such parties hereby expressly disclaim all warranties of originality, accuracy, completeness, merchantability or fitness for a particular purpose with respect to any of such standard or classification. Without limiting any of the foregoing, in no event shall MSCI, S&P, any of their affiliates or any third party involved in making or compiling the GICS or any GICS classifications have any liability for any direct, indirect, special, punitive, consequential or any other damages (including lost profits) even if notified of the possibility of such damages.
The portfolio risk management process includes an effort to monitor and manage risk, but does not imply low risk.
This material is not authorized for distribution to prospective investors unless preceded or accompanied by a current Prospectus or summary prospectus, if applicable. Investors should consider a Fund’s objective, risks, and charges and expenses, and read the summary prospectus, if available, and/or the Prospectus carefully before investing or sending money. The summary prospectus, if available, and the Prospectus contain this and other information about a Fund and may be obtained from your Authorized Institution or from Goldman, Sachs & Co. by calling (retail – 1-800-526-7384) (institutional – 1-800-621-2550).
© 2016 Goldman Sachs. All rights reserved. 58902-TMPL-08/2016 TAXADVSAR-16/18.7K
(a) As of the end of the period covered by this report, the registrant has adopted a code of ethics that applies to the registrant’s principal executive officer, principal financial officer, principal accounting officer or controller, or persons performing similar functions, regardless of whether these individuals are employed by the registrant or a third party (the “Code of Ethics”).
(b) During the period covered by this report, no amendments were made to the provisions of the Code of Ethics.
(c) During the period covered by this report, the registrant did not grant any waivers, including an implicit waiver, from any provision of the Code of Ethics.
(d) A copy of the Code of Ethics is available as provided in Item 12(a)(1) of this report.
| ITEM 3. | AUDIT COMMITTEE FINANCIAL EXPERT. |
The registrant’s board of trustees has determined that the registrant has at least one “audit committee financial expert” (as defined in Item 3 of Form N-CSR) serving on its audit committee. Gregory G. Weaver is the “audit committee financial expert” and is “independent” (as each term is defined in Item 3 of Form N-CSR).
| ITEM 4. | PRINCIPAL ACCOUNTANT FEES AND SERVICES. |
The information required by this Item is only required in an annual report on this Form N-CSR.
| ITEM 5. | AUDIT COMMITTEE OF LISTED REGISTRANTS. |
| ITEM 6. | SCHEDULE OF INVESTMENTS. |
| | Schedule of Investments is included as part of the Report to Shareholders filed under Item 1. |
| ITEM 7. | DISCLOSURE OF PROXY VOTING POLICIES AND PROCEDURES FOR CLOSED-END MANAGEMENT INVESTMENT COMPANIES. |
| ITEM 8. | PORTFOLIO MANAGERS OF CLOSED-END MANAGEMENT INVESTMENT COMPANIES. |
| ITEM 9. | PURCHASES OF EQUITY SECURITIES BY CLOSED-END MANAGEMENT INVESTMENT COMPANY AND AFFILIATED PURCHASERS. |
| ITEM 10. | SUBMISSION OF MATTERS TO A VOTE OF SECURITY HOLDERS. |
| | There have been no material changes to the procedures by which shareholders may recommend nominees to the registrant’s board of trustees. |
| ITEM 11. | CONTROLS AND PROCEDURES. |
| | (a) | The registrant’s principal executive and principal financial officers, or persons performing similar functions have concluded that the registrant’s disclosure controls and procedures (as defined in Rule 30a-3(c) under the Investment Company Act of 1940, as amended (the “1940 Act”)) are effective as of a date within 90 days of the filing of this report that includes the disclosure required by this paragraph, based on the evaluation of these controls and procedures required by Rule 30a-3(b) under the 1940 Act and 15d-15(b) under the Securities Exchange Act of 1934, as amended. |
| | (b) | There were no changes in the registrant’s internal control over financial reporting (as defined in Rule 30a-3(d) under the 1940 Act) that occurred during the registrant’s second fiscal quarter of the period covered by this report that have materially affected, or are reasonably likely to materially affect, the registrant’s internal control over financial reporting. |
| | | | |
| (a)(1) | | Goldman Sachs Trust’s Code of Ethics for Principal Executive and Senior Financial Officers is incorporated by reference to Exhibit 12(a)(1) of the registrant’s Form N-CSR filed on July 8, 2015 for its International Equity Insights Funds. |
| | |
| (a)(2) | | Exhibit 99.CERT | | Certifications pursuant to Section 302 of the Sarbanes-Oxley Act of 2002 filed herewith. |
| | |
| (b) | | Exhibit 99.906CERT | | Certifications pursuant to Section 906 of the Sarbanes-Oxley Act of 2002 filed herewith. |
SIGNATURES
Pursuant to the requirements of the Securities Exchange Act of 1934 and the Investment Company Act of 1940, the registrant has duly caused this report to be signed on its behalf by the undersigned, thereunto duly authorized.
| | |
| | | Goldman Sachs Trust |
| |
| By: | | /s/ James A. McNamara |
| |
| | |
| | James A. McNamara |
| | President/Chief Executive Officer |
| | Goldman Sachs Trust |
| |
| Date: | | September 2, 2016 |
Pursuant to the requirements of the Securities Exchange Act of 1934 and the Investment Company Act of 1940, this report has been signed below by the following persons on behalf of the registrant and in the capacities and on the dates indicated.
| | |
| By: | | /s/ James A. McNamara |
| |
| | |
| | James A. McNamara |
| | President/Chief Executive Officer |
| | Goldman Sachs Trust |
| |
| Date: | | September 2, 2016 |
| |
| By: | | /s/ Scott McHugh |
| |
| | |
| | Scott McHugh |
| | Principal Financial Officer |
| | Goldman Sachs Trust |
| |
| Date: | | September 2, 2016 |