UNITED STATES
SECURITIES AND EXCHANGE COMMISSION
Washington, D.C. 20549
FORM N-CSR
CERTIFIED SHAREHOLDER REPORT OF REGISTERED
MANAGEMENT INVESTMENT COMPANIES
Investment Company Act file number 811-05349
Goldman Sachs Trust
(Exact name of registrant as specified in charter)
71 South Wacker Drive, Chicago, Illinois 60606
(Address of principal executive offices) (Zip code)
| | |
| Caroline Kraus, Esq. | | Copies to: |
| Goldman, Sachs & Co. | | Geoffrey R.T. Kenyon, Esq. |
| 200 West Street | | Dechert LLP |
| New York, New York 10282 | | 100 Oliver Street |
| | 40th Floor |
| | Boston, MA 02110-2605 |
(Name and address of agents for service)
Registrant’s telephone number, including area code: (312) 655-4400
Date of fiscal year end: August 31
Date of reporting period: February 28, 2017
| ITEM 1. | REPORTS TO STOCKHOLDERS. |
| | The Semi-Annual Report to Shareholders is filed herewith. |
Goldman Sachs Funds

| | | | |
| | |
| Semi-Annual Report | | | | February 28, 2017 |
| | |
| | | | Financial Square FundsSM |
| | | | Federal Instruments |
| | | | Government |
| | | | Money Market |
| | | | Prime Obligations |
| | | | Tax-Exempt Money Market |
| | | | Treasury Instruments |
| | | | Treasury Obligations |
| | | | Treasury Solutions |

Goldman Sachs Financial Square Funds
| ∎ | | FEDERAL INSTRUMENTS FUND |
| ∎ | | TAX-EXEMPT MONEY MARKET FUND |
| ∎ | | TREASURY INSTRUMENTS FUND |
| ∎ | | TREASURY OBLIGATIONS FUND |
| ∎ | | TREASURY SOLUTIONS FUND |
| | | | |
TABLE OF CONTENTS | | | | |
| |
Portfolio Management Discussion and Analysis | | | 1 | |
| |
Fund Basics | | | 5 | |
| |
Yield Summary | | | 7 | |
| |
Sector Allocations | | | 8 | |
| |
Schedules of Investments | | | 11 | |
| |
Financial Statements | | | 38 | |
| |
Financial Highlights | | | 46 | |
| |
Notes to Financial Statements | | | 62 | |
| |
Other Information | | | 77 | |
| | | | |
| | | |
| NOT FDIC-INSURED | | May Lose Value | | No Bank Guarantee |
PORTFOLIO RESULTS
Goldman Sachs Financial Square Funds
Portfolio Management Discussion and Analysis
Below, the Goldman Sachs Money Market Portfolio Management Team discusses the Goldman Sachs Financial Square Funds’ (the “Funds”) performance and positioning for the six-month period ended February 28, 2017 (the “Reporting Period”).
| Q | | What economic and market factors most influenced the money markets as a whole during the Reporting Period? |
| A | | During the Reporting Period, U.S. money market fund reform and the U.S. presidential election were among the most significant events influencing the front, or short-term, end of the taxable and tax-exempt money market yield curves. Yield curve is a spectrum of maturities. |
| | When the Reporting Period began in September 2016, credit spreads (the difference in yields between government and taxable bonds of comparable maturity) widened in advance of money market fund reform, with final implementation taking effect in October 2016. Meanwhile, the agency floater curve steepened, as LIBOR widened and interest in shorter floaters amongst market participants increased. (LIBOR, or the London Inter-Bank Offered Rate, is the interest rate that banks charge each other for short-term loans.) The BofA Merrill Lynch U.S. Dollar Three-Month LIBOR Constant Maturity Index spiked to its highest level since the 2008 financial crisis. However, unlike in 2008, funding costs for banks did not increase due to market stress. Instead, spreads widened because of declining demand, as prime money market funds had been a key source of short-term bank funding. (Prime money market funds primarily invest in corporate debt securities.) Most of the flows went into government money market funds that invest in agencies — and may offer higher yields benchmarked to LIBOR — benefiting government yields and reducing pressure on U.S. Treasury yields. During September and October 2016, prime money market funds lost approximately $440 billion in assets, while government money market funds gained $410 billion in assets.* After money market fund reform was implemented on October 14, 2016, credit spreads gradually tightened to end the Reporting Period at widths seen at the beginning of 2016. |
| | Money market fund reform also impacted tax-exempt money market funds, with investment outflows reducing demand for one-day to seven-day maturities. In tandem with the outflows, the Securities Industry and Financial Markets Association (“SIFMA”) Municipal Swap Index, representing seven-day tax-exempt variable rate demand obligations, rose. |
| | In November 2016, Donald Trump’s victory in the U.S. presidential election was widely viewed as a potential regime change in monetary and fiscal policy. The U.S. Treasury yield curve steepened as the markets began pricing in higher inflation due to greater anticipated government fiscal spending. |
| | In December 2016, in a move widely expected by the markets, the Federal Reserve (the “Fed”) raised interest rates for the second time since the 2008 global financial crisis. Fed policymakers also raised their interest rate projections on the back of continued improvement in the U.S. labor market, rising wages and the potential of fiscal policy initiatives by the Trump administration. After the December 2016 policy meeting, market expectations increased for additional Fed rate hikes in 2017, and money market yields generally moved higher. |
| Q | | What key factors were responsible for the performance of the Funds during the Reporting Period? |
| A | | The taxable and tax-exempt Funds’ yields rose during the Reporting Period, driven by the increase in money market yields, which was due primarily to the economic and market factors discussed above. Yields along the taxable money market yield curve rose, but the difference in yields between those on the shorter-term end of the curve and those on the longer-term end of the curve ended the Reporting Period near where it started. The tax-exempt money market yield curve steepened during the Reporting Period. |
| | The interest rate and market environment did not provide bountiful opportunities to pick up additional yield. However, in keeping with our investment approach, we sought to position the Funds to take advantage of changes in the interest rate environment, and throughout the Reporting Period, we found pockets of opportunity to add extra yield. That said, it should be noted that regardless of interest rate conditions, we seek to manage the Funds consistently. Our investment approach has always been tri-fold — to seek preservation of capital, daily liquidity and maximization of yield potential. We manage interest and credit risk daily. Whether interest rates are historically low, high or in-between, we intend to |
1
PORTFOLIO RESULTS
| | continue to use our actively managed approach to seek to provide the best possible return within the framework of the Funds’ guidelines and objectives. |
| Q | | How did you manage the taxable Funds during the Reporting Period? |
| A | | Collectively, the taxable Funds had investments in commercial paper, asset-backed commercial paper, U.S. Treasury securities, government agency securities, repurchase agreements (“repos”), government guaranteed paper, time deposits, certificates of deposit, variable rate demand notes and municipal securities during the Reporting Period. |
| | In our taxable commercial paper strategies (i.e., the Goldman Sachs Financial Square Money Market Fund and the Goldman Sachs Financial Square Prime Obligations Fund), we maintained an especially low weighted average maturity of less than 10 days, along with high levels of liquidity, as the implementation of money market fund reform approached and amid uncertainty about investment flows from prime money market funds to government money market funds. Following the implementation of money market fund reform, investment flows into prime money market funds stabilized, and we gradually extended the weighted average maturity of our taxable commercial paper strategies. Toward the end of January 2017, as credit spreads normalized and we sought to add yield, we meaningfully extended the weighted average maturity of our taxable commercial paper strategies to a range of between 30 days and 40 days. |
| | Because we were skeptical about chances of a Fed interest rate hike in September 2016, we extended the weighted average maturity of our taxable government repo strategies (i.e., the Goldman Sachs Financial Square Government Fund, the Goldman Sachs Financial Square Treasury Obligations Fund and the Goldman Sachs Financial Square Treasury Solutions Fund) and our taxable government non-repo strategies (i.e., the Goldman Sachs Financial Square Federal Instruments Fund and the Goldman Sachs Financial Square Treasury Instruments Fund). We focused Fund purchases on LIBOR floaters. As already mentioned, LIBOR widened heading into U.S. money market fund reform, and interest in shorter floaters among market participants increased. During the period when the floater curve was steep, we focused on longer, i.e. 12- to 18-month final, three-month LIBOR floaters. As that curve began to flatten in the late summer of 2016, we adjusted and expressed this view via shorter, i.e. six-month final, three-month LIBOR floaters. In November 2016, we extended the weighted average maturity of our taxable government repo strategies and our taxable government non-repo strategies to take advantage of an increase in yields. We also added positions that we thought would perform well even if the Fed raised interest rates more aggressively than the market expected. Toward the end of the Reporting Period, we reduced the weighted average maturity of our taxable government repo and non-repo strategies in anticipation of the March 2017 federal debt ceiling deadline. (In 2015, Congress and the White House agreed to suspend the federal debt limit until March 15, 2017. After that date, the government cannot continue to borrow money to pay its obligations.) |
| Q | | How did you manage the tax-exempt Fund during the Reporting Period? |
| A | | During the Reporting Period, the tax-exempt Fund (i.e., the Goldman Sachs Financial Square Tax-Exempt Money Market Fund) had investments in variable rate demand notes (“VRDNs”), tax-exempt commercial paper and municipal put bonds. |
| | We maintained a particularly low weighted average maturity and a high level of liquidity in the tax-exempt Fund in response to money market fund reform, which reduced demand for short-term money market securities. Tax-exempt mutual funds overall lost more than $78 billion in assets during the summer of 2016 and had regained only $3 billion in assets by the end of the Reporting Period.* In November 2016, we extended the weighted average maturity of the tax-exempt Fund, maintaining it in a range of between 23 days and 35 days for the rest of the Reporting Period. We focused on securities scheduled to mature in late June 2017, as they generally offered higher yields than shorter maturities and also offered, in our view, some protection should the Fed raise interest rates multiple times in 2017. |
| Q | | Did you make any changes to the Funds’ portfolios during the Reporting Period? |
| A | | During the Reporting Period, we made adjustments to the Funds’ weighted average maturities and their allocations to specific investments based on then-current market conditions, our near-term view and anticipated and actual Fed monetary policy statements. |
| Q | | What is the Funds’ tactical view and strategy for the months ahead? |
| A | | At the end of the Reporting Period, we expected U.S. economic growth to accelerate in the near term, driven by |
2
PORTFOLIO RESULTS
| | strong domestic demand and fiscal policy easing. The U.S. economy was already strengthening, in our view, prior to the November 2016 election, and we believe proposed fiscal stimulus and the potential loosening of regulations could provide additional support. We see U.S. economic growth picking up to 2.3% in 2017, with consumption underpinned in the near term by rising wages amid a labor market near full employment. (Full employment means the highest amount of skilled and unskilled labor that can be employed within an economy at any given time.) We also see scope for marginal improvements in business investment. That said, we remain alert to potential policy changes and geopolitical tensions, largely related to a more protectionist stance on trade, that might be associated with the Trump administration. |
| | Regarding Fed policy, we expect a gradual pace of interest rate hikes — perhaps three in 2017 — as the most likely scenario, largely due to the possibility of a fiscal stimulus package and the consensus’ anticipation of continued improvement in the labor market along with rising wages. |
| | In our taxable commercial paper strategies, we expect to maintain a targeted weighted average maturity in a range of between 30 days and 35 days as we seek to add yield and add yield and to position the Funds for the potential of continued spread tightening. In our taxable government repo strategies and taxable government non-repo strategies, we plan to maintain positions at the shorter end of our targeted weighted average maturity range. We anticipate a pickup in U.S. Treasury bill issuance ahead of the debt ceiling deadline in mid-March 2017 and as we head into the April 2017 tax season. In our tax-exempt Fund, we plan to maintain positions at the shorter end of our weighted average maturity range because we anticipate three Fed rate hikes during 2017 and because we expect tax-exempt money market yields to rise due to tax-related investment outflows in April 2017. |
| | Overall, we expect to keep all the Funds conservatively positioned as we continue to focus on preservation of capital and daily liquidity. We do not believe there is value in sacrificing liquidity in exchange for opportunities that only modestly increase yield potential. We will continue to use our actively managed approach to seek the best possible return within the framework of our Funds’ investment guidelines and objectives. In addition, we will continue to manage interest, liquidity and credit risk daily. We will also continue to closely monitor economic data, Fed policy and any shifts in the money market yield curves, as we strive to navigate the interest rate environment. |
3
PORTFOLIO RESULTS
GOVERNMENT MONEY MARKET FUNDS
You could lose money by investing in the Fund. Although the Fund seeks to preserve the value of your investment at $1.00 per share, it cannot guarantee it will do so. An investment in the Fund is not a deposit of a bank and is not insured or guaranteed by the Federal Deposit Insurance Corporation or any other government agency. The Fund’s sponsor has no legal obligation to provide financial support to the Fund, and you should not expect that the sponsor will provide financial support to the Fund at any time.
INSTITUTIONAL PRIME MONEY MARKET FUNDS
You could lose money by investing in the Fund. Because the share price of the Fund will fluctuate, when you sell your shares they may be worth more or less than what you originally paid for them. The Fund may impose a fee upon sale of your shares or may temporarily suspend your ability to sell shares if the Fund’s liquidity falls below required minimums because of market conditions or other factors. An investment in the Fund is not a deposit of a bank and is not insured or guaranteed by the Federal Deposit Insurance Corporation or any other government agency. The Fund’s sponsor has no legal obligation to provide financial support to the Fund, and you should not expect that the sponsor will provide financial support to the Fund at any time.
RETAIL MONEY MARKET FUNDS
You could lose money by investing in the Fund. Although the Fund seeks to preserve the value of your investment at $1.00 per share, it cannot guarantee it will do so. The Fund may impose a fee upon sale of your shares or may temporarily suspend your ability to sell shares if the Fund’s liquidity falls below required minimums because of market conditions or other factors. An investment in the Fund is not a deposit of a bank and is not insured or guaranteed by the Federal Deposit Insurance Corporation or any other government agency. The Fund’s sponsor has no legal obligation to provide financial support to the Fund, and you should not expect that the sponsor will provide financial support to the Fund at any time.
4
FUND BASICS
Financial Square Funds
as of February 28, 2017
| | | | | | | | | | |
| | PERFORMANCE REVIEW1 | |
| | | September 1, 2016–February 28, 2017 | | Fund Total Return (based on NAV)2
Institutional Shares | | | iMoneyNet Institutional Average3 | |
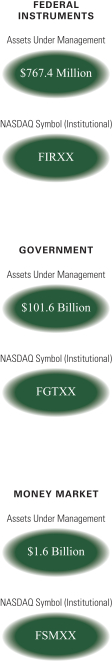
| | Federal Instruments | | | 0.17 | % | | | 0.21 | %4 |
| | Government | | | 0.19 | | | | 0.21 | 4 |
| | Money Market | | | 0.32 | | | | 0.50 | 5 |
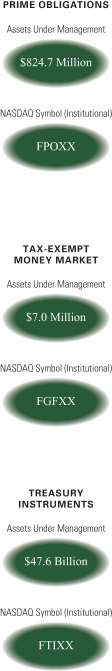
| | Prime Obligations | | | 0.33 | | | | 0.50 | 5 |
| | Tax-Exempt Money Market | | | 0.24 | | | | 0.45 | 6 |
| | Treasury Instruments | | | 0.14 | | | | 0.16 | 7 |
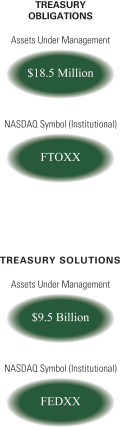
| | Treasury Obligations | | | 0.14 | | | | 0.17 | 8 |
| | | Treasury Solutions | | | 0.14 | | | | 0.21 | 4 |
| | | The returns represent past performance. Past performance does not guarantee future results. The Funds’ investment returns will fluctuate. Current performance may be lower or higher than the performance quoted above. Please visit our Web site at www.GSAMFUNDS.com to obtain the most recent month-end returns. Performance reflects applicable fee waivers and/or expense limitations in effect during the periods shown. In their absence, performance would be reduced. Returns do not reflect the deduction of taxes that a shareholder would pay on Fund distributions or the redemption of Fund shares. |
| 1 | | Each of the Prime Obligations, Treasury Obligations, Money Market, Treasury Instruments and Treasury Solutions Funds offers nine separate classes of shares (Institutional, Select, Preferred, Capital, Administration, Service, Cash Management, Premier and Resource), the Tax-Exempt Money Market Fund offers seven separate share classes (Institutional, Select, Preferred, Capital, Administration, Service and Resource), the Federal Instruments Fund offers eight separate classes of shares (Institutional, Select, Preferred, Capital, Administration, Service, Cash Management and Premier), and the Government Fund offers twelve separate classes of shares (Institutional, Select, Preferred, Capital, Administration, Service, Cash Management, Premier, Resource, Class R6, Class A and Class C), each of which is subject to different fees and expenses that affect performance and entitles shareholders to different services. The Institutional and Class R6 Shares do not have distribution and/or service (12b-1), administration or service (non-12b-1) fees. The Select, Preferred, Capital, Administration, Service, Cash Management, Premier, Resource, Class A and Class C Shares offer financial institutions the opportunity to receive fees for providing certain distribution (12b-1), administrative support and/or shareholder services (as applicable). As an annualized percentage of average daily net assets, these share classes pay combined distribution and/or service (12b-1), administration and/or service (non-12b-1) fees (as applicable) at the following contractual rates: the Select Shares pay 0.03%, Preferred Shares pay 0.10%, Capital Shares pay 0.15%, Administration Shares pay 0.25%, Service Shares pay 0.50%, Cash Management Shares pay 0.80%, Premier Shares pay 0.35%, Resource Shares pay 0.65%, Class A Shares pay 0.25% and Class C Shares pay 1.00%. If these fees were reflected in the above performance, performance would have been reduced. In addition, the Fund’s performance does not reflect the deduction of any applicable sales charges. |
| 2 | | The net asset value (NAV) represents the net assets of the class of the Fund (ex-dividend) divided by the total number of shares of the class outstanding. A Fund’s total return reflects the reinvestment of dividends and other distributions. |
| 3 | | Source: iMoneyNet, Inc. February 2017. |
| 4 | | Government & Agencies Institutional — Category includes the most broadly based of the government institutional funds. These funds may invest in U.S. treasuries, U.S. agencies, repurchase agreements, or government-backed floating rate notes. |
| 5 | | First Tier Institutional — Category includes only non-government institutional funds that also are not holding any second tier securities. Portfolio holdings of First Tier funds include U.S. Treasury, U.S. other, repurchase agreements, time deposits, domestic bank obligations, foreign bank obligations, first tier commercial paper, floating rate notes, and asset-backed commercial paper. |
| 6 | | Tax-Free National Institutional — Category includes all institutional national and state tax-free and institutional municipal money funds. Portfolio holdings of tax-free funds include rated and unrated demand notes, rated and unrated general market notes, commercial paper, put bonds — 6 months & less, put bonds — over 6 months, alternative minimum tax paper and other tax-free holdings. Consists of funds in the National Tax-Free Institutional and State-Specific Institutional categories. |
| 7 | | Treasury Institutional — Category includes only institutional government funds that hold 100 percent in U.S. Treasuries. |
| 8 | | Treasury & Repo Institutional — Category includes only institutional government funds that hold U.S. Treasuries and repurchase agreements backed by the U.S. Treasury. |
5
FUND BASICS
| | | | | | | | | | | | | | | | | | | | | | | | |
| | STANDARDIZED TOTAL RETURNS1,9 |
| | | For the period ended December 31, 2016 | | SEC
7-Day
Current
Yield10 | | | One Year | | | Five Years | | | Ten Years | | | Since
Inception | | | Inception Date |
| | Federal Instruments | | | 0.40 | % | | | 0.25 | % | | | N/A | | | | N/A | | | | 0.22 | % | | 10/30/15 |
| | Government | | | 0.45 | | | | 0.29 | | | | 0.07 | % | | | 0.83 | % | | | 2.71 | | | 4/6/93 |
| | Money Market | | | 0.74 | | | | 0.45 | | | | 0.18 | | | | 0.94 | | | | 2.77 | | | 5/18/94 |
| | Prime Obligations | | | 0.74 | | | | 0.44 | | | | 0.14 | | | | 0.90 | | | | 3.10 | | | 3/8/90 |
| | Tax-Exempt Money Market | | | 0.49 | | | | N/A | | | | N/A | | | | N/A | | | | 0.24 | | | 3/31/16 |
| | Treasury Instruments | | | 0.35 | | | | 0.20 | | | | 0.04 | | | | 0.63 | | | | 2.05 | | | 3/3/97 |
| | Treasury Obligations | | | 0.38 | | | | 0.22 | | | | 0.05 | | | | 0.68 | | | | 2.91 | | | 4/25/90 |
| | | Treasury Solutions | | | 0.37 | | | | 0.21 | | | | 0.05 | | | | 0.80 | | | | 2.25 | | | 2/28/97 |
| | 9 | | The Standardized Total Returns are average annual or cumulative total returns (only if the performance period is one year or less) of Institutional Shares as of the most recent calendar quarter-end. They assume reinvestment of all distributions at NAV. The SEC 7-Day Current Yield is not a Standardized Total Return. |
| | | | Because Institutional Shares do not involve a sales charge, such a charge is not applied to their Standardized Total Returns. |
| | | | The yields and returns represent past performance. Past performance does not guarantee future results. The Funds’ investment yield and return will fluctuate as market conditions change. Current performance may be lower or higher than the performance quoted above. Please visit our Web site at www.GSAMFUNDS.com to obtain the most recent month-end returns. Performance reflects applicable fee waivers and/or expense limitations in effect during the periods shown. In their absence, performance would be reduced. Returns do not reflect the deduction of taxes that a shareholder would pay on Fund distributions or the redemption of Fund shares. |
| 10 | | The SEC 7-Day Current Yield figures are as of 12/31/16 and are calculated in accordance with securities industry regulations and do not include net capital gains. SEC 7-Day Current Yield may differ slightly from the actual distribution rate of a given Fund because of the exclusion of distributed capital gains, which are non-recurring. The SEC 7-Day Current Yield more closely reflects a Fund’s current earnings than do the Standardized Total Return figures. |
6
YIELD SUMMARY
| | | | | | | | | | | | | | | | | | | | | | |
| | SUMMARY OF THE INSTITUTIONAL SHARES1 AS OF 2/28/17 | |
| | | Funds | | 7-Day
Dist.
Yield11 | | | SEC 7-Day
Effective
Yield12 | | | 30-Day
Average
Yield13 | | | Weighted Avg.
Maturity
(days)14 | | | Weighted
Avg. Life
(days)15 | |
| | Federal Instruments | | | 0.43 | % | | | 0.42 | % | | | 0.43 | % | | | 38 | | | | 74 | |
| | Government | | | 0.47 | | | | 0.47 | | | | 0.48 | | | | 38 | | | | 84 | |
| | Money Market | | | 0.84 | | | | 0.83 | | | | 0.85 | | | | 32 | | | | 79 | |
| | Prime Obligations | | | 0.85 | | | | 0.82 | | | | 0.85 | | | | 32 | | | | 80 | |
| | Tax-Exempt Money Market | | | 0.47 | | | | 0.47 | | | | 0.47 | | | | 29 | | | | 29 | |
| | Treasury Instruments | | | 0.38 | | | | 0.37 | | | | 0.37 | | | | 38 | | | | 108 | |
| | Treasury Obligations | | | 0.40 | | | | 0.39 | | | | 0.39 | | | | 43 | | | | 102 | |
| | | Treasury Solutions | | | 0.40 | | | | 0.38 | | | | 0.40 | | | | 37 | | | | 80 | |
| | | The Yields represent past performance. Past performance does not guarantee future results. Current performance may be lower or higher than the performance quoted above. |
| | | Yields reflect fee waivers and expense limitations in effect and will fluctuate as market conditions change. The yield quotations more closely reflect the current earnings of the Fund. Please visit our Web site at www.GSAMFUNDS.com to obtain the most recent month-end performance. |
| 11 | | The 7-Day Distribution Yield is the average total return over the previous seven days. It is a Fund’s total income net of expenses, divided by the total number of outstanding shares. This yield can include capital gain/loss distribution, if any. This is not a SEC Yield. |
| 12 | | The SEC 7-Day Effective Yield of a Fund is calculated in accordance with securities industry regulations and do not include net capital gains. The SEC 7-Day Effective Yield assumes reinvestment of dividends for one year. |
| 13 | | The 30-Day Average Yield is a net annualized yield of 30 days back from the current date listed. This yield includes capital gain/loss distribution. |
| 14 | | A Fund’s weighted average maturity (WAM) is an average of the effective maturities of all securities held in the portfolio, weighted by each security’s percentage of net assets. This must not exceed 60 days as calculated under SEC Rule 2a-7. |
| 15 | | A Fund’s weighted average life (WAL) is an average of the final maturities of all securities held in the portfolio, weighted by each security’s percentage of net assets. This must not exceed 120 days as calculated under SEC Rule 2a-7. |
7
SECTOR ALLOCATIONS
| | | | | | | | | | | | | | | | | | | | | | | | | | | | | | |
| | TAXABLE FUNDS16 | |
| | | As of February 28, 2017 | | | | | | | | | | | | | | | | | | | |
| | | Security Type (Percentage of Net Assets) | | Federal
Instruments | | | Government | | | Money
Market | | | Prime
Obligations | | | Treasury
Instruments | | | Treasury
Obligations | | | Treasury
Solutions | |
| | Certificates of Deposit | | | — | | | | — | | | | 1.0 | % | | | 1.3 | % | | | — | | | | — | | | | — | |
| | Certificates of Deposit - Yankeedollar | | | — | | | | — | | | | 6.9 | | | | 8.1 | | | | — | | | | — | | | | — | |
| | Commercial Paper & Corporate Obligations | | | — | | | | — | | | | 25.1 | | | | 20.6 | | | | — | | | | — | | | | — | |
| | Fixed Rate Municipal Debt Obligations | | | — | | | | — | | | | 5.0 | | | | 1.6 | | | | — | | | | — | | | | — | |
| | Repurchase Agreements | | | — | | | | 48.4 | % | | | 4.9 | | | | 3.6 | | | | — | | | | 51.1 | % | | | 49.3 | % |
| | Time Deposits | | | — | | | | — | | | | 8.2 | | | | 9.3 | | | | — | | | | — | | | | — | |
| | U.S. Government Agency Obligations | | | 39.7 | % | | | 33.2 | | | | — | | | | 1.1 | | | | — | | | | — | | | | — | |
| | U.S. Treasury Obligations | | | 60.2 | | | | 18.3 | | | | — | | | | — | | | | 99.9 | % | | | 48.3 | | | | 50.8 | |
| | Variable Rate Municipal Debt Obligations | | | — | | | | — | | | | 21.6 | | | | 22.5 | | | | — | | | | — | | | | — | |
| | | Variable Rate Obligations | | | — | | | | — | | | | 27.7 | | | | 31.6 | | | | — | | | | — | | | | — | |
| 16 | | Each Fund is actively managed and, as such, its portfolio composition may differ over time. The percentage shown for each investment category reflects the value of investments in that category as a percentage of net assets. Figures in the above table may not sum to 100% due to the exclusion of other assets and liabilities. |
8
SECTOR ALLOCATIONS
| | | | | | | | | | | | | | | | | | | | | | | | | | | | | | |
| | TAXABLE FUNDS16 | |
| | | As of August 31, 2016 | | | | | | | | | | | | | | | | | | | |
| | | Security Type (Percentage of Net Assets) | | Federal
Instruments | | | Government | | | Money
Market | | | Prime
Obligations | | | Treasury
Instruments | | | Treasury
Obligations | | | Treasury
Solutions | |
| | Certificates of Deposit - Yankeedollar | | | — | | | | — | | | | 7.4 | % | | | 7.5 | % | | | — | | | | — | | | | — | |
| | Commercial Paper & Corporate Obligations | | | — | | | | — | | | | 0.5 | | | | 1.0 | | | | — | | | | — | | | | — | |
| | Fixed Rate Municipal Debt Obligations | | | — | | | | — | | | | 0.9 | | | | 1.0 | | | | — | | | | — | | | | — | |
| | Repurchase Agreements | | | — | | | | 56.6 | % | | | 26.4 | | | | 22.3 | | | | — | | | | 64.6 | % | | | 51.3 | % |
| | Time Deposits | | | — | | | | — | | | | 40.3 | | | | 35.2 | | | | — | | | | — | | | | — | |
| | U.S. Government Agency Obligations | | | 68.4 | % | | | 43.0 | | | | 0.7 | | | | 4.2 | | | | — | | | | — | | | | — | |
| | U.S. Treasury Obligations | | | 31.5 | | | | 2.7 | | | | — | | | | — | | | | 101.2 | % | | | 32.3 | | | | 49.2 | |
| | | Variable Rate Municipal Debt Obligations | | | — | | | | — | | | | 23.9 | | | | 28.9 | | | | — | | | | — | | | | — | |
| 16 | | Each Fund is actively managed and, as such, its portfolio composition may differ over time. The percentage shown for each investment category reflects the value of investments in that category as a percentage of net assets. Figures in the above table may not sum to 100% due to the exclusion of other assets and liabilities. |
| | | | | | |
| | TAX-EXEMPT MONEY MARKET FUND17 | |
| | | As of February 28, 2017 | | | |
| | | Security Type | | Percentage of
Net Assets | |
| | Bond Anticipation Notes | | | 2.2 | % |
| | Commercial Paper | | | 8.4 | |
| | General Obligation Bonds | | | 7.2 | |
| | Revenue Anticipation Notes | | | 2.9 | |
| | Revenue Bonds | | | 2.9 | |
| | Tax and Revenue Anticipation Notes | | | 6.5 | |
| | | Variable Rate Obligations | | | 70.7 | |
| | | As of August 31, 2016 | | | |
| | Commercial Paper | | | 6.9 | % |
| | | Variable Rate Obligations | | | 91.0 | |
| 17 | | The Fund is actively managed and, as such, its portfolio composition may differ over time. The percentage shown for each investment category reflects the value of investments in that category as a percentage of net assets. Figures in the above table may not sum to 100% due to the exclusion of other assets and liabilities. |
9
PORTFOLIO RESULTS
Index Definitions
The BofA Merrill Lynch U.S. Dollar Three-Month LIBOR Constant Maturity Index is based on the assumed purchase of a synthetic instrument having three months to maturity and with a coupon equal to the closing quote for three-month LIBOR. That issue is sold the following day (priced at a yield equal to the current day closing three-month LIBOR rate) and is rolled into a new three-month instrument. The index, therefore, will always have a constant maturity equal to exactly three months.
The Securities Industry and Financial Markets Association (“SIFMA”) Municipal Swap Index is a seven-day high-grade market index comprised of tax-exempt variable rate demand obligations with certain characteristics. The Index is calculated and published by Bloomberg. The Index is overseen by SIFMA’s municipal swap index committee.
10
FINANCIAL SQUARE FEDERAL INSTRUMENTS FUND
Schedule of Investments
February 28, 2017 (Unaudited)
| | | | | | | | | | | | | | |
Principal
Amount | | | Interest
Rate | | | Maturity
Date | | | Amortized
Cost | |
| | | | | | | | | | | | | | |
| U.S. Government Agency Obligations – 39.7% | |
| Federal Farm Credit Bank(a) | |
| $ | 1,100,000 | | | | 0.856 | % | | | 04/07/17 | | | $ | 1,099,996 | |
| | 1,000,000 | | | | 0.878 | | | | 04/25/17 | | | | 1,000,000 | |
| | 200,000 | | | | 0.927 | | | | 06/13/17 | | | | 200,069 | |
| | 650,000 | | | | 0.823 | | | | 06/15/17 | | | | 650,000 | |
| | 3,500,000 | | | | 0.806 | | | | 06/30/17 | | | | 3,499,953 | |
| | 25,000,000 | | | | 0.801 | | | | 07/13/17 | | | | 25,000,072 | |
| | 1,250,000 | | | | 1.034 | | | | 08/01/17 | | | | 1,249,742 | |
| | 700,000 | | | | 0.810 | | | | 09/15/17 | | | | 699,981 | |
| Federal Home Loan Bank(a) | |
| | 6,500,000 | | | | 0.817 | | | | 03/03/17 | | | | 6,500,000 | |
| | 4,000,000 | | | | 0.897 | | | | 03/13/17 | | | | 4,000,000 | |
| | 4,000,000 | | | | 0.910 | | | | 03/16/17 | | | | 4,000,000 | |
| | 6,600,000 | | | | 0.919 | | | | 03/21/17 | | | | 6,600,000 | |
| | 20,000,000 | | | | 0.868 | | | | 03/23/17 | | | | 20,000,087 | |
| | 7,500,000 | | | | 0.887 | | | | 03/29/17 | | | | 7,500,000 | |
| | 4,000,000 | | | | 0.578 | | | | 04/03/17 | | | | 4,000,000 | |
| | 6,350,000 | | | | 0.884 | | | | 04/05/17 | | | | 6,350,000 | |
| | 7,000,000 | | | | 0.589 | | | | 04/07/17 | | | | 6,999,969 | |
| | 4,450,000 | | | | 0.922 | | | | 04/13/17 | | | | 4,450,000 | |
| | 3,500,000 | | | | 0.923 | | | | 04/18/17 | | | | 3,500,000 | |
| | 17,500,000 | | | | 0.871 | | | | 04/21/17 | | | | 17,500,000 | |
| | 25,000,000 | | | | 0.858 | | | | 04/25/17 | | | | 25,000,000 | |
| | 1,600,000 | | | | 0.616 | | | | 06/13/17 | | | | 1,599,964 | |
| | 1,600,000 | | | | 0.621 | | | | 06/13/17 | | | | 1,600,000 | |
| | 1,600,000 | | | | 0.626 | | | | 06/13/17 | | | | 1,600,000 | |
| | 3,300,000 | | | | 0.620 | | | | 06/15/17 | | | | 3,300,000 | |
| | 24,000,000 | | | | 0.615 | | | | 06/16/17 | | | | 24,000,000 | |
| | 1,300,000 | | | | 0.581 | | | | 07/12/17 | | | | 1,300,000 | |
| | 200,000 | | | | 0.636 | | | | 07/14/17 | | | | 200,000 | |
| | 7,000,000 | | | | 0.583 | | | | 07/25/17 | | | | 7,000,000 | |
| | 3,750,000 | | | | 0.588 | | | | 07/25/17 | | | | 3,750,000 | |
| | 500,000 | | | | 0.731 | | | | 08/21/17 | | | | 500,000 | |
| | 4,000,000 | | | | 0.719 | | | | 08/22/17 | | | | 4,000,000 | |
| | 4,000,000 | | | | 1.024 | | | | 08/28/17 | | | | 3,999,801 | |
| | 1,500,000 | | | | 0.911 | | | | 09/01/17 | | | | 1,500,000 | |
| | 1,600,000 | | | | 0.661 | | | | 09/12/17 | | | | 1,600,000 | |
| | 2,500,000 | | | | 0.783 | | | | 12/19/17 | | | | 2,500,000 | |
| | 2,300,000 | | | | 0.782 | | | | 12/27/17 | | | | 2,300,000 | |
| | 2,410,000 | | | | 0.793 | | | | 03/15/18 | | | | 2,410,000 | |
| | 2,410,000 | | | | 0.800 | | | | 03/16/18 | | | | 2,409,874 | |
| | 7,000,000 | | | | 0.771 | | | | 06/01/18 | | | | 7,000,000 | |
| | 4,800,000 | | | | 0.791 | | | | 06/19/18 | | | | 4,800,000 | |
| | 3,270,000 | | | | 0.791 | | | | 06/28/18 | | | | 3,270,000 | |
| | 700,000 | | | | 0.789 | | | | 07/09/18 | | | | 699,950 | |
| | 1,100,000 | | | | 0.798 | | | | 07/12/18 | | | | 1,099,924 | |
| Federal Home Loan Bank Discount Notes | |
| | 48,000,000 | | | | 0.457 | | | | 03/23/17 | | | | 47,986,800 | |
| | 24,600,000 | | | | 0.503 | | | | 03/29/17 | | | | 24,590,529 | |
| | |
| TOTAL U.S. GOVERNMENT
AGENCY OBLIGATIONS |
| | $ | 304,816,711 | |
| | |
| | |
| U.S. Treasury Obligations – 60.2% | |
| United States Cash Management Bill | |
| $ | 52,700,000 | | | | 0.534 | % | | | 03/15/17 | | | $ | 52,689,241 | |
| | |
| | | | | | | | | | | | | | |
| U.S. Treasury Obligations – (continued) | |
| United States Treasury Bills | |
| 500,000 | | | | 0.406 | | | | 03/02/17 | | | | 499,994 | |
| | 7,500,000 | | | | 0.427 | | | | 03/02/17 | | | | 7,499,913 | |
| | 3,100,000 | | | | 0.437 | | | | 03/02/17 | | | | 3,099,963 | |
| | 1,500,000 | | | | 0.457 | | | | 03/02/17 | | | | 1,499,981 | |
| | 5,100,000 | | | | 0.406 | (b) | | | 03/16/17 | | | | 5,099,150 | |
| | 2,800,000 | | | | 0.422 | | | | 03/16/17 | | | | 2,799,516 | |
| | 5,000,000 | | | | 0.508 | | | | 03/16/17 | | | | 4,998,958 | |
| | 37,000,000 | | | | 0.524 | | | | 03/16/17 | | | | 36,992,060 | |
| | 40,000,000 | | | | 0.524 | | | | 04/06/17 | | | | 39,979,380 | |
| | 35,000,000 | | | | 0.539 | | | | 04/06/17 | | | | 34,981,450 | |
| | 100,000 | | | | 0.544 | | | | 04/06/17 | | | | 99,947 | |
| | 20,950,000 | | | | 0.519 | | | | 04/13/17 | | | | 20,937,238 | |
| | 100,000 | | | | 0.539 | | | | 04/20/17 | | | | 99,926 | |
| | 900,000 | | | | 0.488 | | | | 05/04/17 | | | | 899,232 | |
| | 500,000 | | | | 0.493 | | | | 05/04/17 | | | | 499,569 | |
| | 2,400,000 | | | | 0.503 | | | | 05/04/17 | | | | 2,397,888 | |
| | 400,000 | | | | 0.509 | | | | 05/04/17 | | | | 399,644 | |
| | 700,000 | | | | 0.514 | | | | 05/04/17 | | | | 699,372 | |
| | 100,000 | | | | 0.519 | | | | 05/04/17 | | | | 99,909 | |
| | 100,000 | | | | 0.524 | | | | 05/04/17 | | | | 99,908 | |
| | 100,000 | | | | 0.529 | | | | 05/04/17 | | | | 99,908 | |
| | 50,000 | | | | 0.596 | | | | 05/04/17 | | | | 49,948 | |
| | 4,450,000 | | | | 0.637 | | | | 05/18/17 | | | | 4,443,974 | |
| | 925,000 | | | | 0.524 | | | | 05/25/17 | | | | 923,875 | |
| | 525,000 | | | | 0.529 | | | | 05/25/17 | | | | 524,355 | |
| | 100,000 | | | | 0.539 | | | | 05/25/17 | | | | 99,875 | |
| | 140,000 | | | | 0.642 | | | | 05/25/17 | | | | 139,792 | |
| | 1,000,000 | | | | 0.611 | | | | 07/13/17 | | | | 997,767 | |
| | 100,000 | | | | 0.601 | | | | 07/20/17 | | | | 99,769 | |
| | 600,000 | | | | 0.606 | | | | 07/20/17 | | | | 598,602 | |
| | 30,000 | | | | 0.611 | | | | 07/20/17 | | | | 29,930 | |
| | 100,000 | | | | 0.683 | | | | 08/24/17 | | | | 99,672 | |
| | 100,000 | | | | 0.683 | (b) | | | 08/31/17 | | | | 99,661 | |
| United States Treasury Floating Rate Notes(a) | |
| | 113,300,000 | | | | 0.590 | | | | 04/30/17 | | | | 113,315,281 | |
| | 2,900,000 | | | | 0.593 | | | | 07/31/17 | | | | 2,900,739 | |
| | 200,000 | | | | 0.684 | | | | 10/31/17 | | | | 200,173 | |
| United States Treasury Notes | |
| | 6,800,000 | | | | 0.750 | | | | 03/15/17 | | | | 6,800,616 | |
| | 7,400,000 | | | | 0.500 | | | | 03/31/17 | | | | 7,400,000 | |
| | 16,000,000 | | | | 1.000 | | | | 03/31/17 | | | | 16,006,347 | |
| | 7,150,000 | | | | 3.250 | | | | 03/31/17 | | | | 7,166,218 | |
| | 100,000 | | | | 0.875 | | | | 04/15/17 | | | | 100,040 | |
| | 700,000 | | | | 0.500 | | | | 04/30/17 | | | | 699,960 | |
| | 300,000 | | | | 3.125 | | | | 04/30/17 | | | | 301,271 | |
| | 210,000 | | | | 0.875 | | | | 05/15/17 | | | | 210,140 | |
| | 5,850,000 | | | | 4.500 | | | | 05/15/17 | | | | 5,896,846 | |
| | 300,000 | | | | 0.625 | | | | 05/31/17 | | | | 300,062 | |
| | 8,950,000 | | | | 2.750 | | | | 05/31/17 | | | | 8,998,228 | |
| | 5,500,000 | | | | 0.875 | | | | 06/15/17 | | | | 5,504,030 | |
| | 1,270,000 | | | | 0.625 | | | | 06/30/17 | | | | 1,270,162 | |
| | 2,300,000 | | | | 0.750 | | | | 06/30/17 | | | | 2,300,898 | |
| | 6,600,000 | | | | 2.500 | | | | 06/30/17 | | | | 6,641,015 | |
| | 8,900,000 | | | | 0.875 | | | | 07/15/17 | | | | 8,908,592 | |
| | 11,500,000 | | | | 0.875 | | | | 08/15/17 | | | | 11,510,558 | |
| | |
| | |
| The accompanying notes are an integral part of these financial statements. | | 11 |
FINANCIAL SQUARE FEDERAL INSTRUMENTS FUND
Schedule of Investments (continued)
February 28, 2017 (Unaudited)
| | | | | | | | | | | | | | |
Principal
Amount | | | Interest
Rate | | | Maturity
Date | | | Amortized
Cost | |
| | | | | | | | | | | | | | |
| U.S. Treasury Obligations – (continued) | |
| | United States Treasury Notes – (continued) | |
| $ | 5,300,000 | | | | 4.750 | % | | | 08/15/17 | | | $ | 5,398,862 | |
| | 2,900,000 | | | | 0.625 | | | | 08/31/17 | | | | 2,898,000 | |
| | 4,400,000 | | | | 1.875 | | | | 08/31/17 | | | | 4,425,942 | |
| | 2,900,000 | | | | 1.000 | | | | 09/15/17 | | | | 2,903,195 | |
| | 3,300,000 | | | | 0.625 | | | | 09/30/17 | | | | 3,296,177 | |
| | 1,100,000 | | | | 1.875 | | | | 09/30/17 | | | | 1,106,857 | |
| | 2,350,000 | | | | 0.875 | | | | 10/15/17 | | | | 2,350,527 | |
| | 2,100,000 | | | | 0.750 | | | | 10/31/17 | | | | 2,098,225 | |
| | 2,950,000 | | | | 1.875 | | | | 10/31/17 | | | | 2,970,395 | |
| | 3,000,000 | | | | 4.250 | | | | 11/15/17 | | | | 3,071,214 | |
| | 200,000 | | | | 0.625 | | | | 11/30/17 | | | | 199,574 | |
| | 400,000 | | | | 2.250 | | | | 11/30/17 | | | | 404,268 | |
| | |
| TOTAL U.S. TREASURY
OBLIGATIONS |
| | $ | 462,133,779 | |
| | |
| | TOTAL INVESTMENTS – 99.9% | | | $ | 766,950,490 | |
| | |
| OTHER ASSETS IN EXCESS OF
LIABILITIES – 0.1% |
| | | 426,640 | |
| | |
| | NET ASSETS – 100.0% | | | $ | 767,377,130 | |
| | |
| | |
| The percentage shown for each investment category reflects the value of investments in that category as a percentage of net assets. |
(a) | | Variable or floating rate security. Interest rate disclosed is that which is in effect at February 28, 2017. |
(b) | | All or a portion represents a forward commitment. |
|
| Interest rates represent either the stated coupon rate, annualized yield on date of purchase for discounted securities, or, for floating rate securities, the current reset rate, which is based upon current interest rate indices. |
|
| Maturity dates represent either the final legal maturity date on the security, the demand date for puttable securities, or the prerefunded date for those types of securities. |
| | |
| 12 | | The accompanying notes are an integral part of these financial statements. |
FINANCIAL SQUARE GOVERNMENT FUND
Schedule of Investments
February 28, 2017 (Unaudited)
| | | | | | | | | | | | | | |
Principal Amount | | | Interest
Rate | | | Maturity
Date | | | Amortized Cost | |
| | | | | | | | | | | | | | |
| U.S. Government Agency Obligations – 33.2% | |
| Federal Farm Credit Bank(a) | |
| $ | 73,400,000 | | | | 0.856 | % | | | 04/07/17 | | | $ | 73,399,699 | |
| | 131,300,000 | | | | 0.878 | | | | 04/25/17 | | | | 131,300,000 | |
| | 150,000,000 | | | | 1.080 | | | | 04/27/17 | | | | 149,999,705 | |
| | 200,000,000 | | | | 1.077 | | | | 05/15/17 | | | | 199,999,252 | |
| | 490,000,000 | | | | 0.839 | | | | 05/23/17 | | | | 490,000,000 | |
| | 13,450,000 | | | | 0.927 | | | | 06/13/17 | | | | 13,454,670 | |
| | 49,000,000 | | | | 0.823 | | | | 06/15/17 | | | | 49,000,000 | |
| | 275,000,000 | | | | 1.131 | | | | 06/26/17 | | | | 274,998,725 | |
| | 294,500,000 | | | | 0.806 | | | | 06/30/17 | | | | 294,496,053 | |
| | 75,000,000 | | | | 0.801 | | | | 07/13/17 | | | | 75,000,215 | |
| | 65,000,000 | | | | 0.924 | | | | 07/21/17 | | | | 64,999,961 | |
| | 6,500,000 | | | | 1.034 | | | | 08/01/17 | | | | 6,498,661 | |
| | 64,000,000 | | | | 0.810 | | | | 09/15/17 | | | | 63,998,249 | |
| Federal Home Loan Bank | |
| | 1,460,500,000 | | | | 0.817 | (a) | | | 03/03/17 | | | | 1,460,500,000 | |
| | 748,000,000 | | | | 0.872 | (a) | | | 03/03/17 | | | | 748,000,000 | |
| | 725,000,000 | | | | 0.877 | (a) | | | 03/03/17 | | | | 725,000,000 | |
| | 244,500,000 | | | | 0.897 | (a) | | | 03/13/17 | | | | 244,500,000 | |
| | 244,500,000 | | | | 0.910 | (a) | | | 03/16/17 | | | | 244,500,000 | |
| | 247,500,000 | | | | 0.919 | (a) | | | 03/21/17 | | | | 247,500,000 | |
| | 739,000,000 | | | | 0.887 | (a) | | | 03/29/17 | | | | 739,000,000 | |
| | 493,000,000 | | | | 0.578 | (a) | | | 04/03/17 | | | | 493,000,000 | |
| | 490,500,000 | | | | 0.884 | (a) | | | 04/05/17 | | | | 490,500,000 | |
| | 484,500,000 | | | | 0.565 | (a) | | | 04/06/17 | | | | 484,500,000 | |
| | 496,500,000 | | | | 0.569 | (a) | | | 04/07/17 | | | | 496,500,000 | |
| | 986,000,000 | | | | 0.589 | (a) | | | 04/07/17 | | | | 985,995,620 | |
| | 248,500,000 | | | | 0.575 | (a) | | | 04/11/17 | | | | 248,500,000 | |
| | 250,000,000 | | | | 0.930 | (a) | | | 04/11/17 | | | | 250,000,000 | |
| | 238,100,000 | | | | 0.922 | (a) | | | 04/13/17 | | | | 238,100,000 | |
| | 195,000,000 | | | | 0.923 | (a) | | | 04/18/17 | | | | 195,000,000 | |
| | 516,700,000 | | | | 0.493 | | | | 04/19/17 | | | | 516,359,610 | |
| | 475,000,000 | | | | 0.871 | (a) | | | 04/21/17 | | | | 475,000,000 | |
| | 396,200,000 | | | | 0.858 | (a) | | | 04/25/17 | | | | 396,200,000 | |
| | 250,000,000 | | | | 0.955 | (a) | | | 05/02/17 | | | | 249,995,750 | |
| | 1,468,000,000 | | | | 0.841 | (a) | | | 06/09/17 | | | | 1,468,000,000 | |
| | 247,000,000 | | | | 0.616 | (a) | | | 06/13/17 | | | | 246,994,354 | |
| | 247,050,000 | | | | 0.621 | (a) | | | 06/13/17 | | | | 247,050,000 | |
| | 247,050,000 | | | | 0.626 | (a) | | | 06/13/17 | | | | 247,050,000 | |
| | 494,000,000 | | | | 0.620 | (a) | | | 06/15/17 | | | | 494,000,000 | |
| | 198,500,000 | | | | 0.828 | (a) | | | 06/15/17 | | | | 198,500,000 | |
| | 497,000,000 | | | | 0.642 | (a) | | | 06/27/17 | | | | 497,000,000 | |
| | 500,000,000 | | | | 0.582 | (a) | | | 07/10/17 | | | | 500,000,000 | |
| | 397,500,000 | | | | 0.605 | (a) | | | 07/10/17 | | | | 397,500,000 | |
| | 484,850,000 | | | | 0.576 | (a) | | | 07/11/17 | | | | 484,850,000 | |
| | 182,700,000 | | | | 0.581 | (a) | | | 07/12/17 | | | | 182,700,000 | |
| | 198,700,000 | | | | 0.636 | (a) | | | 07/14/17 | | | | 198,700,000 | |
| | 952,500,000 | | | | 0.583 | (a) | | | 07/25/17 | | | | 952,500,000 | |
| | 1,493,500,000 | | | | 0.588 | (a) | | | 07/25/17 | | | | 1,493,500,000 | |
| | 79,000,000 | | | | 0.731 | (a) | | | 08/21/17 | | | | 79,000,000 | |
| | 245,000,000 | | | | 0.719 | (a) | | | 08/22/17 | | | | 245,000,000 | |
| | 152,500,000 | | | | 1.024 | (a) | | | 08/28/17 | | | | 152,492,421 | |
| | 581,900,000 | | | | 0.691 | (a) | | | 09/01/17 | | | | 581,900,000 | |
| | 348,000,000 | | | | 0.706 | (a) | | | 09/06/17 | | | | 348,000,000 | |
| | 247,050,000 | | | | 0.661 | (a) | | | 09/12/17 | | | | 247,050,000 | |
| | 497,500,000 | | | | 0.728 | (a) | | | 10/02/17 | | | | 497,500,000 | |
| | 497,000,000 | | | | 0.738 | (a) | | | 10/02/17 | | | | 497,000,000 | |
| | |
| | | | | | | | | | | | | | |
| U.S. Government Agency Obligations – (continued) | |
| Federal Home Loan Bank – (continued) | |
| 148,500,000 | | | | 0.863 | %(a) | | | 11/08/17 | | | | 148,500,000 | |
| | 246,000,000 | | | | 0.783 | (a) | | | 12/19/17 | | | | 246,000,000 | |
| | 247,000,000 | | | | 0.763 | (a) | | | 12/26/17 | | | | 247,000,000 | |
| | 246,300,000 | | | | 0.782 | (a) | | | 12/27/17 | | | | 246,300,000 | |
| | 248,000,000 | | | | 0.929 | (a) | | | 02/05/18 | | | | 248,000,000 | |
| | 133,000,000 | | | | 0.889 | (a) | | | 02/15/18 | | | | 133,000,000 | |
| | 497,000,000 | | | | 0.902 | (a) | | | 02/22/18 | | | | 497,000,000 | |
| | 238,060,000 | | | | 0.793 | (a) | | | 03/15/18 | | | | 238,060,000 | |
| | 238,060,000 | | | | 0.800 | (a) | | | 03/16/18 | | | | 238,047,574 | |
| | 496,000,000 | | | | 0.778 | (a) | | | 03/23/18 | | | | 496,000,000 | |
| | 993,000,000 | | | | 0.771 | (a) | | | 06/01/18 | | | | 993,000,000 | |
| | 741,200,000 | | | | 0.791 | (a) | | | 06/19/18 | | | | 741,200,000 | |
| | 494,020,000 | | | | 0.791 | (a) | | | 06/28/18 | | | | 494,020,000 | |
| | 98,700,000 | | | | 0.789 | (a) | | | 07/09/18 | | | | 98,693,007 | |
| | 148,100,000 | | | | 0.798 | (a) | | | 07/12/18 | | | | 148,089,818 | |
| | 497,200,000 | | | | 0.721 | (a) | | | 07/13/18 | | | | 497,200,000 | |
| Federal Home Loan Mortgage Corporation | |
| | 300,000,000 | | | | 0.786 | (a) | | | 04/20/17 | | | | 299,993,712 | |
| | 755,000,000 | | | | 1.056 | (a) | | | 04/26/17 | | | | 754,988,404 | |
| | 102,000,000 | | | | 1.250 | | | | 05/12/17 | | | | 102,114,888 | |
| | 27,300,000 | | | | 1.000 | | | | 06/29/17 | | | | 27,336,900 | |
| | 500,000,000 | | | | 0.909 | (a) | | | 07/21/17 | | | | 499,979,989 | |
| | 1,992,500,000 | | | | 0.917 | (a) | | | 12/20/17 | | | | 1,992,500,000 | |
| | 997,000,000 | | | | 0.979 | (a) | | | 01/08/18 | | | | 997,000,000 | |
| | 249,000,000 | | | | 0.988 | (a) | | | 01/12/18 | | | | 249,000,000 | |
| Federal National Mortgage Association | |
| | 26,400,000 | | | | 0.750 | | | | 04/20/17 | | | | 26,403,506 | |
| | 151,000,000 | | | | 5.000 | | | | 05/11/17 | | | | 152,241,682 | |
| | 14,900,000 | | | | 0.609 | | | | 06/01/17 | | | | 14,877,280 | |
| | 87,550,000 | | | | 5.375 | | | | 06/12/17 | | | | 88,711,498 | |
| | 143,175,000 | | | | 0.801 | (a) | | | 07/20/17 | | | | 143,141,566 | |
| Overseas Private Investment Corp. (USA)(a)(b) | |
| | 51,600,000 | | | | 0.660 | | | | 03/07/17 | | | | 51,600,000 | |
| | 203,814,120 | | | | 0.670 | | | | 03/07/17 | | | | 203,814,120 | |
| | 60,368,101 | | | | 0.680 | | | | 03/07/17 | | | | 60,368,101 | |
| | 228,280,848 | | | | 0.690 | | | | 03/07/17 | | | | 228,280,848 | |
| | |
| TOTAL U.S. GOVERNMENT
AGENCY OBLIGATIONS |
| | $ | 33,674,545,838 | |
| | |
| | |
| U.S. Treasury Obligations – 18.3% | |
| United States Treasury Bills | |
| $ | 29,900,000 | | | | 0.437 | % | | | 03/02/17 | | | $ | 29,899,643 | |
| | 161,000,000 | | | | 0.503 | | | | 05/04/17 | | | | 160,858,320 | |
| | 251,800,000 | | | | 0.545 | | | | 05/11/17 | | | | 251,534,316 | |
| | 128,000,000 | | | | 0.560 | | | | 05/11/17 | | | | 127,861,156 | |
| | 936,585,000 | | | | 0.637 | | | | 05/18/17 | | | | 935,316,709 | |
| | 10,000,000 | | | | 0.509 | | | | 05/25/17 | | | | 9,988,194 | |
| | 195,025,000 | | | | 0.524 | | | | 05/25/17 | | | | 194,787,855 | |
| | 322,850,000 | | | | 0.529 | | | | 05/25/17 | | | | 322,453,612 | |
| | 277,725,000 | | | | 0.534 | | | | 05/25/17 | | | | 277,380,737 | |
| | 162,300,000 | | | | 0.539 | | | | 05/25/17 | | | | 162,096,900 | |
| | 453,790,000 | | | | 0.616 | | | | 05/25/17 | | | | 453,141,773 | |
| | 252,900,000 | | | | 0.621 | | | | 05/25/17 | | | | 252,535,754 | |
| | 130,500,000 | | | | 0.626 | | | | 05/25/17 | | | | 130,310,503 | |
| | |
| | |
| The accompanying notes are an integral part of these financial statements. | | 13 |
FINANCIAL SQUARE GOVERNMENT FUND
Schedule of Investments (continued)
February 28, 2017 (Unaudited)
| | | | | | | | | | | | | | |
Principal Amount | | | Interest
Rate | | | Maturity
Date | | | Amortized Cost | |
| | | | | | | | | | | | | | |
| U.S. Treasury Obligations – (continued) | |
| United States Treasury Bills – (continued) | |
| $ | 110,700,000 | | | | 0.524 | %(c) | | | 06/01/17 | | | $ | 110,555,890 | |
| | 98,400,000 | | | | 0.611 | | | | 07/13/17 | | | | 98,180,240 | |
| | 20,600,000 | | | | 0.601 | | | | 07/20/17 | | | | 20,552,397 | |
| | 52,800,000 | | | | 0.606 | | | | 07/20/17 | | | | 52,676,954 | |
| | 44,100,000 | | | | 0.611 | | | | 07/20/17 | | | | 43,996,365 | |
| | 19,500,000 | | | | 0.616 | | | | 07/20/17 | | | | 19,453,793 | |
| | 35,000,000 | | | | 0.621 | | | | 07/20/17 | | | | 34,916,379 | |
| | 63,000,000 | | | | 0.626 | | | | 07/20/17 | | | | 62,848,249 | |
| | 657,400,000 | | | | 0.606 | | | | 07/27/17 | | | | 655,791,927 | |
| | 25,500,000 | | | | 0.632 | | | | 08/10/17 | | | | 25,428,855 | |
| | 32,500,000 | | | | 0.647 | | | | 08/10/17 | | | | 32,407,131 | |
| | 47,600,000 | | | | 0.662 | (c) | | | 08/24/17 | | | | 47,448,738 | |
| | 60,500,000 | | | | 0.683 | (c) | | | 08/24/17 | | | | 60,301,829 | |
| | 12,000,000 | | | | 0.688 | (c) | | | 08/24/17 | | | | 11,960,400 | |
| | 95,200,000 | | | | 0.683 | (c) | | | 08/31/17 | | | | 94,877,536 | |
| United States Treasury Notes | |
| | 4,800,000 | | | | 1.000 | | | | 03/31/17 | | | | 4,801,847 | |
| | 44,600,000 | | | | 3.250 | | | | 03/31/17 | | | | 44,697,730 | |
| | 40,300,000 | | | | 0.500 | | | | 04/30/17 | | | | 40,295,798 | |
| | 48,800,000 | | | | 3.125 | | | | 04/30/17 | | | | 49,007,105 | |
| | 443,300,000 | | | | 4.500 | | | | 05/15/17 | | | | 446,846,741 | |
| | 202,700,000 | | | | 0.625 | | | | 05/31/17 | | | | 202,700,204 | |
| | 848,850,000 | | | | 2.750 | | | | 05/31/17 | | | | 853,402,560 | |
| | 1,811,650,000 | | | | 0.875 | | | | 06/15/17 | | | | 1,812,959,379 | |
| | 310,432,000 | | | | 0.625 | | | | 06/30/17 | | | | 310,472,256 | |
| | 499,500,000 | | | | 0.750 | | | | 06/30/17 | | | | 499,698,491 | |
| | 678,050,000 | | | | 2.500 | | | | 06/30/17 | | | | 682,235,247 | |
| | 233,500,000 | | | | 0.875 | | | | 07/15/17 | | | | 233,656,175 | |
| | 100,000 | | | | 0.625 | | | | 07/31/17 | | | | 99,974 | |
| | 416,822,000 | | | | 0.875 | | | | 08/15/17 | | | | 417,160,067 | |
| | 1,253,011,000 | | | | 4.750 | | | | 08/15/17 | | | | 1,276,272,540 | |
| | 900,100,000 | | | | 0.625 | | | | 08/31/17 | | | | 899,607,858 | |
| | 1,703,200,000 | | | | 1.875 | | | | 08/31/17 | | | | 1,713,152,563 | |
| | 513,400,000 | | | | 1.000 | | | | 09/15/17 | | | | 513,951,617 | |
| | 939,000,000 | | | | 0.625 | | | | 09/30/17 | | | | 937,927,461 | |
| | 291,400,000 | | | | 1.875 | | | | 09/30/17 | | | | 293,262,177 | |
| | 760,450,000 | | | | 0.875 | | | | 10/15/17 | | | | 760,598,925 | |
| | 348,800,000 | | | | 0.750 | | | | 10/31/17 | | | | 348,547,997 | |
| | 531,900,000 | | | | 1.875 | | | | 10/31/17 | | | | 535,498,168 | |
| | 692,200,000 | | | | 4.250 | | | | 11/15/17 | | | | 708,656,096 | |
| | 33,600,000 | | | | 0.625 | | | | 11/30/17 | | | | 33,528,426 | |
| | 163,000,000 | | | | 0.875 | | | | 11/30/17 | | | | 162,950,296 | |
| | 123,000,000 | | | | 2.250 | | | | 11/30/17 | | | | 124,312,409 | |
| | |
| | TOTAL U.S. TREASURY OBLIGATIONS | | | $ | 18,585,862,262 | |
| | |
| TOTAL INVESTMENTS BEFORE
REPURCHASE AGREEMENTS |
| | $ | 52,260,408,100 | |
| | |
| | | | | | | | | | | | | | |
| Repurchase Agreements(d) – 48.4% | |
| Bank of Montreal | |
| $ | 500,000,000 | | | | 0.520 | % | | | 03/01/17 | | | $ | 500,000,000 | |
| Maturity Value: $500,007,222 | |
| Collateralized by U.S. Treasury Notes, 1.000% to 2.625%, due
10/31/17 to 02/15/26. The aggregate market value of the
collateral, including accrued interest, was $510,000,012. |
|
| | 250,000,000 | | | | 0.530 | | | | 03/01/17 | | | | 250,000,000 | |
| Maturity Value: $250,003,681 | |
| Collateralized by Federal National Mortgage Association, 3.000%
to 4.000%, due 09/01/26 to 05/01/46 and Government National
Mortgage Association, 5.500%, due 12/20/41. The aggregate
market value of the collateral, including accrued interest, was
$257,500,000. |
|
| | |
| Bank of Nova Scotia (The) | |
| | 500,000,000 | | | | 0.560 | (a)(b) | | | 03/07/17 | | | | 500,000,000 | |
| Maturity Value: $500,700,002 | |
| Settlement Date: 01/06/17 | |
| Collateralized by Federal Home Loan Mortgage Corp., 3.500% to
4.000%, due 09/01/26 to 01/01/47, Federal National Mortgage
Association, 3.000% to 7.000%, due 03/01/27 to 02/01/47,
Government National Mortgage Association, 5.000%, due
05/20/45 and a U.S. Treasury Note, 2.750% to 11/15/23. The
aggregate market value of the collateral, including accrued
interest, was $515,418,719. |
|
| | |
| Barclays Capital, Inc. | |
| | 200,000,000 | | | | 0.520 | | | | 03/01/17 | | | | 200,000,000 | |
| Maturity Value: $200,002,889 | |
| Collateralized by a U.S. Treasury Bond, 3.500%, due 02/15/39
and U.S. Treasury Notes, 1.625% to 1.750%, due 07/31/20 to
05/15/23. The aggregate market value of the collateral,
including accrued interest, was $204,000,085. |
|
| | 400,000,000 | | | | 0.520 | | | | 03/01/17 | | | | 400,000,000 | |
| Maturity Value: $400,005,778 | |
| Collateralized by U.S. Treasury Bonds, 2.875% to 8.750%, due
05/15/20 to 11/15/44 and U.S. Treasury Notes, 0.625% to
4.000%, due 08/31/17 to 08/15/25. The aggregate market value
of the collateral, including accrued interest, was $408,000,087. |
|
| | |
| BNP Paribas | |
| | 65,000,000 | | | | 0.500 | | | | 03/01/17 | | | | 65,000,000 | |
| Maturity Value: $65,000,903 | |
| Collateralized by a U.S. Treasury Interest-Only Stripped Security,
0.000%, due 11/15/44 and a U.S. Treasury Note, 1.250%, due
07/31/23. The aggregate market value of the collateral,
including accrued interest, was $66,300,000. |
|
| | 30,000,000 | | | | 0.520 | | | | 03/01/17 | | | | 30,000,000 | |
| Maturity Value: $30,000,433 | |
| Collateralized by a U.S. Treasury Floating Rate Note, 0.656%,
due 01/31/19. The market value of the collateral, including
accrued interest, was $30,600,031. |
|
| | |
| | |
| 14 | | The accompanying notes are an integral part of these financial statements. |
FINANCIAL SQUARE GOVERNMENT FUND
| | | | | | | | | | | | | | |
Principal Amount | | | Interest
Rate | | | Maturity
Date | | | Amortized Cost | |
| | | | | | | | | | | | | | |
| Repurchase Agreements(d) – (continued) | |
| BNP Paribas – (continued) | |
| $ | 500,000,000 | | | | 0.550 | %(a)(b) | | | 03/01/17 | | | $ | 500,000,000 | |
| Maturity Value: $502,956,254 | |
| Settlement Date: 02/23/16 | |
| Collateralized by Federal Home Loan Mortgage Corp., 2.500% to
7.500%, due 05/01/21 to 11/01/46, Federal National Mortgage
Association, 2.125% to 7.500%, due 01/01/19 to 01/01/47,
Government National Mortgage Association, 2.500% to
7.500%, due 09/15/27 to 02/20/47, a U.S. Treasury Bill,
0.000% due 05/18/17, a U.S. Treasury Bond, 8.875%, due
02/15/19, a U.S. Treasury Inflation-Indexed Note, 0.125%, due
04/15/18, U.S. Treasury Interest-Only Stripped Securities,
0.000%, due 05/15/23 to 08/15/42, U.S. Treasury Notes,
1.000% to 4.000%, due 09/30/17 to 05/15/22 and a U.S.
Treasury Principal-Only Stripped Security, 0.000%, due
08/15/21. The aggregate market value of the collateral,
including accrued interest, was $512,836,519. |
|
| | 550,000,000 | | | | 0.550 | (a)(b) | | | 03/01/17 | | | | 550,000,000 | |
| Maturity Value: $553,193,060 | |
| Settlement Date: 02/23/16 | |
| Collateralized by Federal Home Loan Mortgage Corp., 2.500% to
9.000%, due 11/01/24 to 02/01/47, Federal National Mortgage
Association, 3.000% to 8.000%, due 01/01/18 to 03/01/47,
Government National Mortgage Association, 3.000% to
10.000%, due 02/15/18 to 02/20/47, a U.S. Treasury Bill,
0.000% due 12/07/17, U.S. Treasury Bonds, 4.750% to
8.750%, due 08/15/20 to 02/15/37, a U.S. Treasury Floating
Rate Note, 0.656%, due 01/31/19, a U.S. Treasury Inflation-
Indexed Bond, 2.375%, due 01/15/27, U.S. Treasury Inflation-
Indexed Notes, 0.125% to 0.625%, due 04/15/17 to 07/15/26,
U.S. Treasury Interest-Only Stripped Securities, 0.000%, due
02/15/37 to 02/15/44 and U.S. Treasury Notes, 0.750% to
3.125%, due 10/31/17 to 08/15/25. The aggregate market value
of the collateral, including accrued interest, was $564,454,607. |
|
| | 1,000,000,000 | | | | 0.550 | (a)(b) | | | 03/06/17 | | | | 1,000,000,000 | |
| Maturity Value: $1,000,947,224 | |
| Settlement Date: 01/03/17 | |
| Collateralized by Federal Home Loan Mortgage Corp., 2.500% to
7.500%, due 08/01/22 to 02/01/47, Federal National Mortgage
Association, 2.500% to 7.500%, due 03/01/19 to 08/01/55,
Government National Mortgage Association, 2.000% to
10.000%, due 07/15/17 to 10/20/46, U.S. Treasury Bills,
0.000% due 05/25/17 to 02/01/18, a U.S. Treasury Bond,
8.750%, due 08/15/20, a U.S. Treasury Interest-Only Stripped
Security, 0.000%, due 11/15/19 and U.S. Treasury Notes,
0.750% to 2.625%, due 03/15/17 to 02/15/22. The aggregate
market value of the collateral, including accrued interest, was
$1,028,453,195. |
|
| | |
| | | | | | | | | | | | | | |
| Repurchase Agreements(d) – (continued) | |
| BNP Paribas – (continued) | |
| 1,750,000,000 | | | | 0.550 | %(a)(b) | | | 03/07/17 | | | | 1,750,000,000 | |
| Maturity Value: $1,750,989,238 | |
| Settlement Date: 02/07/17 | |
| Collateralized by Federal Home Loan Mortgage Corp., 3.000% to
7.000%, due 05/01/25 to 01/01/47, Federal National Mortgage
Association, 2.500% to 7.500%, due 09/01/18 to 08/01/48,
Government National Mortgage Association, 1.500% to
8.000%, due 12/15/25 to 01/20/47, a U.S. Treasury Floating
Rate Note, 0.788%, due 01/31/18, a U.S. Treasury Inflation-
Indexed Note, 0.125%, due 04/15/18 and U.S. Treasury Notes,
0.625% to 2.625%, due 04/30/18 to 09/30/22. The aggregate
market value of the collateral, including accrued interest, was
$1,799,718,122. |
|
| | 1,000,000,000 | | | | 0.610 | (a)(b) | | | 03/07/17 | | | | 1,000,000,000 | |
| Maturity Value: $1,001,524,996 | |
| Settlement Date: 01/19/17 | |
| Collateralized by Federal Home Loan Mortgage Corp., 2.500% to
7.000%, due 10/01/23 to 03/01/47, Federal National Mortgage
Association, 2.500% to 8.000%, due 09/01/18 to 08/01/55,
Government National Mortgage Association, 3.000% to
7.000%, due 01/20/33 to 10/20/46, a U.S. Treasury Bill,
0.000% due 06/22/17, U.S. Treasury Bonds, 2.750% to
3.125%, due 11/15/42 to 11/15/44, a U.S. Treasury Inflation-
Indexed Note, 0.125%, due 04/15/18, U.S. Treasury Interest-
Only Stripped Securities, 0.000%, due 05/15/23 to 05/15/38
and U.S. Treasury Notes, 0.750% to 3.125%, due 04/30/18 to
08/15/23. The aggregate market value of the collateral,
including accrued interest, was $1,029,948,245. |
|
| | |
| BNP Paribas Securities Corp. | |
| | 114,200,000 | | | | 0.530 | | | | 03/01/17 | | | | 114,200,000 | |
| Maturity Value: $114,201,681 | |
| Collateralized by Federal Home Loan Mortgage Corp., 3.000% to
6.000%, due 04/01/26 to 01/01/47, Federal National Mortgage
Association, 3.000% to 7.000%, due 07/01/17 to 02/01/47,
Government National Mortgage Association, 4.000%, due
09/20/45 to 07/20/46, a U.S. Treasury Inflation-Indexed Note,
0.250%, due 01/15/25 and U.S. Treasury Notes, 1.375% to
3.500%, due 02/15/18 to 03/31/20. The aggregate market value
of the collateral, including accrued interest, was $116,484,004. |
|
| | |
| Citibank N.A. | |
| | 1,000,000,000 | | | | 0.530 | | | | 03/01/17 | | | | 1,000,000,000 | |
| Maturity Value: $1,000,103,056 | |
| Settlement Date: 02/22/17 | |
| Collateralized by Federal Home Loan Mortgage Corp., 1.000% to
8.500%, due 07/01/17 to 07/01/47, Federal National Mortgage
Association, 1.300% to 7.000%, due 05/11/17 to 05/01/46,
Government National Mortgage Association, 4.000% to
6.000%, due 03/20/43 to 08/20/43, Tennessee Valley Authority,
2.875% to 5.980%, due 09/15/24 to 12/15/42, a U.S. Treasury
Floating Rate Note, 0.686%, due 10/31/18, U.S. Treasury
Inflation-Indexed Bonds, 1.375% to 3.875%, due 01/15/25 to
02/15/44, U.S. Treasury Inflation-Indexed Notes, 0.125% to
1.125%, due 01/15/21 to 07/15/26 and U.S. Treasury Notes,
0.750% to 3.750%, due 05/31/17 to 07/31/23. The aggregate
market value of the collateral, including accrued interest, was
$1,020,000,006. |
|
| | |
| | |
| The accompanying notes are an integral part of these financial statements. | | 15 |
FINANCIAL SQUARE GOVERNMENT FUND
Schedule of Investments (continued)
February 28, 2017 (Unaudited)
| | | | | | | | | | | | | | |
Principal Amount | | | Interest
Rate | | | Maturity
Date | | | Amortized Cost | |
| | | | | | | | | | | | | | |
| Repurchase Agreements(d) – (continued) | |
| Citibank N.A. – (continued) | |
| $ | 250,000,000 | | | | 0.540 | % | | | 03/01/17 | | | $ | 250,000,000 | |
| Maturity Value: $250,003,750 | |
| Collateralized by Federal Home Loan Mortgage Corp., 3.000% to
4.500%, due 02/01/26 to 02/01/46 and Federal National
Mortgage Association, 3.000% to 4.000%, due 06/01/27 to
02/01/44. The aggregate market value of the collateral,
including accrued interest, was $255,000,000. |
|
| | |
| Citigroup Global Markets, Inc. | |
| | 114,000,000 | | | | 0.540 | | | | 03/01/17 | | | | 114,000,000 | |
| Maturity Value: $114,001,710 | |
| Collateralized by U.S. Treasury Notes, 1.375% to 1.750%, due
08/31/20 to 02/28/22. The aggregate market value of the
collateral, including accrued interest, was $116,280,038. |
|
| | |
| Credit Agricole Corporate and Investment Bank | |
| | 100,000,000 | | | | 0.520 | | | | 03/01/17 | | | | 100,000,000 | |
| Maturity Value: $100,001,444 | |
| Collateralized by U.S. Treasury Notes, 0.875% to 2.000%, due
08/31/18 to 09/30/22 and a U.S. Treasury Principal-Only
Stripped Security, 0.000%, due 02/15/44. The aggregate market
value of the collateral, including accrued interest, was
$102,000,072. |
|
| | 1,500,000,000 | | | | 0.530 | | | | 03/01/17 | | | | 1,500,000,000 | |
| Maturity Value: $1,500,022,083 | |
| Collateralized by Federal Farm Credit Bank, 0.980% to 2.640%,
due 07/13/18 to 11/05/24, Federal Home Loan Bank, 0.00% to
5.250%, due 03/07/17 to 10/20/26, Federal Home Loan
Mortgage Corp., 0.800% to 6.000%, due 12/28/17 to 03/01/47,
Federal National Mortgage Association, 0.875% to 6.210%,
due 04/27/17 to 03/01/47, Government National Mortgage
Association, 3.000% to 7.000%, due 12/15/30 to 02/20/47, U.S.
Treasury Bonds, 2.500% to 4.500%, due 02/15/36 to 05/15/46,
a U.S. Treasury Inflation-Indexed Note, 0.125%, due 04/15/21,
a U.S. Treasury Interest-Only Stripped Security, 0.000%, due
08/15/33 and U.S. Treasury Notes, 0.625% to 3.250%, due
03/15/17 to 05/15/26. The aggregate market value of the
collateral, including accrued interest, was $1,540,429,810. |
|
| | 150,000,000 | | | | 0.520 | | | | 03/02/17 | | | | 150,000,000 | |
| Maturity Value: $150,015,167 | |
| Settlement Date: 02/23/17 | |
| Collateralized by a U.S. Treasury Bond, 3.750%, due 11/15/43, a
U.S. Treasury Inflation-Indexed Bond, 1.375%, due 02/15/44,
U.S. Treasury Inflation-Indexed Notes, 0.125% to 0.375%, due
04/15/21 to 07/15/23, U.S. Treasury Notes, 1.750% to 2.000%,
due 07/31/20 to 05/15/23 and a U.S. Treasury Principal-Only
Stripped Security, 0.000%, due 11/15/41. The aggregate market
value of the collateral, including accrued interest, was
$153,000,005. |
|
| | 300,000,000 | | | | 0.520 | | | | 03/07/17 | | | | 300,000,000 | |
| Maturity Value: $300,030,333 | |
| Collateralized by U.S. Treasury Bonds, 4.750% to 6.875%, due
08/15/25 to 02/15/37, a U.S. Treasury Inflation-Indexed Bond,
1.000%, due 02/15/46 and U.S. Treasury Notes, 0.750% to
0.875%, due 03/15/17 to 09/30/18. The aggregate market value
of the collateral, including accrued interest, was $306,000,025. |
|
| | |
| | | | | | | | | | | | | | |
| Repurchase Agreements(d) – (continued) | |
| Credit Suisse Securities (USA) LLC | |
| $ | 400,000,000 | | | | 0.510 | % | | | 03/01/17 | | | $ | 400,000,000 | |
| Maturity Value: $400,005,667 | |
| Collateralized by a U.S. Treasury Bond, 2.750%, due 08/15/42
and U.S. Treasury Notes, 0.625% to 3.125%, due 11/30/17 to
08/15/24. The aggregate market value of the collateral,
including accrued interest, was $408,001,968. |
|
| | |
| Deutsche Bank Securities, Inc. | |
| | 750,000,000 | | | | 0.530 | | | | 03/01/17 | | | | 750,000,000 | |
| Maturity Value: $750,011,042 | |
| Collateralized by a U.S. Treasury Interest-Only Stripped Security,
0.000%, due 05/15/25, a U.S. Treasury Principal-Only Stripped
Security, 0.000%, due 02/15/19 and U.S. Treasury Notes,
0.875% to 2.250%, due 03/31/18 to 12/31/23. The aggregate
market value of the collateral, including accrued interest, was
$765,000,048. |
|
| | 375,000,000 | | | | 0.540 | | | | 03/01/17 | | | | 375,000,000 | |
| Maturity Value: $375,005,625 | |
| Collateralized by Federal Home Loan Bank, 0.00%, due 03/01/17
to 08/02/17, Federal Home Loan Mortgage Corp., 1.000% to
1.250%, due 09/29/17 to 10/02/19 and Federal National
Mortgage Association, 1.125% to 5.355%, due 11/24/17 to
08/24/20. The aggregate market value of the collateral,
including accrued interest, was $382,500,844. |
|
| | |
| Federal Reserve Bank of New York | |
| | 6,100,000,000 | | | | 0.500 | | | | 03/01/17 | | | | 6,100,000,000 | |
| Maturity Value: $6,100,084,722 | |
| Collateralized by U.S. Treasury Bonds, 3.125% to 6.125%, due
11/15/27 to 02/15/43 and U.S. Treasury Notes, 1.375% to
2.000%, due 01/31/20 to 02/15/23. The aggregate market value
of the collateral, including accrued interest, was
$6,100,084,832. |
|
| | |
| HSBC Securities (USA), LLC | |
| | 200,000,000 | | | | 0.500 | | | | 03/01/17 | | | | 200,000,000 | |
| Maturity Value: $200,002,778 | |
| Collateralized by a U.S. Treasury Inflation-Indexed Note,
0.125%, due 04/15/21. The market value of the collateral,
including accrued interest, was $204,002,141. |
|
| | 200,000,000 | | | | 0.510 | | | | 03/01/17 | | | | 200,000,000 | |
| Maturity Value: $200,002,833 | |
| Collateralized by U.S. Treasury Inflation-Indexed Notes, 0.125%
to 0.250%, due 04/15/21 to 01/15/25. The aggregate market
value of the collateral, including accrued interest, was
$204,004,223. |
|
| | 600,000,000 | | | | 0.510 | | | | 03/01/17 | | | | 600,000,000 | |
| Maturity Value: $600,008,500 | |
| Collateralized by Federal National Mortgage Association, 3.500%
to 5.550%, due 11/01/42 to 08/01/48. The aggregate market
value of the collateral, including accrued interest, was
$612,004,980. |
|
| | |
| | |
| 16 | | The accompanying notes are an integral part of these financial statements. |
FINANCIAL SQUARE GOVERNMENT FUND
| | | | | | | | | | | | | | |
Principal Amount | | | Interest
Rate | | | Maturity
Date | | | Amortized Cost | |
| | | | | | | | | | | | | | |
| Repurchase Agreements(d) – (continued) | |
| ING Financial Markets LLC | |
| $ | 200,000,000 | | | | 0.530 | % | | | 03/01/17 | | | $ | 200,000,000 | |
| Maturity Value: $200,002,944 | |
| Collateralized by Federal National Mortgage Association, 2.000%
to 4.000%, due 03/01/21 to 09/01/46. The market value of the
collateral, including accrued interest, was $204,000,469. |
|
| | 250,000,000 | | | | 0.530 | | | | 03/07/17 | | | | 250,000,000 | |
| Maturity Value: $250,025,764 | |
| Collateralized by Federal National Mortgage Association, 3.500%
to 6.500%, due 08/01/30 to 02/01/47. The aggregate market
value of the collateral, including accrued interest, was
$255,003,976. |
|
| | 500,000,000 | | | | 0.686 | (a)(e) | | | 04/07/17 | | | | 500,000,000 | |
| Maturity Value: $506,493,765 | |
| Settlement Date: 05/26/15 | |
| | 500,000,000 | | | | 0.686 | (a)(e) | | | 04/07/17 | | | | 500,000,000 | |
| Maturity Value: $502,418,499 | |
| Settlement Date: 07/27/16 | |
| Shared collateral consisting of Federal Home Loan Mortgage
Corp., 7.000%, due 03/17/31 and Federal National Mortgage
Association, 2.500% to 5.000%, due 12/01/25 to 01/01/47. The
aggregate market value of the collateral, including accrued
interest, was $1,020,001,615. |
|
| | 100,000,000 | | | | 0.682 | (a)(e) | | | 04/11/17 | | | | 100,000,000 | |
| Maturity Value: $101,043,335 | |
| Settlement Date: 10/08/15 | |
| Collateralized by Federal National Mortgage Association,
3.000%, to 3.500%, due 05/01/28 to 11/01/43. The aggregate
market value of the collateral, including accrued interest, was
$102,002,187. |
|
| | 100,000,000 | | | | 0.682 | (a)(e) | | | 04/18/17 | | | | 100,000,000 | |
| Maturity Value: $101,229,894 | |
| Settlement Date: 07/09/15 | |
| Collateralized by Federal National Mortgage Association,
3.500%, to 4.500%, due 06/01/26 to 11/01/45. The aggregate
market value of the collateral, including accrued interest, was
$102,000,939. |
|
| | |
| Joint Repurchase Agreement Account I | |
| | 5,580,000,000 | | | | 0.520 | | | | 03/01/17 | | | | 5,580,000,000 | |
| Maturity Value: $5,580,080,600 | |
| | |
| Joint Repurchase Agreement Account III | |
| | 7,292,600,000 | | | | 0.536 | | | | 03/01/17 | | | | 7,292,600,000 | |
| Maturity Value: $7,292,708,490 | |
| | |
| JP Morgan Securities LLC | |
| | 500,000,000 | | | | 0.570 | | | | 04/10/17 | | | | 500,000,000 | |
| Maturity Value: $500,720,417 | |
| Settlement Date: 01/09/17 | |
| Collateralized by Federal National Mortgage Association, 2.000%
to 6.000%, due 03/01/22 to 02/01/47. The aggregate market
value of the collateral, including accrued interest, was
$510,004,380. |
|
| | |
| | | | | | | | | | | | | | |
| Repurchase Agreements(d) – (continued) | |
| Merrill Lynch, Pierce, Fenner & Smith, Inc. | |
| 115,500,000 | | | | 0.530 | | | | 03/01/17 | | | | 115,500,000 | |
| Maturity Value: $115,501,700 | |
| Collateralized by Federal Home Loan Bank, 0.000% to 5.250%,
due 05/15/17 to 12/09/22, Federal Home Loan Mortgage Corp.,
0.000% to 3.750%, due 10/02/17 to 01/28/22, Federal National
Mortgage Association, 0.875% to 2.625%, due 09/27/17 to
09/06/24 and Tennessee Valley Authority, 4.500%, due
04/01/28. The aggregate market value of the collateral,
including accrued interest, was $117,810,801. |
|
| | 370,500,000 | | | | 0.530 | | | | 03/01/17 | | | | 370,500,000 | |
| Maturity Value: $370,505,455 | |
| Collateralized by U.S. Treasury Notes, 0.875% to 1.875%, due
04/30/17 to 08/31/17. The aggregate market value of the
collateral, including accrued interest, was $377,910,018. |
|
| | 1,000,000,000 | | | | 0.750 | (a)(e) | | | 06/05/17 | | | | 1,000,000,000 | |
| Maturity Value: $1,004,437,493 | |
| Settlement Date: 11/04/16 | |
| Collateralized by Federal Home Loan Mortgage Corp., 2.500% to
5.500%, due 11/01/23 to 03/01/47, Federal National Mortgage
Association, 2.000% to 8.000%, due 12/01/23 to 02/01/47 and
Government National Mortgage Association, 3.000% to
5.000%, due 01/20/28 to 02/20/47. The aggregate market value
of the collateral, including accrued interest, was
$1,029,999,997. |
|
| | |
| Morgan Stanley & Co., LLC | |
| | 500,000,000 | | | | 0.510 | | | | 03/01/17 | | | | 500,000,000 | |
| Maturity Value: $500,007,083 | |
| Collateralized by a U.S. Treasury Bond, 7.500%, due 11/15/24
and U.S. Treasury Notes, 0.750% to 2.500%, due 10/31/17 to
08/15/23. The aggregate market value of the collateral,
including accrued interest, was $510,000,082. |
|
| | |
| MUFG Securities Americas, Inc. | |
| | 300,000,000 | | | | 0.530 | | | | 03/01/17 | | | | 300,000,000 | |
| Maturity Value: $300,004,417 | |
| Collateralized by Federal Home Loan Mortgage Corp., 2.500% to
5.500%, due 08/01/26 to 03/01/47, Federal National Mortgage
Association, 3.000% to 5.000%, due 10/01/26 to 03/01/47 and
Government National Mortgage Association, 2.000% to
6.000%, due 02/20/32 to 02/20/47. The aggregate market value
of the collateral, including accrued interest, was $309,000,001. |
|
| | |
| MUFG Securities EMEA PLC | |
| | 29,436,750 | | | | 0.560 | | | | 03/02/17 | | | | 29,436,750 | |
| Maturity Value: $29,437,666 | |
| Collateralized by a U.S. Treasury Note, 1.750%, due 02/28/22.
The market value of the collateral, including accrued interest,
was $30,025,485. |
|
| | 29,510,250 | | | | 0.560 | | | | 03/02/17 | | | | 29,510,250 | |
| Maturity Value: $29,511,168 | |
| Collateralized by a U.S. Treasury Note, 2.125%, due 11/30/23.
The market value of the collateral, including accrued interest,
was $30,100,455. |
|
| | |
| | |
| The accompanying notes are an integral part of these financial statements. | | 17 |
FINANCIAL SQUARE GOVERNMENT FUND
Schedule of Investments (continued)
February 28, 2017 (Unaudited)
| | | | | | | | | | | | | | |
Principal Amount | | | Interest
Rate | | | Maturity
Date | | | Amortized Cost | |
| | | | | | | | | | | | | | |
| Repurchase Agreements(d) – (continued) | |
| MUFG Securities EMEA PLC – (continued) | |
| $ | 45,225,101 | | | | 0.560 | % | | | 03/02/17 | | | $ | 45,225,101 | |
| Maturity Value: $45,226,508 | |
| Collateralized by a U.S. Treasury Bond, 2.875%, due 08/15/45.
The market value of the collateral, including accrued interest,
was $46,129,603. |
|
| | 57,256,500 | | | | 0.560 | | | | 03/02/17 | | | | 57,256,500 | |
| Maturity Value: $57,258,281 | |
| Collateralized by a U.S. Treasury Note, 1.500%, due 03/31/23.
The market value of the collateral, including accrued interest,
was $58,401,630. |
|
| | 88,690,000 | | | | 0.560 | | | | 03/02/17 | | | | 88,690,000 | |
| Maturity Value: $88,692,759 | |
| Collateralized by a U.S. Treasury Bond, 2.500%, due 02/15/46.
The market value of the collateral, including accrued interest,
was $90,463,800. |
|
| | 101,679,165 | | | | 0.560 | | | | 03/02/17 | | | | 101,679,165 | |
| Maturity Value: $101,682,328 | |
| Collateralized by a U.S. Treasury Note, 2.375%, due 08/15/24.
The market value of the collateral, including accrued interest,
was $103,712,748. |
|
| | |
| Nomura Securities International, Inc. | |
| | 400,000,000 | | | | 0.520 | | | | 03/01/17 | | | | 400,000,000 | |
| Maturity Value: $400,005,778 | |
| Collateralized by U.S. Treasury Bills, 0.000% due 04/06/17 to
02/01/18, U.S. Treasury Bonds, 3.000% to 4.250%, due
05/15/39 to 05/15/42, U.S. Treasury Floating Rate Notes,
0.593% to 0.686%, due 07/31/17 to 10/31/18, U.S. Treasury
Interest-Only Stripped Securities, 0.000%, due 05/15/33 to
08/15/46 and U.S. Treasury Notes, 0.875% to 4.000%, due
10/15/17 to 12/31/23. The aggregate market value of the
collateral, including accrued interest, was $408,000,032. |
|
| | 900,000,000 | | | | 0.520 | | | | 03/01/17 | | | | 900,000,000 | |
| Maturity Value: $900,013,000 | |
| Collateralized by U.S. Treasury Bill, 0.000% due 10/12/17, U.S.
Treasury Bonds, 3.125% to 4.750%, due 02/15/41 to 02/15/42,
U.S. Treasury Inflation-Indexed Notes, 0.375% to 1.625%, due
01/15/18 to 01/15/27 and U.S. Treasury Notes, 0.625% to
3.625%, due 03/31/17 to 02/28/23. The aggregate market value
of the collateral, including accrued interest, was $918,000,062. |
|
| | 3,400,000,000 | | | | 0.540 | | | | 03/01/17 | | | | 3,400,000,000 | |
| Maturity Value: $3,400,051,000 | |
| Collateralized by Federal Farm Credit Bank, 3.625%, due
07/28/34, Federal Home Loan Bank, 1.125% to 3.370%, due
02/23/18 to 04/25/18, Federal Home Loan Mortgage Corp.,
1.250% to 9.500%, due 03/01/17 to 02/01/47, Federal Home
Loan Mortgage Corp., Stripped Security 0.000%, due 09/15/28,
Federal National Mortgage Association, 2.500% to 8.500%,
due 03/01/17 to 05/01/47, Government National Mortgage
Association, 2.100% to 10.500%, due 03/15/17 to 02/20/47,
Tennessee Valley Authority, 2.875% to 5.550%, due 09/15/24
to 04/01/56, U.S. Treasury Bonds, 4.500% to 5.250%, due
11/15/28 to 02/15/36, U.S. Treasury Interest-Only Stripped
Securities, 0.000%, due 08/15/17 to 11/15/46, U.S. Treasury
Notes, 2.125% to 2.250%, due 01/31/21 to 02/15/27 and U.S.
Treasury Principal-Only Stripped Securities, 0.000%, due
02/15/21 to 02/15/46. The aggregate market value of the
collateral, including accrued interest, was $3,483,787,810. |
|
| | |
| | | | | | | | | | | | | | |
| Repurchase Agreements(d) – (continued) | |
| Prudential Insurance Company of America (The) | |
| $ | 41,718,750 | | | | 0.550 | % | | | 03/01/17 | | | $ | 41,718,750 | |
| Maturity Value: $41,719,387 | |
| Collateralized by a U.S. Treasury Interest-Only Stripped Security,
0.000%, due 05/15/36. The market value of the collateral,
including accrued interest, was $42,553,125. |
|
| | 58,050,000 | | | | 0.550 | | | | 03/01/17 | | | | 58,050,000 | |
| Maturity Value: $58,050,887 | |
| Collateralized by a U.S. Treasury Bond, 2.875%, due 05/15/43.
The market value of the collateral, including accrued interest,
was $59,211,000. |
|
| | 66,562,500 | | | | 0.550 | | | | 03/01/17 | | | | 66,562,500 | |
| Maturity Value: $66,563,517 | |
| Collateralized by a U.S. Treasury Bond, 2.500%, due 02/15/45.
The market value of the collateral, including accrued interest,
was $67,893,750. |
|
| | 151,750,000 | | | | 0.550 | | | | 03/01/17 | | | | 151,750,000 | |
| Maturity Value: $151,752,318 | |
| Collateralized by a U.S. Treasury Principal-Only Stripped
Security, 0.000%, due 08/15/27. The market value of the
collateral, including accrued interest, was $154,785,000. |
|
| | 191,500,000 | | | | 0.550 | | | | 03/01/17 | | | | 191,500,000 | |
| Maturity Value: $191,502,926 | |
| Collateralized by a U.S. Treasury Bond, 2.875%, due 08/15/45.
The market value of the collateral, including accrued interest,
was $195,330,000. |
|
| | |
| RBC Capital Markets LLC | |
| | 50,000,000 | | | | 0.560 | (a)(b) | | | 03/07/17 | | | | 50,000,000 | |
| Maturity Value: $50,378,001 | |
| Settlement Date: 01/15/16 | |
| Collateralized by Federal Home Loan Corp., 3.000% to 4.500%,
due 01/01/43 to 11/01/46, Federal National Mortgage
Association, 2.500%, to 5.000%, due 07/01/26 to 01/01/47 and
Government National Mortgage Association, 3.000%, due
01/20/47. The aggregate market value of the collateral,
including accrued interest, was $51,000,000. |
|
| | 200,000,000 | | | | 0.560 | (a)(b) | | | 03/07/17 | | | | 200,000,000 | |
| Maturity Value: $202,426,674 | |
| Settlement Date: 03/27/15 | |
| Collateralized by Federal Home Loan Corp., 3.500%, due
09/01/42 to 03/01/47, Federal National Mortgage Association,
2.500% to 4.500%, due 02/01/24 to 03/01/47 and Government
National Mortgage Association, 3.000%, due 01/20/47. The
aggregate market value of the collateral, including accrued
interest, was $204,000,001. |
|
| | 350,000,000 | | | | 0.560 | (a)(b) | | | 03/07/17 | | | | 350,000,000 | |
| Maturity Value: $351,497,227 | |
| Settlement Date: 08/08/16 | |
| Collateralized by Federal Home Loan Mortgage Corp., 2.500% to
3.500%, due 02/01/32 to 02/01/47, Federal National Mortgage
Association, 2.500%, due 03/01/27 and Government National
Mortgage Association, 3.000% to 4.000%, due 01/20/47 to
02/20/47. The aggregate market value of the collateral,
including accrued interest, was $356,999,999. |
|
| | |
| | |
| 18 | | The accompanying notes are an integral part of these financial statements. |
FINANCIAL SQUARE GOVERNMENT FUND
| | | | | | | | | | | | | | |
Principal Amount | | | Interest
Rate | | | Maturity
Date | | | Amortized Cost | |
| | | | | | | | | | | | | | |
| Repurchase Agreements(d) – (continued) | |
| RBC Capital Markets LLC – (continued) | |
| $ | 500,000,000 | | | | 0.560 | %(a)(b) | | | 03/07/17 | | | $ | 500,000,000 | |
| Maturity Value: $501,905,561 | |
| Settlement Date: 09/27/16 | |
| Collateralized by Federal Home Loan Mortgage Corp., 2.500% to
3.500%, due 03/01/32 to 03/01/47, Federal National Mortgage
Association, 3.000% to 4.500%, due 09/01/28 to 03/01/47 and
Government National Mortgage Association, 3.500% to
4.000%, due 01/20/45 to 01/20/47. The aggregate market value
of the collateral, including accrued interest, was $510,000,003. |
|
| | 500,000,000 | | | | 0.560 | (a)(b) | | | 03/07/17 | | | | 500,000,000 | |
| Maturity Value: $501,633,338 | |
| Settlement Date: 10/05/16 | |
| Collateralized by Federal Home Loan Mortgage Corp., 2.500% to
8.000%, due 09/01/17 to 03/01/47, Federal National Mortgage
Association, 2.500% to 6.000%, due 02/01/18 to 02/01/47 and
Government National Mortgage Association, 3.000% to
4.500%, due 08/20/46 to 02/20/47. The aggregate market value
of the collateral, including accrued interest, was $510,000,008. |
|
| | 750,000,000 | | | | 0.560 | (a)(b) | | | 03/07/17 | | | | 750,000,000 | |
| Maturity Value: $752,461,674 | |
| Settlement Date: 10/04/16 | |
| Collateralized by Federal Home Loan Mortgage Corp., 3.000% to
4.000%, due 02/01/32 to 03/01/47, Federal National Mortgage
Association, 3.500% to 4.000%, due 11/01/34 to 03/01/47 and
Government National Mortgage Association, 3.000% to
7.000%, due 04/20/39 to 02/20/47. The aggregate market value
of the collateral, including accrued interest, was $765,000,001. |
|
| | 250,000,000 | | | | 0.570 | (a)(b) | | | 03/07/17 | | | | 250,000,000 | |
| Maturity Value: $251,203,331 | |
| Settlement Date: 07/18/16 | |
| Collateralized by Federal Home Loan Mortgage Corp., 2.500% to
3.000%, due 11/01/31 to 02/01/47, Federal National Mortgage
Association, 3.000% to 4.500%, due 08/01/33 to 09/01/46 and
Government National Mortgage Association, 3.000% to
4.000%, due 08/20/46 to 02/20/47. The aggregate market value
of the collateral, including accrued interest, was $255,000,000. |
|
| | 250,000,000 | | | | 0.570 | (a)(b) | | | 03/07/17 | | | | 250,000,000 | |
| Maturity Value: $251,195,414 | |
| Settlement Date: 07/20/16 | |
| Collateralized by Federal Home Loan Mortgage Corp., 2.500% to
3.000%, due 02/01/32 to 02/01/47, Federal National Mortgage
Association, 3.000% to 4.000%, due 01/01/27 to 03/01/47 and
Government National Mortgage Association, 3.000%, due
01/20/47. The aggregate market value of the collateral,
including accrued interest, was $255,000,003. |
|
| | 250,000,000 | | | | 0.570 | (a)(b) | | | 03/07/17 | | | | 250,000,000 | |
| Maturity Value: $251,219,164 | |
| Settlement Date: 07/13/16 | |
| Collateralized by Federal Home Loan Mortgage Corp., 2.500% to
5.500%, due 09/01/23 to 03/01/47, Federal National Mortgage
Association, 2.500% to 5.000%, due 08/01/26 to 02/01/47 and
Government National Mortgage Association, 3.000% to
6.000%, due 04/20/43 to 01/20/47. The aggregate market value
of the collateral, including accrued interest, was $255,000,000. |
|
| | |
| | | | | | | | | | | | | | |
| Repurchase Agreements(d) – (continued) | |
| RBC Capital Markets LLC – (continued) | |
| 1,000,000,000 | | | | 0.570 | %(a)(b) | | | 03/07/17 | | | | 1,000,000,000 | |
| Maturity Value: $1,004,354,158 | |
| Settlement Date: 08/22/16 | |
| Collateralized by Federal Home Loan Mortgage Corp., 3.000% to
4.000%, due 11/01/30 to 03/01/47, Federal National Mortgage
Association, 3.500%, due 08/01/45 to 01/01/47 and
Government National Mortgage Association, 2.500% to
7.500%, due 01/15/18 to 02/20/47. The aggregate market value
of the collateral, including accrued interest, was
$1,020,000,003. |
|
| | |
| RBC Dominion Securities, Inc. | |
| | 240,000,000 | | | | 0.520 | | | | 03/02/17 | | | | 240,000,000 | |
| Maturity Value: $240,024,267 | |
| Settlement Date: 02/23/17 | |
| Collateralized by Federal National Mortgage Corp., 4.000%, due
03/01/47 and Government National Mortgage Association,
3.500%, due 04/20/46 to 06/20/46. The aggregate market value
of the collateral, including accrued interest, was $244,800,001. |
|
| | 1,665,000,000 | | | | 0.550 | (a)(b) | | | 03/07/17 | | | | 1,665,000,000 | |
| Maturity Value: $1,665,788,564 | |
| Settlement Date: 02/13/17 | |
| Collateralized by Federal National Mortgage Association, 3.000%
to 6.000%, due 06/01/37 to 12/01/46, Government National
Mortgage Association, 3.000% to 5.500%, due 10/15/39 to
02/20/47, a U.S. Treasury Bond, 4.375%, due 05/15/41, and
U.S. Treasury Notes, 1.500% to 1.875%, due 10/31/19 to
03/31/23. The aggregate market value of the collateral,
including accrued interest, was $1,698,300,034. |
|
| | |
| Societe Generale | |
| | 200,000,000 | | | | 0.540 | | | | 03/01/17 | | | | 200,000,000 | |
| Maturity Value: $200,003,000 | |
| Collateralized by U.S. Treasury Bonds, 3.750% to 6.125%, due
08/15/29 to 11/15/43, a U.S. Treasury Inflation-Indexed Note,
0.125%, due 07/15/26 and U.S. Treasury Notes, 2.000% to
2.125%, due 09/30/20 to 06/30/22. The aggregate market value
of the collateral, including accrued interest, was $204,000,075. |
|
| | 600,000,000 | | | | 0.630 | (a) | | | 03/07/17 | | | | 600,000,000 | |
| Maturity Value: $601,491,000 | |
| Settlement Date: 10/18/16 | |
| Collateralized by U.S. Treasury Bills, 0.000% due 03/16/17 to
08/03/17, U.S. Treasury Bonds, 2.500% to 5.250%, due
11/15/28 to 02/15/45, a U.S. Treasury Floating Rate Note,
0.656%, due 01/31/19, a U.S. Treasury Inflation-Indexed Bond,
3.625%, due 04/15/28, U.S. Treasury Inflation-Indexed Notes,
0.125% to 0.625%, due 04/15/18 to 07/15/25 and U.S. Treasury
Notes, 0.500% to 3.750%, due 03/15/17 to 02/15/26. The
aggregate market value of the collateral, including accrued
interest, was $612,000,023. |
|
| | |
| | |
| The accompanying notes are an integral part of these financial statements. | | 19 |
FINANCIAL SQUARE GOVERNMENT FUND
Schedule of Investments (continued)
February 28, 2017 (Unaudited)
| | | | | | | | | | | | | | |
Principal Amount | | | Interest
Rate | | | Maturity
Date | | | Amortized Cost | |
| | | | | | | | | | | | | | |
| Repurchase Agreements(d) – (continued) | |
| Wells Fargo Bank, N.A. | |
| $ | 25,000,000 | | | | 0.580 | %(e) | | | 03/02/17 | | | $ | 25,000,000 | |
| Maturity Value: $25,073,708 | |
| Settlement Date: 08/31/16 | |
| Collateralized by a U.S. Treasury Note, 1.750%, due 12/31/20.
The market value of the collateral, including accrued interest,
was $25,500,077. |
|
| | 121,500,000 | | | | 0.580 | (e) | | | 03/03/17 | | | | 121,500,000 | |
| Maturity Value: $121,860,180 | |
| Settlement Date: 08/31/16 | |
| Collateralized by a U.S. Treasury Inflation-Indexed Note, 0.125%,
due 04/15/20. The market value of the collateral, including
accrued interest, was $123,930,059. |
|
| | |
| Wells Fargo Securities, LLC | |
| | 150,000,000 | | | | 0.540 | | | | 03/01/17 | | | | 150,000,000 | |
| Maturity Value: $150,002,250 | |
| Collateralized by Federal Home Loan Mortgage Corp., 3.000% to
4.000%, due 02/01/47 to 03/01/47. The aggregate market value
of the collateral, including accrued interest, was $154,500,000. |
|
| | 300,000,000 | | | | 0.540 | | | | 03/01/17 | | | | 300,000,000 | |
| Maturity Value: $300,004,500 | |
| Collateralized by Federal Home Loan Mortgage Corp., 4.000%,
due 03/01/47 and Federal National Mortgage Association,
2.500%, due 01/01/32. The aggregate market value of the
collateral, including accrued interest, was $309,000,001. |
|
| | |
| | TOTAL REPURCHASE AGREEMENTS | | | $ | 49,169,679,016 | |
| | |
| | TOTAL INVESTMENTS – 99.9% | | | $ | 101,430,087,116 | |
| | |
| OTHER ASSETS IN EXCESS OF
LIABILITIES – 0.1% |
| | | 145,210,830 | |
| | |
| | NET ASSETS – 100.0% | | | $ | 101,575,297,946 | |
| | |
| | |
| The percentage shown for each investment category reflects the value of investments in that category as a percentage of net assets. |
(a) | | Variable or floating rate security. Interest rate disclosed is that which is in effect at February 28, 2017. |
(b) | | The instrument is subject to a demand feature. |
(c) | | All or a portion represents a forward commitment. |
(d) | | Unless noted, all repurchase agreements were entered into on February 28, 2017. Additional information on Joint Repurchase Agreement Accounts I and III appear on pages 36 and 37. |
(e) | | Security has been determined to be illiquid by the Investment Adviser. At February 28, 2017, these securities amounted to $2,346,500,000 or approximately 2.3% of net assets. |
|
| Interest rates represent either the stated coupon rate, annualized yield on date of purchase for discounted securities, or, for floating rate securities, the current reset rate, which is based upon current interest rate indices. |
|
| Maturity dates represent either the final legal maturity date on the security, the demand date for puttable securities, or the prerefunded date for those types of securities. |
| | |
| 20 | | The accompanying notes are an integral part of these financial statements. |
FINANCIAL SQUARE MONEY MARKET FUND
Schedule of Investments
February 28, 2017 (Unaudited)
| | | | | | | | | | | | | | |
Principal Amount | | | Interest Rate | | | Maturity Date | | | Value | |
| Commercial Paper and Corporate Obligations – 25.1% | |
| | Albion Capital LLC | |
| $ | 10,000,000 | | | | 0.753 | % | | | 03/03/17 | | | $ | 9,999,445 | |
| | Atlantic Asset Securitization LLC | |
| | 7,000,000 | | | | 1.088 | | | | 04/11/17 | | | | 6,992,323 | |
| | 20,000,000 | | | | 1.092 | | | | 04/20/17 | | | | 19,972,517 | |
| | 7,000,000 | | | | 1.124 | | | | 06/02/17 | | | | 6,978,743 | |
| | Banque et Caisse d’Epargne de l’Etat | |
| | 9,500,000 | | | | 1.103 | | | | 04/07/17 | | | | 9,493,251 | |
| | Barton Capital S.A. | |
| | 10,000,000 | | | | 0.680 | | | | 03/01/17 | | | | 9,999,784 | |
| | 16,000,000 | | | | 0.733 | | | | 03/03/17 | | | | 15,998,964 | |
| | 7,500,000 | | | | 1.113 | | | | 05/02/17 | | | | 7,487,138 | |
| | CAFCO LLC | |
| | 4,700,000 | | | | 1.124 | | | | 05/08/17 | | | | 4,692,847 | |
| | 11,000,000 | | | | 1.197 | | | | 08/01/17 | | | | 10,947,392 | |
| | Charta LLC | |
| | 15,000,000 | | | | 1.197 | | | | 08/03/17 | | | | 14,927,070 | |
| | CRC Funding LLC | |
| | 8,000,000 | | | | 1.020 | | | | 05/02/17 | | | | 7,987,190 | |
| | 4,700,000 | | | | 1.124 | | | | 05/08/17 | | | | 4,691,487 | |
| | 10,000,000 | | | | 1.197 | | | | 08/01/17 | | | | 9,943,533 | |
| | DZ Bank AG | |
| | 7,500,000 | | | | 1.228 | | | | 08/14/17 | | | | 7,461,242 | |
| | Erste Abwicklungsanstalt | |
| | 7,000,000 | | | | 1.155 | | | | 06/05/17 | | | | 6,982,648 | |
| | Kaiser Foundation Hospitals | |
| | 9,000,000 | | | | 0.948 | | | | 03/28/17 | | | | 8,994,134 | |
| | 10,000,000 | | | | 0.928 | | | | 04/03/17 | | | | 9,991,953 | |
| | Kells Funding LLC | |
| | 8,000,000 | | | | 1.021 | | | | 06/06/17 | | | | 7,977,199 | |
| | Liberty Street Funding LLC | |
| | 16,000,000 | | | | 1.020 | | | | 05/22/17 | | | | 15,962,558 | |
| | LMA-Americas LLC | |
| | 7,500,000 | | | | 1.196 | | | | 05/09/17 | | | | 7,486,146 | |
| | 9,000,000 | | | | 1.124 | | | | 06/15/17 | | | | 8,970,388 | |
| | Matchpoint Finance PLC | |
| | 25,000,000 | | | | 0.712 | | | | 03/01/17 | | | | 24,999,460 | |
| | 8,000,000 | | | | 1.102 | | | | 05/02/17 | | | | 7,986,070 | |
| | National Bank of Abu Dhabi PJSC | |
| | 20,000,000 | | | | 0.774 | | | | 03/01/17 | | | | 19,999,647 | |
| | Nieuw Amsterdam Receivables Corp. | |
| | 7,750,000 | | | | 0.815 | | | | 03/02/17 | | | | 7,749,700 | |
| | 10,000,000 | | | | 1.228 | | | | 08/08/17 | | | | 9,948,033 | |
| | Northwestern Memorial HealthCare | |
| | 7,500,000 | | | | 0.887 | | | | 03/09/17 | | | | 7,498,271 | |
| | Old Line Funding Corp. | |
| | 9,000,000 | | | | 0.980 | | | | 03/06/17 | | | | 8,998,926 | |
| | 10,000,000 | | | | 1.052 | | | | 06/08/17 | | | | 9,969,917 | |
| | Oversea-Chinese Banking Corp., Ltd. | |
| | 10,000,000 | | | | 1.072 | | | | 04/06/17 | | | | 9,992,477 | |
| | 15,000,000 | | | | 1.072 | | | | 04/10/17 | | | | 14,987,392 | |
| | SSM Health Care Corp. | |
| | 9,000,000 | | | | 0.934 | | | | 03/22/17 | | | | 8,994,841 | |
| | 3,000,000 | | | | 0.938 | | | | 03/29/17 | | | | 2,997,622 | |
| | 8,000,000 | | | | 0.917 | | | | 04/20/17 | | | | 7,987,817 | |
| | 8,000,000 | | | | 0.887 | | | | 04/27/17 | | | | 7,985,990 | |
| | |
| Commercial Paper and Corporate Obligations – (continued) | |
| | Swedbank AB | |
| 25,000,000 | | | | 1.021 | | | | 05/24/17 | | | | 24,947,879 | |
| | United Overseas Bank Ltd. | |
| | 10,000,000 | | | | 1.155 | | | | 04/21/17 | | | | 9,989,499 | |
| | Victory Receivables Corp. | |
| | 15,000,000 | | | | 0.753 | | | | 03/02/17 | | | | 14,999,249 | |
| | |
| TOTAL COMMERCIAL PAPER AND
CORPORATE OBLIGATIONS |
|
| | (Cost $413,941,698) | | | $ | 413,970,742 | |
| | |
| | | | | | | | | | | | | | |
| Certificate of Deposit – 1.0% | |
| | Citibank, N.A. | |
| $ | 16,000,000 | | | | 1.000 | % | | | 03/13/17 | | | $ | 16,002,159 | |
| | (Cost $16,000,000) | | | | | |
| | |
| | | | | | | | | | | | | | |
| Certificates of Deposit-Yankeedollar – 6.9% | |
| | Cooperatieve Rabobank U.A. | |
| $ | 7,000,000 | | | | 1.300 | % | | | 08/01/17 | | | $ | 7,003,851 | |
| | Credit Agricole Corporate and Investment Bank | |
| | 14,000,000 | | | | 1.140 | | | | 06/02/17 | | | | 14,005,655 | |
| | DZ Bank AG | |
| | 9,500,000 | | | | 1.290 | | | | 08/25/17 | | | | 9,502,290 | |
| | 3,000,000 | | | | 1.380 | | | | 10/20/17 | | | | 3,001,378 | |
| | Landesbank Hessen-Thueringen Girozentrale | |
| | 19,750,000 | | | | 1.000 | | | | 03/17/17 | | | | 19,752,769 | |
| | National Bank of Kuwait | |
| | 20,000,000 | | | | 1.350 | | | | 05/31/17 | | | | 20,009,354 | |
| | Norinchukin Bank (The) | |
| | 18,000,000 | | | | 1.260 | | | | 04/26/17 | | | | 18,012,136 | |
| | 10,000,000 | | | | 1.430 | | | | 07/26/17 | | | | 10,008,038 | |
| | Oversea-Chinese Banking Corp., Ltd. | |
| | 4,500,000 | | | | 1.050 | | | | 04/19/17 | | | | 4,501,617 | |
| | Svenska Handelsbanken AB | |
| | 5,000,000 | | | | 1.190 | | | | 06/08/17 | | | | 5,002,972 | |
| | Toronto-Dominion Bank (The) | |
| | 3,500,000 | | | | 1.240 | | | | 06/16/17 | | | | 3,502,844 | |
| | |
| TOTAL CERTIFICATES OF
DEPOSIT-YANKEEDOLLAR |
|
| | (Cost $114,253,967) | | | $ | 114,302,904 | |
| | |
| | | | | | | | | | | | | | |
| Fixed Rate Municipal Debt Obligations – 5.0% | |
| | ANZ New Zealand (Int’l) Ltd. | |
| $ | 4,000,000 | | | | 1.400 | %(a) | | | 04/27/17 | | | $ | 4,002,240 | |
| | Bank of Tokyo-Mitsubishi UFJ Ltd. (The) | |
| | 3,000,000 | | | | 1.200 | (a) | | | 03/10/17 | | | | 3,000,363 | |
| | Commonwealth Bank of Australia | |
| | 4,000,000 | | | | 1.400 | | | | 09/08/17 | | | | 4,003,597 | |
| | Credit Suisse AG | |
| | 4,000,000 | | | | 1.375 | | | | 05/26/17 | | | | 4,003,348 | |
| | DNB Bank ASA | |
| | 12,000,000 | | | | 3.200 | (a) | | | 04/03/17 | | | | 12,022,920 | |
| | |
| | |
| The accompanying notes are an integral part of these financial statements. | | 21 |
FINANCIAL SQUARE MONEY MARKET FUND
Schedule of Investments (continued)
February 28, 2017 (Unaudited)
| | | | | | | | | | | | | | |
Principal Amount | | | Interest Rate | | | Maturity Date | | | Value | |
| Fixed Rate Municipal Debt Obligations – (continued) | |
| | Metropolitan Life Global Funding I | |
| $ | 5,000,000 | | | | 1.300 | % (a) | | | 04/10/17 | | | $ | 5,001,900 | |
| | Mizuho Bank Ltd. | |
| | 8,000,000 | | | | 2.550 | (a) | | | 03/17/17 | | | | 8,004,620 | |
| | MUFG Union Bank N.A. | |
| | 3,803,000 | | | | 2.125 | | | | 06/16/17 | | | | 3,813,798 | |
| | Nordea Bank AB | |
| | 10,780,000 | | | | 3.125 | (a) | | | 03/20/17 | | | | 10,792,258 | |
| | 1,600,000 | | | | 1.250 | (a) | | | 04/04/17 | | | | 1,600,190 | |
| Rutgers The State University of New Jersey CP GO Series 2017 C
(Wells Fargo Bank N.A., SLOC) |
|
| | 7,825,000 | | | | 0.860 | | | | 04/06/17 | | | | 7,825,255 | |
| | Sentara Healthcare | |
| | 5,000,000 | | | | 1.100 | | | | 04/04/17 | | | | 5,000,439 | |
| | UBS AG | |
| | 13,500,000 | | | | 1.375 | | | | 06/01/17 | | | | 13,510,486 | |
| | |
| TOTAL FIXED RATE MUNICIPAL
DEBT OBLIGATIONS |
|
| | (Cost $82,568,651) | | | $ | 82,581,414 | |
| | |
| | | | | | | | | | | | | | |
| Time Deposits – 8.2% | |
| | National Bank of Kuwait | |
| $ | 50,000,000 | | | | 0.620 | % | | | 03/01/17 | | | $ | 50,000,000 | |
| | Natixis | |
| | 60,000,000 | | | | 0.570 | | | | 03/01/17 | | | | 60,000,000 | |
| | Skandinaviska Enskilda Banken AB | |
| | 25,800,000 | | | | 0.560 | | | | 03/01/17 | | | | 25,800,000 | |
| | |
| | TOTAL TIME DEPOSITS | |
| | (Cost $135,800,000) | | | $ | 135,800,000 | |
| | |
| | | | | | | | | | | | | | |
| Variable Rate Municipal Debt Obligations(b) – 21.6% | |
| BlackRock Municipal Bond Trust VRDN RB Putters Series 2012-T0014
(JPMorgan Chase N.A., LIQ)(a) |
|
| $ | 19,375,000 | | | | 0.750 | % | | | 03/01/17 | | | $ | 19,375,000 | |
| BlackRock MuniVest Fund II, Inc. VRDN RB Putters Series 2012-T0005
(JPMorgan Chase Bank N.A., LIQ)(a) |
|
| | 13,950,000 | | | | 0.750 | | | | 03/01/17 | | | | 13,950,000 | |
| BlackRock MuniVest Fund, Inc. VRDN RB Putters Series 2012-T0007 (JPMorgan
Chase Bank N.A., LIQ) |
|
| | 29,110,000 | | | | 0.750 | | | | 03/01/17 | | | | 29,110,000 | |
| City of Austin, Texas Hotel Occupancy Tax VRDN RB Refunding Subordinate Lien
Series 2008 A RMKT (JPMorgan Chase Bank N.A., LOC) |
|
| | 16,000,000 | | | | 0.660 | | | | 03/07/17 | | | | 16,000,000 | |
| City of Columbia, South Carolina Waterworks & Sewer System VRDN RB
Series 2009 RMKT (Sumitomo Mitsui Banking Corp., LOC) |
|
| | 8,250,000 | | | | 0.650 | | | | 03/07/17 | | | | 8,250,000 | |
| City of Portland, Maine GO VRDN for Taxable Pension Bonds Series 2001 RMKT
(Sumitomo Mitsui Banking Corp., SPA) |
|
| | 58,500,000 | | | | 0.780 | | | | 03/07/17 | | | | 58,500,000 | |
| Connecticut Housing Finance Authority VRDN RB Housing Mortgage Finance
Program Refunding Series 2013 Subseries B-6 (Bank of Tokyo-Mitsubishi
UFJ, SPA) |
|
| | 300,000 | | | | 0.640 | | | | 03/07/17 | | | | 300,000 | |
| | |
| Variable Rate Municipal Debt Obligations(b) – (continued) | |
| County of King, Washington Sewer Revenue VRDN RB Junior Lien Series 2001 A
RMKT (Landesbank Hessen-Thueringen Girozentrale, LOC) |
|
| 7,100,000 | | | | 0.670 | | | | 03/07/17 | | | | 7,100,000 | |
| Federal Home Loan Mortgage Corporation VRDN RB for Multi-Family Variable
Rate Certificates Series 2013-M027 Class A (FHLMC, LIQ) |
|
| | 15,600,000 | | | | 0.670 | | | | 03/07/17 | | | | 15,600,000 | |
| Jacksonville Electric Authority Water & Sewer System VRDN RB Refunding
Series 2008 Subseries B-1 RMKT (State Street Bank & Trust Co., SPA) |
|
| | 8,045,000 | | | | 0.660 | | | | 03/07/17 | | | | 8,045,000 | |
| Los Angeles Department of Water & Power Waterworks VRDN RB Refunding
Series 2001 Subseries B-4 RMKT (Citibank N.A., SPA) |
|
| | 3,650,000 | | | | 0.590 | | | | 03/07/17 | | | | 3,650,000 | |
| Missouri Health & Educational Facilities Authority VRDN RB Refunding for BJC
Health System Series 2005 B RMKT |
|
| | 8,400,000 | | | | 0.610 | | | | 03/07/17 | | | | 8,400,000 | |
| Montgomery County, Tennessee IDB VRDN RB for Hankook Tire Manufacturing
LP Project Series 2015 A (Kookmin Bank, LOC) |
|
| | 40,000,000 | | | | 1.100 | | | | 03/07/17 | | | | 40,000,000 | |
| New York City GO VRDN Refunding Series 2008 Subseries J-6 (Landesbank
Hessen-Thueringen Girozentrale, LOC) |
|
| | 400,000 | | | | 0.630 | | | | 03/01/17 | | | | 400,000 | |
| North Carolina Capital Facilities Finance Agency VRDN RB Refunding for Wake
Forest University Series 2004 A |
|
| | 9,000,000 | | | | 0.660 | | | | 03/07/17 | | | | 9,000,000 | |
| | Ohio State University VRDN RB Series 2001 | |
| | 180,000 | | | | 0.610 | | | | 03/07/17 | | | | 180,000 | |
| | State of Ohio GO VRDN for Common Schools Series 2003 D RMKT | |
| | 1,000,000 | | | | 0.660 | | | | 03/07/17 | | | | 1,000,000 | |
| | State of Ohio GO VRDN Refunding for Infrastructure Improvement Series 2004 A | |
| | 12,900,000 | | | | 0.660 | | | | 03/07/17 | | | | 12,900,000 | |
| State of Texas GO VRDN for Veterans Bonds Series 2015 B (Mizuho Bank,
Ltd., SPA) |
|
| | 3,600,000 | | | | 0.660 | | | | 03/07/17 | | | | 3,600,000 | |
| State of Texas GO VRDN Refunding for Veterans Bonds Series 2011 C
(Landesbank Hessen-Thueringen Girozentrale, SPA) |
|
| | 36,000,000 | | | | 0.680 | | | | 03/07/17 | | | | 36,000,000 | |
| Tarrant County Cultural Education Facilities Finance Corp. VRDN RB for Texas
Health Resources System Series 2012 B |
|
| | 16,050,000 | | | | 0.650 | | | | 03/07/17 | | | | 16,050,000 | |
| Tarrant County Cultural Education Facilities Finance Corp. VRDN RB Refunding
for Texas Health Resources Series 2008 C RMKT |
|
| | 20,795,000 | | | | 0.660 | | | | 03/07/17 | | | | 20,795,000 | |
| Triborough Bridge & Tunnel Authority VRDN RB Refunding General Series 2005
Subseries B-3 RMKT (Bank of Tokyo-Mitsubishi UFJ, LOC) |
|
| | 12,700,000 | | | | 0.650 | | | | 03/07/17 | | | | 12,700,000 | |
| Triborough Bridge & Tunnel Authority VRDN Refunding Floating RB Series 2013
Subseries 2B RMKT (Bank of America N.A., LOC) |
|
| | 15,695,000 | | | | 0.730 | | | | 03/07/17 | | | | 15,695,000 | |
| | |
| TOTAL VARIABLE RATE MUNICIPAL
DEBT OBLIGATIONS |
|
| | (Cost $356,600,000) | | | $ | 356,600,000 | |
| | |
| | |
| 22 | | The accompanying notes are an integral part of these financial statements. |
FINANCIAL SQUARE MONEY MARKET FUND
| | | | | | | | | | | | | | |
Principal Amount | | | Interest Rate | | | Maturity Date | | | Value | |
| Variable Rate Obligations(b) – 27.7% | |
| | Bank of Montreal | |
| $ | 5,000,000 | | | | 1.434 | % | | | 05/12/17 | | | $ | 5,005,702 | |
| | 9,000,000 | | | | 1.216 | | | | 08/07/17 | | | | 9,003,402 | |
| | 7,500,000 | | | | 1.311 | | | | 01/11/18 | | | | 7,508,485 | |
| | Bank of Nova Scotia (The) | |
| | 9,500,000 | | | | 1.418 | | | | 04/12/17 | | | | 9,507,277 | |
| | 35,000,000 | | | | 1.232 | (a) | | | 02/09/18 | | | | 34,970,409 | |
| | Bank of Tokyo-Mitsubishi UFJ Ltd. (The) | |
| | 10,000,000 | | | | 1.368 | | | | 04/27/17 | | | | 10,008,868 | |
| | Bedford Row Funding Corp. | |
| | 13,000,000 | | | | 1.428 | (a) | | | 10/12/17 | | | | 13,026,501 | |
| | Canadian Imperial Bank of Commerce | |
| | 6,400,000 | | | | 1.302 | (a) | | | 01/19/18 | | | | 6,408,226 | |
| | Collateralized Commercial Paper Co., LLC | |
| | 8,000,000 | | | | 1.329 | | | | 04/25/17 | | | | 8,006,442 | |
| | Collateralized Commercial Paper II Co., LLC | |
| | 7,000,000 | | | | 1.488 | (a) | | | 10/25/17 | | | | 7,015,376 | |
| | 20,000,000 | | | | 1.377 | (a) | | | 01/24/18 | | | | 20,026,999 | |
| | Commonwealth Bank of Australia | |
| | 3,500,000 | | | | 1.317 | (a) | | | 03/13/17 | | | | 3,500,598 | |
| | 8,000,000 | | | | 0.000 | (a)(c) | | | 02/23/18 | | | | 8,000,000 | |
| | Credit Suisse AG | |
| | 11,000,000 | | | | 1.479 | | | | 04/18/17 | | | | 11,010,348 | |
| | 4,000,000 | | | | 1.472 | | | | 07/10/17 | | | | 4,001,953 | |
| | Dexia Credit Local | |
| | 10,000,000 | | | | 1.289 | | | | 06/19/17 | | | | 10,009,308 | |
| | 7,000,000 | | | | 1.180 | | | | 08/16/17 | | | | 7,003,540 | |
| | 10,000,000 | | | | 1.261 | | | | 01/29/18 | | | | 10,005,374 | |
| | DNB Bank ASA | |
| | 12,000,000 | | | | 1.228 | | | | 04/25/17 | | | | 12,007,752 | |
| | 4,000,000 | | | | 0.988 | | | | 08/28/17 | | | | 3,998,827 | |
| | Erste Abwicklungsanstalt | |
| | 8,500,000 | | | | 1.121 | (a) | | | 03/14/17 | | | | 8,501,450 | |
| | 8,000,000 | | | | 1.112 | (a) | | | 04/19/17 | | | | 8,003,649 | |
| | HSBC Bank PLC | |
| | 8,000,000 | | | | 1.238 | (a) | | | 11/01/17 | | | | 8,005,675 | |
| | 20,000,000 | | | | 1.181 | (a) | | | 11/10/17 | | | | 19,988,071 | |
| | Mizuho Bank Ltd. | |
| | 8,000,000 | | | | 1.351 | | | | 05/12/17 | | | | 8,006,919 | |
| | 10,000,000 | | | | 1.359 | | | | 07/20/17 | | | | 10,006,445 | |
| | 7,000,000 | | | | 1.329 | | | | 08/02/17 | | | | 7,004,037 | |
| | National Australia Bank Ltd. | |
| | 7,500,000 | | | | 1.288 | (a) | | | 12/06/17 | | | | 7,512,988 | |
| | Norinchukin Bank (The) | |
| | 10,000,000 | | | | 1.281 | | | | 07/31/17 | | | | 10,006,534 | |
| | Oversea-Chinese Banking Corp., Ltd. | |
| | 9,500,000 | | | | 1.369 | (a) | | | 11/15/17 | | | | 9,515,480 | |
| | Royal Bank of Canada | |
| | 5,000,000 | | | | 1.213 | | | | 08/09/17 | | | | 5,003,769 | |
| | Skandinaviska Enskilda Banken AB | |
| | 8,000,000 | | | | 0.988 | | | | 08/23/17 | | | | 7,997,992 | |
| | Standard Chartered Bank | |
| | 13,000,000 | | | | 1.479 | | | | 04/19/17 | | | | 13,012,423 | |
| | 17,000,000 | | | | 1.428 | | | | 10/27/17 | | | | 17,008,683 | |
| | |
| Variable Rate Obligations(b) – (continued) | |
| | Sumitomo Mitsui Banking Corp. | |
| 500,000 | | | | 1.521 | | | | 03/14/17 | | | | 500,153 | |
| | 10,000,000 | | | | 1.375 | | | | 05/08/17 | | | | 10,008,619 | |
| | 10,000,000 | | | | 1.182 | | | | 08/10/17 | | | | 9,998,863 | |
| | Sumitomo Mitsui Trust Bank Ltd. | |
| | 10,000,000 | | | | 1.368 | | | | 04/27/17 | | | | 10,008,024 | |
| | Svenska Handelsbanken AB | |
| | 6,000,000 | | | | 1.294 | | | | 08/01/17 | | | | 6,007,896 | |
| | Toronto-Dominion Bank (The) | |
| | 15,000,000 | | | | 1.219 | | | | 11/02/17 | | | | 15,008,586 | |
| | 8,000,000 | | | | 1.343 | | | | 01/17/18 | | | | 8,012,875 | |
| | UBS AG | |
| | 5,900,000 | | | | 1.491 | | | | 06/01/17 | | | | 5,905,303 | |
| | Wells Fargo Bank N.A. | |
| | 9,600,000 | | | | 1.240 | | | | 05/03/17 | | | | 9,606,929 | |
| | 14,500,000 | | | | 1.357 | | | | 01/26/18 | | | | 14,522,462 | |
| | Westpac Banking Corp. | |
| | 11,000,000 | | | | 1.249 | (a) | | | 01/26/18 | | | | 11,004,945 | |
| | Westpac Securities NZ Ltd. | |
| | 10,000,000 | | | | 1.339 | (a) | | | 07/31/17 | | | | 10,013,120 | |
| | 7,000,000 | | | | 1.169 | (a) | | | 11/02/17 | | | | 7,002,208 | |
| | |
| | TOTAL VARIABLE RATE OBLIGATIONS | |
| | (Cost $456,915,384) | | | $ | 457,199,485 | |
| | |
| TOTAL INVESTMENTS BEFORE
REPURCHASE AGREEMENTS |
|
| | (Cost $1,576,079,700) | | | $ | 1,576,456,704 | |
| | |
| | | | | | | | | | | | | | |
| Repurchase Agreements(d) – 4.9% | |
| | HSBC Bank PLC | |
| $ | 40,000,000 | | | | 0.810 | % | | | 03/01/17 | | | $ | 40,000,213 | |
| | Maturity Value: $40,000,900 | |
| Collateralized by various equity securities. The aggregate market
value of the collateral, including accrued interest, was
$43,200,007. |
|
| | |
| | Wells Fargo Securities LLC | |
| | 40,000,000 | | | | 0.760 | (e) | | | 03/07/17 | | | | 40,000,000 | |
| | Maturity Value: $40,000,844 | |
| Collateralized by various sovereign debt security issuers, 0.875%
to 6.500%, due 09/05/17 to 11/03/25. The aggregate market
value of the collateral, including accrued interest, was
$42,041,550. |
|
| | |
| | TOTAL REPURCHASE AGREEMENTS | |
| | (Cost $80,000,000) | | | $ | 80,000,213 | |
| | |
| | TOTAL INVESTMENTS – 100.4% | |
| | (Cost $1,656,079,700) | | | $ | 1,656,456,917 | |
| | |
| LIABILITIES IN EXCESS OF
OTHER ASSETS – (0.4)% |
| | | (7,153,236 | ) |
| | |
| | NET ASSETS – 100.0% | | | $ | 1,649,303,681 | |
| | |
| | |
| The accompanying notes are an integral part of these financial statements. | | 23 |
FINANCIAL SQUARE MONEY MARKET FUND
Schedule of Investments (continued)
February 28, 2017 (Unaudited)
| | |
| The percentage shown for each investment category reflects the value of investments in that category as a percentage of net assets. |
(a) | | Security not registered under the Securities Act of 1933, as amended. Such securities may be deemed liquid by the Investment Adviser. At February 28, 2017, these securities amounted to $260,245,186 or approximately 15.8% of net assets. |
(b) | | Variable or floating rate security. Interest rate disclosed is that which is in effect at February 28, 2017. |
(c) | | All or a portion represents a forward commitment. |
(d) | | Unless noted, all repurchase agreements were entered into on February 28, 2017. |
(e) | | The instrument is subject to a demand feature. |
Interest rates represent either the stated coupon rate, annualized yield on date of purchase for discounted securities, or, for floating rate securities, the current reset rate, which is based upon current interest rate indices.
Maturity dates represent either the final legal maturity date on the security, the demand date for puttable securities, or the prerefunded date for those types of securities.
| | |
|
Investment Abbreviations: |
CP | | —Commercial Paper |
FHLMC | | —Insured by Federal Home Loan Mortgage Corp. |
GO | | —General Obligation |
IDB | | —Industrial Development Board |
LIQ | | —Liquidity Agreement |
LOC | | —Letter of Credit |
LP | | —Limited Partnership |
RB | | —Revenue Bond |
RMKT | | —Remarketed |
SLOC | | —Stand-by Letter of Credit |
SPA | | —Stand-by Purchase Agreement |
VRDN | | —Variable Rate Demand Notes |
|
| | |
| 24 | | The accompanying notes are an integral part of these financial statements. |
FINANCIAL SQUARE PRIME OBLIGATIONS FUND
Schedule of Investments
February 28, 2017 (Unaudited)
| | | | | | | | | | | | | | |
Principal Amount | | | Interest Rate | | | Maturity Date | | | Value | |
| Commercial Paper and Corporate Obligations – 20.6% | |
| | Albion Capital LLC | |
| $ | 5,000,000 | | | | 0.753 | % | | | 03/03/17 | | | $ | 4,999,723 | |
| | 8,000,000 | | | | 0.917 | | | | 04/25/17 | | | | 7,990,878 | |
| | Atlantic Asset Securitization LLC | |
| | 3,500,000 | | | | 1.088 | | | | 04/11/17 | | | | 3,496,162 | |
| | Barton Capital S.A. | |
| | 8,000,000 | | | | 0.733 | | | | 03/03/17 | | | | 7,999,482 | |
| | 4,500,000 | | | | 1.113 | | | | 05/02/17 | | | | 4,492,282 | |
| | BNZ International Funding Ltd. | |
| | 3,500,000 | | | | 1.279 | | | | 07/24/17 | | | | 3,484,783 | |
| | Charlotte-Mecklenburg Hospital Authority | |
| | 4,000,000 | | | | 0.917 | | | | 03/14/17 | | | | 3,998,705 | |
| | Charta LLC | |
| | 5,000,000 | | | | 1.197 | | | | 08/03/17 | | | | 4,975,690 | |
| | CRC Funding LLC | |
| | 5,000,000 | | | | 1.197 | | | | 08/01/17 | | | | 4,971,767 | |
| | Erste Abwicklungsanstalt | |
| | 4,000,000 | | | | 1.144 | | | | 05/25/17 | | | | 3,991,725 | |
| | 4,500,000 | | | | 1.155 | | | | 06/05/17 | | | | 4,488,845 | |
| | Fairway Finance Co., LLC | |
| | 4,000,000 | | | | 1.135 | | | | 07/26/17 | | | | 3,978,787 | |
| | Kaiser Foundation Hospitals | |
| | 6,000,000 | | | | 0.948 | | | | 03/28/17 | | | | 5,996,089 | |
| | 6,000,000 | | | | 0.928 | | | | 04/03/17 | | | | 5,995,172 | |
| | Kells Funding LLC | |
| | 4,000,000 | | | | 1.113 | | | | 05/15/17 | | | | 3,991,978 | |
| | Liberty Street Funding LLC | |
| | 4,000,000 | | | | 1.000 | | | | 05/12/17 | | | | 3,992,173 | |
| | 8,000,000 | | | | 1.020 | | | | 05/22/17 | | | | 7,981,279 | |
| | LMA-Americas LLC | |
| | 4,000,000 | | | | 1.123 | | | | 04/04/17 | | | | 3,996,823 | |
| | 6,000,000 | | | | 1.144 | | | | 05/02/17 | | | | 5,990,392 | |
| | Matchpoint Finance PLC | |
| | 15,000,000 | | | | 0.712 | | | | 03/01/17 | | | | 14,999,676 | |
| | MetLife Short Term Funding LLC | |
| | 3,000,000 | | | | 1.083 | | | | 04/10/17 | | | | 2,997,243 | |
| | National Bank of Abu Dhabi PJSC | |
| | 10,000,000 | | | | 0.774 | | | | 03/01/17 | | | | 9,999,823 | |
| | Nieuw Amsterdam Receivables Corp. | |
| | 6,000,000 | | | | 1.228 | | | | 08/08/17 | | | | 5,968,820 | |
| | Northwestern Memorial HealthCare | |
| | 4,000,000 | | | | 0.887 | | | | 03/09/17 | | | | 3,999,078 | |
| | Old Line Funding Corp. | |
| | 4,000,000 | | | | 0.980 | | | | 03/06/17 | | | | 3,999,523 | |
| | SSM Health Care Corp. | |
| | 6,000,000 | | | | 0.934 | | | | 03/22/17 | | | | 5,996,561 | |
| | 6,000,000 | | | | 0.887 | | | | 04/27/17 | | | | 5,989,492 | |
| | United Overseas Bank Ltd. | |
| | 5,000,000 | | | | 1.155 | | | | 04/21/17 | | | | 4,994,749 | |
| | Victory Receivables Corp. | |
| | 10,000,000 | | | | 0.753 | | | | 03/02/17 | | | | 9,999,499 | |
| | 3,750,000 | | | | 0.969 | | | | 03/16/17 | | | | 3,748,412 | |
| | |
| TOTAL COMMERCIAL PAPER AND
CORPORATE OBLIGATIONS |
|
| | (Cost $169,496,439) | | | $ | 169,505,611 | |
| | |
| Certificates of Deposit – 1.3% | |
| | Citibank, N.A. | |
| $ | 6,000,000 | | | | 1.000 | % | | | 03/13/17 | | | $ | 6,000,810 | |
| | Wells Fargo Bank N.A. | |
| | 4,500,000 | | | | 1.550 | | | | 01/18/18 | | | | 4,508,753 | |
| | |
| | TOTAL CERTIFICATES OF DEPOSIT | |
| | (Cost $10,500,000) | | | $ | 10,509,563 | |
| | |
| | | | | | | | | | | | | | |
| Certificates of Deposit-Yankeedollar – 8.1% | |
| | Cooperatieve Rabobank U.A. | |
| $ | 3,500,000 | | | | 1.300 | % | | | 08/01/17 | | | $ | 3,501,925 | |
| | Credit Agricole Corporate and Investment Bank | |
| | 7,500,000 | | | | 1.140 | | | | 06/02/17 | | | | 7,503,030 | |
| | DZ Bank AG | |
| | 4,500,000 | | | | 1.290 | | | | 08/25/17 | | | | 4,501,085 | |
| | 4,600,000 | | | | 1.380 | | | | 10/20/17 | | | | 4,602,112 | |
| | Landesbank Hessen-Thueringen Girozentrale | |
| | 8,250,000 | | | | 1.000 | | | | 03/17/17 | | | | 8,251,157 | |
| | National Bank of Kuwait | |
| | 15,000,000 | | | | 1.350 | | | | 05/31/17 | | | | 15,007,016 | |
| | Norinchukin Bank (The) | |
| | 7,000,000 | | | | 1.260 | | | | 04/26/17 | | | | 7,004,720 | |
| | 5,000,000 | | | | 1.430 | | | | 07/26/17 | | | | 5,004,019 | |
| | Oversea-Chinese Banking Corp., Ltd. | |
| | 4,500,000 | | | | 1.050 | | | | 04/19/17 | | | | 4,501,617 | |
| | Svenska Handelsbanken AB | |
| | 5,000,000 | | | | 1.190 | | | | 06/08/17 | | | | 5,002,972 | |
| | Toronto-Dominion Bank (The) | |
| | 2,000,000 | | | | 1.240 | | | | 06/16/17 | | | | 2,001,625 | |
| | |
| TOTAL CERTIFICATES OF
DEPOSIT-YANKEEDOLLAR |
|
| | (Cost $66,852,543) | | | $ | 66,881,278 | |
| | |
| | | | | | | | | | | | | | |
| Fixed Rate Municipal Debt Obligations – 1.6% | |
| | ANZ New Zealand (Int’l) Ltd. | |
| $ | 2,000,000 | | | | 1.400 | %(a) | | | 04/27/17 | | | $ | 2,001,120 | |
| | Commonwealth Bank of Australia | |
| | 4,000,000 | | | | 1.400 | | | | 09/08/17 | | | | 4,003,597 | |
| | Credit Suisse AG | |
| | 2,000,000 | | | | 1.375 | | | | 05/26/17 | | | | 2,001,674 | |
| | Metropolitan Life Global Funding I | |
| | 2,500,000 | | | | 1.300 | (a) | | | 04/10/17 | | | | 2,500,950 | |
| | MUFG Union Bank N.A. | |
| | 2,500,000 | | | | 2.125 | | | | 06/16/17 | | | | 2,507,098 | |
| | |
| TOTAL FIXED RATE MUNICIPAL
DEBT OBLIGATIONS |
|
| | (COST $13,010,171) | | | $ | 13,014,439 | |
| | |
| | |
| The accompanying notes are an integral part of these financial statements. | | 25 |
FINANCIAL SQUARE PRIME OBLIGATIONS FUND
Schedule of Investments (continued)
February 28, 2017 (Unaudited)
| | | | | | | | | | | | | | |
Principal Amount | | | Interest Rate | | | Maturity Date | | | Value | |
| Time Deposits – 9.3% | |
| National Bank of Kuwait | |
| $ | 20,000,000 | | | | 0.620 | % | | | 03/01/17 | | | $ | 20,000,000 | |
| Natixis | |
| | 30,000,000 | | | | 0.570 | | | | 03/01/17 | | | | 30,000,000 | |
| Skandinaviska Enskilda Banken AB | |
| | 26,900,000 | | | | 0.560 | | | | 03/01/17 | | | | 26,900,000 | |
| | |
| | TOTAL TIME DEPOSITS | |
| | (COST $76,900,000) | | | $ | 76,900,000 | |
| | |
| | | | | | | | | | | | | | |
| U.S. Government Agency Obligations – 1.1% | |
| Overseas Private Investment Corp. (USA)(b)(c) | |
| $ | 4,270,659 | | | | 0.660 | % | | | 03/07/17 | | | $ | 4,270,659 | |
| | 4,691,501 | | | | 0.760 | | | | 03/07/17 | | | | 4,691,501 | |
| | |
| TOTAL U.S. GOVERNMENT
AGENCY OBLIGATIONS |
|
| | (Cost $8,962,160) | | | $ | 8,962,160 | |
| | |
| | | | | | | | | | | | | | |
| Variable Rate Municipal Debt Obligations(b) – 22.5% | |
| BlackRock MuniVest Fund, Inc. VRDN RB Putters Series 2012-T0007 (JPMorgan
Chase Bank N.A., LIQ) |
|
| $ | 30,000,000 | | | | 0.750 | % | | | 03/01/17 | | | $ | 30,000,000 | |
| City of Austin, Texas Hotel Occupancy Tax VRDN RB Refunding Subordinate Lien
Series 2008 A RMKT (JPMorgan Chase Bank N.A., LOC) |
|
| | 13,010,000 | | | | 0.660 | | | | 03/07/17 | | | | 13,010,000 | |
| City of Columbia, South Carolina Waterworks & Sewer System VRDN RB
Series 2009 RMKT (Sumitomo Mitsui Banking Corp., LOC) |
|
| | 8,000,000 | | | | 0.650 | | | | 03/07/17 | | | | 8,000,000 | |
| City of Portland, Maine GO VRDN for Taxable Pension Bonds Series 2001 RMKT
(Sumitomo Mitsui Banking Corp., SPA) |
|
| | 19,700,000 | | | | 0.780 | | | | 03/07/17 | | | | 19,700,000 | |
| Montgomery County, Tennessee IDB VRDN RB for Hankook Tire Manufacturing
LP Project Series 2016 A (Kookmin Bank, LOC)(a) |
|
| | 26,650,000 | | | | 1.100 | | | | 03/07/17 | | | | 26,650,000 | |
| New York City GO VRDN Refunding Series 2008 Subseries J-5 (Bank of America
N.A., SPA) |
|
| | 1,500,000 | | | | 0.570 | | | | 03/01/17 | | | | 1,500,000 | |
| North Carolina Capital Facilities Finance Agency VRDN RB Refunding for Wake
Forest University Series 2004 A |
|
| | 1,250,000 | | | | 0.660 | | | | 03/07/17 | | | | 1,250,000 | |
| Nuveen Enhanced Municipal Credit Opportunities Fund VRDP Series 2010-2
(JPMorgan Chase Bank N.A., LIQ)(a) |
|
| | 17,400,000 | | | | 0.790 | | | | 03/07/17 | | | | 17,400,000 | |
| Ohio Water Development Authority VRDN RB for Water Pollution Control Loan
Fund Series 2016 A (BMO Harris Bank, N.A., LIQ) |
|
| | 22,000,000 | | | | 0.670 | | | | 03/07/17 | | | | 22,000,000 | |
| Providence Health & Services Obligated Group VRDN RB Series 2012-E (U.S.
Bank N.A., SBPA) |
|
| | 30,900,000 | | | | 0.730 | | | | 03/07/17 | | | | 30,900,000 | |
| State of Ohio GO VRDN for Common Schools Series 2003 D RMKT | |
| | 6,200,000 | | | | 0.660 | | | | 03/07/17 | | | | 6,200,000 | |
| | |
| Variable Rate Municipal Debt Obligations(b) – (continued) | |
| Triborough Bridge & Tunnel Authority VRDN Refunding Floating RB Series 2013
Subseries 2B RMKT (Bank of America N.A., LOC) |
|
| 9,000,000 | | | | 0.730 | | | | 03/07/17 | | | | 9,000,000 | |
| | |
| TOTAL VARIABLE RATE MUNICIPAL
DEBT OBLIGATIONS |
|
| | (COST $185,610,000) | | | $ | 185,610,000 | |
| | |
| | | | | | | | | | | | | | |
| Variable Rate Obligations(b) – 31.6% | |
| Bank of Montreal | |
| $ | 4,000,000 | | | | 1.311 | % | | | 01/11/18 | | | $ | 4,004,525 | |
| Bank of Nova Scotia (The) | |
| | 4,500,000 | | | | 1.418 | | | | 04/12/17 | | | | 4,503,447 | |
| | 4,000,000 | | | | 1.217 | (a) | | | 08/04/17 | | | | 4,002,045 | |
| | 4,000,000 | | | | 1.435 | | | | 10/06/17 | | | | 4,008,047 | |
| Bank of Tokyo-Mitsubishi UFJ Ltd. (The) | |
| | 4,000,000 | | | | 1.368 | | | | 04/27/17 | | | | 4,003,547 | |
| Bedford Row Funding Corp. | |
| | 5,000,000 | | | | 1.428 | (a) | | | 10/12/17 | | | | 5,010,193 | |
| BNP Paribas | |
| | 6,000,000 | | | | 1.494 | | | | 05/07/17 | | | | 6,003,751 | |
| Canadian Imperial Bank of Commerce | |
| | 3,600,000 | | | | 1.302 | (a) | | | 01/19/18 | | | | 3,604,627 | |
| Collateralized Commercial Paper Co., LLC | |
| | 3,000,000 | | | | 1.329 | | | | 04/25/17 | | | | 3,002,416 | |
| Collateralized Commercial Paper II Co., LLC | |
| | 2,000,000 | | | | 1.488 | (a) | | | 10/25/17 | | | | 2,004,393 | |
| | 4,500,000 | | | | 1.372 | (a) | | | 01/17/18 | | | | 4,506,139 | |
| | 12,000,000 | | | | 1.377 | (a) | | | 01/24/18 | | | | 12,016,199 | |
| Commonwealth Bank of Australia | |
| | 1,620,000 | | | | 1.317 | (a) | | | 03/13/17 | | | | 1,620,277 | |
| Credit Suisse AG | |
| | 5,000,000 | | | | 1.479 | | | | 04/18/17 | | | | 5,004,704 | |
| | 3,000,000 | | | | 1.472 | | | | 07/10/17 | | | | 3,001,464 | |
| Dexia Credit Local | |
| | 5,000,000 | | | | 1.289 | | | | 06/19/17 | | | | 5,004,654 | |
| | 4,000,000 | | | | 1.187 | | | | 11/22/17 | | | | 4,001,058 | |
| | 6,000,000 | | | | 1.261 | | | | 01/29/18 | | | | 6,003,224 | |
| DNB Bank ASA | |
| | 5,000,000 | | | | 1.228 | | | | 04/25/17 | | | | 5,003,230 | |
| | 6,000,000 | | | | 0.988 | | | | 08/28/17 | | | | 5,998,240 | |
| Erste Abwicklungsanstalt | |
| | 4,000,000 | | | | 1.121 | (a) | | | 03/14/17 | | | | 4,000,683 | |
| | 4,000,000 | | | | 1.112 | (a) | | | 04/19/17 | | | | 4,001,824 | |
| Fairway Finance Co., LLC | |
| | 5,000,000 | | | | 1.183 | (a) | | | 04/10/17 | | | | 5,002,409 | |
| HSBC Bank PLC | |
| | 6,000,000 | | | | 1.238 | (a) | | | 11/01/17 | | | | 6,004,256 | |
| | 10,000,000 | | | | 1.181 | (a) | | | 11/10/17 | | | | 9,994,035 | |
| Metropolitan Life Global Funding I | |
| | 2,858,000 | | | | 1.390 | (a) | | | 04/10/17 | | | | 2,859,612 | |
| Mizuho Bank Ltd. | |
| | 4,000,000 | | | | 1.351 | | | | 05/12/17 | | | | 4,003,460 | |
| | 6,500,000 | | | | 1.359 | | | | 07/20/17 | | | | 6,504,189 | |
| | 4,000,000 | | | | 1.329 | | | | 08/02/17 | | | | 4,002,307 | |
| | |
| | |
| 26 | | The accompanying notes are an integral part of these financial statements. |
FINANCIAL SQUARE PRIME OBLIGATIONS FUND
| | | | | | | | | | | | | | |
Principal Amount | | | Interest Rate | | | Maturity Date | | | Value | |
| Variable Rate Obligations(b) – (continued) | |
| National Australia Bank Ltd. | |
| $ | 4,500,000 | | | | 1.288 | % (a) | | | 12/06/17 | | | $ | 4,507,793 | |
| Nordea Bank AB | |
| | 4,600,000 | | | | 1.432 | | | | 04/26/17 | | | | 4,604,452 | |
| Norinchukin Bank (The) | |
| | 9,000,000 | | | | 1.281 | | | | 07/31/17 | | | | 9,005,881 | |
| Oversea-Chinese Banking Corp., Ltd. | |
| | 4,000,000 | | | | 1.369 | (a) | | | 11/15/17 | | | | 4,006,518 | |
| Royal Bank of Canada | |
| | 3,500,000 | | | | 1.213 | | | | 08/09/17 | | | | 3,502,638 | |
| Skandinaviska Enskilda Banken AB | |
| | 6,000,000 | | | | 0.988 | | | | 08/23/17 | | | | 5,998,494 | |
| Standard Chartered Bank | |
| | 5,000,000 | | | | 1.479 | | | | 04/19/17 | | | | 5,004,778 | |
| | 13,000,000 | | | | 1.428 | | | | 10/27/17 | | | | 13,006,640 | |
| State Street Bank & Trust Co. | |
| | 4,970,000 | | | | 1.278 | | | | 03/30/17 | | | | 4,972,252 | |
| Sumitomo Mitsui Banking Corp. | |
| | 5,000,000 | | | | 1.375 | | | | 05/08/17 | | | | 5,004,310 | |
| | 6,000,000 | | | | 1.182 | | | | 08/10/17 | | | | 5,999,318 | |
| Sumitomo Mitsui Trust Bank Ltd. | |
| | 8,000,000 | | | | 1.368 | | | | 04/27/17 | | | | 8,006,419 | |
| | 4,000,000 | | | | 1.171 | | | | 08/14/17 | | | | 3,999,081 | |
| Svenska Handelsbanken AB | |
| | 4,000,000 | | | | 1.294 | | | | 08/01/17 | | | | 4,005,264 | |
| Toronto-Dominion Bank (The) | |
| | 7,000,000 | | | | 1.219 | | | | 11/02/17 | | | | 7,004,007 | |
| | 5,000,000 | | | | 1.343 | | | | 01/17/18 | | | | 5,008,047 | |
| UBS AG | |
| | 3,000,000 | | | | 1.491 | | | | 06/01/17 | | | | 3,002,696 | |
| Wells Fargo Bank N.A. | |
| | 4,600,000 | | | | 1.240 | | | | 05/03/17 | | | | 4,603,320 | |
| | 9,000,000 | | | | 1.357 | | | | 01/26/18 | | | | 9,013,942 | |
| Westpac Banking Corp. | |
| | 7,000,000 | | | | 1.249 | (a) | | | 01/26/18 | | | | 7,003,147 | |
| Westpac Securities NZ Ltd. | |
| | 5,000,000 | | | | 1.339 | (a) | | | 07/31/17 | | | | 5,006,560 | |
| | |
| | TOTAL VARIABLE RATE OBLIGATIONS | |
| | (Cost $260,767,711) | | | $ | 260,944,512 | |
| | |
| TOTAL INVESTMENTS BEFORE
REPURCHASE AGREEMENTS |
|
| | (Cost $792,099,024) | | | $ | 792,327,563 | |
| | |
| | | | | | | | | | | | | | |
| Repurchase Agreements(d) – 3.6% | |
| HSBC Bank PLC | |
| $ | 20,000,000 | | | | 0.810 | % | | | 03/01/17 | | | $ | 20,000,107 | |
| Maturity Value: $20,000,450 | |
| Collateralized by various equity securities. The aggregate market
value of the collateral, including accrued interest, was
$21,600,001. |
|
| | |
| Repurchase Agreements(d) – (continued) | |
| Wells Fargo Securities LLC | |
| 10,000,000 | | | | 0.760 | %(c) | | | 03/07/17 | | | | 10,000,000 | |
| Maturity Value: $10,000,211 | |
| Collateralized by various sovereign debt security issuers, 1.000%
to 1.125%, due 06/11/18 to 08/06/18. The aggregate market
value of the collateral, including accrued interest, was
$10,500,825. |
|
| | |
| | TOTAL REPURCHASE AGREEMENTS | |
| | (Cost $30,000,000) | | | $ | 30,000,107 | |
| | |
| | TOTAL INVESTMENTS – 99.7% | |
| | (Cost $822,099,024) | | | $ | 822,327,670 | |
| | |
| OTHER ASSETS IN EXCESS OF
LIABILITIES – 0.3% |
| | | 2,405,423 | |
| | |
| | NET ASSETS – 100.0% | | | $ | 824,733,093 | |
| | |
| | |
| The percentage shown for each investment category reflects the value of investments in that category as a percentage of net assets. |
(a) | | Security not registered under the Securities Act of 1933, as amended. Such securities may be deemed liquid by the Investment Adviser. At February 28, 2017, these securities amounted to $133,702,780 or approximately 16.2% of net assets. |
(b) | | Variable or floating rate security. Interest rate disclosed is that which is in effect at February 28, 2017. |
(c) | | The instrument is subject to a demand feature. |
(d) | | Unless noted, all repurchase agreements were entered into on February 28, 2017. |
Interest rates represent either the stated coupon rate, annualized yield on date of purchase for discounted securities, or, for floating rate securities, the current reset rate, which is based upon current interest rate indices.
Maturity dates represent either the final legal maturity date on the security, the demand date for puttable securities, or the prerefunded date for those types of securities.
| | |
|
Investment Abbreviations: |
GO | | —General Obligation |
IDB | | —Industrial Development Board |
LIQ | | —Liquidity Agreement |
LOC | | —Letter of Credit |
LP | | —Limited Partnership |
RB | | —Revenue Bond |
RMKT | | —Remarketed |
SBPA | | —Standby Bond Purchase Agreement |
SPA | | —Stand-by Purchase Agreement |
VRDN | | —Variable Rate Demand Notes |
VRDP | | —Variable Rate Demand Preferred Shares |
|
| | |
| The accompanying notes are an integral part of these financial statements. | | 27 |
FINANCIAL SQUARE TAX-EXEMPT MONEY MARKET FUND
Schedule of Investments
February 28, 2017 (Unaudited)
| | | | | | | | | | | | | | |
Principal Amount | | | Interest Rate | | | Maturity Date | | | Value | |
| | | | | | | | | | | | | | |
| Municipal Debt Obligations – 100.8% | |
| Alabama – 2.9% | |
| | Huntsville Health Care Authority CP Series 2017 | |
| $ | 200,000 | | | | 0.840 | % | | | 06/01/17 | | | $ | 200,015 | |
| | |
| California – 18.9% | |
| ABAG Finance Authority for Non-Profit Corporations VRDN RB for Lakeside
Village Apartments Series 2011 A (FHLMC, LIQ) |
|
| | 140,000 | | | | 0.580 | | | | 03/07/17 | | | | 140,000 | |
| California Educational Facilities Authority VRDN RB Refunding for Stanford
University Series 1997 L-5 |
|
| | 100,000 | | | | 0.590 | | | | 03/07/17 | | | | 100,000 | |
| | California School Cash Reserve Program Authority RB Series 2016 C | |
| | 200,000 | | | | 2.000 | | | | 06/30/17 | | | | 200,791 | |
| California Statewide Communities Development Authority CP for Kaiser
Permanente Series 2017 04-I |
|
| | 140,000 | | | | 0.780 | | | | 03/14/17 | | | | 140,010 | |
| | City of Los Angeles GO TRANS Series 2016 B | |
| | 200,000 | | | | 3.000 | | | | 06/29/17 | | | | 201,535 | |
| Los Angeles County Housing Authority MF Hsg VRDN RB Refunding for Malibu
Meadows II Project Series 1998 C (FNMA) (FNMA, LIQ) |
|
| | 200,000 | | | | 0.580 | | | | 03/07/17 | | | | 200,000 | |
| Metropolitan Water District of Southern California VRDN RB Refunding
Series 2016 B-1 (Landesbank Hessen-Thueringen Girozentrale, SPA) |
|
| | 135,000 | | | | 0.490 | | | | 03/01/17 | | | | 135,000 | |
| San Diego County Regional Transportation Commission VRDN RB Refunding for
Limited Tax Series 2008 C (Mizuho Corp. Bank, SPA) |
|
| | 200,000 | | | | 0.610 | | | | 03/07/17 | | | | 200,000 | |
| | | | | | | | | | | | | | |
| | | | | | | | | | | | | 1,317,336 | |
| | |
| Colorado – 3.5% | |
| City of Colorado Springs Utilities System VRDN RB Series 2010 C (JPMorgan
Chase Bank N.A., SPA) |
|
| | 245,000 | | | | 0.640 | | | | 03/07/17 | | | | 245,000 | |
| | |
| Delaware – 3.4% | |
| | University of Delaware VRDN RB Refunding Series 2005 (TD Bank N.A., SPA) | |
| | 140,000 | | | | 0.570 | | | | 03/01/17 | | | | 140,000 | |
| | University of Delaware VRDN RB Series 2004 B (Bank of America N.A., SPA) | |
| | 100,000 | | | | 0.570 | | | | 03/01/17 | | | | 100,000 | |
| | | | | | | | | | | | | | |
| | | | | | | | | | | | | 240,000 | |
| | |
| District of Columbia – 2.9% | |
| | District of Columbia Income Tax Secured VRDN RB Refunding Series 2014 B(a) | |
| | 200,000 | | | | 0.940 | | | | 03/07/17 | | | | 200,110 | |
| | |
| Florida – 4.2% | |
| City of Gainesville Utilities System VRDN RB Refunding Series 2007 A (State
Street Bank & Trust Co., SPA) |
|
| | 155,000 | | | | 0.650 | | | | 03/07/17 | | | | 155,000 | |
| Jacksonville Electric Authority Water & Sewer System VRDN RB Refunding
Series 2008 Subseries B-1 RMKT (State Street Bank & Trust Co., SPA) |
|
| | 140,000 | | | | 0.660 | | | | 03/07/17 | | | | 140,000 | |
| | | | | | | | | | | | | | |
| | | | | | | | | | | | | 295,000 | |
| | |
| Georgia – 8.6% | |
| Private Colleges & Universities Authority VRDN RB Refunding for Emory
University Series 2005 B-1 |
|
| | 300,000 | | | | 0.630 | | | | 03/07/17 | | | | 300,000 | |
| | |
| | | | | | | | | | | | | | |
| Municipal Debt Obligations – (continued) | |
| Georgia – (continued) | |
| | State of Georgia GO Series 2007 B | |
| 300,000 | | | | 5.000 | | | | 04/01/17 | | | | 301,072 | |
| | | | | | | | | | | | | | |
| | | | | | | | | | | | | 601,072 | |
| | |
| Illinois – 1.4% | |
| Illinois Finance Authority VRDN RB Refunding for Northwestern Memorial
Hospital Series 2007 A-3 RMKT (JPMorgan Chase Bank N.A., SPA) |
|
| | 100,000 | | | | 0.640 | | | | 03/07/17 | | | | 100,000 | |
| | |
| Massachusetts – 1.4% | |
| Massachusetts Health & Educational Facilities Authority VRDN RB for Museum
of Fine Arts Series 2007 A-2 RMKT (Bank of America N.A., SPA) |
|
| | 100,000 | | | | 0.570 | | | | 03/01/17 | | | | 100,000 | |
| | |
| Mississippi – 4.3% | |
| Mississippi Business Finance Commission Gulf Opportunity Zone VRDN RB for
Chevron USA, Inc. Project Series 2010 L (GTY AGMT – Chevron Corp.) |
|
| | 300,000 | | | | 0.570 | | | | 03/01/17 | | | | 300,000 | |
| | |
| New Jersey – 2.2% | |
| | County of Bergen GO BANS Refunding Series 2016 B | |
| | 150,000 | | | | 2.000 | | | | 12/14/17 | | | | 151,195 | |
| | |
| New York – 12.0% | |
| County of Nassau, New York IDA Civic Facility Refunding & Improvement VRDN
RB Refunding for Cold Spring Harbor Laboratory Project Series 1999 RMKT
(TD Bank N.A., SPA) |
|
| | 200,000 | | | | 0.570 | | | | 03/01/17 | | | | 200,000 | |
| New York City Transitional Finance Authority VRDN RB for Future Tax Secured
Subordinate Series 2015 Subseries A-4 (Mizuho Bank, Ltd., SPA) |
|
| | 140,000 | | | | 0.580 | | | | 03/01/17 | | | | 140,000 | |
| New York State Thruway Authority Personal Income Tax RB for Transportation
Series 2013 A |
|
| | 200,000 | | | | 5.000 | | | | 03/15/17 | | | | 200,326 | |
| Triborough Bridge & Tunnel Authority VRDN RB Refunding General
Series 2002 F RMKT (Landesbank Hessen-Thueringen Girozentrale, LOC) |
|
| | 300,000 | | | | 0.620 | | | | 03/01/17 | | | | 300,000 | |
| | | | | | | | | | | | | | |
| | | | | | | | | | | | | 840,326 | |
| | |
| North Carolina – 10.5% | |
| City of Raleigh VRDN COPS for Downtown Improvement Project Series 2005 B-1
RMKT (Wells Fargo Bank N.A., SPA) |
|
| | 250,000 | | | | 0.620 | | | | 03/07/17 | | | | 250,000 | |
| North Carolina Educational Facilities Finance Agency VRDN RB for Duke
University Project Series 1991 B |
|
| | 140,000 | | | | 0.600 | | | | 03/07/17 | | | | 140,000 | |
| | University of North Carolina at Chapel Hill VRDN RB Refunding Series 2001 B | |
| | 140,000 | | | | 0.600 | | | | 03/07/17 | | | | 140,000 | |
| University of North Carolina Hospital at Chapel Hill VRDN RB Series 2001 B
RMKT (Landesbank Hessen-Thueringen Girozentrale, SPA) |
|
| | 200,000 | | | | 0.570 | | | | 03/01/17 | | | | 200,000 | |
| | | | | | | | | | | | | | |
| | | | | | | | | | | | | 730,000 | |
| | |
| Ohio – 3.5% | |
| | City of Columbus GO VRDN for Sanitation Sewer System Series 2006-1 | |
| | 245,000 | | | | 0.600 | | | | 03/07/17 | | | | 245,000 | |
| | |
| | |
| 28 | | The accompanying notes are an integral part of these financial statements. |
FINANCIAL SQUARE TAX-EXEMPT MONEY MARKET FUND
| | | | | | | | | | | | | | |
Principal Amount | | | Interest Rate | | | Maturity Date | | | Value | |
| | | | | | | | | | | | | | |
| Municipal Debt Obligations – (continued) | |
| Oregon – 1.4% | |
| State of Oregon GO VRDN for Veterans’ Welfare Series 2006 86 RMKT (U.S.
Bank N.A., SPA) |
|
| $ | 100,000 | | | | 0.530 | % | | | 03/01/17 | | | $ | 100,000 | |
| | |
| Pennsylvania – 4.3% | |
| Philadelphia Hospitals & Higher Education Facilities Authority VRDN RB
Refunding for Children’s Hospital of Philadelphia Project Series 2002 B RMKT
(Wells Fargo Bank N.A., SPA) |
|
| | 300,000 | | | | 0.560 | | | | 03/01/17 | | | | 300,000 | |
| | |
| Texas – 9.2% | |
| | City of Houston TRANS Series 2016 | |
| | 250,000 | | | | 5.000 | | | | 06/30/17 | | | | 253,495 | |
| City of San Antonio Electric & Gas Systems CP Series 2017 B (State Street
Bank & Trust Co. and Wells Fargo Bank N.A., LOC) |
|
| | 250,000 | | | | 0.730 | | | | 04/06/17 | | | | 250,008 | |
| Lower Neches Valley Authority Industrial Development Corp. VRDN RB for
ExxonMobil Project Series 2010 (GTY AGMT – Exxon Mobil Corp.) |
|
| | 140,000 | | | | 0.550 | | | | 03/01/17 | | | | 140,000 | |
| | | | | | | | | | | | | | |
| | | | | | | | | | | | | 643,503 | |
| | |
| Washington – 3.3% | |
| County of King Multi-Modal Limited Tax GO VRDN Series 2010 B (State Street
Bank & Trust Co., SPA) |
|
| | 230,000 | | | | 0.640 | | | | 03/07/17 | | | | 230,000 | |
| | |
| Wisconsin – 2.9% | |
| City of Milwaukee GO Refunding for Promissory & Corporate Notes
Series 2012 N2 |
|
| | 200,000 | | | | 5.000 | | | | 05/01/17 | | | | 201,441 | |
| | |
| | TOTAL INVESTMENTS – 100.8% | |
| | (Cost $7,039,647) | | | $ | 7,039,998 | |
| | |
| LIABILITIES IN EXCESS OF
OTHER ASSETS – (0.8)% |
| | | (56,489 | ) |
| | |
| | NET ASSETS – 100.0% | | | $ | 6,983,509 | |
| | |
| | |
| The percentage shown for each investment category reflects the value of investments in that category as a percentage of net assets. |
(a) | | All or a portion represents a forward commitment. |
|
| Interest rates represent either the stated coupon rate, or for floating rate securities, the current reset rate, which is based upon current interest rate indices. |
|
| Maturity dates represent either the final legal maturity date on the security, the demand date for puttable securities, or the prerefunded date for those types of securities. |
| | |
|
Investment Abbreviations: |
BANS | | —Bond Anticipation Notes |
COPS | | —Certificates of Participation |
CP | | —Commercial Paper |
FHLMC | | —Insured by Federal Home Loan Mortgage Corp. |
FNMA | | —Insured by Federal National Mortgage Association |
GO | | —General Obligation |
GTY AGMT | | —Guaranty Agreement |
IDA | | —Industrial Development Agency |
LIQ | | —Liquidity Agreement |
LOC | | —Letter of Credit |
MF Hsg | | —Multi-Family Housing |
RB | | —Revenue Bond |
RMKT | | —Remarketed |
SPA | | —Stand-by Purchase Agreement |
TRANS | | —Tax Revenue Anticipation Notes |
VRDN | | —Variable Rate Demand Notes |
|
| | |
| The accompanying notes are an integral part of these financial statements. | | 29 |
FINANCIAL SQUARE TREASURY INSTRUMENTS FUND
Schedule of Investments
February 28, 2017 (Unaudited)
| | | | | | | | | | | | | | |
Principal Amount | | | Interest Rate | | | Maturity Date | | | Amortized Cost | |
| | | | | | | | | | | | | | |
| U.S. Treasury Obligations – 99.9% | |
| United States Cash Management Bill | |
| $ | 2,215,800,000 | | | | 0.534 | % | | | 03/15/17 | | | $ | 2,215,347,607 | |
| United States Treasury Bills | |
| | 22,200,000 | | | | 0.432 | | | | 03/02/17 | | | | 22,199,738 | |
| | 118,000,000 | | | | 0.437 | | | | 03/02/17 | | | | 117,998,591 | |
| | 300,000,000 | | | | 0.457 | | | | 03/09/17 | | | | 299,970,000 | |
| | 100,000,000 | | | | 0.498 | | | | 03/09/17 | | | | 99,989,111 | |
| | 215,000,000 | | | | 0.406 | (a) | | | 03/16/17 | | | | 214,964,167 | |
| | 120,000,000 | | | | 0.422 | | | | 03/16/17 | | | | 119,979,250 | |
| | 51,600,000 | | | | 0.498 | | | | 03/16/17 | | | | 51,589,465 | |
| | 46,500,000 | | | | 0.508 | | | | 03/16/17 | | | | 46,490,312 | |
| | 809,500,000 | | | | 0.524 | | | | 03/16/17 | | | | 809,326,293 | |
| | 1,343,800,000 | | | | 0.539 | | | | 03/16/17 | | | | 1,343,503,245 | |
| | 90,100,000 | | | | 0.550 | | | | 03/16/17 | | | | 90,079,728 | |
| | 170,500,000 | | | | 0.457 | | | | 03/23/17 | | | | 170,453,113 | |
| | 458,000,000 | | | | 0.468 | | | | 03/23/17 | | | | 457,871,251 | |
| | 1,687,900,000 | | | | 0.483 | | | | 03/23/17 | | | | 1,687,410,040 | |
| | 240,500,000 | | | | 0.493 | | | | 03/23/17 | | | | 240,428,718 | |
| | 50,000,000 | | | | 0.514 | | | | 03/23/17 | | | | 49,984,569 | |
| | 596,100,000 | | | | 0.519 | | | | 03/23/17 | | | | 595,914,216 | |
| | 1,000,000,000 | | | | 0.524 | | | | 03/23/17 | | | | 999,685,277 | |
| | 102,800,000 | | | | 0.529 | | | | 03/23/17 | | | | 102,767,332 | |
| | 3,541,700,000 | | | | 0.539 | | | | 04/06/17 | | | | 3,539,822,902 | |
| | 13,300,000 | | | | 0.544 | | | | 04/06/17 | | | | 13,292,885 | |
| | 289,740,000 | | | | 0.512 | | | | 04/13/17 | | | | 289,565,923 | |
| | 839,900,000 | | | | 0.514 | | | | 04/13/17 | | | | 839,393,377 | |
| | 988,600,000 | | | | 0.519 | | | | 04/13/17 | | | | 987,997,776 | |
| | 255,500,000 | | | | 0.539 | | | | 04/20/17 | | | | 255,311,924 | |
| | 234,200,000 | | | | 0.488 | | | | 05/04/17 | | | | 234,000,149 | |
| | 88,600,000 | | | | 0.493 | | | | 05/04/17 | | | | 88,523,607 | |
| | 205,600,000 | | | | 0.503 | | | | 05/04/17 | | | | 205,419,072 | |
| | 35,100,000 | | | | 0.509 | | | | 05/04/17 | | | | 35,068,800 | |
| | 119,800,000 | | | | 0.514 | | | | 05/04/17 | | | | 119,692,446 | |
| | 12,100,000 | | | | 0.519 | | | | 05/04/17 | | | | 12,089,029 | |
| | 80,300,000 | | | | 0.524 | | | | 05/04/17 | | | | 80,226,481 | |
| | 9,700,000 | | | | 0.529 | | | | 05/04/17 | | | | 9,691,033 | |
| | 53,960,000 | | | | 0.596 | | | | 05/04/17 | | | | 53,903,882 | |
| | 148,400,000 | | | | 0.560 | | | | 05/11/17 | | | | 148,239,027 | |
| | 709,850,000 | | | | 0.637 | | | | 05/18/17 | | | | 708,888,745 | |
| | 4,100,000 | | | | 0.509 | | | | 05/25/17 | | | | 4,095,160 | |
| | 147,850,000 | | | | 0.524 | | | | 05/25/17 | | | | 147,670,218 | |
| | 159,700,000 | | | | 0.529 | | | | 05/25/17 | | | | 159,503,924 | |
| | 64,000,000 | | | | 0.534 | | | | 05/25/17 | | | | 63,920,667 | |
| | 49,000,000 | | | | 0.539 | | | | 05/25/17 | | | | 48,938,682 | |
| | 34,800,000 | | | | 0.621 | | | | 05/25/17 | | | | 34,749,878 | |
| | 54,100,000 | | | | 0.626 | | | | 05/25/17 | | | | 54,021,442 | |
| | 163,800,000 | | | | 0.642 | | | | 05/25/17 | | | | 163,556,348 | |
| | 25,900,000 | | | | 0.524 | (a) | | | 06/01/17 | | | | 25,866,283 | |
| | 3,600,000 | | | | 0.560 | | | | 06/08/17 | | | | 3,594,555 | |
| | 31,400,000 | | | | 0.611 | | | | 07/13/17 | | | | 31,329,873 | |
| | 19,600,000 | | | | 0.601 | | | | 07/20/17 | | | | 19,554,708 | |
| | 16,900,000 | | | | 0.606 | | | | 07/20/17 | | | | 16,860,616 | |
| | 11,530,000 | | | | 0.611 | | | | 07/20/17 | | | | 11,502,905 | |
| | 12,800,000 | | | | 0.683 | | | | 08/24/17 | | | | 12,758,073 | |
| | 7,200,000 | | | | 0.683 | (a) | | | 08/31/17 | | | | 7,175,612 | |
| | |
| United States Treasury Floating Rate Notes(b) | |
| 6,141,500,000 | | | | 0.590 | | | | 04/30/17 | | | | 6,141,972,328 | |
| | 4,679,705,000 | | | | 0.593 | | | | 07/31/17 | | | | 4,680,550,748 | |
| | 3,719,526,000 | | | | 0.684 | | | | 10/31/17 | | | | 3,723,636,982 | |
| | 663,356,000 | | | | 0.788 | | | | 01/31/18 | | | | 664,891,424 | |
| | 756,800,000 | | | | 0.706 | (a) | | | 04/30/18 | | | | 757,787,007 | |
| | 944,800,000 | | | | 0.690 | | | | 07/31/18 | | | | 945,556,859 | |
| | 450,000,000 | | | | 0.656 | | | | 01/31/19 | | | | 450,060,641 | |
| United States Treasury Notes | |
| | 1,397,950,000 | | | | 0.750 | | | | 03/15/17 | | | | 1,398,074,917 | |
| | 231,280,000 | | | | 0.500 | | | | 03/31/17 | | | | 231,279,700 | |
| | 787,300,000 | | | | 1.000 | | | | 03/31/17 | | | | 787,611,539 | |
| | 691,220,000 | | | | 3.250 | | | | 03/31/17 | | | | 692,774,251 | |
| | 25,100,000 | | | | 0.875 | | | | 04/15/17 | | | | 25,110,158 | |
| | 106,000,000 | | | | 0.500 | | | | 04/30/17 | | | | 105,993,926 | |
| | 74,100,000 | | | | 3.125 | | | | 04/30/17 | | | | 74,414,472 | |
| | 78,350,000 | | | | 0.875 | | | | 05/15/17 | | | | 78,390,209 | |
| | 743,610,000 | | | | 4.500 | | | | 05/15/17 | | | | 749,588,938 | |
| | 414,000,000 | | | | 8.750 | | | | 05/15/17 | | | | 420,960,316 | |
| | 880,613,000 | | | | 0.625 | | | | 05/31/17 | | | | 880,607,841 | |
| | 1,445,450,000 | | | | 2.750 | | | | 05/31/17 | | | | 1,453,248,934 | |
| | 570,000,000 | | | | 0.875 | | | | 06/15/17 | | | | 570,439,836 | |
| | 339,070,000 | | | | 0.625 | | | | 06/30/17 | | | | 339,088,068 | |
| | 72,700,000 | | | | 0.750 | | | | 06/30/17 | | | | 72,731,521 | |
| | 1,191,100,000 | | | | 2.500 | | | | 06/30/17 | | | | 1,198,550,142 | |
| | 343,300,000 | | | | 0.875 | | | | 07/15/17 | | | | 343,585,298 | |
| | 200,000 | | | | 0.625 | | | | 07/31/17 | | | | 199,949 | |
| | 258,600,000 | | | | 2.375 | | | | 07/31/17 | | | | 260,494,487 | |
| | 361,350,000 | | | | 0.875 | | | | 08/15/17 | | | | 361,676,571 | |
| | 432,530,000 | | | | 4.750 | | | | 08/15/17 | | | | 440,604,974 | |
| | 266,700,000 | | | | 0.625 | | | | 08/31/17 | | | | 266,535,908 | |
| | 685,100,000 | | | | 1.875 | | | | 08/31/17 | | | | 689,086,153 | |
| | 208,300,000 | | | | 1.000 | | | | 09/15/17 | | | | 208,529,997 | |
| | 107,400,000 | | | | 0.625 | | | | 09/30/17 | | | | 107,283,052 | |
| | 116,900,000 | | | | 1.875 | | | | 09/30/17 | | | | 117,626,358 | |
| | 84,200,000 | | | | 0.875 | | | | 10/15/17 | | | | 84,224,454 | |
| | 20,200,000 | | | | 0.750 | | | | 10/31/17 | | | | 20,195,246 | |
| | 67,200,000 | | | | 1.875 | | | | 10/31/17 | | | | 67,665,970 | |
| | 18,200,000 | | | | 4.250 | | | | 11/15/17 | | | | 18,633,876 | |
| | |
| | TOTAL INVESTMENTS – 99.9% | | | $ | 47,591,841,075 | |
| | |
| OTHER ASSETS IN EXCESS OF
LIABILITIES – 0.1% |
| | | 34,450,413 | |
| | |
| | NET ASSETS – 100.0% | | | $ | 47,626,291,488 | |
| | |
| | |
| 30 | | The accompanying notes are an integral part of these financial statements. |
FINANCIAL SQUARE TREASURY INSTRUMENTS FUND
| | |
| The percentage shown for each investment category reflects the value of investments in that category as a percentage of net assets. |
(a) | | All or a portion represents a forward commitment. |
(b) | | Variable or floating rate security. Interest rate disclosed is that which is in effect at February 28, 2017. |
Interest rates represent either the stated coupon rate, annualized yield on date of purchase for discounted securities, or, for floating rate securities, the current reset rate, which is based upon interest rate indices.
Maturity dates represent either the final legal maturity date on the security, the demand date for puttable securities, or the prerefunded date for those types of securities.
| | |
| The accompanying notes are an integral part of these financial statements. | | 31 |
FINANCIAL SQUARE TREASURY OBLIGATIONS FUND
Schedule of Investments
February 28, 2017 (Unaudited)
| | | | | | | | | | | | | | |
Principal Amount | | | Interest Rate | | | Maturity Date | | | Amortized Cost | |
| U.S. Treasury Obligations – 48.3% | |
| United States Treasury Bills | |
| $ | 28,800,000 | | | | 0.503 | % | | | 05/04/17 | | | $ | 28,774,656 | |
| | 52,650,000 | | | | 0.560 | | | | 05/11/17 | | | | 52,592,889 | |
| | 207,775,000 | | | | 0.637 | | | | 05/18/17 | | | | 207,493,638 | |
| | 100,000 | | | | 0.509 | | | | 05/25/17 | | | | 99,882 | |
| | 43,250,000 | | | | 0.524 | | | | 05/25/17 | | | | 43,197,409 | |
| | 26,675,000 | | | | 0.529 | | | | 05/25/17 | | | | 26,642,249 | |
| | 22,625,000 | | | | 0.534 | | | | 05/25/17 | | | | 22,596,955 | |
| | 34,500,000 | | | | 0.539 | | | | 05/25/17 | | | | 34,456,827 | |
| | 110,550,000 | | | | 0.616 | | | | 05/25/17 | | | | 110,392,082 | |
| | 42,500,000 | | | | 0.621 | | | | 05/25/17 | | | | 42,438,788 | |
| | 23,800,000 | | | | 0.626 | | | | 05/25/17 | | | | 23,765,440 | |
| | 38,350,000 | | | | 0.524 | (a) | | | 06/01/17 | | | | 38,300,076 | |
| | 33,400,000 | | | | 0.611 | | | | 07/13/17 | | | | 33,325,407 | |
| | 9,500,000 | | | | 0.601 | | | | 07/20/17 | | | | 9,478,047 | |
| | 17,900,000 | | | | 0.606 | | | | 07/20/17 | | | | 17,858,286 | |
| | 4,500,000 | | | | 0.611 | | | | 07/20/17 | | | | 4,489,425 | |
| | 6,100,000 | | | | 0.683 | | | | 08/24/17 | | | | 6,080,019 | |
| | 12,400,000 | | | | 0.683 | (a) | | | 08/31/17 | | | | 12,357,998 | |
| United States Treasury Floating Rate Notes(b) | |
| | 195,200,000 | | | | 0.590 | | | | 04/30/17 | | | | 195,218,737 | |
| | 613,300,000 | | | | 0.593 | | | | 07/31/17 | | | | 613,322,210 | |
| | 244,000,000 | | | | 0.684 | | | | 10/31/17 | | | | 243,961,728 | |
| | 610,800,000 | | | | 0.788 | | | | 01/31/18 | | | | 611,123,253 | |
| | 986,900,000 | | | | 0.706 | (a) | | | 04/30/18 | | | | 987,388,860 | |
| | 377,000,000 | | | | 0.690 | | | | 07/31/18 | | | | 377,016,190 | |
| | 142,500,000 | | | | 0.656 | | | | 01/31/19 | | | | 142,519,203 | |
| United States Treasury Notes | |
| | 22,100,000 | | | | 1.000 | | | | 03/31/17 | | | | 22,108,501 | |
| | 182,700,000 | | | | 3.250 | | | | 03/31/17 | | | | 183,111,694 | |
| | 8,900,000 | | | | 0.500 | | | | 04/30/17 | | | | 8,899,072 | |
| | 36,200,000 | | | | 3.125 | | | | 04/30/17 | | | | 36,353,631 | |
| | 314,650,000 | | | | 4.500 | | | | 05/15/17 | | | | 317,172,407 | |
| | 163,400,000 | | | | 8.750 | | | | 05/15/17 | | | | 166,147,139 | |
| | 413,700,000 | | | | 0.625 | | | | 05/31/17 | | | | 413,694,713 | |
| | 689,800,000 | | | | 2.750 | | | | 05/31/17 | | | | 693,493,844 | |
| | 213,200,000 | | | | 0.875 | | | | 06/15/17 | | | | 213,360,654 | |
| | 127,700,000 | | | | 0.625 | | | | 06/30/17 | | | | 127,707,279 | |
| | 47,800,000 | | | | 0.750 | | | | 06/30/17 | | | | 47,820,153 | |
| | 533,100,000 | | | | 2.500 | | | | 06/30/17 | | | | 536,441,809 | |
| | 382,400,000 | | | | 0.875 | | | | 07/15/17 | | | | 382,768,792 | |
| | 81,500,000 | | | | 2.375 | | | | 07/31/17 | | | | 82,097,615 | |
| | 188,150,000 | | | | 0.875 | | | | 08/15/17 | | | | 188,327,057 | |
| | 217,250,000 | | | | 4.750 | | | | 08/15/17 | | | | 221,297,197 | |
| | 117,000,000 | | | | 0.625 | | | | 08/31/17 | | | | 116,925,101 | |
| | 275,500,000 | | | | 1.875 | | | | 08/31/17 | | | | 277,099,867 | |
| | 132,800,000 | | | | 1.000 | | | | 09/15/17 | | | | 132,946,277 | |
| | 138,800,000 | | | | 0.625 | | | | 09/30/17 | | | | 138,640,547 | |
| | 74,900,000 | | | | 1.875 | | | | 09/30/17 | | | | 75,373,690 | |
| | 96,200,000 | | | | 0.875 | | | | 10/15/17 | | | | 96,220,362 | |
| | 186,600,000 | | | | 0.750 | | | | 10/31/17 | | | | 186,459,868 | |
| | 219,100,000 | | | | 1.875 | | | | 10/31/17 | | | | 220,586,233 | |
| | 131,450,000 | | | | 4.250 | | | | 11/15/17 | | | | 134,580,906 | |
| | 7,900,000 | | | | 0.625 | | | | 11/30/17 | | | | 7,883,172 | |
| | 14,700,000 | | | | 2.250 | | | | 11/30/17 | | | | 14,856,849 | |
| | |
| TOTAL INVESTMENTS BEFORE
REPURCHASE AGREEMENTS |
| | $ | 8,927,264,683 | |
| | |
| Repurchase Agreements(c) – 51.1% | |
| Bank of Montreal | |
| $ | 200,000,000 | | | | 0.520 | % | | | 03/01/17 | | | $ | 200,000,000 | |
| Maturity Value: $200,002,889 | |
| Collateralized by U.S. Treasury Inflation-Indexed Notes, 0.125%,
due 04/15/19 to 07/15/26 and U.S. Treasury Notes, 0.875% to
2.250%, due 05/31/18 to 01/31/24. The aggregate market value
of the collateral, including accrued interest, was $204,000,091. |
|
| | |
| Bank of Nova Scotia (The) | |
| | 96,900,000 | | | | 0.520 | | | | 03/01/17 | | | | 96,900,000 | |
| Maturity Value: $96,901,400 | |
| Collateralized by U.S. Treasury Bonds, 2.500% to 3.750%, due
11/15/43 to 05/15/46, U.S. Treasury Inflation-Indexed Bonds,
2.000% to 2.500%, due 01/15/26 to 01/15/29, U.S. Treasury
Inflation-Indexed Notes, 0.125%, due 04/15/18 to 04/15/19 and
a U.S. Treasury Note, 1.750%, due 05/15/23. The aggregate
market value of the collateral, including accrued interest, was
$98,839,505. |
|
| | |
| BNP Paribas | |
| | 100,000,000 | | | | 0.520 | | | | 03/01/17 | | | | 100,000,000 | |
| Maturity Value: $100,001,444 | |
| Collateralized by U.S. Treasury Inflation-Indexed Note, 1.625%,
due 01/15/18, U.S. Treasury Interest-Only Stripped Securities,
0.000%, due 05/15/27 to 02/15/45, U.S. Treasury Notes,
0.625% to 1.500%, due 08/31/17 to 11/30/19 and U.S. Treasury
Principal-Only Stripped Securities, 0.000%, due 05/15/44 to
11/15/45. The aggregate market value of the collateral,
including accrued interest, was $101,999,998. |
|
| | 700,000,000 | | | | 0.540 | (b)(d) | | | 03/01/17 | | | | 700,000,000 | |
| Maturity Value: $704,063,500 | |
| Settlement Date: 02/23/16 | |
| Collateralized by a U.S. Treasury Bond, 3.750%, due 11/15/43,
U.S. Treasury Inflation-Indexed Bonds, 0.625% to 3.375%, due
01/15/27 to 02/15/43, U.S. Treasury Inflation-Indexed Notes,
0.125% to 0.625%, due 04/15/20 to 01/15/24, a U.S. Treasury
Interest-Only Stripped Security, 0.000%, due 05/15/28 and U.S.
Treasury Notes, 1.000% to 3.375%, due 12/15/17 to 04/30/23.
The aggregate market value of the collateral, including accrued
interest, was $714,000,001. |
|
| | 1,000,000,000 | | | | 0.530 | (b)(d) | | | 03/07/17 | | | | 1,000,000,000 | |
| Maturity Value: $1,000,544,721 | |
| Settlement Date: 02/07/17 | |
| Collateralized by U.S. Treasury Bonds, 3.000% to 8.875%, due
02/15/19 to 02/15/47, U.S. Treasury Inflation-Indexed Bonds,
2.000% to 3.375%, due 01/15/26 to 04/15/32, U.S. Treasury
Inflation-Indexed Notes, 0.125% to 1.625%, due 04/15/17 to
01/15/24, U.S. Treasury Interest-Only Stripped Securities,
0.000%, due 05/15/29 to 02/15/42, U.S. Treasury Notes,
1.250% to 2.250%, due 11/30/19 to 12/31/23 and a U.S.
Treasury Principal-Only Stripped Security, 0.000%, due
05/15/42. The aggregate market value of the collateral,
including accrued interest, was $1,019,999,997. |
|
| | 750,000,000 | | | | 0.570 | (b)(d) | | | 03/07/17 | | | | 750,000,000 | |
| Maturity Value: $751,270,622 | |
| Settlement Date: 12/14/16 | |
| Collateralized by U.S. Treasury Inflation-Indexed Bonds, 0.750%
to 3.875%, due 04/15/29 to 02/15/42, a U.S. Treasury Inflation-
Indexed Note, 1.375%, due 07/15/18, U.S. Treasury Interest-
Only Stripped Securities, 0.000%, due 02/15/27 to 02/15/37,
U.S. Treasury Notes, 1.125% to 3.500%, due 02/15/18 to
10/31/20 and a U.S. Treasury Principal-Only Stripped Security,
0.000%, due 05/15/40. The aggregate market value of the
collateral, including accrued interest, was $764,999,998. |
|
| | |
| | |
| 32 | | The accompanying notes are an integral part of these financial statements. |
FINANCIAL SQUARE TREASURY OBLIGATIONS FUND
| | | | | | | | | | | | | | |
Principal Amount | | | Interest Rate | | | Maturity Date | | | Amortized Cost | |
| Repurchase Agreements(c) – (continued) | |
| | Citigroup Global Markets, Inc. | |
| $ | 150,000,000 | | | | 0.510 | % | | | 03/01/17 | | | $ | 150,000,000 | |
| | Maturity Value: $150,002,125 | |
| Collateralized by U.S. Treasury Bills, 0.000%, due 03/09/17 to
10/12/17 and U.S. Treasury Notes, 0.875% to 2.250%, due
07/15/17 to 11/30/20. The aggregate market value of the
collateral, including accrued interest, was $153,000,019. |
|
| | 68,900,000 | | | | 0.520 | | | | 03/01/17 | | | | 68,900,000 | |
| | Maturity Value: $68,900,995 | |
| Collateralized by U.S. Treasury Notes, 1.000% to 2.000%, due
10/15/19 to 11/15/26. The aggregate market value of the
collateral, including accrued interest, was $70,278,043. |
|
| | |
| | Credit Agricole Corporate and Investment Bank | |
| | 100,000,000 | | | | 0.520 | | | | 03/02/17 | | | | 100,000,000 | |
| | Maturity Value: $100,010,111 | |
| | Settlement Date: 02/23/17 | |
| Collateralized by a U.S. Treasury Bond, 3.750%, due 11/15/43,
U.S. Treasury Notes, 0.625% to 2.250%, due 06/30/18 to
05/15/26 and a U.S. Treasury Principal-Only Stripped Security,
0.000%, due 11/15/41. The aggregate market value of the
collateral, including accrued interest, was $102,000,064. |
|
| | 200,000,000 | | | | 0.520 | | | | 03/07/17 | | | | 200,000,000 | |
| | Maturity Value: $200,020,222 | |
| Collateralized by U.S. Treasury Inflation-Indexed Notes, 0.625%
to 1.250%, due 07/15/20 to 01/15/24 and U.S. Treasury Notes,
1.125% to 2.125%, due 09/30/17 to 06/30/22. The aggregate
market value of the collateral, including accrued interest, was
$204,000,071. |
|
| | |
| | Credit Suisse Securities (USA) LLC | |
| | 300,000,000 | | | | 0.510 | | | | 03/01/17 | | | | 300,000,000 | |
| | Maturity Value: $300,004,250 | |
| Collateralized by a U.S. Treasury Bond, 3.125%, due 08/15/44
and U.S. Treasury Notes, 0.750% to 2.250%, due 10/31/17 to
11/15/24. The aggregate market value of the collateral,
including accrued interest, was $306,002,608. |
|
| | |
| | HSBC Securities (USA), Inc. | |
| | 800,000,000 | | | | 0.510 | | | | 03/01/17 | | | | 800,000,000 | |
| | Maturity Value: $800,011,333 | |
| Collateralized by U.S. Treasury Bonds, 2.500% to 7.625%, due
11/15/22 to 05/15/46 and U.S. Treasury Notes, 1.125% to
3.625%, due 11/30/19 to 08/31/21. The aggregate market value
of the collateral, including accrued interest, was $816,004,032. |
|
| | |
| | ING Financial Markets LLC | |
| | 250,000,000 | | | | 0.510 | | | | 03/01/17 | | | | 250,000,000 | |
| | Maturity Value: $250,003,542 | |
| Collateralized by U.S. Treasury Bonds, 2.250% to 3.750%, due
11/15/43 to 08/15/46, U.S. Treasury Inflation-Indexed Bonds,
0.750% to 1.750%, due 01/15/28 to 02/15/47, U.S. Treasury
Inflation-Indexed Notes, 0.125% to 0.375%, due 04/15/17 to
07/15/25 and U.S. Treasury Notes, 0.625% to 3.625%, due
06/30/17 to 08/15/26. The aggregate market value of the
collateral, including accrued interest, was $255,004,785. |
|
| | |
| | J.P. Morgan Securities LLC | |
| 62,400,000 | | | | 0.520 | | | | 03/01/17 | | | | 62,400,000 | |
| | Maturity Value: $62,400,901 | |
| Collateralized by U.S. Treasury Principal-Only Stripped
Securities, 0.000%, due 05/15/17 to 02/15/46. The aggregate
market value of the collateral, including accrued interest, was
$63,648,265. |
|
| | 500,000,000 | | | | 0.530 | (b)(d) | | | 03/07/17 | | | | 500,000,000 | |
| | Maturity Value: $505,432,492 | |
| | Settlement Date: 03/02/15 | |
| Collateralized by U.S. Treasury Interest-Only Stripped Securities,
0.000%, due 02/15/19 to 11/15/36. The aggregate market value
of the collateral, including accrued interest, was $510,003,653. |
|
| | |
| | Joint Repurchase Agreement Account I | |
| | 1,700,000,000 | | | | 0.520 | | | | 03/01/17 | | | | 1,700,000,000 | |
| | Maturity Value: $1,700,024,556 | |
| | |
| | Merrill Lynch, Pierce, Fenner & Smith, Inc. | |
| | 100,000,000 | | | | 0.500 | | | | 03/01/17 | | | | 100,000,000 | |
| | Maturity Value: $100,001,389 | |
| Collateralized by U.S. Treasury Bills, 0.000%, due 03/09/17 to
09/14/17, U.S. Treasury Notes, 0.875% to 2.625%, due
01/31/18 to 08/15/26 and a U.S. Treasury Principal-Only
Stripped Security, 0.000%, due 11/15/26. The aggregate market
value of the collateral, including accrued interest, was
$102,000,039. |
|
| | 119,200,000 | | | | 0.520 | | | | 03/01/17 | | | | 119,200,000 | |
| | Maturity Value: $119,201,722 | |
| Collateralized by a U.S. Treasury Note, 2.125%, due 02/29/24.
The market value of the collateral, including accrued interest,
was $121,584,031. |
|
| | 179,900,000 | | | | 0.520 | | | | 03/01/17 | | | | 179,900,000 | |
| | Maturity Value: $179,902,599 | |
| Collateralized by a U.S. Treasury Note, 1.750%, due 05/15/23.
The market value of the collateral, including accrued interest,
was $183,498,065. |
|
| | |
| | MUFG Securities EMEA PLC | |
| | 50,452,605 | | | | 0.560 | | | | 03/02/17 | | | | 50,452,605 | |
| | Maturity Value: $50,454,175 | |
| Collateralized by a U.S. Treasury Bond, 2.875%, due 08/15/45.
The market value of the collateral, including accrued interest,
was $51,461,657. |
|
| | |
| | Nomura Securities International, Inc. | |
| | 200,000,000 | | | | 0.520 | | | | 03/01/17 | | | | 200,000,000 | |
| | Maturity Value: $200,002,889 | |
| Collateralized by a U.S. Treasury Interest-Only Stripped Security,
0.000%, due 05/15/34 and U.S. Treasury Notes, 0.875% to
4.000%, due 04/15/17 to 04/30/21. The aggregate market value
of the collateral, including accrued interest, was $204,000,068. |
|
| | 400,000,000 | | | | 0.520 | | | | 03/01/17 | | | | 400,000,000 | |
| | Maturity Value: $400,005,778 | |
| Collateralized by U.S. Treasury Bills, 0.000%, due 03/16/17 to
07/06/17, U.S. Treasury Bonds, 3.000% to 7.625%, due
11/15/22 to 11/15/44, U.S. Treasury Inflation-Indexed Notes,
0.125% to 0.250%, due 07/15/24 to 01/15/25, U.S. Treasury
Interest-Only Stripped Securities, 0.000%, due 08/15/24 to
11/15/44, U.S. Treasury Notes, 0.500% to 3.125%, due
03/31/17 to 05/15/24 and U.S. Treasury Principal-Only
Stripped Securities, 0.000%, due 05/15/39 to 11/15/43. The
aggregate market value of the collateral, including accrued
interest, was $408,000,006. |
|
| | |
| | |
| The accompanying notes are an integral part of these financial statements. | | 33 |
FINANCIAL SQUARE TREASURY OBLIGATIONS FUND
Schedule of Investments (continued)
February 28, 2017 (Unaudited)
| | | | | | | | | | | | | | |
Principal Amount | | | Interest Rate | | | Maturity Date | | | Amortized Cost | |
| Repurchase Agreements(c) – (continued) | |
| RBC Dominion Securities, Inc. | |
| $ | 1,000,000,000 | | | | 0.530 | % (b)(d) | | | 03/07/17 | | | $ | 1,000,000,000 | |
| Maturity Value: $1,000,456,388 | |
| Settlement Date: 02/13/17 | |
| Collateralized by U.S. Treasury Bonds, 2.250% to 4.375%, due
02/15/39 to 02/15/47, U.S. Treasury Inflation-Indexed Bonds,
2.375% to 3.875%, due 01/15/27 to 04/15/29, U.S. Treasury
Inflation-Indexed Notes, 0.125%, due 04/15/17 to 07/15/26 and
U.S. Treasury Notes, 0.875% to 3.625%, due 05/15/17 to
11/15/25. The aggregate market value of the collateral,
including accrued interest, was $1,020,000,017. |
|
| | |
| Societe Generale | |
| | 150,000,000 | | | | 0.630 | (b) | | | 03/07/17 | | | | 150,000,000 | |
| Maturity Value: $150,372,750 | |
| Settlement Date: 10/18/16 | |
| Collateralized by a U.S. Treasury Bond, 2.875%, due 05/15/43, a
U.S. Treasury Inflation-Indexed Bond, 0.875%, due 02/15/47, a
U.S. Treasury Inflation-Indexed Note, 0.125%, due 01/15/22
and U.S. Treasury Notes, 1.375% to 3.625%, due 08/31/18 to
05/31/21. The aggregate market value of the collateral,
including accrued interest, was $153,000,017. |
|
| | |
| Wells Fargo Bank, N.A. | |
| | 8,000,000 | | | | 0.580 | (e) | | | 03/02/17 | | | | 8,000,000 | |
| Maturity Value: $8,023,587 | |
| Settlement Date: 08/31/16 | |
| Collateralized by a U.S. Treasury Note, 1.750%, due 12/31/20.
The market value of the collateral, including accrued interest,
was $8,160,093. |
|
| | 38,500,000 | | | | 0.580 | (e) | | | 03/03/17 | | | | 38,500,000 | |
| Maturity Value: $38,614,131 | |
| Settlement Date: 08/31/16 | |
| Collateralized by a U.S. Treasury Note, 1.750%, due 12/31/20.
The market value of the collateral, including accrued interest,
was $39,270,064. |
|
| | 225,000,000 | | | | 0.600 | (e) | | | 03/10/17 | | | | 225,000,000 | |
| Maturity Value: $225,686,250 | |
| Settlement Date: 09/08/16 | |
| Collateralized by a U.S. Treasury Note, 1.125%, due 02/28/19.
The market value of the collateral, including accrued interest,
was $229,500,010. |
|
| | |
| | TOTAL REPURCHASE AGREEMENTS | | | $ | 9,449,252,605 | |
| | |
| | TOTAL INVESTMENTS – 99.4% | | | $ | 18,376,517,288 | |
| | |
| OTHER ASSETS IN EXCESS OF
LIABILITIES – 0.6% |
| | | 113,172,078 | |
| | |
| | NET ASSETS – 100.0% | | | $ | 18,489,689,366 | |
| | |
| | |
| The percentage shown for each investment category reflects the value of investments in that category as a percentage of net assets. |
(a) | | All or a portion represents a forward commitment. |
(b) | | Variable or floating rate security. Interest rate disclosed is that which is in effect at February 28, 2017. |
(c) | | Unless noted, all repurchase agreements were entered into on February 28, 2017. Additional information on Joint Repurchase Agreement Account I appears on page 36. |
(d) | | The instrument is subject to a demand feature. |
(e) | | Security has been determined to be illiquid by the Investment Adviser. At February 28, 2017, these securities amounted to $271,500,000 or approximately 1.5% of net assets. |
Interest rates represent either the stated coupon rate, annualized yield on date of purchase for discounted securities, or, for floating rate securities, the current reset rate, which is based upon current interest rate indices.
Maturity dates represent either the final legal maturity date on the security, the demand date for puttable securities, or the prerefunded date for those types of securities.
| | |
| 34 | | The accompanying notes are an integral part of these financial statements. |
FINANCIAL SQUARE TREASURY SOLUTIONS
Schedule of Investments
February 28, 2017 (Unaudited)
| | | | | | | | | | | | | | |
Principal Amount | | | Interest Rate | | | Maturity Date | | | Amortized Cost | |
| | | | | | | | | | | | | | |
| U.S. Treasury Obligations – 50.8% | |
| United States Treasury Bills | |
| $ | 27,100,000 | | | | 0.427 | % | | | 03/02/17 | | | $ | 27,099,684 | |
| | 30,000,000 | | | | 0.437 | | | | 03/02/17 | | | | 29,999,642 | |
| | 5,600,000 | | | | 0.539 | | | | 04/20/17 | | | | 5,595,878 | |
| | 16,300,000 | | | | 0.524 | | | | 05/04/17 | | | | 16,285,076 | |
| | 2,600,000 | | | | 0.529 | | | | 05/04/17 | | | | 2,597,596 | |
| | 1,470,000 | | | | 0.596 | | | | 05/04/17 | | | | 1,468,471 | |
| | 15,050,000 | | | | 0.545 | | | | 05/11/17 | | | | 15,034,120 | |
| | 54,050,000 | | | | 0.637 | | | | 05/18/17 | | | | 53,976,807 | |
| | 500,000 | | | | 0.509 | | | | 05/25/17 | | | | 499,410 | |
| | 11,250,000 | | | | 0.524 | | | | 05/25/17 | | | | 11,236,320 | |
| | 17,950,000 | | | | 0.529 | | | | 05/25/17 | | | | 17,927,961 | |
| | 40,050,000 | | | | 0.534 | | | | 05/25/17 | | | | 40,000,355 | |
| | 10,000,000 | | | | 0.539 | | | | 05/25/17 | | | | 9,987,486 | |
| | 51,150,000 | | | | 0.642 | | | | 05/25/17 | | | | 51,073,914 | |
| | 21,350,000 | | | | 0.524 | (a) | | | 06/01/17 | | | | 21,322,206 | |
| | 12,000,000 | | | | 0.611 | | | | 07/13/17 | | | | 11,973,200 | |
| | 1,600,000 | | | | 0.601 | | | | 07/20/17 | | | | 1,596,303 | |
| | 6,500,000 | | | | 0.606 | | | | 07/20/17 | | | | 6,484,852 | |
| | 9,500,000 | | | | 0.611 | | | | 07/20/17 | | | | 9,477,675 | |
| | 1,750,000 | | | | 0.616 | | | | 07/20/17 | | | | 1,745,853 | |
| | 3,300,000 | | | | 0.621 | | | | 07/20/17 | | | | 3,292,116 | |
| | 6,000,000 | | | | 0.626 | | | | 07/20/17 | | | | 5,985,548 | |
| | 60,350,000 | | | | 0.606 | | | | 07/27/17 | | | | 60,202,377 | |
| | 1,950,000 | | | | 0.632 | | | | 08/10/17 | | | | 1,944,560 | |
| | 3,300,000 | | | | 0.647 | | | | 08/10/17 | | | | 3,290,570 | |
| | 4,500,000 | | | | 0.662 | | | | 08/24/17 | | | | 4,485,700 | |
| | 3,800,000 | | | | 0.683 | | | | 08/24/17 | | | | 3,787,553 | |
| | 1,250,000 | | | | 0.688 | (a) | | | 08/24/17 | | | | 1,245,875 | |
| | 3,800,000 | | | | 0.683 | (a) | | | 08/31/17 | | | | 3,787,129 | |
| United States Treasury Floating Rate Notes(b) | |
| | 434,800,000 | | | | 0.590 | | | | 04/30/17 | | | | 434,843,923 | |
| | 1,088,100,000 | | | | 0.593 | | | | 07/31/17 | | | | 1,088,013,833 | |
| | 194,000,000 | | | | 0.684 | | | | 10/31/17 | | | | 193,987,797 | |
| | 127,400,000 | | | | 0.788 | | | | 01/31/18 | | | | 127,502,978 | |
| | 42,200,000 | | | | 0.706 | | | | 04/30/18 | | | | 42,275,274 | |
| | 4,200,000 | | | | 0.690 | | | | 07/31/18 | | | | 4,206,839 | |
| | 157,500,000 | | | | 0.656 | | | | 01/31/19 | | | | 157,521,225 | |
| United States Treasury Notes | |
| | 34,000,000 | | | | 0.750 | | | | 03/15/17 | | | | 34,003,493 | |
| | 12,800,000 | | | | 1.000 | | | | 03/31/17 | | | | 12,804,924 | |
| | 105,000,000 | | | | 3.250 | | | | 03/31/17 | | | | 105,236,071 | |
| | 2,300,000 | | | | 0.500 | | | | 04/30/17 | | | | 2,299,760 | |
| | 10,500,000 | | | | 3.125 | | | | 04/30/17 | | | | 10,544,557 | |
| | 168,500,000 | | | | 4.500 | | | | 05/15/17 | | | | 169,850,390 | |
| | 91,300,000 | | | | 8.750 | | | | 05/15/17 | | | | 92,834,968 | |
| | 293,700,000 | | | | 0.625 | | | | 05/31/17 | | | | 293,701,622 | |
| | 307,300,000 | | | | 2.750 | | | | 05/31/17 | | | | 308,937,618 | |
| | 121,200,000 | | | | 0.875 | | | | 06/15/17 | | | | 121,295,054 | |
| | 74,300,000 | | | | 0.625 | | | | 06/30/17 | | | | 74,304,608 | |
| | 39,700,000 | | | | 0.750 | | | | 06/30/17 | | | | 39,715,802 | |
| | 246,900,000 | | | | 2.500 | | | | 06/30/17 | | | | 248,445,129 | |
| | 86,600,000 | | | | 0.875 | | | | 07/15/17 | | | | 86,676,085 | |
| | 30,900,000 | | | | 2.375 | | | | 07/31/17 | | | | 31,126,511 | |
| | 78,900,000 | | | | 0.875 | | | | 08/15/17 | | | | 78,968,479 | |
| | 133,650,000 | | | | 4.750 | | | | 08/15/17 | | | | 136,138,159 | |
| | 49,300,000 | | | | 0.625 | | | | 08/31/17 | | | | 49,269,563 | |
| | |
| | | | | | | | | | | | | | |
| U.S. Treasury Obligations – (continued) | |
| United States Treasury Notes – (continued) | |
| 107,300,000 | | | | 1.875 | | | | 08/31/17 | | | | 107,920,670 | |
| | 54,000,000 | | | | 1.000 | | | | 09/15/17 | | | | 54,059,026 | |
| | 60,900,000 | | | | 0.625 | | | | 09/30/17 | | | | 60,830,046 | |
| | 32,500,000 | | | | 1.875 | | | | 09/30/17 | | | | 32,705,612 | |
| | 36,800,000 | | | | 0.875 | | | | 10/15/17 | | | | 36,807,322 | |
| | 64,800,000 | | | | 0.750 | | | | 10/31/17 | | | | 64,750,648 | |
| | 60,830,000 | | | | 1.875 | | | | 10/31/17 | | | | 61,242,975 | |
| | 54,000,000 | | | | 4.250 | | | | 11/15/17 | | | | 55,285,435 | |
| | 3,300,000 | | | | 0.625 | | | | 11/30/17 | | | | 3,292,970 | |
| | 6,200,000 | | | | 2.250 | | | | 11/30/17 | | | | 6,266,154 | |
| | |
| TOTAL INVESTMENTS BEFORE
REPURCHASE AGREEMENTS |
| | $ | 4,851,069,757 | |
| | |
| | | | | | | | | | | | | | |
| Repurchase Agreements(c) – 49.3% | |
| Federal Reserve Bank of New York | |
| $ | 4,700,000,000 | | | | 0.500 | % | | | 03/01/17 | | | $ | 4,700,000,000 | |
| Maturity Value: $4,700,065,278 | |
| Collateralized by U.S. Treasury Bonds, 2.750% to 6.125%, due
11/15/27 to 11/15/42 and U.S. Treasury Notes, 0.875% to
2.125%, due 07/31/19 to 02/15/23. The aggregate market value
of the collateral, including accrued interest, was
$4,700,065,329. |
|
| | |
| | TOTAL INVESTMENTS – 100.1% | | | $ | 9,551,069,757 | |
| | |
| LIABILITIES IN EXCESS OF
OTHER ASSETS – (0.1)% |
| | | (13,361,746 | ) |
| | |
| | NET ASSETS – 100.0% | | | $ | 9,537,708,011 | |
| | |
| | |
| The percentage shown for each investment category reflects the value of investments in that category as a percentage of net assets. |
(a) | | All or a portion represents a forward commitment. |
(b) | | Variable or floating rate security. Interest rate disclosed is that which is in effect at February 28, 2017. |
(c) | | Unless noted, all repurchase agreements were entered into on February 28, 2017. |
|
| Interest rates represent either the stated coupon rate, annualized yield on date of purchase for discounted securities, or, for floating rate securities, the current reset rate, which is based upon current interest rate indices. |
|
| Maturity dates represent either the final legal maturity date on the security, the demand date for puttable securities, or the prerefunded date for those types of securities. |
| | |
| The accompanying notes are an integral part of these financial statements. | | 35 |
GOLDMAN SACHS FUNDS — FINANCIAL SQUARE FUNDS
Schedule of Investments
February 28, 2017 (Unaudited)
|
| ADDITIONAL INVESTMENT INFORMATION |
JOINT REPURCHASE AGREEMENT ACCOUNT I — At February 28, 2017, certain Funds had undivided interests in the Joint Repurchase Agreement Account I with a maturity date of March 1, 2017, as follows:
| | | | | | | | | | | | |
| Fund | | Principal Amount | | | Maturity Value | | | Collateral Value
Allocation | |
Government | | $ | 5,580,000,000 | | | $ | 5,580,080,600 | | | $ | 5,691,611,526 | |
Treasury Obligations | | | 1,700,000,000 | | | | 1,700,024,556 | | | | 1,734,003,512 | |
REPURCHASE AGREEMENTS — At February 28, 2017, the Principal Amounts of certain Funds’ interest in the Joint Repurchase Agreement Account I were as follows:
| | | | | | | | | | | | |
| Counterparty | | Interest Rate | | | Government | | | Treasury Obligations | |
Bank of Nova Scotia (The) | | | 0.520 | % | | $ | 766,483,516 | | | $ | 233,516,484 | |
BNP Paribas | | | 0.520 | | | | 2,606,043,956 | | | | 793,956,044 | |
Citigroup Global Markets, Inc. | | | 0.520 | | | | 444,560,440 | | | | 135,439,560 | |
Credit Agricole Corporate and Investment Bank | | | 0.520 | | | | 383,241,758 | | | | 116,758,242 | |
Merrill Lynch, Pierce, Fenner & Smith, Inc. | | | 0.520 | | | | 613,186,813 | | | | 186,813,187 | |
Wells Fargo Securities LLC | | | 0.520 | | | | 766,483,517 | | | | 233,516,483 | |
| TOTAL | | | $ | 5,580,000,000 | | | $ | 1,700,000,000 | |
At February 28, 2017, the Joint Repurchase Agreement Account I was fully collateralized by:
| | | | | | | | |
| Issuer | | Interest Rates | | | Maturity Dates | |
U.S. Treasury Bills | | | 0.000 | % | | | 03/02/17 to 12/07/17 | |
U.S. Treasury Bonds | | | 2.250 to 8.750 | | | | 05/15/20 to 02/15/47 | |
U.S. Treasury Inflation-Indexed Bonds | | | 0.750 to 3.625 | | | | 01/15/25 to 02/15/47 | |
U.S. Treasury Inflation-Indexed Notes | | | 0.125 to 2.625 | | | | 04/15/17 to 01/15/27 | |
U.S. Treasury Interest-Only Stripped Securities | | | 0.000 | | | | 08/15/17 to 02/15/45 | |
U.S. Treasury Notes | | | 0.625 to 4.000 | | | | 04/15/17 to 02/15/27 | |
U.S. Treasury Principal-Only Stripped Securities | | | 0.000 | | | | 11/15/21 to 11/15/45 | |
| | |
| 36 | | The accompanying notes are an integral part of these financial statements. |
GOLDMAN SACHS FUNDS — FINANCIAL SQUARE FUNDS
|
| ADDITIONAL INVESTMENT INFORMATION (continued) |
JOINT REPURCHASE AGREEMENT ACCOUNT III — At February 28, 2017, the Government Fund had undivided interests in the Joint Repurchase Agreement Account III with a maturity date of March 1, 2017, as follows:
| | | | |
| Principal Amount | | Maturity Value | | Collateral Value |
| $7,292,600,000 | | $7,292,708,490 | | $7,487,035,071 |
REPURCHASE AGREEMENTS — At February 28, 2017, the Principal Amounts of the Government Fund’s interest in the Joint Repurchase Agreement Account III were as follows:
| | | | | | | | |
| Counterparty | | Interest Rate | | | Principal Amount | |
ABN Amro Bank N.V. | | | 0.540 | % | | $ | 524,304,575 | |
Bank of America, N.A. | | | 0.530 | | | | 476,640,523 | |
Bank of Nova Scotia (The) | | | 0.530 | | | | 1,429,921,569 | |
BNP Paribas | | | 0.530 | | | | 1,048,609,150 | |
Citigroup Global Markets, Inc. | | | 0.540 | | | | 667,296,732 | |
TD Securities (USA), LLC | | | 0.530 | | | | 285,984,314 | |
Wells Fargo Securities, LLC | | | 0.540 | | | | 2,859,843,137 | |
| TOTAL | | | $ | 7,292,600,000 | |
At February 28, 2017, the Joint Repurchase Agreement Account III was fully collateralized by:
| | | | | | | | |
| Issuer | | Interest Rates | | | Maturity Dates | |
Federal Home Loan Mortgage Corp. | | | 2.500% to 7.500 | % | | | 06/01/22 to 07/01/47 | |
Federal National Mortgage Association | | | 0.875 to 8.000 | | | | 10/26/17 to 02/01/47 | |
Government National Mortgage Association | | | 3.000 to 8.500 | | | | 01/15/27 to 01/20/47 | |
U.S. Treasury Bill | | | 0.000 | | | | 09/14/17 | |
U.S. Treasury Bonds | | | 2.875 to 4.750 | | | | 02/15/37 to 02/15/47 | |
U.S. Treasury Inflation-Indexed Notes | | | 0.125 to 0.250 | | | | 07/15/22 to 01/15/25 | |
U.S. Treasury Interest-Only Stripped Securities | | | 0.000 | | | | 08/15/17 to 11/15/44 | |
U.S. Treasury Notes | | | 0.875 to 4.250 | | | | 10/31/17 to 02/15/27 | |
U.S. Treasury Principal-Only Stripped Security | | | 0.000 | | | | 11/15/44 | |
| | |
| The accompanying notes are an integral part of these financial statements. | | 37 |
GOLDMAN SACHS FUNDS — FINANCIAL SQUARE FUNDS
Statements of Assets and Liabilities
February 28, 2017 (Unaudited)
| | | | | | |
| | | | | Federal Instruments Fund | |
| | Assets: | | | | |
| | Investments, at value (cost $766,950,490, $52,260,408,100, $1,576,079,700, $792,099,024, $7,039,647, $47,591,841,075, $8,927,264,683 and $4,851,069,757) | | $ | 766,950,490 | |
| | Repurchase agreements, at value (cost $0, $49,169,679,016, $80,000,000, $30,000,000, $0, $0, $9,449,252,605 and $4,700,000,000) | | | — | |
| | Cash | | | 74,480 | |
| | Deferred offering costs | | | — | |
| | Receivables: | | | | |
| | Investments sold | | | 4,499,290 | |
| | Interest | | | 777,519 | |
| | Fund shares sold | | | — | |
| | Reimbursement from investment advisor | | | 35,718 | |
| | Other assets | | | 3,921 | |
| | Total assets | | | 772,341,418 | |
| | | | | | |
| | Liabilities: | | | | |
| | Due to custodian | | | — | |
| | Payables: | | | | |
| | Investments purchased | | | 4,498,928 | |
| | Fund shares redeemed | | | — | |
| | Dividend distribution | | | 5,179 | |
| | Management fees | | | 104,745 | |
| | Distribution and Service fees and Transfer Agency fees | | | 5,831 | |
| | Accrued expenses and other liabilities | | | 349,605 | |
| | Total liabilities | | | 4,964,288 | |
| | | | | | |
| | Net Assets: | | | | |
| | Paid-in capital | | | 767,321,381 | |
| | Undistributed (distributions in excess of) net investment income | | | 37,486 | |
| | Accumulated net realized gain | | | 18,263 | |
| | Net unrealized gain | | | — | |
| | | NET ASSETS | | $ | 767,377,130 | |
| | | Net Assets: | | | | |
| | | Institutional Shares | | $ | 702,961,206 | |
| | | Select Shares | | | 47,143 | |
| | | Preferred Shares | | | 50,104 | |
| | | Capital Shares | | | 8,481,305 | |
| | | Administration Shares | | | 40,832,622 | |
| | | Premier Shares | | | 50,013 | |
| | | Service Shares | | | 14,904,731 | |
| | | Class A Shares | | | — | |
| | | Class C Shares | | | — | |
| | | Resource Shares | | | — | |
| | | Cash Management Shares | | | 50,006 | |
| | | Class R6 Shares | | | — | |
| | | Total Net Assets | | $ | 767,377,130 | |
| | | Shares outstanding $0.001 par value (unlimited number of shares authorized): | | | | |
| | | Institutional Shares | | | 702,947,498 | |
| | | Select Shares | | | 47,142 | |
| | | Preferred Shares | | | 50,103 | |
| | | Capital Shares | | | 8,481,139 | |
| | | Administration Shares | | | 40,831,825 | |
| | | Premier Shares | | | 50,012 | |
| | | Service Shares | | | 14,904,441 | |
| | | Class A Shares | | | — | |
| | | Class C Shares | | | — | |
| | | Resource Shares | | | — | |
| | | Cash Management Shares | | | 50,005 | |
| | | Class R6 Shares | | | — | |
| | | Net asset value, offering and redemption price per share: | | | | |
| | | Institutional Shares | | | $1.00 | |
| | | Select Shares | | | 1.00 | |
| | | Preferred Shares | | | 1.00 | |
| | | Capital Shares | | | 1.00 | |
| | | Administration Shares | | | 1.00 | |
| | | Premier Shares | | | 1.00 | |
| | | Service Shares | | | 1.00 | |
| | | Class A Shares | | | — | |
| | | Class C Shares | | | — | |
| | | Resource Shares | | | — | |
| | | Cash Management Shares | | | 1.00 | |
| | | Class R6 Shares | | | — | |
| | |
| 38 | | The accompanying notes are an integral part of these financial statements. |
GOLDMAN SACHS FUNDS — FINANCIAL SQUARE FUNDS
| | | | | | | | | | | | | | | | | | | | | | | | | | | | | | | | | | | | | | | | |
| | | Government Fund | | | | | Money Market Fund | | | | | Prime Obligations Fund | | | | | Tax-Exempt Money Market
Fund | | | | | Treasury Instruments Fund | | | | | Treasury Obligations Fund | | | | | Treasury Solutions Fund | |
| | | | | | | | | | | | | | | | | | | | | | | | | | | | | | | | | | | | | | | | |
| | $ | 52,260,408,100 | | | | | $ | 1,576,456,704 | | | | | $ | 792,327,563 | | | | | $ | 7,039,998 | | | | | $ | 47,591,841,075 | | | | | $ | 8,927,264,683 | | | | | $ | 4,851,069,757 | |
| | | 49,169,679,016 | | | | | | 80,000,213 | | | | | | 30,000,107 | | | | | | — | | | | | | — | | | | | | 9,449,252,605 | | | | | | 4,700,000,000 | |
| | | 179,192,379 | | | | | | 84,091 | | | | | | 52,577 | | | | | | — | | | | | | 64,016 | | | | | | 124,926,144 | | | | | | 105,126 | �� |
| | | — | | | | | | — | | | | | | — | | | | | | 47,743 | | | | | | — | | | | | | — | | | | | | — | |
| | | | | | | | | | | | | | | | | | | | | | | | | | | | | | | | | | | | | | | | |
| | | 120,189,176 | | | | | | — | | | | | | — | | | | | | — | | | | | | 243,723,971 | | | | | | 64,629,012 | | | | | | 1,246,428 | |
| | | 89,651,633 | | | | | | 1,623,194 | | | | | | 706,503 | | | | | | 31,894 | | | | | | 71,331,583 | | | | | | 30,328,152 | | | | | | 13,794,784 | |
| | | 22,537,486 | | | | | | — | | | | | | 2,298,774 | | | | | | — | | | | | | 1,388,668 | | | | | | 739 | | | | | | 272,147 | |
| | | — | | | | | | 75,388 | | | | | | 54,911 | | | | | | 237,615 | | | | | | — | | | | | | — | | | | | | — | |
| | | 610,148 | | | | | | 22,948 | | | | | | 9,397 | | | | | | 92 | | | | | | 330,797 | | | | | | 140,600 | | | | | | 58,083 | |
| | | 101,842,267,938 | | | | | | 1,658,262,538 | | | | | | 825,449,832 | | | | | | 7,357,342 | | | | | | 47,908,680,110 | | | | | | 18,596,541,935 | | | | | | 9,566,546,325 | |
| | | | | | | | | | | | | | | | | | | | | | | | | | | | | | | | | | | | | | | | |
| | | | | | | | | | | | | | | | | | | | | | | | | | | | | | | | | | | | | | | | |
| | | — | | | | | | — | | | | | | — | | | | | | 11,178 | | | | | | — | | | | | | — | | | | | | — | |
| | | | | | | | | | | | | | | | | | | | | | | | | | | | | | | | | | | | | | | | |
| | | 217,393,827 | | | | | | 8,000,000 | | | | | | — | | | | | | 200,115 | | | | | | 269,529,975 | | | | | | 96,967,696 | | | | | | 26,355,210 | |
| | | 17,058,438 | | | | | | — | | | | | | 82,075 | | | | | | — | | | | | | 759,891 | | | | | | 4,477,834 | | | | | | 62,301 | |
| | | 16,799,317 | | | | | | 431,442 | | | | | | 254,028 | | | | | | 1,483 | | | | | | 3,973,893 | | | | | | 1,975,111 | | | | | | 826,348 | |
| | | 12,857,431 | | | | | | 196,591 | | | | | | 105,479 | | | | | | 877 | | | | | | 6,675,642 | | | | | | 2,739,920 | | | | | | 1,291,848 | |
| | | 829,199 | | | | | | 12,288 | | | | | | 6,593 | | | | | | 56 | | | | | | 370,962 | | | | | | 152,233 | | | | | | 89,378 | |
| | | 2,031,780 | | | | | | 318,536 | | | | | | 268,564 | | | | | | 160,124 | | | | | | 1,078,259 | | | | | | 539,775 | | | | | | 213,229 | |
| | | 266,969,992 | | | | | | 8,958,857 | | | | | | 716,739 | | | | | | 373,833 | | | | | | 282,388,622 | | | | | | 106,852,569 | | | | | | 28,838,314 | |
| | | | | | | | | | | | | | | | | | | | | | | | | | | | | | | | | | | | | | | | |
| | | | | | | | | | | | | | | | | | | | | | | | | | | | | | | | | | | | | | | | |
| | | 101,573,997,316 | | | | | | 1,648,915,953 | | | | | | 824,561,485 | | | | | | 6,983,015 | | | | | | 47,626,049,974 | | | | | | 18,489,013,211 | | | | | | 9,537,301,579 | |
| | | (76,265 | ) | | | | | (3,580 | ) | | | | | (76,587 | ) | | | | | 143 | | | | | | (237,821 | ) | | | | | (213,288 | ) | | | | | (145,588 | ) |
| | | 1,376,895 | | | | | | 14,091 | | | | | | 19,549 | | | | | | — | | | | | | 479,335 | | | | | | 889,443 | | | | | | 552,020 | |
| | | — | | | | | | 377,217 | | | | | | 228,646 | | | | | | 351 | | | | | | — | | | | | | — | | | | | | — | |
| | | $ | 101,575,297,946 | | | | | $ | 1,649,303,681 | | | | | $ | 824,733,093 | | | | | $ | 6,983,509 | | | | | $ | 47,626,291,488 | | | | | $ | 18,489,689,366 | | | | | $ | 9,537,708,011 | |
| | | | | | | | | | | | | | | | | | | | | | | | | | | | | | | | | | | | | | | | | |
| | | $ | 92,254,654,365 | | | | | $ | 1,632,055,093 | | | | | | $818,982,019 | | | | | $ | 6,923,420 | | | | | $ | 44,803,675,509 | | | | | $ | 15,786,980,815 | | | | | $ | 8,732,821,694 | |
| | | | 2,527,008,545 | | | | | | 7,689,484 | | | | | | 119,939 | | | | | | 10,029 | | | | | | 58,967,261 | | | | | | 97,623,561 | | | | | | 10,705,230 | |
| | | | 1,006,727,142 | | | | | | 63,715 | | | | | | 775,156 | | | | | | 10,023 | | | | | | 58,595,111 | | | | | | 255,991,273 | | | | | | 29,958,590 | |
| | | | 1,286,944,506 | | | | | | 1,002 | | | | | | 406,174 | | | | | | 10,018 | | | | | | 582,414,568 | | | | | | 282,806,358 | | | | | | 282,631,221 | |
| | | | 3,958,423,425 | | | | | | 8,663,049 | | | | | | 3,839,469 | | | | | | 10,013 | | | | | | 2,013,164,173 | | | | | | 1,278,581,092 | | | | | | 240,908,441 | |
| | | | 66,165,483 | | | | | | 1,002 | | | | | | 1,002 | | | | | | — | | | | | | 29,727,129 | | | | | | 1,000 | | | | | | 30,859,200 | |
| | | | 314,188,601 | | | | | | 828,335 | | | | | | 607,332 | | | | | | 10,003 | | | | | | 79,505,925 | | | | | | 787,703,267 | | | | | | 142,311,120 | |
| | | | 48,131,187 | | | | | | — | | | | | | — | | | | | | — | | | | | | — | | | | | | — | | | | | | — | |
| | | | 12,399,850 | | | | | | — | | | | | | — | | | | | | — | | | | | | — | | | | | | — | | | | | | — | |
| | | | 81,456,759 | | | | | | 1,001 | | | | | | 1,001 | | | | | | 10,003 | | | | | | 1,000 | | | | | | 1,000 | | | | | | 1,000 | |
| | | | 7,146,147 | | | | | | 1,000 | | | | | | 1,001 | | | | | | — | | | | | | 240,812 | | | | | | 1,000 | | | | | | 67,511,515 | |
| | | | 12,051,936 | | | | | | — | | | | | | — | | | | | | — | | | | | | — | | | | | | — | | | | | | — | |
| | | $ | 101,575,297,946 | | | | | $ | 1,649,303,681 | | | | | | $824,733,093 | | | | | $ | 6,983,509 | | | | | $ | 47,626,291,488 | | | | | $ | 18,489,689,366 | | | | | $ | 9,537,708,011 | |
| | | | | | | | | | | | | | | | | | | | | | | | | | | | | | | | | | | | | | | | | |
| | | | 92,253,468,127 | | | | | | 1,631,670,429 | | | | | | 818,713,933 | | | | | | 6,923,060 | | | | | | 44,803,450,688 | | | | | | 15,786,403,487 | | | | | | 8,732,449,566 | |
| | | | 2,526,976,055 | | | | | | 7,688,148 | | | | | | 119,898 | | | | | | 10,028 | | | | | | 58,966,965 | | | | | | 97,619,992 | | | | | | 10,704,775 | |
| | | | 1,006,714,194 | | | | | | 63,700 | | | | | | 774,848 | | | | | | 10,022 | | | | | | 58,594,817 | | | | | | 255,981,913 | | | | | | 29,957,313 | |
| | | | 1,286,927,957 | | | | | | 1,002 | | | | | | 406,045 | | | | | | 10,018 | | | | | | 582,411,645 | | | | | | 282,796,019 | | | | | | 282,619,176 | |
| | | | 3,958,372,516 | | | | | | 8,660,601 | | | | | | 3,838,190 | | | | | | 10,012 | | | | | | 2,013,154,069 | | | | | | 1,278,534,339 | | | | | | 240,898,174 | |
| | | | 66,164,632 | | | | | | 1,002 | | | | | | 1,001 | | | | | | — | | | | | | 29,726,980 | | | | | | 1,000 | | | | | | 30,857,884 | |
| | | | 314,184,560 | | | | | | 828,137 | | | | | | 607,136 | | | | | | 10,003 | | | | | | 79,505,526 | | | | | | 787,674,463 | | | | | | 142,305,054 | |
| | | | 48,130,568 | | | | | | — | | | | | | — | | | | | | — | | | | | | — | | | | | | — | | | | | | — | |
| | | | 12,399,690 | | | | | | — | | | | | | — | | | | | | — | | | | | | — | | | | | | — | | | | | | — | |
| | | | 81,455,717 | | | | | | 1,001 | | | | | | 1,000 | | | | | | 10,002 | | | | | | 1,000 | | | | | | 1,000 | | | | | | 1,000 | |
| | | | 7,146,055 | | | | | | 1,000 | | | | | | 1,000 | | | | | | — | | | | | | 240,811 | | | | | | 1,000 | | | | | | 67,508,637 | |
| | | | 12,051,781 | | | | | | — | | | | | | — | | | | | | — | | | | | | — | | | | | | — | | | | | | — | |
| | | | | | | | | | | | | | | | | | | | | | | | | | | | | | | | | | | | | | | | | |
| | | | $1.00 | | | | | | $1.0002 | | | | | | $1.0003 | | | | | | $1.0001 | | | | | | $1.00 | | | | | | $1.00 | | | | | | $1.00 | |
| | | | 1.00 | | | | | | 1.0002 | | | | | | 1.0003 | | | | | | 1.0001 | | | | | | 1.00 | | | | | | 1.00 | | | | | | 1.00 | |
| | | | 1.00 | | | | | | 1.0002 | | | | | | 1.0004 | | | | | | 1.0001 | | | | | | 1.00 | | | | | | 1.00 | | | | | | 1.00 | |
| | | | 1.00 | | | | | | 1.0002 | | | | | | 1.0003 | | | | | | 1.0001 | | | | | | 1.00 | | | | | | 1.00 | | | | | | 1.00 | |
| | | | 1.00 | | | | | | 1.0003 | | | | | | 1.0003 | | | | | | 1.0001 | | | | | | 1.00 | | | | | | 1.00 | | | | | | 1.00 | |
| | | | 1.00 | | | | | | 1.0002 | | | | | | 1.0004 | | | | | | — | | | | | | 1.00 | | | | | | 1.00 | | | | | | 1.00 | |
| | | | 1.00 | | | | | | 1.0002 | | | | | | 1.0003 | | | | | | 1.0001 | | | | | | 1.00 | | | | | | 1.00 | | | | | | 1.00 | |
| | | | 1.00 | | | | | | — | | | | | | — | | | | | | — | | | | | | — | | | | | | — | | | | | | — | |
| | | | 1.00 | | | | | | — | | | | | | — | | | | | | — | | | | | | — | | | | | | — | | | | | | — | |
| | | | 1.00 | | | | | | 1.0002 | | | | | | 1.0004 | | | | | | 1.0000 | | | | | | 1.00 | | | | | | 1.00 | | | | | | 1.00 | |
| | | | 1.00 | | | | | | 1.0002 | | | | | | 1.0004 | | | | | | — | | | | | | 1.00 | | | | | | 1.00 | | | | | | 1.00 | |
| | | | 1.00 | | | | | | — | | | | | | — | | | | | | — | | | | | | — | | | | | | — | | | | | | — | |
| | |
| The accompanying notes are an integral part of these financial statements. | | 39 |
GOLDMAN SACHS FUNDS — FINANCIAL SQUARE FUNDS
Statements of Operations
For the Six Months Ended February 28, 2017 (Unaudited)
| | | | | | |
| | | | | Federal Instruments Fund | |
| | Investment income: | | | | |
| | Interest income | | $ | 1,865,883 | |
| | Total investment income | | | 1,865,883 | |
| | | | | | |
| | Expenses: | | | | |
| | Fund-Level Expenses: | | | | |
| | Management fees | | | 705,943 | |
| | Transfer Agency fees | | | 34,436 | |
| | Custody, accounting and administrative services | | | 9,988 | |
| | Registration fees | | | 88,710 | |
| | Printing and mailing fees | | | 88,525 | |
| | Professional fees | | | 66,170 | |
| | Trustee fees | | | 8,062 | |
| | Amortization of offering costs | | | 10,667 | |
| | Other | | | 20,539 | |
| | Subtotal | | | 1,033,040 | |
| | Class Specific Expenses: | | | | |
| | Administration Share fees | | | 58,708 | |
| | Capital Share fees | | | 15,308 | |
| | Service Share fees | | | 34,329 | |
| | Select Share fees | | | 7 | |
| | Preferred Share fees | | | 25 | |
| | Resource Share fees | | | — | |
| | Premier Share fees | | | 87 | |
| | Distribution fees — Resource Shares | | | — | |
| | Distribution and Service fees — Class A Shares | | | — | |
| | Distribution fees — Class C Shares(a) | | | — | |
| | Cash Management Share fees | | | 124 | |
| | Distribution fees — Cash Management Shares | | | 74 | |
| | Class C Share fees(a) | | | — | |
| | Total expenses | | | 1,141,702 | |
| | Less — expense reductions | | | (341,528 | ) |
| | Net expenses | | | 800,174 | |
| | NET INVESTMENT INCOME | | $ | 1,065,709 | |
| | Net realized gain from investment transactions | | | 22,218 | |
| | Unrealized gain from investment transactions | | | — | |
| | Net realized and unrealized gain | | | 22,218 | |
| | NET INCREASE IN NET ASSETS RESULTING FROM OPERATIONS | | $ | 1,087,927 | |
| | (a) | | At the close of business on October 11, 2016, Class C Shares of the Prime Obligations Fund were liquidated. |
| | |
| 40 | | The accompanying notes are an integral part of these financial statements. |
GOLDMAN SACHS FUNDS — FINANCIAL SQUARE FUNDS
| | | | | | | | | | | | | | | | | | | | | | | | | | | | | | | | | | | | | | | | |
| | | Government Fund | | | | | Money Market Fund | | | | | Prime Obligations Fund | | | | | Tax-Exempt Money Market Fund | | | | | Treasury Instruments Fund | | | | | Treasury Obligations Fund | | | | | Treasury Solutions Fund | |
| | | | | | | | | | | | | | | | | | | | | | | | | | | | | | | | | | | | | | | | |
| | $ | 260,771,213 | | | | | $ | 11,837,313 | | | | | $ | 6,396,885 | | | | | $ | 24,653 | | | | | $ | 119,036,594 | | | | | $ | 52,800,191 | | | | | $ | 23,171,680 | |
| | | 260,771,213 | | | | | | 11,837,313 | | | | | | 6,396,885 | | | | | | 24,653 | | | | | | 119,036,594 | | | | | | 52,800,191 | | | | | | 23,171,680 | |
| | | | | | | | | | | | | | | | | | | | | | | | | | | | | | | | | | | | | | | | |
| | | | | | | | | | | | | | | | | | | | | | | | | | | | | | | | | | | | | | | | |
| | | | | | | | | | | | | | | | | | | | | | | | | | | | | | | | | | | | | | | | |
| | | 96,334,944 | | | | | | 3,699,961 | | | | | | 1,968,099 | | | | | | 7,838 | | | | | | 52,356,883 | | | | | | 22,744,691 | | | | | | 10,236,499 | |
| | | 4,699,266 | | | | | | 180,486 | | | | | | 96,005 | | | | | | 382 | | | | | | 2,553,994 | | | | | | 1,109,497 | | | | | | 499,341 | |
| | | 1,530,443 | | | | | | 147,850 | | | | | | 99,150 | | | | | | 31,834 | | | | | | 900,878 | | | | | | 380,999 | | | | | | 183,671 | |
| | | 1,356,350 | | | | | | 120,777 | | | | | | 139,996 | | | | | | 163,092 | | | | | | 489,823 | | | | | | 177,181 | | | | | | 75,080 | |
| | | 154,446 | | | | | | 86,639 | | | | | | 56,621 | | | | | | 25,794 | | | | | | 579,428 | | | | | | 35,651 | | | | | | 42,215 | |
| | | 109,994 | | | | | | 97,423 | | | | | | 67,583 | | | | | | 55,132 | | | | | | 122,025 | | | | | | 93,030 | | | | | | 83,442 | |
| | | 87,218 | | | | | | 19,600 | | | | | | 13,413 | | | | | | 6,870 | | | | | | 64,542 | | | | | | 21,376 | | | | | | 15,884 | |
| | | — | | | | | | — | | | | | | — | | | | | | 136,764 | | | | | | — | | | | | | — | | | | | | — | |
| | | 193,781 | | | | | | 189,041 | | | | | | 105,538 | | | | | | 29,713 | | | | | | 208,690 | | | | | | 100,701 | | | | | | 74,554 | |
| | | 104,466,442 | | | | | | 4,541,777 | | | | | | 2,546,405 | | | | | | 457,419 | | | | | | 57,276,263 | | | | | | 24,663,126 | | | | | | 11,210,686 | |
| | | | | | | | | | | | | | | | | | | | | | | | | | | | | | | | | | | | | | | | |
| | | 4,609,901 | | | | | | 60,709 | | | | | | 194,543 | | | | | | 12 | | | | | | 2,502,768 | | | | | | 1,740,456 | | | | | | 214,993 | |
| | | 1,135,220 | | | | | | 8,059 | | | | | | 13,931 | | | | | | 7 | | | | | | 421,121 | | | | | | 220,725 | | | | | | 210,932 | |
| | | 1,018,656 | | | | | | 8,094 | | | | | | 134,133 | | | | | | 25 | | | | | | 219,057 | | | | | | 2,378,024 | | | | | | 468,160 | |
| | | 415,909 | | | | | | 29,860 | | | | | | 354 | | | | | | 2 | | | | | | 9,496 | | | | | | 20,261 | | | | | | 1,591 | |
| | | 409,583 | | | | | | 7,002 | | | | | | 22,789 | | | | | | 5 | | | | | | 28,212 | | | | | | 50,768 | | | | | | 24,097 | |
| | | 177,754 | | | | | | 2 | | | | | | 19,906 | | | | | | 25 | | | | | | 2 | | | | | | 2 | | | | | | 2 | |
| | | 87,159 | | | | | | 2 | | | | | | 2 | | | | | | — | | | | | | 78,155 | | | | | | 2 | | | | | | 58,252 | |
| | | 53,326 | | | | | | 1 | | | | | | 5,972 | | | | | | 7 | | | | | | 1 | | | | | | 1 | | | | | | 1 | |
| | | 47,951 | | | | | | — | | | | | | — | | | | | | — | | | | | | — | | | | | | — | | | | | | — | |
| | | 40,084 | | | | | | — | | | | | | 12,745 | | | | | | — | | | | | | — | | | | | | — | | | | | | — | |
| | | 35,321 | | | | | | 903 | | | | | | 2 | | | | | | — | | | | | | 594 | | | | | | 2 | | | | | | 176,432 | |
| | | 21,193 | | | | | | 542 | | | | | | 1 | | | | | | — | | | | | | 357 | | | | | | 1 | | | | | | 105,859 | |
| | | 13,361 | | | | | | — | | | | | | 4,248 | | | | | | — | | | | | | — | | | | | | — | | | | | | — | |
| | | 112,531,860 | | | | | | 4,656,951 | | | | | | 2,955,031 | | | | | | 457,502 | | | | | | 60,536,026 | | | | | | 29,073,368 | | | | | | 12,471,005 | |
| | | (21,594,864 | ) | | | | | (1,223,386 | ) | | | | | (827,507 | ) | | | | | (450,399 | ) | | | | | (6,781,637 | ) | | | | | (3,945,069 | ) | | | | | (1,671,658 | ) |
| | | 90,936,996 | | | | | | 3,433,565 | | | | | | 2,127,524 | | | | | | 7,103 | | | | | | 53,754,389 | | | | | | 25,128,299 | | | | | | 10,799,347 | |
| | $ | 169,834,217 | | | | | $ | 8,403,748 | | | | | $ | 4,269,361 | | | | | $ | 17,550 | | | | | $ | 65,282,205 | | | | | $ | 27,671,892 | | | | | $ | 12,372,333 | |
| | | 2,284,961 | | | | | | 68,047 | | | | | | 44,405 | | | | | | — | | | | | | 1,892,661 | | | | | | 1,353,249 | | | | | | 1,080,429 | |
| | | — | | | | | | 377,217 | | | | | | 228,646 | | | | | | 351 | | | | | | — | | | | | | — | | | | | | — | |
| | | 2,284,961 | | | | | | 445,264 | | | | | | 273,051 | | | | | | 351 | | | | | | 1,892,661 | | | | | | 1,353,249 | | | | | | 1,080,429 | |
| | $ | 172,119,178 | | | | | $ | 8,849,012 | | | | | $ | 4,542,412 | | | | | $ | 17,901 | | | | | $ | 67,174,866 | | | | | $ | 29,025,141 | | | | | $ | 13,452,762 | |
| | |
| The accompanying notes are an integral part of these financial statements. | | 41 |
GOLDMAN SACHS FUNDS — FINANCIAL SQUARE FUNDS
Statements of Changes in Net Assets
| | | | | | | | | | |
| | | | | Federal Instruments Fund | |
| | | | | For the
Six Months Ended
February 28, 2017
(Unaudited) | | | For the Period Ended
August 31, 2016* | |
| | From operations: | | | | | | | | |
| | Net investment income | | $ | 1,065,709 | | | $ | 802,111 | |
| | Net realized gain from investment transactions | | | 22,218 | | | | 125,180 | |
| | Unrealized gain from investment transactions | | | — | | | | — | |
| | Net increase in net assets resulting from operations | | | 1,087,927 | | | | 927,291 | |
| | | | | | | | | | |
| | Distributions to shareholders: | | | | | | | | |
| | From net investment income: | | | | | | | | |
| | Institutional Shares | | | (1,030,105 | ) | | | (804,850 | ) |
| | Select Shares | | | (72 | ) | | | (61 | ) |
| | Preferred Shares | | | (58 | ) | | | (34 | ) |
| | Capital Shares | | | (16,493 | ) | | | (18 | ) |
| | Administration Shares | | | (19,417 | ) | | | — | |
| | Premier Shares | | | (7 | ) | | | (1 | ) |
| | Service Shares | | | — | | | | — | |
| | Class A Shares(a) | | | — | | | | — | |
| | Class C Shares(a),(b) | | | — | | | | — | |
| | Resource Shares | | | — | | | | — | |
| | Cash Management Shares | | | (1 | ) | | | (1 | ) |
| | Class R6 Shares(c) | | | — | | | | — | |
| | From net realized gains: | | | | | | | | |
| | Institutional Shares | | | (38,670 | ) | | | (80,949 | ) |
| | Select Shares | | | (3 | ) | | | (7 | ) |
| | Preferred Shares | | | (3 | ) | | | (7 | ) |
| | Capital Shares | | | (1,262 | ) | | | (7 | ) |
| | Administration Shares | | | (3,043 | ) | | | (3,671 | ) |
| | Premier Shares | | | (3 | ) | | | (7 | ) |
| | Service Shares | | | (421 | ) | | | (1,072 | ) |
| | Class A Shares(a) | | | — | | | | — | |
| | Class C Shares(a)(b) | | | — | | | | — | |
| | Resource Shares | | | — | | | | — | |
| | Cash Management Shares | | | (3 | ) | | | (7 | ) |
| | Class R6 Shares(c) | | | — | | | | — | |
| | Total distributions to shareholders | | | (1,109,561 | ) | | | (890,692 | ) |
| | | | | | | | | | |
| | From share transactions: | | | | | | | | |
| | Proceeds from sales of shares | | | 762,415,109 | | | | 1,546,236,485 | |
| | Reinvestment of distributions | | | 1,086,994 | | | | 876,007 | |
| | Cost of shares redeemed | | | (632,532,158 | ) | | | (910,720,272 | ) |
| | Net increase (decrease) in net assets resulting from share transactions | | | 130,969,945 | | | | 636,392,220 | |
| | NET INCREASE (DECREASE) | | | 130,948,311 | | | | 636,428,819 | |
| | | | | | | | | | |
| | Net assets: | | | | | | | | |
| | Beginning of period | | | 636,428,819 | | | | — | |
| | End of period | | $ | 767,377,130 | | | $ | 636,428,819 | |
| | Undistributed (distributions in excess of) net investment income | | $ | 37,486 | | | $ | 37,930 | |
| | * | | Commenced operations on October 30, 2015. |
| | (a) | | Class A Shares and Class C Shares of the Government Fund commenced operations on February 29, 2016. |
| | (b) | | At the close of business on October 11, 2016, Class C Shares of the Prime Obligations Fund were liquidated. |
| | (c) | | Class R6 Shares of the Government Fund commenced operations on December 29, 2015. |
| | |
| 42 | | The accompanying notes are an integral part of these financial statements. |
GOLDMAN SACHS FUNDS — FINANCIAL SQUARE FUNDS
| | | | | | | | | | | | | | | | | | | | | | | | | | | | | | | | | | |
| | | Government Fund | | | | | Money Market Fund | | | | | Prime Obligations Fund | |
| | | For the
Six Months Ended
February 28, 2017
(Unaudited) | | | | | For the Fiscal
Year Ended
August 31, 2016 | | | | | For the
Six Months Ended
February 28, 2017
(Unaudited) | | | | | For the Fiscal
Year Ended
August 31, 2016 | | | | | For the
Six Months Ended
February 28, 2017
(Unaudited) | | | | | For the Fiscal
Year Ended
August 31, 2016 | |
| | | | | | | | | | | | | | | | | | | | | | | | | | | | | | | | | | |
| | $ | 169,834,217 | | | | | $ | 83,508,452 | | | | | $ | 8,403,748 | | | | | $ | 120,080,500 | | | | | $ | 4,269,361 | | | | | $ | 37,263,404 | |
| | | 2,284,961 | | | | | | 6,514,881 | | | | | | 68,047 | | | | | | 2,004,070 | | | | | | 44,405 | | | | | | 744,822 | |
| | | — | | | | | | — | | | | | | 377,217 | | | | | | — | | | | | | 228,646 | | | | | | — | |
| | | 172,119,178 | | | | | | 90,023,333 | | | | | | 8,849,012 | | | | | | 122,084,570 | | | | | | 4,542,412 | | | | | | 38,008,226 | |
| | | | | | | | | | | | | | | | | | | | | | | | | | | | | | | | | | |
| | | | | | | | | | | | | | | | | | | | | | | | | | | | | | | | | | |
| | | | | | | | | | | | | | | | | | | | | | | | | | | | | | | | | | |
| | | (160,127,528 | ) | | | | | (80,632,652 | ) | | | | | (7,953,093 | ) | | | | | (111,988,540 | ) | | | | | (4,047,720 | ) | | | | | (34,448,321 | ) |
| | | (4,623,397 | ) | | | | | (1,393,511 | ) | | | | | (377,364 | ) | | | | | (7,001,821 | ) | | | | | (4,686 | ) | | | | | (344,600 | ) |
| | | (1,119,335 | ) | | | | | (449,597 | ) | | | | | (20,774 | ) | | | | | (200,460 | ) | | | | | (65,341 | ) | | | | | (616,359 | ) |
| | | (1,631,428 | ) | | | | | (925,822 | ) | | | | | (10,731 | ) | | | | | (540,439 | ) | | | | | (21,038 | ) | | | | | (233,478 | ) |
| | | (2,261,135 | ) | | | | | (127,879 | ) | | | | | (41,052 | ) | | | | | (349,375 | ) | | | | | (100,102 | ) | | | | | (1,597,312 | ) |
| | | (15,406 | ) | | | | | (4 | ) | | | | | (2 | ) | | | | | (4 | ) | | | | | (2 | ) | | | | | (4 | ) |
| | | (4,348 | ) | | | | | — | | | | | | (716 | ) | | | | | — | | | | | | (8,258 | ) | | | | | (18,231 | ) |
| | | (27,208 | ) | | | | | (23 | ) | | | | | — | | | | | | — | | | | | | — | | | | | | — | |
| | | (143 | ) | | | | | (2 | ) | | | | | — | | | | | | — | | | | | | (236 | ) | | | | | (1,178 | ) |
| | | (838 | ) | | | | | — | | | | | | (2 | ) | | | | | (4 | ) | | | | | (608 | ) | | | | | (3,917 | ) |
| | | (167 | ) | | | | | (5 | ) | | | | | (16 | ) | | | | | (15 | ) | | | | | (2 | ) | | | | | (4 | ) |
| | | (23,284 | ) | | | | | (351 | ) | | | | | — | | | | | | — | | | | | | — | | | | | | — | |
| | | | | | | | | | | | | | | | | | | | | | | | | | | | | | | | | | |
| | | (1,592,217 | ) | | | | | (5,105,247 | ) | | | | | (48,085 | ) | | | | | (1,869,604 | ) | | | | | (22,166 | ) | | | | | (594,706 | ) |
| | | (54,286 | ) | | | | | (103,525 | ) | | | | | (928 | ) | | | | | (124,986 | ) | | | | | (12 | ) | | | | | (5,820 | ) |
| | | (15,437 | ) | | | | | (50,081 | ) | | | | | (14 | ) | | | | | (5,192 | ) | | | | | (140 | ) | | | | | (16,250 | ) |
| | | (28,962 | ) | | | | | (155,746 | ) | | | | | — | | | | | | (15,719 | ) | | | | | (50 | ) | | | | | (8,539 | ) |
| | | (70,774 | ) | | | | | (274,192 | ) | | | | | (357 | ) | | | | | (19,379 | ) | | | | | (482 | ) | | | | | (107,705 | ) |
| | | (853 | ) | | | | | — | | | | | | — | | | | | | — | | | | | | — | | | | | | — | |
| | | (7,809 | ) | | | | | (21,760 | ) | | | | | (35 | ) | | | | | (1,296 | ) | | | | | (346 | ) | | | | | (40,925 | ) |
| | | (660 | ) | | | | | (17 | ) | | | | | — | | | | | | — | | | | | | — | | | | | | — | |
| | | (184 | ) | | | | | (2 | ) | | | | | — | | | | | | — | | | | | | (12 | ) | | | | | (1,175 | ) |
| | | (1,294 | ) | | | | | (840 | ) | | | | | — | | | | | | — | | | | | | (3 | ) | | | | | (3,877 | ) |
| | | (275 | ) | | | | | — | | | | | | — | | | | | | (500 | ) | | | | | — | | | | | | — | |
| | | (245 | ) | | | | | (14 | ) | | | | | — | | | | | | — | | | | | | — | | | | | | — | |
| | | (171,607,213 | ) | | | | | (89,241,270 | ) | | | | | (8,453,169 | ) | | | | | (122,117,334 | ) | | | | | (4,271,204 | ) | | | | | (38,042,401 | ) |
| | | | | | | | | | | | | | | | | | | | | | | | | | | | | | | | | | |
| | | | | | | | | | | | | | | | | | | | | | | | | | | | | | | | | | |
| | | 384,905,637,196 | | | | | | 367,506,460,914 | | | | | | 12,440,254,822 | | | | | | 374,647,465,196 | | | | | | 7,247,999,431 | | | | | | 130,502,049,346 | |
| | | 89,846,434 | | | | | | 49,935,946 | | | | | | 3,745,612 | | | | | | 68,394,597 | | | | | | 1,485,928 | | | | | | 12,770,800 | |
| | | (354,689,420,597 | ) | | | | | (330,056,654,786 | ) | | | | | (27,723,571,421 | ) | | | | | (393,229,703,574 | ) | | | | | (15,748,209,240 | ) | | | | | (133,691,524,490 | ) |
| | | 30,306,063,033 | | | | | | 37,499,742,074 | | | | | | (15,279,570,987 | ) | | | | | (18,513,843,781 | ) | | | | | (8,498,723,881 | ) | | | | | (3,176,704,344 | ) |
| | | 30,306,574,998 | | | | | | 37,500,524,137 | | | | | | (15,279,175,144 | ) | | | | | (18,513,876,545 | ) | | | | | (8,498,452,673 | ) | | | | | (3,176,738,519 | ) |
| | | | | | | | | | | | | | | | | | | | | | | | | | | | | | | | | | |
| | | | | | | | | | | | | | | | | | | | | | | | | | | | | | | | | | |
| | | 71,268,722,948 | | | | | | 33,768,198,811 | | | | | | 16,928,478,825 | | | | | | 35,442,355,370 | | | | | | 9,323,185,766 | | | | | | 12,499,924,285 | |
| | $ | 101,575,297,946 | | | | | $ | 71,268,722,948 | | | | | $ | 1,649,303,681 | | | | | $ | 16,928,478,825 | | | | | $ | 824,733,093 | | | | | $ | 9,323,185,766 | |
| | $ | (76,265 | ) | | | | $ | (76,265 | ) | | | | $ | (3,580 | ) | | | | $ | (3,578 | ) | | | | $ | (76,587 | ) | | | | $ | (97,955 | ) |
| | |
| The accompanying notes are an integral part of these financial statements. | | 43 |
GOLDMAN SACHS FUNDS — FINANCIAL SQUARE FUNDS
Statements of Changes in Net Assets (continued)
| | | | | | | | | | |
| | | | | Tax-Exempt Money Market Fund | |
| | | | | For the
Six Months Ended
February 28, 2017
(Unaudited) | | | For the
Period Ended
August 31, 2016* | |
| | From operations: | | | | |
| | Net investment income | | $ | 17,550 | | | $ | 3,905 | |
| | Net realized gain from investment transactions | | | — | | | | — | |
| | Unrealized gain from investment transactions | | | 351 | | | | — | |
| | Net increase in net assets resulting from operations | | | 17,901 | | | | 3,905 | |
| | | | | | | | | | |
| | Distributions to shareholders: | | | | |
| | From net investment income: | | | | | | | | |
| | Institutional Shares | | | (17,483 | ) | | | (3,886 | ) |
| | Select Shares | | | (21 | ) | | | (7 | ) |
| | Preferred Shares | | | (17 | ) | | | (4 | ) |
| | Capital Shares | | | (15 | ) | | | (3 | ) |
| | Administration Shares | | | (10 | ) | | | (2 | ) |
| | Premier Shares | | | — | | | | — | |
| | Service Shares | | | (2 | ) | | | (1 | ) |
| | Resource Shares | | | (2 | ) | | | (2 | ) |
| | Cash Management Shares | | | — | | | | — | |
| | From net realized gains: | | | | | | | | |
| | Institutional Shares | | | — | | | | — | |
| | Select Shares | | | — | | | | — | |
| | Preferred Shares | | | — | | | | — | |
| | Capital Shares | | | — | | | | — | |
| | Administration Shares | | | — | | | | — | |
| | Premier Shares | | | — | | | | — | |
| | Service Shares | | | — | | | | — | |
| | Cash Management Shares | | | — | | | | — | |
| | Total distributions to shareholders | | | (17,550 | ) | | | (3,905 | ) |
| | | | | | | | | | |
| | From share transactions: | | | | | | | | |
| | Proceeds from sales of shares | | | 5,197,310 | | | | 15,055,338 | |
| | Reinvestment of distributions | | | 6,738 | | | | 2,664 | |
| | Cost of shares redeemed | | | (10,776,194 | ) | | | (2,502,698 | ) |
| | Net increase (decrease) in net assets resulting from share transactions | | | (5,572,146 | ) | | | 12,555,304 | |
| | NET INCREASE (DECREASE) | | | (5,571,795 | ) | | | 12,555,304 | |
| | | | | | | | | | |
| | Net assets: | | | | | | | | |
| | Beginning of period | | | 12,555,304 | | | | — | |
| | End of period | | $ | 6,983,509 | | | $ | 12,555,304 | |
| | Undistributed (distributions in excess of) net investment income | | $ | 143 | | | $ | 143 | |
| | * | | Commenced operations on March 31, 2016. |
| | |
| 44 | | The accompanying notes are an integral part of these financial statements. |
GOLDMAN SACHS FUNDS — FINANCIAL SQUARE FUNDS
| | | | | | | | | | | | | | | | | | | | | | | | | | | | | | | | | | |
| | | Treasury Instruments Fund | | | | | Treasury Obligations Fund | | | | | Treasury Solutions Fund | |
| | | For the
Six Months Ended
February 28, 2017
(Unaudited) | | | | | For the Fiscal
Year Ended
August 31, 2016 | | | | | For the Six Months Ended
February 28, 2017
(Unaudited) | | | | | For the Fiscal Year Ended
August 31, 2016 | | | | | For the Six Months Ended
February 28, 2017
(Unaudited) | | | | | For the Fiscal Year Ended
August 31, 2016 | |
| | | | | | | | | | | | | | | | | | | | | | |
| | $ | 65,282,205 | | | | | $ | 58,768,195 | | | | | $ | 27,671,892 | | | | | $ | 19,011,263 | | | | | $ | 12,372,333 | | | | | $ | 10,432,698 | |
| | | 1,892,661 | | | | | | 6,465,778 | | | | | | 1,353,249 | | | | | | 3,041,197 | | | | | | 1,080,429 | | | | | | 2,958,048 | |
| | | — | | | | | | — | | | | | | — | | | | | | — | | | | | | — | | | | | | — | |
| | | 67,174,866 | | | | | | 65,233,973 | | | | | | 29,025,141 | | | | | | 22,052,460 | | | | | | 13,452,762 | | | | | | 13,390,746 | |
| | | | | | | | | | | | | | | | | | | | | | | | | | | | | | | | | | |
| | | | | | | | | | | | | | | | | | | | | | |
| | | | | | | | | | | | | | | | | | | | | | | | | | | | | | | | | | |
| | | (64,421,745 | ) | | | | | (58,873,948 | ) | | | | | (26,928,807 | ) | | | | | (18,732,046 | ) | | | | | (12,137,274 | ) | | | | | (10,526,178 | ) |
| | | (77,218 | ) | | | | | (17,091 | ) | | | | | (163,436 | ) | | | | | (203,396 | ) | | | | | (12,482 | ) | | | | | (8,401 | ) |
| | | (52,688 | ) | | | | | (16,992 | ) | | | | | (87,310 | ) | | | | | (70,392 | ) | | | | | (34,630 | ) | | | | | (17,244 | ) |
| | | (335,401 | ) | | | | | (68,383 | ) | | | | | (185,250 | ) | | | | | (158,841 | ) | | | | | (162,607 | ) | | | | | (13,055 | ) |
| | | (400,099 | ) | | | | | — | | | | | | (330,121 | ) | | | | | — | | | | | | (39,832 | ) | | | | | — | |
| | | — | | | | | | — | | | | | | (2 | ) | | | | | (4 | ) | | | | | (357 | ) | | | | | (4 | ) |
| | | — | | | | | | — | | | | | | — | | | | | | — | | | | | | — | | | | | | — | |
| | | (2 | ) | | | | | (4 | ) | | | | | (2 | ) | | | | | (3 | ) | | | | | (2 | ) | | | | | (4 | ) |
| | | — | | | | | | (3 | ) | | | | | (2 | ) | | | | | (4 | ) | | | | | — | | | | | | — | |
| | | | | | | | | | | | | | | | | | | | | | | | | | | | | | | | | | |
| | | (2,352,399 | ) | | | | | (5,203,649 | ) | | | | | (1,099,566 | ) | | | | | (1,937,931 | ) | | | | | (865,489 | ) | | | | | (2,991,632 | ) |
| | | (3,050 | ) | | | | | (2,197 | ) | | | | | (8,046 | ) | | | | | (23,348 | ) | | | | | (992 | ) | | | | | (2,987 | ) |
| | | (2,398 | ) | | | | | (3,344 | ) | | | | | (6,063 | ) | | | | | (14,040 | ) | | | | | (4,684 | ) | | | | | (15,473 | ) |
| | | (27,270 | ) | | | | | (43,662 | ) | | | | | (17,042 | ) | | | | | (65,202 | ) | | | | | (26,061 | ) | | | | | (63,142 | ) |
| | | (101,615 | ) | | | | | (23,841 | ) | | | | | (81,437 | ) | | | | | (95,744 | ) | | | | | (16,046 | ) | | | | | (14,889 | ) |
| | | (1,407 | ) | | | | | (14 | ) | | | | | — | | | | | | — | | | | | | (2,963 | ) | | | | | — | |
| | | (484 | ) | | | | | (1,592 | ) | | | | | (29,982 | ) | | | | | (55,685 | ) | | | | | (5,724 | ) | | | | | (14,056 | ) |
| | | (3 | ) | | | | | (1 | ) | | | | | — | | | | | | — | | | | | | (2,157 | ) | | | | | (8,462 | ) |
| | | (67,775,779 | ) | | | | | (64,254,721 | ) | | | | | (28,937,066 | ) | | | | | (21,356,636 | ) | | | | | (13,311,300 | ) | | | | | (13,675,527 | ) |
| | | | | | | | | | | | | | | | | | | | | | | | | | | | | | | | | | |
| | | | | | | | | | | | | | | | | | | | | | | | | | | | | | | | | | |
| | | 102,821,841,591 | | | | | | 184,356,949,726 | | | | | | 87,152,128,551 | | | | | | 111,588,712,687 | | | | | | 18,360,648,671 | | | | | | 32,805,057,997 | |
| | | 46,638,524 | | | | | | 39,025,013 | | | | | | 17,133,963 | | | | | | 10,844,001 | | | | | | 8,913,907 | | | | | | 9,307,231 | |
| | | (108,664,042,746 | ) | | | | | (167,833,814,688 | ) | | | | | (91,953,500,853 | ) | | | | | (104,478,394,348 | ) | | | | | (19,465,060,859 | ) | | | | | (33,283,705,380 | ) |
| | | (5,795,562,631 | ) | | | | | 16,562,160,051 | | | | | | (4,784,238,339 | ) | | | | | 7,121,162,340 | | | | | | (1,095,498,281 | ) | | | | | (469,340,152 | ) |
| | | (5,796,163,544 | ) | | | | | 16,563,139,303 | | | | | | (4,784,150,264 | ) | | | | | 7,121,858,164 | | | | | | (1,095,356,819 | ) | | | | | (469,624,933 | ) |
| | | | | | | | | | | | | | | | | | | | | | | | | | | | | | | | | | |
| | | | | | | | | | | | | | | | | | | | | | | | | | | | | | | | | | |
| | | 53,422,455,032 | | | | | | 36,859,315,729 | | | | | | 23,273,839,630 | | | | | | 16,151,981,466 | | | | | | 10,633,064,830 | | | | | | 11,102,689,763 | |
| | $ | 47,626,291,488 | | | | | $ | 53,422,455,032 | | | | | $ | 18,489,689,366 | | | | | $ | 23,273,839,630 | | | | | $ | 9,537,708,011 | | | | | $ | 10,633,064,830 | |
| | $ | (237,821 | ) | | | | $ | (232,873 | ) | | | | $ | (213,288 | ) | | | | $ | (190,250 | ) | | | | $ | (145,588 | ) | | | | $ | (130,737 | ) |
| | |
| The accompanying notes are an integral part of these financial statements. | | 45 |
FINANCIAL SQUARE FEDERAL INSTRUMENTS FUND
Financial Highlights
Selected Data for a Share Outstanding Throughout Each Period
| | | | | | | | | | | | | | | | | | | | | | | | | | | | | | |
| | | | | | | | From
investment operations | | | Distributions
to shareholders | |
| | | Year - Share Class | | Net asset value, beginning of period | | | Net
investment
income(a) | | | Net realized
and unrealized
gain | | | Total from
investment
operations | | | From net
investment
income | | | From net
realized
gains | | | Total
distributions(b) | |
| | FOR THE SIX MONTHS ENDED FEBRUARY 28, (UNAUDITED) | | | | | | | | | | | | | |
| | 2017 - Institutional Shares | | $ | 1.00 | | | $ | 0.002 | | | $ | — | (d) | | $ | 0.002 | | | $ | (0.002 | ) | | $ | — | (d) | | $ | (0.002 | ) |
| | 2017 - Select Shares | | | 1.00 | | | | 0.002 | | | | — | (d) | | | 0.002 | | | | (0.002 | ) | | | — | (d) | | | (0.002 | ) |
| | 2017 - Preferred Shares | | | 1.00 | | | | 0.001 | | | | — | (d) | | | 0.001 | | | | (0.001 | ) | | | — | (d) | | | (0.001 | ) |
| | 2017 - Capital Shares | | | 1.00 | | | | 0.001 | | | | — | (d) | | | 0.001 | | | | (0.001 | ) | | | — | (d) | | | (0.001 | ) |
| | 2017 - Administration Shares | | | 1.00 | | | | — | (d) | | | — | (d) | | | — | (d) | | | — | (d) | | | — | (d) | | | — | (d) |
| | 2017 - Premier Shares | | | 1.00 | | | | — | (d) | | | — | (d) | | | — | (d) | | | — | (d) | | | — | (d) | | | — | (d) |
| | 2017 - Service Shares | | | 1.00 | | | | — | (d) | | | — | (d) | | | — | (d) | | | — | (d) | | | — | (d) | | | — | (d) |
| | 2017 - Cash Management Shares | | | 1.00 | | | | — | (d) | | | — | (d) | | | — | (d) | | | — | (d) | | | — | (d) | | | — | (d) |
| | | | | | | | | | | | | | | | | | | | | | | | | | | | | | |
| | FOR THE PERIOD ENDED AUGUST 31,* | | | | | | | | | | | | | |
| | 2016 - Institutional Shares | | | 1.00 | | | | 0.002 | | | | — | (d) | | | 0.002 | | | | (0.002 | ) | | | — | (d) | | | (0.002 | ) |
| | 2016 - Select Shares | | | 1.00 | | | | 0.001 | | | | — | (d) | | | 0.001 | | | | (0.001 | ) | | | — | (d) | | | (0.001 | ) |
| | 2016 - Preferred Shares | | | 1.00 | | | | 0.001 | | | | — | (d) | | | 0.001 | | | | (0.001 | ) | | | — | (d) | | | (0.001 | ) |
| | 2016 - Capital Shares | | | 1.00 | | | | — | (d) | | | — | (d) | | | — | (d) | | | — | (d) | | | — | (d) | | | — | (d) |
| | 2016 - Administration Shares | | | 1.00 | | | | — | (d) | | | — | (d) | | | — | (d) | | | — | (d) | | | — | (d) | | | — | (d) |
| | 2016 - Premier Shares | | | 1.00 | | | | — | (d) | | | — | (d) | | | — | (d) | | | — | (d) | | | — | (d) | | | — | (d) |
| | 2016 - Service Shares | | | 1.00 | | | | — | (d) | | | — | (d) | | | — | (d) | | | — | (d) | | | — | (d) | | | — | (d) |
| | 2016 - Cash Management Shares | | | 1.00 | | | | — | (d) | | | — | (d) | | | — | (d) | | | — | (d) | | | — | (d) | | | — | (d) |
| | * | | Commenced operations on October 30, 2015. |
| | (a) | | Calculated based on the average shares outstanding methodology. |
| | (b) | | Distributions may not coincide with the current year net investment income or net realized gains as distributions may be paid from current or prior year earnings. |
| | (c) | | Assumes reinvestment of all distributions. Returns do not reflect the deduction of taxes that a shareholder would pay on Fund distributions. Total returns for periods less than one full year are not annualized. |
| | (d) | | Amount is less than $0.0005 per share. |
| | (f) | | Amount is less than 0.005%. |
| | (g) | | Amount is less than 0.005% of average net assets. |
| | |
| 46 | | The accompanying notes are an integral part of these financial statements. |
FINANCIAL SQUARE FEDERAL INSTRUMENTS FUND
| | | | | | | | | | | | | | | | | | | | | | | | | | | | | | | | | | |
| | | | | | | | | | | |
| | | Net asset value, end of period | | | | | Total return(c) | | | | | Net assets end of period (in 000s) | | | | | Ratio of net expenses to average net assets | | | | | Ratio of total expenses to average net assets | | | | | Ratio of net investment income (loss) to average net assets | |
| | | | | | | | | | | | | | | | | | | | | | | | | | | | | | | | | | |
| | $ | 1.00 | | | | | | 0.17 | % | | | | $ | 702,961 | | | | | | 0.20 | %(e) | | | | | 0.30 | %(e) | | | | | 0.34 | %(e) |
| | | 1.00 | | | | | | 0.16 | | | | | | 47 | | | | | | 0.23 | (e) | | | | | 0.33 | (e) | | | | | 0.30 | (e) |
| | | 1.00 | | | | | | 0.12 | | | | | | 50 | | | | | | 0.30 | (e) | | | | | 0.40 | (e) | | | | | 0.23 | (e) |
| | | 1.00 | | | | | | 0.10 | | | | | | 8,481 | | | | | | 0.35 | (e) | | | | | 0.45 | (e) | | | | | 0.16 | (e) |
| | | 1.00 | | | | | | 0.05 | | | | | | 40,833 | | | | | | 0.45 | (e) | | | | | 0.55 | (e) | | | | | 0.08 | (e) |
| | | 1.00 | | | | | | 0.02 | | | | | | 50 | | | | | | 0.51 | (e) | | | | | 0.65 | (e) | | | | | 0.03 | (e) |
| | | 1.00 | | | | | | — | (f) | | | | | 14,905 | | | | | | 0.54 | (e) | | | | | 0.80 | (e) | | | | | (0.01 | )(e) |
| | | 1.00 | | | | | | — | (f) | | | | | 50 | | | | | | 0.54 | (e) | | | | | 1.10 | (e) | | | | | — | (e)(g) |
| | | | | | | | | | | | | | | | | | | | | | | | | | | | | | | | | | |
| | | | | | | | | | | | | | | | | | | | | | | | | | | | | | | | | | |
| | | 1.00 | | | | | | 0.16 | | | | | | 577,395 | | | | | | 0.20 | (e) | | | | | 0.39 | (e) | | | | | 0.19 | (e) |
| | | 1.00 | | | | | | 0.13 | | | | | | 50 | | | | | | 0.23 | (e) | | | | | 0.42 | (e) | | | | | 0.14 | (e) |
| | | 1.00 | | | | | | 0.08 | | | | | | 50 | | | | | | 0.29 | (e) | | | | | 0.49 | (e) | | | | | 0.08 | (e) |
| | | 1.00 | | | | | | 0.05 | | | | | | 50 | | | | | | 0.33 | (e) | | | | | 0.54 | (e) | | | | | 0.04 | (e) |
| | | 1.00 | | | | | | 0.01 | | | | | | 43,835 | | | | | | 0.39 | (e) | | | | | 0.64 | (e) | | | | | (0.01 | )(e) |
| | | 1.00 | | | | | | 0.01 | | | | | | 50 | | | | | | 0.38 | (e) | | | | | 0.74 | (e) | | | | | — | (e)(g) |
| | | 1.00 | | | | | | 0.01 | | | | | | 14,949 | | | | | | 0.39 | (e) | | | | | 0.89 | (e) | | | | | (0.01 | )(e) |
| | | 1.00 | | | | | | 0.01 | | | | | | 50 | | | | | | 0.38 | (e) | | | | | 1.19 | (e) | | | | | — | (e)(g) |
| | |
| The accompanying notes are an integral part of these financial statements. | | 47 |
FINANCIAL SQUARE GOVERNMENT FUND
Financial Highlights
Selected Data for a Share Outstanding Throughout Each Period
| | | | | | | | | | | | | | | | | | | | | | | | | | | | | | |
| | | | | | | | From
investment operations | | | Distributions
to shareholders | |
| | | Year - Share Class | | Net asset value, beginning of period | | | Net
investment
income(a) | | | Net realized
and unrealized
gain | | | Total from
investment
operations | | | From net
investment
income | | | From net
realized
gains | | | Total
distributions(b) | |
| | FOR THE SIX MONTHS ENDED FEBRUARY 28, (UNAUDITED) | | | | | | | | | | | | | | | | | |
| | 2017 - Institutional Shares | | $ | 1.00 | | | $ | 0.002 | | | $ | — | (d) | | $ | 0.002 | | | $ | (0.002 | ) | | $ | — | (d) | | $ | (0.002 | ) |
| | 2017 - Select Shares | | | 1.00 | | | | 0.002 | | | | — | (d) | | | 0.002 | | | | (0.002 | ) | | | — | (d) | | | (0.002 | ) |
| | 2017 - Preferred Shares | | | 1.00 | | | | 0.001 | | | | — | (d) | | | 0.001 | | | | (0.001 | ) | | | — | (d) | | | (0.001 | ) |
| | 2017 - Capital Shares | | | 1.00 | | | | 0.001 | | | | — | (d) | | | 0.001 | | | | (0.001 | ) | | | — | (d) | | | (0.001 | ) |
| | 2017 - Administration Shares | | | 1.00 | | | | 0.001 | | | | — | (d) | | | 0.001 | | | | (0.001 | ) | | | — | (d) | | | (0.001 | ) |
| | 2017 - Premier Shares | | | 1.00 | | | | — | (d) | | | — | (d) | | | — | (d) | | | — | (d) | | | — | (d) | | | — | (d) |
| | 2017 - Service Shares | | | 1.00 | | | | — | (d) | | | — | (d) | | | — | (d) | | | — | (d) | | | — | (d) | | | — | (d) |
| | 2017 - Resource Shares | | | 1.00 | | | | — | (d) | | | — | (d) | | | — | (d) | | | — | (d) | | | — | (d) | | | — | (d) |
| | 2017 - Cash Management Shares | | | 1.00 | | | | — | (d) | | | — | (d) | | | — | (d) | | | — | (d) | | | — | (d) | | | — | (d) |
| | 2017 - Class R6 Shares | | | 1.00 | | | | 0.002 | | | | — | (d) | | | 0.002 | | | | (0.002 | ) | | | — | (d) | | | (0.002 | ) |
| | 2017 - Class A Shares | | | 1.00 | | | | 0.001 | | | | — | (d) | | | 0.001 | | | | (0.001 | ) | | | — | (d) | | | (0.001 | ) |
| | 2017 - Class C Shares | | | 1.00 | | | | — | (d) | | | — | (d) | | | — | (d) | | | — | (d) | | | — | (d) | | | — | (d) |
| | | | | | | | | | | | | | | | | | | | | | | | | | | | | | |
| | FOR THE FISCAL YEARS ENDED AUGUST 31, | |
| | 2016 - Institutional Shares | | | 1.00 | | | | 0.002 | | | | — | (d) | | | 0.002 | | | | (0.002 | ) | | | — | (d) | | | (0.002 | ) |
| | 2016 - Select Shares | | | 1.00 | | | | 0.002 | | | | — | (d) | | | 0.002 | | | | (0.002 | ) | | | — | (d) | | | (0.002 | ) |
| | 2016 - Preferred Shares | | | 1.00 | | | | 0.001 | | | | — | (d) | | | 0.001 | | | | (0.001 | ) | | | — | (d) | | | (0.001 | ) |
| | 2016 - Capital Shares | | | 1.00 | | | | 0.001 | | | | — | (d) | | | 0.001 | | | | (0.001 | ) | | | — | (d) | | | (0.001 | ) |
| | 2016 - Administration Shares | | | 1.00 | | | | — | (d) | | | — | (d) | | | — | (d) | | | — | (d) | | | — | (d) | | | — | (d) |
| | 2016 - Premier Shares | | | 1.00 | | | | — | (d) | | | — | (d) | | | — | (d) | | | — | (d) | | | — | (d) | | | — | (d) |
| | 2016 - Service Shares | | | 1.00 | | | | — | (d) | | | — | (d) | | | — | (d) | | | — | (d) | | | — | (d) | | | — | (d) |
| | 2016 - Resource Shares | | | 1.00 | | | | — | (d) | | | — | (d) | | | — | (d) | | | — | (d) | | | — | (d) | | | — | (d) |
| | 2016 - Cash Management Shares | | | 1.00 | | | | — | (d) | | | — | (d) | | | — | (d) | | | — | (d) | | | — | (d) | | | — | (d) |
| | 2016 - Class R6 Shares (Commenced operations on December 29, 2015) | | | 1.00 | | | | 0.002 | | | | — | (d) | | | 0.002 | | | | (0.002 | ) | | | — | (d) | | | (0.002 | ) |
| | 2016 - Class A Shares (Commenced operations on February 29, 2016) | | | 1.00 | | | | — | (d) | | | — | (d) | | | — | (d) | | | — | (d) | | | — | (d) | | | — | (d) |
| | 2016 - Class C Shares (Commenced operations on February 29, 2016) | | | 1.00 | | | | — | (d) | | | — | (d) | | | — | (d) | | | — | (d) | | | — | (d) | | | — | (d) |
| | 2015 - Institutional Shares | | | 1.00 | | | | — | (d) | | | — | (d) | | | — | (d) | | | — | (d) | | | — | (d) | | | — | (d) |
| | 2015 - Select Shares | | | 1.00 | | | | — | (d) | | | — | (d) | | | — | (d) | | | — | (d) | | | — | (d) | | | — | (d) |
| | 2015 - Preferred Shares | | | 1.00 | | | | — | (d) | | | — | (d) | | | — | (d) | | | — | (d) | | | — | (d) | | | — | (d) |
| | 2015 - Capital Shares | | | 1.00 | | | | — | (d) | | | — | (d) | | | — | (d) | | | — | (d) | | | — | (d) | | | — | (d) |
| | 2015 - Administration Shares | | | 1.00 | | | | — | (d) | | | — | (d) | | | — | (d) | | | — | (d) | | | — | (d) | | | — | (d) |
| | 2015 - Premier Shares | | | 1.00 | | | | — | (d) | | | — | (d) | | | — | (d) | | | — | (d) | | | — | (d) | | | — | (d) |
| | 2015 - Service Shares | | | 1.00 | | | | — | (d) | | | — | (d) | | | — | (d) | | | — | (d) | | | — | (d) | | | — | (d) |
| | 2015 - Resource Shares | | | 1.00 | | | | — | (d) | | | — | (d) | | | — | (d) | | | — | (d) | | | — | (d) | | | — | (d) |
| | 2015 - Cash Management Shares | | | 1.00 | | | | — | (d) | | | — | (d) | | | — | (d) | | | — | (d) | | | — | (d) | | | — | (d) |
| | 2014 - Institutional Shares | | | 1.00 | | | | — | (d) | | | — | (d) | | | — | (d) | | | — | (d) | | | — | (d) | | | — | (d) |
| | 2014 - Select Shares | | | 1.00 | | | | — | (d) | | | — | (d) | | | — | (d) | | | — | (d) | | | — | (d) | | | — | (d) |
| | 2014 - Preferred Shares | | | 1.00 | | | | — | (d) | | | — | (d) | | | — | (d) | | | — | (d) | | | — | (d) | | | — | (d) |
| | 2014 - Capital Shares | | | 1.00 | | | | — | (d) | | | — | (d) | | | — | (d) | | | — | (d) | | | — | (d) | | | — | (d) |
| | 2014 - Administration Shares | | | 1.00 | | | | — | (d) | | | — | (d) | | | — | (d) | | | — | (d) | | | — | (d) | | | — | (d) |
| | 2014 - Premier Shares | | | 1.00 | | | | — | (d) | | | — | (d) | | | — | (d) | | | — | (d) | | | — | (d) | | | — | (d) |
| | 2014 - Service Shares | | | 1.00 | | | | — | (d) | | | — | (d) | | | — | (d) | | | — | (d) | | | — | (d) | | | — | (d) |
| | 2014 - Resource Shares | | | 1.00 | | | | — | (d) | | | — | (d) | | | — | (d) | | | — | (d) | | | — | (d) | | | — | (d) |
| | 2014 - Cash Management Shares | | | 1.00 | | | | — | (d) | | | — | (d) | | | — | (d) | | | — | (d) | | | — | (d) | | | — | (d) |
| | 2013 - Institutional Shares | | | 1.00 | | | | — | (d) | | | — | (d) | | | — | (d) | | | — | (d) | | | — | (d) | | | — | (d) |
| | 2013 - Select Shares | | | 1.00 | | | | — | (d) | | | — | (d) | | | — | (d) | | | — | (d) | | | — | (d) | | | — | (d) |
| | 2013 - Preferred Shares | | | 1.00 | | | | — | (d) | | | — | (d) | | | — | (d) | | | — | (d) | | | — | (d) | | | — | (d) |
| | 2013 - Capital Shares | | | 1.00 | | | | — | (d) | | | — | (d) | | | — | (d) | | | — | (d) | | | — | (d) | | | — | (d) |
| | 2013 - Administration Shares | | | 1.00 | | | | — | (d) | | | — | (d) | | | — | (d) | | | — | (d) | | | — | (d) | | | — | (d) |
| | 2013 - Premier Shares | | | 1.00 | | | | — | (d) | | | — | (d) | | | — | (d) | | | — | (d) | | | — | (d) | | | — | (d) |
| | 2013 - Service Shares | | | 1.00 | | | | — | (d) | | | — | (d) | | | — | (d) | | | — | (d) | | | — | (d) | | | — | (d) |
| | 2013 - Resource Shares | | | 1.00 | | | | — | (d) | | | — | (d) | | | — | (d) | | | — | (d) | | | — | (d) | | | — | (d) |
| | 2013 - Cash Management Shares | | | 1.00 | | | | — | (d) | | | — | (d) | | | — | (d) | | | — | (d) | | | — | (d) | | | — | (d) |
| | 2012 - Institutional Shares | | | 1.00 | | | | — | (d) | | | — | (d) | | | — | (d) | | | — | (d) | | | — | (d) | | | — | (d) |
| | 2012 - Select Shares | | | 1.00 | | | | — | (d) | | | — | (d) | | | — | (d) | | | — | (d) | | | — | (d) | | | — | (d) |
| | 2012 - Preferred Shares | | | 1.00 | | | | — | (d) | | | — | (d) | | | — | (d) | | | — | (d) | | | — | (d) | | | — | (d) |
| | 2012 - Capital Shares | | | 1.00 | | | | — | (d) | | | — | (d) | | | — | (d) | | | — | (d) | | | — | (d) | | | — | (d) |
| | 2012 - Administration Shares | | | 1.00 | | | | — | (d) | | | — | (d) | | | — | (d) | | | — | (d) | | | — | (d) | | | — | (d) |
| | 2012 - Premier Shares | | | 1.00 | | | | — | (d) | | | — | (d) | | | — | (d) | | | — | (d) | | | — | (d) | | | — | (d) |
| | 2012 - Service Shares | | | 1.00 | | | | — | (d) | | | — | (d) | | | — | (d) | | | — | (d) | | | — | (d) | | | — | (d) |
| | 2012 - Resource Shares | | | 1.00 | | | | — | (d) | | | — | (d) | | | — | (d) | | | — | (d) | | | — | (d) | | | — | (d) |
| | 2012 - Cash Management Shares | | | 1.00 | | | | — | (d) | | | — | (d) | | | — | (d) | | | — | (d) | | | — | (d) | | | — | (d) |
| | (a) | | Calculated based on the average shares outstanding methodology. |
| | (b) | | Distributions may not coincide with the current year net investment income or net realized gains as distributions may be paid from current or prior year earnings. |
| | (c) | | Assumes reinvestment of all distributions. Returns do not reflect the deduction of taxes that a shareholder would pay on Fund distributions. Total returns for periods less than one full year are not annualized. |
| | (d) | | Amount is less than $0.0005 per share. |
| | (f) | | Amount is less than 0.005%. |
| | (g) | | Amount is less than 0.005% of average net assets. |
| | |
| 48 | | The accompanying notes are an integral part of these financial statements. |
FINANCIAL SQUARE GOVERNMENT FUND
| | | | | | | | | | | | | | | | | | | | | | | | | | | | | | | | | | |
| | | | | | | | | | | |
| | | Net asset value, end of period | | | | | Total return(c) | | | | | Net assets end of period (in 000s) | | | | | Ratio of net expenses to average net assets | | | | | Ratio of total expenses to average net assets | | | | | Ratio of net investment income (loss) to average net assets | |
| | | | | | | | | | | | | | | | | | | | | | | | | | | | | | | | | | |
| | $ | 1.00 | | | | | | 0.19 | % | | | | $ | 92,254,654 | | | | | | 0.18 | %(e) | | | | | 0.23 | %(e) | | | | | 0.38 | %(e) |
| | | 1.00 | | | | | | 0.17 | | | | | | 2,527,009 | | | | | | 0.21 | (e) | | | | | 0.26 | (e) | | | | | 0.33 | (e) |
| | | 1.00 | | | | | | 0.14 | | | | | | 1,006,727 | | | | | | 0.28 | (e) | | | | | 0.33 | (e) | | | | | 0.27 | (e) |
| | | 1.00 | | | | | | 0.11 | | | | | | 1,286,945 | | | | | | 0.33 | (e) | | | | | 0.38 | (e) | | | | | 0.22 | (e) |
| | | 1.00 | | | | | | 0.06 | | | | | | 3,958,423 | | | | | | 0.43 | (e) | | | | | 0.48 | (e) | | | | | 0.12 | (e) |
| | | 1.00 | | | | | | 0.03 | | | | | | 66,165 | | | | | | 0.51 | (e) | | | | | 0.58 | (e) | | | | | 0.06 | (e) |
| | | 1.00 | | | | | | — | (f) | | | | | 314,189 | | | | | | 0.54 | (e) | | | | | 0.73 | (e) | | | | | — | (e)(g) |
| | | 1.00 | | | | | | — | (f) | | | | | 81,457 | | | | | | 0.56 | (e) | | | | | 0.88 | (e) | | | | | — | (e)(g) |
| | | 1.00 | | | | | | — | (f) | | | | | 7,146 | | | | | | 0.54 | (e) | | | | | 1.03 | (e) | | | | | — | (e)(g) |
| | | 1.00 | | | | | | 0.19 | | | | | | 12,052 | | | | | | 0.18 | (e) | | | | | 0.23 | (e) | | | | | 0.37 | (e) |
| | | 1.00 | | | | | | 0.06 | | | | | | 48,131 | | | | | | 0.43 | (e) | | | | | 0.48 | (e) | | | | | 0.14 | (e) |
| | | 1.00 | | | | | | — | (f) | | | | | 12,400 | | | | | | 0.56 | (e) | | | | | 1.23 | (e) | | | | | — | (e)(g) |
| | | | | | | | | | | | | | | | | | | | | | | | | | | | | | | | | | |
| | | | | | | | | | | | | | | | | | | | | | | | | | | | | | | | | | |
| | | 1.00 | | | | | | 0.20 | | | | | | 63,804,041 | | | | | | 0.18 | | | | | | 0.23 | | | | | | 0.21 | |
| | | 1.00 | | | | | | 0.17 | | | | | | 2,471,275 | | | | | | 0.21 | | | | | | 0.26 | | | | | | 0.21 | |
| | | 1.00 | | | | | | 0.12 | | | | | | 536,818 | | | | | | 0.27 | | | | | | 0.33 | | | | | | 0.13 | |
| | | 1.00 | | | | | | 0.08 | | | | | | 1,390,271 | | | | | | 0.30 | | | | | | 0.38 | | | | | | 0.07 | |
| | | 1.00 | | | | | | 0.02 | | | | | | 2,673,689 | | | | | | 0.36 | | | | | | 0.48 | | | | | | 0.01 | |
| | | 1.00 | | | | | | 0.02 | | | | | | 1 | | | | | | 0.20 | | | | | | 0.58 | | | | | | 0.40 | |
| | | 1.00 | | | | | | 0.01 | | | | | | 368,299 | | | | | | 0.36 | | | | | | 0.73 | | | | | | (0.01 | ) |
| | | 1.00 | | | | | | 0.01 | | | | | | 17,634 | | | | | | 0.43 | | | | | | 0.88 | | | | | | (0.01 | ) |
| | | 1.00 | | | | | | 0.02 | | | | | | 14 | | | | | | 0.35 | | | | | | 1.03 | | | | | | 0.06 | |
| | | 1.00 | | | | | | 0.18 | | | | | | 4,705 | | | | | | 0.18 | (e) | | | | | 0.23 | (e) | | | | | 0.26 | (e) |
| | | 1.00 | | | | | | 0.01 | | | | | | 1,563 | | | | | | 0.43 | (e) | | | | | 0.48 | (e) | | | | | 0.02 | (e) |
| | | 1.00 | | | | | | 0.01 | | | | | | 413 | | | | | | 0.44 | (e) | | | | | 1.23 | (e) | | | | | 0.01 | (e) |
| | | 1.00 | | | | | | 0.01 | | | | | | 29,753,210 | | | | | | 0.14 | | | | | | 0.23 | | | | | | 0.01 | |
| | | 1.00 | | | | | | 0.01 | | | | | | 203,098 | | | | | | 0.14 | | | | | | 0.26 | | | | | | 0.01 | |
| | | 1.00 | | | | | | 0.01 | | | | | | 249,542 | | | | | | 0.14 | | | | | | 0.33 | | | | | | 0.01 | |
| | | 1.00 | | | | | | 0.01 | | | | | | 1,174,099 | | | | | | 0.14 | | | | | | 0.38 | | | | | | 0.01 | |
| | | 1.00 | | | | | | 0.01 | | | | | | 1,920,203 | | | | | | 0.14 | | | | | | 0.48 | | | | | | 0.01 | |
| | | 1.00 | | | | | | 0.01 | | | | | | 1 | | | | | | 0.14 | | | | | | 0.58 | | | | | | 0.40 | |
| | | 1.00 | | | | | | 0.01 | | | | | | 468,041 | | | | | | 0.14 | | | | | | 0.73 | | | | | | 0.01 | |
| | | 1.00 | | | | | | 0.01 | | | | | | 1 | | | | | | 0.14 | | | | | | 0.88 | | | | | | 0.40 | |
| | | 1.00 | | | | | | 0.01 | | | | | | 4 | | | | | | 0.14 | | | | | | 1.03 | | | | | | 0.22 | |
| | | 1.00 | | | | | | 0.01 | | | | | | 22,069,515 | | | | | | 0.12 | | | | | | 0.23 | | | | | | — | (g) |
| | | 1.00 | | | | | | 0.01 | | | | | | 101,446 | | | | | | 0.12 | | | | | | 0.26 | | | | | | — | (g) |
| | | 1.00 | | | | | | 0.01 | | | | | | 266,881 | | | | | | 0.12 | | | | | | 0.33 | | | | | | — | (g) |
| | | 1.00 | | | | | | 0.01 | | | | | | 1,113,078 | | | | | | 0.12 | | | | | | 0.38 | | | | | | — | (g) |
| | | 1.00 | | | | | | 0.01 | | | | | | 1,939,309 | | | | | | 0.12 | | | | | | 0.48 | | | | | | — | (g) |
| | | 1.00 | | | | | | 0.01 | | | | | | 1 | | | | | | 0.12 | | | | | | 0.58 | | | | | | — | (g) |
| | | 1.00 | | | | | | 0.01 | | | | | | 376,094 | | | | | | 0.12 | | | | | | 0.73 | | | | | | — | (g) |
| | | 1.00 | | | | | | 0.01 | | | | | | 1 | | | | | | 0.12 | | | | | | 0.88 | | | | | | 0.40 | |
| | | 1.00 | | | | | | 0.01 | | | | | | 1 | | | | | | 0.12 | | | | | | 1.03 | | | | | | 0.40 | |
| | | 1.00 | | | | | | 0.03 | | | | | | 21,751,069 | | | | | | 0.18 | | | | | | 0.23 | | | | | | 0.03 | |
| | | 1.00 | | | | | | 0.01 | | | | | | 145,992 | | | | | | 0.20 | | | | | | 0.26 | | | | | | 0.02 | |
| | | 1.00 | | | | | | 0.01 | | | | | | 305,546 | | | | | | 0.21 | | | | | | 0.33 | | | | | | — | (g) |
| | | 1.00 | | | | | | 0.01 | | | | | | 411,426 | | | | | | 0.20 | | | | | | 0.38 | | | | | | — | (g) |
| | | 1.00 | | | | | | 0.01 | | | | | | 1,983,578 | | | | | | 0.20 | | | | | | 0.48 | | | | | | — | (g) |
| | | 1.00 | | | | | | 0.01 | | | | | | 5,416 | | | | | | 0.20 | | | | | | 0.58 | | | | | | — | (g) |
| | | 1.00 | | | | | | 0.01 | | | | | | 260,856 | | | | | | 0.20 | | | | | | 0.73 | | | | | | — | (g) |
| | | 1.00 | | | | | | 0.01 | | | | | | 1 | | | | | | 0.18 | | | | | | 0.88 | | | | | | 0.40 | |
| | | 1.00 | | | | | | 0.01 | | | | | | 1 | | | | | | 0.18 | | | | | | 1.03 | | | | | | 0.40 | |
| | | 1.00 | | | | | | 0.03 | | | | | | 28,326,048 | | | | | | 0.18 | | | | | | 0.23 | | | | | | 0.03 | |
| | | 1.00 | | | | | | 0.01 | | | | | | 628,155 | | | | | | 0.20 | | | | | | 0.26 | | | | | | 0.01 | |
| | | 1.00 | | | | | | 0.01 | | | | | | 546,452 | | | | | | 0.20 | | | | | | 0.33 | | | | | | 0.01 | |
| | | 1.00 | | | | | | 0.01 | | | | | | 493,427 | | | | | | 0.20 | | | | | | 0.38 | | | | | | 0.01 | |
| | | 1.00 | | | | | | 0.01 | | | | | | 2,382,900 | | | | | | 0.20 | | | | | | 0.48 | | | | | | 0.01 | |
| | | 1.00 | | | | | | 0.01 | | | | | | 5,594 | | | | | | 0.21 | | | | | | 0.58 | | | | | | 0.01 | |
| | | 1.00 | | | | | | 0.01 | | | | | | 374,051 | | | | | | 0.20 | | | | | | 0.73 | | | | | | 0.01 | |
| | | 1.00 | | | | | | 0.01 | | | | | | 1 | | | | | | 0.18 | | | | | | 0.88 | | | | | | 0.40 | |
| | | 1.00 | | | | | | 0.01 | | | | | | 1 | | | | | | 0.18 | | | | | | 1.03 | | | | | | 0.40 | |
| | |
| The accompanying notes are an integral part of these financial statements. | | 49 |
FINANCIAL SQUARE MONEY MARKET FUND
Financial Highlights
Selected Data for a Share Outstanding Throughout Each Period
| | | | | | | | | | | | | | | | | | | | | | | | | | | | | | |
| | | | | | | | From
investment operations | | | Distributions
to shareholders | |
| | | Year - Share Class | | Net asset value, beginning of period | | | Net
investment
income(a) | | | Net realized
and unrealized
gain (loss) | | | Total from
investment
operations | | | From net
investment
income | | | From net
realized
gains | | | Total
distributions(b) | |
| | FOR THE SIX MONTHS ENDED FEBRUARY 28, (UNAUDITED) | | | | | | | | | |
| | 2017 - Institutional Shares | | $ | 1.0000 | | | $ | 0.0024 | | | $ | 0.0008 | | | $ | 0.0032 | | | $ | (0.0030 | ) | | $ | — | (d) | | $ | (0.0030 | ) |
| | 2017 - Select Shares | | | 1.0000 | | | | 0.0019 | | | | 0.0011 | | | | 0.0030 | | | | (0.0028 | ) | | | — | (d) | | | (0.0028 | ) |
| | 2017 - Preferred Shares | | | 1.0000 | | | | 0.0015 | | | | 0.0012 | | | | 0.0027 | | | | (0.0025 | ) | | | — | (d) | | | (0.0025 | ) |
| | 2017 - Capital Shares | | | 1.0000 | | | | 0.0010 | | | | 0.0014 | | | | 0.0024 | | | | (0.0022 | ) | | | — | (d) | | | (0.0022 | ) |
| | 2017 - Administration Shares | | | 1.0000 | | | | 0.0008 | | | | 0.0012 | | | | 0.0020 | | | | (0.0017 | ) | | | — | (d) | | | (0.0017 | ) |
| | 2017 - Premier Shares | | | 1.0000 | | | | 0.0020 | | | | (0.0005 | ) | | | 0.0015 | | | | (0.0013 | ) | | | — | (d) | | | (0.0013 | ) |
| | 2017 - Service Shares | | | 1.0000 | | | | 0.0002 | | | | 0.0007 | | | | 0.0009 | | | | (0.0007 | ) | | | — | (d) | | | (0.0007 | ) |
| | 2017 - Resource Shares | | | 1.0000 | | | | 0.0020 | | | | (0.0014 | ) | | | 0.0006 | | | | (0.0004 | ) | | | — | (d) | | | (0.0004 | ) |
| | 2017 - Cash Management Shares | | | 1.0000 | | | | — | (d) | | | 0.0003 | | | | 0.0003 | | | | (0.0001 | ) | | | — | (d) | | | (0.0001 | ) |
| | | | | | | | | | | | | | | | | | | | | | | | | | | | | | |
| | FOR THE FISCAL YEARS ENDED AUGUST 31, | | | | | | | | | |
| | 2016 - Institutional Shares | | | 1.00 | | | | 0.003 | | | | — | (f) | | | 0.003 | | | | (0.003 | ) | | | — | (f) | | | (0.003 | ) |
| | 2016 - Select Shares | | | 1.00 | | | | 0.003 | | | | — | (f) | | | 0.003 | | | | (0.003 | ) | | | — | (f) | | | (0.003 | ) |
| | 2016 - Preferred Shares | | | 1.00 | | | | 0.002 | | | | — | (f) | | | 0.002 | | | | (0.002 | ) | | | — | (f) | | | (0.002 | ) |
| | 2016 - Capital Shares | | | 1.00 | | | | 0.002 | | | | — | (f) | | | 0.002 | | | | (0.002 | ) | | | — | (f) | | | (0.002 | ) |
| | 2016 - Administration Shares | | | 1.00 | | | | 0.001 | | | | — | (f) | | | 0.001 | | | | (0.001 | ) | | | — | (f) | | | (0.001 | ) |
| | 2016 - Premier Shares | | | 1.00 | | | | 0.001 | | | | — | (f) | | | 0.001 | | | | (0.001 | ) | | | — | (f) | | | (0.001 | ) |
| | 2016 - Service Shares | | | 1.00 | | | | — | (f) | | | — | (f) | | | — | (f) | | | — | (f) | | | — | (f) | | | — | (f) |
| | 2016 - Resource Shares | | | 1.00 | | | | 0.001 | | | | — | (f) | | | 0.001 | | | | (0.001 | ) | | | — | (f) | | | (0.001 | ) |
| | 2016 - Cash Management Shares | | | 1.00 | | | | — | (f) | | | — | (f) | | | — | (f) | | | — | (f) | | | — | (f) | | | — | (f) |
| | 2015 - Institutional Shares | | | 1.00 | | | | 0.001 | | | | — | (f) | | | 0.001 | | | | (0.001 | ) | | | — | (f) | | | (0.001 | ) |
| | 2015 - Select Shares | | | 1.00 | | | | 0.001 | | | | — | (f) | | | 0.001 | | | | (0.001 | ) | | | — | (f) | | | (0.001 | ) |
| | 2015 - Preferred Shares | | | 1.00 | | | | — | (f) | | | — | (f) | | | — | (f) | | | — | (f) | | | — | (f) | | | — | (f) |
| | 2015 - Capital Shares | | | 1.00 | | | | — | (f) | | | — | (f) | | | — | (f) | | | — | (f) | | | — | (f) | | | — | (f) |
| | 2015 - Administration Shares | | | 1.00 | | | | — | (f) | | | — | (f) | | | — | (f) | | | — | (f) | | | — | (f) | | | — | (f) |
| | 2015 - Premier Shares | | | 1.00 | | | | — | (f) | | | — | (f) | | | — | (f) | | | — | (f) | | | — | (f) | | | — | (f) |
| | 2015 - Service Shares | | | 1.00 | | | | — | (f) | | | — | (f) | | | — | (f) | | | — | (f) | | | — | (f) | | | — | (f) |
| | 2015 - Resource Shares | | | 1.00 | | | | — | (f) | | | — | (f) | | | — | (f) | | | — | (f) | | | — | (f) | | | — | (f) |
| | 2015 - Cash Management Shares | | | 1.00 | | | | — | (f) | | | — | (f) | | | — | (f) | | | — | (f) | | | — | (f) | | | — | (f) |
| | 2014 - Institutional Shares | | | 1.00 | | | | 0.001 | | | | — | (f) | | | 0.001 | | | | (0.001 | ) | | | — | (f) | | | (0.001 | ) |
| | 2014 - Select Shares | | | 1.00 | | | | — | (f) | | | — | (f) | | | — | (f) | | | — | (f) | | | — | (f) | | | — | (f) |
| | 2014 - Preferred Shares | | | 1.00 | | | | — | (f) | | | — | (f) | | | — | (f) | | | — | (f) | | | — | (f) | | | — | (f) |
| | 2014 - Capital Shares | | | 1.00 | | | | — | (f) | | | — | (f) | | | — | (f) | | | — | (f) | | | — | (f) | | | — | (f) |
| | 2014 - Administration Shares | | | 1.00 | | | | — | (f) | | | — | (f) | | | — | (f) | | | — | (f) | | | — | (f) | | | — | (f) |
| | 2014 - Premier Shares | | | 1.00 | | | | — | (f) | | | — | (f) | | | — | (f) | | | — | (f) | | | — | (f) | | | — | (f) |
| | 2014 - Service Shares | | | 1.00 | | | | — | (f) | | | — | (f) | | | — | (f) | | | — | (f) | | | — | (f) | | | — | (f) |
| | 2014 - Resource Shares | | | 1.00 | | | | — | (f) | | | — | (f) | | | — | (f) | | | — | (f) | | | — | (f) | | | — | (f) |
| | 2014 - Cash Management Shares | | | 1.00 | | | | — | (f) | | | — | (f) | | | — | (f) | | | — | (f) | | | — | (f) | | | — | (f) |
| | 2013 - Institutional Shares | | | 1.00 | | | | 0.001 | | | | — | (f) | | | 0.001 | | | | (0.001 | ) | | | — | (f) | | | (0.001 | ) |
| | 2013 - Select Shares | | | 1.00 | | | | 0.001 | | | | — | (f) | | | 0.001 | | | | (0.001 | ) | | | — | (f) | | | (0.001 | ) |
| | 2013 - Preferred Shares | | | 1.00 | | | | — | (f) | | | — | (f) | | | — | (f) | | | — | (f) | | | — | (f) | | | — | (f) |
| | 2013 - Capital Shares | | | 1.00 | | | | — | (f) | | | — | (f) | | | — | (f) | | | — | (f) | | | — | (f) | | | — | (f) |
| | 2013 - Administration Shares | | | 1.00 | | | | — | (f) | | | — | (f) | | | — | (f) | | | — | (f) | | | — | (f) | | | — | (f) |
| | 2013 - Premier Shares | | | 1.00 | | | | — | (f) | | | — | (f) | | | — | (f) | | | — | (f) | | | — | (f) | | | — | (f) |
| | 2013 - Service Shares | | | 1.00 | | | | — | (f) | | | — | (f) | | | — | (f) | | | — | (f) | | | — | (f) | | | — | (f) |
| | 2013 - Resource Shares | | | 1.00 | | | | — | (f) | | | — | (f) | | | — | (f) | | | — | (f) | | | — | (f) | | | — | (f) |
| | 2013 - Cash Management Shares | | | 1.00 | | | | — | (f) | | | — | (f) | | | — | (f) | | | — | (f) | | | — | (f) | | | — | (f) |
| | 2012 - Institutional Shares | | | 1.00 | | | | 0.002 | | | | — | (f) | | | 0.002 | | | | (0.002 | ) | | | — | (f) | | | (0.002 | ) |
| | 2012 - Select Shares | | | 1.00 | | | | 0.001 | | | | — | (f) | | | 0.001 | | | | (0.001 | ) | | | — | (f) | | | (0.001 | ) |
| | 2012 - Preferred Shares | | | 1.00 | | | | 0.001 | | | | — | (f) | | | 0.001 | | | | (0.001 | ) | | | — | (f) | | | (0.001 | ) |
| | 2012 - Capital Shares | | | 1.00 | | | | — | (f) | | | — | (f) | | | — | (f) | | | — | (f) | | | — | (f) | | | — | (f) |
| | 2012 - Administration Shares | | | 1.00 | | | | — | (f) | | | — | (f) | | | — | (f) | | | — | (f) | | | — | (f) | | | — | (f) |
| | 2012 - Premier Shares | | | 1.00 | | | | — | (f) | | | — | (f) | | | — | (f) | | | — | (f) | | | — | (f) | | | — | (f) |
| | 2012 - Service Shares | | | 1.00 | | | | — | (f) | | | — | (f) | | | — | (f) | | | — | (f) | | | — | (f) | | | — | (f) |
| | 2012 - Resource Shares | | | 1.00 | | | | — | (f) | | | — | (f) | | | — | (f) | | | — | (f) | | | — | (f) | | | — | (f) |
| | 2012 - Cash Management Shares | | | 1.00 | | | | — | (f) | | | — | (f) | | | — | (f) | | | — | (f) | | | — | (f) | | | — | (f) |
| | (a) | | Calculated based on the average shares outstanding methodology. |
| | (b) | | Distributions may not coincide with the current year net investment income or net realized gains as distributions may be paid from current or prior year earnings. |
| | (c) | | Assumes investment at the net asset value at the beginning of the year, reinvestment of all dividends and distributions, a complete redemption of the investment at the net asset value at the end of the year and no sales or redemption charges. Total returns would be reduced if a sales redemption charge was taken into account. Returns do not reflect the deduction of taxes that a shareholder would pay on Fund distributions or the redemption of Fund shares. Total returns for periods less than one full year are not annualized. |
| | (d) | | Amount is less than $0.00005 per share. |
| | (f) | | Amount is less than $0.0005 per share. |
| | (g) | | Amount is less than 0.005% of average net assets. |
| | |
| 50 | | The accompanying notes are an integral part of these financial statements. |
FINANCIAL SQUARE MONEY MARKET FUND
| | | | | | | | | | | | | | | | | | | | | | | | | | | | | | | | | | |
| | | | | | | | | | | |
| | | Net asset value, end of period | | | | | Total return(c) | | | | | Net assets end of period (in 000s) | | | | | Ratio of net expenses to average net assets | | | | | Ratio of total expenses to average net assets | | | | | Ratio of net investment income (loss) to average net assets | |
| | | | | | | | | | | | | | | | | | | | | | | | | | | | | | | | | | |
| | $ | 1.0002 | | | | | | 0.32 | % | | | | $ | 1,632,055 | | | | | | 0.18 | %(e) | | | | | 0.25 | %(e) | | | | | 0.48 | %(e) |
| | | 1.0002 | | | | | | 0.30 | | | | | | 7,690 | | | | | | 0.21 | (e) | | | | | 0.28 | (e) | | | | | 0.38 | (e) |
| | | 1.0002 | | | | | | 0.27 | | | | | | 64 | | | | | | 0.28 | (e) | | | | | 0.35 | (e) | | | | | 0.30 | (e) |
| | | 1.0002 | | | | | | 0.24 | | | | | | 1 | | | | | | 0.33 | (e) | | | | | 0.40 | (e) | | | | | 0.20 | (e) |
| | | 1.0003 | | | | | | 0.20 | | | | | | 8,663 | | | | | | 0.43 | (e) | | | | | 0.50 | (e) | | | | | 0.17 | (e) |
| | | 1.0002 | | | | | | 0.15 | | | | | | 1 | | | | | | 0.52 | (e) | | | | | 0.60 | (e) | | | | | 0.40 | (e) |
| | | 1.0002 | | | | | | 0.10 | | | | | | 828 | | | | | | 0.58 | (e) | | | | | 0.75 | (e) | | | | | 0.04 | (e) |
| | | 1.0002 | | | | | | 0.06 | | | | | | 1 | | | | | | 0.52 | (e) | | | | | 0.90 | (e) | | | | | 0.40 | (e) |
| | | 1.0002 | | | | | | 0.03 | | | | | | 1 | | | | | | 0.49 | (e) | | | | | 1.05 | (e) | | | | | 0.01 | (e) |
| | | | | | | | | | | | | | | | | | | | | | | | | | | | | | | | | | |
| | | | | | | | | | | | | | | | | | | | | | | | | | | | | | | | | | |
| | | | | | | | | | | | | | | | | | | | | | | | | | | | | | | | | | |
| | | 1.00 | | | | | | 0.32 | | | | | | 15,336,774 | | | | | | 0.18 | | | | | | 0.23 | | | | | | 0.32 | |
| | | 1.00 | | | | | | 0.29 | | | | | | 1,080,075 | | | | | | 0.21 | | | | | | 0.26 | | | | | | 0.29 | |
| | | 1.00 | | | | | | 0.22 | | | | | | 59,053 | | | | | | 0.28 | | | | | | 0.33 | | | | | | 0.20 | |
| | | 1.00 | | | | | | 0.18 | | | | | | 108,671 | | | | | | 0.33 | | | | | | 0.38 | | | | | | 0.18 | |
| | | 1.00 | | | | | | 0.10 | | | | | | 316,162 | | | | | | 0.40 | | | | | | 0.48 | | | | | | 0.09 | |
| | | 1.00 | | | | | | 0.10 | | | | | | 1 | | | | | | 0.19 | | | | | | 0.58 | | | | | | 0.37 | |
| | | 1.00 | | | | | | 0.01 | | | | | | 17,000 | | | | | | 0.49 | | | | | | 0.73 | | | | | | — | (g) |
| | | 1.00 | | | | | | 0.10 | | | | | | 1 | | | | | | 0.19 | | | | | | 0.88 | | | | | | 0.37 | |
| | | 1.00 | | | | | | 0.01 | | | | | | 10,742 | | | | | | 0.51 | | | | | | 1.03 | | | | | | — | (g) |
| | | 1.00 | | | | | | 0.09 | | | | | | 32,746,797 | | | | | | 0.18 | | | | | | 0.23 | | | | | | 0.08 | |
| | | 1.00 | | | | | | 0.06 | | | | | | 1,917,216 | | | | | | 0.21 | | | | | | 0.26 | | | | | | 0.06 | |
| | | 1.00 | | | | | | 0.01 | | | | | | 116,846 | | | | | | 0.26 | | | | | | 0.33 | | | | | | 0.01 | |
| | | 1.00 | | | | | | 0.01 | | | | | | 201,440 | | | | | | 0.27 | | | | | | 0.38 | | | | | | — | (g) |
| | | 1.00 | | | | | | 0.01 | | | | | | 430,947 | | | | | | 0.26 | | | | | | 0.48 | | | | | | — | (g) |
| | | 1.00 | | | | | | 0.01 | | | | | | 1 | | | | | | 0.18 | | | | | | 0.58 | | | | | | 0.40 | |
| | | 1.00 | | | | | | 0.01 | | | | | | 21,066 | | | | | | 0.26 | | | | | | 0.73 | | | | | | — | (g) |
| | | 1.00 | | | | | | 0.01 | | | | | | 1 | | | | | | 0.18 | | | | | | 0.88 | | | | | | 0.40 | |
| | | 1.00 | | | | | | 0.01 | | | | | | 8,041 | | | | | | 0.28 | | | | | | 1.03 | | | | | | — | (g) |
| | | 1.00 | | | | | | 0.06 | | | | | | 26,529,130 | | | | | | 0.18 | | | | | | 0.23 | | | | | | 0.06 | |
| | | 1.00 | | | | | | 0.03 | | | | | | 527,470 | | | | | | 0.21 | | | | | | 0.26 | | | | | | 0.03 | |
| | | 1.00 | | | | | | 0.01 | | | | | | 66,193 | | | | | | 0.24 | | | | | | 0.33 | | | | | | 0.01 | |
| | | 1.00 | | | | | | 0.01 | | | | | | 36,709 | | | | | | 0.24 | | | | | | 0.38 | | | | | | 0.01 | |
| | | 1.00 | | | | | | 0.01 | | | | | | 277,404 | | | | | | 0.24 | | | | | | 0.48 | | | | | | 0.01 | |
| | | 1.00 | | | | | | 0.01 | | | | | | 1 | | | | | | 0.24 | | | | | | 0.58 | | | | | | 0.01 | |
| | | 1.00 | | | | | | 0.01 | | | | | | 20,963 | | | | | | 0.24 | | | | | | 0.73 | | | | | | 0.01 | |
| | | 1.00 | | | | | | 0.01 | | | | | | 1 | | | | | | 0.18 | | | | | | 0.88 | | | | | | 0.40 | |
| | | 1.00 | | | | | | 0.01 | | | | | | 1 | | | | | | 0.18 | | | | | | 1.03 | | | | | | 0.40 | |
| | | 1.00 | | | | | | 0.11 | | | | | | 25,047,026 | | | | | | 0.18 | | | | | | 0.23 | | | | | | 0.11 | |
| | | 1.00 | | | | | | 0.08 | | | | | | 178,080 | | | | | | 0.21 | | | | | | 0.26 | | | | | | 0.08 | |
| | | 1.00 | | | | | | 0.02 | | | | | | 44,177 | | | | | | 0.27 | | | | | | 0.33 | | | | | | 0.02 | |
| | | 1.00 | | | | | | 0.01 | | | | | | 44,542 | | | | | | 0.28 | | | | | | 0.38 | | | | | | — | (g) |
| | | 1.00 | | | | | | 0.01 | | | | | | 338,423 | | | | | | 0.29 | | | | | | 0.48 | | | | | | — | (g) |
| | | 1.00 | | | | | | 0.01 | | | | | | 30,335 | | | | | | 0.28 | | | | | | 0.58 | | | | | | — | (g) |
| | | 1.00 | | | | | | 0.01 | | | | | | 40,544 | | | | | | 0.28 | | | | | | 0.73 | | | | | | — | (g) |
| | | 1.00 | | | | | | 0.01 | | | | | | 1 | | | | | | 0.18 | | | | | | 0.88 | | | | | | 0.40 | |
| | | 1.00 | | | | | | 0.01 | | | | | | 1 | | | | | | 0.18 | | | | | | 1.03 | | | | | | 0.40 | |
| | | 1.00 | | | | | | 0.17 | | | | | | 20,278,527 | | | | | | 0.18 | | | | | | 0.23 | | | | | | 0.17 | |
| | | 1.00 | | | | | | 0.14 | | | | | | 151,931 | | | | | | 0.21 | | | | | | 0.26 | | | | | | 0.14 | |
| | | 1.00 | | | | | | 0.07 | | | | | | 34,142 | | | | | | 0.28 | | | | | | 0.33 | | | | | | 0.07 | |
| | | 1.00 | | | | | | 0.03 | | | | | | 31,393 | | | | | | 0.33 | | | | | | 0.38 | | | | | | 0.02 | |
| | | 1.00 | | | | | | 0.01 | | | | | | 400,478 | | | | | | 0.35 | | | | | | 0.48 | | | | | | 0.01 | |
| | | 1.00 | | | | | | 0.01 | | | | | | 28,554 | | | | | | 0.35 | | | | | | 0.58 | | | | | | 0.01 | |
| | | 1.00 | | | | | | 0.01 | | | | | | 24,931 | | | | | | 0.34 | | | | | | 0.73 | | | | | | 0.01 | |
| | | 1.00 | | | | | | 0.01 | | | | | | 1 | | | | | | 0.18 | | | | | | 0.88 | | | | | | 0.40 | |
| | | 1.00 | | | | | | 0.01 | | | | | | 1 | | | | | | 0.18 | | | | | | 1.03 | | | | | | 0.40 | |
| | |
| The accompanying notes are an integral part of these financial statements. | | 51 |
FINANCIAL SQUARE PRIME OBLIGATIONS FUND
Financial Highlights
Selected Data for a Share Outstanding Throughout Each Period
| | | | | | | | | | | | | | | | | | | | | | | | | | | | | | |
| | | | | | | | From
investment operations | | | Distributions
to shareholders | |
| | | Year - Share Class | | Net asset value, beginning of period | | | Net
investment
income(a) | | | Net realized
and unrealized
gain (loss) | | | Total from
investment
operations | | | From net
investment
income | | | From net
realized
gains | | | Total
distributions(b) | |
| | FOR THE SIX MONTHS ENDED FEBRUARY 28, (UNAUDITED) | | | | | | | | | |
| | 2017 - Institutional Shares | | $ | 1.0000 | | | $ | 0.0025 | | | $ | 0.0008 | | | $ | 0.0033 | | | $ | (0.0030 | ) | | $ | — | (d) | | $ | (0.0030 | ) |
| | 2017 - Select Shares | | | 1.0000 | | | | 0.0020 | | | | 0.0012 | | | | 0.0032 | | | | (0.0029 | ) | | | — | (d) | | | (0.0029 | ) |
| | 2017 - Preferred Shares | | | 1.0000 | | | | 0.0014 | | | | 0.0015 | | | | 0.0029 | | | | (0.0025 | ) | | | — | (d) | | | (0.0025 | ) |
| | 2017 - Capital Shares | | | 1.0000 | | | | 0.0011 | | | | 0.0015 | | | | 0.0026 | | | | (0.0023 | ) | | | — | (d) | | | (0.0023 | ) |
| | 2017 - Administration Shares | | | 1.0000 | | | | 0.0006 | | | | 0.0015 | | | | 0.0021 | | | | (0.0018 | ) | | | — | (d) | | | (0.0018 | ) |
| | 2017 - Premier Shares | | | 1.0000 | | | | 0.0020 | | | | (0.0002 | ) | | | 0.0018 | | | | (0.0014 | ) | | | — | (d) | | | (0.0014 | ) |
| | 2017 - Service Shares | | | 1.0000 | | | | 0.0002 | | | | 0.0008 | | | | 0.0010 | | | | (0.0007 | ) | | | — | (d) | | | (0.0007 | ) |
| | 2017 - Resource Shares | | | 1.0000 | | | | 0.0001 | | | | 0.0006 | | | | 0.0007 | | | | (0.0003 | ) | | | — | (d) | | | (0.0003 | ) |
| | 2017 - Cash Management Shares | | | 1.0000 | | | | 0.0018 | | | | (0.0012 | ) | | | 0.0006 | | | | (0.0002 | ) | | | — | (d) | | | (0.0002 | ) |
| | | | | | | | | | | | | | | | | | | | | | | | | | | | | | |
| | FOR THE FISCAL YEARS ENDED AUGUST 31, | |
| | 2016 - Institutional Shares | | | 1.00 | | | | 0.003 | | | | — | (f) | | | 0.003 | | | | (0.003 | ) | | | — | (f) | | | (0.003 | ) |
| | 2016 - Select Shares | | | 1.00 | | | | 0.003 | | | | — | (f) | | | 0.003 | | | | (0.003 | ) | | | — | (f) | | | (0.003 | ) |
| | 2016 - Preferred Shares | | | 1.00 | | | | 0.002 | | | | — | (f) | | | 0.002 | | | | (0.002 | ) | | | — | (f) | | | (0.002 | ) |
| | 2016 - Capital Shares | | | 1.00 | | | | 0.002 | | | | — | (f) | | | 0.002 | | | | (0.002 | ) | | | — | (f) | | | (0.002 | ) |
| | 2016 - Administration Shares | | | 1.00 | | | | 0.001 | | | | — | (f) | | | 0.001 | | | | (0.001 | ) | | | — | (f) | | | (0.001 | ) |
| | 2016 - Premier Shares | | | 1.00 | | | | 0.001 | | | | — | (f) | | | 0.001 | | | | (0.001 | ) | | | — | (f) | | | (0.001 | ) |
| | 2016 - Service Shares | | | 1.00 | | | | — | (f) | | | — | (f) | | | — | (f) | | | — | (f) | | | — | (f) | | | — | (f) |
| | 2016 - Resource Shares | | | 1.00 | | | | — | (f) | | | — | (f) | | | — | (f) | | | — | (f) | | | — | (f) | | | — | (f) |
| | 2016 - Cash Management Shares | | | 1.00 | | | | 0.001 | | | | — | (f) | | | 0.001 | | | | (0.001 | ) | | | — | (f) | | | (0.001 | ) |
| | 2015 - Institutional Shares | | | 1.00 | | | | — | (f) | | | — | (f) | | | — | (f) | | | — | (f) | | | — | (f) | | | — | (f) |
| | 2015 - Select Shares | | | 1.00 | | | | — | (f) | | | — | (f) | | | — | (f) | | | — | (f) | | | — | (f) | | | — | (f) |
| | 2015 - Preferred Shares | | | 1.00 | | | | — | (f) | | | — | (f) | | | — | (f) | | | — | (f) | | | — | (f) | | | — | (f) |
| | 2015 - Capital Shares | | | 1.00 | | | | — | (f) | | | — | (f) | | | — | (f) | | | — | (f) | | | — | (f) | | | — | (f) |
| | 2015 - Administration Shares | | | 1.00 | | | | — | (f) | | | — | (f) | | | — | (f) | | | — | (f) | | | — | (f) | | | — | (f) |
| | 2015 - Premier Shares | | | 1.00 | | | | — | (f) | | | — | (f) | | | — | (f) | | | — | (f) | | | — | (f) | | | — | (f) |
| | 2015 - Service Shares | | | 1.00 | | | | — | (f) | | | — | (f) | | | — | (f) | | | — | (f) | | | — | (f) | | | — | (f) |
| | 2015 - Resource Shares | | | 1.00 | | | | — | (f) | | | — | (f) | | | — | (f) | | | — | (f) | | | — | (f) | | | — | (f) |
| | 2015 - Cash Management Shares | | | 1.00 | | | | — | (f) | | | — | (f) | | | — | (f) | | | — | (f) | | | — | (f) | | | — | (f) |
| | 2014 - Institutional Shares | | | 1.00 | | | | — | (f) | | | — | (f) | | | — | (f) | | | — | (f) | | | — | (f) | | | — | (f) |
| | 2014 - Select Shares | | | 1.00 | | | | — | (f) | | | — | (f) | | | — | (f) | | | — | (f) | | | — | (f) | | | — | (f) |
| | 2014 - Preferred Shares | | | 1.00 | | | | — | (f) | | | — | (f) | | | — | (f) | | | — | (f) | | | — | (f) | | | — | (f) |
| | 2014 - Capital Shares | | | 1.00 | | | | — | (f) | | | — | (f) | | | — | (f) | | | — | (f) | | | — | (f) | | | — | (f) |
| | 2014 - Administration Shares | | | 1.00 | | | | — | (f) | | | — | (f) | | | — | (f) | | | — | (f) | | | — | (f) | | | — | (f) |
| | 2014 - Premier Shares | | | 1.00 | | | | — | (f) | | | — | (f) | | | — | (f) | | | — | (f) | | | — | (f) | | | — | (f) |
| | 2014 - Service Shares | | | 1.00 | | | | — | (f) | | | — | (f) | | | — | (f) | | | — | (f) | | | — | (f) | | | — | (f) |
| | 2014 - Resource Shares | | | 1.00 | | | | — | (f) | | | — | (f) | | | — | (f) | | | — | (f) | | | — | (f) | | | — | (f) |
| | 2014 - Cash Management Shares | | | 1.00 | | | | — | (f) | | | — | (f) | | | — | (f) | | | — | (f) | | | — | (f) | | | — | (f) |
| | 2013 - Institutional Shares | | | 1.00 | | | | 0.001 | | | | — | (f) | | | 0.001 | | | | (0.001 | ) | | | — | (f) | | | (0.001 | ) |
| | 2013 - Select Shares | | | 1.00 | | | | — | (f) | | | — | (f) | | | — | (f) | | | — | (f) | | | — | (f) | | | — | (f) |
| | 2013 - Preferred Shares | | | 1.00 | | | | — | (f) | | | — | (f) | | | — | (f) | | | — | (f) | | | — | (f) | | | — | (f) |
| | 2013 - Capital Shares | | | 1.00 | | | | — | (f) | | | — | (f) | | | — | (f) | | | — | (f) | | | — | (f) | | | — | (f) |
| | 2013 - Administration Shares | | | 1.00 | | | | — | (f) | | | — | (f) | | | — | (f) | | | — | (f) | | | — | (f) | | | — | (f) |
| | 2013 - Premier Shares | | | 1.00 | | | | — | (f) | | | — | (f) | | | — | (f) | | | — | (f) | | | — | (f) | | | — | (f) |
| | 2013 - Service Shares | | | 1.00 | | | | — | (f) | | | — | (f) | | | — | (f) | | | — | (f) | | | — | (f) | | | — | (f) |
| | 2013 - Resource Shares | | | 1.00 | | | | — | (f) | | | — | (f) | | | — | (f) | | | — | (f) | | | — | (f) | | | — | (f) |
| | 2013 - Cash Management Shares | | | 1.00 | | | | — | (f) | | | — | (f) | | | — | (f) | | | — | (f) | | | — | (f) | | | — | (f) |
| | 2012 - Institutional Shares | | | 1.00 | | | | 0.001 | | | | — | (f) | | | 0.001 | | | | (0.001 | ) | | | — | (f) | | | (0.001 | ) |
| | 2012 - Select Shares | | | 1.00 | | | | 0.001 | | | | — | (f) | | | 0.001 | | | | (0.001 | ) | | | — | (f) | | | (0.001 | ) |
| | 2012 - Preferred Shares | | | 1.00 | | | | — | (f) | | | — | (f) | | | — | (f) | | | — | (f) | | | — | (f) | | | — | (f) |
| | 2012 - Capital Shares | | | 1.00 | | | | — | (f) | | | — | (f) | | | — | (f) | | | — | (f) | | | — | (f) | | | — | (f) |
| | 2012 - Administration Shares | | | 1.00 | | | | — | (f) | | | — | (f) | | | — | (f) | | | — | (f) | | | — | (f) | | | — | (f) |
| | 2012 - Premier Shares | | | 1.00 | | | | — | (f) | | | — | (f) | | | — | (f) | | | — | (f) | | | — | (f) | | | — | (f) |
| | 2012 - Service Shares | | | 1.00 | | | | — | (f) | | | — | (f) | | | — | (f) | | | — | (f) | | | — | (f) | | | — | (f) |
| | 2012 - Resource Shares | | | 1.00 | | | | — | (f) | | | — | (f) | | | — | (f) | | | — | (f) | | | — | (f) | | | — | (f) |
| | 2012 - Cash Management Shares | | | 1.00 | | | | — | (f) | | | — | (f) | | | — | (f) | | | — | (f) | | | — | (f) | | | — | (f) |
| | (a) | | Calculated based on the average shares outstanding methodology. |
| | (b) | | Distributions may not coincide with the current year net investment income or net realized gains as distributions may be paid from current or prior year earnings. |
| | (c) | | Assumes investment at the net asset value at the beginning of the year, reinvestment of all dividends and distributions, a complete redemption of the investment at the net asset value at the end of the year and no sales or redemption charges. Total returns would be reduced if a sales redemption charge was taken into account. Returns do not reflect the deduction of taxes that a shareholder would pay on Fund distributions or the redemption of Fund shares. Total returns for periods less than one full year are not annualized. |
| | (d) | | Amount is less than $0.00005 per share. |
| | (f) | | Amount is less than $0.0005 per share. |
| | (g) | | Amount is less than 0.005% of average net assets. |
| | |
| 52 | | The accompanying notes are an integral part of these financial statements. |
FINANCIAL SQUARE PRIME OBLIGATIONS FUND
| | | | | | | | | | | | | | | | | | | | | | | | | | | | | | | | | | |
| | | | | | | | | | | | | | | | | | | | | | | | | | | | | |
| | | Net asset value, end of period | | | | | Total return(c) | | | | | Net assets end of Period (in 000s) | | | | | Ratio of net expenses to average net assets | | | | | Ratio of total expenses to average net assets | | | | | Ratio of net investment income (loss) to average net assets | |
| | | | | | | | | | | | | | | | | | | | | | | | | | | | | | | | | | |
| | $ | 1.0003 | | | | | | 0.33 | % | | | | $ | 818,982 | | | | | | 0.18 | %(e) | | | | | 0.27 | %(e) | | | | | 0.50 | %(e) |
| | | 1.0003 | | | | | | 0.32 | | | | | | 120 | | | | | | 0.21 | (e) | | | | | 0.30 | (e) | | | | | 0.40 | (e) |
| | | 1.0004 | | | | | | 0.29 | | | | | | 775 | | | | | | 0.28 | (e) | | | | | 0.37 | (e) | | | | | 0.29 | (e) |
| | | 1.0003 | | | | | | 0.26 | | | | | | 406 | | | | | | 0.33 | (e) | | | | | 0.42 | (e) | | | | | 0.23 | (e) |
| | | 1.0003 | | | | | | 0.21 | | | | | | 3,840 | | | | | | 0.43 | (e) | | | | | 0.52 | (e) | | | | | 0.13 | (e) |
| | | 1.0004 | | | | | | 0.18 | | | | | | 1 | | | | | | 0.52 | (e) | | | | | 0.62 | (e) | | | | | 0.40 | (e) |
| | | 1.0003 | | | | | | 0.10 | | | | | | 607 | | | | | | 0.59 | (e) | | | | | 0.77 | (e) | | | | | 0.03 | (e) |
| | | 1.0004 | | | | | | 0.07 | | | | | | 1 | | | | | | 0.52 | (e) | | | | | 0.92 | (e) | | | | | 0.02 | (e) |
| | | 1.0004 | | | | | | 0.06 | | | | | | 1 | | | | | | 0.55 | (e) | | | | | 1.07 | (e) | | | | | 0.37 | (e) |
| | | | | | | | | | | | | | | | | | | | | | | | | | | | | | | | | | |
| | | | | | | | | | | | | | | | | | | | | | | | | | | | | | | | | | |
| | | 1.00 | | | | | | 0.29 | | | | | | 7,299,656 | | | | | | 0.18 | | | | | | 0.23 | | | | | | 0.31 | |
| | | 1.00 | | | | | | 0.26 | | | | | | 9,454 | | | | | | 0.21 | | | | | | 0.26 | | | | | | 0.29 | |
| | | 1.00 | | | | | | 0.20 | | | | | | 279,445 | | | | | | 0.28 | | | | | | 0.33 | | | | | | 0.19 | |
| | | 1.00 | | | | | | 0.16 | | | | | | 140,138 | | | | | | 0.31 | | | | | | 0.38 | | | | | | 0.16 | |
| | | 1.00 | | | | | | 0.09 | | | | | | 1,250,848 | | | | | | 0.38 | | | | | | 0.48 | | | | | | 0.09 | |
| | | 1.00 | | | | | | 0.09 | | | | | | 1 | | | | | | 0.18 | | | | | | 0.58 | | | | | | 0.36 | |
| | | 1.00 | | | | | | 0.01 | | | | | | 253,231 | | | | | | 0.42 | | | | | | 0.73 | | | | | | — | (g) |
| | | 1.00 | | | | | | 0.01 | | | | | | 71,804 | | | | | | 0.46 | | | | | | 0.88 | | | | | | 0.01 | |
| | | 1.00 | | | | | | 0.09 | | | | | | 1 | | | | | | 0.18 | | | | | | 1.03 | | | | | | 0.37 | |
| | | 1.00 | | | | | | 0.03 | | | | | | 9,211,383 | | | | | | 0.18 | | | | | | 0.23 | | | | | | 0.03 | |
| | | 1.00 | | | | | | 0.01 | | | | | | 88,996 | | | | | | 0.20 | | | | | | 0.26 | | | | | | 0.01 | |
| | | 1.00 | | | | | | 0.01 | | | | | | 332,798 | | | | | | 0.21 | | | | | | 0.33 | | | | | | 0.01 | |
| | | 1.00 | | | | | | 0.01 | | | | | | 103,978 | | | | | | 0.21 | | | | | | 0.38 | | | | | | 0.01 | |
| | | 1.00 | | | | | | 0.01 | | | | | | 1,893,461 | | | | | | 0.20 | | | | | | 0.48 | | | | | | 0.01 | |
| | | 1.00 | | | | | | 0.01 | | | | | | 1 | | | | | | 0.18 | | | | | | 0.58 | | | | | | 0.40 | |
| | | 1.00 | | | | | | 0.01 | | | | | | 777,357 | | | | | | 0.20 | | | | | | 0.73 | | | | | | 0.01 | |
| | | 1.00 | | | | | | 0.01 | | | | | | 72,031 | | | | | | 0.20 | | | | | | 0.88 | | | | | | 0.01 | |
| | | 1.00 | | | | | | 0.01 | | | | | | 1 | | | | | | 0.18 | | | | | | 1.03 | | | | | | 0.40 | |
| | | 1.00 | | | | | | 0.02 | | | | | | 10,934,044 | | | | | | 0.18 | | | | | | 0.23 | | | | | | 0.02 | |
| | | 1.00 | | | | | | 0.01 | | | | | | 118,994 | | | | | | 0.19 | | | | | | 0.26 | | | | | | 0.01 | |
| | | 1.00 | | | | | | 0.01 | | | | | | 108,264 | | | | | | 0.19 | | | | | | 0.33 | | | | | | 0.01 | |
| | | 1.00 | | | | | | 0.01 | | | | | | 72,327 | | | | | | 0.19 | | | | | | 0.38 | | | | | | 0.01 | |
| | | 1.00 | | | | | | 0.01 | | | | | | 1,644,425 | | | | | | 0.19 | | | | | | 0.48 | | | | | | 0.01 | |
| | | 1.00 | | | | | | 0.01 | | | | | | 1 | | | | | | 0.18 | | | | | | 0.58 | | | | | | 0.40 | |
| | | 1.00 | | | | | | 0.01 | | | | | | 938,791 | | | | | | 0.19 | | | | | | 0.73 | | | | | | 0.01 | |
| | | 1.00 | | | | | | 0.01 | | | | | | 78,532 | | | | | | 0.19 | | | | | | 0.88 | | | | | | 0.01 | |
| | | 1.00 | | | | | | 0.01 | | | | | | 1 | | | | | | 0.18 | | | | | | 1.03 | | | | | | 0.40 | |
| | | 1.00 | | | | | | 0.07 | | | | | | 13,339,031 | | | | | | 0.18 | | | | | | 0.23 | | | | | | 0.07 | |
| | | 1.00 | | | | | | 0.05 | | | | | | 212,468 | | | | | | 0.21 | | | | | | 0.26 | | | | | | 0.04 | |
| | | 1.00 | | | | | | 0.01 | | | | | | 227,037 | | | | | | 0.24 | | | | | | 0.33 | | | | | | — | (g) |
| | | 1.00 | | | | | | 0.01 | | | | | | 102,509 | | | | | | 0.26 | | | | | | 0.38 | | | | | | — | (g) |
| | | 1.00 | | | | | | 0.01 | | | | | | 2,579,850 | | | | | | 0.24 | | | | | | 0.48 | | | | | | — | (g) |
| | | 1.00 | | | | | | 0.01 | | | | | | 1 | | | | | | 0.18 | | | | | | 0.58 | | | | | | 0.40 | |
| | | 1.00 | | | | | | 0.01 | | | | | | 767,593 | | | | | | 0.24 | | | | | | 0.73 | | | | | | — | (g) |
| | | 1.00 | | | | | | 0.01 | | | | | | 91,805 | | | | | | 0.25 | | | | | | 0.88 | | | | | | — | (g) |
| | | 1.00 | | | | | | 0.01 | | | | | | 1 | | | | | | 0.18 | | | | | | 1.03 | | | | | | 0.40 | |
| | | 1.00 | | | | | | 0.12 | | | | | | 14,614,135 | | | | | | 0.18 | | | | | | 0.23 | | | | | | 0.11 | |
| | | 1.00 | | | | | | 0.09 | | | | | | 325,596 | | | | | | 0.21 | | | | | | 0.26 | | | | | | 0.09 | |
| | | 1.00 | | | | | | 0.02 | | | | | | 206,707 | | | | | | 0.27 | | | | | | 0.33 | | | | | | 0.02 | |
| | | 1.00 | | | | | | 0.01 | | | | | | 187,844 | | | | | | 0.29 | | | | | | 0.38 | | | | | | — | (g) |
| | | 1.00 | | | | | | 0.01 | | | | | | 1,888,821 | | | | | | 0.29 | | | | | | 0.48 | | | | | | — | (g) |
| | | 1.00 | | | | | | 0.01 | | | | | | 1 | | | | | | 0.18 | | | | | | 0.58 | | | | | | 0.40 | |
| | | 1.00 | | | | | | 0.01 | | | | | | 764,803 | | | | | | 0.29 | | | | | | 0.73 | | | | | | — | (g) |
| | | 1.00 | | | | | | 0.01 | | | | | | 139,778 | | | | | | 0.29 | | | | | | 0.88 | | | | | | — | (g) |
| | | 1.00 | | | | | | 0.01 | | | | | | 1 | | | | | | 0.18 | | | | | | 1.03 | | | | | | 0.40 | |
| | |
| The accompanying notes are an integral part of these financial statements. | | 53 |
FINANCIAL SQUARE TAX-EXEMPT MONEY MARKET FUND
Financial Highlights
Selected Data for a Share Outstanding Throughout Each Period
| | | | | | | | | | | | | | | | | | | | | | | | | | | | | | |
| | | | | | | | From
investment operations | | | Distributions
to shareholders | |
| | | Year - Share Class | | Net asset value, beginning of period | | | Net
investment
income(a) | | | Net realized
and unrealized
gain (loss) | | | Total from
investment
operations | | | From net
investment
income | | | From net
realized
gains | | | Total
distributions(b) | |
| | FOR THE SIX MONTHS ENDED FEBRUARY 28, (UNAUDITED) | |
| | 2017 - Institutional Shares | | $ | 1.0000 | | | $ | 0.0023 | | | $ | 0.0001 | | | $ | 0.0024 | | | $ | (0.0023 | ) | | $ | — | (d) | | $ | (0.0023 | ) |
| | 2017 - Select Shares | | | 1.0000 | | | | 0.0021 | | | | 0.0001 | | | | 0.0022 | | | | (0.0021 | ) | | | — | (d) | | | (0.0021 | ) |
| | 2017 - Preferred Shares | | | 1.0000 | | | | 0.0017 | | | | 0.0002 | | | | 0.0019 | | | | (0.0018 | ) | | | — | (d) | | | (0.0018 | ) |
| | 2017 - Capital Shares | | | 1.0000 | | | | 0.0016 | | | | — | (d) | | | 0.0016 | | | | (0.0015 | ) | | | — | (d) | | | (0.0015 | ) |
| | 2017 - Administration Shares | | | 1.0000 | | | | 0.0010 | | | | 0.0001 | | | | 0.0011 | | | | (0.0010 | ) | | | — | (d) | | | (0.0010 | ) |
| | 2017 - Service Shares | | | 1.0000 | | | | 0.0002 | | | | — | (d) | | | 0.0002 | | | | (0.0001 | ) | | | — | (d) | | | (0.0001 | ) |
| | 2017 - Resource Shares | | | 1.0000 | | | | 0.0002 | | | | (0.0001 | ) | | | 0.0001 | | | | (0.0001 | ) | | | — | (d) | | | (0.0001 | ) |
| | | | | | | | | | | | | | | | | | | | | | | | | | | | | | |
| | FOR THE PERIOD ENDED AUGUST 31,* | |
| | 2016 - Institutional Shares | | | 1.00 | | | | 0.001 | | | | — | (f) | | | 0.001 | | | | (0.001 | ) | | | — | (f) | | | (0.001 | ) |
| | 2016 - Select Shares | | | 1.00 | | | | 0.001 | | | | — | (f) | | | 0.001 | | | | (0.001 | ) | | | — | (f) | | | (0.001 | ) |
| | 2016 - Preferred Shares | | | 1.00 | | | | — | (f) | | | — | (f) | | | — | (f) | | | — | (f) | | | — | (f) | | | — | (f) |
| | 2016 - Capital Shares | | | 1.00 | | | | — | (f) | | | — | (f) | | | — | (f) | | | — | (f) | | | — | (f) | | | — | (f) |
| | 2016 - Administration Shares | | | 1.00 | | | | — | (f) | | | — | (f) | | | — | (f) | | | — | (f) | | | — | (f) | | | — | (f) |
| | 2016 - Service Shares | | | 1.00 | | | | — | (f) | | | — | (f) | | | — | (f) | | | — | (f) | | | — | (f) | | | — | (f) |
| | 2016 - Resource Shares | | | 1.00 | | | | — | (f) | | | — | (f) | | | — | (f) | | | — | (f) | | | — | (f) | | | — | (f) |
| | * | | Commenced operations on March 31, 2016. |
| | (a) | | Calculated based on the average shares outstanding methodology. |
| | (b) | | Distributions may not coincide with the current year net investment income or net realized gains as distributions may be paid from current or prior year earnings. |
| | (c) | | Assumes investment at the net asset value at the beginning of the year, reinvestment of all dividends and distributions, a complete redemption of the investment at the net asset value at the end of the year and no sales or redemption charges. Total returns would be reduced if a sales redemption charge was taken into account. Returns do not reflect the deduction of taxes that a shareholder would pay on Fund distributions or the redemption of Fund shares. Total returns for periods less than one full year are not annualized. |
| | (d) | | Amount is less than $0.00005 per share. |
| | (f) | | Amount is less than $0.0005 per share. |
| | |
| 54 | | The accompanying notes are an integral part of these financial statements. |
FINANCIAL SQUARE TAX-EXEMPT MONEY MARKET FUND
| | | | | | | | | | | | | | | | | | | | | | | | | | | | | | | | | | |
| | | | | | | | | | | | | | | | | | | | | | | | | | | | | |
| | | Net asset value, end of period | | | | | Total return(c) | | | | | Net assets end of period (in 000s) | | | | | Ratio of net expenses to average net assets | | | | | Ratio of total expenses to average net assets | | | | | Ratio of net investment income (loss) to average net assets | |
| | | | | | | | | | | | | | | | | | | | | | | | | | | | | | | | | | |
| | $ | 1.0001 | | | | | | 0.24 | % | | | | $ | 6,924 | | | | | | 0.18 | %(e) | | | | | 10.16 | %(e) | | | | | 0.46 | %(e) |
| | | 1.0001 | | | | | | 0.22 | | | | | | 10 | | | | | | 0.22 | (e) | | | | | 10.19 | (e) | | | | | 0.42 | (e) |
| | | 1.0001 | | | | | | 0.19 | | | | | | 10 | | | | | | 0.29 | (e) | | | | | 10.26 | (e) | | | | | 0.35 | (e) |
| | | 1.0001 | | | | | | 0.16 | | | | | | 10 | | | | | | 0.33 | (e) | | | | | 10.31 | (e) | | | | | 0.31 | (e) |
| | | 1.0001 | | | | | | 0.11 | | | | | | 10 | | | | | | 0.44 | (e) | | | | | 10.41 | (e) | | | | | 0.20 | (e) |
| | | 1.0001 | | | | | | 0.02 | | | | | | 10 | | | | | | 0.60 | (e) | | | | | 10.66 | (e) | | | | | 0.04 | (e) |
| | | 1.0000 | | | | | | 0.01 | | | | | | 10 | | | | | | 0.60 | (e) | | | | | 10.81 | (e) | | | | | 0.04 | (e) |
| | | | | | | | | | | | | | | | | | | | | | | | | | | | | | | | | | |
| | | | | | | | | | | | | | | | | | | | | | | | | | | | | | | | | | |
| | | 1.00 | | | | | | 0.09 | | | | | | 12,495 | | | | | | 0.18 | (e) | | | | | 9.48 | (e) | | | | | 0.23 | (e) |
| | | 1.00 | | | | | | 0.07 | | | | | | 10 | | | | | | 0.22 | (e) | | | | | 9.51 | (e) | | | | | 0.17 | (e) |
| | | 1.00 | | | | | | 0.04 | | | | | | 10 | | | | | | 0.29 | (e) | | | | | 9.58 | (e) | | | | | 0.10 | (e) |
| | | 1.00 | | | | | | 0.03 | | | | | | 10 | | | | | | 0.32 | (e) | | | | | 9.63 | (e) | | | | | 0.07 | (e) |
| | | 1.00 | | | | | | 0.02 | | | | | | 10 | | | | | | 0.34 | (e) | | | | | 9.73 | (e) | | | | | 0.04 | (e) |
| | | 1.00 | | | | | | 0.02 | | | | | | 10 | | | | | | 0.35 | (e) | | | | | 9.98 | (e) | | | | | 0.04 | (e) |
| | | 1.00 | | | | | | 0.02 | | | | | | 10 | | | | | | 0.35 | (e) | | | | | 10.13 | (e) | | | | | 0.04 | (e) |
| | |
| The accompanying notes are an integral part of these financial statements. | | 55 |
FINANCIAL SQUARE TREASURY INSTRUMENTS FUND
Financial Highlights
Selected Data for a Share Outstanding Throughout Each Period
| | | | | | | | | | | | | | | | | | | | | | | | | | | | | | |
| | | | | | | | From
investment operations | | | Distributions
to shareholders | |
| | | Year - Share Class | | Net asset value, beginning of period | | | Net
investment
income(a) | | | Net realized
and unrealized
gain (loss) | | | Total from
investment
operations | | | From net
investment
income | | | From net
realized
gains | | | Total
distributions(b) | |
| | FOR THE SIX MONTHS ENDED FEBRUARY 28, (UNAUDITED) | |
| | 2017 - Institutional Shares | | $ | 1.00 | | | $ | 0.001 | | | $ | — | (d) | | $ | 0.001 | | | $ | (0.001 | ) | | $ | — | (d) | | $ | (0.001 | ) |
| | 2017 - Select Shares | | | 1.00 | | | | 0.001 | | | | — | (d) | | | 0.001 | | | | (0.001 | ) | | | — | (d) | | | (0.001 | ) |
| | 2017 - Preferred Shares | | | 1.00 | | | | 0.001 | | | | — | (d) | | | 0.001 | | | | (0.001 | ) | | | — | (d) | | | (0.001 | ) |
| | 2017 - Capital Shares | | | 1.00 | | | | 0.001 | | | | — | (d) | | | 0.001 | | | | (0.001 | ) | | | — | (d) | | | (0.001 | ) |
| | 2017 - Administration Shares | | | 1.00 | | | | — | (d) | | | — | (d) | | | — | (d) | | | — | (d) | | | — | (d) | | | — | (d) |
| | 2017 - Premier Shares | | | 1.00 | | | | — | (d) | | | — | (d) | | | — | (d) | | | — | (d) | | | — | (d) | | | — | (d) |
| | 2017 - Service Shares | | | 1.00 | | | | — | (d) | | | — | (d) | | | — | (d) | | | — | (d) | | | — | (d) | | | — | (d) |
| | 2017 - Resource Shares | | | 1.00 | | | | 0.002 | | | | (0.002 | ) | | | — | (d) | | | — | (d) | | | — | (d) | | | — | (d) |
| | 2017 - Cash Management Shares | | | 1.00 | | | | — | (d) | | | — | (d) | | | — | (d) | | | — | (d) | | | — | (d) | | | — | (d) |
| | | | | | | | | | | | | | | | | | | | | | | | | | | | | | |
| | FOR THE FISCAL YEARS ENDED AUGUST 31, | |
| | 2016 - Institutional Shares | | | 1.00 | | | | 0.001 | | | | — | (d) | | | 0.001 | | | | (0.001 | ) | | | — | (d) | | | (0.001 | ) |
| | 2016 - Select Shares | | | 1.00 | | | | 0.001 | | | | — | (d) | | | 0.001 | | | | (0.001 | ) | | | — | (d) | | | (0.001 | ) |
| | 2016 - Preferred Shares | | | 1.00 | | | | 0.001 | | | | — | (d) | | | 0.001 | | | | (0.001 | ) | | | — | (d) | | | (0.001 | ) |
| | 2016 - Capital Shares | | | 1.00 | | | | — | (d) | | | — | (d) | | | — | (d) | | | — | (d) | | | — | (d) | | | — | (d) |
| | 2016 - Administration Shares | | | 1.00 | | | | — | (d) | | | — | (d) | | | — | (d) | | | — | (d) | | | — | (d) | | | — | (d) |
| | 2016 - Premier Shares | | | 1.00 | | | | — | (d) | | | — | (d) | | | — | (d) | | | — | (d) | | | — | (d) | | | — | (d) |
| | 2016 - Service Shares | | | 1.00 | | | | — | (d) | | | — | (d) | | | — | (d) | | | — | (d) | | | — | (d) | | | — | (d) |
| | 2016 - Resource Shares | | | 1.00 | | | | — | (d) | | | — | (d) | | | — | (d) | | | — | (d) | | | — | (d) | | | — | (d) |
| | 2016 - Cash Management Shares | | | 1.00 | | | | — | (d) | | | — | (d) | | | — | (d) | | | — | (d) | | | — | (d) | | | — | (d) |
| | 2015 - Institutional Shares | | | 1.00 | | | | — | (d) | | | — | (d) | | | — | (d) | | | — | (d) | | | — | (d) | | | — | (d) |
| | 2015 - Select Shares | | | 1.00 | | | | — | (d) | | | — | (d) | | | — | (d) | | | — | (d) | | | — | (d) | | | — | (d) |
| | 2015 - Preferred Shares | | | 1.00 | | | | — | (d) | | | — | (d) | | | — | (d) | | | — | (d) | | | — | (d) | | | — | (d) |
| | 2015 - Capital Shares | | | 1.00 | | | | — | (d) | | | — | (d) | | | — | (d) | | | — | (d) | | | — | (d) | | | — | (d) |
| | 2015 - Administration Shares | | | 1.00 | | | | — | (d) | | | — | (d) | | | — | (d) | | | — | (d) | | | — | (d) | | | — | (d) |
| | 2015 - Premier Shares | | | 1.00 | | | | — | (d) | | | — | (d) | | | — | (d) | | | — | (d) | | | — | (d) | | | — | (d) |
| | 2015 - Service Shares | | | 1.00 | | | | — | (d) | | | — | (d) | | | — | (d) | | | — | (d) | | | — | (d) | | | — | (d) |
| | 2015 - Resource Shares | | | 1.00 | | | | — | (d) | | | — | (d) | | | — | (d) | | | — | (d) | | | — | (d) | | | — | (d) |
| | 2015 - Cash Management Shares | | | 1.00 | | | | — | (d) | | | — | (d) | | | — | (d) | | | — | (d) | | | — | (d) | | | — | (d) |
| | 2014 - Institutional Shares | | | 1.00 | | | | — | (d) | | | — | (d) | | | — | (d) | | | — | (d) | | | — | (d) | | | — | (d) |
| | 2014 - Select Shares | | | 1.00 | | | | — | (d) | | | — | (d) | | | — | (d) | | | — | (d) | | | — | (d) | | | — | (d) |
| | 2014 - Preferred Shares | | | 1.00 | | | | — | (d) | | | — | (d) | | | — | (d) | | | — | (d) | | | — | (d) | | | — | (d) |
| | 2014 - Capital Shares | | | 1.00 | | | | — | (d) | | | — | (d) | | | — | (d) | | | — | (d) | | | — | (d) | | | — | (d) |
| | 2014 - Administration Shares | | | 1.00 | | | | — | (d) | | | — | (d) | | | — | (d) | | | — | (d) | | | — | (d) | | | — | (d) |
| | 2014 - Premier Shares | | | 1.00 | | | | — | (d) | | | — | (d) | | | — | (d) | | | — | (d) | | | — | (d) | | | — | (d) |
| | 2014 - Service Shares | | | 1.00 | | | | — | (d) | | | — | (d) | | | — | (d) | | | — | (d) | | | — | (d) | | | — | (d) |
| | 2014 - Resource Shares | | | 1.00 | | | | — | (d) | | | — | (d) | | | — | (d) | | | — | (d) | | | — | (d) | | | — | (d) |
| | 2014 - Cash Management Shares | | | 1.00 | | | | — | (d) | | | — | (d) | | | — | (d) | | | — | (d) | | | — | (d) | | | — | (d) |
| | 2013 - Institutional Shares | | | 1.00 | | | | — | (d) | | | — | (d) | | | — | (d) | | | — | (d) | | | — | (d) | | | — | (d) |
| | 2013 - Select Shares | | | 1.00 | | | | — | (d) | | | — | (d) | | | — | (d) | | | — | (d) | | | — | (d) | | | — | (d) |
| | 2013 - Preferred Shares | | | 1.00 | | | | — | (d) | | | — | (d) | | | — | (d) | | | — | (d) | | | — | (d) | | | — | (d) |
| | 2013 - Capital Shares | | | 1.00 | | | | — | (d) | | | — | (d) | | | — | (d) | | | — | (d) | | | — | (d) | | | — | (d) |
| | 2013 - Administration Shares | | | 1.00 | | | | — | (d) | | | — | (d) | | | — | (d) | | | — | (d) | | | — | (d) | | | — | (d) |
| | 2013 - Premier Shares | | | 1.00 | | | | — | (d) | | | — | (d) | | | — | (d) | | | — | (d) | | | — | (d) | | | — | (d) |
| | 2013 - Service Shares | | | 1.00 | | | | — | (d) | | | — | (d) | | | — | (d) | | | — | (d) | | | — | (d) | | | — | (d) |
| | 2013 - Resource Shares | | | 1.00 | | | | — | (d) | | | — | (d) | | | — | (d) | | | — | (d) | | | — | (d) | | | — | (d) |
| | 2013 - Cash Management Shares | | | 1.00 | | | | — | (d) | | | — | (d) | | | — | (d) | | | — | (d) | | | — | (d) | | | — | (d) |
| | 2012 - Institutional Shares | | | 1.00 | | | | — | (d) | | | — | (d) | | | — | (d) | | | — | (d) | | | — | (d) | | | — | (d) |
| | 2012 - Select Shares | | | 1.00 | | | | — | (d) | | | — | (d) | | | — | (d) | | | — | (d) | | | — | (d) | | | — | (d) |
| | 2012 - Preferred Shares | | | 1.00 | | | | — | (d) | | | — | (d) | | | — | (d) | | | — | (d) | | | — | (d) | | | — | (d) |
| | 2012 - Capital Shares | | | 1.00 | | | | — | (d) | | | — | (d) | | | — | (d) | | | — | (d) | | | — | (d) | | | — | (d) |
| | 2012 - Administration Shares | | | 1.00 | | | | — | (d) | | | — | (d) | | | — | (d) | | | — | (d) | | | — | (d) | | | — | (d) |
| | 2012 - Premier Shares | | | 1.00 | | | | — | (d) | | | — | (d) | | | — | (d) | | | — | (d) | | | — | (d) | | | — | (d) |
| | 2012 - Service Shares | | | 1.00 | | | | — | (d) | | | — | (d) | | | — | (d) | | | — | (d) | | | — | (d) | | | — | (d) |
| | 2012 - Resource Shares | | | 1.00 | | | | — | (d) | | | — | (d) | | | — | (d) | | | — | (d) | | | — | (d) | | | — | (d) |
| | 2012 - Cash Management Shares | | | 1.00 | | | | — | (d) | | | — | (d) | | | — | (d) | | | — | (d) | | | — | (d) | | | — | (d) |
| | (a) | | Calculated based on the average shares outstanding methodology. |
| | (b) | | Distributions may not coincide with the current year net investment income or net realized gains as distributions may be paid from current or prior year earnings. |
| | (c) | | Assumes reinvestment of all distributions. Returns do not reflect the deduction of taxes that a shareholder would pay on Fund distributions. Total returns for periods less than one full year are not annualized. |
| | (d) | | Amount is less than $0.0005 per share. |
| | (f) | | Amount is less than 0.005%. |
| | (g) | | Amount is less than 0.005% of average net assets. |
| | |
| 56 | | The accompanying notes are an integral part of these financial statements. |
FINANCIAL SQUARE TREASURY INSTRUMENTS FUND
| | | | | | | | | | | | | | | | | | | | | | | | | | | | | | | | | | |
| | | | | | | | | | | |
| | | Net asset value, end of period | | | | | Total return(c) | | | | | Net assets end of period (in 000s) | | | | | Ratio of net expenses to average net assets | | | | | Ratio of total expenses to average net assets | | | | | Ratio of net investment income (loss) to average net assets | |
| | | | | | | | | | | | | | | | | | | | | | | | | | | | | | | | | | |
| | $ | 1.00 | | | | | | 0.14 | % | | | | $ | 44,803,675 | | | | | | 0.20 | %(e) | | | | | 0.23 | %(e) | | | | | 0.27 | %(e) |
| | | 1.00 | | | | | | 0.12 | | | | | | 58,967 | | | | | | 0.23 | (e) | | | | | 0.26 | (e) | | | | | 0.24 | (e) |
| | | 1.00 | | | | | | 0.09 | | | | | | 58,595 | | | | | | 0.30 | (e) | | | | | 0.33 | (e) | | | | | 0.19 | (e) |
| | | 1.00 | | | | | | 0.06 | | | | | | 582,415 | | | | | | 0.35 | (e) | | | | | 0.38 | (e) | | | | | 0.12 | (e) |
| | | 1.00 | | | | | | 0.03 | | | | | | 2,013,164 | | | | | | 0.42 | (e) | | | | | 0.48 | (e) | | | | | 0.04 | (e) |
| | | 1.00 | | | | | | — | (f) | | | | | 29,727 | | | | | | 0.45 | (e) | | | | | 0.58 | (e) | | | | | — | (e)(g) |
| | | 1.00 | | | | | | — | (f) | | | | | 79,506 | | | | | | 0.47 | (e) | | | | | 0.73 | (e) | | | | | (0.01 | )(e) |
| | | 1.00 | | | | | | — | (f) | | | | | 1 | | | | | | 0.20 | (e) | | | | | 0.88 | (e) | | | | | 0.37 | (e) |
| | | 1.00 | | | | | | — | (f) | | | | | 241 | | | | | | 0.48 | (e) | | | | | 1.03 | (e) | | | | | (0.01 | )(e) |
| | | | | | | | | | | | | | | | | | | | | | | | | | | | | | | | | | |
| | | | | | | | | | | | | | | | | | | | | | | | | | | | | | | | | | |
| | | 1.00 | | | | | | 0.13 | | | | | | 50,595,412 | | | | | | 0.19 | | | | | | 0.23 | | | | | | 0.14 | |
| | | 1.00 | | | | | | 0.11 | | | | | | 21,009 | | | | | | 0.21 | | | | | | 0.26 | | | | | | 0.07 | |
| | | 1.00 | | | | | | 0.06 | | | | | | 12,735 | | | | | | 0.26 | | | | | | 0.33 | | | | | | 0.05 | |
| | | 1.00 | | | | | | 0.03 | | | | | | 495,853 | | | | | | 0.30 | | | | | | 0.38 | | | | | | 0.02 | |
| | | 1.00 | | | | | | — | (f) | | | | | 2,186,426 | | | | | | 0.32 | | | | | | 0.48 | | | | | | (0.01 | ) |
| | | 1.00 | | | | | | — | (f) | | | | | 19,142 | | | | | | 0.38 | | | | | | 0.58 | | | | | | (0.02 | ) |
| | | 1.00 | | | | | | — | (f) | | | | | 91,598 | | | | | | 0.29 | | | | | | 0.73 | | | | | | (0.01 | ) |
| | | 1.00 | | | | | | — | (f) | | | | | 1 | | | | | | 0.19 | | | | | | 0.88 | | | | | | 0.37 | |
| | | 1.00 | | | | | | — | (f) | | | | | 279 | | | | | | 0.35 | | | | | | 1.03 | | | | | | 0.05 | |
| | | 1.00 | | | | | | — | (f) | | | | | 34,094,054 | | | | | | 0.06 | | | | | | 0.23 | | | | | | — | (g) |
| | | 1.00 | | | | | | — | (f) | | | | | 80,008 | | | | | | 0.06 | | | | | | 0.26 | | | | | | — | (g) |
| | | 1.00 | | | | | | — | (f) | | | | | 33,032 | | | | | | 0.06 | | | | | | 0.33 | | | | | | — | (g) |
| | | 1.00 | | | | | | — | (f) | | | | | 353,326 | | | | | | 0.06 | | | | | | 0.38 | | | | | | — | (g) |
| | | 1.00 | | | | | | — | (f) | | | | | 2,101,757 | | | | | | 0.06 | | | | | | 0.48 | | | | | | — | (g) |
| | | 1.00 | | | | | | — | (f) | | | | | 54 | | | | | | 0.06 | | | | | | 0.58 | | | | | | — | (g) |
| | | 1.00 | | | | | | — | (f) | | | | | 197,083 | | | | | | 0.06 | | | | | | 0.73 | | | | | | — | (g) |
| | | 1.00 | | | | | | — | (f) | | | | | 1 | | | | | | 0.06 | | | | | | 0.88 | | | | | | 0.40 | |
| | | 1.00 | | | | | | — | (f) | | | | | 1 | | | | | | 0.06 | | | | | | 1.03 | | | | | | 0.40 | |
| | | 1.00 | | | | | | — | (f) | | | | | 31,170,061 | | | | | | 0.07 | | | | | | 0.23 | | | | | | — | (g) |
| | | 1.00 | | | | | | — | (f) | | | | | 192,930 | | | | | | 0.07 | | | | | | 0.26 | | | | | | — | (g) |
| | | 1.00 | | | | | | — | (f) | | | | | 43,335 | | | | | | 0.07 | | | | | | 0.33 | | | | | | — | (g) |
| | | 1.00 | | | | | | — | (f) | | | | | 163,450 | | | | | | 0.07 | | | | | | 0.38 | | | | | | — | (g) |
| | | 1.00 | | | | | | — | (f) | | | | | 1,231,641 | | | | | | 0.07 | | | | | | 0.48 | | | | | | — | (g) |
| | | 1.00 | | | | | | — | (f) | | | | | 2,720 | | | | | | 0.07 | | | | | | 0.58 | | | | | | — | (g) |
| | | 1.00 | | | | | | — | (f) | | | | | 140,016 | | | | | | 0.07 | | | | | | 0.73 | | | | | | — | (g) |
| | | 1.00 | | | | | | — | (f) | | | | | 1 | | | | | | 0.07 | | | | | | 0.88 | | | | | | 0.40 | |
| | | 1.00 | | | | | | — | (f) | | | | | 1 | | | | | | 0.07 | | | | | | 1.03 | | | | | | 0.40 | |
| | | 1.00 | | | | | | — | (f) | | | | | 25,382,266 | | | | | | 0.10 | | | | | | 0.23 | | | | | | — | (g) |
| | | 1.00 | | | | | | — | (f) | | | | | 224,452 | | | | | | 0.10 | | | | | | 0.26 | | | | | | — | (g) |
| | | 1.00 | | | | | | — | (f) | | | | | 110,400 | | | | | | 0.10 | | | | | | 0.33 | | | | | | — | (g) |
| | | 1.00 | | | | | | — | (f) | | | | | 165,250 | | | | | | 0.10 | | | | | | 0.38 | | | | | | — | (g) |
| | | 1.00 | | | | | | — | (f) | | | | | 1,352,128 | | | | | | 0.10 | | | | | | 0.48 | | | | | | — | (g) |
| | | 1.00 | | | | | | — | (f) | | | | | 360,992 | | | | | | 0.10 | | | | | | 0.58 | | | | | | — | (g) |
| | | 1.00 | | | | | | — | (f) | | | | | 185,658 | | | | | | 0.10 | | | | | | 0.73 | | | | | | — | (g) |
| | | 1.00 | | | | | | — | (f) | | | | | 1 | | | | | | 0.10 | | | | | | 0.88 | | | | | | — | (g) |
| | | 1.00 | | | | | | — | (f) | | | | | 1 | | | | | | 0.10 | | | | | | 1.03 | | | | | | — | (g) |
| | | 1.00 | | | | | | — | (f) | | | | | 23,364,396 | | | | | | 0.07 | | | | | | 0.23 | | | | | | — | (g) |
| | | 1.00 | | | | | | — | (f) | | | | | 110,090 | | | | | | 0.07 | | | | | | 0.26 | | | | | | — | (g) |
| | | 1.00 | | | | | | — | (f) | | | | | 156,016 | | | | | | 0.07 | | | | | | 0.33 | | | | | | — | (g) |
| | | 1.00 | | | | | | — | (f) | | | | | 157,629 | | | | | | 0.07 | | | | | | 0.38 | | | | | | — | (g) |
| | | 1.00 | | | | | | — | (f) | | | | | 1,319,295 | | | | | | 0.07 | | | | | | 0.48 | | | | | | — | (g) |
| | | 1.00 | | | | | | — | (f) | | | | | 401,333 | | | | | | 0.07 | | | | | | 0.58 | | | | | | — | (g) |
| | | 1.00 | | | | | | — | (f) | | | | | 298,413 | | | | | | 0.07 | | | | | | 0.73 | | | | | | — | (g) |
| | | 1.00 | | | | | | — | (f) | | | | | 1 | | | | | | 0.07 | | | | | | 0.88 | | | | | | 0.40 | |
| | | 1.00 | | | | | | — | (f) | | | | | 1 | | | | | | 0.07 | | | | | | 1.03 | | | | | | 0.40 | |
| | |
| The accompanying notes are an integral part of these financial statements. | | 57 |
FINANCIAL SQUARE TREASURY OBLIGATIONS FUND
Financial Highlights
Selected Data for a Share Outstanding Throughout Each Period
| | | | | | | | | | | | | | | | | | | | | | | | | | | | | | |
| | | | | | | | From
investment operations | | | Distributions
to shareholders | |
| | | Year - Share Class | | Net asset value, beginning of period | | | Net
investment
income(a) | | | Net realized
and unrealized
gain (loss) | | | Total from
investment
operations | | | From net
investment
income | | | From net
realized
gains | | | Total
distributions(b) | |
| | FOR THE SIX MONTHS ENDED FEBRUARY 28, (UNAUDITED) | |
| | 2017 - Institutional Shares | | $ | 1.00 | | | $ | 0.001 | | | $ | — | (d) | | $ | 0.001 | | | $ | (0.001 | ) | | $ | — | (d) | | $ | (0.001 | ) |
| | 2017 - Select Shares | | | 1.00 | | | | 0.001 | | | | — | (d) | | | 0.001 | | | | (0.001 | ) | | | — | (d) | | | (0.001 | ) |
| | 2017 - Preferred Shares | | | 1.00 | | | | 0.001 | | | | — | (d) | | | 0.001 | | | | (0.001 | ) | | | — | (d) | | | (0.001 | ) |
| | 2017 - Capital Shares | | | 1.00 | | | | 0.001 | | | | — | (d) | | | 0.001 | | | | (0.001 | ) | | | — | (d) | | | (0.001 | ) |
| | 2017 - Administration Shares | | | 1.00 | | | | — | (d) | | | — | (d) | | | — | (d) | | | — | (d) | | | — | (d) | | | — | (d) |
| | 2017 - Premier Shares | | | 1.00 | | | | 0.002 | | | | (0.002 | ) | | | — | (d) | | | — | (d) | | | — | (d) | | | — | (d) |
| | 2017 - Service Shares | | | 1.00 | | | | — | (d) | | | — | (d) | | | — | (d) | | | — | (d) | | | — | (d) | | | — | (d) |
| | 2017 - Resource Shares | | | 1.00 | | | | 0.002 | | | | (0.002 | ) | | | — | (d) | | | — | (d) | | | — | (d) | | | — | (d) |
| | 2017 - Cash Management Shares | | | 1.00 | | | | 0.002 | | | | (0.002 | ) | | | — | (d) | | | — | (d) | | | — | (d) | | | — | (d) |
| | | | | | | | | | | | | | | | | | | | | | | | | | | | | | |
| | FOR THE FISCAL YEARS ENDED AUGUST 31, | |
| | 2016 - Institutional Shares | | | 1.00 | | | | 0.002 | | | | — | (d) | | | 0.002 | | | | (0.002 | ) | | | — | (d) | | | (0.002 | ) |
| | 2016 - Select Shares | | | 1.00 | | | | 0.001 | | | | — | (d) | | | 0.001 | | | | (0.001 | ) | | | — | (d) | | | (0.001 | ) |
| | 2016 - Preferred Shares | | | 1.00 | | | | 0.001 | | | | — | (d) | | | 0.001 | | | | (0.001 | ) | | | — | (d) | | | (0.001 | ) |
| | 2016 - Capital Shares | | | 1.00 | | | | — | (d) | | | — | (d) | | | — | (d) | | | — | (d) | | | — | (d) | | | — | (d) |
| | 2016 - Administration Shares | | | 1.00 | | | | — | (d) | | | — | (d) | | | — | (d) | | | — | (d) | | | — | (d) | | | — | (d) |
| | 2016 - Premier Shares | | | 1.00 | | | | — | (d) | | | — | (d) | | | — | (d) | | | — | (d) | | | — | (d) | | | — | (d) |
| | 2016 - Service Shares | | | 1.00 | | | | — | (d) | | | — | (d) | | | — | (d) | | | — | (d) | | | — | (d) | | | — | (d) |
| | 2016 - Resource Shares | | | 1.00 | | | | — | (d) | | | — | (d) | | | — | (d) | | | — | (d) | | | — | (d) | | | — | (d) |
| | 2016 - Cash Management Shares | | | 1.00 | | | | — | (d) | | | — | (d) | | | — | (d) | | | — | (d) | | | — | (d) | | | — | (d) |
| | 2015 - Institutional Shares | | | 1.00 | | | | — | (d) | | | — | (d) | | | — | (d) | | | — | (d) | | | — | (d) | | | — | (d) |
| | 2015 - Select Shares | | | 1.00 | | | | — | (d) | | | — | (d) | | | — | (d) | | | — | (d) | | | — | (d) | | | — | (d) |
| | 2015 - Preferred Shares | | | 1.00 | | | | — | (d) | | | — | (d) | | | — | (d) | | | — | (d) | | | — | (d) | | | — | (d) |
| | 2015 - Capital Shares | | | 1.00 | | | | — | (d) | | | — | (d) | | | — | (d) | | | — | (d) | | | — | (d) | | | — | (d) |
| | 2015 - Administration Shares | | | 1.00 | | | | — | (d) | | | — | (d) | | | — | (d) | | | — | (d) | | | — | (d) | | | — | (d) |
| | 2015 - Premier Shares | | | 1.00 | | | | — | (d) | | | — | (d) | | | — | (d) | | | — | (d) | | | — | (d) | | | — | (d) |
| | 2015 - Service Shares | | | 1.00 | | | | — | (d) | | | — | (d) | | | — | (d) | | | — | (d) | | | — | (d) | | | — | (d) |
| | 2015 - Resource Shares | | | 1.00 | | | | — | (d) | | | — | (d) | | | — | (d) | | | — | (d) | | | — | (d) | | | — | (d) |
| | 2015 - Cash Management Shares | | | 1.00 | | | | — | (d) | | | — | (d) | | | — | (d) | | | — | (d) | | | — | (d) | | | — | (d) |
| | 2014 - Institutional Shares | | | 1.00 | | | | — | (d) | | | — | (d) | | | — | (d) | | | — | (d) | | | — | (d) | | | — | (d) |
| | 2014 - Select Shares | | | 1.00 | | | | — | (d) | | | — | (d) | | | — | (d) | | | — | (d) | | | — | (d) | | | — | (d) |
| | 2014 - Preferred Shares | | | 1.00 | | | | — | (d) | | | — | (d) | | | — | (d) | | | — | (d) | | | — | (d) | | | — | (d) |
| | 2014 - Capital Shares | | | 1.00 | | | | — | (d) | | | — | (d) | | | — | (d) | | | — | (d) | | | — | (d) | | | — | (d) |
| | 2014 - Administration Shares | | | 1.00 | | | | — | (d) | | | — | (d) | | | — | (d) | | | — | (d) | | | — | (d) | | | — | (d) |
| | 2014 - Premier Shares | | | 1.00 | | | | — | (d) | | | — | (d) | | | — | (d) | | | — | (d) | | | — | (d) | | | — | (d) |
| | 2014 - Service Shares | | | 1.00 | | | | — | (d) | | | — | (d) | | | — | (d) | | | — | (d) | | | — | (d) | | | — | (d) |
| | 2014 - Resource Shares | | | 1.00 | | | | — | (d) | | | — | (d) | | | — | (d) | | | — | (d) | | | — | (d) | | | — | (d) |
| | 2014 - Cash Management Shares | | | 1.00 | | | | — | (d) | | | — | (d) | | | — | (d) | | | — | (d) | | | — | (d) | | | — | (d) |
| | 2013 - Institutional Shares | | | 1.00 | | | | — | (d) | | | — | (d) | | | — | (d) | | | — | (d) | | | — | (d) | | | — | (d) |
| | 2013 - Select Shares | | | 1.00 | | | | — | (d) | | | — | (d) | | | — | (d) | | | — | (d) | | | — | (d) | | | — | (d) |
| | 2013 - Preferred Shares | | | 1.00 | | | | — | (d) | | | — | (d) | | | — | (d) | | | — | (d) | | | — | (d) | | | — | (d) |
| | 2013 - Capital Shares | | | 1.00 | | | | — | (d) | | | — | (d) | | | — | (d) | | | — | (d) | | | — | (d) | | | — | (d) |
| | 2013 - Administration Shares | | | 1.00 | | | | — | (d) | | | — | (d) | | | — | (d) | | | — | (d) | | | — | (d) | | | — | (d) |
| | 2013 - Premier Shares | | | 1.00 | | | | — | (d) | | | — | (d) | | | — | (d) | | | — | (d) | | | — | (d) | | | — | (d) |
| | 2013 - Service Shares | | | 1.00 | | | | — | (d) | | | — | (d) | | | — | (d) | | | — | (d) | | | — | (d) | | | — | (d) |
| | 2013 - Resource Shares | | | 1.00 | | | | — | (d) | | | — | (d) | | | — | (d) | | | — | (d) | | | — | (d) | | | — | (d) |
| | 2013 - Cash Management Shares | | | 1.00 | | | | — | (d) | | | — | (d) | | | — | (d) | | | — | (d) | | | — | (d) | | | — | (d) |
| | 2012 - Institutional Shares | | | 1.00 | | | | — | (d) | | | — | (d) | | | — | (d) | | | — | (d) | | | — | (d) | | | — | (d) |
| | 2012 - Select Shares | | | 1.00 | | | | — | (d) | | | — | (d) | | | — | (d) | | | — | (d) | | | — | (d) | | | — | (d) |
| | 2012 - Preferred Shares | | | 1.00 | | | | — | (d) | | | — | (d) | | | — | (d) | | | — | (d) | | | — | (d) | | | — | (d) |
| | 2012 - Capital Shares | | | 1.00 | | | | — | (d) | | | — | (d) | | | — | (d) | | | — | (d) | | | — | (d) | | | — | (d) |
| | 2012 - Administration Shares | | | 1.00 | | | | — | (d) | | | — | (d) | | | — | (d) | | | — | (d) | | | — | (d) | | | — | (d) |
| | 2012 - Premier Shares | | | 1.00 | | | | — | (d) | | | — | (d) | | | — | (d) | | | — | (d) | | | — | (d) | | | — | (d) |
| | 2012 - Service Shares | | | 1.00 | | | | — | (d) | | | — | (d) | | | — | (d) | | | — | (d) | | | — | (d) | | | — | (d) |
| | 2012 - Resource Shares | | | 1.00 | | | | — | (d) | | | — | (d) | | | — | (d) | | | — | (d) | | | — | (d) | | | — | (d) |
| | 2012 - Cash Management Shares | | | 1.00 | | | | — | (d) | | | — | (d) | | | — | (d) | | | — | (d) | | | — | (d) | | | — | (d) |
| | (a) | | Calculated based on the average shares outstanding methodology. |
| | (b) | | Distributions may not coincide with the current year net investment income or net realized gains as distributions may be paid from current or prior year earnings. |
| | (c) | | Assumes reinvestment of all distributions. Returns do not reflect the deduction of taxes that a shareholder would pay on Fund distributions. Total returns for periods less than one full year are not annualized. |
| | (d) | | Amount is less than $0.0005 per share. |
| | (f) | | Amount is less than 0.005%. |
| | (g) | | Amount is less than 0.005% of average net assets. |
| | |
| 58 | | The accompanying notes are an integral part of these financial statements. |
FINANCIAL SQUARE TREASURY OBLIGATIONS FUND
| | | | | | | | | | | | | | | | | | | | | | | | | | | | | | | | | | |
| | | | | | | | | | | |
| | | Net asset value, end of period | | | | | Total return(c) | | | | | Net assets end of period (in 000s) | | | | | Ratio of net expenses to average net assets | | | | | Ratio of total expenses to average net assets | | | | | Ratio of net investment income (loss) to average net assets | |
| | | | | | | | | | | | | | | | | | | | | | | | | | | | | | | | | | |
| | $ | 1.00 | | | | | | 0.14 | % | | | | $ | 15,786,981 | | | | | | 0.20 | %(e) | | | | | 0.23 | %(e) | | | | | 0.28 | %(e) |
| | | 1.00 | | | | | | 0.13 | | | | | | 97,624 | | | | | | 0.23 | (e) | | | | | 0.26 | (e) | | | | | 0.22 | (e) |
| | | 1.00 | | | | | | 0.09 | | | | | | 255,991 | | | | | | 0.30 | (e) | | | | | 0.33 | (e) | | | | | 0.19 | (e) |
| | | 1.00 | | | | | | 0.07 | | | | | | 282,806 | | | | | | 0.35 | (e) | | | | | 0.38 | (e) | | | | | 0.12 | (e) |
| | | 1.00 | | | | | | 0.03 | | | | | | 1,278,581 | | | | | | 0.43 | (e) | | | | | 0.48 | (e) | | | | | 0.05 | (e) |
| | | 1.00 | | | | | | 0.01 | | | | | | 1 | | | | | | 0.20 | (e) | | | | | 0.58 | (e) | | | | | 0.37 | (e) |
| | | 1.00 | | | | | | — | (f) | | | | | 787,703 | | | | | | 0.49 | (e) | | | | | 0.73 | (e) | | | | | — | (e)(g) |
| | | 1.00 | | | | | | — | (f) | | | | | 1 | | | | | | 0.20 | (e) | | | | | 0.88 | (e) | | | | | 0.37 | (e) |
| | | 1.00 | | | | | | — | (f) | | | | | 1 | | | | | | 0.20 | (e) | | | | | 1.03 | (e) | | | | | 0.37 | (e) |
| | | | | | | | | | | | | | | | | | | | | | | | | | | | | | | | | | |
| | | | | | | | | | | | | | | | | | | | | | | | | | | | | | | | | | |
| | | 1.00 | | | | | | 0.15 | | | | | | 19,950,969 | | | | | | 0.19 | | | | | | 0.23 | | | | | | 0.14 | |
| | | 1.00 | | | | | | 0.13 | | | | | | 505,162 | | | | | | 0.21 | | | | | | 0.26 | | | | | | 0.12 | |
| | | 1.00 | | | | | | 0.08 | | | | | | 81,542 | | | | | | 0.25 | | | | | | 0.33 | | | | | | 0.05 | |
| | | 1.00 | | | | | | 0.05 | | | | | | 404,533 | | | | | | 0.30 | | | | | | 0.38 | | | | | | 0.03 | |
| | | 1.00 | | | | | | 0.01 | | | | | | 1,543,863 | | | | | | 0.33 | | | | | | 0.48 | | | | | | (0.01 | ) |
| | | 1.00 | | | | | | 0.01 | | | | | | 1 | | | | | | 0.19 | | | | | | 0.58 | | | | | | 0.36 | |
| | | 1.00 | | | | | | 0.01 | | | | | | 787,768 | | | | | | 0.33 | | | | | | 0.73 | | | | | | (0.01 | ) |
| | | 1.00 | | | | | | 0.01 | | | | | | 1 | | | | | | 0.19 | | | | | | 0.88 | | | | | | 0.36 | |
| | | 1.00 | | | | | | 0.01 | | | | | | 1 | | | | | | 0.19 | | | | | | 1.03 | | | | | | 0.36 | |
| | | 1.00 | | | | | | 0.01 | | | | | | 12,758,713 | | | | | | 0.10 | | | | | | 0.23 | | | | | | — | (g) |
| | | 1.00 | | | | | | 0.01 | | | | | | 169,026 | | | | | | 0.10 | | | | | | 0.26 | | | | | | — | (g) |
| | | 1.00 | | | | | | 0.01 | | | | | | 220,426 | | | | | | 0.10 | | | | | | 0.33 | | | | | | — | (g) |
| | | 1.00 | | | | | | 0.01 | | | | | | 442,625 | | | | | | 0.10 | | | | | | 0.38 | | | | | | 0.01 | |
| | | 1.00 | | | | | | 0.01 | | | | | | 1,620,517 | | | | | | 0.10 | | | | | | 0.48 | | | | | | — | (g) |
| | | 1.00 | | | | | | 0.01 | | | | | | 1 | | | | | | 0.10 | | | | | | 0.58 | | | | | | (0.02 | ) |
| | | 1.00 | | | | | | 0.01 | | | | | | 940,671 | | | | | | 0.10 | | | | | | 0.73 | | | | | | — | (g) |
| | | 1.00 | | | | | | 0.01 | | | | | | 1 | | | | | | 0.10 | | | | | | 0.88 | | | | | | 0.40 | |
| | | 1.00 | | | | | | 0.01 | | | | | | 1 | | | | | | 0.10 | | | | | | 1.03 | | | | | | 0.40 | |
| | | 1.00 | | | | | | 0.01 | | | | | | 12,822,354 | | | | | | 0.08 | | | | | | 0.23 | | | | | | 0.01 | |
| | | 1.00 | | | | | | 0.01 | | | | | | 279,848 | | | | | | 0.08 | | | | | | 0.26 | | | | | | — | (g) |
| | | 1.00 | | | | | | 0.01 | | | | | | 205,386 | | | | | | 0.08 | | | | | | 0.33 | | | | | | — | (g) |
| | | 1.00 | | | | | | 0.01 | | | | | | 356,753 | | | | | | 0.08 | | | | | | 0.38 | | | | | | — | (g) |
| | | 1.00 | | | | | | 0.01 | | | | | | 2,144,601 | | | | | | 0.08 | | | | | | 0.48 | | | | | | — | (g) |
| | | 1.00 | | | | | | 0.01 | | | | | | 948 | | | | | | 0.08 | | | | | | 0.58 | | | | | | (0.01 | ) |
| | | 1.00 | | | | | | 0.01 | | | | | | 915,527 | | | | | | 0.08 | | | | | | 0.73 | | | | | | — | (g) |
| | | 1.00 | | | | | | 0.01 | | | | | | 1 | | | | | | 0.08 | | | | | | 0.88 | | | | | | 0.40 | |
| | | 1.00 | | | | | | 0.01 | | | | | | 1 | | | | | | 0.08 | | | | | | 1.03 | | | | | | 0.40 | |
| | | 1.00 | | | | | | 0.01 | | | | | | 6,998,695 | | | | | | 0.14 | | | | | | 0.23 | | | | | | 0.01 | |
| | | 1.00 | | | | | | 0.01 | | | | | | 189,482 | | | | | | 0.14 | | | | | | 0.26 | | | | | | 0.01 | |
| | | 1.00 | | | | | | 0.01 | | | | | | 146,636 | | | | | | 0.14 | | | | | | 0.33 | | | | | | 0.01 | |
| | | 1.00 | | | | | | 0.01 | | | | | | 317,742 | | | | | | 0.14 | | | | | | 0.38 | | | | | | 0.01 | |
| | | 1.00 | | | | | | 0.01 | | | | | | 1,577,830 | | | | | | 0.14 | | | | | | 0.48 | | | | | | 0.01 | |
| | | 1.00 | | | | | | 0.01 | | | | | | 97,655 | | | | | | 0.14 | | | | | | 0.58 | | | | | | — | (g) |
| | | 1.00 | | | | | | 0.01 | | | | | | 1,061,790 | | | | | | 0.14 | | | | | | 0.73 | | | | | | 0.01 | |
| | | 1.00 | | | | | | 0.01 | | | | | | 1 | | | | | | 0.14 | | | | | | 0.88 | | | | | | 0.40 | |
| | | 1.00 | | | | | | 0.01 | | | | | | 1 | | | | | | 0.14 | | | | | | 1.03 | | | | | | 0.40 | |
| | | 1.00 | | | | | | 0.01 | | | | | | 8,084,641 | | | | | | 0.12 | | | | | | 0.23 | | | | | | 0.01 | |
| | | 1.00 | | | | | | 0.01 | | | | | | 152,228 | | | | | | 0.12 | | | | | | 0.26 | | | | | | — | (g) |
| | | 1.00 | | | | | | 0.01 | | | | | | 95,065 | | | | | | 0.12 | | | | | | 0.33 | | | | | | — | (g) |
| | | 1.00 | | | | | | 0.01 | | | | | | 216,015 | | | | | | 0.12 | | | | | | 0.38 | | | | | | 0.01 | |
| | | 1.00 | | | | | | 0.01 | | | | | | 1,525,805 | | | | | | 0.12 | | | | | | 0.48 | | | | | | 0.01 | |
| | | 1.00 | | | | | | 0.01 | | | | | | 124,439 | | | | | | 0.12 | | | | | | 0.58 | | | | | | 0.01 | |
| | | 1.00 | | | | | | 0.01 | | | | | | 1,025,286 | | | | | | 0.12 | | | | | | 0.73 | | | | | | — | (g) |
| | | 1.00 | | | | | | 0.01 | | | | | | 1 | | | | | | 0.12 | | | | | | 0.88 | | | | | | 0.40 | |
| | | 1.00 | | | | | | 0.01 | | | | | | 1 | | | | | | 0.12 | | | | | | 1.03 | | | | | | 0.40 | |
| | |
| The accompanying notes are an integral part of these financial statements. | | 59 |
FINANCIAL SQUARE TREASURY SOLUTIONS FUND
Financial Highlights
Selected Data for a Share Outstanding Throughout Each Period
| | | | | | | | | | | | | | | | | | | | | | | | | | | | | | |
| | | | | | | | From
investment operations | | | Distributions
to shareholders | |
| | | Year - Share Class | | Net asset value, beginning of period | | | Net
investment
income(a) | | | Net realized
and unrealized
gain (loss) | | | Total from
investment
operations | | | From net
investment
income | | | From net
realized
gains | | | Total
distributions(b) | |
| | FOR THE SIX MONTHS ENDED FEBRUARY 28, (UNAUDITED) | |
| | 2017 - Institutional Shares | | $ | 1.00 | | | $ | 0.001 | | | $ | — | (d) | | $ | 0.001 | | | $ | (0.001 | ) | | $ | — | (d) | | $ | (0.001 | ) |
| | 2017 - Select Shares | | | 1.00 | | | | 0.001 | | | | — | (d) | | | 0.001 | | | | (0.001 | ) | | | — | (d) | | | (0.001 | ) |
| | 2017 - Preferred Shares | | | 1.00 | | | | 0.001 | | | | — | (d) | | | 0.001 | | | | (0.001 | ) | | | — | (d) | | | (0.001 | ) |
| | 2017 - Capital Shares | | | 1.00 | | | | 0.001 | | | | — | (d) | | | 0.001 | | | | (0.001 | ) | | | — | (d) | | | (0.001 | ) |
| | 2017 - Administration Shares | | | 1.00 | | | | — | (d) | | | — | (d) | | | — | (d) | | | — | (d) | | | — | (d) | | | — | (d) |
| | 2017 - Premier Shares | | | 1.00 | | | | — | (d) | | | — | (d) | | | — | (d) | | | — | (d) | | | — | (d) | | | — | (d) |
| | 2017 - Service Shares | | | 1.00 | | | | — | (d) | | | — | (d) | | | — | (d) | | | — | (d) | | | — | (d) | | | — | (d) |
| | 2017 - Resource Shares | | | 1.00 | | | | 0.002 | | | | (0.002 | ) | | | — | (d) | | | — | (d) | | | — | (d) | | | — | (d) |
| | 2017 - Cash Management Shares | | | 1.00 | | | | — | (d) | | | — | (d) | | | — | (d) | | | — | (d) | | | — | (d) | | | — | (d) |
| | | | | | | | | | | | | | | | | | | | | | | | | | | | | | |
| | FOR THE FISCAL YEARS ENDED AUGUST 31, | |
| | 2016 - Institutional Shares | | | 1.00 | | | | 0.001 | | | | — | (d) | | | 0.001 | | | | (0.001 | ) | | | — | (d) | | | (0.001 | ) |
| | 2016 - Select Shares | | | 1.00 | | | | 0.001 | | | | — | (d) | | | 0.001 | | | | (0.001 | ) | | | — | (d) | | | (0.001 | ) |
| | 2016 - Preferred Shares | | | 1.00 | | | | 0.001 | | | | — | (d) | | | 0.001 | | | | (0.001 | ) | | | — | (d) | | | (0.001 | ) |
| | 2016 - Capital Shares | | | 1.00 | | | | — | (d) | | | — | (d) | | | — | (d) | | | — | (d) | | | — | (d) | | | — | (d) |
| | 2016 - Administration Shares | | | 1.00 | | | | — | (d) | | | — | (d) | | | — | (d) | | | — | (d) | | | — | (d) | | | — | (d) |
| | 2016 - Premier Shares | | | 1.00 | | | | — | (d) | | | — | (d) | | | — | (d) | | | — | (d) | | | — | (d) | | | — | (d) |
| | 2016 - Service Shares | | | 1.00 | | | | — | (d) | | | — | (d) | | | — | (d) | | | — | (d) | | | — | (d) | | | — | (d) |
| | 2016 - Resource Shares | | | 1.00 | | | | — | (d) | | | — | (d) | | | — | (d) | | | — | (d) | | | — | (d) | | | — | (d) |
| | 2016 - Cash Management Shares | | | 1.00 | | | | — | (d) | | | — | (d) | | | — | (d) | | | — | (d) | | | — | (d) | | | — | (d) |
| | 2015 - Institutional Shares | | | 1.00 | | | | — | (d) | | | — | (d) | | | — | (d) | | | — | (d) | | | — | (d) | | | — | (d) |
| | 2015 - Select Shares | | | 1.00 | | | | — | (d) | | | — | (d) | | | — | (d) | | | — | (d) | | | — | (d) | | | — | (d) |
| | 2015 - Preferred Shares | | | 1.00 | | | | — | (d) | | | — | (d) | | | — | (d) | | | — | (d) | | | — | (d) | | | — | (d) |
| | 2015 - Capital Shares | | | 1.00 | | | | — | (d) | | | — | (d) | | | — | (d) | | | — | (d) | | | — | (d) | | | — | (d) |
| | 2015 - Administration Shares | | | 1.00 | | | | — | (d) | | | — | (d) | | | — | (d) | | | — | (d) | | | — | (d) | | | — | (d) |
| | 2015 - Premier Shares | | | 1.00 | | | | — | (d) | | | — | (d) | | | — | (d) | | | — | (d) | | | — | (d) | | | — | (d) |
| | 2015 - Service Shares | | | 1.00 | | | | — | (d) | | | — | (d) | | | — | (d) | | | — | (d) | | | — | (d) | | | — | (d) |
| | 2015 - Resource Shares | | | 1.00 | | | | — | (d) | | | — | (d) | | | — | (d) | | | — | (d) | | | — | (d) | | | — | (d) |
| | 2015 - Cash Management Shares | | | 1.00 | | | | — | (d) | | | — | (d) | | | — | (d) | | | — | (d) | | | — | (d) | | | — | (d) |
| | 2014 - Institutional Shares | | | 1.00 | | | | — | (d) | | | — | (d) | | | — | (d) | | | — | (d) | | | — | (d) | | | — | (d) |
| | 2014 - Select Shares | | | 1.00 | | | | — | (d) | | | — | (d) | | | — | (d) | | | — | (d) | | | — | (d) | | | — | (d) |
| | 2014 - Preferred Shares | | | 1.00 | | | | — | (d) | | | — | (d) | | | — | (d) | | | — | (d) | | | — | (d) | | | — | (d) |
| | 2014 - Capital Shares | | | 1.00 | | | | — | (d) | | | — | (d) | | | — | (d) | | | — | (d) | | | — | (d) | | | — | (d) |
| | 2014 - Administration Shares | | | 1.00 | | | | — | (d) | | | — | (d) | | | — | (d) | | | — | (d) | | | — | (d) | | | — | (d) |
| | 2014 - Premier Shares | | | 1.00 | | | | — | (d) | | | — | (d) | | | — | (d) | | | — | (d) | | | — | (d) | | | — | (d) |
| | 2014 - Service Shares | | | 1.00 | | | | — | (d) | | | — | (d) | | | — | (d) | | | — | (d) | | | — | (d) | | | — | (d) |
| | 2014 - Resource Shares | | | 1.00 | | | | — | (d) | | | — | (d) | | | — | (d) | | | — | (d) | | | — | (d) | | | — | (d) |
| | 2014 - Cash Management Shares | | | 1.00 | | | | — | (d) | | | — | (d) | | | — | (d) | | | — | (d) | | | — | (d) | | | — | (d) |
| | 2013 - Institutional Shares | | | 1.00 | | | | — | (d) | | | — | (d) | | | — | (d) | | | — | (d) | | | — | (d) | | | — | (d) |
| | 2013 - Select Shares | | | 1.00 | | | | — | (d) | | | — | (d) | | | — | (d) | | | — | (d) | | | — | (d) | | | — | (d) |
| | 2013 - Preferred Shares | | | 1.00 | | | | — | (d) | | | — | (d) | | | — | (d) | | | — | (d) | | | — | (d) | | | — | (d) |
| | 2013 - Capital Shares | | | 1.00 | | | | — | (d) | | | — | (d) | | | — | (d) | | | — | (d) | | | — | (d) | | | — | (d) |
| | 2013 - Administration Shares | | | 1.00 | | | | — | (d) | | | — | (d) | | | — | (d) | | | — | (d) | | | — | (d) | | | — | (d) |
| | 2013 - Premier Shares | | | 1.00 | | | | — | (d) | | | — | (d) | | | — | (d) | | | — | (d) | | | — | (d) | | | — | (d) |
| | 2013 - Service Shares | | | 1.00 | | | | — | (d) | | | — | (d) | | | — | (d) | | | — | (d) | | | — | (d) | | | — | (d) |
| | 2013 - Resource Shares | | | 1.00 | | | | — | (d) | | | — | (d) | | | — | (d) | | | — | (d) | | | — | (d) | | | — | (d) |
| | 2013 - Cash Management Shares | | | 1.00 | | | | — | (d) | | | — | (d) | | | — | (d) | | | — | (d) | | | — | (d) | | | — | (d) |
| | 2012 - Institutional Shares | | | 1.00 | | | | — | (d) | | | — | (d) | | | — | (d) | | | — | (d) | | | — | (d) | | | — | (d) |
| | 2012 - Select Shares | | | 1.00 | | | | — | (d) | | | — | (d) | | | — | (d) | | | — | (d) | | | — | (d) | | | — | (d) |
| | 2012 - Preferred Shares | | | 1.00 | | | | — | (d) | | | — | (d) | | | — | (d) | | | — | (d) | | | — | (d) | | | — | (d) |
| | 2012 - Capital Shares | | | 1.00 | | | | — | (d) | | | — | (d) | | | — | (d) | | | — | (d) | | | — | (d) | | | — | (d) |
| | 2012 - Administration Shares | | | 1.00 | | | | — | (d) | | | — | (d) | | | — | (d) | | | — | (d) | | | — | (d) | | | — | (d) |
| | 2012 - Premier Shares | | | 1.00 | | | | — | (d) | | | — | (d) | | | — | (d) | | | — | (d) | | | — | (d) | | | — | (d) |
| | 2012 - Service Shares | | | 1.00 | | | | — | (d) | | | — | (d) | | | — | (d) | | | — | (d) | | | — | (d) | | | — | (d) |
| | 2012 - Resource Shares | | | 1.00 | | | | — | (d) | | | — | (d) | | | — | (d) | | | — | (d) | | | — | (d) | | | — | (d) |
| | 2012 - Cash Management Shares | | | 1.00 | | | | — | (d) | | | — | (d) | | | — | (d) | | | — | (d) | | | — | (d) | | | — | (d) |
| | (a) | | Calculated based on the average shares outstanding methodology. |
| | (b) | | Distributions may not coincide with the current year net investment income or net realized gains as distributions may be paid from current or prior year earnings. |
| | (c) | | Assumes reinvestment of all distributions. Returns do not reflect the deduction of taxes that a shareholder would pay on Fund distributions. Total returns for periods less than one full year are not annualized. |
| | (d) | | Amount is less than $0.0005 per share. |
| | (f) | | Amount is less than 0.005% of average net assets. |
| | (g) | | Amount is less than 0.005%. |
| | |
| 60 | | The accompanying notes are an integral part of these financial statements. |
FINANCIAL SQUARE TREASURY SOLUTIONS FUND
| | | | | | | | | | | | | | | | | | | | | | | | | | | | | | | | | | |
| | | | | | | | | | | |
| | | Net asset value, end of period | | | | | Total return(c) | | | | | Net assets end of period (in 000s) | | | | | Ratio of net expenses to average net assets | | | | | Ratio of total expenses to average net assets | | | | | Ratio of net investment income (loss) to average net assets | |
| | | | | | | | | | | | | | | | | | | | | | | | | | | | | | | | | | |
| | $ | 1.00 | | | | | | 0.14 | % | | | | $ | 8,732,822 | | | | | | 0.20 | %(e) | | | | | 0.23 | %(e) | | | | | 0.26 | %(e) |
| | | 1.00 | | | | | | 0.13 | | | | | | 10,705 | | | | | | 0.23 | (e) | | | | | 0.26 | (e) | | | | | 0.24 | (e) |
| | | 1.00 | | | | | | 0.09 | | | | | | 29,959 | | | | | | 0.30 | (e) | | | | | 0.33 | (e) | | | | | 0.14 | (e) |
| | | 1.00 | | | | | | 0.07 | | | | | | 282,631 | | | | | | 0.35 | (e) | | | | | 0.38 | (e) | | | | | 0.12 | (e) |
| | | 1.00 | | | | | | 0.03 | | | | | | 240,908 | | | | | | 0.42 | (e) | | | | | 0.48 | (e) | | | | | 0.05 | (e) |
| | | 1.00 | | | | | | 0.01 | | | | | | 30,859 | | | | | | 0.47 | (e) | | | | | 0.58 | (e) | | | | | — | (e)(f) |
| | | 1.00 | | | | | | — | (g) | | | | | 142,311 | | | | | | 0.48 | (e) | | | | | 0.73 | (e) | | | | | (0.01 | )(e) |
| | | 1.00 | | | | | | — | (g) | | | | | 1 | | | | | | 0.20 | (e) | | | | | 0.88 | (e) | | | | | 0.37 | (e) |
| | | 1.00 | | | | | | — | (g) | | | | | 67,512 | | | | | | 0.48 | (e) | | | | | 1.03 | (e) | | | | | (0.01 | )(e) |
| | | | | | | | | | | | | | | | | | | | | | | | | | | | | | | | | | |
| | | | | | | | | | | | | | | | | | | | | | | | | | | | | | | | | | |
| | | 1.00 | | | | | | 0.14 | | | | | | 9,876,558 | | | | | | 0.19 | | | | | | 0.23 | | | | | | 0.11 | |
| | | 1.00 | | | | | | 0.12 | | | | | | 10,969 | | | | | | 0.21 | | | | | | 0.26 | | | | | | 0.09 | |
| | | 1.00 | | | | | | 0.07 | | | | | | 75,756 | | | | | | 0.26 | | | | | | 0.33 | | | | | | 0.03 | |
| | | 1.00 | | | | | | 0.03 | | | | | | 264,092 | | | | | | 0.32 | | | | | | 0.38 | | | | | | 0.01 | |
| | | 1.00 | | | | | | 0.01 | | | | | | 189,870 | | | | | | 0.30 | | | | | | 0.48 | | | | | | (0.02 | ) |
| | | 1.00 | | | | | | 0.01 | | | | | | 1 | | | | | | 0.19 | | | | | | 0.58 | | | | | | 0.36 | |
| | | 1.00 | | | | | | 0.01 | | | | | | 142,607 | | | | | | 0.29 | | | | | | 0.73 | | | | | | (0.02 | ) |
| | | 1.00 | | | | | | 0.01 | | | | | | 1 | | | | | | 0.19 | | | | | | 0.88 | | | | | | 0.37 | |
| | | 1.00 | | | | | | 0.01 | | | | | | 73,211 | | | | | | 0.31 | | | | | | 1.03 | | | | | | (0.02 | ) |
| | | 1.00 | | | | | | 0.01 | | | | | | 10,053,367 | | | | | | 0.10 | | | | | | 0.23 | | | | | | — | (f) |
| | | 1.00 | | | | | | 0.01 | | | | | | 12,266 | | | | | | 0.10 | | | | | | 0.26 | | | | | | — | (f) |
| | | 1.00 | | | | | | 0.01 | | | | | | 40,923 | | | | | | 0.10 | | | | | | 0.33 | | | | | | — | (f) |
| | | 1.00 | | | | | | 0.01 | | | | | | 103,108 | | | | | | 0.10 | | | | | | 0.38 | | | | | | — | (f) |
| | | 1.00 | | | | | | 0.01 | | | | | | 390,266 | | | | | | 0.10 | | | | | | 0.48 | | | | | | — | (f) |
| | | 1.00 | | | | | | 0.01 | | | | | | 1 | | | | | | 0.10 | | | | | | 0.58 | | | | | | 0.01 | |
| | | 1.00 | | | | | | 0.01 | | | | | | 355,272 | | | | | | 0.10 | | | | | | 0.73 | | | | | | — | (f) |
| | | 1.00 | | | | | | 0.01 | | | | | | 1 | | | | | | 0.10 | | | | | | 0.88 | | | | | | 0.40 | |
| | | 1.00 | | | | | | 0.01 | | | | | | 147,486 | | | | | | 0.10 | | | | | | 1.03 | | | | | | — | (f) |
| | | 1.00 | | | | | | 0.01 | | | | | | 9,153,246 | | | | | | 0.09 | | | | | | 0.23 | | | | | | 0.01 | |
| | | 1.00 | | | | | | 0.01 | | | | | | 38,054 | | | | | | 0.09 | | | | | | 0.26 | | | | | | 0.01 | |
| | | 1.00 | | | | | | 0.01 | | | | | | 52,417 | | | | | | 0.09 | | | | | | 0.33 | | | | | | 0.01 | |
| | | 1.00 | | | | | | 0.01 | | | | | | 55,729 | | | | | | 0.09 | | | | | | 0.38 | | | | | | 0.01 | |
| | | 1.00 | | | | | | 0.01 | | | | | | 403,438 | | | | | | 0.09 | | | | | | 0.48 | | | | | | 0.01 | |
| | | 1.00 | | | | | | 0.01 | | | | | | 17,834 | | | | | | 0.09 | | | | | | 0.58 | | | | | | 0.01 | |
| | | 1.00 | | | | | | 0.01 | | | | | | 435,856 | | | | | | 0.09 | | | | | | 0.73 | | | | | | 0.01 | |
| | | 1.00 | | | | | | 0.01 | | | | | | 1 | | | | | | 0.09 | | | | | | 0.88 | | | | | | 0.40 | |
| | | 1.00 | | | | | | 0.01 | | | | | | 90,568 | | | | | | 0.09 | | | | | | 1.03 | | | | | | 0.01 | |
| | | 1.00 | | | | | | 0.01 | | | | | | 8,211,951 | | | | | | 0.14 | | | | | | 0.23 | | | | | | — | (f) |
| | | 1.00 | | | | | | 0.01 | | | | | | 127,241 | | | | | | 0.14 | | | | | | 0.26 | | | | | | — | (f) |
| | | 1.00 | | | | | | 0.01 | | | | | | 53,020 | | | | | | 0.14 | | | | | | 0.33 | | | | | | — | (f) |
| | | 1.00 | | | | | | 0.01 | | | | | | 62,058 | | | | | | 0.14 | | | | | | 0.38 | | | | | | — | (f) |
| | | 1.00 | | | | | | 0.01 | | | | | | 418,901 | | | | | | 0.14 | | | | | | 0.48 | | | | | | — | (f) |
| | | 1.00 | | | | | | 0.01 | | | | | | 1,137,540 | | | | | | 0.14 | | | | | | 0.58 | | | | | | — | (f) |
| | | 1.00 | | | | | | 0.01 | | | | | | 508,699 | | | | | | 0.14 | | | | | | 0.73 | | | | | | — | (f) |
| | | 1.00 | | | | | | 0.01 | | | | | | 1 | | | | | | 0.14 | | | | | | 0.88 | | | | | | 0.40 | |
| | | 1.00 | | | | | | 0.01 | | | | | | 47,993 | | | | | | 0.14 | | | | | | 1.03 | | | | | | — | (f) |
| | | 1.00 | | | | | | 0.01 | | | | | | 9,044,336 | | | | | | 0.12 | | | | | | 0.23 | | | | | | — | (f) |
| | | 1.00 | | | | | | 0.01 | | | | | | 89,636 | | | | | | 0.12 | | | | | | 0.26 | | | | | | 0.01 | |
| | | 1.00 | | | | | | 0.01 | | | | | | 60,660 | | | | | | 0.12 | | | | | | 0.33 | | | | | | — | (f) |
| | | 1.00 | | | | | | 0.01 | | | | | | 71,459 | | | | | | 0.12 | | | | | | 0.38 | | | | | | — | (f) |
| | | 1.00 | | | | | | 0.01 | | | | | | 480,896 | | | | | | 0.12 | | | | | | 0.48 | | | | | | — | (f) |
| | | 1.00 | | | | | | 0.01 | | | | | | 1,313,277 | | | | | | 0.12 | | | | | | 0.58 | | | | | | — | (f) |
| | | 1.00 | | | | | | 0.01 | | | | | | 603,587 | | | | | | 0.12 | | | | | | 0.73 | | | | | | — | (f) |
| | | 1.00 | | | | | | 0.01 | | | | | | 1 | | | | | | 0.12 | | | | | | 0.88 | | | | | | 0.40 | |
| | | 1.00 | | | | | | 0.01 | | | | | | 175,249 | | | | | | 0.12 | | | | | | 1.03 | | | | | | — | (f) |
| | |
| The accompanying notes are an integral part of these financial statements. | | 61 |
GOLDMAN SACHS FUNDS — FINANCIAL SQUARE FUNDS
Notes to Financial Statements
February 28, 2017 (Unaudited)
Goldman Sachs Trust (the “Trust”) is a Delaware statutory trust registered under the Investment Company Act of 1940, as amended (the “Act”), as an open-end management investment company. The following table lists those series of the Trust that are included in this report (collectively, the “Funds” or individually a “Fund”), along with their corresponding share classes and respective diversification status under the Act:
| | | | |
| Fund | | Share Classes Offered | | Diversified/
Non-Diversified |
Federal Instruments | | Institutional, Select, Preferred, Capital, Administration, Premier, Service, and Cash Management | | Diversified |
Government | | Institutional, Select, Preferred, Capital, Administration, Premier, Service, Class R6, Class A, Class C, Resource and Cash Management | | Diversified |
Money Market, Prime Obligations, Treasury Instruments, Treasury Obligations and Treasury Solutions | | Institutional, Select, Preferred, Capital, Administration, Premier, Service, Resource and Cash Management | | Diversified |
Tax-Exempt Money Market | | Institutional, Select, Preferred, Capital, Administration, Service, and Resource | | Diversified |
Class C Shares may typically be acquired only in an exchange for Class C Shares of another Goldman Sachs Fund. Class C Shares may be subject to a contingent deferred sales charge (“CDSC”) of 1.00% during the first 12 months, measured from the time the original shares subject to the CDSC were acquired. At the close of business on October 11, 2016, Class C Shares of the Financial Square (“FSQ”) Prime Obligations Fund were liquidated.
Goldman Sachs Asset Management, L.P. (“GSAM”), an affiliate of Goldman, Sachs & Co. (“Goldman Sachs”), serves as investment adviser to the Funds pursuant to management agreements (the “Agreements”) with the Trust.
Effective on October 11, 2016, the following Funds were designated by the Board of Trustees (“Trustees”) as “institutional money market funds” under Rule 2a-7 under the Act: FSQ Money Market Fund, FSQ Prime Obligations Fund, and FSQ Tax-Exempt Money Market Fund (the “Institutional Money Market Funds”). Each of the Institutional Money Market Funds must price its shares at a net asset value (“NAV”) reflecting market-based values of its portfolio securities (i.e., at a “floating” NAV) rounded to the fourth decimal place (e.g., $1.0000).
|
| 2. SIGNIFICANT ACCOUNTING POLICIES |
The financial statements have been prepared in accordance with accounting principles generally accepted in the United States of America (“GAAP”) and require management to make estimates and assumptions that may affect the reported amounts and disclosures. Actual results may differ from those estimates and assumptions.
A. Investment Valuation — The investment valuation policy of the Funds, except for the Institutional Money Market Funds, is to use the amortized-cost method permitted by Rule 2a-7 under the Act for valuing portfolio securities. The amortized-cost method of valuation involves valuing a security at its cost and thereafter applying a constant amortization to maturity of any discount or premium. Normally, a security’s amortized cost will approximate its market value. Under procedures and tolerances approved by the Trustees, GSAM evaluates daily the difference between each Fund’s NAV per share using the amortized costs of its portfolio securities and the Fund’s NAV per share using market-based values of its portfolio securities. The Institutional Money Market Funds’ investment valuation policy is to value its portfolio securities only at market-based values. (Prior to October 11, 2016, the Institutional Money Market Funds’ investment valuation policy was to use the amortized-cost method.) The market-based value of a portfolio security is determined, where readily available, on the basis of market quotations provided by pricing services or securities dealers, or, where accurate market quotations are not readily available, on the basis of the security’s fair value as determined in accordance with Valuation Procedures approved by the Trustees. The pricing services may use valuation models or matrix pricing, which may consider (among other things): (i) yield or price with respect to debt securities that are considered comparable in characteristics such as rating, interest rate and maturity date or (ii) quotations from securities dealers to determine current value.
62
GOLDMAN SACHS FUNDS — FINANCIAL SQUARE FUNDS
|
| 2. SIGNIFICANT ACCOUNTING POLICIES (continued) |
B. Investment Income and Investments — Interest income is accrued daily and adjusted for amortization of premiums and accretion of discounts. Investment transactions are reflected on trade date. Realized gains and losses are calculated using identified cost.
C. Class Allocations and Expenses — Investment income, realized and unrealized gain (loss), and non-class specific expenses of each Fund are allocated daily based upon the proportion of net assets of each class. Class specific expenses, where applicable, are borne by the respective share classes and include Distribution and Service, Transfer Agency and Service and Shareholder Administration fees. Non-class specific expenses directly incurred by a Fund are charged to that Fund, while such expenses incurred by the Trust are allocated across the respective Funds on a straight-line and/or pro-rata basis depending upon the nature of the expenses.
D. Federal Taxes and Distributions to Shareholders — It is each Fund’s policy to comply with the requirements of the Internal Revenue Code of 1986, as amended (the “Code”), applicable to regulated investment companies (mutual funds) and to distribute each year substantially all of its investment company taxable and tax-exempt income and capital gains to its shareholders. Accordingly, the Funds are not required to make any provisions for the payment of federal income tax. Distributions to shareholders are declared and recorded daily and paid monthly by the Funds and may include short-term capital gains. Long-term capital gain distributions, if any, are declared and paid annually.
Net capital losses, if any, are carried forward to future fiscal years and may be used to the extent allowed by the Code to offset any future capital gains. Utilization of capital loss carryforwards will reduce the requirement of future capital gains distributions.
The characterization of distributions to shareholders for financial reporting purposes is determined in accordance with federal income tax rules, which may differ from GAAP. The source of each Fund’s distributions may be shown in the accompanying financial statements as either from net investment income, net realized gain or capital. Certain components of the Funds’ net assets on the Statements of Assets and Liabilities reflect permanent GAAP/tax differences based on the appropriate tax character.
E. Forward Commitments — A forward commitment involves entering into a contract to purchase or sell securities, typically on an extended settlement basis, for a fixed price at a future date. The purchase of securities on a forward commitment basis involves a risk of loss if the value of the security to be purchased declines before the settlement date. Conversely, the sale of securities on a forward commitment basis involves the risk that the value of the securities sold may increase before the settlement date. Although a Fund will generally purchase securities on a forward commitment basis with the intention of acquiring the securities for its portfolio, the Fund may dispose of forward commitments prior to settlement which may result in a realized gain or loss.
F. Offering Costs — Offering costs paid in connection with the offering of shares of the Goldman Sachs FSQ Federal Instruments Fund and the Goldman Sachs FSQ Tax-Exempt Money Market Fund were amortized on a straight-line basis over 12 months from the date of commencement of operations.
G. Repurchase Agreements — Repurchase agreements involve the purchase of securities subject to the seller’s agreement to repurchase the securities at a mutually agreed upon date and price, under the terms of a Master Repurchase Agreement (“MRA”). During the term of a repurchase agreement, the value of the underlying securities held as collateral on behalf of a Fund, including accrued interest, is required to exceed the value of the repurchase agreement, including accrued interest. The gross value of repurchase agreements is included in the Statements of Assets and Liabilities for financial reporting purposes. The underlying securities for all repurchase agreements are held at the Funds’ custodian or designated sub-custodians under tri-party repurchase agreements.
An MRA governs transactions between a Fund and select counterparties. An MRA contains provisions for, among other things, initiation of the transaction, income payments, events of default and maintenance of securities for repurchase agreements. An MRA also permits offsetting with collateral to create one single net payment in the event of default or similar events, including the bankruptcy or insolvency of a counterparty.
If the seller defaults, a Fund could suffer a loss to the extent that the proceeds from the sale of the underlying securities and other collateral held by the Fund are less than the repurchase price and the Fund’s costs associated with delay and enforcement of the repurchase agreement. In addition, in the event of default or insolvency of the seller, a court could determine that a Fund’s interest in the collateral is not enforceable, resulting in additional losses to the Fund.
Pursuant to exemptive relief granted by the Securities and Exchange Commission (“SEC”) and terms and conditions contained therein, the Funds, together with other funds of the Trust and registered investment companies having management agreements with GSAM or its affiliates, may transfer uninvested cash into joint accounts, the daily aggregate balance of which is
63
GOLDMAN SACHS FUNDS — FINANCIAL SQUARE FUNDS
Notes to Financial Statements (continued)
February 28, 2017 (Unaudited)
|
| 2. SIGNIFICANT ACCOUNTING POLICIES (continued) |
invested in one or more repurchase agreements. Under these joint accounts, the Funds maintain pro-rata credit exposure to the underlying repurchase agreements’ counterparties. With the exception of certain transaction fees, the Funds are not subject to any expenses in relation to these investments.
|
| 3. INVESTMENTS AND FAIR VALUE MEASUREMENTS |
The fair value of a financial instrument is the amount that would be received to sell an asset or paid to transfer a liability in an orderly transaction between market participants at the measurement date (i.e., the exit price). GAAP establishes a fair value hierarchy that prioritizes the inputs to valuation techniques used to measure fair value. The hierarchy gives the highest priority to unadjusted quoted prices in active markets for identical assets or liabilities (Level 1 measurements) and the lowest priority to unobservable inputs (Level 3 measurements). The levels used for classifying investments are not necessarily an indication of the risk associated with investing in these investments. The three levels of the fair value hierarchy are described below:
Level 1 — Unadjusted quoted prices in active markets that are accessible at the measurement date for identical, unrestricted assets or liabilities;
Level 2 — Quoted prices in markets that are not active or financial instruments for which significant inputs are observable (including, but not limited to, quoted prices for similar investments, interest rates, foreign exchange rates, volatility and credit spreads), either directly or indirectly;
Level 3 — Prices or valuations that require significant unobservable inputs (including GSAM’s assumptions in determining fair value measurement).
The Trustees have approved Valuation Procedures that govern the valuation of the portfolio investments held by the Funds, including investments for which market quotations are not readily available. The Trustees have delegated to GSAM day-to-day responsibility for implementing and maintaining internal controls and procedures related to the valuation (including both the amortized cost and market-based methods of valuation) of the Funds’ portfolio investments. To assess the continuing appropriateness of pricing sources and methodologies related to the market-based method of valuation, GSAM regularly performs price verification procedures and issues challenges as necessary to third party pricing vendors or brokers, and any differences are reviewed in accordance with the Valuation Procedures.
As of February 28, 2017, all investments, other than those held by the Institutional Money Market Funds, are classified as Level 2 of the fair value hierarchy. All investments for the Institutional Money Market Funds are classified as Level 2, with the exception of treasury securities of G8 countries which are generally classified as Level 1. Please refer to the Schedules of Investments for further detail.
|
| 4. AGREEMENTS AND AFFILIATED TRANSACTIONS |
A. Management Agreements — Under the Agreements, GSAM manages the Funds, subject to the general supervision of the Trustees.
As compensation for the services rendered pursuant to the Agreements, the assumption of the expenses related thereto and administration of the Funds’ business affairs, including providing facilities, GSAM is entitled to a management fee, accrued daily and paid monthly, equal to an annual percentage rate of each Fund’s average daily net assets.
B. Administration, Service and/or Shareholder Administration Plans — The Trust, on behalf of each applicable Fund, has adopted Administration, Service and/or Shareholder Administration Plans (the “Plans”) to allow Class C, Select, Preferred, Capital, Administration, Premier, Service, Resource and Cash Management Shares to compensate service organizations (including Goldman Sachs) for providing varying levels of account administration and/or personal and account maintenance services to their customers who are beneficial owners of such shares. The Plans provide for compensation to the service organizations equal to an annual percentage rate of the average daily net assets of such shares.
C. Distribution and/or Service (12b-1) Plans — The Trust, on behalf of Class A Shares of each applicable Fund, has adopted a Distribution and Service Plan subject to Rule 12b-1 under the Act. Under the Distribution and Service Plan, Goldman Sachs, as Distributor, is entitled to a fee accrued daily and paid monthly for distribution services and personal and account maintenance
64
GOLDMAN SACHS FUNDS — FINANCIAL SQUARE FUNDS
|
| 4. AGREEMENTS AND AFFILIATED TRANSACTIONS (continued) |
services, which may then be paid by Goldman Sachs to authorized dealers. These fees are equal to an annual percentage rate of the average daily net assets attributable to Class A Shares of the Funds.
The Trust, on behalf of Class C, Resource and Cash Management Shares of each applicable Fund, has adopted Distribution Plans subject to Rule 12b-1 under the Act. Under the Distribution Plans, Goldman Sachs is entitled to a fee accrued daily and paid monthly for distribution services, which may then be paid by Goldman Sachs to authorized dealers. These fees are equal to an annual percentage rate of the average daily net assets attributable to Class C, Resource and Cash Management Shares of the Funds.
The Trust, on behalf of the Service Shares of each applicable Fund, has adopted a Service Plan subject to Rule 12b-1 under the Act to allow Service Shares to compensate service organizations (including Goldman Sachs) for providing personal and account maintenance services to their customers who are beneficial owners of such shares. The Service Plan provides for compensation to the service organizations equal to an annual percentage rate of the average daily net assets of such shares.
D. Distribution Agreement — Goldman Sachs, as Distributor of the shares of the Funds pursuant to a Distribution Agreement, may retain a portion of the Class C Shares’ CDSC. During the six months ended February 28, 2017, Goldman Sachs has advised that it retained $704 and $171 in CDSCs with respect to Class C Shares of the FSQ Government and FSQ Prime Obligations Funds, respectively.
E. Transfer Agency Agreement — Goldman Sachs also serves as the transfer agent of the Funds for a fee pursuant to a Transfer Agency Agreement. The fee charged for such transfer agency services is accrued daily and paid monthly and is equal to an annual percentage rate of each Fund’s average daily net assets.
F. Other Agreements — GSAM has agreed to limit certain “Other Expenses” of the Funds (excluding transfer agency fees and expenses, administration fees (as applicable), service fees (as applicable), shareholder administration fees (as applicable), taxes, interest, brokerage fees, shareholder meetings, litigation, indemnification and extraordinary expenses) to the extent such expenses exceed, on an annual basis, 0.014% of the average daily net assets of each Fund. Such Other Expense reimbursements, if any, are accrued daily and paid monthly. These Other Expense limitations will remain in place through at least December 29, 2017, and prior to such date GSAM may not terminate the arrangements without the approval of the Trustees.
In addition, the Funds have entered into certain offset arrangements with the custodian and the transfer agent, which may result in a reduction of the Funds’ expenses and are received irrespective of the application of the “Other Expense” limitations described above.
G. Total Fund Expenses
Fund Contractual Fees
The contractual annualized rates for each of the Funds are as follows:
| | | | | | | | | | | | | | | | | | | | | | | | | | | | | | | | | | | | | | | | | | | | | | | | |
| | | Institutional
Shares | | | Select
Shares | | | Preferred
Shares | | | Capital
Shares | | | Administration
Shares | | | Premier
Shares | | | Service
Shares | | | Resource
Shares | | | Cash
Management
Shares | | | Class R6
Shares(a) | | | Class A
Shares(a) | | | Class C
Shares(a) | |
Management Fee | | | 0.205 | % | | | 0.205 | % | | | 0.205 | % | | | 0.205 | % | | | 0.205 | % | | | 0.205 | % | | | 0.205 | % | | | 0.205 | % | | | 0.205 | % | | | 0.205 | % | | | 0.205 | % | | | 0.205 | % |
Administration, Service and/or Shareholder Administration Fees | | | N/A | | | | 0.03 | | | | 0.10 | | | | 0.15 | | | | 0.25 | | | | 0.35 | | | | 0.25 | | | | 0.50 | | | | 0.50 | | | | N/A | | | | N/A | | | | 0.25 | |
Distribution and/or Service (12b-1) Fees | | | N/A | | | | N/A | | | | N/A | | | | N/A | | | | N/A | | | | N/A | | | | 0.25 | (b) | | | 0.15 | (c) | | | 0.30 | (c) | | | N/A | | | | 0.25 | | | | 0.75 | (c) |
Transfer Agency Fee | | | 0.01 | | | | 0.01 | | | | 0.01 | | | | 0.01 | | | | 0.01 | | | | 0.01 | | | | 0.01 | | | | 0.01 | | | | 0.01 | | | | 0.01 | | | | 0.01 | | | | 0.01 | |
N/A — Fees not applicable to respective share class
| (a) | | Government Fund only. |
| (b) | | Service (12b-1) fee only. |
| (c) | | Distribution (12b-1) fee only. |
65
GOLDMAN SACHS FUNDS — FINANCIAL SQUARE FUNDS
Notes to Financial Statements (continued)
February 28, 2017 (Unaudited)
|
| 4. AGREEMENTS AND AFFILIATED TRANSACTIONS (continued) |
Fund Effective Net Expenses (After Waivers and Reimbursements)
During the six months ended February 28, 2017, GSAM and Goldman Sachs (as applicable) voluntarily agreed to waive a portion of the management fees, respective class-specific fees (consisting of Distribution and/or Service, Administration, Service and/or Shareholder Administration Plan fees) and transfer agency fees attributable to the Funds. These waivers may be modified or terminated at any time at the option of GSAM or Goldman Sachs (as applicable), with the exception of GSAM’s agreement not to impose a portion of the management fee equal annually to 0.025% of the FSQ Federal Instruments, FSQ Treasury Instruments, FSQ Treasury Obligations and FSQ Treasury Solutions Funds’ average daily net assets and 0.045% of the FSQ Government, FSQ Money Market, FSQ Prime Obligations and FSQ Tax-Exempt Money Market Funds’ average daily net assets. The Funds are not obligated to reimburse GSAM or Goldman Sachs for prior fiscal year fee waivers and/or expense reimbursements, if any.
For the six months ended February 28, 2017, expense reductions including any fee waivers and Other Expense reimbursements were as follows (in thousands):
| | | | | | | | | | | | | | | | | | | | | | |
| Fund | | | | Management Fee Waivers | | | Transfer Agent Fee Waivers | | | Distribution, Administration, Service and/or Shareholder, Administration Plans Fee Waivers | | | Other Expense Reimbursements | | | Total Expense Reductions | |
Federal Instruments | | | | $ | 86 | | | $ | — | | | $ | 11 | | | $ | 245 | | | $ | 342 | |
Government | | | | | 21,149 | | | | — | | | | 446 | | | | — | | | | 21,595 | |
Money Market | | | | | 812 | | | | — | | | | 2 | | | | 409 | | | | 1,223 | |
Prime Obligations | | | | | 432 | | | | — | | | | 48 | | | | 348 | | | | 828 | |
Tax-Exempt Money Market | | | | | 2 | | | | — | | | | — | * | | | 448 | | | | 450 | |
Treasury Instruments | | | | | 6,387 | | | | — | * | | | 395 | | | | — | | | | 6,782 | |
Treasury Obligations | | | | | 2,775 | | | | — | * | | | 1,170 | | | | — | | | | 3,945 | |
Treasury Solutions | | | | | 1,249 | | | | — | * | | | 423 | | | | — | | | | 1,672 | |
| * | | Amount less than one thousand. |
H. Other Transactions with Affiliates — A Fund may purchase securities from, or sell securities to, an affiliated fund provided the affiliation is solely due to having a common investment adviser, common officers, or common Trustees.
As of February 28, 2017, the Goldman Sachs Group (“GSG”), Inc. was the beneficial owner of 5% or more of the outstanding share classes of the following funds:
| | | | | | | | | | | | | | | | | | | | | | | | | | | | | | | | | | | | | | |
| Fund | | | | Institutional
Shares | | | Select
Shares | | | Preferred
Shares | | | Capital
Shares | | | Administration
Shares | | | Premier
Shares | | | Service
Shares | | | Resource
Shares | | | Cash
Management
Shares | |
Federal Instruments | | | | | — | % | | | 100 | % | | | 100 | % | | | — | % | | | — | % | | | 100 | % | | | — | % | | | — | % | | | 100 | % |
Money Market | | | | | — | | | | — | | | | — | | | | 100 | | | | — | | | | 100 | | | | — | | | | 100 | | | | 100 | |
Prime Obligations | | | | | — | | | | — | | | | — | | | | — | | | | — | | | | 100 | | | | — | | | | 100 | | | | 100 | |
Tax-Exempt Money Market | | | | | 43 | | | | 100 | | | | 100 | | | | 100 | | | | 100 | | | | — | | | | 100 | | | | 100 | | | | — | |
Treasury Instruments | | | | | — | | | | — | | | | — | | | | — | | | | — | | | | — | | | | — | | | | 100 | | | | — | |
Treasury Obligations | | | | | — | | | | — | | | | — | | | | — | | | | — | | | | 100 | | | | — | | | | 100 | | | | 100 | |
Treasury Solutions | | | | | — | | | | — | | | | — | | | | — | | | | — | | | | — | | | | — | | | | 100 | | | | — | |
66
GOLDMAN SACHS FUNDS — FINANCIAL SQUARE FUNDS
|
| 4. AGREEMENTS AND AFFILIATED TRANSACTIONS (continued) |
For the six months ended February 28, 2017, the purchase and sale transactions and related net realized gain (loss) for the Funds with affiliated funds in compliance with Rule 17a-7 under the Act were as follows:
| | | | | | | | | | | | | | |
| Fund | | | | Purchases | | | Sales | | | Net Realized
Gain | |
Government | | | | $ | 2,962,231,926 | | | $ | — | | | $ | — | |
Money Market | | | | | 489,733,175 | | | | 165,629,086 | | | | — | |
Prime Obligations | | | | | 145,800,529 | | | | 504,008,782 | | | | — | |
Tax-Exempt Money Market | | | | | 1,100,247 | | | | 8,693,056 | | | | — | |
Treasury Instruments | | | | | — | | | | 9,457,607,139 | | | | 80,823 | |
Treasury Obligations | | | | | 475,434,329 | | | | — | | | | — | |
Treasury Solutions | | | | | 5,529,018,216 | | | | — | | | | — | |
I. Line of Credit Facility — As of February 28, 2017, the Funds participated in a $1,100,000,000 committed, unsecured revolving line of credit facility (the “facility”) together with other funds of the Trust and registered investment companies having management agreements with GSAM or its affiliates. This facility is to be used for temporary emergency purposes, or to allow for an orderly liquidation of securities to meet redemption requests. The interest rate on borrowings is based on the federal funds rate. The facility also requires a fee to be paid by the Funds based on the amount of the commitment that has not been utilized. For the six months ended February 28, 2017, the Funds did not have any borrowings under the facility.
As of the Funds’ most recent fiscal year end, August 31, 2016, the Funds’ certain timing differences on a tax basis were as follows:
| | | | | | | | | | | | | | | | | | | | | | | | | | | | | | | | |
| | | Federal Instruments | | | Government | | | Money Market | | | Prime Obligations | | | Tax-Exempt Money Market | | | Treasury Instruments | | | Treasury Obligations | | | Treasury Solutions | |
Timing differences (Qualified Late Year Loss Deferral and Dividend Payable) | | $ | (4,091 | ) | | $ | (7,059,672 | ) | | $ | (2,160,322 | ) | | $ | (1,400,282 | ) | | $ | (1,240 | ) | | $ | (2,879,234 | ) | | $ | (1,491,189 | ) | | $ | (545,374 | ) |
At February 28, 2017, the aggregate cost for each Fund stated in the accompanying Schedules of Investments also approximates the aggregate cost for U.S. federal income tax purposes.
GSAM has reviewed the Funds’ tax positions for all open tax years (the current and prior three tax years, as applicable) and has concluded that no provision for income tax is required in the Funds’ financial statements. Such open tax years remain subject to examination and adjustment by tax authorities.
The Funds’ risks include, but are not limited to, the following:
Large Shareholder Transactions Risk — A Fund may experience adverse effects when certain large shareholders, such as other funds, institutional investors (including those trading by use of non-discretionary mathematical formulas), financial intermediaries (who may make investment decisions on behalf of underlying clients and/or include a Fund in their investment model), individuals, accounts and Goldman Sachs affiliates, purchase or redeem large amounts of shares of a Fund. Such large
67
GOLDMAN SACHS FUNDS — FINANCIAL SQUARE FUNDS
Notes to Financial Statements (continued)
February 28, 2017 (Unaudited)
|
| 6. OTHER RISKS (continued) |
shareholder redemptions may cause a Fund to sell portfolio securities at times when it would not otherwise do so, which may negatively impact the Fund’s NAV and liquidity. Similarly, large Fund share purchases may adversely affect a Fund’s performance to the extent that the Fund is delayed in investing new cash and is required to maintain a larger cash position than it ordinarily would. These transactions may also accelerate the realization of taxable income to shareholders if such sales of investments resulted in gains, and may also increase transaction costs. In addition, a large redemption could result in a Fund’s current expenses being allocated over a smaller asset base, leading to an increase in the Fund’s expense ratio.
Interest Rate Risk — When interest rates increase, a Fund’s yield will tend to be lower than prevailing market rates, and the market value of its securities or instruments may also be adversely affected. A low interest rate environment poses additional risks to a Fund, because low yields on the Fund’s portfolio holdings may have an adverse impact on the Fund’s ability to provide a positive yield to its shareholders, pay expenses out of Fund assets, or, at times, maintain a stable $1.00 share price (or, for the Institutional Money Market Funds, minimize the volatility of the Fund’s NAV per share). The risks associated with increasing interest rates are heightened given that interest rates are near historic lows, but may be expected to increase in the future with unpredictable effects on the markets and a Fund’s investments. Fluctuations in interest rates may also affect the liquidity of fixed income securities and instruments held by the Funds.
Market and Credit Risks — In the normal course of business, the Funds trade financial instruments and enter into financial transactions where risk of potential loss exists due to changes in the market (market risk). Additionally, a Fund may also be exposed to credit risk in the event that an issuer or guarantor fails to perform or that an institution or entity with which a Fund has unsettled or open transactions defaults.
Geographic and Sector Risk — The FSQ Tax-Exempt Money Market Fund may invest a significant portion of its total assets in certain issuers within the same state, geographic region or economic sector, which may subject the value of the Fund’s investments to risks associated with an adverse economic, business, political or environmental development affecting that state, region or sector.
Under the Trust’s organizational documents, its Trustees, officers, employees and agents are indemnified, to the extent permitted by the Act and state law, against certain liabilities that may arise out of performance of their duties to the Funds. Additionally, in the course of business, the Funds enter into contracts that contain a variety of indemnification clauses. The Funds’ maximum exposure under these arrangements is unknown, as this would involve future claims that may be made against the Funds that have not yet occurred. However, GSAM believes the risk of loss under these arrangements to be remote.
Exemptive Orders — Pursuant to SEC exemptive orders, the Funds may enter into certain principal transactions, including repurchase agreements, with Goldman Sachs.
Subsequent events after the Statements of Assets and Liabilities date have been evaluated and GSAM has concluded that there is no impact requiring adjustment or disclosure in the financial statements.
68
GOLDMAN SACHS FUNDS — FINANCIAL SQUARE FUNDS
|
| 10. SUMMARY OF SHARE TRANSACTIONS |
Share activity is as follows:
| | | | | | | | |
| | | Federal Instruments Fund | |
| | | | |
| | | For the Six Months Ended February 28, 2017
(Unaudited) | | | For the Period Ended
August 31, 2016* | |
| | | | |
| | | Shares** | | | Shares** | |
| | | | |
| Institutional Shares | | | | | | | | |
Shares sold | | | 604,131,027 | | | | 1,385,664,141 | |
Reinvestment of distributions | | | 1,066,002 | | | | 875,865 | |
Shares redeemed | | | (479,611,469 | ) | | | (809,178,068 | ) |
| | | | 125,585,560 | | | | 577,361,938 | |
| Select Shares | | | | | | | | |
Shares sold | | | — | | | | 50,000 | |
Reinvestment of distributions | | | 75 | | | | 67 | |
Shares redeemed | | | (3,000 | ) | | | — | |
| | | | (2,925 | ) | | | 50,067 | |
| Preferred Shares | | | | | | | | |
Shares sold | | | 10 | | | | 50,000 | |
Reinvestment of distributions | | | 61 | | | | 42 | |
Shares redeemed | | | (10 | ) | | | — | |
| | | | 61 | | | | 50,042 | |
| Capital Shares | | | | | | | | |
Shares sold | | | 82,209,615 | | | | 50,000 | |
Reinvestment of distributions | | | 17,720 | | | | 24 | |
Shares redeemed | | | (73,796,220 | ) | | | — | |
| | | | 8,431,115 | | | | 50,024 | |
| Administration Shares | | | | | | | | |
Shares sold | | | 67,826,009 | | | | 103,145,254 | |
Reinvestment of distributions | | | 3,126 | | | | 1 | |
Shares redeemed | | | (70,829,563 | ) | | | (59,313,002 | ) |
| | | | (3,000,428 | ) | | | 43,832,253 | |
| Premier Shares | | | | | | | | |
Shares sold | | | — | | | | 50,000 | |
Reinvestment of distributions | | | 8 | | | | 4 | |
Shares redeemed | | | — | | | | — | |
| | | | 8 | | | | 50,004 | |
| Service Shares | | | | | | | | |
Shares sold | | | 8,248,438 | | | | 57,177,090 | |
Reinvestment of distributions | | | — | | | | 1 | |
Shares redeemed | | | (8,291,886 | ) | | | (42,229,202 | ) |
| | | | (43,448 | ) | | | 14,947,889 | |
| Cash Management Shares | | | | | | | | |
Shares sold | | | 10 | | | | 50,000 | |
Reinvestment of distributions | | | 2 | | | | 3 | |
Shares redeemed | | | (10 | ) | | | — | |
| | | | 2 | | | | 50,003 | |
NET INCREASE IN SHARES | | | 130,969,945 | | | | 636,392,220 | |
| * | | Commenced operations on October 30, 2015. |
| ** | | Valued at $1.00 per share. |
69
GOLDMAN SACHS FUNDS — FINANCIAL SQUARE FUNDS
Notes to Financial Statements (continued)
February 28, 2017 (Unaudited)
|
| 10. SUMMARY OF SHARE TRANSACTIONS (continued) |
Share activity is as follows:
| | | | | | | | |
| | | Government Fund | |
| | | | |
| | | For the Six Months Ended February 28, 2017
(Unaudited) | | | For the Fiscal Year Ended
August 31, 2016 | |
| | | | |
| | | Shares* | | | Shares* | |
| | | | |
| Institutional Shares | | | | | | | | |
Shares sold | | | 359,479,170,366 | | | | 341,664,419,857 | |
Reinvestment of distributions | | | 83,694,832 | | | | 47,502,955 | |
Shares redeemed | | | (331,112,726,976 | ) | | | (307,661,792,266 | ) |
| | | | 28,450,138,222 | | | | 34,050,130,546 | |
| Select Shares | | | | | | | | |
Shares sold | | | 4,948,655,226 | | | | 4,724,518,327 | |
Reinvestment of distributions | | | 4,380,941 | | | | 1,486,634 | |
Shares redeemed | | | (4,897,307,241 | ) | | | (2,457,856,271 | ) |
| | | | 55,728,926 | | | | 2,268,148,690 | |
| Preferred Shares | | | | | | | | |
Shares sold | | | 3,660,380,944 | | | | 4,436,751,899 | |
Reinvestment of distributions | | | 110,144 | | | | 22,074 | |
Shares redeemed | | | (3,190,588,759 | ) | | | (4,149,503,757 | ) |
| | | | 469,902,329 | | | | 287,270,216 | |
| Capital Shares | | | | | | | | |
Shares sold | | | 5,462,942,348 | | | | 6,278,638,378 | |
Reinvestment of distributions | | | 1,116,483 | | | | 872,480 | |
Shares redeemed | | | (5,567,386,190 | ) | | | (6,063,354,389 | ) |
| | | | (103,327,359 | ) | | | 216,156,469 | |
| Administration Shares | | | | | | | | |
Shares sold | | | 10,098,480,167 | | | | 9,147,766,081 | |
Reinvestment of distributions | | | 488,199 | | | | 46,616 | |
Shares redeemed | | | (8,814,254,628 | ) | | | (8,394,355,777 | ) |
| | | | 1,284,713,738 | | | | 753,456,920 | |
| Premier Shares | | | | | | | | |
Shares sold | | | 78,505,252 | | | | — | |
Reinvestment of distributions | | | — | | | | — | |
Shares redeemed | | | (12,341,620 | ) | | | — | |
| | | | 66,163,632 | | | | — | |
| Service Shares | | | | | | | | |
Shares sold | | | 892,438,695 | | | | 1,207,971,623 | |
Reinvestment of distributions | | | 1,988 | | | | 3,944 | |
Shares redeemed | | | (946,551,417 | ) | | | (1,307,720,818 | ) |
| | | | (54,110,734 | ) | | | (99,745,251 | ) |
| Class A Shares(a) | | | | | | | | |
Shares sold | | | 56,779,276 | | | | 2,627,049 | |
Reinvestment of distributions | | | 27,510 | | | | 32 | |
Shares redeemed | | | (10,239,020 | ) | | | (1,064,279 | ) |
| | | | 46,567,766 | | | | 1,562,802 | |
| Class C Shares(a) | | | | | | | | |
Shares sold | | | 14,723,570 | | | | 446,476 | |
Reinvestment of distributions | | | 296 | | | | 3 | |
Shares redeemed | | | (2,737,532 | ) | | | (33,123 | ) |
| | | | 11,986,334 | | | | 413,356 | |
| Resource Shares | | | | | | | | |
Shares sold | | | 115,591,406 | | | | 37,856,196 | |
Reinvestment of distributions | | | 2,141 | | | | 883 | |
Shares redeemed | | | (51,771,945 | ) | | | (20,223,965 | ) |
| | | | 63,821,602 | | | | 17,633,114 | |
| Cash Management Shares | | | | | | | | |
Shares sold | | | 84,540,588 | | | | 243,548 | |
Reinvestment of distributions | | | 398 | | | | — | |
Shares redeemed | | | (77,409,309 | ) | | | (233,217 | ) |
| | | | 7,131,677 | | | | 10,331 | |
| Class R6 Shares(b) | | | | | | | | |
Shares sold | | | 13,429,358 | | | | 5,221,480 | |
Reinvestment of distributions | | | 23,502 | | | | 325 | |
Shares redeemed | | | (6,105,960 | ) | | | (516,924 | ) |
| | | | 7,346,900 | | | | 4,704,881 | |
NET INCREASE IN SHARES | | | 30,306,063,033 | | | | 37,499,742,074 | |
| * | | Valued at $1.00 per share. |
| (a) | | Commenced operations on February 29, 2016. |
| (b) | | Commenced operations on December 29, 2015. |
70
GOLDMAN SACHS FUNDS — FINANCIAL SQUARE FUNDS
|
| 10. SUMMARY OF SHARE TRANSACTIONS (continued) |
Share activity is as follows:
| | | | | | | | | | | | |
| | | Money Market Fund | |
| | | | |
| | | For the Six Months Ended February 28, 2017 (Unaudited) | | | For the Fiscal Year Ended
August 31, 2016 | |
| | | | |
| | | Shares | | | Dollars | | | Shares* | |
| | | | |
| Institutional Shares | | | | | | | | | | | | |
Shares sold | | | 11,177,337,190 | | | $ | 11,177,646,237 | | | | 359,975,501,741 | |
Reinvestment of distributions | | | 3,542,315 | | | | 3,542,559 | | | | 60,513,386 | |
Shares redeemed | | | (24,885,982,500 | ) | | | (24,886,293,704 | ) | | | (377,446,008,048 | ) |
| | | | (13,705,102,995 | ) | | | (13,705,104,908 | ) | | | (17,409,992,921 | ) |
| Select Shares | | | | | | | | | | | | |
Shares sold | | | 658,587,534 | | | | 658,600,572 | | | | 8,194,089,563 | |
Reinvestment of distributions | | | 167,246 | | | | 167,247 | | | | 6,865,222 | |
Shares redeemed | | | (1,731,141,189 | ) | | | (1,731,159,847 | ) | | | (9,038,094,344 | ) |
| | | | (1,072,386,409 | ) | | | (1,072,392,028 | ) | | | (837,139,559 | ) |
| Preferred Shares | | | | | | | | | | | | |
Shares sold | | | 545,397,055 | | | | 545,397,055 | | | | 2,790,204,684 | |
Reinvestment of distributions | | | 11,169 | | | | 11,169 | | | | 129,915 | |
Shares redeemed | | | (604,397,127 | ) | | | (604,397,127 | ) | | | (2,848,127,716 | ) |
| | | | (58,988,903 | ) | | | (58,988,903 | ) | | | (57,793,117 | ) |
| Capital Shares | | | | | | | | | | | | |
Shares sold | | | 5,238,387 | | | | 5,238,387 | | | | 1,757,607,292 | |
Reinvestment of distributions | | | 2 | | | | 2 | | | | 561,194 | |
Shares redeemed | | | (113,907,949 | ) | | | (113,907,949 | ) | | | (1,850,937,346 | ) |
| | | | (108,669,560 | ) | | | (108,669,560 | ) | | | (92,768,860 | ) |
| Administration Shares | | | | | | | | | | | | |
Shares sold | | | 47,454,813 | | | | 47,454,813 | | | | 1,697,152,174 | |
Reinvestment of distributions | | | 23,985 | | | | 23,988 | | | | 323,068 | |
Shares redeemed | | | (354,980,698 | ) | | | (354,980,886 | ) | | | (1,812,259,753 | ) |
| | | | (307,501,900 | ) | | | (307,502,085 | ) | | | (114,784,511 | ) |
| Premier Shares | | | | | | | | | | | | |
Shares sold | | | — | | | | — | | | | — | |
Reinvestment of distributions | | | 1 | | | | 1 | | | | 1 | |
Shares redeemed | | | — | | | | — | | | | — | |
| | | | 1 | | | | 1 | | | | 1 | |
| Service Shares | | | | | | | | | | | | |
Shares sold | | | 5,633,982 | | | | 5,634,223 | | | | 218,281,802 | |
Reinvestment of distributions | | | 646 | | | | 646 | | | | 1,164 | |
Shares redeemed | | | (21,806,590 | ) | | | (21,806,886 | ) | | | (222,349,097 | ) |
| | | | (16,171,962 | ) | | | (16,172,017 | ) | | | (4,066,131 | ) |
| Resource Shares | | | | | | | | | | | | |
Shares sold | | | — | | | | — | | | | — | |
Reinvestment of distributions | | | — | | | | — | | | | 1 | |
Shares redeemed | | | — | | | | — | | | | — | |
| | | | — | | | | — | | | | 1 | |
| Cash Management Shares | | | | | | | | | | | | |
Shares sold | | | 283,535 | | | | 283,535 | | | | 14,627,940 | |
Reinvestment of distributions | | | — | | | | — | | | | 646 | |
Shares redeemed | | | (11,025,022 | ) | | | (11,025,022 | ) | | | (11,927,270 | ) |
| | | | (10,741,487 | ) | | | (10,741,487 | ) | | | 2,701,316 | |
NET DECREASE | | | (15,279,563,215 | ) | | $ | (15,279,570,987 | ) | | | (18,513,843,781 | ) |
| * | | Valued at $1.00 per share. |
71
GOLDMAN SACHS FUNDS — FINANCIAL SQUARE FUNDS
Notes to Financial Statements (continued)
February 28, 2017 (Unaudited)
|
| 10. SUMMARY OF SHARE TRANSACTIONS (continued) |
Share activity is as follows:
| | | | | | | | | | | | |
| | | Prime Obligations Fund | |
| | | | |
| | | For the Six Months Ended February 28, 2017 (Unaudited) | | | For the Fiscal Year Ended
August 31, 2016 | |
| | | | |
| | | Shares | | | Dollars | | | Shares* | |
| | | | |
| Institutional Shares | | | | | | | | | | | | |
Shares sold | | | 6,011,018,715 | | | $ | 6,011,431,119 | | | | 103,785,116,510 | |
Reinvestment of distributions | | | 1,470,587 | | | | 1,470,765 | | | | 11,417,004 | |
Shares redeemed | | | (12,493,664,836 | ) | | | (12,493,831,145 | ) | | | (105,708,221,276 | ) |
| | | | (6,481,175,534 | ) | | | (6,480,929,261 | ) | | | (1,911,687,762 | ) |
| Select Shares | | | | | | | | | | | | |
Shares sold | | | 28,554,804 | | | | 28,555,310 | | | | 2,117,945,818 | |
Reinvestment of distributions | | | 2,632 | | | | 2,632 | | | | 270,446 | |
Shares redeemed | | | (37,891,609 | ) | | | (37,891,693 | ) | | | (2,197,760,584 | ) |
| | | | (9,334,173 | ) | | | (9,333,751 | ) | | | (79,544,320 | ) |
| Preferred Shares | | | | | | | | | | | | |
Shares sold | | | 455,372,870 | | | | 455,385,749 | | | | 5,446,341,434 | |
Reinvestment of distributions | | | 3,838 | | | | 3,838 | | | | 510,400 | |
Shares redeemed | | | (734,056,073 | ) | | | (734,056,205 | ) | | | (5,500,202,709 | ) |
| | | | (278,679,365 | ) | | | (278,666,618 | ) | | | (53,350,875 | ) |
| Capital Shares | | | | | | | | | | | | |
Shares sold | | | 39,980,109 | | | | 39,983,541 | | | | 602,761,250 | |
Reinvestment of distributions | | | 808 | | | | 809 | | | | 161,889 | |
Shares redeemed | | | (179,717,055 | ) | | | (179,717,056 | ) | | | (566,760,887 | ) |
| | | | (139,736,138 | ) | | | (139,732,706 | ) | | | 36,162,252 | |
| Administration Shares | | | | | | | | | | | | |
Shares sold | | | 487,565,417 | | | | 487,592,616 | | | | 13,601,562,982 | |
Reinvestment of distributions | | | 7,284 | | | | 7,284 | | | | 374,085 | |
Shares redeemed | | | (1,734,622,977 | ) | | | (1,734,625,965 | ) | | | (14,244,549,509 | ) |
| | | | (1,247,050,276 | ) | | | (1,247,026,065 | ) | | | (642,612,442 | ) |
| Premier Shares | | | | | | | | | | | | |
Shares sold | | | — | | | | — | | | | — | |
Reinvestment of distributions | | | 1 | | | | 1 | | | | — | |
Shares redeemed | | | — | | | | — | | | | (5 | ) |
| | | | 1 | | | | 1 | | | | (5 | ) |
| Service Shares | | | | | | | | | | | | |
Shares sold | | | 221,510,023 | | | | 221,539,519 | | | | 4,837,531,314 | |
Reinvestment of distributions | | | 459 | | | | 458 | | | | 28,135 | |
Shares redeemed | | | (474,142,027 | ) | | | (474,163,181 | ) | | | (5,361,694,359 | ) |
| | | | (252,631,545 | ) | | | (252,623,204 | ) | | | (524,134,910 | ) |
| Class C Shares(a) | | | | | | | | | | | | |
Shares sold | | | 192,576 | | | | 193,680 | | | | 9,508,979 | |
Reinvestment of distributions | | | 141 | | | | 141 | | | | 2,021 | |
Shares redeemed | | | (18,801,137 | ) | | | (18,801,137 | ) | | | (10,820,524 | ) |
| | | | (18,608,420 | ) | | | (18,607,316 | ) | | | (1,309,524 | ) |
| Resource Shares | | | | | | | | | | | | |
Shares sold | | | 3,317,891 | | | | 3,317,897 | | | | 101,281,054 | |
Reinvestment of distributions | | | — | | | | — | | | | 6,820 | |
Shares redeemed | | | (75,122,856 | ) | | | (75,122,858 | ) | | | (101,514,632 | ) |
| | | | (71,804,965 | ) | | | (71,804,961 | ) | | | (226,758 | ) |
| Cash Management Shares | | | | | | | | | | | | |
Shares sold | | | — | | | | — | | | | 5 | |
Reinvestment of distributions | | | — | | | | — | | | | — | |
Shares redeemed | | | — | | | | — | | | | (5 | ) |
| | | | — | | | | — | | | | — | |
NET DECREASE | | | (8,499,020,415 | ) | | $ | (8,498,723,881 | ) | | | (3,176,704,344 | ) |
| * | | Valued at $1.00 per share. |
| (a) | | At the close of business on October 11, 2016, Class C Shares were liquidated. |
72
GOLDMAN SACHS FUNDS — FINANCIAL SQUARE FUNDS
|
| 10. SUMMARY OF SHARE TRANSACTIONS (continued) |
Share activity is as follows:
| | | | | | | | | | | | |
| | | Tax-Exempt Money Market Fund | |
| | | | |
| | | For the Six Months Ended February 28, 2017 (Unaudited) | | | For the Period Ended
August 31, 2016* | |
| | | | |
| | | Shares | | | Dollars | | | Shares** | |
| | | | |
| Institutional Shares | | | | | | | | | | | | |
Shares sold | | | 5,197,234 | | | $ | 5,197,310 | | | | 14,995,333 | |
Reinvestment of distributions | | | 6,673 | | | | 6,673 | | | | 2,644 | |
Shares redeemed | | | (10,776,131 | ) | | | (10,776,194 | ) | | | (2,502,693 | ) |
| | | | (5,572,224 | ) | | | (5,572,211 | ) | | | 12,495,284 | |
| Select Shares | | | | | | | | | | | | |
Shares sold | | | — | | | | — | | | | 10,000 | |
Reinvestment of distributions | | | 21 | | | | 21 | | | | 7 | |
Shares redeemed | | | — | | | | — | | | | — | |
| | | | 21 | | | | 21 | | | | 10,007 | |
| Preferred Shares | | | | | | | | | | | | |
Shares sold | | | — | | | | — | | | | 10,000 | |
Reinvestment of distributions | | | 18 | | | | 18 | | | | 4 | |
Shares redeemed | | | — | | | | — | | | | — | |
| | | | 18 | | | | 18 | | | | 10,004 | |
| Capital Shares | | | | | | | | | | | | |
Shares sold | | | — | | | | — | | | | 10,000 | |
Reinvestment of distributions | | | 15 | | | | 15 | | | | 3 | |
Shares redeemed | | | — | | | | — | | | | — | |
| | | | 15 | | | | 15 | | | | 10,003 | |
| Administration Shares | | | | | | | | | | | | |
Shares sold | | | — | | | | — | | | | 10,000 | |
Reinvestment of distributions | | | 10 | | | | 10 | | | | 2 | |
Shares redeemed | | | — | | | | — | | | | — | |
| | | | 10 | | | | 10 | | | | 10,002 | |
| Service Shares | | | | | | | | | | | | |
Shares sold | | | — | | | | — | | | | 10,000 | |
Reinvestment of distributions | | | 1 | | | | 1 | | | | 2 | |
Shares redeemed | | | — | | | | — | | | | — | |
| | | | 1 | | | | 1 | | | | 10,002 | |
| Resource Shares | | | | | | | | | | | | |
Shares sold | | | — | | | | — | | | | 10,005 | |
Reinvestment of distributions | | | — | | | | — | | | | 2 | |
Shares redeemed | | | — | | | | — | | | | (5 | ) |
| | | | — | | | | — | | | | 10,002 | |
NET INCREASE (DECREASE) | | | (5,572,159 | ) | | $ | (5,572,146 | ) | | | 12,555,304 | |
| * | | Commenced operations on March 31, 2016. |
| ** | | Valued at $1.00 per share. |
73
GOLDMAN SACHS FUNDS — FINANCIAL SQUARE FUNDS
Notes to Financial Statements (continued)
February 28, 2017 (Unaudited)
|
| 10. SUMMARY OF SHARE TRANSACTIONS (continued) |
Share activity is as follows:
| | | | | | | | |
| | | Treasury Instruments Fund | |
| | | | |
| | | For the Six Months Ended February 28, 2017
(Unaudited) | | | For the Fiscal Year Ended
August 31, 2016 | |
| | | | |
| | | Shares* | | | Shares* | |
| | | | |
| Institutional Shares | | | | | | | | |
Shares sold | | | 96,446,037,741 | | | | 172,852,122,298 | |
Reinvestment of distributions | | | 45,857,320 | | | | 38,873,240 | |
Shares redeemed | | | (102,283,060,926 | ) | | | (156,390,561,598 | ) |
| | | | (5,791,165,865 | ) | | | 16,500,433,940 | |
| Select Shares | | | | | | | | |
Shares sold | | | 432,100,657 | | | | 49,612,983 | |
Reinvestment of distributions | | | 78,940 | | | | 19,119 | |
Shares redeemed | | | (394,221,824 | ) | | | (108,631,567 | ) |
| | | | 37,957,773 | | | | (58,999,465 | ) |
| Preferred Shares | | | | | | | | |
Shares sold | | | 231,653,167 | | | | 455,706,727 | |
Reinvestment of distributions | | | 42,472 | | | | 7,441 | |
Shares redeemed | | | (185,836,067 | ) | | | (476,011,362 | ) |
| | | | 45,859,572 | | | | (20,297,194 | ) |
| Capital Shares | | | | | | | | |
Shares sold | | | 1,876,057,653 | | | | 2,575,909,714 | |
Reinvestment of distributions | | | 360,418 | | | | 111,256 | |
Shares redeemed | | | (1,789,851,386 | ) | | | (2,433,503,089 | ) |
| | | | 86,566,685 | | | | 142,517,881 | |
| Administration Shares | | | | | | | | |
Shares sold | | | 3,710,341,466 | | | | 8,080,799,975 | |
Reinvestment of distributions | | | 299,037 | | | | 13,405 | |
Shares redeemed | | | (3,883,877,727 | ) | | | (7,996,187,327 | ) |
| | | | (173,237,224 | ) | | | 84,626,053 | |
| Premier Shares | | | | | | | | |
Shares sold | | | 62,556,728 | | | | 20,005,149 | |
Reinvestment of distributions | | | 1 | | | | — | |
Shares redeemed | | | (51,970,984 | ) | | | (917,314 | ) |
| | | | 10,585,745 | | | | 19,087,835 | |
| Service Shares | | | | | | | | |
Shares sold | | | 63,067,243 | | | | 322,514,582 | |
Reinvestment of distributions | | | 334 | | | | 552 | |
Shares redeemed | | | (75,158,407 | ) | | | (428,002,431 | ) |
| | | | (12,090,830 | ) | | | (105,487,297 | ) |
| Resource Shares | | | | | | | | |
Shares sold | | | — | | | | — | |
Reinvestment of distributions | | | — | | | | — | |
Shares redeemed | | | — | | | | — | |
| | | | — | | | | — | |
| Cash Management Shares | | | | | | | | |
Shares sold | | | 26,936 | | | | 278,298 | |
Reinvestment of distributions | | | 2 | | | | — | |
Shares redeemed | | | (65,425 | ) | | | — | |
| | | | (38,487 | ) | | | 278,298 | |
NET INCREASE (DECREASE) IN SHARES | | | (5,795,562,631 | ) | | | 16,562,160,051 | |
| * | | Valued at $1.00 per share. |
74
GOLDMAN SACHS FUNDS — FINANCIAL SQUARE FUNDS
|
| 10. SUMMARY OF SHARE TRANSACTIONS (continued) |
Share activity is as follows:
| | | | | | | | |
| | | Treasury Obligations Fund | |
| | | | |
| | | For the Six Months Ended February 28, 2017
(Unaudited) | | | For the Fiscal Year Ended
August 31, 2016 | |
| | | | |
| | | Shares* | | | Shares* | |
| | | | |
| Institutional Shares | | | | | | | | |
Shares sold | | | 79,920,059,385 | | | | 97,363,853,064 | |
Reinvestment of distributions | | | 16,657,414 | | | | 10,384,855 | |
Shares redeemed | | | (84,100,779,456 | ) | | | (90,182,570,590 | ) |
| | | | (4,164,062,657 | ) | | | 7,191,667,329 | |
| Select Shares | | | | | | | | |
Shares sold | | | 1,704,268,565 | | | | 873,046,093 | |
Reinvestment of distributions | | | 111,292 | | | | 179,323 | |
Shares redeemed | | | (2,111,908,883 | ) | | | (537,103,323 | ) |
| | | | (407,529,026 | ) | | | 336,122,093 | |
| Preferred Shares | | | | | | | | |
Shares sold | | | 432,619,598 | | | | 1,141,034,269 | |
Reinvestment of distributions | | | 56,206 | | | | 55,229 | |
Shares redeemed | | | (258,233,646 | ) | | | (1,279,977,158 | ) |
| | | | 174,442,158 | | | | (138,887,660 | ) |
| Capital Shares | | | | | | | | |
Shares sold | | | 882,363,756 | | | | 2,978,985,083 | |
Reinvestment of distributions | | | 195,566 | | | | 186,951 | |
Shares redeemed | | | (1,004,285,801 | ) | | | (3,017,277,611 | ) |
| | | | (121,726,479 | ) | | | (38,105,577 | ) |
| Administration Shares | | | | | | | | |
Shares sold | | | 2,626,525,250 | | | | 6,933,045,331 | |
Reinvestment of distributions | | | 110,941 | | | | 28,279 | |
Shares redeemed | | | (2,891,924,771 | ) | | | (7,009,778,183 | ) |
| | | | (265,288,580 | ) | | | (76,704,573 | ) |
| Premier Shares | | | | | | | | |
Shares sold | | | — | | | | — | |
Reinvestment of distributions | | | — | | | | — | |
Shares redeemed | | | — | | | | — | |
| | | | — | | | | — | |
| Service Shares | | | | | | | | |
Shares sold | | | 1,586,291,997 | | | | 2,298,748,847 | |
Reinvestment of distributions | | | 2,544 | | | | 9,364 | |
Shares redeemed | | | (1,586,368,296 | ) | | | (2,451,687,483 | ) |
| | | | (73,755 | ) | | | (152,929,272 | ) |
| Resource Shares | | | | | | | | |
Shares sold | | | — | | | | — | |
Reinvestment of distributions | | | — | | | | — | |
Shares redeemed | | | — | | | | — | |
| | | | — | | | | — | |
| Cash Management Shares | | | | | | | | |
Shares sold | | | — | | | | — | |
Reinvestment of distributions | | | — | | | | — | |
Shares redeemed | | | — | | | | — | |
| | | | — | | | | — | |
NET INCREASE (DECREASE) IN SHARES | | | (4,784,238,339 | ) | | | 7,121,162,340 | |
| * | | Valued at $1.00 per share. |
75
GOLDMAN SACHS FUNDS — FINANCIAL SQUARE FUNDS
Notes to Financial Statements (continued)
February 28, 2017 (Unaudited)
|
| 10. SUMMARY OF SHARE TRANSACTIONS (continued) |
Share activity is as follows:
| | | | | | | | |
| | | Treasury Solutions Fund | |
| | | | |
| | | For the Six Months Ended February 28, 2017
(Unaudited) | | | For the Fiscal Year Ended
August 31, 2016 | |
| | | | |
| | | Shares* | | | Shares* | |
| | | | |
| Institutional Shares | | | | | | | | |
Shares sold | | | 16,340,702,494 | | | | 28,752,349,005 | |
Reinvestment of distributions | | | 8,735,955 | | | | 9,208,383 | |
Shares redeemed | | | (17,493,300,878 | ) | | | (28,938,114,201 | ) |
| | | | (1,143,862,429 | ) | | | (176,556,813 | ) |
| Select Shares | | | | | | | | |
Shares sold | | | — | | | | 6,200,006 | |
Reinvestment of distributions | | | 13,471 | | | | 11,386 | |
Shares redeemed | | | (276,988 | ) | | | (7,508,363 | ) |
| | | | (263,517 | ) | | | (1,296,971 | ) |
| Preferred Shares | | | | | | | | |
Shares sold | | | 104,393,921 | | | | 697,520,894 | |
Reinvestment of distributions | | | 28,558 | | | | 24,437 | |
Shares redeemed | | | (150,219,247 | ) | | | (662,712,556 | ) |
| | | | (45,796,768 | ) | | | 34,832,775 | |
| Capital Shares | | | | | | | | |
Shares sold | | | 1,041,715,350 | | | | 1,336,137,651 | |
Reinvestment of distributions | | | 107,586 | | | | 49,784 | |
Shares redeemed | | | (1,023,288,887 | ) | | | (1,175,205,221 | ) |
| | | | 18,534,049 | | | | 160,982,214 | |
| Administration Shares | | | | | | | | |
Shares sold | | | 225,088,474 | | | | 439,259,245 | |
Reinvestment of distributions | | | 28,200 | | | | 8,175 | |
Shares redeemed | | | (174,084,014 | ) | | | (639,648,519 | ) |
| | | | 51,032,660 | | | | (200,381,099 | ) |
| Premier Shares | | | | | | | | |
Shares sold | | | 49,620,536 | | | | 9 | |
Reinvestment of distributions | | | — | | | | — | |
Shares redeemed | | | (18,763,656 | ) | | | (5 | ) |
| | | | 30,856,880 | | | | 4 | |
| Service Shares | | | | | | | | |
Shares sold | | | 479,609,513 | | | | 1,323,551,907 | |
Reinvestment of distributions | | | 137 | | | | 5,066 | |
Shares redeemed | | | (479,907,960 | ) | | | (1,536,207,787 | ) |
| | | | (298,310 | ) | | | (212,650,814 | ) |
| Resource Shares | | | | | | | | |
Shares sold | | | — | | | | 5 | |
Reinvestment of distributions | | | — | | | | — | |
Shares redeemed | | | — | | | | (5 | ) |
| | | | — | | | | — | |
| Cash Management Shares | | | | | | | | |
Shares sold | | | 119,518,383 | | | | 250,039,275 | |
Reinvestment of distributions | | | — | | | | — | |
Shares redeemed | | | (125,219,229 | ) | | | (324,308,723 | ) |
| | | | (5,700,846 | ) | | | (74,269,448 | ) |
NET DECREASE IN SHARES | | | (1,095,498,281 | ) | | | (469,340,152 | ) |
| * | | Valued at $1.00 per share. |
76
GOLDMAN SACHS FUNDS — FINANCIAL SQUARE FUNDS
Fund Expenses — Six Month Period Ended February 28, 2017 (Unaudited)
As a shareholder of Institutional Shares, Select Shares, Preferred Shares, Capital Shares, Administration Shares, Premier Shares, Service Shares, Class A Shares, Class C Shares, Resource Shares, Cash Management Shares or Class R6 Shares of a Fund, you incur two types of costs: (1) transaction costs, including contingent deferred sales charges (with respect to Class C Shares); and (2) ongoing costs, including management fees and distribution, service and/or shareholder administration fees (with respect to all share classes except Institutional Shares and Class R6 Shares) and other Fund expenses. This Example is intended to help you understand your ongoing costs (in dollars) of investing in Institutional Shares, Select Shares, Preferred Shares, Capital Shares, Administration Shares, Premier Shares, Service Shares, Class A Shares, Class C Shares, Resource Shares, Cash Management Shares or Class R6 Shares of the Funds and to compare these costs with the ongoing costs of investing in other mutual funds.
The Example is based on an investment of $1,000 invested at the beginning of the period and held for the entire period from September 1, 2016 through February 28, 2017, which represents a period of 181 days in a 365-day year.
Actual Expenses — The first line under each share class in the table below provides information about actual account values and actual expenses. You may use the information in this line, together with the amount you invested, to estimate the expenses that you paid over the period. Simply divide your account value by $1,000 (for example, an $8,600 account value divided by $1,000=8.6), then multiply the result by the number in the first line under the column heading entitled “Expenses Paid” to estimate the expenses you paid on your account during this period.
Hypothetical Example for Comparison Purposes — The second line under each share class in the table below provides information about hypothetical account values and hypothetical expenses based on the Funds’ actual net expense ratios and an assumed rate of return of 5% per year before expenses, which is not the Funds’ actual return. The hypothetical account values and expenses may not be used to estimate the actual ending account balance or expenses you paid for the period. You may use this information to compare the ongoing costs of investing in the Funds and other funds. To do so, compare this 5% hypothetical example with the 5% hypothetical examples that appear in the shareholder reports of the other funds.
Please note that the expenses shown in the table are meant to highlight your ongoing costs only and do not reflect any transactional costs, such as sales charges, redemption fees, or exchange fees. Therefore, the second line of the table is useful in comparing ongoing costs only, and will not help you determine the relative total costs of owning different funds. In addition, if these transactional costs were included, your costs would have been higher.
| | | | | | | | | | | | | | | | | | | | | | | | | | | | | | | | | | | | |
| | | Federal Instruments Fund | | | Government Fund | | | Money Market Fund | |
| Share Class | | Beginning Account Value 9/1/16 | | | Ending Account Value 2/28/17 | | | Expenses Paid for the 6 months ended
2/28/17* | | | Beginning Account Value 9/1/16 | | | Ending Account Value 2/28/17 | | | Expenses Paid for the 6 months ended
2/28/17* | | | Beginning Account Value 9/1/16 | | | Ending Account Value 2/28/17 | | | Expenses Paid for the 6 months ended
2/28/17* | |
| Institutional Shares | | | | | | | | | | | | | | | | | | | | | | | | | | | | | | | | | | | | |
Actual | | $ | 1,000.00 | | | $ | 1,001.70 | | | $ | 0.99 | | | $ | 1,000.00 | | | $ | 1,001.90 | | | $ | 0.89 | | | $ | 1,000.00 | | | $ | 1,003.20 | | | $ | 0.89 | |
Hypothetical (5% return before expenses) | | | 1,000.00 | | | | 1,023.80 | + | | | 1.00 | | | | 1,000.00 | | | | 1,023.90 | + | | | 0.90 | | | | 1,000.00 | | | | 1,023.90 | + | | | 0.90 | |
| Select Shares | | | | | | | | | | | | | | | | | | | | | | | | | | | | | | | | | | | | |
Actual | | | 1,000.00 | | | | 1,001.60 | | | | 1.14 | | | | 1,000.00 | | | | 1,001.70 | | | | 1.04 | | | | 1,000.00 | | | | 1,003.00 | | | | 1.04 | |
Hypothetical (5% return before expenses) | | | 1,000.00 | | | | 1,023.65 | + | | | 1.15 | | | | 1,000.00 | | | | 1,023.75 | + | | | 1.05 | | | | 1,000.00 | | | | 1,023.75 | + | | | 1.05 | |
| Preferred Shares | | | | | | | | | | | | | | | | | | | | | | | | | | | | | | | | | | | | |
Actual | | | 1,000.00 | | | | 1,001.20 | | | | 1.49 | | | | 1,000.00 | | | | 1,001.40 | | | | 1.39 | | | | 1,000.00 | | | | 1,002.70 | | | | 1.39 | |
Hypothetical (5% return before expenses) | | | 1,000.00 | | | | 1,023.31 | + | | | 1.51 | | | | 1,000.00 | | | | 1,023.41 | + | | | 1.40 | | | | 1,000.00 | | | | 1,023.41 | + | | | 1.40 | |
| Capital Shares | | | | | | | | | | | | | | | | | | | | | | | | | | | | | | | | | | | | |
Actual | | | 1,000.00 | | | | 1,001.00 | | | | 1.74 | | | | 1,000.00 | | | | 1,001.10 | | | | 1.64 | | | | 1,000.00 | | | | 1,002.40 | | | | 1.64 | |
Hypothetical (5% return before expenses) | | | 1,000.00 | | | | 1,023.06 | + | | | 1.76 | | | | 1,000.00 | | | | 1,023.16 | + | | | 1.66 | | | | 1,000.00 | | | | 1,023.16 | + | | | 1.66 | |
| Administration Shares | | | | | | | | | | | | | | | | | | | | | | | | | | | | | | | | | | | | |
Actual | | | 1,000.00 | | | | 1,000.50 | | | | 2.23 | | | | 1,000.00 | | | | 1,000.60 | | | | 2.13 | | | | 1,000.00 | | | | 1,002.00 | | | | 2.13 | |
Hypothetical (5% return before expenses) | | | 1,000.00 | | | | 1,022.56 | + | | | 2.26 | | | | 1,000.00 | | | | 1,022.66 | + | | | 2.16 | | | | 1,000.00 | | | | 1,022.66 | + | | | 2.16 | |
| Premier Shares | | | | | | | | | | | | | | | | | | | | | | | | | | | | | | | | | | | | |
Actual | | | 1,000.00 | | | | 1,000.20 | | | | 2.53 | | | | 1,000.00 | | | | 1,000.30 | | | | 2.53 | | | | 1,000.00 | | | | 1,001.50 | | | | 2.58 | |
Hypothetical (5% return before expenses) | | | 1,000.00 | | | | 1,022.27 | + | | | 2.56 | | | | 1,000.00 | | | | 1,022.27 | + | | | 2.56 | | | | 1,000.00 | | | | 1,022.22 | + | | | 2.61 | |
| Service Shares | | | | | | | | | | | | | | | | | | | | | | | | | | | | | | | | | | | | |
Actual | | | 1,000.00 | | | | 1,000.00 | | | | 2.68 | | | | 1,000.00 | | | | 1,000.00 | | | | 2.68 | | | | 1,000.00 | | | | 1,001.00 | | | | 2.88 | |
Hypothetical (5% return before expenses) | | | 1,000.00 | | | | 1,022.12 | + | | | 2.71 | | | | 1,000.00 | | | | 1,022.12 | + | | | 2.71 | | | | 1,000.00 | | | | 1,021.92 | + | | | 2.91 | |
| Class A Shares | | | | | | | | | | | | | | | | | | | | | | | | | | | | | | | | | | | | |
Actual | | | N/A | | | | N/A | | | | N/A | | | | 1,000.00 | | | | 1,000.60 | | | | 2.13 | | | | N/A | | | | N/A | | | | N/A | |
Hypothetical (5% return before expenses) | | | N/A | | | | N/A | | | | N/A | | | | 1,000.00 | | | | 1,022.66 | + | | | 2.16 | | | | N/A | | | | N/A | | | | N/A | |
| Class C Shares | | | | | | | | | | | | | | | | | | | | | | | | | | | | | | | | | | | | |
Actual | | | N/A | | | | N/A | | | | N/A | | | | 1,000.00 | | | | 1,000.00 | | | | 2.78 | | | | N/A | | | | N/A | | | | N/A | |
Hypothetical (5% return before expenses) | | | N/A | | | | N/A | | | | N/A | | | | 1,000.00 | | | | 1,022.02 | + | | | 2.81 | | | | N/A | | | | N/A | | | | N/A | |
| Resource Shares | | | | | | | | | | | | | | | | | | | | | | | | | | | | | | | | | | | | |
Actual | | | N/A | | | | N/A | | | | N/A | | | | 1,000.00 | | | | 1,000.00 | | | | 2.78 | | | | 1,000.00 | | | | 1,000.60 | | | | 2.58 | |
Hypothetical (5% return before expenses) | | | N/A | | | | N/A | | | | N/A | | | | 1,000.00 | | | | 1,022.02 | + | | | 2.81 | | | | 1,000.00 | | | | 1,022.22 | + | | | 2.61 | |
| Cash Management Shares | | | | | | | | | | | | | | | | | | | | | | | | | | | | | | | | | | | | |
Actual | | | 1,000.00 | | | | 1,000.00 | | | | 2.68 | | | | 1,000.00 | | | | 1,000.00 | | | | 2.68 | | | | 1,000.00 | | | | 1,000.30 | | | | 2.43 | |
Hypothetical (5% return before expenses) | | | 1,000.00 | | | | 1,022.12 | + | | | 2.71 | | | | 1,000.00 | | | | 1,022.12 | + | | | 2.71 | | | | 1,000.00 | | | | 1,022.36 | + | | | 2.46 | |
| Class R6 Shares | | | | | | | | | | | | | | | | | | | | | | | | | | | | | | | | | | | | |
Actual | | | N/A | | | | N/A | | | | N/A | | | | 1,000.00 | | | | 1,001.90 | | | | 0.89 | | | | N/A | | | | N/A | | | | N/A | |
Hypothetical (5% return before expenses) | | | N/A | | | | N/A | | | | N/A | | | | 1,000.00 | | | | 1,023.90 | + | | | 0.90 | | | | N/A | | | | N/A | | | | N/A | |
77
GOLDMAN SACHS FUNDS — FINANCIAL SQUARE FUNDS
Fund Expenses — Six Month Period Ended February 28, 2017 (Unaudited) (continued)
| | | | | | | | | | | | | | | | | | | | | | | | | | | | | | | | | | | | |
| | | Prime Obligations | | | Tax-Exempt Money Market | | | Treasury Instruments Fund | |
| Share Class | | Beginning Account Value 9/1/16 | | | Ending Account Value 2/28/17 | | | Expenses Paid for the 6 months ended
2/28/17* | | | Beginning Account Value 9/1/16 | | | Ending Account Value 2/28/17 | | | Expenses Paid for the 6 months ended
2/28/17* | | | Beginning Account Value 9/1/16 | | | Ending Account Value 2/28/17 | | | Expenses Paid for the 6 months ended
2/28/17* | |
| Institutional Shares | | | | | | | | | | | | | | | | | | | | | | | | | | | | | | | | | | | | |
Actual | | $ | 1,000.00 | | | $ | 1,003.30 | | | $ | 0.89 | | | $ | 1,000.00 | | | $ | 1,002.40 | | | $ | 0.89 | | | $ | 1,000.00 | | | $ | 1,001.40 | | | $ | 0.99 | |
Hypothetical (5% return before expenses) | | | 1,000.00 | | | | 1,023.90 | + | | | 0.90 | | | | 1,000.00 | | | | 1,023.90 | + | | | 0.90 | | | | 1,000.00 | | | | 1,023.80 | + | | | 1.00 | |
| Select Shares | | | | | | | | | | | | | | | | | | | | | | | | | | | | | | | | | | | | |
Actual | | | 1,000.00 | | | | 1,003.20 | | | | 1.04 | | | | 1,000.00 | | | | 1,002.20 | | | | 1.09 | | | | 1,000.00 | | | | 1,001.20 | | | | 1.14 | |
Hypothetical (5% return before expenses) | | | 1,000.00 | | | | 1,023.75 | + | | | 1.05 | | | | 1,000.00 | | | | 1,023.70 | + | | | 1.10 | | | | 1,000.00 | | | | 1,023.65 | + | | | 1.15 | |
| Preferred Shares | | | | | | | | | | | | | | | | | | | | | | | | | | | | | | | | | | | | |
Actual | | | 1,000.00 | | | | 1,002.90 | | | | 1.39 | | | | 1,000.00 | | | | 1,001.90 | | | | 1.44 | | | | 1,000.00 | | | | 1,000.90 | | | | 1.49 | |
Hypothetical (5% return before expenses) | | | 1,000.00 | | | | 1,023.41 | + | | | 1.40 | | | | 1,000.00 | | | | 1,023.36 | + | | | 1.45 | | | | 1,000.00 | | | | 1,023.31 | + | | | 1.51 | |
| Capital Shares | | | | | | | | | | | | | | | | | | | | | | | | | | | | | | | | | | | | |
Actual | | | 1,000.00 | | | | 1,002.60 | | | | 1.64 | | | | 1,000.00 | | | | 1,001.60 | | | | 1.64 | | | | 1,000.00 | | | | 1,000.60 | | | | 1.74 | |
Hypothetical (5% return before expenses) | | | 1,000.00 | | | | 1,023.16 | + | | | 1.66 | | | | 1,000.00 | | | | 1,023.16 | + | | | 1.66 | | | | 1,000.00 | | | | 1,023.06 | + | | | 1.76 | |
| Administration Shares | | | | | | | | | | | | | | | | | | | | | | | | | | | | | | | | | | | | |
Actual | | | 1,000.00 | | | | 1,002.10 | | | | 2.13 | | | | 1,000.00 | | | | 1,001.10 | | | | 2.18 | | | | 1,000.00 | | | | 1,000.30 | | | | 2.08 | |
Hypothetical (5% return before expenses) | | | 1,000.00 | | | | 1,022.66 | + | | | 2.16 | | | | 1,000.00 | | | | 1,022.61 | + | | | 2.21 | | | | 1,000.00 | | | | 1,022.71 | + | | | 2.11 | |
| Premier Shares | | | | | | | | | | | | | | | | | | | | | | | | | | | | | | | | | | | | |
Actual | | | 1,000.00 | | | | 1,001.80 | | | | 2.58 | | | | N/A | | | | N/A | | | | N/A | | | | 1,000.00 | | | | 1,000.00 | | | | 2.23 | |
Hypothetical (5% return before expenses) | | | 1,000.00 | | | | 1,022.22 | + | | | 2.61 | | | | N/A | | | | N/A | | | | N/A | | | | 1,000.00 | | | | 1,022.56 | + | | | 2.26 | |
| Service Shares | | | | | | | | | | | | | | | | | | | | | | | | | | | | | | | | | | | | |
Actual | | | 1,000.00 | | | | 1,001.00 | | | | 2.93 | | | | 1,000.00 | | | | 1,000.20 | | | | 2.98 | | | | 1,000.00 | | | | 1,000.00 | | | | 2.33 | |
Hypothetical (5% return before expenses) | | | 1,000.00 | | | | 1,021.87 | + | | | 2.96 | | | | 1,000.00 | | | | 1,021.82 | + | | | 3.01 | | | | 1,000.00 | | | | 1,022.46 | + | | | 2.36 | |
| Resource Shares | | | | | | | | | | | | | | | | | | | | | | | | | | | | | | | | | | | | |
Actual | | | 1,000.00 | | | | 1,000.70 | | | | 2.58 | | | | 1,000.00 | | | | 1,000.10 | | | | 2.98 | | | | 1,000.00 | | | | 1,000.00 | | | | 0.99 | |
Hypothetical (5% return before expenses) | | | 1,000.00 | | | | 1,022.22 | + | | | 2.61 | | | | 1,000.00 | | | | 1,021.82 | + | | | 3.01 | | | | 1,000.00 | | | | 1,023.80 | + | | | 1.00 | |
| Cash Management Shares | | | | | | | | | | | | | | | | | | | | | | | | | | | | | | | | | | | | |
Actual | | | 1,000.00 | | | | 1,000.60 | | | | 2.73 | | | | N/A | | | | N/A | | | | N/A | | | | 1,000.00 | | | | 1,000.00 | | | | 2.38 | |
Hypothetical (5% return before expenses) | | | 1,000.00 | | | | 1,022.07 | + | | | 2.76 | | | | N/A | | | | N/A | | | | N/A | | | | 1,000.00 | | | | 1,022.41 | + | | | 2.41 | |
78
GOLDMAN SACHS FUNDS — FINANCIAL SQUARE FUNDS
Fund Expenses — Six Month Period Ended February 28, 2017 (Unaudited) (continued)
| | | | | | | | | | | | | | | | | | | | | | | | |
| | | Treasury Obligations Fund | | | Treasury Solutions Fund | |
| Share Class | | Beginning Account Value 9/1/16 | | | Ending Account Value 2/28/17 | | | Expenses Paid for the 6 months ended
2/28/17* | | | Beginning Account Value 9/1/16 | | | Ending Account Value 2/28/17 | | | Expenses Paid for the 6 months ended 2/28/17* | |
| Institutional Shares | | | | | | | | | | | | | | | | | | | | | | | | |
Actual | | $ | 1,000.00 | | | $ | 1,001.40 | | | $ | 0.99 | | | $ | 1,000.00 | | | $ | 1,001.40 | | | $ | 0.99 | |
Hypothetical (5% return before expenses) | | | 1,000.00 | | | | 1,023.80 | + | | | 1.00 | | | | 1,000.00 | | | | 1,023.80 | + | | | 1.00 | |
| Select Shares | | | | | | | | | | | | | | | | | | | | | | | | |
Actual | | | 1,000.00 | | | | 1,001.30 | | | | 1.14 | | | | 1,000.00 | | | | 1,001.30 | | | | 1.14 | |
Hypothetical (5% return before expenses) | | | 1,000.00 | | | | 1,023.65 | + | | | 1.15 | | | | 1,000.00 | | | | 1,023.65 | + | | | 1.15 | |
| Preferred Shares | | | | | | | | | | | | | | | | | | | | | | | | |
Actual | | | 1,000.00 | | | | 1,000.90 | | | | 1.49 | | | | 1,000.00 | | | | 1,000.90 | | | | 1.49 | |
Hypothetical (5% return before expenses) | | | 1,000.00 | | | | 1,023.31 | + | | | 1.51 | | | | 1,000.00 | | | | 1,023.31 | + | | | 1.51 | |
| Capital Shares | | | | | | | | | | | | | | | | | | | | | | | | |
Actual | | | 1,000.00 | | | | 1,000.70 | | | | 1.74 | | | | 1,000.00 | | | | 1,000.70 | | | | 1.74 | |
Hypothetical (5% return before expenses) | | | 1,000.00 | | | | 1,023.06 | + | | | 1.76 | | | | 1,000.00 | | | | 1,023.06 | + | | | 1.76 | |
| Administration Shares | | | | | | | | | | | | | | | | | | | | | | | | |
Actual | | | 1,000.00 | | | | 1,000.30 | | | | 2.13 | | | | 1,000.00 | | | | 1,000.30 | | | | 2.08 | |
Hypothetical (5% return before expenses) | | | 1,000.00 | | | | 1,022.66 | + | | | 2.16 | | | | 1,000.00 | | | | 1,022.71 | + | | | 2.11 | |
| Premier Shares | | | | | | | | | | | | | | | | | | | | | | | | |
Actual | | | 1,000.00 | | | | 1,000.10 | | | | 0.99 | | | | 1,000.00 | | | | 1,000.10 | | | | 2.33 | |
Hypothetical (5% return before expenses) | | | 1,000.00 | | | | 1,023.80 | + | | | 1.00 | | | | 1,000.00 | | | | 1,022.46 | + | | | 2.36 | |
| Service Shares | | | | | | | | | | | | | | | | | | | | | | | | |
Actual | | | 1,000.00 | | | | 1,000.00 | | | | 2.43 | | | | 1,000.00 | | | | 1,000.00 | | | | 2.38 | |
Hypothetical (5% return before expenses) | | | 1,000.00 | | | | 1,022.36 | + | | | 2.46 | | | | 1,000.00 | | | | 1,022.41 | + | | | 2.41 | |
| Resource Shares | | | | | | | | | | | | | | | | | | | | | | | | |
Actual | | | 1,000.00 | | | | 1,000.00 | | | | 0.99 | | | | 1,000.00 | | | | 1,000.00 | | | | 0.99 | |
Hypothetical (5% return before expenses) | | | 1,000.00 | | | | 1,023.80 | + | | | 1.00 | | | | 1,000.00 | | | | 1,023.80 | + | | | 1.00 | |
| Cash Management Shares | | | | | | | | | | | | | | | | | | | | | | | | |
Actual | | | 1,000.00 | | | | 1,000.00 | | | | 0.99 | | | | 1,000.00 | | | | 1,000.00 | | | | 2.38 | |
Hypothetical (5% return before expenses) | | | 1,000.00 | | | | 1,023.80 | + | | | 1.00 | | | | 1,000.00 | | | | 1,022.41 | + | | | 2.41 | |
79
GOLDMAN SACHS FUNDS — FINANCIAL SQUARE FUNDS
Fund Expenses — Six Month Period Ended February 28, 2017 (Unaudited) (continued)
| * | | Expenses for each share class are calculated using each Fund’s annualized net expense ratio for each class, which represents the ongoing expenses as a percentage of net assets for the six months ended February 28, 2017. Expenses are calculated by multiplying the annualized net expense ratio by the average account value for the period; then multiplying the result by the number of days in the most recent fiscal half year; and then dividing that result by the number of days in the fiscal year. The annualized net expense ratios for the period were as follows: |
| | | | | | | | | | | | | | | | | | | | | | | | | | | | | | | | | | | | | | | | | | | | | | | | |
| Fund | | Institutional Shares | | | Select Shares | | | Preferred Shares | | | Capital Shares | | | Administration Shares | | | Premier Shares | | | Service Shares | | | Class A Shares | | | Class C Shares(a) | | | Resource Shares | | | Cash Management Shares | | | Class R6 Shares | |
Federal Instruments | | | 0.20 | % | | | 0.23 | % | | | 0.30 | % | | | 0.35 | % | | | 0.45 | % | | | 0.51 | % | | | 0.54 | % | | | N/A | | | | N/A | | | | N/A | | | | 0.54 | % | | | N/A | |
Government | | | 0.18 | | | | 0.21 | | | | 0.28 | | | | 0.33 | | | | 0.43 | | | | 0.51 | | | | 0.54 | | | | 0.43 | % | | | 0.56 | % | | | 0.56 | % | | | 0.54 | | | | 0.18 | % |
Money Market | | | 0.18 | | | | 0.21 | | | | 0.28 | | | | 0.33 | | | | 0.43 | | | | 0.52 | | | | 0.58 | | | | N/A | | | | N/A | | | | 0.52 | | | | 0.49 | | | | N/A | |
Prime Obligations | | | 0.18 | | | | 0.21 | | | | 0.28 | | | | 0.33 | | | | 0.43 | | | | 0.52 | | | | 0.59 | | | | N/A | | | | N/A | | | | 0.52 | | | | 0.55 | | | | N/A | |
Tax-Exempt Money Market | | | 0.18 | | | | 0.22 | | | | 0.29 | | | | 0.33 | | | | 0.44 | | | | N/A | | | | 0.60 | | | | N/A | | | | N/A | | | | 0.60 | | | | N/A | | | | N/A | |
Treasury Instruments | | | 0.20 | | | | 0.23 | | | | 0.30 | | | | 0.35 | | | | 0.42 | | | | 0.45 | | | | 0.47 | | | | N/A | | | | N/A | | | | 0.20 | | | | 0.48 | | | | N/A | |
Treasury Obligations | | | 0.20 | | | | 0.23 | | | | 0.30 | | | | 0.35 | | | | 0.43 | | | | 0.20 | | | | 0.49 | | | | N/A | | | | N/A | | | | 0.20 | | | | 0.20 | | | | N/A | |
Treasury Solutions | | | 0.20 | | | | 0.23 | | | | 0.30 | | | | 0.35 | | | | 0.42 | | | | 0.47 | | | | 0.48 | | | | N/A | | | | N/A | | | | 0.20 | | | | 0.48 | | | | N/A | |
| + | | Hypothetical expenses are based on each Fund’s actual annualized net expense ratios and an assumed rate of return of 5% per year before expenses. |
| (a) | | At the close of business on October 11, 2016, Class C Shares of the Prime Obligations Fund were liquidated. |
80
FUNDS PROFILE
Goldman Sachs Funds
Goldman Sachs is a premier financial services firm, known since 1869 for creating thoughtful and customized investment solutions in complex global markets.
Today, the Investment Management Division of Goldman Sachs serves a diverse set of clients worldwide, including private institutions, public entities and individuals. With approximately $1.17 trillion in assets under supervision as of December 31, 2016, Goldman Sachs Asset Management (“GSAM”) has portfolio management teams located around the world and our investment professionals bring firsthand knowledge of local markets to every investment decision. Assets under supervision includes assets under management and other client assets for which Goldman Sachs does not have full discretion. GSAM leverages the resources of Goldman, Sachs & Co. subject to legal, internal and regulatory restrictions.
Money Market
Financial Square FundsSM
| ∎ | | Financial Square Treasury Solutions Fund1 |
| ∎ | | Financial Square Government Fund1 |
| ∎ | | Financial Square Money Market Fund2 |
| ∎ | | Financial Square Prime Obligations Fund2 |
| ∎ | | Financial Square Treasury Instruments Fund1 |
| ∎ | | Financial Square Treasury Obligations Fund1 |
| ∎ | | Financial Square Federal Instruments Fund1 |
| ∎ | | Financial Square Tax-Exempt Money Market Fund2 |
Investor FundsSM
| ∎ | | Investor Money Market Fund3 |
| ∎ | | Investor Tax-Exempt Money Market Fund3 |
Fixed Income
Short Duration and Government
| ∎ | | High Quality Floating Rate Fund |
| ∎ | | Short-Term Conservative Income Fund4 |
| ∎ | | Short Duration Government Fund |
| ∎ | | Short Duration Income Fund |
| ∎ | | Inflation Protected Securities Fund |
Multi-Sector
Municipal and Tax-Free
| ∎ | | High Yield Municipal Fund |
| ∎ | | Dynamic Municipal Income Fund |
| ∎ | | Short Duration Tax-Free Fund |
Single Sector
| ∎ | | Investment Grade Credit Fund |
| ∎ | | High Yield Floating Rate Fund |
| ∎ | | Emerging Markets Debt Fund |
| ∎ | | Local Emerging Markets Debt Fund |
| ∎ | | Dynamic Emerging Markets Debt Fund |
Fixed Income Alternatives
| ∎ | | Long Short Credit Strategies Fund |
| ∎ | | Fixed Income Macro Strategies Fund |
Fundamental Equity
| ∎ | | Small/Mid Cap Value Fund |
| ∎ | | Small/Mid Cap Growth Fund |
| ∎ | | Flexible Cap Growth Fund |
| ∎ | | Concentrated Growth Fund |
| ∎ | | Technology Opportunities Fund |
| ∎ | | Growth Opportunities Fund |
| ∎ | | Rising Dividend Growth Fund |
| ∎ | | Dynamic U.S. Equity Fund |
Tax-Advantaged Equity
| ∎ | | U.S. Tax-Managed Equity Fund |
| ∎ | | International Tax-Managed Equity Fund |
| ∎ | | U.S. Equity Dividend and Premium Fund |
| ∎ | | International Equity Dividend and Premium Fund |
Equity Insights
| ∎ | | Small Cap Equity Insights Fund |
| ∎ | | U.S. Equity Insights Fund |
| ∎ | | Small Cap Growth Insights Fund |
| ∎ | | Large Cap Growth Insights Fund |
| ∎ | | Large Cap Value Insights Fund |
| ∎ | | Small Cap Value Insights Fund |
| ∎ | | International Small Cap Insights Fund |
| ∎ | | International Equity Insights Fund |
| ∎ | | Emerging Markets Equity Insights Fund |
Fundamental Equity International
| ∎ | | Strategic International Equity Fund |
| ∎ | | Focused International Equity Fund |
| ∎ | | Emerging Markets Equity Fund |
Select Satellite
| ∎ | | Real Estate Securities Fund |
| ∎ | | International Real Estate Securities Fund |
| ∎ | | Commodity Strategy Fund |
| ∎ | | Global Real Estate Securities Fund |
| ∎ | | Dynamic Allocation Fund |
| ∎ | | Absolute Return Tracker Fund |
| ∎ | | Managed Futures Strategy Fund |
| ∎ | | MLP Energy Infrastructure Fund |
| ∎ | | Multi-Manager Alternatives Fund |
| ∎ | | Absolute Return Multi-Asset Fund |
| ∎ | | Global Infrastructure Fund |
Total Portfolio Solutions
| ∎ | | Global Managed Beta Fund |
| ∎ | | Multi-Manager Non-Core Fixed Income Fund |
| ∎ | | Multi-Manager U.S. Dynamic Equity Fund |
| ∎ | | Multi-Manager Global Equity Fund |
| ∎ | | Multi-Manager International Equity Fund |
| ∎ | | Tactical Tilt Overlay Fund5 |
| ∎ | | Balanced Strategy Portfolio |
| ∎ | | Multi-Manager U.S. Small Cap Equity Fund |
| ∎ | | Multi-Manager Real Assets Strategy Fund |
| ∎ | | Growth and Income Strategy Portfolio |
| ∎ | | Growth Strategy Portfolio |
| ∎ | | Equity Growth Strategy Portfolio |
| ∎ | | Satellite Strategies Portfolio |
| ∎ | | Enhanced Dividend Global Equity Portfolio |
| ∎ | | Tax-Advantaged Global Equity Portfolio |
| ∎ | | Strategic Factor Allocation Fund |
| ∎ | | Target Date 2020 Portfolio |
| ∎ | | Target Date 2025 Portfolio |
| ∎ | | Target Date 2030 Portfolio |
| ∎ | | Target Date 2035 Portfolio |
| ∎ | | Target Date 2040 Portfolio |
| ∎ | | Target Date 2045 Portfolio |
| ∎ | | Target Date 2050 Portfolio |
| ∎ | | Target Date 2055 Portfolio |
| ∎ | | GQG Partners International Opportunities Fund |
| 1 | | You could lose money by investing in the Fund. Although the Fund seeks to preserve the value of your investment at $1.00 per share, it cannot guarantee it will do so. An investment in the Fund is not a deposit of a bank and is not insured or guaranteed by the Federal Deposit Insurance Corporation or any other government agency. The Fund’s sponsor has no legal obligation to provide financial support to the Fund, and you should not expect that the sponsor will provide financial support to the Fund at any time. |
| 2 | | You could lose money by investing in the Fund. Because the share price of the Fund will fluctuate, when you sell your shares they may be worth more or less than what you originally paid for them. The Fund may impose a fee upon sale of your shares or may temporarily suspend your ability to sell shares if the Fund’s liquidity falls below required minimums because of market conditions or other factors. An investment in the Fund is not a deposit of a bank and is not insured or guaranteed by the Federal Deposit Insurance Corporation or any other government agency. The Fund’s sponsor has no legal obligation to provide financial support to the Fund, and you should not expect that the sponsor will provide financial support to the Fund at any time. |
| 3 | | You could lose money by investing in the Fund. Although the Fund seeks to preserve the value of your investment at $1.00 per share, it cannot guarantee it will do so. The Fund may impose a fee upon sale of your shares or may temporarily suspend your ability to sell shares if the Fund’s liquidity falls below required minimums because of market conditions or other factors. An investment in the Fund is not a deposit of a bank and is not insured or guaranteed by the Federal Deposit Insurance Corporation or any other government agency. The Fund’s sponsor has no legal obligation to provide financial support to the Fund, and you should not expect that the sponsor will provide financial support to the Fund at any time. |
| 4 | | Effective on July 29, 2016, the Goldman Sachs Limited Maturity Obligations Fund was renamed the Goldman Sachs Short-Term Conservative Income Fund. |
| 5 | | Effective on June 1, 2016, the Goldman Sachs Tactical Tilt Implementation Fund was renamed the Goldman Sachs Tactical Tilt Overlay Fund. |
Financial Square FundsSM and Investor FundsSM are registered service marks of Goldman, Sachs & Co.
| * | | This list covers open-end funds only. Please visit our website at www.GSAMFUNDS.com to learn about our closed-end funds and exchange-traded funds. |
| | |
TRUSTEES Ashok N. Bakhru, Chairman Kathryn A. Cassidy Diana M. Daniels Herbert J. Markley James A. McNamara Jessica Palmer Roy W. Templin Gregory G. Weaver | | OFFICERS James A. McNamara, President Scott M. McHugh, Treasurer, Senior Vice President and Principal Financial Officer Caroline L. Kraus, Secretary |
| |
GOLDMAN, SACHS & CO. Distributor and Transfer Agent | | GOLDMAN SACHS ASSET MANAGEMENT, L.P. Investment Adviser |
Visit our web site at www.GSAMFUNDS.com to obtain the most recent month-end returns.
Goldman Sachs Asset Management, L.P., 200 West Street, New York, New York 10282
Economic and market forecasts presented herein reflect our judgment as of the date of this presentation and are subject to change without notice. These forecasts do not take into account the specific investment objectives, restrictions, tax and financial situation or other needs of any specific client. Actual data will vary and may not be reflected here. These forecasts are subject to high levels of uncertainty that may affect actual performance. Accordingly, these forecasts should be viewed as merely representative of a broad range of possible outcomes. These forecasts are estimated, based on assumptions, and are subject to significant revision and may change materially as economic and market conditions change. Goldman Sachs has no obligation to provide updates or changes to these forecasts. Case studies and examples are for illustrative purposes only.
The portfolio risk management process includes an effort to monitor and manage risk, but does not imply low risk. The reports concerning the Funds included in this shareholder report may contain certain forward-looking statements about the factors that may affect the performance of the Funds in the future. These statements are based on Fund management’s predictions and expectations concerning certain future events and their expected impact on the Funds, such as performance of the economy as a whole and of specific industry sectors, changes in the levels of interest rates, the impact of developing world events, and other factors that may influence the future performance of the Funds. Management believes these forward-looking statements to be reasonable, although they are inherently uncertain and difficult to predict. Actual events may cause adjustments in portfolio management strategies from those currently expected to be employed.
A description of the policies and procedures that the Funds use to determine how to vote proxies relating to portfolio securities and information regarding how a Fund voted proxies relating to portfolio securities during the most recent 12-month period ended June 30 is available (i) without charge, upon request by calling 1-800-526-7384 (for Retail Shareholders) or 1-800-621-2550 (for Institutional Shareholders); and (ii) on the Securities and Exchange Commission (“SEC”) web site at http://www.sec.gov.
The Funds file their complete schedule of portfolio holdings with the SEC for the first and third quarters of each fiscal year on Form N-Qs. The Funds’ Form N-Qs are available on the SEC’s web site at http://www.sec.gov within 60 days after the Funds’ first and third fiscal quarters. The Funds’ Form N-Qs may be reviewed and copied at the SEC’s Public Reference Room in Washington, D.C. and information on the operation of the Public Reference Room may also be obtained by calling 1-800-SEC-0330. Form N-Qs may be obtained upon request and without charge by calling 1-800-526-7384 (for Retail Shareholders) or 1-800-621-2550 (for Institutional Shareholders).
Goldman, Sachs & Co. (“Goldman Sachs’’) does not provide legal, tax or accounting advice. Any statement contained in this communication (including any attachments) concerning U.S. tax matters was not intended or written to be used, and cannot be used, for the purpose of avoiding penalties under the Internal Revenue Code, and was written to support the promotion or marketing of the transaction(s) or matter(s) addressed. Clients of Goldman Sachs should obtain their own independent tax advice based on their particular circumstances.
Fund holdings and allocations shown are as of February 28, 2017 and may not be representative of future investments. Fund holdings should not be relied on in making investment decisions and should not be construed as research or investment advice regarding particular securities. Current and future holdings are subject to risk.
Financial Square FundsSM is a registered service mark of Goldman, Sachs & Co.
This material is not authorized for distribution to prospective investors unless preceded or accompanied by a current Prospectus or summary prospectus, if applicable. Investors should consider a Fund’s objective, risks, and charges and expenses, and read the summary prospectus, if available, and/or the Prospectus carefully before investing or sending money. The summary prospectus, if available, and the Prospectus contain this and other information about a Fund and may be obtained from your Intermediary or from Goldman, Sachs & Co. by calling (retail – 1-800-526-7384) (institutional – 1-800-621-2550).
© 2017 Goldman Sachs. All rights reserved. 88167-TMPL-04/2017-517730 FSQSAR-17/84K
Goldman Sachs Funds

| | | | |
| | |
| Semi-Annual Report | | | | February 28, 2017 |
| | |
| | | | Investor FundsSM |
| | | | Money Market |
| | | | Tax-Exempt Money Market |

Goldman Sachs Investor Funds
| ∎ | | TAX-EXEMPT MONEY MARKET |
| | | | |
TABLE OF CONTENTS | | | | |
| |
Portfolio Management Discussion and Analysis | | | 1 | |
| |
Fund Basics | | | 4 | |
| |
Yield Summary | | | 5 | |
| |
Sector Allocations | | | 6 | |
| |
Schedule of Investments | | | 9 | |
| |
Financial Statements | | | 20 | |
| |
Financial Highlights | | | 24 | |
| |
Notes to Financial Statements | | | 28 | |
| |
Other Information | | | 39 | |
| | | | |
| | | |
| NOT FDIC-INSURED | | May Lose Value | | No Bank Guarantee |
PORTFOLIO RESULTS
Goldman Sachs Investor Funds
Portfolio Management Discussion and Analysis
Below, the Goldman Sachs Money Market Portfolio Management Team discusses the Goldman Sachs Investor Funds’ (the “Funds”) performance and positioning for the six-month period ended February 28, 2017 (the “Reporting Period”).
| Q | | What economic and market factors most influenced the money markets as a whole during the Reporting Period? |
| A | | During the Reporting Period, U.S. money market fund reform and the U.S. presidential election were among the most significant events influencing the front, or short-term, end of the taxable and tax-exempt money market yield curves. Yield curve is a spectrum of maturities. |
| | When the Reporting Period began in September 2016, credit spreads (the difference in yields between government and taxable bonds of comparable maturity) widened in advance of money market fund reform, with final implementation taking effect in October 2016. In addition, the BofA Merrill Lynch U.S. Dollar Three-Month LIBOR Constant Maturity Index spiked to its highest level since the 2008 financial crisis. However, unlike in 2008, funding costs for banks did not increase due to market stress. Instead, spreads widened because of declining demand, as prime money market funds had been a key source of short-term bank funding. (Prime money market funds primarily invest in corporate debt securities.) Most of the flows went into government money market funds that invest in agency securities — and may offer higher yields benchmarked to LIBOR — benefiting government yields and reducing pressure on U.S. Treasury yields. (LIBOR, or the London Inter-Bank Offered Rate, is the interest rate that banks charge each other for short-term loans.) During September and October 2016, prime money market funds lost approximately $440 billion in assets, while government money market funds gained $410 billion in assets. After money market fund reform was implemented on October 14, 2016, credit spreads gradually tightened to end the Reporting Period at widths seen at the beginning of 2016. |
| | Money market fund reform also impacted tax-exempt money market funds, with investment outflows reducing demand for one-day to seven-day maturities. In tandem with the outflows, the Securities Industry and Financial Markets Association (“SIFMA”) Municipal Swap Index, representing seven-day tax-exempt variable rate demand obligations, rose. |
| | In November 2016, Donald Trump’s victory in the U.S. presidential election was widely viewed as a potential regime change in monetary and fiscal policy. The U.S. Treasury yield curve steepened as the markets began pricing in higher inflation due to greater anticipated government fiscal spending. |
| | In December 2016, in a move widely expected by the markets, the Federal Reserve (the “Fed”) raised interest rates for the second time since the 2008 global financial crisis. Fed policymakers also raised their interest rate projections on the back of continued improvement in the U.S. labor market, rising wages and the potential of fiscal policy initiatives by the Trump administration. After the Fed’s December 2016 policy meeting, market expectations increased for additional Fed rate hikes in 2017, and money market yields generally moved higher. |
| Q | | What key factors were responsible for the performance of the Funds during the Reporting Period? |
| A | | The yields of the Goldman Sachs Investor Money Market Fund (“the taxable Fund”) and the Goldman Sachs Investor Tax-Exempt Money Market Fund (“the tax-exempt Fund”) rose during the Reporting Period, driven by the increase in money market yields, which was due primarily to the economic and market factors discussed above. Yields along the taxable money market yield curve rose, but the difference in yields between those on the shorter-term end of the curve and those on the longer-term end of the curve ended the Reporting Period near where it started. The tax-exempt money market yield curve steepened during the Reporting Period. |
| | The interest rate and market environment did not provide bountiful opportunities to pick up additional yield. However, in keeping with our investment approach, we sought to position both Funds to take advantage of changes in the interest rate environment, and throughout the Reporting Period, we found pockets of opportunity to add extra yield. That said, it should be noted that regardless of interest rate conditions, we seek to manage the Funds consistently. Our investment approach has always been tri-fold — to seek |
1
PORTFOLIO RESULTS
| | preservation of capital, daily liquidity and maximization of yield potential. We manage interest and credit risk daily. Whether interest rates are historically low, high or in-between, we intend to continue to use our actively managed approach to seek to provide the best possible return within the framework of the Funds’ guidelines and objectives. |
| Q | | How did you manage the taxable Fund during the Reporting Period? |
| A | | During the Reporting Period, the taxable Fund had investments in commercial paper, asset-backed commercial paper, repurchase agreements (“repos”), variable rate demand notes, certificates of deposit, municipal securities and short-term corporate obligations. |
| | In the taxable Fund, we maintained an especially low weighted average maturity of less than 10 days, along with a high level of liquidity, as the implementation of money market fund reform approached and amid uncertainty about investment flows from prime money market funds to government money market funds. Following the implementation of money market fund reform in October 2016, investment flows into prime money market funds stabilized, and we gradually extended the taxable Fund’s weighted average maturity. Toward the end of January 2017, as credit spreads normalized and we sought to add yield, we meaningfully extended the taxable Fund’s weighted average maturity to a range of between 30 days and 35 days. |
| Q | | How did you manage the tax-exempt Fund during the Reporting Period? |
| A | | During the Reporting Period, the tax-exempt Fund had investments in variable rate demand notes, tax-exempt commercial paper and other municipal securities. |
| | We maintained a particularly low weighted average maturity and a high level of liquidity in the tax-exempt Fund in response to money market fund reform, which reduced demand for short-term money market securities. Tax-exempt mutual funds overall lost more than $78 billion in assets during the summer of 2016 and had regained only $3 billion in assets by the end of the Reporting Period. In November 2016, we extended the weighted average maturity of the tax-exempt Fund, maintaining it in a range of between 25 days and 35 days for the rest of the Reporting Period. We focused on securities scheduled to mature in late June 2017, as they generally offered higher yields than shorter maturities and also offered, in our view, some protection should the Fed raise interest rates multiple times in 2017. |
| Q | | Did you make any changes to the Funds’ portfolios during the Reporting Period? |
| A | | During the Reporting Period, we made adjustments to the Funds’ weighted average maturities and their allocations to specific investments based on then-current market conditions, our near-term view and anticipated and actual Fed monetary policy statements. |
| Q | | What is the Funds’ tactical view and strategy for the months ahead? |
| A | | At the end of the Reporting Period, we expected U.S. economic growth to accelerate in the near term, driven by strong domestic demand and fiscal policy easing. The U.S. economy was already strengthening, in our view, prior to the November 2016 election, and we believe proposed fiscal stimulus and the potential loosening of regulations could provide additional support. We see U.S. economic growth picking up to 2.3% in 2017, with consumption underpinned in the near term by rising wages amid a labor market near full employment. (Full employment means the highest amount of skilled and unskilled labor that can be employed within an economy at any given time.) We also see scope for marginal improvements in business investment. That said, we remain alert to potential policy changes and geopolitical tensions, largely related to a more protectionist stance on trade, that might be associated with the Trump administration. |
| | Regarding Fed policy, we expect a gradual pace of interest rate hikes — perhaps three in 2017 — as the most likely scenario, largely due to the possibility of a fiscal stimulus package and the consensus’ anticipation of continued improvement in the labor market along with rising wages. |
| | In the taxable Fund, we expect to maintain a targeted weighted average maturity in a range of between 30 days and 35 days as we seek to add yield and to position the Fund for the potential of continued spread tightening. In the tax-exempt Fund, we plan to maintain positions at the shorter end of its weighted average maturity range because we anticipate three Fed rate hikes during 2017 and because we expect tax-exempt money market yields to rise due to tax-related investment outflows in April 2017. |
| | Overall, we expect to keep both Funds conservatively positioned as we continue to focus on preservation of capital and daily liquidity. We do not believe there is value in sacrificing liquidity in exchange for opportunities that only modestly increase yield potential. We will continue to use our actively managed approach to seek the best possible |
2
PORTFOLIO RESULTS
| | return within the framework of our Funds’ investment guidelines and objectives. In addition, we will continue to manage interest, liquidity and credit risk daily. We will also continue to closely monitor economic data, Fed policy and any shifts in the money market yield curves, as we strive to navigate the interest rate environment. |
|
| |
| RETAIL MONEY MARKET FUNDS |
| |
| You could lose money by investing in the Fund. Although the Fund seeks to preserve the value of your investment at $1.00 per share, it cannot guarantee it will do so. The Fund may impose a fee upon sale of your shares or may temporarily suspend your ability to sell shares if the Fund’s liquidity falls below required minimums because of market conditions or other factors. An investment in the Fund is not a deposit of a bank and is not insured or guaranteed by the Federal Deposit Insurance Corporation or any other government agency. The Fund’s sponsor has no legal obligation to provide financial support to the Fund, and you should not expect that the sponsor will provide financial support to the Fund at any time. |
3
FUND BASICS
Investor Funds
as of February 28, 2017
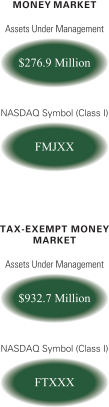
| | | | | | | | | | |
| | PERFORMANCE REVIEW1 | |
| | | September 1, 2016–February 28, 2017 | | Fund Total Return (based on NAV)2 Class I Shares | | | iMoneyNet Institutional Average3 | |
| | Money Market | | | 0.36 | % | | | 0.28 | %4 |
| | | Tax-Exempt Money Market | | | 0.30 | | | | 0.29 | %5 |
The returns represent past performance. Past performance does not guarantee future results. The Fund’s investment returns will fluctuate. Current performance may be lower or higher than the performance quoted above. Please visit our Web site at www.GSAMFUNDS.com to obtain the most recent month-end returns. Performance reflects applicable fee waivers and/or expense limitations in effect during the periods shown. In their absence, performance would be reduced. Returns do not reflect the deduction of taxes that a shareholder would pay on Fund distributions or the redemption of Fund shares.
| | 1 | | The Money Market Fund offers seven separate classes of shares (Class I, Administration, Service, Resource, Cash Management, Class A and Class C Shares) and the Tax-Exempt Money Market Fund offers eleven separate classes of shares (Class I, Select, Preferred, Capital, Administration, Premier, Service, Resource, Cash Management, Class A and Class C Shares), each of which is subject to different fees and expenses that affect performance and entitles shareholders to different services. The Class I Shares do not have distribution and/or service (12b-1), administration or service (non-12b-1) fees. The Select, Preferred, Capital, Administration, Premier, Service, Resource, Cash Management, Class A and Class C Shares offer financial institutions the opportunity to receive fees for providing certain distribution, administrative support and/or shareholder services (as applicable). As an annualized percentage of average daily net assets, these share classes pay combined distribution and/or service (12b-1), administration and/or service (non-12b-1) fees (as applicable) at the following contractual rates: Select Shares pay 0.03%, Preferred Shares pay 0.10%, Capital Shares pay 0.15%, Administration Shares pay 0.25%, Premier Shares pay 0.35%, Service Shares pay 0.50%, Resource Shares pay 0.65%, Cash Management Shares pay 0.80%, Class A Shares pay 0.25%, and Class C Shares pay 1.00%. |
| | | | If these fees were reflected in the above performance, performance would have been reduced. In addition, the Fund’s performance does not reflect the deduction of any applicable sales charges. |
| | 2 | | The net asset value (“NAV”) represents the net assets of the class of the Fund (ex-dividend) divided by the total number of shares of the class outstanding. A Fund’s total return assumes the reinvestment of dividends and other distributions. |
| | 3 | | Source: iMoneyNet, Inc. February 2017. |
| | 4 | | First Tier Retail – Category includes only non-government retail funds that also are not holding any second-tier securities. Portfolio holdings of first-tier funds include US Treasury, US other, repos, time deposits, domestic bank obligations, foreign bank obligations, first-tier commercial paper, floating rate notes and asset-backed commercial paper. |
| | 5 | | Tax-Free National Retail – Category includes all retail national and state tax-free and municipal money funds. Portfolio holdings of tax-free funds include rated and unrated demand notes, rated and unrated general market notes, commercial paper, put bonds — 6 months & less, put bonds — over 6 months, alternative minimum tax paper and other tax-free holdings. Consists of all funds in the National Tax-Free Retail and State-Specific Retail categories. |
4
YIELD SUMMARY
| | | | | | | | | | | | | | | | | | | | | | | | | | |
| | STANDARDIZED TOTAL RETURNS1,6 | |
| | | For the period
ended 12/31/16 | | SEC 7-Day Current Yield7 | | | One Year | | | Five Years | | | Ten Years | | | Since
Inception | | | Inception
Date | |
| | Money Market | | | 0.80 | % | | | N/A | | | | N/A | | | | N/A | | | | 0.47 | % | | | 1/29/16 | |
| | | Tax-Exempt Money Market | | | 0.55 | | | | 0.32 | % | | | 0.08 | % | | | 0.64 | % | | | 1.80 | | | | 7/19/94 | |
| | 6 | | The Standardized Total Returns are average annual or cumulative total returns (only if the performance period is one year or less) of Class I Shares as of the most recent calendar quarter-end. They assume reinvestment of all distributions at NAV. The SEC 7-Day Current Yield is not a Standardized Total Return. |
| | | | Because Class I Shares do not involve a sales charge, such a charge is not applied to their Standardized Total Returns. |
| | | | The yields and returns represent past performance. Past performance does not guarantee future results. The Funds’ investment yields and returns will fluctuate as market conditions change. Current performance may be lower or higher than the performance quoted above. Please visit our Web site at www.GSAMFUNDS.com to obtain the most recent month-end returns. |
| | | | Performance reflects applicable fee waivers and/or expense limitations in effect during the periods shown. In their absence, performance would be reduced. Returns do not reflect the deduction of taxes that a shareholder would pay on Fund distributions or the redemption of Fund shares. |
| | 7 | | The SEC 7-Day Current Yield figures are as of 12/31/16 and are calculated in accordance with securities industry regulations and do not include net capital gains. SEC 7-Day Current Yield may differ slightly from the actual distribution rate of a given Fund because of the exclusion of distributed capital gains, which are non-recurring. The SEC 7-Day Current Yield more closely reflects a Fund’s current earnings than do the Standardized Total Return figures. |
| | | | | | | | | | | | | | | | | | | | | | |
| | SUMMARY OF THE CLASS I SHARES AS OF 2/28/171 | |
| | | Fund | | 7-Day Dist. Yield8 | | | SEC 7-Day Effective Yield9 | | | 30-Day Average Yield10 | | | Weighted Avg. Maturity (days)11 | | | Weighted Avg. Life (days)12 | |
| | Money Market | | | 0.70 | % | | | 0.70 | % | | | 0.76 | % | | | 36 | | | | 70 | |
| | | Tax-Exempt Money Market | | | 0.50 | | | | 0.50 | | | | 0.50 | | | | 33 | | | | 33 | |
| | | The Yields represent past performance. Past performance does not guarantee future results. Current performance may be lower or higher than the performance quoted above. |
| | | Yields reflect fee waivers and expense limitations in effect and will fluctuate as market conditions change. The yield quotations more closely reflect the current earnings of the Fund. Please visit our Web site at www.GSAMFUNDS.com to obtain the most recent month-end performance. |
| | 8 | | The 7-Day Distribution Yield is the average total return over the previous seven days. It is a Fund’s total income net of expenses, divided by the total number of outstanding shares. This yield can include capital gain/loss distribution, if any. This is not a SEC Yield. |
| | 9 | | The SEC 7-Day Effective Yield of a Fund is calculated in accordance with securities industry regulations and do not include net capital gains. The SEC 7-Day Effective Yield assumes reinvestment of dividends for one year. |
| 10 | | The 30-Day Average Yield is a net annualized yield of 30 days back from the current date listed. This yield includes capital gain/loss distribution. |
| 11 | | A Fund’s weighted average maturity (WAM) is an average of the effective maturities of all securities held in the portfolio, weighted by each security’s percentage of net assets. This must not exceed 60 days as calculated under SEC Rule 2a-7. |
| 12 | | A Fund’s weighted average life (WAL) is an average of the final maturities of all securities held in the portfolio, weighted by each security’s percentage of net assets. This must not exceed 120 days as calculated under SEC Rule 2a-7. |
5
SECTOR ALLOCATIONS
| | | | | | |
| | INVESTOR MONEY MARKET FUND13 | |
| | | As of February 28, 2017 | | | |
| | | Security Type | | (Percentage of Net Assets) | |
| | Certificates of Deposit | | | 0.5 | % |
| | Certificates of Deposit — Yankeedollar | | | 4.8 | |
| | Commercial Paper & Corporate Obligations | | | 38.6 | |
| | Fixed Rate Municipal Debt Obligations | | | 2.5 | |
| | Repurchase Agreements | | | 13.7 | |
| | Variable Rate Municipal Debt Obligations | | | 21.0 | |
| | | Variable Rate Obligations | | | 22.4 | |
| | | As of August 31, 2016 | | | |
| | | Security Type | | (Percentage of Net Assets) | |
| | Certificates of Deposit — Yankeedollar | | | 11.4 | % |
| | Commercial Paper & Corporate Obligations | | | 25.0 | |
| | Fixed Rate Municipal Debt Obligations | | | 2.1 | |
| | Repurchase Agreements | | | 19.1 | |
| | Variable Rate Municipal Debt Obligations | | | 25.4 | |
| | | Variable Rate Obligations | | | 15.9 | |
| 13 | | The Fund is actively managed and, as such, its portfolio composition may differ over time. The percentage shown for each investment category reflects the value (based on amortized cost) of investments in that category as a percentage of net assets. Figures in the above table may not sum to 100% due to the exclusion of other assets and liabilities. |
6
SECTOR ALLOCATIONS
| | | | | | |
| | INVESTOR TAX-EXEMPT MONEY MARKET FUND14 | |
| | | As of February 28, 2017 | | | |
| | | Security Type | | (Percentage of Net Assets) | |
| | Bond Anticipation Notes | | | 1.6 | % |
| | Commercial Paper | | | 12.0 | |
| | General Obligation Bonds | | | 2.3 | |
| | Revenue Anticipation Notes | | | 3.8 | |
| | Revenue Bonds | | | 1.3 | |
| | Tax and Revenue Anticipation Notes | | | 7.6 | |
| | | Variable Rate Obligations | | | 71.9 | |
| | | As of August 31, 2016 | | | |
| | | Security Type | | (Percentage of Net Assets) | |
| | Commercial Paper | | | 8.7 | % |
| | Put Bonds | | | 0.5 | |
| | Tax and Revenue Anticipation Notes | | | 1.3 | |
| | | Variable Rate Obligations | | | 89.5 | |
| 14 | | The Fund is actively managed and, as such, its portfolio composition may differ over time. The percentage shown for each investment category reflects the value (based on amortized cost) of investments in that category as a percentage of net assets. Figures in the above table may not sum to 100% due to the exclusion of other assets and liabilities. |
7
PORTFOLIO RESULTS
Index Definitions
The BofA Merrill Lynch U.S. Dollar Three-Month LIBOR Constant Maturity Index is based on the assumed purchase of a synthetic instrument having three months to maturity and with a coupon equal to the closing quote for three-month LIBOR. That issue is sold the following day (priced at a yield equal to the current day closing three-month LIBOR rate) and is rolled into a new three-month instrument. The index, therefore, will always have a constant maturity equal to exactly three months.
The Securities Industry and Financial Markets Association (“SIFMA”) Municipal Swap Index is a seven-day high-grade market index comprised of tax-exempt variable rate demand obligations with certain characteristics. The Index is calculated and published by Bloomberg. The Index is overseen by SIFMA’s municipal swap index committee.
8
INVESTOR MONEY MARKET FUND
Schedule of Investments
February 28, 2017 (Unaudited)
| | | | | | | | | | | | | | |
Principal
Amount | | | Interest
Rate | | | Maturity
Date | | | Amortized
Cost | |
| Commercial Paper and Corporate Obligations – 38.6% | |
| | Albion Capital LLC | |
| $ | 5,000,000 | | | | 0.753 | % | | | 03/03/17 | | | $ | 4,999,794 | |
| | 2,700,000 | | | | 0.917 | | | | 04/25/17 | | | | 2,696,288 | |
| | Atlantic Asset Securitization LLC | |
| | 500,000 | | | | 1.123 | | | | 03/14/17 | | | | 499,801 | |
| | 1,500,000 | | | | 1.124 | | | | 06/02/17 | | | | 1,495,738 | |
| | Bank of Nova Scotia (The) | |
| | 1,600,000 | | | | 1.228 | | | | 04/26/17 | | | | 1,597,013 | |
| | Bank of Tokyo-Mitsubishi UFJ Ltd. (The) | |
| | 2,000,000 | | | | 1.279 | (a) | | | 08/04/17 | | | | 1,989,167 | |
| | 1,000,000 | | | | 1.331 | (a) | | | 08/18/17 | | | | 993,861 | |
| | Barton Capital S.A. | |
| | 3,000,000 | | | | 0.680 | | | | 03/01/17 | | | | 3,000,000 | |
| | 3,000,000 | | | | 0.733 | | | | 03/03/17 | | | | 2,999,880 | |
| | Charta LLC | |
| | 1,000,000 | | | | 1.197 | | | | 08/03/17 | | | | 994,963 | |
| | CRC Funding LLC | |
| | 1,500,000 | | | | 1.020 | | | | 05/02/17 | | | | 1,497,417 | |
| | Dexia Credit Local New York Branch | |
| | 1,000,000 | | | | 1.197 | | | | 04/21/17 | | | | 998,343 | |
| | 1,000,000 | | | | 1.249 | | | | 05/18/17 | | | | 997,357 | |
| | Erste Abwicklungsanstalt | |
| | 1,000,000 | | | | 1.144 | | | | 05/25/17 | | | | 997,356 | |
| | Fairway Finance Co., LLC | |
| | 3,000,000 | | | | 1.135 | | | | 07/26/17 | | | | 2,986,403 | |
| | Kaiser Foundation Hospitals | |
| | 1,500,000 | | | | 0.928 | | | | 04/03/17 | | | | 1,498,749 | |
| | Kells Funding LLC | |
| | 1,500,000 | | | | 1.123 | | | | 05/24/17 | | | | 1,496,150 | |
| | 3,000,000 | | | | 1.021 | | | | 06/06/17 | | | | 2,991,917 | |
| | Liberty Street Funding LLC | |
| | 3,000,000 | | | | 1.000 | | | | 05/12/17 | | | | 2,994,120 | |
| | 2,000,000 | | | | 1.020 | | | | 05/22/17 | | | | 1,995,444 | |
| | Matchpoint Finance PLC | |
| | 5,000,000 | | | | 0.712 | | | | 03/01/17 | | | | 4,999,999 | |
| | 1,500,000 | | | | 1.102 | | | | 05/02/17 | | | | 1,497,210 | |
| | National Bank of Abu Dhabi PJSC | |
| | 5,000,000 | | | | 0.774 | | | | 03/01/17 | | | | 4,999,999 | |
| | Nieuw Amsterdam Receivables Corp. | |
| | 8,000,000 | | | | 0.815 | | | | 03/02/17 | | | | 7,999,821 | |
| | 1,500,000 | | | | 1.228 | | | | 08/10/17 | | | | 1,491,900 | |
| | Nordea Bank AB | |
| | 2,500,000 | | | | 1.135 | | | | 04/04/17 | | | | 2,497,379 | |
| | 2,500,000 | | | | 0.902 | | | | 05/26/17 | | | | 2,494,715 | |
| | Old Line Funding Corp. | |
| | 4,250,000 | | | | 1.062 | | | | 06/20/17 | | | | 4,236,372 | |
| | Oversea-Chinese Banking Corp., Ltd. | |
| | 3,000,000 | | | | 1.072 | | | | 04/10/17 | | | | 2,996,500 | |
| | SSM Health Care Corp. | |
| | 3,000,000 | | | | 0.917 | | | | 04/20/17 | | | | 2,996,250 | |
| | 3,000,000 | | | | 0.887 | | | | 04/27/17 | | | | 2,995,868 | |
| | Svenska Handelsbanken AB | |
| | 3,000,000 | | | | 0.938 | (a) | | | 05/31/17 | | | | 2,993,023 | |
| | Swedbank AB | |
| | 3,000,000 | | | | 0.959 | | | | 05/25/17 | | | | 2,993,342 | |
| | 3,000,000 | | | | 0.995 | | | | 05/31/17 | | | | 2,992,606 | |
| | |
| Commercial Paper and Corporate Obligations – (continued) | |
| | United Overseas Bank Ltd. | |
| 1,500,000 | | | | 1.155 | | | | 04/21/17 | | | | 1,497,599 | |
| | Versailles Commercial Paper LLC | |
| | 5,000,000 | | | | 0.815 | | | | 03/01/17 | | | | 4,999,999 | |
| | Victory Receivables Corp. | |
| | 5,000,000 | | | | 0.753 | | | | 03/02/17 | | | | 4,999,897 | |
| | 1,350,000 | | | | 0.969 | | | | 03/16/17 | | | | 1,349,466 | |
| | Westpac Banking Corp. | |
| | 1,250,000 | | | | 1.073 | (a) | | | 08/04/17 | | | | 1,244,313 | |
| | 2,000,000 | | | | 1.398 | | | | 09/29/17 | | | | 1,983,982 | |
| | Westpac Securities NZ, Ltd. | |
| | 3,000,000 | | | | 1.228 | | | | 09/05/17 | | | | 2,981,200 | |
| | |
| TOTAL COMMERCIAL PAPER AND
CORPORATE OBLIGATIONS |
| | $ | 106,961,201 | |
| | |
| | | | | | | | | | | | | | |
| Certificate of Deposit – 0.5% | |
| | Citibank, N.A. | |
| $ | 1,400,000 | | | | 1.000 | % | | | 03/13/17 | | | $ | 1,400,000 | |
| | |
| | | | | | | | | | | | | | |
| Certificates of Deposit-Yankeedollar – 4.8% | |
| | Bank of Montreal | |
| $ | 250,000 | | | | 1.534 | %(b) | | | 08/11/17 | | | $ | 250,000 | |
| | Cooperative Rabobank UA | |
| | 500,000 | | | | 1.400 | | | | 09/20/17 | | | | 500,000 | |
| | Credit Agricole Corporate and Investment Bank | |
| | 1,500,000 | | | | 1.140 | | | | 06/02/17 | | | | 1,500,000 | |
| | DZ Bank AG | |
| | 250,000 | | | | 1.240 | | | | 03/31/17 | | | | 250,000 | |
| | 1,300,000 | | | | 1.290 | | | | 08/25/17 | | | | 1,300,000 | |
| | Mitsubishi UFJ Trust & Banking Corp. | |
| | 5,000,000 | | | | 1.130 | | | | 03/06/17 | | | | 5,000,000 | |
| | National Bank of Kuwait | |
| | 4,000,000 | | | | 1.350 | | | | 06/12/17 | | | | 4,000,000 | |
| | Standard Chartered Bank | |
| | 300,000 | | | | 1.714 | | | | 09/20/17 | | | | 300,000 | |
| | Westpac Banking Corp. | |
| | 250,000 | | | | 1.120 | | | | 03/17/17 | | | | 249,999 | |
| | |
| TOTAL CERTIFICATES OF
DEPOSIT-YANKEEDOLLAR |
| | $ | 13,349,999 | |
| | |
| | | | | | | | | | | | | | |
| Fixed Rate Municipal Debt Obligations – 2.5% | |
| | ANZ New Zealand (Int’l) Ltd. | |
| $ | 1,000,000 | | | | 1.400 | %(c) | | | 04/27/17 | | | $ | 1,000,342 | |
| | DNB Bank ASA | |
| | 950,000 | | | | 3.200 | (c) | | | 04/03/17 | | | | 951,775 | |
| | Nordea Bank AB | |
| | 2,000,000 | | | | 3.125 | (c) | | | 03/20/17 | | | | 2,002,654 | |
| | Royal Bank of Canada | |
| | 1,500,000 | | | | 1.500 | (a) | | | 01/16/18 | | | | 1,502,015 | |
| | |
| | |
| The accompanying notes are an integral part of these financial statements. | | 9 |
INVESTOR MONEY MARKET FUND
Schedule of Investments (continued)
February 28, 2017 (Unaudited)
| | | | | | | | | | | | | | |
Principal
Amount | | | Interest
Rate | | | Maturity
Date | | | Amortized
Cost | |
| Fixed Rate Municipal Debt Obligations – (continued) | |
| | UBS AG | |
| $ | 1,500,000 | | | | 1.375 | % | | | 06/01/17 | | | $ | 1,500,500 | |
| | |
| TOTAL FIXED RATE MUNICIPAL
DEBT OBLIGATIONS |
| | $ | 6,957,286 | |
| | |
| | | | | | | | | | | | | | |
| Variable Rate Municipal Debt Obligations(b) – 21.0% | |
| Alaska Housing Finance Corp. VRDN RB for Home Mortgage Series 2002 A
RMKT (JPMorgan Chase Bank N.A., SPA) |
|
| $ | 3,900,000 | | | | 0.640 | % | | | 03/01/17 | | | $ | 3,900,000 | |
| Alaska Housing Finance Corp. VRDN RB Refunding for Governmental Purpose
Series 2001 B RMKT |
|
| | 1,000,000 | | | | 0.620 | | | | 03/07/17 | | | | 1,000,000 | |
| City of Austin, Texas Hotel Occupancy Tax VRDN RB Refunding Subordinate Lien
Series 2008 A RMKT (JPMorgan Chase Bank N.A., LOC) |
|
| | 4,000,000 | | | | 0.660 | | | | 03/07/17 | | | | 4,000,000 | |
| City of Charlotte, North Carolina VRDN RB for Uptown Revitalization Project
Series 2004 (Wells Fargo Bank N.A., SPA) |
|
| | 1,745,000 | | | | 0.730 | | | | 03/07/17 | | | | 1,745,000 | |
| City of Colorado Springs Utilities System VRDN RB for Subordinate Lien
Improvement Series 2006 B RMKT (Landesbank Hessen-Thueringen
Girozentrale, SPA) |
|
| | 300,000 | | | | 0.670 | | | | 03/07/17 | | | | 300,000 | |
| City of Columbia, South Carolina Waterworks & Sewer System VRDN RB
Series 2009 RMKT (Sumitomo Mitsui Banking Corp., LOC) |
|
| | 4,000,000 | | | | 0.650 | | | | 03/07/17 | | | | 4,000,000 | |
| City of Portland, Maine GO VRDN for Taxable Pension Bonds Series 2001 RMKT
(Sumitomo Mitsui Banking Corp., SPA) |
|
| | 500,000 | | | | 0.780 | | | | 03/07/17 | | | | 500,000 | |
| Colorado Health Facilities Authority VRDN RB for SCL Health System
Series 2016 D (Wells Fargo Bank N.A., LIQ) |
|
| | 5,500,000 | | | | 0.640 | | | | 03/07/17 | | | | 5,500,000 | |
| Connecticut Housing Finance Authority VRDN RB Housing Mortgage Finance
Program Series 2008 E (Bank of America N.A., SPA) |
|
| | 1,400,000 | | | | 0.680 | | | | 03/07/17 | | | | 1,400,000 | |
| East Baton Rouge Parish IDB, Inc. VRDN RB for ExxonMobil Project Gulf
Opportunity Zone Series 2011 RMKT |
|
| | 500,000 | | | | 0.560 | | | | 03/01/17 | | | | 499,995 | |
| Fairfax County IDA VRDN RB for Fairfax Hospital Series 1988 A RMKT (Northern
Trust Co., LOC) |
|
| | 300,000 | | | | 0.680 | | | | 03/07/17 | | | | 300,000 | |
| Illinois Development Finance Authority VRDN RB for Evanston Northwestern
Healthcare Corp. Series 2001 B RMKT (JPMorgan Chase Bank N.A., SPA) |
|
| | 750,000 | | | | 0.580 | | | | 03/01/17 | | | | 750,000 | |
| Illinois Toll Highway Authority VRDN RB Senior Priority Series 2007 A-2C RMKT
(Landesbank Hessen-Thueringen Girozentrale, LOC) |
|
| | 2,300,000 | | | | 0.660 | | | | 03/07/17 | | | | 2,300,000 | |
| Jacksonville Electric Authority Water & Sewer System VRDN RB Refunding
Series 2008 Subseries B-1 RMKT (State Street Bank & Trust Co., SPA) |
|
| | 3,000,000 | | | | 0.660 | | | | 03/07/17 | | | | 3,000,000 | |
| Massachusetts Health & Educational Facilities Authority VRDN RB for Museum
of Fine Arts Series 2007 A-1 RMKT (Wells Fargo Bank N.A., SPA) |
|
| | 2,700,000 | | | | 0.570 | | | | 03/01/17 | | | | 2,700,000 | |
| Metropolitan Washington D.C. Airport Authority VRDN RB Refunding
Series 2010 Subseries C-2 RMKT (Sumitomo Mitsui Banking Corp., LOC) |
|
| | 200,000 | | | | 0.640 | | | | 03/07/17 | | | | 200,000 | |
| | |
| Variable Rate Municipal Debt Obligations(b) – (continued) | |
| Mississippi Business Finance Commission Gulf Opportunity Zone VRDN RB for
Chevron USA, Inc. Project Series 2007 A (GTY AGMT – Chevron Corp.) |
|
| 300,000 | | | | 0.570 | | | | 03/01/17 | | | | 300,000 | |
| Mississippi Business Finance Commission Gulf Opportunity Zone VRDN RB for
Chevron USA, Inc. Project Series 2010 H (GTY AGMT – Chevron Corp.) |
|
| | 3,500,000 | | | | 0.570 | | | | 03/01/17 | | | | 3,500,000 | |
| Missouri Health & Educational Facilities Authority VRDN RB Refunding for BJC
Health System Series 2005 B RMKT |
|
| | 3,000,000 | | | | 0.610 | | | | 03/07/17 | | | | 3,000,000 | |
| New York City GO VRDN Refunding Series 2008 Subseries J-5 (Bank of America
N.A., SPA) |
|
| | 1,500,000 | | | | 0.570 | | | | 03/01/17 | | | | 1,500,000 | |
| New York City GO VRDN Refunding Series 2008 Subseries J-6 (Landesbank
Hessen-Thueringen Girozentrale, LOC) |
|
| | 500,000 | | | | 0.630 | | | | 03/01/17 | | | | 500,000 | |
| Ohio Water Development Authority VRDN RB for Water Pollution Control Loan
Fund Series 2016 A (BMO Harris Bank, N.A., LIQ) |
|
| | 4,000,000 | | | | 0.670 | | | | 03/07/17 | | | | 4,000,000 | |
| Orlando Utilities Commission VRDN RB Series 2008-2 RMKT (JPMorgan Chase
Bank N.A., SPA) |
|
| | 400,000 | | | | 0.670 | | | | 03/07/17 | | | | 400,000 | |
| Philadelphia Hospitals & Higher Education Facilities Authority VRDN RB for
Children’s Hospital of Philadelphia Project Series 2011 A RMKT (JPMorgan
Chase Bank, SPA) |
|
| | 3,415,000 | | | | 0.560 | | | | 03/01/17 | | | | 3,415,000 | |
| Pinellas County Health Facilities Authority VRDN RB for BayCare Health System
Series 2009 A2 (Northern Trust Co., LOC) |
|
| | 725,000 | | | | 0.650 | | | | 03/07/17 | | | | 725,000 | |
| | State of Ohio GO VRDN Refunding for Infrastructure Improvement Series 2003 D | |
| | 200,000 | | | | 0.660 | | | | 03/07/17 | | | | 200,000 | |
| State of Texas GO VRDN for Veterans Bonds Series 2016 (Landesbank Hessen-
Thueringen Girozentrale, SPA) |
|
| | 300,000 | | | | 0.650 | | | | 03/07/17 | | | | 300,000 | |
| Tarrant County Cultural Education Facilities Finance Corp. VRDN RB Refunding
for Texas Health Resources Series 2008 C RMKT |
|
| | 475,000 | | | | 0.660 | | | | 03/07/17 | | | | 475,000 | |
| Triborough Bridge & Tunnel Authority VRDN Refunding Floating RB Series 2013
Subseries 2B RMKT (Bank of America N.A., LOC) |
|
| | 3,500,000 | | | | 0.730 | | | | 03/07/17 | | | | 3,500,000 | |
| | University of Delaware VRDN RB Series 2004 B (Bank of America N.A., SPA) | |
| | 2,820,000 | | | | 0.570 | | | | 03/01/17 | | | | 2,820,000 | |
| Washington State Housing Finance Commission VRDN RB for Discovery Heights
Apartments Series 2010 (FHLMC, LIQ) |
|
| | 1,300,000 | | | | 0.660 | | | | 03/07/17 | | | | 1,300,000 | |
| | |
| TOTAL VARIABLE RATE MUNICIPAL
DEBT OBLIGATIONS |
| | $ | 58,029,995 | |
| | |
| | | | | | | | | | | | | | |
| Variable Rate Obligations(b) – 22.4% | |
| | Banco Del Estado De Chile | |
| $ | 1,000,000 | | | | 1.363 | % | | | 03/09/17 | | | $ | 1,000,000 | |
| | Bank of Montreal | |
| | 1,000,000 | | | | 1.216 | | | | 08/07/17 | | | | 1,000,000 | |
| | Bank of Nova Scotia (The) | |
| | 500,000 | | | | 1.383 | | | | 03/09/17 | | | | 500,000 | |
| | |
| | |
| 10 | | The accompanying notes are an integral part of these financial statements. |
INVESTOR MONEY MARKET FUND
| | | | | | | | | | | | | | |
Principal
Amount | | | Interest
Rate | | | Maturity
Date | | | Amortized
Cost | |
| Variable Rate Obligations(b) – (continued) | |
| | BNP Paribas | |
| $ | 1,000,000 | | | | 1.494 | % | | | 05/07/17 | | | $ | 1,000,786 | |
| | BNZ International Funding Ltd. | |
| | 1,900,000 | | | | 1.488 | (c) | | | 10/04/17 | | | | 1,900,000 | |
| | Canadian Imperial Bank of Commerce | |
| | 3,000,000 | | | | 1.452 | | | | 10/13/17 | | | | 3,000,000 | |
| | Chase Bank USA, N.A. | |
| | 491,000 | | | | 1.351 | | | | 06/09/17 | | | | 490,895 | |
| | Collateralized Commercial Paper II Co., LLC | |
| | 250,000 | | | | 1.505 | (c) | | | 07/06/17 | | | | 250,000 | |
| | 1,000,000 | | | | 1.372 | (c) | | | 01/17/18 | | | | 1,000,000 | |
| | 1,000,000 | | | | 1.377 | (c) | | | 01/24/18 | | | | 1,000,000 | |
| | Commonwealth Bank of Australia | |
| | 800,000 | | | | 1.487 | | | | 07/27/17 | | | | 799,910 | |
| | 3,000,000 | | | | 0.000 | (a)(c) | | | 02/23/18 | | | | 3,000,000 | |
| | Credit Suisse AG | |
| | 500,000 | | | | 1.477 | | | | 03/31/17 | | | | 500,000 | |
| | 2,000,000 | | | | 1.476 | | | | 04/07/17 | | | | 2,000,000 | |
| | Dexia Credit Local | |
| | 2,500,000 | | | | 1.187 | | | | 11/22/17 | | | | 2,500,000 | |
| | DNB Bank ASA | |
| | 3,000,000 | | | | 0.988 | | | | 08/28/17 | | | | 3,000,000 | |
| | HSBC Bank PLC | |
| | 1,500,000 | | | | 1.238 | (c) | | | 11/01/17 | | | | 1,500,000 | |
| | J.P. Morgan Securities LLC | |
| | 3,000,000 | | | | 1.031 | (c) | | | 09/01/17 | | | | 3,000,000 | |
| | Metropolitan Life Global Funding I | |
| | 1,000,000 | | | | 1.390 | (c) | | | 04/10/17 | | | | 1,000,410 | |
| | Mizuho Bank Ltd. | |
| | 2,000,000 | | | | 1.329 | | | | 08/02/17 | | | | 2,000,000 | |
| | National Australia Bank Ltd. | |
| | 900,000 | | | | 1.315 | | | | 06/08/17 | | | | 899,527 | |
| | Nordea Bank AB | |
| | 650,000 | | | | 1.446 | | | | 09/06/17 | | | | 650,000 | |
| | Norinchukin Bank (The) | |
| | 5,000,000 | | | | 1.476 | | | | 04/10/17 | | | | 5,000,000 | |
| | 1,500,000 | | | | 1.129 | | | | 08/24/17 | | | | 1,500,000 | |
| | Oversea-Chinese Banking Corp., Ltd. | |
| | 1,300,000 | | | | 1.369 | (c) | | | 11/15/17 | | | | 1,300,000 | |
| | Royal Bank of Canada | |
| | 1,500,000 | | | | 1.409 | | | | 10/05/17 | | | | 1,499,990 | |
| | Skandinaviska Enskilda Banken AB | |
| | 3,500,000 | | | | 0.988 | | | | 08/23/17 | | | | 3,500,000 | |
| | Standard Chartered Bank | |
| | 2,000,000 | | | | 1.539 | | | | 07/19/17 | | | | 2,000,000 | |
| | 250,000 | | | | 1.482 | | | | 10/12/17 | | | | 250,000 | |
| | State Street Bank & Trust Co. | |
| | 1,400,000 | | | | 1.278 | | | | 03/30/17 | | | | 1,400,292 | |
| | Sumitomo Mitsui Banking Corp. | |
| | 1,000,000 | | | | 1.375 | | | | 05/08/17 | | | | 1,000,000 | |
| | 1,000,000 | | | | 1.182 | | | | 08/10/17 | | | | 1,000,000 | |
| | Sumitomo Mitsui Trust Bank Ltd. | |
| | 4,000,000 | | | | 1.159 | | | | 08/21/17 | | | | 4,000,000 | |
| | Svenska Handelsbanken AB | |
| | 1,400,000 | | | | 1.294 | | | | 08/01/17 | | | | 1,400,657 | |
| | Toronto-Dominion Bank (The) | |
| | 3,000,000 | | | | 1.219 | | | | 11/02/17 | | | | 3,000,000 | |
| | |
| Variable Rate Obligations(b) – (continued) | |
| | Wells Fargo Bank N.A. | |
| 500,000 | | | | 1.478 | | | | 09/22/17 | | | | 500,000 | |
| | 1,500,000 | | | | 1.357 | | | | 01/26/18 | | | | 1,500,000 | |
| | Westpac Banking Corp. | |
| | 550,000 | | | | 1.504 | (c) | | | 08/07/17 | | | | 550,878 | |
| | Westpac Securities NZ, Ltd. | |
| | 750,000 | | | | 1.534 | (c) | | | 08/11/17 | | | | 749,916 | |
| | |
| TOTAL VARIABLE RATE
OBLIGATIONS |
| | $ | 62,143,261 | |
| | |
| TOTAL INVESTMENTS BEFORE
REPURCHASE AGREEMENTS |
| | $ | 248,841,742 | |
| | |
| | | | | | | | | | | | | | |
| Repurchase Agreements(d) – 13.7% | |
| | Joint Repurchase Agreement Account III | |
| $ | 37,800,000 | | | | 0.536 | % | | | 03/01/17 | | | $ | 37,800,000 | |
| | Maturity Value: $37,800,562 | |
| | |
| | TOTAL INVESTMENTS – 103.5% | | | $ | 286,641,742 | |
| | |
| LIABILITIES IN EXCESS OF
OTHER ASSETS – (3.5)% |
| | | (9,726,083 | ) |
| | |
| | NET ASSETS – 100.0% | | | $ | 276,915,659 | |
| | |
| | |
| The percentage shown for each investment category reflects the value of investments in that category as a percentage of net assets. |
(a) | | All or a portion represents a forward commitment. |
(b) | | Variable or floating rate security. Interest rate disclosed is that which is in effect at February 28, 2017. |
(c) | | Security not registered under the Securities Act of 1933, as amended. Such securities may be deemed liquid by the Investment Adviser. At February 28, 2017, these securities amounted to $19,205,975 or approximately 6.9% of net assets. |
(d) | | Unless noted, all repurchase agreements were entered into on February 28, 2017. Additional information on Joint Repurchase Agreement Account III appears on pages 18 and 19. |
Interest rates represent either the stated coupon rate, annualized yield on date of purchase for discounted securities, or, for floating rate securities, the current reset rate, which is based upon current interest rate indices.
Maturity dates represent either the final legal maturity date on the security, the demand date for puttable securities, or the prerefunded date for those types of securities.
| | |
| The accompanying notes are an integral part of these financial statements. | | 11 |
INVESTOR MONEY MARKET FUND
Schedule of Investments (continued)
February 28, 2017 (Unaudited)
| | |
|
Investment Abbreviations: |
FHLMC | | —Insured by Federal Home Loan Mortgage Corp. |
GO | | —General Obligation |
GTY AGMT | | —Guaranty Agreement |
IDA | | —Industrial Development Agency |
IDB | | —Industrial Development Board |
LIQ | | —Liquidity Agreement |
LOC | | —Letter of Credit |
RB | | —Revenue Bond |
RMKT | | —Remarketed |
SPA | | —Stand-by Purchase Agreement |
VRDN | | —Variable Rate Demand Notes |
|
| | |
| 12 | | The accompanying notes are an integral part of these financial statements. |
INVESTOR TAX-EXEMPT MONEY MARKET FUND
Schedule of Investments
February 28, 2017 (Unaudited)
| | | | | | | | | | | | | | |
Principal Amount | | | Interest Rate | | | Maturity Date | | | Amortized Cost | |
| Municipal Debt Obligations – 100.5% | |
| Alabama – 4.1% | |
| Columbia IDB VRDN PCRB Refunding for Alabama Power Co.
Project Series 2014 C |
|
| $ | 10,000,000 | | | | 0.670 | % | | | 03/01/17 | | | $ | 10,000,000 | |
| | Huntsville Health Care Authority CP Series 2017 | |
| | 17,300,000 | | | | 0.840 | | | | 06/01/17 | | | | 17,300,000 | |
| Mobile IDB VRDN PCRB for Alabama Power Co. Barry Plant
Project Series 2007 C RMKT |
|
| | 11,500,000 | | | | 0.680 | | | | 03/07/17 | | | | 11,500,000 | |
| | | | | | | | | | | | | | |
| | | | | | | | | | | | | 38,800,000 | |
| | |
| Alaska – 3.5% | |
| Alaska Housing Finance Corp. Home Mortgage VRDN RB
Refunding Series 2009 D RMKT (Bank of America N.A.,
SPA) |
|
| | 11,080,000 | | | | 0.620 | | | | 03/07/17 | | | | 11,080,000 | |
| Alaska Housing Finance Corp. VRDN RB Refunding for
Governmental Purpose Series 2001 A RMKT |
|
| | 13,810,000 | | | | 0.620 | | | | 03/07/17 | | | | 13,810,000 | |
| Alaska Housing Finance Corp. VRDN RB Refunding for
Governmental Purpose Series 2001 B RMKT |
|
| | 450,000 | | | | 0.620 | | | | 03/07/17 | | | | 450,000 | |
| Alaska Housing Finance Corp. VRDN RB State Capital Project
Series 2002 C RMKT |
|
| | 7,110,000 | | | | 0.640 | | | | 03/07/17 | | | | 7,110,000 | |
| | | | | | | | | | | | | | |
| | | | | | | | | | | | | 32,450,000 | |
| | |
| Arizona – 1.0% | |
| Arizona Health Facilities Authority VRDN RB Refunding for
Banner Health Series 2008 G (Wells Fargo Bank N.A., LOC) |
|
| | 8,665,000 | | | | 0.650 | | | | 03/07/17 | | | | 8,665,000 | |
| City of Phoenix IDA Health Care Facilities VRDN RB for Mayo
Clinic Series 2014 A (GTY AGMT – Mayo Clinic) (Bank of
America N.A., SPA) |
|
| | 750,000 | | | | 0.550 | | | | 03/01/17 | | | | 750,000 | |
| | | | | | | | | | | | | | |
| | | | | | | | | | | | | 9,415,000 | |
| | |
| California – 8.3% | |
| California School Cash Reserve Program Authority RB
Series 2016 C |
|
| | 16,390,000 | | | | 2.000 | | | | 06/30/17 | | | | 16,455,262 | |
| California Statewide Communities Development Authority CP for
Kaiser Permanente Series 2017 04-I |
|
| | 500,000 | | | | 0.780 | | | | 03/09/17 | | | | 500,000 | |
| | 16,100,000 | | | | 0.780 | | | | 03/14/17 | | | | 16,100,000 | |
| | City of Los Angeles GO TRANS Series 2016 B | |
| | 18,400,000 | | | | 3.000 | | | | 06/29/17 | | | | 18,527,912 | |
| City of Santa Clara Electric VRDN RB Refunding Series 2008
Subseries B RMKT (Bank of Tokyo-Mitsubishi UFJ, LOC) |
|
| | 3,100,000 | | | | 0.640 | | | | 03/07/17 | | | | 3,100,000 | |
| Eastern Municipal Water District VRDN RB Refunding for Water
and Wastewater Series 2014 A (Wells Fargo Bank N.A., SPA) |
|
| | 250,000 | | | | 0.600 | | | | 03/07/17 | | | | 250,000 | |
| Sacramento County Housing Authority VRDN RB Refunding for
River Terrace Apartments Series 1996 C RMKT (FNMA)
(FNMA, LIQ) |
|
| | 7,160,000 | | | | 0.580 | | | | 03/07/17 | | | | 7,160,000 | |
| | |
| Municipal Debt Obligations – (continued) | |
| California – (continued) | |
| | State of California GO Refunding Series 2015 | |
| 9,345,000 | | | | 5.000 | | | | 08/01/17 | | | | 9,507,750 | |
| The Regents of the University of California VRDN RB Refunding
General Series 2013 AL-2 |
|
| | 5,525,000 | | | | 0.610 | | | | 03/07/17 | | | | 5,525,000 | |
| | | | | | | | | | | | | | |
| | | | | | | | | | | | | 77,125,924 | |
| | |
| Colorado – 3.5% | |
| City of Colorado Springs Utilities System VRDN RB for
Subordinate Lien Improvement Series 2006 B RMKT
(Landesbank Hessen-Thueringen Girozentrale, SPA) |
|
| | 2,400,000 | | | | 0.670 | | | | 03/07/17 | | | | 2,400,000 | |
| City of Colorado Springs Utilities System VRDN RB for
Subordinate Lien Series 2000 A RMKT (Landesbank Hessen-
Thueringen Girozentrale, SPA) |
|
| | 3,000,000 | | | | 0.670 | | | | 03/07/17 | | | | 3,000,000 | |
| Colorado Health Facilities Authority VRDN RB for SCL Health
System Series 2016 D (Wells Fargo Bank N.A., LIQ) |
|
| | 11,200,000 | | | | 0.640 | | | | 03/07/17 | | | | 11,200,000 | |
| Colorado Housing & Finance Authority VRDN RB Refunding for
Single Family Mortgage Class I Adjustable Series 2001 AA-2
RMKT (Sumitomo Mitsui Banking Corp., LOC) |
|
| | 7,045,000 | | | | 0.670 | | | | 03/07/17 | | | | 7,045,000 | |
| University of Colorado Hospital Authority VRDN RB Refunding
Series 2017 B-1 |
|
| | 6,000,000 | | | | 0.660 | | | | 03/07/17 | | | | 6,000,000 | |
| University of Colorado Hospital Authority VRDN RB Refunding
Series 2017 B-2 |
|
| | 3,450,000 | | | | 0.660 | | | | 03/07/17 | | | | 3,450,000 | |
| | | | | | | | | | | | | | |
| | | | | | | | | | | | | 33,095,000 | |
| | |
| Connecticut – 2.0% | |
| Connecticut Housing Finance Authority VRDN RB Housing
Mortgage Finance Program Refunding Series 2011
Subseries E-3 (Bank of Tokyo-Mitsubishi UFJ, SPA) |
|
| | 12,830,000 | | | | 0.640 | | | | 03/07/17 | | | | 12,830,000 | |
| Connecticut Housing Finance Authority VRDN RB Housing
Mortgage Finance Program Refunding Series 2014
Subseries C-2 (Bank of Tokyo-Mitsubishi UFJ, SPA) |
|
| | 5,500,000 | | | | 0.640 | | | | 03/07/17 | | | | 5,500,000 | |
| | | | | | | | | | | | | | |
| | | | | | | | | | | | | 18,330,000 | |
| | |
| Delaware – 2.5% | |
| University of Delaware VRDN RB Series 2004 B (Bank of
America N.A., SPA) |
|
| | 22,865,000 | | | | 0.570 | | | | 03/01/17 | | | | 22,865,000 | |
| | |
| District of Columbia – 0.5% | |
| District of Columbia Income Tax Secured VRDN RB Refunding
Series 2014 B(a) |
|
| | 4,800,000 | | | | 0.940 | | | | 03/07/17 | | | | 4,802,640 | |
| | |
| Florida – 3.0% | |
| Jacksonville Electric Authority Electric System VRDN RB
Series Three 2008 A RMKT (Royal Bank of Canada, SPA) |
|
| | 5,170,000 | | | | 0.640 | | | | 03/07/17 | | | | 5,170,000 | |
| | |
| | |
| The accompanying notes are an integral part of these financial statements. | | 13 |
INVESTOR TAX-EXEMPT MONEY MARKET FUND
Schedule of Investments (continued)
February 28, 2017 (Unaudited)
| | | | | | | | | | | | | | |
Principal Amount | | | Interest Rate | | | Maturity Date | | | Amortized Cost | |
| Municipal Debt Obligations – (continued) | |
| Florida – (continued) | |
| Jacksonville Electric Authority Water & Sewer System VRDN
RB Refunding Series 2008 B RMKT (JPMorgan Chase Bank
N.A., SPA) |
|
| $ | 9,380,000 | | | | 0.640 | % | | | 03/07/17 | | | $ | 9,380,000 | |
| Pinellas County Health Facilities Authority VRDN RB for
BayCare Health System Series 2009 A2 (Northern Trust Co.,
LOC) |
|
| | 13,025,000 | | | | 0.650 | | | | 03/07/17 | | | | 13,025,000 | |
| | | | | | | | | | | | | | |
| | | | | | | | | | | | | 27,575,000 | |
| | |
| Georgia – 2.2% | |
| Private Colleges & Universities Authority VRDN RB Refunding
for Emory University Series 2005 B-1 |
|
| | 10,200,000 | | | | 0.630 | | | | 03/07/17 | | | | 10,200,000 | |
| Private Colleges & Universities Authority VRDN RB Refunding
for Emory University Series 2005 B-3 |
|
| | 2,900,000 | | | | 0.600 | | | | 03/07/17 | | | | 2,900,000 | |
| | State of Georgia GO Refunding Series 2015 C | |
| | 7,000,000 | | | | 5.000 | | | | 07/01/17 | | | | 7,097,266 | |
| | State of Georgia GO Series 2007 B | |
| | 225,000 | | | | 5.000 | | | | 04/01/17 | | | | 225,812 | |
| | | | | | | | | | | | | | |
| | | | | | | | | | | | | 20,423,078 | |
| | |
| Idaho – 1.3% | |
| | State of Idaho GO TANS Series 2016 | |
| | 12,000,000 | | | | 2.000 | | | | 06/30/17 | | | | 12,046,914 | |
| | |
| Illinois – 1.9% | |
| Illinois Finance Authority VRDN RB for Northwestern
University Series 2008 Subseries B RMKT |
|
| | 5,000,000 | | | | 0.620 | | | | 03/07/17 | | | | 5,000,000 | |
| Illinois Toll Highway Authority VRDN RB Senior Priority
Series 2007 A-2C RMKT (Landesbank Hessen-Thueringen
Girozentrale, LOC) |
|
| | 12,700,000 | | | | 0.660 | | | | 03/07/17 | | | | 12,700,000 | |
| | | | | | | | | | | | | | |
| | | | | | | | | | | | | 17,700,000 | |
| | |
| Iowa – 1.4% | |
| Iowa Finance Authority VRDN RB Refunding for Trinity Health
Series 2000 D |
|
| | 12,880,000 | | | | 0.610 | | | | 03/07/17 | | | | 12,880,000 | |
| | |
| Louisiana – 0.6% | |
| East Baton Rouge Parish VRDN PCRB Refunding for
ExxonMobil Project Series 1993 |
|
| | 6,000,000 | | | | 0.560 | | | | 03/01/17 | | | | 6,000,000 | |
| | |
| Maryland – 0.7% | |
| Washington Suburban Sanitary District GO VRDN BANS
Series 2013 A (TD Bank N.A., SPA) |
|
| | 6,100,000 | | | | 0.620 | | | | 03/07/17 | | | | 6,100,000 | |
| | |
| Massachusetts – 4.9% | |
| | Commonwealth of Massachusetts (The) GO RANS Series 2016 B | |
| | 19,100,000 | | | | 2.000 | | | | 05/22/17 | | | | 19,148,915 | |
| Massachusetts Health & Educational Facilities Authority VRDN
RB for Harvard University Series 2000 Y |
|
| | 9,600,000 | | | | 0.620 | | | | 03/07/17 | | | | 9,600,000 | |
| | |
| Municipal Debt Obligations – (continued) | |
| Massachusetts – (continued) | |
| Massachusetts Health & Educational Facilities Authority VRDN
RB for Museum of Fine Arts Series 2007 A-1 RMKT (Wells
Fargo Bank N.A., SPA) |
|
| 7,550,000 | | | | 0.570 | | | | 03/01/17 | | | | 7,550,000 | |
| Massachusetts Health & Educational Facilities Authority VRDN
RB for Museum of Fine Arts Series 2007 A-2 RMKT (Bank of
America N.A., SPA) |
|
| | 965,000 | | | | 0.570 | | | | 03/01/17 | | | | 965,000 | |
| Massachusetts Water Resources Authority VRDN RB Refunding
Subordinated General Series 2008 E (JPMorgan Chase Bank
N.A., SPA) |
|
| | 8,740,000 | | | | 0.640 | | | | 03/07/17 | | | | 8,740,000 | |
| | | | | | | | | | | | | | |
| | | | | | | | | | | | | 46,003,915 | |
| | |
| Minnesota – 2.6% | |
| Minnesota Higher Education Facilities Authority VRDN RB
Refunding for Carleton College Series 2005 Six D RMKT
(JPMorgan Chase Bank N.A., SPA) |
|
| | 4,360,000 | | | | 0.680 | | | | 03/07/17 | | | | 4,360,000 | |
| | Rochester Health Care Facilities CP Series 2017 | |
| | 20,000,000 | | | | 0.700 | | | | 04/05/17 | | | | 20,000,000 | |
| | | | | | | | | | | | | | |
| | | | | | | | | | | | | 24,360,000 | |
| | |
| Mississippi – 4.3% | |
| Mississippi Business Finance Commission Gulf Opportunity Zone
VRDN RB for Chevron USA, Inc. Project Series 2007 B
RMKT (GTY AGMT – Chevron Corp.) |
|
| | 11,160,000 | | | | 0.570 | | | | 03/01/17 | | | | 11,160,000 | |
| Mississippi Business Finance Commission Gulf Opportunity Zone
VRDN RB for Chevron USA, Inc. Project Series 2009 B (GTY
AGMT – Chevron Corp.) |
|
| | 7,700,000 | | | | 0.570 | | | | 03/01/17 | | | | 7,700,000 | |
| Mississippi Business Finance Commission Gulf Opportunity Zone
VRDN RB for Chevron USA, Inc. Project Series 2010 E (GTY
AGMT – Chevron Corp.) |
|
| | 6,200,000 | | | | 0.630 | | | | 03/07/17 | | | | 6,200,000 | |
| Mississippi Business Finance Commission Gulf Opportunity Zone
VRDN RB for Chevron USA, Inc. Project Series 2011 E (GTY
AGMT – Chevron Corp.) |
|
| | 14,700,000 | | | | 0.570 | | | | 03/01/17 | | | | 14,700,000 | |
| | | | | | | | | | | | | | |
| | | | | | | | | | | | | 39,760,000 | |
| | |
| Missouri – 2.5% | |
| Missouri Development Finance Board Cultural Facilities VRDN
RB for Kauffman Center Performing Arts Series 2007 A
RMKT (Northern Trust Co., SPA) |
|
| | 5,800,000 | | | | 0.580 | | | | 03/01/17 | | | | 5,800,000 | |
| Missouri Development Finance Board Cultural Facilities VRDN
RB for Nelson Gallery Foundation Series 2004 A RMKT
(Northern Trust Co., SPA) |
|
| | 10,500,000 | | | | 0.560 | | | | 03/01/17 | | | | 10,500,000 | |
| Missouri Health & Educational Facilities Authority VRDN RB
Refunding for BJC Health System Series 2005 B RMKT |
|
| | 7,000,000 | | | | 0.610 | | | | 03/07/17 | | | | 7,000,000 | |
| | | | | | | | | | | | | | |
| | | | | | | | | | | | | 23,300,000 | |
| | |
| | |
| 14 | | The accompanying notes are an integral part of these financial statements. |
INVESTOR TAX-EXEMPT MONEY MARKET FUND
| | | | | | | | | | | | | | |
Principal Amount | | | Interest Rate | | | Maturity Date | | | Amortized Cost | |
| Municipal Debt Obligations – (continued) | |
| Multi-State – 4.0% | |
| Federal Home Loan Mortgage Corporation VRDN RB for Multi-
Family Variable Rate Certificates Series 2014-M031 Class A
(FHLMC, LIQ) |
|
| $ | 22,715,000 | | | | 0.650 | % | | | 03/07/17 | | | $ | 22,715,000 | |
| Federal Home Loan Mortgage Corporation VRDN RB for Multi-
Family Variable Rate Certificates Series 2015-M033 Class A
(FHLMC, LIQ) |
|
| | 10,450,000 | | | | 0.650 | | | | 03/07/17 | | | | 10,450,000 | |
| Nuveen AMT-Free Municipal Income Fund VRDP
Series 2013-2-1309 (Citibank N.A., LIQ)(b) |
|
| | 4,500,000 | | | | 0.740 | | | | 03/07/17 | | | | 4,500,000 | |
| | | | | | | | | | | | | | |
| | | | | | | | | | | | | 37,665,000 | |
| | |
| New Jersey – 1.6% | |
| | County of Bergen GO BANS Refunding Series 2016 B | |
| | 14,850,000 | | | | 2.000 | | | | 12/14/17 | | | | 14,960,142 | |
| | |
| New York – 15.7% | |
| County of Nassau Interim Finance Authority VRDN RB
Refunding Series 2008 D-1 RMKT (BMO Harris Bank N.A.,
SPA) |
|
| | 6,000,000 | | | | 0.640 | | | | 03/07/17 | | | | 6,000,000 | |
| New York City GO VRDN Refunding Series 2008 Subseries J-6
(Landesbank Hessen-Thueringen Girozentrale, LOC) |
|
| | 14,680,000 | | | | 0.630 | | | | 03/01/17 | | | | 14,680,000 | |
| New York City GO VRDN Series 2013 Subseries F-3 (Bank of
America N.A., LIQ) |
|
| | 1,600,000 | | | | 0.570 | | | | 03/01/17 | | | | 1,600,000 | |
| New York City Housing Development Corp. Multi-Family
Mortgage VRDN RB for Bruckner by the Bridge Series 2008 A
RMKT (FHLMC, LIQ) |
|
| | 8,000,000 | | | | 0.650 | | | | 03/07/17 | | | | 8,000,000 | |
| New York City Housing Development Corp. Multi-Family
Mortgage VRDN RB for Elliot Chelsea Development
Series 2010 A RMKT (FHLMC, LIQ) |
|
| | 800,000 | | | | 0.640 | | | | 03/07/17 | | | | 800,000 | |
| New York City Municipal Water Finance Authority Water &
Sewer System VRDN RB Refunding Series 2001 Subseries F-1
(Mizuho Bank, Ltd., SPA) |
|
| | 3,700,000 | | | | 0.620 | | | | 03/01/17 | | | | 3,700,000 | |
| New York City Municipal Water Finance Authority Water &
Sewer System VRDN RB Second General Resolution
Refunding Series 2008 Subseries BB-2 (Landesbank Hessen-
Thueringen Girozentrale, SPA) |
|
| | 2,900,000 | | | | 0.620 | | | | 03/01/17 | | | | 2,900,000 | |
| New York City Municipal Water Finance Authority Water &
Sewer System VRDN RB Second General Resolution
Refunding Series 2015 Subseries AA-2 (PNC Bank N.A., SPA) |
|
| | 2,000,000 | | | | 0.600 | | | | 03/01/17 | | | | 2,000,000 | |
| New York City Transitional Finance Authority RB Refunding for
Future Tax Secured Series 2012 B |
|
| | 12,145,000 | | | | 5.000 | | | | 11/01/17 | | | | 12,478,345 | |
| New York City Transitional Finance Authority VRDN RB for
Future Tax Secured Series 1998 Subseries A-1 (JPMorgan
Chase Bank N.A., SPA) |
|
| | 90,000 | | | | 0.640 | | | | 03/07/17 | | | | 90,000 | |
| | |
| Municipal Debt Obligations – (continued) | |
| New York – (continued) | |
| New York City Trust for Cultural Resources VRDN RB for
Metropolitan Museum of Art Series 2006 A1 RMKT |
|
| 11,900,000 | | | | 0.620 | | | | 03/07/17 | | | | 11,900,000 | |
| New York City Trust for Cultural Resources VRDN RB for
Metropolitan Museum of Art Series 2006 A2 RMKT |
|
| | 7,450,000 | | | | 0.620 | | | | 03/07/17 | | | | 7,450,000 | |
| New York City Trust for Cultural Resources VRDN RB
Refunding for The New York Botanical Garden Series 2009 A
(JPMorgan Chase Bank N.A., LOC) |
|
| | 6,010,000 | | | | 0.640 | | | | 03/07/17 | | | | 6,010,000 | |
| New York State Dormitory Authority Non-State Supported Debt
VRDN RB for University of Rochester Series 2003 C RMKT
(JPMorgan Chase Bank N.A., LOC) |
|
| | 7,890,000 | | | | 0.650 | | | | 03/07/17 | | | | 7,890,000 | |
| New York State Housing Finance Agency VRDN RB for
100 Maiden Lane Series 2004 A RMKT (FNMA, LIQ)
(FNMA, LOC) |
|
| | 9,000,000 | | | | 0.630 | | | | 03/07/17 | | | | 9,000,000 | |
| New York State Housing Finance Agency VRDN RB for
20 River Terrace Housing Series 2002 A RMKT (FNMA,
LIQ) (FNMA, LOC) |
|
| | 5,100,000 | | | | 0.640 | | | | 03/07/17 | | | | 5,100,000 | |
| New York State Housing Finance Agency VRDN RB for West
37th Street Housing Series 2009 A RMKT (FHLMC, LIQ) |
|
| | 6,800,000 | | | | 0.640 | | | | 03/07/17 | | | | 6,800,000 | |
| New York State Housing Finance Agency VRDN RB Refunding
for Taconic Housing West 17th Street Series 2009 A (FNMA,
LIQ) (FNMA, LOC) |
|
| | 18,800,000 | | | | 0.560 | | | | 03/07/17 | | | | 18,800,000 | |
| New York State Local Government Assistance Corp. VRDN RB
Refunding for Subordinated Lien Series 2003 4V RMKT (Bank
of America N.A., SPA) |
|
| | 4,000,000 | | | | 0.640 | | | | 03/07/17 | | | | 4,000,000 | |
| New York State Power Authority CP Series 2017-1 (JPMorgan
Chase Bank N.A., TD Bank N.A., State Street Bank & Trust
Co. and Wells Fargo Bank N.A., LOC) |
|
| | 10,000,000 | | | | 0.770 | | | | 04/04/17 | | | | 10,000,000 | |
| Triborough Bridge & Tunnel Authority VRDN RB Refunding
General Series 2001 C RMKT (Bank of Tokyo-Mitsubishi UFJ,
LOC) |
|
| | 5,865,000 | | | | 0.650 | | | | 03/07/17 | | | | 5,865,000 | |
| Triborough Bridge & Tunnel Authority VRDN RB Refunding
General Series 2002 F RMKT (Landesbank Hessen-Thueringen
Girozentrale, LOC) |
|
| | 1,100,000 | | | | 0.620 | | | | 03/01/17 | | | | 1,100,000 | |
| | | | | | | | | | | | | | |
| | | | | | | | | | | | | 146,163,345 | |
| | |
| North Carolina – 2.4% | |
| County of Union Enterprise System VRDN RB Series 2009
RMKT (U.S. Bank N.A., LOC) |
|
| | 16,400,000 | | | | 0.630 | | | | 03/07/17 | | | | 16,400,000 | |
| North Carolina Capital Facilities Finance Agency VRDN RB
Refunding for Wake Forest University Series 2004 A |
|
| | 6,000,000 | | | | 0.660 | | | | 03/07/17 | | | | 6,000,000 | |
| | | | | | | | | | | | | | |
| | | | | | | | | | | | | 22,400,000 | |
| | |
| | |
| The accompanying notes are an integral part of these financial statements. | | 15 |
INVESTOR TAX-EXEMPT MONEY MARKET FUND
Schedule of Investments (continued)
February 28, 2017 (Unaudited)
| | | | | | | | | | | | | | |
Principal Amount | | | Interest Rate | | | Maturity Date | | | Amortized Cost | |
| Municipal Debt Obligations – (continued) | |
| Ohio – 5.0% | |
| Allen County Hospital Facilities VRDN RB for Catholic Health
Partners Series 2012 B |
|
| $ | 10,000,000 | | | | 0.660 | % | | | 03/07/17 | | | $ | 10,000,000 | |
| | Ohio State University VRDN RB Series 2005 B | |
| | 2,000,000 | | | | 0.600 | | | | 03/07/17 | | | | 2,000,000 | |
| | Ohio State University VRDN RB Series 2014 B-2 | |
| | 12,500,000 | | | | 0.610 | | | | 03/07/17 | | | | 12,500,000 | |
| Ohio Water Development Authority VRDN RB for Water
Pollution Control Loan Fund Series 2016 A (BMO Harris
Bank, N.A., LIQ) |
|
| | 19,050,000 | | | | 0.670 | | | | 03/07/17 | | | | 19,050,000 | |
| State of Ohio GO VRDN for Common Schools Series 2003 D
RMKT |
|
| | 2,800,000 | | | | 0.660 | | | | 03/07/17 | | | | 2,800,000 | |
| | | | | | | | | | | | | | |
| | | | | | | | | | | | | 46,350,000 | |
| | |
| Oregon – 2.1% | |
| | State of Oregon GO TANS Series 2016 A | |
| | 20,000,000 | | | | 2.000 | | | | 06/30/17 | | | | 20,079,161 | |
| | |
| Pennsylvania – 1.7% | |
| Allegheny County Hospital Development Authority VRDN RB
for University of Pittsburg Medical Center Putters
Series 2013-4323 (GTY AGMT – JPMorgan Chase Bank N.A.)
(JPMorgan Chase Bank N.A., LIQ)(b) |
|
| | 11,635,000 | | | | 0.620 | | | | 03/01/17 | | | | 11,635,000 | |
| Philadelphia Hospitals & Higher Education Facilities Authority
VRDN RB for Children’s Hospital of Philadelphia
Series 2011 A RMKT (JPMorgan Chase Bank, SPA) |
|
| | 3,610,000 | | | | 0.560 | | | | 03/01/17 | | | | 3,610,000 | |
| Philadelphia Hospitals & Higher Education Facilities Authority
VRDN RB Refunding for Children’s Hospital of Philadelphia
Project Series 2005 A RMKT (Wells Fargo Bank N.A., SPA) |
|
| | 565,000 | | | | 0.560 | | | | 03/01/17 | | | | 565,000 | |
| | | | | | | | | | | | | | |
| | | | | | | | | | | | | 15,810,000 | |
| | |
| Rhode Island – 1.0% | |
| Rhode Island Health & Educational Building Corp. Higher
Education Facilities VRDN RB for Brown University
Series 2003 B RMKT (Northern Trust Co., SPA) |
|
| | 8,965,000 | | | | 0.600 | | | | 03/07/17 | | | | 8,965,000 | |
| | |
| Texas – 11.3% | |
| | City of Houston TRANS Series 2016 | |
| | 19,750,000 | | | | 5.000 | | | | 06/30/17 | | | | 20,021,307 | |
| City of San Antonio Electric & Gas Systems CP Series 2017 B
(State Street Bank & Trust Co. and Wells Fargo Bank N.A.,
LOC) |
|
| | 13,000,000 | | | | 0.730 | | | | 04/06/17 | | | | 13,000,000 | |
| | 15,000,000 | | | | 0.750 | | | | 04/19/17 | | | | 15,000,000 | |
| City of San Antonio Water System CP Series 2017 A (Bank of
Tokyo Mitsubishi UFJ Ltd., LOC) |
|
| | 10,000,000 | | | | 0.760 | | | | 03/08/17 | | | | 10,000,000 | |
| Harris County Cultural Education Facilities Finance Corp. RB CP
Refunding for Methodist Hospital System Series 2017 2009C-2 |
|
| | 10,000,000 | | | | 0.720 | | | | 03/29/17 | | | | 10,000,000 | |
| | |
| Municipal Debt Obligations – (continued) | |
| Texas – (continued) | |
| Harris County Cultural Education Facilities Finance Corp. VRDN
RB Refunding for Methodist Hospital System Series 2008
Subseries C-1 RMKT |
|
| 100,000 | | | | 0.570 | | | | 03/01/17 | | | | 100,000 | |
| Harris County Health Facilities Development Corp. VRDN RB
Refunding for Methodist Hospital System Series 2008 A-1 |
|
| | 7,250,000 | | | | 0.570 | | | | 03/01/17 | | | | 7,250,000 | |
| Harris County Industrial Development Corp. VRDN PCRB for
Exxon Project Series 1984 |
|
| | 6,100,000 | | | | 0.560 | | | | 03/01/17 | | | | 6,100,000 | |
| State of Texas GO VRDN for Veterans Bonds Series 2015 B
(Mizuho Bank, Ltd., SPA) |
|
| | 9,035,000 | | | | 0.660 | | | | 03/07/17 | | | | 9,035,000 | |
| State of Texas GO VRDN for Veterans Bonds Series 2016
(Landesbank Hessen-Thueringen Girozentrale, SPA) |
|
| | 1,500,000 | | | | 0.650 | | | | 03/07/17 | | | | 1,500,000 | |
| State of Texas GO VRDN for Veterans Bonds Series 2017
(Sumitomo Mitsui Banking Corp., SPA) |
|
| | 5,000,000 | | | | 0.670 | | | | 03/07/17 | | | | 5,000,000 | |
| Tarrant County Cultural Education Facilities Finance Corp.
VRDN RB Refunding for Texas Health Resources
Series 2008 A |
|
| | 6,250,000 | | | | 0.650 | | | | 03/07/17 | | | | 6,250,000 | |
| Tarrant County Cultural Education Facilities Finance Corp.
VRDN RB Refunding for Texas Health Resources
Series 2008 B |
|
| | 2,285,000 | | | | 0.620 | | | | 03/07/17 | | | | 2,285,000 | |
| | | | | | | | | | | | | | |
| | | | | | | | | | | | | 105,541,307 | |
| | |
| Virginia – 1.5% | |
| City of Norfolk Economic Development Authority Hospital
Facilities VRDN RB Refunding for Sentara Healthcare
Series 2016 B |
|
| | 8,030,000 | | | | 0.630 | | | | 03/07/17 | | | | 8,030,000 | |
| Fairfax County IDA VRDN RB for Inova Health System
Series 2000 (Branch Banking & Trust, SPA) |
|
| | 5,900,000 | | | | 0.650 | | | | 03/07/17 | | | | 5,900,000 | |
| | | | | | | | | | | | | | |
| | | | | | | | | | | | | 13,930,000 | |
| | |
| Washington – 3.0% | |
| County of King Sewer Revenue VRDN RB Junior Lien
Series 2001 A RMKT (Landesbank Hessen-Thueringen
Girozentrale, LOC) |
|
| | 6,650,000 | | | | 0.670 | | | | 03/07/17 | | | | 6,650,000 | |
| Washington Health Care Facilities Authority VRDN RB
Refunding for Providence Health & Services Series 2012 C
(U.S. Bank N.A., SPA) |
|
| | 17,560,000 | | | | 0.650 | | | | 03/07/17 | | | | 17,560,000 | |
| Washington State Housing Finance Commission VRDN RB for
Discovery Heights Apartments Series 2010 (FHLMC, LIQ) |
|
| | 3,600,000 | | | | 0.660 | | | | 03/07/17 | | | | 3,600,000 | |
| | | | | | | | | | | | | | |
| | | | | | | | | | | | | 27,810,000 | |
| | |
| | |
| 16 | | The accompanying notes are an integral part of these financial statements. |
INVESTOR TAX-EXEMPT MONEY MARKET FUND
| | | | | | | | | | | | | | |
Principal Amount | | | Interest Rate | | | Maturity Date | | | Amortized Cost | |
| Municipal Debt Obligations – (continued) | |
| Wisconsin – 0.4% | |
| City of Milwaukee GO Refunding for Promissory & Corporate
Notes Series 2012 N2 |
|
| $ | 4,350,000 | | | | 5.000 | % | | | 05/01/17 | | | $ | 4,380,435 | |
| | |
| | TOTAL INVESTMENTS – 100.5% | | | $ | 937,086,861 | |
| | |
| LIABILITIES IN EXCESS OF
OTHER ASSETS – (0.5)% |
| | | (4,355,699 | ) |
| | |
| | NET ASSETS – 100.0% | | | $ | 932,731,162 | |
| | |
| | |
| The percentage shown for each investment category reflects the value of investments in that category as a percentage of net assets. |
(a) | | All or a portion represents a forward commitment. |
(b) | | Security not registered under the Securities Act of 1933, as amended. Such securities may be deemed liquid by the Investment Adviser. At February 28, 2017, these securities amounted to $16,135,000 or approximately 1.7% of net assets. |
Interest rates represent either the stated coupon rate, or for floating rate securities, the current reset rate, which is based upon current interest rate indices.
Maturity dates represent either the final legal maturity date on the security, the demand date for puttable securities, or the prerefunded date for those types of securities.
| | |
|
Investment Abbreviations: |
AMT | | —Alternative Minimum Tax (subject to) |
BANS | | —Bond Anticipation Notes |
CP | | —Commercial Paper |
FHLMC | | —Insured by Federal Home Loan Mortgage Corp. |
FNMA | | —Insured by Federal National Mortgage Association |
GO | | —General Obligation |
GTY AGMT | | —Guaranty Agreement |
IDA | | —Industrial Development Agency |
IDB | | —Industrial Development Board |
LIQ | | —Liquidity Agreement |
LOC | | —Letter of Credit |
PCRB | | —Pollution Control Revenue Bond |
RANS | | —Revenue Anticipation Notes |
RB | | —Revenue Bond |
RMKT | | —Remarketed |
SPA | | —Stand-by Purchase Agreement |
TANS | | —Tax Anticipation Notes |
TRANS | | —Tax Revenue Anticipation Notes |
VRDN | | —Variable Rate Demand Notes |
VRDP | | —Variable Rate Demand Preferred Shares |
|
| | |
| The accompanying notes are an integral part of these financial statements. | | 17 |
GOLDMAN SACHS FUNDS — INVESTOR FUNDS
Schedule of Investments
February 28, 2017 (Unaudited)
|
| ADDITIONAL INVESTMENT INFORMATION |
JOINT REPURCHASE AGREEMENT ACCOUNT III — At February 28, 2017, Investor Money Market Fund had undivided interests in the Joint Repurchase Agreement Account III, with a maturity date of March 1, 2017, as follows:
| | | | |
| Principal Amount | | Maturity Value | | Collateral Value |
| $37,800,000 | | $37,800,562 | | $38,807,822 |
REPURCHASE AGREEMENTS — At February 28, 2017, the Principal Amounts of the Investor Money Market Fund’s interest in the Joint Repurchase Agreement Account III were as follows:
| | | | | | | | |
| Counterparty | | Interest Rate | | | Principal Amount | |
ABN Amro Bank N.V. | | | 0.540 | % | | $ | 2,717,647 | |
Bank of America, N.A. | | | 0.530 | | | | 2,470,588 | |
Bank of Nova Scotia (The) | | | 0.530 | | | | 7,411,765 | |
BNP Paribas | | | 0.530 | | | | 5,435,294 | |
Citigroup Global Markets, Inc. | | | 0.540 | | | | 3,458,824 | |
TD Securities (USA), LLC | | | 0.530 | | | | 1,482,353 | |
Wells Fargo Securities, LLC | | | 0.540 | | | | 14,823,529 | |
| TOTAL | | | | | | $ | 37,800,000 | |
| | |
| 18 | | The accompanying notes are an integral part of these financial statements. |
GOLDMAN SACHS FUNDS — INVESTOR FUNDS
|
| ADDITIONAL INVESTMENT INFORMATION (continued) |
At February 28, 2017, the Joint Repurchase Agreement Account III was fully collateralized by:
| | | | | | | | |
| Issuer | | Interest Rates | | | Maturity Dates | |
Federal Home Loan Mortgage Corp. | | | 2.500% to 7.500 | % | | | 06/01/22 to 07/01/47 | |
Federal National Mortgage Association | | | 0.875 to 8.000 | | | | 10/26/17 to 02/01/47 | |
Government National Mortgage Association | | | 3.000 to 8.500 | | | | 01/15/27 to 01/20/47 | |
U.S. Treasury Bill | | | 0.000 | | | | 09/14/17 | |
U.S. Treasury Bonds | | | 2.875 to 4.750 | | | | 02/15/37 to 02/15/47 | |
U.S. Treasury Inflation-Indexed Notes | | | 0.125 to 0.250 | | | | 07/15/22 to 01/15/25 | |
U.S. Treasury Interest-Only Stripped Securities | | | 0.000 | | | | 08/15/17 to 11/15/44 | |
U.S. Treasury Notes | | | 0.875 to 4.250 | | | | 10/31/17 to 02/15/27 | |
U.S. Treasury Principal-Only Stripped Security | | | 0.000 | | | | 11/15/44 | |
| | |
| The accompanying notes are an integral part of these financial statements. | | 19 |
GOLDMAN SACHS FUNDS — INVESTOR FUNDS
Statements of Assets and Liabilities
February 28, 2017 (Unaudited)
| | | | | | | | | | |
| | | | | Investor Money Market Fund | | | Investor Tax-Exempt
Money Market
Fund | |
| | Assets: | | | | | | | | |
| | Investments based on amortized cost | | $ | 248,841,742 | | | $ | 937,086,861 | |
| | Repurchase agreements based on amortized cost | | | 37,800,000 | | | | — | |
| | Cash | | | 81,449 | | | | — | |
| | Receivables: | | | | | | | | |
| | Interest | | | 185,532 | | | | 2,700,432 | |
| | Fund shares sold | | | 219,628 | | | | 359,897 | |
| | Reimbursement from investment advisor | | | 132,713 | | | | 38,425 | |
| | Other assets | | | 831 | | | | 33,870 | |
| | Total assets | | | 287,261,895 | | | | 940,219,485 | |
| | | | | | | | | | |
| | Liabilities: | | | | | | | | |
| | Due to custodian | | | — | | | | 1,896,774 | |
| | Payables: | | | | | | | | |
| | Investments purchased | | | 10,129,707 | | | | 4,802,764 | |
| | Dividend distribution | | | 58,366 | | | | 320,098 | |
| | Management fees | | | 26,025 | | | | 118,992 | |
| | Fund shares redeemed | | | 36,782 | | | | 10,619 | |
| | Distribution and Service fees and Transfer Agency fees | | | 1,734 | | | | 8,178 | |
| | Accrued expenses and other liabilities | | | 93,622 | | | | 330,898 | |
| | Total liabilities | | | 10,346,236 | | | | 7,488,323 | |
| | | | | | | | | | |
| | Net Assets: | | | | | | | | |
| | Paid-in capital | | | 276,911,075 | | | | 932,731,071 | |
| | Undistributed (distributions in excess of) net investment income | | | 647 | | | | (29 | ) |
| | Accumulated net realized gain | | | 3,937 | | | | 120 | |
| | NET ASSETS | | $ | 276,915,659 | | | $ | 932,731,162 | |
| | | Net asset value, offering and redemption price per share | | | $1.00 | | | | $1.00 | |
| | | Net Assets: | | | | | | | | |
| | | Class I Shares | | $ | 150,375,972 | | | $ | 921,632,120 | |
| | | Select Shares | | | — | | | | 1,002 | |
| | | Preferred Shares | | | — | | | | 35,156 | |
| | | Capital Shares | | | — | | | | 1,002 | |
| | | Administration Shares | | | 126,020,924 | | | | 4,879,683 | |
| | | Premier Shares | | | — | | | | 1,001 | |
| | | Service Shares | | | 50,089 | | | | 907,014 | |
| | | Resource Shares | | | 50,059 | | | | 4,583,089 | |
| | | Cash Management Shares | | | 50,313 | | | | 40,301 | |
| | | Class A Shares | | | 318,258 | | | | 641,797 | |
| | | Class C Shares | | | 50,044 | | | | 8,997 | |
| | | Total Net Assets | | $ | 276,915,659 | | | $ | 932,731,162 | |
| | | Shares outstanding $0.001 par value (unlimited number of shares authorized): | | | | | | | | |
| | | Class I Shares | | | 150,373,835 | | | | 921,581,683 | |
| | | Select Shares | | | — | | | | 1,002 | |
| | | Preferred Shares | | | — | | | | 35,154 | |
| | | Capital Shares | | | — | | | | 1,002 | |
| | | Administration Shares | | | 126,019,131 | | | | 4,879,416 | |
| | | Premier Shares | | | — | | | | 1,001 | |
| | | Service Shares | | | 50,089 | | | | 906,964 | |
| | | Resource Shares | | | 50,058 | | | | 4,582,838 | |
| | | Cash Management Shares | | | 50,312 | | | | 40,299 | |
| | | Class A Shares | | | 318,254 | | | | 641,761 | |
| | | Class C Shares | | | 50,043 | | | | 8,997 | |
| | |
| 20 | | The accompanying notes are an integral part of these financial statements. |
GOLDMAN SACHS FUNDS — INVESTOR FUNDS
Statements of Operations
For the Six Months Ended February 28, 2017 (Unaudited)
| | | | | | | | | | |
| | | | | Investor Money Market
Fund | | | Investor Tax-Exempt
Money
Market Fund | |
| | Investment income: | | | | | | | | |
| | Interest income | | $ | 598,514 | | | $ | 3,249,052 | |
| | Total investment income | | | 598,514 | | | | 3,249,052 | |
| | | | | | | | | | |
| | Expenses: | | | | | | | | |
| | Fund-Level Expenses: | | | | | | | | |
| | Management fees | | | 135,160 | | | | 995,792 | |
| | Professional fees | | | 109,472 | | | | 174,711 | |
| | Registration fees | | | 75,870 | | | | 152,029 | |
| | Custody, accounting and administrative services | | | 13,626 | | | | 98,519 | |
| | Printing and mailing fees | | | 73,797 | | | | 80,439 | |
| | Transfer Agency fees | | | 6,593 | | | | 48,575 | |
| | Trustee fees | | | 6,639 | | | | 7,259 | |
| | Amortization of offering costs | | | 107,052 | | | | — | |
| | Other | | | 22,410 | | | | 35,606 | |
| | Subtotal | | | 550,619 | | | | 1,592,930 | |
| | Class Specific Expenses: | | | | | | | | |
| | Service Share fees | | | 124 | | | | 45,928 | |
| | Resource Share fees | | | 124 | | | | 13,590 | |
| | Administration Share fees | | | 15,218 | | | | 6,353 | |
| | Distribution fees — Resource Shares | | | 37 | | | | 4,077 | |
| | Distribution and Service fees — Class A Shares | | | 349 | | | | 380 | |
| | Capital Share fees | | | — | | | | 52 | |
| | Cash Management Share fees | | | 124 | | | | 40 | |
| | Distribution fees — Class C Shares | | | 185 | | | | 34 | |
| | Distribution fees — Cash Management Shares | | | 75 | | | | 24 | |
| | Preferred Share fees | | | — | | | | 13 | |
| | Class C Share fees | | | 62 | | | | 11 | |
| | Premier Share fees | | | — | | | | 2 | |
| | Total expenses | | | 566,917 | | | | 1,663,434 | |
| | Less — expense reductions | | | (429,420 | ) | | | (708,422 | ) |
| | Net expenses | | | 137,497 | | | | 955,012 | |
| | NET INVESTMENT INCOME | | $ | 461,017 | | | $ | 2,294,040 | |
| | Net realized gain from investment transactions | | | 13,448 | | | | 193 | |
| | NET INCREASE IN NET ASSETS RESULTING FROM OPERATIONS | | $ | 474,465 | | | $ | 2,294,233 | |
| | |
| The accompanying notes are an integral part of these financial statements. | | 21 |
GOLDMAN SACHS FUNDS — INVESTOR FUNDS
Statements of Changes in Net Assets
| | | | | | | | | | |
| | | | | Investor Money Market Fund | |
| | | | | For the Six Months Ended February 28, 2017 (Unaudited) | | | For the Period Ended August 31, 2016* | |
| | From operations: | | | | | | | | |
| | Net investment income | | $ | 461,017 | | | $ | 24,448 | |
| | Net realized gain from investment transactions | | | 13,448 | | | | 50 | |
| | Net increase in net assets resulting from operations | | | 474,465 | | | | 24,498 | |
| | | | | | | | | | |
| | Distributions to shareholders: | | | | | | | | |
| | From net investment income: | | | | | | | | |
| | Class I Shares | | | (434,744 | ) | | | (24,348 | ) |
| | Select Shares | | | — | | | | — | |
| | Preferred Shares | | | — | | | | (1 | ) |
| | Capital Shares | | | — | | | | — | |
| | Administration Shares | | | (25,535 | ) | | | (47 | ) |
| | Premier Shares | | | — | | | | — | |
| | Service Shares(a) | | | (54 | ) | | | (2 | ) |
| | Resource Shares(a) | | | (20 | ) | | | — | |
| | Cash Management Shares(a) | | | (3 | ) | | | (1 | ) |
| | Class A Shares(b) | | | (661 | ) | | | (47 | ) |
| | Class C Shares(b) | | | — | | | | (2 | ) |
| | From net realized gains: | | | | | | | | |
| | Class I Shares | | | (8,937 | ) | | | (36 | ) |
| | Select Shares | | | — | | | | — | |
| | Preferred Shares | | | — | | | | — | |
| | Capital Shares | | | — | | | | — | |
| | Administration Shares | | | (545 | ) | | | — | |
| | Premier Shares | | | — | | | | — | |
| | Service Shares(a) | | | (3 | ) | | | — | |
| | Resource Shares(a) | | | (3 | ) | | | — | |
| | Cash Management Shares(a) | | | (3 | ) | | | — | |
| | Class A Shares(b) | | | (31 | ) | | | — | |
| | Class C Shares(b) | | | (3 | ) | | | — | |
| | Total distributions to shareholders | | | (470,542 | ) | | | (24,484 | ) |
| | | | | | | | | | |
| | From share transactions (at 1.00 per share): | | | | | | | | |
| | Proceeds from sales of shares | | | 411,341,989 | | | | 11,553,041 | |
| | Reinvestment of distributions | | | 122,409 | | | | 23,657 | |
| | Cost of shares redeemed | | | (145,531,365 | ) | | | (598,009 | ) |
| | Net increase (decrease) in net assets resulting from share transactions | | | 265,933,033 | | | | 10,978,689 | |
| | NET INCREASE (DECREASE) | | | 265,936,956 | | | | 10,978,703 | |
| | | | | | | | | | |
| | Net assets: | | | | | | | | |
| | Beginning of period | | | 10,978,703 | | | | — | |
| | End of period | | $ | 276,915,659 | | | $ | 10,978,703 | |
| | Undistributed (distributions in excess of) net investment income | | $ | 647 | | | $ | 647 | |
| | * | | Commenced operations on January 29, 2016. |
| | (a) | | Service Shares, Resource Shares and Cash Management Shares of the Investor Money Market Fund commenced operations on May 31, 2016. |
| | (b) | | Class A Shares and Class C Shares of the Investor Tax-Exempt Money Market Fund commenced operations on March 31, 2016. |
| | |
| 22 | | The accompanying notes are an integral part of these financial statements. |
GOLDMAN SACHS FUNDS — INVESTOR FUNDS
| | | | | | | | | | |
| | | Investor Tax-Exempt Money Market Fund | |
| | | For the Six Months Ended February 28, 2017 (Unaudited) | | | | | For the Fiscal Year Ended August 31, 2016 | |
| | | | | | | | | | |
| | $ | 2,294,040 | | | | | $ | 2,825,733 | |
| | | 193 | | | | | | 724,670 | |
| | | 2,294,233 | | | | | | 3,550,403 | |
| | | | | | | | | | |
| | | | | | | | | | |
| | | | | | | | | | |
| | | (2,284,296 | ) | | | | | (2,787,780 | ) |
| | | (3 | ) | | | | | (6,816 | ) |
| | | (50 | ) | | | | | (968 | ) |
| | | (100 | ) | | | | | (19,299 | ) |
| | | (5,965 | ) | | | | | (6,611 | ) |
| | | (2 | ) | | | | | (4 | ) |
| | | (3,070 | ) | | | | | (3,778 | ) |
| | | (171 | ) | | | | | (469 | ) |
| | | (2 | ) | | | | | (4 | ) |
| | | (379 | ) | | | | | (2 | ) |
| | | (2 | ) | | | | | (2 | ) |
| | | | | | | | | | |
| | | (567,168 | ) | | | | | (198,426 | ) |
| | | (1 | ) | | | | | (7,632 | ) |
| | | (12 | ) | | | | | (206 | ) |
| | | (1 | ) | | | | | (1,525 | ) |
| | | (2,773 | ) | | | | | (4,514 | ) |
| | | (1 | ) | | | | | — | |
| | | (560 | ) | | | | | (2,046 | ) |
| | | (3,473 | ) | | | | | (320 | ) |
| | | (10 | ) | | | | | — | |
| | | (388 | ) | | | | | — | |
| | | (6 | ) | | | | | — | |
| | | (2,868,433 | ) | | | | | (3,040,402 | ) |
| | | | | | | | | | |
| | | | | | | | | | |
| | | 737,857,909 | | | | | | 14,225,281,433 | |
| | | 250,121 | | | | | | 1,741,174 | |
| | | (1,271,074,165 | ) | | | | | (18,128,302,933 | ) |
| | | (532,966,135 | ) | | | | | (3,901,280,326 | ) |
| | | (533,540,335 | ) | | | | | (3,900,770,325 | ) |
| | | | | | | | | | |
| | | | | | | | | | |
| | | 1,466,271,497 | | | | | | 5,367,041,822 | |
| | $ | 932,731,162 | | | | | $ | 1,466,271,497 | |
| | $ | (29 | ) | | | | $ | (29 | ) |
| | |
| The accompanying notes are an integral part of these financial statements. | | 23 |
INVESTOR MONEY MARKET FUND
Financial Highlights
Selected Data for a Share Outstanding Throughout Each Period
| | | | | | | | | | | | | | | | | | | | | | | | | | | | | | |
| | | | | | | | From
investment operations | | | Distributions
to shareholders | |
| | | Year - Share Class | | Net asset value, beginning of period | | | Net
investment
income(a) | | | Net realized
and unrealized
gain | | | Total from
investment
operations | | | From net
investment
income | | | From net
realized
gains | | | Total
distributions(b) | |
| | FOR THE SIX MONTHS ENDED FEBRUARY 28, (UNAUDITED) | |
| | 2017 - Class I Shares | | $ | 1.00 | | | $ | 0.004 | | | $ | — | (d) | | $ | 0.004 | | | $ | (0.004 | ) | | $ | — | (d) | | $ | (0.004 | ) |
| | 2017 - Administration Shares | | | 1.00 | | | | 0.002 | | | | — | (d) | | | 0.002 | | | | (0.002 | ) | | | — | (d) | | | (0.002 | ) |
| | 2017 - Service Shares | | | 1.00 | | | | 0.001 | | | | — | (d) | | | 0.001 | | | | (0.001 | ) | | | — | (d) | | | (0.001 | ) |
| | 2017 - Resource Shares | | | 1.00 | | | | 0.001 | | | | — | (d) | | | 0.001 | | | | (0.001 | ) | | | — | (d) | | | (0.001 | ) |
| | 2017 - Cash Management Shares | | | 1.00 | | | | — | (d) | | | — | (d) | | | — | (d) | | | — | (d) | | | — | (d) | | | — | (d) |
| | 2017 - Class A Shares | | | 1.00 | | | | 0.002 | | | | — | (d) | | | 0.002 | | | | (0.002 | ) | | | — | (d) | | | (0.002 | ) |
| | 2017 - Class C Shares | | | 1.00 | | | | — | (d) | | | — | (d) | | | — | (d) | | | — | (d) | | | — | (d) | | | — | (d) |
| | | | | | | | | | | | | | | | | | | | | | | | | | | | | | |
| | FOR THE PERIOD ENDED AUGUST 31,* | |
| | 2016 - Class I Shares | | | 1.00 | | | | 0.002 | | | | — | (d) | | | 0.002 | | | | (0.002 | ) | | | — | (d) | | | (0.002 | ) |
| | 2016 - Administration Shares | | | 1.00 | | | | 0.001 | | | | — | (d) | | | 0.001 | | | | (0.001 | ) | | | — | (d) | | | (0.001 | ) |
| | 2016 - Service Shares (Commenced operations on May 31, 2016) | | | 1.00 | | | | — | (d) | | | — | (d) | | | — | (d) | | | — | (d) | | | — | (d) | | | — | (d) |
| | 2016 - Resource Shares (Commenced operations on May 31, 2016) | | | 1.00 | | | | — | (d) | | | — | (d) | | | — | (d) | | | — | (d) | | | — | (d) | | | — | (d) |
| | 2016 - Cash Management Shares (Commenced operations on May 31, 2016) | | | 1.00 | | | | — | (d) | | | — | (d) | | | — | (d) | | | — | (d) | | | — | (d) | | | — | (d) |
| | 2016 - Class A Shares | | | 1.00 | | | | 0.001 | | | | — | (d) | | | 0.001 | | | | (0.001 | ) | | | — | (d) | | | (0.001 | ) |
| | 2016 - Class C Shares | | | 1.00 | | | | — | (d) | | | — | (d) | | | — | (d) | | | — | (d) | | | — | (d) | | | — | (d) |
| | * | | Commenced operations on January 29, 2016. |
| | (a) | | Calculated based on the average shares outstanding methodology. |
| | (b) | | Distributions may not coincide with the current year net investment income or net realized gains as distributions may be paid from current or prior year earnings. |
| | (c) | | Assumes reinvestment of all distributions. Returns do not reflect the deduction of taxes that a shareholder would pay on Fund distributions. Total returns for periods less than one full year are not annualized. |
| | (d) | | Amount is less than $0.0005 per share. |
| | (f) | | Amount is less than 0.005% of average net assets. |
| | |
| 24 | | The accompanying notes are an integral part of these financial statements. |
INVESTOR MONEY MARKET FUND
| | | | | | | | | | | | | | | | | | | | | | | | | | | | | | | | | | |
| | | | | | | | | | | | | | | | | | | | | | | | | | | | | |
| | | Net asset
value, end
of period | | | | | Total return(c) | | | | | Net assets end of
period (in 000s) | | | | | Ratio of
net expenses
to average
net assets | | | | | Ratio of
total expenses
to average
net assets | | | | | Ratio of
net investment
income
to average
net assets | |
| | | | | | | | | | | | | | | | | | | | | | | | | | | | | | | | | | |
| | $ | 1.00 | | | | | | 0.36 | % | | | | $ | 150,376 | | | | | | 0.18 | %(e) | | | | | 0.76 | %(e) | | | | | 0.73 | %(e) |
| | | 1.00 | | | | | | 0.23 | | | | | | 126,021 | | | | | | 0.43 | (e) | | | | | 1.01 | (e) | | | | | 0.42 | (e) |
| | | 1.00 | | | | | | 0.13 | | | | | | 50 | | | | | | 0.67 | (e) | | | | | 1.26 | (e) | | | | | 0.22 | (e) |
| | | 1.00 | | | | | | 0.07 | | | | | | 50 | | | | | | 0.80 | (e) | | | | | 1.41 | (e) | | | | | 0.08 | (e) |
| | | 1.00 | | | | | | 0.03 | | | | | | 51 | | | | | | 0.88 | (e) | | | | | 1.56 | (e) | | | | | 0.01 | (e) |
| | | 1.00 | | | | | | 0.23 | | | | | | 318 | | | | | | 0.43 | (e) | | | | | 1.01 | (e) | | | | | 0.47 | (e) |
| | | 1.00 | | | | | | 0.03 | | | | | | 50 | | | | | | 0.89 | (e) | | | | | 1.76 | (e) | | | | | — | (e)(f) |
| | | | | | | | | | | | | | | | | | | | | | | | | | | | | | | | | | |
| | | | | | | | | | | | | | | | | | | | | | | | | | | | | | | | | | |
| | | 1.00 | | | | | | 0.24 | | | | | | 10,679 | | | | | | 0.18 | (e) | | | | | 4.88 | (e) | | | | | 0.41 | (e) |
| | | 1.00 | | | | | | 0.09 | | | | | | 50 | | | | | | 0.43 | (e) | | | | | 5.13 | (e) | | | | | 0.16 | (e) |
| | | 1.00 | | | | | | 0.05 | | | | | | 50 | | | | | | 0.61 | (e) | | | | | 5.38 | (e) | | | | | 0.02 | (e) |
| | | 1.00 | | | | | | 0.05 | | | | | | 50 | | | | | | 0.62 | (e) | | | | | 5.53 | (e) | | | | | 0.01 | (e) |
| | | 1.00 | | | | | | 0.05 | | | | | | 50 | | | | | | 0.62 | (e) | | | | | 5.68 | (e) | | | | | 0.01 | (e) |
| | | 1.00 | | | | | | 0.09 | | | | | | 50 | | | | | | 0.43 | (e) | | | | | 5.13 | (e) | | | | | 0.16 | (e) |
| | | 1.00 | | | | | | 0.05 | | | | | | 50 | | | | | | 0.58 | (e) | | | | | 5.88 | (e) | | | | | 0.01 | (e) |
| | |
| The accompanying notes are an integral part of these financial statements. | | 25 |
INVESTOR TAX-EXEMPT MONEY MARKET FUND
Financial Highlights
Selected Data for a Share Outstanding Throughout Each Period
| | | | | | | | | | | | | | | | | | | | | | | | | | | | | | |
| | | | | | | | From investment operations | | | Distributions to shareholders | |
| | | Year - Share Class | | Net asset value, beginning of period | | | Net
investment
income(a) | | | Net realized
and unrealized
gain (loss) | | | Total from
investment
operations | | | From net
investment
income | | | From net
realized
gains | | | Total
distributions(b) | |
| | FOR THE SIX MONTHS ENDED FEBRUARY 28, (UNAUDITED) | |
| | 2017 - Class I Shares | | $ | 1.00 | | | $ | 0.002 | | | $ | 0.001 | | | $ | 0.003 | | | $ | (0.002 | ) | | $ | (0.001 | ) | | $ | (0.003 | ) |
| | 2017 - Select Shares | | | 1.00 | | | | 0.003 | | | | — | (e) | | | 0.003 | | | | (0.002 | ) | | | (0.001 | ) | | | (0.003 | ) |
| | 2017 - Preferred Shares | | | 1.00 | | | | 0.002 | | | | 0.001 | | | | 0.003 | | | | (0.002 | ) | | | (0.001 | ) | | | (0.003 | ) |
| | 2017 - Capital Shares | | | 1.00 | | | | 0.002 | | | | 0.001 | | | | 0.003 | | | | (0.002 | ) | | | (0.001 | ) | | | (0.003 | ) |
| | 2017 - Administration Shares | | | 1.00 | | | | 0.001 | | | | 0.001 | | | | 0.002 | | | | (0.001 | ) | | | (0.001 | ) | | | (0.002 | ) |
| | 2017 - Premier Shares | | | 1.00 | | | | 0.002 | | | | — | (e) | | | 0.002 | | | | (0.001 | ) | | | (0.001 | ) | | | (0.002 | ) |
| | 2017 - Service Shares | | | 1.00 | | | | — | (e) | | | 0.001 | | | | 0.001 | | | | — | (e) | | | (0.001 | ) | | | (0.001 | ) |
| | 2017 - Resource Shares | | | 1.00 | | | | — | (e) | | | 0.001 | | | | 0.001 | | | | — | (e) | | | (0.001 | ) | | | (0.001 | ) |
| | 2017 - Cash Management Shares | | | 1.00 | | | | — | (e) | | | 0.001 | | | | 0.001 | | | | — | (e) | | | (0.001 | ) | | | (0.001 | ) |
| | 2017 - Class A Shares | | | 1.00 | | | | 0.001 | | | | 0.001 | | | | 0.002 | | | | (0.001 | ) | | | (0.001 | ) | | | (0.002 | ) |
| | 2017 - Class C Shares | | | 1.00 | | | | — | (e) | | | 0.001 | | | | 0.001 | | | | — | (e) | | | (0.001 | ) | | | (0.001 | ) |
| | | | | | | | | | | | | | | | | | | | | | | | | | | | | | |
| | FOR THE FISCAL YEARS ENDED AUGUST 31, | |
| | 2016 - Class I Shares | | | 1.00 | | | | 0.001 | | | | — | (e) | | | 0.001 | | | | (0.001 | ) | | | — | (e) | | | (0.001 | ) |
| | 2016 - Select Shares | | | 1.00 | | | | 0.001 | | | | — | (e) | | | 0.001 | | | | (0.001 | ) | | | — | (e) | | | (0.001 | ) |
| | 2016 - Preferred Shares | | | 1.00 | | | | 0.001 | | | | — | (e) | | | 0.001 | | | | (0.001 | ) | | | — | (e) | | | (0.001 | ) |
| | 2016 - Capital Shares | | | 1.00 | | | | — | (e) | | | — | (e) | | | — | (e) | | | — | (e) | | | — | (e) | | | — | (e) |
| | 2016 - Administration Shares | | | 1.00 | | | | — | (e) | | | — | (e) | | | — | (e) | | | — | (e) | | | — | (e) | | | — | (e) |
| | 2016 - Premier Shares | | | 1.00 | | | | — | (e) | | | — | (e) | | | — | (e) | | | — | (e) | | | — | (e) | | | — | (e) |
| | 2016 - Service Shares | | | 1.00 | | | | — | (e) | | | — | (e) | | | — | (e) | | | — | (e) | | | — | (e) | | | — | (e) |
| | 2016 - Resource Shares | | | 1.00 | | | | — | (e) | | | — | (e) | | | — | (e) | | | — | (e) | | | — | (e) | | | — | (e) |
| | 2016 - Cash Management Shares | | | 1.00 | | | | — | (e) | | | — | (e) | | | — | (e) | | | — | (e) | | | — | (e) | | | — | (e) |
| | 2016 - Class A Shares (Commenced operations on March 31, 2016) | | | 1.00 | | | | — | (e) | | | — | (e) | | | — | (e) | | | — | (e) | | | — | (e) | | | — | (e) |
| | 2016 - Class C Shares (Commenced operations on March 31, 2016) | | | 1.00 | | | | — | (e) | | | — | (e) | | | — | (e) | | | — | (e) | | | — | (e) | | | — | (e) |
| | 2015 - Class I Shares | | | 1.00 | | | | — | (e) | | | — | (e) | | | — | (e) | | | — | (e) | | | — | (e) | | | — | (e) |
| | 2015 - Select Shares | | | 1.00 | | | | — | (e) | | | — | (e) | | | — | (e) | | | — | (e) | | | — | (e) | | | — | (e) |
| | 2015 - Preferred Shares | | | 1.00 | | | | — | (e) | | | — | (e) | | | — | (e) | | | — | (e) | | | — | (e) | | | — | (e) |
| | 2015 - Capital Shares | | | 1.00 | | | | — | (e) | | | — | (e) | | | — | (e) | | | — | (e) | | | — | (e) | | | — | (e) |
| | 2015 - Administration Shares | | | 1.00 | | | | — | (e) | | | — | (e) | | | — | (e) | | | — | (e) | | | — | (e) | | | — | (e) |
| | 2015 - Premier Shares | | | 1.00 | | | | — | (e) | | | — | (e) | | | — | (e) | | | — | (e) | | | — | (e) | | | — | (e) |
| | 2015 - Service Shares | | | 1.00 | | | | — | (e) | | | — | (e) | | | — | (e) | | | — | (e) | | | — | (e) | | | — | (e) |
| | 2015 - Resource Shares | | | 1.00 | | | | — | (e) | | | — | (e) | | | — | (e) | | | — | (e) | | | — | (e) | | | — | (e) |
| | 2015 - Cash Management Shares | | | 1.00 | | | | — | (e) | | | — | (e) | | | — | (e) | | | — | (e) | | | — | (e) | | | — | (e) |
| | 2014 - Class I Shares | | | 1.00 | | | | — | (e) | | | — | (e) | | | — | (e) | | | — | (e) | | | — | (e) | | | — | (e) |
| | 2014 - Select Shares | | | 1.00 | | | | — | (e) | | | — | (e) | | | — | (e) | | | — | (e) | | | — | (e) | | | — | (e) |
| | 2014 - Preferred Shares | | | 1.00 | | | | — | (e) | | | — | (e) | | | — | (e) | | | — | (e) | | | — | (e) | | | — | (e) |
| | 2014 - Capital Shares | | | 1.00 | | | | — | (e) | | | — | (e) | | | — | (e) | | | — | (e) | | | — | (e) | | | — | (e) |
| | 2014 - Administration Shares | | | 1.00 | | | | — | (e) | | | — | (e) | | | — | (e) | | | — | (e) | | | — | (e) | | | — | (e) |
| | 2014 - Premier Shares | | | 1.00 | | | | — | (e) | | | — | (e) | | | — | (e) | | | — | (e) | | | — | (e) | | | — | (e) |
| | 2014 - Service Shares | | | 1.00 | | | | — | (e) | | | — | (e) | | | — | (e) | | | — | (e) | | | — | (e) | | | — | (e) |
| | 2014 - Resource Shares | | | 1.00 | | | | — | (e) | | | — | (e) | | | — | (e) | | | — | (e) | | | — | (e) | | | — | (e) |
| | 2014 - Cash Management Shares | | | 1.00 | | | | — | (e) | | | — | (e) | | | — | (e) | | | — | (e) | | | — | (e) | | | — | (e) |
| | 2013 - Class I Shares | | | 1.00 | | | | — | (e) | | | — | (e) | | | — | (e) | | | — | (e) | | | — | (e) | | | — | (e) |
| | 2013 - Select Shares | | | 1.00 | | | | — | (e) | | | — | (e) | | | — | (e) | | | — | (e) | | | — | (e) | | | — | (e) |
| | 2013 - Preferred Shares | | | 1.00 | | | | — | (e) | | | — | (e) | | | — | (e) | | | — | (e) | | | — | (e) | | | — | (e) |
| | 2013 - Capital Shares | | | 1.00 | | | | — | (e) | | | — | (e) | | | — | (e) | | | — | (e) | | | — | (e) | | | — | (e) |
| | 2013 - Administration Shares | | | 1.00 | | | | — | (e) | | | — | (e) | | | — | (e) | | | — | (e) | | | — | (e) | | | — | (e) |
| | 2013 - Premier Shares | | | 1.00 | | | | — | (e) | | | — | (e) | | | — | (e) | | | — | (e) | | | — | (e) | | | — | (e) |
| | 2013 - Service Shares | | | 1.00 | | | | — | (e) | | | — | (e) | | | — | (e) | | | — | (e) | | | — | (e) | | | — | (e) |
| | 2013 - Resource Shares | | | 1.00 | | | | — | (e) | | | — | (e) | | | — | (e) | | | — | (e) | | | — | (e) | | | — | (e) |
| | 2013 - Cash Management Shares | | | 1.00 | | | | — | (e) | | | — | (e) | | | — | (e) | | | — | (e) | | | — | (e) | | | — | (e) |
| | 2012 - Class I Shares | | | 1.00 | | | | — | (e) | | | — | (e) | | | — | (e) | | | — | (e) | | | — | (e) | | | — | (e) |
| | 2012 - Select Shares | | | 1.00 | | | | — | (e) | | | — | (e) | | | — | (e) | | | — | (e) | | | — | (e) | | | — | (e) |
| | 2012 - Preferred Shares | | | 1.00 | | | | — | (e) | | | — | (e) | | | — | (e) | | | — | (e) | | | — | (e) | | | — | (e) |
| | 2012 - Capital Shares | | | 1.00 | | | | — | (e) | | | — | (e) | | | — | (e) | | | — | (e) | | | — | (e) | | | — | (e) |
| | 2012 - Administration Shares | | | 1.00 | | | | — | (e) | | | — | (e) | | | — | (e) | | | — | (e) | | | — | (e) | | | — | (e) |
| | 2012 - Premier Shares | | | 1.00 | | | | — | (e) | | | — | (e) | | | — | (e) | | | — | (e) | | | — | (e) | | | — | (e) |
| | 2012 - Service Shares | | | 1.00 | | | | — | (e) | | | — | (e) | | | — | (e) | | | — | (e) | | | — | (e) | | | — | (e) |
| | 2012 - Resource Shares | | | 1.00 | | | | — | (e) | | | — | (e) | | | — | (e) | | | — | (e) | | | — | (e) | | | — | (e) |
| | 2012 - Cash Management Shares | | | 1.00 | | | | — | (e) | | | — | (e) | | | — | (e) | | | — | (e) | | | — | (e) | | | — | (e) |
| | (a) | | Calculated based on the average shares outstanding methodology. |
| | (b) | | Distributions may not coincide with the current year net investment income or net realized gains as distributions may be paid from current or prior year earnings. |
| | (c) | | Assumes reinvestment of all distributions. Returns do not reflect the deduction of taxes that a shareholder would pay on Fund distributions. Total returns for periods less than one full year are not annualized. |
| | (e) | | Amount is less than $0.0005 per share. |
| | |
| 26 | | The accompanying notes are an integral part of these financial statements. |
INVESTOR TAX-EXEMPT MONEY MARKET FUND
| | | | | | | | | | | | | | | | | | | | | | | | | | | | | | | | | | |
| | | | | | | | | | | | | | | | | | | | | | | | | | | | | | | | | | |
| | | Net asset value, end of period | | | | | Total return(c) | | | | | Net assets end of period (in 000s) | | | | | Ratio of
net expenses
to average
net assets | | | | | Ratio of
total expenses
to average
net assets | | | | | Ratio of
net investment
income
to average
net assets | |
| | | | | | | | | | | | | | | | | | | | | | | | | | | | | | | | | | |
| | $ | 1.00 | | | | | | 0.30 | % | | | | $ | 921,632 | | | | | | 0.18 | %(d) | | | | | 0.33 | %(d) | | | | | 0.48 | %(d) |
| | | 1.00 | | | | | | 0.29 | | | | | | 1 | | | | | | 0.18 | (d) | | | | | 0.36 | (d) | | | | | 0.66 | (d) |
| | | 1.00 | | | | | | 0.25 | | | | | | 35 | | | | | | 0.28 | (d) | | | | | 0.43 | (d) | | | | | 0.38 | (d) |
| | | 1.00 | | | | | | 0.23 | | | | | | 1 | | | | | | 0.33 | (d) | | | | | 0.48 | (d) | | | | | 0.29 | (d) |
| | | 1.00 | | | | | | 0.18 | | | | | | 4,880 | | | | | | 0.43 | (d) | | | | | 0.58 | (d) | | | | | 0.23 | (d) |
| | | 1.00 | | | | | | 0.14 | | | | | | 1 | | | | | | 0.40 | (d) | | | | | 0.68 | (d) | | | | | 0.37 | (d) |
| | | 1.00 | | | | | | 0.07 | | | | | | 907 | | | | | | 0.63 | (d) | | | | | 0.83 | (d) | | | | | 0.03 | (d) |
| | | 1.00 | | | | | | 0.06 | | | | | | 4,583 | | | | | | 0.66 | (d) | | | | | 0.98 | (d) | | | | | 0.01 | (d) |
| | | 1.00 | | | | | | 0.08 | | | | | | 40 | | | | | | 0.63 | (d) | | | | | 1.13 | (d) | | | | | 0.02 | (d) |
| | | 1.00 | | | | | | 0.18 | | | | | | 642 | | | | | | 0.43 | (d) | | | | | 0.58 | (d) | | | | | 0.25 | (d) |
| | | 1.00 | | | | | | 0.07 | | | | | | 9 | | | | | | 0.64 | (d) | | | | | 1.33 | (d) | | | | | 0.04 | (d) |
| | | | | | | | | | | | | | | | | | | | | | | | | | | | | | | | | | |
| | | | | | | | | | | | | | | | | | | | | | | | | | | | | | | | | | |
| | | 1.00 | | | | | | 0.11 | | | | | | 1,387,634 | | | | | | 0.11 | | | | | | 0.24 | | | | | | 0.07 | |
| | | 1.00 | | | | | | 0.09 | | | | | | — | | | | | | 0.11 | | | | | | 0.27 | | | | | | 0.01 | |
| | | 1.00 | | | | | | 0.06 | | | | | | 46 | | | | | | 0.13 | | | | | | 0.34 | | | | | | 0.03 | |
| | | 1.00 | | | | | | 0.04 | | | | | | 886 | | | | | | 0.19 | | | | | | 0.39 | | | | | | 0.04 | |
| | | 1.00 | | | | | | 0.01 | | | | | | 13,041 | | | | | | 0.18 | | | | | | 0.49 | | | | | | 0.01 | |
| | | 1.00 | | | | | | 0.01 | | | | | | 1 | | | | | | 0.12 | | | | | | 0.59 | | | | | | 0.37 | |
| | | 1.00 | | | | | | 0.01 | | | | | | 58,173 | | | | | | 0.21 | | | | | | 0.74 | | | | | | 0.01 | |
| | | 1.00 | | | | | | 0.01 | | | | | | 6,469 | | | | | | 0.20 | | | | | | 0.89 | | | | | | 0.01 | |
| | | 1.00 | | | | | | 0.01 | | | | | | 1 | | | | | | 0.12 | | | | | | 1.04 | | | | | | 0.37 | |
| | | 1.00 | | | | | | 0.01 | | | | | | 10 | | | | | | 0.30 | (d) | | | | | 0.49 | (d) | | | | | 0.04 | (d) |
| | | 1.00 | | | | | | 0.01 | | | | | | 10 | | | | | | 0.31 | (d) | | | | | 1.24 | (d) | | | | | 0.04 | (d) |
| | | 1.00 | | | | | | 0.01 | | | | | | 4,955,885 | | | | | | 0.08 | | | | | | 0.23 | | | | | | 0.01 | |
| | | 1.00 | | | | | | 0.01 | | | | | | 193,506 | | | | | | 0.08 | | | | | | 0.26 | | | | | | 0.01 | |
| | | 1.00 | | | | | | 0.01 | | | | | | 6,914 | | | | | | 0.08 | | | | | | 0.33 | | | | | | 0.01 | |
| | | 1.00 | | | | | | 0.01 | | | | | | 22,788 | | | | | | 0.08 | | | | | | 0.38 | | | | | | 0.01 | |
| | | 1.00 | | | | | | 0.01 | | | | | | 107,676 | | | | | | 0.08 | | | | | | 0.48 | | | | | | 0.01 | |
| | | 1.00 | | | | | | 0.01 | | | | | | 1 | | | | | | 0.08 | | | | | | 0.58 | | | | | | 0.01 | |
| | | 1.00 | | | | | | 0.01 | | | | | | 72,003 | | | | | | 0.08 | | | | | | 0.73 | | | | | | 0.01 | |
| | | 1.00 | | | | | | 0.01 | | | | | | 8,268 | | | | | | 0.08 | | | | | | 0.88 | | | | | | 0.01 | |
| | | 1.00 | | | | | | 0.01 | | | | | | 1 | | | | | | 0.08 | | | | | | 1.03 | | | | | | 0.40 | |
| | | 1.00 | | | | | | 0.01 | | | | | | 5,225,304 | | | | | | 0.10 | | | | | | 0.23 | | | | | | 0.01 | |
| | | 1.00 | | | | | | 0.01 | | | | | | 267,104 | | | | | | 0.10 | | | | | | 0.26 | | | | | | 0.01 | |
| | | 1.00 | | | | | | 0.01 | | | | | | 15,635 | | | | | | 0.10 | | | | | | 0.33 | | | | | | 0.01 | |
| | | 1.00 | | | | | | 0.01 | | | | | | 5,728 | | | | | | 0.10 | | | | | | 0.38 | | | | | | 0.01 | |
| | | 1.00 | | | | | | 0.01 | | | | | | 155,732 | | | | | | 0.10 | | | | | | 0.48 | | | | | | 0.01 | |
| | | 1.00 | | | | | | 0.01 | | | | | | 1,858 | | | | | | 0.10 | | | | | | 0.58 | | | | | | 0.01 | |
| | | 1.00 | | | | | | 0.01 | | | | | | 66,226 | | | | | | 0.10 | | | | | | 0.73 | | | | | | 0.01 | |
| | | 1.00 | | | | | | 0.01 | | | | | | 12,979 | | | | | | 0.10 | | | | | | 0.88 | | | | | | 0.01 | |
| | | 1.00 | | | | | | 0.01 | | | | | | 1 | | | | | | 0.10 | | | | | | 1.03 | | | | | | 0.40 | |
| | | 1.00 | | | | | | 0.02 | | | | | | 4,762,419 | | | | | | 0.15 | | | | | | 0.23 | | | | | | 0.02 | |
| | | 1.00 | | | | | | 0.02 | | | | | | 197,985 | | | | | | 0.16 | | | | | | 0.26 | | | | | | 0.01 | |
| | | 1.00 | | | | | | 0.01 | | | | | | 19,349 | | | | | | 0.16 | | | | | | 0.33 | | | | | | 0.01 | |
| | | 1.00 | | | | | | 0.01 | | | | | | 3,511 | | | | | | 0.16 | | | | | | 0.38 | | | | | | 0.01 | |
| | | 1.00 | | | | | | 0.01 | | | | | | 134,037 | | | | | | 0.16 | | | | | | 0.48 | | | | | | 0.01 | |
| | | 1.00 | | | | | | 0.01 | | | | | | 572,262 | | | | | | 0.16 | | | | | | 0.58 | | | | | | 0.01 | |
| | | 1.00 | | | | | | 0.01 | | | | | | 16,214 | | | | | | 0.16 | | | | | | 0.73 | | | | | | 0.01 | |
| | | 1.00 | | | | | | 0.01 | | | | | | 26,818 | | | | | | 0.16 | | | | | | 0.88 | | | | | | 0.01 | |
| | | 1.00 | | | | | | 0.01 | | | | | | 1 | | | | | | 0.15 | | | | | | 1.03 | | | | | | 0.40 | |
| | | 1.00 | | | | | | 0.02 | | | | | | 5,462,807 | | | | | | 0.17 | | | | | | 0.23 | | | | | | 0.02 | |
| | | 1.00 | | | | | | 0.02 | | | | | | 102,994 | | | | | | 0.18 | | | | | | 0.26 | | | | | | 0.01 | |
| | | 1.00 | | | | | | 0.01 | | | | | | 22,477 | | | | | | 0.18 | | | | | | 0.33 | | | | | | 0.01 | |
| | | 1.00 | | | | | | 0.01 | | | | | | 11,793 | | | | | | 0.18 | | | | | | 0.38 | | | | | | 0.01 | |
| | | 1.00 | | | | | | 0.01 | | | | | | 217,010 | | | | | | 0.18 | | | | | | 0.48 | | | | | | 0.01 | |
| | | 1.00 | | | | | | 0.01 | | | | | | 565,678 | | | | | | 0.18 | | | | | | 0.58 | | | | | | 0.01 | |
| | | 1.00 | | | | | | 0.01 | | | | | | 29,450 | | | | | | 0.18 | | | | | | 0.73 | | | | | | 0.01 | |
| | | 1.00 | | | | | | 0.01 | | | | | | 27,615 | | | | | | 0.18 | | | | | | 0.88 | | | | | | 0.01 | |
| | | 1.00 | | | | | | 0.01 | | | | | | 1 | | | | | | 0.17 | | | | | | 1.03 | | | | | | 0.40 | |
| | |
| The accompanying notes are an integral part of these financial statements. | | 27 |
GOLDMAN SACHS FUNDS — INVESTOR FUNDS
Notes to Financial Statements
February 28, 2017 (Unaudited)
Goldman Sachs Trust (the “Trust”) is a Delaware statutory trust registered under the Investment Company Act of 1940, as amended (the “Act”), as an open-end management investment company. The following table lists those series of the Trust that are included in this report (collectively, the “Funds” or individually a “Fund”), along with their corresponding share classes and respective diversification status under the Act:
| | | | |
| Fund | | Share Classes Offered | | Diversified/ Non-Diversified |
Investor Money Market | | Class I, Administration, Service, Class A, Class C, Resource and Cash Management | | Diversified |
Investor Tax-Exempt Money Market | | Class I, Select, Preferred, Capital, Administration, Premier, Service, Class A, Class C, Resource and Cash Management | | Diversified |
Class C Shares may typically be acquired only in an exchange for Class C Shares of another Goldman Sachs Fund. Class C Shares may be subject to a contingent deferred sales charge (“CDSC”) of 1.00% during the first 12 months, measured from the time the original shares subject to the CDSC were acquired. Previously, ‘Class I Shares’ for the Investor Tax-Exempt Money Market Fund were known as ‘Institutional Shares’.
Goldman Sachs Asset Management, L.P. (“GSAM”), an affiliate of Goldman, Sachs & Co. (“Goldman Sachs”), serves as investment adviser to the Funds pursuant to management agreements (the “Agreements”) with the Trust.
|
| 2. SIGNIFICANT ACCOUNTING POLICIES |
The financial statements have been prepared in accordance with accounting principles generally accepted in the United States of America (“GAAP”) and require management to make estimates and assumptions that may affect the reported amounts and disclosures. Actual results may differ from those estimates and assumptions.
28
GOLDMAN SACHS FUNDS — INVESTOR FUNDS
|
| 2. SIGNIFICANT ACCOUNTING POLICIES (continued) |
A. Investment Valuation — The investment valuation policy of the Funds is to use the amortized-cost method permitted by Rule 2a-7 under the Act for valuing portfolio securities. The amortized-cost method of valuation involves valuing a security at its cost and thereafter applying a constant amortization to maturity of any discount or premium. Normally, a security’s amortized cost will approximate its market value. Under procedures and tolerances approved by the Board of Trustees (“Trustees”), GSAM evaluates daily the difference between each Fund’s net asset value (“NAV”) per share using the amortized costs of its portfolio securities and the Fund’s NAV per share using market-based values of its portfolio securities. The market-based value of a portfolio security is determined, where readily available, on the basis of market quotations provided by pricing services or securities dealers, or, where accurate market quotations are not readily available, on the basis of the security’s fair value as determined in accordance with Valuation Procedures approved by the Trustees. The pricing services may use valuation models or matrix pricing, which may consider (among other things): (i) yield or price with respect to debt securities that are considered comparable in characteristics such as rating, interest rate and maturity date or (ii) quotations from securities dealers to determine current value.
B. Investment Income and Investments — Interest income is accrued daily and adjusted for amortization of premiums and accretion of discounts. Investment transactions are reflected on trade date. Realized gains and losses are calculated using identified cost.
C. Class Allocations and Expenses — Investment income, realized and unrealized gain (loss), and non-class specific expenses of each Fund are allocated daily based upon the proportion of net assets of each class. Class specific expenses, where applicable, are borne by the respective share classes and include Distribution and Service, Transfer Agency and Service and Shareholder Administration fees. Non-class specific expenses directly incurred by a Fund are charged to that Fund, while such expenses incurred by the Trust are allocated across the respective Funds on a straight-line and/or pro-rata basis depending upon the nature of the expenses.
D. Federal Taxes and Distributions to Shareholders — It is each Fund’s policy to comply with the requirements of the Internal Revenue Code of 1986, as amended (the “Code”), applicable to regulated investment companies (mutual funds) and to
29
GOLDMAN SACHS FUNDS — INVESTOR FUNDS
Notes to Financial Statements (continued)
February 28, 2017 (Unaudited)
|
| 2. SIGNIFICANT ACCOUNTING POLICIES (continued) |
distribute each year substantially all of its investment company taxable and tax-exempt income and capital gains to its shareholders. Accordingly, the Funds are not required to make any provisions for the payment of federal income tax. Distributions to shareholders are declared and recorded daily and paid monthly by the Funds and may include short-term capital gains. Long-term capital gain distributions, if any, are declared and paid annually.
Net capital losses, if any, are carried forward to future fiscal years and may be used to the extent allowed by the Code to offset any future capital gains. Utilization of capital loss carryforwards will reduce the requirement of future capital gains distributions.
The characterization of distributions to shareholders for financial reporting purposes is determined in accordance with federal income tax rules, which may differ from GAAP. The source of each Fund’s distributions may be shown in the accompanying financial statements as either from net investment income, net realized gain or capital. Certain components of the Funds’ net assets on the Statements of Assets and Liabilities reflect permanent GAAP/tax differences based on the appropriate tax character.
E. Forward Commitments — A forward commitment involves entering into a contract to purchase or sell securities, typically on an extended settlement basis, for a fixed price at a future date. The purchase of securities on a forward commitment basis involves a risk of loss if the value of the security to be purchased declines before the settlement date. Conversely, the sale of securities on a forward commitment basis involves the risk that the value of the securities sold may increase before the settlement date. Although a Fund will generally purchase securities on a forward commitment basis with the intention of acquiring the securities for its portfolio, the Fund may dispose of forward commitments prior to settlement which may result in a realized gain or loss.
F. Offering Costs — Offering costs paid in connection with the offering of shares of the Goldman Sachs Investor Money Market Fund were amortized on a straight-line basis over 12 months from the date of commencement of operations.
G. Repurchase Agreements — Repurchase agreements involve the purchase of securities subject to the seller’s agreement to repurchase the securities at a mutually agreed upon date and price, under the terms of a Master Repurchase Agreement (“MRA”). During the term of a repurchase agreement, the value of the underlying securities held as collateral on behalf of a Fund, including accrued interest, is required to exceed the value of the repurchase agreement, including accrued interest. The gross value of
30
GOLDMAN SACHS FUNDS — INVESTOR FUNDS
|
| 2. SIGNIFICANT ACCOUNTING POLICIES (continued) |
repurchase agreements is included in the Statements of Assets and Liabilities for financial reporting purposes. The underlying securities for all repurchase agreements are held at the Funds’ custodian or designated sub-custodians under tri-party repurchase agreements.
An MRA governs transactions between a Fund and select counterparties. An MRA contains provisions for, among other things, initiation of the transaction, income payments, events of default and maintenance of securities for repurchase agreements. An MRA also permits offsetting with collateral to create one single net payment in the event of default or similar events, including the bankruptcy or insolvency of a counterparty.
If the seller defaults, a Fund could suffer a loss to the extent that the proceeds from the sale of the underlying securities and other collateral held by the Fund are less than the repurchase price and the Fund’s costs associated with delay and enforcement of the repurchase agreement. In addition, in the event of default or insolvency of the seller, a court could determine that a Fund’s interest in the collateral is not enforceable, resulting in additional losses to the Fund.
Pursuant to exemptive relief granted by the Securities and Exchange Commission (“SEC”) and terms and conditions contained therein, the Funds, together with other funds of the Trust and registered investment companies having management agreements with GSAM or its affiliates, may transfer uninvested cash into joint accounts, the daily aggregate balance of which is invested in one or more repurchase agreements. Under these joint accounts, the Funds maintain pro-rata credit exposure to the underlying repurchase agreements’ counterparties. With the exception of certain transaction fees, the Funds are not subject to any expenses in relation to these investments.
|
| 3. INVESTMENTS AND FAIR VALUE MEASUREMENTS |
The fair value of a financial instrument is the amount that would be received to sell an asset or paid to transfer a liability in an orderly transaction between market participants at the measurement date (i.e., the exit price). GAAP establishes a fair value hierarchy that prioritizes the inputs to valuation techniques used to measure fair value. The hierarchy gives the highest priority to unadjusted quoted prices in active markets for identical assets or liabilities (Level 1 measurements) and the lowest priority to
31
GOLDMAN SACHS FUNDS — INVESTOR FUNDS
Notes to Financial Statements (continued)
February 28, 2017 (Unaudited)
|
| 3. INVESTMENTS AND FAIR VALUE MEASUREMENTS (continued) |
unobservable inputs (Level 3 measurements). The levels used for classifying investments are not necessarily an indication of the risk associated with investing in these investments. The three levels of the fair value hierarchy are described below:
Level 1 — Unadjusted quoted prices in active markets that are accessible at the measurement date for identical, unrestricted assets or liabilities;
Level 2 — Quoted prices in markets that are not active or financial instruments for which significant inputs are observable (including, but not limited to, quoted prices for similar investments, interest rates, foreign exchange rates, volatility and credit spreads), either directly or indirectly;
Level 3 — Prices or valuations that require significant unobservable inputs (including GSAM’s assumptions in determining fair value measurement).
The Trustees have approved Valuation Procedures that govern the valuation of the portfolio investments held by the Funds, including investments for which market quotations are not readily available. The Trustees have delegated to GSAM day-to-day responsibility for implementing and maintaining internal controls and procedures related to the valuation (including both the amortized cost and market-based methods of valuation) of the Funds’ portfolio investments. To assess the continuing appropriateness of pricing sources and methodologies related to the market-based method of valuation, GSAM regularly performs price verification procedures and issues challenges as necessary to third party pricing vendors or brokers, and any differences are reviewed in accordance with the Valuation Procedures.
As of February 28, 2017, all investments are classified as Level 2 of the fair value hierarchy. Please refer to the Schedules of Investments for further detail.
|
| 4. AGREEMENTS AND AFFILIATED TRANSACTIONS |
A. Management Agreements — Under the Agreements, GSAM manages the Funds, subject to the general supervision of the Trustees.
As compensation for the services rendered pursuant to the Agreements, the assumption of the expenses related thereto and administration of the Funds’ business affairs, including providing facilities, GSAM is entitled to a management fee, accrued daily and paid monthly, equal to an annual percentage rate of each Fund’s average daily net assets. GSAM has agreed to not impose a portion of the management fee equal annually to 0.045% of each Fund’s average daily net assets. This arrangement will remain in effect through at least December 29, 2017, and prior to such date, GSAM may not terminate the arrangement without the approval of the Trustees.
32
GOLDMAN SACHS FUNDS — INVESTOR FUNDS
|
| 4. AGREEMENTS AND AFFILIATED TRANSACTIONS (continued) |
B. Administration, Service and/or Shareholder Administration Plans — The Trust, on behalf of each applicable Fund, has adopted Administration, Service and/or Shareholder Administration Plans (the “Plans”) to allow Class C, Select, Preferred, Capital, Administration, Premier, Service, Resource and Cash Management Shares to compensate service organizations (including Goldman Sachs) for providing varying levels of account administration and/or personal and account maintenance services to their customers who are beneficial owners of such shares. The Plans provide for compensation to the service organizations equal to an annual percentage rate of the average daily net assets of such shares.
C. Distribution and/or Service (12b-1) Plans — The Trust, on behalf of the Class A Shares of each applicable Fund, has adopted a Distribution and Service Plan subject to Rule 12b-1 under the Act. Under the Distribution and Service Plan, Goldman Sachs, as Distributor, is entitled to a fee accrued daily and paid monthly for distribution services and personal and account maintenance services, which may then be paid by Goldman Sachs to authorized dealers. These fees are equal to an annual percentage rate of the average daily net assets attributable to Class A Shares of the Funds.
The Trust, on behalf of Class C, Resource and Cash Management Shares of each applicable Fund, has adopted Distribution Plans subject to Rule 12b-1 under the Act. Under the Distribution Plans, Goldman Sachs is entitled to a fee accrued daily and paid monthly for distribution services, which may then be paid by Goldman Sachs to authorized dealers. These fees are equal to an annual percentage rate of the average daily net assets attributable to Class C, Resource and Cash Management Shares of the Funds.
The Trust, on behalf of the Service Shares of each applicable Fund, has adopted a Service Plan subject to Rule 12b-1 under the Act to allow Service Shares to compensate service organizations (including Goldman Sachs) for providing personal and account maintenance services to their customers who are beneficial owners of such shares. The Service Plan provides for compensation to the service organizations equal to an annual percentage rate of the average daily net assets of such shares.
D. Distribution Agreement — Goldman Sachs, as Distributor of the shares of the Funds pursuant to a Distribution Agreement, may retain a portion of the Class C Shares’ CDSC. During the six months ended February 28, 2017, Goldman Sachs has advised that it did not retain any CDSCs with respect to Class C Shares of the Funds.
E. Transfer Agency Agreement — Goldman Sachs also serves as the transfer agent of the Funds for a fee pursuant to a Transfer Agency Agreement. The fee charged for such transfer agency services is accrued daily and paid monthly and is equal to an annual percentage rate of each Fund’s average daily net assets.
F. Other Agreements — GSAM has agreed to limit certain “Other Expenses” of the Funds (excluding transfer agency fees and expenses, administration fees (as applicable), service fees (as applicable), shareholder administration fees (as applicable), taxes, interest, brokerage fees, shareholder meetings, litigation, indemnification and extraordinary expenses) to the extent such expenses exceed, on an annual basis, 0.014% of the average daily net assets of each Fund. Such Other Expense reimbursements, if any, are accrued daily and paid monthly. These Other Expense limitations will remain in place through at least December 29, 2017, and prior to such date GSAM may not terminate the arrangements without the approval of the Trustees.
In addition, the Funds have entered into certain offset arrangements with the custodian and the transfer agent, which may result in a reduction of the Funds’ expenses and are received irrespective of the application of the “Other Expense” limitations described above.
33
GOLDMAN SACHS FUNDS — INVESTOR FUNDS
Notes to Financial Statements (continued)
February 28, 2017 (Unaudited)
|
| 4. AGREEMENTS AND AFFILIATED TRANSACTIONS (continued) |
G. Total Fund Expenses
Fund Contractual Fees
The contractual annualized rates for each of the Funds are as follows:
| | | | | | | | | | | | | | | | | | | | | | | | | | | | | | | | | | | | | | | | | | | | |
| | | Class I Shares | | | Select Shares(a) | | | Preferred Shares(a) | | | Capital Shares(a) | | | Administration Shares | | | Premier Shares(a) | | | Service Shares | | | Resource Shares | | | Cash Management Shares | | | Class A Shares | | | Class C Shares | |
Management Fee | | | 0.205 | % | | | 0.205 | % | | | 0.205 | % | | | 0.205 | % | | | 0.205 | % | | | 0.205 | % | | | 0.205 | % | | | 0.205 | % | | | 0.205 | % | | | 0.205 | % | | | 0.205 | % |
Administration, Service and/or Shareholder Administration Fees | | | N/A | | | | 0.03 | | | | 0.10 | | | | 0.15 | | | | 0.25 | | | | 0.35 | | | | 0.25 | | | | 0.50 | | | | 0.50 | | | | N/A | | | | 0.25 | |
Distribution and/or Service (12b-1) Fees | | | N/A | | | | N/A | | | | N/A | | | | N/A | | | | N/A | | | | N/A | | | | 0.25 | (b) | | | 0.15 | (c) | | | 0.30 | (c) | | | 0.25 | | | | 0.75 | (c) |
Transfer Agency Fee | | | 0.01 | | | | 0.01 | | | | 0.01 | | | | 0.01 | | | | 0.01 | | | | 0.01 | | | | 0.01 | | | | 0.01 | | | | 0.01 | | | | 0.01 | | | | 0.01 | |
N/A—Fees not applicable to respective share class
| (a) | | Tax-Exempt Money Market Fund only. |
| (b) | | Service (12b-1) fee only. |
| (c) | | Distribution (12b-1) fee only. |
Fund Effective Net Expenses (After Waivers and Reimbursements)
In addition to the contractual fee waivers and expense limitations discussed above, during the six months ended February 28, 2017, GSAM and Goldman Sachs (as applicable) voluntarily agreed to waive all or a portion of the respective class-specific fees (consisting of Distribution and/or Service, Administration, Service and/or Shareholder Administration Plan fees) attributable to the Funds. These waivers may be modified or terminated at any time at the option of GSAM or Goldman Sachs (as applicable). The Funds are not obligated to reimburse GSAM or Goldman Sachs for prior fiscal year fee waivers and/or expense reimbursements, if any.
For the six months ended February 28, 2017, expense reductions including any fee waivers and Other Expense reimbursements were as follows (in thousands):
| | | | | | | | | | | | | | | | | | |
| Fund | | | | Management Fee Waivers | | | Distribution, Administration, Service and/or Shareholder, Administration Plans Fee Waivers | | | Other Expense Reimbursements | | | Total Expense Reductions | |
Investor Money Market | | | | $ | 30 | | | $ | — | * | | $ | 399 | | | $ | 429 | |
Investor Tax-Exempt Money Market | | | | | 218 | | | | 9 | | | | 481 | | | | 708 | |
| * | | Amount less than one thousand. |
34
GOLDMAN SACHS FUNDS — INVESTOR FUNDS
|
| 4. AGREEMENTS AND AFFILIATED TRANSACTIONS (continued) |
H. Other Transactions with Affiliates — A Fund may purchase securities from, or sell securities to, an affiliated fund provided the affiliation is solely due to having a common investment adviser, common officers, or common Trustees. For the six months ended February 28, 2017, the purchase and sale transactions and related net realized gain (loss) for the Funds with affiliated funds in compliance with Rule 17a-7 under the Act were as follows:
| | | | | | | | | | | | | | |
| Fund | | | | Purchases | | | Sales | | | Net Realized
Gain (Loss) | |
Investor Money Market | | | | $ | 31,760,379 | | | $ | 2,365,933 | | | $ | — | |
Investor Tax-Exempt Money Market | | | | | 157,941,893 | | | | 636,562,023 | | | | — | |
As of February 28, 2017, the Goldman Sachs Group (“GSG”), Inc. was the beneficial owner of approximately 100%, 16%, 100%, 100% and 99% of Service, Class A, Class C, Resource and Cash Management Shares, respectively, of the Investor Money Market Fund and 100%, 100%, 100% and 100% of Select, Capital, Premier and Class C Shares, respectively, of the Investor Tax-Exempt Money Market Fund.
I. Line of Credit Facility — As of February 28, 2017, the Funds participated in a $1,100,000,000 committed, unsecured revolving line of credit facility (the “facility”) together with other funds of the Trust and registered investment companies having management agreements with GSAM or its affiliates. This facility is to be used for temporary emergency purposes, or to allow for an orderly liquidation of securities to meet redemption requests. The interest rate on borrowings is based on the federal funds rate. The facility also requires a fee to be paid by the Funds based on the amount of the commitment that has not been utilized. For the six months ended February 28, 2017, the Funds did not have any borrowings under the facility.
As of the Funds’ most recent fiscal year end, August 31, 2016, the Funds’ certain timing differences on a tax basis were as follows:
| | | | | | | | |
| | | Investor
Money
Market | | | Investor
Tax-Exempt
Money Market | |
Timing differences (Dividend Payable) | | $ | (278 | ) | | $ | (349,792 | ) |
At February 28, 2017, the aggregate cost for each Fund stated in the accompanying Schedule of Investments also approximates the aggregate cost for U.S. federal income tax purposes.
GSAM has reviewed the Funds’ tax positions for all open tax years (the current and prior three tax years, as applicable) and has concluded that no provision for income tax is required in the Funds’ financial statements. Such open tax years remain subject to examination and adjustment by tax authorities.
The Funds’ risks include, but are not limited to, the following:
Large Shareholder Transactions Risk — A Fund may experience adverse effects when certain large shareholders, such as financial intermediaries (who may make investment decisions on behalf of underlying clients) and individuals, purchase or redeem
35
GOLDMAN SACHS FUNDS — INVESTOR FUNDS
Notes to Financial Statements (continued)
February 28, 2017 (Unaudited)
|
| 6. OTHER RISKS (continued) |
large amounts of shares of a Fund. Such large shareholder redemptions may cause a Fund to sell portfolio securities at times when it would not otherwise do so, which may negatively impact the Fund’s NAV and liquidity. Similarly, large Fund share purchases may adversely affect a Fund’s performance to the extent that the Fund is delayed in investing new cash and is required to maintain a larger cash position than it ordinarily would. These transactions may also accelerate the realization of taxable income to shareholders if such sales of investments resulted in gains, and may also increase transaction costs. In addition, a large redemption could result in a Fund’s current expenses being allocated over a smaller asset base, leading to an increase in the Fund’s expense ratio.
Interest Rate Risk — When interest rates increase, a Fund’s yield will tend to be lower than prevailing market rates, and the market value of its securities or instruments may also be adversely affected. A low interest rate environment poses additional risks to a Fund, because low yields on the Fund’s portfolio holdings may have an adverse impact on the Fund’s ability to provide a positive yield to its shareholders, pay expenses out of Fund assets, or, at times, maintain a stable $1.00 share price. The risks associated with increasing interest rates are heightened given that interest rates are near historic lows, but may be expected to increase in the future with unpredictable effects on the markets and a Fund’s investments. Fluctuations in interest rates may also affect the liquidity of fixed income securities and instruments held by the Funds.
Market and Credit Risks — In the normal course of business, the Funds trade financial instruments and enter into financial transactions where risk of potential loss exists due to changes in the market (market risk). Additionally, a Fund may also be exposed to credit risk in the event that an issuer or guarantor fails to perform or that an institution or entity with which a Fund has unsettled or open transactions defaults.
Geographic and Sector Risk — The Investor Tax-Exempt Money Market Fund may invest a significant portion of its total assets in certain issuers within the same state, geographic region or economic sector which may subject the value of the Fund’s investments to risks associated with an adverse economic, business, political or environmental development affecting that state, region or sector.
Under the Trust’s organizational documents, its Trustees, officers, employees and agents are indemnified, to the extent permitted by the Act and state law, against certain liabilities that may arise out of performance of their duties to the Funds. Additionally, in the course of business, the Funds enter into contracts that contain a variety of indemnification clauses. The Funds’ maximum exposure under these arrangements is unknown, as this would involve future claims that may be made against the Funds that have not yet occurred. However, GSAM believes the risk of loss under these arrangements to be remote.
Exemptive Orders — Pursuant to SEC exemptive orders, the Funds may enter into certain principal transactions, including repurchase agreements, with Goldman Sachs.
Subsequent events after the Statement of Assets and Liabilities date have been evaluated and GSAM has concluded that there is no impact requiring adjustment or disclosure in the financial statements.
36
GOLDMAN SACHS FUNDS — INVESTOR FUNDS
|
| 10. SUMMARY OF SHARE TRANSACTIONS (AT $1.00 PER SHARE) |
Share activity is as follows:
| | | | | | | | |
| | | Investor Money Market Fund | |
| | | | |
| | | For the Six Months Ended
February 28, 2017
(Unaudited) | | | For the Period Ended
August 31, 2016* | |
| | | | |
| Class I Shares | | | | | | | | |
Shares sold | | | 282,469,048 | | | | 11,253,024 | |
Reinvestment of distributions | | | 100,233 | | | | 23,471 | |
Shares redeemed | | | (142,873,932 | ) | | | (598,009 | ) |
| | | | 139,695,349 | | | | 10,678,486 | |
| Administration Shares | | | | | | | | |
Shares sold | | | 127,898,467 | | | | 50,005 | |
Reinvestment of distributions | | | 21,355 | | | | 47 | |
Shares redeemed | | | (1,950,743 | ) | | | — | |
| | | | 125,969,079 | | | | 50,052 | |
| Service Shares(a) | | | | | | | | |
Shares sold | | | — | | | | 50,000 | |
Reinvestment of distributions | | | 65 | | | | 24 | |
Shares redeemed | | | — | | | | — | |
| | | | 65 | | | | 50,024 | |
| Resource Shares(a) | | | | | | | | |
Shares sold | | | — | | | | 50,000 | |
Reinvestment of distributions | | | 35 | | | | 23 | |
Shares redeemed | | | — | | | | — | |
| | | | 35 | | | | 50,023 | |
| Cash Management Shares(a) | | | | | | | | |
Shares sold | | | 1,098 | | | | 50,000 | |
Reinvestment of distributions | | | 17 | | | | 23 | |
Shares redeemed | | | (826 | ) | | | — | |
| | | | 289 | | | | 50,023 | |
| Class A Shares | | | | | | | | |
Shares sold | | | 973,376 | | | | 50,007 | |
Reinvestment of distributions | | | 690 | | | | 45 | |
Shares redeemed | | | (705,864 | ) | | | — | |
| | | | 268,202 | | | | 50,052 | |
| Class C Shares | | | | | | | | |
Shares sold | | | — | | | | 50,005 | |
Reinvestment of distributions | | | 14 | | | | 24 | |
Shares redeemed | | | — | | | | — | |
| | | | 14 | | | | 50,029 | |
NET INCREASE IN SHARES | | | 265,933,033 | | | | 10,978,689 | |
| * | | Commenced operations on January 29, 2016. |
| (a) | | Commenced operations on May 31, 2016. |
37
GOLDMAN SACHS FUNDS — INVESTOR FUNDS
Notes to Financial Statements (continued)
February 28, 2017 (Unaudited)
|
| 10. SUMMARY OF SHARE TRANSACTIONS (AT $1.00 PER SHARE) (continued) |
Share activity is as follows:
| | | | | | | | |
| | | Investor Tax-Exempt Money Market Fund | |
| | | | |
| | | For the Six Months Ended
February 28, 2017
(Unaudited) | | | For the Fiscal Year Ended
August 31, 2016 | |
| | | | |
| Class I Shares | | | | | | | | |
Shares sold | | | 717,079,177 | | | | 13,183,639,707 | |
Reinvestment of distributions | | | 243,658 | | | | 1,703,962 | |
Shares redeemed | | | (1,182,783,445 | ) | | | (16,754,080,268 | ) |
| | | | (465,460,610 | ) | | | (3,568,736,599 | ) |
| Select Shares | | | | | | | | |
Shares sold | | | 1,000 | | | | 86,955,362 | |
Reinvestment of distributions | | | 2 | | | | 13,672 | |
Shares redeemed | | | (307 | ) | | | (280,470,486 | ) |
| | | | 695 | | | | (193,501,452 | ) |
| Preferred Shares | | | | | | | | |
Shares sold | | | 19,584 | | | | 10,822,209 | |
Reinvestment of distributions | | | 4 | | | | 558 | |
Shares redeemed | | | (30,492 | ) | | | (17,690,231 | ) |
| | | | (10,904 | ) | | | (6,867,464 | ) |
| Capital Shares | | | | | | | | |
Shares sold | | | 1,000 | | | | 233,070,268 | |
Reinvestment of distributions | | | 2 | | | | 17,029 | |
Shares redeemed | | | (885,172 | ) | | | (254,989,902 | ) |
| | | | (884,170 | ) | | | (21,902,605 | ) |
| Administration Shares | | | | | | | | |
Shares sold | | | 9,289,576 | | | | 532,705,799 | |
Reinvestment of distributions | | | 1,608 | | | | 4,725 | |
Shares redeemed | | | (17,447,384 | ) | | | (627,348,583 | ) |
| | | | (8,156,200 | ) | | | (94,638,059 | ) |
| Premier Shares | | | | | | | | |
Shares sold | | | — | | | | 1 | |
Reinvestment of distributions | | | 1 | | | | — | |
Shares redeemed | | | — | | | | (1 | ) |
| | | | 1 | | | | — | |
| Service Shares | | | | | | | | |
Shares sold | | | 4,355,835 | | | | 161,062,699 | |
Reinvestment of distributions | | | 459 | | | | 508 | |
Shares redeemed | | | (61,597,819 | ) | | | (174,915,864 | ) |
| | | | (57,241,525 | ) | | | (13,852,657 | ) |
| Resource Shares | | | | | | | | |
Shares sold | | | 6,366,498 | | | | 17,005,387 | |
Reinvestment of distributions | | | 3,604 | | | | 718 | |
Shares redeemed | | | (8,253,579 | ) | | | (18,807,597 | ) |
| | | | (1,883,477 | ) | | | (1,801,492 | ) |
| Cash Management Shares | | | | | | | | |
Shares sold | | | 96,594 | | | | 1 | |
Reinvestment of distributions | | | 10 | | | | — | |
Shares redeemed | | | (57,305 | ) | | | (1 | ) |
| | | | 39,299 | | | | — | |
| Class A Shares(a) | | | | | | | | |
Shares sold | | | 648,645 | | | | 10,000 | |
Reinvestment of distributions | | | 767 | | | | 1 | |
Shares redeemed | | | (17,652 | ) | | | — | |
| | | | 631,760 | | | | 10,001 | |
| Class C Shares(a) | | | | | | | | |
Shares sold | | | — | | | | 10,000 | |
Reinvestment of distributions | | | 6 | | | | 1 | |
Shares redeemed | | | (1,010 | ) | | | — | |
| | | | (1,004 | ) | | | 10,001 | |
NET DECREASE IN SHARES | | | (532,966,135 | ) | | | (3,901,280,326 | ) |
| (a) | | Commenced operations on March 31, 2016. |
38
GOLDMAN SACHS FUNDS — INVESTOR FUNDS
| | |
| Fund Expenses — Six Month Period Ended February 28, 2017 (Unaudited) | | |
As a shareholder of Class I Shares, Select Shares, Preferred Shares, Capital Shares, Administration Shares, Premier Shares, Service Shares, Resource Shares, Cash Management Shares, Class A Shares, or Class C Shares of a Fund you incur two types of costs: (1) transaction costs, including contingent deferred sales charges (with respect to Class C Shares); and (2) ongoing costs, including management fees and distribution, service and/or administration fees (with respect to all share classes except Class I Shares) and other Fund expenses. This Example is intended to help you understand your ongoing costs (in dollars) of investing in Class I Shares, Select Shares, Preferred Shares, Capital Shares, Administration Shares, Premier Shares, Service Shares, Resource Shares, Cash Management Shares, Class A Shares, or Class C Shares of the Funds and to compare these costs with the ongoing costs of investing in other mutual funds.
The Example is based on an investment of $1,000 invested at the beginning of the period and held for the entire period from September 1, 2016 through February 28, 2017, which represents a period of 181 days in a 365-day year.
Actual Expenses — The first line under each Share class in the table below provides information about actual account values and actual expenses. You may use the information in this line, together with the amount you invested, to estimate the expenses that you paid over the period. Simply divide your account value by $1,000 (for example, an $8,600 account value divided by $1,000=8.6), then multiply the result by the number in the first line under the heading entitled “Expenses Paid” to estimate the expenses you paid on your account during this period.
Hypothetical Example for Comparison Purposes — The second line under each Share class in the table below provides information about hypothetical account values and hypothetical expenses based on the Funds’ actual net expense ratios and an assumed rate of return of 5% per year before expenses, which is not the Funds’ actual return. The hypothetical account values and expenses may not be used to estimate the actual ending account balance or expenses you paid for the period. You may use this information to compare the ongoing costs of investing in the Funds and other funds. To do so, compare this 5% hypothetical example with the 5% hypothetical examples that appear in the shareholder reports of the other funds.
Please note that the expenses shown in the table are meant to highlight your ongoing costs only and do not reflect any transactional costs, such as sales charges, redemption fees, or exchange fees. Therefore, the second line of the table is useful in comparing ongoing costs only, and will not help you determine the relative total costs of owning different funds. In addition, if these transactional costs were included, your costs would have been higher.
| | | | | | | | | | | | |
| | | Investor Money Market Fund | |
| Share Class | | Beginning Account Value 9/1/16 | | | Ending Account Value 2/28/17 | | | Expenses Paid for the 6 months ended 2/28/17* | |
| Class I Shares | | | | | | | | | | | | |
Actual | | $ | 1,000.00 | | | $ | 1,003.60 | | | $ | 0.89 | |
Hypothetical (5% return before expenses) | | | 1,000.00 | | | | 1,023.90 | + | | | 0.90 | |
| Administration Shares | | | | | | | | | | | | |
Actual | | | 1,000.00 | | | | 1,002.30 | | | | 2.13 | |
Hypothetical (5% return before expenses) | | | 1,000.00 | | | | 1,022.66 | + | | | 2.16 | |
| Service Shares | | | | | | | | | | | | |
Actual | | | 1,000.00 | | | | 1,001.30 | | | | 3.32 | |
Hypothetical (5% return before expenses) | | | 1,000.00 | | | | 1,021.47 | + | | | 3.36 | |
| Resource Shares | | | | | | | | | | | | |
Actual | | | 1,000.00 | | | | 1,000.70 | | | | 3.97 | |
Hypothetical (5% return before expenses) | | | 1,000.00 | | | | 1,020.83 | + | | | 4.01 | |
| Cash Management Shares | | | | | | | | | | | | |
Actual | | | 1,000.00 | | | | 1,000.30 | | | | 4.36 | |
Hypothetical (5% return before expenses) | | | 1,000.00 | | | | 1,020.43 | + | | | 4.41 | |
| Class A Shares | | | | | | | | | | | | |
Actual | | | 1,000.00 | | | | 1,002.30 | | | | 2.13 | |
Hypothetical (5% return before expenses) | | | 1,000.00 | | | | 1,022.66 | + | | | 2.16 | |
| Class C Shares | | | | | | | | | | | | |
Actual | | | 1,000.00 | | | | 1,000.30 | | | | 4.41 | |
Hypothetical (5% return before expenses) | | | 1,000.00 | | | | 1,020.38 | + | | | 4.46 | |
39
GOLDMAN SACHS FUNDS — INVESTOR FUNDS
| | |
| Fund Expenses — Six Month Period Ended February 28, 2017 (Unaudited) (continued) | | |
| | | | | | | | | | | | |
| | | Investor Tax-Exempt Money Market Fund | |
| Share Class | | Beginning Account Value 9/1/16 | | | Ending Account Value 2/28/17 | | | Expenses Paid for the 6 months ended 2/28/17* | |
| Class I Shares | | | | | | | | | | | | |
Actual | | $ | 1,000.00 | | | $ | 1,003.00 | | | $ | 0.89 | |
Hypothetical (5% return before expenses) | | | 1,000.00 | | | | 1,023.90 | + | | | 0.90 | |
| Select Shares | | | | | | | | | | | | |
Actual | | | 1,000.00 | | | | 1,002.90 | | | | 0.89 | |
Hypothetical (5% return before expenses) | | | 1,000.00 | | | | 1,023.90 | + | | | 0.90 | |
| Preferred Shares | | | | | | | | | | | | |
Actual | | | 1,000.00 | | | | 1,002.50 | | | | 1.39 | |
Hypothetical (5% return before expenses) | | | 1,000.00 | | | | 1,023.41 | + | | | 1.40 | |
| Capital Shares | | | | | | | | | | | | |
Actual | | | 1,000.00 | | | | 1,002.30 | | | | 1.64 | |
Hypothetical (5% return before expenses) | | | 1,000.00 | | | | 1,023.16 | + | | | 1.66 | |
| Administration Shares | | | | | | | | | | | | |
Actual | | | 1,000.00 | | | | 1,001.80 | | | | 2.13 | |
Hypothetical (5% return before expenses) | | | 1,000.00 | | | | 1,022.66 | + | | | 2.16 | |
| Premier Shares | | | | | | | | | | | | |
Actual | | | 1,000.00 | | | | 1,001.40 | | | | 1.98 | |
Hypothetical (5% return before expenses) | | | 1,000.00 | | | | 1,022.81 | + | | | 2.01 | |
| Service Shares | | | | | | | | | | | | |
Actual | | | 1,000.00 | | | | 1,000.70 | | | | 3.13 | |
Hypothetical (5% return before expenses) | | | 1,000.00 | | | | 1,021.67 | + | | | 3.16 | |
| Resource Shares | | | | | | | | | | | | |
Actual | | | 1,000.00 | | | | 1,000.60 | | | | 3.27 | |
Hypothetical (5% return before expenses) | | | 1,000.00 | | | | 1,021.52 | + | | | 3.31 | |
| Cash Management Shares | | | | | | | | | | | | |
Actual | | | 1,000.00 | | | | 1,000.80 | | | | 3.13 | |
Hypothetical (5% return before expenses) | | | 1,000.00 | | | | 1,021.67 | + | | | 3.16 | |
| Class A Shares | | | | | | | | | | | | |
Actual | | | 1,000.00 | | | | 1,001.80 | | | | 2.13 | |
Hypothetical (5% return before expenses) | | | 1,000.00 | | | | 1,022.66 | + | | | 2.16 | |
| Class C Shares | | | | | | | | | | | | |
Actual | | | 1,000.00 | | | | 1,000.70 | | | | 3.17 | |
Hypothetical (5% return before expenses) | | | 1,000.00 | | | | 1,021.62 | + | | | 3.21 | |
| | * | | Expenses for each share class are calculated using each Fund’s annualized net expense ratio for each class, which represents the ongoing expenses as a percentage of net assets for the six months ended February 28, 2017. Expenses are calculated by multiplying the annualized net expense ratio by the average account value for the period; then multiplying the result by the number of days in the most recent fiscal half year; and then dividing that result by the number of days in the fiscal year. The annualized net expense ratios for the period were as follows: | |
| | | | | | | | | | | | | | | | | | | | | | | | | | | | | | | | | | | | | | | | | | | | |
| Fund | | Class I
Shares | | | Select
Shares | | | Preferred
Shares | | | Capital
Shares | | | Administration
Shares | | | Premier
Shares | | | Service
Shares | | | Resource
Shares | | | Cash
Management
Shares | | | Class A
Shares | | | Class C
Shares | |
Investor Money Market | | | 0.18 | % | | | N/A | | | | N/A | | | | N/A | | | | 0.43 | % | | | N/A | | | | 0.67 | % | | | 0.80 | % | | | 0.88 | % | | | 0.43 | % | | | 0.89 | % |
Investor Tax-Exempt Money Market | | | 0.18 | | | | 0.18 | % | | | 0.28 | % | | | 0.33 | % | | | 0.43 | | | | 0.40 | % | | | 0.63 | | | | 0.66 | | | | 0.63 | | | | 0.43 | | | | 0.64 | |
| | + | | Hypothetical expenses are based on each Fund’s actual annualized net expense ratios and an assumed rate of return of 5% per year before expenses. | |
40
FUNDS PROFILE
Goldman Sachs Funds
Goldman Sachs is a premier financial services firm, known since 1869 for creating thoughtful and customized investment solutions in complex global markets.
Today, the Investment Management Division of Goldman Sachs serves a diverse set of clients worldwide, including private institutions, public entities and individuals. With approximately $1.17 trillion in assets under supervision as of December 31, 2016, Goldman Sachs Asset Management (“GSAM”) has portfolio management teams located around the world and our investment professionals bring firsthand knowledge of local markets to every investment decision. Assets under supervision includes assets under management and other client assets for which Goldman Sachs does not have full discretion. GSAM leverages the resources of Goldman, Sachs & Co. subject to legal, internal and regulatory restrictions.
Money Market
Financial Square FundsSM
| ∎ | | Financial Square Treasury Solutions Fund1 |
| ∎ | | Financial Square Government Fund1 |
| ∎ | | Financial Square Money Market Fund2 |
| ∎ | | Financial Square Prime Obligations Fund2 |
| ∎ | | Financial Square Treasury Instruments Fund1 |
| ∎ | | Financial Square Treasury Obligations Fund1 |
| ∎ | | Financial Square Federal Instruments Fund1 |
| ∎ | | Financial Square Tax-Exempt Money Market Fund2 |
Investor FundsSM
| ∎ | | Investor Money Market Fund3 |
| ∎ | | Investor Tax-Exempt Money Market Fund3 |
Fixed Income
Short Duration and Government
| ∎ | | High Quality Floating Rate Fund |
| ∎ | | Short-Term Conservative Income Fund4 |
| ∎ | | Short Duration Government Fund |
| ∎ | | Short Duration Income Fund |
| ∎ | | Inflation Protected Securities Fund |
Multi-Sector
Municipal and Tax-Free
| ∎ | | High Yield Municipal Fund |
| ∎ | | Dynamic Municipal Income Fund |
| ∎ | | Short Duration Tax-Free Fund |
Single Sector
| ∎ | | Investment Grade Credit Fund |
| ∎ | | High Yield Floating Rate Fund |
| ∎ | | Emerging Markets Debt Fund |
| ∎ | | Local Emerging Markets Debt Fund |
| ∎ | | Dynamic Emerging Markets Debt Fund |
Fixed Income Alternatives
| ∎ | | Long Short Credit Strategies Fund |
| ∎ | | Fixed Income Macro Strategies Fund |
Fundamental Equity
| ∎ | | Small/Mid Cap Value Fund |
| ∎ | | Small/Mid Cap Growth Fund |
| ∎ | | Flexible Cap Growth Fund |
| ∎ | | Concentrated Growth Fund |
| ∎ | | Technology Opportunities Fund |
| ∎ | | Growth Opportunities Fund |
| ∎ | | Rising Dividend Growth Fund |
| ∎ | | Dynamic U.S. Equity Fund |
Tax-Advantaged Equity
| ∎ | | U.S. Tax-Managed Equity Fund |
| ∎ | | International Tax-Managed Equity Fund |
| ∎ | | U.S. Equity Dividend and Premium Fund |
| ∎ | | International Equity Dividend and Premium Fund |
Equity Insights
| ∎ | | Small Cap Equity Insights Fund |
| ∎ | | U.S. Equity Insights Fund |
| ∎ | | Small Cap Growth Insights Fund |
| ∎ | | Large Cap Growth Insights Fund |
| ∎ | | Large Cap Value Insights Fund |
| ∎ | | Small Cap Value Insights Fund |
| ∎ | | International Small Cap Insights Fund |
| ∎ | | International Equity Insights Fund |
| ∎ | | Emerging Markets Equity Insights Fund |
Fundamental Equity International
| ∎ | | Strategic International Equity Fund |
| ∎ | | Focused International Equity Fund |
| ∎ | | Emerging Markets Equity Fund |
Select Satellite
| ∎ | | Real Estate Securities Fund |
| ∎ | | International Real Estate Securities Fund |
| ∎ | | Commodity Strategy Fund |
| ∎ | | Global Real Estate Securities Fund |
| ∎ | | Dynamic Allocation Fund |
| ∎ | | Absolute Return Tracker Fund |
| ∎ | | Managed Futures Strategy Fund |
| ∎ | | MLP Energy Infrastructure Fund |
| ∎ | | Multi-Manager Alternatives Fund |
| ∎ | | Absolute Return Multi-Asset Fund |
| ∎ | | Global Infrastructure Fund |
Total Portfolio Solutions
| ∎ | | Global Managed Beta Fund |
| ∎ | | Multi-Manager Non-Core Fixed Income Fund |
| ∎ | | Multi-Manager U.S. Dynamic Equity Fund |
| ∎ | | Multi-Manager Global Equity Fund |
| ∎ | | Multi-Manager International Equity Fund |
| ∎ | | Tactical Tilt Overlay Fund5 |
| ∎ | | Balanced Strategy Portfolio |
| ∎ | | Multi-Manager U.S. Small Cap Equity Fund |
| ∎ | | Multi-Manager Real Assets Strategy Fund |
| ∎ | | Growth and Income Strategy Portfolio |
| ∎ | | Growth Strategy Portfolio |
| ∎ | | Equity Growth Strategy Portfolio |
| ∎ | | Satellite Strategies Portfolio |
| ∎ | | Enhanced Dividend Global Equity Portfolio |
| ∎ | | Tax-Advantaged Global Equity Portfolio |
| ∎ | | Strategic Factor Allocation Fund |
| ∎ | | Target Date 2020 Portfolio |
| ∎ | | Target Date 2025 Portfolio |
| ∎ | | Target Date 2030 Portfolio |
| ∎ | | Target Date 2035 Portfolio |
| ∎ | | Target Date 2040 Portfolio |
| ∎ | | Target Date 2045 Portfolio |
| ∎ | | Target Date 2050 Portfolio |
| ∎ | | Target Date 2055 Portfolio |
| ∎ | | GQG Partners International Opportunities Fund |
| 1 | | You could lose money by investing in the Fund. Although the Fund seeks to preserve the value of your investment at $1.00 per share, it cannot guarantee it will do so. An investment in the Fund is not a deposit of a bank and is not insured or guaranteed by the Federal Deposit Insurance Corporation or any other government agency. The Fund’s sponsor has no legal obligation to provide financial support to the Fund, and you should not expect that the sponsor will provide financial support to the Fund at any time. |
| 2 | | You could lose money by investing in the Fund. Because the share price of the Fund will fluctuate, when you sell your shares they may be worth more or less than what you originally paid for them. The Fund may impose a fee upon sale of your shares or may temporarily suspend your ability to sell shares if the Fund’s liquidity falls below required minimums because of market conditions or other factors. An investment in the Fund is not a deposit of a bank and is not insured or guaranteed by the Federal Deposit Insurance Corporation or any other government agency. The Fund’s sponsor has no legal obligation to provide financial support to the Fund, and you should not expect that the sponsor will provide financial support to the Fund at any time. |
| 3 | | You could lose money by investing in the Fund. Although the Fund seeks to preserve the value of your investment at $1.00 per share, it cannot guarantee it will do so. The Fund may impose a fee upon sale of your shares or may temporarily suspend your ability to sell shares if the Fund’s liquidity falls below required minimums because of market conditions or other factors. An investment in the Fund is not a deposit of a bank and is not insured or guaranteed by the Federal Deposit Insurance Corporation or any other government agency. The Fund’s sponsor has no legal obligation to provide financial support to the Fund, and you should not expect that the sponsor will provide financial support to the Fund at any time. |
| 4 | | Effective on July 29, 2016, the Goldman Sachs Limited Maturity Obligations Fund was renamed the Goldman Sachs Short-Term Conservative Income Fund. |
| 5 | | Effective on June 1, 2016, the Goldman Sachs Tactical Tilt Implementation Fund was renamed the Goldman Sachs Tactical Tilt Overlay Fund. |
Financial Square FundsSM and Investor FundsSM are registered service marks of Goldman, Sachs & Co.
| * | | This list covers open-end funds only. Please visit our website at www.GSAMFUNDS.com to learn about our closed-end funds and exchange-traded funds. |
| | |
TRUSTEES Ashok N. Bakhru, Chairman Kathryn A. Cassidy Diana M. Daniels Herbert J. Markley James A. McNamara Jessica Palmer Roy W. Templin Gregory G. Weaver | | OFFICERS James A. McNamara, President Scott M. McHugh, Treasurer, Senior Vice President and Principal Financial Officer Caroline L. Kraus, Secretary |
| |
GOLDMAN, SACHS & CO. Distributor and Transfer Agent | | GOLDMAN SACHS ASSET MANAGEMENT, L.P. Investment Adviser |
Visit our web site at www.GSAMFUNDS.com to obtain the most recent month-end returns.
Goldman Sachs Asset Management, L.P., 200 West Street, New York, New York 10282
Economic and market forecasts presented herein reflect our judgment as of the date of this presentation and are subject to change without notice. These forecasts do not take into account the specific investment objectives, restrictions, tax and financial situation or other needs of any specific client. Actual data will vary and may not be reflected here. These forecasts are subject to high levels of uncertainty that may affect actual performance. Accordingly, these forecasts should be viewed as merely representative of a broad range of possible outcomes. These forecasts are estimated, based on assumptions, and are subject to significant revision and may change materially as economic and market conditions change. Goldman Sachs has no obligation to provide updates or changes to these forecasts. Case studies and examples are for illustrative purposes only.
The portfolio risk management process includes an effort to monitor and manage risk, but does not imply low risk The reports concerning the Funds included in this shareholder report may contain certain forward-looking statements about the factors that may affect the performance of the Funds in the future. These statements are based on Fund management’s predictions and expectations concerning certain future events and their expected impact on the Funds, such as performance of the economy as a whole and of specific industry sectors, changes in the levels of interest rates, the impact of developing world events, and other factors that may influence the future performance of the Funds. Management believes these forward-looking statements to be reasonable, although they are inherently uncertain and difficult to predict. Actual events may cause adjustments in portfolio management strategies from those currently expected to be employed.
A description of the policies and procedures that the Funds use to determine how to vote proxies relating to portfolio securities and information regarding how a Fund voted proxies relating to portfolio securities during the most recent 12-month period ended June 30 is available (i) without charge, upon request by calling 1-800-526-7384 (for shareholders of Class A Shares or Class C Shares of a Fund) or 1-800-621-2550 (for shareholders of all other share classes of a Fund); and (ii) on the Securities and Exchange Commission (“SEC”) web site at http://www.sec.gov.
Each Fund files its complete schedule of portfolio holdings with the SEC for the first and third quarters of each fiscal year on Form N-Qs. The Funds’ Form N-Qs are available on the SEC’s web site at http://www.sec.gov within 60 days after the Fund’s first and third fiscal quarters. The Funds’ Form N-Qs may be reviewed and copied at the SEC’s Public Reference Room in Washington, D.C. and information on the operation of the Public Reference Room may also be obtained by calling 1-800-SEC-0330. Form N-Qs may be obtained upon request and without charge by calling 1-800-526-7384 (for shareholders of Class A Shares or Class C Shares) or 1-800-621-2550 (for shareholders of all other share classes of a Fund).
Goldman, Sachs & Co. (‘‘Goldman Sachs’’) does not provide legal, tax or accounting advice. Any statement contained in this communication (including any attachments) concerning U.S. tax matters was not intended or written to be used, and cannot be used, for the purpose of avoiding penalties under the Internal Revenue Code, and was written to support the promotion or marketing of the transaction(s) or matter(s) addressed. Clients of Goldman Sachs should obtain their own independent tax advice based on their particular circumstances.
Fund holdings and allocations shown are as of February 28, 2017 and may not be representative of future investments. Fund holdings should not be relied on in making investment decisions and should not be construed as research or investment advice regarding particular securities. Current and future holdings are subject to risk.
Goldman Sachs Investor FundsSM is a service mark of Goldman, Sachs & Co.
The portfolio risk management process includes an effort to monitor and manage risk, but does not imply low risk.
This material is not authorized for distribution to prospective investors unless preceded or accompanied by a current Prospectus or summary prospectus, if applicable. Investors should consider a Fund’s objective, risks, and charges and expenses, and read the summary prospectus, if available, and/or the Prospectus carefully before investing or sending money. The summary prospectus, if available, and the Prospectus contain this and other information about a Fund and may be obtained from your Intermediary or from Goldman, Sachs & Co. by calling (Class A Shares and Class C Shares – 1-800-526-7384) (all other share classes – 1-800-621-2550).
© 2017 Goldman Sachs. All rights reserved. 88332-TMPL-04/2017-517756 IMMITEMMSAR-17 / 2.3k
Goldman Sachs Funds

| | | | |
| | |
| Semi-Annual Report | | | | February 28, 2017 |
| | |
| | | | Fundamental Equity Growth Funds |
| | | | Capital Growth |
| | | | Concentrated Growth |
| | | | Dynamic U.S. Equity |
| | | | Flexible Cap Growth |
| | | | Focused Growth |
| | | | Growth Opportunities |
| | | | Small/Mid Cap Growth |
| | | | Strategic Growth |
| | | | Technology Opportunities |

Goldman Sachs Fundamental Equity Growth Funds
| ∎ | | TECHNOLOGY OPPORTUNITIES |
| | | | |
TABLE OF CONTENTS | |
| |
Investment Process | | | 1 | |
| |
Market Review | | | 2 | |
| |
Portfolio Management Discussions and Performance Summaries | | | 4 | |
| |
Schedules of Investments | | | 58 | |
| |
Financial Statements | | | 74 | |
| |
Financial Highlights | | | 84 | |
| |
Notes to Financial Statements | | | 102 | |
| |
Other Information | | | 122 | |
| | | | |
| | | |
| NOT FDIC-INSURED | | May Lose Value | | No Bank Guarantee |
GOLDMAN SACHS FUNDAMENTAL EQUITY GROWTH FUNDS
What Differentiates the Goldman Sachs Growth Team’s Investment Process?
For over 30 years, the Goldman Sachs Growth Team has consistently applied a three-step investment process based on our belief that wealth is created through the long-term ownership of growing businesses.


| ∎ | | Make decisions as long-term business owners rather than as stock traders |
| ∎ | | Perform in-depth, fundamental research |
| ∎ | | Focus on long-term structural and competitive advantages |
Result
Performance driven by the compounding growth of businesses over time — not short-term market movements
Long-term participation in growing businesses — less reliance on macroeconomic predictions, market timing, sector rotation or momentum

Identify high quality growth businesses. Some required investment criteria include:
| ∎ | | Established brand names |
| ∎ | | Recurring revenue streams |
| ∎ | | Long product life cycles |
| ∎ | | Favorable long-term growth prospects |
Result
Investments in businesses that we believe are strategically positioned for consistent, sustainable long-term growth

| ∎ | | Perform rigorous valuation analysis of every potential investment |
| ∎ | | Use valuation tools and analytics to ensure that the high-quality business franchises we have identified also represent sound investments |
Result
Good investment decisions based on solid understanding of what each business is worth
Attractive buying opportunities as the stock prices of quality growth businesses fluctuate over time
1
MARKET REVIEW
Goldman Sachs Fundamental Equity Growth Funds
Market Review
Overall, U.S. equities rallied during the six months ended February 28, 2017 (the “Reporting Period”), despite unexpected political events both domestically and abroad and a Federal Reserve (“Fed”) interest rate hike. The Standard & Poor’s 500® Index (the “S&P 500 Index”) ended the Reporting Period with a gain of 10.01%. The Russell 3000® Index generated a return of 10.29%.
As the Reporting Period began in early September 2016, U.S. and international equities alike fell as the European Central Bank disappointed markets with its lack of commitment to extend quantitative easing. However, there was a subsequent rebound following the Fed’s decision in September 2016 to leave interest rates unchanged. In October 2016, a combination of hawkish Fed commentary and mounting strong U.S. economic data led to increased market pricing for a December 2016 interest rate hike (Hawkish language or action tends to suggest higher interest rates (opposite of dovish)). U.S. GDP increased by 3.5% on an annualized basis for the third quarter of 2016, above consensus expectations and the strongest growth rate in two years. Following the unexpected victory of Donald Trump in the November 2016 U.S. elections, U.S. equities quickly reversed a short-lived sell-off and surged on anticipation of a pro-growth effect of Mr. Trump’s fiscal stimulus plan. The Fed raised rates 0.25% in December 2016, for the first time in a year but as had largely been anticipated, and set a more hawkish hike path for 2017, causing equities to decline, albeit modestly, following the announcement.
U.S. equities rallied significantly in the first two months of 2017. In January 2017, markets searched for details on timing and scope behind President Trump’s campaign proclamations but rallied to new highs on the prospect of deregulation following executive orders on oil pipelines and on optimism around infrastructure spending after a $1 trillion proposal from Senate Democrats made headlines. However, U.S. equities subsequently retreated on political uncertainty and protectionism concerns following executive orders on immigration, a border wall and U.S. withdrawal from the Trans-Pacific Partnership, popularly known as TPP. Amid a busy political agenda, U.S. economic data released in January 2017 remained encouraging. Consumer sentiment set a 13-year high in the month, and non-manufacturing data remained consistent with growth in service-providing industries. Industrial production in December 2016 had recorded its biggest increase in two years, and the Philadelphia Fed’s manufacturing index also unexpectedly rose to a two-year high. Consumer prices rose in December 2016, making a fifth straight monthly gain and signaling to many modest inflationary pressures.
In February 2017, investors continued to assess the outlook for potential tax reform, deregulation and other economic policies out of the new administration, while also heeding the tone of Fed officials. The U.S. dollar strengthened on the month, as the market-implied probability of a March 2017 interest rate hike increased with Fed Chair Yellen’s testimony before Congress and hawkish comments from other Fed officials. Economic data released during the month remained robust. U.S. non-farm payrolls for January 2017 were well above market expectations at 227,000, with particular strength in the construction industry. The Institute of Supply Management’s manufacturing and non-manufacturing indices rose to a two-year and six-year high in February 2017, respectively; U.S. consumer confidence reached a 15-year high in February 2017; and the core personal consumption expenditure index increased 1.7% year over year in January 2017, while personal spending increased a modest 0.2% month over month.
For the Reporting Period overall, financials, information technology and industrials were the best performing sectors in the S&P 500 Index by a wide margin. The weakest performing sector in the S&P 500 Index was real estate, the only one to post a negative absolute return,
2
MARKET REVIEW
followed by consumer staples, health care and energy, which were comparatively weak but generated positive returns during the Reporting Period.
Within the U.S. equity market, all capitalization segments posted positive returns, but small-cap stocks, as measured by the Russell 2000® Index, performed best, followed by large-cap stocks, as measured by the Russell 1000® Index, and then mid-cap stocks, as measured by the Russell Midcap® Index. From a style perspective, value-oriented stocks significantly outpaced growth-oriented stocks across the capitalization spectrum. (All as measured by the Russell Investments indices.)
Looking Ahead
At the end of the Reporting Period, we believed the macroeconomic environment was shifting from low growth to pro-growth. Following Donald Trump’s victory in the U.S. presidential election, we expect to see more aggressive fiscal and pro-business policies leading to strong U.S. and global economic growth. Chief Executive Officer confidence was already increasing toward the end of the Reporting Period and, in our view, could reignite what are known as corporate “animal spirits,” economist John Maynard Keynes’ term for the confidence and willingness to invest that are essential for economic growth. We believe the U.S. equity bull market could extend through 2017. Strong economic growth and revenue-driven earnings growth in the U.S. is a positive backdrop for equities, in our view. Moreover, equities can potentially do well in an environment of modestly rising interest rates and inflation, provided the underlying reason is healthy economic growth.
Given this view, we were increasingly positive on the outlook for U.S. economic and revenue-driven earnings growth at the end of the Reporting Period, although the U.S. equity market, we believe, remains expensive, both compared to its own history and to that of other regional equity markets. That said, we believe the U.S. equity market still offers significant opportunities at the stock level once more policy details become available and investors begin to focus on company-specific impacts. Policy changes from a populist, protectionist and unconventional U.S. president may well increase volatility and the dispersion of returns, as investors consider the effects of such policy changes on individual stocks, creating what we anticipate may be a good environment for active investment management.
Regardless of market direction, our fundamental, bottom-up stock selection continues to drive our process, rather than headlines or sentiment. We maintain high conviction in the companies the Funds own and believe they have the potential to outperform relative to the broader market regardless of economic growth conditions. As always, we maintain our focus on seeking companies that we believe will generate long-term growth in today’s ever-changing market conditions.
3
PORTFOLIO RESULTS
Goldman Sachs Capital Growth Fund
Portfolio Composition
The Fund invests primarily in U.S. equity investments. Since the Fund’s inception, the Goldman Sachs Growth Equity Investment Team has focused on several key investment criteria that it believes can drive a company’s growth over the long term. These characteristics are: dominant market share, established brand name, pricing power, recurring revenue stream, free cash flow, high returns on invested capital, predictable growth, sustainable growth, long product life cycle, enduring competitive advantage, favorable demographic trends and excellent management. The Team strives to purchase these companies at reasonable valuations in order to capture the full benefits of their growth.
Portfolio Management Discussion and Analysis
Below, the Goldman Sachs Growth Equity Investment Team discusses the Goldman Sachs Capital Growth Fund’s (the “Fund”) performance and positioning for the six-month period ended February 28, 2017 (the “Reporting Period”).
| Q | | How did the Fund perform during the Reporting Period? |
| A | | During the Reporting Period, the Fund’s Class A, C, Institutional, Service, IR, R and R6 Shares generated cumulative total returns, without sales charges, of 8.83%, 8.44%, 9.03%, 8.75%, 8.93%, 8.69% and 9.05%, respectively. These returns compare to the 9.15% cumulative total return of the Fund’s benchmark, the Russell 1000® Growth Index (with dividends reinvested) (the “Russell Index”), during the same period. |
| Q | | What key factors were responsible for the Fund’s performance during the Reporting Period? |
| A | | The Fund posted solid absolute gains, but stock selection overall detracted modestly from the Fund’s performance relative to the Russell Index during the Reporting Period. Sector allocation as a whole contributed positively. |
| Q | | Which equity market sectors most significantly affected Fund performance? |
| A | | Detracting from the Fund’s relative results most was weak stock selection in the health care, information technology and financials sectors. The sectors that contributed most positively to the Fund’s relative performance during the Reporting Period were consumer staples, real estate and consumer discretionary, wherein effective stock selection drove results. Having an underweighted allocation to real estate, which lagged the Russell Index during the Reporting Period, also helped. |
| Q | | Which stocks detracted significantly from the Fund’s performance during the Reporting Period? |
| A | | Among those stocks detracting most from the Fund’s results relative to the Russell Index were positions in medical device company Edwards Lifesciences, consumer products retailer Newell Brands and pharmaceutical distribution services and medical supplies provider McKesson. |
| | | Edwards Lifesciences, a new purchase for the Fund during the Reporting Period, was the top detractor from the Fund’s results during the Reporting Period, driven by earnings results that were well below market expectations. Despite the weakness, we remained positive on the company at the end of the Reporting Period. Edwards Lifesciences is a leading innovator in technologies that treat structural heart diseases, an area of largely unmet need. One of the company’s key innovations is transcatheter aortic valve replacement (“TAVR”), which is a minimally invasive procedure to replace heart valves. We believe the TAVR market opportunity remained compelling to the company’s valuation at the end of the Reporting Period. We also believe TAVR is in the early phases in terms of penetration and adoption. In our view, the company has substantial upside potential should it continue to take share away from open heart surgery and expand the market over the coming years. |
| | | Newell Brands reported earnings that were below market expectations, causing its shares to decline. There was short-term investor concern that sales momentum may slow in the coming quarters due to ongoing integration work. Despite its underperformance, we continued to like the business and believed, at the end of the Reporting Period, that Newell Brands potentially represents a multi-year, double-digit earnings growth story. In our view, the company’s acquisition of Jarden, a similar holding company of consumer durable goods, could also yield meaningful synergies and earnings flexibility. Overall, we believed at the |
4
PORTFOLIO RESULTS
| | end of the Reporting Period that Newell Brands has a strong management team with a demonstrated track record of delivering shareholder value through both organic growth and acquisitions. |
| | Shares of McKesson declined after it reported fiscal second quarter 2017 results with earnings per share well below consensus estimates and its management reduced its 2017 earnings per share guidance. The health care sector in general has seen increased scrutiny over drug pricing procedures, creating a difficult environment to create value. While we continue to like the company, greater uncertainty in the near term led us to exit the position and allocate the capital to positions that have a more compelling risk/reward outlook, in our view. |
| Q | | What were some of the Fund’s best-performing individual stocks? |
| A | | Among those stocks the Fund benefited most from relative to the Russell Index were positions in information technology giant Apple, transportation provider CSX and digital media streaming company Netflix. |
| | | Apple’s quarterly earnings during the Reporting Period were generally in line with market expectations on revenues and earnings per share, and its management remained constructive about guidance. During the Reporting Period, Apple launched the iPhone 7 as well as other products such as the new Apple watch and wireless earbuds. At the end of the Reporting Period, we continued to see a number of strong growth catalysts for Apple, including solid iPhone 7 and iPhone 7 Plus demand as well as ongoing product innovation and development. In our view, the company continues to deliver strong services growth, which we believe is important, as this decreases transactional volatility tied to product cycles. At the end of the Reporting Period, we remained optimistic on Apple’s significant installed base, experienced management, established brand name and continued innovation. |
| | | CSX, a new position for the Fund during the Reporting Period, provides rail, intermodal, domestic container shipping and contract logistics services around the world. Since being added to the Fund’s portfolio during the fourth quarter of 2016, the company saw its stock price spike in January 2017, as Canadian Pacific Chief Executive Officer, Hunter Harrison, resigned and was reportedly seeking a senior management position at CSX. The market viewed the potential move positively given Harrison’s strong reputation. The company also reported results that beat market expectations on revenues but slightly missed on earnings. In our view, CSX’s focus on margin expansion initiatives could be supportive of growth alongside a free cash flow inflection following investments in locomotives. We believe CSX is well positioned to benefit from a possible inflationary environment given its cyclical business model and also from potential tax reforms given its currently high tax rate. Overall, at the end of the Reporting Period, we were optimistic about CSX’s growth prospects, operation improvement potential and strong free cash flow generation. |
| | During the Reporting Period, shares of Netflix gained sharply following exceptionally strong third and fourth quarter 2016 results with revenues and earnings that were well ahead of market expectations. Importantly, subscriber growth across both domestic and international markets was strong. At the end of the Reporting Period, we remained positive on Netflix as the market leader within the digital media streaming industry, offering a convenient way to consume content without the burden of ownership. We further believed the company was well positioned to capture subscriber growth globally. |
| Q | | How did the Fund use derivatives and similar instruments during the Reporting Period? |
| A | | During the Reporting Period, we did not use derivatives as part of an active management strategy. |
| Q | | Did the Fund make any significant purchases or sales during the Reporting Period? |
| A | | In addition to the purchase of Edwards Lifesciences, already mentioned, we initiated a Fund position in Northern Trust, an international financial services firm. Northern Trust is a company we had previously owned in our portfolios for its high quality fundamentals, including a solid balance sheet and cash position. We believe Northern Trust is well positioned to benefit from interest rate hikes and significant organic growth opportunities within the custody and fund administration business. We are additionally positive on the company’s wealth management segment given its mix of both active and passive strategies. The company’s management has stated it expects to reinvest its earnings into the business while targeting a meaningful return on equity, which could benefit shareholders. Northern Trust also has a high payout ratio and is well capitalized, in our view. Finally, we believe Northern Trust may further benefit from potentially lower corporate tax rates. With what we consider to be an experienced management and a high quality franchise, we are optimistic on Northern Trust’s growth prospects. |
5
PORTFOLIO RESULTS
| | Conversely, in addition to those sales mentioned earlier, we exited the Fund’s position in tobacco company Reynolds American during the Reporting Period. The company saw its stock price spike in October 2016 as news broke that British American Tobacco, which already owned 42% of Reynolds American, made a proposal to acquire the remaining 58% of the company at a premium. Following this development, we felt the risk/reward was less compelling and decided to sell the position. |
| | We eliminated the Fund’s position in McCormick & Company, a manufacturer of spices, seasoning mixes and condiments. Its stock had been a strong performer for the Fund in the first half of 2016. However, the company’s premium valuation and more conventional consumer staples characteristics left it vulnerable amidst a cyclical market rotation, in our view. Consequently, we decided to exit the position. |
| Q | | Were there any notable changes in the Fund’s weightings during the Reporting Period? |
| A | | In constructing the Fund’s portfolio, we focus on picking stocks rather than on making industry or sector bets. We seek to outpace the benchmark index by overweighting stocks that we expect to outperform and underweighting those that we think may lag. Consequently, changes in its sector weights are generally the direct result of individual stock selection or of stock appreciation or depreciation. That said, during the Reporting Period, there were no notable changes in the Fund’s sector weightings. |
| Q | | How was the Fund positioned relative to its benchmark index at the end of February 2017? |
| A | | At the end of February 2017, the Fund had an overweighted position relative to the Russell Index in the financials sector. On the same date, the Fund was rather neutrally weighted to the Russell Index in consumer discretionary, consumer staples, energy, health care, industrials, information technology, materials and real estate and had no positions at all in utilities or telecommunication services at the end of the Reporting Period. |
6
FUND BASICS
Capital Growth Fund
as of February 28, 2017
| | | | | | | | | | |
| | PERFORMANCE REVIEW | |
| | | September 1, 2016–February 28, 2017 | | Fund Total Return (based on NAV)1 | | | Russell 1000® Growth Index2 | |
| | Class A | | | 8.83 | % | | | 9.15 | % |
| | Class C | | | 8.44 | | | | 9.15 | |
| | Institutional | | | 9.03 | | | | 9.15 | |
| | Service | | | 8.75 | | | | 9.15 | |
| | Class IR | | | 8.93 | | | | 9.15 | |
| | Class R | | | 8.69 | | | | 9.15 | |
| | | Class R6 | | | 9.05 | | | | 9.15 | |
| | 1 | | The net asset value (“NAV”) represents the net assets of the class of the Fund (ex-dividend) divided by the total number of shares of the class outstanding. The Fund’s performance reflects the reinvestment of dividends and other distributions. The Fund’s performance does not reflect the deduction of any applicable sales charges. |
| | 2 | | The Russell 1000® Growth Index is an unmanaged index that measures the performance of those Russell 1000® companies with higher price-to-book ratios and higher forecasted growth values. The Index figures do not reflect any deduction for fees, expenses or taxes. It is not possible to invest directly in an index. |
| | | | | | | | | | | | | | | | | | | | |
| | STANDARDIZED TOTAL RETURNS3 |
| | | For the period ended 12/31/16 | | One Year | | | Five Years | | | Ten Years | | | Since Inception | | | Inception Date |
| | Class A | | | -3.68 | % | | | 11.73 | % | | | 5.86 | % | | | 8.77 | % | | 4/20/90 |
| | Class C | | | 0.11 | | | | 12.15 | | | | 5.66 | | | | 5.00 | | | 8/15/97 |
| | Institutional | | | 2.33 | | | | 13.45 | | | | 6.88 | | | | 6.20 | | | 8/15/97 |
| | Service | | | 1.81 | | | | 12.88 | | | | 6.35 | | | | 5.68 | | | 8/15/97 |
| | Class IR | | | 2.16 | | | | 13.28 | | | | N/A | | | | 6.39 | | | 11/30/07 |
| | Class R | | | 1.68 | | | | 12.72 | | | | N/A | | | | 5.87 | | | 11/30/07 |
| | | Class R6 | | | 2.34 | | | | N/A | | | | N/A | | | | -1.20 | | | 7/31/15 |
| | 3 | | The Standardized Total Returns are average annual total returns or cumulative total returns (only if the performance period is one year or less) as of the most recent calendar quarter-end. They assume reinvestment of all distributions at NAV. These returns reflect a maximum initial sales charge of 5.5% for Class A Shares and the assumed contingent deferred sales charge for Class C Shares (1% if redeemed within 12 months of purchase). Because Institutional, Service, Class IR, Class R and Class R6 Shares do not involve a sales charge, such a charge is not applied to their Standardized Total Returns. |
The returns set forth in the tables above represent past performance. Past performance does not guarantee future results. The Fund’s investment return and principal value will fluctuate so that an investor’s shares, when redeemed, may be worth more or less than their original cost. Current performance may be lower or higher than the performance quoted above. Please visit our web site at www.GSAMFUNDS.com to obtain the most recent month-end returns. Performance reflects applicable fee waivers and/or expense limitations in effect during the periods shown. In their absence, performance would be reduced. Returns do not reflect the deduction of taxes that a shareholder would pay on Fund distributions or the redemption of Fund shares.
7
FUND BASICS
| | | | | | | | | | |
| | EXPENSE RATIOS4 | |
| | | | | Net Expense Ratio (Current) | | | Gross Expense Ratio (Before Waivers) | |
| | Class A | | | 1.15 | % | | | 1.51 | % |
| | Class C | | | 1.90 | | | | 2.26 | |
| | Institutional | | | 0.75 | | | | 1.11 | |
| | Service | | | 1.25 | | | | 1.61 | |
| | Class IR | | | 0.90 | | | | 1.26 | |
| | Class R | | | 1.40 | | | | 1.76 | |
| | | Class R6 | | | 0.74 | | | | 1.09 | |
| | 4 | | The expense ratios of the Fund, both current (net of applicable fee waivers and/or expense limitations) and before waivers (gross of applicable fee waivers and/or expense limitations) are as set forth above according to the most recent publicly available Prospectus for the Fund and may differ from the expense ratios disclosed in the Financial Highlights in this report. Pursuant to a contractual arrangement, the Fund’s waivers and/or expense limitations will remain in place through at least December 29, 2017, and prior to such date the investment adviser may not terminate the arrangements without the approval of the Fund’s Board of Trustees. If these arrangements are discontinued in the future, the expense ratios may change without shareholder approval. |
| | | | | | | | |
| | TOP TEN HOLDINGS AS OF 2/28/175 |
| | | Holding | | % of Net Assets | | | Line of Business |
| | Apple, Inc. | | | 7.3 | % | | Technology Hardware, Storage &
Peripherals |
| | Amazon.com, Inc. | | | 3.2 | | | Internet & Direct Marketing
Retail |
| | Facebook, Inc. Class A | | | 3.1 | | | Internet Software & Services |
| | Microsoft Corp. | | | 3.0 | | | Software |
| | MasterCard, Inc. Class A | | | 2.9 | | | IT Services |
| | Comcast Corp. Class A | | | 2.4 | | | Media |
| | Alphabet, Inc. Class C | | | 2.2 | | | Internet Software & Services |
| | Eli Lilly & Co. | | | 2.2 | | | Pharmaceuticals |
| | Alphabet, Inc. Class A | | | 2.2 | | | Internet Software & Services |
| | | The Walt Disney Co. | | | 2.2 | | | Media |
| | 5 | | The top 10 holdings may not be representative of the Fund’s future investments. |
8
FUND BASICS
|
| FUND VS. BENCHMARK SECTOR ALLOCATION6 |
| As of February 28, 2017 |
| | 6 | | The Fund is actively managed and, as such, its composition may differ over time. Consequently, the Fund’s overall sector allocations may differ from the percentages contained in the graph above. The graph categorizes investments using the Global Industry Classification Standard (“GICS”), however, the sector classifications used by the portfolio management team may differ from GICS. The percentage shown for each investment category reflects the value of investments in that category as a percentage of market value (excluding investments in the securities lending reinvestment vehicle, if any). Investments in the securities lending reinvestment vehicle represented 0.3% of the Fund’s net assets as of February 28, 2017. The graph depicts the Fund’s investments but may not represent the Fund’s market exposure due to the exclusion of certain derivatives, if any, as listed in the Additional Investment Information section of the Schedule of Investments. |
9
PORTFOLIO RESULTS
Goldman Sachs Concentrated Growth Fund
Portfolio Composition
The Fund invests primarily in U.S. equity investments. The Fund typically holds 30-40 high quality growth companies and tends to be more concentrated in individual holdings, industries and sectors than the typical broadly diversified large-cap growth fund. Since the Fund’s inception, the Goldman Sachs Growth Equity Investment Team has focused on several key investment criteria that it believes can drive a company’s growth over the long term. These characteristics are: dominant market share, established brand name, pricing power, recurring revenue stream, free cash flow, high returns on invested capital, predictable growth, sustainable growth, long product life cycle, enduring competitive advantage, favorable demographic trends and excellent management. The Team strives to purchase these companies at reasonable valuations in order to capture the full benefits of their growth.
Portfolio Management Discussion and Analysis
Below, the Goldman Sachs Growth Equity Investment Team discusses the Goldman Sachs Concentrated Growth Fund’s (the “Fund”) performance and positioning for the six-month period ended February 28, 2017 (the “Reporting Period”).
| Q | | How did the Fund perform during the Reporting Period? |
| A | | During the Reporting Period, the Fund’s Class A, C, Institutional, IR, R and R6 Shares generated cumulative total returns, without sales charges, of 6.79%, 6.39%, 7.00%, 6.91%, 6.62% and 6.95%, respectively. These returns compare to the 9.15% cumulative total return of the Fund’s benchmark, the Russell 1000® Growth Index (with dividends reinvested) (the “Russell Index”), during the same period. |
| Q | | What key factors were responsible for the Fund’s performance during the Reporting Period? |
| A | | The Fund generated solid positive absolute returns, but stock selection overall detracted from the Fund’s performance relative to the Russell Index during the Reporting Period. Sector allocation as a whole also detracted, albeit more modestly. |
| Q | | Which equity market sectors most significantly affected Fund performance? |
| A | | Challenging stock selection in the health care, consumer discretionary and industrials sectors detracted from the Fund’s relative results most during the Reporting Period. The only two sectors to contribute positively to the Fund’s relative performance during the Reporting Period were consumer staples and materials. Effective stock selection helped most in consumer staples. Having an underweighted allocation to materials, which lagged the Russell Index during the Reporting Period, drove results in that sector. |
| Q | | Which stocks detracted significantly from the Fund’s performance during the Reporting Period? |
| A | | Among those stocks detracting most from the Fund’s results relative to the Russell Index were positions in global pharmaceutical company Allergan, water and wastewater applications services provider Xylem and consumer products retailer Newell Brands. |
| | | During the Reporting Period, Allergan reported disappointing quarterly results due to persistent drug pricing pressures, which have weighed on the company and the pharmaceuticals industry broadly. Though we remain positive on the outlook of Allergan, we decided to exit the Fund’s position in favor of what we considered to be more compelling ideas. |
| | | We believe the weakness in Xylem during the Reporting Period was less company specific and more related to an ongoing rotation into more cyclical stocks following the November U.S. elections. Despite the weakness, we remained positive on Xylem at the end of the Reporting Period and believed the company may benefit from secular growth and the recovery of utility spending. Additionally, we were optimistic about Xylem’s margin expansion prospects and believed its management team has done well to position the company for sustainable long-term growth. |
| | | Newell Brands reported earnings that were below market expectations, causing its shares to decline. There was short-term investor concern that sales momentum may slow in the |
10
PORTFOLIO RESULTS
| | coming quarters due to ongoing integration work. While we continue to believe Newell Brands has a strong management team, we felt the risk/reward profile of the company had become less compelling for the concentrated growth strategy and so decided to exit the position during the Reporting Period. |
| Q | | What were some of the Fund’s best-performing individual stocks? |
| A | | The Fund benefited most relative to the Russell Index from positions in information technology giant Apple, transportation provider CSX and semiconductor company NXP Semiconductors. |
| | | CSX, a new position for the Fund during the Reporting Period, provides rail, intermodal, domestic container shipping and contract logistics services around the world. Since being added to the Fund’s portfolio during the fourth quarter of 2016, the company saw its stock price spike in January 2017, as Canadian Pacific Chief Executive Officer, Hunter Harrison, resigned and was reportedly seeking a senior management position at CSX. The market viewed the potential move positively given Harrison’s strong reputation. The company also reported results that beat market expectations on revenues but slightly missed on earnings. In our view, CSX’s focus on margin expansion initiatives could be supportive of growth alongside a free cash flow inflection following investments in locomotives. We believe CSX is well positioned to benefit from a possible inflationary environment given its cyclical business model and also from potential tax reforms given its currently high tax rate. Overall, at the end of the Reporting Period, we were optimistic about CSX’s growth prospects, operation improvement potential and strong free cash flow generation. |
| | | Apple’s quarterly earnings during the Reporting Period were generally in line with market expectations on revenues and earnings per share, and its management remained constructive about guidance. During the Reporting Period, Apple launched the iPhone 7 as well as other products such as the new Apple watch and wireless earbuds. At the end of the Reporting Period, we continued to see a number of strong growth catalysts for Apple, including solid iPhone 7 and iPhone 7 Plus demand as well as ongoing product innovation and development. In our view, the company continues to deliver strong services growth, which we believe is important, as this decreases transactional volatility tied to product cycles. At the end of the Reporting Period, we remained optimistic on Apple’s significant installed base, experienced management, established brand name and continued innovation. |
| | Shares of NXP Semiconductors gained sharply early in the Reporting Period following the announcement by Qualcomm that it would acquire NXP Semiconductors. Our thesis was that the company was a high quality franchise with a diverse opportunity set, differentiated product lineup and effective management team. We believed these factors positioned the company well for long-term growth. Later in the Reporting Period, we exited the Fund’s position in NXP Semiconductors in favor of other ideas. |
| Q | | How did the Fund use derivatives and similar instruments during the Reporting Period? |
| A | | During the Reporting Period, we did not use derivatives as part of an active management strategy. |
| Q | | Did the Fund make any significant purchases or sales during the Reporting Period? |
| A | | In addition to those purchases already mentioned, we initiated a Fund position in Northern Trust, an international financial services firm. Northern Trust is a company we had previously owned in our portfolios for its high quality fundamentals, including a solid balance sheet and cash position. We believe Northern Trust is well positioned to benefit from interest rate hikes and significant organic growth opportunities within the custody and fund administration business. We are additionally positive on the company’s wealth management segment given its mix of both active and passive strategies. The company’s management has stated it expects to reinvest its earnings into the business while targeting a meaningful return on equity, which could benefit shareholders. Northern Trust also has a high payout ratio and is well capitalized, in our view. Finally, we believe Northern Trust may further benefit from potentially lower corporate tax rates. With what we consider to be an experienced management and a high quality franchise, we are optimistic on Northern Trust’s growth prospects. |
| | | We established a Fund position in media and entertainment company Walt Disney & Co. As the outlook for U.S. economic growth improved for many following the U.S. elections, we were positive on the ability of the company to capitalize on the potential opportunities, especially in their theme park revenue. We also felt some of the perceived risks surrounding its ESPN business were overstated. In our view, Disney has a strong balance sheet, robust free cash flow and earnings growth and remains committed to buying back |
11
PORTFOLIO RESULTS
| | shares. We are positive on the company moving forward and on its potential for sustained growth. |
| | Conversely, in addition to those sales mentioned earlier, we eliminated the Fund’s position in multinational conglomerate 3M. In our view, 3M is undergoing a transition with revised earnings, particularly in its electronics business. We believe this is being driven by customers moving away from LED to OLED devices in televisions and smartphones. (LED stands for light-emitting diode. OLED stands for organic light-emitting diode.) We think this shift may add headwinds to the company’s earnings in the near term, and we exited the position to invest in what we considered to be relatively more attractive risk/reward ideas. |
| | We exited the Fund’s position in tobacco company Reynolds American during the Reporting Period. The company saw its stock price spike in October 2016 as news broke that British American Tobacco, which already owned 42% of Reynolds American, made a proposal to acquire the remaining 58% of the company at a premium. Following this development, we felt the risk/reward was less compelling and decided to sell the position. |
| Q | | Were there any notable changes in the Fund’s weightings during the Reporting Period? |
| A | | In constructing the Fund’s portfolio, we focus on picking stocks rather than on making industry or sector bets. We seek to outpace the benchmark index by overweighting stocks that we expect to outperform and underweighting those that we think may lag. Consequently, changes in its sector weights are generally the direct result of individual stock selection or of stock appreciation or depreciation. That said, during the Reporting Period, the Fund’s exposure to energy, financials and industrials increased and its allocations to health care, information technology and real estate decreased relative to the Russell Index. |
| Q | | How was the Fund positioned relative to its benchmark index at the end of February 2017? |
| A | | At the end of February 2017, the Fund had overweighted positions relative to the Russell Index in the financials, information technology and real estate sectors. On the same date, the Fund had underweighted positions compared to the Russell Index in consumer discretionary, health care and materials. The Fund was rather neutrally weighted relative to the Russell Index in consumer staples, energy and industrials and had no positions at all in the utilities and telecommunication services sectors at the end of the Reporting Period. |
12
FUND BASICS
Concentrated Growth Fund
as of February 28, 2017
| | | | | | | | | | |
| | PERFORMANCE REVIEW | |
| | | September 1, 2016–February 28, 2017 | | Fund Total Return (based on NAV)1 | | | Russell 1000® Growth Index2 | |
| | Class A | | | 6.79 | % | | | 9.15 | % |
| | Class C | | | 6.39 | | | | 9.15 | |
| | Institutional | | | 7.00 | | | | 9.15 | |
| | Class IR | | | 6.91 | | | | 9.15 | |
| | Class R | | | 6.62 | | | | 9.15 | |
| | | Class R6 | | | 6.95 | | | | 9.15 | |
| | 1 | | The net asset value (“NAV”) represents the net assets of the class of the Fund (ex-dividend) divided by the total number of shares of the class outstanding. The Fund’s performance reflects the reinvestment of dividends and other distributions. The Fund’s performance does not reflect the deduction of any applicable sales charges. |
| | 2 | | The Russell 1000® Growth Index is an unmanaged index that measures the performance of those Russell 1000® companies with higher price-to-book ratios and higher forecasted growth values. The Index figures do not reflect any deduction for fees, expenses or taxes. It is not possible to invest directly in an index. |
| | | | | | | | | | | | | | | | | | | | |
| | STANDARDIZED TOTAL RETURNS3 |
| | | For the period ended 12/31/16 | | One Year | | | Five Years | | | Ten Years | | | Since Inception | | | Inception Date |
| | Class A | | | -5.76 | % | | | 10.49 | % | | | 5.19 | % | | | 6.40 | % | | 9/03/02 |
| | Class C | | | -2.05 | | | | 10.90 | | | | 5.00 | | | | 6.01 | | | 9/03/02 |
| | Institutional | | | 0.08 | | | | 12.20 | | | | 6.21 | | | | 7.25 | | | 9/03/02 |
| | Class IR | | | -0.11 | | | | 12.03 | | | | N/A | | | | 5.20 | | | 11/30/07 |
| | Class R | | | -0.52 | | | | 11.48 | | | | N/A | | | | 4.70 | | | 11/30/07 |
| | | Class R6 | | | 0.09 | | | | N/A | | | | N/A | | | | -2.15 | | | 7/31/15 |
| | 3 | | The Standardized Total Returns are average annual total returns or cumulative total returns (only if the performance period is one year or less) as of the most recent calendar quarter-end. They assume reinvestment of all distributions at NAV. These returns reflect a maximum initial sales charge of 5.5% for Class A Shares and the assumed contingent deferred sales charge for Class C Shares (1% if redeemed within 12 months of purchase). Because Institutional, Class IR, Class R and Class R6 Shares do not involve a sales charge, such a charge is not applied to their Standardized Total Returns. |
The returns set forth in the tables above represent past performance. Past performance does not guarantee future results. The Fund’s investment return and principal value will fluctuate so that an investor’s shares, when redeemed, may be worth more or less than their original cost. Current performance may be lower or higher than the performance quoted above. Please visit our web site at www.GSAMFUNDS.com to obtain the most recent month-end returns. Performance reflects applicable fee waivers and/or expense limitations in effect during the periods shown. In their absence, performance would be reduced. Returns do not reflect the deduction of taxes that a shareholder would pay on Fund distributions or the redemption of Fund shares.
13
FUND BASICS
| | | | | | | | | | |
| | EXPENSE RATIOS4 | |
| | | | | Net Expense Ratio (Current) | | | Gross Expense Ratio (Before Waivers) | |
| | Class A | | | 1.19 | % | | | 1.63 | % |
| | Class C | | | 1.95 | | | | 2.38 | |
| | Institutional | | | 0.82 | | | | 1.23 | |
| | Class IR | | | 0.94 | | | | 1.38 | |
| | Class R | | | 1.45 | | | | 1.89 | |
| | | Class R6 | | | 0.81 | | | | 1.21 | |
| | 4 | | The expense ratios of the Fund, both current (net of applicable fee waivers and/or expense limitations) and before waivers (gross of applicable fee waivers and/or expense limitations) are as set forth above according to the most recent publicly available Prospectus for the Fund and may differ from the expense ratios disclosed in the Financial Highlights in this report. Pursuant to a contractual arrangement, the Fund’s waivers and/or expense limitations will remain in place through at least December 29, 2017, and prior to such date the investment adviser may not terminate the arrangements without the approval of the Fund’s Board of Trustees. If these arrangements are discontinued in the future, the expense ratios may change without shareholder approval. |
| | | | | | | | |
| | TOP TEN HOLDINGS AS OF 2/28/175 |
| | | Holding | | % of Net Assets | | | Line of Business |
| | Apple, Inc. | | | 8.0 | % | | Technology Hardware, Storage &
Peripherals |
| | Facebook, Inc. Class A | | | 4.8 | | | Internet Software & Services |
| | Amazon.com, Inc. | | | 4.6 | | | Internet & Direct Marketing
Retail |
| | Microsoft Corp. | | | 4.4 | | | Software |
| | Costco Wholesale Corp. | | | 4.1 | | | Food & Staples Retailing |
| | Alphabet, Inc. Class A | | | 4.1 | | | Internet Software & Services |
| | Comcast Corp. Class A | | | 3.4 | | | Media |
| | MasterCard, Inc. Class A | | | 3.1 | | | IT Services |
| | Northern Trust Corp. | | | 2.9 | | | Capital Markets |
| | | Eli Lilly & Co. | | | 2.8 | | | Pharmaceuticals |
| | 5 | | The top 10 holdings may not be representative of the Fund’s future investments. |
14
FUND BASICS
|
| FUND VS. BENCHMARK SECTOR ALLOCATION6 |
| As of February 28, 2017 |
| | 6 | | The Fund is actively managed and, as such, its composition may differ over time. Consequently, the Fund’s overall sector allocations may differ from the percentages contained in the graph above. The graph categorizes investments using the Global Industry Classification Standard (“GICS”), however, the sector classifications used by the portfolio management team may differ from GICS. The percentage shown for each investment category reflects the value of investments in that category as a percentage of market value. The graph depicts the Fund’s investments but may not represent the Fund’s market exposure due to the exclusion of certain derivatives, if any, as listed in the Additional Investment Information section of the Schedule of Investments. |
15
PORTFOLIO RESULTS
Goldman Sachs Dynamic U.S. Equity Fund
Portfolio Composition
The Fund invests primarily in U.S. equity investments. Since the Fund’s inception, the Goldman Sachs Growth Equity Investment Team and the Goldman Sachs Fundamental Equity Value Investment Team have focused on several key investment criteria that they believe can drive a company’s growth over the long term. These characteristics are: dominant market share, established brand name, pricing power, recurring revenue stream, free cash flow, high returns on invested capital, predictable growth, sustainable growth, long product life cycle, enduring competitive advantage, favorable demographic trends and excellent management. The Teams strive to purchase these companies at reasonable valuations in order to capture the full benefits of their growth.
Portfolio Management Discussion and Analysis
Below, the Goldman Sachs Growth Equity Investment Team and the Goldman Sachs Value Equity Investment Team discuss the Goldman Sachs Dynamic U.S. Equity Fund’s (the “Fund”) performance and positioning for the six-month period ended February 28, 2017 (the “Reporting Period”).
| Q | | How did the Fund perform during the Reporting Period? |
| A | | During the Reporting Period, the Fund’s Class A, C, Institutional, IR, R and R6 Shares generated cumulative total returns, without sales charges, of 9.60%, 9.16%, 9.75%, 9.67%, 9.41% and 9.84%, respectively. These returns compare to the 10.01% cumulative total return of the Fund’s benchmark, the Standard & Poor’s 500® Index (the “S&P 500 Index”), during the same period. |
| Q | | What key factors were responsible for the Fund’s performance during the Reporting Period? |
| A | | The Fund posted positive absolute returns, but stock selection overall detracted from the Fund’s performance relative to the S&P 500 Index during the Reporting Period. Sector allocation as a whole contributed positively. |
| Q | | Which equity market sectors most significantly affected Fund performance? |
| A | | Challenging stock selection in energy, industrials and health care detracted from the Fund’s relative results most. The only two sectors to contribute positively to the Fund’s relative performance during the Reporting Period were financial and materials, wherein effective stock selection helped. Having an overweighted allocation to financials, which significantly outperformed the S&P 500 Index during the Reporting Period, also boosted the Fund’s relative results. |
| Q | | Which stocks detracted significantly from the Fund’s performance during the Reporting Period? |
| A | | Among those stocks detracting most from the Fund’s results relative to its benchmark index were positions in oil and gas exploration and production company Southwestern Energy, beer producer and seller Molson Coors Brewing and global pharmaceutical company Allergan. |
| | | The stock price of Southwestern Energy came under pressure during the Reporting Period largely due to weak natural gas prices. Additionally, investors felt there was a lack of transparency in future guidance. At the end of the Reporting Period, we continued to see upside potential for Southwestern Energy given what we view as the company’s high quality assets, specifically in the Marcellus, Fayetteville and Utica shales. We also remained encouraged by its management team’s focus on cutting costs and divesting assets as it seeks to maintain an appropriate level of debt and by its commitment to capital efficiency amidst a challenging macro environment. |
| | | Shares of Molson Coors Brewing declined following the U.S. elections as did other names in the beverage industry. Much of this was driven by weaker than expected scanner data. (Scanner data is retail purchase information (such as price, brand, product size, amount purchased) gathered at the point of purchase by an electronic device that reads a coded ticket on the product through the use of an electronic reader over |
16
PORTFOLIO RESULTS
| | which the product passes.) Still, the company reported earnings that slightly beat modest market estimates. At the end of the Reporting Period, we remained positive on Molson Coors Brewing given the potential for value creation from its transformational acquisition of the Miller joint venture. We expect the deal may unlock greater cost and revenue synergy opportunities than currently expected by the market and may well drive significant margin expansion over time, in our view. Additionally, we think consolidation within the industry could lead to more positive tailwinds. |
| | | During the Reporting Period, Allergan reported disappointing quarterly results due to persistent drug pricing pressures, which have weighed on the company and the pharmaceuticals industry broadly. Though we remain positive on the outlook of Allergan, we decided to exit the Fund’s position in favor of what we considered to be more compelling ideas. |
| Q | | What were some of the Fund’s best-performing individual stocks? |
| A | | The Fund benefited most relative to the S&P 500 Index from positions in Bank of America, Wells Fargo and JPMorgan Chase, each of the financials sector, which broadly rose following the U.S. presidential election as investor sentiment around the sector, and banks in particular, improved. Sentiment improved as investors anticipated both a more attractive regulatory environment and increases in interest rates. |
| | | Additionally, on a more company-specific level, the stock price of Bank of America strengthened after the company reported revenue and earnings that exceeded consensus expectations, largely due to improved trading and investment banking growth. At the end of the Reporting Period, we believed shares of Bank of America remained attractively valued given rising U.S. interest rates and an improving U.S. economy. In our view, its management is committed to bettering execution, growing margins and returning capital to shareholders. |
| | | Wells Fargo was a new purchase for the Fund during the Reporting Period. Following a challenging period for Wells Fargo in September and October 2016 due to the company being fined for illegal sales practices, the departure of its Chief Executive Officer, John Stumpf, and negative scrutiny, the company rebounded with strong performance through the rest of the Reporting Period. Following the decline, we had taken the opportunity to add the company to the Fund’s portfolio, as we believed the fine to be relatively minor given the company’s size and particularly in the then-current regulatory environment. The market appeared to take a positive view on the change in management, and Wells Fargo announced good earnings in October 2016, with earnings per share and fee income coming in better than market expectations. At the end of the Reporting Period, we maintained our conviction in what we viewed as Wells Fargo’s strong deposit franchise and leading national distribution network. We also believed its shares were trading at a compelling valuation relative to its peer group and the overall market. In our view, the company’s experienced management team and what we consider to be its strong balance sheet positioned it well for increasing shareholder distributions. |
| | | Shares of JPMorgan Chase enjoyed strong performance throughout the Reporting Period driven by solid earnings that were generally positive across several quarters. The company also continued to grow loans and gain market share, and its management remained focused on utilizing technology to reduce costs and improve efficiency across business lines. Overall, we remained positive on JPMorgan Chase’s business outlook and continued to find the stock compelling from a risk-reward perspective. |
| Q | | How did the Fund use derivatives and similar instruments during the Reporting Period? |
| A | | During the Reporting Period, we did not use derivatives as part of an active management strategy. |
| Q | | Did the Fund make any significant purchases or sales during the Reporting Period? |
| A | | In addition to those purchases already mentioned, we established a Fund position in media and entertainment company Walt Disney & Co. As the outlook for U.S. economic growth improved for many following the U.S. elections, we were positive on the ability of the company to capitalize on the potential opportunities, especially in their theme park revenue. We also felt some of the perceived risks surrounding its ESPN business were overstated. In our view, Disney has a strong balance sheet, robust free cash flow and earnings growth and remains committed to buying back shares. We are positive on the company moving forward and on its potential for sustained growth. |
| | | Conversely, we sold the Fund’s position in pharmaceutical distribution services and medical supplies provider McKesson. Shares of McKesson declined after it reported fiscal second quarter 2017 results with earnings per share well below consensus estimates and its management reduced |
17
PORTFOLIO RESULTS
| | its 2017 earnings per share guidance. The health care sector in general has seen increased scrutiny over drug pricing procedures, creating a difficult environment to create value. While we continue to like the company, greater uncertainty in the near term led us to exit the position and allocate the capital to positions that have a more compelling risk/reward outlook, in our view. |
| | | We eliminated the Fund’s position in health care equipment and services company Abbott Laboratories. The company’s share price had experienced weakness over acquisition-related news, along with foreign exchange headwinds and market growth deterioration in its pediatric nutrition segment in China. Although we continue to believe Abbott Laboratories is a growing business that capitalizes on strong execution, we exited the Fund’s position to invest in companies we considered to have a more favorable risk/ reward profile. |
| Q | | Were there any notable changes in the Fund’s weightings during the Reporting Period? |
| A | | In constructing the Fund’s portfolio, we focus on picking stocks rather than on making industry or sector bets. We seek to outpace the benchmark index by overweighting stocks that we expect to outperform and underweighting those that we think may lag. Consequently, changes in its sector weights are generally the direct result of individual stock selection or of stock appreciation or depreciation. That said, during the Reporting Period, the Fund’s exposure to consumer discretionary and financials increased and its allocations to health care, industrials, information technology, materials and energy decreased compared to the S&P 500 Index. The Fund’s position in cash increased during the Reporting Period. |
| Q | | How was the Fund positioned relative to its benchmark index at the end of February 2017? |
| A | | At the end of February 2017, the Fund had overweighted positions relative to the S&P 500 Index in consumer discretionary, financials, consumer staples and real estate. On the same date, the Fund had underweighted positions compared to the S&P 500 Index in health care, industrials and information technology and was rather neutrally weighted to the S&P 500 Index in energy and materials. The Fund had no positions at all in telecommunication services and utilities at the end of the Reporting Period. |
18
FUND BASICS
Dynamic U.S. Equity Fund
as of February 28, 2017
| | | | | | | | | | |
| | PERFORMANCE REVIEW | |
| | | September 1, 2016–February 28, 2017 | | Fund Total Return (based on NAV)1 | | | S&P 500® Index2 | |
| | Class A | | | 9.60 | % | | | 10.01 | % |
| | Class C | | | 9.16 | | | | 10.01 | |
| | Institutional | | | 9.75 | | | | 10.01 | |
| | Class IR | | | 9.67 | | | | 10.01 | |
| | Class R | | | 9.41 | | | | 10.01 | |
| | | Class R6 | | | 9.84 | | | | 10.01 | |
| | 1 | | The net asset value (“NAV”) represents the net assets of the class of the Fund (ex-dividend) divided by the total number of shares of the class outstanding. The Fund’s performance reflects the reinvestment of dividends and other distributions. The Fund’s performance does not reflect the deduction of any applicable sales charges. |
| | 2 | | The S&P 500® Index is the Standard & Poor’s 500 Composite Index of 500 stocks, an unmanaged index of common stock prices. The Index figures do not reflect any deduction for fees, expenses or taxes. It is not possible to invest directly in an index. |
| | | | | | | | | | | | | | | | |
| | STANDARDIZED TOTAL RETURNS3 |
| | | For the period ended 12/31/16 | | One Year | | | Five Years | | | Since Inception | | | Inception Date |
| | Class A | | | -1.17 | % | | | 11.29 | % | | | 9.30 | % | | 11/30/09 |
| | Class C | | | 2.84 | | | | 11.73 | | | | 9.34 | | | 11/30/09 |
| | Institutional | | | 5.07 | | | | 13.03 | | | | 10.62 | | | 11/30/09 |
| | Class IR | | | 4.92 | | | | 12.85 | | | | 10.44 | | | 11/30/09 |
| | Class R | | | 4.36 | | | | 12.30 | | | | 9.90 | | | 11/30/09 |
| | | Class R6 | | | 5.00 | | | | N/A | | | | 0.34 | | | 7/31/15 |
| | 3 | | The Standardized Total Returns are average annual total returns or cumulative total returns (only if the performance period is one year or less) as of the most recent calendar quarter-end. They assume reinvestment of all distributions at NAV. These returns reflect a maximum initial sales charge of 5.5% for Class A Shares and the assumed contingent deferred sales charge for Class C Shares (1% if redeemed within 12 months of purchase). Because Institutional, Class IR, Class R and Class R6 Shares do not involve a sales charge, such a charge is not applied to their Standardized Total Returns. |
The returns set forth in the tables above represent past performance. Past performance does not guarantee future results. The Fund’s investment return and principal value will fluctuate so that an investor’s shares, when redeemed, may be worth more or less than their original cost. Current performance may be lower or higher than the performance quoted above. Please visit our web site at www.GSAMFUNDS.com to obtain the most recent month-end returns. Performance reflects applicable fee waivers and/or expense limitations in effect during the periods shown. In their absence, performance would be reduced. Returns do not reflect the deduction of taxes that a shareholder would pay on Fund distributions or the redemption of Fund shares.
19
FUND BASICS
| | | | | | | | | | |
| | EXPENSE RATIOS4 | |
| | | | | Net Expense Ratio (Current) | | | Gross Expense Ratio (Before Waivers) | |
| | Class A | | | 1.19 | % | | | 3.60 | % |
| | Class C | | | 1.94 | | | | 4.33 | |
| | Institutional | | | 0.82 | | | | 3.16 | |
| | Class IR | | | 0.94 | | | | 3.54 | |
| | Class R | | | 1.44 | | | | 3.70 | |
| | | Class R6 | | | 0.81 | | | | 3.14 | |
| | 4 | | The expense ratios of the Fund, both current (net of applicable fee waivers and/or expense limitations) and before waivers (gross of applicable fee waivers and/or expense limitations) are as set forth above according to the most recent publicly available Prospectus for the Fund and may differ from the expense ratios disclosed in the Financial Highlights in this report. Pursuant to a contractual arrangement, the Fund’s waivers and/or expense limitations will remain in place through at least December 29, 2017, and prior to such date the investment adviser may not terminate the arrangements without the approval of the Fund’s Board of Trustees. If these arrangements are discontinued in the future, the expense ratios may change without shareholder approval. |
| | | | | | | | |
| | TOP TEN HOLDINGS AS OF 2/28/175 |
| | | Holding | | % of Net Assets | | | Line of Business |
| | Apple, Inc. | | | 5.1 | % | | Technology Hardware, Storage &
Peripherals |
| | Wells Fargo & Co. | | | 4.9 | | | Banks |
| | Bank of America Corp. | | | 4.1 | | | Banks |
| | MasterCard, Inc. Class A | | | 4.1 | | | IT Services |
| | Amazon.com, Inc. | | | 4.0 | | | Internet & Direct Marketing Retail |
| | Whole Foods Market, Inc. | | | 3.5 | | | Food & Staples Retailing |
| | JPMorgan Chase & Co. | | | 3.3 | | | Banks |
| | Facebook, Inc. Class A | | | 3.2 | | | Internet Software & Services |
| | Alphabet, Inc. Class A | | | 3.1 | | | Internet Software & Services |
| | | Pfizer, Inc. | | | 3.0 | | | Pharmaceuticals |
| | 5 | | The top 10 holdings may not be representative of the Fund’s future investments. |
20
FUND BASICS
|
| FUND VS. BENCHMARK SECTOR ALLOCATION6 |
| As of February 28, 2017 |
| | 6 | | The Fund is actively managed and, as such, its composition may differ over time. Consequently, the Fund’s overall sector allocations may differ from the percentages contained in the graph above. The graph categorizes investments using the Global Industry Classification Standard (“GICS”), however, the sector classifications used by the portfolio management team may differ from GICS. The percentage shown for each investment category reflects the value of investments in that category as a percentage of market value. The graph depicts the Fund’s investments but may not represent the Fund’s market exposure due to the exclusion of certain derivatives, if any, as listed in the Additional Investment Information section of the Schedule of Investments. |
21
PORTFOLIO RESULTS
Goldman Sachs Flexible Cap Growth Fund
Portfolio Composition
The Fund invests primarily in U.S. equity investments in small-, mid- and large-capitalization issuers. Since the Fund’s inception, the Goldman Sachs Growth Equity Investment Team has focused on several key investment criteria that it believes can drive a company’s growth over the long term. These characteristics are: dominant market share, established brand name, pricing power, recurring revenue stream, free cash flow, high returns on invested capital, predictable growth, sustainable growth, long product life cycle, enduring competitive advantage, favorable demographic trends and excellent management. The Team strives to purchase these companies at reasonable valuations in order to capture the full benefits of their growth.
Portfolio Management Discussion and Analysis
Below, the Goldman Sachs Growth Equity Investment Team discusses the Goldman Sachs Flexible Cap Growth Fund’s (the “Fund”) performance and positioning for the six-month period ended February 28, 2017 (the “Reporting Period”).
| Q | | How did the Fund perform during the Reporting Period? |
| A | | During the Reporting Period, the Fund’s Class A, C, Institutional, IR, R and R6 Shares generated cumulative total returns, without sales charges, of 7.44%, 7.03%, 7.72%, 7.59%, 7.30% and 7.72%, respectively. These returns compare to the 9.17% cumulative total return of the Fund’s benchmark, the Russell 3000® Growth Index (with dividends reinvested) (the “Russell Index”), during the same period. |
| Q | | What key factors were responsible for the Fund’s performance during the Reporting Period? |
| A | | The Fund generated solid positive absolute returns, but stock selection overall detracted from the Fund’s performance relative to the Russell Index during the Reporting Period. Sector allocation as a whole also detracted, albeit more modestly. |
| Q | | Which equity market sectors most significantly affected Fund performance? |
| A | | The sectors that detracted most from the Fund’s relative results during the Reporting Period were industrials, information technology and consumer discretionary, wherein stock selection proved challenging. The only two sectors that contributed positively to the Fund’s relative performance during the Reporting Period were financials and telecommunication services, wherein effective stock selection drove results. Having an overweighted allocation to financials, which outperformed the Russell Index during the Reporting Period, also helped. |
| Q | | Which stocks detracted significantly from the Fund’s performance during the Reporting Period? |
| A | | Detracting most from the Fund’s results relative to the Russell Index were positions in food manufacturer TreeHouse Foods, water and wastewater applications services provider Xylem and consumer products retailer Newell Brands. |
| | Shares of TreeHouse Foods declined after the company reported mixed second quarter 2016 earnings and announced the retirement of its Chief Financial Officer. Then, in November 2016, the company reported disappointing third calendar quarter results with sales and earnings below market expectations. TreeHouse Foods also announced management changes, which, alongside plans to reorganize its sales force, led to some near-term uncertainty. Following the drop in its stock price, however, the company saw better performance, especially in February 2017 when it announced earnings that were better than the market feared, causing its stock price to regain some of the prior losses. At the end of the Reporting Period, we remained positive on TreeHouse Foods’ growth opportunities, including its acquisition of Ralcorp through which it could potentially extract long-term value for shareholders. |
| | We believe the weakness in Xylem during the Reporting Period was less company specific and more related to an ongoing rotation into more cyclical stocks following the |
22
PORTFOLIO RESULTS
| | November U.S. elections. Despite the weakness, we remained positive on Xylem at the end of the Reporting Period and believed the company may benefit from secular growth and the recovery of utility spending. Additionally, we were optimistic about Xylem’s margin expansion prospects and believed its management team has done well to position the company for sustainable long-term growth. |
| | Newell Brands reported earnings that were below market expectations, causing its shares to decline. There was short- term investor concern that sales momentum may slow in the coming quarters due to ongoing integration work. Despite its underperformance, we continued to like the business and believed, at the end of the Reporting Period, that Newell Brands potentially represents a multi-year, double-digit earnings growth story. In our view, the company’s acquisition of Jarden, a similar holding company of consumer durable goods, could also yield meaningful synergies and earnings flexibility. Overall, we believed at the end of the Reporting Period that Newell Brands has a strong management team with a demonstrated track record of delivering shareholder value through both organic growth and acquisitions. |
| Q | | What were some of the Fund’s best-performing individual stocks? |
| A | | Among those stocks the Fund benefited most from relative to the Russell Index were positions in investment banking advisory company Evercore Partners, information technology giant Apple and transportation provider CSX. |
| | During the Reporting Period, shares of Evercore Partners gained steadily, as the company reported consecutive quarters of positive results. Evercore was a new purchase for the Fund during the Reporting Period. We expected to see Evercore Partners taking share from bulge bracket firms and other independent boutiques. (The bulge bracket comprises the world’s largest and most profitable multinational investment banks whose investment banking clients are usually large corporations, institutions and governments.) The company had also made a conscious decision to reduce its investment management business and focus on delivering margins through higher productivity and cost control initiatives. With a meaningful share buyback and rise in dividends, Evercore Partners’ management has emphasized a focus on returning capital to shareholders. We initiated the purchase as we viewed Evercore Partners as a high quality growth company with an experienced management team and a favorable valuation. As our investment thesis largely played out, we sold the Fund’s position in the company by the end of the Reporting Period. |
| | Apple’s quarterly earnings during the Reporting Period were generally in line with market expectations on revenues and earnings per share, and its management remained constructive about guidance. During the Reporting Period, Apple launched the iPhone 7 as well as other products such as the new Apple watch and wireless earbuds. At the end of the Reporting Period, we continued to see a number of strong growth catalysts for Apple, including solid iPhone 7 and iPhone 7 Plus demand as well as ongoing product innovation and development. In our view, the company continues to deliver strong services growth, which we believe is important, as this decreases transactional volatility tied to product cycles. At the end of the Reporting Period, we remained optimistic on Apple’s significant installed base, experienced management, established brand name and continued innovation. |
| | CSX, a new position for the Fund during the Reporting Period, provides rail, intermodal, domestic container shipping and contract logistics services around the world. Since being added to the Fund’s portfolio during the fourth quarter of 2016, the company saw its stock price spike in January 2017, as Canadian Pacific Chief Executive Officer, Hunter Harrison, resigned and was reportedly seeking a senior management position at CSX. The market viewed the potential move positively given Harrison’s strong reputation. The company also reported results that beat market expectations on revenues but slightly missed on earnings. In our view, CSX’s focus on margin expansion initiatives could be supportive of growth alongside a free cash flow inflection following investments in locomotives. We believe CSX is well positioned to benefit from a possible inflationary environment given its cyclical business model and also from potential tax reforms given its currently high tax rate. Overall, at the end of the Reporting Period, we were optimistic about CSX’s growth prospects, operation improvement potential and strong free cash flow generation. |
| Q | | How did the Fund use derivatives and similar instruments during the Reporting Period? |
| A | | During the Reporting Period, we did not use derivatives as part of an active management strategy. |
23
PORTFOLIO RESULTS
| Q | | Did the Fund make any significant purchases or sales during the Reporting Period? |
| A | | In addition to the purchases already mentioned, we established a Fund position in leading pharmaceutical company Eli Lilly. In our view, Eli Lilly has a strong history of innovation and a solid upcoming pipeline. The company is coming off its patent cliff years and entering a phase of growth driven by new products. We see its margins expanding as new drugs improve its overall product mix. We believe Eli Lilly is a high quality company with leading franchises, strong growth prospects and an improving financial profile. (Patent cliff is a colloquialism to denote the potential sharp decline in revenues upon patent expiration of one or more leading products of a firm. A patent cliff is when a firm’s revenues could “fall off a cliff” when one or more established products go off-patent, since these products can be replicated and sold at much cheaper prices by competitors. While it is applicable to any industry, in recent years the term “patent cliff” has come to be associated almost exclusively with the pharmaceutical industry.) |
| | We initiated a Fund position in Northern Trust, an international financial services firm. Northern Trust is a company we had previously owned in our portfolios for its high quality fundamentals, including a solid balance sheet and cash position. We believe Northern Trust is well positioned to benefit from interest rate hikes and significant organic growth opportunities within the custody and fund administration business. We are additionally positive on the company’s wealth management segment given its mix of both active and passive strategies. The company’s management has stated it expects to reinvest its earnings into the business while targeting a meaningful return on equity, which could benefit shareholders. Northern Trust also has a high payout ratio and is well capitalized, in our view. Finally, we believe Northern Trust may further benefit from potentially lower corporate tax rates. With what we consider to be an experienced management and a high quality franchise, we are optimistic on Northern Trust’s growth prospects. |
| | Conversely, in addition to those sales mentioned earlier, we eliminated the Fund’s position in health care equipment and services company Abbott Laboratories. The company’s share price had experienced weakness over acquisition-related news, along with foreign exchange headwinds and market growth deterioration in its pediatric nutrition segment in China. Although we continue to believe Abbott Laboratories is a growing business that capitalizes on strong execution, we exited the Fund’s position to invest in companies we considered to have a more favorable risk/reward profile. |
| | We eliminated the Fund’s position in McCormick & Company, a manufacturer of spices, seasoning mixes and condiments. Its stock had been a strong performer for the Fund in the first half of 2016. However, the company’s premium valuation and more conventional consumer staples characteristics left it vulnerable amidst a cyclical market rotation, in our view. Consequently, we decided to exit the position. |
| Q | | Were there any notable changes in the Fund’s weightings during the Reporting Period? |
| A | | In constructing the Fund’s portfolio, we focus on picking stocks rather than on making industry or sector bets. We seek to outpace the benchmark index by overweighting stocks that we expect to outperform and underweighting those that we think may lag. Consequently, changes in its sector weights are generally the direct result of individual stock selection or of stock appreciation or depreciation. That said, during the Reporting Period, the Fund’s exposure to energy, financials, health care and industrials increased and its allocations to consumer discretionary and consumer staples decreased relative to the Russell Index. |
| Q | | How was the Fund positioned relative to its benchmark index at the end of February 2017? |
| A | | At the end of February 2017, the Fund had overweighted positions relative to the Russell Index in the energy, financials and industrials sectors. On the same date, the Fund had underweighted positions compared to the Russell Index in consumer discretionary, consumer staples and materials and was rather neutrally weighted to the Russell Index in health care, information technology and real estate. The Fund had no positions at all in the utilities and telecommunication services sectors at the end of the Reporting Period. |
24
FUND BASICS
Flexible Cap Growth Fund
as of February 28, 2017
| | | | | | | | | | |
| | PERFORMANCE REVIEW | |
| | | September 1, 2016–February 28, 2017 | | Fund Total Return (based on NAV)1 | | | Russell 3000® Growth Index2 | |
| | Class A | | | 7.44 | % | | | 9.17 | % |
| | Class C | | | 7.03 | | | | 9.17 | |
| | Institutional | | | 7.72 | | | | 9.17 | |
| | Class IR | | | 7.59 | | | | 9.17 | |
| | Class R | | | 7.30 | | | | 9.17 | |
| | | Class R6 | | | 7.72 | | | | 9.17 | |
| | 1 | | The net asset value (“NAV”) represents the net assets of the class of the Fund (ex-dividend) divided by the total number of shares of the class outstanding. The Fund’s performance reflects the reinvestment of dividends and other distributions. The Fund’s performance does not reflect the deduction of any applicable sales charges. |
| | 2 | | The unmanaged Russell 3000® Growth Index measures the performance of the 3,000 largest U.S. companies based on total market capitalization. The Index figures do not reflect any deduction for fees, expenses or taxes. It is not possible to invest directly in an index. |
| | | | | | | | | | | | | | | | |
| | STANDARDIZED TOTAL RETURNS3 |
| | | For the period ended 12/31/16 | | One Year | | | Five Years | | | Since Inception | | | Inception Date |
| | Class A | | | -3.81 | % | | | 11.91 | % | | | 7.71 | % | | 1/31/08 |
| | Class C | | | -0.02 | | | | 12.34 | | | | 7.61 | | | 1/31/08 |
| | Institutional | | | 2.20 | | | | 13.66 | | | | 8.85 | | | 1/31/08 |
| | Class IR | | | 2.06 | | | | 13.48 | | | | 8.68 | | | 1/31/08 |
| | Class R | | | 1.56 | | | | 12.93 | | | | 8.16 | | | 1/31/08 |
| | | Class R6 | | | 2.20 | | | | N/A | | | | -2.64 | | | 7/31/15 |
| | 3 | | The Standardized Total Returns are average annual total returns or cumulative total returns (only if the performance period is one year or less) as of the most recent calendar quarter-end. They assume reinvestment of all distributions at NAV. These returns reflect a maximum initial sales charge of 5.5% for Class A Shares and the assumed contingent deferred sales charge for Class C Shares (1% if redeemed within 12 months of purchase). Because Institutional, Class IR, Class R and Class R6 Shares do not involve a sales charge, such a charge is not applied to their Standardized Total Returns. |
The returns set forth in the tables above represent past performance. Past performance does not guarantee future results. The Fund’s investment return and principal value will fluctuate so that an investor’s shares, when redeemed, may be worth more or less than their original cost. Current performance may be lower or higher than the performance quoted above. Please visit our web site at www.GSAMFUNDS.com to obtain the most recent month-end returns. Performance reflects applicable fee waivers and/or expense limitations in effect during the periods shown. In their absence, performance would be reduced. Returns do not reflect the deduction of taxes that a shareholder would pay on Fund distributions or the redemption of Fund shares.
25
FUND BASICS
| | | | | | | | | | |
| | EXPENSE RATIOS4 | |
| | | | | Net Expense Ratio (Current) | | | Gross Expense Ratio (Before Waivers) | |
| | Class A | | | 1.19 | % | | | 3.07 | % |
| | Class C | | | 1.94 | | | | 3.82 | |
| | Institutional | | | 0.82 | | | | 2.68 | |
| | Class IR | | | 0.94 | | | | 2.76 | |
| | Class R | | | 1.44 | | | | 3.33 | |
| | | Class R6 | | | 0.81 | | | | 2.66 | |
| | 4 | | The expense ratios of the Fund, both current (net of applicable fee waivers and/or expense limitations) and before waivers (gross of applicable fee waivers and/or expense limitations) are as set forth above according to the most recent publicly available Prospectus for the Fund and may differ from the expense ratios disclosed in the Financial Highlights in this report. Pursuant to a contractual arrangement, the Fund’s waivers and/or expense limitations will remain in place through at least December 29, 2017, and prior to such date the investment adviser may not terminate the arrangements without the approval of the Fund’s Board of Trustees. If these arrangements are discontinued in the future, the expense ratios may change without shareholder approval. |
| | | | | | | | |
| | TOP TEN HOLDINGS AS OF 2/28/175 |
| | | Holding | | % of Net Assets | | | Line of Business |
| | Apple, Inc. | | | 6.7 | % | | Technology Hardware, Storage &
Peripherals |
| | Facebook, Inc. Class A | | | 3.7 | | | Internet Software & Services |
| | Amazon.com, Inc. | | | 3.5 | | | Internet & Direct Marketing Retail |
| | Microsoft Corp. | | | 2.7 | | | Software |
| | Alphabet, Inc. Class A | | | 2.7 | | | Internet Software & Services |
| | Alphabet, Inc. Class C | | | 2.3 | | | Internet Software & Services |
| | MasterCard, Inc. Class A | | | 2.2 | | | IT Services |
| | Honeywell International, Inc. | | | 2.1 | | | Industrial Conglomerates |
| | Comcast Corp. Class A | | | 2.0 | | | Media |
| | | Costco Wholesale Corp. | | | 1.9 | | | Food & Staples Retailing |
| | 5 | | The top 10 holdings may not be representative of the Fund’s future investments. |
26
FUND BASICS
|
| FUND VS. BENCHMARK SECTOR ALLOCATION6 |
| As of February 28, 2017 |
| | 6 | | The Fund is actively managed and, as such, its composition may differ over time. Consequently, the Fund’s overall sector allocations may differ from the percentages contained in the graph above. The graph categorizes investments using the Global Industry Classification Standard (“GICS”), however, the sector classifications used by the portfolio management team may differ from GICS. The percentage shown for each investment category reflects the value of investments in that category as a percentage of market value (excluding investments in the securities lending reinvestment vehicle, if any). Investments in the securities lending reinvestment vehicle represented 0.5% of the Fund’s net assets as of February 28, 2017. The graph depicts the Fund’s investments but may not represent the Fund’s market exposure due to the exclusion of certain derivatives, if any, as listed in the Additional Investment Information section of the Schedule of Investments. |
27
PORTFOLIO RESULTS
Goldman Sachs Focused Growth Fund
Portfolio Composition
The Fund invests primarily in U.S. equity investments. Since the Fund’s inception, the Goldman Sachs Growth Equity Investment Team has focused on several key investment criteria that it believes can drive a company’s growth over the long term. These characteristics are: dominant market share, established brand name, pricing power, recurring revenue stream, free cash flow, high returns on invested capital, predictable growth, sustainable growth, long product life cycle, enduring competitive advantage, favorable demographic trends and excellent management. The Team strives to purchase these companies at reasonable valuations in order to capture the full benefits of their growth.
Portfolio Management Discussion and Analysis
Below, the Goldman Sachs Growth Equity Investment Team discusses the Goldman Sachs Focused Growth Fund’s (the “Fund”) performance and positioning for the six-month period ended February 28, 2017 (the “Reporting Period”).
| Q | | How did the Fund perform during the Reporting Period? |
| A | | During the Reporting Period, the Fund’s Class A, C, Institutional, IR, R and R6 Shares generated cumulative total returns, without sales charges, of 6.10%, 5.73%, 6.34%, 6.27%, 6.04% and 6.38%, respectively. These returns compare to the 9.15% cumulative total return of the Fund’s benchmark, the Russell 1000® Growth Index (with dividends reinvested) (the “Russell Index”), during the same period. |
| Q | | What key factors were responsible for the Fund’s performance during the Reporting Period? |
| A | | The Fund posted positive absolute returns, but sector allocation overall detracted from the Fund’s performance relative to the Russell Index during the Reporting Period. Stock selection as a whole also detracted, albeit more modestly, during the Reporting Period. |
| Q | | Which equity market sectors most significantly affected Fund performance? |
| A | | Challenging stock selection in industrials, health care and financials detracted from the Fund’s relative results most. Having underweighted allocations to industrials and health care also hurt. Effective stock selection in the consumer staples and information technology sectors helped the Fund’s performance most relative to the Russell Index. |
| Q | | Which stocks detracted significantly from the Fund’s performance during the Reporting Period? |
| A | | Detracting most from the Fund’s results relative to the Russell Index were positions in global pharmaceutical company Allergan, water and wastewater applications services provider Xylem and beer producer and seller Molson Coors Brewing. |
| | | During the Reporting Period, Allergan reported disappointing quarterly results due to persistent drug pricing pressures, which have weighed on the company and the pharmaceuticals industry broadly. Though we remain positive on the outlook of Allergan, we decided to exit the Fund’s position in favor of what we considered to be more compelling ideas. |
| | | We believe the weakness in Xylem during the Reporting Period was less company specific and more related to an ongoing rotation into more cyclical stocks following the November U.S. elections. Despite the weakness, we remained positive on Xylem at the end of the Reporting Period and believed the company may benefit from secular growth and the recovery of utility spending. Additionally, we were optimistic about Xylem’s margin expansion prospects and believed its management team has done well to position the company for sustainable long-term growth. |
| | | Shares of Molson Coors Brewing declined following the U.S. elections as did other names in the beverage industry. Much of this was driven by weaker than expected scanner data. (Scanner data is retail purchase information (such as price, brand, product size, amount purchased) gathered at the point |
28
PORTFOLIO RESULTS
| | of purchase by an electronic device that reads a coded ticket on the product through the use of an electronic reader over which the product passes.) Still, the company reported earnings that slightly beat modest estimates. At the end of the Reporting Period, we remained positive on Molson Coors Brewing given the potential for value creation from its transformational acquisition of the Miller joint venture. We expect the deal may unlock greater cost and revenue synergy opportunities than currently expected by the market and may well drive significant margin expansion over time, in our view. Additionally, we think consolidation within the industry could lead to more positive tailwinds. |
| Q | | What were some of the Fund’s best-performing individual stocks? |
| A | | Among those stocks the Fund benefited from relative to the Russell Index were positions in transportation provider CSX, information technology giant Apple and biopharmaceutical company Incyte. |
| | | CSX, a new position for the Fund during the Reporting Period, provides rail, intermodal, domestic container shipping and contract logistics services around the world. Since being added to the Fund’s portfolio during the fourth quarter of 2016, the company saw its stock price spike in January 2017, as Canadian Pacific Chief Executive Officer, Hunter Harrison, resigned and was reportedly seeking a senior management position at CSX. The market viewed the potential move positively given Harrison’s strong reputation. The company also reported results that beat market expectations on revenues but slightly missed on earnings. In our view, CSX’s focus on margin expansion initiatives could be supportive of growth alongside a free cash flow inflection following investments in locomotives. We believe CSX is well positioned to benefit from a possible inflationary environment given its cyclical business model and also from potential tax reforms given its currently high tax rate. Overall, at the end of the Reporting Period, we were optimistic about CSX’s growth prospects, operation improvement potential and strong free cash flow generation. |
| | | Apple’s quarterly earnings during the Reporting Period were generally in line with market expectations on revenues and earnings per share, and its management remained constructive about guidance. During the Reporting Period, Apple launched the iPhone 7 as well as other products such as the new Apple watch and wireless earbuds. At the end of the Reporting Period, we continued to see a number of strong growth catalysts for Apple, including solid iPhone 7 and iPhone 7 Plus demand as well as ongoing product innovation and development. In our view, the company continues to deliver strong services growth, which we believe is important, as this decreases transactional volatility tied to product cycles. At the end of the Reporting Period, we remained optimistic on Apple’s significant installed base, experienced management, established brand name and continued innovation. |
| | During the Reporting Period, Incyte announced it would be advancing one of its key oncology drugs, Epacadostat, into five additional tumor types, which was above market expectations. Additionally, the announced acquisition of ARIAD Pharmaceuticals by Takeda was viewed as a positive for the industry broadly, demonstrating the scarcity value of mid-cap oncology franchises like Incyte. At the end of the Reporting Period, we maintained our belief that Incyte has a strong combination of growing revenues and pipeline opportunities that make it, in our view, a compelling growth investment. |
| Q | | How did the Fund use derivatives and similar instruments during the Reporting Period? |
| A | | During the Reporting Period, we did not use derivatives as part of an active management strategy. |
| Q | | Did the Fund make any significant purchases or sales during the Reporting Period? |
| A | | In addition to the purchases already mentioned, we initiated a Fund position in Northern Trust, an international financial services firm. Northern Trust is a company we had previously owned in our portfolios for its high quality fundamentals, including a solid balance sheet and cash position. We believe Northern Trust is well positioned to benefit from interest rate hikes and significant organic growth opportunities within the custody and fund administration business. We are additionally positive on the company’s wealth management segment given its mix of both active and passive strategies. The company’s management has stated it expects to reinvest its earnings into the business while targeting a meaningful return on equity, which could benefit shareholders. Northern Trust also has a high payout ratio and is well capitalized, in our view. Finally, we believe Northern Trust may further benefit from potentially lower corporate tax rates. With what we consider to be an experienced management and a high quality franchise, we are optimistic on Northern Trust’s growth prospects. |
29
PORTFOLIO RESULTS
| | We established a Fund position in Danaher, a company that designs, manufactures and markets medical, industrial and commercial products and services. We liked the company for its disciplined approach to capital deployment, investing through acquisitions with what it considered to be attractive economics. Danaher has also continued to post favorable organic growth, especially relative to its peers and in a low economic growth environment. Danaher has additionally adjusted its focus on business areas less tied to capital equipment spending, and we believe this could serve the company well in the long term. Our thesis was that Danaher is a high quality company that was reasonably priced, with what we viewed as an outstanding management team and high barriers to entry in its key business segments. |
| | Conversely, in addition to those sales mentioned earlier, we exited the Fund’s position in Honeywell International. Honeywell International is a diversified technology and manufacturing company, which offers aerospace products, power generation systems, specialty chemicals and electronic materials. During the fourth quarter of 2016, Honeywell International pre-announced earnings that were lower than market expectations, causing its shares to decline. The company also revised its third quarter 2016 revenue growth outlook lower amidst weaker results in its aerospace business segment and generally soft industry conditions. While we continue to like the franchise, we believed the company was going through a slow stretch of growth, while its management was also transitioning. We believed these developments warranted prudence. Thus, we exited the Fund’s position in favor of other ideas with what we believe are more compelling risk/reward opportunities. |
| | We eliminated the Fund’s position in health care equipment and services company Abbott Laboratories. The company’s share price had experienced weakness over acquisition-related news, along with foreign exchange headwinds and market growth deterioration in its pediatric nutrition segment in China. Although we continue to believe Abbott Laboratories is a growing business that capitalizes on strong execution, we exited the Fund’s position to invest in companies we considered to have a more favorable risk/ reward profile. |
| Q | | Were there any notable changes in the Fund’s weightings during the Reporting Period? |
| A | | In constructing the Fund’s portfolio, we focus on picking stocks rather than on making industry or sector bets. We seek to outpace the benchmark index by overweighting stocks that we expect to outperform and underweighting those that we think may lag. Consequently, changes in its sector weights are generally the direct result of individual stock selection or of stock appreciation or depreciation. That said, during the Reporting Period, the Fund’s exposure to consumer discretionary, energy, financials and health care increased and its allocations to consumer staples, industrials, information technology, materials and real estate decreased relative to the Russell Index. |
| Q | | How was the Fund positioned relative to its benchmark index at the end of February 2017? |
| A | | At the end of February 2017, the Fund had overweighted positions relative to the Russell Index in the financials, real estate and energy sectors. On the same date, the Fund had underweighted positions compared to the Russell Index in consumer discretionary, health care, industrials and information technology. The Fund was rather neutrally weighted to the Russell Index in consumer staples and had no positions at all in the materials, telecommunication services or utilities sectors at the end of the Reporting Period. |
30
FUND BASICS
Focused Growth Fund
as of February 28, 2017
| | | | | | | | | | |
| | PERFORMANCE REVIEW | |
| | | September 1, 2016–February 28, 2017 | | Fund Total Return (based on NAV)1 | | | Russell 1000® Growth Index2 | |
| | Class A | | | 6.10 | % | | | 9.15 | % |
| | Class C | | | 5.73 | | | | 9.15 | |
| | Institutional | | | 6.34 | | | | 9.15 | |
| | Class IR | | | 6.27 | | | | 9.15 | |
| | Class R | | | 6.04 | | | | 9.15 | |
| | | Class R6 | | | 6.38 | | | | 9.15 | |
| | 1 | | The net asset value (“NAV”) represents the net assets of the class of the Fund (ex-dividend) divided by the total number of shares of the class outstanding. The Fund’s performance reflects the reinvestment of dividends and other distributions. The Fund’s performance does not reflect the deduction of any applicable sales charges. |
| | 2 | | The Russell 1000® Growth Index is an unmanaged index that measures the performance of those Russell 1000® companies with higher price-to-book ratios and higher forecasted growth values. The Index figures do not reflect any deduction for fees, expenses or taxes. It is not possible to invest directly in an index. |
| | | | | | | | | | | | |
| | STANDARDIZED TOTAL RETURNS3 |
| | | For the period ended 12/31/16 | | One Year | | | Since Inception | | | Inception Date |
| | Class A | | | -8.49 | % | | | 9.55 | % | | 1/31/12 |
| | Class C | | | -4.81 | | | | 10.02 | | | 1/31/12 |
| | Institutional | | | -2.72 | | | | 11.28 | | | 1/31/12 |
| | Class IR | | | -2.87 | | | | 11.12 | | | 1/31/12 |
| | Class R | | | -3.42 | | | | 10.55 | | | 1/31/12 |
| | | Class R6 | | | -2.68 | | | | -2.90 | | | 7/31/15 |
| | 3 | | The Standardized Total Returns are average annual total returns or cumulative total returns (only if the performance period is one year or less) as of the most recent calendar quarter-end. They assume reinvestment of all distributions at NAV. These returns reflect a maximum initial sales charge of 5.5% for Class A Shares and the assumed contingent deferred sales charge for Class C Shares (1% if redeemed within 12 months of purchase). Because Institutional, Class IR, Class R and Class R6 Shares do not involve a sales charge, such a charge is not applied to their Standardized Total Returns. |
The returns set forth in the tables above represent past performance. Past performance does not guarantee future results. The Fund’s investment return and principal value will fluctuate so that an investor’s shares, when redeemed, may be worth more or less than their original cost. Current performance may be lower or higher than the performance quoted above. Please visit our web site at www.GSAMFUNDS.com to obtain the most recent month-end returns. Performance reflects applicable fee waivers and/or expense limitations in effect during the periods shown. In their absence, performance would be reduced. Returns do not reflect the deduction of taxes that a shareholder would pay on Fund distributions or the redemption of Fund shares.
31
FUND BASICS
| | | | | | | | | | |
| | EXPENSE RATIOS4 | |
| | | | | Net Expense Ratio (Current) | | | Gross Expense Ratio (Before Waivers) | |
| | Class A | | | 1.21 | % | | | 2.35 | % |
| | Class C | | | 1.96 | | | | 3.14 | |
| | Institutional | | | 0.82 | | | | 1.91 | |
| | Class IR | | | 0.96 | | | | 1.90 | |
| | Class R | | | 1.47 | | | | 2.56 | |
| | | Class R6 | | | 0.78 | | | | 1.87 | |
| | 4 | | The expense ratios of the Fund, both current (net of applicable fee waivers and/or expense limitations) and before waivers (gross of applicable fee waivers and/or expense limitations) are as set forth above according to the most recent publicly available Prospectus for the Fund and may differ from the expense ratios disclosed in the Financial Highlights in this report. Pursuant to a contractual arrangement, the Fund’s waivers and/or expense limitations will remain in place through at least December 29, 2017, and prior to such date the investment adviser may not terminate the arrangements without the approval of the Fund’s Board of Trustees. If these arrangements are discontinued in the future, the expense ratios may change without shareholder approval. |
| | | | | | | | |
| | TOP TEN HOLDINGS AS OF 2/28/175 |
| | | Holding | | % of Net Assets | | | Line of Business |
| | Apple, Inc. | | | 9.5 | % | | Technology Hardware, Storage &
Peripherals |
| | Costco Wholesale Corp. | | | 6.6 | | | Food & Staples Retailing |
| | MasterCard, Inc. Class A | | | 6.0 | | | IT Services |
| | Alphabet, Inc. Class A | | | 5.7 | | | Internet Software & Services |
| | Amazon.com, Inc. | | | 5.3 | | | Internet & Direct Marketing Retail |
| | Facebook, Inc. Class A | | | 5.2 | | | Internet Software & Services |
| | Comcast Corp. Class A | | | 4.9 | | | Media |
| | Northern Trust Corp. | | | 4.8 | | | Capital Markets |
| | Intercontinental Exchange, Inc. | | | 4.7 | | | Capital Markets |
| | | Danaher Corp. | | | 4.3 | | | Health Care Equipment & Supplies |
| | 5 | | The top 10 holdings may not be representative of the Fund’s future investments. |
32
FUND BASICS
|
| FUND VS. BENCHMARK SECTOR ALLOCATION6 |
| As of February 28, 2017 |
| | 6 | | The Fund is actively managed and, as such, its composition may differ over time. Consequently, the Fund’s overall sector allocations may differ from the percentages contained in the graph above. The graph categorizes investments using the Global Industry Classification Standard (“GICS”), however, the sector classifications used by the portfolio management team may differ from GICS. The percentage shown for each investment category reflects the value of investments in that category as a percentage of market value. The graph depicts the Fund’s investments but may not represent the Fund’s market exposure due to the exclusion of certain derivatives, if any, as listed in the Additional Investment Information section of the Schedule of Investments. |
33
PORTFOLIO RESULTS
Goldman Sachs Growth Opportunities Fund
Portfolio Composition
The Fund invests primarily in medium-sized growth companies with a market capitalization between $1 and $10 billion. Since the Fund’s inception, the Goldman Sachs Growth Equity Investment Team has focused on several key investment criteria that it believes can drive a company’s growth over the long term. These characteristics are: dominant market share, established brand name, pricing power, recurring revenue stream, free cash flow, high returns on invested capital, predictable growth, sustainable growth, long product life cycle, enduring competitive advantage, favorable demographic trends and excellent management. The Team strives to purchase these companies at reasonable valuations in order to capture the full benefits of their growth.
Portfolio Management Discussion and Analysis
Below, the Goldman Sachs Growth Equity Investment Team discusses the Goldman Sachs Growth Opportunities Fund’s (the “Fund”) performance and positioning for the six-month period ended February 28, 2017 (the “Reporting Period”).
| Q | | How did the Fund perform during the Reporting Period? |
| A | | During the Reporting Period, the Fund’s Class A, C, Institutional, Service, IR, R and R6 Shares generated cumulative total returns, without sales charges, of 3.13%, 2.72%, 3.35%, 3.06%, 3.30%, 3.05% and 3.31%, respectively. These returns compare to the 6.74% cumulative total return of the Fund’s benchmark, the Russell Midcap® Growth Index (with dividends reinvested) (the “Russell Index”), during the same period. |
| Q | | What key factors were responsible for the Fund’s performance during the Reporting Period? |
| A | | The Fund generated positive absolute returns, but stock selection overall detracted from the Fund’s performance relative to the Russell Index during the Reporting Period. Sector allocation as a whole also detracted, albeit much more modestly. |
| Q | | Which equity market sectors most significantly affected Fund performance? |
| A | | Detracting most from the Fund’s relative results was challenging stock selection in the information technology, consumer staples and industrials sectors. The sectors that contributed most positively to the Fund’s relative performance during the Reporting Period were health care, telecommunication services and energy, wherein effective stock selection drove results. |
| Q | | Which stocks detracted significantly from the Fund’s performance during the Reporting Period? |
| A | | Detracting most from the Fund’s results relative to the Russell Index were positions in food manufacturer TreeHouse Foods, water and wastewater applications services provider Xylem and consumer products retailer Newell Brands. |
| | | Shares of TreeHouse Foods declined after the company reported mixed second quarter 2016 earnings and announced the retirement of its Chief Financial Officer. Then, in November 2016, the company reported disappointing third calendar quarter results with sales and earnings below market expectations. TreeHouse Foods also announced management changes, which, alongside plans to reorganize its sales force, led to some near-term uncertainty. Following the drop in its stock price, however, the company saw better performance, especially in February 2017 when it announced earnings that were better than the market feared, causing its stock price to regain some of the prior losses. At the end of the Reporting Period, we remained positive on TreeHouse Foods’ growth opportunities, including its acquisition of Ralcorp through which it could potentially extract long-term value for shareholders. |
| | | We believe the weakness in Xylem during the Reporting Period was less company specific and more related to an ongoing rotation into more cyclical stocks following the November U.S. elections. Despite the weakness, we remained positive on Xylem at the end of the Reporting |
34
PORTFOLIO RESULTS
| | Period and believed the company may benefit from secular growth and the recovery of utility spending. Additionally, we were optimistic about Xylem’s margin expansion prospects and believed its management team has done well to position the company for sustainable long-term growth. |
| | | Newell Brands reported earnings that were below market expectations, causing its shares to decline. There was short-term concern that sales momentum may slow in the coming quarters due to ongoing integration work. Despite its underperformance, we continued to like the business and believed, at the end of the Reporting Period, that Newell Brands potentially represents a multi-year, double-digit earnings growth story. In our view, the company’s acquisition of Jarden, a similar holding company of consumer durable goods, could also yield meaningful synergies and earnings flexibility. Overall, we believed at the end of the Reporting Period that Newell Brands has a strong management team with a demonstrated track record of delivering shareholder value through both organic growth and acquisitions. |
| Q | | What were some of the Fund’s best-performing individual stocks? |
| A | | The Fund benefited most relative to the Russell Index from positions in diversified technology company Roper Technologies, integrated communications services provider Level 3 Communications and veterinary clinics operator VCA. |
| | | Roper Technologies provides engineered products and solutions for the global niche markets. For much of the Reporting Period, the company performed in line with the overall market. However, in February 2017, its stock price spiked, as it announced solid earnings that beat market expectations on earnings per share and also announced strong guidance. Roper Technologies focuses on cash return on investment (“CROI”) metrics, which have historically served the company well. In our view, Roper Technologies has a significant runway for its differentiated merger and acquisition strategy to potentially grow the business. We think the company’s margins and CROI could continue to expand as it transitions from an industrial company to a more software aligned company. At the end of the Reporting Period, we were optimistic on what we viewed as the company’s innovative measures, disciplined capital deployment and its management’s solid execution ability. |
| | | During the Reporting Period, Level 3 Communications announced it had accepted an acquisition offer from CenturyLink, a communication services provider. Following the news, the stock’s price rose, and we decided to exit the Fund’s position in the company. |
| | | VCA announced during the Reporting Period that it had accepted a buyout offer from Mars, Inc. We had initiated a position in VCA earlier in 2016, as we believed there was positive momentum in the U.S. veterinary market, and the company’s same-store revenue growth had remained strong. We were encouraged by this acquisition news and exited the Fund’s position in VCA accordingly, taking profits after the stock surged on the announcement. |
| Q | | How did the Fund use derivatives and similar instruments during the Reporting Period? |
| A | | During the Reporting Period, we did not use derivatives as part of an active management strategy. |
| Q | | Did the Fund make any significant purchases or sales during the Reporting Period? |
| A | | We initiated a Fund position in Northern Trust, an international financial services firm. Northern Trust is a company we had previously owned in our portfolios for its high quality fundamentals, including a solid balance sheet and cash position. We believe Northern Trust is well positioned to benefit from interest rate hikes and significant organic growth opportunities within the custody and fund administration business. We are additionally positive on the company’s wealth management segment given its mix of both active and passive strategies. The company’s management has stated it expects to reinvest its earnings into the business while targeting a meaningful return on equity, which could benefit shareholders. Northern Trust also has a high payout ratio and is well capitalized, in our view. Finally, we believe Northern Trust may further benefit from potentially lower corporate tax rates. With what we consider to be an experienced management and a high quality franchise, we are optimistic on Northern Trust’s growth prospects. |
| | | We established a Fund position in financial services technology company Fiserv. The company provides products and services used to process electronic payment transactions and other account processing services. Fiserv has a strong long-term track record, and we believe is poised to accelerate organic revenue growth. We are positive on the company’s ability to continue to grow revenue and increase margins. We also look to the positive benefits that could come from potential tax reforms given its currently high tax rate. |
35
PORTFOLIO RESULTS
| | | Conversely, in addition to those sales already mentioned, we exited the Fund’s position in Fidelity National Information Services. In February 2017, the company reported fourth quarter 2016 results that were in line with market expectations but lowered its outlook for 2017. Based on this disappointing outlook, we decided to sell the Fund’s position and allocate capital into other ideas with what we believed to be more compelling risk/reward opportunities. |
| | | We eliminated the Fund’s position in McCormick & Company, a manufacturer of spices, seasoning mixes and condiments. Its stock had been a strong performer for the Fund in the first half of 2016. However, the company’s premium valuation and more conventional consumer staples characteristics left it vulnerable amidst a cyclical market rotation, in our view. Consequently, we decided to exit the position. |
| Q | | Were there any notable changes in the Fund’s weightings during the Reporting Period? |
| A | | In constructing the Fund’s portfolio, we focus on picking stocks rather than on making industry or sector bets. We seek to outpace the benchmark index by overweighting stocks that we expect to outperform and underweighting those that we think may lag. Consequently, changes in its sector weights are generally the direct result of individual stock selection or of stock appreciation or depreciation. That said, during the Reporting Period, the Fund’s exposure to financials, industrials, real estate and information technology increased and its allocations to consumer discretionary, consumer staples, health care, materials, and telecommunication services decreased relative to the Russell Index. |
| Q | | How was the Fund positioned relative to its benchmark index at the end of February 2017? |
| A | | At the end of February 2017, the Fund had overweighted positions relative to the Russell Index in the financials and industrials sectors. On the same date, the Fund had underweighted positions compared to the Russell Index in consumer discretionary, consumer staples, health care and real estate. The Fund was rather neutrally weighted to the Index in information technology, energy and materials and had no positions at all in telecommunication services and utilities at the end of the Reporting Period. |
36
FUND BASICS
Growth Opportunities Fund
as of February 28, 2017
| | | | | | | | | | |
| | PERFORMANCE REVIEW | |
| | | September 1, 2016–February 28, 2017 | | Fund Total Return (based on NAV)1 | | | Russell Midcap® Growth Index2 | |
| | Class A | | | 3.13 | % | | | 6.74 | % |
| | Class C | | | 2.72 | | | | 6.74 | |
| | Institutional | | | 3.35 | | | | 6.74 | |
| | Service | | | 3.06 | | | | 6.74 | |
| | Class IR | | | 3.30 | | | | 6.74 | |
| | Class R | | | 3.05 | | | | 6.74 | |
| | | Class R6 | | | 3.31 | | | | 6.74 | |
| | 1 | | The net asset value (“NAV”) represents the net assets of the class of the Fund (ex-dividend) divided by the total number of shares of the class outstanding. The Fund’s performance reflects the reinvestment of dividends and other distributions. The Fund’s performance does not reflect the deduction of any applicable sales charges. |
| | 2 | | The Russell Midcap® Growth Index is an unmanaged market capitalization weighted index that measures the performance of those Russell Midcap companies with higher price-to-book ratios and higher forecasted growth values. The Index figures do not reflect any deduction for fees, expenses or taxes. It is not possible to invest directly in an index. |
| | | | | | | | | | | | | | | | | | | | |
| | STANDARDIZED TOTAL RETURNS3 |
| | | For the period ended 12/31/16 | | One Year | | | Five Years | | | Ten Years | | | Since Inception | | | Inception Date |
| | Class A | | | -4.43 | % | | | 9.45 | % | | | 7.23 | % | | | 9.66 | % | | 5/24/99 |
| | Class C | | | -0.62 | | | | 9.88 | | | | 7.04 | | | | 9.19 | | | 5/24/99 |
| | Institutional | | | 1.49 | | | | 11.14 | | | | 8.27 | | | | 10.44 | | | 5/24/99 |
| | Service | | | 0.95 | | | | 10.57 | | | | 7.73 | | | | 9.89 | | | 5/24/99 |
| | Class IR | | | 1.41 | | | | 10.98 | | | | N/A | | | | 7.06 | | | 11/30/07 |
| | Class R | | | 0.90 | | | | 10.42 | | | | N/A | | | | 6.53 | | | 11/30/07 |
| | | Class R6 | | | 1.49 | | | | N/A | | | | N/A | | | | -4.48 | | | 7/31/15 |
| | 3 | | The Standardized Total Returns are average annual total returns or cumulative total returns (only if the performance period is one year or less) as of the most recent calendar quarter-end. They assume reinvestment of all distributions at NAV. These returns reflect a maximum initial sales charge of 5.5% for Class A Shares and the assumed contingent deferred sales charge for Class C Shares (1% if redeemed within 12 months of purchase). Because Institutional, Service, Class IR, Class R and Class R6 Shares do not involve a sales charge, such a charge is not applied to their Standardized Total Returns. |
The returns set forth in the tables above represent past performance. Past performance does not guarantee future results. The Fund’s investment return and principal value will fluctuate so that an investor’s shares, when redeemed, may be worth more or less than their original cost. Current performance may be lower or higher than the performance quoted above. Please visit our web site at www.GSAMFUNDS.com to obtain the most recent month-end returns. Performance reflects applicable fee waivers and/or expense limitations in effect during the periods shown. In their absence, performance would be reduced. Returns do not reflect the deduction of taxes that a shareholder would pay on Fund distributions or the redemption of Fund shares.
37
FUND BASICS
| | | | | | | | | | |
| | EXPENSE RATIOS4 | |
| | | | | Net Expense Ratio (Current) | | | Gross Expense Ratio (Before Waivers) | |
| | Class A | | | 1.32 | % | | | 1.42 | % |
| | Class C | | | 2.07 | | | | 2.17 | |
| | Institutional | | | 0.95 | | | | 1.02 | |
| | Service | | | 1.45 | | | | 1.52 | |
| | Class IR | | | 1.07 | | | | 1.17 | |
| | Class R | | | 1.57 | | | | 1.67 | |
| | | Class R6 | | | 0.93 | | | | 1.01 | |
| | 4 | | The expense ratios of the Fund, both current (net of applicable fee waivers and/or expense limitations) and before waivers (gross of applicable fee waivers and/or expense limitations) are as set forth above according to the most recent publicly available Prospectus for the Fund and may differ from the expense ratios disclosed in the Financial Highlights in this report. Pursuant to a contractual arrangement, the Fund’s waivers and/or expense limitations will remain in place through at least December 29, 2017, and prior to such date the investment adviser may not terminate the arrangements without the approval of the Fund’s Board of Trustees. If these arrangements are discontinued in the future, the expense ratios may change without shareholder approval. |
| | | | | | | | |
| | TOP TEN HOLDINGS AS OF 2/28/175 |
| | | Holding | | % of
Net Assets | | | Line of Business |
| | Roper Technologies, Inc. | | | 3.1 | % | | Industrial Conglomerates |
| | Amphenol Corp. Class A | | | 3.0 | | | Electronic Equipment, Instruments &
Components |
| | Xylem, Inc. | | | 2.7 | | | Machinery |
| | The Middleby Corp. | | | 2.5 | | | Machinery |
| | Ulta Salon, Cosmetics & Fragrance, Inc. | | | 2.5 | | | Specialty Retail |
| | Panera Bread Co. Class A | | | 2.3 | | | Hotels, Restaurants & Leisure |
| | Ross Stores, Inc. | | | 2.3 | | | Specialty Retail |
| | Northern Trust Corp. | | | 2.3 | | | Capital Markets |
| | Chipotle Mexican Grill, Inc. | | | 2.1 | | | Hotels, Restaurants & Leisure |
| | | Intuit, Inc. | | | 2.0 | | | Software |
| | 5 | | The top 10 holdings may not be representative of the Fund’s future investments. |
38
FUND BASICS
|
| FUND VS. BENCHMARK SECTOR ALLOCATION6 |
| As of February 28, 2017 |
| | 6 | | The Fund is actively managed and, as such, its composition may differ over time. Consequently, the Fund’s overall sector allocations may differ from the percentages contained in the graph above. The graph categorizes investments using the Global Industry Classification Standard (“GICS”), however, the sector classifications used by the portfolio management team may differ from GICS. The percentage shown for each investment category reflects the value of investments in that category as a percentage of market value (excluding investments in the securities lending reinvestment vehicle, if any). Investments in the securities lending reinvestment vehicle represented 0.6% of the Fund’s net assets as of February 28, 2017. The graph depicts the Fund’s investments but may not represent the Fund’s market exposure due to the exclusion of certain derivatives, if any, as listed in the Additional Investment Information section of the Schedule of Investments. |
39
PORTFOLIO RESULTS
Goldman Sachs Small/Mid Cap Growth Fund
Portfolio Composition
The Fund invests primarily in small and medium-sized growth companies with a market capitalization between $15 million and $43 billion. Since the Fund’s inception, the Goldman Sachs Growth Equity Investment Team has focused on several key investment criteria that it believes can drive a company’s growth over the long term. These characteristics are: dominant market share, established brand name, pricing power, recurring revenue stream, free cash flow, high returns on invested capital, predictable growth, sustainable growth, long product life cycle, enduring competitive advantage, favorable demographic trends and excellent management. The Team strives to purchase these companies at reasonable valuations in order to capture the full benefits of their growth.
Portfolio Management Discussion and Analysis
Below, the Goldman Sachs Growth Equity Investment Team discusses the Goldman Sachs Small/Mid Cap Growth Fund’s (the “Fund”) performance and positioning for the six-month period ended February 28, 2017 (the “Reporting Period”).
| Q | | How did the Fund perform during the Reporting Period? |
| A | | During the Reporting Period, the Fund’s Class A, C, Institutional, Service, IR, R and R6 Shares generated cumulative total returns, without sales charges, of 4.60%, 4.24%, 4.76%, 4.54%, 4.73%, 4.46% and 4.80%, respectively. These returns compare to the 8.52% cumulative total return of the Fund’s benchmark, the Russell 2500® Growth Index (with dividends reinvested) (the “Russell Index”), during the same period. |
| Q | | What key factors were responsible for the Fund’s performance during the Reporting Period? |
| A | | The Fund generated positive absolute returns, but stock selection overall detracted from the Fund’s performance relative to the Russell Index during the Reporting Period. Sector allocation as a whole also detracted, albeit much more modestly. |
| Q | | Which equity market sectors most significantly affected Fund performance? |
| A | | Detracting from relative results most during the Reporting Period were industrials, information technology and consumer discretionary, wherein stock selection was challenging. Effective stock selection in the financials, telecommunication services and energy sectors helped the Fund’s performance most relative to the Russell Index. Having an overweighted allocation to financials, which outperformed the Russell Index during the Reporting Period, also buoyed the Fund’s relative results. |
| Q | | Which stocks detracted significantly from the Fund’s performance during the Reporting Period? |
| A | | Among those stocks detracting most from the Fund’s results relative to the Russell Index were positions in food manufacturer TreeHouse Foods, clinical-stage pharmaceutical company Cempra and wireless communication towers operator SBA Communications. |
| | | Shares of TreeHouse Foods declined after the company reported mixed second quarter 2016 earnings and announced the retirement of its Chief Financial Officer. Then, in November 2016, the company reported disappointing third calendar quarter results with sales and earnings below market expectations. TreeHouse Foods also announced management changes, which, alongside plans to reorganize its sales force, led to some near-term uncertainty. Following the drop in its stock price, however, the company saw better performance, especially in February 2017 when it announced earnings that were better than the market feared, causing its stock price to regain some of the prior losses. At the end of the Reporting Period, we remained positive on TreeHouse Foods’ growth opportunities, including its acquisition of Ralcorp through which it could potentially extract long-term value for shareholders. |
| | Cempra’s shares declined following its third quarter 2016 earnings report, as the company announced disappointing test |
40
PORTFOLIO RESULTS
| | results for one of its key pipeline treatments. As a result, we exited the Fund’s position during the Reporting Period. |
| | | In our view, there were no company-specific drivers of SBA Communications’ share price weakness. Early in the Reporting Period, the company’s shares declined, as the rapid rise in interest rates following the U.S. elections was seen as a negative for the company. Its shares rallied late in the Reporting Period, as the company reported encouraging results and as demand for mobile data increased. Despite the near-term weakness, we remained positive at the end of the Reporting Period on its long-term prospects. In our view, SBA Communications should benefit from secular trends toward growing data usage and is well positioned for growth as it penetrates new markets. |
| Q | | What were some of the Fund’s best-performing individual stocks? |
| A | | Among those stocks the Fund benefited most from relative to the Russell Index were positions in veterinary clinics operator VCA, biopharmaceutical company Exelixis and investment banking advisory company Evercore Partners. |
| | | VCA announced during the Reporting Period that it had accepted a buyout offer from Mars, Inc. We had initiated a position in VCA earlier in 2016, as we believed there was positive momentum in the U.S. veterinary market, and the company’s same-store revenue growth had remained strong. We were encouraged by this acquisition news and exited the Fund’s position in VCA accordingly. |
| | | Exelixis engages in the development and commercialization of oncology treatments. Its shares gained following strong results during the Reporting Period. At the end of the Reporting Period, we remained positive on the company and believed it is a well-run and profitable oncology company that has what we consider to be attractive growth and value opportunities within its industry. |
| | | During the Reporting Period, shares of Evercore Partners gained steadily, as the company reported consecutive quarters of positive results. Evercore was a new purchase for the Fund during the Reporting Period. We expected to see Evercore Partners taking share from bulge bracket firms and other independent boutiques. (The bulge bracket comprises the world’s largest and most profitable multinational investment banks whose investment banking clients are usually large corporations, institutions, and governments.) The company had also made a conscious decision to reduce its investment management business and focus on delivering margins through higher productivity and cost control initiatives. With a meaningful share buyback and rise in dividends, Evercore Partners’ management has emphasized a focus on returning capital to shareholders. We initiated the purchase as we viewed Evercore Partners as a high quality growth company with an experienced management team and a favorable valuation. |
| Q | | How did the Fund use derivatives and similar instruments during the Reporting Period? |
| A | | During the Reporting Period, we did not use derivatives as part of an active management strategy. |
| Q | | Did the Fund make any significant purchases or sales during the Reporting Period? |
| A | | In addition to those purchases already mentioned, we initiated a Fund position in Nevro, a medical device manufacturer. We view the company as having strong growth prospects, as it works to expand its patented spinal pain treatment product into other pain remedy markets. We are encouraged by Nevro’s ability to gain market share at a rapid pace through its disruptive technology and sales efforts. Overall, we believe the company presents a favorable risk/reward opportunity. |
| | | We established a Fund position in Badger Meter. Badger Meter is a water metering and flow equipment company. We believe the company has the opportunity for accelerating growth should municipal spending recover. Additionally, we believe the company is well positioned within its industry, which has seen some signs of consolidation. |
| | | Conversely, in addition to those sales mentioned earlier, we eliminated the Fund’s position in McCormick & Company, a manufacturer of spices, seasoning mixes and condiments. Its stock had been a strong performer for the Fund in the first half of 2016. However, the company’s premium valuation and more conventional consumer staples characteristics left it vulnerable amidst a cyclical market rotation, in our view. Consequently, we decided to exit the position. |
41
PORTFOLIO RESULTS
| Q | | Were there any notable changes in the Fund’s weightings during the Reporting Period? |
| A | | In constructing the Fund’s portfolio, we focus on picking stocks rather than on making industry or sector bets. We seek to outpace the benchmark index by overweighting stocks that we expect to outperform and underweighting those that we think may lag. Consequently, changes in its sector weights are generally the direct result of individual stock selection or of stock appreciation or depreciation. That said, during the Reporting Period, the Fund’s exposure to financials, industrials and information technology increased and its allocations to consumer discretionary, consumer staples, health care, materials and telecommunication services decreased relative to the Russell Index. The Fund’s position in cash increased during the Reporting Period. |
| Q | | How was the Fund positioned relative to its benchmark index at the end of February 2017? |
| A | | At the end of February 2017, the Fund had an overweighted position relative to the Russell Index in the financials, information technology and consumer staples sectors. On the same date, the Fund had underweighted positions compared to the Russell Index in consumer discretionary, health care and real estate. The Fund was rather neutrally weighted to the Index in energy, industrials and materials and had no positions at all in telecommunication services and utilities at the end of the Reporting Period. |
42
FUND BASICS
Small/Mid Cap Growth Fund
as of February 28, 2017

| | | | | | | | | | |
| | PERFORMANCE REVIEW | |
| | | September 1, 2016–February 28, 2017 | | Fund Total Return (based on NAV)1 | | | Russell 2500® Growth Index2 | |
| | Class A | | | 4.60 | % | | | 8.52 | % |
| | Class C | | | 4.24 | | | | 8.52 | |
| | Institutional | | | 4.76 | | | | 8.52 | |
| | Service | | | 4.54 | | | | 8.52 | |
| | Class IR | | | 4.73 | | | | 8.52 | |
| | Class R | | | 4.46 | | | | 8.52 | |
| | | Class R6 | | | 4.80 | | | | 8.52 | |
| | 1 | | The net asset value (“NAV”) represents the net assets of the class of the Fund (ex-dividend) divided by the total number of shares of the class outstanding. The Fund’s performance reflects the reinvestment of dividends and other distributions. The Fund’s performance does not reflect the deduction of any applicable sales charges. |
| | 2 | | The Russell 2500® Growth Index is an unmanaged index that measures the performance of the small to mid-cap growth segment of the US equity universe. The Russell 2500® Growth Index is constructed to provide a comprehensive and unbiased barometer of the small- to mid-cap growth market. Based on ongoing empirical research of investment manager behavior, the methodology used to determine growth probability approximates the aggregate small- to mid-cap growth manager’s opportunity set. The Index figures do not reflect any deduction for fees, expenses or taxes. It is not possible to invest directly in an index. |
| | | | | | | | | | | | | | | | | | | | |
| | STANDARDIZED TOTAL RETURNS3 |
| | | For the period ended 12/31/16 | | One Year | | | Five Years | | | Ten Years | | | Since Inception | | | Inception Date |
| | Class A | | | -5.74 | % | | | 11.03 | % | | | 8.23 | % | | | 8.75 | % | | 6/30/05 |
| | Class C | | | -2.01 | | | | 11.44 | | | | 8.02 | | | | 8.43 | | | 6/30/05 |
| | Institutional | | | 0.11 | | | | 12.73 | | | | 9.27 | | | | 9.68 | | | 6/30/05 |
| | Service | | | -0.35 | | | | 12.15 | | | | 8.73 | | | | 9.13 | | | 6/30/05 |
| | Class IR | | | 0.01 | | | | 12.56 | | | | N/A | | | | 8.16 | | | 11/30/07 |
| | Class R | | | -0.52 | | | | 12.00 | | | | N/A | | | | 7.62 | | | 11/30/07 |
| | | Class R6 | | | 0.16 | | | | N/A | | | | N/A | | | | -7.30 | | | 7/31/15 |
| | 3 | | The Standardized Total Returns are average annual total returns or cumulative total returns (only if the performance period is one year or less) as of the most recent calendar quarter-end. They assume reinvestment of all distributions at NAV. These returns reflect a maximum initial sales charge of 5.5% for Class A Shares and the assumed contingent deferred sales charge for Class C Shares (1% if redeemed within 12 months of purchase). Because Institutional, Service, Class IR, Class R and Class R6 Shares do not involve a sales charge, such a charge is not applied to their Standardized Total Returns. |
The returns set forth in the tables above represent past performance. Past performance does not guarantee future results. The Fund’s investment return and principal value will fluctuate so that an investor’s shares, when redeemed, may be worth more or less than their original cost. Current performance may be lower or higher than the performance quoted above. Please visit our web site at www.GSAMFUNDS.com to obtain the most recent month-end returns. Performance reflects applicable fee waivers and/or expense limitations in effect during the periods shown. In their absence, performance would be reduced. Returns do not reflect the deduction of taxes that a shareholder would pay on Fund distributions or the redemption of Fund shares.
43
FUND BASICS
| | | | | | | | | | |
| | EXPENSE RATIOS4 | |
| | | | | Net Expense Ratio (Current) | | | Gross Expense Ratio (Before Waivers) | |
| | Class A | | | 1.31 | % | | | 1.45 | % |
| | Class C | | | 2.06 | | | | 2.20 | |
| | Institutional | | | 0.93 | | | | 1.05 | |
| | Service | | | 1.43 | | | | 1.55 | |
| | Class IR | | | 1.06 | | | | 1.20 | |
| | Class R | | | 1.56 | | | | 1.70 | |
| | | Class R6 | | | 0.92 | | | | 1.04 | |
| | 4 | | The expense ratios of the Fund, both current (net of applicable fee waivers and/or expense limitations) and before waivers (gross of applicable fee waivers and/or expense limitations) are as set forth above according to the most recent publicly available Prospectus for the Fund and may differ from the expense ratios disclosed in the Financial Highlights in this report. Pursuant to a contractual arrangement, the Fund’s waivers and/or expense limitations will remain in place through at least December 29, 2017, and prior to such date the investment adviser may not terminate the arrangements without the approval of the Fund’s Board of Trustees. If these arrangements are discontinued in the future, the expense ratios may change without shareholder approval. |
| | | | | | | | |
| | TOP TEN HOLDINGS AS OF 2/28/175 |
| | | Holding | | % of Net Assets | | | Line of Business |
| | Xylem, Inc. | | | 2.6 | % | | Machinery |
| | RPM International, Inc. | | | 2.3 | | | Chemicals |
| | The Middleby Corp. | | | 2.3 | | | Machinery |
| | Panera Bread Co. Class A | | | 2.2 | | | Hotels, Restaurants & Leisure |
| | Global Payments, Inc. | | | 2.1 | | | IT Services |
| | Electronics For Imaging, Inc. | | | 2.1 | | | Technology Hardware, Storage &
Peripherals |
| | Black Knight Financial Services, Inc. Class A | | | 2.0 | | | IT Services |
| | Lazard Ltd. Class A | | | 2.0 | | | Capital Markets |
| | Healthcare Services Group, Inc. | | | 1.8 | | | Commercial Services & Supplies |
| | | Eagle Bancorp, Inc. | | | 1.8 | | | Banks |
| | 5 | | The top 10 holdings may not be representative of the Fund’s future investments. |
44
FUND BASICS
|
| FUND VS. BENCHMARK SECTOR ALLOCATION6 |
| As of February 28, 2017 |
| | 6 | | The Fund is actively managed and, as such, its composition may differ over time. Consequently, the Fund’s overall sector allocations may differ from the percentages contained in the graph above. The graph categorizes investments using the Global Industry Classification Standard (“GICS”), however, the sector classifications used by the portfolio management team may differ from GICS. The percentage shown for each investment category reflects the value of investments in that category as a percentage of market value (excluding investments in the securities lending reinvestment vehicle, if any). Investments in the securities lending reinvestment vehicle represented 1.6% of the Fund’s net assets as of February 28, 2017. The graph depicts the Fund’s investments but may not represent the Fund’s market exposure due to the exclusion of certain derivatives, if any, as listed in the Additional Investment Information section of the Schedule of Investments. |
45
PORTFOLIO RESULTS
Goldman Sachs Strategic Growth Fund
Portfolio Composition
The Fund invests primarily in U.S. equity investments. The Fund is more selective and focused than many mutual funds and there are typically 50 to 70 holdings in the portfolio. Since the Fund’s inception, the Goldman Sachs Growth Equity Investment Team has focused on several key investment criteria that it believes can drive a company’s growth over the long term. These characteristics are: dominant market share, established brand name, pricing power, recurring revenue stream, free cash flow, high returns on invested capital, predictable growth, sustainable growth, long product life cycle, enduring competitive advantage, favorable demographic trends and excellent management. The Team strives to purchase these companies at reasonable valuations in order to capture the full benefits of their growth.
Portfolio Management Discussion and Analysis
Below, the Goldman Sachs Growth Equity Investment Team discusses the Goldman Sachs Strategic Growth Fund’s (the “Fund”) performance and positioning for the six-month period ended February 28, 2017 (the “Reporting Period”).
| Q | | How did the Fund perform during the Reporting Period? |
| A | | During the Reporting Period, the Fund’s Class A, C, Institutional, Service, IR, R and R6 Shares generated cumulative total returns, without sales charges, of 7.62%, 7.27%, 7.91%, 7.61%, 7.86%, 7.57% and 7.93%, respectively. These returns compare to the 9.15% cumulative total return of the Fund’s benchmark, the Russell 1000® Growth Index (with dividends reinvested) (the “Russell Index”), during the same period. |
| Q | | What key factors were responsible for the Fund’s performance during the Reporting Period? |
| A | | The Fund posted solid absolute gains, but stock selection and sector allocation overall detracted from the Fund’s performance relative to the Russell Index during the Reporting Period. |
| Q | | Which equity market sectors most significantly affected Fund performance? |
| A | | Challenging stock selection in health care, information technology and industrials detracted from the Fund’s relative results most during the Reporting Period. The only two sectors that contributed positively to the Fund’s relative performance during the Reporting Period were consumer discretionary and consumer staples, wherein effective stock selection drove results. |
| Q | | Which stocks detracted significantly from the Fund’s performance during the Reporting Period? |
| A | | Among the stocks detracting most from the Fund’s results relative to the Russell Index were positions in pharmaceutical distribution services and medical supplies provider McKesson, water and wastewater applications services provider Xylem and health care equipment and services company Abbott Laboratories. |
| | | Shares of McKesson declined after it reported fiscal second quarter 2017 results with earnings per share well below consensus estimates and its management reduced its 2017 earnings per share guidance. The health care sector in general has seen increased scrutiny over drug pricing procedures, creating a difficult environment to create value. While we continue to like the company, greater uncertainty in the near term led us to exit the position and allocate the capital to positions that have a more compelling risk/reward outlook, in our view. |
| | | We believe the weakness in Xylem during the Reporting Period was less company specific and more related to an ongoing rotation into more cyclical stocks following the November U.S. elections. Despite the weakness, we remained positive on Xylem at the end of the Reporting Period and believed the company may benefit from secular growth and the recovery of utility spending. Additionally, we were optimistic about Xylem’s margin expansion prospects |
46
PORTFOLIO RESULTS
| | and believed its management team has done well to position the company for sustainable long-term growth. |
| | | Abbott Laboratories’ share price experienced weakness in October 2016 when it was disclosed that St. Jude, a pending acquisition of the company, was experiencing premature battery depletion in some of its devices. Also in October 2016, Abbott Laboratories announced third calendar quarter earnings that were generally in line with market consensus. The company’s share price continued to experience weakness over acquisition-related news, along with foreign exchange headwinds and market growth deterioration in its pediatric nutrition segment in China. Although we continue to believe Abbott Laboratories is a growing business that capitalizes on strong execution, we exited the Fund’s position to invest in companies we considered to have a more favorable risk/reward profile. |
| Q | | What were some of the Fund’s best-performing individual stocks? |
| A | | Among those stocks the Fund benefited most from relative to the Russell Index were positions in transportation provider CSX, information technology giant Apple and digital media streaming company Netflix. |
| | | CSX, a new position for the Fund during the Reporting Period, provides rail, intermodal, domestic container shipping and contract logistics services around the world. Since being added to the Fund’s portfolio during the fourth quarter of 2016, the company saw its stock price spike in January 2017, as Canadian Pacific Chief Executive Officer, Hunter Harrison, resigned and was reportedly seeking a senior management position at CSX. The market viewed the potential move positively given Harrison’s strong reputation. The company also reported results that beat market expectations on revenues but slightly missed on earnings. In our view, CSX’s focus on margin expansion initiatives could be supportive of growth alongside a free cash flow inflection following investments in locomotives. We believe CSX is well positioned to benefit from a possible inflationary environment given its cyclical business model and also from potential tax reforms given its currently high tax rate. Overall, at the end of the Reporting Period, we were optimistic about CSX’s growth prospects, operation improvement potential and strong free cash flow generation. |
| | | Apple’s quarterly earnings during the Reporting Period were generally in line with market expectations on revenues and earnings per share, and its management remained constructive about guidance. During the Reporting Period, Apple launched the iPhone 7 as well as other products such as the new Apple watch and wireless earbuds. At the end of the Reporting Period, we continued to see a number of strong growth catalysts for Apple, including solid iPhone 7 and iPhone 7 Plus demand as well as ongoing product innovation and development. In our view, the company continues to deliver strong services growth, which we believe is important, as this decreases transactional volatility tied to product cycles. At the end of the Reporting Period, we remained optimistic on Apple’s significant installed base, experienced management, established brand name and continued innovation. |
| | | During the Reporting Period, shares of Netflix gained sharply following exceptionally strong third and fourth quarter 2016 results with revenues and earnings that were well ahead of market expectations. Importantly, subscriber growth across both domestic and international markets was strong. At the end of the Reporting Period, we remained positive on Netflix as the market leader within the digital media streaming industry, offering a convenient way to consume content without the burden of ownership. We further believed the company was well positioned to capture subscriber growth globally. |
| Q | | How did the Fund use derivatives and similar instruments during the Reporting Period? |
| A | | During the Reporting Period, we did not use derivatives as part of an active management strategy. |
| Q | | Did the Fund make any significant purchases or sales during the Reporting Period? |
| A | | In addition to those purchases already mentioned, we established a Fund position in media and entertainment company Walt Disney & Co. As the outlook for U.S. economic growth improved for many following the U.S. elections, we were positive on the ability of the company to capitalize on the potential opportunities, especially in their theme park revenue. We also felt some of the perceived risks surrounding its ESPN business were overstated. In our view, Disney has a strong balance sheet, robust free cash flow and earnings growth and remains committed to buying back shares. We are positive on the company moving forward and on its potential for sustained growth. |
| | | We initiated a Fund position in Northern Trust, an international financial services firm. Northern Trust is a company we had previously owned in our portfolios for its high quality fundamentals, including a solid balance sheet |
47
PORTFOLIO RESULTS
| | and cash position. We believe Northern Trust is well positioned to benefit from interest rate hikes and significant organic growth opportunities within the custody and fund administration business. We are additionally positive on the company’s wealth management segment given its mix of both active and passive strategies. The company’s management has stated it expects to reinvest its earnings into the business while targeting a meaningful return on equity, which could benefit shareholders. Northern Trust also has a high payout ratio and is well capitalized, in our view. Finally, we believe Northern Trust may further benefit from potentially lower corporate tax rates. With what we consider to be an experienced management and a high quality franchise, we are optimistic on Northern Trust’s growth prospects. |
| | | The two biggest sales by the Fund during the Reporting Period were those of Abbott Laboratories and McKesson, each mentioned earlier. |
| Q | | Were there any notable changes in the Fund’s weightings during the Reporting Period? |
| A | | In constructing the Fund’s portfolio, we focus on picking stocks rather than on making industry or sector bets. We seek to outpace the benchmark index by overweighting stocks that we expect to outperform and underweighting those that we think may lag. Consequently, changes in its sector weights are generally the direct result of individual stock selection or of stock appreciation or depreciation. That said, during the Reporting Period, the Fund’s exposure to consumer discretionary and financials increased and its allocations to health care, information technology and real estate decreased relative to the Russell Index. The Fund’s position in cash also decreased during the Reporting Period. |
| Q | | How was the Fund positioned relative to its benchmark index at the end of February 2017? |
| A | | At the end of February 2017, the Fund had an overweighted position relative to the Russell Index in the financials and energy sectors. On the same date, the Fund had underweighted positions compared to the Russell Index in health care and materials. The Fund was rather neutrally weighted to the Russell Index in consumer discretionary, consumer staples, information technology, industrials and real estate and had no positions at all in utilities and telecommunication services at the end of the Reporting Period. |
48
FUND BASICS
Strategic Growth Fund
as of February 28, 2017
| | | | | | | | | | |
| | PERFORMANCE REVIEW | |
| | | September 1, 2016–February 28, 2017 | | Fund Total Return (based on NAV)1 | | | Russell 1000® Growth Index2 | |
| | Class A | | | 7.62 | % | | | 9.15 | % |
| | Class C | | | 7.27 | | | | 9.15 | |
| | Institutional | | | 7.91 | | | | 9.15 | |
| | Service | | | 7.61 | | | | 9.15 | |
| | Class IR | | | 7.86 | | | | 9.15 | |
| | Class R | | | 7.57 | | | | 9.15 | |
| | | Class R6 | | | 7.93 | | | | 9.15 | |
| | 1 | | The net asset value (“NAV”) represents the net assets of the class of the Fund (ex-dividend) divided by the total number of shares of the class outstanding. The Fund’s performance reflects the reinvestment of dividends and other distributions. The Fund’s performance does not reflect the deduction of any applicable sales charges. |
| | 2 | | The Russell 1000® Growth Index is an unmanaged index that measures the performance of those Russell 1000® companies with higher price-to-book ratios and higher forecasted growth values. The Index figures do not reflect any deduction for fees, expenses or taxes. It is not possible to invest directly in an index. |
| | | | | | | | | | | | | | | | | | | | | | |
| | STANDARDIZED TOTAL RETURNS3 | |
| | | For the period ended 12/31/16 | | One Year | | | Five Years | | | Ten Years | | | Since Inception | | | Inception Date | |
| | Class A | | | -4.28 | % | | | 11.98 | % | | | 6.04 | % | | | 3.20 | % | | | 5/24/99 | |
| | Class C | | | -0.34 | | | | 12.41 | | | | 5.84 | | | | 2.77 | | | | 5/24/99 | |
| | Institutional | | | 1.70 | | | | 13.70 | | | | 7.05 | | | | 3.95 | | | | 5/24/99 | |
| | Service | | | 1.26 | | | | 13.16 | | | | 6.58 | | | | 3.52 | | | | 5/24/99 | |
| | Class IR | | | 1.65 | | | | 13.54 | | | | N/A | | | | 13.50 | | | | 1/06/09 | |
| | Class R | | | 1.07 | | | | 13.02 | | | | N/A | | | | 12.99 | | | | 1/06/09 | |
| | | Class R6 | | | 1.80 | | | | N/A | | | | N/A | | | | -0.62 | | | | 7/31/15 | |
| | 3 | | The Standardized Total Returns are average annual total returns or cumulative total returns (only if the performance period is one year or less) as of the most recent calendar quarter-end. They assume reinvestment of all distributions at NAV. These returns reflect a maximum initial sales charge of 5.5% for Class A Shares and the assumed contingent deferred sales charge for Class C Shares (1% if redeemed within 12 months of purchase). Because Institutional, Service, Class IR, Class R and Class R6 Shares do not involve a sales charge, such a charge is not applied to their Standardized Total Returns. |
The returns set forth in the tables above represent past performance. Past performance does not guarantee future results. The Fund’s investment return and principal value will fluctuate so that an investor’s shares, when redeemed, may be worth more or less than their original cost. Current performance may be lower or higher than the performance quoted above. Please visit our web site at www.GSAMFUNDS.com to obtain the most recent month-end returns. Performance reflects applicable fee waivers and/or expense limitations in effect during the periods shown. In their absence, performance would be reduced. Returns do not reflect the deduction of taxes that a shareholder would pay on Fund distributions or the redemption of Fund shares.
49
FUND BASICS
| | | | | | | | | | |
| | EXPENSE RATIOS4 | |
| | | | | Net Expense Ratio (Current) | | | Gross Expense Ratio (Before Waivers) | |
| | Class A | | | 1.15 | % | | | 1.54 | % |
| | Class C | | | 1.90 | | | | 2.29 | |
| | Institutional | | | 0.75 | | | | 1.14 | |
| | Service | | | 1.25 | | | | 1.64 | |
| | Class IR | | | 0.90 | | | | 1.29 | |
| | Class R | | | 1.40 | | | | 1.79 | |
| | | Class R6 | | | 0.76 | | | | 1.15 | |
| | 4 | | The expense ratios of the Fund, both current (net of applicable fee waivers and/or expense limitations) and before waivers (gross of applicable fee waivers and/or expense limitations) are as set forth above according to the most recent publicly available Prospectus for the Fund and may differ from the expense ratios disclosed in the Financial Highlights in this report. Pursuant to a contractual arrangement, the Fund’s waivers and/or expense limitations will remain in place through at least December 29, 2017, and prior to such date the investment adviser may not terminate the arrangements without the approval of the Fund’s Board of Trustees. If these arrangements are discontinued in the future, the expense ratios may change without shareholder approval. |
| | | | | | | | |
| | TOP TEN HOLDINGS AS OF 2/28/175 |
| | | Holding | | % of Net Assets | | | Line of Business |
| | Apple, Inc. | | | 7.2 | % | | Technology Hardware, Storage &
Peripherals |
| | Microsoft Corp. | | | 4.3 | | | Software |
| | Facebook, Inc. Class A | | | 3.8 | | | Internet Software & Services |
| | Amazon.com, Inc. | | | 3.8 | | | Internet & Direct Marketing Retail |
| | Alphabet, Inc. Class A | | | 3.1 | | | Internet Software & Services |
| | Costco Wholesale Corp. | | | 2.7 | | | Food & Staples Retailing |
| | Comcast Corp. Class A | | | 2.6 | | | Media |
| | MasterCard, Inc. Class A | | | 2.3 | | | IT Services |
| | Alphabet, Inc. Class C | | | 2.3 | | | Internet Software & Services |
| | | Eli Lilly & Co. | | | 2.1 | | | Pharmaceuticals |
| | 5 | | The top 10 holdings may not be representative of the Fund’s future investments. |
50
FUND BASICS
|
| FUND VS. BENCHMARK SECTOR ALLOCATION6 |
| As of February 28, 2017 |
| | 6 | | The Fund is actively managed and, as such, its composition may differ over time. Consequently, the Fund’s overall sector allocations may differ from the percentages contained in the graph above. The graph categorizes investments using the Global Industry Classification Standard (“GICS”), however, the sector classifications used by the portfolio management team may differ from GICS. The percentage shown for each investment category reflects the value of investments in that category as a percentage of market value (excluding investments in the securities lending reinvestment vehicle, if any). Investments in the securities lending reinvestment vehicle represented 0.4% of the Fund’s net assets as of February 28, 2017. The graph depicts the Fund’s investments but may not represent the Fund’s market exposure due to the exclusion of certain derivatives, if any, as listed in the Additional Investment Information section of the Schedule of Investments. |
51
PORTFOLIO RESULTS
Goldman Sachs Technology Opportunities Fund
Portfolio Composition
The Fund invests, under normal circumstances, at least 80% of its net assets plus any borrowing for investment purposes (measured at time of purchase) in equity investments in technology companies. The Fund seeks to achieve its investment objective by investing, under normal circumstances, in approximately 30-40 companies that are considered by the Investment Adviser to benefit from the proliferation of technology. Although the Fund invests primarily in publicly traded U.S. securities, it may invest up to 25% of its total assets measured at the time of purchase in foreign securities, including securities of issuers in countries with emerging markets or economies and securities quoted in foreign currencies. The Fund may also invest in privately held companies and companies that only recently began to trade publicly.
Portfolio Management Discussion and Analysis
Below, the Goldman Sachs Growth Equity Investment Team discusses the Goldman Sachs Technology Opportunities Fund’s (the “Fund”) performance and positioning for the six-month period ended February 28, 2017 (the “Reporting Period”).
| Q | | How did the Fund perform during the Reporting Period? |
| A | | During the Reporting Period, the Fund’s Class A, C, Institutional, Service and IR Shares generated cumulative total returns, without sales charges, of 9.83%, 9.39%, 10.01%, 9.71% and 9.92%, respectively. These returns compare to the 13.09% cumulative total return of the Fund’s benchmark, the S&P North American Technology Sector Index (the “S&P Technology Index”), during the same period. |
| Q | | What key factors were responsible for the Fund’s performance during the Reporting Period? |
| A | | The Fund generated positive absolute returns, but stock selection overall detracted from the Fund’s performance relative to the S&P Technology Index during the Reporting Period. Sector allocation as a whole also detracted, albeit more modestly. |
| Q | | Which equity market sectors most significantly affected Fund performance? |
| A | | As both the Fund and the S&P Technology Index have the majority of their respective assets allocated to the information technology sector, broad equity market sector performance generally does not have a meaningful impact on relative performance. That said, detracting most from the Fund’s relative results was weak stock selection in information technology and having exposure to the real estate and financials sectors, which are not components of the S&P Technology Index but which lagged the S&P Technology Index during the Reporting Period. Having exposure to the telecommunication services sector, which is not a component of the S&P Technology Index but which outperformed the S&P Technology Index during the Reporting Period, buoyed the Fund’s relative results most. |
| Q | | Which stocks detracted significantly from the Fund’s performance during the Reporting Period? |
| A | | Detracting most from the Fund’s results relative to the S&P Technology Index were positions in wireless communications and broadcast tower real estate investment trust American Tower, wireless communication towers operator SBA Communications and social networking, user review and local search website operator Yelp. |
| | | American Tower was the top detractor from the Fund’s relative results during the Reporting Period. In our view, there were no company-specific drivers of its weakness. Early in the Reporting Period, the company’s shares declined, as the rapid rise in interest rates following the U.S. elections was seen as a negative for the company. American Tower’s stock rallied late in the Reporting Period as the company reported encouraging results and as demand for mobile data increased. Despite its shares’ decline for the Reporting Period overall, at the end of the Reporting Period, we believed American Tower may benefit going forward from secular trends toward growing data usage, taking advantage of its dominant market share, global expansion and additional investment opportunities to fuel long-term growth. With recurring revenue streams and strong organic leasing growth, at what we consider to be an attractive |
52
PORTFOLIO RESULTS
| | valuation relative to its peers, we believe American Tower is a high quality and durable growth company. |
| | | Similarly, in our view, there were no company-specific drivers of SBA Communications’ share price weakness. Early in the Reporting Period, the company’s shares declined, as the rapid rise in interest rates following the U.S. elections was seen as a negative for the company. Its shares rallied late in the Reporting Period, as the company reported encouraging results and as demand for mobile data increased. Despite the near-term weakness, we remained positive at the end of the Reporting Period on its long-term prospects. In our view, SBA Communications should benefit from secular trends toward growing data usage and is well positioned for growth as it penetrates new markets. |
| | | Shares of Yelp, a new position for the Fund during the Reporting Period, declined after the company reported mixed fourth quarter 2016 earnings with guidance below market expectations. The company also announced that its sales force had decreased during the Reporting Period, which investors viewed negatively. Despite its share price decline, at the end of the Reporting Period, we viewed Yelp favorably, as the company continues to transition its business to become more transactional, supported by the launch of its Request a Quote product, which we believe has strong potential upside. |
| Q | | What were some of the Fund’s best-performing individual stocks? |
| A | | Among those stocks the Fund benefited most from relative to the S&P Technology Index were positions in integrated communications services provider Level 3 Communications, cloud-based services provider ServiceNow and semiconductor company NXP Semiconductors. |
| | | During the Reporting Period, Level 3 Communications announced it had accepted an acquisition offer from CenturyLink, a communication services provider. Following the news, the stock’s price rose, and we decided to exit the Fund’s position in the company. |
| | | ServiceNow provides cloud-based services to automate enterprise information technology operators. During the Reporting Period, the company reported positive third and fourth quarter 2016 results, with revenues and earnings ahead of market estimates. Such results were driven by a number of large deals, increasing add-on sales and growing success in the company’s new Inspire program, which helps organizations improve their platforms. The company also gave positive guidance that beat market expectations across its key metrics. At the end of the Reporting Period, we continued to believe ServiceNow is a high quality growth business in the software space and that the company may well generate shareholder value through its product pipeline and acquisition synergies. |
| | Shares of NXP Semiconductors gained sharply early in the Reporting Period following the announcement by Qualcomm that it would acquire NXP Semiconductors. Our thesis was that the company was a high quality franchise with a diverse opportunity set, differentiated product lineup and effective management team. We believed these factors positioned the company well for long-term growth. |
| Q | | How did the Fund use derivatives and similar instruments during the Reporting Period? |
| A | | During the Reporting Period, we did not use derivatives as part of an active management strategy. |
| Q | | Did the Fund make any significant purchases or sales during the Reporting Period? |
| A | | In addition to those purchases already mentioned, we initiated a Fund position in Global Payments, a provider of payment technology services. In January 2017, the company reported fiscal first quarter results that slightly beat market expectations. The highlights of its earnings were good operating margins, particularly in the U.S., and accelerating organic revenue growth. In our view, there are multiple levers the company can utilize to deliver earnings growth — cost synergies and pricing opportunities at Heartland, which the company acquired, and capital allocation via joint ventures and share repurchases. We sought to take advantage of the pullback in technology stocks to invest in what we believe is a high quality growth company at an attractive valuation. |
| | | We added Total System Services to the Fund’s portfolio during the Reporting Period. Total System Services provides electronic payment processing services to banks and other financial institutions. When we initiated a Fund position in the company, we viewed it as a high quality payments franchise that was trading at a depressed valuation due to several short-term headwinds. The company performed well during the Reporting Period, and we remained positive on its outlook at the end of the Reporting Period. |
53
PORTFOLIO RESULTS
| | Conversely, in addition to those sales mentioned earlier, we exited the Fund’s position in LinkedIn. In early June 2016, Microsoft announced its acquisition of LinkedIn. We were encouraged to have our view validated through this news, as we previously held conviction in LinkedIn’s unique business offering, competitive position and long-term growth potential. We sold the position accordingly and allocated the capital to other high conviction ideas. |
| Q | | Were there any notable changes in the Fund’s weightings during the Reporting Period? |
| A | | In constructing the Fund’s portfolio, we focus on picking stocks rather than on making industry or sector bets. We seek to outpace the benchmark index by overweighting stocks that we expect to outperform and underweighting those that we think may lag. Consequently, changes in its sector weights are generally the direct result of individual stock selection or of stock appreciation or depreciation. That said, during the Reporting Period, the Fund’s exposure to information technology increased and its exposure to consumer discretionary decreased relative to the S&P Technology Index. The Fund’s position in cash also decreased during the Reporting Period, and its exposure to telecommunication services decreased. |
| Q | | How was the Fund positioned relative to its benchmark index at the end of February 2017? |
| A | | At the end of February 2017, the Fund’s was underweighted relative to the S&P Technology Index in the information technology sector and was rather neutrally weighted to the S&P Technology Index in the consumer discretionary sector, the only other component of the S&P Technology Index. On the same date, the Fund had exposure to the financials and real estate sectors. The Fund had no exposure to the telecommunication services sector at the end of the Reporting Period. |
54
FUND BASICS
Technology Opportunities Fund
as of February 28, 2017
| | | | | | | | | | |
| | PERFORMANCE REVIEW | |
| | | September 1, 2016–February 28, 2017 | | Fund Total Return (based on NAV)1 | | | S&P North American Technology Sector Index2 | |
| | Class A | | | 9.83 | % | | | 13.09 | % |
| | Class C | | | 9.39 | | | | 13.09 | |
| | Institutional | | | 10.01 | | | | 13.09 | |
| | Service | | | 9.71 | | | | 13.09 | |
| | | Class IR | | | 9.92 | | | | 13.09 | |
| | 1 | | The net asset value (“NAV”) represents the net assets of the class of the Fund (ex-dividend) divided by the total number of shares of the class outstanding. The Fund’s performance reflects the reinvestment of dividends and other distributions. The Fund’s performance does not reflect the deduction of any applicable sales charges. |
| | 2 | | The S&P North American Technology Sector Index provides investors with a benchmark that represents U.S. securities classified under the Global Industry Classification Standard (“GICS”)® technology sector and Internet retail sub-industry. |
| | | | | | | | | | | | | | | | | | | | |
| | STANDARDIZED TOTAL RETURNS3 |
| | | For the period ended 12/31/16 | | One Year | | | Five Years | | | Ten Years | | | Since Inception | | | Inception Date |
| | Class A | | | 0.33 | % | | | 12.96 | % | | | 8.83 | % | | | 4.51 | % | | 10/1/99 |
| | Class C | | | 4.35 | | | | 13.40 | | | | 8.64 | | | | 4.06 | | | 10/1/99 |
| | Institutional | | | 6.56 | | | | 14.71 | | | | 9.89 | | | | 5.28 | | | 10/1/99 |
| | Service | | | 6.05 | | | | 14.14 | | | | 9.36 | | | | 4.77 | | | 10/1/99 |
| | | Class IR | | | 6.41 | | | | 14.53 | | | | N/A | | | | 11.05 | | | 9/30/10 |
| | 3 | | The Standardized Total Returns are average annual total returns or cumulative total returns (only if the performance period is one year or less) as of the most recent calendar quarter-end. They assume reinvestment of all distributions at NAV. These returns reflect a maximum initial sales charge of 5.5% for Class A Shares and the assumed contingent deferred sales charge for Class C Shares (1% if redeemed within 12 months of purchase). Because Institutional, Service and Class IR Shares do not involve a sales charge, such a charge is not applied to their Standardized Total Returns. |
The returns set forth in the tables above represent past performance. Past performance does not guarantee future results. The Fund’s investment return and principal value will fluctuate so that an investor’s shares, when redeemed, may be worth more or less than their original cost. Current performance may be lower or higher than the performance quoted above. Please visit our web site at www.GSAMFUNDS.com to obtain the most recent month-end returns. Performance reflects applicable fee waivers and/or expense limitations in effect during the periods shown. In their absence, performance would be reduced. Returns do not reflect the deduction of taxes that a shareholder would pay on Fund distributions or the redemption of Fund shares.
55
FUND BASICS
| | | | | | | | | | |
| | EXPENSE RATIOS4 | |
| | | | | Net Expense Ratio (Current) | | | Gross Expense Ratio (Before Waivers) | |
| | Class A | | | 1.39 | % | | | 1.55 | % |
| | Class C | | | 2.14 | | | | 2.30 | |
| | Institutional | | | 0.99 | | | | 1.15 | |
| | Service | | | 1.49 | | | | 1.65 | |
| | | Class IR | | | 1.14 | | | | 1.30 | |
| | 4 | | The expense ratios of the Fund, both current (net of applicable fee waivers and/or expense limitations) and before waivers (gross of applicable fee waivers and/or expense limitations) are as set forth above according to the most recent publicly available Prospectus for the Fund and may differ from the expense ratios disclosed in the Financial Highlights in this report. Pursuant to a contractual arrangement, the Fund’s waivers and/or expense limitations will remain in place through at least December 29, 2017, and prior to such date the investment adviser may not terminate the arrangements without the approval of the Fund’s Board of Trustees. If these arrangements are discontinued in the future, the expense ratios may change without shareholder approval. |
| | | | | | | | |
| | TOP TEN HOLDINGS AS OF 2/28/175 |
| | | Holding | | % of Net Assets | | | Line of Business |
| | Apple, Inc. | | | 8.4 | % | | Technology Hardware, Storage &
Peripherals |
| | Amazon.com, Inc. | | | 6.0 | | | Internet & Direct Marketing Retail |
| | Facebook, Inc. Class A | | | 5.8 | | | Internet Software & Services |
| | Alphabet, Inc. Class A | | | 4.4 | | | Internet Software & Services |
| | Alphabet, Inc. Class C | | | 4.1 | | | Internet Software & Services |
| | NXP Semiconductors NV | | | 4.0 | | | Semiconductors & Semiconductor
Equipment |
| | Microsoft Corp. | | | 3.9 | | | Software |
| | Oracle Corp. | | | 3.9 | | | Software |
| | Amphenol Corp. Class A | | | 3.6 | | | Electronic Equipment, Instruments &
Components |
| | | American Tower Corp. | | | 3.3 | | | Equity Real Estate Investment Trusts
(REITs) |
| | 5 | | The top 10 holdings may not be representative of the Fund’s future investments. |
56
FUND BASICS
|
| FUND VS. BENCHMARK SECTOR ALLOCATION6 |
| As of February 28, 2017 |
| | 6 | | The Fund is actively managed and, as such, its composition may differ over time. Consequently, the Fund’s overall sector allocations may differ from the percentages contained in the graph above. The graph categorizes investments using the Global Industry Classification Standard (“GICS”), however, the sector classifications used by the portfolio management team may differ from GICS. The percentage shown for each investment category reflects the value of investments in that category as a percentage of market value (excluding investments in the securities lending reinvestment vehicle, if any). Investments in the securities lending reinvestment vehicle represented 0.2% of the Fund’s net assets as of February 28, 2017. The graph depicts the Fund’s investments but may not represent the Fund’s market exposure due to the exclusion of certain derivatives, if any, as listed in the Additional Investment Information section of the Schedule of Investments. |
57
GOLDMAN SACHS CAPITAL GROWTH FUND
Schedule of Investments
February 28, 2017 (Unaudited)
| | | | | | | | |
Shares | | | Description | | Value | |
| | | | | | | | |
| Common Stocks – 99.6% | |
| Aerospace & Defense – 3.2% | |
| | 28,994 | | | General Dynamics Corp. | | $ | 5,503,351 | |
| | 25,523 | | | Northrop Grumman Corp. | | | 6,306,478 | |
| | 88,647 | | | The Boeing Co. | | | 15,976,849 | |
| | | | | | | | |
| | | | | | | 27,786,678 | |
| | |
| Air Freight & Logistics – 0.6% | |
| | 27,652 | | | FedEx Corp. | | | 5,336,283 | |
| | |
| Auto Components – 0.2% | |
| | 48,179 | | | BorgWarner, Inc. | | | 2,032,672 | |
| | |
| Banks – 0.8% | |
| | 24,373 | | | First Republic Bank | | | 2,286,919 | |
| | 71,821 | | | SunTrust Banks, Inc. | | | 4,272,631 | |
| | | | | | | | |
| | | | | | | 6,559,550 | |
| | |
| Beverages – 3.2% | |
| | 196,514 | | | Brown-Forman Corp. Class B | | | 9,582,023 | |
| | 81,078 | | | Molson Coors Brewing Co. Class B | | | 8,139,420 | |
| | 136,607 | | | Monster Beverage Corp.* | | | 5,660,994 | |
| | 92,227 | | | The Coca-Cola Co. | | | 3,869,845 | |
| | | | | | | | |
| | | | | | | 27,252,282 | |
| | |
| Biotechnology – 3.6% | |
| | 55,403 | | | Alkermes PLC* | | | 3,130,269 | |
| | 78,765 | | | Celgene Corp.* | | | 9,728,265 | |
| | 67,824 | | | Gilead Sciences, Inc. | | | 4,780,235 | |
| | 59,146 | | | Incyte Corp.* | | | 7,872,333 | |
| | 66,251 | | | Vertex Pharmaceuticals, Inc.* | | | 6,003,666 | |
| | | | | | | | |
| | | | | | | 31,514,768 | |
| | |
| Building Products – 1.0% | |
| | 155,359 | | | Fortune Brands Home & Security, Inc. | | | 8,984,411 | |
| | |
| Capital Markets – 2.9% | |
| | 32,758 | | | Affiliated Managers Group, Inc. | | | 5,501,051 | |
| | 103,378 | | | Intercontinental Exchange, Inc. | | | 5,905,985 | |
| | 70,124 | | | Lazard Ltd. Class A | | | 3,019,539 | |
| | 69,370 | | | Northern Trust Corp. | | | 6,059,470 | |
| | 36,232 | | | S&P Global, Inc. | | | 4,690,957 | |
| | | | | | | | |
| | | | | | | 25,177,002 | |
| | |
| Chemicals – 2.6% | |
| | 59,527 | | | Ashland Global Holdings, Inc. | | | 7,182,528 | |
| | 62,964 | | | RPM International, Inc. | | | 3,355,351 | |
| | 31,485 | | | The Sherwin-Williams Co. | | | 9,714,382 | |
| | 101,760 | | | Valvoline, Inc.(a) | | | 2,281,459 | |
| | | | | | | | |
| | | | | | | 22,533,720 | |
| | |
| Consumer Finance* – 0.3% | |
| | 199,124 | | | SLM Corp. | | | 2,387,497 | |
| | |
| Containers & Packaging – 0.7% | |
| | 74,427 | | | Avery Dennison Corp. | | | 6,007,003 | |
| | |
| Electrical Equipment* – 0.3% | |
| | 68,787 | | | Sensata Technologies Holding NV | | | 2,823,706 | |
| | |
| Electronic Equipment, Instruments & Components – 0.7% | |
| | 86,363 | | | Amphenol Corp. Class A | | | 5,977,183 | |
| | |
| | | | | | | | |
| Common Stocks – (continued) | |
| Energy Equipment & Services – 0.3% | |
| | 36,588 | | | Schlumberger Ltd. | | | 2,940,212 | |
| | |
| Equity Real Estate Investment Trusts (REITs) – 2.0% | |
| | 85,922 | | | American Tower Corp. | | | 9,862,986 | |
| | 19,235 | | | Equinix, Inc. | | | 7,233,707 | |
| | | | | | | | |
| | | | | | | 17,096,693 | |
| | |
| Food & Staples Retailing – 2.7% | |
| | 78,844 | | | Costco Wholesale Corp. | | | 13,969,580 | |
| | 88,293 | | | Walgreens Boots Alliance, Inc. | | | 7,626,749 | |
| | 57,750 | | | Whole Foods Market, Inc. | | | 1,771,193 | |
| | | | | | | | |
| | | | | | | 23,367,522 | |
| | |
| Food Products – 1.1% | |
| | 117,284 | | | Blue Buffalo Pet Products, Inc.* | | | 2,866,421 | |
| | 77,375 | | | Snyder’s-Lance, Inc. | | | 3,062,502 | |
| | 14,841 | | | The Kraft Heinz Co. | | | 1,358,100 | |
| | 26,769 | | | TreeHouse Foods, Inc.* | | | 2,277,507 | |
| | | | | | | | |
| | | | | | | 9,564,530 | |
| | |
| Health Care Equipment & Supplies – 3.2% | |
| | 305,510 | | | Boston Scientific Corp.* | | | 7,500,271 | |
| | 18,058 | | | C.R. Bard, Inc. | | | 4,428,544 | |
| | 48,668 | | | Danaher Corp. | | | 4,163,547 | |
| | 96,051 | | | Edwards Lifesciences Corp.* | | | 9,032,636 | |
| | 3,212 | | | Intuitive Surgical, Inc.* | | | 2,367,244 | |
| | | | | | | | |
| | | | | | | 27,492,242 | |
| | |
| Health Care Providers & Services – 2.8% | |
| | 36,714 | | | Aetna, Inc. | | | 4,727,295 | |
| | 58,243 | | | AmerisourceBergen Corp. | | | 5,329,817 | |
| | 77,435 | | | UnitedHealth Group, Inc. | | | 12,806,200 | |
| | 19,452 | | | VCA, Inc.* | | | 1,768,187 | |
| | | | | | | | |
| | | | | | | 24,631,499 | |
| | |
| Hotels, Restaurants & Leisure – 3.0% | |
| | 12,877 | | | Chipotle Mexican Grill, Inc.* | | | 5,392,115 | |
| | 112,753 | | | McDonald’s Corp. | | | 14,392,920 | |
| | 25,582 | | | Panera Bread Co. Class A* | | | 5,904,326 | |
| | | | | | | | |
| | | | | | | 25,689,361 | |
| | |
| Household Durables – 0.8% | |
| | 138,583 | | | Newell Brands, Inc. | | | 6,794,724 | |
| | |
| Household Products – 0.2% | |
| | 19,457 | | | Colgate-Palmolive Co. | | | 1,419,972 | |
| | |
| Industrial Conglomerates – 3.2% | |
| | 18,995 | | | 3M Co. | | | 3,539,718 | |
| | 147,512 | | | Honeywell International, Inc. | | | 18,365,244 | |
| | 28,140 | | | Roper Technologies, Inc. | | | 5,886,888 | |
| | | | | | | | |
| | | | | | | 27,791,850 | |
| | |
| Internet & Direct Marketing Retail – 5.5% | |
| | 32,342 | | | Amazon.com, Inc.* | | | 27,330,284 | |
| | 15,676 | | | Expedia, Inc. | | | 1,866,071 | |
| | 62,852 | | | Netflix, Inc.* | | | 8,933,155 | |
| | 5,417 | | | The Priceline Group, Inc.* | | | 9,339,612 | |
| | | | | | | | |
| | | | | | | 47,469,122 | |
| | |
| | |
| 58 | | The accompanying notes are an integral part of these financial statements. |
GOLDMAN SACHS CAPITAL GROWTH FUND
| | | | | | | | |
Shares | | | Description | | Value | |
| | | | | | | | |
| Common Stocks – (continued) | |
| Internet Software & Services* – 7.9% | |
| | 22,402 | | | Alphabet, Inc. Class A | | $ | 18,928,122 | |
| | 23,441 | | | Alphabet, Inc. Class C | | | 19,296,866 | |
| | 80,348 | | | eBay, Inc. | | | 2,723,797 | |
| | 196,021 | | | Facebook, Inc. Class A | | | 26,568,686 | |
| | 26,933 | | | Yelp, Inc. | | | 907,642 | |
| | | | | | | | |
| | | | | | | 68,425,113 | |
| | |
| IT Services – 6.7% | |
| | 38,122 | | | Accenture PLC Class A | | | 4,669,945 | |
| | 112,336 | | | Black Knight Financial Services, Inc. Class A*(a) | | | 4,324,936 | |
| | 38,541 | | | Cognizant Technology Solutions Corp. Class A* | | | 2,284,325 | |
| | 37,546 | | | Fidelity National Information Services, Inc. | | | 3,088,910 | |
| | 29,229 | | | Fiserv, Inc.* | | | 3,373,027 | |
| | 11,959 | | | FleetCor Technologies, Inc.* | | | 2,033,030 | |
| | 46,560 | | | Global Payments, Inc. | | | 3,710,367 | |
| | 19,459 | | | International Business Machines Corp. | | | 3,499,117 | |
| | 228,418 | | | MasterCard, Inc. Class A | | | 25,231,052 | |
| | 104,668 | | | PayPal Holdings, Inc.* | | | 4,396,056 | |
| | 29,832 | | | Total System Services, Inc. | | | 1,625,247 | |
| | | | | | | | |
| | | | | | | 58,236,012 | |
| | |
| Life Sciences Tools & Services – 1.6% | |
| | 120,775 | | | Agilent Technologies, Inc. | | | 6,195,757 | |
| | 30,692 | | | Illumina, Inc.* | | | 5,137,841 | |
| | 5,857 | | | Mettler-Toledo International, Inc.* | | | 2,789,221 | |
| | | | | | | | |
| | | | | | | 14,122,819 | |
| | |
| Machinery – 1.4% | |
| | 24,412 | | | Fortive Corp. | | | 1,407,352 | |
| | 36,495 | | | The Middleby Corp.* | | | 5,062,221 | |
| | 120,805 | | | Xylem, Inc. | | | 5,813,137 | |
| | | | | | | | |
| | | | | | | 12,282,710 | |
| | |
| Media – 4.5% | |
| | 544,350 | | | Comcast Corp. Class A | | | 20,369,577 | |
| | 171,923 | | | The Walt Disney Co. | | | 18,927,003 | |
| | | | | | | | |
| | | | | | | 39,296,580 | |
| | |
| Oil, Gas & Consumable Fuels* – 0.2% | |
| | 14,468 | | | Concho Resources, Inc. | | | 1,916,287 | |
| | |
| Personal Products – 0.6% | |
| | 57,681 | | | The Estee Lauder Cos., Inc. Class A | | | 4,778,871 | |
| | |
| Pharmaceuticals – 4.2% | |
| | 42,922 | | | Allergan PLC | | | 10,508,164 | |
| | 229,932 | | | Eli Lilly & Co. | | | 19,040,669 | |
| | 121,172 | | | Zoetis, Inc. | | | 6,459,679 | |
| | | | | | | | |
| | | | | | | 36,008,512 | |
| | |
| Road & Rail – 0.7% | |
| | 120,304 | | | CSX Corp. | | | 5,841,962 | |
| | |
| Semiconductors & Semiconductor Equipment – 2.0% | |
| | 94,409 | | | Applied Materials, Inc. | | | 3,419,494 | |
| | 78,160 | | | NXP Semiconductors NV* | | | 8,035,629 | |
| | |
| | | | | | | | |
| Common Stocks – (continued) | |
| Semiconductors & Semiconductor Equipment – (continued) | |
| | 33,356 | | | Qorvo, Inc.* | | | 2,204,832 | |
| | 41,685 | | | Texas Instruments, Inc. | | | 3,193,905 | |
| | | | | | | | |
| | | | | | | 16,853,860 | |
| | |
| Software – 8.4% | |
| | 32,929 | | | Adobe Systems, Inc.* | | | 3,896,818 | |
| | 16,456 | | | Autodesk, Inc.* | | | 1,420,153 | |
| | 35,561 | | | Electronic Arts, Inc.* | | | 3,076,026 | |
| | 40,190 | | | Intuit, Inc. | | | 5,041,434 | |
| | 411,048 | | | Microsoft Corp. | | | 26,298,851 | |
| | 107,176 | | | Mobileye NV*(a) | | | 4,878,652 | |
| | 311,753 | | | Oracle Corp. | | | 13,277,560 | |
| | 34,334 | | | salesforce.com, Inc.* | | | 2,793,071 | |
| | 62,028 | | | ServiceNow, Inc.* | | | 5,391,474 | |
| | 74,936 | | | Splunk, Inc.* | | | 4,625,799 | |
| | 38,726 | | | Tableau Software, Inc. Class A* | | | 2,042,409 | |
| | | | | | | | |
| | | | | | | 72,742,247 | |
| | |
| Specialty Retail – 5.5% | |
| | 17,234 | | | Advance Auto Parts, Inc. | | | 2,699,017 | |
| | 34,123 | | | O’Reilly Automotive, Inc.* | | | 9,271,560 | |
| | 115,581 | | | Ross Stores, Inc. | | | 7,926,545 | |
| | 101,981 | | | The Home Depot, Inc. | | | 14,778,067 | |
| | 41,792 | | | Tractor Supply Co. | | | 2,963,471 | |
| | 35,464 | | | Ulta Salon, Cosmetics & Fragrance, Inc.* | | | 9,696,921 | |
| | | | | | | | |
| | | | | | | 47,335,581 | |
| | |
| Technology Hardware, Storage & Peripherals – 7.3% | |
| | 463,858 | | | Apple, Inc. | | | 63,543,907 | |
| | |
| Textiles, Apparel & Luxury Goods – 1.6% | |
| | 140,181 | | | Kate Spade & Co.* | | | 3,344,719 | |
| | 145,944 | | | NIKE, Inc. Class B | | | 8,342,159 | |
| | 22,656 | | | PVH Corp. | | | 2,075,289 | |
| | | | | | | | |
| | | | | | | 13,762,167 | |
| | |
| Tobacco – 2.1% | |
| | 155,810 | | | Altria Group, Inc. | | | 11,673,285 | |
| | 61,701 | | | Philip Morris International, Inc. | | | 6,747,005 | |
| | | | | | | | |
| | | | | | | 18,420,290 | |
| | |
| | TOTAL COMMON STOCKS | |
| | (Cost $576,516,693) | | $ | 862,197,400 | |
| | |
| | | | | | | | |
Shares | | Distribution Rate | | | Value | |
| | | | | | | | |
| Investment Companies(b)(c) – 0.0% | |
Goldman Sachs Financial Square Government Fund – Institutional Shares | |
| 290 | | | 0.470 | % | | $ | 290 | |
| (Cost $290) | | | | | |
| |
| TOTAL INVESTMENTS BEFORE SECURITIES LENDING REINVESTMENT VEHICLE | |
| (Cost $576,516,983) | | | $ | 862,197,690 | |
| |
| | |
| The accompanying notes are an integral part of these financial statements. | | 59 |
GOLDMAN SACHS CAPITAL GROWTH FUND
Schedule of Investments (continued)
February 28, 2017 (Unaudited)
| | | | | | | | |
Shares | | Distribution Rate | | | Value | |
| | | | | | | | |
| Securities Lending Reinvestment Vehicle(b)(c) – 0.3% | |
Goldman Sachs Financial Square Government Fund – Institutional Shares | |
| 2,330,752 | | | 0.470 | % | | $ | 2,330,752 | |
| (Cost $2,330,752) | | | | | |
| |
| TOTAL INVESTMENTS – 99.9% | |
| (Cost $578,847,735) | | | $ | 864,528,442 | |
| |
OTHER ASSETS IN EXCESS OF LIABILITIES – 0.1% | | | | 980,641 | |
| |
| NET ASSETS – 100.0% | | | $ | 865,509,083 | |
| |
| | |
| The percentage shown for each investment category reflects the value of investments in that category as a percentage of net assets. |
* | | Non-income producing security. |
(a) | | All or a portion of security is on loan. |
(b) | | Represents an Affiliated fund. |
(c) | | Variable rate security. Interest rate or distribution rate disclosed is that which is in effect on February 28, 2017. |
| | |
|
Investment Abbreviations: |
PLC | | —Public Limited Company |
|
| | |
| 60 | | The accompanying notes are an integral part of these financial statements. |
GOLDMAN SACHS CONCENTRATED GROWTH FUND
Schedule of Investments
February 28, 2017 (Unaudited)
| | | | | | | | |
Shares | | | Description | | Value | |
| | | | | | | | |
| Common Stocks – 98.6% | |
| Banks – 1.6% | |
| | 35,505 | | | SunTrust Banks, Inc. | | $ | 2,112,192 | |
| | |
| Beverages – 2.4% | |
| | 17,640 | | | Molson Coors Brewing Co. Class B | | | 1,770,880 | |
| | 33,837 | | | Monster Beverage Corp.* | | | 1,402,205 | |
| | | | | | | | |
| | | | | | | 3,173,085 | |
| | |
| Biotechnology* – 2.7% | |
| | 14,202 | | | Incyte Corp. | | | 1,890,286 | |
| | 18,801 | | | Vertex Pharmaceuticals, Inc. | | | 1,703,747 | |
| | | | | | | | |
| | | | | | | 3,594,033 | |
| | |
| Capital Markets – 5.5% | |
| | 58,541 | | | Intercontinental Exchange, Inc. | | | 3,344,447 | |
| | 44,383 | | | Northern Trust Corp. | | | 3,876,855 | |
| | | | | | | | |
| | | | | | | 7,221,302 | |
| | |
| Chemicals – 1.4% | |
| | 5,905 | | | The Sherwin-Williams Co. | | | 1,821,929 | |
| | |
| Energy Equipment & Services – 1.3% | |
| | 21,564 | | | Schlumberger Ltd. | | | 1,732,883 | |
| | |
| Equity Real Estate Investment Trusts (REITs) – 4.6% | |
| | 28,767 | | | American Tower Corp. | | | 3,302,164 | |
| | 7,442 | | | Equinix, Inc. | | | 2,798,713 | |
| | | | | | | | |
| | | | | | | 6,100,877 | |
| | |
| Food & Staples Retailing – 5.7% | |
| | 30,631 | | | Costco Wholesale Corp. | | | 5,427,201 | |
| | 23,087 | | | Walgreens Boots Alliance, Inc. | | | 1,994,255 | |
| | | | | | | | |
| | | | | | | 7,421,456 | |
| | |
| Food Products – 1.5% | |
| | 20,950 | | | The Kraft Heinz Co. | | | 1,917,134 | |
| | |
| Health Care Equipment & Supplies – 4.6% | |
| | 68,347 | | | Boston Scientific Corp.* | | | 1,677,919 | |
| | 34,533 | | | Danaher Corp. | | | 2,954,298 | |
| | 15,508 | | | Edwards Lifesciences Corp.* | | | 1,458,372 | |
| | | | | | | | |
| | | | | | | 6,090,589 | |
| | |
| Hotels, Restaurants & Leisure – 2.6% | |
| | 4,914 | | | Chipotle Mexican Grill, Inc.* | | | 2,057,688 | |
| | 10,387 | | | McDonald’s Corp. | | | 1,325,901 | |
| | | | | | | | |
| | | | | | | 3,383,589 | |
| | |
| Industrial Conglomerates – 3.9% | |
| | 23,577 | | | Honeywell International, Inc. | | | 2,935,336 | |
| | 10,648 | | | Roper Technologies, Inc. | | | 2,227,562 | |
| | | | | | | | |
| | | | | | | 5,162,898 | |
| | |
| Internet & Direct Marketing Retail* – 5.4% | |
| | 7,124 | | | Amazon.com, Inc. | | | 6,020,065 | |
| | 646 | | | The Priceline Group, Inc. | | | 1,113,788 | |
| | | | | | | | |
| | | | | | | 7,133,853 | |
| | |
| Internet Software & Services* – 10.7% | |
| | 6,311 | | | Alphabet, Inc. Class A | | | 5,332,353 | |
| | 2,982 | | | Alphabet, Inc. Class C | | | 2,454,812 | |
| | |
| | | | | | | | |
| Common Stocks – (continued) | |
| Internet Software & Services* – (continued) | |
| | 46,269 | | | Facebook, Inc. Class A | | | 6,271,301 | |
| | | | | | | | |
| | | | | | | 14,058,466 | |
| | |
| IT Services – 3.2% | |
| | 37,456 | | | MasterCard, Inc. Class A | | | 4,137,390 | |
| | |
| Machinery – 5.0% | |
| | 40,524 | | | Fortive Corp. | | | 2,336,209 | |
| | 16,161 | | | The Middleby Corp.* | | | 2,241,692 | |
| | 42,113 | | | Xylem, Inc. | | | 2,026,477 | |
| | | | | | | | |
| | | | | | | 6,604,378 | |
| | |
| Media – 6.1% | |
| | 119,112 | | | Comcast Corp. Class A | | | 4,457,171 | |
| | 31,994 | | | The Walt Disney Co. | | | 3,522,219 | |
| | | | | | | | |
| | | | | | | 7,979,390 | |
| | |
| Pharmaceuticals – 4.0% | |
| | 43,919 | | | Eli Lilly & Co. | | | 3,636,932 | |
| | 30,268 | | | Zoetis, Inc. | | | 1,613,587 | |
| | | | | | | | |
| | | | | | | 5,250,519 | |
| | |
| Road & Rail – 1.9% | |
| | 51,201 | | | CSX Corp. | | | 2,486,321 | |
| | |
| Semiconductors & Semiconductor Equipment – 1.4% | |
| | 24,487 | | | Texas Instruments, Inc. | | | 1,876,194 | |
| | |
| Software – 10.9% | |
| | 22,210 | | | Electronic Arts, Inc.* | | | 1,921,165 | |
| | 17,481 | | | Intuit, Inc. | | | 2,192,817 | |
| | 89,824 | | | Microsoft Corp. | | | 5,746,940 | |
| | 59,839 | | | Oracle Corp. | | | 2,548,543 | |
| | 23,044 | | | salesforce.com, Inc.* | | | 1,874,629 | |
| | | | | | | | |
| | | | | | | 14,284,094 | |
| | |
| Specialty Retail – 1.9% | |
| | 35,984 | | | Ross Stores, Inc. | | | 2,467,783 | |
| | |
| Technology Hardware, Storage & Peripherals – 8.0% | |
| | 77,037 | | | Apple, Inc. | | | 10,553,299 | |
| | |
| Textiles, Apparel & Luxury Goods – 2.3% | |
| | 52,775 | | | NIKE, Inc. Class B | | | 3,016,619 | |
| | |
| | TOTAL COMMON STOCKS | |
| | (Cost $90,105,895) | | $ | 129,580,273 | |
| | |
| | |
| The accompanying notes are an integral part of these financial statements. | | 61 |
GOLDMAN SACHS CONCENTRATED GROWTH FUND
Schedule of Investments (continued)
February 28, 2017 (Unaudited)
| | | | | | | | |
Shares | | Distribution
Rate | | | Value | |
| | | | | | | | |
| Investment Companies(a)(b) – 0.0% | |
Goldman Sachs Financial Square Government Fund –Institutional Shares | |
| 78 | | | 0.470 | % | | $ | 78 | |
| (Cost $78) | | | | | |
| |
| TOTAL INVESTMENTS – 98.6% | |
| (Cost $90,105,973) | | | $ | 129,580,351 | |
| |
OTHER ASSETS IN EXCESS OF LIABILITIES – 1.4% | | | | 1,882,260 | |
| |
| NET ASSETS – 100.0% | | | $ | 131,462,611 | |
| |
| | |
| The percentage shown for each investment category reflects the value of investments in that category as a percentage of net assets. |
* | | Non-income producing security. |
(a) | | Represents an Affiliated fund. |
(b) | | Variable rate security. Interest rate or distribution rate disclosed is that which is in effect on February 28, 2017. |
| | |
| 62 | | The accompanying notes are an integral part of these financial statements. |
GOLDMAN SACHS DYNAMIC U.S. EQUITY FUND
Schedule of Investments
February 28, 2017 (Unaudited)
| | | | | | | | |
Shares | | | Description | | Value | |
| | | | | | | | |
| Common Stocks – 97.8% | |
| Automobiles – 2.1% | |
| | 4,244 | | | General Motors Co. | | $ | 156,349 | |
| | |
| Banks – 12.3% | |
| | 12,256 | | | Bank of America Corp. | | | 302,478 | |
| | 2,641 | | | JPMorgan Chase & Co. | | | 239,328 | |
| | 6,223 | | | Wells Fargo & Co. | | | 360,187 | |
| | | | | | | | |
| | | | | | | 901,993 | |
| | |
| Beverages – 1.8% | |
| | 1,354 | | | Molson Coors Brewing Co. Class B | | | 135,928 | |
| | |
| Biotechnology* – 1.2% | |
| | 638 | | | Incyte Corp. | | | 84,918 | |
| | |
| Capital Markets – 6.3% | |
| | 5,810 | | | Deutsche Bank AG* | | | 114,399 | |
| | 3,482 | | | Intercontinental Exchange, Inc. | | | 198,926 | |
| | 3,231 | | | Morgan Stanley | | | 147,560 | |
| | | | | | | | |
| | | | | | | 460,885 | |
| | |
| Chemicals – 2.4% | |
| | 1,467 | | | E.I. du Pont de Nemours & Co. | | | 115,218 | |
| | 198 | | | The Sherwin-Williams Co. | | | 61,091 | |
| | | | | | | | |
| | | | | | | 176,309 | |
| | |
| Consumer Finance – 1.3% | |
| | 1,181 | | | American Express Co. | | | 94,551 | |
| | |
| Electrical Equipment – 0.8% | |
| | 941 | | | Emerson Electric Co. | | | 56,554 | |
| | |
| Equity Real Estate Investment Trusts (REITs) – 4.1% | |
| | 1,234 | | | American Tower Corp. | | | 141,651 | |
| | 428 | | | Equinix, Inc. | | | 160,958 | |
| | | | | | | | |
| | | | | | | 302,609 | |
| | |
| Food & Staples Retailing – 8.4% | |
| | 1,190 | | | Costco Wholesale Corp. | | | 210,844 | |
| | 1,767 | | | Walgreens Boots Alliance, Inc. | | | 152,634 | |
| | 8,388 | | | Whole Foods Market, Inc. | | | 257,260 | |
| | | | | | | | |
| | | | | | | 620,738 | |
| | |
| Health Care Equipment & Supplies – 4.0% | |
| | 1,884 | | | Danaher Corp. | | | 161,176 | |
| | 1,440 | | | Edwards Lifesciences Corp.* | | | 135,418 | |
| | | | | | | | |
| | | | | | | 296,594 | |
| | |
| Hotels, Restaurants & Leisure* – 1.5% | |
| | 263 | | | Chipotle Mexican Grill, Inc. | | | 110,129 | |
| | |
| Industrial Conglomerates – 3.0% | |
| | 7,351 | | | General Electric Co. | | | 219,133 | |
| | |
| Insurance – 1.5% | |
| | 2,152 | | | MetLife, Inc. | | | 112,851 | |
| | |
| Internet & Direct Marketing Retail* – 6.6% | |
| | 349 | | | Amazon.com, Inc. | | | 294,919 | |
| | 111 | | | The Priceline Group, Inc. | | | 191,378 | |
| | | | | | | | |
| | | | | | | 486,297 | |
| | |
| Internet Software & Services* – 8.4% | |
| | 267 | | | Alphabet, Inc. Class A | | | 225,596 | |
| | 189 | | | Alphabet, Inc. Class C | | | 155,587 | |
| | 1,737 | | | Facebook, Inc. Class A | | | 235,433 | |
| | | | | | | | |
| | | | | | | 616,616 | |
| | |
| | | | | | | | |
| Common Stocks – (continued) | |
| IT Services – 4.1% | |
| | 2,703 | | | MasterCard, Inc. Class A | | | 298,573 | |
| | |
| Machinery – 1.0% | |
| | 1,512 | | | Xylem, Inc. | | | 72,757 | |
| | |
| Media – 5.1% | |
| | 1,767 | | | The Walt Disney Co. | | | 194,529 | |
| | 4,212 | | | Viacom, Inc. Class B | | | 183,011 | |
| | | | | | | | |
| | | | | | | 377,540 | |
| | |
| Oil, Gas & Consumable Fuels – 5.9% | |
| | 947 | | | Chevron Corp. | | | 106,538 | |
| | 261 | | | Concho Resources, Inc.* | | | 34,569 | |
| | 2,204 | | | ConocoPhillips | | | 104,844 | |
| | 989 | | | Exxon Mobil Corp. | | | 80,425 | |
| | 14,623 | | | Southwestern Energy Co.* | | | 109,819 | |
| | | | | | | | |
| | | | | | | 436,195 | |
| | |
| Pharmaceuticals – 4.8% | |
| | 1,576 | | | Eli Lilly & Co. | | | 130,509 | |
| | 6,450 | | | Pfizer, Inc. | | | 220,074 | |
| | | | | | | | |
| | | | | | | 350,583 | |
| | |
| Road & Rail – 1.4% | |
| | 937 | | | Union Pacific Corp. | | | 101,140 | |
| | |
| Software – 1.1% | |
| | 1,884 | | | Oracle Corp. | | | 80,240 | |
| | |
| Technology Hardware, Storage & Peripherals – 5.1% | |
| | 2,741 | | | Apple, Inc. | | | 375,490 | |
| | |
| Textiles, Apparel & Luxury Goods – 3.6% | |
| | 3,372 | | | NIKE, Inc. Class B | | | 192,743 | |
| | 795 | | | PVH Corp. | | | 72,822 | |
| | | | | | | | |
| | | | | | | 265,565 | |
| | |
| | TOTAL COMMON STOCKS | |
| | (Cost $5,391,563) | | $ | 7,190,537 | |
| | |
| | | | | | | | |
Shares | | Distribution
Rate | | | Value | |
| | | | | | | | |
| Investment Companies(a)(b) – 0.7% | |
Goldman Sachs Financial Square Government Fund – Institutional Shares | |
| 50,469 | | | 0.470 | % | | $ | 50,469 | |
| (Cost $50,469) | | | | | |
| |
| TOTAL INVESTMENTS – 98.5% | |
| (Cost $5,442,032) | | | $ | 7,241,006 | |
| |
OTHER ASSETS IN EXCESS OF LIABILITIES – 1.5% | | | | 107,996 | |
| |
| NET ASSETS – 100.0% | | | $ | 7,349,002 | |
| |
| | |
| The percentage shown for each investment category reflects the value of investments in that category as a percentage of net assets. |
* | | Non-income producing security. |
(a) | | Represents an Affiliated fund. |
(b) | | Variable rate security. Interest rate or distribution rate disclosed is that which is in effect on February 28, 2017. |
| | |
| The accompanying notes are an integral part of these financial statements. | | 63 |
GOLDMAN SACHS FLEXIBLE CAP GROWTH FUND
Schedule of Investments
February 28, 2017 (Unaudited)
| | | | | | | | |
Shares | | | Description | | Value | |
| Common Stocks – 98.1% | |
| Aerospace & Defense – 0.5% | |
| | 323 | | | Northrop Grumman Corp. | | $ | 79,810 | |
| | |
| Banks – 1.9% | |
| | 2,457 | | | Eagle Bancorp, Inc.* | | | 152,948 | |
| | 2,894 | | | SunTrust Banks, Inc. | | | 172,164 | |
| | | | | | | | |
| | | | | | | 325,112 | |
| | |
| Beverages – 2.3% | |
| | 1,827 | | | Brown-Forman Corp. Class B | | | 89,084 | |
| | 1,640 | | | Molson Coors Brewing Co. Class B | | | 164,640 | |
| | 3,663 | | | Monster Beverage Corp.* | | | 151,795 | |
| | | | | | | | |
| | | | | | | 405,519 | |
| | |
| Biotechnology* – 3.6% | |
| | 3,605 | | | ACADIA Pharmaceuticals, Inc. | | | 137,387 | |
| | 1,340 | | | Alkermes PLC | | | 75,710 | |
| | 1,108 | | | Celgene Corp. | | | 136,849 | |
| | 1,396 | | | Incyte Corp. | | | 185,808 | |
| | 896 | | | Vertex Pharmaceuticals, Inc. | | | 81,195 | |
| | | | | | | | |
| | | | | | | 616,949 | |
| | |
| Building Products – 0.4% | |
| | 1,348 | | | Fortune Brands Home & Security, Inc. | | | 77,955 | |
| | |
| Capital Markets – 3.6% | |
| | 2,861 | | | Intercontinental Exchange, Inc. | | | 163,449 | |
| | 3,952 | | | Lazard Ltd. Class A | | | 170,173 | |
| | 3,238 | | | Northern Trust Corp. | | | 282,839 | |
| | | | | | | | |
| | | | | | | 616,461 | |
| | |
| Chemicals – 2.3% | |
| | 1,355 | | | Ashland Global Holdings, Inc. | | | 163,494 | |
| | 588 | | | The Sherwin-Williams Co. | | | 181,421 | |
| | 2,518 | | | Valvoline, Inc.(a) | | | 56,454 | |
| | | | | | | | |
| | | | | | | 401,369 | |
| | |
| Commercial Services & Supplies – 0.4% | |
| | 1,606 | | | Healthcare Services Group, Inc. | | | 66,456 | |
| | |
| Electrical Equipment – 1.7% | |
| | 780 | | | Rockwell Automation, Inc. | | | 117,858 | |
| | 4,212 | | | Sensata Technologies Holding NV* | | | 172,903 | |
| | | | | | | | |
| | | | | | | 290,761 | |
| | |
| Electronic Equipment, Instruments & Components – 1.2% | |
| | 3,054 | | | Amphenol Corp. Class A | | | 211,367 | |
| | |
| Energy Equipment & Services – 1.2% | |
| | 2,609 | | | Schlumberger Ltd. | | | 209,659 | |
| | |
| Equity Real Estate Investment Trusts (REITs) – 3.6% | |
| | 1,942 | | | American Tower Corp. | | | 222,922 | |
| | 603 | | | Equinix, Inc. | | | 226,770 | |
| | 1,546 | | | SBA Communications Corp.* | | | 178,981 | |
| | | | | | | | |
| | | | | | | 628,673 | |
| | |
| Food & Staples Retailing – 3.1% | |
| | 1,811 | | | Costco Wholesale Corp. | | | 320,873 | |
| | 2,035 | | | Walgreens Boots Alliance, Inc. | | | 175,783 | |
| | |
| Common Stocks – (continued) | |
| Food & Staples Retailing – (continued) | |
| | 1,295 | | | Whole Foods Market, Inc. | | | 39,718 | |
| | | | | | | | |
| | | | | | | 536,374 | |
| | |
| Food Products* – 1.1% | |
| | 3,081 | | | Blue Buffalo Pet Products, Inc. | | | 75,300 | |
| | 1,393 | | | TreeHouse Foods, Inc. | | | 118,516 | |
| | | | | | | | |
| | | | | | | 193,816 | |
| | |
| Health Care Equipment & Supplies – 5.2% | |
| | 5,821 | | | Boston Scientific Corp.* | | | 142,905 | |
| | 1,075 | | | C.R. Bard, Inc. | | | 263,633 | |
| | 1,683 | | | Danaher Corp. | | | 143,981 | |
| | 1,916 | | | Edwards Lifesciences Corp.* | | | 180,181 | |
| | 1,723 | | | Nevro Corp.* | | | 165,391 | |
| | | | | | | | |
| | | | | | | 896,091 | |
| | |
| Health Care Providers & Services – 1.3% | |
| | 1,293 | | | Acadia Healthcare Co., Inc.* | | | 57,823 | |
| | 1,277 | | | Aetna, Inc. | | | 164,427 | |
| | | | | | | | |
| | | | | | | 222,250 | |
| | |
| Hotels, Restaurants & Leisure – 3.0% | |
| | 250 | | | Chipotle Mexican Grill, Inc.* | | | 104,685 | |
| | 1,959 | | | McDonald’s Corp. | | | 250,066 | |
| | 731 | | | Panera Bread Co. Class A* | | | 168,715 | |
| | | | | | | | |
| | | | | | | 523,466 | |
| | |
| Household Durables – 0.9% | |
| | 3,208 | | | Newell Brands, Inc. | | | 157,288 | |
| | |
| Industrial Conglomerates – 4.9% | |
| | 1,429 | | | 3M Co. | | | 266,294 | |
| | 2,930 | | | Honeywell International, Inc. | | | 364,785 | |
| | 1,036 | | | Roper Technologies, Inc. | | | 216,731 | |
| | | | | | | | |
| | | | | | | 847,810 | |
| | |
| Internet & Direct Marketing Retail* – 4.5% | |
| | 724 | | | Amazon.com, Inc. | | | 611,809 | |
| | 99 | | | The Priceline Group, Inc. | | | 170,689 | |
| | | | | | | | |
| | | | | | | 782,498 | |
| | |
| Internet Software & Services* – 8.7% | |
| | 552 | | | Alphabet, Inc. Class A | | | 466,401 | |
| | 494 | | | Alphabet, Inc. Class C | | | 406,666 | |
| | 4,731 | | | Facebook, Inc. Class A | | | 641,240 | |
| | | | | | | | |
| | | | | | | 1,514,307 | |
| | |
| IT Services – 4.4% | |
| | 3,398 | | | Black Knight Financial Services, Inc. Class A*(a) | | | 130,823 | |
| | 761 | | | Fiserv, Inc.* | | | 87,820 | |
| | 935 | | | Global Payments, Inc. | | | 74,510 | |
| | 3,433 | | | MasterCard, Inc. Class A | | | 379,209 | |
| | 1,607 | | | Total System Services, Inc. | | | 87,549 | |
| | | | | | | | |
| | | | | | | 759,911 | |
| | |
| | |
| 64 | | The accompanying notes are an integral part of these financial statements. |
GOLDMAN SACHS FLEXIBLE CAP GROWTH FUND
| | | | | | | | |
Shares | | | Description | | Value | |
| Common Stocks – (continued) | |
| Life Sciences Tools & Services – 2.0% | |
| | 3,415 | | | Agilent Technologies, Inc. | | $ | 175,190 | |
| | 367 | | | Illumina, Inc.* | | | 61,436 | |
| | 242 | | | Mettler-Toledo International, Inc.* | | | 115,245 | |
| | | | | | | | |
| | | | | | | 351,871 | |
| | |
| Machinery – 4.3% | |
| | 2,087 | | | Fortive Corp. | | | 120,316 | |
| | 964 | | | Graco, Inc. | | | 87,493 | |
| | 828 | | | IDEX Corp. | | | 76,333 | |
| | 1,376 | | | The Middleby Corp.* | | | 190,865 | |
| | 5,443 | | | Xylem, Inc. | | | 261,917 | |
| | | | | | | | |
| | | | | | | 736,924 | |
| | |
| Media – 3.0% | |
| | 9,164 | | | Comcast Corp. Class A | | | 342,917 | |
| | 1,572 | | | The Walt Disney Co. | | | 173,061 | |
| | | | | | | | |
| | | | | | | 515,978 | |
| | |
| Oil, Gas & Consumable Fuels* – 0.5% | |
| | 626 | | | Concho Resources, Inc. | | | 82,914 | |
| | |
| Pharmaceuticals – 4.0% | |
| | 979 | | | Allergan PLC | | | 239,679 | |
| | 3,657 | | | Eli Lilly & Co. | | | 302,836 | |
| | 2,912 | | | Zoetis, Inc. | | | 155,239 | |
| | | | | | | | |
| | | | | | | 697,754 | |
| | |
| Road & Rail – 0.7% | |
| | 2,331 | | | CSX Corp. | | | 113,193 | |
| | |
| Semiconductors & Semiconductor Equipment – 1.7% | |
| | 710 | | | NXP Semiconductors NV* | | | 72,995 | |
| | 765 | | | Qorvo, Inc.* | | | 50,567 | |
| | 2,142 | | | Texas Instruments, Inc. | | | 164,120 | |
| | | | | | | | |
| | | | | | | 287,682 | |
| | |
| Software – 9.2% | |
| | 1,095 | | | Adobe Systems, Inc.* | | | 129,582 | |
| | 1,606 | | | Electronic Arts, Inc.* | | | 138,919 | |
| | 1,296 | | | Intuit, Inc. | | | 162,570 | |
| | 7,326 | | | Microsoft Corp. | | | 468,718 | |
| | 2,247 | | | Mobileye NV* | | | 102,283 | |
| | 5,875 | | | Oracle Corp. | | | 250,216 | |
| | 1,781 | | | Red Hat, Inc.* | | | 147,485 | |
| | 1,836 | | | salesforce.com, Inc.* | | | 149,359 | |
| | 871 | | | Splunk, Inc.* | | | 53,767 | |
| | | | | | | | |
| | | | | | | 1,602,899 | |
| | |
| Specialty Retail – 4.2% | |
| | 632 | | | Burlington Stores, Inc.* | | | 56,254 | |
| | 548 | | | O’Reilly Automotive, Inc.* | | | 148,897 | |
| | 3,123 | | | Ross Stores, Inc. | | | 214,175 | |
| | 992 | | | The Home Depot, Inc. | | | 143,751 | |
| | 586 | | | Ulta Salon, Cosmetics & Fragrance, Inc.* | | | 160,230 | |
| | | | | | | | |
| | | | | | | 723,307 | |
| | |
| Technology Hardware, Storage & Peripherals – 6.7% | |
| | 8,495 | | | Apple, Inc. | | | 1,163,730 | |
| | |
| Common Stocks – (continued) | |
| Textiles, Apparel & Luxury Goods – 2.0% | |
| | 3,717 | | | Kate Spade & Co.* | | | 88,687 | |
| | 4,604 | | | NIKE, Inc. Class B | | | 263,165 | |
| | | | | | | | |
| | | | | | | 351,852 | |
| | |
| | TOTAL COMMON STOCKS | |
| | (Cost $11,803,655) | | $ | 16,992,006 | |
| | |
| TOTAL INVESTMENTS BEFORE SECURITIES
LENDING REINVESTMENT VEHICLE |
|
| | (Cost $11,803,655) | | $ | 16,992,006 | |
| | |
| | | | | | | | |
Shares | | | Distribution
Rate | | Value | |
| Securities Lending Reinvestment Vehicle(b)(c) – 0.5% | |
| Goldman Sachs Financial Square Government Fund –
Institutional Shares |
|
| | 94,800 | | | 0.470% | | $ | 94,800 | |
| | (Cost $94,800) | | | | |
| | |
| | TOTAL INVESTMENTS – 98.6% | |
| | (Cost $11,898,455) | | $ | 17,086,806 | |
| | |
| OTHER ASSETS IN EXCESS OF
LIABILITIES – 1.4% | | | 242,696 | |
| | |
| | NET ASSETS – 100.0% | | $ | 17,329,502 | |
| | |
| | |
| The percentage shown for each investment category reflects the value of investments in that category as a percentage of net assets. |
* | | Non-income producing security. |
(a) | | All or a portion of security is on loan. |
(b) | | Represents an Affiliated fund. |
(c) | | Variable rate security. Interest rate or distribution rate disclosed is that which is in effect on February 28, 2017. |
| | |
|
Investment Abbreviations: |
PLC | | —Public Limited Company |
|
| | |
| The accompanying notes are an integral part of these financial statements. | | 65 |
GOLDMAN SACHS FOCUSED GROWTH FUND
Schedule of Investments
February 28, 2017 (Unaudited)
| | | | | | | | |
Shares | | | Description | | Value | |
| | | | | | | | |
| Common Stocks – 98.3% | |
| Banks – 2.7% | |
| | 7,354 | | | SunTrust Banks, Inc. | | $ | 437,489 | |
| | |
| Beverages – 2.7% | |
| | 4,392 | | | Molson Coors Brewing Co. Class B | | | 440,913 | |
| | |
| Biotechnology* – 3.1% | |
| | 3,780 | | | Incyte Corp. | | | 503,118 | |
| | |
| Capital Markets – 9.5% | |
| | 13,387 | | | Intercontinental Exchange, Inc. | | | 764,799 | |
| | 8,943 | | | Northern Trust Corp. | | | 781,171 | |
| | | | | | | | |
| | | | | | | 1,545,970 | |
| | |
| Energy Equipment & Services – 2.3% | |
| | 4,614 | | | Schlumberger Ltd. | | | 370,781 | |
| | |
| Equity Real Estate Investment Trusts (REITs) – 4.9% | |
| | 2,877 | | | American Tower Corp. | | | 330,251 | |
| | 1,224 | | | Equinix, Inc. | | | 460,310 | |
| | | | | | | | |
| | | | | | | 790,561 | |
| | |
| Food & Staples Retailing – 6.6% | |
| | 6,020 | | | Costco Wholesale Corp. | | | 1,066,624 | |
| | |
| Health Care Equipment & Supplies – 7.6% | |
| | 8,180 | | | Danaher Corp. | | | 699,799 | |
| | 5,643 | | | Edwards Lifesciences Corp.* | | | 530,668 | |
| | | | | | | | |
| | | | | | | 1,230,467 | |
| | |
| Internet & Direct Marketing Retail* – 5.3% | |
| | 1,012 | | | Amazon.com, Inc. | | | 855,180 | |
| | |
| Internet Software & Services* – 10.9% | |
| | 1,095 | | | Alphabet, Inc. Class A | | | 925,198 | |
| | 6,236 | | | Facebook, Inc. Class A | | | 845,228 | |
| | | | | | | | |
| | | | | | | 1,770,426 | |
| | |
| IT Services – 6.0% | |
| | 8,857 | | | MasterCard, Inc. Class A | | | 978,344 | |
| | |
| Machinery – 3.3% | |
| | 10,992 | | | Xylem, Inc. | | | 528,935 | |
| | |
| Media – 4.8% | |
| | 21,027 | | | Comcast Corp. Class A | | | 786,830 | |
| | |
| Pharmaceuticals – 3.3% | |
| | 6,413 | | | Eli Lilly & Co. | | | 531,061 | |
| | |
| Road & Rail – 3.8% | |
| | 12,799 | | | CSX Corp. | | | 621,519 | |
| | |
| Software – 3.7% | |
| | 14,284 | | | Oracle Corp. | | | 608,356 | |
| | |
| Specialty Retail – 4.1% | |
| | 9,655 | | | Ross Stores, Inc. | | | 662,140 | |
| | |
| Technology Hardware, Storage & Peripherals – 9.5% | |
| | 11,204 | | | Apple, Inc. | | | 1,534,836 | |
| | |
| Textiles, Apparel & Luxury Goods – 4.2% | |
| | 12,034 | | | NIKE, Inc. Class B | | | 687,864 | |
| | |
| | TOTAL COMMON STOCKS | |
| | (Cost $12,214,721) | | $ | 15,951,414 | |
| | |
Shares | | Distribution Rate | | Value | |
| Investment Companies(a)(b) – 4.4% | |
Goldman Sachs Financial Square Government Fund – Institutional Shares | |
| 713,488 | | 0.470% | | $ | 713,488 | |
| (Cost $713,488) | | | | |
| |
| TOTAL INVESTMENTS – 102.7% | |
| (Cost $12,928,209) | | $ | 16,664,902 | |
| |
LIABILITIES IN EXCESS OF OTHER ASSETS – (2.7)% | | | (443,530 | ) |
| |
| NET ASSETS – 100.0% | | $ | 16,221,372 | |
| |
| | |
| The percentage shown for each investment category reflects the value of investments in that category as a percentage of net assets. |
* | | Non-income producing security. |
(a) | | Represents an Affiliated fund. |
(b) | | Variable rate security. Interest rate or distribution rate disclosed is that which is in effect on February 28, 2017. |
| | |
| 66 | | The accompanying notes are an integral part of these financial statements. |
GOLDMAN SACHS GROWTH OPPORTUNITIES FUND
Schedule of Investments
February 28, 2017 (Unaudited)
| | | | | | | | |
Shares | | | Description | | Value | |
| | | | | | | | |
| Common Stocks – 98.5% | |
| Aerospace & Defense – 1.0% | |
| | 175,023 | | | L3 Technologies, Inc. | | $ | 29,459,871 | |
| | |
| Banks – 3.9% | |
| | 716,660 | | | Eagle Bancorp, Inc.* | | | 44,612,085 | |
| | 423,550 | | | First Republic Bank | | | 39,741,696 | |
| | 502,626 | | | SunTrust Banks, Inc. | | | 29,901,221 | |
| | | | | | | | |
| | | | | | | 114,255,002 | |
| | |
| Beverages – 2.0% | |
| | 348,372 | | | Brown-Forman Corp. Class B | | | 16,986,619 | |
| | 225,934 | | | Molson Coors Brewing Co. Class B | | | 22,681,514 | |
| | 469,489 | | | Monster Beverage Corp.* | | | 19,455,624 | |
| | | | | | | | |
| | | | | | | 59,123,757 | |
| | |
| Biotechnology* – 3.4% | |
| | 98,284 | | | ACADIA Pharmaceuticals, Inc. | | | 3,745,603 | |
| | 483,648 | | | Alkermes PLC | | | 27,326,112 | |
| | 570,346 | | | Exelixis, Inc. | | | 12,279,550 | |
| | 304,558 | | | Incyte Corp. | | | 40,536,670 | |
| | 153,484 | | | Vertex Pharmaceuticals, Inc. | | | 13,908,720 | |
| | | | | | | | |
| | | | | | | 97,796,655 | |
| | |
| Building Products – 1.1% | |
| | 523,412 | | | Fortune Brands Home & Security, Inc. | | | 30,268,916 | |
| | |
| Capital Markets – 6.4% | |
| | 193,098 | | | Affiliated Managers Group, Inc. | | | 32,426,947 | |
| | 981,604 | | | Intercontinental Exchange, Inc. | | | 56,079,037 | |
| | 695,272 | | | Lazard Ltd. Class A | | | 29,938,412 | |
| | 764,558 | | | Northern Trust Corp. | | | 66,784,141 | |
| | | | | | | | |
| | | | | | | 185,228,537 | |
| | |
| Chemicals – 4.2% | |
| | 269,765 | | | Ashland Global Holdings, Inc. | | | 32,549,845 | |
| | 983,111 | | | RPM International, Inc. | | | 52,389,985 | |
| | 74,709 | | | The Sherwin-Williams Co. | | | 23,050,715 | |
| | 644,362 | | | Valvoline, Inc.(a) | | | 14,446,596 | |
| | | | | | | | |
| | | | | | | 122,437,141 | |
| | |
| Containers & Packaging – 1.6% | |
| | 584,113 | | | Avery Dennison Corp. | | | 47,143,760 | |
| | |
| Electrical Equipment – 4.0% | |
| | 269,011 | | | Hubbell, Inc. | | | 31,910,085 | |
| | 301,696 | | | Rockwell Automation, Inc. | | | 45,586,265 | |
| | 920,452 | | | Sensata Technologies Holding NV* | | | 37,784,555 | |
| | | | | | | | |
| | | | | | | 115,280,905 | |
| | |
| Electronic Equipment, Instruments & Components – 3.0% | |
| | 1,253,477 | | | Amphenol Corp. Class A | | | 86,753,143 | |
| | |
| Energy Equipment & Services* – 0.4% | |
| | 179,843 | | | Dril-Quip, Inc. | | | 11,033,368 | |
| | |
| Equity Real Estate Investment Trusts (REITs) – 3.4% | |
| | 158,154 | | | Equinix, Inc. | | | 59,476,975 | |
| | 340,858 | | | SBA Communications Corp.* | | | 39,461,130 | |
| | | | | | | | |
| | | | | | | 98,938,105 | |
| | |
| | | | | | | | |
| Common Stocks – (continued) | |
| Food & Staples Retailing – 0.6% | |
| | 586,071 | | | Whole Foods Market, Inc. | | | 17,974,798 | |
| | |
| Food Products – 3.3% | |
| | 1,745,409 | | | Blue Buffalo Pet Products, Inc.* | | | 42,657,796 | |
| | 623,474 | | | Snyder’s-Lance, Inc. | | | 24,677,101 | |
| | 332,273 | | | TreeHouse Foods, Inc.* | | | 28,269,787 | |
| | | | | | | | |
| | | | | | | 95,604,684 | |
| | |
| Health Care Equipment & Supplies – 4.3% | |
| | 202,738 | | | C.R. Bard, Inc. | | | 49,719,467 | |
| | 555,946 | | | Edwards Lifesciences Corp.* | | | 52,281,162 | |
| | 251,389 | | | Nevro Corp.* | | | 24,130,830 | |
| | | | | | | | |
| | | | | | | 126,131,459 | |
| | |
| Hotels, Restaurants & Leisure* – 4.4% | |
| | 142,673 | | | Chipotle Mexican Grill, Inc. | | | 59,742,892 | |
| | 295,169 | | | Panera Bread Co. Class A | | | 68,125,005 | |
| | | | | | | | |
| | | | | | | 127,867,897 | |
| | |
| Household Durables – 1.7% | |
| | 1,005,855 | | | Newell Brands, Inc. | | | 49,317,071 | |
| | |
| Industrial Conglomerates – 3.1% | |
| | 425,357 | | | Roper Technologies, Inc. | | | 88,984,684 | |
| | |
| Internet & Direct Marketing Retail – 1.3% | |
| | 322,181 | | | Expedia, Inc. | | | 38,352,426 | |
| | |
| Internet Software & Services* – 1.0% | |
| | 392,576 | | | GoDaddy, Inc. Class A | | | 14,466,425 | |
| | 185,899 | | | Match Group, Inc.(a) | | | 3,004,128 | |
| | 336,340 | | | Yelp, Inc. | | | 11,334,658 | |
| | | | | | | | |
| | | | | | | 28,805,211 | |
| | |
| IT Services – 8.0% | |
| | 1,276,372 | | | Black Knight Financial Services, Inc. Class A*(a) | | | 49,140,322 | |
| | 492,454 | | | Fiserv, Inc.* | | | 56,829,192 | |
| | 212,980 | | | FleetCor Technologies, Inc.* | | | 36,206,600 | |
| | 586,785 | | | Global Payments, Inc. | | | 46,760,897 | |
| | 818,105 | | | Total System Services, Inc. | | | 44,570,360 | |
| | | | | | | | |
| | | | | | | 233,507,371 | |
| | |
| Life Sciences Tools & Services – 4.4% | |
| | 886,712 | | | Agilent Technologies, Inc. | | | 45,488,326 | |
| | 150,020 | | | Illumina, Inc.* | | | 25,113,348 | |
| | 118,868 | | | Mettler-Toledo International, Inc.* | | | 56,607,319 | |
| | | | | | | | |
| | | | | | | 127,208,993 | |
| | |
| Machinery – 8.3% | |
| | 776,909 | | | Fortive Corp. | | | 44,788,804 | |
| | 262,836 | | | IDEX Corp. | | | 24,230,851 | |
| | 241,900 | | | John Bean Technologies Corp. | | | 21,625,860 | |
| | 524,015 | | | The Middleby Corp.* | | | 72,686,121 | |
| | 1,615,604 | | | Xylem, Inc. | | | 77,742,864 | |
| | | | | | | | |
| | | | | | | 241,074,500 | |
| | |
| Media – 1.0% | |
| | 450,825 | | | CBS Corp. Class B | | | 29,718,384 | |
| | |
| | |
| The accompanying notes are an integral part of these financial statements. | | 67 |
GOLDMAN SACHS GROWTH OPPORTUNITIES FUND
Schedule of Investments (continued)
February 28, 2017 (Unaudited)
| | | | | | | | |
Shares | | | Description | | Value | |
| | | | | | | | |
| Common Stocks – (continued) | |
| Oil, Gas & Consumable Fuels* – 1.0% | |
| | 224,277 | | | Concho Resources, Inc. | | $ | 29,705,489 | |
| | |
| Pharmaceuticals – 2.0% | |
| | 1,107,089 | | | Zoetis, Inc. | | | 59,018,915 | |
| | |
| Semiconductors & Semiconductor Equipment – 1.1% | |
| | 271,421 | | | Qorvo, Inc.* | | | 17,940,928 | |
| | 244,460 | | | Xilinx, Inc. | | | 14,379,137 | |
| | | | | | | | |
| | | | | | | 32,320,065 | |
| | |
| Software – 8.3% | |
| | 600,079 | | | Electronic Arts, Inc.* | | | 51,906,834 | |
| | 475,062 | | | Intuit, Inc. | | | 59,591,777 | |
| | 370,079 | | | Mobileye NV* | | | 16,845,996 | |
| | 554,573 | | | Red Hat, Inc.* | | | 45,924,190 | |
| | 287,839 | | | ServiceNow, Inc.* | | | 25,018,966 | |
| | 334,833 | | | Splunk, Inc.* | | | 20,669,241 | |
| | 132,105 | | | Tyler Technologies, Inc.* | | | 20,033,723 | |
| | | | | | | | |
| | | | | | | 239,990,727 | |
| | |
| Specialty Retail – 9.1% | |
| | 310,558 | | | Advance Auto Parts, Inc. | | | 48,636,488 | |
| | 550,223 | | | Five Below, Inc.* | | | 21,211,097 | |
| | 202,555 | | | O’Reilly Automotive, Inc.* | | | 55,036,219 | |
| | 990,039 | | | Ross Stores, Inc. | | | 67,896,875 | |
| | 265,246 | | | Ulta Salon, Cosmetics & Fragrance, Inc.* | | | 72,526,214 | |
| | | | | | | | |
| | | | | | | 265,306,893 | |
| | |
| Textiles, Apparel & Luxury Goods – 1.2% | |
| | 900,570 | | | Kate Spade & Co.* | | | 21,487,600 | |
| | 153,032 | | | PVH Corp. | | | 14,017,731 | |
| | | | | | | | |
| | | | | | | 35,505,331 | |
| | |
| | TOTAL COMMON STOCKS | |
| | (Cost $2,242,630,139) | | $ | 2,864,114,058 | |
| | |
| | | | | | | | |
Shares | | Distribution
Rate | | | Value | |
| Investment Companies(b)(c) – 0.0% | |
Goldman Sachs Financial Square Government Fund – Institutional Shares | |
| 4,690 | | | 0.470 | % | | $ | 4,690 | |
| (Cost $4,690) | | | | | |
| |
| TOTAL INVESTMENTS BEFORE SECURITIES LENDING REINVESTMENT VEHICLE | |
| (Cost $2,242,634,829) | | | $ | 2,864,118,748 | |
| |
| Securities Lending Reinvestment Vehicle(b)(c) – 0.6% | |
Goldman Sachs Financial Square Government Fund – Institutional Shares | |
| 18,866,365 | | | 0.470 | % | | $ | 18,866,365 | |
| (Cost $18,866,365) | | | | | |
| |
| TOTAL INVESTMENTS – 99.1% | |
| (Cost $2,261,501,194) | | | $ | 2,882,985,113 | |
| |
OTHER ASSETS IN EXCESS OF LIABILITIES – 0.9% | | | | 24,875,135 | |
| |
| NET ASSETS – 100.0% | | | $ | 2,907,860,248 | |
| |
| | |
| The percentage shown for each investment category reflects the value of investments in that category as a percentage of net assets. |
* | | Non-income producing security. |
(a) | | All or a portion of security is on loan. |
(b) | | Represents an Affiliated fund. |
(c) | | Variable rate security. Interest rate or distribution rate disclosed is that which is in effect on February 28, 2017. |
| | |
|
Investment Abbreviations: |
PLC | | —Public Limited Company |
|
| | |
| 68 | | The accompanying notes are an integral part of these financial statements. |
GOLDMAN SACHS SMALL/MID CAP GROWTH FUND
Schedule of Investments
February 28, 2017 (Unaudited)
| | | | | | | | |
Shares | | | Description | | Value | |
| Common Stocks – 96.6% | |
| Aerospace & Defense – 2.0% | |
| | 1,205,061 | | | Aerovironment, Inc.*(a) | | $ | 32,560,748 | |
| | 74,621 | | | L3 Technologies, Inc. | | | 12,560,207 | |
| | | | | | | | |
| | | | | | | 45,120,955 | |
| | |
| Banks – 3.3% | |
| | 657,069 | | | Eagle Bancorp, Inc.* | | | 40,902,545 | |
| | 348,431 | | | First Republic Bank | | | 32,693,281 | |
| | | | | | | | |
| | | | | | | 73,595,826 | |
| | |
| Beverages(b) – 0.9% | |
| | 457,194 | | | MGP Ingredients, Inc. | | | 20,221,691 | |
| | |
| Biotechnology* – 6.5% | |
| | 605,555 | | | ACADIA Pharmaceuticals, Inc. | | | 23,077,701 | |
| | 360,626 | | | Acceleron Pharma, Inc. | | | 9,635,927 | |
| | 290,480 | | | Agios Pharmaceuticals, Inc.(b) | | | 14,070,851 | |
| | 412,885 | | | Alder Biopharmaceuticals, Inc. | | | 9,434,422 | |
| | 555,954 | | | Alkermes PLC | | | 31,411,401 | |
| | 285,575 | | | Emergent BioSolutions, Inc. | | | 8,961,344 | |
| | 921,634 | | | Exelixis, Inc. | | | 19,842,780 | |
| | 163,515 | | | Galapagos NV ADR(b) | | | 11,535,983 | |
| | 421,780 | | | Myovant Sciences Ltd.(b) | | | 4,597,402 | |
| | 158,211 | | | Ultragenyx Pharmaceutical, Inc.(b) | | | 13,460,592 | |
| | | | | | | | |
| | | | | | | 146,028,403 | |
| | |
| Building Products – 1.2% | |
| | 461,677 | | | Fortune Brands Home & Security, Inc. | | | 26,698,781 | |
| | |
| Capital Markets – 4.4% | |
| | 219,242 | | | Affiliated Managers Group, Inc. | | | 36,817,309 | |
| | 213,661 | | | Evercore Partners, Inc. Class A | | | 16,996,732 | |
| | 1,037,331 | | | Lazard Ltd. Class A | | | 44,667,473 | |
| | | | | | | | |
| | | | | | | 98,481,514 | |
| | |
| Chemicals – 4.1% | |
| | 259,064 | | | Ashland Global Holdings, Inc. | | | 31,258,662 | |
| | 982,663 | | | RPM International, Inc. | | | 52,366,112 | |
| | 357,519 | | | Valvoline, Inc.(b) | | | 8,015,576 | |
| | | | | | | | |
| | | | | | | 91,640,350 | |
| | |
| Commercial Services & Supplies – 1.8% | |
| | 997,519 | | | Healthcare Services Group, Inc. | | | 41,277,336 | |
| | |
| Construction Materials* – 1.1% | |
| | 1,051,646 | | | Summit Materials, Inc. Class A | | | 25,123,823 | |
| | |
| Consumer Finance* – 0.9% | |
| | 1,631,647 | | | SLM Corp. | | | 19,563,448 | |
| | |
| Containers & Packaging – 1.4% | |
| | 377,705 | | | Avery Dennison Corp. | | | 30,484,571 | |
| | |
| Electrical Equipment – 3.5% | |
| | 216,029 | | | Hubbell, Inc. | | | 25,625,360 | |
| | 148,099 | | | Rockwell Automation, Inc. | | | 22,377,759 | |
| | 709,243 | | | Sensata Technologies Holding NV* | | | 29,114,425 | |
| | | | | | | | |
| | | | | | | 77,117,544 | |
| | |
| Common Stocks – (continued) | |
| Electronic Equipment, Instruments & Components – 2.9% | |
| | 322,771 | | | Amphenol Corp. Class A | | | 22,338,981 | |
| | 739,538 | | | Badger Meter, Inc. | | | 27,067,091 | |
| | 212,279 | | | Cognex Corp. | | | 16,305,150 | |
| | | | | | | | |
| | | | | | | 65,711,222 | |
| | |
| Energy Equipment & Services* – 0.4% | |
| | 154,897 | | | Dril-Quip, Inc. | | | 9,502,931 | |
| | |
| Equity Real Estate Investment Trusts (REITs)* – 0.6% | |
| | 112,199 | | | SBA Communications Corp. | | | 12,989,278 | |
| | |
| Food & Staples Retailing – 0.6% | |
| | 455,077 | | | Whole Foods Market, Inc. | | | 13,957,212 | |
| | |
| Food Products – 3.4% | |
| | 1,292,988 | | | Blue Buffalo Pet Products, Inc.* | | | 31,600,627 | |
| | 449,706 | | | Snyder’s-Lance, Inc. | | | 17,799,364 | |
| | 306,979 | | | TreeHouse Foods, Inc.* | | | 26,117,773 | |
| | | | | | | | |
| | | | | | | 75,517,764 | |
| | |
| Health Care Equipment & Supplies – 5.4% | |
| | 208,576 | | | ABIOMED, Inc.* | | | 24,605,711 | |
| | 138,707 | | | C.R. Bard, Inc. | | | 34,016,505 | |
| | 107,924 | | | ICU Medical, Inc.* | | | 16,231,769 | |
| | 111,726 | | | IDEXX Laboratories, Inc.* | | | 16,193,566 | |
| | 304,621 | | | Nevro Corp.* | | | 29,240,570 | |
| | | | | | | | |
| | | | | | | 120,288,121 | |
| | |
| Health Care Providers & Services* – 0.9% | |
| | 474,148 | | | Acadia Healthcare Co., Inc. | | | 21,203,899 | |
| | |
| Health Care Technology*(b) – 0.6% | |
| | 632,872 | | | Evolent Health, Inc. Class A | | | 12,467,578 | |
| | |
| Hotels, Restaurants & Leisure – 5.9% | |
| | 85,449 | | | Chipotle Mexican Grill, Inc.* | | | 35,780,914 | |
| | 214,619 | | | Jack in the Box, Inc. | | | 20,111,946 | |
| | 217,081 | | | Panera Bread Co. Class A* | | | 50,102,295 | |
| | 237,050 | | | Shake Shack, Inc. Class A*(b) | | | 8,493,502 | |
| | 696,230 | | | Wingstop, Inc.(b) | | | 18,310,849 | |
| | | | | | | | |
| | | | | | | 132,799,506 | |
| | |
| Household Durables* – 1.0% | |
| | 983,492 | | | M/I Homes, Inc. | | | 23,210,411 | |
| | |
| Internet Software & Services* – 2.2% | |
| | 1,048,975 | | | GoDaddy, Inc. Class A | | | 38,654,729 | |
| | 119,272 | | | Match Group, Inc.(b) | | | 1,927,436 | |
| | 261,282 | | | Yelp, Inc. | | | 8,805,203 | |
| | | | | | | | |
| | | | | | | 49,387,368 | |
| | |
| IT Services – 7.6% | |
| | 1,169,968 | | | Black Knight Financial Services, Inc. Class A* | | | 45,043,768 | |
| | 97,732 | | | FleetCor Technologies, Inc.* | | | 16,614,440 | |
| | 108,587 | | | Gartner, Inc.* | | | 11,207,264 | |
| | 580,301 | | | Global Payments, Inc. | | | 46,244,187 | |
| | 670,903 | | | InterXion Holding NV* | | | 26,098,127 | |
| | 443,026 | | | Total System Services, Inc. | | | 24,136,056 | |
| | | | | | | | |
| | | | | | | 169,343,842 | |
| | |
| | |
| The accompanying notes are an integral part of these financial statements. | | 69 |
GOLDMAN SACHS SMALL/MID CAP GROWTH FUND
Schedule of Investments (continued)
February 28, 2017 (Unaudited)
| | | | | | | | |
Shares | | | Description | | Value | |
| Common Stocks – (continued) | |
| Life Sciences Tools & Services – 3.7% | |
| | 459,538 | | | Agilent Technologies, Inc. | | $ | 23,574,299 | |
| | 73,495 | | | Mettler-Toledo International, Inc.* | | | 34,999,789 | |
| | 427,464 | | | PerkinElmer, Inc. | | | 23,194,197 | |
| | | | | | | | |
| | | | | | | 81,768,285 | |
| | |
| Machinery – 9.7% | |
| | 244,025 | | | Graco, Inc. | | | 22,147,709 | |
| | 183,286 | | | IDEX Corp. | | | 16,897,136 | |
| | 375,932 | | | John Bean Technologies Corp. | | | 33,608,321 | |
| | 652,785 | | | Kornit Digital Ltd.*(b) | | | 10,575,117 | |
| | 184,822 | | | Tennant Co. | | | 12,983,746 | |
| | 321,573 | | | The Gorman-Rupp Co. | | | 10,010,567 | |
| | 377,464 | | | The Middleby Corp.* | | | 52,358,031 | |
| | 1,213,272 | | | Xylem, Inc. | | | 58,382,649 | |
| | | | | | | | |
| | | | | | | 216,963,276 | |
| | |
| Oil, Gas & Consumable Fuels* – 0.8% | |
| | 130,254 | | | Concho Resources, Inc. | | | 17,252,142 | |
| | |
| Pharmaceuticals*(b) – 0.3% | |
| | 340,898 | | | Revance Therapeutics, Inc. | | | 7,158,858 | |
| | |
| Real Estate Management & Development – 1.5% | |
| | 1,117,365 | | | HFF, Inc. Class A | | | 33,129,872 | |
| | |
| Semiconductors & Semiconductor Equipment* – 1.3% | |
| | 215,596 | | | Cavium, Inc. | | | 14,123,694 | |
| | 210,490 | | | Qorvo, Inc. | | | 13,913,389 | |
| | | | | | | | |
| | | | | | | 28,037,083 | |
| | |
| Software* – 6.2% | |
| | 419,988 | | | Guidewire Software, Inc. | | | 22,948,144 | |
| | 341,898 | | | Mobileye NV(b) | | | 15,563,197 | |
| | 285,581 | | | Red Hat, Inc. | | | 23,648,963 | |
| | 185,381 | | | ServiceNow, Inc. | | | 16,113,316 | |
| | 189,188 | | | Splunk, Inc. | | | 11,678,575 | |
| | 240,521 | | | Tableau Software, Inc. Class A | | | 12,685,078 | |
| | 234,125 | | | Tyler Technologies, Inc. | | | 35,505,056 | |
| | | | | | | | |
| | | | | | | 138,142,329 | |
| | |
| Specialty Retail – 6.0% | |
| | 144,507 | | | Advance Auto Parts, Inc. | | | 22,631,241 | |
| | 455,952 | | | Burlington Stores, Inc.* | | | 40,584,288 | |
| | 552,859 | | | Five Below, Inc.* | | | 21,312,715 | |
| | 235,854 | | | Tractor Supply Co. | | | 16,724,407 | |
| | 116,908 | | | Ulta Salon, Cosmetics & Fragrance, Inc.* | | | 31,966,154 | |
| | | | | | | | |
| | | | | | | 133,218,805 | |
| | |
| Technology Hardware, Storage & Peripherals* – 2.1% | |
| | 1,002,776 | | | Electronics For Imaging, Inc. | | | 46,197,890 | |
| | |
| Textiles, Apparel & Luxury Goods – 1.5% | |
| | 953,129 | | | Kate Spade & Co.* | | | 22,741,658 | |
| | 110,409 | | | PVH Corp. | | | 10,113,464 | |
| | | | | | | | |
| | | | | | | 32,855,122 | |
| | |
| Common Stocks – (continued) | |
| Trading Companies & Distributors – 0.9% | |
| | 134,103 | | | Fastenal Co. | | | 6,709,173 | |
| | 66,023 | | | MSC Industrial Direct Co., Inc. Class A | | | 6,641,254 | |
| | 26,839 | | | W.W. Grainger, Inc. | | | 6,654,998 | |
| | | | | | | | |
| | | | | | | 20,005,425 | |
| | |
| | TOTAL COMMON STOCKS | |
| | (Cost $1,741,620,260) | | $ | 2,156,462,461 | |
| | |
| | | | | | | | |
| Shares | | �� | Distribution
Rate | | Value | |
| Investment Companies(a)(c) – 1.6% | |
| Goldman Sachs Financial Square Government Fund –
Institutional Shares |
|
| | 35,428,823 | | | 0.470% | | $ | 35,428,823 | |
| | (Cost $35,428,823) | | | | |
| | |
| TOTAL INVESTMENTS BEFORE SECURITIES
LENDING REINVESTMENT VEHICLE |
|
| | (Cost $1,777,049,083) | | $ | 2,191,891,284 | |
| | |
| | |
| Securities Lending Reinvestment Vehicle(a)(c) – 1.6% | |
| Goldman Sachs Financial Square Government Fund –
Institutional Shares |
|
| | 35,820,930 | | | 0.470% | | $ | 35,820,930 | |
| | (Cost $35,820,930) | | | | |
| | |
| | TOTAL INVESTMENTS – 99.8% | |
| | (Cost $1,812,870,013) | | $ | 2,227,712,214 | |
| | |
| OTHER ASSETS IN EXCESS OF
LIABILITIES – 0.2% | | | 5,356,323 | |
| | |
| | NET ASSETS – 100.0% | | $ | 2,233,068,537 | |
| | |
| | |
| The percentage shown for each investment category reflects the value of investments in that category as a percentage of net assets. |
* | | Non-income producing security. |
(a) | | Represents an affiliated fund/issuer. |
(b) | | All or a portion of security is on loan. |
(c) | | Variable rate security. Interest rate or distribution rate disclosed is that which is in effect on February 28, 2017. |
| | |
|
Investment Abbreviations: |
ADR | | —American Depositary Receipt |
PLC | | —Public Limited Company |
|
| | |
| 70 | | The accompanying notes are an integral part of these financial statements. |
GOLDMAN SACHS STRATEGIC GROWTH FUND
Schedule of Investments
February 28, 2017 (Unaudited)
| | | | | | | | |
Shares | | | Description | | Value | |
| | | | | | | | |
| Common Stocks – 98.2% | |
| Aerospace & Defense – 2.3% | |
| | 8,753 | | | General Dynamics Corp. | | $ | 1,661,407 | |
| | 16,690 | | | Northrop Grumman Corp. | | | 4,123,932 | |
| | 11,972 | | | The Boeing Co. | | | 2,157,714 | |
| | | | | | | | |
| | | | | | | 7,943,053 | |
| | |
| Banks – 1.4% | |
| | 78,780 | | | SunTrust Banks, Inc. | | | 4,686,622 | |
| | |
| Beverages – 2.9% | |
| | 32,397 | | | Brown-Forman Corp. Class B | | | 1,579,677 | |
| | 37,025 | | | Molson Coors Brewing Co. Class B | | | 3,716,940 | |
| | 69,423 | | | Monster Beverage Corp.* | | | 2,876,889 | |
| | 37,430 | | | The Coca-Cola Co. | | | 1,570,563 | |
| | | | | | | | |
| | | | | | | 9,744,069 | |
| | |
| Biotechnology – 3.4% | |
| | 29,278 | | | Celgene Corp.* | | | 3,616,126 | |
| | 28,574 | | | Gilead Sciences, Inc. | | | 2,013,896 | |
| | 21,732 | | | Incyte Corp.* | | | 2,892,529 | |
| | 32,397 | | | Vertex Pharmaceuticals, Inc.* | | | 2,935,816 | |
| | | | | | | | |
| | | | | | | 11,458,367 | |
| | |
| Building Products – 0.8% | |
| | 47,028 | | | Fortune Brands Home & Security, Inc. | | | 2,719,629 | |
| | |
| Capital Markets – 3.2% | |
| | 88,540 | | | Intercontinental Exchange, Inc. | | | 5,058,290 | |
| | 65,700 | | | Northern Trust Corp. | | | 5,738,895 | |
| | | | | | | | |
| | | | | | | 10,797,185 | |
| | |
| Chemicals – 2.0% | |
| | 18,613 | | | Ashland Global Holdings, Inc. | | | 2,245,845 | |
| | 11,469 | | | The Sherwin-Williams Co. | | | 3,538,645 | |
| | 49,300 | | | Valvoline, Inc.(a) | | | 1,105,306 | |
| | | | | | | | |
| | | | | | | 6,889,796 | |
| | |
| Consumer Finance* – 0.5% | |
| | 138,142 | | | SLM Corp. | | | 1,656,323 | |
| | |
| Energy Equipment & Services – 1.0% | |
| | 43,062 | | | Schlumberger Ltd. | | | 3,460,462 | |
| | |
| Equity Real Estate Investment Trusts (REITs) – 3.4% | |
| | 56,343 | | | American Tower Corp. | | | 6,467,613 | |
| | 13,775 | | | Equinix, Inc. | | | 5,180,364 | |
| | | | | | | | |
| | | | | | | 11,647,977 | |
| | |
| Food & Staples Retailing – 4.1% | |
| | 51,614 | | | Costco Wholesale Corp. | | | 9,144,968 | |
| | 38,365 | | | Walgreens Boots Alliance, Inc. | | | 3,313,969 | |
| | 44,873 | | | Whole Foods Market, Inc. | | | 1,376,255 | |
| | | | | | | | |
| | | | | | | 13,835,192 | |
| | |
| Food Products – 0.8% | |
| | 28,323 | | | The Kraft Heinz Co. | | | 2,591,838 | |
| | |
| Health Care Equipment & Supplies – 3.3% | |
| | 127,980 | | | Boston Scientific Corp.* | | | 3,141,909 | |
| | 58,557 | | | Danaher Corp. | | | 5,009,551 | |
| | |
| | | | | | | | |
| Common Stocks – (continued) | |
| Health Care Equipment & Supplies – (continued) | |
| | 33,303 | | | Edwards Lifesciences Corp.* | | | 3,131,814 | |
| | | | | | | | |
| | | | | | | 11,283,274 | |
| | |
| Health Care Providers & Services – 1.0% | |
| | 26,562 | | | Aetna, Inc. | | | 3,420,123 | |
| | |
| Hotels, Restaurants & Leisure – 2.4% | |
| | 7,717 | | | Chipotle Mexican Grill, Inc.* | | | 3,231,417 | |
| | 39,330 | | | McDonald’s Corp. | | | 5,020,474 | |
| | | | | | | | |
| | | | | | | 8,251,891 | |
| | |
| Household Durables – 0.7% | |
| | 47,691 | | | Newell Brands, Inc. | | | 2,338,290 | |
| | |
| Household Products – 0.5% | |
| | 24,651 | | | Colgate-Palmolive Co. | | | 1,799,030 | |
| | |
| Industrial Conglomerates – 3.3% | |
| | 15,477 | | | 3M Co. | | | 2,884,139 | |
| | 46,133 | | | Honeywell International, Inc. | | | 5,743,559 | |
| | 12,677 | | | Roper Technologies, Inc. | | | 2,652,028 | |
| | | | | | | | |
| | | | | | | 11,279,726 | |
| | |
| Internet & Direct Marketing Retail* – 6.5% | |
| | 15,091 | | | Amazon.com, Inc. | | | 12,752,499 | |
| | 30,888 | | | Netflix, Inc. | | | 4,390,111 | |
| | 2,816 | | | The Priceline Group, Inc. | | | 4,855,150 | |
| | | | | | | | |
| | | | | | | 21,997,760 | |
| | |
| Internet Software & Services* – 9.2% | |
| | 12,375 | | | Alphabet, Inc. Class A | | | 10,456,009 | |
| | 9,357 | | | Alphabet, Inc. Class C | | | 7,702,776 | |
| | 95,683 | | | Facebook, Inc. Class A | | | 12,968,874 | |
| | | | | | | | |
| | | | | | | 31,127,659 | |
| | |
| IT Services – 3.4% | |
| | 31,822 | | | Fiserv, Inc.* | | | 3,672,259 | |
| | 70,631 | | | MasterCard, Inc. Class A | | | 7,801,900 | |
| | | | | | | | |
| | | | | | | 11,474,159 | |
| | |
| Life Sciences Tools & Services – 1.5% | |
| | 46,282 | | | Agilent Technologies, Inc. | | | 2,374,267 | |
| | 15,940 | | | Illumina, Inc.* | | | 2,668,356 | |
| | | | | | | | |
| | | | | | | 5,042,623 | |
| | |
| Machinery – 3.2% | |
| | 52,520 | | | Fortive Corp. | | | 3,027,778 | |
| | 29,278 | | | The Middleby Corp.* | | | 4,061,151 | |
| | 75,763 | | | Xylem, Inc. | | | 3,645,716 | |
| | | | | | | | |
| | | | | | | 10,734,645 | |
| | |
| Media – 4.4% | |
| | 231,189 | | | Comcast Corp. Class A | | | 8,651,092 | |
| | 57,853 | | | The Walt Disney Co. | | | 6,369,037 | |
| | | | | | | | |
| | | | | | | 15,020,129 | |
| | |
| Oil, Gas & Consumable Fuels* – 0.6% | |
| | 15,091 | | | Concho Resources, Inc. | | | 1,998,803 | |
| | |
| | |
| The accompanying notes are an integral part of these financial statements. | | 71 |
GOLDMAN SACHS STRATEGIC GROWTH FUND
Schedule of Investments (continued)
February 28, 2017 (Unaudited)
| | | | | | | | |
Shares | | | Description | | Value | |
| Common Stocks – (continued) | |
| Personal Products – 0.5% | |
| | 19,518 | | | The Estee Lauder Cos., Inc. Class A | | $ | 1,617,066 | |
| | |
| Pharmaceuticals – 4.4% | |
| | 19,619 | | | Allergan PLC | | | 4,803,124 | |
| | 87,735 | | | Eli Lilly & Co. | | | 7,265,335 | |
| | 54,633 | | | Zoetis, Inc. | | | 2,912,485 | |
| | | | | | | | |
| | | | | | | 14,980,944 | |
| | |
| Road & Rail – 1.6% | |
| | 108,260 | | | CSX Corp. | | | 5,257,106 | |
| | |
| Semiconductors & Semiconductor Equipment – 0.9% | |
| | 39,339 | | | Texas Instruments, Inc. | | | 3,014,154 | |
| | |
| Software – 10.6% | |
| | 28,290 | | | Adobe Systems, Inc.* | | | 3,347,839 | |
| | 46,685 | | | Electronic Arts, Inc.* | | | 4,038,252 | |
| | 26,506 | | | Intuit, Inc. | | | 3,324,913 | |
| | 227,084 | | | Microsoft Corp. | | | 14,528,834 | |
| | 37,529 | | | Mobileye NV* | | | 1,708,320 | |
| | 111,681 | | | Oracle Corp. | | | 4,756,494 | |
| | 49,400 | | | salesforce.com, Inc.* | | | 4,018,690 | |
| | | | | | | | |
| | | | | | | 35,723,342 | |
| | |
| Specialty Retail – 3.7% | |
| | 11,151 | | | O’Reilly Automotive, Inc.* | | | 3,029,838 | |
| | 61,172 | | | Ross Stores, Inc. | | | 4,195,176 | |
| | 37,025 | | | The Home Depot, Inc. | | | 5,365,293 | |
| | | | | | | | |
| | | | | | | 12,590,307 | |
| | |
| Technology Hardware, Storage & Peripherals – 7.2% | |
| | 178,991 | | | Apple, Inc. | | | 24,519,977 | |
| | |
| Textiles, Apparel & Luxury Goods – 2.9% | |
| | 98,903 | | | Kate Spade & Co.* | | | 2,359,826 | |
| | 104,034 | | | NIKE, Inc. Class B | | | 5,946,583 | |
| | 16,197 | | | PVH Corp. | | | 1,483,645 | |
| | | | | | | | |
| | | | | | | 9,790,054 | |
| | |
| Tobacco – 0.6% | |
| | 17,809 | | | Philip Morris International, Inc. | | | 1,947,414 | |
| | |
| | TOTAL COMMON STOCKS | |
| | (Cost $221,054,411) | | $ | 332,638,989 | |
| | |
| | | | | | |
Shares | | Distribution Rate | | Value | |
| Investment Companies(b)(c) – 0.0% | |
Goldman Sachs Financial Square Government Fund – Institutional Shares | |
| 146 | | 0.470% | | $ | 146 | |
| (Cost $146) | | | | |
| |
TOTAL INVESTMENTS BEFORE SECURITIES LENDING REINVESTMENT VEHICLE | |
| (Cost $221,054,557) | | $ | 332,639,135 | |
| |
| Securities Lending Reinvestment Vehicle(b)(c) – 0.4% | |
Goldman Sachs Financial Square Government Fund – Institutional Shares | |
| 1,206,675 | | 0.470 | | | 1,206,675 | |
| (Cost $1,206,675) | | | | |
| |
| TOTAL INVESTMENTS – 98.6% | |
| (Cost $222,261,232) | | $ | 333,845,810 | |
| |
OTHER ASSETS IN EXCESS OF LIABILITIES – 1.4% | | | 4,833,611 | |
| |
| NET ASSETS – 100.0% | | $ | 338,679,421 | |
| |
| | |
| The percentage shown for each investment category reflects the value of investments in that category as a percentage of net assets. |
* | | Non-income producing security. |
(a) | | All or a portion of security is on loan. |
(b) | | Represents an Affiliated fund. |
(c) | | Variable rate security. Interest rate or distribution rate disclosed is that which is in effect on February 28, 2017. |
| | |
|
Investment Abbreviations: |
PLC | | —Public Limited Company |
|
| | |
| 72 | | The accompanying notes are an integral part of these financial statements. |
GOLDMAN SACHS TECHNOLOGY OPPORTUNITIES FUND
Schedule of Investments
February 28, 2017 (Unaudited)
| | | | | | | | |
Shares | | | Description | | Value | |
| Common Stocks – 99.3% | |
| Capital Markets – 1.5% | |
| | 105,118 | | | Intercontinental Exchange, Inc. | | $ | 6,005,391 | |
| | |
| Electronic Equipment, Instruments & Components – 3.6% | |
| | 209,651 | | | Amphenol Corp. Class A | | | 14,509,946 | |
| | |
| Equity Real Estate Investment Trusts (REITs) – 8.7% | |
| | 116,427 | | | American Tower Corp. | | | 13,364,655 | |
| | 25,848 | | | Equinix, Inc. | | | 9,720,657 | |
| | 102,654 | | | SBA Communications Corp.* | | | 11,884,254 | |
| | | | | | | | |
| | | | | | | 34,969,566 | |
| | |
| Internet & Direct Marketing Retail – 9.1% | |
| | 28,550 | | | Amazon.com, Inc.* | | | 24,125,892 | |
| | 43,024 | | | Expedia, Inc. | | | 5,121,577 | |
| | 4,339 | | | The Priceline Group, Inc.* | | | 7,481,000 | |
| | | | | | | | |
| | | | | | | 36,728,469 | |
| | |
| Internet Software & Services* – 15.5% | |
| | 21,204 | | | Alphabet, Inc. Class A | | | 17,915,896 | |
| | 20,142 | | | Alphabet, Inc. Class C | | | 16,581,096 | |
| | 173,248 | | | Facebook, Inc. Class A | | | 23,482,034 | |
| | 139,016 | | | Yelp, Inc. | | | 4,684,839 | |
| | | | | | | | |
| | | | | | | 62,663,865 | |
| | |
| IT Services – 13.1% | |
| | 187,962 | | | Black Knight Financial Services, Inc. Class A*(a) | | | 7,236,537 | |
| | 74,419 | | | Cognizant Technology Solutions Corp. Class A* | | | 4,410,814 | |
| | 49,337 | | | Fidelity National Information Services, Inc. | | | 4,058,955 | |
| | 26,518 | | | FleetCor Technologies, Inc.* | | | 4,508,060 | |
| | 44,602 | | | Gartner, Inc.* | | | 4,603,372 | |
| | 105,742 | | | Global Payments, Inc. | | | 8,426,580 | |
| | 120,038 | | | MasterCard, Inc. Class A | | | 13,259,398 | |
| | 116,050 | | | Total System Services, Inc. | | | 6,322,404 | |
| | | | | | | | |
| | | | | | | 52,826,120 | |
| | |
| Semiconductors & Semiconductor Equipment – 12.0% | |
| | 307,484 | | | Applied Materials, Inc. | | | 11,137,071 | |
| | 91,494 | | | Cavium, Inc.* | | | 5,993,772 | |
| | 155,120 | | | NXP Semiconductors NV* | | | 15,947,887 | |
| | 99,977 | | | Qorvo, Inc.* | | | 6,608,480 | |
| | 111,634 | | | Texas Instruments, Inc. | | | 8,553,397 | |
| | | | | | | | |
| | | | | | | 48,240,607 | |
| | |
| Software – 25.6% | |
| | 73,290 | | | Adobe Systems, Inc.* | | | 8,673,139 | |
| | 46,645 | | | Autodesk, Inc.* | | | 4,025,464 | |
| | 82,219 | | | Electronic Arts, Inc.* | | | 7,111,943 | |
| | 79,593 | | | Intuit, Inc. | | | 9,984,146 | |
| | 247,145 | | | Microsoft Corp. | | | 15,812,337 | |
| | 370,721 | | | Oracle Corp. | | | 15,789,007 | |
| | 105,587 | | | Red Hat, Inc.* | | | 8,743,659 | |
| | 95,443 | | | Salesforce.com, Inc.* | | | 7,764,288 | |
| | 130,164 | | | ServiceNow, Inc.* | | | 11,313,855 | |
| | 163,542 | | | Splunk, Inc.* | | | 10,095,448 | |
| | |
| Common Stocks – (continued) | |
| Software – (continued) | |
| | 45,867 | | | Workday, Inc. Class A* | | | 3,803,750 | |
| | | | | | | | |
| | | | | | | 103,117,036 | |
| | |
| Technology Hardware, Storage & Peripherals – 10.2% | |
| | 248,408 | | | Apple, Inc. | | | 34,029,412 | |
| | 157,958 | | | Electronics For Imaging, Inc.* | | | 7,277,125 | |
| | | | | | | | |
| | | | | | | 41,306,537 | |
| | |
| | TOTAL COMMON STOCKS | |
| | (Cost $225,427,127) | | $ | 400,367,537 | |
| | |
| TOTAL INVESTMENTS BEFORE SECURITIES
LENDING REINVESTMENT VEHICLE |
|
| | (Cost $225,427,127) | | $ | 400,367,537 | |
| | |
| | | | | | | | |
| Shares | | | Distribution
Rate | | Value | |
| Securities Lending Reinvestment Vehicle(b)(c) – 0.2% | |
| Goldman Sachs Financial Square Government Fund –
Institutional Shares |
|
| | 742,800 | | | 0.470% | | $ | 742,800 | |
| | (Cost $742,800) | | | | |
| | |
| | TOTAL INVESTMENTS – 99.5% | |
| | (Cost $226,169,927) | | $ | 401,110,337 | |
| | |
| OTHER ASSETS IN EXCESS OF
LIABILITIES – 0.5% | | | 1,896,840 | |
| | |
| | NET ASSETS – 100.0% | | $ | 403,007,177 | |
| | |
| | |
| The percentage shown for each investment category reflects the value of investments in that category as a percentage of net assets. |
* | | Non-income producing security. |
(a) | | All or a portion of security is on loan. |
(b) | | Represents an Affiliated fund. |
(c) | | Variable rate security. Interest rate or distribution rate disclosed is that which is in effect on February 28, 2017. |
| | |
| The accompanying notes are an integral part of these financial statements. | | 73 |
GOLDMAN SACHS FUNDAMENTAL EQUITY GROWTH FUNDS
Statements of Assets and Liabilities
February 28, 2017 (Unaudited)
| | | | | | |
| | | | | Capital Growth Fund | |
| | Assets: | | | | |
| | Investments of unaffiliated issuers, at value (cost $576,516,693, $90,105,895, $5,391,563, $11,803,655, $12,214,721, $2,242,630,139, $1,711,076,986, $221,054,411 and $225,427,127)(a) | | $ | 862,197,400 | |
| | Investments of affiliated issuers, at value (cost $290, $78, $50,469, $0, $713,488, $4,690, $65,972,097, $146 and $0) | | | 290 | |
| | Investments in securities lending reinvestment vehicle — affiliated issuer, at value which equals cost | | | 2,330,752 | |
| | Collateral received for securities on loan | | | 4,082,386 | |
| | Cash | | | 2,084,616 | |
| | Receivables: | | | | |
| | Investments sold | | | 3,944,419 | |
| | Dividends and interest | | | 1,122,564 | |
| | Fund shares sold | | | 58,797 | |
| | Reimbursement from investment adviser | | | 34,148 | |
| | Foreign tax reclaims | | | 32,145 | |
| | Securities lending income | | | 8,227 | |
| | Other assets | | | 12,219 | |
| | Total assets | | | 875,907,963 | |
| | | | | | |
| | Liabilities: | | | | |
| | Payables: | | | | |
| | Payable upon return of securities loaned | | | 6,413,138 | |
| | Investments purchased | | | 2,262,991 | |
| | Fund shares redeemed | | | 813,270 | |
| | Management fees | | | 464,440 | |
| | Distribution and Service fees and Transfer Agency fees | | | 282,054 | |
| | Accrued expenses | | | 162,987 | |
| | Total liabilities | | | 10,398,880 | |
| | | | | | |
| | Net Assets: | | | | |
| | Paid-in capital | | | 569,834,790 | |
| | Undistributed (distributions in excess of) net investment income (loss) | | | 420,674 | |
| | Accumulated net realized gain (loss) | | | 9,572,912 | |
| | Net unrealized gain | | | 285,680,707 | |
| | | NET ASSETS | | $ | 865,509,083 | |
| | | Net Assets: | | | | |
| | | Class A | | $ | 638,133,017 | |
| | | Class C | | | 69,339,645 | |
| | | Institutional | | | 146,252,029 | |
| | | Service | | | 1,718,779 | |
| | | Class IR | | | 6,499,535 | |
| | | Class R | | | 3,555,314 | |
| | | Class R6 | | | 10,764 | |
| | | Total Net Assets | | $ | 865,509,083 | |
| | | Shares Outstanding $0.001 par value (unlimited number of shares authorized): | | | | |
| | | Class A | | | 24,632,474 | |
| | | Class C | | | 3,484,928 | |
| | | Institutional | | | 5,177,253 | |
| | | Service | | | 68,492 | |
| | | Class IR | | | 247,853 | |
| | | Class R | | | 141,505 | |
| | | Class R6 | | | 381 | |
| | | Net asset value, offering and redemption price per share:(b) | | | | |
| | | Class A | | | $25.91 | |
| | | Class C | | | 19.90 | |
| | | Institutional | | | 28.25 | |
| | | Service | | | 25.09 | |
| | | Class IR | | | 26.22 | |
| | | Class R | | | 25.12 | |
| | | Class R6 | | | 28.24 | |
| | (a) | | Includes loaned securities having a market value of $6,256,629, $176,480, $32,281,220, $50,518,137, $1,172,940 and $1,434,040 for the Capital Growth, Flexible Cap Growth, Growth Opportunities, Small/Mid Cap Growth, Strategic Growth and Technology Opportunities Funds, respectively. |
| | (b) | | Maximum public offering price per share for Class A Shares of the Capital Growth, Concentrated Growth, Dynamic U.S. Equity, Flexible Cap Growth, Focused Growth, Growth Opportunities, Small/Mid Cap Growth, Strategic Growth and Technology Opportunities Funds is $27.42, $16.91, $15.09, $13.33, $15.69, $23.07, $21.22, $13.11 and $20.73, respectively. At redemption, Class C Shares may be subject to a contingent deferred sales charge, assessed on the amount equal to the lesser of the current net asset value (“NAV”) or the original purchase price of the shares. |
| | |
| 74 | | The accompanying notes are an integral part of these financial statements. |
GOLDMAN SACHS FUNDAMENTAL EQUITY GROWTH FUNDS
| | | | | | | | | | | | | | | | | | | | | | | | | | | | | | | | | | | | | | | | | | | | | | |
| | | Concentrated
Growth Fund | | | | | Dynamic U.S.
Equity Fund | | | | | Flexible Cap
Growth Fund | | | | | Focused
Growth Fund | | | | | Growth
Opportunities
Fund | | | | | Small/Mid Cap
Growth Fund | | | | | Strategic
Growth Fund | | | | | Technology
Opportunities
Fund | |
| | | | | | | | | | | | | | | | | | | | | | | | | | | | | | | | | | | | | | | | | | | | | | |
| | $ | 129,580,273 | | | | | $ | 7,190,537 | | | | | $ | 16,992,006 | | | | | $ | 15,951,414 | | | | | $ | 2,864,114,058 | | | | | $ | 2,123,901,713 | | | | | $ | 332,638,989 | | | | | $ | 400,367,537 | |
| | | 78 | | | | | | 50,469 | | | | | | — | | | | | | 713,488 | | | | | | 4,690 | | | | | | 67,989,571 | | | | | | 146 | | | | | | — | |
| | | — | | | | | | — | | | | | | 94,800 | | | | | | — | | | | | | 18,866,365 | | | | | | 35,820,930 | | | | | | 1,206,675 | | | | | | 742,800 | |
| | | — | | | | | | — | | | | | | 86,151 | | | | | | — | | | | | | 14,190,856 | | | | | | 15,952,770 | | | | | | — | | | | | | 724,450 | |
| | | 806,611 | | | | | | 110,828 | | | | | | 54,900 | | | | | | 244,601 | | | | | | 33,073,607 | | | | | | 34,045,440 | | | | | | 1,182,594 | | | | | | 2,929,407 | |
| | | | | | | | | | | | | | | | | | | | | | | | | | | | | | | | | | | | | | | | | | | | | | |
| | | 1,110,873 | | | | | | 192,295 | | | | | | 340,751 | | | | | | — | | | | | | 22,900,534 | | | | | | 24,623,006 | | | | | | 22,611,613 | | | | | | 4,745,069 | |
| | | 162,134 | | | | | | 14,450 | | | | | | 20,928 | | | | | | 16,620 | | | | | | 2,410,471 | | | | | | 1,569,616 | | | | | | 467,083 | | | | | | 178,831 | |
| | | 7,917 | | | | | | 104 | | | | | | 11,904 | | | | | | 50 | | | | | | 1,929,686 | | | | | | 2,712,088 | | | | | | 219,924 | | | | | | 308,380 | |
| | | 19,550 | | | | | | 25,613 | | | | | | 22,203 | | | | | | 22,600 | | | | | | 27,351 | | | | | | — | | | | | | 23,332 | | | | | | 24,487 | |
| | | — | | | | | | 233 | | | | | | — | | | | | | — | | | | | | — | | | | | | — | | | | | | — | | | | | | — | |
| | | — | | | | | | — | | | | | | 211 | | | | | | — | | | | | | 79,813 | | | | | | 64,058 | | | | | | 3,845 | | | | | | 3,704 | |
| | | 1,234 | | | | | | 3,281 | | | | | | 3,596 | | | | | | 3,004 | | | | | | 16,127 | | | | | | 13,109 | | | | | | 5,248 | | | | | | 2,245 | |
| | | 131,688,670 | | | | | | 7,587,810 | | | | | | 17,627,450 | | | | | | 16,951,777 | | | | | | 2,957,613,558 | | | | | | 2,306,692,301 | | | | | | 358,359,449 | | | | | | 410,026,910 | |
| | | | | | | | | | | | | | | | | | | | | | | | | | | | | | | | | | | | | | | | | | | | | | |
| | | | | | | | | | | | | | | | | | | | | | | | | | | | | | | | | | | | | | | | | | | | | | |
| | | | | | | | | | | | | | | | | | | | | | | | | | | | | | | | | | | | | | | | | | | | | | |
| | | — | | | | | | — | | | | | | 180,951 | | | | | | — | | | | | | 33,057,221 | | | | | | 51,773,700 | | | | | | 1,206,675 | | | | | | 1,467,250 | |
| | | 78 | | | | | | 183,827 | | | | | | 42,841 | | | | | | 62 | | | | | | 4,033,203 | | | | | | 14,246,388 | | | | | | 146 | | | | | | 4,076,209 | |
| | | 55,270 | | | | | | 87 | | | | | | 11,856 | | | | | | 683,938 | | | | | | 9,900,688 | | | | | | 5,366,509 | | | | | | 18,165,040 | | | | | | 899,169 | |
| | | 77,663 | | | | | | 4,174 | | | | | | 10,257 | | | | | | 9,586 | | | | | | 2,004,065 | | | | | | 1,455,523 | | | | | | 190,789 | | | | | | 290,170 | |
| | | 7,484 | | | | | | 966 | | | | | | 3,165 | | | | | | 743 | | | | | | 358,584 | | | | | | 449,359 | | | | | | 33,762 | | | | | | 131,742 | |
| | | 85,564 | | | | | | 49,754 | | | | | | 48,878 | | | | | | 36,076 | | | | | | 399,548 | | | | | | 332,284 | | | | | | 83,616 | | | | | | 155,193 | |
| | | 226,059 | | | | | | 238,808 | | | | | | 297,948 | | | | | | 730,405 | | | | | | 49,753,309 | | | | | | 73,623,763 | | | | | | 19,680,028 | | | | | | 7,019,733 | |
| | | | | | | | | | | | | | | | | | | | | | | | | | | | | | | | | | | | | | | | | | | | | | |
| | | | | | | | | | | | | | | | | | | | | | | | | | | | | | | | | | | | | | | | | | | | | | |
| | | 89,294,404 | | | | | | 5,531,397 | | | | | | 11,712,027 | | | | | | 13,453,022 | | | | | | 2,196,699,884 | | | | | | 1,775,291,411 | | | | | | 217,669,531 | | | | | | 224,410,756 | |
| | | 81,636 | | | | | | 10,965 | | | | | | 1,685 | | | | | | 44,563 | | | | | | (12,834,236 | ) | | | | | (15,635,142 | ) | | | | | 608,737 | | | | | | (3,403,351 | ) |
| | | 2,612,193 | | | | | | 7,666 | | | | | | 427,439 | | | | | | (1,012,906 | ) | | | | | 102,510,681 | | | | | | 58,570,067 | | | | | | 8,816,575 | | | | | | 7,059,362 | |
| | | 39,474,378 | | | | | | 1,798,974 | | | | | | 5,188,351 | | | | | | 3,736,693 | | | | | | 621,483,919 | | | | | | 414,842,201 | | | | | | 111,584,578 | | | | | | 174,940,410 | |
| | | $ | 131,462,611 | | | | | $ | 7,349,002 | | | | | $ | 17,329,502 | | | | | $ | 16,221,372 | | | | | $ | 2,907,860,248 | | | | | $ | 2,233,068,537 | | | | | $ | 338,679,421 | | | | | $ | 403,007,177 | |
| | | | | | | | | | | | | | | | | | | | | | | | | | | | | | | | | | | | | | | | | | | | | | | |
| | | | $5,575,787 | | | | | $ | 1,922,423 | | | | | $ | 5,148,295 | | | | | $ | 220,901 | | | | | $ | 527,488,465 | | | | | $ | 400,437,035 | | | | | $ | 46,179,638 | | | | | $ | 231,590,520 | |
| | | | 2,154,453 | | | | | | 168,466 | | | | | | 1,274,239 | | | | | | 181,926 | | | | | | 106,986,900 | | | | | | 226,600,908 | | | | | | 9,846,922 | | | | | | 52,544,252 | |
| | | | 123,086,761 | | | | | | 4,951,572 | | | | | | 10,308,881 | | | | | | 15,728,957 | | | | | | 1,945,526,975 | | | | | | 1,094,555,665 | | | | | | 280,695,358 | | | | | | 83,052,531 | |
| | | | — | | | | | | — | | | | | | — | | | | | | — | | | | | | 33,147,423 | | | | | | 14,887,406 | | | | | | 430,805 | | | | | | 13,047,559 | |
| | | | 609,346 | | | | | | 274,979 | | | | | | 551,998 | | | | | | 61,208 | | | | | | 134,256,811 | | | | | | 448,105,208 | | | | | | 1,352,807 | | | | | | 22,772,315 | |
| | | | 25,698 | | | | | | 20,834 | | | | | | 35,545 | | | | | | 17,898 | | | | | | 59,337,273 | | | | | | 29,676,482 | | | | | | 163,074 | | | | | | — | |
| | | | 10,566 | | | | | | 10,728 | | | | | | 10,544 | | | | | | 10,482 | | | | | | 101,116,401 | | | | | | 18,805,833 | | | | | | 10,817 | | | | | | — | |
| | | | $131,462,611 | | | | | $ | 7,349,002 | | | | | $ | 17,329,502 | | | | | $ | 16,221,372 | | | | | $ | 2,907,860,248 | | | | | $ | 2,233,068,537 | | | | | $ | 338,679,421 | | | | | $ | 403,007,177 | |
| | | | | | | | | | | | | | | | | | | | | | | | | | | | | | | | | | | | | | | | | | | | | | | |
| | | | 349,013 | | | | | | 134,834 | | | | | | 408,530 | | | | | | 14,896 | | | | | | 24,193,405 | | | | | | 19,974,995 | | | | | | 3,725,959 | | | | | | 11,824,711 | |
| | | | 158,525 | | | | | | 12,161 | | | | | | 111,277 | | | | | | 12,642 | | | | | | 6,526,212 | | | | | | 12,745,368 | | | | | | 952,385 | | | | | | 3,164,991 | |
| | | | 7,291,535 | | | | | | 345,939 | | | | | | 775,891 | | | | | | 1,048,121 | | | | | | 77,799,095 | | | | | | 51,694,598 | | | | | | 21,329,850 | | | | | | 3,892,450 | |
| | | | — | | | | | | — | | | | | | — | | | | | | — | | | | | | 1,579,603 | | | | | | 758,570 | | | | | | 34,958 | | | | | | 677,700 | |
| | | | 37,649 | | | | | | 19,201 | | | | | | 42,237 | | | | | | 4,089 | | | | | | 5,935,248 | | | | | | 21,713,748 | | | | | | 102,801 | | | | | | 1,079,727 | |
| | | | 1,652 | | | | | | 1,455 | | | | | | 2,904 | | | | | | 1,214 | | | | | | 2,819,040 | | | | | | 1,522,943 | | | | | | 13,362 | | | | | | — | |
| | | | 626 | | | | | | 749 | | | | | | 794 | | | | | | 698 | | | | | | 4,042,408 | | | | | | 887,893 | | | | | | 823 | | | | | | — | |
| | | | | | | | | | | | | | | | | | | | | | | | | | | | | | | | | | | | | | | | | | | | | | | |
| | | | $15.98 | | | | | | $14.26 | | | | | | $12.60 | | | | | | $14.83 | | | | | | $21.80 | | | | | | $20.05 | | | | | | $12.39 | | | | | | $19.59 | |
| | | | 13.59 | | | | | | 13.85 | | | | | | 11.45 | | | | | | 14.39 | | | | | | 16.39 | | | | | | 17.78 | | | | | | 10.34 | | | | | | 16.60 | |
| | | | 16.88 | | | | | | 14.31 | | | | | | 13.29 | | | | | | 15.01 | | | | | | 25.01 | | | | | | 21.17 | | | | | | 13.16 | | | | | | 21.34 | |
| | | | — | | | | | | — | | | | | | — | | | | | | — | | | | | | 20.98 | | | | | | 19.63 | | | | | | 12.32 | | | | | | 19.25 | |
| | | | 16.18 | | | | | | 14.32 | | | | | | 13.07 | | | | | | 14.97 | | | | | | 22.62 | | | | | | 20.64 | | | | | | 13.16 | | | | | | 21.09 | |
| | | | 15.55 | | | | | | 14.32 | | | | | | 12.24 | | | | | | 14.75 | | | | | | 21.05 | | | | | | 19.49 | | | | | | 12.20 | | | | | | — | |
| | | | 16.88 | | | | | | 14.32 | | | | | | 13.29 | | | | | | 15.01 | | | | | | 25.01 | | | | | | 21.18 | | | | | | 13.15 | | | | | | — | |
| | |
| The accompanying notes are an integral part of these financial statements. | | 75 |
GOLDMAN SACHS FUNDAMENTAL EQUITY GROWTH FUNDS
Statements of Operations
For the Six Months Ended February 28, 2017 (Unaudited)
| | | | | | |
| | | | | Capital
Growth Fund | |
| | Investment income: | | | | |
| | Dividends — unaffiliated issuers (net of foreign withholding taxes of $12,313, $0, $0, $0, $0, $0, $0, $31,343 and $0) | | $ | 5,107,601 | |
| | Dividends — affiliated issuers | | | 6,042 | |
| | Interest | | | — | |
| | Securities lending income — affiliated issuer | | | 22,417 | |
| | Total investment income | | | 5,136,060 | |
| | | | | | |
| | Expenses: | | | | |
| | Management fees | | | 4,122,469 | |
| | Distribution and Service fees(a) | | | 1,102,598 | |
| | Transfer Agency fees(a) | | | 677,809 | |
| | Printing and mailing costs | | | 74,364 | |
| | Custody, accounting and administrative services | | | 53,208 | |
| | Professional fees | | | 43,608 | |
| | Registration fees | | | 42,633 | |
| | Trustee fees | | | 9,163 | |
| | Service Share fees — Service Plan | | | 1,961 | |
| | Service Share fees — Shareholder Administration Plan | | | 1,961 | |
| | Other | | | 14,646 | |
| | Total expenses | | | 6,144,420 | |
| | Less — expense reductions | | | (1,419,792 | ) |
| | Net expenses | | | 4,724,628 | |
| | NET INVESTMENT INCOME (LOSS) | | | 411,432 | |
| | | | | | |
| | Realized and unrealized gain (loss): | | | | |
| | Net realized gain (loss) from: | | | | |
| | Investments — unaffiliated issuers (including commission recapture of $0, $6,046, $84, $157, $386, $65,784, $42,431, $10,796 and $2,497) | | | 12,657,298 | |
| | Investments — affiliated issuers | | | — | |
| | Net change in unrealized gain (loss) on: | | | | |
| | Investments — unaffiliated issuers | | | 57,582,491 | |
| | Investments — affiliated issuers | | | — | |
| | Net realized and unrealized gain | | | 70,239,789 | |
| | NET INCREASE IN NET ASSETS RESULTING FROM OPERATIONS | | $ | 70,651,221 | |
| | (a) | | Class specific Distribution and Service and Transfer Agency fees were as follows: |
| | | | | | | | | | | | | | | | | | | | | | | | | | | | | | | | | | | | | | | | |
| | | Distribution and Service Fees | | | Transfer Agency Fees | |
Fund | | Class A | | | Class C | | | Class R | | | Class A | | | Class C | | | Institutional | | | Service | | | Class IR | | | Class R | | | Class R6 | |
Capital Growth | | $ | 761,825 | | | $ | 332,185 | | | $ | 8,588 | | | $ | 578,987 | | | $ | 63,115 | | | $ | 27,807 | | | $ | 314 | | | $ | 4,321 | | | $ | 3,263 | | | $ | 2 | |
Concentrated Growth | | | 6,972 | | | | 10,406 | | | | 58 | | | | 5,299 | | | | 1,977 | | | | 24,677 | | | | — | | | | 390 | | | | 22 | | | | 2 | |
Dynamic U.S. Equity | | | 2,451 | | | | 807 | | | | 48 | | | | 1,863 | | | | 153 | | | | 1,025 | | | | — | | | | 173 | | | | 18 | | | | 2 | |
Flexible Cap Growth | | | 6,863 | | | | 6,540 | | | | 72 | | | | 5,215 | | | | 1,243 | | | | 1,892 | | | | — | | | | 222 | | | | 27 | | | | 2 | |
Focused Growth | | | 287 | | | | 842 | | | | 42 | | | | 219 | | | | 160 | | | | 3,944 | | | | — | | | | 54 | | | | 16 | | | | 2 | |
Growth Opportunities | | | 694,786 | | | | 569,869 | | | | 147,630 | | | | 528,037 | | | | 108,275 | | | | 396,908 | | | | 6,865 | | | | 122,125 | | | | 56,100 | | | | 8,311 | |
Small/Mid Cap Growth | | | 773,798 | | | | 1,186,513 | | | | 78,060 | | | | 588,086 | | | | 225,438 | | | | 225,807 | | | | 2,749 | | | | 288,988 | | | | 29,663 | | | | 1,358 | |
Strategic Growth | | | 55,075 | | | | 50,747 | | | | 327 | | | | 41,857 | | | | 9,642 | | | | 54,756 | | | | 58 | | | | 844 | | | | 124 | | | | 2 | |
Technology Opportunities | | | 285,624 | | | | 255,794 | | | | — | | | | 217,074 | | | | 48,601 | | | | 16,413 | | | | 2,347 | | | | 9,728 | | | | — | | | | — | |
| | |
| 76 | | The accompanying notes are an integral part of these financial statements. |
GOLDMAN SACHS FUNDAMENTAL EQUITY GROWTH FUNDS
| | | | | | | | | | | | | | | | | | | | | | | | | | | | | | | | | | | | | | | | | | | | | | | | |
| | | Concentrated
Growth Fund | | | | | Dynamic U.S.
Equity Fund | | | | | Flexible Cap
Growth Fund | | | | | Focused Growth
Fund | | | | | Growth
Opportunities
Fund | | | | | Small/Mid Cap
Growth Fund | | | | | Strategic
Growth Fund | | | | | | Technology
Opportunities
Fund | |
| | | | | | | | | | | | | | | | | | | | | | | | | | | | | | | | | | | | | | | | | | | | | | | | |
| | $ | 799,253 | | | | | $ | 60,622 | | | | | $ | 92,747 | | | | | $ | 129,123 | | | | | $ | 10,836,388 | | | | | $ | 8,748,841 | | | | | $ | 1,990,554 | | | | | | | $ | 1,325,975 | |
| | | 1,502 | | | | | | 69 | | | | | | 81 | | | | | | 378 | | | | | | 21,911 | | | | | | 13,211 | | | | | | 1,874 | | | | | | | | 110 | |
| | | 304 | | | | | | — | | | | | | 47 | | | | | | 24 | | | | | | — | | | | | | 2,393 | | | | | | 1,345 | | | | | | | | 1,654 | |
| | | — | | | | | | — | | | | | | 563 | | | | | | — | | | | | | 221,079 | | | | | | 190,643 | | | | | | 10,433 | | | | | | | | 10,019 | |
| | | 801,059 | | | | | | 60,691 | | | | | | 93,438 | | | | | | 129,525 | | | | | | 11,079,378 | | | | | | 8,955,088 | | | | | | 2,004,206 | | | | | | | | 1,337,758 | |
| | | | | | | | | | | | | | | | | | | | | | | | | | | | | | | | | | | | | | | | | | | | | | | | |
| | | | | | | | | | | | | | | | | | | | | | | | | | | | | | | | | | | | | | | | | | | | | | | | |
| | | 657,441 | | | | | | 26,101 | | | | | | 82,648 | | | | | | 101,019 | | | | | | 14,309,012 | | | | | | 11,558,341 | | | | | | 1,646,544 | | | | | | | | 1,918,489 | |
| | | 17,436 | | | | | | 3,306 | | | | | | 13,475 | | | | | | 1,171 | | | | | | 1,412,285 | | | | | | 2,038,371 | | | | | | 106,149 | | | | | | | | 541,418 | |
| | | 32,367 | | | | | | 3,234 | | | | | | 8,601 | | | | | | 4,395 | | | | | | 1,226,621 | | | | | | 1,362,089 | | | | | | 107,283 | | | | | | | | 294,163 | |
| | | 12,934 | | | | | | 10,117 | | | | | | 10,600 | | | | | | 10,107 | | | | | | 157,064 | | | | | | 136,011 | | | | | | 21,708 | | | | | | | | 53,544 | |
| | | 23,994 | | | | | | 21,451 | | | | | | 24,729 | | | | | | 21,447 | | | | | | 96,461 | | | | | | 90,147 | | | | | | 32,595 | | | | | | | | 32,123 | |
| | | 41,049 | | | | | | 49,425 | | | | | | 40,437 | | | | | | 41,000 | | | | | | 43,608 | | | | | | 35,923 | | | | | | 42,426 | | | | | | | | 39,957 | |
| | | 35,763 | | | | | | 58,400 | | | | | | 40,820 | | | | | | 42,617 | | | | | | 61,618 | | | | | | 74,754 | | | | | | 43,291 | | | | | | | | 30,876 | |
| | | 8,418 | | | | | | 8,272 | | | | | | 8,282 | | | | | | 8,291 | | | | | | 11,627 | | | | | | 10,991 | | | | | | 8,651 | | | | | | | | 8,672 | |
| | | — | | | | | | — | | | | | | — | | | | | | — | | | | | | 42,905 | | | | | | 17,183 | | | | | | 360 | | | | | | | | 14,670 | |
| | | — | | | | | | — | | | | | | — | | | | | | — | | | | | | 42,905 | | | | | | 17,183 | | | | | | 360 | | | | | | | | 14,670 | |
| | | 5,093 | | | | | | 3,325 | | | | | | 3,425 | | | | | | 3,540 | | | | | | 38,137 | | | | | | 57,480 | | | | | | 8,346 | | | | | | | | 7,873 | |
| | | 834,495 | | | | | | 183,631 | | | | | | 233,017 | | | | | | 233,587 | | | | | | 17,442,243 | | | | | | 15,398,473 | | | | | | 2,017,713 | | | | | | | | 2,956,455 | |
| | | (270,326 | ) | | | | | (148,004 | ) | | | | | (146,542 | ) | | | | | (151,013 | ) | | | | | (1,415,950 | ) | | | | | (1,762,063 | ) | | | | | (628,722 | ) | | | | | | | (159,969 | ) |
| | | 564,169 | | | | | | 35,627 | | | | | | 86,475 | | | | | | 82,574 | | | | | | 16,026,293 | | | | | | 13,636,410 | | | | | | 1,388,991 | | | | | | | | 2,796,486 | |
| | | 236,890 | | | | | | 25,064 | | | | | | 6,963 | | | | | | 46,951 | | | | | | (4,946,915 | ) | | | | | (4,681,322 | ) | | | | | 615,215 | | | | | | | | (1,458,728 | ) |
| | | | | | | | | | | | | | | | | | | | | | | | | | | | | | | | | | | | | | | | | | | | | | | | |
| | | | | | | | | | | | | | | | | | | | | | | | | | | | | | | | | | | | | | | | | | | | | | | | |
| | | | | | | | | | | | | | | | | | | | | | | | | | | | | | | | | | | | | | | | | | | | | | | | |
| | | | | | | | | | | | | | | |
| | | 5,683,761 | | | | | | 428,395 | | | | | | 530,427 | | | | | | 593,869 | | | | | | 137,151,495 | | | | | | 88,621,616 | | | | | | 18,856,088 | | | | | | | | 9,146,249 | |
| | | — | | | | | | — | | | | | | — | | | | | | — | | | | | | — | | | | | | (19,541 | ) | | | | | — | | | | | | | | — | |
| | | | | | | | | | | | | | | | | | | | | | | | | | | | | | | | | | | | | | | | | | | | | | | | |
| | | 2,592,678 | | | | | | 248,271 | | | | | | 688,364 | | | | | | 59,118 | | | | | | (46,777,482 | ) | | | | | 6,643,986 | | | | | | 6,398,691 | | | | | | | | 28,562,925 | |
| | | — | | | | | | — | | | | | | — | | | | | | — | | | | | | — | | | | | | 2,460,224 | | | | | | — | | | | | | | | — | |
| | | 8,276,439 | | | | | | 676,666 | | | | | | 1,218,791 | | | | | | 652,987 | | | | | | 90,374,013 | | | | | | 97,706,285 | | | | | | 25,254,779 | | | | | | | | 37,709,174 | |
| | $ | 8,513,329 | | | | | $ | 701,730 | | | | | $ | 1,225,754 | | | | | $ | 699,938 | | | | | $ | 85,427,098 | | | | | $ | 93,024,963 | | | | | $ | 25,869,994 | | | | | | | $ | 36,250,446 | |
| | |
| The accompanying notes are an integral part of these financial statements. | | 77 |
GOLDMAN SACHS FUNDAMENTAL EQUITY GROWTH FUNDS
Statements of Changes in Net Assets
| | | | | | | | | | |
| | | | | Capital Growth Fund | |
| | | | | For the
Six Months Ended
February 28, 2017
(Unaudited) | | | For the Fiscal
Year Ended
August 31, 2016 | |
| | From operations: | | | | | | | | |
| | Net investment income (loss) | | $ | 411,432 | | | $ | 1,001,228 | |
| | Net realized gain (loss) | | | 12,657,298 | | | | 12,702,788 | |
| | Net change in unrealized gain (loss) | | | 57,582,491 | | | | 32,983,438 | |
| | Net increase (decrease) in net assets resulting from operations | | | 70,651,221 | | | | 46,687,454 | |
| | | | | | | | | | |
| | Distributions to shareholders: | | | | | | | | |
| | From net investment income | | | | | | | | |
| | Class A Shares | | | (351,955 | ) | | | — | |
| | Class C Shares | | | — | | | | — | |
| | Institutional Shares | | | (602,702 | ) | | | (262,248 | ) |
| | Service Shares | | | — | | | | — | |
| | Class IR Shares | | | (15,368 | ) | | | (3,425 | ) |
| | Class R Shares | | | — | | | | — | |
| | Class R6 Shares | | | (45 | ) | | | (18 | ) |
| | From net realized gains | | | | | | | | |
| | Class A Shares | | | (8,263,004 | ) | | | (53,960,173 | ) |
| | Class C Shares | | | (1,166,606 | ) | | | (7,608,296 | ) |
| | Institutional Shares | | | (1,734,258 | ) | | | (13,105,149 | ) |
| | Service Shares | | | (21,688 | ) | | | (152,819 | ) |
| | Class IR Shares | | | (59,705 | ) | | | (374,339 | ) |
| | Class R Shares | | | (48,146 | ) | | | (304,242 | ) |
| | Class R6 Shares | | | (123 | ) | | | (712 | ) |
| | Total distributions to shareholders | | | (12,263,600 | ) | | | (75,771,421 | ) |
| | | | | | | | | | |
| | From share transactions: | | | | | | | | |
| | Proceeds from sales of shares | | | 16,678,702 | | | | 34,992,956 | |
| | Reinvestment of distributions | | | 11,586,016 | | | | 71,646,769 | |
| | Cost of shares redeemed | | | (70,954,188 | ) | | | (155,817,837 | ) |
| | Net decrease in net assets resulting from share transactions | | | (42,689,470 | ) | | | (49,178,112 | ) |
| | TOTAL INCREASE (DECREASE) | | | 15,698,151 | | | | (78,262,079 | ) |
| | | | | | | | | | |
| | Net assets: | | | | | | | | |
| | Beginning of period | | | 849,810,932 | | | | 928,073,011 | |
| | End of period | | $ | 865,509,083 | | | $ | 849,810,932 | |
| | Undistributed net investment income | | $ | 420,674 | | | $ | 979,312 | |
| | |
| 78 | | The accompanying notes are an integral part of these financial statements. |
GOLDMAN SACHS FUNDAMENTAL EQUITY GROWTH FUNDS
| | | | | | | | | | | | | | | | | | | | | | |
| | | Concentrated Growth Fund | | | | | Dynamic U.S. Equity Fund | |
| | | For the Six Months Ended February 28, 2017 (Unaudited) | | | | | For the Fiscal
Year Ended August 31, 2016 | | | | | For the Six Months Ended February 28, 2017 (Unaudited) | | | | | For the Fiscal
Year Ended
August 31, 2016 | |
| | | | | | | | | | | | | | | | | | | | | | |
| | $ | 236,890 | | | | | $ | 600,808 | | | | | $ | 25,064 | | | | | $ | 104,373 | |
| | | 5,683,761 | | | | | | (2,449,540 | ) | | | | | 428,395 | | | | | | (63,632 | ) |
| | | 2,592,678 | | | | | | 9,687,706 | | | | | | 248,271 | | | | | | 332,852 | |
| | | 8,513,329 | | | | | | 7,838,974 | | | | | | 701,730 | | | | | | 373,593 | |
| | | | | | | | | | | | | | | | | | | | | | |
| | | | | | | | | | | | | | | | | | | | | | |
| | | | | | | | | | | | | | | | | | | | | | |
| | | (11,087 | ) | | | | | — | | | | | | (10,370 | ) | | | | | (17,622 | ) |
| | | — | | | | | | — | | | | | | — | | | | | | — | |
| | | (751,721 | ) | | | | | (373,404 | ) | | | | | (57,578 | ) | | | | | (103,664 | ) |
| | | — | | | | | | — | | | | | | — | | | | | | — | |
| | | (2,033 | ) | | | | | (483 | ) | | | | | (1,491 | ) | | | | | (2,981 | ) |
| | | — | | | | | | — | | | | | | — | | | | | | — | |
| | | (63 | ) | | | | | (26 | ) | | | | | (101 | ) | | | | | (102 | ) |
| | | | | | | | | | | | | | | | | | | | | | |
| | | (23,848 | ) | | | | | (842,410 | ) | | | | | (326 | ) | | | | | (290,672 | ) |
| | | (10,841 | ) | | | | | (395,561 | ) | | | | | (23 | ) | | | | | (33,918 | ) |
| | | (508,883 | ) | | | | | (16,282,694 | ) | | | | | (796 | ) | | | | | (976,319 | ) |
| | | — | | | | | | — | | | | | | — | | | | | | — | |
| | | (1,669 | ) | | | | | (36,485 | ) | | | | | (31 | ) | | | | | (40,105 | ) |
| | | (104 | ) | | | | | (3,308 | ) | | | | | (3 | ) | | | | | (5,478 | ) |
| | | (40 | ) | | | | | (1,002 | ) | | | | | (2 | ) | | | | | (901 | ) |
| | | (1,310,289 | ) | | | | | (17,935,373 | ) | | | | | (70,721 | ) | | | | | (1,471,762 | ) |
| | | | | | | | | | | | | | | | | | | | | | |
| | | | | | | | | | | | | | | | | | | | | | |
| | | 3,176,560 | | | | | | 6,131,931 | | | | | | 1,572,137 | | | | | | 1,218,198 | |
| | | 1,290,974 | | | | | | 17,572,644 | | | | | | 70,721 | | | | | | 1,161,930 | |
| | | (24,274,080 | ) | | | | | (36,526,581 | ) | | | | | (2,183,321 | ) | | | | | (9,246,741 | ) |
| | | (19,806,546 | ) | | | | | (12,822,006 | ) | | | | | (540,463 | ) | | | | | (6,866,613 | ) |
| | | (12,603,506 | ) | | | | | (22,918,405 | ) | | | | | 90,546 | | | | | | (7,964,782 | ) |
| | | | | | | | | | | | | | | | | | | | | | |
| | | | | | | | | | | | | | | | | | | | | | |
| | | 144,066,117 | | | | | | 166,984,522 | | | | | | 7,258,456 | | | | | | 15,223,238 | |
| | $ | 131,462,611 | | | | | $ | 144,066,117 | | | | | $ | 7,349,002 | | | | | $ | 7,258,456 | |
| | $ | 81,636 | | | | | $ | 609,650 | | | | | $ | 10,965 | | | | | $ | 55,441 | |
| | |
| The accompanying notes are an integral part of these financial statements. | | 79 |
GOLDMAN SACHS FUNDAMENTAL EQUITY GROWTH FUNDS
Statements of Changes in Net Assets (continued)
| | | | | | | | | | |
| | | | | Flexible Cap Growth Fund | |
| | | | | For the Six Months Ended
February 28, 2017
(Unaudited) | | | For the Fiscal
Year Ended
August 31, 2016 | |
| | From operations: | | | | | | | | |
| | Net investment income (loss) | | $ | 6,963 | | | $ | (13,099 | ) |
| | Net realized gain (loss) | | | 530,427 | | | | 193,770 | |
| | Net change in unrealized gain (loss) | | | 688,364 | | | | 596,395 | |
| | Net increase (decrease) in net assets resulting from operations | | | 1,225,754 | | | | 777,066 | |
| | | | | | | | | | |
| | Distributions to shareholders: | | | | | | | | |
| | From net investment income | | | | | | | | |
| | Class A Shares | | | — | | | | — | |
| | Class C Shares | | | — | | | | — | |
| | Institutional Shares | | | — | | | | — | |
| | Service Shares | | | — | | | | — | |
| | Class IR Shares | | | — | | | | — | |
| | Class R Shares | | | — | | | | — | |
| | Class R6 Shares | | | — | | | | — | |
| | From net realized gains | | | | | | | | |
| | Class A Shares | | | (5,826 | ) | | | (458,035 | ) |
| | Class C Shares | | | (1,496 | ) | | | (116,932 | ) |
| | Institutional Shares | | | (9,494 | ) | | | (497,675 | ) |
| | Service Shares | | | — | | | | — | |
| | Class IR Shares | | | (198 | ) | | | (13,475 | ) |
| | Class R Shares | | | (27 | ) | | | (2,254 | ) |
| | Class R6 Shares | | | (10 | ) | | | (544 | ) |
| | Total distributions to shareholders | | | (17,051 | ) | | | (1,088,915 | ) |
| | | | | | | | | | |
| | From share transactions: | | | | | | | | |
| | Proceeds from sales of shares | | | 2,071,708 | | | | 3,195,796 | |
| | Reinvestment of distributions | | | 17,051 | | | | 1,088,915 | |
| | Cost of shares redeemed | | | (2,943,848 | ) | | | (4,728,552 | ) |
| | Net decrease in net assets resulting from share transactions | | | (855,089 | ) | | | (443,841 | ) |
| | TOTAL INCREASE (DECREASE) | | | 353,614 | | | | (755,690 | ) |
| | | | | | | | | | |
| | Net assets: | | | | | | | | |
| | Beginning of period | | | 16,975,888 | | | | 17,731,578 | |
| | End of period | | $ | 17,329,502 | | | $ | 16,975,888 | |
| | Undistributed (distributions in excess of) net investment income (loss) | | $ | 1,685 | | | $ | (5,278 | ) |
| | |
| 80 | | The accompanying notes are an integral part of these financial statements. |
GOLDMAN SACHS FUNDAMENTAL EQUITY GROWTH FUNDS
| | | | | | | | | | | | | | | | | | | | | | |
| | | Focused Growth Fund | | | | | Growth Opportunities Fund | |
| | | For the Six Months Ended
February 28, 2017
(Unaudited) | | | | | For the Fiscal Year Ended
August 31, 2016 | | | | | For the Six Months Ended
February 28, 2017
(Unaudited) | | | | | For the Fiscal Year Ended August 31, 2016 | |
| | | | | | | | | | | | | | | | | | | | | | |
| | $ | 46,951 | | | | | $ | 161,132 | | | | | $ | (4,946,915 | ) | | | | $ | (9,095,539 | ) |
| | | 593,869 | | | | | | (1,517,766 | ) | | | | | 137,151,495 | | | | | | 143,274,021 | |
| | | 59,118 | | | | | | 2,432,571 | | | | | | (46,777,482 | ) | | | | | (51,072,627 | ) |
| | | 699,938 | | | | | | 1,075,937 | | | | | | 85,427,098 | | | | | | 83,105,855 | |
| | | | | | | | | | | | | | | | | | | | | | |
| | | | | | | | | | | | | | | | | | | | | | |
| | | | | | | | | | | | | | | | | | | | | | |
| | | (1,594 | ) | | | | | (451 | ) | | | | | — | | | | | | — | |
| | | — | | | | | | (262 | ) | | | | | — | | | | | | — | |
| | | (162,046 | ) | | | | | (76,800 | ) | | | | | — | | | | | | — | |
| | | — | | | | | | — | | | | | | — | | | | | | — | |
| | | (574 | ) | | | | | (21 | ) | | | | | — | | | | | | — | |
| | | (72 | ) | | | | | — | | | | | | — | | | | | | — | |
| | | (103 | ) | | | | | (24 | ) | | | | | — | | | | | | — | |
| | | | | | | | | | | | | | | | | | | | | | |
| | | — | | | | | | (14,231 | ) | | | | | (14,410,877 | ) | | | | | (97,819,695 | ) |
| | | — | | | | | | (14,215 | ) | | | | | (3,935,680 | ) | | | | | (23,532,032 | ) |
| | | — | | | | | | (1,744,722 | ) | | | | | (45,399,922 | ) | | | | | (309,058,207 | ) |
| | | — | | | | | | — | | | | | | (939,914 | ) | | | | | (5,746,888 | ) |
| | | — | | | | | | (872 | ) | | | | | (3,279,388 | ) | | | | | (18,674,509 | ) |
| | | — | | | | | | (868 | ) | | | | | (1,600,130 | ) | | | | | (9,066,946 | ) |
| | | — | | | | | | (495 | ) | | | | | (2,386,639 | ) | | | | | (1,081,229 | ) |
| | | (164,389 | ) | | | | | (1,852,961 | ) | | | | | (71,952,550 | ) | | | | | (464,979,506 | ) |
| | | | | | | | | | | | | | | | | | | | | | |
| | | | | | | | | | | | | | | | | | | | | | |
| | | 484,469 | | | | | | 2,465,625 | | | | | | 334,502,642 | | | | | | 664,433,721 | |
| | | 164,389 | | | | | | 1,852,961 | | | | | | 64,113,934 | | | | | | 390,089,513 | |
| | | (9,575,256 | ) | | | | | (12,507,765 | ) | | | | | (706,117,890 | ) | | | | | (2,055,513,321 | ) |
| | | (8,926,398 | ) | | | | | (8,189,179 | ) | | | | | (307,501,314 | ) | | | | | (1,000,990,087 | ) |
| | | (8,390,849 | ) | | | | | (8,966,203 | ) | | | | | (294,026,766 | ) | | | | | (1,382,863,738 | ) |
| | | | | | | | | | | | | | | | | | | | | | |
| | | | | | | | | | | | | | | | | | | | | | |
| | | 24,612,221 | | | | | | 33,578,424 | | | | | | 3,201,887,014 | | | | | | 4,584,750,752 | |
| | $ | 16,221,372 | | | | | $ | 24,612,221 | | | | | $ | 2,907,860,248 | | | | | $ | 3,201,887,014 | |
| | $ | 44,563 | | | | | $ | 162,001 | | | | | $ | (12,834,236 | ) | | | | $ | (7,887,321 | ) |
| | |
| The accompanying notes are an integral part of these financial statements. | | 81 |
GOLDMAN SACHS FUNDAMENTAL EQUITY GROWTH FUNDS
Statements of Changes in Net Assets (continued)
| | | | | | | | | | |
| | | | | Small/Mid Cap Growth Fund | |
| | | | | For the
Six Months Ended
February 28, 2017
(Unaudited) | | | For the Fiscal
Year Ended
August 31, 2016 | |
| | From operations: | | | | | | | | |
| | Net investment income (loss) | | $ | (4,681,322 | ) | | $ | (16,317,215 | ) |
| | Net realized gain (loss) | | | 88,602,075 | | | | 52,255,039 | |
| | Net change in unrealized gain (loss) | | | 9,104,210 | | | | (71,634,818 | ) |
| | Net increase (decrease) in net assets resulting from operations | | | 93,024,963 | | | | (35,696,994 | ) |
| | | | | | | | | | |
| | Distributions to shareholders: | | | | | | | | |
| | From net investment income | | | | | | | | |
| | Class A Shares | | | — | | | | — | |
| | Class C Shares | | | — | | | | — | |
| | Institutional Shares | | | — | | | | — | |
| | Service Shares | | | — | | | | — | |
| | Class IR Shares | | | — | | | | — | |
| | Class R Shares | | | — | | | | — | |
| | Class R6 Shares | | | — | | | | — | |
| | From net realized gains | | | | | | | | |
| | Class A Shares | | | (22,115,735 | ) | | | (33,875,139 | ) |
| | Class C Shares | | | (9,352,469 | ) | | | (10,986,288 | ) |
| | Institutional Shares | | | (37,610,927 | ) | | | (47,806,278 | ) |
| | Service Shares | | | (484,480 | ) | | | (475,742 | ) |
| | Class IR Shares | | | (10,342,325 | ) | | | (10,051,807 | ) |
| | Class R Shares | | | (1,149,251 | ) | | | (1,254,158 | ) |
| | Class R6 Shares | | | (610,048 | ) | | | (313 | ) |
| | Total distributions to shareholders | | | (81,665,235 | ) | | | (104,449,725 | ) |
| | | | | | | | | | |
| | From share transactions: | | | | | | | | |
| | Proceeds from sales of shares | | | 451,455,862 | | | | 1,008,705,061 | |
| | Reinvestment of distributions | | | 73,298,160 | | | | 93,324,637 | |
| | Cost of shares redeemed | | | (911,876,435 | ) | | | (1,151,579,076 | ) |
| | Net decrease in net assets resulting from share transactions | | | (387,122,413 | ) | | | (49,549,378 | ) |
| | TOTAL INCREASE (DECREASE) | | | (375,762,685 | ) | | | (189,696,097 | ) |
| | | | | | | | | | |
| | Net assets: | | | | | | | | |
| | Beginning of period | | | 2,608,831,222 | | | | 2,798,527,319 | |
| | End of period | | $ | 2,233,068,537 | | | $ | 2,608,831,222 | |
| | Undistributed (distributions in excess of) net investment income (loss) | | $ | (15,635,142 | ) | | $ | (10,953,820 | ) |
| | |
| 82 | | The accompanying notes are an integral part of these financial statements. |
GOLDMAN SACHS FUNDAMENTAL EQUITY GROWTH FUNDS
| | | | | | | | | | | | | | | | | | | | | | |
| | | Strategic Growth Fund | | | | | Technology Opportunities Fund | |
| | | For the
Six Months Ended
February 28, 2017
(Unaudited) | | | | | For the Fiscal
Year Ended
August 31, 2016 | | | | | For the
Six Months Ended
February 28, 2017
(Unaudited) | | | | | For the Fiscal
Year Ended
August 31, 2016 | |
| | | | | | | | | | | | | | | | | | | | | | |
| | $ | 615,215 | | | | | $ | 2,040,512 | | | | | $ | (1,458,728 | ) | | | | $ | (2,695,009 | ) |
| | | 18,856,088 | | | | | | 1,548,451 | | | | | | 9,146,249 | | | | | | 18,604,630 | |
| | | 6,398,691 | | | | | | 21,597,125 | | | | | | 28,562,925 | | | | | | 31,771,257 | |
| | | 25,869,994 | | | | | | 25,186,088 | | | | | | 36,250,446 | | | | | | 47,680,878 | |
| | | | | | | | | | | | | | | | | | | | | | |
| | | | | | | | | | | | | | | | | | | | | | |
| | | | | | | | | | | | | | | | | | | | | | |
| | | (143,097 | ) | | | | | (72,760 | ) | | | | | — | | | | | | — | |
| | | — | | | | | | — | | | | | | — | | | | | | — | |
| | | (1,865,022 | ) | | | | | (1,396,604 | ) | | | | | — | | | | | | — | |
| | | (1,064 | ) | | | | | (299 | ) | | | | | — | | | | | | — | |
| | | (4,837 | ) | | | | | (2,572 | ) | | | | | — | | | | | | — | |
| | | (579 | ) | | | | | (106 | ) | | | | | — | | | | | | — | |
| | | (71 | ) | | | | | (42 | ) | | | | | — | | | | | | — | |
| | | | | | | | | | | | | | | | | | | | | | |
| | | (1,309,232 | ) | | | | | (2,662,084 | ) | | | | | (10,972,102 | ) | | | | | (21,931,579 | ) |
| | | (359,532 | ) | | | | | (747,201 | ) | | | | | (2,857,031 | ) | | | | | (5,298,231 | ) |
| | | (7,706,675 | ) | | | | | (18,504,227 | ) | | | | | (3,662,504 | ) | | | | | (6,969,643 | ) |
| | | (8,931 | ) | | | | | (12,976 | ) | | | | | (563,605 | ) | | | | | (975,553 | ) |
| | | (24,506 | ) | | | | | (47,249 | ) | | | | | (412,820 | ) | | | | | (511,029 | ) |
| | | (4,139 | ) | | | | | (4,036 | ) | | | | | — | | | | | | — | |
| | | (285 | ) | | | | | (516 | ) | | | | | — | | | | | | — | |
| | | (11,427,970 | ) | | | | | (23,450,672 | ) | | | | | (18,468,062 | ) | | | | | (35,686,035 | ) |
| | | | | | | | | | | | | | | | | | | | | | |
| | | | | | | | | | | | | | | | | | | | | | |
| | | 44,548,387 | | | | | | 110,866,442 | | | | | | 55,276,406 | | | | | | 64,248,588 | |
| | | 11,138,138 | | | | | | 22,818,629 | | | | | | 16,881,342 | | | | | | 32,420,710 | |
| | | (84,789,236 | ) | | | | | (166,077,206 | ) | | | | | (74,545,257 | ) | | | | | (133,609,474 | ) |
| | | (29,102,711 | ) | | | | | (32,392,135 | ) | | | | | (2,387,509 | ) | | | | | (36,940,176 | ) |
| | | (14,660,687 | ) | | | | | (30,656,719 | ) | | | | | 15,394,875 | | | | | | (24,945,333 | ) |
| | | | | | | | | | | | | | | | | | | | | | |
| | | | | | | | | | | | | | | | | | | | | | |
| | | 353,340,108 | | | | | | 383,996,827 | | | | | | 387,612,302 | | | | | | 412,557,635 | |
| | $ | 338,679,421 | | | | | $ | 353,340,108 | | | | | $ | 403,007,177 | | | | | $ | 387,612,302 | |
| | $ | 608,737 | | | | | $ | 2,008,192 | | | | | $ | (3,403,351 | ) | | | | $ | (1,944,623 | ) |
| | |
| The accompanying notes are an integral part of these financial statements. | | 83 |
GOLDMAN SACHS CAPITAL GROWTH FUND
Financial Highlights
Selected Data for a Share Outstanding Throughout Each Period
| | | | | | | | | | | | | | | | | | | | | | | | | | | | | | |
| | | | | | | | Income (loss) from
investment operations | | | Distributions
to shareholders | |
| | | Year - Share Class | | Net asset
value,
beginning
of period | | | Net
investment
income (loss)(a) | | | Net realized
and unrealized
gain (loss) | | | Total from
investment
operations | | | From net
investment
income | | | From net
realized
gains | | | Total
distributions | |
| | FOR THE SIX MONTHS ENDED FEBRUARY 28, (UNAUDITED) | |
| | 2017 - A | | $ | 24.15 | | | $ | 0.01 | | | $ | 2.09 | | | $ | 2.10 | | | $ | (0.01 | ) | | $ | (0.33 | ) | | $ | (0.34 | ) |
| | 2017 - C | | | 18.68 | | | | (0.06 | ) | | | 1.61 | | | | 1.55 | | | | — | | | | (0.33 | ) | | | (0.33 | ) |
| | 2017 - Institutional | | | 26.35 | | | | 0.06 | | | | 2.28 | | | | 2.34 | | | | (0.11 | ) | | | (0.33 | ) | | | (0.44 | ) |
| | 2017 - Service | | | 23.40 | | | | — | (e) | | | 2.02 | | | | 2.02 | | | | — | | | | (0.33 | ) | | | (0.33 | ) |
| | 2017 - IR | | | 24.48 | | | | 0.05 | | | | 2.10 | | | | 2.15 | | | | (0.08 | ) | | | (0.33 | ) | | | (0.41 | ) |
| | 2017 - R | | | 23.44 | | | | (0.02 | ) | | | 2.03 | | | | 2.01 | | | | — | | | | (0.33 | ) | | | (0.33 | ) |
| | 2017 - R6 | | | 26.34 | | | | 0.07 | | | | 2.28 | | | | 2.35 | | | | (0.12 | ) | | | (0.33 | ) | | | (0.45 | ) |
| | | | | | | | | | | | | | | | | | | | | | | | | | | | | | |
| | FOR THE FISCAL YEARS ENDED AUGUST 31, | |
| | 2016 - A | | | 24.80 | | | | 0.03 | | | | 1.37 | | | | 1.40 | | | | — | | | | (2.05 | ) | | | (2.05 | ) |
| | 2016 - C | | | 19.77 | | | | (0.12 | ) | | | 1.08 | | | | 0.96 | | | | — | | | | (2.05 | ) | | | (2.05 | ) |
| | 2016 - Institutional | | | 26.82 | | | | 0.13 | | | | 1.49 | | | | 1.62 | | | | (0.04 | ) | | | (2.05 | ) | | | (2.09 | ) |
| | 2016 - Service | | | 24.12 | | | | — | (e) | | | 1.33 | | | | 1.33 | | | | — | | | | (2.05 | ) | | | (2.05 | ) |
| | 2016 - IR | | | 25.07 | | | | 0.08 | | | | 1.40 | | | | 1.48 | | | | (0.02 | ) | | | (2.05 | ) | | | (2.07 | ) |
| | 2016 - R | | | 24.19 | | | | (0.03 | ) | | | 1.33 | | | | 1.30 | | | | — | | | | (2.05 | ) | | | (2.05 | ) |
| | 2016 - R6 | | | 26.82 | | | | 0.13 | | | | 1.49 | | | | 1.62 | | | | (0.05 | ) | | | (2.05 | ) | | | (2.10 | ) |
| | 2015 - A | | | 28.16 | | | | 0.01 | | | | 1.00 | | | | 1.01 | | | | — | | | | (4.37 | ) | | | (4.37 | ) |
| | 2015 - C | | | 23.45 | | | | (0.15 | ) | | | 0.84 | | | | 0.69 | | | | — | | | | (4.37 | ) | | | (4.37 | ) |
| | 2015 - Institutional | | | 30.01 | | | | 0.12 | | | | 1.06 | | | | 1.18 | | | | — | | | | (4.37 | ) | | | (4.37 | ) |
| | 2015 - Service | | | 27.53 | | | | (0.02 | ) | | | 0.98 | | | | 0.96 | | | | — | | | | (4.37 | ) | | | (4.37 | ) |
| | 2015 - IR | | | 28.36 | | | | 0.07 | | | | 1.01 | | | | 1.08 | | | | — | | | | (4.37 | ) | | | (4.37 | ) |
| | 2015 - R | | | 27.64 | | | | (0.06 | ) | | | 0.98 | | | | 0.92 | | | | — | | | | (4.37 | ) | | | (4.37 | ) |
| | 2015 - R6 (Commenced July 31,2015) | | | 28.86 | | | | 0.01 | | | | (2.05 | ) | | | (2.04 | ) | | | — | | | | — | | | | — | |
| | 2014 - A | | | 28.13 | | | | (0.01 | ) | | | 6.41 | | | | 6.40 | | | | (0.08 | ) | | | (6.29 | ) | | | (6.37 | ) |
| | 2014 - C | | | 24.46 | | | | (0.18 | ) | | | 5.46 | | | | 5.28 | | | | — | | | | (6.29 | ) | | | (6.29 | ) |
| | 2014 - Institutional | | | 29.57 | | | | 0.10 | | | | 6.79 | | | | 6.89 | | | | (0.16 | ) | | | (6.29 | ) | | | (6.45 | ) |
| | 2014 - Service | | | 27.62 | | | | (0.04 | ) | | | 6.29 | | | | 6.25 | | | | (0.05 | ) | | | (6.29 | ) | | | (6.34 | ) |
| | 2014 - IR | | | 28.28 | | | | 0.06 | | | | 6.44 | | | | 6.50 | | | | (0.13 | ) | | | (6.29 | ) | | | (6.42 | ) |
| | 2014 - R | | | 27.75 | | | | (0.08 | ) | | | 6.31 | | | | 6.23 | | | | (0.05 | ) | | | (6.29 | ) | | | (6.34 | ) |
| | 2013 - A | | | 24.40 | | | | 0.10 | (g) | | | 3.66 | | | | 3.76 | | | | (0.03 | ) | | | — | | | | (0.03 | ) |
| | 2013 - C | | | 21.35 | | | | (0.08 | )(g) | | | 3.19 | | | | 3.11 | | | | — | | | | — | | | | — | |
| | 2013 - Institutional | | | 25.64 | | | | 0.21 | (g) | | | 3.84 | | | | 4.05 | | | | (0.12 | ) | | | — | | | | (0.12 | ) |
| | 2013 - Service | | | 23.96 | | | | 0.07 | (g) | | | 3.60 | | | | 3.67 | | | | (0.01 | ) | | | — | | | | (0.01 | ) |
| | 2013 - IR | | | 24.53 | | | | 0.18 | (g) | | | 3.67 | | | | 3.85 | | | | (0.10 | ) | | | — | | | | (0.10 | ) |
| | 2013 - R | | | 24.14 | | | | 0.03 | (g) | | | 3.62 | | | | 3.65 | | | | (0.04 | ) | | | — | | | | (0.04 | ) |
| | 2012 - A | | | 20.49 | | | | 0.02 | | | | 3.93 | | | | 3.95 | | | | (0.04 | ) | | | — | | | | (0.04 | ) |
| | 2012 - C | | | 18.03 | | | | (0.13 | ) | | | 3.45 | | | | 3.32 | | | | — | | | | — | | | | — | |
| | 2012 - Institutional | | | 21.54 | | | | 0.10 | | | | 4.12 | | | | 4.22 | | | | (0.12 | ) | | | — | | | | (0.12 | ) |
| | 2012 - Service | | | 20.13 | | | | — | (e) | | | 3.85 | | | | 3.85 | | | | (0.02 | ) | | | — | | | | (0.02 | ) |
| | 2012 - IR | | | 20.66 | | | | 0.08 | | | | 3.93 | | | | 4.01 | | | | (0.14 | ) | | | — | | | | (0.14 | ) |
| | 2012 - R | | | 20.31 | | | | (0.03 | ) | | | 3.88 | | | | 3.85 | | | | (0.02 | ) | | | — | | | | (0.02 | ) |
| | (a) | | Calculated based on the average shares outstanding methodology. |
| | (b) | | Assumes investment at the NAV at the beginning of the period, reinvestment of all dividends and distributions, a complete redemption of the investment at the NAV at the end of the period and no sales or redemption charges. Total returns would be reduced if a sales or redemption charge was taken into account. Returns do not reflect the impact of taxes to shareholder relating to Fund distributions or the redemption of Fund shares. Total returns for periods less than one full year are not annualized. |
| | (c) | | The Fund’s portfolio turnover rate is calculated in accordance with regulatory requirements, without regard to transactions involving short term investments. If such transactions were included, the Fund’s portfolio turnover rate may be higher. |
| | (e) | | Amount is less than $0.005 per share. |
| | (f) | | Amount is less than 0.005% of average net assets. |
| | (g) | | Reflects income recognized from special dividends which amounted to $0.06 per share and 0.21% of average net assets. |
| | |
| 84 | | The accompanying notes are an integral part of these financial statements. |
GOLDMAN SACHS CAPITAL GROWTH FUND
| | | | | | | | | | | | | | | | | | | | | | | | | | | | | | | | | | | | | | | | |
| | | | | | | | | | | | | |
| | | Net asset value, end of period | | | | | Total return(b) | | | | | Net assets, end of period (in 000s) | | | | | Ratio of net expenses to average net assets | | | | | Ratio of total expenses to average net assets | | | | | Ratio of net investment income (loss) to average net assets | | | | | Portfolio turnover rate(c) | |
| | | | | | | | | | | | | | | | | | | | | | | | | | | | | | | | | | | | | | | | |
| | $ | 25.91 | | | | | | 8.83 | % | | | | $ | 638,133 | | | | | | 1.15 | %(d) | | | | | 1.50 | %(d) | | | | | 0.09 | %(d) | | | | | 23 | % |
| | | 19.90 | | | | | | 8.44 | | | | | | 69,340 | | | | | | 1.90 | (d) | | | | | 2.25 | (d) | | | | | (0.66 | )(d) | | | | | 23 | |
| | | 28.25 | | | | | | 9.03 | | | | | | 146,252 | | | | | | 0.75 | (d) | | | | | 1.10 | (d) | | | | | 0.49 | (d) | | | | | 23 | |
| | | 25.09 | | | | | | 8.75 | | | | | | 1,719 | | | | | | 1.25 | (d) | | | | | 1.60 | (d) | | | | | — | (d)(f) | | | | | 23 | |
| | | 26.22 | | | | | | 8.93 | | | | | | 6,500 | | | | | | 0.90 | (d) | | | | | 1.25 | (d) | | | | | 0.39 | (d) | | | | | 23 | |
| | | 25.12 | | | | | | 8.69 | | | | | | 3,555 | | | | | | 1.40 | (d) | | | | | 1.75 | (d) | | | | | (0.16 | )(d) | | | | | 23 | |
| | | 28.24 | | | | | | 9.05 | | | | | | 11 | | | | | | 0.75 | (d) | | | | | 1.09 | (d) | | | | | 0.50 | (d) | | | | | 23 | |
| | | | | | | | | | | | | | | | | | | | | | | | | | | | | | | | | | | | | | | | |
| | | | | | | | | | | | | | | | | | | | | | | | | | | | | | | | | | | | | | | | |
| | | 24.15 | | | | | | 5.79 | | | | | | 630,091 | | | | | | 1.15 | | | | | | 1.51 | | | | | | 0.11 | | | | | | 45 | |
| | | 18.68 | | | | | | 4.98 | | | | | | 68,960 | | | | | | 1.90 | | | | | | 2.26 | | | | | | (0.64 | ) | | | | | 45 | |
| | | 26.35 | | | | | | 6.19 | | | | | | 141,442 | | | | | | 0.75 | | | | | | 1.11 | | | | | | 0.50 | | | | | | 45 | |
| | | 23.40 | | | | | | 5.66 | | | | | | 1,561 | | | | | | 1.25 | | | | | | 1.61 | | | | | | 0.01 | | | | | | 45 | |
| | | 24.48 | | | | | | 6.05 | | | | | | 4,297 | | | | | | 0.90 | | | | | | 1.26 | | | | | | 0.35 | | | | | | 45 | |
| | | 23.44 | | | | | | 5.51 | | | | | | 3,450 | | | | | | 1.40 | | | | | | 1.76 | | | | | | (0.15 | ) | | | | | 45 | |
| | | 26.34 | | | | | | 6.19 | | | | | | 10 | | | | | | 0.74 | | | | | | 1.09 | | | | | | 0.52 | | | | | | 45 | |
| | | 24.80 | | | | | | 3.34 | | | | | | 669,345 | | | | | | 1.15 | | | | | | 1.49 | | | | | | 0.04 | | | | | | 55 | |
| | | 19.77 | | | | | | 2.55 | | | | | | 75,941 | | | | | | 1.90 | | | | | | 2.25 | | | | | | (0.71 | ) | | | | | 55 | |
| | | 26.82 | | | | | | 3.75 | | | | | | 173,539 | | | | | | 0.75 | | | | | | 1.09 | | | | | | 0.44 | | | | | | 55 | |
| | | 24.12 | | | | | | 3.23 | | | | | | 1,917 | | | | | | 1.25 | | | | | | 1.60 | | | | | | (0.08 | ) | | | | | 55 | |
| | | 25.07 | | | | | | 3.59 | | | | | | 3,823 | | | | | | 0.90 | | | | | | 1.24 | | | | | | 0.28 | | | | | | 55 | |
| | | 24.19 | | | | | | 3.05 | | | | | | 3,500 | | | | | | 1.40 | | | | | | 1.74 | | | | | | (0.21 | ) | | | | | 55 | |
| | | 26.82 | | | | | | (7.07 | ) | | | | | 9 | | | | | | 0.76 | (d) | | | | | 1.11 | (d) | | | | | 0.54 | (d) | | | | | 55 | |
| | | 28.16 | | | | | | 25.50 | | | | | | 702,534 | | | | | | 1.16 | | | | | | 1.51 | | | | | | (0.05 | ) | | | | | 75 | |
| | | 23.45 | | | | | | 24.57 | | | | | | 81,954 | | | | | | 1.91 | | | | | | 2.26 | | | | | | (0.80 | ) | | | | | 75 | |
| | | 30.01 | | | | | | 26.03 | | | | | | 147,642 | | | | | | 0.76 | | | | | | 1.11 | | | | | | 0.35 | | | | | | 75 | |
| | | 27.53 | | | | | | 25.39 | | | | | | 1,135 | | | | | | 1.26 | | | | | | 1.61 | | | | | | (0.15 | ) | | | | | 75 | |
| | | 28.36 | | | | | | 25.80 | | | | | | 2,951 | | | | | | 0.91 | | | | | | 1.26 | | | | | | 0.20 | | | | | | 75 | |
| | | 27.64 | | | | | | 25.18 | | | | | | 3,571 | | | | | | 1.41 | | | | | | 1.76 | | | | | | (0.30 | ) | | | | | 75 | |
| | | 28.13 | | | | | | 15.41 | | | | | | 630,495 | | | | | | 1.14 | | | | | | 1.50 | | | | | | 0.38 | (g) | | | | | 52 | |
| | | 24.46 | | | | | | 14.57 | | | | | | 75,375 | | | | | | 1.89 | | | | | | 2.25 | | | | | | (0.37 | )(g) | | | | | 52 | |
| | | 29.57 | | | | | | 15.89 | | | | | | 124,795 | | | | | | 0.74 | | | | | | 1.10 | | | | | | 0.75 | (g) | | | | | 52 | |
| | | 27.62 | | | | | | 15.32 | | | | | | 980 | | | | | | 1.24 | | | | | | 1.60 | | | | | | 0.27 | (g) | | | | | 52 | |
| | | 28.28 | | | | | | 15.75 | | | | | | 2,112 | | | | | | 0.89 | | | | | | 1.25 | | | | | | 0.67 | (g) | | | | | 52 | |
| | | 27.75 | | | | | | 15.15 | | | | | | 2,480 | | | | | | 1.39 | | | | | | 1.75 | | | | | | 0.13 | (g) | | | | | 52 | |
| | | 24.40 | | | | | | 19.24 | | | | | | 662,127 | | | | | | 1.14 | | | | | | 1.48 | | | | | | 0.09 | | | | | | 55 | |
| | | 21.35 | | | | | | 18.36 | | | | | | 73,162 | | | | | | 1.89 | | | | | | 2.23 | | | | | | (0.66 | ) | | | | | 55 | |
| | | 25.64 | | | | | | 19.64 | | | | | | 83,466 | | | | | | 0.74 | | | | | | 1.08 | | | | | | 0.42 | | | | | | 55 | |
| | | 23.96 | | | | | | 19.08 | | | | | | 1,072 | | | | | | 1.24 | | | | | | 1.58 | | | | | | (0.02 | ) | | | | | 55 | |
| | | 24.53 | | | | | | 19.48 | | | | | | 2,415 | | | | | | 0.89 | | | | | | 1.23 | | | | | | 0.36 | | | | | | 55 | |
| | | 24.14 | | | | | | 18.92 | | | | | | 1,475 | | | | | | 1.39 | | | | | | 1.73 | | | | | | (0.12 | ) | | | | | 55 | |
| | |
| The accompanying notes are an integral part of these financial statements. | | 85 |
GOLDMAN SACHS CONCENTRATED GROWTH FUND
Financial Highlights
Selected Data for a Share Outstanding Throughout Each Period
| | | | | | | | | | | | | | | | | | | | | | | | | | | | | | |
| | | | | | | | Income (loss) from
investment operations | | | Distributions
to shareholders | |
| | | Year - Share Class | | Net asset value, beginning of period | | | Net investment income (loss)(a) | | | Net realized and unrealized gain (loss) | | | Total from investment operations | | | From net investment income | | | From net realized gains | | | Total distributions | |
| | FOR THE SIX MONTHS ENDED FEBRUARY 28, (UNAUDITED) | |
| | 2017 - A | | $ | 15.06 | | | $ | — | (d) | | $ | 1.02 | | | $ | 1.02 | | | $ | (0.03 | ) | | $ | (0.07 | ) | | $ | (0.10 | ) |
| | 2017 - C | | | 12.84 | | | | (0.05 | ) | | | 0.87 | | | | 0.82 | | | | — | | | | (0.07 | ) | | | (0.07 | ) |
| | 2017 - Institutional | | | 15.94 | | | | 0.03 | | | | 1.07 | | | | 1.10 | | | | (0.09 | ) | | | (0.07 | ) | | | (0.16 | ) |
| | 2017 - IR | | | 15.28 | | | | 0.02 | | | | 1.02 | | | | 1.04 | | | | (0.07 | ) | | | (0.07 | ) | | | (0.14 | ) |
| | 2017 - R | | | 14.65 | | | | (0.02 | ) | | | 0.99 | | | | 0.97 | | | | — | | | | (0.07 | ) | | | (0.07 | ) |
| | 2017 - R6 | | | 15.95 | | | | 0.03 | | | | 1.07 | | | | 1.10 | | | | (0.10 | ) | | | (0.07 | ) | | | (0.17 | ) |
| | | | | | | | | | | | | | | | | | | | | | | | | | | | | | |
| | FOR THE FISCAL YEARS ENDED AUGUST 31, | |
| | 2016 - A | | | 16.06 | | | | — | (f) | | | 0.81 | | | | 0.81 | | | | — | | | | (1.81 | ) | | | (1.81 | ) |
| | 2016 - C | | | 14.05 | | | | (0.09 | )(f) | | | 0.69 | | | | 0.60 | | | | — | | | | (1.81 | ) | | | (1.81 | ) |
| | 2016 - Institutional | | | 16.88 | | | | 0.07 | (f) | | | 0.84 | | | | 0.91 | | | | (0.04 | ) | | | (1.81 | ) | | | (1.85 | ) |
| | 2016 - IR | | | 16.26 | | | | 0.04 | (f) | | | 0.81 | | | | 0.85 | | | | (0.02 | ) | | | (1.81 | ) | | | (1.83 | ) |
| | 2016 - R | | | 15.71 | | | | (0.04 | )(f) | | | 0.79 | | | | 0.75 | | | | — | | | | (1.81 | ) | | | (1.81 | ) |
| | 2016 - R6 | | | 16.88 | | | | 0.07 | (f) | | | 0.85 | | | | 0.92 | | | | (0.04 | ) | | | (1.81 | ) | | | (1.85 | ) |
| | 2015 - A | | | 18.94 | | | | — | (d)(g) | | | 0.55 | | | | 0.55 | | | | — | | | | (3.43 | ) | | | (3.43 | ) |
| | 2015 - C | | | 17.09 | | | | (0.11 | )(g) | | | 0.50 | | | | 0.39 | | | | — | | | | (3.43 | ) | | | (3.43 | ) |
| | 2015 - Institutional | | | 19.71 | | | | 0.08 | (g) | | | 0.57 | | | | 0.65 | | | | (0.05 | ) | | | (3.43 | ) | | | (3.48 | ) |
| | 2015 - IR | | | 19.10 | | | | 0.05 | (g) | | | 0.56 | | | | 0.61 | | | | (0.02 | ) | | | (3.43 | ) | | | (3.45 | ) |
| | 2015 - R | | | 18.64 | | | | (0.05 | )(g) | | | 0.55 | | | | 0.50 | | | | — | | | | (3.43 | ) | | | (3.43 | ) |
| | 2015 - R6 (Commenced July 31, 2015) | | | 18.04 | | | | 0.01 | (g) | | | (1.17 | ) | | | (1.16 | ) | | | — | | | | — | | | | — | |
| | 2014 - A | | | 17.05 | | | | (0.06 | ) | | | 3.78 | | | | 3.72 | | | | — | | | | (1.83 | ) | | | (1.83 | ) |
| | 2014 - C | | | 15.65 | | | | (0.17 | ) | | | 3.44 | | | | 3.27 | | | | — | | | | (1.83 | ) | | | (1.83 | ) |
| | 2014 - Institutional | | | 17.63 | | | | 0.02 | | | | 3.92 | | | | 3.94 | | | | (0.03 | ) | | | (1.83 | ) | | | (1.86 | ) |
| | 2014 - IR | | | 17.15 | | | | (0.01 | ) | | | 3.81 | | | | 3.80 | | | | (0.02 | ) | | | (1.83 | ) | | | (1.85 | ) |
| | 2014 - R | | | 16.84 | | | | (0.10 | ) | | | 3.73 | | | | 3.63 | | | | — | | | | (1.83 | ) | | | (1.83 | ) |
| | 2013 - A | | | 14.97 | | | | 0.11 | (h) | | | 2.03 | | | | 2.14 | | | | (0.06 | ) | | | — | | | | (0.06 | ) |
| | 2013 - C | | | 13.79 | | | | (0.06 | )(h) | | | 1.93 | | | | 1.87 | | | | (0.01 | ) | | | — | | | | (0.01 | ) |
| | 2013 - Institutional | | | 15.48 | | | | 0.09 | (h) | | | 2.18 | | | | 2.27 | | | | (0.12 | ) | | | — | | | | (0.12 | ) |
| | 2013 - IR | | | 15.07 | | | | 0.12 | (h) | | | 2.07 | | | | 2.19 | | | | (0.11 | ) | | | — | | | | (0.11 | ) |
| | 2013 - R | | | 14.80 | | | | 0.01 | (h) | | | 2.06 | | | | 2.07 | | | | (0.03 | ) | | | — | | | | (0.03 | ) |
| | 2012 - A | | | 12.64 | | | | — | (d) | | | 2.33 | | | | 2.33 | | | | — | | | | — | | | | — | |
| | 2012 - C | | | 11.73 | | | | (0.09 | ) | | | 2.15 | | | | 2.06 | | | | — | | | | — | | | | — | |
| | 2012 - Institutional | | | 13.07 | | | | 0.05 | | | | 2.41 | | | | 2.46 | | | | (0.05 | ) | | | — | | | | (0.05 | ) |
| | 2012 - IR | | | 12.73 | | | | 0.04 | | | | 2.34 | | | | 2.38 | | | | (0.04 | ) | | | — | | | | (0.04 | ) |
| | 2012 - R | | | 12.52 | | | | (0.03 | ) | | | 2.31 | | | | 2.28 | | | | — | | | | — | | | | — | |
| | (a) | | Calculated based on the average shares outstanding methodology. |
| | (b) | | Assumes investment at the NAV at the beginning of the period, reinvestment of all dividends and distributions, a complete redemption of the investment at the NAV at the end of the period and no sales or redemption charges. Total returns would be reduced if a sales or redemption charge was taken into account. Returns do not reflect the impact of taxes to shareholder relating to Fund distributions or the redemption of Fund shares. Total returns for periods less than one full year are not annualized. |
| | (c) | | The Fund’s portfolio turnover rate is calculated in accordance with regulatory requirements, without regard to transactions involving short term investments. If such transactions were included, the Fund’s portfolio turnover rate may be higher. |
| | (d) | | Amount is less than $0.005 per share. |
| | (f) | | Reflects income recognized from a special dividend which amounted to $0.03 per share and 0.19% of average net assets. |
| | (g) | | Reflects income recognized from a special dividend which amounted to $0.05 per share and 0.30% of average net assets. |
| | (h) | | Reflects income recognized from a special dividend which amounted to $0.06 per share and 0.35% of average net assets. |
| | |
| 86 | | The accompanying notes are an integral part of these financial statements. |
GOLDMAN SACHS CONCENTRATED GROWTH FUND
| | | | | | | | | | | | | | | | | | | | | | | | | | | | | | | | | | | | | | | | |
| | | | | | | | | | | | | |
| | | Net asset
value, end
of period | | | | | Total
return(b) | | | | | Net assets,
end of
period (in 000s) | | | | | Ratio of
net expenses
to average
net assets | | | | | Ratio of
total expenses
to average
net assets | | | | | Ratio of
net investment
income (loss)
to average net assets | | | | | Portfolio
turnover
rate(c) | |
| | | | | | | | | | | | | | | | | | | | | | | | | | | | | | | | | | | | | | | | |
| | $ | 15.98 | | | | | | 6.79 | % | | | | $ | 5,576 | | | | | | 1.21 | %(e) | | | | | 1.63 | %(e) | | | | | — | %(e) | | | | | 36 | % |
| | | 13.59 | | | | | | 6.39 | | | | | | 2,154 | | | | | | 1.96 | (e) | | | | | 2.38 | (e) | | | | | (0.74 | )(e) | | | | | 36 | |
| | | 16.88 | | | | | | 7.00 | | | | | | 123,087 | | | | | | 0.82 | (e) | | | | | 1.23 | (e) | | | | | 0.40 | (e) | | | | | 36 | |
| | | 16.18 | | | | | | 6.91 | | | | | | 609 | | | | | | 0.96 | (e) | | | | | 1.38 | (e) | | | | | 0.33 | (e) | | | | | 36 | |
| | | 15.55 | | | | | | 6.62 | | | | | | 26 | | | | | | 1.46 | (e) | | | | | 1.89 | (e) | | | | | (0.23 | )(e) | | | | | 36 | |
| | | 16.88 | | | | | | 6.95 | | | | | | 11 | | | | | | 0.82 | (e) | | | | | 1.23 | (e) | | | | | 0.41 | (e) | | | | | 36 | |
| | | | | | | | | | | | | | | | | | | | | | | | | | | | | | | | | | | | | | | | |
| | | | | | | | | | | | | | | | | | | | | | | | | | | | | | | | | | | | | | | | |
| | | 15.06 | | | | | | 5.10 | | | | | | 6,573 | | | | | | 1.22 | | | | | | 1.63 | | | | | | 0.03 | (f) | | | | | 55 | |
| | | 12.84 | | | | | | 4.27 | | | | | | 2,192 | | | | | | 1.98 | | | | | | 2.38 | | | | | | (0.71 | )(f) | | | | | 55 | |
| | | 15.94 | | | | | | 5.47 | | | | | | 134,818 | | | | | | 0.82 | | | | | | 1.23 | | | | | | 0.43 | (f) | | | | | 55 | |
| | | 15.28 | | | | | | 5.31 | | | | | | 452 | | | | | | 0.97 | | | | | | 1.38 | | | | | | 0.27 | (f) | | | | | 55 | |
| | | 14.65 | | | | | | 4.81 | | | | | | 22 | | | | | | 1.48 | | | | | | 1.89 | | | | | | (0.25 | )(f) | | | | | 55 | |
| | | 15.95 | | | | | | 5.56 | | | | | | 10 | | | | | | 0.81 | | | | | | 1.21 | | | | | | 0.44 | (f) | | | | | 55 | |
| | | 16.06 | | | | | | 2.54 | | | | | | 7,350 | | | | | | 1.24 | | | | | | 1.60 | | | | | | 0.02 | (g) | | | | | 47 | |
| | | 14.05 | | | | | | 1.78 | | | | | | 3,604 | | | | | | 1.99 | | | | | | 2.35 | | | | | | (0.74 | )(g) | | | | | 47 | |
| | | 16.88 | | | | | | 2.97 | | | | | | 155,652 | | | | | | 0.84 | | | | | | 1.20 | | | | | | 0.42 | (g) | | | | | 47 | |
| | | 16.26 | | | | | | 2.84 | | | | | | 342 | | | | | | 0.99 | | | | | | 1.35 | | | | | | 0.29 | (g) | | | | | 47 | |
| | | 15.71 | | | | | | 2.28 | | | | | | 27 | | | | | | 1.49 | | | | | | 1.87 | | | | | | (0.31 | )(g) | | | | | 47 | |
| | | 16.88 | | | | | | (6.43 | ) | | | | | 9 | | | | | | 0.77 | (e) | | | | | 1.48 | (e) | | | | | 0.46 | (e)(g) | | | | | 47 | |
| | | 18.94 | | | | | | 22.88 | | | | | | 7,564 | | | | | | 1.27 | | | | | | 1.60 | | | | | | (0.32 | ) | | | | | 60 | |
| | | 17.09 | | | | | | 21.98 | | | | | | 3,460 | | | | | | 2.02 | | | | | | 2.35 | | | | | | (1.06 | ) | | | | | 60 | |
| | | 19.71 | | | | | | 23.44 | | | | | | 169,387 | | | | | | 0.87 | | | | | | 1.20 | | | | | | 0.09 | | | | | | 60 | |
| | | 19.10 | | | | | | 23.20 | | | | | | 385 | | | | | | 1.02 | | | | | | 1.35 | | | | | | (0.06 | ) | | | | | 60 | |
| | | 18.64 | | | | | | 22.61 | | | | | | 14 | | | | | | 1.50 | | | | | | 1.84 | | | | | | (0.55 | ) | | | | | 60 | |
| | | 17.05 | | | | | | 14.36 | | | | | | 8,476 | | | | | | 1.26 | | | | | | 1.62 | | | | | | 0.69 | (h) | | | | | 57 | |
| | | 15.65 | | | | | | 13.57 | | | | | | 2,561 | | | | | | 2.01 | | | | | | 2.37 | | | | | | (0.39 | )(h) | | | | | 57 | |
| | | 17.63 | | | | | | 14.81 | | | | | | 146,183 | | | | | | 0.86 | | | | | | 1.23 | | | | | | 0.56 | (h) | | | | | 57 | |
| | | 17.15 | | | | | | 14.61 | | | | | | 346 | | | | | | 1.01 | | | | | | 1.38 | | | | | | 0.76 | (h) | | | | | 57 | |
| | | 16.84 | | | | | | 14.13 | | | | | | 12 | | | | | | 1.51 | | | | | | 1.87 | | | | | | 0.09 | (h) | | | | | 57 | |
| | | 14.97 | | | | | | 18.38 | | | | | | 92,207 | | | | | | 1.26 | | | | | | 1.57 | | | | | | 0.01 | | | | | | 33 | |
| | | 13.79 | | | | | | 17.51 | | | | | | 2,877 | | | | | | 2.01 | | | | | | 2.32 | | | | | | (0.72 | ) | | | | | 33 | |
| | | 15.48 | | | | | | 18.80 | | | | | | 56,118 | | | | | | 0.86 | | | | | | 1.17 | | | | | | 0.39 | | | | | | 33 | |
| | | 15.07 | | | | | | 18.69 | | | | | | 584 | | | | | | 1.01 | | | | | | 1.32 | | | | | | 0.28 | | | | | | 33 | |
| | | 14.80 | | | | | | 18.08 | | | | | | 10 | | | | | | 1.51 | | | | | | 1.82 | | | | | | (0.22 | ) | | | | | 33 | |
| | |
| The accompanying notes are an integral part of these financial statements. | | 87 |
GOLDMAN SACHS DYNAMIC U.S. EQUITY FUND
Financial Highlights
Selected Data for a Share Outstanding Throughout Each Period
| | | | | | | | | | | | | | | | | | | | | | | | | | | | | | |
| | | | | | | | Income (loss) from
investment operations | | | Distributions
to shareholders | |
| | | Year - Share Class | | Net asset value, beginning of period | | | Net
investment
income (loss)(a) | | | Net realized
and unrealized
gain (loss) | | | Total from
investment
operations | | | From net
investment
income | | | From net
realized
gains | | | Total
distributions | |
| | FOR THE SIX MONTHS ENDED FEBRUARY 28, (UNAUDITED) | |
| | 2017 - A | | $ | 13.08 | | | $ | 0.03 | | | $ | 1.22 | | | $ | 1.25 | | | $ | (0.07 | ) | | $ | — | (d) | | $ | (0.07 | ) |
| | 2017 - C | | | 12.69 | | | | (0.02 | ) | | | 1.18 | | | | 1.16 | | | | — | | | | — | (d) | | | — | (d) |
| | 2017 - Institutional | | | 13.17 | | | | 0.05 | | | | 1.23 | | | | 1.28 | | | | (0.14 | ) | | | — | (d) | | | (0.14 | ) |
| | 2017 - IR | | | 13.16 | | | | 0.05 | | | | 1.22 | | | | 1.27 | | | | (0.11 | ) | | | — | (d) | | | (0.11 | ) |
| | 2017 - R | | | 13.09 | | | | 0.01 | | | | 1.22 | | | | 1.23 | | | | — | | | | — | (d) | | | —(d | |
| | 2017 - R6 | | | 13.17 | | | | 0.06 | | | | 1.23 | | | | 1.29 | | | | (0.14 | ) | | | — | (d) | | | (0.14 | ) |
| | | | | | | | | | | | | | | | | | | | | | | | | | | | | | |
| | FOR THE FISCAL YEARS ENDED AUGUST 31, | |
| | 2016 - A | | | 13.92 | | | | 0.09 | | | | 0.50 | | | | 0.59 | | | | (0.07 | ) | | | (1.36 | ) | | | (1.43 | ) |
| | 2016 - C | | | 13.56 | | | | (0.01 | ) | | | 0.50 | | | | 0.49 | | | | — | | | | (1.36 | ) | | | (1.36 | ) |
| | 2016 - Institutional | | | 14.01 | | | | 0.14 | | | | 0.51 | | | | 0.65 | | | | (0.13 | ) | | | (1.36 | ) | | | (1.49 | ) |
| | 2016 - IR | | | 13.98 | | | | 0.13 | | | | 0.50 | | | | 0.63 | | | | (0.09 | ) | | | (1.36 | ) | | | (1.45 | ) |
| | 2016 - R | | | 13.88 | | | | 0.07 | | | | 0.50 | | | | 0.57 | | | | — | | | | (1.36 | ) | | | (1.36 | ) |
| | 2016 - R6 | | | 14.01 | | | | 0.14 | | | | 0.51 | | | | 0.65 | | | | (0.13 | ) | | | (1.36 | ) | | | (1.49 | ) |
| | 2015 - A | | | 16.66 | | | | 0.09 | | | | (0.17 | ) | | | (0.08 | ) | | | (0.07 | ) | | | (2.59 | ) | | | (2.66 | ) |
| | 2015 - C | | | 16.33 | | | | (0.03 | ) | | | (0.15 | ) | | | (0.18 | ) | | | — | | | | (2.59 | ) | | | (2.59 | ) |
| | 2015 - Institutional | | | 16.75 | | | | 0.14 | | | | (0.16 | ) | | | (0.02 | ) | | | (0.13 | ) | | | (2.59 | ) | | | (2.72 | ) |
| | 2015 - IR | | | 16.72 | | | | 0.11 | | | | (0.15 | ) | | | (0.04 | ) | | | (0.11 | ) | | | (2.59 | ) | | | (2.70 | ) |
| | 2015 - R | | | 16.62 | | | | 0.04 | | | | (0.16 | ) | | | (0.12 | ) | | | (0.03 | ) | | | (2.59 | ) | | | (2.62 | ) |
| | 2015 - R6 (Commenced July 31, 2015) | | | 15.04 | | | | 0.01 | | | | (1.04 | ) | | | (1.03 | ) | | | — | | | | — | | | | — | |
| | 2014 - A | | | 14.79 | | | | 0.06 | | | | 3.23 | | | | 3.29 | | | | (0.05 | ) | | | (1.37 | ) | | | (1.42 | ) |
| | 2014 - C | | | 14.58 | | | | (0.06 | ) | | | 3.18 | | | | 3.12 | | | | — | | | | (1.37 | ) | | | (1.37 | ) |
| | 2014 - Institutional | | | 14.85 | | | | 0.12 | | | | 3.25 | | | | 3.37 | | | | (0.10 | ) | | | (1.37 | ) | | | (1.47 | ) |
| | 2014 - IR | | | 14.83 | | | | 0.10 | | | | 3.24 | | | | 3.34 | | | | (0.08 | ) | | | (1.37 | ) | | | (1.45 | ) |
| | 2014 - R | | | 14.78 | | | | 0.02 | | | | 3.23 | | | | 3.25 | | | | (0.04 | ) | | | (1.37 | ) | | | (1.41 | ) |
| | 2013 - A | | | 12.30 | | | | 0.09 | | | | 2.48 | | | | 2.57 | | | | (0.08 | ) | | | — | | | | (0.08 | ) |
| | 2013 - C | | | 12.13 | | | | (0.01 | ) | | | 2.46 | | | | 2.45 | | | | — | | | | — | | | | — | |
| | 2013 - Institutional | | | 12.35 | | | | 0.14 | | | | 2.50 | | | | 2.64 | | | | (0.14 | ) | | | — | | | | (0.14 | ) |
| | 2013 - IR | | | 12.34 | | | | 0.12 | | | | 2.50 | | | | 2.62 | | | | (0.13 | ) | | | — | | | | (0.13 | ) |
| | 2013 - R | | | 12.29 | | | | 0.04 | | | | 2.51 | | | | 2.55 | | | | (0.06 | ) | | | — | | | | (0.06 | ) |
| | 2012 - A | | | 10.71 | | | | 0.08 | | | | 1.66 | | | | 1.74 | | | | (0.04 | ) | | | (0.11 | ) | | | (0.15 | ) |
| | 2012 - C | | | 10.61 | | | | (0.01 | ) | | | 1.64 | | | | 1.63 | | | | — | | | | (0.11 | ) | | | (0.11 | ) |
| | 2012 - Institutional | | | 10.76 | | | | 0.13 | | | | 1.65 | | | | 1.78 | | | | (0.08 | ) | | | (0.11 | ) | | | (0.19 | ) |
| | 2012 - IR | | | 10.73 | | | | 0.11 | | | | 1.65 | | | | 1.76 | | | | (0.04 | ) | | | (0.11 | ) | | | (0.15 | ) |
| | 2012 - R | | | 10.70 | | | | 0.05 | | | | 1.65 | | | | 1.70 | | | | — | (d) | | | (0.11 | ) | | | (0.11 | ) |
| | (a) | | Calculated based on the average shares outstanding methodology. |
| | (b) | | Assumes investment at the NAV at the beginning of the period, reinvestment of all dividends and distributions, a complete redemption of the investment at the NAV at the end of the period and no sales or redemption charges. Total returns would be reduced if a sales or redemption charge was taken into account. Returns do not reflect the impact of taxes to shareholder relating to Fund distributions or the redemption of Fund shares. Total returns for periods less than one full year are not annualized. |
| | (c) | | The Fund’s portfolio turnover rate is calculated in accordance with regulatory requirements, without regard to transactions involving short term investments. If such transactions were included, the Fund’s portfolio turnover rate may be higher. |
| | (d) | | Amount is less than $0.005 per share. |
| | |
| 88 | | The accompanying notes are an integral part of these financial statements. |
GOLDMAN SACHS DYNAMIC U.S. EQUITY FUND
| | | | | | | | | | | | | | | | | | | | | | | | | | | | | | | | | | | | | | | | |
| | | | | | | | | | | | | |
| | | Net asset
value, end
of period | | | | | Total
return(b) | | | | | Net assets,
end of
period (in 000s) | | | | | Ratio of
net expenses
to average
net assets | | | | | Ratio of
total expenses
to average
net assets | | | | | Ratio of
net investment
income (loss)
to average
net assets | | | | | Portfolio
turnover
rate(c) | |
| | | | | | | | | | | | | | | | | | | | | | | | | | | | | | | | | | | | | | | | |
| | $ | 14.26 | | | | | | 9.60 | % | | | | $ | 1,922 | | | | | | 1.21 | %(e) | | | | | 5.18 | %(e) | | | | | 0.42 | %(e) | | | | | 47 | % |
| | | 13.85 | | | | | | 9.16 | | | | | | 168 | | | | | | 1.96 | (e) | | | | | 5.92 | (e) | | | | | (0.28 | )(e) | | | | | 47 | |
| | | 14.31 | | | | | | 9.75 | | | | | | 4,952 | | | | | | 0.82 | (e) | | | | | 4.79 | (e) | | | | | 0.80 | (e) | | | | | 47 | |
| | | 14.32 | | | | | | 9.67 | | | | | | 275 | | | | | | 0.96 | (e) | | | | | 4.97 | (e) | | | | | 0.72 | (e) | | | | | 47 | |
| | | 14.32 | | | | | | 9.41 | | | | | | 21 | | | | | | 1.46 | (e) | | | | | 5.44 | (e) | | | | | 0.18 | (e) | | | | | 47 | |
| | | 14.32 | | | | | | 9.84 | | | | | | 11 | | | | | | 0.82 | (e) | | | | | 4.78 | (e) | | | | | 0.83 | (e) | | | | | 47 | |
| | | | | | | | | | | | | | | | | | | | | | | | | | | | | | | | | | | | | | | | |
| | | | | | | | | | | | | | | | | | | | | | | | | | | | | | | | | | | | | | | | |
| | | 13.08 | | | | | | 4.39 | | | | | | 2,124 | | | | | | 1.22 | | | | | | 3.60 | | | | | | 0.67 | | | | | | 49 | |
| | | 12.69 | | | | | | 3.66 | | | | | | 195 | | | | | | 1.97 | | | | | | 4.33 | | | | | | (0.10 | ) | | | | | 49 | |
| | | 13.17 | | | | | | 4.84 | | | | | | 4,754 | | | | | | 0.82 | | | | | | 3.16 | | | | | | 1.10 | | | | | | 49 | |
| | | 13.16 | | | | | | 4.67 | | | | | | 156 | | | | | | 0.97 | | | | | | 3.54 | | | | | | 0.97 | | | | | | 49 | |
| | | 13.09 | | | | | | 4.18 | | | | | | 19 | | | | | | 1.47 | | | | | | 3.70 | | | | | | 0.49 | | | | | | 49 | |
| | | 13.17 | | | | | | 4.86 | | | | | | 10 | | | | | | 0.81 | | | | | | 3.14 | | | | | | 1.09 | | | | | | 49 | |
| | | 13.92 | | | | | | (1.22 | ) | | | | | 3,086 | | | | | | 1.21 | | | | | | 2.81 | | | | | | 0.57 | | | | | | 67 | |
| | | 13.56 | | | | | | (1.96 | ) | | | | | 355 | | | | | | 1.97 | | | | | | 3.56 | | | | | | (0.21 | ) | | | | | 67 | |
| | | 14.01 | | | | | | (0.82 | ) | | | | | 10,855 | | | | | | 0.81 | | | | | | 2.42 | | | | | | 0.93 | | | | | | 67 | |
| | | 13.98 | | | | | | (0.98 | ) | | | | | 800 | | | | | | 0.96 | | | | | | 1.06 | | | | | | 0.73 | | | | | | 67 | |
| | | 13.88 | | | | | | (1.48 | ) | | | | | 118 | | | | | | 1.46 | | | | | | 3.10 | | | | | | 0.28 | | | | | | 67 | |
| | | 14.01 | | | | | | (6.85 | ) | | | | | 9 | | | | | | 0.76 | (e) | | | | | 1.65 | (e) | | | | | 1.08 | (e) | | | | | 67 | |
| | | 16.66 | | | | | | 23.41 | | | | | | 4,542 | | | | | | 1.20 | | | | | | 3.04 | | | | | | 0.37 | | | | | | 67 | |
| | | 16.33 | | | | | | 22.44 | | | | | | 247 | | | | | | 1.95 | | | | | | 3.78 | | | | | | (0.37 | ) | | | | | 67 | |
| | | 16.75 | | | | | | 23.92 | | | | | | 8,995 | | | | | | 0.80 | | | | | | 2.65 | | | | | | 0.76 | | | | | | 67 | |
| | | 16.72 | | | | | | 23.71 | | | | | | 205 | | | | | | 0.95 | | | | | | 2.80 | | | | | | 0.61 | | | | | | 67 | |
| | | 16.62 | | | | | | 23.06 | | | | | | 110 | | | | | | 1.45 | | | | | | 3.30 | | | | | | 0.11 | | | | | | 67 | |
| | | 14.79 | | | | | | 21.05 | | | | | | 2,869 | | | | | | 1.18 | | | | | | 3.66 | | | | | | 0.68 | | | | | | 61 | |
| | | 14.58 | | | | | | 20.20 | | | | | | 126 | | | | | | 1.93 | | | | | | 4.41 | | | | | | (0.09 | ) | | | | | 61 | |
| | | 14.85 | | | | | | 21.56 | | | | | | 8,646 | | | | | | 0.78 | | | | | | 3.24 | | | | | | 1.06 | | | | | | 61 | |
| | | 14.83 | | | | | | 21.39 | | | | | | 174 | | | | | | 0.93 | | | | | | 3.39 | | | | | | 0.90 | | | | | | 61 | |
| | | 14.78 | | | | | | 20.83 | | | | | | 51 | | | | | | 1.43 | | | | | | 3.80 | | | | | | 0.29 | | | | | | 61 | |
| | | 12.30 | | | | | | 16.37 | | | | | | 3,331 | | | | | | 1.18 | | | | | | 3.63 | | | | | | 0.69 | | | | | | 76 | |
| | | 12.13 | | | | | | 15.45 | | | | | | 158 | | | | | | 1.93 | | | | | | 4.38 | | | | | | (0.05 | ) | | | | | 76 | |
| | | 12.35 | | | | | | 16.71 | | | | | | 7,142 | | | | | | 0.78 | | | | | | 3.23 | | | | | | 1.11 | | | | | | 76 | |
| | | 12.34 | | | | | | 16.52 | | | | | | 70 | | | | | | 0.93 | | | | | | 3.38 | | | | | | 0.97 | | | | | | 76 | |
| | | 12.29 | | | | | | 16.02 | | | | | | 12 | | | | | | 1.43 | | | | | | 3.88 | | | | | | 0.45 | | | | | | 76 | |
| | |
| The accompanying notes are an integral part of these financial statements. | | 89 |
GOLDMAN SACHS FLEXIBLE CAP GROWTH FUND
Financial Highlights
Selected Data for a Share Outstanding Throughout Each Period
| | | | | | | | | | | | | | | | | | | | | | | | | | | | | | |
| | | | | | | | Income (loss) from
investment operations | | | Distributions
to shareholders | |
| | | Year - Share Class | | Net asset
value,
beginning
of period | | | Net
investment
income (loss)(a) | | | Net realized
and unrealized
gain (loss) | | | Total from
investment
operations | | | From net
investment
income | | | From net
realized
gains | | | Total
distributions | |
| | FOR THE SIX MONTHS ENDED FEBRUARY 28, (UNAUDITED) | |
| | 2017 - A | | $ | 11.74 | | | $ | (0.01 | ) | | $ | 0.88 | | | $ | 0.87 | | | $ | — | | | $ | (0.01 | ) | | $ | (0.01 | ) |
| | 2017 - C | | | 10.71 | | | | (0.05 | ) | | | 0.80 | | | | 0.75 | | | | — | | | | (0.01 | ) | | | (0.01 | ) |
| | 2017 - Institutional | | | 12.35 | | | | 0.02 | | | | 0.93 | | | | 0.95 | | | | — | | | | (0.01 | ) | | | (0.01 | ) |
| | 2017 - IR | | | 12.16 | | | | 0.02 | | | | 0.90 | | | | 0.92 | | | | — | | | | (0.01 | ) | | | (0.01 | ) |
| | 2017 - R | | | 11.42 | | | | (0.02 | ) | | | 0.85 | | | | 0.83 | | | | — | | | | (0.01 | ) | | | (0.01 | ) |
| | 2017 - R6 | | | 12.35 | | | | 0.02 | | | | 0.93 | | | | 0.95 | | | | — | | | | (0.01 | ) | | | (0.01 | ) |
| | | | | | | | | | | | | | | | | | | | | | | | | | | | | | |
| | FOR THE FISCAL YEAR ENDED AUGUST 31, | |
| | 2016 - A | | | 11.90 | | | | (0.02 | ) | | | 0.59 | | | | 0.57 | | | | — | | | | (0.73 | ) | | | (0.73 | ) |
| | 2016 - C | | | 11.00 | | | | (0.10 | ) | | | 0.54 | | | | 0.44 | | | | — | | | | (0.73 | ) | | | (0.73 | ) |
| | 2016 - Institutional | | | 12.44 | | | | 0.02 | | | | 0.62 | | | | 0.64 | | | | — | | | | (0.73 | ) | | | (0.73 | ) |
| | 2016 - IR | | | 12.27 | | | | — | (e) | | | 0.62 | | | | 0.62 | | | | — | | | | (0.73 | ) | | | (0.73 | ) |
| | 2016 - R | | | 11.63 | | | | (0.05 | ) | | | 0.57 | | | | 0.52 | | | | — | | | | (0.73 | ) | | | (0.73 | ) |
| | 2016 - R6 | | | 12.44 | | | | 0.03 | | | | 0.61 | | | | 0.64 | | | | — | | | | (0.73 | ) | | | (0.73 | ) |
| | 2015 - A | | | 13.21 | | | | (0.04 | )(f) | | | 0.63 | | | | 0.59 | | | | — | | | | (1.90 | ) | | | (1.90 | ) |
| | 2015 - C | | | 12.43 | | | | (0.12 | )(f) | | | 0.59 | | | | 0.47 | | | | — | | | | (1.90 | ) | | | (1.90 | ) |
| | 2015 - Institutional | | | 13.68 | | | | 0.01 | (f) | | | 0.65 | | | | 0.66 | | | | — | | | | (1.90 | ) | | | (1.90 | ) |
| | 2015 - IR | | | 13.53 | | | | — | (e)(f) | | | 0.64 | | | | 0.64 | | | | — | | | | (1.90 | ) | | | (1.90 | ) |
| | 2015 - R | | | 12.97 | | | | (0.07 | )(f) | | | 0.63 | | | | 0.56 | | | | — | | | | (1.90 | ) | | | (1.90 | ) |
| | 2015 - R6 (Commenced July 31, 2015) | | | 13.38 | | | | — | (e)(f) | | | (0.94 | ) | | | (0.94 | ) | | | — | | | | — | | | | — | |
| | 2014 - A | | | 11.83 | | | | (0.05 | ) | | | 3.01 | | | | 2.96 | | | | — | | | | (1.58 | ) | | | (1.58 | ) |
| | 2014 - C | | | 11.29 | | | | (0.14 | ) | | | 2.86 | | | | 2.72 | | | | — | | | | (1.58 | ) | | | (1.58 | ) |
| | 2014 - Institutional | | | 12.17 | | | | — | (e) | | | 3.11 | | | | 3.11 | | | | (0.02 | ) | | | (1.58 | ) | | | (1.60 | ) |
| | 2014 - IR | | | 12.05 | | | | (0.02 | ) | | | 3.08 | | | | 3.06 | | | | — | | | | (1.58 | ) | | | (1.58 | ) |
| | 2014 - R | | | 11.66 | | | | (0.08 | ) | | | 2.97 | | | | 2.89 | | | | — | | | | (1.58 | ) | | | (1.58 | ) |
| | 2013 - A | | | 11.48 | | | | — | (e)(h) | | | 1.71 | | | | 1.71 | | | | — | | | | (1.36 | ) | | | (1.36 | ) |
| | 2013 - C | | | 11.09 | | | | (0.08 | )(h) | | | 1.64 | | | | 1.56 | | | | — | | | | (1.36 | ) | | | (1.36 | ) |
| | 2013 - Institutional | | | 11.73 | | | | 0.04 | (h) | | | 1.76 | | | | 1.80 | | | | — | | | | (1.36 | ) | | | (1.36 | ) |
| | 2013 - IR | | | 11.64 | | | | 0.03 | (h) | | | 1.74 | | | | 1.77 | | | | — | | | | (1.36 | ) | | | (1.36 | ) |
| | 2013 - R | | | 11.36 | | | | (0.02 | )(h) | | | 1.68 | | | | 1.66 | | | | — | | | | (1.36 | ) | | | (1.36 | ) |
| | 2012 - A | | | 10.38 | | | | (0.02 | ) | | | 1.71 | | | | 1.69 | | | | — | | | | (0.59 | ) | | | (0.59 | ) |
| | 2012 - C | | | 10.12 | | | | (0.10 | ) | | | 1.66 | | | | 1.56 | | | | — | | | | (0.59 | ) | | | (0.59 | ) |
| | 2012 - Institutional | | | 10.55 | | | | 0.02 | | | | 1.75 | | | | 1.77 | | | | — | | | | (0.59 | ) | | | (0.59 | ) |
| | 2012 - IR | | | 10.49 | | | | 0.01 | | | | 1.73 | | | | 1.74 | | | | — | | | | (0.59 | ) | | | (0.59 | ) |
| | 2012 - R | | | 10.30 | | | | (0.05 | ) | | | 1.70 | | | | 1.65 | | | | — | | | | (0.59 | ) | | | (0.59 | ) |
| | (a) | | Calculated based on the average shares outstanding methodology. |
| | (b) | | Assumes investment at the NAV at the beginning of the period, reinvestment of all dividends and distributions, a complete redemption of the investment at the NAV at the end of the period and no sales or redemption charges. Total returns would be reduced if a sales or redemption charge was taken into account. Returns do not reflect the impact of taxes to shareholder relating to Fund distributions or the redemption of Fund shares. Total returns for periods less than one full year are not annualized. |
| | (c) | | The Fund’s portfolio turnover rate is calculated in accordance with regulatory requirements, without regard to transactions involving short term investments. If such transactions were included, the Fund’s portfolio turnover rate may be higher. |
| | (e) | | Amount is less than $0.005 per share. |
| | (f) | | Reflects income recognized from special dividends which amounted to $0.02 per share and 0.13% of average net assets. |
| | (g) | | Amount is less than 0.005% of average net assets. |
| | (h) | | Reflects income recognized from special dividends which amounted to $0.02 per share and 0.20% of average net assets. |
| | |
| 90 | | The accompanying notes are an integral part of these financial statements. |
GOLDMAN SACHS FLEXIBLE CAP GROWTH FUND
| | | | | | | | | | | | | | | | | | | | | | | | | | | | | | | | | | | | | | | | |
| | | | | | | | | | | | | |
| | | Net asset
value, end
of period | | | | | Total
return(b) | | | | | Net assets,
end of
period (in 000s) | | | | | Ratio of
net expenses
to average
net assets | | | | | Ratio of
total expenses
to average
net assets | | | | | Ratio of
net investment
income (loss)
to average net assets | | | | | Portfolio
turnover
rate(c) | |
| | | | | | | | | | | | | | | | | | | | | | | | | | | | | | | | | | | | | | | | |
| | $ | 12.60 | | | | | | 7.44 | % | | | | $ | 5,148 | | | | | | 1.21 | %(d) | | | | | 2.99 | %(d) | | | | | (0.11 | )%(d) | | | | | 29 | % |
| | | 11.45 | | | | | | 7.03 | | | | | | 1,274 | | | | | | 1.96 | (d) | | | | | 3.73 | (d) | | | | | (0.86 | )(d) | | | | | 29 | |
| | | 13.29 | | | | | | 7.72 | | | | | | 10,309 | | | | | | 0.82 | (d) | | | | | 2.59 | (d) | | | | | 0.30 | (d) | | | | | 29 | |
| | | 13.07 | | | | | | 7.59 | | | | | | 552 | | | | | | 0.96 | (d) | | | | | 2.76 | (d) | | | | | 0.41 | (d) | | | | | 29 | |
| | | 12.24 | | | | | | 7.30 | | | | | | 36 | | | | | | 1.46 | (d) | | | | | 3.26 | (d) | | | | | (0.31 | )(d) | | | | | 29 | |
| | | 13.29 | | | | | | 7.72 | | | | | | 11 | | | | | | 0.82 | (d) | | | | | 2.58 | (d) | | | | | 0.30 | (d) | | | | | 29 | |
| | | | | | | | | | | | | | | | | | | | | | | | | | | | | | | | | | | | | | | | |
| | | | | | | | | | | | | | | | | | | | | | | | | | | | | | | | | | | | | | | | |
| | | 11.74 | | | | | | 4.93 | | | | | | 5,927 | | | | | | 1.22 | | | | | | 3.07 | | | | | | (0.21 | ) | | | | | 46 | |
| | | 10.71 | | | | | | 4.12 | | | | | | 1,474 | | | | | | 1.97 | | | | | | 3.82 | | | | | | (0.96 | ) | | | | | 46 | |
| | | 12.35 | | | | | | 5.29 | | | | | | 9,330 | | | | | | 0.82 | | | | | | 2.68 | | | | | | 0.20 | | | | | | 46 | |
| | | 12.16 | | | | | | 5.20 | | | | | | 197 | | | | | | 0.97 | | | | | | 2.76 | | | | | | 0.03 | | | | | | 46 | |
| | | 11.42 | | | | | | 4.61 | | | | | | 37 | | | | | | 1.47 | | | | | | 3.33 | | | | | | (0.45 | ) | | | | | 46 | |
| | | 12.35 | | | | | | 5.29 | | | | | | 10 | | | | | | 0.81 | | | | | | 2.66 | | | | | | 0.22 | | | | | | 46 | |
| | | 11.90 | | | | | | 4.59 | | | | | | 7,048 | | | | | | 1.24 | | | | | | 2.97 | | | | | | (0.30 | )(f) | | | | | 41 | |
| | | 11.00 | | | | | | 3.83 | | | | | | 1,802 | | | | | | 1.98 | | | | | | 3.71 | | | | | | (1.04 | )(f) | | | | | 41 | |
| | | 12.44 | | | | | | 4.99 | | | | | | 8,586 | | | | | | 0.84 | | | | | | 2.57 | | | | | | 0.09 | (f) | | | | | 41 | |
| | | 12.27 | | | | | | 4.88 | | | | | | 253 | | | | | | 0.98 | | | | | | 2.66 | | | | | | (0.03 | )(f) | | | | | 41 | |
| | | 11.63 | | | | | | 4.43 | | | | | | 33 | | | | | | 1.49 | | | | | | 3.24 | | | | | | (0.55 | )(f) | | | | | 41 | |
| | | 12.44 | | | | | | (7.03 | ) | | | | | 9 | | | | | | 0.84 | (d) | | | | | 4.34 | (d) | | | | | 0.24 | (d)(f) | | | | | 41 | |
| | | 13.21 | | | | | | 26.62 | | | | | | 5,665 | | | | | | 1.28 | | | | | | 3.32 | | | | | | (0.40 | ) | | | | | 56 | |
| | | 12.43 | | | | | | 25.68 | | | | | | 1,119 | | | | | | 2.03 | | | | | | 4.09 | | | | | | (1.15 | ) | | | | | 56 | |
| | | 13.68 | | | | | | 27.21 | | | | | | 8,262 | | | | | | 0.88 | | | | | | 2.92 | | | | | | — | (g) | | | | | 56 | |
| | | 13.53 | | | | | | 26.98 | | | | | | 126 | | | | | | 1.03 | | | | | | 3.04 | | | | | | (0.17 | ) | | | | | 56 | |
| | | 12.97 | | | | | | 26.38 | | | | | | 55 | | | | | | 1.53 | | | | | | 3.56 | | | | | | (0.65 | ) | | | | | 56 | |
| | | 11.83 | | | | | | 16.78 | | | | | | 4,584 | | | | | | 1.26 | | | | | | 3.62 | | | | | | 0.03 | (h) | | | | | 40 | |
| | | 11.29 | | | | | | 15.94 | | | | | | 1,005 | | | | | | 2.01 | | | | | | 4.32 | | | | | | (0.75 | )(h) | | | | | 40 | |
| | | 12.17 | | | | | | 17.23 | | | | | | 6,215 | | | | | | 0.86 | | | | | | 3.18 | | | | | | 0.37 | (h) | | | | | 40 | |
| | | 12.05 | | | | | | 17.08 | | | | | | 167 | | | | | | 1.01 | | | | | | 3.35 | | | | | | 0.26 | (h) | | | | | 40 | |
| | | 11.66 | | | | | | 16.50 | | | | | | 41 | | | | | | 1.51 | | | | | | 3.91 | | | | | | (0.19 | )(h) | | | | | 40 | |
| | | 11.48 | | | | | | 17.11 | | | | | | 7,423 | | | | | | 1.26 | | | | | | 3.14 | | | | | | (0.22 | ) | | | | | 32 | |
| | | 11.09 | | | | | | 16.23 | | | | | | 975 | | | | | | 2.01 | | | | | | 3.89 | | | | | | (0.95 | ) | | | | | 32 | |
| | | 11.73 | | | | | | 17.61 | | | | | | 4,640 | | | | | | 0.86 | | | | | | 2.74 | | | | | | 0.21 | | | | | | 32 | |
| | | 11.64 | | | | | | 17.41 | | | | | | 179 | | | | | | 1.01 | | | | | | 2.89 | | | | | | 0.06 | | | | | | 32 | |
| | | 11.36 | | | | | | 16.84 | | | | | | 63 | | | | | | 1.51 | | | | | | 3.39 | | | | | | (0.43 | ) | | | | | 32 | |
| | |
| The accompanying notes are an integral part of these financial statements. | | 91 |
GOLDMAN SACHS FOCUSED GROWTH FUND
Financial Highlights
Selected Data for a Share Outstanding Throughout Each Period
| | | | | | | | | | | | | | | | | | | | | | | | | | | | | | |
| | | | | | | | Income (loss) from
Investment Operations | | | Distributions
to shareholders | |
| | | Year - Share Class | | Net asset
value,
beginning
of period | | | Net
investment
income (loss)(a) | | | Net realized
and unrealized
gain (loss) | | | Total from
investment
operations | | | From net
investment
income | | | From net
realized
gains | | | Total
distributions | |
| | FOR THE SIX MONTHS ENDED FEBRUARY 28, (UNAUDITED) | |
| | 2017 - A | | $ | 14.07 | | | $ | — | (g) | | $ | 0.85 | | | $ | 0.85 | | | $ | (0.09 | ) | | $ | — | | | $ | (0.09 | ) |
| | 2017 - C | | | 13.61 | | | | (0.05 | ) | | | 0.83 | | | | 0.78 | | | | — | | | | — | | | | — | |
| | 2017 - Institutional | | | 14.26 | | | | 0.03 | | | | 0.86 | | | | 0.89 | | | | (0.14 | ) | | | — | | | | (0.14 | ) |
| | 2017 - IR | | | 14.23 | | | | 0.02 | | | | 0.86 | | | | 0.88 | | | | (0.14 | ) | | | — | | | | (0.14 | ) |
| | 2017 - R | | | 13.97 | | | | (0.01 | ) | | | 0.85 | | | | 0.84 | | | | (0.06 | ) | | | — | | | | (0.06 | ) |
| | 2017 - R6 | | | 14.26 | | | | 0.03 | | | | 0.87 | | | | 0.90 | | | | (0.15 | ) | | | — | | | | (0.15 | ) |
| | | | | | | | | | | | | | | | | | | | | | | | | | | | | | |
| | FOR THE FISCAL YEARS ENDED AUGUST 31, | |
| | 2016 - A | | | 14.36 | | | | 0.01 | (e) | | | 0.48 | | | | 0.49 | | | | (0.02 | ) | | | (0.76 | ) | | | (0.78 | ) |
| | 2016 - C | | | 14.01 | | | | (0.09 | )(e) | | | 0.46 | | | | 0.37 | | | | (0.01 | ) | | | (0.76 | ) | | | (0.77 | ) |
| | 2016 - Institutional | | | 14.50 | | | | 0.08 | (e) | | | 0.47 | | | | 0.55 | | | | (0.03 | ) | | | (0.76 | ) | | | (0.79 | ) |
| | 2016 - IR | | | 14.47 | | | | 0.06 | (e) | | | 0.47 | | | | 0.53 | | | | (0.01 | ) | | | (0.76 | ) | | | (0.77 | ) |
| | 2016 - R | | | 14.28 | | | | (0.01 | )(e) | | | 0.46 | | | | 0.45 | | | | — | | | | (0.76 | ) | | | (0.76 | ) |
| | 2016 - R6 | | | 14.50 | | | | 0.08 | (e) | | | 0.47 | | | | 0.55 | | | | (0.03 | ) | | | (0.76 | ) | | | (0.79 | ) |
| | 2015 - A | | | 14.74 | | | | (0.01 | )(f) | | | 0.65 | | | | 0.64 | | | | — | | | | (1.02 | ) | | | (1.02 | ) |
| | 2015 - C | | | 14.51 | | | | (0.10 | )(f) | | | 0.62 | | | | 0.52 | | | | — | | | | (1.02 | ) | | | (1.02 | ) |
| | 2015 - Institutional | | | 14.85 | | | | 0.07 | (f) | | | 0.64 | | | | 0.71 | | | | (0.04 | ) | | | (1.02 | ) | | | (1.06 | ) |
| | 2015 - IR | | | 14.83 | | | | 0.04 | (f) | | | 0.64 | | | | 0.68 | | | | (0.02 | ) | | | (1.02 | ) | | | (1.04 | ) |
| | 2015 - R | | | 14.70 | | | | (0.03 | )(f) | | | 0.63 | | | | 0.60 | | | | — | | | | (1.02 | ) | | | (1.02 | ) |
| | 2015 - R6 (Commenced July 31, 2015) | | | 15.27 | | | | — | (f)(g) | | | (0.77 | ) | | | (0.77 | ) | | | — | | | | — | | | | — | |
| | 2014 - A | | | 12.95 | | | | (0.05 | ) | | | 2.77 | | | | 2.72 | | | | — | | | | (0.93 | ) | | | (0.93 | ) |
| | 2014 - C | | | 12.85 | | | | (0.15 | ) | | | 2.74 | | | | 2.59 | | | | — | | | | (0.93 | ) | | | (0.93 | ) |
| | 2014 - Institutional | | | 13.02 | | | | 0.01 | | | | 2.78 | | | | 2.79 | | | | (0.03 | ) | | | (0.93 | ) | | | (0.96 | ) |
| | 2014 - IR | | | 13.01 | | | | (0.01 | ) | | | 2.77 | | | | 2.76 | | | | (0.01 | ) | | | (0.93 | ) | | | (0.94 | ) |
| | 2014 - R | | | 12.95 | | | | (0.08 | ) | | | 2.76 | | | | 2.68 | | | | — | | | | (0.93 | ) | | | (0.93 | ) |
| | 2013 - A | | | 11.35 | | | | 0.01 | (h) | | | 1.66 | | | | 1.67 | | | | (0.05 | ) | | | (0.02 | ) | | | (0.07 | ) |
| | 2013 - C | | | 11.31 | | | | (0.06 | )(h) | | | 1.63 | | | | 1.57 | | | | (0.01 | ) | | | (0.02 | ) | | | (0.03 | ) |
| | 2013 - Institutional | | | 11.38 | | | | 0.07 | (h) | | | 1.66 | | | | 1.73 | | | | (0.07 | ) | | | (0.02 | ) | | | (0.09 | ) |
| | 2013 - IR | | | 11.38 | | | | 0.06 | (h) | | | 1.65 | | | | 1.71 | | | | (0.06 | ) | | | (0.02 | ) | | | (0.08 | ) |
| | 2013 - R | | | 11.34 | | | | — | (g)(h) | | | 1.64 | | | | 1.64 | | | | (0.01 | ) | | | (0.02 | ) | | | (0.03 | ) |
| | 2012 - A (Commenced January 31, 2012) | | | 10.00 | | | | — | (g) | | | 1.35 | | | | 1.35 | | | | — | | | | — | | | | — | |
| | 2012 - C (Commenced January 31, 2012) | | | 10.00 | | | | (0.05 | ) | | | 1.36 | | | | 1.31 | | | | — | | | | — | | | | — | |
| | 2012 - Institutional (Commenced January 31, 2012) | | | 10.00 | | | | 0.02 | | | | 1.36 | | | | 1.38 | | | | — | | | | — | | | | — | |
| | 2012 - IR (Commenced January 31, 2012) | | | 10.00 | | | | 0.01 | | | | 1.37 | | | | 1.38 | | | | — | | | | — | | | | — | |
| | 2012 - R (Commenced January 31, 2012) | | | 10.00 | | | | (0.02 | ) | | | 1.36 | | | | 1.34 | | | | — | | | | — | | | | — | |
| | (a) | | Calculated based on the average shares outstanding methodology. |
| | (b) | | Assumes investment at the NAV at the beginning of the period, reinvestment of all dividends and distributions, a complete redemption of the investment at the NAV at the end of the period and no sales or redemption charges. Total returns would be reduced if a sales or redemption charge was taken into account. Returns do not reflect the impact of taxes to shareholder relating to Fund distributions or the redemption of Fund shares. Total returns for periods less than one full year are not annualized. |
| | (c) | | The Fund’s portfolio turnover rate is calculated in accordance with regulatory requirements, without regard to transactions involving short term investments. If such transactions were included, the Fund’s portfolio turnover rate may be higher. |
| | (e) | | Reflects income recognized from special dividends which amounted to $0.04 per share and 0.25% of average net assets. |
| | (f) | | Reflects income recognized from special dividends which amounted to $0.05 per share and 0.31% of average net assets. |
| | (g) | | Amount is less than $0.005 per share. |
| | (h) | | Reflects income recognized from special dividends which amounted to $0.02 per share and 0.18% of average net assets. |
| | |
| 92 | | The accompanying notes are an integral part of these financial statements. |
GOLDMAN SACHS FOCUSED GROWTH FUND
| | | | | | | | | | | | | | | | | | | | | | | | | | | | | | | | | | | | | | | | |
| | | | | | | | | | | | | |
| | | Net asset
value, end
of period | | | | | Total
return(b) | | | | | Net assets,
end of
period (in 000s) | | | | | Ratio of
net expenses
to average
net assets | | | | | Ratio of
total expenses
to average
net assets | | | | | Ratio of
net investment
income (loss)
to average net assets | | | | | Portfolio
turnover
rate(c) | |
| | | | | | | | | | | | | | | | | | | | | | | | | | | | | | | | | | | | | | | | |
| | $ | 14.83 | | | | | | 6.10 | % | | | | $ | 221 | | | | | | 1.20 | %(d) | | | | | 2.78 | %(d) | | | | | 0.03 | %(d) | | | | | 52 | % |
| | | 14.39 | | | | | | 5.73 | | | | | | 182 | | | | | | 1.95 | (d) | | | | | 3.54 | (d) | | | | | (0.69 | )(d) | | | | | 52 | |
| | | 15.01 | | | | | | 6.34 | | | | | | 15,729 | | | | | | 0.80 | (d) | | | | | 2.30 | (d) | | | | | 0.48 | (d) | | | | | 52 | |
| | | 14.97 | | | | | | 6.27 | | | | | | 61 | | | | | | 0.95 | (d) | | | | | 2.54 | (d) | | | | | 0.31 | (d) | | | | | 52 | |
| | | 14.75 | | | | | | 6.04 | | | | | | 18 | | | | | | 1.46 | (d) | | | | | 3.04 | (d) | | | | | (0.20 | )(d) | | | | | 52 | |
| | | 15.01 | | | | | | 6.38 | | | | | | 10 | | | | | | 0.80 | (d) | | | | | 2.38 | (d) | | | | | 0.47 | (d) | | | | | 52 | |
| | | | | | | | | | | | | | | | | | | | | | | | | | | | | | | | | | | | | | | | |
| | | | | | | | | | | | | | | | | | | | | | | | | | | | | | | | | | | | | | | | |
| | | 14.07 | | | | | | 3.36 | | | | | | 243 | | | | | | 1.21 | | | | | | 2.35 | | | | | | 0.10 | (e) | | | | | 55 | |
| | | 13.61 | | | | | | 2.56 | | | | | | 169 | | | | | | 1.96 | | | | | | 3.14 | | | | | | (0.69 | )(e) | | | | | 55 | |
| | | 14.26 | | | | | | 3.75 | | | | | | 24,116 | | | | | | 0.82 | | | | | | 1.91 | | | | | | 0.56 | (e) | | | | | 55 | |
| | | 14.23 | | | | | | 3.65 | | | | | | 58 | | | | | | 0.96 | | | | | | 1.90 | | | | | | 0.40 | (e) | | | | | 55 | |
| | | 13.97 | | | | | | 3.07 | | | | | | 17 | | | | | | 1.47 | | | | | | 2.56 | | | | | | (0.10 | )(e) | | | | | 55 | |
| | | 14.26 | | | | | | 3.77 | | | | | | 10 | | | | | | 0.78 | | | | | | 1.87 | | | | | | 0.59 | (e) | | | | | 55 | |
| | | 14.36 | | | | | | 4.27 | | | | | | 148 | | | | | | 1.24 | | | | | | 2.22 | | | | | | (0.05 | )(f) | | | | | 67 | |
| | | 14.01 | | | | | | 3.47 | | | | | | 53 | | | | | | 1.99 | | | | | | 3.00 | | | | | | (0.70 | )(f) | | | | | 67 | |
| | | 14.50 | | | | | | 4.72 | | | | | | 33,335 | | | | | | 0.84 | | | | | | 1.85 | | | | | | 0.45 | (f) | | | | | 67 | |
| | | 14.47 | | | | | | 4.50 | | | | | | 17 | | | | | | 1.01 | | | | | | 2.02 | | | | | | 0.30 | (f) | | | | | 67 | |
| | | 14.28 | | | | | | 3.99 | | | | | | 16 | | | | | | 1.49 | | | | | | 2.50 | | | | | | (0.19 | )(f) | | | | | 67 | |
| | | 14.50 | | | | | | (5.04 | ) | | | | | 9 | | | | | | 0.81 | (d) | | | | | 2.05 | (d) | | | | | 0.24 | (f)(d) | | | | | 67 | |
| | | 14.74 | | | | | | 21.60 | | | | | | 42 | | | | | | 1.26 | | | | | | 2.83 | | | | | | (0.37 | ) | | | | | 97 | |
| | | 14.51 | | | | | | 20.71 | | | | | | 39 | | | | | | 2.01 | | | | | | 3.49 | | | | | | (1.05 | ) | | | | | 97 | |
| | | 14.85 | | | | | | 22.00 | | | | | | 24,346 | | | | | | 0.86 | | | | | | 2.31 | | | | | | 0.10 | | | | | | 97 | |
| | | 14.83 | | | | | | 21.83 | | | | | | 16 | | | | | | 1.01 | | | | | | 2.51 | | | | | | (0.08 | ) | | | | | 97 | |
| | | 14.70 | | | | | | 21.28 | | | | | | 16 | | | | | | 1.51 | | | | | | 3.01 | | | | | | (0.58 | ) | | | | | 97 | |
| | | 12.95 | | | | | | 14.79 | | | | | | 56 | | | | | | 1.24 | | | | | | 6.12 | | | | | | 0.08 | (h) | | | | | 87 | |
| | | 12.85 | | | | | | 13.94 | | | | | | 23 | | | | | | 1.99 | | | | | | 6.91 | | | | | | (0.52 | )(h) | | | | | 87 | |
| | | 13.02 | | | | | | 15.33 | | | | | | 12,838 | | | | | | 0.84 | | | | | | 4.59 | | | | | | 0.53 | (h) | | | | | 87 | |
| | | 13.01 | | | | | | 15.08 | | | | | | 13 | | | | | | 1.00 | | | | | | 6.58 | | | | | | 0.52 | (h) | | | | | 87 | |
| | | 12.95 | | | | | | 14.53 | | | | | | 13 | | | | | | 1.49 | | | | | | 7.08 | | | | | | 0.02 | (h) | | | | | 87 | |
| | | 11.35 | | | | | | 13.50 | | | | | | 35 | | | | | | 1.24 | (d) | | | | | 17.07 | (d) | | | | | 0.04 | (d) | | | | | 23 | |
| | | 11.31 | | | | | | 13.10 | | | | | | 11 | | | | | | 1.99 | (d) | | | | | 17.82 | (d) | | | | | (0.81 | )(d) | | | | | 23 | |
| | | 11.38 | | | | | | 13.80 | | | | | | 3,417 | | | | | | 0.84 | (d) | | | | | 16.67 | (d) | | | | | 0.36 | (d) | | | | | 23 | |
| | | 11.38 | | | | | | 13.80 | | | | | | 11 | | | | | | 0.99 | (d) | | | | | 16.82 | (d) | | | | | 0.22 | (d) | | | | | 23 | |
| | | 11.34 | | | | | | 13.40 | | | | | | 11 | | | | | | 1.49 | (d) | | | | | 17.32 | (d) | | | | | (0.30 | )(d) | | | | | 23 | |
| | |
| The accompanying notes are an integral part of these financial statements. | | 93 |
GOLDMAN SACHS GROWTH OPPORTUNITIES FUND
Financial Highlights
Selected Data for a Share Outstanding Throughout Each Period
| | | | | | | | | | | | | | | | | | | | | | |
| | | | | | | | Income (loss) from
investment operations | | | | |
| | | Year - Share Class | | Net asset
value,
beginning
of period | | | Net
investment
income (loss)(a) | | | Net realized
and unrealized
gain (loss) | | | Total from
investment
operations | | | Distributions
to shareholders
from net
realized
gains | |
| | FOR THE SIX MONTHS ENDED FEBRUARY 28, (UNAUDITED) | |
| | 2017 - A | | $ | 21.70 | | | $ | (0.06 | ) | | $ | 0.71 | | | $ | 0.65 | | | $ | (0.55 | ) |
| | 2017 - C | | | 16.52 | | | | (0.10 | ) | | | 0.52 | | | | 0.42 | | | | (0.55 | ) |
| | 2017 - Institutional | | | 24.76 | | | | (0.02 | ) | | | 0.82 | | | | 0.80 | | | | (0.55 | ) |
| | 2017 - Service | | | 20.92 | | | | (0.07 | ) | | | 0.68 | | | | 0.61 | | | | (0.55 | ) |
| | 2017 - IR | | | 22.46 | | | | (0.03 | ) | | | 0.74 | | | | 0.71 | | | | (0.55 | ) |
| | 2017 - R | | | 20.99 | | | | (0.08 | ) | | | 0.69 | | | | 0.61 | | | | (0.55 | ) |
| | 2017 - R6 | | | 24.77 | | | | (0.02 | ) | | | 0.81 | | | | 0.79 | | | | (0.55 | ) |
| | | | | | | | | | | | | | | | | | | | | | |
| | FOR THE FISCAL YEARS ENDED AUGUST 31, | |
| | 2016 - A | | | 23.84 | | | | (0.10 | )(e) | | | 0.77 | | | | 0.67 | | | | (2.81 | ) |
| | 2016 - C | | | 18.95 | | | | (0.20 | )(e) | | | 0.58 | | | | 0.38 | | | | (2.81 | ) |
| | 2016 - Institutional | | | 26.71 | | | | (0.03 | )(e) | | | 0.89 | | | | 0.86 | | | | (2.81 | ) |
| | 2016 - Service | | | 23.11 | | | | (0.13 | )(e) | | | 0.75 | | | | 0.62 | | | | (2.81 | ) |
| | 2016 - IR | | | 24.52 | | | | (0.05 | )(e) | | | 0.80 | | | | 0.75 | | | | (2.81 | ) |
| | 2016 - R | | | 23.21 | | | | (0.15 | )(e) | | | 0.74 | | | | 0.59 | | | | (2.81 | ) |
| | 2016 - R6 | | | 26.71 | | | | (0.04 | )(e) | | | 0.91 | | | | 0.87 | | | | (2.81 | ) |
| | 2015 - A | | | 30.22 | | | | (0.17 | )(f) | | | (0.05 | ) | | | (0.22 | ) | | | (6.16 | ) |
| | 2015 - C | | | 25.42 | | | | (0.30 | )(f) | | | (0.01 | ) | | | (0.31 | ) | | | (6.16 | ) |
| | 2015 - Institutional | | | 33.02 | | | | (0.07 | )(f) | | | (0.08 | ) | | | (0.15 | ) | | | (6.16 | ) |
| | 2015 - Service | | | 29.51 | | | | (0.19 | )(f) | | | (0.05 | ) | | | (0.24 | ) | | | (6.16 | ) |
| | 2015 - IR | | | 30.85 | | | | (0.11 | )(f) | | | (0.06 | ) | | | (0.17 | ) | | | (6.16 | ) |
| | 2015 - R | | | 29.65 | | | | (0.23 | )(f) | | | (0.05 | ) | | | (0.28 | ) | | | (6.16 | ) |
| | 2015 - R6 (Commenced July 31, 2015) | | | 28.49 | | | | (0.01 | )(f) | | | (1.77 | ) | | | (1.78 | ) | | | — | |
| | 2014 - A | | | 26.65 | | | | (0.19 | ) | | | 5.95 | | | | 5.76 | | | | (2.19 | ) |
| | 2014 - C | | | 22.89 | | | | (0.34 | ) | | | 5.06 | | | | 4.72 | | | | (2.19 | ) |
| | 2014 - Institutional | | | 28.83 | | | | (0.08 | ) | | | 6.46 | | | | 6.38 | | | | (2.19 | ) |
| | 2014 - Service | | | 26.10 | | | | (0.21 | ) | | | 5.81 | | | | 5.60 | | | | (2.19 | ) |
| | 2014 - IR | | | 27.10 | | | | (0.12 | ) | | | 6.06 | | | | 5.94 | | | | (2.19 | ) |
| | 2014 - R | | | 26.25 | | | | (0.25 | ) | | | 5.84 | | | | 5.59 | | | | (2.19 | ) |
| | 2013 - A | | | 23.88 | | | | (0.11 | )(g) | | | 4.53 | | | | 4.42 | | | | (1.65 | ) |
| | 2013 - C | | | 20.89 | | | | (0.26 | )(g) | | | 3.91 | | | | 3.65 | | | | (1.65 | ) |
| | 2013 - Institutional | | | 25.59 | | | | (0.01 | )(g) | | | 4.90 | | | | 4.89 | | | | (1.65 | ) |
| | 2013 - Service | | | 23.44 | | | | (0.13 | )(g) | | | 4.44 | | | | 4.31 | | | | (1.65 | ) |
| | 2013 - IR | | | 24.19 | | | | (0.05 | )(g) | | | 4.61 | | | | 4.56 | | | | (1.65 | ) |
| | 2013 - R | | | 23.59 | | | | (0.17 | )(g) | | | 4.48 | | | | 4.31 | | | | (1.65 | ) |
| | 2012 - A | | | 21.36 | | | | (0.15 | ) | | | 4.06 | | | | 3.91 | | | | (1.39 | ) |
| | 2012 - C | | | 18.99 | | | | (0.28 | ) | | | 3.57 | | | | 3.29 | | | | (1.39 | ) |
| | 2012 - Institutional | | | 22.71 | | | | (0.06 | ) | | | 4.33 | | | | 4.27 | | | | (1.39 | ) |
| | 2012 - Service | | | 21.01 | | | | (0.17 | ) | | | 3.99 | | | | 3.82 | | | | (1.39 | ) |
| | 2012 - IR | | | 21.57 | | | | (0.09 | ) | | | 4.10 | | | | 4.01 | | | | (1.39 | ) |
| | 2012 - R | | | 21.17 | | | | (0.20 | ) | | | 4.01 | | | | 3.81 | | | | (1.39 | ) |
| | (a) | | Calculated based on the average shares outstanding methodology. |
| | (b) | | Assumes investment at the NAV at the beginning of the period, reinvestment of all dividends and distributions, a complete redemption of the investment at the NAV at the end of the period and no sales or redemption charges. Total returns would be reduced if a sales or redemption charge was taken into account. Returns do not reflect the impact of taxes to shareholder relating to Fund distributions or the redemption of Fund shares. Total returns for periods less than one full year are not annualized. |
| | (c) | | The Fund’s portfolio turnover rate is calculated in accordance with regulatory requirements, without regard to transactions involving short term investments. If such transactions were included, the Fund’s portfolio turnover rate may be higher. |
| | (e) | | Reflects income recognized from special dividends which amounted to $0.04 per share and 0.16% of average net assets. |
| | (f) | | Reflects income recognized from special dividends which amounted to $0.03 per share and 0.10% of average net assets. |
| | (g) | | Reflects income recognized from special dividends which amounted to $0.04 per share and 0.17% of average net assets. |
| | |
| 94 | | The accompanying notes are an integral part of these financial statements. |
GOLDMAN SACHS GROWTH OPPORTUNITIES FUND
| | | | | | | | | | | | | | | | | | | | | | | | | | | | | | | | | | | | | | | | |
| | | | | | | | | | | | | |
| | | Net asset
value, end
of period | | | | | Total
return(b) | | | | | Net assets,
end of
period
(in 000s) | | | | | Ratio of
net expenses
to average
net assets | | | | | Ratio of
total expenses
to average
net assets | | | | | Ratio of
net investment
income (loss)
to average
net assets | | | | | Portfolio
turnover
rate(c) | |
| | | | | | | | | | | | | | | | | | | | | | | | | | | | | | | | | | | | | | | | |
| | $ | 21.80 | | | | | | 3.13 | % | | | | $ | 527,488 | | | | | | 1.30 | %(d) | | | | | 1.43 | %(d) | | | | | (0.56 | )%(d) | | | | | 35 | % |
| | | 16.39 | | | | | | 2.72 | | | | | | 106,987 | | | | | | 2.05 | (d) | | | | | 2.19 | (d) | | | | | (1.31 | )(d) | | | | | 35 | |
| | | 25.01 | | | | | | 3.35 | | | | | | 1,945,527 | | | | | | 0.95 | (d) | | | | | 1.03 | (d) | | | | | (0.20 | )(d) | | | | | 35 | |
| | | 20.98 | | | | | | 3.06 | | | | | | 33,147 | | | | | | 1.45 | (d) | | | | | 1.53 | (d) | | | | | (0.71 | )(d) | | | | | 35 | |
| | | 22.62 | | | | | | 3.30 | | | | | | 134,257 | | | | | | 1.05 | (d) | | | | | 1.18 | (d) | | | | | (0.30 | )(d) | | | | | 35 | |
| | | 21.05 | | | | | | 3.05 | | | | | | 59,337 | | | | | | 1.55 | (d) | | | | | 1.69 | (d) | | | | | (0.80 | )(d) | | | | | 35 | |
| | | 25.01 | | | | | | 3.31 | | | | | | 101,116 | | | | | | 0.93 | (d) | | | | | 1.01 | (d) | | | | | (0.16 | )(d) | | | | | 35 | |
| | | | | | | | | | | | | | | | | | | | | | | | | | | | | | | | | | | | | | | | |
| | | | | | | | | | | | | | | | | | | | | | | | | | | | | | | | | | | | | | | | |
| | | 21.70 | | | | | | 3.39 | | | | | | 631,053 | | | | | | 1.32 | | | | | | 1.42 | | | | | | (0.47 | )(e) | | | | | 55 | |
| | | 16.52 | | | | | | 2.66 | | | | | | 128,788 | | | | | | 2.07 | | | | | | 2.17 | | | | | | (1.23 | )(e) | | | | | 55 | |
| | | 24.76 | | | | | | 3.76 | | | | | | 2,160,714 | | | | | | 0.95 | | | | | | 1.02 | | | | | | (0.11 | )(e) | | | | | 55 | |
| | | 20.92 | | | | | | 3.27 | | | | | | 37,432 | | | | | | 1.45 | | | | | | 1.52 | | | | | | (0.61 | )(e) | | | | | 55 | |
| | | 22.46 | | | | | | 3.64 | | | | | | 135,930 | | | | | | 1.07 | | | | | | 1.17 | | | | | | (0.23 | )(e) | | | | | 55 | |
| | | 20.99 | | | | | | 3.12 | | | | | | 63,105 | | | | | | 1.57 | | | | | | 1.67 | | | | | | (0.73 | )(e) | | | | | 55 | |
| | | 24.77 | | | | | | 3.81 | | | | | | 44,865 | | | | | | 0.93 | | | | | | 1.01 | | | | | | (0.19 | )(e) | | | | | 55 | |
| | | 23.84 | | | | | | (1.47 | ) | | | | | 946,463 | | | | | | 1.35 | | | | | | 1.40 | | | | | | (0.65 | )(f) | | | | | 51 | |
| | | 18.95 | | | | | | (2.23 | ) | | | | | 168,461 | | | | | | 2.10 | | | | | | 2.15 | | | | | | (1.40 | )(f) | | | | | 51 | |
| | | 26.71 | | | | | | (1.08 | ) | | | | | 3,171,058 | | | | | | 0.95 | | | | | | 1.00 | | | | | | (0.24 | )(f) | | | | | 51 | |
| | | 23.11 | | | | | | (1.59 | ) | | | | | 49,105 | | | | | | 1.45 | | | | | | 1.50 | | | | | | (0.75 | )(f) | | | | | 51 | |
| | | 24.52 | | | | | | (1.25 | ) | | | | | 171,980 | | | | | | 1.10 | | | | | | 1.15 | | | | | | (0.41 | )(f) | | | | | 51 | |
| | | 23.21 | | | | | | (1.74 | ) | | | | | 77,673 | | | | | | 1.60 | | | | | | 1.65 | | | | | | (0.90 | )(f) | | | | | 51 | |
| | | 26.71 | | | | | | (6.25 | ) | | | | | 9 | | | | | | 0.97 | (d) | | | | | 1.02 | (d) | | | | | (0.32 | )(d)(f) | | | | | 51 | |
| | | 30.22 | | | | | | 22.57 | | | | | | 1,110,320 | | | | | | 1.36 | | | | | | 1.40 | | | | | | (0.66 | ) | | | | | 59 | |
| | | 25.42 | | | | | | 21.67 | | | | | | 191,125 | | | | | | 2.11 | | | | | | 2.15 | | | | | | (1.41 | ) | | | | | 59 | |
| | | 33.02 | | | | | | 23.04 | | | | | | 3,750,790 | | | | | | 0.96 | | | | | | 1.00 | | | | | | (0.26 | ) | | | | | 59 | |
| | | 29.51 | | | | | | 22.42 | | | | | | 57,643 | | | | | | 1.46 | | | | | | 1.50 | | | | | | (0.76 | ) | | | | | 59 | |
| | | 30.85 | | | | | | 22.87 | | | | | | 143,249 | | | | | | 1.11 | | | | | | 1.15 | | | | | | (0.41 | ) | | | | | 59 | |
| | | 29.65 | | | | | | 22.25 | | | | | | 80,542 | | | | | | 1.61 | | | | | | 1.65 | | | | | | (0.91 | ) | | | | | 59 | |
| | | 26.65 | | | | | | 19.84 | | | | | | 1,130,449 | | | | | | 1.35 | | | | | | 1.41 | | | | | | (0.44 | )(g) | | | | | 41 | |
| | | 22.89 | | | | | | 18.94 | | | | | | 172,010 | | | | | | 2.10 | | | | | | 2.16 | | | | | | (1.19 | )(g) | | | | | 41 | |
| | | 28.83 | | | | | | 20.38 | | | | | | 3,207,925 | | | | | | 0.95 | | | | | | 1.01 | | | | | | (0.05 | )(g) | | | | | 41 | |
| | | 26.10 | | | | | | 19.74 | | | | | | 60,977 | | | | | | 1.45 | | | | | | 1.51 | | | | | | (0.54 | )(g) | | | | | 41 | |
| | | 27.10 | | | | | | 20.18 | | | | | | 91,093 | | | | | | 1.10 | | | | | | 1.16 | | | | | | (0.21 | )(g) | | | | | 41 | |
| | | 26.25 | | | | | | 19.61 | | | | | | 71,263 | | | | | | 1.60 | | | | | | 1.66 | | | | | | (0.71 | )(g) | | | | | 41 | |
| | | 23.88 | | | | | | 19.15 | | | | | | 1,068,187 | | | | | | 1.35 | | | | | | 1.41 | | | | | | (0.67 | ) | | | | | 59 | |
| | | 20.89 | | | | | | 18.24 | | | | | | 157,901 | | | | | | 2.10 | | | | | | 2.16 | | | | | | (1.42 | ) | | | | | 59 | |
| | | 25.59 | | | | | | 19.61 | | | | | | 2,710,810 | | | | | | 0.95 | | | | | | 1.01 | | | | | | (0.27 | ) | | | | | 59 | |
| | | 23.44 | | | | | | 19.03 | | | | | | 59,834 | | | | | | 1.45 | | | | | | 1.51 | | | | | | (0.77 | ) | | | | | 59 | |
| | | 24.19 | | | | | | 19.43 | | | | | | 75,702 | | | | | | 1.10 | | | | | | 1.16 | | | | | | (0.42 | ) | | | | | 59 | |
| | | 23.59 | | | | | | 18.83 | | | | | | 54,071 | | | | | | 1.60 | | | | | | 1.66 | | | | | | (0.91 | ) | | | | | 59 | |
| | |
| The accompanying notes are an integral part of these financial statements. | | 95 |
GOLDMAN SACHS SMALL/MID CAP GROWTH FUND
Financial Highlights
Selected Data for a Share Outstanding Throughout Each Period
| | | | | | | | | | | | | | | | | | | | | | |
| | | | | | | | Income (loss) from
investment operations | | | | |
| | | Year - Share Class | | Net asset
value,
beginning
of period | | | Net
investment
income (loss)(a) | | | Net realized
and unrealized
gain (loss) | | | Total from
investment
operations | | | Distribution
to shareholders
from net
realized
gains | |
| | FOR THE SIX MONTHS ENDED FEBRUARY 28, (UNAUDITED) | |
| | 2017 - A | | $ | 19.85 | | | $ | (0.05 | )(d) | | $ | 0.94 | | | $ | 0.89 | | | $ | (0.69 | ) |
| | 2017 - C | | | 17.75 | | | | (0.11 | )(d) | | | 0.83 | | | | 0.72 | | | | (0.69 | ) |
| | 2017 - Institutional | | | 20.89 | | | | (0.02 | )(d) | | | 0.99 | | | | 0.97 | | | | (0.69 | ) |
| | 2017 - Service | | | 19.46 | | | | (0.06 | )(d) | | | 0.92 | | | | 0.86 | | | | (0.69 | ) |
| | 2017 - IR | | | 20.39 | | | | (0.02 | )(d) | | | 0.96 | | | | 0.94 | | | | (0.69 | ) |
| | 2017 - R | | | 19.34 | | | | (0.07 | )(d) | | | 0.91 | | | | 0.84 | | | | (0.69 | ) |
| | 2017 - R6 | | | 20.89 | | | | — | (d)(f) | | | 0.98 | | | | 0.98 | | | | (0.69 | ) |
| | | | | | | | | | | | | | | | | | | | | | |
| | FOR THE FISCAL YEARS ENDED AUGUST 31, | |
| | 2016 - A | | | 20.72 | | | | (0.14 | )(g) | | | — | | | | (0.14 | ) | | | (0.73 | ) |
| | 2016 - C | | | 18.74 | | | | (0.25 | )(g) | | | (0.01 | ) | | | (0.26 | ) | | | (0.73 | ) |
| | 2016 - Institutional | | | 21.69 | | | | (0.07 | )(g) | | | — | | | | (0.07 | ) | | | (0.73 | ) |
| | 2016 - Service | | | 20.35 | | | | (0.16 | )(g) | | | — | | | | (0.16 | ) | | | (0.73 | ) |
| | 2016 - IR | | | 21.21 | | | | (0.09 | )(g) | | | — | | | | (0.09 | ) | | | (0.73 | ) |
| | 2016 - R | | | 20.26 | | | | (0.18 | )(g) | | | (0.01 | ) | | | (0.19 | ) | | | (0.73 | ) |
| | 2016 - R6 | | | 21.69 | | | | (0.06 | )(g) | | | (0.01 | ) | | | (0.07 | ) | | | (0.73 | ) |
| | 2015 - A | | | 20.90 | | | | (0.18 | )(h) | | | 1.71 | | | | 1.53 | | | | (1.71 | ) |
| | 2015 - C | | | 19.20 | | | | (0.31 | )(h) | | | 1.56 | | | | 1.25 | | | | (1.71 | ) |
| | 2015 - Institutional | | | 21.71 | | | | (0.10 | )(h) | | | 1.79 | | | | 1.69 | | | | (1.71 | ) |
| | 2015 - Service | | | 20.58 | | | | (0.20 | )(h) | | | 1.68 | | | | 1.48 | | | | (1.71 | ) |
| | 2015 - IR | | | 21.30 | | | | (0.13 | )(h) | | | 1.75 | | | | 1.62 | | | | (1.71 | ) |
| | 2015 - R | | | 20.51 | | | | (0.23 | )(h) | | | 1.69 | | | | 1.46 | | | | (1.71 | ) |
| | 2015 - R6 (Commenced July 31, 2015) | | | 23.47 | | | | (0.01 | )(h) | | | (1.77 | ) | | | (1.78 | ) | | | — | |
| | 2014 - A | | | 18.63 | | | | (0.16 | )(i) | | | 3.43 | | | | 3.27 | | | | (1.00 | ) |
| | 2014 - C | | | 17.31 | | | | (0.29 | )(i) | | | 3.18 | | | | 2.89 | | | | (1.00 | ) |
| | 2014 - Institutional | | | 19.25 | | | | (0.09 | )(i) | | | 3.55 | | | | 3.46 | | | | (1.00 | ) |
| | 2014 - Service | | | 18.38 | | | | (0.18 | )(i) | | | 3.38 | | | | 3.20 | | | | (1.00 | ) |
| | 2014 - IR | | | 18.93 | | | | (0.12 | )(i) | | | 3.49 | | | | 3.37 | | | | (1.00 | ) |
| | 2014 - R | | | 18.35 | | | | (0.21 | )(i) | | | 3.37 | | | | 3.16 | | | | (1.00 | ) |
| | 2013 - A | | | 15.52 | | | | (0.11 | )(j) | | | 3.99 | | | | 3.88 | | | | (0.77 | ) |
| | 2013 - C | | | 14.58 | | | | (0.23 | )(j) | | | 3.73 | | | | 3.50 | | | | (0.77 | ) |
| | 2013 - Institutional | | | 15.95 | | | | (0.06 | )(j) | | | 4.13 | | | | 4.07 | | | | (0.77 | ) |
| | 2013 - Service | | | 15.34 | | | | (0.13 | )(j) | | | 3.94 | | | | 3.81 | | | | (0.77 | ) |
| | 2013 - IR | | | 15.72 | | | | (0.08 | )(j) | | | 4.06 | | | | 3.98 | | | | (0.77 | ) |
| | 2013 - R | | | 15.34 | | | | (0.15 | )(j) | | | 3.93 | | | | 3.78 | | | | (0.77 | ) |
| | 2012 - A | | | 13.67 | | | | (0.12 | ) | | | 2.63 | | | | 2.51 | | | | (0.66 | ) |
| | 2012 - C | | | 12.98 | | | | (0.21 | ) | | | 2.47 | | | | 2.26 | | | | (0.66 | ) |
| | 2012 - Institutional | | | 13.98 | | | | (0.06 | ) | | | 2.69 | | | | 2.63 | | | | (0.66 | ) |
| | 2012 - Service | | | 13.53 | | | | (0.13 | ) | | | 2.60 | | | | 2.47 | | | | (0.66 | ) |
| | 2012 - IR | | | 13.81 | | | | (0.08 | ) | | | 2.65 | | | | 2.57 | | | | (0.66 | ) |
| | 2012 - R | | | 13.55 | | | | (0.15 | ) | | | 2.60 | | | | 2.45 | | | | (0.66 | ) |
| | (a) | | Calculated based on the average shares outstanding methodology. |
| | (b) | | Assumes investment at the NAV at the beginning of the period, reinvestment of all dividends and distributions, a complete redemption of the investment at the NAV at the end of the period and no sales or redemption charges. Total returns would be reduced if a sales or redemption charge was taken into account. Returns do not reflect the impact of taxes to shareholder relating to Fund distributions or the redemption of Fund shares. Total returns for periods less than one full year are not annualized. |
| | (c) | | The Fund’s portfolio turnover rate is calculated in accordance with regulatory requirements, without regard to transactions involving short term investments. If such transactions were included, the Fund’s portfolio turnover rate may be higher. |
| | (d) | | Reflects income recognized from special dividends which amounted to $0.02 per share and 0.23% of average net assets. |
| | (f) | | Amount is less than $0.005 per share. |
| | (g) | | Reflects income recognized from special dividends which amounted to $0.03 per share and 0.15% of average net assets. |
| | (h) | | Reflects income recognized from special dividends which amounted to $0.01 per share and 0.05% of average net assets. |
| | (i) | | Reflects income recognized from special dividends which amounted to $0.01 per share and 0.12% of average net assets. |
| | (j) | | Reflects income recognized from special dividends which amounted to $0.02 per share and 0.14% of average net assets. |
| | |
| 96 | | The accompanying notes are an integral part of these financial statements. |
GOLDMAN SACHS SMALL/MID CAP GROWTH FUND
| | | | | | | | | | | | | | | | | | | | | | | | | | | | | | | | | | | | | | | | |
| | | | | | | | | | | | | |
| | | Net asset
value, end
of period | | | | | Total
return(b) | | | | | Net assets,
end of
period
(in 000s) | | | | | Ratio of
net expenses
to average
net assets | | | | | Ratio of
total expenses
to average
net assets | | | | | Ratio of
net investment
income (loss)
to average
net assets | | | | | Portfolio
turnover
rate(c) | |
| | | | | | | | | | | | | | | | | | | | | | | | | | | | | | | | | | | | | | | | |
| | $ | 20.05 | | | | | | 4.60 | % | | | | $ | 400,437 | | | | | | 1.29 | %(e) | | | | | 1.46 | %(e) | | | | | (0.56 | )%(d)(e) | | | | | 30 | % |
| | | 17.78 | | | | | | 4.24 | | | | | | 226,601 | | | | | | 2.04 | (e) | | | | | 2.21 | (e) | | | | | (1.28 | )(d)(e) | | | | | 30 | |
| | | 21.17 | | | | | | 4.76 | | | | | | 1,094,556 | | | | | | 0.92 | (e) | | | | | 1.06 | (e) | | | | | (0.16 | )(d)(e) | | | | | 30 | |
| | | 19.63 | | | | | | 4.54 | | | | | | 14,887 | | | | | | 1.42 | (e) | | | | | 1.56 | (e) | | | | | (0.62 | )(d)(e) | | | | | 30 | |
| | | 20.64 | | | | | | 4.73 | | | | | | 448,105 | | | | | | 1.04 | (e) | | | | | 1.21 | (e) | | | | | (0.25 | )(d)(e) | | | | | 30 | |
| | | 19.49 | | | | | | 4.46 | | | | | | 29,676 | | | | | | 1.54 | (e) | | | | | 1.71 | (e) | | | | | (0.78 | )(d)(e) | | | | | 30 | |
| | | 21.18 | | | | | | 4.80 | | | | | | 18,806 | | | | | | 0.90 | (e) | | | | | 1.04 | (e) | | | | | (0.01 | )(d)(e) | | | | | 30 | |
| | | | | | | | | | | | | | | | | | | | | | | | | | | | | | | | | | | | | | | | |
| | | | | | | | | | | | | | | | | | | | | | | | | | | | | | | | | | | | | | | | |
| | | 19.85 | | | | | | (0.56 | ) | | | | | 736,221 | | | | | | 1.31 | | | | | | 1.45 | | | | | | (0.73 | )(g) | | | | | 67 | |
| | | 17.75 | | | | | | (1.34 | ) | | | | | 265,282 | | | | | | 2.06 | | | | | | 2.20 | | | | | | (1.48 | )(g) | | | | | 67 | |
| | | 20.89 | | | | | | (0.21 | ) | | | | | 1,235,282 | | | | | | 0.93 | | | | | | 1.05 | | | | | | (0.35 | )(g) | | | | | 67 | |
| | | 19.46 | | | | | | (0.67 | ) | | | | | 13,956 | | | | | | 1.43 | | | | | | 1.55 | | | | | | (0.85 | )(g) | | | | | 67 | |
| | | 20.39 | | | | | | (0.31 | ) | | | | | 313,812 | | | | | | 1.06 | | | | | | 1.20 | | | | | | (0.48 | )(g) | | | | | 67 | |
| | | 19.34 | | | | | | (0.83 | ) | | | | | 34,493 | | | | | | 1.56 | | | | | | 1.70 | | | | | | (0.98 | )(g) | | | | | 67 | |
| | | 20.89 | | | | | | (0.21 | ) | | | | | 9,785 | | | | | | 0.92 | | | | | | 1.04 | | | | | | (0.28 | )(g) | | | | | 67 | |
| | | 20.72 | | | | | | 7.67 | | | | | | 906,362 | | | | | | 1.33 | | | | | | 1.45 | | | | | | (0.85 | )(h) | | | | | 47 | |
| | | 18.74 | | | | | | 6.84 | | | | | | 268,384 | | | | | | 2.08 | | | | | | 2.20 | | | | | | (1.60 | )(h) | | | | | 47 | |
| | | 21.69 | | | | | | 8.15 | | | | | | 1,355,322 | | | | | | 0.93 | | | | | | 1.05 | | | | | | (0.45 | )(h) | | | | | 47 | |
| | | 20.35 | | | | | | 7.54 | | | | | | 12,695 | | | | | | 1.42 | | | | | | 1.55 | | | | | | (0.95 | )(h) | | | | | 47 | |
| | | 21.21 | | | | | | 7.97 | | | | | | 221,058 | | | | | | 1.08 | | | | | | 1.20 | | | | | | (0.60 | )(h) | | | | | 47 | |
| | | 20.26 | | | | | | 7.46 | | | | | | 34,697 | | | | | | 1.58 | | | | | | 1.70 | | | | | | (1.10 | )(h) | | | | | 47 | |
| | | 21.69 | | | | | | (7.58 | ) | | | | | 9 | | | | | | 0.92 | (e) | | | | | 1.05 | (e) | | | | | (0.34 | )(e)(h) | | | | | 47 | |
| | | 20.90 | | | | | | 17.97 | | | | | | 741,254 | | | | | | 1.33 | | | | | | 1.48 | | | | | | (0.82 | )(i) | | | | | 43 | |
| | | 19.20 | | | | | | 17.11 | | | | | | 221,451 | | | | | | 2.08 | | | | | | 2.23 | | | | | | (1.57 | )(i) | | | | | 43 | |
| | | 21.71 | | | | | | 18.39 | | | | | | 1,077,769 | | | | | | 0.93 | | | | | | 1.08 | | | | | | (0.42 | )(i) | | | | | 43 | |
| | | 20.58 | | | | | | 17.83 | | | | | | 8,692 | | | | | | 1.43 | | | | | | 1.58 | | | | | | (0.92 | )(i) | | | | | 43 | |
| | | 21.30 | | | | | | 18.22 | | | | | | 171,779 | | | | | | 1.08 | | | | | | 1.23 | | | | | | (0.57 | )(i) | | | | | 43 | |
| | | 20.51 | | | | | | 17.63 | | | | | | 34,118 | | | | | | 1.58 | | | | | | 1.73 | | | | | | (1.07 | )(i) | | | | | 43 | |
| | | 18.63 | | | | | | 26.18 | | | | | | 592,798 | | | | | | 1.34 | | | | | | 1.49 | | | | | | (0.68 | )(j) | | | | | 37 | |
| | | 17.31 | | | | | | 25.23 | | | | | | 150,744 | | | | | | 2.09 | | | | | | 2.24 | | | | | | (1.44 | )(j) | | | | | 37 | |
| | | 19.25 | | | | | | 26.68 | | | | | | 725,662 | | | | | | 0.94 | | | | | | 1.09 | | | | | | (0.32 | )(j) | | | | | 37 | |
| | | 18.38 | | | | | | 26.02 | | | | | | 8,495 | | | | | | 1.44 | | | | | | 1.59 | | | | | | (0.77 | )(j) | | | | | 37 | |
| | | 18.93 | | | | | | 26.49 | | | | | | 93,255 | | | | | | 1.09 | | | | | | 1.24 | | | | | | (0.45 | )(j) | | | | | 37 | |
| | | 18.35 | | | | | | 25.82 | | | | | | 24,420 | | | | | | 1.59 | | | | | | 1.74 | | | | | | (0.93 | )(j) | | | | | 37 | |
| | | 15.52 | | | | | | 18.97 | | | | | | 393,284 | | | | | | 1.35 | | | | | | 1.50 | | | | | | (0.83 | ) | | | | | 51 | |
| | | 14.58 | | | | | | 18.03 | | | | | | 87,185 | | | | | | 2.10 | | | | | | 2.25 | | | | | | (1.58 | ) | | | | | 51 | |
| | | 15.95 | | | | | | 19.42 | | | | | | 291,636 | | | | | | 0.95 | | | | | | 1.10 | | | | | | (0.43 | ) | | | | | 51 | |
| | | 15.34 | | | | | | 18.87 | | | | | | 6,774 | | | | | | 1.45 | | | | | | 1.60 | | | | | | (0.92 | ) | | | | | 51 | |
| | | 15.72 | | | | | | 19.22 | | | | | | 46,777 | | | | | | 1.10 | | | | | | 1.25 | | | | | | (0.57 | ) | | | | | 51 | |
| | | 15.34 | | | | | | 18.69 | | | | | | 19,156 | | | | | | 1.60 | | | | | | 1.75 | | | | | | (1.07 | ) | | | | | 51 | |
| | |
| The accompanying notes are an integral part of these financial statements. | | 97 |
GOLDMAN SACHS STRATEGIC GROWTH FUND
Financial Highlights
Selected Data for a Share Outstanding Throughout Each Period
| | | | | | | | | | | | | | | | | | | | | | | | | | | | | | |
| | | | | | | | Income (loss) from
investment operations | | | Distributions
to shareholders | |
| | | Year - Share Class | | Net asset
value,
beginning
of period | | | Net
investment
income (loss)(a) | | | Net realized
and unrealized
gain (loss) | | | Total from
investment
operations | | | From net
investment
income | | | From net
realized
gains | | | Total
distributions | |
| | FOR THE SIX MONTHS ENDED FEBRUARY 28, (UNAUDITED) | |
| | 2017 - A | | $ | 11.91 | | | $ | — | (d) | | $ | 0.88 | | | $ | 0.88 | | | $ | (0.04 | ) | | $ | (0.36 | ) | | $ | (0.40 | ) |
| | 2017 - C | | | 10.00 | | | | (0.03 | ) | | | 0.73 | | | | 0.70 | | | | — | | | | (0.36 | ) | | | (0.36 | ) |
| | 2017 - Institutional | | | 12.64 | | | | 0.03 | | | | 0.93 | | | | 0.96 | | | | (0.08 | ) | | | (0.36 | ) | | | (0.44 | ) |
| | 2017 - Service | | | 11.85 | | | | — | (d) | | | 0.87 | | | | 0.87 | | | | (0.04 | ) | | | (0.36 | ) | | | (0.40 | ) |
| | 2017 - IR | | | 12.63 | | | | 0.02 | | | | 0.94 | | | | 0.96 | | | | (0.07 | ) | | | (0.36 | ) | | | (0.43 | ) |
| | 2017 - R | | | 11.75 | | | | (0.01 | ) | | | 0.87 | | | | 0.86 | | | | (0.05 | ) | | | (0.36 | ) | | | (0.41 | ) |
| | 2017 - R6 | | | 12.63 | | | | 0.03 | | | | 0.94 | | | | 0.97 | | | | (0.09 | ) | | | (0.36 | ) | | | (0.45 | ) |
| | | | | | | | | | | | | | | | | | | | | | | | | | | | | | |
| | FOR THE FISCAL YEARS ENDED AUGUST 31, | |
| | 2016 - A | | | 11.86 | | | | 0.02 | | | | 0.74 | | | | 0.76 | | | | (0.02 | ) | | | (0.69 | ) | | | (0.71 | ) |
| | 2016 - C | | | 10.12 | | | | (0.05 | ) | | | 0.62 | | | | 0.57 | | | | — | | | | (0.69 | ) | | | (0.69 | ) |
| | 2016 - Institutional | | | 12.53 | | | | 0.07 | | | | 0.78 | | | | 0.85 | | | | (0.05 | ) | | | (0.69 | ) | | | (0.74 | ) |
| | 2016 - Service | | | 11.81 | | | | 0.01 | | | | 0.73 | | | | 0.74 | | | | (0.01 | ) | | | (0.69 | ) | | | (0.70 | ) |
| | 2016 - IR | | | 12.53 | | | | 0.05 | | | | 0.78 | | | | 0.83 | | | | (0.04 | ) | | | (0.69 | ) | | | (0.73 | ) |
| | 2016 - R | | | 11.74 | | | | (0.01 | ) | | | 0.73 | | | | 0.72 | | | | (0.02 | ) | | | (0.69 | ) | | | (0.71 | ) |
| | 2016 - R6 | | | 12.53 | | | | 0.07 | | | | 0.77 | | | | 0.84 | | | | (0.05 | ) | | | (0.69 | ) | | | (0.74 | ) |
| | 2015 - A | | | 13.50 | | | | 0.02 | (f) | | | 0.42 | | | | 0.44 | | | | — | | | | (2.08 | ) | | | (2.08 | ) |
| | 2015 - C | | | 11.90 | | | | (0.07 | )(f) | | | 0.37 | | | | 0.30 | | | | — | | | | (2.08 | ) | | | (2.08 | ) |
| | 2015 - Institutional | | | 14.15 | | | | 0.07 | (f) | | | 0.43 | | | | 0.50 | | | | (0.04 | ) | | | (2.08 | ) | | | (2.12 | ) |
| | 2015 - Service | | | 13.47 | | | | — | (d)(f) | | | 0.42 | | | | 0.42 | | | | — | | | | (2.08 | ) | | | (2.08 | ) |
| | 2015 - IR | | | 14.14 | | | | 0.05 | (f) | | | 0.44 | | | | 0.49 | | | | (0.02 | ) | | | (2.08 | ) | | | (2.10 | ) |
| | 2015 - R | | | 13.42 | | | | (0.01 | )(f) | | | 0.41 | | | | 0.40 | | | | — | | | | (2.08 | ) | | | (2.08 | ) |
| | 2015 - R6 (Commenced July 31, 2015) | | | 13.36 | | | | 0.01 | (f) | | | (0.84 | ) | | | (0.83 | ) | | | — | | | | — | | | | — | |
| | 2014 - A | | | 12.29 | | | | (0.01 | ) | | | 3.06 | | | | 3.05 | | | | (0.01 | ) | | | (1.83 | ) | | | (1.84 | ) |
| | 2014 - C | | | 11.09 | | | | (0.10 | ) | | | 2.74 | | | | 2.64 | | | | — | | | | (1.83 | ) | | | (1.83 | ) |
| | 2014 - Institutional | | | 12.79 | | | | 0.04 | | | | 3.21 | | | | 3.25 | | | | (0.06 | ) | | | (1.83 | ) | | | (1.89 | ) |
| | 2014 - Service | | | 12.28 | | | | (0.02 | ) | | | 3.05 | | | | 3.03 | | | | (0.01 | ) | | | (1.83 | ) | | | (1.84 | ) |
| | 2014 - IR | | | 12.80 | | | | 0.02 | | | | 3.20 | | | | 3.22 | | | | (0.05 | ) | | | (1.83 | ) | | | (1.88 | ) |
| | 2014 - R | | | 12.26 | | | | (0.04 | ) | | | 3.05 | | | | 3.01 | | | | (0.02 | ) | | | (1.83 | ) | | | (1.85 | ) |
| | 2013 - A | | | 11.57 | | | | 0.06 | (g) | | | 1.58 | | | | 1.64 | | | | (0.05 | ) | | | (0.87 | ) | | | (0.92 | ) |
| | 2013 - C | | | 10.54 | | | | (0.04 | )(g) | | | 1.46 | | | | 1.42 | | | | — | | | | (0.87 | ) | | | (0.87 | ) |
| | 2013 - Institutional | | | 12.00 | | | | 0.10 | (g) | | | 1.66 | | | | 1.76 | | | | (0.10 | ) | | | (0.87 | ) | | | (0.97 | ) |
| | 2013 - Service | | | 11.59 | | | | 0.03 | (g) | | | 1.61 | | | | 1.64 | | | | (0.08 | ) | | | (0.87 | ) | | | (0.95 | ) |
| | 2013 - IR | | | 12.01 | | | | 0.07 | (g) | | | 1.68 | | | | 1.75 | | | | (0.09 | ) | | | (0.87 | ) | | | (0.96 | ) |
| | 2013 - R | | | 11.53 | | | | 0.03 | (g) | | | 1.60 | | | | 1.63 | | | | (0.03 | ) | | | (0.87 | ) | | | (0.90 | ) |
| | 2012 - A | | | 9.77 | | | | 0.01 | | | | 1.81 | | | | 1.82 | | | | (0.02 | ) | | | — | | | | (0.02 | ) |
| | 2012 - C | | | 8.95 | | | | (0.06 | ) | | | 1.65 | | | | 1.59 | | | | — | | | | — | | | | — | |
| | 2012 - Institutional | | | 10.14 | | | | 0.06 | | | | 1.86 | | | | 1.92 | | | | (0.06 | ) | | | — | | | | (0.06 | ) |
| | 2012 - Service | | | 9.80 | | | | 0.02 | | | | 1.79 | | | | 1.81 | | | | (0.02 | ) | | | — | | | | (0.02 | ) |
| | 2012 - IR | | | 10.10 | | | | 0.04 | | | | 1.87 | | | | 1.91 | | | | — | | | | — | | | | — | |
| | 2012 - R | | | 9.74 | | | | — | (d) | | | 1.79 | | | | 1.79 | | | | — | | | | — | | | | — | |
| | (a) | | Calculated based on the average shares outstanding methodology. |
| | (b) | | Assumes investment at the NAV at the beginning of the period, reinvestment of all dividends and distributions, a complete redemption of the investment at the NAV at the end of the period and no sales or redemption charges. Total returns would be reduced if a sales or redemption charge was taken into account. Returns do not reflect the impact of taxes to shareholder relating to Fund distributions or the redemption of Fund shares. Total returns for periods less than one full year are not annualized. |
| | (c) | | The Fund’s portfolio turnover rate is calculated in accordance with regulatory requirements, without regard to transactions involving short term investments. If such transactions were included, the Fund’s portfolio turnover rate may be higher. |
| | (d) | | Amount is less than $0.005 per share. |
| | (f) | | Reflects income recognized from special dividends which amounted to $0.02 per share and 0.18% of average net assets. |
| | (g) | | Reflects income recognized from special dividends which amounted to $0.03 per share and 0.29% of average net assets. |
| | |
| 98 | | The accompanying notes are an integral part of these financial statements. |
GOLDMAN SACHS STRATEGIC GROWTH FUND
| | | | | | | | | | | | | | | | | | | | | | | | | | | | | | | | | | | | | | | | |
| | | | | | | | | | | | | |
| | | Net asset
value, end
of period | | | | | Total
return(b) | | | | | Net assets,
end of
period
(in 000s) | | | | | Ratio of
net expenses
to average
net assets | | | | | Ratio of
total expenses
to average
net assets | | | | | Ratio of
net investment
income (loss)
to average
net assets | | | | | Portfolio
turnover
rate(c) | |
| | | | | | | | | | | | | | | | | | | | | | | | | | | | | | | | | | | | | | | | |
| | $ | 12.39 | | | | | | 7.62 | % | | | | $ | 46,180 | | | | | | 1.15 | %(e) | | | | | 1.54 | %(e) | | | | | 0.06 | %(e) | | | | | 35 | % |
| | | 10.34 | | | | | | 7.27 | | | | | | 9,847 | | | | | | 1.90 | (e) | | | | | 2.29 | (e) | | | | | (0.69 | )(e) | | | | | 35 | |
| | | 13.16 | | | | | | 7.91 | | | | | | 280,695 | | | | | | 0.75 | (e) | | | | | 1.13 | (e) | | | | | 0.46 | (e) | | | | | 35 | |
| | | 12.32 | | | | | | 7.61 | | | | | | 431 | | | | | | 1.25 | (e) | | | | | 1.64 | (e) | | | | | (0.01 | )(e) | | | | | 35 | |
| | | 13.16 | | | | | | 7.86 | | | | | | 1,353 | | | | | | 0.90 | (e) | | | | | 1.29 | (e) | | | | | 0.40 | (e) | | | | | 35 | |
| | | 12.20 | | | | | | 7.57 | | | | | | 163 | | | | | | 1.40 | (e) | | | | | 1.79 | (e) | | | | | (0.13 | )(e) | | | | | 35 | |
| | | 13.15 | | | | | | 7.93 | | | | | | 11 | | | | | | 0.75 | (e) | | | | | 1.12 | (e) | | | | | 0.47 | (e) | | | | | 35 | |
| | | | | | | | | | | | | | | | | | | | | | | | | | | | | | | | | | | | | | | | |
| | | | | | | | | | | | | | | | | | | | | | | | | | | | | | | | | | | | | | | | |
| | | 11.91 | | | | | | 6.48 | | | | | | 46,093 | | | | | | 1.15 | | | | | | 1.54 | | | | | | 0.19 | | | | | | 56 | |
| | | 10.00 | | | | | | 5.70 | | | | | | 11,103 | | | | | | 1.90 | | | | | | 2.29 | | | | | | (0.56 | ) | | | | | 56 | |
| | | 12.64 | | | | | | 6.89 | | | | | | 294,952 | | | | | | 0.75 | | | | | | 1.14 | | | | | | 0.59 | | | | | | 56 | |
| | | 11.85 | | | | | | 6.40 | | | | | | 272 | | | | | | 1.25 | | | | | | 1.64 | | | | | | 0.11 | | | | | | 56 | |
| | | 12.63 | | | | | | 6.69 | | | | | | 829 | | | | | | 0.90 | | | | | | 1.29 | | | | | | 0.44 | | | | | | 56 | |
| | | 11.75 | | | | | | 6.18 | | | | | | 81 | | | | | | 1.40 | | | | | | 1.79 | | | | | | (0.05 | ) | | | | | 56 | |
| | | 12.63 | | | | | | 6.83 | | | | | | 10 | | | | | | 0.76 | | | | | | 1.15 | | | | | | 0.59 | | | | | | 56 | |
| | | 11.86 | | | | | | 3.09 | | | | | | 45,046 | | | | | | 1.15 | | | | | | 1.52 | | | | | | 0.13 | (f) | | | | | 52 | |
| | | 10.12 | | | | | | 2.23 | | | | | | 11,175 | | | | | | 1.90 | | | | | | 2.27 | | | | | | (0.63 | )(f) | | | | | 52 | |
| | | 12.53 | | | | | | 3.43 | | | | | | 326,619 | | | | | | 0.75 | | | | | | 1.12 | | | | | | 0.52 | (f) | | | | | 52 | |
| | | 11.81 | | | | | | 2.93 | | | | | | 254 | | | | | | 1.25 | | | | | | 1.62 | | | | | | (0.01 | )(f) | | | | | 52 | |
| | | 12.53 | | | | | | 3.34 | | | | | | 817 | | | | | | 0.90 | | | | | | 1.27 | | | | | | 0.37 | (f) | | | | | 52 | |
| | | 11.74 | | | | | | 2.78 | | | | | | 77 | | | | | | 1.40 | | | | | | 1.76 | | | | | | (0.07 | )(f) | | | | | 52 | |
| | | 12.53 | | | | | | (6.21 | ) | | | | | 9 | | | | | | 0.73 | (e) | | | | | 1.06 | (e) | | | | | 0.68 | (e)(f) | | | | | 52 | |
| | | 13.50 | | | | | | 26.74 | | | | | | 51,626 | | | | | | 1.16 | | | | | | 1.53 | | | | | | (0.10 | ) | | | | | 64 | |
| | | 11.90 | | | | | | 25.83 | | | | | | 11,717 | | | | | | 1.91 | | | | | | 2.28 | | | | | | (0.85 | ) | | | | | 64 | |
| | | 14.15 | | | | | | 27.32 | | | | | | 332,401 | | | | | | 0.76 | | | | | | 1.13 | | | | | | 0.30 | | | | | | 64 | |
| | | 13.47 | | | | | | 26.55 | | | | | | 156 | | | | | | 1.26 | | | | | | 1.63 | | | | | | (0.20 | ) | | | | | 64 | |
| | | 14.14 | | | | | | 27.03 | | | | | | 994 | | | | | | 0.91 | | | | | | 1.28 | | | | | | 0.15 | | | | | | 64 | |
| | | 13.42 | | | | | | 26.49 | | | | | | 15 | | | | | | 1.38 | | | | | | 1.75 | | | | | | (0.30 | ) | | | | | 64 | |
| | | 12.29 | | | | | | 15.53 | | | | | | 87,987 | | | | | | 1.15 | | | | | | 1.54 | | | | | | 0.49 | (g) | | | | | 55 | |
| | | 11.09 | | | | | | 14.68 | | | | | | 9,314 | | | | | | 1.90 | | | | | | 2.29 | | | | | | (0.35 | )(g) | | | | | 55 | |
| | | 12.79 | | | | | | 15.98 | | | | | | 242,865 | | | | | | 0.75 | | | | | | 1.14 | | | | | | 0.81 | (g) | | | | | 55 | |
| | | 12.28 | | | | | | 15.45 | | | | | | 82 | | | | | | 1.25 | | | | | | 1.64 | | | | | | 0.24 | (g) | | | | | 55 | |
| | | 12.80 | | | | | | 15.80 | | | | | | 884 | | | | | | 0.90 | | | | | | 1.29 | | | | | | 0.57 | (g) | | | | | 55 | |
| | | 12.26 | | | | | | 15.36 | | | | | | 6 | | | | | | 1.34 | | | | | | 1.73 | | | | | | 0.22 | (g) | | | | | 55 | |
| | | 11.57 | | | | | | 18.45 | | | | | | 181,257 | | | | | | 1.15 | | | | | | 1.51 | | | | | | 0.14 | | | | | | 54 | |
| | | 10.54 | | | | | | 17.71 | | | | | | 8,279 | | | | | | 1.90 | | | | | | 2.26 | | | | | | (0.61 | ) | | | | | 54 | |
| | | 12.00 | | | | | | 18.97 | | | | | | 256,389 | | | | | | 0.75 | | | | | | 1.11 | | | | | | 0.54 | | | | | | 54 | |
| | | 11.59 | | | | | | 18.50 | | | | | | 52 | | | | | | 1.25 | | | | | | 1.61 | | | | | | 0.18 | | | | | | 54 | |
| | | 12.01 | | | | | | 18.85 | | | | | | 321 | | | | | | 0.90 | | | | | | 1.26 | | | | | | 0.38 | | | | | | 54 | |
| | | 11.53 | | | | | | 18.32 | | | | | | 4 | | | | | | 1.40 | | | | | | 1.76 | | | | | | (0.05 | ) | | | | | 54 | |
| | |
| The accompanying notes are an integral part of these financial statements. | | 99 |
GOLDMAN SACHS TECHNOLOGY OPPORTUNITIES FUND
Financial Highlights
Selected Data for a Share Outstanding Throughout Each Period
| | | | | | | | | | | | | | | | | | | | | | |
| | | | | | Income (loss) from
investment operations | | | | |
| | | Year - Share Class | | Net asset
value,
beginning
of period | | | Net
investment
income (loss)(a) | | | Net realized
and unrealized
gain | | | Total from
investment
operations | | | Distributions
to shareholders from net
realized
gains | |
| | FOR THE SIX MONTHS ENDED FEBRUARY 28, (UNAUDITED) | |
| | 2017 - A | | $ | 18.73 | | | $ | (0.07 | ) | | $ | 1.84 | | | $ | 1.77 | | | $ | (0.91 | ) |
| | 2017 - C | | | 16.07 | | | | (0.12 | ) | | | 1.56 | | | | 1.44 | | | | (0.91 | ) |
| | 2017 - Institutional | | | 20.29 | | | | (0.04 | ) | | | 2.00 | | | | 1.96 | | | | (0.91 | ) |
| | 2017 - Service | | | 18.44 | | | | (0.08 | ) | | | 1.80 | | | | 1.72 | | | | (0.91 | ) |
| | 2017 - IR | | | 20.08 | | | | (0.04 | ) | | | 1.96 | | | | 1.92 | | | | (0.91 | ) |
| | | | | | | | | | | | | | | | | | | | | | |
| | FOR THE FISCAL YEARS ENDING AUGUST 31, | |
| | 2016 - A | | | 17.93 | | | | (0.12 | )(e) | | | 2.50 | | | | 2.38 | | | | (1.58 | ) |
| | 2016 - C | | | 15.70 | | | | (0.22 | )(e) | | | 2.17 | | | | 1.95 | | | | (1.58 | ) |
| | 2016 - Institutional | | | 19.22 | | | | (0.05 | )(e) | | | 2.70 | | | | 2.65 | | | | (1.58 | ) |
| | 2016 - Service | | | 17.69 | | | | (0.14 | )(e) | | | 2.47 | | | | 2.33 | | | | (1.58 | ) |
| | 2016 - IR | | | 19.07 | | | | (0.08 | )(e) | | | 2.67 | | | | 2.59 | | | | (1.58 | ) |
| | 2015 - A | | | 18.97 | | | | (0.14 | )(f) | | | 0.57 | | | | 0.43 | | | | (1.47 | ) |
| | 2015 - C | | | 16.91 | | | | (0.24 | )(f) | | | 0.50 | | | | 0.26 | | | | (1.47 | ) |
| | 2015 - Institutional | | | 20.16 | | | | (0.07 | )(f) | | | 0.60 | | | | 0.53 | | | | (1.47 | ) |
| | 2015 - Service | | | 18.76 | | | | (0.15 | )(f) | | | 0.55 | | | | 0.40 | | | | (1.47 | ) |
| | 2015 - IR | | | 20.04 | | | | (0.10 | )(f) | | | 0.60 | | | | 0.50 | | | | (1.47 | ) |
| | 2014 - A | | | 15.20 | | | | (0.15 | ) | | | 4.16 | | | | 4.01 | | | | (0.24 | ) |
| | 2014 - C | | | 13.68 | | | | (0.25 | ) | | | 3.72 | | | | 3.47 | | | | (0.24 | ) |
| | 2014 - Institutional | | | 16.08 | | | | (0.08 | ) | | | 4.40 | | | | 4.32 | | | | (0.24 | ) |
| | 2014 - Service | | | 15.04 | | | | (0.16 | ) | | | 4.12 | | | | 3.96 | | | | (0.24 | ) |
| | 2014 - IR | | | 16.01 | | | | (0.11 | ) | | | 4.38 | | | | 4.27 | | | | (0.24 | ) |
| | 2013 - A | | | 13.62 | | | | (0.12 | ) | | | 1.70 | | | | 1.58 | | | | — | |
| | 2013 - C | | | 12.34 | | | | (0.20 | ) | | | 1.54 | | | | 1.34 | | | | — | |
| | 2013 - Institutional | | | 14.34 | | | | (0.06 | ) | | | 1.80 | | | | 1.74 | | | | — | |
| | 2013 - Service | | | 13.49 | | | | (0.13 | ) | | | 1.68 | | | | 1.55 | | | | — | |
| | 2013 - IR | | | 14.30 | | | | (0.09 | ) | | | 1.80 | | | | 1.71 | | | | — | |
| | 2012 - A | | | 11.51 | | | | (0.13 | ) | | | 2.24 | | | | 2.11 | | | | — | |
| | 2012 - C | | | 10.51 | | | | (0.21 | ) | | | 2.04 | | | | 1.83 | | | | — | |
| | 2012 - Institutional | | | 12.08 | | | | (0.09 | ) | | | 2.35 | | | | 2.26 | | | | — | |
| | 2012 - Service | | | 11.41 | | | | (0.14 | ) | | | 2.22 | | | | 2.08 | | | | — | |
| | 2012 - IR | | | 12.06 | | | | (0.11 | ) | | | 2.35 | | | | 2.24 | | | | — | |
| | (a) | | Calculated based on the average shares outstanding methodology. |
| | (b) | | Assumes investment at the NAV at the beginning of the period, reinvestment of all dividends and distributions, a complete redemption of the investment at the NAV at the end of the period and no sales or redemption charges. Total returns would be reduced if a sales or redemption charge was taken into account. Returns do not reflect the impact of taxes to shareholder relating to Fund distributions or the redemption of Fund shares. Total returns for periods less than one full year are not annualized. |
| | (c) | | The Fund’s portfolio turnover rate is calculated in accordance with regulatory requirements, without regard to transactions involving short term investments. If such transactions were included, the Fund’s portfolio turnover rate may be higher. |
| | (e) | | Reflects income recognized from special dividends which amounted to $0.02 per share and 0.13% of average net assets. |
| | (f) | | Reflects income recognized from special dividends which amounted to $0.02 per share and 0.10% of average net assets. |
| | |
| 100 | | The accompanying notes are an integral part of these financial statements. |
GOLDMAN SACHS TECHNOLOGY OPPORTUNITIES FUND
| | | | | | | | | | | | | | | | | | | | | | | | | | | | | | | | | | | | | | | | |
| | | | | | | | | | | | | |
| | | Net asset
value, end
of period | | | | | Total
return(b) | | | | | Net assets,
end of
period
(in 000s) | | | | | Ratio of
net expenses
to average
net assets | | | | | Ratio of
total expenses
to average
net assets | | | | | Ratio of
net investment
income (loss)
to average
net assets | | | | | Portfolio
turnover
rate(c) | |
| | | | | | | | | | | | | | | | | | | | | | | | | | | | | | | | | | | | | | | | |
| | $ | 19.59 | | | | | | 9.83 | % | | | | $ | 231,591 | | | | | | 1.45 | %(d) | | | | | 1.53 | %(d) | | | | | (0.75 | )%(d) | | | | | 11 | % |
| | | 16.60 | | | | | | 9.39 | | | | | | 52,544 | | | | | | 2.20 | (d) | | | | | 2.28 | (d) | | | | | (1.50 | )(d) | | | | | 11 | |
| | | 21.34 | | | | | | 10.01 | | | | | | 83,053 | | | | | | 1.05 | (d) | | | | | 1.13 | (d) | | | | | (0.35 | )(d) | | | | | 11 | |
| | | 19.25 | | | | | | 9.71 | | | | | | 13,048 | | | | | | 1.55 | (d) | | | | | 1.63 | (d) | | | | | (0.84 | )(d) | | | | | 11 | |
| | | 21.09 | | | | | | 9.92 | | | | | | 22,772 | | | | | | 1.19 | (d) | | | | | 1.29 | (d) | | | | | (0.44 | )(d) | | | | | 11 | |
| | | | | | | | | | | | | | | | | | | | | | | | | | | | | | | | | | | | | | | | |
| | | | | | | | | | | | | | | | | | | | | | | | | | | | | | | | | | | | | | | | |
| | | 18.73 | | | | | | 13.71 | | | | | | 233,097 | | | | | | 1.47 | | | | | | 1.55 | | | | | | (0.68 | )(e) | | | | | 22 | |
| | | 16.07 | | | | | | 12.87 | | | | | | 52,843 | | | | | | 2.22 | | | | | | 2.30 | | | | | | (1.43 | )(e) | | | | | 22 | |
| | | 20.29 | | | | | | 14.22 | | | | | | 83,746 | | | | | | 1.07 | | | | | | 1.15 | | | | | | (0.27 | )(e) | | | | | 22 | |
| | | 18.44 | | | | | | 13.61 | | | | | | 11,186 | | | | | | 1.57 | | | | | | 1.65 | | | | | | (0.79 | )(e) | | | | | 22 | |
| | | 20.08 | | | | | | 14.00 | | | | | | 6,741 | | | | | | 1.22 | | | | | | 1.30 | | | | | | (0.43 | )(e) | | | | | 22 | |
| | | 17.93 | | | | | | 2.31 | | | | | | 250,087 | | | | | | 1.48 | | | | | | 1.54 | | | | | | (0.74 | )(f) | | | | | 41 | |
| | | 15.70 | | | | | | 1.53 | | | | | | 53,556 | | | | | | 2.23 | | | | | | 2.29 | | | | | | (1.49 | )(f) | | | | | 41 | |
| | | 19.22 | | | | | | 2.68 | | | | | | 92,483 | | | | | | 1.08 | | | | | | 1.14 | | | | | | (0.33 | )(f) | | | | | 41 | |
| | | 17.69 | | | | | | 2.17 | | | | | | 10,329 | | | | | | 1.58 | | | | | | 1.64 | | | | | | (0.84 | )(f) | | | | | 41 | |
| | | 19.07 | | | | | | 2.54 | | | | | | 6,103 | | | | | | 1.23 | | | | | | 1.29 | | | | | | (0.52 | )(f) | | | | | 41 | |
| | | 18.97 | | | | | | 26.55 | | | | | | 260,982 | | | | | | 1.51 | | | | | | 1.55 | | | | | | (0.85 | ) | | | | | 39 | |
| | | 16.91 | | | | | | 25.54 | | | | | | 58,602 | | | | | | 2.26 | | | | | | 2.30 | | | | | | (1.60 | ) | | | | | 39 | |
| | | 20.16 | | | | | | 27.03 | | | | | | 99,039 | | | | | | 1.11 | | | | | | 1.15 | | | | | | (0.45 | ) | | | | | 39 | |
| | | 18.76 | | | | | | 26.49 | | | | | | 10,712 | | | | | | 1.61 | | | | | | 1.65 | | | | | | (0.96 | ) | | | | | 39 | |
| | | 20.04 | | | | | | 26.83 | | | | | | 3,228 | | | | | | 1.26 | | | | | | 1.30 | | | | | | (0.59 | ) | | | | | 39 | |
| | | 15.20 | | | | | | 11.60 | | | | | | 228,424 | | | | | | 1.50 | | | | | | 1.55 | | | | | | (0.85 | ) | | | | | 33 | |
| | | 13.68 | | | | | | 10.86 | | | | | | 50,278 | | | | | | 2.25 | | | | | | 2.30 | | | | | | (1.59 | ) | | | | | 33 | |
| | | 16.08 | | | | | | 12.13 | | | | | | 70,416 | | | | | | 1.10 | | | | | | 1.15 | | | | | | (0.43 | ) | | | | | 33 | |
| | | 15.04 | | | | | | 11.49 | | | | | | 10,167 | | | | | | 1.60 | | | | | | 1.65 | | | | | | (0.95 | ) | | | | | 33 | |
| | | 16.01 | | | | | | 11.96 | | | | | | 2,651 | | | | | | 1.25 | | | | | | 1.30 | | | | | | (0.59 | ) | | | | | 33 | |
| | | 13.62 | | | | | | 18.28 | | | | | | 239,355 | | | | | | 1.50 | | | | | | 1.55 | | | | | | (1.06 | ) | | | | | 43 | |
| | | 12.34 | | | | | | 17.36 | | | | | | 50,682 | | | | | | 2.25 | | | | | | 2.30 | | | | | | (1.81 | ) | | | | | 43 | |
| | | 14.34 | | | | | | 18.65 | | | | | | 49,238 | | | | | | 1.10 | | | | | | 1.15 | | | | | | (0.66 | ) | | | | | 43 | |
| | | 13.49 | | | | | | 18.18 | | | | | | 10,977 | | | | | | 1.60 | | | | | | 1.65 | | | | | | (1.15 | ) | | | | | 43 | |
| | | 14.30 | | | | | | 18.52 | | | | | | 2,569 | | | | | | 1.25 | | | | | | 1.30 | | | | | | (0.81 | ) | | | | | 43 | |
| | |
| The accompanying notes are an integral part of these financial statements. | | 101 |
GOLDMAN SACHS FUNDAMENTAL EQUITY GROWTH FUNDS
Notes to Financial Statements
February 28, 2017 (Unaudited)
Goldman Sachs Trust (the “Trust”) is a Delaware statutory trust registered under the Investment Company Act of 1940, as amended (the “Act”), as an open-end management investment company. The following table lists those series of the Trust that are included in this report (collectively, the “Funds” or individually a “Fund”), along with their corresponding share classes and respective diversification status under the Act:
| | | | |
| Fund | | Share Classes Offered | | Diversified/ Non-diversified |
Capital Growth, Growth Opportunities, Small/Mid Cap Growth and Strategic Growth | | A, C, Institutional, Service, IR, R and R6 | | Diversified |
Concentrated Growth and Focused Growth | | A, C, Institutional, IR, R and R6 | | Non-diversified |
Dynamic U.S. Equity and Flexible Cap Growth | | A, C, Institutional, IR, R and R6 | | Diversified |
Technology Opportunities | | A, C, Institutional, Service and IR | | Diversified |
Class A Shares are sold with a front-end sales charge of up to 5.50%. Class C Shares are sold with a contingent deferred sales charge (“CDSC”) of 1.00%, which is imposed on redemptions made within 12 months of purchase. Institutional, Service, Class IR, Class R and Class R6 Shares are not subject to a sales charge.
Goldman Sachs Asset Management, L.P. (“GSAM”), an affiliate of Goldman, Sachs & Co. (“Goldman Sachs”), serves as investment adviser to the Funds pursuant to a management agreement (the “Agreement”) with the Trust.
|
| 2. SIGNIFICANT ACCOUNTING POLICIES |
The financial statements have been prepared in accordance with accounting principles generally accepted in the United States of America (“GAAP”) and require management to make estimates and assumptions that may affect the reported amounts and disclosures. Actual results may differ from those estimates and assumptions.
A. Investment Valuation — The Funds’ valuation policy is to value investments at fair value.
B. Investment Income and Investments — Investment income includes interest income, dividend income, net of any foreign withholding taxes, less any amounts reclaimable, and securities lending income. Interest income is accrued daily and adjusted for amortization of premiums and accretion of discounts. Dividend income is recognized on ex-dividend date or, for certain foreign securities, as soon as such information is obtained subsequent to the ex-dividend date. Investment transactions are reflected on trade date. Realized gains and losses are calculated using identified cost. Investment transactions are recorded on the following business day for daily net asset value (“NAV”) calculations. Any foreign capital gains tax is accrued daily based upon net unrealized gains, and is payable upon sale of such investments. Distributions received from the Funds’ investments in U.S. real estate investment trusts (“REITs”) may be characterized as ordinary income, net capital gain or a return of capital. A return of capital is recorded by the Funds as a reduction to the cost basis of the REIT.
C. Class Allocations and Expenses — Investment income, realized and unrealized gain (loss), and non-class specific expenses of each Fund are allocated daily based upon the proportion of net assets of each class. Non-class specific expenses directly incurred by a Fund are charged to that Fund, while such expenses incurred by the Trust are allocated across the applicable Funds on a straight-line and/or pro-rata basis depending upon the nature of the expenses. Class specific expenses, where applicable, are borne by the respective share classes and include Distribution and Service, Transfer Agency and Service and Shareholder Administration fees.
102
GOLDMAN SACHS FUNDAMENTAL EQUITY GROWTH FUNDS
|
| 2. SIGNIFICANT ACCOUNTING POLICIES (continued) |
D. Federal Taxes and Distributions to Shareholders — It is each Fund’s policy to comply with the requirements of the Internal Revenue Code of 1986, as amended (the “Code”), applicable to regulated investment companies (mutual funds) and to distribute each year substantially all of its investment company taxable income and capital gains to its shareholders. Accordingly, the Funds are not required to make any provisions for the payment of federal income tax. Distributions to shareholders are recorded on the ex-dividend date. Income and capital gains distributions, if any, are declared and paid annually.
Net capital losses, if any, are carried forward to future fiscal years and may be used to the extent allowed by the Code to offset any future capital gains. Losses that are carried forward will retain their character as either short-term or long-term capital losses. Utilization of capital loss carryforwards will reduce the requirement of future capital gains distributions.
The characterization of distributions to shareholders for financial reporting purposes is determined in accordance with federal income tax rules, which may differ from GAAP. The source of each Fund’s distributions may be shown in the accompanying financial statements as either from net investment income, net realized gain or capital. Certain components of the Funds’ net assets on the Statements of Assets and Liabilities reflect permanent GAAP/tax differences based on the appropriate tax character.
E. Commission Recapture — GSAM, on behalf of certain Funds, may direct portfolio trades, subject to seeking best execution, to various brokers who have agreed to rebate a portion of the commissions generated. Such rebates are made directly to a Fund as cash payments and are included in net realized gain (loss) from investments on the Statements of Operations.
|
| 3. INVESTMENTS AND FAIR VALUE MEASUREMENTS |
The fair value of a financial instrument is the amount that would be received to sell an asset or paid to transfer a liability in an orderly transaction between market participants at the measurement date (i.e., the exit price). GAAP establishes a fair value hierarchy that prioritizes the inputs to valuation techniques used to measure fair value. The hierarchy gives the highest priority to unadjusted quoted prices in active markets for identical assets or liabilities (Level 1 measurements) and the lowest priority to unobservable inputs (Level 3 measurements). The levels used for classifying investments are not necessarily an indication of the risk associated with investing in these investments. The three levels of the fair value hierarchy are described below:
Level 1 — Unadjusted quoted prices in active markets that are accessible at the measurement date for identical, unrestricted assets or liabilities;
Level 2 — Quoted prices in markets that are not active or financial instruments for which significant inputs are observable (including, but not limited to, quoted prices for similar investments, interest rates, foreign exchange rates, volatility and credit spreads), either directly or indirectly;
Level 3 — Prices or valuations that require significant unobservable inputs (including GSAM’s assumptions in determining fair value measurement).
Changes in valuation techniques may result in transfers into or out of an assigned level within the hierarchy. In accordance with the Funds’ policy, transfers between different levels of the fair value hierarchy resulting from such changes are deemed to have occurred as of the beginning of the reporting period.
The Board of Trustees (“Trustees”) has approved Valuation Procedures that govern the valuation of the portfolio investments held by the Funds, including investments for which market quotations are not readily available. The Trustees have delegated to GSAM day-to-day responsibility for implementing and maintaining internal controls and procedures related to the valuation of the Funds’ portfolio investments. To assess the continuing appropriateness of pricing sources and methodologies, GSAM regularly performs price verification procedures and issues challenges as necessary to third party pricing vendors or brokers, and any differences are reviewed in accordance with the Valuation Procedures.
A. Level 1 and Level 2 Fair Value Investments — The valuation techniques and significant inputs used in determining the fair values for investments classified as Level 1 and Level 2 are as follows:
Equity Securities — Equity securities traded on a United States (“U.S.”) securities exchange or the NASDAQ system, or those located on certain foreign exchanges, including but not limited to the Americas, are valued daily at their last sale price or official
103
GOLDMAN SACHS FUNDAMENTAL EQUITY GROWTH FUNDS
Notes to Financial Statements (continued)
February 28, 2017 (Unaudited)
|
| 3. INVESTMENTS AND FAIR VALUE MEASUREMENTS (continued) |
closing price on the principal exchange or system on which they are traded. If there is no sale or official closing price or such price is believed by GSAM to not represent fair value, equity securities are valued at the last bid price for long positions and at the last ask price for short positions. To the extent these investments are actively traded, they are classified as Level 1 of the fair value hierarchy, otherwise they are generally classified as Level 2.
Unlisted equity securities for which market quotations are available are valued at the last sale price on the valuation date, or if no sale occurs, at the last bid price. Securities traded on certain foreign securities exchanges are valued daily at fair value determined by an independent fair value service (if available) under Valuation Procedures approved by the Trustees and consistent with applicable regulatory guidance. The independent fair value service takes into account multiple factors including, but not limited to, movements in the securities markets, certain depositary receipts, futures contracts and foreign currency exchange rates that have occurred subsequent to the close of the foreign securities exchange. These investments are generally classified as Level 2 of the fair value hierarchy.
Money Market Funds — Investments in the Goldman Sachs Financial Square Government Fund (“Underlying Fund”) are valued at the NAV of the Institutional Share class on the day of valuation. These investments are generally classified as Level 1 of the fair value hierarchy. For information regarding an Underlying Fund’s accounting policies and investment holdings, please see the Underlying Fund’s shareholder report.
Short Term Investments — Short-term investments having a maturity of 60 days or less are valued using available market quotations as provided by a third party pricing vendor or broker. Prior to October 11, 2016, such securities were valued at amortized cost. These investments are classified as Level 2 of the fair value hierarchy.
B. Level 3 Fair Value Investments — To the extent that significant inputs to valuation models and other alternative pricing sources are unobservable, or if quotations are not readily available, or if GSAM believes that such quotations do not accurately reflect fair value, the fair value of the Funds’ investments may be determined under Valuation Procedures approved by the Trustees. GSAM, consistent with its procedures and applicable regulatory guidance, may make an adjustment to the most recent valuation prices of either domestic or foreign securities in light of significant events to reflect what it believes to be the fair value of the securities at the time of determining a Fund’s NAV. Significant events which could affect a large number of securities in a particular market may include, but are not limited to: significant fluctuations in U.S. or foreign markets; market dislocations; market disruptions; or unscheduled market closings. Significant events which could also affect a single issuer may include, but are not limited to: corporate actions such as reorganizations, mergers and buy-outs; ratings downgrades; and bankruptcies.
C. Fair Value Hierarchy — The following is a summary of the Funds’ investments classified in the fair value hierarchy as of February 28, 2017:
| | | | | | | | | | | | |
| | | |
| CAPITAL GROWTH | | | | | | | | | | | | |
| | | |
| Investment Type | | Level 1 | | | Level 2 | | | Level 3 | |
| Assets | | | | | | | | | | | | |
Common Stock and/or Other Equity Investments(a) | | | | | | | | | | | | |
Europe | | $ | 20,714,495 | | | $ | — | | | $ | — | |
North America | | | 841,482,905 | | | | — | | | | — | |
Investment Company | | | 290 | | | | — | | | | — | |
Securities Lending Reinvestment Vehicle | | | 2,330,752 | | | | — | | | | — | |
| Total | | $ | 864,528,442 | | | $ | — | | | $ | — | |
104
GOLDMAN SACHS FUNDAMENTAL EQUITY GROWTH FUNDS
|
| 3. INVESTMENTS AND FAIR VALUE MEASUREMENTS (continued) |
| | | | | | | | | | | | |
| | | |
| CONCENTRATED GROWTH | | | | | | | | | | | | |
| | | |
| Investment Type | | Level 1 | | | Level 2 | | | Level 3 | |
| Assets | | | | | | | | | | | | |
Common Stock and/or Other Equity Investments(a) | | | | | | | | | | | | |
North America | | $ | 129,580,273 | | | $ | — | | | $ | — | |
Investment Company | | | 78 | | | | — | | | | — | |
| Total | | $ | 129,580,351 | | | $ | — | | | $ | — | |
| | | |
| DYNAMIC U.S. EQUITY | | | | | | | | | | | | |
| | | |
| Investment Type | | Level 1 | | | Level 2 | | | Level 3 | |
| Assets | | | | | | | | | | | | |
Common Stock and/or Other Equity Investments(a) | | | | | | | | | | | | |
Europe | | $ | 114,399 | | | $ | — | | | $ | — | |
North America | | | 7,076,138 | | | | — | | | | — | |
Investment Company | | | 50,469 | | | | — | | | | — | |
| Total | | $ | 7,241,006 | | | $ | — | | | $ | — | |
| | | |
| FLEXIBLE CAP GROWTH | | | | | | | | | | | | |
| | | |
| Investment Type | | Level 1 | | | Level 2 | | | Level 3 | |
| Assets | | | | | | | | | | | | |
Common Stock and/or Other Equity Investments(a) | | | | | | | | | | | | |
Europe | | $ | 250,988 | | | $ | — | | | $ | — | |
North America | | | 16,741,018 | | | | — | | | | — | |
Securities Lending Reinvestment Vehicle | | | 94,800 | | | | — | | | | — | |
| Total | | $ | 17,086,806 | | | $ | — | | | $ | — | |
| | | |
| FOCUSED GROWTH | | | | | | | | | | | | |
| | | |
| Investment Type | | Level 1 | | | Level 2 | | | Level 3 | |
| Assets | | | | | | | | | | | | |
Common Stock and/or Other Equity Investments(a) | | | | | | | | | | | | |
North America | | $ | 15,951,414 | | | $ | — | | | $ | — | |
Investment Company | | | 713,488 | | | | — | | | | — | |
| Total | | $ | 16,664,902 | | | $ | — | | | $ | — | |
105
GOLDMAN SACHS FUNDAMENTAL EQUITY GROWTH FUNDS
Notes to Financial Statements (continued)
February 28, 2017 (Unaudited)
|
| 3. INVESTMENTS AND FAIR VALUE MEASUREMENTS (continued) |
| | | | | | | | | | | | |
| | | |
| GROWTH OPPORTUNITIES | | | | | | | | | | | | |
| | | |
| Investment Type | | Level 1 | | | Level 2 | | | Level 3 | |
| Assets | | | | | | | | | | | | |
Common Stock and/or Other Equity Investments(a) | | | | | | | | | | | | |
Europe | | $ | 44,172,108 | | | $ | — | | | $ | — | |
North America | | | 2,819,941,950 | | | | — | | | | — | |
Investment Company | | | 4,690 | | | | — | | | | — | |
Securities Lending Reinvestment Vehicle | | | 18,866,365 | | | | — | | | | — | |
| Total | | $ | 2,882,985,113 | | | $ | — | | | $ | — | |
| | | |
| SMALL/MID CAP GROWTH | | | | | | | | | | | | |
| | | |
| Investment Type | | Level 1 | | | Level 2 | | | Level 3 | |
| Assets | | | | | | | | | | | | |
Common Stock and/or Other Equity Investments(a) | | | | | | | | | | | | |
Asia | | $ | 10,575,117 | | | $ | — | | | $ | — | |
Europe | | | 84,608,708 | | | | — | | | | — | |
North America | | | 2,061,278,636 | | | | — | | | | — | |
Investment Company | | | 35,428,823 | | | | — | | | | — | |
Securities Lending Reinvestment Vehicle | | | 35,820,930 | | | | — | | | | — | |
| Total | | $ | 2,227,712,214 | | | $ | — | | | $ | — | |
| | | |
| STRATEGIC GROWTH | | | | | | | | | | | | |
| | | |
| Investment Type | | Level 1 | | | Level 2 | | | Level 3 | |
| Assets | | | | | | | | | | | | |
Common Stock and/or Other Equity Investments(a) | | | | | | | | | | | | |
Asia | | $ | 1,708,320 | | | $ | — | | | $ | — | |
North America | | | 330,930,669 | | | | — | | | | — | |
Investment Company | | | 146 | | | | — | | | | — | |
Securities Lending Reinvestment Vehicle | | | 1,206,675 | | | | — | | | | — | |
| Total | | $ | 333,845,810 | | | $ | — | | | $ | — | |
| | | |
| TECHNOLOGY OPPORTUNITIES | | | | | | | | | | | | |
| | | |
| Investment Type | | Level 1 | | | Level 2 | | | Level 3 | |
| Assets | | | | | | | | | | | | |
Common Stock and/or Other Equity Investments(a) | | | | | | | | | | | | |
Europe | | $ | 15,947,887 | | | $ | — | | | $ | — | |
North America | | | 384,419,650 | | | | — | | | | — | |
Securities Lending Reinvestment Vehicle | | | 742,800 | | | | — | | | | — | |
| Total | | $ | 401,110,337 | | | $ | — | | | $ | — | |
| (a) | | Amounts are disclosed by continent to highlight the impact of time zone differences between local market close and the calculation of net asset value. Security valuations are based on the principle exchange or system on which they are traded, which may differ from country of domicile. The Funds utilize fair value model prices provided by an independent fair value service for international equities, resulting in a Level 2 classification. |
106
GOLDMAN SACHS FUNDAMENTAL EQUITY GROWTH FUNDS
|
| 3. INVESTMENTS AND FAIR VALUE MEASUREMENTS (continued) |
For further information regarding security characteristics, see the Schedules of Investments.
|
| 4. AGREEMENTS AND AFFILIATED TRANSACTIONS |
A. Management Agreement — Under the Agreement, GSAM manages the Funds, subject to the general supervision of the Trustees.
As compensation for the services rendered pursuant to the Agreement, the assumption of the expenses related thereto and administration of the Funds’ business affairs, including providing facilities, GSAM is entitled to a management fee, accrued daily and paid monthly, equal to an annual percentage rate of each Fund’s average daily net assets.
For the six months ended February 28, 2017, contractual and effective net management fees with GSAM were at the following rates:
| | | | | | | | | | | | | | | | | | | | | | | | | | | | | | |
| | | | | Contractual Management Rate | | | Effective Net
Management
Rate | |
| Fund | | | | First
$1 billion | | | Next
$1 billion | | | Next
$3 billion | | | Next
$3 billion | | | Over
$8 billion | | | Effective
Rate | | |
Capital Growth | | | | | 1.00 | % | | | 0.90 | % | | | 0.80 | % | | | 0.80 | % | | | 0.80 | % | | | 1.00 | % | | | 0.71 | %# |
Concentrated Growth | | | | | 1.00 | | | | 0.90 | | | | 0.86 | | | | 0.84 | | | | 0.82 | | | | 1.00 | | | | 0.78 | # |
Dynamic U.S. Equity | | | | | 0.70 | | | | 0.63 | | | | 0.60 | | | | 0.59 | | | | 0.58 | | | | 0.70 | | | | 0.70 | |
Flexible Cap Growth | | | | | 1.00 | | | | 0.90 | | | | 0.86 | | | | 0.84 | | | | 0.82 | | | | 1.00 | | | | 0.78 | # |
Focused Growth | | | | | 1.00 | | | | 0.90 | | | | 0.86 | | | | 0.84 | | | | 0.82 | | | | 1.00 | | | | 0.76 | # |
Growth Opportunities | | | | | 1.00 | | | | 1.00 | | | | 0.90 | | | | 0.86 | | | | 0.84 | | | | 0.97 | | | | 0.90 | # |
Small/Mid Cap Growth | | | | | 1.00 | | | | 1.00 | | | | 0.90 | | | | 0.86 | | | | 0.84 | | | | 0.98 | | | | 0.85 | # |
Strategic Growth | | | | | 1.00 | | | | 0.90 | | | | 0.86 | | | | 0.84 | | | | 0.82 | | | | 1.00 | | | | 0.71 | # |
Technology Opportunities | | | | | 1.00 | | | | 0.90 | | | | 0.86 | | | | 0.84 | | | | 0.82 | | | | 1.00 | | | | 0.98 | #^ |
| # | | GSAM agreed to waive a portion of its management fee rates, set forth in the Funds’ most recent prospectuses. In addition, the Effective Net Management Rate includes the impact of management fee waivers of affiliated underlying funds, if any. These waivers will be effective through at least December 29, 2017, and prior to such date GSAM may not terminate the arrangements without the approval of the Trustees. |
| ^ | | Effective December 29, 2016, GSAM elected to implement a management fee waiver of 5 basis points on management fees charged to the first $1 billion in net assets. |
The Funds invest in Institutional Shares of the Goldman Sachs Financial Square Government Fund, which is an affiliated Underlying Fund. GSAM has agreed to waive a portion of its management fee payable by the Funds in an amount equal to the management fee it earns as an investment adviser to any of the affiliated Underlying Funds in which the Funds invest. For the six months ended February 28, 2017, the management fee waived by GSAM for each fund was as follows:
| | | | | | |
| Fund | | | | Management
Fee Waived | |
Capital Growth | | | | $ | 3,143 | |
Concentrated Growth | | | | | 649 | |
Dynamic U.S. Equity | | | | | 29 | |
Flexible Cap Growth | | | | | 43 | |
Focused Growth | | | | | 171 | |
107
GOLDMAN SACHS FUNDAMENTAL EQUITY GROWTH FUNDS
Notes to Financial Statements (continued)
February 28, 2017 (Unaudited)
|
| 4. AGREEMENTS AND AFFILIATED TRANSACTIONS (continued) |
| | | | | | |
| Fund | | | | Management
Fee Waived | |
Growth Opportunities | | | | $ | 8,459 | |
Small/Mid-Cap Growth | | | | | 4,487 | |
Strategic Growth | | | | | 793 | |
Technology Opportunities | | | | | 49 | |
B. Distribution and/or Service (12b-1) Plans — The Trust, on behalf of Class A and Class R Shares of each applicable Fund, has adopted Distribution and Service Plans subject to Rule 12b-1 under the Act. Under the Distribution and Service Plans, Goldman Sachs, which serves as distributor (the “Distributor”), is entitled to a fee accrued daily and paid monthly, for distribution services and personal and account maintenance services, which may then be paid by Goldman Sachs to authorized dealers. These fees are equal to an annual percentage rate of the average daily net assets attributable to Class A or Class R Shares of the Funds, as applicable.
The Trust, on behalf of Class C Shares of each applicable Fund, has adopted a Distribution Plan subject to Rule 12b-1 under the Act. Under the Distribution Plan, Goldman Sachs as Distributor is entitled to a fee accrued daily and paid monthly for distribution services, which may then be paid by Goldman Sachs to authorized dealers. These fees are equal to an annual percentage rate of the average daily net assets attributable to Class C Shares of the Funds.
The Trust, on behalf of Services Shares of each applicable Fund, has adopted a Service Plan subject to Rule 12b-1 under the Act to allow Service Shares to compensate service organizations (including Goldman Sachs) for providing personal account maintenance to their customers who are beneficial owners of such shares. The Service Plan provides for compensation to the service organizations equal to an annual percentage rate of the average daily net assets attributable to Services Shares of the Funds.
| | | | | | | | | | | | |
| | | Distribution and Service Plan Rates | |
| | | Class A* | | | Class C | | | Class R* | |
Distribution Plan | | | 0.25 | % | | | 0.75 | % | | | 0.50 | % |
Service Plan | | | — | | | | 0.25 | | | | — | |
| * | | With respect to Class A and Class R Shares, the Distributor at its discretion may use compensation for distribution services paid under the Distribution Plan to compensate service organizations for personal and account maintenance services and expenses as long as such total compensation does not exceed the maximum cap on “service fees” imposed by the Financial Industry Regulatory Authority. |
C. Distribution Agreement — Goldman Sachs, as Distributor of the shares of the Funds pursuant to a Distribution Agreement, may retain a portion of the Class A Shares’ front end sales charge and Class C Shares’ CDSC. For the six months ended February 28, 2017, Goldman Sachs advised that it retained the following amounts:
| | | | | | | | | | |
| | | | | Front End
Sales Charge | | | Contingent Deferred
Sales Charge | |
| Fund | | | | Class A | | | Class C | |
Capital Growth | | | | $ | 6,754 | | | $ | 285 | |
Concentrated Growth | | | | | 1,022 | | | | — | |
Dynamic U.S. Equity | | | | | 62 | | | | — | |
Flexible Cap Growth | | | | | 591 | | | | — | |
Focused Growth | | | | | 27 | | | | — | |
108
GOLDMAN SACHS FUNDAMENTAL EQUITY GROWTH FUNDS
|
| 4. AGREEMENTS AND AFFILIATED TRANSACTIONS (continued) |
| | | | | | | | | | |
| | | | | Front End
Sales Charge | | | Contingent Deferred
Sales Charge | |
| Fund | | | | Class A | | | Class C | |
Growth Opportunities | | | | $ | 6,775 | | | $ | 437 | |
Small/Mid Cap Growth | | | | | 26,536 | | | | — | |
Strategic Growth | | | | | 2,402 | | | | — | |
Technology Opportunities | | | | | 7,131 | | | | 311 | |
D. Service and/or Shareholder Administration Plans — The Trust, on behalf of each applicable Fund, has adopted Service and/or Shareholder Administration Plans to allow Class C and Service Shares, respectively, to compensate service organizations (including Goldman Sachs) for providing varying levels of personal and account maintenance and/or shareholder administration services to their customers who are beneficial owners of such shares. The Service and/or Shareholder Administration Plans each provide for compensation to the service organizations equal to an annual percentage rate of the average daily net assets attributable to Class C or Service Shares of the Funds, respectively.
E. Transfer Agency Agreement — Goldman Sachs also serves as the transfer agent of the Funds for a fee pursuant to the Transfer Agency Agreement. The fees charged for such transfer agency services are accrued daily and paid monthly at annual rates as follows: 0.19% of the average daily net assets of Class A, Class C, Class IR and Class R Shares; 0.02% of the average daily net assets of Class R6 Shares; and 0.04% of the average daily net assets of Institutional and Service Shares.
Goldman Sachs has agreed to waive a portion of its transfer agency fee equal to 0.05% as an annual percentage rate of the average daily net assets attributable to Class A, Class C, Class IR, and Class R Shares of the Growth Opportunities Fund. As a result of this waiver, a net transfer agency fee equal to 0.14% as an annual percentage rate of the average daily net assets attributable to Class A, Class C, Class IR, and Class R Shares of the Growth Opportunities Fund is being charged to those share classes. This arrangement will remain in effect through at least December 29, 2017, and prior to such date, the Investment Advisor may not terminate the arrangement without the approval of the Board of Trustees.
Goldman Sachs has agreed to waive a portion of its transfer agency fee equal to 0.03% as an annual percentage rate of the average daily net assets attributable to Class A, Class C, Class IR, and Class R Shares of the Concentrated Growth, Dynamic U.S. Equity, Flexible Cap Growth and Small/Mid Cap Growth Funds. As a result of this waiver, a net transfer agency fee equal to 0.16% as an annual percentage rate of the average daily net assets attributable to Class A, Class C, Class IR, and Class R Shares of the Concentrated Growth, Dynamic U.S. Equity, Flexible Cap Growth and Small/Mid Cap Growth Funds is being charged to those share classes. Such waiver was effective on December 29, 2016 for the Concentrated Growth, Dynamic U.S. Equity, and Flexible Cap Growth Funds. This arrangement will remain in effect through at least December 29, 2017, and prior to such date, the Investment Advisor may not terminate the arrangement without the approval of the Board of Trustees.
F. Other Expense Agreements and Affiliated Transactions — GSAM has agreed to limit certain “Other Expenses” of the Funds (excluding acquired fund fees and expenses, transfer agency fees and expenses, service fees and shareholder administration fees (as applicable), taxes, interest, brokerage fees, shareholder meeting, litigation, indemnification and extraordinary expenses) to the extent such expenses exceed, on an annual basis, a percentage rate of the average daily net assets of each Fund. Such Other Expense reimbursements, if any, are accrued daily and paid monthly. In addition, the Funds are not obligated to reimburse GSAM for prior fiscal year expense reimbursements, if any. The Other Expense limitations as an annual percentage rate of average daily net assets for Capital Growth, Concentrated Growth, Dynamic U.S. Equity, Flexible Cap Growth, Focused Growth, Growth Opportunities, Small/Mid Cap Growth, Strategic Growth, and Technology Opportunities Funds are 0.004%, 0.004%, 0.084%, 0.004%, 0.004%, 0.014%, 0.064%, 0.004%, and 0.004%, respectively. Prior to December 29, 2016, the Other Expense limitation for Technology Opportunities Fund was 0.034%. These Other Expense limitations will remain in place through at least December 29, 2017, and prior to such date GSAM may not terminate the arrangements without the approval of the Trustees. In addition, the Funds have entered into certain offset arrangements with the transfer agent, which may result in a reduction of the Funds’ expenses and are received irrespective of the application of the “Other Expense” limitations described above.
109
GOLDMAN SACHS FUNDAMENTAL EQUITY GROWTH FUNDS
Notes to Financial Statements (continued)
February 28, 2017 (Unaudited)
|
| 4. AGREEMENTS AND AFFILIATED TRANSACTIONS (continued) |
For the six months ended February 28, 2017, these expense reductions, including any fee waivers and Other Expense reimbursements, were as follows:
| | | | | | | | | | | | | | | | | | |
| Fund | | | | Management
Fee Waiver | | | Transfer Agency
Fee Waiver | | | Other Expense
Reimbursements | | | Total Expense
Reductions | |
Capital Growth | | | | $ | 1,198,659 | | | $ | — | | | $ | 221,133 | | | $ | 1,419,792 | |
Concentrated Growth | | | | | 145,286 | | | | 417 | | | | 124,623 | | | | 270,326 | |
Dynamic U.S. Equity | | | | | 29 | | | | 118 | | | | 147,857 | | | | 148,004 | |
Flexible Cap Growth | | | | | 18,225 | | | | 355 | | | | 127,962 | | | | 146,542 | |
Focused Growth | | | | | 24,416 | | | | — | | | | 126,597 | | | | 151,013 | |
Growth Opportunities | | | | | 1,000,239 | | | | 214,352 | | | | 201,359 | | | | 1,415,950 | |
Small/Mid Cap Growth | | | | | 1,583,299 | | | | 178,764 | | | | — | | | | 1,762,063 | |
Strategic Growth | | | | | 478,290 | | | | — | | | | 150,432 | | | | 628,722 | |
Technology Opportunities | | | | | 33,156 | | | | — | | | | 126,813 | | | | 159,969 | |
G. Line of Credit Facility — As of February 28, 2017, the Funds participated in a $1,100,000,000 committed, unsecured revolving line of credit facility (the “facility”) together with other funds of the Trust and certain registered investment companies having management agreements with GSAM or its affiliates. This facility is to be used for temporary emergency purposes, or to allow for an orderly liquidation of securities to meet redemption requests. The interest rate on borrowings is based on the federal funds rate. The facility also requires a fee to be paid by the Funds based on the amount of the commitment that has not been utilized. For the six months ended February 28, 2017, the Funds did not have any borrowings under the facility.
H. Other Transactions with Affiliates — For the six months ended February 28, 2017, Goldman Sachs did not earn any brokerage commissions from portfolio transactions, on behalf of the Funds.
An investment by a Fund representing greater than 5% of the voting securities of an issuer makes that issuer an affiliated person (as defined by the Act) of such Fund. The following table provides information about the investment by the Small/Mid Cap Growth Fund in shares of issuers of which the Fund is an affiliate for the six months ended February 28, 2017:
| | | | | | | | | | | | | | | | | | | | | | | | | | | | | | | | |
| Fund | | Name of Affiliated Issuer | | | Market Value
8/31/2016 | | | Purchases at Cost | | | Proceeds from Sales | | | Net Realized
Gain (Loss) | | | Change in
Unrealized
Gain (Loss) | | | Market Value
2/28/2017 | | | Dividend
Income | |
Small/Mid-Cap Growth | | | Aerovironment, Inc. | | | $ | 24,795,319 | | | $ | 8,556,934 | | | $ | (3,589,211 | ) | | $ | (19,541 | ) | | $ | 2,817,247 | | | $ | 32,560,748 | | | $ | — | |
| |
| Corium
International, Inc.* |
| | | 9,218,322 | | | | — | | | | (4,768,704 | ) | | | (8,232,070 | ) | | | 3,782,452 | | | | — | | | | — | |
| | | | M/I Homes, Inc.* | | | | 28,904,359 | | | | 4,095,361 | | | | (10,831,017 | ) | | | 1,586,184 | | | | (544,476 | ) | | | 23,210,411 | | | | — | |
| * | | Security was no longer affiliated as of February 28, 2017. |
110
GOLDMAN SACHS FUNDAMENTAL EQUITY GROWTH FUNDS
|
| 4. AGREEMENTS AND AFFILIATED TRANSACTIONS (continued) |
The table below shows the transactions in and earnings from investments in the Underlying Funds (Goldman Sachs Financial Square Government Fund — Institutional Shares) for the six months ended February 28, 2017:
| | | | | | | | | | | | | | | | | | | | | | |
| Fund | | | | Market
Value
8/31/2016 | | | Purchases at Cost | | | Proceeds from Sales | | | Market Value
2/28/2017 | | | Dividend
Income | |
Capital Growth | | | | $ | 7,550,880 | | | $ | 14,463,244 | | | $ | (22,013,834 | ) | | $ | 290 | | | $ | 6,042 | |
Concentrated Growth | | | | | — | | | | 17,402,025 | | | | (17,401,947 | ) | | | 78 | | | | 1,502 | |
Dynamic U.S. Equity | | | | | — | | | | 1,654,402 | | | | (1,603,933 | ) | | | 50,469 | | | | 69 | |
Flexible Cap Growth | | | | | — | | | | 951,213 | | | | (951,213 | ) | | | — | | | | 81 | |
Focused Growth | | | | | — | | | | 3,705,132 | | | | (2,991,644 | ) | | | 713,488 | | | | 378 | |
Growth Opportunities | | | | | 651 | | | | 300,488,017 | | | | (300,483,978 | ) | | | 4,690 | | | | 21,911 | |
Small/Mid Cap Growth | | | | | — | | | | 222,177,039 | | | | (186,748,216 | ) | | | 35,428,823 | | | | 13,211 | |
Strategic Growth | | | | | — | | | | 26,711,023 | | | | (26,710,877 | ) | | | 146 | | | | 1,874 | |
Technology Opportunities | | | | | — | | | | 3,200,406 | | | | (3,200,406 | ) | | | — | | | | 110 | |
As of February 28, 2017, The Goldman Sachs Group, Inc. was the beneficial owner of 5% or more of outstanding Class C, Institutional, Class IR, Class R and Class R6 Shares of the following funds:
| | | | | | | | | | | | | | | | | | | | | | |
| Fund | | | | Class C | | | Institutional | | | Class IR | | | Class R | | | Class R6 | |
Capital Growth | | | | | — | % | | | — | % | | | — | % | | | — | % | | | 100 | % |
Concentrated Growth | | | | | — | | | | — | | | | — | | | | 64 | | | | 100 | |
Dynamic U.S. Equity | | | | | 12 | | | | 24 | | | | 8 | | | | 100 | | | | 100 | |
Flexible Cap Growth | | | | | — | | | | — | | | | — | | | | 60 | | | | 100 | |
Focused Growth | | | | | 10 | | | | — | | | | 30 | | | | 100 | | | | 100 | |
Strategic Growth | | | | | — | | | | — | | | | — | | | | — | | | | 100 | |
111
GOLDMAN SACHS FUNDAMENTAL EQUITY GROWTH FUNDS
Notes to Financial Statements (continued)
February 28, 2017 (Unaudited)
|
| 5. PORTFOLIO SECURITIES TRANSACTIONS |
The cost of purchases and proceeds from sales and maturities of long-term securities for the six months ended February 28, 2017, were:
| | | | | | | | | | |
| Fund | | | | Purchases | | | Sales and Maturities | |
Capital Growth | | | | $ | 187,717,137 | | | $ | 235,130,340 | |
Concentrated Growth | | | | | 47,153,318 | | | | 67,722,268 | |
Dynamic U.S. Equity | | | | | 3,441,487 | | | | 4,176,212 | |
Flexible Cap Growth | | | | | 4,852,564 | | | | 5,743,067 | |
Focused Growth | | | | | 10,438,411 | | | | 19,576,237 | |
Growth Opportunities | | | | | 1,038,855,057 | | | | 1,421,950,368 | |
Small/Mid Cap Growth | | | | | 694,347,730 | | | | 1,211,008,305 | |
Strategic Growth | | | | | 112,900,547 | | | | 149,320,188 | |
Technology Opportunities | | | | | 41,099,457 | | | | 52,473,263 | |
The Funds may lend their securities through a securities lending agent, the Bank of New York Mellon (“BNYM”), to certain qualified borrowers. In accordance with the Funds’ securities lending procedures, the Funds receive cash and/or U.S. Treasury securities collateral at least equal to the market value of the securities on loan. The market value of the loaned securities is determined at the close of business of the Funds at their last sale price or official closing price on the principal exchange or system on which they are traded, and any additional required collateral is delivered to the Funds on the next business day. As with other extensions of credit, the Funds may experience delay in the recovery of their securities or incur a loss should the borrower of the securities breach its agreement with the Funds or become insolvent at a time when the collateral is insufficient to cover the cost of repurchasing securities on loan. Dividend income received from securities on loan may not be subject to withholding taxes and therefore withholding taxes paid may differ from the amounts listed in the Statements of Operations. Loans of securities are terminable at any time and as such 1) the remaining contractual maturities of the outstanding securities lending transactions are considered to be overnight and continuous and 2) the borrower, after notice, is required to return borrowed securities within the standard time period for settlement of securities transactions.
The Capital Growth, Flexible Cap Growth, Growth Opportunities, Small/Mid Cap Growth, Strategic Growth, and Technology Opportunities Funds invest the cash collateral received in connection with securities lending transactions in the Goldman Sachs Financial Square Government Fund (“Government Money Market Fund”), an affiliated series of the Trust. Prior to September 30, 2016, the cash collateral had been invested in the Goldman Sachs Financial Square Money Market Fund. The Government Money Market Fund is registered under the Act as an open end investment company, is subject to Rule 2a-7 under the Act, and is managed by GSAM, for which GSAM may receive an investment advisory fee of up to 0.205% on an annualized basis of the average daily net assets of the Government Money Market Fund.
In the event of a default by a borrower with respect to any loan, BNYM may exercise any and all remedies provided under the applicable borrower agreement to make the Funds whole. These remedies include purchasing replacement securities by applying the collateral held from the defaulting broker against the purchase cost of the replacement securities. If BNYM is unable to purchase replacement securities, BNYM will indemnify the Funds by paying the Funds an amount equal to the market value of the securities loaned minus the value of cash and/or U.S. Treasury securities collateral received from the borrower for the loan, subject to an exclusion for any shortfalls resulting from a loss of value in such cash and/or U.S. Treasury securities collateral due to reinvestment risk. The Funds’ loaned securities were all subject to enforceable Securities Lending Agreements and the value of the collateral is at least equal to the value of the cash and/or U.S. Treasury securities received. The amounts of the Funds’ overnight
112
GOLDMAN SACHS FUNDAMENTAL EQUITY GROWTH FUNDS
|
| 6. SECURITIES LENDING (continued) |
and continuous agreements collateralized by common stocks which represent the gross amounts of recognized liabilities for securities lending transactions outstanding as of February 28, 2017 are disclosed as “Payable upon return of securities loaned” on the Statements of Assets and Liabilities.
Both the Capital Growth, Flexible Cap Growth, Growth Opportunities, Small/Mid Cap Growth, Strategic Growth, and Technology Opportunities Funds and BNYM received compensation relating to the lending of the Funds’ securities. The amounts earned, if any, by the Funds’ for the six months ended February 28, 2017, are reported under Investment Income on the Statements of Operations.
The following table provides information about the Funds’ investments in the Government Money Market Fund for the six months ended February 28, 2017:
| | | | | | | | | | | | | | | | | | | | | | |
| Fund | | | | Number of Shares Held Beginning of Period | | | Shares Bought | | | Shares Sold | | | Number of Shares Held End of Period | | | Value at End of Period | |
Capital Growth | | | | | — | | | | 13,965,211 | | | | (11,634,459 | ) | | | 2,330,752 | | | $ | 2,330,752 | |
Flexible Cap Growth | | | | | — | | | | 896,843 | | | | (802,043 | ) | | | 94,800 | | | | 94,800 | |
Growth Opportunities | | | | | — | | | | 58,564,363 | | | | (39,697,998 | ) | | | 18,866,365 | | | | 18,866,365 | |
Small/Mid Cap Growth | | | | | — | | | | 152,735,307 | | | | (116,914,377 | ) | | | 35,820,930 | | | | 35,820,930 | |
Strategic Growth | | | | | — | | | | 4,494,350 | | | | (3,287,676 | ) | | | 1,206,674 | | | | 1,206,674 | |
Technology Opportunities | | | | | — | | | | 10,603,038 | | | | (9,860,238 | ) | | | 742,800 | | | | 742,800 | |
As of the Funds’ most recent fiscal year end, August 31, 2016, the Funds’ capital loss carryforwards and certain timing differences on a tax basis were as follows:
| | | | | | | | | | | | | | | | | | | | | | | | | | | | | | | | | | | | |
| | | Capital
Growth | | | Concentrated
Growth | | | Dynamic
U.S. Equity | | | Flexible
Cap
Growth | | | Focused
Growth | | | Growth
Opportunities | | | Small/Mid Cap
Growth | | | Strategic
Growth | | | Technology
Opportunities | |
Capital loss carryforwards: | | | | | | | | | | | | | | | | | | | | | | | | | | | | | | | | | | | | |
Perpetual Short-term | | | — | | | $ | (1,011,477 | ) | | | — | | | | — | | | $ | (168,628 | ) | | | — | | | | — | | | | — | | | | — | |
Timing differences (Qualified Late Year Deferrals) | | $ | — | | | $ | (1,015,284 | ) | | $ | (379,906 | ) | | $ | (34,516 | ) | | $ | (1,254,463 | ) | | $ | (8,092,308 | ) | | $ | (11,095,012 | ) | | $ | — | | | $ | (1,972,577 | ) |
113
GOLDMAN SACHS FUNDAMENTAL EQUITY GROWTH FUNDS
Notes to Financial Statements (continued)
February 28, 2017 (Unaudited)
|
| 7. TAX INFORMATION (continued) |
As of February 28, 2017, the Funds’ aggregate security unrealized gains and losses based on cost for U.S. federal income tax purposes were as follows:
| | | | | | | | | | | | | | | | | | | | | | | | | | | | | | | | | | | | |
| | | Capital Growth | | | Concentrated
Growth | | | Dynamic U.S. Equity | | | Flexible Cap Growth | | | Focused
Growth | | | Growth
Opportunities | | | Small/Mid Cap Growth | | | Strategic
Growth | | | Technology
Opportunities | |
Tax Cost | | $ | 581,068,496 | | | $ | 90,594,730 | | | $ | 5,482,461 | | | $ | 11,956,637 | | | $ | 13,109,713 | | | $ | 2,295,883,256 | | | $ | 1,826,990,481 | | | $ | 223,041,401 | | | $ | 226,468,338 | |
Gross unrealized gain | | | 291,763,736 | | | | 40,304,675 | | | | 1,943,783 | | | | 5,266,715 | | | | 3,839,338 | | | | 634,968,587 | | | | 429,522,387 | | | | 113,366,005 | | | | 176,402,536 | |
Gross unrealized loss | | | (8,303,790 | ) | | | (1,319,054 | ) | | | (185,238 | ) | | | (136,546 | ) | | | (284,149 | ) | | | (47,866,730 | ) | | | (28,800,654 | ) | | | (2,561,596 | ) | | | (1,760,537 | ) |
Net unrealized security gain | | $ | 283,459,946 | | | $ | 38,985,621 | | | $ | 1,758,545 | | | $ | 5,130,169 | | | $ | 3,555,189 | | | $ | 587,101,857 | | | $ | 400,721,733 | | | $ | 110,804,409 | | | $ | 174,641,999 | |
The difference between GAAP-basis and tax basis unrealized gains (losses) is attributable primarily to wash sales, differences in the tax treatment of underlying fund investments, and partnership investments.
GSAM has reviewed the Funds’ tax positions for all open tax years (the current and prior three years, as applicable) and has concluded that no provision for income tax is required in the Funds’ financial statements. Such open tax years remain subject to examination and adjustment by tax authorities.
The Funds’ risks include, but are not limited to, the following:
Industry Concentration Risk — The Technology Opportunities Fund invests primarily in equity investments in high-quality technology, media, or service companies that adopt or use technology to improve their cost structure, revenue opportunities or competitive advantage. Because of its focus on technology, media and service companies, the Technology Opportunities Fund is subject to greater risk of loss as a result of adverse economic, business or other developments than if its investments were diversified across different industry sectors. The Technology Opportunities Fund may also invest in a relatively few number of issuers. Thus, the Technology Opportunities Fund may be more susceptible to adverse developments affecting any single issuer held in its portfolio and may be more susceptible to greater losses because of these developments.
Investments in Other Investment Companies — As a shareholder of another investment company, a Fund will indirectly bear its proportionate share of any net management fees and other expenses paid by such other investment companies, in addition to the fees and expenses regularly borne by the Fund.
Large Shareholder Transactions Risk — A Fund may experience adverse effects when certain large shareholders, such as other funds, institutional investors (including those trading by use of non-discretionary mathematical formulas), financial intermediaries (who may make investment decisions on behalf of underlying clients and/or include a Fund in their investment model), individuals, accounts and Goldman Sachs affiliates, purchase or redeem large amounts of shares of a Fund. Such large shareholder redemptions may cause a Fund to sell portfolio securities at times when it would not otherwise do so, which may negatively impact a Fund’s NAV and liquidity. These transactions may also accelerate the realization of taxable income to shareholders if such sales of investments resulted in gains, and may also increase transaction costs. In addition, a large redemption could result in a Fund’s current expenses being allocated over a smaller asset base, leading to an increase in the Fund’s expense ratio. Similarly, large Fund share purchases may adversely affect a Fund’s performance to the extent that the Fund is delayed in investing new cash and is required to maintain a larger cash position than it ordinarily would.
114
GOLDMAN SACHS FUNDAMENTAL EQUITY GROWTH FUNDS
|
| 8. OTHER RISKS (continued) |
Liquidity Risk — A Fund may make investments that are illiquid or that may become less liquid in response to market developments or adverse investor perceptions. Illiquid investments may be more difficult to value. Liquidity risk may also refer to the risk that a Fund will not be able to pay redemption proceeds within the allowable time period because of unusual market conditions, an unusually high volume of redemption requests, or other reasons. To meet redemption requests, a Fund may be forced to sell investments at an unfavorable time and/or under unfavorable conditions.
Market and Credit Risks — In the normal course of business, the Funds trade financial instruments and enter into financial transactions where risk of potential loss exists due to changes in the market (market risk). Additionally, the Funds may also be exposed to credit risk in the event that an issuer or guarantor fails to perform or that an institution or entity with which the Funds have unsettled or open transactions defaults.
Non-Diversification Risk — The Concentrated Growth and Focused Growth Funds are non-diversified, meaning that are permitted to invest a larger percentage of their assets in fewer issuers than diversified mutual funds. Thus, a Fund may be more susceptible to adverse developments affecting any single issuer held in its portfolio, and may be more susceptible to greater losses because of these developments.
Under the Trust’s organizational documents, its Trustees, officers, employees and agents are indemnified, to the extent permitted by the Act and state law, against certain liabilities that may arise out of performance of their duties to the Funds. Additionally, in the course of business, the Funds enter into contracts that contain a variety of indemnification clauses. The Funds’ maximum exposure under these arrangements is unknown, as this would involve future claims that may be made against the Funds that have not yet occurred. However, GSAM believes the risk of loss under these arrangements to be remote.
At a meeting held on April 19, 2017, the Trustees approved a reorganization pursuant to which the Goldman Sachs Focused Growth Fund (the “Acquired Fund”) will be reorganized with and into the Goldman Sachs Concentrated Growth Fund (the “Surviving Fund”). Effective on or about July 2017 (the “Closing Date”), shareholders of the Acquired Fund will own shares in the Surviving Fund equal in dollar value to their interest in the Acquired Fund on the Closing Date. As part of the reorganization, holders of Class A, Class C, Institutional, Class IR, Class R and Class R6 Shares of the Acquired Fund, respectively, will receive Class A, Class C, Institutional, Class IR, Class R and Class R6 Shares of the Survivor Fund. The reorganization is intended to be a tax-free reorganization for Federal income tax purposes.
Subsequent events after the Statements of Assets and Liabilities date have been evaluated and GSAM has concluded that there is no impact requiring adjustment or disclosure in the financial statements.
115
GOLDMAN SACHS FUNDAMENTAL EQUITY GROWTH FUNDS
Notes to Financial Statements (continued)
February 28, 2017 (Unaudited)
|
| 12. SUMMARY OF SHARE TRANSACTIONS |
Share activity is as follows:
| | | | | | | | | | | | | | | | |
| | | Capital Growth Fund | |
| | | | |
| | | For the Six Months Ended
February 28, 2017
(Unaudited) | | | For the Fiscal Year Ended
August 31, 2016 | |
| | | | |
| | | Shares | | | Dollars | | | Shares | | | Dollars | |
| | | | |
| Class A Shares | | | | | | | | | | | | | | | | |
Shares sold | | | 239,464 | | | $ | 5,814,496 | | | | 664,254 | | | $ | 15,685,065 | |
Reinvestment of distributions | | | 342,923 | | | | 8,210,400 | | | | 2,165,893 | | | | 51,418,306 | |
Shares redeemed | | | (2,043,748 | ) | | | (49,500,169 | ) | | | (3,725,446 | ) | | | (88,186,013 | ) |
| | | | (1,461,361 | ) | | | (35,475,273 | ) | | | (895,299 | ) | | | (21,082,642 | ) |
| Class C Shares | | | | | | | | | | | | | | | | |
Shares sold | | | 122,886 | | | | 2,314,349 | | | | 249,049 | | | | 4,603,944 | |
Reinvestment of distributions | | | 57,361 | | | | 1,056,008 | | | | 372,429 | | | | 6,878,768 | |
Shares redeemed | | | (386,903 | ) | | | (7,225,153 | ) | | | (771,189 | ) | | | (14,309,764 | ) |
| | | | (206,656 | ) | | | (3,854,796 | ) | | | (149,711 | ) | | | (2,827,052 | ) |
| Institutional Shares | | | | | | | | | | | | | | | | |
Shares sold | | | 209,170 | | | | 5,497,874 | | | | 435,916 | | | | 11,486,482 | |
Reinvestment of distributions | | | 83,334 | | | | 2,181,053 | | | | 485,148 | | | | 12,546,206 | |
Shares redeemed | | | (483,615 | ) | | | (12,783,239 | ) | | | (2,024,093 | ) | | | (49,724,048 | ) |
| | | | (191,111 | ) | | | (5,104,312 | ) | | | (1,103,029 | ) | | | (25,691,360 | ) |
| Service Shares | | | | | | | | | | | | | | | | |
Shares sold | | | 3,749 | | | | 88,817 | | | | 6,962 | | | | 162,356 | |
Reinvestment of distributions | | | 870 | | | | 20,175 | | | | 5,946 | | | | 136,873 | |
Shares redeemed | | | (2,852 | ) | | | (67,404 | ) | | | (25,655 | ) | | | (593,276 | ) |
| | | | 1,767 | | | | 41,588 | | | | (12,747 | ) | | | (294,047 | ) |
| Class IR Shares | | | | | | | | | | | | | | | | |
Shares sold | | | 97,768 | | | | 2,475,762 | | | | 53,124 | | | | 1,326,280 | |
Reinvestment of distributions | | | 3,091 | | | | 75,073 | | | | 15,717 | | | | 377,764 | |
Shares redeemed | | | (28,562 | ) | | | (707,610 | ) | | | (45,766 | ) | | | (1,054,398 | ) |
| | | | 72,297 | | | | 1,843,225 | | | | 23,075 | | | | 649,646 | |
| Class R Shares | | | | | | | | | | | | | | | | |
Shares sold | | | 20,768 | | | | 487,404 | | | | 73,489 | | | | 1,728,829 | |
Reinvestment of distributions | | | 1,858 | | | | 43,139 | | | | 12,478 | | | | 288,122 | |
Shares redeemed | | | (28,290 | ) | | | (670,613 | ) | | | (83,452 | ) | | | (1,950,338 | ) |
| | | | (5,664 | ) | | | (140,070 | ) | | | 2,515 | | | | 66,613 | |
| Class R6 Shares | | | | | | | | | | | | | | | | |
Shares sold | | | — | | | | — | | | | — | | | | — | |
Reinvestment of distributions | | | 6 | | | | 168 | | | | 28 | | | | 730 | |
Shares redeemed | | | — | | | | — | | | | — | | | | — | |
| | | | 6 | | | | 168 | | | | 28 | | | | 730 | |
NET DECREASE | | | (1,790,722 | ) | | $ | (42,689,470 | ) | | | (2,135,168 | ) | | $ | (49,178,112 | ) |
116
GOLDMAN SACHS FUNDAMENTAL EQUITY GROWTH FUNDS
| | | | | | | | | | | | | | | | | | | | | | | | | | | | | | |
| Concentrated Growth Fund | | | Dynamic U.S. Equity Fund | |
For the Six Months Ended
February 28, 2017
(Unaudited) | | | For the Fiscal Year Ended
August 31, 2016 | | | For the Six Months Ended
February 28, 2017
(Unaudited) | | | For the Fiscal Year Ended
August 31, 2016 | |
| Shares | | | Dollars | | | Shares | | | Dollars | | | Shares | | | Dollars | | | Shares | | | Dollars | |
| | | | | | | | | | | | | | | | | | | | | | | | | | | | | | |
| | 11,378 | | | $ | 169,049 | | | | 52,192 | | | $ | 821,213 | | | | 24,841 | | | $ | 338,471 | | | | 12,607 | | | $ | 162,541 | |
| | 1,772 | | | | 26,307 | | | | 45,827 | | | | 684,660 | | | | 789 | | | | 10,696 | | | | 23,802 | | | | 308,204 | |
| | (100,638 | ) | | | (1,519,902 | ) | | | (119,056 | ) | | | (1,736,160 | ) | | | (53,206 | ) | | | (716,767 | ) | | | (95,770 | ) | | | (1,210,967 | ) |
| | (87,488 | ) | | | (1,324,546 | ) | | | (21,037 | ) | | | (230,287 | ) | | | (27,576 | ) | | | (367,600 | ) | | | (59,361 | ) | | | (740,222 | ) |
| | | | | | | | | | | | | | | | | | | | | | | | | | | | | | |
| | 4,039 | | | | 50,808 | | | | 31,025 | | | | 409,544 | | | | 7,001 | | | | 89,995 | | | | 4,026 | | | | 49,591 | |
| | 594 | | | | 7,494 | | | | 20,916 | | | | 267,936 | | | | 2 | | | | 22 | | | | 2,696 | | | | 33,918 | |
| | (16,808 | ) | | | (216,972 | ) | | | (137,702 | ) | | | (1,784,637 | ) | | | (10,227 | ) | | | (129,624 | ) | | | (17,511 | ) | | | (219,594 | ) |
| | (12,175 | ) | | | (158,670 | ) | | | (85,761 | ) | | | (1,107,157 | ) | | | (3,224 | ) | | | (39,607 | ) | | | (10,789 | ) | | | (136,085 | ) |
| | | | | | | | | | | | | | | | | | | | | | | | | | | | | | |
| | 172,298 | | | | 2,746,073 | | | | 296,640 | | | | 4,728,852 | | | | 72,044 | | | | 988,101 | | | | 48,423 | | | | 656,390 | |
| | 79,695 | | | | 1,253,285 | | | | 1,049,110 | | | | 16,578,987 | | | | 4,295 | | | | 58,374 | | | | 59,033 | | | | 770,241 | |
| | (1,416,786 | ) | | | (22,456,053 | ) | | | (2,109,806 | ) | | | (32,916,814 | ) | | | (91,432 | ) | | | (1,281,303 | ) | | | (521,192 | ) | | | (6,696,086 | ) |
| | (1,164,793 | ) | | | (18,456,695 | ) | | | (764,056 | ) | | | (11,608,975 | ) | | | (15,093 | ) | | | (234,828 | ) | | | (413,736 | ) | | | (5,269,455 | ) |
| | | | | | | | | | | | | | | | | | | | | | | | | | | | | | |
| | — | | | | — | | | | — | | | | — | | | | — | | | | — | | | | — | | | | — | |
| | — | | | | — | | | | — | | | | — | | | | — | | | | — | | | | — | | | | — | |
| | — | | | | — | | | | — | | | | — | | | | — | | | | — | | | | — | | | | — | |
| | — | | | | — | | | | — | | | | — | | | | — | | | | — | | | | — | | | | — | |
| | | | | | | | | | | | | | | | | | | | | | | | | | | | | | |
| | 13,150 | | | | 208,966 | | | | 11,110 | | | | 165,677 | | | | 11,383 | | | | 155,570 | | | | 28,181 | | | | 344,243 | |
| | 245 | | | | 3,701 | | | | 2,439 | | | | 36,968 | | | | 112 | | | | 1,523 | | | | 3,311 | | | | 43,086 | |
| | (5,296 | ) | | | (81,153 | ) | | | (5,059 | ) | | | (76,091 | ) | | | (4,137 | ) | | | (55,627 | ) | | | (76,845 | ) | | | (1,011,626 | ) |
| | 8,099 | | | | 131,514 | | | | 8,490 | | | | 126,554 | | | | 7,358 | | | | 101,466 | | | | (45,353 | ) | | | (624,297 | ) |
| | | | | | | | | | | | | | | | | | | | | | | | | | | | | | |
| | 113 | | | | 1,664 | | | | 461 | | | | 6,645 | | | | — | | | | — | | | | 428 | | | | 5,433 | |
| | 6 | | | | 84 | | | | 211 | | | | 3,065 | | | | 1 | | | | 3 | | | | 424 | | | | 5,478 | |
| | — | | | | — | | | | (876 | ) | | | (12,879 | ) | | | — | | | | — | | | | (7,899 | ) | | | (108,468 | ) |
| | 119 | | | | 1,748 | | | | (204 | ) | | | (3,169 | ) | | | 1 | | | | 3 | | | | (704 | ) | | | (97,557 | ) |
| | | | | | | | | | | | | | | | | | | | | | | | | | | | | | |
| | — | | | | — | | | | — | | | | — | | | | — | | | | — | | | | — | | | | — | |
| | 7 | | | | 103 | | | | 65 | | | | 1,028 | | | | 7 | | | | 103 | | | | 77 | | | | 1,003 | |
| | — | | | | — | | | | — | | | | — | | | | — | | | | — | | | | — | | | | — | |
| | 7 | | | | 103 | | | | 65 | | | | 1,028 | | | | 7 | | | | 103 | | | | 77 | | | | 1,003 | |
| | (1,256,231 | ) | | $ | (19,806,546 | ) | | | (862,503 | ) | | $ | (12,822,006 | ) | | | (38,527 | ) | | $ | (540,463 | ) | | | (536,209 | ) | | $ | (6,866,613 | ) |
117
GOLDMAN SACHS FUNDAMENTAL EQUITY GROWTH FUNDS
Notes to Financial Statements (continued)
February 28, 2017 (Unaudited)
|
| 12. SUMMARY OF SHARE TRANSACTIONS (continued) |
Share activity is as follows:
| | | | | | | | | | | | | | | | |
| | | Flexible Cap Growth Fund | |
| | | | |
| | | For the Six Months Ended
February 28, 2017
(Unaudited) | | | For the Fiscal Year Ended
August 31, 2016 | |
| | | | |
| | | Shares | | | Dollars | | | Shares | | | Dollars | |
| | | | |
| Class A Shares | | | | | | | | | | | | | | | | |
Shares sold | | | 27,978 | | | $ | 326,554 | | | | 136,627 | | | $ | 1,598,220 | |
Reinvestment of distributions | | | 500 | | | | 5,826 | | | | 40,108 | | | | 458,035 | |
Shares redeemed | | | (124,829 | ) | | | (1,483,527 | ) | | | (263,936 | ) | | | (2,915,077 | ) |
| | | | (96,351 | ) | | | (1,151,147 | ) | | | (87,201 | ) | | | (858,822 | ) |
| Class C Shares | | | | | | | | | | | | | | | | |
Shares sold | | | 11,146 | | | | 117,481 | | | | 36,060 | | | | 382,842 | |
Reinvestment of distributions | | | 141 | | | | 1,496 | | | | 11,168 | | | | 116,932 | |
Shares redeemed | | | (37,674 | ) | | | (399,641 | ) | | | (73,393 | ) | | | (766,608 | ) |
| | | | (26,387 | ) | | | (280,664 | ) | | | (26,165 | ) | | | (266,834 | ) |
| Institutional Shares | | | | | | | | | | | | | | | | |
Shares sold | | | 90,020 | | | | 1,099,755 | | | | 93,234 | | | | 1,069,282 | |
Reinvestment of distributions | | | 774 | | | | 9,494 | | | | 41,542 | | | | 497,675 | |
Shares redeemed | | | (70,120 | ) | | | (859,219 | ) | | | (69,689 | ) | | | (843,461 | ) |
| | | | 20,674 | | | | 250,030 | | | | 65,087 | | | | 723,496 | |
| Service Shares | | | | | | | | | | | | | | | | |
Shares sold | | | — | | | | — | | | | — | | | | — | |
Reinvestment of distributions | | | — | | | | — | | | | — | | | | — | |
Shares redeemed | | | — | | | | — | | | | — | | | | — | |
| | | | — | | | | — | | | | — | | | | — | |
| Class IR Shares | | | | | | | | | | | | | | | | |
Shares sold | | | 40,811 | | | | 519,680 | | | | 11,548 | | | | 134,523 | |
Reinvestment of distributions | | | 16 | | | | 198 | | | | 1,142 | | | | 13,475 | |
Shares redeemed | | | (14,826 | ) | | | (189,182 | ) | | | (17,043 | ) | | | (195,238 | ) |
| | | | 26,001 | | | | 330,696 | | | | (4,353 | ) | | | (47,240 | ) |
| Class R Shares | | | | | | | | | | | | | | | | |
Shares sold | | | 730 | | | | 8,238 | | | | 973 | | | | 10,929 | |
Reinvestment of distributions | | | 2 | | | | 27 | | | | 203 | | | | 2,254 | |
Shares redeemed | | | (1,082 | ) | | | (12,279 | ) | | | (749 | ) | | | (8,168 | ) |
| | | | (350 | ) | | | (4,014 | ) | | | 427 | | | | 5,015 | |
| Class R6 Shares | | | | | | | | | | | | | | | | |
Shares sold | | | — | | | | — | | | | — | | | | — | |
Reinvestment of distributions | | | 1 | | | | 10 | | | | 46 | | | | 544 | |
Shares redeemed | | | — | | | | — | | | | — | | | | — | |
| | | | 1 | | | | 10 | | | | 46 | | | | 544 | |
NET DECREASE | | | (76,412 | ) | | $ | (855,089 | ) | | | (52,159 | ) | | $ | (443,841 | ) |
118
GOLDMAN SACHS FUNDAMENTAL EQUITY GROWTH FUNDS
| | | | | | | | | | | | | | | | | | | | | | | | | | | | | | |
| Focused Growth Fund | | | Growth Opportunities Fund | |
For the Six Months Ended
February 28, 2017
(Unaudited) | | | For the Fiscal Year Ended
August 31, 2016 | | | For the Six Months Ended
February 28, 2017
(Unaudited) | | | For the Fiscal Year Ended
August 31, 2016 | |
| Shares | | | Dollars | | | Shares | | | Dollars | | | Shares | | | Dollars | | | Shares | | | Dollars | |
| | | | | | | | | | | | | | | | | | | | | | | | | | | | | | |
| | 3,710 | | | $ | 51,093 | | | | 13,514 | | | $ | 196,056 | | | | 1,844,817 | | | $ | 38,805,035 | | | | 5,188,410 | | | $ | 109,990,949 | |
| | 116 | | | | 1,594 | | | | 1,035 | | | | 14,681 | | | | 616,532 | | | | 12,830,026 | | | | 4,305,749 | | | | 89,085,946 | |
| | (6,210 | ) | | | (86,755 | ) | | | (7,574 | ) | | | (101,683 | ) | | | (7,348,476 | ) | | | (154,986,502 | ) | | | (20,121,034 | ) | | | (429,709,764 | ) |
| | (2,384 | ) | | | (34,068 | ) | | | 6,975 | | | | 109,054 | | | | (4,887,127 | ) | | | (103,351,441 | ) | | | (10,626,875 | ) | | | (230,632,869 | ) |
| | | | | | | | | | | | | | | | | | | | | | | | | | | | | | |
| | 205 | | | | 2,767 | | | | 16,287 | | | | 237,681 | | | | 209,084 | | | | 3,310,116 | | | | 962,529 | | | | 15,367,206 | |
| | — | | | | — | | | | 1,049 | | | | 14,477 | | | | 201,442 | | | | 3,156,597 | | | | 1,130,439 | | | | 17,894,856 | |
| | — | | | | — | | | | (8,707 | ) | | | (113,983 | ) | | | (1,682,111 | ) | | | (26,711,007 | ) | | | (3,185,261 | ) | | | (51,807,187 | ) |
| | 205 | | | | 2,767 | | | | 8,629 | | | | 138,175 | | | | (1,271,585 | ) | | | (20,244,294 | ) | | | (1,092,293 | ) | | | (18,545,125 | ) |
| | | | | | | | | | | | | | | | | | | | | | | | | | | | | | |
| | 30,057 | | | | 430,609 | | | | 141,976 | | | | 1,993,103 | | | | 7,136,412 | | | | 171,516,977 | | | | 18,570,813 | | | | 439,755,390 | |
| | 11,608 | | | | 162,046 | | | | 126,942 | | | | 1,821,523 | | | | 1,689,189 | | | | 40,287,147 | | | | 10,632,111 | | | | 250,386,206 | |
| | (684,892 | ) | | | (9,488,501 | ) | | | (876,939 | ) | | | (12,292,099 | ) | | | (18,278,707 | ) | | | (439,817,171 | ) | | | (60,682,704 | ) | | | (1,450,641,387 | ) |
| | (643,227 | ) | | | (8,895,846 | ) | | | (608,021 | ) | | | (8,477,473 | ) | | | (9,453,106 | ) | | | (228,013,047 | ) | | | (31,479,780 | ) | | | (760,499,791 | ) |
| | | | | | | | | | | | | | | | | | | | | | | | | | | | | | |
| | — | | | | — | | | | — | | | | — | | | | 73,444 | | | | 1,483,858 | | | | 212,601 | | | | 4,302,039 | |
| | — | | | | — | | | | — | | | | — | | | | 36,199 | | | | 725,434 | | | | 224,585 | | | | 4,484,961 | |
| | — | | | | — | | | | — | | | | — | | | | (319,138 | ) | | | (6,456,136 | ) | | | (772,840 | ) | | | (15,380,698 | ) |
| | — | | | | — | | | | — | | | | — | | | | (209,495 | ) | | | (4,246,844 | ) | | | (335,654 | ) | | | (6,593,698 | ) |
| | | | | | | | | | | | | | | | | | | | | | | | | | | | | | |
| | — | | | | — | | | | 2,834 | | | | 38,785 | | | | 1,549,724 | | | | 34,159,200 | | | | 1,654,412 | | | | 36,014,147 | |
| | 41 | | | | 574 | | | | 62 | | | | 893 | | | | 151,961 | | | | 3,279,315 | | | | 873,457 | | | | 18,674,509 | |
| | — | | | | — | | | | — | | | | — | | | | (1,817,285 | ) | | | (39,616,012 | ) | | | (3,491,281 | ) | | | (76,158,982 | ) |
| | 41 | | | | 574 | | | | 2,896 | | | | 39,678 | | | | (115,600 | ) | | | (2,177,497 | ) | | | (963,412 | ) | | | (21,470,326 | ) |
| | | | | | | | | | | | | | | | | | | | | | | | | | | | | | |
| | — | | | | — | | | | — | | | | — | | | | 251,719 | | | | 5,120,525 | | | | 660,335 | | | | 13,556,973 | |
| | 5 | | | | 72 | | | | 62 | | | | 868 | | | | 72,079 | | | | 1,448,776 | | | | 423,033 | | | | 8,481,806 | |
| | — | | | | — | | | | — | | | | — | | | | (510,537 | ) | | | (10,362,541 | ) | | | (1,424,623 | ) | | | (29,193,359 | ) |
| | 5 | | | | 72 | | | | 62 | | | | 868 | | | | (186,739 | ) | | | (3,793,240 | ) | | | (341,255 | ) | | | (7,154,580 | ) |
| | | | | | | | | | | | | | | | | | | | | | | | | | | | | | |
| | — | | | | — | | | | — | | | | — | | | | 3,318,478 | | | | 80,106,931 | | | | 1,874,647 | | | | 45,447,017 | |
| | 7 | | | | 103 | | | | 36 | | | | 519 | | | | 100,027 | | | | 2,386,639 | | | | 45,912 | | | | 1,081,229 | |
| | — | | | | — | | | | — | | | | — | | | | (1,187,525 | ) | | | (28,168,521 | ) | | | (109,482 | ) | | | (2,621,944 | ) |
| | 7 | | | | 103 | | | | 36 | | | | 519 | | | | 2,230,980 | | | | 54,325,049 | | | | 1,811,077 | | | | 43,906,302 | |
| | (645,353 | ) | | $ | (8,926,398 | ) | | | (589,423 | ) | | $ | (8,189,179 | ) | | | (13,892,672 | ) | | $ | (307,501,314 | ) | | | (43,028,192 | ) | | $ | (1,000,990,087 | ) |
119
GOLDMAN SACHS FUNDAMENTAL EQUITY GROWTH FUNDS
Notes to Financial Statements (continued)
February 28, 2017 (Unaudited)
|
| 12. SUMMARY OF SHARE TRANSACTIONS (continued) |
Share activity is as follows:
| | | | | | | | | | | | | | | | |
| | | Small/Mid Cap Growth Fund | |
| | | | |
| | | For the Six Months Ended
February 28, 2017
(Unaudited) | | | For the Fiscal Year Ended
August 31, 2016 | |
| | | | |
| | | Shares | | | Dollars | | | Shares | | | Dollars | |
| | | | |
| Class A Shares | | | | | | | | | | | | | | | | |
Shares sold | | | 2,328,955 | | | $ | 45,046,946 | | | | 13,059,932 | | | $ | 248,962,765 | |
Reinvestment of distributions | | | 1,063,586 | | | | 20,548,483 | | | | 1,658,772 | | | | 32,113,835 | |
Shares redeemed | | | (20,511,496 | ) | | | (401,492,966 | ) | | | (21,364,280 | ) | | | (402,785,510 | ) |
| | | | (17,118,955 | ) | | | (335,897,537 | ) | | | (6,645,576 | ) | | | (121,708,910 | ) |
| Class C Shares | | | | | | | | | | | | | | | | |
Shares sold | | | 580,267 | | | | 10,007,338 | | | | 3,947,819 | | | | 67,860,295 | |
Reinvestment of distributions | | | 486,596 | | | | 8,349,983 | | | | 552,467 | | | | 9,612,934 | |
Shares redeemed | | | (3,271,123 | ) | | | (56,099,171 | ) | | | (3,869,475 | ) | | | (65,440,359 | ) |
| | | | (2,204,260 | ) | | | (37,741,850 | ) | | | 630,811 | | | | 12,032,870 | |
| Institutional Shares | | | | | | | | | | | | | | | | |
Shares sold | | | 6,779,934 | | | | 138,161,881 | | | | 23,356,509 | | | | 467,210,062 | |
Reinvestment of distributions | | | 1,573,154 | | | | 32,076,604 | | | | 1,970,711 | | | | 40,044,852 | |
Shares redeemed | | | (15,797,497 | ) | | | (320,743,646 | ) | | | (28,679,407 | ) | | | (559,510,889 | ) |
| | | | (7,444,409 | ) | | | (150,505,161 | ) | | | (3,352,187 | ) | | | (52,255,975 | ) |
| Service Shares | | | | | | | | | | | | | | | | |
Shares sold | | | 155,873 | | | | 2,947,177 | | | | 281,592 | | | | 5,278,687 | |
Reinvestment of distributions | | | 20,720 | | | | 392,014 | | | | 20,051 | | | | 380,769 | |
Shares redeemed | | | (135,249 | ) | | | (2,550,970 | ) | | | (208,125 | ) | | | (3,881,601 | ) |
| | | | 41,344 | | | | 788,221 | | | | 93,518 | | | | 1,777,855 | |
| Class IR Shares | | | | | | | | | | | | | | | | |
Shares sold | | | 11,810,148 | | | | 240,668,917 | | | | 10,006,149 | | | | 196,523,636 | |
Reinvestment of distributions | | | 520,109 | | | | 10,339,759 | | | | 506,347 | | | | 10,050,989 | |
Shares redeemed | | | (6,010,128 | ) | | | (118,783,850 | ) | | | (5,540,314 | ) | | | (106,415,747 | ) |
| | | | 6,320,129 | | | | 132,224,826 | | | | 4,972,182 | | | | 100,158,878 | |
| Class R Shares | | | | | | | | | | | | | | | | |
Shares sold | | | 196,426 | | | | 3,685,850 | | | | 666,389 | | | | 12,300,998 | |
Reinvestment of distributions | | | 52,223 | | | | 981,268 | | | | 59,341 | | | | 1,120,945 | |
Shares redeemed | | | (509,571 | ) | | | (9,506,038 | ) | | | (654,691 | ) | | | (12,142,962 | ) |
| | | | (260,922 | ) | | | (4,838,920 | ) | | | 71,039 | | | | 1,278,981 | |
| Class R6 Shares | | | | | | | | | | | | | | | | |
Shares sold | | | 523,957 | | | | 10,937,753 | | | | 537,717 | | | | 10,568,618 | |
Reinvestment of distributions | | | 29,904 | | | | 610,049 | | | | 16 | | | | 313 | |
Shares redeemed | | | (134,302 | ) | | | (2,699,794 | ) | | | (69,825 | ) | | | (1,402,008 | ) |
| | | | 419,559 | | | | 8,848,008 | | | | 467,908 | | | | 9,166,923 | |
NET DECREASE | | | (20,247,514 | ) | | $ | (387,122,413 | ) | | | (3,762,305 | ) | | $ | (49,549,378 | ) |
120
GOLDMAN SACHS FUNDAMENTAL EQUITY GROWTH FUNDS
| | | | | | | | | | | | | | | | | | | | | | | | | | | | | | |
| Strategic Growth Fund | | | Technology Opportunities Fund | |
For the Six Months Ended
February 28, 2017
(Unaudited) | | | For the Fiscal Year Ended
August 31, 2016 | | | For the Six Months Ended
February 28, 2017
(Unaudited) | | | For the Fiscal Year Ended
August 31, 2016 | |
| Shares | | | Dollars | | | Shares | | | Dollars | | | Shares | | | Dollars | | | Shares | | | Dollars | |
| | | | | | | | | | | | | | | | | | | | | | | | | | | | | | |
| | 518,943 | | | $ | 6,032,954 | | | | 823,979 | | | $ | 9,618,983 | | | | 997,637 | | | $ | 18,681,976 | | | | 1,770,746 | | | $ | 31,374,570 | |
| | 118,583 | | | | 1,364,885 | | | | 219,495 | | | | 2,569,040 | | | | 561,199 | | | | 10,202,588 | | | | 1,154,064 | | | | 20,565,422 | |
| | (783,186 | ) | | | (9,260,715 | ) | | | (970,584 | ) | | | (11,223,910 | ) | | | (2,179,026 | ) | | | (40,908,760 | ) | | | (4,430,997 | ) | | | (75,088,065 | ) |
| | (145,660 | ) | | | (1,862,876 | ) | | | 72,890 | | | | 964,113 | | | | (620,190 | ) | | | (12,024,196 | ) | | | (1,506,187 | ) | | | (23,148,073 | ) |
| | | | | | | | | | | | | | | | | | | | | | | | | | | | | | |
| | 37,384 | | | | 364,997 | | | | 162,871 | | | | 1,581,949 | | | | 119,367 | | | | 1,904,553 | | | | 311,683 | | | | 4,754,165 | |
| | 29,118 | | | | 278,952 | | | | 55,139 | | | | 544,217 | | | | 155,295 | | | | 2,396,207 | | | | 282,440 | | | | 4,341,104 | |
| | (224,790 | ) | | | (2,202,002 | ) | | | (211,544 | ) | | | (2,076,408 | ) | | | (397,606 | ) | | | (6,352,885 | ) | | | (717,473 | ) | | | (10,769,123 | ) |
| | (158,288 | ) | | | (1,558,053 | ) | | | 6,466 | | | | 49,758 | | | | (122,944 | ) | | | (2,052,125 | ) | | | (123,350 | ) | | | (1,673,854 | ) |
| | | | | | | | | | | | | | | | | | | | | | | | | | | | | | |
| | 3,000,299 | | | | 37,370,925 | | | | 8,220,144 | | | | 99,417,986 | | | | 722,561 | | | | 14,739,049 | | | | 1,051,764 | | | | 19,886,091 | |
| | 772,278 | | | | 9,454,373 | | | | 1,582,533 | | | | 19,641,430 | | | | 169,963 | | | | 3,363,564 | | | | 318,400 | | | | 6,126,021 | |
| | (5,779,494 | ) | | | (73,204,538 | ) | | | (12,531,831 | ) | | | (152,494,532 | ) | | | (1,128,292 | ) | | | (22,839,147 | ) | | | (2,053,226 | ) | | | (39,107,713 | ) |
| | (2,006,917 | ) | | | (26,379,240 | ) | | | (2,729,154 | ) | | | (33,435,116 | ) | | | (235,768 | ) | | | (4,736,534 | ) | | | (683,062 | ) | | | (13,095,601 | ) |
| | | | | | | | | | | | | | | | | | | | | | | | | | | | | | |
| | 12,091 | | | | 147,245 | | | | 5,667 | | | | 65,578 | | | | 222,171 | | | | 4,106,919 | | | | 378,536 | | | | 6,613,636 | |
| | 873 | | | | 9,995 | | | | 1,139 | | | | 13,275 | | | | 28,324 | | | | 506,163 | | | | 49,979 | | | | 877,134 | |
| | (958 | ) | | | (11,131 | ) | | | (5,357 | ) | | | (64,372 | ) | | | (179,512 | ) | | | (3,311,743 | ) | | | (405,820 | ) | | | (6,930,197 | ) |
| | 12,006 | | | | 146,109 | | | | 1,449 | | | | 14,481 | | | | 70,983 | | | | 1,301,339 | | | | 22,695 | | | | 560,573 | |
| | | | | | | | | | | | | | | | | | | | | | | | | | | | | | |
| | 42,728 | | | | 547,012 | | | | 13,080 | | | | 164,860 | | | | 778,714 | | | | 15,843,909 | | | | 83,801 | | | | 1,620,126 | |
| | 2,398 | | | | 29,343 | | | | 4,008 | | | | 49,728 | | | | 21,094 | | | | 412,820 | | | | 26,798 | | | | 511,029 | |
| | (7,962 | ) | | | (100,594 | ) | | | (16,658 | ) | | | (204,493 | ) | | | (55,808 | ) | | | (1,132,722 | ) | | | (94,969 | ) | | | (1,714,376 | ) |
| | 37,164 | | | | 475,761 | | | | 430 | | | | 10,095 | | | | 744,000 | | | | 15,124,007 | | | | 15,630 | | | | 416,779 | |
| | | | | | | | | | | | | | | | | | | | | | | | | | | | | | |
| | 7,279 | | | | 85,254 | | | | 1,497 | | | | 17,086 | | | | — | | | | — | | | | — | | | | — | |
| | 21 | | | | 234 | | | | 33 | | | | 381 | | | | — | | | | — | | | | — | | | | — | |
| | (857 | ) | | | (10,256 | ) | | | (1,162 | ) | | | (13,491 | ) | | | — | | | | — | | | | — | | | | — | |
| | 6,443 | | | | 75,232 | | | | 368 | | | | 3,976 | | | | — | | | | — | | | | — | | | | — | |
| | | | | | | | | | | | | | | | | | | | | | | | | | | | | | |
| | — | | | | — | | | | — | | | | — | | | | — | | | | — | | | | — | | | | — | |
| | 30 | | | | 356 | | | | 44 | | | | 558 | | | | — | | | | — | | | | — | | | | — | |
| | — | | | | — | | | | — | | | | — | | | | — | | | | — | | | | — | | | | — | |
| | 30 | | | | 356 | | | | 44 | | | | 558 | | | | — | | | | — | | | | — | | | | — | |
| | (2,255,222 | ) | | $ | (29,102,711 | ) | | | (2,647,507 | ) | | $ | (32,392,135 | ) | | | (163,919 | ) | | $ | (2,387,509 | ) | | | (2,274,274 | ) | | $ | (36,940,176 | ) |
121
GOLDMAN SACHS FUNDAMENTAL EQUITY GROWTH FUNDS
Fund Expenses — Six Month Period Ended February 28, 2017 (Unaudited)
As a shareholder of Class A, Class C, Institutional, Service, Class IR, Class R and Class R6 Shares of a Fund, you incur two types of costs: (1) transaction costs, including sales charges on purchase payments (with respect to Class A Shares), contingent deferred sales charges on redemptions (with respect to Class C Shares), and (2) ongoing costs, including management fees; distribution and/or service (12b-1) fees (with respect to Class A, Class C, Service and Class R Shares); and other Fund expenses. This Example is intended to help you understand your ongoing costs (in dollars) of investing in Class A, Class C, Institutional, Service, Class IR, Class R or Class R6 Shares of the Funds and to compare these costs with the ongoing costs of investing in other mutual funds.
The Example is based on an investment of $1,000 invested at the beginning of the period and held for the entire period from September 1, 2016 through February 28, 2017, which represents a period of 181 days in a 365-day year.
Actual Expenses — The first line under each share class in the table below provides information about actual account values and actual expenses. You may use the information in this line, together with the amount you invested, to estimate the expenses that you paid over the period. Simply divide your account value by $1,000 (for example, an $8,600 account value divided by $1,000=8.6), then multiply the result by the number in the first line under the heading entitled “Expenses Paid” to estimate the expenses you paid on your account during this period.
Hypothetical Example for Comparison Purposes — The second line under each share class in the table below provides information about hypothetical account values and hypothetical expenses based on the Funds’ actual net expense ratios and an assumed rate of return of 5% per year before expenses, which is not the Funds’ actual return. The hypothetical account values and expenses may not be used to estimate the actual ending account balance or expenses you paid for the period. You may use this information to compare the ongoing costs of investing in the Funds and other funds. To do so, compare this 5% hypothetical example with the 5% hypothetical examples that appear in the shareholder reports of the other funds.
Please note that the expenses shown in the table are meant to highlight your ongoing costs only and do not reflect any transactional costs, such as sales charges, redemption fees, or exchange fees. Therefore, the second line of the table is useful in comparing ongoing costs only, and will not help you determine the relative total costs of owning different funds. In addition, if these transactional costs were included, your costs would have been higher.
| | | | | | | | | | | | | | | | | | | | | | | | | | | | | | | | | | | | |
| | | Capital Growth Fund | | | Concentrated Growth Fund | | | Dynamic U.S. Equity Fund | |
| Share Class | | Beginning
Account
Value
9/1/16 | | | Ending
Account
Value
2/28/17 | | | Expenses
Paid for the
6 months
ended
2/28/17* | | | Beginning
Account
Value
9/1/16 | | | Ending
Account
Value
2/28/17 | | | Expenses
Paid for the
6 months
ended
2/28/17* | | | Beginning
Account
Value
9/1/16 | | | Ending
Account
Value
2/28/17 | | | Expenses
Paid for the
6 months
ended
2/28/17* | |
| Class A | | | | | | | | | | | | | | | | | | | | | | | | | | | | | | | | | | | | |
Actual | | $ | 1,000.00 | | | $ | 1,088.30 | | | $ | 5.95 | | | $ | 1,000.00 | | | $ | 1,067.90 | | | $ | 6.20 | | | $ | 1,000.00 | | | $ | 1,096.00 | | | $ | 6.29 | |
Hypothetical 5% return | | | 1,000.00 | | | | 1,019.09 | + | | | 5.76 | | | | 1,000.00 | | | | 1,018.79 | + | | | 6.06 | | | | 1,000.00 | | | | 1,018.79 | + | | | 6.06 | |
| Class C | | | | | | | | | | | | | | | | | | | | | | | | | | | | | | | | | | | | |
Actual | | | 1,000.00 | | | | 1,084.40 | | | | 9.82 | | | | 1,000.00 | | | | 1,063.90 | | | | 10.03 | | | | 1,000.00 | | | | 1,091.60 | | | | 10.16 | |
Hypothetical 5% return | | | 1,000.00 | | | | 1,015.37 | + | | | 9.49 | | | | 1,000.00 | | | | 1,015.08 | + | | | 9.79 | | | | 1,000.00 | | | | 1,015.08 | + | | | 9.79 | |
| Institutional | | | | | | | | | | | | | | | | | | | | | | | | | | | | | | | | | | | | |
Actual | | | 1,000.00 | | | | 1,090.30 | | | | 3.89 | | | | 1,000.00 | | | | 1,070.00 | | | | 4.21 | | | | 1,000.00 | | | | 1,097.50 | | | | 4.26 | |
Hypothetical 5% return | | | 1,000.00 | | | | 1,021.08 | + | | | 3.76 | | | | 1,000.00 | | | | 1,020.73 | + | | | 4.11 | | | | 1,000.00 | | | | 1,020.73 | + | | | 4.11 | |
| Service | | | | | | | | | | | | | | | | | | | | | | | | | | | | | | | | | | | | |
Actual | | | 1,000.00 | | | | 1,087.50 | | | | 6.47 | | | | N/A | | | | N/A | | | | N/A | | | | N/A | | | | N/A | | | | N/A | |
Hypothetical 5% return | | | 1,000.00 | | | | 1,018.60 | + | | | 6.26 | | | | N/A | | | | N/A | | | | N/A | | | | N/A | | | | N/A | | | | N/A | |
| Class IR | | | | | | | | | | | | | | | | | | | | | | | | | | | | | | | | | | | | |
Actual | | | 1,000.00 | | | | 1,089.30 | | | | 4.66 | | | | 1,000.00 | | | | 1,069.10 | | | | 4.93 | | | | 1,000.00 | | | | 1,096.70 | | | | 4.99 | |
Hypothetical 5% return | | | 1,000.00 | | | | 1,020.33 | + | | | 4.51 | | | | 1,000.00 | | | | 1,020.03 | + | | | 4.81 | | | | 1,000.00 | | | | 1,020.03 | + | | | 4.81 | |
| Class R | | | | | | | | | | | | | | | | | | | | | | | | | | | | | | | | | | | | |
Actual | | | 1,000.00 | | | | 1,086.90 | | | | 7.24 | | | | 1,000.00 | | | | 1,066.20 | | | | 7.48 | | | | 1,000.00 | | | | 1,094.10 | | | | 7.58 | |
Hypothetical 5% return | | | 1,000.00 | | | | 1,017.85 | + | | | 7.00 | | | | 1,000.00 | | | | 1,017.56 | + | | | 7.30 | | | | 1,000.00 | | | | 1,017.56 | + | | | 7.30 | |
| Class R6 | | | | | | | | | | | | | | | | | | | | | | | | | | | | | | | | | | | | |
Actual | | | 1,000.00 | | | | 1,090.50 | | | | 3.89 | | | | 1,000.00 | | | | 1,069.50 | | | | 4.21 | | | | 1,000.00 | | | | 1,098.40 | | | | 4.27 | |
Hypothetical 5% return | | | 1,000.00 | | | | 1,021.08 | + | | | 3.76 | | | | 1,000.00 | | | | 1,020.73 | + | | | 4.11 | | | | 1,000.00 | | | | 1,020.73 | + | | | 4.11 | |
122
GOLDMAN SACHS FUNDAMENTAL EQUITY GROWTH FUNDS
Fund Expenses — Six Month Period Ended February 28, 2017 (Unaudited) (continued)
| | | | | | | | | | | | | | | | | | | | | | | | | | | | | | | | | | | | |
| | | Flexible Cap Growth Fund | | | Focused Growth Fund | | | Growth Opportunities Fund | |
| Share Class | | Beginning
Account
Value
9/1/16 | | | Ending
Account
Value
2/28/17 | | | Expenses
Paid for the
6 months
ended
2/28/17* | | | Beginning
Account
Value
9/1/16 | | | Ending
Account
Value
2/28/17 | | | Expenses
Paid for the
6 months
ended
2/28/17* | | | Beginning
Account
Value
9/1/16 | | | Ending
Account
Value
2/28/17 | | | Expenses
Paid for the
6 months ended
2/28/17* | |
| Class A | | | | | | | | | | | | | | | | | | | | | | | | | | | | | | | | | | | | |
Actual | | $ | 1,000.00 | | | $ | 1,074.40 | | | $ | 6.22 | | | $ | 1,000.00 | | | $ | 1,061.00 | | | $ | 6.13 | | | $ | 1,000.00 | | | $ | 1,031.30 | | | $ | 6.55 | |
Hypothetical 5% return | | | 1,000.00 | | | | 1,018.79 | + | | | 6.06 | | | | 1,000.00 | | | | 1,018.84 | + | | | 6.01 | | | | 1,000.00 | | | | 1,018.35 | + | | | 6.51 | |
| Class C | | | | | | | | | | | | | | | | | | | | | | | | | | | | | | | | | | | | |
Actual | | | 1,000.00 | | | | 1,070.30 | | | | 10.06 | | | | 1,000.00 | | | | 1,057.30 | | | | 9.95 | | | | 1,000.00 | | | | 1,027.20 | | | | 10.30 | |
Hypothetical 5% return | | | 1,000.00 | | | | 1,015.08 | + | | | 9.79 | | | | 1,000.00 | | | | 1,015.13 | + | | | 9.74 | | | | 1,000.00 | | | | 1,014.63 | + | | | 10.24 | |
| Institutional | | | | | | | | | | | | | | | | | | | | | | | | | | | | | | | | | | | | |
Actual | | | 1,000.00 | | | | 1,077.20 | | | | 4.22 | | | | 1,000.00 | | | | 1,063.40 | | | | 4.09 | | | | 1,000.00 | | | | 1,033.50 | | | | 4.79 | |
Hypothetical 5% return | | | 1,000.00 | | | | 1,020.73 | + | | | 4.11 | | | | 1,000.00 | | | | 1,020.83 | + | | | 4.01 | | | | 1,000.00 | | | | 1,020.08 | + | | | 4.76 | |
| Service | | | | | | | | | | | | | | | | | | | | | | | | | | | | | | | | | | | | |
Actual | | | N/A | | | | N/A | | | | N/A | | | | N/A | | | | N/A | | | | N/A | | | | 1,000.00 | | | | 1,030.60 | | | | 7.30 | |
Hypothetical 5% return | | | N/A | | | | N/A | | | | N/A | | | | N/A | | | | N/A | | | | N/A | | | | 1,000.00 | | | | 1,017.60 | + | | | 7.25 | |
| Class IR | | | | | | | | | | | | | | | | | | | | | | | | | | | | | | | | | | | | |
Actual | | | 1,000.00 | | | | 1,075.90 | | | | 4.94 | | | | 1,000.00 | | | | 1,062.70 | | | | 4.86 | | | | 1,000.00 | | | | 1,033.00 | | | | 5.29 | |
Hypothetical 5% return | | | 1,000.00 | | | | 1,020.03 | + | | | 4.81 | | | | 1,000.00 | | | | 1,020.08 | + | | | 4.76 | | | | 1,000.00 | | | | 1,019.59 | + | | | 5.26 | |
| Class R | | | | | | | | | | | | | | | | | | | | | | | | | | | | | | | | | | | | |
Actual | | | 1,000.00 | | | | 1,073.00 | | | | 7.50 | | | | 1,000.00 | | | | 1,060.40 | | | | 7.46 | | | | 1,000.00 | | | | 1,030.50 | | | | 7.80 | |
Hypothetical 5% return | | | 1,000.00 | | | | 1,017.56 | + | | | 7.30 | | | | 1,000.00 | | | | 1,017.56 | + | | | 7.30 | | | | 1,000.00 | | | | 1,017.11 | + | | | 7.75 | |
| Class R6 | | | | | | | | | | | | | | | | | | | | | | | | | | | | | | | | | | | | |
Actual | | | 1,000.00 | | | | 1,077.20 | | | | 4.22 | | | | 1,000.00 | | | | 1,063.80 | | | | 4.09 | | | | 1,000.00 | | | | 1,033.10 | | | | 4.69 | |
Hypothetical 5% return | | | 1,000.00 | | | | 1,020.73 | + | | | 4.11 | | | | 1,000.00 | | | | 1,020.83 | + | | | 4.01 | | | | 1,000.00 | | | | 1,020.18 | + | | | 4.66 | |
123
GOLDMAN SACHS FUNDAMENTAL EQUITY GROWTH FUNDS
Fund Expenses — Six Month Period Ended February 28, 2017 (Unaudited) (continued)
| | | | | | | | | | | | | | | | | | | | | | | | | | | | | | | | | | | | |
| | | Small/Mid Cap Growth Fund | | | Strategic Growth Fund | | | Technology Opportunities Fund | |
| Share Class | | Beginning
Account
Value
9/1/16 | | | Ending
Account
Value
2/28/17 | | | Expenses
Paid for the
6 months ended
2/28/17* | | | Beginning
Account
Value
9/1/16 | | | Ending
Account
Value
2/28/17 | | | Expenses
Paid for the
6 months ended
2/28/17* | | | Beginning
Account
Value
9/1/16 | | | Ending
Account
Value
2/28/17 | | | Expenses
Paid for the
6 months ended
2/28/17* | |
| Class A | | | | | | | | | | | | | | | | | | | | | | | | | | | | | | | | | | | | |
Actual | | $ | 1,000.00 | | | $ | 1,046.00 | | | $ | 6.54 | | | $ | 1,000.00 | | | $ | 1,076.20 | | | $ | 5.92 | | | $ | 1,000.00 | | | $ | 1,098.30 | | | $ | 7.54 | |
Hypothetical 5% return | | | 1,000.00 | | | | 1,018.40 | + | | | 6.46 | | | | 1,000.00 | | | | 1,019.09 | + | | | 5.76 | | | | 1,000.00 | | | | 1,017.60 | + | | | 7.25 | |
| Class C | | | | | | | | | | | | | | | | | | | | | | | | | | | | | | | | | | | | |
Actual | | | 1,000.00 | | | | 1,042.40 | | | | 10.33 | | | | 1,000.00 | | | | 1,072.70 | | | | 9.76 | | | | 1,000.00 | | | | 1,093.90 | | | | 11.42 | |
Hypothetical 5% return | | | 1,000.00 | | | | 1,014.68 | + | | | 10.19 | | | | 1,000.00 | | | | 1,015.37 | + | | | 9.49 | | | | 1,000.00 | | | | 1,013.89 | + | | | 10.99 | |
| Institutional | | | | | | | | | | | | | | | | | | | | | | | | | | | | | | | | | | | | |
Actual | | | 1,000.00 | | | | 1,047.60 | | | | 4.67 | | | | 1,000.00 | | | | 1,079.10 | | | | 3.87 | | | | 1,000.00 | | | | 1,100.10 | | | | 5.47 | |
Hypothetical 5% return | | | 1,000.00 | | | | 1,020.23 | + | | | 4.61 | | | | 1,000.00 | | | | 1,021.08 | + | | | 3.76 | | | | 1,000.00 | | | | 1,019.59 | + | | | 5.26 | |
| Service | | | | | | | | | | | | | | | | | | | | | | | | | | | | | | | | | | | | |
Actual | | | 1,000.00 | | | | 1,045.40 | | | | 7.20 | | | | 1,000.00 | | | | 1,076.10 | | | | 6.43 | | | | 1,000.00 | | | | 1,097.10 | | | | 8.06 | |
Hypothetical 5% return | | | 1,000.00 | | | | 1,017.75 | + | | | 7.10 | | | | 1,000.00 | | | | 1,018.60 | + | | | 6.26 | | | | 1,000.00 | | | | 1,017.11 | + | | | 7.75 | |
| Class IR | | | | | | | | | | | | | | | | | | | | | | | | | | | | | | | | | | | | |
Actual | | | 1,000.00 | | | | 1,047.30 | | | | 5.28 | | | | 1,000.00 | | | | 1,078.60 | | | | 4.64 | | | | 1,000.00 | | | | 1,099.20 | | | | 6.19 | |
Hypothetical 5% return | | | 1,000.00 | | | | 1,019.64 | + | | | 5.21 | | | | 1,000.00 | | | | 1,020.33 | + | | | 4.51 | | | | 1,000.00 | | | | 1,018.89 | + | | | 5.96 | |
| Class R | | | | | | | | | | | | | | | | | | | | | | | | | | | | | | | | | | | | |
Actual | | | 1,000.00 | | | | 1,044.60 | | | | 7.81 | | | | 1,000.00 | | | | 1,075.70 | | | | 7.21 | | | | N/A | | | | N/A | | | | — | |
Hypothetical 5% return | | | 1,000.00 | | | | 1,017.16 | + | | | 7.70 | | | | 1,000.00 | | | | 1,017.85 | + | | | 7.00 | | | | N/A | | | | N/A | | | | N/A | |
| Class R6 | | | | | | | | | | | | | | | | | | | | | | | | | | | | | | | | | | | | |
Actual | | | 1,000.00 | | | | 1,048.00 | | | | 4.57 | | | | 1,000.00 | | | | 1,079.30 | | | | 3.87 | | | | N/A | | | | N/A | | | | — | |
Hypothetical 5% return | | | 1,000.00 | | | | 1,020.33 | + | | | 4.51 | | | | 1,000.00 | | | | 1,021.08 | + | | | 3.76 | | | | N/A | | | | N/A | | | | N/A | |
| * | | Expenses for each share class are calculated using each Fund’s annualized net expense ratio for each class, which represents the ongoing expenses as a percentage of net assets for the six months ended February 28, 2017. Expenses are calculated by multiplying the annualized net expense ratio by the average account value for the period; then multiplying the result by the number of days in the most recent fiscal half year; and then dividing that result by the number of days in the fiscal year. The annualized net expense ratios for the period were as follows: |
| | | | | | | | | | | | | | | | | | | | | | | | | | | | |
| Fund | | Class A | | | Class C | | | Institutional | | | Service | | | Class IR | | | Class R | | | Class R6 | |
Capital Growth | | | 1.15 | % | | | 1.90 | % | | | 0.75 | % | | | 1.25 | % | | | 0.90 | % | | | 1.40 | % | | | 0.75 | % |
Concentrated Growth | | | 1.21 | | | | 1.96 | | | | 0.82 | | | | N/A | | | | 0.96 | | | | 1.46 | | | | 0.82 | |
Dynamic U.S. Equity | | | 1.21 | | | | 1.96 | | | | 0.82 | | | | N/A | | | | 0.96 | | | | 1.46 | | | | 0.82 | |
Flexible Cap Growth | | | 1.21 | | | | 1.96 | | | | 0.82 | | | | N/A | | | | 0.96 | | | | 1.46 | | | | 0.82 | |
Focused Growth | | | 1.20 | | | | 1.95 | | | | 0.80 | | | | N/A | | | | 0.95 | | | | 1.46 | | | | 0.80 | |
Growth Opportunities | | | 1.30 | | | | 2.05 | | | | 0.95 | | | | 1.45 | | | | 1.05 | | | | 1.55 | | | | 0.93 | |
Small/Mid Cap Growth | | | 1.29 | | | | 2.04 | | | | 0.92 | | | | 1.42 | | | | 1.04 | | | | 1.54 | | | | 0.90 | |
Strategic Growth | | | 1.15 | | | | 1.90 | | | | 0.75 | | | | 1.25 | | | | 0.90 | | | | 1.40 | | | | 0.75 | |
Technology Opportunities | | | 1.45 | | | | 2.20 | | | | 1.05 | | | | 1.55 | | | | 1.19 | | | | N/A | | | | N/A | |
| + | | Hypothetical expenses are based on each Fund’s actual annualized net expense ratios and an assumed rate of return of 5% per year before expenses. |
124
FUNDS PROFILE
Goldman Sachs Funds
Goldman Sachs is a premier financial services firm, known since 1869 for creating thoughtful and customized investment solutions in complex global markets.
Today, the Investment Management Division of Goldman Sachs serves a diverse set of clients worldwide, including private institutions, public entities and individuals. With approximately $1.17 trillion in assets under supervision as of December 31, 2016, Goldman Sachs Asset Management (“GSAM”) has portfolio management teams located around the world and our investment professionals bring firsthand knowledge of local markets to every investment decision. Assets under supervision includes assets under management and other client assets for which Goldman Sachs does not have full discretion. GSAM leverages the resources of Goldman, Sachs & Co. subject to legal, internal and regulatory restrictions.
Money Market
Financial Square FundsSM
| ∎ | | Financial Square Treasury Solutions Fund1 |
| ∎ | | Financial Square Government Fund1 |
| ∎ | | Financial Square Money Market Fund2 |
| ∎ | | Financial Square Prime Obligations Fund2 |
| ∎ | | Financial Square Treasury Instruments Fund1 |
| ∎ | | Financial Square Treasury Obligations Fund1 |
| ∎ | | Financial Square Federal Instruments Fund1 |
| ∎ | | Financial Square Tax-Exempt Money Market Fund2 |
Investor FundsSM
| ∎ | | Investor Money Market Fund3 |
| ∎ | | Investor Tax-Exempt Money Market Fund3 |
Fixed Income
Short Duration and Government
| ∎ | | High Quality Floating Rate Fund |
| ∎ | | Short-Term Conservative Income Fund4 |
| ∎ | | Short Duration Government Fund |
| ∎ | | Short Duration Income Fund |
| ∎ | | Inflation Protected Securities Fund |
Multi-Sector
Municipal and Tax-Free
| ∎ | | High Yield Municipal Fund |
| ∎ | | Dynamic Municipal Income Fund |
| ∎ | | Short Duration Tax-Free Fund |
Single Sector
| ∎ | | Investment Grade Credit Fund |
| ∎ | | High Yield Floating Rate Fund |
| ∎ | | Emerging Markets Debt Fund |
| ∎ | | Local Emerging Markets Debt Fund |
| ∎ | | Dynamic Emerging Markets Debt Fund |
Fixed Income Alternatives
| ∎ | | Long Short Credit Strategies Fund |
| ∎ | | Fixed Income Macro Strategies Fund |
Fundamental Equity
| ∎ | | Small/Mid Cap Value Fund |
| ∎ | | Small/Mid Cap Growth Fund |
| ∎ | | Flexible Cap Growth Fund |
| ∎ | | Concentrated Growth Fund |
| ∎ | | Technology Opportunities Fund |
| ∎ | | Growth Opportunities Fund |
| ∎ | | Rising Dividend Growth Fund |
| ∎ | | Dynamic U.S. Equity Fund |
Tax-Advantaged Equity
| ∎ | | U.S. Tax-Managed Equity Fund |
| ∎ | | International Tax-Managed Equity Fund |
| ∎ | | U.S. Equity Dividend and Premium Fund |
| ∎ | | International Equity Dividend and Premium Fund |
Equity Insights
| ∎ | | Small Cap Equity Insights Fund |
| ∎ | | U.S. Equity Insights Fund |
| ∎ | | Small Cap Growth Insights Fund |
| ∎ | | Large Cap Growth Insights Fund |
| ∎ | | Large Cap Value Insights Fund |
| ∎ | | Small Cap Value Insights Fund |
| ∎ | | International Small Cap Insights Fund |
| ∎ | | International Equity Insights Fund |
| ∎ | | Emerging Markets Equity Insights Fund |
Fundamental Equity International
| ∎ | | Strategic International Equity Fund |
| ∎ | | Focused International Equity Fund |
| ∎ | | Emerging Markets Equity Fund |
Select Satellite
| ∎ | | Real Estate Securities Fund |
| ∎ | | International Real Estate Securities Fund |
| ∎ | | Commodity Strategy Fund |
| ∎ | | Global Real Estate Securities Fund |
| ∎ | | Dynamic Allocation Fund |
| ∎ | | Absolute Return Tracker Fund |
| ∎ | | Managed Futures Strategy Fund |
| ∎ | | MLP Energy Infrastructure Fund |
| ∎ | | Multi-Manager Alternatives Fund |
| ∎ | | Absolute Return Multi-Asset Fund |
| ∎ | | Global Infrastructure Fund |
Total Portfolio Solutions
| ∎ | | Global Managed Beta Fund |
| ∎ | | Multi-Manager Non-Core Fixed Income Fund |
| ∎ | | Multi-Manager U.S. Dynamic Equity Fund |
| ∎ | | Multi-Manager Global Equity Fund |
| ∎ | | Multi-Manager International Equity Fund |
| ∎ | | Tactical Tilt Overlay Fund5 |
| ∎ | | Balanced Strategy Portfolio |
| ∎ | | Multi-Manager U.S. Small Cap Equity Fund |
| ∎ | | Multi-Manager Real Assets Strategy Fund |
| ∎ | | Growth and Income Strategy Portfolio |
| ∎ | | Growth Strategy Portfolio |
| ∎ | | Equity Growth Strategy Portfolio |
| ∎ | | Satellite Strategies Portfolio |
| ∎ | | Enhanced Dividend Global Equity Portfolio |
| ∎ | | Tax-Advantaged Global Equity Portfolio |
| ∎ | | Strategic Factor Allocation Fund |
| ∎ | | Target Date 2020 Portfolio |
| ∎ | | Target Date 2025 Portfolio |
| ∎ | | Target Date 2030 Portfolio |
| ∎ | | Target Date 2035 Portfolio |
| ∎ | | Target Date 2040 Portfolio |
| ∎ | | Target Date 2045 Portfolio |
| ∎ | | Target Date 2050 Portfolio |
| ∎ | | Target Date 2055 Portfolio |
| ∎ | | GQG Partners International Opportunities Fund |
| 1 | | You could lose money by investing in the Fund. Although the Fund seeks to preserve the value of your investment at $1.00 per share, it cannot guarantee it will do so. An investment in the Fund is not a deposit of a bank and is not insured or guaranteed by the Federal Deposit Insurance Corporation or any other government agency. The Fund’s sponsor has no legal obligation to provide financial support to the Fund, and you should not expect that the sponsor will provide financial support to the Fund at any time. |
| 2 | | You could lose money by investing in the Fund. Because the share price of the Fund will fluctuate, when you sell your shares they may be worth more or less than what you originally paid for them. The Fund may impose a fee upon sale of your shares or may temporarily suspend your ability to sell shares if the Fund’s liquidity falls below required minimums because of market conditions or other factors. An investment in the Fund is not a deposit of a bank and is not insured or guaranteed by the Federal Deposit Insurance Corporation or any other government agency. The Fund’s sponsor has no legal obligation to provide financial support to the Fund, and you should not expect that the sponsor will provide financial support to the Fund at any time. |
| 3 | | You could lose money by investing in the Fund. Although the Fund seeks to preserve the value of your investment at $1.00 per share, it cannot guarantee it will do so. The Fund may impose a fee upon sale of your shares or may temporarily suspend your ability to sell shares if the Fund’s liquidity falls below required minimums because of market conditions or other factors. An investment in the Fund is not a deposit of a bank and is not insured or guaranteed by the Federal Deposit Insurance Corporation or any other government agency. The Fund’s sponsor has no legal obligation to provide financial support to the Fund, and you should not expect that the sponsor will provide financial support to the Fund at any time. |
| 4 | | Effective on July 29, 2016, the Goldman Sachs Limited Maturity Obligations Fund was renamed the Goldman Sachs Short-Term Conservative Income Fund. |
| 5 | | Effective on June 1, 2016, the Goldman Sachs Tactical Tilt Implementation Fund was renamed the Goldman Sachs Tactical Tilt Overlay Fund. |
Financial Square FundsSM and Investor FundsSM are registered service marks of Goldman, Sachs & Co.
*This list covers open-end funds only. Please visit our website at www.GSAMFUNDS.com to learn about our closed-end funds and exchange-traded funds.
| | |
TRUSTEES Ashok N. Bakhru, Chairman Kathryn A. Cassidy Diana M. Daniels Herbert J. Markley James A. McNamara Jessica Palmer Roy W. Templin Gregory G. Weaver | | OFFICERS James A. McNamara, President Scott M. McHugh, Treasurer, Senior Vice President and Principal Financial Officer Caroline L. Kraus, Secretary |
| |
GOLDMAN, SACHS & CO. Distributor and Transfer Agent | | GOLDMAN SACHS ASSET MANAGEMENT, L.P. Investment Adviser |
Visit our web site at www.GSAMFUNDS.com to obtain the most recent month-end returns.
Goldman Sachs Asset Management, L.P. 200 West Street, New York, New York 10282
The reports concerning the Funds included in this shareholder report may contain certain forward-looking statements about the factors that may affect the performance of the Funds in the future. These statements are based on Fund management’s predictions and expectations concerning certain future events and their expected impact on the Funds, such as performance of the economy as a whole and of specific industry sectors, changes in the levels of interest rates, the impact of developing world events, and other factors that may influence the future performance of the Funds. Management believes these forward-looking statements to be reasonable, although they are inherently uncertain and difficult to predict. Actual events may cause adjustments in portfolio management strategies from those currently expected to be employed.
A description of the policies and procedures that the Funds use to determine how to vote proxies relating to portfolio securities and information regarding how a Fund voted proxies relating to portfolio securities during the most recent 12-month period ended June 30 is available (i) without charge, upon request by calling 1-800-526-7384 (for Retail Shareholders) or 1-800-621-2550 (for Institutional Shareholders); and (ii) on the Securities and Exchange Commission (“SEC”) web site at http://www.sec.gov.
The Funds file their complete schedule of portfolio holdings with the SEC for the first and third quarters of each fiscal year on Form N-Qs. The Funds’ Form N-Qs are available on the SEC’s web site at http://www.sec.gov within 60 days after the Funds’ first and third fiscal quarters. The Funds’ Form N-Qs may be reviewed and copied at the SEC’s Public Reference Room in Washington, D.C. and information on the operation of the Public Reference Room may also be obtained by calling 1-800-SEC-0330. Form N-Qs may be obtained upon request and without charge by calling 1-800-526-7384 (for Retail Shareholders) or 1-800-621-2550 (for Institutional Shareholders).
Goldman, Sachs & Co. (‘‘Goldman Sachs’’) does not provide legal, tax or accounting advice. Any statement contained in this communication (including any attachments) concerning U.S. tax matters was not intended or written to be used, and cannot be used, for the purpose of avoiding penalties under the Internal Revenue Code, and was written to support the promotion or marketing of the transaction(s) or matter(s) addressed. Clients of Goldman Sachs should obtain their own independent tax advice based on their particular circumstances.
Fund holdings and allocations shown are as of February 28, 2017 and may not be representative of future investments. Fund holdings should not be relied on in making investment decisions and should not be construed as research or investment advice regarding particular securities. Current and future holdings are subject to risk.
The Global Industry Classification Standard (GICS) was developed by and is the exclusive property and a service mark of Morgan Stanley Capital International Inc. (MSCI) and Standard & Poor’s, a division of The McGraw-Hill Companies, Inc. (S&P) and is licensed for use by Goldman Sachs. Neither MSCI, S&P nor any other party involved in making or compiling the GICS or any GICS classifications makes any express or implied warranties or representations with respect to such standard or classification (or the results to be obtained by the use thereof), and all such parties hereby expressly disclaim all warranties of originality, accuracy, completeness, merchantability or fitness for a particular purpose with respect to any of such standard or classification. Without limiting any of the foregoing, in no event shall MSCI, S&P, any of their affiliates or any third party involved in making or compiling the GICS or any GICS classifications have any liability for any direct, indirect, special, punitive, consequential or any other damages (including lost profits) even if notified of the possibility of such damages.
The portfolio risk management process includes an effort to monitor and manage risk, but does not imply low risk.
This material is not authorized for distribution to prospective investors unless preceded or accompanied by a current Prospectus or summary prospectus, if applicable. Investors should consider a Fund’s objective, risks, and charges and expenses, and read the summary prospectus, if available, and/or the Prospectus carefully before investing or sending money. The summary prospectus, if available, and the Prospectus contain this and other information about a Fund and may be obtained from your authorized dealer or from Goldman, Sachs & Co. by calling (retail – 1-800-526-7384) (institutional – 1-800-621-2550).
© 2017 Goldman Sachs. All rights reserved. 88112-TMPL-04/2017 EQGRWSAR-17/134K
Goldman Sachs Funds

| | | | |
| | |
| Semi-Annual Report | | | | February 28, 2017 |
| | |
| | | | Fundamental Equity Value Funds |
| | | | Focused Value |
| | | | Growth and Income |
| | | | Large Cap Value |
| | | | Mid Cap Value |
| | | | Small Cap Value |
| | | | Small/Mid Cap Value |

Goldman Sachs Fundamental Equity Value Funds
| | | | |
TABLE OF CONTENTS | |
| |
Investment Process | | | 1 | |
| |
Market Review | | | 2 | |
| |
Portfolio Management Discussions and Performance Summaries | | | 4 | |
| |
Schedules of Investments | | | 40 | |
| |
Financial Statements | | | 56 | |
| |
Financial Highlights | | | 64 | |
| |
Notes to Financial Statements | | | 76 | |
| |
Other Information | | | 95 | |
| | | | |
| | | |
| NOT FDIC-INSURED | | May Lose Value | | No Bank Guarantee |
GOLDMAN SACHS FUNDAMENTAL EQUITY VALUE FUNDS
What Differentiates the Goldman Sachs Fundamental Equity Value Investment Process?
Goldman Sachs’ Fundamental Equity Value Team believes that all successful investing should thoughtfully weigh two important attributes of a stock: price and prospects. Through independent fundamental research, the Team seeks to identify and invest in quality businesses that are selling at compelling valuations.


At the heart of our value investment philosophy is a belief in the rigorous analysis of business fundamentals. Our approach may include:
| ∎ | | Meetings with management teams and on-site company visits |
| ∎ | | Industry-specific, proprietary financial and valuation models |
| ∎ | | Assessment of management quality |
| ∎ | | Analysis of each company’s competitive position and industry dynamics |
| ∎ | | Interviews with competitors, suppliers and customers |

We seek to invest in companies when we believe:
| ∎ | | Market uncertainty exists |
| ∎ | | Their economic value is not recognized by the market |

We seek to buy companies with quality characteristics. For us, this means companies that have:
| ∎ | | Sustainable operating earnings, or competitive advantage |
| ∎ | | Excellent stewardship of capital |
| ∎ | | Capability to earn above their cost of capital |
| ∎ | | Strong or improving balance sheets and cash flow |

Value portfolios that strive to offer:
| | ∎ | | Capital appreciation potential as each company’s true value is recognized in the marketplace | |
| | ∎ | | Investment style consistency | |
1
MARKET REVIEW
Goldman Sachs Fundamental Equity Value Funds
Market Review
Overall, U.S. equities rallied during the six months ended February 28, 2017 (the “Reporting Period”), despite unexpected political events both domestically and abroad and a Federal Reserve (“Fed”) interest rate hike. The Standard & Poor’s 500® Index (the “S&P 500 Index”) ended the Reporting Period with a gain of 10.01%. The Russell 3000® Index generated a return of 10.29%.
As the Reporting Period began in early September 2016, U.S. and international equities alike fell as the European Central Bank disappointed markets with its lack of commitment to extend quantitative easing. However, there was a subsequent rebound following the Fed’s decision in September 2016 to leave interest rates unchanged. In October 2016, a combination of hawkish Fed commentary and mounting strong U.S. economic data led to increased market pricing for a December 2016 interest rate hike (Hawkish language or action tends to suggest higher interest rates (opposite of dovish)). U.S. GDP increased by 3.5% on an annualized basis for the third quarter of 2016, above consensus expectations and the strongest growth rate in two years. Following the unexpected victory of Donald Trump in the November 2016 U.S. presidential elections, U.S. equities quickly reversed a short-lived sell-off and surged on anticipation of a pro-growth effect of Mr. Trump’s fiscal stimulus plan. The Fed raised rates 0.25% in December 2016, for the first time in a year but as had largely been anticipated, and set a more hawkish hike path for 2017, causing equities to decline, albeit modestly, following the announcement.
U.S. equities rallied significantly in the first two months of 2017. In January 2017, markets searched for details on timing and scope behind President Trump’s campaign proclamations but rallied to new highs on the prospect of deregulation following executive orders on oil pipelines and on optimism around infrastructure spending after a $1 trillion proposal from Senate Democrats made headlines. However, U.S. equities subsequently retreated on political uncertainty and protectionism concerns following executive orders on immigration, a border wall and U.S. withdrawal from the Trans-Pacific Partnership, popularly known as TPP. Amid a busy political agenda, U.S. economic data released in January 2017 remained encouraging. Consumer sentiment set a 13-year high in the month, and non-manufacturing data remained consistent with growth in service-providing industries. Industrial production in December 2016 had recorded its biggest increase in two years, and the Philadelphia Fed’s manufacturing index also unexpectedly rose to a two-year high. Consumer prices rose in December 2016, marking a fifth straight monthly gain and signaling to many modest inflationary pressures.
In February 2017, investors continued to assess the outlook for potential tax reform, deregulation and other economic policies out of the new administration, while also heeding the tone of Fed officials. The U.S. dollar strengthened on the month, as the market-implied probability of a March 2017 interest rate hike increased with Fed Chair Yellen’s testimony before Congress and hawkish comments from other Fed officials. Economic data released during the month remained robust. U.S. non-farm payrolls for January 2017 were well above market expectations at 227,000, with particular strength in the construction industry. The Institute of Supply Management’s manufacturing and non-manufacturing indices rose to a two-year and six-year high in February 2017, respectively; U.S. consumer confidence reached a 15-year high in February 2017; and the core personal consumption expenditure index increased 1.7% year over year in January 2017, while personal spending increased a modest 0.2% month over month.
For the Reporting Period overall, financials, information technology and industrials were the best performing sectors in the S&P 500 Index by a wide margin. The weakest performing
2
MARKET REVIEW
sector in the S&P 500 Index was real estate, the only one to post a negative absolute return, followed by consumer staples, health care and energy, which were comparatively weak but generated positive returns during the Reporting Period.
Within the U.S. equity market, all capitalization segments posted positive returns, but small-cap stocks, as measured by the Russell 2000® Index, performed best, followed by large-cap stocks, as measured by the Russell 1000® Index, and then mid-cap stocks, as measured by the Russell Midcap® Index. From a style perspective, value-oriented stocks significantly outpaced growth-oriented stocks across the capitalization spectrum. (All as measured by the Russell Investments indices.)
Looking Ahead
At the end of the Reporting Period, we saw an increasingly positive backdrop for the U.S. equity markets, as the U.S. transitions to what many believe will be a pro-growth political environment. In our view, if realized, most companies should benefit from aggressive fiscal policy, including lower taxes and increased spending, and a less restrictive regulatory environment. In the near term, however, we think uncertainty around policy specifics and timing could increase volatility. While our aggregate return expectations are lower than in recent years given what we consider to be relatively full valuations, we believe U.S. equities still look more attractive than most other asset classes. Accordingly, we favor high quality, domestically-oriented companies with what we feel are strong management teams. Additionally, after several years of thematic-driven markets, we are excited about the prospect of increasing dispersion at the stock level. We believe an active approach is poised to benefit in this type of environment, as companies differentiate themselves on earnings growth and valuation.
Regardless of market direction, our fundamental, bottom-up stock selection continues to drive our process, rather than headlines or sentiment. We maintain high conviction in the companies the Funds own and believe they have the potential to outperform relative to the broader market regardless of economic growth conditions. We continue to focus on undervalued companies that we believe have comparatively greater control of their own destiny, such as innovators with differentiated products, companies with low cost structures or companies that have been investing in their own businesses and may be poised to gain market share. We maintain our discipline in identifying companies with what we believe to be strong or improving balance sheets, led by quality management teams and trading at discounted valuations. We remain focused on the long-term performance of the Funds.
As always, deep research resources, a forward-looking investment process and truly actively managed portfolios are keys, in our view, to both preserving capital and outperforming the market over the long term.
3
PORTFOLIO RESULTS
Goldman Sachs Focused Value Fund
Portfolio Composition
The Fund’s investment objective is to seek long-term capital appreciation. The Fund invests, under normal circumstances, at least 80% of its net assets plus any borrowings for investment purposes (measured at time of purchase) in a non-diversified portfolio of equity investments, including common stocks, preferred stocks and other securities and instruments having equity characteristics. The Fund seeks to achieve its investment objective by investing, under normal circumstances, in approximately 20-35 companies that are considered value opportunities, which the Investment Adviser defines as companies with identifiable competitive advantages whose intrinsic value is not reflected in the stock price. The Fund may invest in securities of companies of any capitalization. Although the Fund will invest primarily in publicly traded U.S. securities, it may invest up to 20% of its total assets in foreign securities, including securities of issuers in countries with emerging markets or economies (“emerging countries”) and securities quoted in foreign currencies. The Fund may invest in fixed income securities, such as government, corporate and bank debt obligations.
Portfolio Management Discussion and Analysis
Below, the Goldman Sachs Value Equity Investment Team discusses the Goldman Sachs Focused Value Fund’s (the “Fund”) performance and positioning for the six-month period ended February 28, 2017 (the “Reporting Period”).
| Q | | How did the Fund perform during the Reporting Period? |
| A | | During the Reporting Period, the Fund’s Class A, C, Institutional, IR, R and R6 Shares generated cumulative total returns, without sales charges, of 10.76%, 10.39%, 10.93%, 10.89%, 10.53% and 10.95%, respectively. These returns compare to the 11.07% cumulative total return of the Fund’s benchmark, the Russell 1000® Value Index (with dividends reinvested) (the “Russell Index”), during the same period. |
| Q | | What key factors were responsible for the Fund’s performance during the Reporting Period? |
| A | | The Fund produced robust absolute gains, but sector allocation overall detracted from the Fund’s performance relative to the Russell Index during the Reporting Period. Stock selection as a whole contributed positively to the Fund’s results. |
| Q | | Which equity market sectors most significantly affected Fund performance? |
| A | | The sectors that most meaningfully detracted from the Fund’s relative results during the Reporting Period were industrials, energy and telecommunication services, wherein stock selection was challenged. Having a position in cash during the Reporting Period when the Russell Index rallied also dampened relative results. Stock selection was most effective in financials and consumer discretionary, which helped the Fund’s performance relative to the Russell Index. Having no exposure to the real estate sector, which significantly lagged the Russell Index during the Reporting Period, also contributed positively. |
| Q | | Which stocks detracted significantly from the Fund’s performance during the Reporting Period? |
| A | | Detracting most from the Fund’s results relative to the Russell Index were positions in oil and gas exploration and production company Southwestern Energy, wireless telecommunications provider Verizon Communications and diversified energy company FirstEnergy. |
| | The stock price of Southwestern Energy came under pressure during the Reporting Period largely due to weak natural gas prices. Additionally, investors felt there was a lack of transparency in future guidance. At the end of the Reporting Period, we continued to see upside potential for Southwestern Energy given what we view as the company’s high quality assets, specifically in the Marcellus, Fayetteville and Utica shales. We also remained encouraged by its management team’s focus on cutting costs and divesting assets as it seeks to maintain an appropriate level of debt and by its commitment to capital efficiency amidst a challenging macro environment. |
4
PORTFOLIO RESULTS
| | Shares of Verizon Communications fell during the second half of 2016 as a sentiment shift occurred with respect to the prospects of higher interest rates in the U.S. following strong jobs data and hawkish commentary from some Federal Reserve (“Fed”) members. As the probability of an interest rate hike increased, equities with high dividend yields, such as Verizon Communications, came under pressure. Further, in January 2017, Verizon Communications reported weaker than market expected fourth quarter 2016 results and 2017 guidance amid increasing industry competition. We had originally initiated a position in the company believing its management would protect the profits of its installed base of subscribers, even in the face of an intensifying competitive environment. Although we continue to believe Verizon Communications has some of the highest quality assets in the industry, we became concerned about its management’s deviation in strategy to more aggressively pursue subscription growth at the expense of margin, and so we exited the Fund’s position. |
| | Shares of FirstEnergy came under pressure during the Reporting Period due to uncertainty about the timeline and costs of the exit of the company’s competitive generation business. We believe its stock price was implying all of the debt from the generation business would be absorbed by the parent company. However, we do not expect this scenario to materialize and believe the stock was being unfairly punished. That said, we eliminated the Fund’s position in FirstEnergy in favor of higher conviction ideas. |
| Q | | What were some of the Fund’s best-performing individual stocks? |
| A | | The Fund benefited most relative to the Russell Index from positions in global financial services company Bank of America, investment banking products and services provider Morgan Stanley and online travel company Expedia. |
| | Financial companies broadly rose following the U.S. presidential election as investor sentiment around the sector, and banks in particular, improved. Sentiment improved as investors anticipated both a more attractive regulatory environment and increases in interest rates. |
| | Additionally, on a more company-specific level, the stock price of Bank of America strengthened after the company reported revenue and earnings that exceeded consensus expectations, largely due to improved trading and investment banking growth. At the end of the Reporting Period, we believed shares of Bank of America remained attractively valued given rising U.S. interest rates and an improving U.S. economy. In our view, its management is committed to bettering execution, growing margins and returning capital to shareholders. |
| | In our view, Morgan Stanley has been emerging from a space of significant change in its business mix, a restructuring of its expense base and an improvement in its capital levels. In addition, we believe we have seen increased capital returns because of the company’s high capital levels and earnings generation. Most of Morgan Stanley’s stock price increase during the Reporting Period came following the outcome of the U.S. presidential election. The company also reported a solid third calendar quarter, driven by better capital markets activity, improved wealth management margins and controlled expenses. At the end of the Reporting Period, we maintained our conviction in the company’s management team and its future prospects. |
| | Shares of Expedia rose after strong data points were released indicating accelerating room night growth and constructive developments in HomeAway, its acquired vacation rental site. We remained confident in its management’s ability to execute on self-help initiatives, but strict to our sell discipline, we exited the position as the stock reached our risk-adjusted price target. (Room night is defined in the travel industry as one hotel room occupied for one night; a statistical unit of occupancy.) |
| Q | | How did the Fund use derivatives and similar instruments during the Reporting Period? |
| A | | During the Reporting Period, we did not use derivatives as part of an active management strategy. |
| Q | | Did the Fund make any significant purchases or sales during the Reporting Period? |
| A | | During the Reporting Period, we initiated a Fund position in Viacom, a global entertainment company, at what we viewed as an attractive valuation relative to its peers. We are constructive on the entry of a new Chief Executive Officer and on the change in management. We are also confident in its new management’s ability to execute on self-help initiatives and refocus on the company’s core networks. We have seen strong initial signs of a turnaround in core network viewership. Improvement in its cash flow profile should, we believe, allow the company to pay down debt and return capital to shareholders. |
| | We established a Fund position in Oracle, a software provider for enterprise information management. In our view, the company is well positioned to deliver on its long-term strategic goals. We are positive on the company’s high margin cloud business and believe successful migration of its customer base from on premises to cloud computing |
5
PORTFOLIO RESULTS
| | platforms should result in a more favorable business mix. Additionally, the company was trading at the time of purchase at a significant discount relative to its peers and at what we believe were attractive levels. |
| | Conversely, in addition to those sales mentioned earlier, we exited the Fund’s position in information technology giant Apple. We had originally entered the position at what we viewed as an attractive valuation relative to its peers. We believed there was significant opportunity in the upcoming product cycle within the company’s installed user base. Its shares rose after sales for the iPhone 7 exceeded market expectations. We therefore sold the position after the stock achieved our risk-adjusted price target. |
| Q | | Were there any notable changes in the Fund’s weightings during the Reporting Period? |
| A | | In constructing the Fund’s portfolio, we focus on picking stocks rather than on making industry or sector bets. We seek to outpace the benchmark index by overweighting stocks that we expect to outperform and underweighting those that we think may lag. Consequently, changes in its sector weights are generally the direct result of individual stock selection or of stock appreciation or depreciation. That said, during the Reporting Period, the Fund’s allocations compared to the Russell Index in health care, consumer discretionary, industrials, energy and consumer staples increased. The Fund also established an allocation to materials during the Reporting Period. The Fund’s exposure to the information technology and financials sectors decreased compared to the Russell Index. The Fund completely eliminated its exposure to the telecommunication services and utilities sectors and decreased its position in cash during the Reporting Period. |
| Q | | How was the Fund positioned relative to its benchmark index at the end of February 2017? |
| A | | At the end of February 2017, the Fund was overweighted in consumer discretionary, health care and information technology relative to the Russell Index. On the same date, the Fund was rather neutrally weighted to the Russell Index in financials, industrials, energy, consumer staples and materials. The Fund had no allocation to telecommunication services, utilities and real estate at the end of February 2017. |
6
FUND BASICS
Focused Value Fund
as of February 28, 2017
| | | | | | | | | | |
| | PERFORMANCE REVIEW | |
| | | September 1, 2016–February 28, 2017 | | Fund Total Return
(based on NAV)1 | | | Russell 1000®
Value Index2 | |
| | Class A | | | 10.76 | % | | | 11.07 | % |
| | Class C | | | 10.39 | | | | 11.07 | |
| | Institutional | | | 10.93 | | | | 11.07 | |
| | Class IR | | | 10.89 | | | | 11.07 | |
| | Class R | | | 10.53 | | | | 11.07 | |
| | | Class R6 | | | 10.95 | | | | 11.07 | |
| | 1 | | The net asset value (“NAV”) represents the net assets of the class of the Fund (ex-dividend) divided by the total number of shares of the class outstanding. The Fund’s performance reflects the reinvestment of dividends and other distributions. The Fund’s performance does not reflect the deduction of any applicable sales charges. |
| | 2 | | The unmanaged Russell 1000 Value Index is a market capitalization weighted index of the 1,000 largest U.S. companies with lower price-to-book ratios and lower forecasted growth values. The Index figures do not reflect any deduction of fees, expenses or taxes. It is not possible to invest directly in an unmanaged index. |
| | | | | | | | | | | | |
| | STANDARDIZED TOTAL RETURNS3 |
| | | For the period ended 12/31/16 | | Since Inception | | | Since Inception | | | Inception Date |
| | Class A | | | 8.18 | % | | | 0.05 | % | | 7/31/15 |
| | Class C | | | 12.66 | | | | 3.31 | | | 7/31/15 |
| | Institutional | | | 14.92 | | | | 4.48 | | | 7/31/15 |
| | Class IR | | | 14.77 | | | | 4.34 | | | 7/31/15 |
| | Class R | | | 14.16 | | | | 3.79 | | | 7/31/15 |
| | | Class R6 | | | 14.95 | | | | 4.50 | | | 7/31/15 |
| | 3 | | The Standardized Total Returns are average annual total returns or cumulative total returns (only if the performance period is one year or less) as of the most recent calendar quarter-end. They assume reinvestment of all distributions at NAV. These returns reflect a maximum initial sales charge of 5.5% for Class A Shares and the assumed contingent deferred sales charge for Class C Shares (1% if redeemed within 12 months of purchase). Because Institutional, Service, Class IR, Class R, and Class R6 Shares do not involve a sales charge, such a charge is not applied to their Standardized Total Returns. |
The returns set forth in the tables above represent past performance. Past performance does not guarantee future results. The Fund’s investment return and principal value will fluctuate so that an investor’s shares, when redeemed, may be worth more or less than their original cost. Current performance may be lower or higher than the performance quoted above. Please visit our web site at www.GSAMFUNDS.com to obtain the most recent month-end returns. Performance reflects fee waivers and/or expense limitations in effect during the periods shown. In their absence, performance would be reduced. Returns do not reflect the deduction of taxes that a shareholder would pay on Fund distributions or the redemption of Fund shares.
7
FUND BASICS
| | | | | | | | | | |
| | EXPENSE RATIOS4 | |
| | | | | Net Expense Ratio (Current) | | | Gross Expense Ratio (Before Waivers) | |
| | Class A | | | 1.13 | % | | | 7.70 | % |
| | Class C | | | 1.88 | | | | 8.45 | |
| | Institutional | | | 0.73 | | | | 7.30 | |
| | Class IR | | | 0.88 | | | | 7.45 | |
| | Class R | | | 1.38 | | | | 7.95 | |
| | | Class R6 | | | 0.71 | | | | 7.28 | |
| | 4 | | The expense ratios of the Fund, both current (net of applicable fee waivers and/or expense limitations) and before waivers (gross of applicable fee waivers and/or expense limitations) are as set forth above according to the most recent publicly available Prospectus for the Fund and may differ from the expense ratios disclosed in the Financial Highlights in this report. Pursuant to a contractual arrangement, the Fund’s waivers and/or expense limitations will remain in place through at least December 29, 2017, and prior to such date the investment adviser may not terminate the arrangements without the approval of the Fund’s Board of Trustees. If these arrangements are discontinued in the future, the expense ratios may change without shareholder approval. |
| | | | | | | | |
| | TOP TEN HOLDINGS AS OF 2/28/175 |
| | | Holding | | % of Net Assets | | | Line of Business |
| | Bank of America Corp. | | | 5.3 | % | | Banks |
| | Wells Fargo & Co. | | | 5.3 | | | Banks |
| | Viacom, Inc. Class B | | | 4.5 | | | Media |
| | General Electric Co. | | | 4.2 | | | Industrial Conglomerates |
| | Alphabet, Inc. Class A | | | 4.2 | | | Internet Software & Services |
| | Morgan Stanley | | | 4.2 | | | Capital Markets |
| | Oracle Corp. | | | 4.1 | | | Software |
| | ConocoPhillips | | | 4.1 | | | Oil, Gas & Consumable Fuels |
| | Eaton Corp. PLC | | | 4.0 | | | Electrical Equipment |
| | | American Express Co. | | | 3.9 | | | Consumer Finance |
| | 5 | | The top 10 holdings may not be representative of the Fund’s future investments. |
8
FUND BASICS
|
| FUND VS. BENCHMARK SECTOR ALLOCATIONS6 |
| As of February 28, 2017 |
| | 6 | | The Fund is actively managed and, as such, its composition may differ over time. Consequently, the Fund’s overall sector allocations may differ from the percentages contained in the graph above. The graph categorizes investments using the Global Industry Classification Standard (“GICS”), however, the sector classifications used by the portfolio management team may differ from GICS. The percentage shown for each investment category reflects the value of investments in that category as a percentage of market value. The graph depicts the Fund’s investments but may not represent the Fund’s market exposure due to the exclusion of certain derivatives, if any, as listed in the Additional Investment Information section of the Schedule of Investments. |
9
PORTFOLIO RESULTS
Goldman Sachs Growth and Income Fund
Portfolio Composition
Under normal circumstances, the Fund invests at least 65% of its total assets measured at the time of purchase (“Total Assets”) in equity investments that the Goldman Sachs Value Equity Investment Team considers to have favorable prospects for capital appreciation and/or dividend-paying ability. Although the Fund will invest primarily in publicly traded U.S. securities, including preferred and convertible securities, master limited partnerships (“MLPs”) and real estate investment trusts (“REITs”), it may invest up to 25% of its Total Assets in foreign securities, including securities of issuers in emerging countries and securities quoted in foreign currencies. The Fund may also invest up to 35% of its Total Assets in fixed income securities, such as government, corporate and bank debt obligations, that offer the potential to further the Fund’s investment objective of long-term capital appreciation and growth of income.
Portfolio Management Discussion and Analysis
Below, the Goldman Sachs Value Equity Investment Team discusses the Goldman Sachs Growth and Income Fund’s (the “Fund”) performance and positioning for the six-month period ended February 28, 2017 (the “Reporting Period”).
| Q | | How did the Fund perform during the Reporting Period? |
| A | | During the Reporting Period, the Fund’s Class A, C, Institutional, Service, IR, R and R6 Shares generated cumulative total returns, without sales charges, of 10.78%, 10.37%, 11.02%, 10.75%, 10.92%, 10.66% and 11.02%, respectively. These returns compare to the 11.07% cumulative total return of the Fund’s benchmark, the Russell 1000® Value Index (with dividends reinvested) (the “Russell Index”), during the same period. |
| Q | | What key factors were responsible for the Fund’s performance during the Reporting Period? |
| A | | The Fund posted solid absolute gains and both stock selection and sector allocation overall contributed positively to the Fund’s performance relative to the Russell Index during the Reporting Period. However, after fees, the Fund modestly underperformed the Russell Index on a relative basis. |
| Q | | Which equity market sectors most significantly affected Fund performance? |
| A | | Effective stock selection and positioning in the financials, real estate and energy sectors helped the Fund’s relative results most. The sectors that detracted most from the Fund’s relative results during the Reporting Period were industrials, telecommunication services and consumer discretionary, wherein stock selection proved challenging. |
| Q | | What were some of the Fund’s best-performing individual stocks? |
| A | | The Fund benefited most relative to the Russell Index from positions in Bank of America, Lincoln National and Morgan Stanley, each of the financials sector, which broadly rose following the U.S. presidential election as investor sentiment around the sector improved, particularly with respect to banks. Sentiment improved as investors anticipated both a more attractive regulatory environment and increases in interest rates. |
| | | Additionally, on a more company-specific level, the stock price of Bank of America strengthened after the company reported revenue and earnings that exceeded consensus expectations, largely due to improved trading and investment banking growth. At the end of the Reporting Period, we believed shares of Bank of America remained attractively valued given rising U.S. interest rates and an improving U.S. economy. In our view, its management is committed to bettering execution, growing margins and returning capital to shareholders. |
| | | We opportunistically initiated a position in Lincoln National following downward pressures it faced from the U.K. referendum outcome, popularly known as Brexit. In addition to its shares rising following the U.S. presidential election, its share price strengthened after the company reported strong third calendar quarter earnings that exceeded market expectations. At the end of the Reporting Period, we maintained a constructive view on Lincoln National’s |
10
PORTFOLIO RESULTS
| | strategy to shift sales to lower risk products and on what we consider to be its strong risk management practices, which we believe may well result in continued market confidence in its return on equity sustainability. Despite its recent strong performance, we also remained positive at the end of the Reporting Period on the company’s risk/reward profile due to its management’s execution and the likelihood of rising interest rates. |
| | | In our view, Morgan Stanley has been emerging from a space of significant change in its business mix, a restructuring of its expense base and an improvement in its capital levels. In addition, we believe we have seen increased capital returns because of the company’s high capital levels and earnings generation. Most of Morgan Stanley’s stock price increase during the Reporting Period came following the outcome of the U.S. presidential election. The company also reported a solid third calendar quarter, driven by better capital markets activity, improved wealth management margins and controlled expenses. At the end of the Reporting Period, we maintained our conviction in the company’s management team and its future prospects. |
| Q | | Which stocks detracted significantly from the Fund’s performance during the Reporting Period? |
| A | | Detracting most from the Fund’s results relative to the Russell Index were positions in telecommunications provider Verizon Communications, pharmaceuticals company Pfizer and industrial conglomerate General Electric. |
| | | Shares of Verizon Communications fell during the second half of 2016 as a sentiment shift occurred with respect to the prospects of higher interest rates in the U.S. following strong jobs data and hawkish commentary from some Federal Reserve (“Fed”) members. (Hawkish language tends to suggest higher interest rates; opposite of dovish.) As the probability of an interest rate hike increased, equities with high dividend yields, such as Verizon Communications, came under pressure. Further, in January 2017, Verizon Communications reported weaker than expected fourth quarter 2016 results and 2017 guidance amid increasing industry competition. Despite this underperformance, at the end of the Reporting Period, we believed Verizon Communications has some of the highest quality assets in the industry and can modestly grow should the company continue to invest in and focus on its strong wireless business and other areas poised for growth, including digital advertising, “Internet of Things” (“IoT”) and fifth generation (5G) products. In our view, the company remains a strong franchise with a stable operating business model and an improving free cash flow profile. (The IoT is the inter-networking of physical devices, connected or smart devices, buildings and other items — embedded with electronics, software, sensors, actuators and network connectivity that enable these objects to collect and exchange data.) |
| | | Pfizer’s stock came under pressure after its management announced that, despite much speculation, it would not split into two companies. Some investors believed its stock price was accounting for the potential increase in profits as a result of a split. Additionally, investors began to raise concerns about increased competition, pricing pressure and drug pipeline uncertainty. In our view, the company’s pipeline was undervalued at the end of the Reporting Period, and we expected its management to continue to highlight its value through clinical success. We also believe Pfizer has a strong balance sheet, which may provide the company with the financial flexibility to invest for growth and return capital to shareholders. |
| | | Shares of General Electric were pressured after the company reported several consecutive quarters of weaker industrial revenues, predominantly driven by its power and transport business as well as by oil and gas headwinds. Despite its recent weaker performance, at the end of the Reporting Period, we believed General Electric remained a high quality franchise with dominant market position. In our view, the company has made great progress in divesting its non-core assets and in re-focusing on its core industrial roots. Furthermore, the business generates high free cash flow with an under-levered balance sheet. However, in light of its recent challenges, we reduced the Fund’s position in General Electric. |
| Q | | How did the Fund use derivatives and similar instruments during the Reporting Period? |
| A | | During the Reporting Period, we did not use derivatives as part of an active management strategy. |
| Q | | Did the Fund make any significant purchases or sales during the Reporting Period? |
| A | | During the Reporting Period, we initiated a Fund position in AvalonBay Communities, an owner of high-end apartments in coastal markets, such as New York City, Washington D.C. and California. We believe AvalonBay Communities has a well diversified portfolio of high quality properties located in both urban and suburban areas. We are also positive on AvalonBay Communities’ well-funded pipeline, which we |
11
PORTFOLIO RESULTS
| | believe could lead to strong future earnings. In addition, in our view, the company has a solid balance sheet, a well-covered dividend and a long history of good capital allocation. |
| | | We established a Fund position in Invesco, a global investment management firm. We are positive on the active management component of the business and see further upside potential given the possibility of a more favorable regulatory environment. Invesco has an attractive relative valuation and strong balance sheet, in our view, which leads us to believe its stock could continue to perform well. Additionally, we have confidence in its management team given its strong performance track record. |
| | | Conversely, we exited the Fund’s position in Williams- Sonoma, a home furnishing specialty retailer. The company faced increasingly strong headwinds from new online competition along with a sluggish retail environment. Additionally, in August 2016, Williams-Sonoma cut its full- year guidance due to weakening sales trends. Finally, big ticket purchases slowed at Williams-Sonoma’s Pottery Barn brand for the first time since 2008, which we believe may well be a negative indicator for the higher ticket discretionary purchases in the industry more broadly. In light of these headwinds, we sold the Fund’s position in Williams-Sonoma in favor of higher conviction opportunities. |
| | | We eliminated the Fund’s position in Comcast, a broadband cable and media company. Its stock price significantly increased during the Reporting Period, particularly following the U.S. presidential election. We believe Comcast is a high quality company that provides on-demand content, innovates well and has outperformed despite cord-cutting trends. (Cord-cutting is the practice of canceling or forgoing a cable television subscription or landline telephone connection in favor of an alternative Internet-based or wireless service.) We are especially constructive on the company’s business model, which emphasizes diversification across content and distribution channels. However, as our investment thesis was realized and as shares approached our price target, we exited the position in favor of stocks having what we considered to be better risk-adjusted return potential. |
| Q | | Were there any notable changes in the Fund’s weightings during the Reporting Period? |
| A | | In constructing the Fund’s portfolio, we focus on picking stocks rather than on making industry or sector bets. We seek to outpace the benchmark index by overweighting stocks that we expect to outperform and underweighting those that we think may lag. Consequently, changes in its sector weights are generally the direct result of individual stock selection or of stock appreciation or depreciation. That said, during the Reporting Period, the Fund’s allocations compared to the Russell Index in consumer staples, financials and industrials increased. The Fund’s exposure to consumer discretionary, telecommunication services and utilities decreased compared to the Russell Index as did its position in cash. |
| Q | | How was the Fund positioned relative to its benchmark index at the end of February 2017? |
| A | | At the end of February 2017, the Fund had overweighted positions relative to the Russell Index in the consumer staples, financials and information technology sectors. On the same date, the Fund had underweighted positions compared to the Russell Index in real estate and energy and was rather neutrally weighted to the Russell Index in consumer discretionary, health care, industrials, materials, telecommunication services and utilities. |
12
FUND BASICS
Growth and Income Fund
as of February 28, 2017
| | | | | | | | | | |
| | PERFORMANCE REVIEW | |
| | | September 1, 2016–February 28, 2017 | | Fund Total Return (based on NAV)1 | | | Russell 1000® Value Index2 | |
| | Class A | | | 10.78 | % | | | 11.07 | % |
| | Class C | | | 10.37 | | | | 11.07 | |
| | Institutional | | | 11.02 | | | | 11.07 | |
| | Service | | | 10.75 | | | | 11.07 | |
| | Class IR | | | 10.92 | | | | 11.07 | |
| | Class R | | | 10.66 | | | | 11.07 | |
| | | Class R6 | | | 11.02 | | | | 11.07 | |
| | 1 | | The net asset value (“NAV”) represents the net assets of the class of the Fund (ex-dividend) divided by the total number of shares of the class outstanding. The Fund’s performance reflects the reinvestment of dividends and other distributions. The Fund’s performance does not reflect the deduction of any applicable sales charges. |
| | 2 | | The unmanaged Russell 1000 Value Index is a market capitalization weighted index of the 1,000 largest U.S. companies with lower price-to-book ratios and lower forecasted growth values. The Index figures do not reflect any deduction of fees, expenses or taxes. It is not possible to invest directly in an unmanaged index. |
| | | | | | | | | | | | | | | | | | | | |
| | STANDARDIZED TOTAL RETURNS3 |
| | | For the period ended 12/31/16 | | One Year | | | Five Years | | | Ten Years | | | Since Inception | | | Inception Date |
| | Class A | | | 7.01 | % | | | 12.82 | % | | | 3.82 | % | | | 6.93 | % | | 2/5/93 |
| | Class C | | | 11.33 | | | | 13.24 | | | | 3.63 | | | | 3.22 | | | 8/15/97 |
| | Institutional | | | 13.64 | | | | 14.56 | | | | 4.82 | | | | 6.18 | | | 6/3/96 |
| | Service | | | 13.07 | | | | 13.99 | | | | 4.31 | | | | 5.73 | | | 3/6/96 |
| | Class IR | | | 13.46 | | | | 14.38 | | | | N/A | | | | 4.92 | | | 11/30/07 |
| | Class R | | | 12.91 | | | | 13.82 | | | | N/A | | | | 4.40 | | | 11/30/07 |
| | | Class R6 | | | 13.68 | | | | N/A | | | | N/A | | | | 6.20 | | | 7/31/15 |
| | 3 | | The Standardized Total Returns are average annual total returns or cumulative total returns (only if the performance period is one year or less) as of the most recent calendar quarter-end. They assume reinvestment of all distributions at NAV. These returns reflect a maximum initial sales charge of 5.5% for Class A Shares and the assumed contingent deferred sales charge for Class C Shares (1% if redeemed within 12 months of purchase). Because Institutional, Service, Class IR, Class R, and Class R6 Shares do not involve a sales charge, such a charge is not applied to their Standardized Total Returns. |
The returns set forth in the tables above represent past performance. Past performance does not guarantee future results. The Fund’s investment return and principal value will fluctuate so that an investor’s shares, when redeemed, may be worth more or less than their original cost. Current performance may be lower or higher than the performance quoted above. Please visit our web site at www.GSAMFUNDS.com to obtain the most recent month-end returns. Performance reflects fee waivers and/or expense limitations in effect during the periods shown. In their absence, performance would be reduced. Returns do not reflect the deduction of taxes that a shareholder would pay on Fund distributions or the redemption of Fund shares.
13
FUND BASICS
| | | | | | | | | | |
| | EXPENSE RATIOS4 | |
| | | | | Net Expense Ratio (Current) | | | Gross Expense Ratio (Before Waivers) | |
| | Class A | | | 1.14 | % | | | 1.27 | % |
| | Class C | | | 1.89 | | | | 2.02 | |
| | Institutional | | | 0.74 | | | | 0.87 | |
| | Service | | | 1.24 | | | | 1.37 | |
| | Class IR | | | 0.89 | | | | 1.02 | |
| | Class R | | | 1.39 | | | | 1.52 | |
| | | Class R6 | | | 0.74 | | | | 0.87 | |
| | 4 | | The expense ratios of the Fund, both current (net of applicable fee waivers and/or expense limitations) and before waivers (gross of applicable fee waivers and/or expense limitations) are as set forth above according to the most recent publicly available Prospectus for the Fund and may differ from the expense ratios disclosed in the Financial Highlights in this report. Pursuant to a contractual arrangement, the Fund’s waivers and/or expense limitations will remain in place through at least December 29, 2017, and prior to such date the investment adviser may not terminate the arrangements without the approval of the Fund’s Board of Trustees. If these arrangements are discontinued in the future, the expense ratios may change without shareholder approval. |
| | | | | | | | |
| | TOP TEN HOLDINGS AS OF 2/28/175 |
| | | Holding | | % of Net Assets | | | Line of Business |
| | Wells Fargo & Co. | | | 5.7 | % | | Banks |
| | Pfizer, Inc. | | | 4.5 | | | Pharmaceuticals |
| | Bank of America Corp. | | | 4.3 | | | Banks |
| | JPMorgan Chase & Co. | | | 4.0 | | | Banks |
| | General Electric Co. | | | 3.3 | | | Industrial Conglomerates |
| | The Procter & Gamble Co. | | | 3.1 | | | Household Products |
| | Cisco Systems, Inc. | | | 3.0 | | | Communications Equipment |
| | Exxon Mobil Corp. | | | 2.9 | | | Oil, Gas & Consumable Fuels |
| | ConocoPhillips | | | 2.9 | | | Oil, Gas & Consumable Fuels |
| | | Verizon Communications, Inc. | | | 2.8 | | | Diversified Telecommunication Services |
| | 5 | | The top 10 holdings may not be representative of the Fund’s future investments. |
14
FUND BASICS
|
| FUND VS. BENCHMARK SECTOR ALLOCATIONS6 |
| As of February 28, 2017 |
| | 6 | | The Fund is actively managed and, as such, its composition may differ over time. Consequently, the Fund’s overall sector allocations may differ from the percentages contained in the graph above. The graph categorizes investments using the Global Industry Classification Standard (“GICS”), however, the sector classifications used by the portfolio management team may differ from GICS. The percentage shown for each investment category reflects the value of investments in that category as a percentage of market value. The graph depicts the Fund’s investments but may not represent the Fund’s market exposure due to the exclusion of certain derivatives, if any, as listed in the Additional Investment Information section of the Schedule of Investments. |
15
PORTFOLIO RESULTS
Goldman Sachs Large Cap Value Fund
Portfolio Composition
The Fund invests, under normal circumstances, at least 80% of its net assets plus any borrowings for investment purposes (measured at the time of purchase) (“Net Assets”) in a diversified portfolio of equity investments in large-cap issuers with public stock market capitalizations within the range of the market capitalization of companies constituting the Russell 1000® Value Index at the time of investment. The Fund seeks its investment objective of long-term capital appreciation by investing in value opportunities that the Goldman Sachs Value Equity Investment Team defines as companies with identifiable competitive advantages whose intrinsic value is not reflected in the stock price. Although the Fund will invest primarily in publicly traded U.S. securities, it may invest up to 20% of its Net Assets in foreign securities, including securities quoted in foreign currencies. The Fund may also invest in the aggregate up to 20% of its Net Assets in fixed income securities, such as government, corporate and bank debt obligations.
Portfolio Management Discussion and Analysis
Below, the Goldman Sachs Value Equity Investment Team discusses the Goldman Sachs Large Cap Value Fund’s (the “Fund”) performance and positioning for the six-month period ended February 28, 2017 (the “Reporting Period”).
| Q | | How did the Fund perform during the Reporting Period? |
| A | | During the Reporting Period, the Fund’s Class A, C, Institutional, Service, IR, R and R6 Shares generated cumulative total returns, without sales charges, of 9.93%, 9.49%, 10.10%, 9.82%, 10.02%, 9.76% and 10.13%, respectively. These returns compare to the 11.07% cumulative total return of the Fund’s benchmark, the Russell 1000® Value Index (with dividends reinvested) (the “Russell Index”), during the same period. |
| Q | | What key factors were responsible for the Fund’s performance during the Reporting Period? |
| A | | The Fund generated solid absolute gains, but stock selection and sector allocation overall detracted from the Fund’s performance relative to the Russell Index during the Reporting Period. |
| Q | | Which equity market sectors most significantly affected Fund performance? |
| A | | Detracting most from the Fund’s performance relative to the Russell Index were industrials, energy and consumer discretionary, wherein stock selection was comparatively weak. Having an allocation to cash during a Reporting Period when the Russell Index rallied further dampened the Fund’s relative results. Effective stock selection in the financials and real estate sectors and having underweighted allocations to the real estate and consumer staples sectors, each of which lagged the Russell Index during the Reporting Period, contributed positively. |
| Q | | Which stocks detracted significantly from the Fund’s performance during the Reporting Period? |
| A | | Detracting most from the Fund’s results relative to the Russell Index were positions in oil and gas exploration and production companies Southwestern Energy and Range Resources and in wireless telecommunications provider Verizon Communications. |
| | | The stock price of Southwestern Energy came under pressure during the Reporting Period largely due to weak natural gas prices. Additionally, investors felt there was a lack of transparency in future guidance. At the end of the Reporting Period, we continued to see upside potential for Southwestern Energy given what we view as the company’s high quality assets, specifically in the Marcellus, Fayetteville and Utica shales. We also remained encouraged by its management team’s focus on cutting costs and divesting assets as it seeks to maintain an appropriate level of debt and by its commitment to capital efficiency amidst a challenging macro environment. |
| | | Weak natural gas prices were the primary driver behind weakness in the stock of Range Resources. There were also investor concerns about the potential effect of long-term |
16
PORTFOLIO RESULTS
| | increases in oil production. At the end of the Reporting Period, we viewed Range Resources positively given what we consider to be its high quality assets, particularly in the Marcellus Basin. We also remained constructive on Range Resource’s management team and believed the company’s low cost of production relative to its peers left room for substantial organic growth potential. |
| | | Shares of Verizon Communications fell during the second half of 2016 as a sentiment shift occurred with respect to the prospects of higher interest rates in the U.S. following strong jobs data and hawkish commentary from some Federal Reserve (“Fed”) members. (Hawkish language tends to suggest higher interest rates; opposite of dovish.) As the probability of an interest rate hike increased, equities with high dividend yields, such as Verizon Communications, came under pressure. Further, in January 2017, Verizon Communications reported weaker than expected fourth quarter 2016 results and 2017 guidance amid increasing industry competition. Despite this underperformance, at the end of the Reporting Period, we believed Verizon Communications has some of the highest quality assets in the industry and can modestly grow should the company continue to invest in and focus on its strong wireless business and other areas poised for growth, including digital advertising, “Internet of Things” (“IoT”) and fifth generation (5G) products. In our view, the company remains a strong franchise with a stable operating business model and an improving free cash flow profile. (The IoT is the inter-networking of physical devices, connected or smart devices, buildings and other items — embedded with electronics, software, sensors, actuators, and network connectivity that enable these objects to collect and exchange data.) |
| Q | | What were some of the Fund’s best-performing individual stocks? |
| A | | The Fund benefited most relative to the Russell Index from positions in Bank of America, Lincoln National and Morgan Stanley, each of the financials sector, which broadly rose following the U.S. presidential election as investor sentiment around the sector improved, particularly with respect to banks. Sentiment improved as investors anticipated both a more attractive regulatory environment and increases in interest rates. |
| | Additionally, on a more company-specific level, the stock price of Bank of America strengthened after the company reported revenue and earnings that exceeded consensus expectations, largely due to improved trading and investment banking growth. At the end of the Reporting Period, we believed shares of Bank of America remained attractively valued given rising U.S. interest rates and an improving U.S. economy. In our view, its management is committed to bettering execution, growing margins and returning capital to shareholders. |
| | We opportunistically initiated a position in Lincoln National following downward pressures it faced from the U.K. referendum outcome, popularly known as Brexit. In addition to its shares rising following the U.S. presidential election, its share price strengthened after the company reported strong third calendar quarter earnings that exceeded market expectations. At the end of the Reporting Period, we maintained a constructive view on Lincoln National’s strategy to shift sales to lower risk products and on what we consider to be its strong risk management practices, which we believe may well result in continued market confidence in its return on equity sustainability. Despite its recent strong performance, we also remained positive at the end of the Reporting Period on the company’s risk/reward profile due to its management’s execution and the likelihood of rising interest rates. |
| | In our view, Morgan Stanley has been emerging from a space of significant change in its business mix, a restructuring of its expense base and an improvement in its capital levels. In addition, we believe we have seen increased capital returns because of the company’s high capital levels and earnings generation. Most of Morgan Stanley’s stock price increase during the Reporting Period came following the outcome of the U.S. presidential election. The company also reported a solid third calendar quarter, driven by better capital markets activity, improved wealth management margins and controlled expenses. At the end of the Reporting Period, we maintained our conviction in the company’s management team and its future prospects. |
| Q | | How did the Fund use derivatives and similar instruments during the Reporting Period? |
| A | | During the Reporting Period, we did not use derivatives as part of an active management strategy. |
| Q | | Did the Fund make any significant purchases or sales during the Reporting Period? |
| A | | We established a Fund position in Altria Group, a tobacco company. We are constructive on strong industry fundamentals and view the availability of Altria’s iQOS |
17
PORTFOLIO RESULTS
| | product, a new type of electronic smokeless cigarette, as a strong catalyst. We expect iQOS to receive Food and Drug Administration (“FDA”) approval for sale in the U.S. this year and believe the product’s purported healthier approach to tobacco usage could grant it significant domestic market share. The product has already seen success in international markets where it has received approval. |
| | We initiated a Fund position in Invesco, a global investment management firm. We are positive on the active management component of the business and see further upside potential given the improved investor sentiment for a more favorable regulatory environment. Invesco has what we consider to be a strong relative valuation and balance sheet, which leads us to believe its stock may continue to perform well. Additionally, we have confidence in its management team given its strong performance track record. |
| | Conversely, we exited the Fund’s position in Procter & Gamble. Its shares rose sharply after activist investor Trian took a significant stake in the company. We are unclear as to what the activist investor plans to accomplish but do not expect a break-up of the company to unlock significant value. |
| | We sold the Fund’s position in United Technologies, an industrial conglomerate. We originally initiated a position in the company due to our view that its shares were undervalued given future growth and margin expansion opportunities for the company. Additionally, we were constructive on its new management team and its focus on cost cutting efforts, divestitures and share repurchases. As our investment thesis was realized and as its shares approached our price target, we exited the position in favor of opportunities that we believed to have better risk-adjusted return potential. |
| Q | | Were there any notable changes in the Fund’s weightings during the Reporting Period? |
| A | | In constructing the Fund’s portfolio, we focus on picking stocks rather than on making industry or sector bets. We seek to outpace the benchmark index by overweighting stocks that we expect to outperform and underweighting those that we think may lag. Consequently, changes in its sector weights are generally the direct result of individual stock selection or of stock appreciation or depreciation. That said, during the Reporting Period, the Fund’s allocations compared to the Russell Index in industrials and consumer discretionary increased. The Fund’s exposure to information technology, financials, utilities and telecommunication services decreased compared to the Russell Index. |
| Q | | How was the Fund positioned relative to its benchmark index at the end of February 2017? |
| A | | At the end of February 2017, the Fund had overweighted positions relative to the Russell Index in the health care, consumer discretionary, industrials and information technology sectors. On the same date, the Fund had underweighted positions compared to the Russell Index in utilities, telecommunication services and real estate, and was rather neutrally weighted to the Russell Index in financials, materials, energy and consumer staples |
18
FUND BASICS
Large Cap Value Fund
as of February 28, 2017
| | | | | | | | | | |
| | PERFORMANCE REVIEW | |
| | | September 1, 2016–February 29, 2017 | | Fund Total Return
(based on NAV)1 | | | Russell 1000®
Value Index2 | |
| | Class A | | | 9.93 | % | | | 11.07 | % |
| | Class C | | | 9.49 | | | | 11.07 | |
| | Institutional | | | 10.10 | | | | 11.07 | |
| | Service | | | 9.82 | | | | 11.07 | |
| | Class IR | | | 10.02 | | | | 11.07 | |
| | Class R | | | 9.76 | | | | 11.07 | |
| | | Class R6 | | | 10.13 | | | | 11.07 | |
| | 1 | | The net asset value (“NAV”) represents the net assets of the class of the Fund (ex-dividend) divided by the total number of shares of the class outstanding. The Fund’s performance reflects the reinvestment of dividends and other distributions. The Fund’s performance does not reflect the deduction of any applicable sales charges. |
| | 2 | | The unmanaged Russell 1000 Value Index is a market capitalization weighted index of the 1,000 largest U.S. companies with lower price-to-book ratios and lower forecasted growth values. The Index figures do not reflect any deduction of fees, expenses or taxes. It is not possible to invest directly in an unmanaged index. |
| | | | | | | | | | | | | | | | | | | | |
| | STANDARDIZED TOTAL RETURNS3 |
| | | For the period ended 12/31/16 | | One Year | | | Five Years | | | Ten Years | | | Since Inception | | | Inception Date |
| | Class A | | | 5.16 | % | | | 12.19 | % | | | 4.06 | % | | | 5.60 | % | | 12/15/99 |
| | Class C | | | 9.35 | | | | 12.63 | | | | 3.87 | | | | 5.15 | | | 12/15/99 |
| | Institutional | | | 11.66 | | | | 13.92 | | | | 5.06 | | | | 6.36 | | | 12/15/99 |
| | Service | | | 11.11 | | | | 13.36 | | | | 4.54 | | | | 5.87 | | | 12/15/99 |
| | Class IR | | | 11.52 | | | | 13.75 | | | | N/A | | | | 5.02 | | | 11/30/07 |
| | Class R | | | 10.99 | | | | 13.19 | | | | N/A | | | | 4.52 | | | 11/30/07 |
| | | Class R6 | | | 11.69 | | | | N/A | | | | N/A | | | | 4.30 | | | 7/31/15 |
| | 3 | | The Standardized Total Returns are average annual total returns or cumulative total returns (only if the performance period is one year or less) as of the most recent calendar quarter-end. They assume reinvestment of all distributions at NAV. These returns reflect a maximum initial sales charge of 5.5% for Class A Shares and the assumed contingent deferred sales charge for Class C Shares (1% if redeemed within 12 months of purchase). Because Institutional, Service, Class IR, Class R, and Class R6 Shares do not involve a sales charge, such a charge is not applied to their Standardized Total Returns. |
The returns set forth in the tables above represent past performance. Past performance does not guarantee future results. The Fund’s investment return and principal value will fluctuate so that an investor’s shares, when redeemed, may be worth more or less than their original cost. Current performance may be lower or higher than the performance quoted above. Please visit our web site at www.GSAMFUNDS.com to obtain the most recent month-end returns. Performance reflects fee waivers and/or expense limitations in effect during the periods shown. In their absence, performance would be reduced. Returns do not reflect the deduction of taxes that a shareholder would pay on Fund distributions or the redemption of Fund shares.
19
FUND BASICS
| | | | | | | | | | |
| | EXPENSE RATIOS4 | |
| | | | | Net Expense Ratio (Current) | | | Gross Expense Ratio (Before Waivers) | |
| | Class A | | | 1.12 | % | | | 1.23 | % |
| | Class C | | | 1.87 | | | | 1.98 | |
| | Institutional | | | 0.79 | | | | 0.83 | |
| | Service | | | 1.29 | | | | 1.33 | |
| | Class IR | | | 0.87 | | | | 0.98 | |
| | Class R | | | 1.37 | | | | 1.48 | |
| | | Class R6 | | | 0.77 | | | | 0.81 | |
| | 4 | | The expense ratios of the Fund, both current (net of applicable fee waivers and/or expense limitations) and before waivers (gross of applicable fee waivers and/or expense limitations) are as set forth above according to the most recent publicly available Prospectus for the Fund and may differ from the expense ratios disclosed in the Financial Highlights in this report. Pursuant to a contractual arrangement, the Fund’s waivers and/or expense limitations will remain in place through at least December 29, 2017, and prior to such date the investment adviser may not terminate the arrangements without the approval of the Fund’s Board of Trustees. If these arrangements are discontinued in the future, the expense ratios may change without shareholder approval. |
| | | | | | | | |
| | TOP TEN HOLDINGS AS OF 2/28/175 |
| | | Holding | | % of Net Assets | | | Line of Business |
| | Wells Fargo & Co. | | | 5.4 | % | | Banks |
| | Bank of America Corp. | | | 5.2 | | | Banks |
| | JPMorgan Chase & Co. | | | 3.8 | | | Banks |
| | Pfizer, Inc. | | | 3.1 | | | Pharmaceuticals |
| | Oracle Corp. | | | 2.7 | | | Software |
| | General Electric Co. | | | 2.5 | | | Industrial Conglomerates |
| | Union Pacific Corp. | | | 2.4 | | | Road & Rail |
| | Allergan PLC | | | 2.4 | | | Pharmaceuticals |
| | Exxon Mobil Corp. | | | 2.4 | | | Oil, Gas & Consumable Fuels |
| | | American Express Co. | | | 2.4 | | | Consumer Finance |
| | 5 | | The top 10 holdings may not be representative of the Fund’s future investments. |
20
FUND BASICS
|
| FUND VS. BENCHMARK SECTOR ALLOCATIONS6 |
| As of February 28, 2017 |
| | 6 | | The Fund is actively managed and, as such, its composition may differ over time. Consequently, the Fund’s overall sector allocations may differ from the percentages contained in the graph above. The graph categorizes investments using the Global Industry Classification Standard (“GICS”), however, the sector classifications used by the portfolio management team may differ from GICS. The percentage shown for each investment category reflects the value of investments in that category as a percentage of market value. The graph depicts the Fund’s investments but may not represent the Fund’s market exposure due to the exclusion of certain derivatives, if any, as listed in the Additional Investment Information section of the Schedule of Investments. |
21
PORTFOLIO RESULTS
Goldman Sachs Mid Cap Value Fund
Portfolio Composition
The Fund invests, under normal circumstances, at least 80% of its net assets plus any borrowings for investment purposes (measured at the time of purchase) (“Net Assets”) in a diversified portfolio of equity investments in mid-cap issuers with public stock market capitalizations within the range of the market capitalization of companies constituting the Russell Midcap® Value Index at the time of investment. The Fund seeks its investment objective of long-term capital appreciation by investing in value opportunities that the Goldman Sachs Value Equity Investment Team defines as companies with identifiable competitive advantages whose intrinsic value is not reflected in the stock price. Although the Fund will invest primarily in publicly traded U.S. securities, it may invest up to 25% of its Net Assets in foreign securities, including securities of issuers in emerging countries and securities quoted in foreign currencies. The Fund may also invest in the aggregate up to 20% of its Net Assets in companies with public stock market capitalizations outside the range of companies constituting the Russell Midcap® Value Index at the time of investment and in fixed income securities, such as government, corporate and bank debt obligations.
Portfolio Management Discussion and Analysis
Below, the Goldman Sachs Value Equity Investment Team discusses the Goldman Sachs Mid Cap Value Fund’s (the “Fund”) performance and positioning for the six-month period ended February 28, 2017 (the “Reporting Period”).
| Q | | How did the Fund perform during the Reporting Period? |
| A | | During the Reporting Period, the Fund’s Class A, C, Institutional, Service, IR, R and R6 Shares generated cumulative total returns, without sales charges, of 9.49%, 9.11%, 9.75%, 9.48%, 9.65%, 9.40% and 9.73%, respectively. These returns compare to the 10.76% cumulative total return of the Fund’s benchmark, the Russell Midcap® Value Index (with dividends reinvested) (the “Russell Index”), during the same period. |
| Q | | What key factors were responsible for the Fund’s performance during the Reporting Period? |
| A | | The Fund posted solid positive absolute returns, but sector allocation overall detracted from the Fund’s performance relative to the Russell Index during the Reporting Period. Stock selection as a whole also detracted, albeit more modestly, from the Fund’s results. |
| Q | | Which equity market sectors most significantly affected Fund performance? |
| A | | Detracting from the Fund’s performance most relative to the Russell Index was stock selection in industrials, consumer discretionary, energy and real estate. Stock selection and having an overweighted allocation to health care, which lagged the Russell Index during the Reporting Period, also hurt. Having a position in cash during a Reporting Period when the Russell Index rallied further dampened relative results. Partially offsetting these detractors was effective stock selection in the financials, materials, telecommunication services and information technology sectors, which contributed positively. |
| Q | | Which stocks detracted significantly from the Fund’s performance during the Reporting Period? |
| A | | Detracting most from the Fund’s results relative to the Russell Index were positions in Brixmor Property Group, DDR and L Brands. |
| | | Brixmor Property Group, an owner of grocery-anchored community shopping centers, was the top detractor from the Fund’s relative results during the Reporting Period. We believe its underperformance of the Russell Index was largely due to investor concerns about disappointing retail industry sales and the potential impact on Brixmor Property Group’s tenants. In our view, these fears were overblown, especially given the company’s base in what we consider to be high quality grocery-anchored shopping centers. Overall, at the end of the Reporting Period, we remained positive on Brixmor Property Group’s long-term growth potential as well as the company’s portfolio of assets, since we believe fundamentals in the industry remained healthy. For example, supply, relative to historical levels, was low, and demand remained strong. Finally, we were encouraged by its management’s focus on high return redevelopment projects and improving the company’s balance sheet. |
22
PORTFOLIO RESULTS
| | | DDR, an owner of shopping centers in the U.S. and Puerto Rico, was also a significant detractor from the Fund’s relative results during the Reporting Period. While the broader real estate sector declined during the Reporting Period, we believe DDR’s underperformance of the Russell Index was exacerbated by uncertainty relative to its new Chief Executive Officer and the outcome of strategic measures being taken by the company. Despite a challenging Reporting Period, we believed at the end of the Reporting Period that shares of DDR were trading at a substantial discount relative to the company’s private market value. Additionally, we maintained confidence in DDR’s new leadership, as we believe they are highly motivated and focused on improving the business’ operational performance over the long term. |
| | | Shares of L Brands, a global retailer that operates primarily through Victoria’s Secret and Bath & Body Works, declined during the Reporting Period. The majority of its underperformance relative to the Russell Index came after the company lowered its first fiscal quarter and fiscal year earnings guidance. Despite these headwinds, L Brands remains the category leader within the lingerie and personal care and beauty markets. Restructuring actions undertaken during the Reporting Period aimed at simplifying the Victoria’s Secret business resulted in increased uncertainty amongst investors around the core health of the franchise. However, we believe this was largely self-inflicted and not an indication of a structural breakdown in the business. While we remained constructive at the end of the Reporting Period on its management team’s ability to execute, we moderated the Fund’s position in L Brands in an effort to improve the portfolio’s risk/reward profile. |
| Q | | What were some of the Fund’s best-performing individual stocks? |
| A | | The Fund benefited most relative to the Russell Index from positions in SLM, Citizens Financial Group and Huntington Bancshares, each of the financials sector. |
| | | SLM, a company that provides funding and servicing for student loans, commonly known as Sallie Mae, was the top positive contributor to the Fund’s results during the Reporting Period. We had invested in SLM because we felt the company had strong and highly visible growth, a dominant position in a market with high barriers to entry and a new Chief Executive Officer with a track record of success at other companies. Despite solid performance at SLM, perceived political risk weighed heavily on the stock ahead of the U.S. presidential election. Its shares subsequently spiked following the election results, and sentiment continued to improve as investors anticipated a more attractive regulatory environment for SLM. At the end of the Reporting Period, we continued to see upside potential for the company and opportunities for future growth. |
| | | Shares of Citizens Financial Group, a consumer and commercial banking company, rose sharply following the U.S. presidential election, as sentiment around the financials sector broadly, and regional banks in particular, improved. At the end of the Reporting Period, we remained positive on its management team’s commitment to creating shareholder value and improving the bank’s operational efficiency through its cost savings program. Additionally, in light of the U.S. presidential election results, we believe Citizens Financial Group could benefit from a less restrictive regulatory environment. |
| | | Shares of Huntington Bancshares, a financial services company, similarly spiked following the U.S. presidential election results. Sentiment continued to improve in the last months of the Reporting Period as investors anticipated a more attractive regulatory environment and increases in interest rates. We believe the company has a solid management team that seems to be committed to doing what we consider to be the right things — i.e. setting up incentives that align with shareholders, committing to annual operating leverage regardless of interest rates, making prudent decisions for the long term and utilizing excess capital judiciously. In our view, we should see an efficiency improvement as revenues start to catch up with expenses following an investment phase by the company. Additionally, the company has been aggressive in getting ahead of regulation, which we believe could lead to a smaller revenue impact versus its peers when regulations are written. |
| Q | | How did the Fund use derivatives and similar instruments during the Reporting Period? |
| A | | During the Reporting Period, we did not use derivatives as part of an active management strategy. |
| Q | | Did the Fund make any significant purchases or sales during the Reporting Period? |
| A | | We initiated a Fund position in SunTrust Banks, a bank holding company based in Atlanta, Georgia. We are positive on what we consider to be SunTrust Banks’ attractive relative valuation and its broad footprint in the fast-growing southeastern U.S. We also are encouraged by its management’s execution on plans to improve its capital efficiency. |
23
PORTFOLIO RESULTS
| | | We established a Fund position in Ameriprise Financial, a financial services company primarily focused on wealth management and retirement planning. We are constructive on Ameriprise Financial and see upside potential given the widespread improved sentiment for a more favorable regulatory environment. We also believe its management is likely to continue its strong track record of distributing capital to shareholders. |
| | | Conversely, we sold the Fund’s position in Pentair, a diversified industrial company. We were positive on Pentair’s plan to improve margins and operational efficiency. Additionally, in our view, the sale of its valves and controls business improved the company’s capital structure and resulted in a simpler business model with high quality construction and water businesses, areas we viewed as the most compelling for growth. Following the U.S. presidential election results, however, we became increasingly concerned that U.K.-based Pentair could be negatively affected by proposed changes to the U.S. tax code. We chose to transition the capital from the sale of Pentair to industrials companies with higher U.S. exposure. |
| | | We exited the Fund’s position in Ingersoll-Rand, a diversified, global company that provides products and services to help improve air quality, transport food and increase industrial production. We had initiated this Fund position as we believed the company would benefit from an improving outlook for non-residential construction, potential share gains in residential construction, and proprietary investments in technology systems. As our investment thesis began to be realized, we sold the stock in favor of other names we believed to have greater upside potential. |
| Q | | Were there any notable changes in the Fund’s weightings during the Reporting Period? |
| A | | In constructing the Fund’s portfolio, we focus on picking stocks rather than on making industry or sector bets. We seek to outpace the benchmark index by overweighting stocks that we expect to outperform and underweighting those that we think may lag. Consequently, changes in its sector weights are generally the direct result of individual stock selection or of stock appreciation or depreciation. That said, during the Reporting Period, the Fund’s allocations compared to the Russell Index in industrials increased. The Fund’s exposure to the health care and financials sectors decreased compared to the Russell Index. |
| Q | | How was the Fund positioned relative to its benchmark index at the end of February 2017? |
| A | | At the end of February 2017, the Fund had overweighted positions relative to the Russell Index in the industrials, energy and health care sectors. On the same date, the Fund had underweighted positions compared to the Russell Index in utilities, real estate and telecommunication services and was rather neutrally weighted to the Russell Index in financials, consumer discretionary, information technology, consumer staples and materials. |
24
FUND BASICS
Mid Cap Value Fund
as of February 28, 2017
| | | | | | | | | | |
| | PERFORMANCE REVIEW | |
| | | September 1, 2016–February 28, 2017 | | Fund Total Return
(based on NAV)1 | | | Russell Midcap®
Value Index2 | |
| | Class A | | | 9.49 | % | | | 10.76 | % |
| | Class C | | | 9.11 | | | | 10.76 | |
| | Institutional | | | 9.75 | | | | 10.76 | |
| | Service | | | 9.48 | | | | 10.76 | |
| | Class IR | | | 9.65 | | | | 10.76 | |
| | Class R | | | 9.40 | | | | 10.76 | |
| | | Class R6 | | | 9.73 | | | | 10.76 | |
| | 1 | | The net asset value (“NAV”) represents the net assets of the class of the Fund (ex-dividend) divided by the total number of shares of the class outstanding. The Fund’s performance reflects the reinvestment of dividends and other distributions. The Fund’s performance does not reflect the deduction of any applicable sales charges. |
| | 2 | | The Russell Midcap Value® Index is an unmanaged index of common stock prices that measures the performance of those Russell Midcap companies with lower price-to-book ratios and lower forecasted growth values. The Index figures do not reflect any deduction for fees, expenses or taxes. It is not possible to invest directly in an unmanaged index. |
| | | | | | | | | | | | | | | | | | | | |
| | STANDARDIZED TOTAL RETURNS3 |
| | | For the period ended 12/31/16 | | One Year | | | Five Years | | | Ten Years | | | Since Inception | | | Inception Date |
| | Class A | | | 6.61 | % | | | 11.30 | % | | | 5.54 | % | | | 8.37 | % | | 8/15/97 |
| | Class C | | | 10.98 | | | | 11.74 | | | | 5.34 | | | | 7.89 | | | 8/15/97 |
| | Institutional | | | 13.25 | | | | 13.02 | | | | 6.56 | | | | 10.92 | | | 8/1/95 |
| | Service | | | 12.69 | | | | 12.45 | | | | 6.03 | | | | 8.71 | | | 7/18/97 |
| | Class IR | | | 13.09 | | | | 12.85 | | | | N/A | | | | 6.83 | | | 11/30/07 |
| | Class R | | | 12.55 | | | | 12.29 | | | | N/A | | | | 12.89 | | | 1/6/09 |
| | | Class R6 | | | 13.29 | | | | N/A | | | | N/A | | | | 2.70 | | | 7/31/15 |
| | 3 | | The Standardized Total Returns are average annual total returns or cumulative total returns (only if the performance period is one year or less) as of the most recent calendar quarter-end. They assume reinvestment of all distributions at NAV. These returns reflect a maximum initial sales charge of 5.5% for Class A Shares and the assumed contingent deferred sales charge for Class C Shares (1% if redeemed within 12 months of purchase). Because Institutional, Service, Class IR, Class R, and Class R6 Shares do not involve a sales charge, such a charge is not applied to their Standardized Total Returns. |
The returns set forth in the tables above represent past performance. Past performance does not guarantee future results. The Fund’s investment return and principal value will fluctuate so that an investor’s shares, when redeemed, may be worth more or less than their original cost. Current performance may be lower or higher than the performance quoted above. Please visit our web site at www.GSAMFUNDS.com to obtain the most recent month-end returns. Performance reflects fee waivers and/or expense limitations in effect during the periods shown. In their absence, performance would be reduced. Returns do not reflect the deduction of taxes that a shareholder would pay on Fund distributions or the redemption of Fund shares.
25
FUND BASICS
| | | | | | | | | | |
| | EXPENSE RATIOS4 | |
| | | | | Net Expense Ratio (Current) | | | Gross Expense Ratio (Before Waivers) | |
| | Class A | | | 1.16 | % | | | 1.16 | % |
| | Class C | | | 1.91 | | | | 1.91 | |
| | Institutional | | | 0.76 | | | | 0.76 | |
| | Service | | | 1.26 | | | | 1.26 | |
| | Class IR | | | 0.91 | | | | 0.91 | |
| | Class R | | | 1.41 | | | | 1.41 | |
| | | Class R6 | | | 0.74 | | | | 0.74 | |
| | 4 | | The expense ratios of the Fund, both current (net of applicable fee waivers and/or expense limitations) and before waivers (gross of applicable fee waivers and/or expense limitations), are as set forth above according to the most recent publicly available Prospectus. |
| | | | | | | | |
| | TOP TEN HOLDINGS AS OF 2/28/175 |
| | | Holding | | % of Net Assets | | | Line of Business |
| | Synchrony Financial | | | 2.1 | % | | Consumer Finance |
| | SunTrust Banks, Inc. | | | 2.1 | | | Banks |
| | Stanley Black & Decker, Inc. | | | 1.8 | | | Machinery |
| | Mid-America Apartment Communities, Inc. | | | 1.7 | | | Equity Real Estate Investment
Trusts (REITs) |
| | Huntington Bancshares, Inc. | | | 1.7 | | | Banks |
| | PG&E Corp. | | | 1.6 | | | Electric Utilities |
| | AMETEK, Inc. | | | 1.6 | | | Electrical Equipment |
| | Ameriprise Financial, Inc. | | | 1.5 | | | Capital Markets |
| | Vornado Realty Trust | | | 1.5 | | | Equity Real Estate Investment
Trusts (REITs) |
| | | Martin Marietta Materials, Inc. | | | 1.5 | | | Construction Materials |
| | 5 | | The top 10 holdings may not be representative of the Fund’s future investments. |
26
FUND BASICS
|
| FUND VS. BENCHMARK SECTOR ALLOCATIONS6 |
| As of February 28, 2017 |
| | 6 | | The Fund is actively managed and, as such, its composition may differ over time. Consequently, the Fund’s overall sector allocations may differ from the percentages contained in the graph above. The graph categorizes investments using the Global Industry Classification Standard (“GICS”), however, the sector classifications used by the portfolio management team may differ from GICS. The percentage shown for each investment category reflects the value of investments in that category as a percentage of market value (excluding investments in the securities lending reinvestment vehicle, if any). Investments in the securities lending reinvestment vehicle represented 0.4% of the Fund’s net assets as of February 28, 2017. The graph depicts the Fund’s investments but may not represent the Fund’s market exposure due to the exclusion of certain derivatives, if any, as listed in the Additional Investment Information section of the Schedule of Investments. |
27
PORTFOLIO RESULTS
Goldman Sachs Small Cap Value Fund
Portfolio Composition
The Fund invests, under normal circumstances, at least 80% of its net assets plus any borrowings for investment purposes (measured at the time of purchase) (“Net Assets”) a diversified portfolio of equity investments in small-cap issuers with public stock market capitalizations within the range of the market capitalization of companies constituting the Russell 2000® Value Index at the time of investment. Under normal circumstances, the Fund’s investment horizon for ownership of stocks will be two to three years. The Fund seeks its investment objective of long-term capital appreciation by investing in value opportunities that the Goldman Sachs Value Equity Investment Team defines as companies with identifiable competitive advantages whose intrinsic value is not reflected in the stock price. Although the Fund will invest primarily in publicly traded U.S. securities, it may invest up to 25% of its Net Assets in foreign securities, including securities of issuers in emerging countries and securities quoted in foreign currencies. The Fund may also invest in the aggregate up to 20% of its Net Assets in companies with public stock market capitalizations outside the range of companies constituting the Russell 2000® Value Index at the time of investment and in fixed income securities, such as government, corporate and bank debt obligations.
Portfolio Management Discussion and Analysis
Below, the Goldman Sachs Value Equity Investment Team discusses the Goldman Sachs Small Cap Value Fund’s (the “Fund”) performance and positioning for the six-month period ended February 28, 2017 (the “Reporting Period”).
| Q | | How did the Fund perform during the Reporting Period? |
| A | | During the Reporting Period, the Fund’s Class A, C, Institutional, Service, IR, R and R6 Shares generated cumulative total returns, without sales charges, of 12.93%, 12.51%, 13.16%, 12.88%, 13.09%, 12.80% and 13.19%, respectively. These returns compare to the 15.80% cumulative total return of the Fund’s benchmark, the Russell 2000® Value Index (with dividends reinvested) (the “Russell Index”), during the same period. |
| Q | | What key factors were responsible for the Fund’s performance during the Reporting Period? |
| A | | The Fund generated robust absolute gains, but stock selection overall detracted most from the Fund’s performance relative to the Russell Index during the Reporting Period. Sector allocation as a whole also detracted, albeit to a lesser degree, from the Fund’s results. |
| Q | | Which equity market sectors most significantly affected Fund performance? |
| A | | Detracting from the Fund’s relative results most was weak stock selection in the energy, materials and consumer staples sectors. Having a position in cash during a Reporting Period when the Russell Index rallied also hurt. Effective stock selection in the financials and utilities sectors helped the Fund’s performance most relative to the Russell Index. Having no exposure to the telecommunication services sector, which significantly lagged the Russell Index during the Reporting Period, also buoyed the Fund’s relative results. |
| Q | | Which stocks detracted significantly from the Fund’s performance during the Reporting Period? |
| A | | Detracting most from the Fund’s results relative to the Russell Index were positions in natural gas-focused exploration and production company Rice Energy, food manufacturer TreeHouse Foods and health care real estate investment trust (“REIT”) Care Capital Properties. |
| | | Rice Energy was the biggest detractor from the Fund’s relative results during the Reporting Period. Natural gas-exposed exploration and production companies underperformed the Russell Index following an agreement by the Organization of the Petroleum Exporting Countries (“OPEC”) to cut production in an effort to stabilize oil prices. In our view, energy investors subsequently reduced their exposure to natural gas-exposed stocks to gain exposure to oil-exposed companies instead. Additionally, investors appear to have held the belief that higher oil prices could lead to greater associated gas production from oil plays, driving down long-term natural gas prices. Despite these headwinds, at the end of the Reporting Period, we maintained our positive view on the company given its prominent acreage in the Marcellus and Utica shales, which we believe has the potential to drive strong long-term results |
28
PORTFOLIO RESULTS
| | for the company. Additionally, Rice Energy is supported, in our view, by a management team committed to generating high returns. We believe the company’s growth opportunities were not fully reflected in its stock valuation at the end of the Reporting Period. |
| | Shares of TreeHouse Foods declined after the company reported mixed second quarter 2016 earnings and announced the retirement of its Chief Financial Officer. We subsequently exited the Fund’s position in the company during the fourth quarter of 2016. We had originally initiated a Fund position in the stock given our view that the company would make operational improvements and that its acquisition of ConAgra’s private brands business could generate substantial synergies. However, the ConAgra deal has proven to be more difficult than we anticipated from an integration perspective. Further, in the event food inflation increases, it could be more difficult, in our opinion, for TreeHouse Foods to pass along cost increases to consumers relative to branded food peers. |
| | Capital Care Properties is a health care REIT with a focus on skilled nursing facilities. Investors appeared to become concerned after its management disclosed in October 2016 that one of the company’s largest tenants was seeking rent relief. Its stock was further pressured during the fourth quarter of 2016 as investor expectations for interest rate hikes by the U.S. Federal Reserve (the “Fed”) increased, which resulted in a sharp rise in the 10-year U.S. Treasury yield. Despite these headwinds, we continued to believe at the end of the Reporting Period that Care Capital Properties has a superior portfolio of properties, supported by a high quality management team and a strong balance sheet. Additionally, we believe U.S. aging demographic trends could be a tailwind for the company going forward. |
| Q | | What were some of the Fund’s best-performing individual stocks? |
| A | | The Fund benefited most relative to the Russell Index from positions in electronic design company Mentor Graphics, property and casualty insurance and reinsurance company Endurance Specialty Holdings and commercial bank Webster Financial. |
| | | Shares of Mentor Graphics rose sharply after its announcement that Siemens agreed to acquire the company at a premium. The deal is expected to close in the second quarter of 2017. We had originally initiated the Fund position in Mentor Graphics when the stock was trading at what we viewed as a discount following a challenging period for the company due to increased competition. We believed its performance would improve and future growth opportunities for the company were being underappreciated by the market. We also liked what we considered to be the company’s strong balance sheet. After the acquisition announcement, we sold the Fund’s position in Mentor Graphics. |
| | | Endurance Specialty Holdings saw its stock price rise sharply after the company reached an agreement to sell itself to a Japanese insurer at a 43% premium relative to its previous closing price. We had originally initiated a position in Endurance Specialty Holdings based on our positive view of its management team’s turnaround strategy. In particular, we were constructive on its efforts to enhance the company’s earnings profile by shifting its mix toward the insurance segment. Additionally, we held a positive view on the company’s then-recently appointed Chief Executive Officer and the tenured team of insurance underwriters that he recruited to the company. Following the announcement of the acquisition, we exited the Fund’s position in Endurance Specialty Holdings and used the proceeds to add to names with what we viewed as more attractive risk-adjusted upside potential. |
| | | Webster Financial reported strong third quarter 2016 earnings, driven by better than market expected loan growth and fee income. Its stock continued to rise following the U.S. presidential election, as investor expectations for better economic growth, regulatory relief and higher interest rates caused bank stocks, particularly those with a domestic focus, to outperform the broader U.S. equity market. In our view, Webster Financial is a well-managed company that is taking share in the northeast U.S., an attractive geographic market for banking fundamentals. Further, the company is one of the leading providers of health savings accounts, a large source of low-cost deposits that may, in our opinion, benefit its margins in a higher interest rate environment. |
| Q | | How did the Fund use derivatives and similar instruments during the Reporting Period? |
| A | | During the Reporting Period, we did not use derivatives as part of an active management strategy. |
| Q | | Did the Fund make any significant purchases or sales during the Reporting Period? |
| A | | We initiated a Fund position in Tech Data, a distribution company that specializes in microcomputer-related hardware and software. We are positive on the company’s recently appointed Chief Financial Officer, who, in our view, brings |
29
PORTFOLIO RESULTS
| | operational, capital allocation and cash flow discipline to the company. We are also constructive on Tech Data’s acquisition of Avnet, which we believe is underappreciated by investors. Additionally, we believe the stock’s valuation, at the time of purchase, was attractive relative to the small-cap information technology universe. Finally, in our view, the company is well positioned to benefit from potential improvements in small business confidence. |
| | | We established a Fund position in Mid-America Apartment Communities, an owner and operator of apartments across the U.S.’ Sunbelt region. We are positive on the company’s geographical exposure and presence in suburban markets, which we view as less susceptible to the potential threat of new supply. Over the long term, we believe this dynamic may well allow for stronger pricing power and more stable rent growth. We further believe Mid-America Apartment Communities has a high quality management team with a strong track record of execution. |
| | | Conversely, in addition to those sales already mentioned, we exited the Fund’s position in Intersil, a semiconductor manufacturer, as a result of an acquisition. At the time of the Fund’s purchase, we had believed Intersil was under-earning relative to its peers, which led to what we considered to be an attractive valuation. We were also constructive on the company’s plan to reallocate research and development spending to its higher margin businesses. Intersil was a long-term holding in the Fund, and we were encouraged by improving operating margins and successful new product launches as a result of its increased research and development investment. Its shares spiked after Renesas Electronic, a Japanese automotive chip manufacturer, announced the acquisition of Intersil at a significant premium, and so we sold the Fund’s shares in the company. |
| Q | | Were there any notable changes in the Fund’s weightings during the Reporting Period? |
| A | | In constructing the Fund’s portfolio, we focus on picking stocks rather than on making industry or sector bets. We seek to outpace the benchmark index by overweighting stocks that we expect to outperform and underweighting those that we think may lag. Consequently, changes in its sector weights are generally the direct result of individual stock selection or of stock appreciation or depreciation. That said, during the Reporting Period, the Fund’s allocations compared to the Russell Index in industrials and consumer discretionary increased and its allocation compared to the Russell Index in information technology decreased. |
| Q | | How was the Fund positioned relative to its benchmark index at the end of February 2017? |
| A | | At the end of February 2017, the Fund was overweighted in industrials and materials and underweighted in financials and real estate relative to the Russell Index. The Fund was rather neutrally weighted to information technology, consumer discretionary, energy, utilities, health care and consumer staples in the Russell Index at the end of February 2017, with the exception of telecommunication services to which the Fund had no exposure at all at the end of the Reporting Period. |
30
FUND BASICS
Small Cap Value Fund
as of February 28, 2017
| | | | | | | | | | |
| | PERFORMANCE REVIEW | |
| | | September 1, 2016–February 28, 2017 | | Fund Total Return
(based on NAV)1 | | | Russell 2000®
Value Index2 | |
| | Class A | | | 12.93 | % | | | 15.80 | % |
| | Class C | | | 12.51 | | | | 15.80 | |
| | Institutional | | | 13.16 | | | | 15.80 | |
| | Service | | | 12.88 | | | | 15.80 | |
| | Class IR | | | 13.09 | | | | 15.80 | |
| | Class R | | | 12.80 | | | | 15.80 | |
| | | Class R6 | | | 13.19 | | | | 15.80 | |
| | 1 | | The net asset value (“NAV”) represents the net assets of the class of the Fund (ex-dividend) divided by the total number of shares of the class outstanding. The Fund’s performance reflects the reinvestment of dividends and other distributions. The Fund’s performance does not reflect the deduction of any applicable sales charges. |
| | 2 | | The Russell 2000 Value Index is an unmanaged index of common stock prices that measures the performance of those Russell 2000 companies with lower price-to-book ratios and lower forecasted growth values. The Index figures do not reflect any deduction for fees, expenses or taxes. It is not possible to invest directly in an unmanaged index. |
| | | | | | | | | | | | | | | | | | | | |
| | STANDARDIZED TOTAL RETURNS3 |
| | | For the period ended 12/31/16 | | One Year | | | Five Years | | | Ten Years | | | Since Inception | | | Inception Date |
| | Class A | | | 17.27 | % | | | 13.64 | % | | | 7.70 | % | | | 10.61 | % | | 10/22/92 |
| | Class C | | | 22.11 | | | | 14.07 | | | | 7.51 | | | | 8.77 | | | 8/15/97 |
| | Institutional | | | 24.58 | | | | 15.38 | | | | 8.75 | | | | 10.04 | | | 8/15/97 |
| | Service | | | 23.94 | | | | 14.81 | | | | 8.21 | | | | 9.49 | | | 8/15/97 |
| | Class IR | | | 24.40 | | | | 15.21 | | | | N/A | | | | 9.99 | | | 11/30/07 |
| | Class R | | | 23.78 | | | | 14.64 | | | | N/A | | | | 9.46 | | | 11/30/07 |
| | | Class R6 | | | 24.59 | | | | N/A | | | | N/A | | | | 11.59 | | | 7/31/15 |
| | 3 | | The Standardized Total Returns are average annual total returns or cumulative total returns (only if the performance period is one year or less) as of the most recent calendar quarter-end. They assume reinvestment of all distributions at NAV. These returns reflect a maximum initial sales charge of 5.5% for Class A Shares and the assumed contingent deferred sales charge for Class C Shares (1% if redeemed within 12 months of purchase). Because Institutional, Service, Class IR, Class R, and Class R6 Shares do not involve a sales charge, such a charge is not applied to their Standardized Total Returns. |
The returns set forth in the tables above represent past performance. Past performance does not guarantee future results. The Fund’s investment return and principal value will fluctuate so that an investor’s shares, when redeemed, may be worth more or less than their original cost. Current performance may be lower or higher than the performance quoted above. Please visit our web site at www.GSAMFUNDS.com to obtain the most recent month-end returns. Performance reflects fee waivers and/or expense limitations in effect during the periods shown. In their absence, performance would be reduced. Returns do not reflect the deduction of taxes that a shareholder would pay on Fund distributions or the redemption of Fund shares.
31
FUND BASICS
| | | | | | | | | | |
| | EXPENSE RATIOS4 | |
| | | | | Net Expense Ratio (Current) | | | Gross Expense Ratio (Before Waivers) | |
| | Class A | | | 1.37 | % | | | 1.41 | % |
| | Class C | | | 2.12 | | | | 2.16 | |
| | Institutional | | | 0.97 | | | | 1.01 | |
| | Service | | | 1.47 | | | | 1.51 | |
| | Class IR | | | 1.12 | | | | 1.16 | |
| | Class R | | | 1.62 | | | | 1.66 | |
| | | Class R6 | | | 0.95 | | | | 1.00 | |
| | 4 | | The expense ratios of the Fund, both current (net of applicable fee waivers and/or expense limitations) and before waivers (gross of applicable fee waivers and/or expense limitations) are as set forth above according to the most recent publicly available Prospectus for the Fund and may differ from the expense ratios disclosed in the Financial Highlights in this report. Pursuant to a contractual arrangement, the Fund’s waivers and/or expense limitations will remain in place through at least December 29, 2017, and prior to such date the investment adviser may not terminate the arrangements without the approval of the Fund’s Board of Trustees. If these arrangements are discontinued in the future, the expense ratios may change without shareholder approval. |
| | | | | | | | |
| | TOP TEN HOLDINGS AS OF 2/28/175 |
| | | Holding | | % of Net Assets | | | Line of Business |
| | Webster Financial Corp. | | | 1.4 | % | | Banks |
| | XPO Logistics, Inc. | | | 1.2 | | | Air Freight & Logistics |
| | Radian Group, Inc. | | | 1.0 | | | Thrifts & Mortgage Finance |
| | Pebblebrook Hotel Trust | | | 1.0 | | | Equity Real Estate Investment
Trusts (REITs) |
| | Life Storage, Inc. | | | 1.0 | | | Equity Real Estate Investment
Trusts (REITs) |
| | New Jersey Resources Corp. | | | 0.9 | | | Gas Utilities |
| | Prosperity Bancshares, Inc. | | | 0.9 | | | Banks |
| | Texas Capital Bancshares, Inc. | | | 0.9 | | | Banks |
| | Burlington Stores, Inc. | | | 0.8 | | | Specialty Retail |
| | | LegacyTexas Financial Group, Inc. | | | 0.8 | | | Banks |
| | 5 | | The top 10 holdings may not be representative of the Fund’s future investments. |
32
FUND BASICS
|
| FUND VS. BENCHMARK SECTOR ALLOCATIONS6 |
| As of February 28, 2017 |
| | 6 | | The Fund is actively managed and, as such, its composition may differ over time. Consequently, the Fund’s overall sector allocations may differ from the percentages contained in the graph above. The graph categorizes investments using the Global Industry Classification Standard (“GICS”), however, the sector classifications used by the portfolio management team may differ from GICS. Underlying sector allocations of Exchange Traded Funds held by the Fund are not reflected in the graph above. The percentage shown for each investment category reflects the value of investments in that category as a percentage of market value (excluding investments in the securities lending reinvestment vehicle, if any). Investments in the securities lending reinvestment vehicle represented 1.2% of the Fund’s net assets as of February 28, 2017. The graph depicts the Fund’s investments but may not represent the Fund’s market exposure due to the exclusion of certain derivatives, if any, as listed in the Additional Investment Information section of the Schedule of Investments. |
33
PORTFOLIO RESULTS
Goldman Sachs Small/Mid Cap Value Fund
Portfolio Composition
The Fund’s investment objective is to seek long-term capital appreciation. The Fund invests, under normal circumstances, at least 80% of its net assets plus any borrowings for investment purposes (measured at time of purchase) (“Net Assets”) in a diversified portfolio of equity investments in small- and mid-cap issuers with public stock market capitalizations within the range of the market capitalization of companies constituting the Russell 2000® Value Index and the Russell Midcap® Value Index, respectively, at the time of investment. Under normal circumstances, the Fund’s investment horizon for ownership of stocks will be two to three years. Although the Fund will invest primarily in publicly traded U.S. securities, including real estate investment trusts (“REITs”), it may also invest in foreign securities, including securities of issuers in emerging countries or economies and securities quoted in foreign currencies. The Fund may invest in the aggregate up to 20% of its Net Assets in companies with public stock market capitalizations outside the range of companies constituting the Russell 2000® Value Index and the Russell Midcap® Value Index at the time of investment and in fixed income securities, such as government, corporate and bank debt obligations.
Portfolio Management Discussion and Analysis
Below, the Goldman Sachs Value Equity Investment Team discusses the Goldman Sachs Small/Mid Cap Value Fund’s (the “Fund”) performance and positioning for the six-month period ended February 28, 2017 (the “Reporting Period”).
| Q | | How did the Fund perform during the Reporting Period? |
| A | | During the Reporting Period, the Fund’s Class A, C, Institutional, IR, R and R6 Shares generated cumulative total returns, without sales charges, of 12.20%, 11.76%, 12.33%, 12.23%, 11.96% and 12.33%, respectively. These returns compare to the 12.73% cumulative total return of the Fund’s benchmark, the Russell 2500® Value Index (with dividends reinvested) (the “Russell Index”), during the same period. |
| Q | | What key factors were responsible for the Fund’s performance during the Reporting Period? |
| A | | The Fund posted solid positive absolute returns, but both stock selection and sector allocation overall detracted modestly from the Fund’s performance relative to the Russell Index during the Reporting Period. |
| Q | | Which equity market sectors most significantly affected Fund performance? |
| A | | The sectors that detracted most from the Fund’s relative results during the Reporting Period were energy and industrials, wherein stock selection proved challenging. Having an allocation to cash during a period when the Russell Index rallied also hurt. Effective stock selection in the financials and consumer discretionary sectors helped the Fund’s performance most relative to the Russell Index. Having no exposure to telecommunication services, which significantly lagged the Russell Index during the Reporting Period, also buoyed the Fund’s relative results. |
| Q | | Which stocks detracted significantly from the Fund’s performance during the Reporting Period? |
| A | | Detracting most from the Fund’s results relative to the Russell Index were positions in Brixmor Property Group, QEP Resources and Federal Realty Investment Trust. |
| | | Brixmor Property Group, an owner of grocery-anchored community shopping centers, was the top detractor from the Fund’s relative results during the Reporting Period. We believe its underperformance of the Russell Index was largely due to investor concerns about disappointing retail industry sales and the potential impact on Brixmor Property Group’s tenants. In our view, these fears were overblown, especially given the company’s base in what we consider to be high quality grocery-anchored shopping centers. Overall, at the end of the Reporting Period, we remained positive on Brixmor Property Group’s long-term growth potential as well as the company’s portfolio of assets since we believe fundamentals in the industry remained healthy. For example, supply, relative to historical levels, was low, and demand remained strong. Finally, we were encouraged by its |
34
PORTFOLIO RESULTS
| | management’s focus on high return redevelopment projects and improving the company’s balance sheet. |
| | We had originally initiated a Fund position in QEP Resources, an oil and natural gas exploration and production company, due to a strategic shift it made in capital allocation. Historically, QEP Resources was a natural gas-focused producer with a relatively high cost base in the Rockies. In more recent years, however, the company had pivoted capital to higher return assets with greater oil exposure in the Permian and Bakken shale plays, or areas of operation. Additionally, QEP Resources had acquired high quality acreage in the Permian Basin, which we believed would provide the company with greater inventory in some of the lowest cost shale in the U.S. We were positive on this strategic shift and believed that as investors came to fully appreciate the improved asset mix, shares of QEP Resources could trade meaningfully higher. However, during the Reporting Period, the company reported earnings that gave us concern regarding the execution of the transition. Its legacy assets underperformed investor expectations and have complicated the investment case around the transition to lower cost plays, as cash flow from its legacy assets will, in our view, have to fund growth in the new assets. We exited the Fund’s position in QEP Resources by the end of the Reporting Period. |
| | Federal Realty Investment Trust, an owner of retail and mixed-use shopping centers, was another top detractor from the Fund’s relative results during the Reporting Period. The move in interest rates following the U.S. elections and heightened expectations for additional interest rate hikes by the Federal Reserve (the “Fed”) pressured the company’s stock. At the end of the Reporting Period, it was our view that Federal Realty Investment Trust’s exposure to the nation’s top urban markets, including Washington, D.C. and San Francisco, could provide the company with pricing power and above-average rent growth going forward. In addition to what we consider to be a strong balance sheet, we believe the company’s development pipeline was being underappreciated by investors, and its management’s track record of building shareholder value could lead to meaningful upside in its stock. |
| Q | | What were some of the Fund’s best-performing individual stocks? |
| A | | The Fund benefited most relative to the Russell Index from positions in property and casualty insurance and reinsurance company Endurance Specialty Holdings, retail and commercial bank East West Bancorp and commercial bank Webster Financial. |
| | | Endurance Specialty Holdings saw its stock price rise sharply after the company reached an agreement to sell itself to a Japanese insurer at a 43% premium relative to its previous closing price. We had originally initiated a position in Endurance Specialty Holdings based on our positive view of its management team’s turnaround strategy. In particular, we were constructive on its efforts to enhance the company’s earnings profile by shifting its mix toward the insurance segment. Additionally, we held a positive view on the company’s then-recently appointed Chief Executive Officer and the tenured team of insurance underwriters that he recruited to the company. Following the announcement of the acquisition, we exited the Fund’s position in Endurance Specialty Holdings and used the proceeds to add to names with what we viewed as more attractive risk-adjusted upside potential. |
| | | Shares of East West Bancorp, headquartered in California, rose sharply following the U.S. presidential election as investor sentiment around the financials sector broadly, and regional banks in particular, improved. At the end of the Reporting Period, we continued to believe East West Bancorp was well positioned with diverse loan growth in some of the fastest growing areas of California, Texas and New York. We remained positive on its above-average loan growth, supported by what we considered to be its strong, shareholder-focused management team. |
| | | Webster Financial reported strong third quarter 2016 earnings, driven by better than market expected loan growth and fee income. Its stock continued to rise following the U.S. presidential election, as investor expectations for better economic growth, regulatory relief and higher interest rates caused bank stocks, particularly those with a domestic focus, to outperform the broader U.S. equity market. In our view, Webster Financial is a well-managed company that is taking share in the northeast U.S., an attractive geographic market for banking fundamentals. Further, the company is one of the leading providers of health savings accounts, a large source of low-cost deposits that may, in our opinion, benefit its margins in a higher interest rate environment. |
| Q | | How did the Fund use derivatives and similar instruments during the Reporting Period? |
| A | | During the Reporting Period, we did not use derivatives as part of an active management strategy. |
35
PORTFOLIO RESULTS
| Q | | Did the Fund make any significant purchases or sales during the Reporting Period? |
| A | | We initiated a Fund position in Trinity Industries, a manufacturer of transportation and industrial products. We believe we are nearing a trough point in the rail car cycle, which was negatively affected by a slowdown in industrial production and energy prices. We believe strong economic growth, should it indeed materialize, may well lead to a pickup in rail car activity and utilization. In our view, early data points are encouraging — train speeds are slowing, implying more traffic; loads are increasing; and idle train cars are coming back online. The company has what we considered to be an under-levered balance sheet and a large leasing business, which could unlock value in a sale scenario. Also, the company is diversifying away from being a pure rail car manufacturer and into the barge and infrastructure businesses. |
| | | We established a Fund position in TechnipFMC, a provider of technologies, systems and services for oil and gas projects. FMC was a market leader in subsea deepwater technologies and equipment. In 2016, it announced a merger with Technip, a leader in above-ground technologies and equipment for deepwater drilling. Combining the expertise of both businesses, TechnipFMC is able to complete projects with approximately 30% lower costs, which, in our view, offers a compelling value proposition to its clients. We believe there are potentially further deal synergies, which are still underappreciated by the market. Additionally, in our opinion, the company could return capital to shareholders and might well be beneficiaries of a lower corporate tax rate, should that materialize. Further, at the time of purchase, the stock was trading at a discount to its oil services peers. |
| | | Conversely, in addition to the sale of QEP Resources, already mentioned, we exited the Fund’s position in Post Properties, a real estate investment trust (“REIT”) that develops and operates multifamily apartment communities. Its stock was a top contributor to the Fund’s relative results during the third quarter of 2016 after it was announced that Mid-America Apartment Communities was acquiring Post Properties in an all-stock deal valued at $17 billion. We are positive on this transaction given the opportunity for substantial operating synergies. Additionally, we believe the scale of the combined company may allow for stronger pricing power and more stable rent growth. We exited the Fund’s position in Post Properties when the deal closed in December 2016, though the Fund maintained high conviction in the combined company through its position in Mid-America Apartment Communities, an owner and operator of apartments across the Sunbelt region. |
| Q | | Were there any notable changes in the Fund’s weightings during the Reporting Period? |
| A | | In constructing the Fund’s portfolio, we focus on picking stocks rather than on making industry or sector bets. We seek to outpace the benchmark index by overweighting stocks that we expect to outperform and underweighting those that we think may lag. Consequently, changes in its sector weights are generally the direct result of individual stock selection or of stock appreciation or depreciation. That said, during the Reporting Period, the Fund’s allocation compared to the Russell Index in industrials increased and its allocation compared to the Russell Index in consumer staples decreased. |
| Q | | How was the Fund positioned relative to its benchmark index at the end of February 2017? |
| A | | At the end of February 2017, the Fund was overweighted in the industrials and materials sectors relative to the Russell Index. On the same date, the Fund had underweighted positions compared to the Russell Index in real estate and consumer staples and was rather neutrally weighted to the Russell Index in the remaining sectors of the Russell Index. The Fund had no allocation to telecommunication services at the end of the Reporting Period. |
36
FUND BASICS
Small/Mid Cap Value Fund
as of February 28, 2017
| | | | | | | | | | |
| | PERFORMANCE REVIEW | |
| | | September 1, 2016–February 28, 2017 | | Fund Total Return
(based on NAV)1 | | | Russell 2500®
Value Index2 | |
| | Class A | | | 12.20 | % | | | 12.73 | % |
| | Class C | | | 11.76 | | | | 12.73 | |
| | Institutional | | | 12.33 | | | | 12.73 | |
| | Class IR | | | 12.23 | | | | 12.73 | |
| | Class R | | | 11.96 | | | | 12.73 | |
| | | Class R6 | | | 12.33 | | | | 12.73 | |
| | 1 | | The net asset value (“NAV”) represents the net assets of the class of the Fund (ex-dividend) divided by the total number of shares of the class outstanding. The Fund’s performance reflects the reinvestment of dividends and other distributions. The Fund’s performance does not reflect the deduction of any applicable sales charges. |
| | 2 | | The Russell 2500 Value Index is composed of the smallest 2,500 of the 3,000 largest U.S. companies based on total market capitalization with lower price-to-book ratios and lower forecast growth values. It is calculated by Frank Russell Company, and reflects reinvestment of all dividends and capital gains. The Index figures do not reflect any deduction for fees, expenses or taxes. It is not possible to invest directly in an unmanaged index. |
| | | | | | | | | | | | |
| | STANDARDIZED TOTAL RETURNS3 |
| | | For the period ended 12/31/16 | | One Year | | | Since Inception | | | Inception Date |
| | Class A | | | 10.44 | % | | | 5.36 | % | | 1/31/2014 |
| | Class C | | | 15.08 | | | | 6.68 | | | 1/31/2014 |
| | Institutional | | | 17.38 | | | | 7.94 | | | 1/31/2014 |
| | Class IR | | | 17.20 | | | | 7.69 | | | 1/31/2014 |
| | Class R | | | 16.59 | | | | 7.19 | | | 1/31/2014 |
| | | Class R6 | | | 17.38 | | | | 7.00 | | | 7/31/2015 |
| | 3 | | The Standardized Total Returns are average annual total returns or cumulative total returns (only if the performance period is one year or less) as of the most recent calendar quarter-end. They assume reinvestment of all distributions at NAV. These returns reflect a maximum initial sales charge of 5.5% for Class A Shares and the assumed contingent deferred sales charge for Class C Shares (1% if redeemed within 12 months of purchase). Because Institutional, Service, Class IR, Class R, and Class R6 Shares do not involve a sales charge, such a charge is not applied to their Standardized Total Returns. |
The returns set forth in the tables above represent past performance. Past performance does not guarantee future results. The Fund’s investment return and principal value will fluctuate so that an investor’s shares, when redeemed, may be worth more or less than their original cost. Current performance may be lower or higher than the performance quoted above. Please visit our web site atwww.GSAMFUNDS.com to obtain the most recent month-end returns. Performance reflects fee waivers and/or expense limitations in effect during the periods shown. In their absence, performance would be reduced. Returns do not reflect the deduction of taxes that a shareholder would pay on Fund distributions or the redemption of Fund shares.
37
FUND BASICS
| | | | | | | | | | |
| | EXPENSE RATIOS3 | |
| | | | | Net Expense Ratio (Current) | | | Gross Expense Ratio (Before Waivers) | |
| | Class A | | | 1.26 | % | | | 2.25 | % |
| | Class C | | | 2.01 | | | | 2.99 | |
| | Institutional | | | 0.87 | | | | 1.84 | |
| | Class IR | | | 1.01 | | | | 2.03 | |
| | Class R | | | 1.52 | | | | 2.50 | |
| | | Class R6 | | | 0.88 | | | | 1.90 | |
| | 3 | | The expense ratios of the Fund, both current (net of applicable fee waivers and/or expense limitations) and before waivers (gross of applicable fee waivers and/or expense limitations) are as set forth above according to the most recent publicly available Prospectus for the Fund and may differ from the expense ratios disclosed in the Financial Highlights in this report. Pursuant to a contractual arrangement, the Fund’s waivers and/or expense limitations will remain in place through at least December 29, 2017, and prior to such date the investment adviser may not terminate the arrangements without the approval of the Fund’s Board of Trustees. If these arrangements are discontinued in the future, the expense ratios may change without shareholder approval. |
| | | | | | | | |
| | TOP TEN HOLDINGS AS OF 2/28/175 |
| | | Holding | | % of Net Assets | | | Line of Business |
| | Mid-America Apartment Communities, Inc. | | | 2.8 | % | | Equity Real Estate Investment
Trusts (REITs) |
| | East West Bancorp, Inc. | | | 1.4 | | | Banks |
| | Webster Financial Corp. | | | 1.3 | | | Banks |
| | Arch Capital Group Ltd. | | | 1.3 | | | Insurance |
| | Brixmor Property Group, Inc. | | | 1.3 | | | Equity Real Estate Investment
Trusts (REITs) |
| | Synovus Financial Corp. | | | 1.2 | | | Banks |
| | American Financial Group, Inc. | | | 1.2 | | | Insurance |
| | Signature Bank | | | 1.2 | | | Banks |
| | Atmos Energy Corp. | | | 1.2 | | | Gas Utilities |
| | | First Republic Bank | | | 1.1 | | | Banks |
| | 5 | | The top 10 holdings may not be representative of the Fund’s future investments. |
38
FUND BASICS
|
| FUND VS. BENCHMARK SECTOR ALLOCATIONS6 |
| As of February 28, 2017 |
| | 6 | | The Fund is actively managed and, as such, its composition may differ over time. Consequently, the Fund’s overall sector allocations may differ from the percentages contained in the graph above. The graph categorizes investments using the Global Industry Classification Standard (“GICS”), however, the sector classifications used by the portfolio management team may differ from GICS. The percentage shown for each investment category reflects the value of investments in that category as a percentage of market value (excluding investments in the securities lending reinvestment vehicle, if any). Investments in the securities lending reinvestment vehicle represented 0.6% of the Fund’s net assets as of February 28, 2017. The graph depicts the Fund’s investments but may not represent the Fund’s market exposure due to the exclusion of certain derivatives, if any, as listed in the Additional Investment Information section of the Schedule of Investments. |
39
GOLDMAN SACHS FOCUSED VALUE FUND
Schedule of Investments
February 28, 2017 (Unaudited)
| | | | | | | | |
Shares | | | Description | | Value | |
| Common Stocks – 97.8% | |
| Airlines* – 2.0% | |
| | 3,823 | | | JetBlue Airways Corp. | | $ | 76,307 | |
| | |
| Automobiles – 1.9% | |
| | 1,953 | | | General Motors Co. | | | 71,948 | |
| | |
| Banks – 14.2% | |
| | 8,063 | | | Bank of America Corp. | | | 198,995 | |
| | 1,495 | | | JPMorgan Chase & Co. | | | 135,477 | |
| | 3,406 | | | Wells Fargo & Co. | | | 197,139 | |
| | | | | | | | |
| | | | | | | 531,611 | |
| | |
| Biotechnology* – 3.5% | |
| | 1,066 | | | Celgene Corp. | | | 131,662 | |
| | |
| Capital Markets – 5.7% | |
| | 2,933 | | | Deutsche Bank AG* | | | 57,751 | |
| | 3,419 | | | Morgan Stanley | | | 156,145 | |
| | | | | | | | |
| | | | | | | 213,896 | |
| | |
| Chemicals – 2.5% | |
| | 1,184 | | | E.I. du Pont de Nemours & Co. | | | 92,991 | |
| | |
| Consumer Finance – 3.9% | |
| | 1,844 | | | American Express Co. | | | 147,631 | |
| | |
| Electrical Equipment – 4.0% | |
| | 2,093 | | | Eaton Corp. PLC | | | 150,654 | |
| | |
| Electronic Equipment, Instruments & Components – 2.6% | |
| | 3,547 | | | Corning, Inc. | | | 97,933 | |
| | |
| Energy Equipment & Services – 2.0% | |
| | 1,803 | | | National Oilwell Varco, Inc. | | | 72,877 | |
| | |
| Food & Staples Retailing – 5.3% | |
| | 915 | | | Wal-Mart Stores, Inc. | | | 64,901 | |
| | 4,380 | | | Whole Foods Market, Inc. | | | 134,335 | |
| | | | | | | | |
| | | | | | | 199,236 | |
| | |
| Health Care Equipment & Supplies – 4.8% | |
| | 2,264 | | | Abbott Laboratories | | | 102,061 | |
| | 667 | | | Zimmer Biomet Holdings, Inc. | | | 78,092 | |
| | | | | | | | |
| | | | | | | 180,153 | |
| | |
| Industrial Conglomerates – 4.2% | |
| | 5,330 | | | General Electric Co. | | | 158,887 | |
| | |
| Insurance – 3.0% | |
| | 2,147 | | | MetLife, Inc. | | | 112,589 | |
| | |
| Internet Software & Services* – 4.2% | |
| | 187 | | | Alphabet, Inc. Class A | | | 158,002 | |
| | |
| Media – 8.1% | |
| | 2,216 | | | DISH Network Corp. Class A* | | | 137,392 | |
| | 3,857 | | | Viacom, Inc. Class B | | | 167,587 | |
| | | | | | | | |
| | | | | | | 304,979 | |
| | |
| Common Stocks – (continued) | |
| Oil, Gas & Consumable Fuels – 9.5% | |
| | 641 | | | Chevron Corp. | | | 72,112 | |
| | 3,253 | | | ConocoPhillips | | | 154,745 | |
| | 17,111 | | | Southwestern Energy Co.* | | | 128,504 | |
| | | | | | | | |
| | | | | | | 355,361 | |
| | |
| Personal Products – 2.9% | |
| | 5,856 | | | Coty, Inc. Class A | | | 109,976 | |
| | |
| Pharmaceuticals – 6.9% | |
| | 266 | | | Allergan PLC | | | 65,122 | |
| | 1,040 | | | Eli Lilly & Co. | | | 86,122 | |
| | 3,123 | | | Pfizer, Inc. | | | 106,557 | |
| | | | | | | | |
| | | | | | | 257,801 | |
| | |
| Software – 4.2% | |
| | 3,644 | | | Oracle Corp. | | | 155,198 | |
| | |
| Specialty Retail – 2.4% | |
| | 1,181 | | | Lowe’s Cos., Inc. | | | 87,831 | |
| | |
| | TOTAL COMMON STOCKS | | | | |
| | (Cost $3,233,767) | | $ | 3,667,523 | |
| | |
| | | | | | | | |
| Shares | | Distribution
Rate | | | Value | |
| Investment Companies(a)(b) – 2.5% | |
Goldman Sachs Financial Square Government Fund – Institutional Shares | |
| 94,608 | | | 0.470 | % | | $ | 94,608 | |
| (Cost $94,608) | | | | | |
| |
| TOTAL INVESTMENTS – 100.3% | |
| (Cost $3,328,375) | | | $ | 3,762,131 | |
| |
LIABILITIES IN EXCESS OF OTHER ASSETS – (0.3)% | | | | (12,451 | ) |
| |
| NET ASSETS – 100.0% | | | $ | 3,749,680 | |
| |
| | |
| The percentage shown for each investment category reflects the value of investments in that category as a percentage of net assets. |
* | | Non-income producing security. |
(a) | | Represents an Affiliated fund. |
(b) | | Variable rate security. Interest rate or distribution rate disclosed is that which is in effect on February 28, 2017. |
| | |
|
Investment Abbreviations: |
PLC | | —Public Limited Company |
|
| | |
| 40 | | The accompanying notes are an integral part of these financial statements. |
GOLDMAN SACHS GROWTH AND INCOME FUND
Schedule of Investments
February 28, 2017 (Unaudited)
| | | | | | | | |
Shares | | | Description | | Value | |
| Common Stocks – 98.7% | |
| Aerospace & Defense – 1.4% | |
| | 52,371 | | | United Technologies Corp. | | $ | 5,894,356 | |
| | |
| Air Freight & Logistics – 1.8% | |
| | 71,159 | | | United Parcel Service, Inc. Class B | | | 7,525,776 | |
| | |
| Automobiles – 1.0% | |
| | 120,539 | | | General Motors Co. | | | 4,440,657 | |
| | |
| Banks – 16.6% | |
| | 741,700 | | | Bank of America Corp. | | | 18,305,156 | |
| | 174,658 | | | BB&T Corp. | | | 8,422,009 | |
| | 35,001 | | | Citigroup, Inc. | | | 2,093,410 | |
| | 189,351 | | | JPMorgan Chase & Co. | | | 17,158,987 | |
| | 420,059 | | | Wells Fargo & Co. | | | 24,313,015 | |
| | | | | | | | |
| | | | | | | 70,292,577 | |
| | |
| Capital Markets – 3.8% | |
| | 133,236 | | | AllianceBernstein Holding LP | | | 3,157,693 | |
| | 186,901 | | | Invesco Ltd. | | | 6,016,343 | |
| | 151,749 | | | Morgan Stanley | | | 6,930,377 | |
| | | | | | | | |
| | | | | | | 16,104,413 | |
| | |
| Chemicals – 2.0% | |
| | 110,813 | | | E.I. du Pont de Nemours & Co. | | | 8,703,253 | |
| | |
| Communications Equipment – 2.9% | |
| | 367,506 | | | Cisco Systems, Inc. | | | 12,561,355 | |
| | |
| Consumer Finance – 4.0% | |
| | 138,113 | | | American Express Co. | | | 11,057,327 | |
| | 63,584 | | | Capital One Financial Corp. | | | 5,967,994 | |
| | | | | | | | |
| | | | | | | 17,025,321 | |
| | |
| Diversified Telecommunication Services – 2.7% | |
| | 235,334 | | | Verizon Communications, Inc. | | | 11,679,626 | |
| | |
| Electric Utilities – 4.7% | |
| | 61,916 | | | Duke Energy Corp. | | | 5,111,166 | |
| | 120,693 | | | FirstEnergy Corp. | | | 3,914,074 | |
| | 88,743 | | | PG&E Corp. | | | 5,923,595 | |
| | 60,020 | | | Pinnacle West Capital Corp. | | | 4,933,044 | |
| | | | | | | | |
| | | | | | | 19,881,879 | |
| | |
| Electrical Equipment – 1.9% | |
| | 46,495 | | | Eaton Corp. PLC | | | 3,346,710 | |
| | 81,978 | | | Emerson Electric Co. | | | 4,926,878 | |
| | | | | | | | |
| | | | | | | 8,273,588 | |
| | |
| Energy Equipment & Services – 0.5% | |
| | 26,531 | | | Schlumberger Ltd. | | | 2,132,031 | |
| | |
| Equity Real Estate Investment Trusts (REITs) – 2.6% | |
| | 35,771 | | | AvalonBay Communities, Inc. | | | 6,573,994 | |
| | 197,744 | | | RLJ Lodging Trust | | | 4,500,654 | |
| | | | | | | | |
| | | | | | | 11,074,648 | |
| | |
| Common Stocks – (continued) | |
| Food & Staples Retailing – 3.4% | |
| | 113,504 | | | Wal-Mart Stores, Inc. | | | 8,050,839 | |
| | 203,966 | | | Whole Foods Market, Inc. | | | 6,255,637 | |
| | | | | | | | |
| | | | | | | 14,306,476 | |
| | |
| Food Products – 2.1% | |
| | 76,392 | | | Campbell Soup Co. | | | 4,533,865 | |
| | 99,897 | | | Mondelez International, Inc. Class A | | | 4,387,476 | |
| | | | | | | | |
| | | | | | | 8,921,341 | |
| | |
| Health Care Equipment & Supplies – 2.2% | |
| | 203,394 | | | Abbott Laboratories | | | 9,169,001 | |
| | |
| Household Products – 3.1% | |
| | 143,807 | | | The Procter & Gamble Co. | | | 13,096,503 | |
| | |
| Independent Power and Renewable Electricity Producers – 0.6% | |
| | 146,720 | | | NRG Energy, Inc. | | | 2,429,683 | |
| | |
| Industrial Conglomerates – 3.3% | |
| | 464,480 | | | General Electric Co. | | | 13,846,149 | |
| | |
| Insurance – 4.0% | |
| | 90,968 | | | Lincoln National Corp. | | | 6,382,315 | |
| | 159,915 | | | MetLife, Inc. | | | 8,385,943 | |
| | 43,906 | | | The Hartford Financial Services Group, Inc. | | | 2,146,564 | |
| | | | | | | | |
| | | | | | | 16,914,822 | |
| | |
| Media – 2.7% | |
| | 78,293 | | | DISH Network Corp. Class A* | | | 4,854,166 | |
| | 154,779 | | | Viacom, Inc. Class B | | | 6,725,148 | |
| | | | | | | | |
| | | | | | | 11,579,314 | |
| | |
| Oil, Gas & Consumable Fuels – 9.9% | |
| | 233,122 | | | BP PLC ADR | | | 7,907,498 | |
| | 85,861 | | | Chevron Corp. | | | 9,659,363 | |
| | 254,598 | | | ConocoPhillips | | | 12,111,227 | |
| | 153,816 | | | Exxon Mobil Corp. | | | 12,508,317 | |
| | | | | | | | |
| | | | | | | 42,186,405 | |
| | |
| Pharmaceuticals – 9.0% | |
| | 65,286 | | | Eli Lilly & Co. | | | 5,406,334 | |
| | 63,536 | | | Johnson & Johnson | | | 7,764,735 | |
| | 89,275 | | | Merck & Co., Inc. | | | 5,880,544 | |
| | 557,834 | | | Pfizer, Inc. | | | 19,033,296 | |
| | | | | | | | |
| | | | | | | 38,084,909 | |
| | |
| Road & Rail – 1.9% | |
| | 76,473 | | | Union Pacific Corp. | | | 8,254,496 | |
| | |
| Semiconductors & Semiconductor Equipment – 2.7% | |
| | 171,422 | | | Intel Corp. | | | 6,205,476 | |
| | 74,689 | | | Maxim Integrated Products, Inc. | | | 3,308,723 | |
| | 31,427 | | | QUALCOMM, Inc. | | | 1,774,997 | |
| | | | | | | | |
| | | | | | | 11,289,196 | |
| | |
| | |
| The accompanying notes are an integral part of these financial statements. | | 41 |
GOLDMAN SACHS GROWTH AND INCOME FUND
Schedule of Investments (continued)
February 28, 2017 (Unaudited)
| | | | | | | | |
Shares | | | Description | | Value | |
| Common Stocks – (continued) | |
| Software – 3.8% | |
| | 173,039 | | | Microsoft Corp. | | $ | 11,071,035 | |
| | 115,998 | | | Oracle Corp. | | | 4,940,355 | |
| | | | | | | | |
| | | | | | | 16,011,390 | |
| | |
| Specialty Retail – 1.0% | |
| | 56,906 | | | Lowe’s Cos., Inc. | | | 4,232,099 | |
| | |
| Technology Hardware, Storage & Peripherals – 1.4% | |
| | 42,512 | | | Apple, Inc. | | | 5,823,719 | |
| | |
| Tobacco – 1.7% | |
| | 97,765 | | | Altria Group, Inc. | | | 7,324,554 | |
| | |
| | TOTAL COMMON STOCKS – 98.7% | | | | |
| | (Cost $347,691,001) | | $ | 419,059,537 | |
| | |
| OTHER ASSETS IN EXCESS OF
LIABILITIES – 1.3% | | | 5,416,363 | |
| | |
| | NET ASSETS – 100.0% | | $ | 424,475,900 | |
| | |
| | |
| The percentage shown for each investment category reflects the value of investments in that category as a percentage of net assets. |
* | | Non-income producing security. |
| | |
|
Investment Abbreviations: |
ADR | | —American Depositary Receipt |
LP | | —Limited Partnership |
PLC | | —Public Limited Company |
|
| | |
| 42 | | The accompanying notes are an integral part of these financial statements. |
GOLDMAN SACHS LARGE CAP VALUE FUND
Schedule of Investments
February 28, 2017 (Unaudited)
| | | | | | | | |
Shares | | | Description | | Value | |
| Common Stocks – 97.7% | |
| Aerospace & Defense – 1.0% | |
| | 247,536 | | | Textron, Inc. | | $ | 11,708,453 | |
| | |
| Airlines* – 0.8% | |
| | 430,253 | | | JetBlue Airways Corp. | | | 8,587,850 | |
| | |
| Automobiles – 0.8% | |
| | 235,979 | | | General Motors Co. | | | 8,693,466 | |
| | |
| Banks – 14.4% | |
| | 2,388,515 | | | Bank of America Corp. | | | 58,948,550 | |
| | 471,292 | | | JPMorgan Chase & Co. | | | 42,708,481 | |
| | 1,059,990 | | | Wells Fargo & Co. | | | 61,352,221 | |
| | | | | | | | |
| | | | | | | 163,009,252 | |
| | |
| Biotechnology* – 2.8% | |
| | 120,498 | | | Celgene Corp. | | | 14,882,708 | |
| | 191,598 | | | Vertex Pharmaceuticals, Inc. | | | 17,362,611 | |
| | | | | | | | |
| | | | | | | 32,245,319 | |
| | |
| Capital Markets – 4.6% | |
| | 594,111 | | | Deutsche Bank AG* | | | 11,698,046 | |
| | 574,792 | | | Invesco Ltd. | | | 18,502,554 | |
| | 478,952 | | | Morgan Stanley | | | 21,873,738 | |
| | | | | | | | |
| | | | | | | 52,074,338 | |
| | |
| Chemicals – 1.8% | |
| | 264,540 | | | E.I. du Pont de Nemours & Co. | | | 20,776,972 | |
| | |
| Communications Equipment – 2.0% | |
| | 663,555 | | | Cisco Systems, Inc. | | | 22,680,310 | |
| | |
| Construction & Engineering – 1.1% | |
| | 223,716 | | | Fluor Corp. | | | 12,391,629 | |
| | |
| Consumer Finance – 3.7% | |
| | 336,898 | | | American Express Co. | | | 26,972,054 | |
| | 155,959 | | | Capital One Financial Corp. | | | 14,638,312 | |
| | | | | | | | |
| | | | | | | 41,610,366 | |
| | |
| Containers & Packaging – 0.8% | |
| | 131,728 | | | Ball Corp. | | | 9,685,960 | |
| | |
| Diversified Telecommunication Services – 1.3% | |
| | 93,509 | | | Level 3 Communications, Inc.* | | | 5,353,390 | |
| | 188,382 | | | Verizon Communications, Inc. | | | 9,349,399 | |
| | | | | | | | |
| | | | | | | 14,702,789 | |
| | |
| Electric Utilities – 3.0% | |
| | 455,637 | | | FirstEnergy Corp. | | | 14,776,308 | |
| | 284,191 | | | PG&E Corp. | | | 18,969,749 | |
| | | | | | | | |
| | | | | | | 33,746,057 | |
| | |
| Electrical Equipment – 2.6% | |
| | 224,405 | | | Eaton Corp. PLC | | | 16,152,672 | |
| | 229,904 | | | Emerson Electric Co. | | | 13,817,230 | |
| | | | | | | | |
| | | | | | | 29,969,902 | |
| | |
| Common Stocks – (continued) | |
| Electronic Equipment, Instruments & Components – 1.7% | |
| | 332,569 | | | Corning, Inc. | | | 9,182,230 | |
| | 134,849 | | | TE Connectivity Ltd. | | | 10,042,205 | |
| | | | | | | | |
| | | | | | | 19,224,435 | |
| | |
| Energy Equipment & Services – 1.0% | |
| | 291,685 | | | National Oilwell Varco, Inc. | | | 11,789,908 | |
| | |
| Equity Real Estate Investment Trusts (REITs) – 3.0% | |
| | 77,960 | | | American Tower Corp. | | | 8,949,028 | |
| | 72,109 | | | AvalonBay Communities, Inc. | | | 13,252,192 | |
| | 113,358 | | | Vornado Realty Trust | | | 12,454,644 | |
| | | | | | | | |
| | | | | | | 34,655,864 | |
| | |
| Food & Staples Retailing – 1.6% | |
| | 196,093 | | | The Kroger Co. | | | 6,235,758 | |
| | 372,405 | | | Whole Foods Market, Inc. | | | 11,421,661 | |
| | | | | | | | |
| | | | | | | 17,657,419 | |
| | |
| Food Products – 2.1% | |
| | 134,060 | | | Campbell Soup Co. | | | 7,956,461 | |
| | 72,859 | | | Kellogg Co. | | | 5,396,666 | |
| | 227,237 | | | Mondelez International, Inc. Class A | | | 9,980,249 | |
| | | | | | | | |
| | | | | | | 23,333,376 | |
| | |
| Health Care Equipment & Supplies – 2.7% | |
| | 540,986 | | | Abbott Laboratories | | | 24,387,649 | |
| | 74,525 | | | Medtronic PLC | | | 6,029,818 | |
| | | | | | | | |
| | | | | | | 30,417,467 | |
| | |
| Health Care Providers & Services – 1.5% | |
| | 96,526 | | | Aetna, Inc. | | | 12,428,688 | |
| | 23,981 | | | Humana, Inc. | | | 5,065,986 | |
| | | | | | | | |
| | | | | | | 17,494,674 | |
| | |
| Household Products – 0.7% | |
| | 62,951 | | | Kimberly-Clark Corp. | | | 8,344,155 | |
| | |
| Industrial Conglomerates – 2.5% | |
| | 962,631 | | | General Electric Co. | | | 28,696,030 | |
| | |
| Insurance – 3.9% | |
| | 228,735 | | | Lincoln National Corp. | | | 16,048,047 | |
| | 428,593 | | | MetLife, Inc. | | | 22,475,417 | |
| | 117,673 | | | The Hartford Financial Services Group, Inc. | | | 5,753,033 | |
| | | | | | | | |
| | | | | | | 44,276,497 | |
| | |
| Internet Software & Services* – 1.8% | |
| | 23,731 | | | Alphabet, Inc. Class A | | | 20,051,034 | |
| | |
| IT Services – 0.7% | |
| | 90,844 | | | Visa, Inc. Class A | | | 7,988,821 | |
| | |
| Machinery – 1.5% | |
| | 175,277 | | | Caterpillar, Inc. | | | 16,942,275 | |
| | |
| | |
| The accompanying notes are an integral part of these financial statements. | | 43 |
GOLDMAN SACHS LARGE CAP VALUE FUND
Schedule of Investments (continued)
February 28, 2017 (Unaudited)
| | | | | | | | |
Shares | | | Description | | Value | |
| Common Stocks – (continued) | |
| Media – 3.7% | |
| | 265,488 | | | DISH Network Corp. Class A* | | $ | 16,460,256 | |
| | 257,878 | | | Liberty Global PLC Series C* | | | 9,048,939 | |
| | 385,888 | | | Viacom, Inc. Class B | | | 16,766,834 | |
| | | | | | | | |
| | | | | | | 42,276,029 | |
| | |
| Multiline Retail – 0.9% | |
| | 143,969 | | | Dollar General Corp. | | | 10,512,616 | |
| | |
| Oil, Gas & Consumable Fuels – 10.0% | |
| | 523,417 | | | BP PLC ADR | | | 17,754,304 | |
| | 167,117 | | | Chevron Corp. | | | 18,800,662 | |
| | 511,837 | | | ConocoPhillips | | | 24,348,086 | |
| | 333,818 | | | Exxon Mobil Corp. | | | 27,146,080 | |
| | 262,843 | | | Range Resources Corp. | | | 7,259,724 | |
| | 2,383,219 | | | Southwestern Energy Co.* | | | 17,897,975 | |
| | | | | | | | |
| | | | | | | 113,206,831 | |
| | |
| Personal Products – 1.1% | |
| | 644,393 | | | Coty, Inc. Class A | | | 12,101,701 | |
| | |
| Pharmaceuticals – 6.4% | |
| | 112,494 | | | Allergan PLC | | | 27,540,781 | |
| | 88,853 | | | Bristol-Myers Squibb Co. | | | 5,038,853 | |
| | 40,081 | | | Johnson & Johnson | | | 4,898,299 | |
| | 1,042,172 | | | Pfizer, Inc. | | | 35,558,909 | |
| | | | | | | | |
| | | | | | | 73,036,842 | |
| | |
| Road & Rail – 2.4% | |
| | 255,442 | | | Union Pacific Corp. | | | 27,572,409 | |
| | |
| Semiconductors & Semiconductor Equipment – 0.7% | |
| | 97,703 | | | Texas Instruments, Inc. | | | 7,486,004 | |
| | |
| Software – 3.6% | |
| | 724,380 | | | Oracle Corp. | | | 30,851,344 | |
| | 338,481 | | | Symantec Corp. | | | 9,670,402 | |
| | | | | | | | |
| | | | | | | 40,521,746 | |
| | |
| Specialty Retail – 1.0% | |
| | 40,551 | | | The Home Depot, Inc. | | | 5,876,245 | |
| | 71,444 | | | The TJX Cos., Inc. | | | 5,604,782 | |
| | | | | | | | |
| | | | | | | 11,481,027 | |
| | |
| Technology Hardware, Storage & Peripherals – 0.6% | |
| | 48,128 | | | Apple, Inc. | | | 6,593,055 | |
| | |
| Tobacco – 1.9% | |
| | 287,222 | | | Altria Group, Inc. | | | 21,518,672 | |
| | |
| | TOTAL COMMON STOCKS | | | | |
| | (Cost $906,945,654) | | $ | 1,109,061,550 | |
| | |
| | | | | | | | |
| Shares | | Distribution
Rate | | | Value | |
| Investment Company(a)(b) – 0.2% | |
Goldman Sachs Financial Square Government Fund – Institutional Shares | |
2,284,991 | | | 0.470 | % | | $ | 2,284,991 | |
| (Cost $2,284,991) | | | | | |
| |
| TOTAL INVESTMENTS – 97.9% | |
| (Cost $909,230,645) | | | $ | 1,111,346,541 | |
| |
OTHER ASSETS IN EXCESS OF LIABILITIES – 2.1% | | | | 24,150,554 | |
| |
| NET ASSETS – 100.0% | | | $ | 1,135,497,095 | |
| |
| | |
| The percentage shown for each investment category reflects the value of investments in that category as a percentage of net assets. |
* | | Non-income producing security. |
(a) | | Represents an Affiliated fund. |
(b) | | Variable rate security. Interest rate or distribution rate disclosed is that which is in effect on February 28, 2017. |
| | |
|
Investment Abbreviations: |
ADR | | —American Depositary Receipt |
PLC | | —Public Limited Company |
|
| | |
| 44 | | The accompanying notes are an integral part of these financial statements. |
GOLDMAN SACHS MID CAP VALUE FUND
Schedule of Investments
February 28, 2017 (Unaudited)
| | | | | | | | |
Shares | | | Description | | Value | |
| Common Stocks – 97.2% | |
| Aerospace & Defense – 2.5% | |
| | 360,655 | | | L3 Technologies, Inc. | | $ | 60,705,449 | |
| | 1,208,789 | | | Textron, Inc. | | | 57,175,720 | |
| | | | | | | | |
| | | | | | | 117,881,169 | |
| | |
| Airlines* – 1.3% | |
| | 3,161,903 | | | JetBlue Airways Corp. | | | 63,111,584 | |
| | |
| Banks – 7.2% | |
| | 1,577,035 | | | CIT Group, Inc. | | | 67,654,802 | |
| | 1,519,338 | | | Citizens Financial Group, Inc. | | | 56,777,661 | |
| | 5,512,431 | | | Huntington Bancshares, Inc. | | | 77,945,774 | |
| | 251,666 | | | Signature Bank* | | | 39,639,912 | |
| | 1,638,801 | | | SunTrust Banks, Inc. | | | 97,492,271 | |
| | | | | | | | |
| | | | | | | 339,510,420 | |
| | |
| Beverages – 1.2% | |
| | 578,633 | | | Molson Coors Brewing Co. Class B | | | 58,088,967 | |
| | |
| Biotechnology* – 1.4% | |
| | 307,151 | | | BioMarin Pharmaceutical, Inc. | | | 28,850,693 | |
| | 405,683 | | | Vertex Pharmaceuticals, Inc. | | | 36,762,994 | |
| | | | | | | | |
| | | | | | | 65,613,687 | |
| | |
| Capital Markets – 2.3% | |
| | 560,614 | | | Ameriprise Financial, Inc. | | | 73,720,741 | |
| | 459,736 | | | Raymond James Financial, Inc. | | | 36,116,860 | |
| | | | | | | | |
| | | | | | | 109,837,601 | |
| | |
| Chemicals – 2.3% | |
| | 702,917 | | | Celanese Corp. Series A | | | 62,679,109 | |
| | 833,141 | | | FMC Corp. | | | 48,005,584 | |
| | | | | | | | |
| | | | | | | 110,684,693 | |
| | |
| Commercial Services & Supplies – 1.1% | |
| | 580,615 | | | Waste Connections, Inc. | | | 50,739,945 | |
| | |
| Communications Equipment – 2.0% | |
| | 2,261,736 | | | Juniper Networks, Inc. | | | 63,328,608 | |
| | 2,894,583 | | | Viavi Solutions, Inc.* | | | 29,003,722 | |
| | | | | | | | |
| | | | | | | 92,332,330 | |
| | |
| Construction & Engineering – 1.3% | |
| | 1,048,252 | | | Jacobs Engineering Group, Inc. | | | 59,131,895 | |
| | |
| Construction Materials – 1.5% | |
| | 320,639 | | | Martin Marietta Materials, Inc. | | | 69,241,992 | |
| | |
| Consumer Finance – 3.6% | |
| | 5,735,613 | | | SLM Corp.* | | | 68,770,000 | |
| | 2,732,654 | | | Synchrony Financial | | | 99,031,381 | |
| | | | | | | | |
| | | | | | | 167,801,381 | |
| | |
| Containers & Packaging – 1.2% | |
| | 791,142 | | | Ball Corp. | | | 58,172,671 | |
| | |
| Diversified Financial Services – 0.7% | |
| | 818,410 | | | Voya Financial, Inc. | | | 33,743,044 | |
| | |
| Common Stocks – (continued) | |
| Diversified Telecommunication Services* – 0.4% | |
| | 326,967 | | | Level 3 Communications, Inc. | | | 18,718,861 | |
| | |
| Electric Utilities – 4.0% | |
| | 2,056,922 | | | FirstEnergy Corp. | | | 66,705,980 | |
| | 1,151,322 | | | PG&E Corp. | | | 76,850,744 | |
| | 569,032 | | | Pinnacle West Capital Corp. | | | 46,768,740 | |
| | | | | | | | |
| | | | | | | 190,325,464 | |
| | |
| Electrical Equipment – 1.6% | |
| | 1,410,914 | | | AMETEK, Inc. | | | 76,147,029 | |
| | |
| Electronic Equipment, Instruments & Components – 1.3% | |
| | 917,491 | | | Corning, Inc. | | | 25,331,926 | |
| | 1,649,589 | | | VeriFone Systems, Inc.* | | | 34,097,005 | |
| | | | | | | | |
| | | | | | | 59,428,931 | |
| | |
| Energy Equipment & Services – 2.5% | |
| | 397,140 | | | Baker Hughes, Inc. | | | 23,939,599 | |
| | 989,135 | | | Patterson-UTI Energy, Inc. | | | 27,319,909 | |
| | 1,136,976 | | | TechnipFMC PLC* | | | 36,747,064 | |
| | 562,762 | | | US Silica Holdings, Inc. | | | 28,458,875 | |
| | | | | | | | |
| | | | | | | 116,465,447 | |
| | |
| Equity Real Estate Investment Trusts (REITs) – 10.9% | |
| | 2,948,650 | | | Brixmor Property Group, Inc. | | | 68,821,491 | |
| | 531,074 | | | CyrusOne, Inc. | | | 27,031,667 | |
| | 3,376,681 | | | DDR Corp. | | | 48,826,807 | |
| | 909,564 | | | Equity Residential Properties Trust | | | 57,366,202 | |
| | 461,717 | | | Federal Realty Investment Trust | | | 64,977,433 | |
| | 796,612 | | | Mid-America Apartment Communities, Inc. | | | 81,835,951 | |
| | 2,263,011 | | | RLJ Lodging Trust | | | 51,506,130 | |
| | 586,559 | | | Taubman Centers, Inc. | | | 40,918,356 | |
| | 656,653 | | | Vornado Realty Trust | | | 72,146,465 | |
| | | | | | | | |
| | | | | | | 513,430,502 | |
| | |
| Food & Staples Retailing – 1.0% | |
| | 1,525,849 | | | Whole Foods Market, Inc. | | | 46,797,789 | |
| | |
| Food Products – 0.9% | |
| | 1,014,590 | | | Conagra Brands, Inc. | | | 41,811,254 | |
| | |
| Gas Utilities – 1.0% | |
| | 616,284 | | | Atmos Energy Corp. | | | 48,248,874 | |
| | |
| Health Care Equipment & Supplies – 1.4% | |
| | 572,689 | | | Zimmer Biomet Holdings, Inc. | | | 67,050,428 | |
| | |
| Health Care Providers & Services* – 2.4% | |
| | 715,365 | | | Centene Corp. | | | 50,433,233 | |
| | 425,936 | | | Laboratory Corp. of America Holdings | | | 60,593,655 | |
| | | | | | | | |
| | | | | | | 111,026,888 | |
| | |
| Hotels, Restaurants & Leisure* – 1.0% | |
| | 1,707,038 | | | MGM Resorts International | | | 44,878,029 | |
| | |
| | |
| The accompanying notes are an integral part of these financial statements. | | 45 |
GOLDMAN SACHS MID CAP VALUE FUND
Schedule of Investments (continued)
February 28, 2017 (Unaudited)
| | | | | | | | |
Shares | | | Description | | Value | |
| Common Stocks – (continued) | |
| Household Durables* – 0.7% | |
| | 910,211 | | | Toll Brothers, Inc. | | $ | 31,074,603 | |
| | |
| Insurance – 4.9% | |
| | 499,868 | | | Arch Capital Group Ltd.* | | | 47,272,517 | |
| | 475,589 | | | Arthur J. Gallagher & Co. | | | 27,084,793 | |
| | 814,446 | | | Lincoln National Corp. | | | 57,141,531 | |
| | 1,399,025 | | | The Hartford Financial Services Group, Inc. | | | 68,398,332 | |
| | 465,681 | | | W.R. Berkley Corp. | | | 33,072,665 | |
| | | | | | | | |
| | | | | | | 232,969,838 | |
| | |
| Internet & Direct Marketing Retail – 1.3% | |
| | 507,295 | | | Expedia, Inc. | | | 60,388,397 | |
| | |
| Internet Software & Services* – 1.4% | |
| | 603,241 | | | IAC/InterActiveCorp. | | | 44,603,640 | |
| | 1,626,911 | | | Pandora Media, Inc.(a) | | | 20,141,158 | |
| | | | | | | | |
| | | | | | | 64,744,798 | |
| | |
| IT Services – 1.7% | |
| | 474,809 | | | Computer Sciences Corp. | | | 32,552,905 | |
| | 592,504 | | | Fidelity National Information Services, Inc. | | | 48,745,304 | |
| | | | | | | | |
| | | | | | | 81,298,209 | |
| | |
| Machinery – 3.9% | |
| | 644,027 | | | Stanley Black & Decker, Inc. | | | 81,888,033 | |
| | 1,399,851 | | | Trinity Industries, Inc. | | | 37,572,001 | |
| | 774,425 | | | Wabtec Corp. | | | 62,046,931 | |
| | | | | | | | |
| | | | | | | 181,506,965 | |
| | |
| Media – 3.8% | |
| | 1,123,579 | | | Discovery Communications, Inc. Class A* | | | 32,314,132 | |
| | 1,041,128 | | | DISH Network Corp. Class A* | | | 64,549,936 | |
| | 167,128 | | | Liberty Broadband Corp. Class C* | | | 14,362,980 | |
| | 609,262 | | | Liberty Media Corp-Liberty Formula One Class C* | | | 18,704,343 | |
| | 1,183,028 | | | Viacom, Inc. Class B | | | 51,402,567 | |
| | | | | | | | |
| | | | | | | 181,333,958 | |
| | |
| Metals & Mining – 1.7% | |
| | 2,801,791 | | | Freeport-McMoRan, Inc.* | | | 37,544,000 | |
| | 1,139,432 | | | Steel Dynamics, Inc. | | | 41,703,211 | |
| | | | | | | | |
| | | | | | | 79,247,211 | |
| | |
| Mortgage Real Estate Investment Trusts (REITs) – 1.2% | |
| | 1,244,458 | | | Starwood Property Trust, Inc. | | | 28,448,310 | |
| | 3,087,362 | | | Two Harbors Investment Corp. | | | 28,712,466 | |
| | | | | | | | |
| | | | | | | 57,160,776 | |
| | |
| Multi-Utilities – 1.6% | |
| | 437,939 | | | Sempra Energy | | | 48,300,292 | |
| | 448,381 | | | Vectren Corp. | | | 25,266,270 | |
| | | | | | | | |
| | | | | | | 73,566,562 | |
| | |
| Common Stocks – (continued) | |
| Multiline Retail – 0.7% | |
| | 464,844 | | | Dollar General Corp. | | | 33,942,909 | |
| | |
| Oil, Gas & Consumable Fuels – 7.9% | |
| | 398,306 | | | Anadarko Petroleum Corp. | | | 25,750,483 | |
| | 1,507,061 | | | Antero Resources Corp.* | | | 36,139,323 | |
| | 187,979 | | | Cimarex Energy Co. | | | 23,632,720 | |
| | 2,007,422 | | | Encana Corp. | | | 22,282,384 | |
| | 937,306 | | | Marathon Petroleum Corp. | | | 46,490,378 | |
| | 1,017,987 | | | Newfield Exploration Co.* | | | 37,115,806 | |
| | 625,510 | | | Parsley Energy, Inc. Class A* | | | 19,009,249 | |
| | 108,974 | | | Pioneer Natural Resources Co. | | | 20,265,895 | |
| | 625,306 | | | Rice Energy, Inc.* | | | 11,661,957 | |
| | 1,010,182 | | | RSP Permian, Inc.* | | | 39,892,087 | |
| | 1,799,313 | | | The Williams Cos., Inc. | | | 50,992,530 | |
| | 2,925,816 | | | WPX Energy, Inc.* | | | 37,743,026 | |
| | | | | | | | |
| | | | | | | 370,975,838 | |
| | |
| Road & Rail* – 1.2% | |
| | 599,895 | | | Old Dominion Freight Line, Inc. | | | 55,046,365 | |
| | |
| Semiconductors & Semiconductor Equipment – 1.7% | |
| | 3,318,983 | | | Marvell Technology Group Ltd. | | | 51,776,135 | |
| | 435,248 | | | Qorvo, Inc.* | | | 28,769,893 | |
| | | | | | | | |
| | | | | | | 80,546,028 | |
| | |
| Software – 1.7% | |
| | 549,520 | | | Activision Blizzard, Inc. | | | 24,799,837 | |
| | 1,311,524 | | | Symantec Corp. | | | 37,470,241 | |
| | 473,607 | | | Verint Systems, Inc.* | | | 17,878,664 | |
| | | | | | | | |
| | | | | | | 80,148,742 | |
| | |
| Specialty Retail – 1.1% | |
| | 23,541 | | | AutoZone, Inc.* | | | 17,339,123 | |
| | 639,464 | | | L Brands, Inc. | | | 33,648,596 | |
| | | | | | | | |
| | | | | | | 50,987,719 | |
| | |
| Textiles, Apparel & Luxury Goods* – 0.5% | |
| | 1,001,894 | | | Kate Spade & Co. | | | 23,905,191 | |
| | |
| Trading Companies & Distributors – 1.0% | |
| | 487,593 | | | MSC Industrial Direct Co., Inc. Class A | | | 49,046,980 | |
| | |
| Water Utilities – 1.2% | |
| | 725,273 | | | American Water Works Co., Inc. | | | 56,571,294 | |
| | |
| | TOTAL COMMON STOCKS | | | | |
| | (Cost $3,918,318,953) | | $ | 4,574,683,258 | |
| | |
| | |
| 46 | | The accompanying notes are an integral part of these financial statements. |
GOLDMAN SACHS MID CAP VALUE FUND
| | | | | | | | |
| Shares | | | Distribution Rate | | Value | |
| Investment Company(b)(c) – 1.5% | |
| Goldman Sachs Financial Square Government Fund –
Institutional Shares |
|
| | 70,854,621 | | | 0.470% | | $ | 70,854,621 | |
| | (Cost $70,854,621) | | | | |
| | |
| TOTAL INVESTMENTS BEFORE SECURITIES
LENDING REINVESTMENT VEHICLE |
|
| | (Cost $3,989,173,574) | | $ | 4,645,537,879 | |
| | |
| | | | | | | | |
| Securities Lending Reinvestment Vehicle(b)(c) – 0.4% | |
| Goldman Sachs Financial Square Government Fund –
Institutional Shares |
|
| | 21,380,300 | | | 0.470% | | $ | 21,380,300 | |
| | (Cost $21,380,300) | | | | |
| | |
| | TOTAL INVESTMENTS – 99.1% | |
| | (Cost $4,010,553,874) | | $ | 4,666,918,179 | |
| | |
| OTHER ASSETS IN EXCESS OF
LIABILITIES – 0.9% | | | 40,393,600 | |
| | |
| | NET ASSETS – 100.0% | | $ | 4,707,311,779 | |
| | |
| | |
| The percentage shown for each investment category reflects the value of investments in that category as a percentage of net assets. |
* | | Non-income producing security. |
(a) | | All or a portion of security is on loan. |
(b) | | Represents an Affiliated fund. |
(c) | | Variable rate security. Interest rate or distribution rate disclosed is that which is in effect on February 28, 2017. |
| | |
|
Investment Abbreviations: |
PLC | | —Public Limited Company |
|
| | |
| The accompanying notes are an integral part of these financial statements. | | 47 |
GOLDMAN SACHS SMALL CAP VALUE FUND
Schedule of Investments
February 28, 2017 (Unaudited)
| | | | | | | | |
Shares | | | Description | | Value | |
| Common Stocks – 97.1% | |
| Aerospace & Defense – 2.7% | |
| | 304,286 | | | Curtiss-Wright Corp. | | $ | 29,768,300 | |
| | 255,349 | | | DigitalGlobe, Inc.* | | | 8,081,796 | |
| | 394,563 | | | Esterline Technologies Corp.* | | | 35,076,651 | |
| | 972,471 | | | KLX, Inc.* | | | 48,954,190 | |
| | 756,112 | | | Mercury Systems, Inc.* | | | 28,248,344 | |
| | 532,535 | | | Moog, Inc. Class A* | | | 35,988,715 | |
| | | | | | | | |
| | | | | | | 186,117,996 | |
| | |
| Air Freight & Logistics – 1.4% | |
| | 352,639 | | | Forward Air Corp. | | | 17,473,262 | |
| | 1,617,831 | | | XPO Logistics, Inc.* | | | 82,493,203 | |
| | | | | | | | |
| | | | | | | 99,966,465 | |
| | |
| Airlines* – 0.2% | |
| | 293,059 | | | Spirit Airlines, Inc. | | | 15,300,610 | |
| | |
| Auto Components – 0.7% | |
| | 92,910 | | | Cooper Tire & Rubber Co. | | | 3,758,210 | |
| | 1,225,100 | | | Dana, Inc. | | | 23,142,139 | |
| | 200,462 | | | Standard Motor Products, Inc. | | | 9,616,162 | |
| | 347,937 | | | Tower International, Inc. | | | 9,620,458 | |
| | | | | | | | |
| | | | | | | 46,136,969 | |
| | |
| Automobiles – 0.2% | |
| | 486,190 | | | Winnebago Industries, Inc. | | | 16,044,270 | |
| | |
| Banks – 20.4% | |
| | 560,429 | | | Ameris Bancorp | | | 27,068,721 | |
| | 986,063 | | | BancorpSouth, Inc. | | | 30,567,953 | |
| | 575,332 | | | Bank of the Ozarks, Inc. | | | 31,487,920 | |
| | 963,853 | | | Banner Corp. | | | 56,019,136 | |
| | 1,042,015 | | | BNC Bancorp | | | 37,460,439 | |
| | 1,634,858 | | | Boston Private Financial Holdings, Inc. | | | 28,119,558 | |
| | 1,316,109 | | | Brookline Bancorp, Inc. | | | 20,860,328 | |
| | 693,521 | | | CenterState Banks, Inc. | | | 17,136,904 | |
| | 1,007,554 | | | CoBiz, Inc. | | | 17,178,796 | |
| | 1,172,567 | | | Columbia Banking System, Inc. | | | 46,773,698 | |
| | 691,642 | | | Community Bank System, Inc. | | | 41,090,451 | |
| | 771,218 | | | ConnectOne Bancorp, Inc. | | | 19,357,572 | |
| | 362,275 | | | CU Bancorp* | | | 14,237,407 | |
| | 2,147,793 | | | CVB Financial Corp. | | | 51,010,084 | |
| | 957,329 | | | First Financial Bankshares, Inc.(a) | | | 42,122,476 | |
| | 1,039,535 | | | First Merchants Corp. | | | 41,706,144 | |
| | 1,196,115 | | | First Midwest Bancorp, Inc. | | | 29,221,089 | |
| | 766,341 | | | Flushing Financial Corp. | | | 21,411,568 | |
| | 1,206,565 | | | Glacier Bancorp, Inc. | | | 44,546,380 | |
| | 1,299,287 | | | Great Western Bancorp, Inc. | | | 55,531,526 | |
| | 627,873 | | | Heritage Financial Corp. | | | 15,696,825 | |
| | 1,218,601 | | | Home BancShares, Inc. | | | 34,291,432 | |
| | 563,896 | | | Independent Bank Corp. | | | 36,653,240 | |
| | 287,444 | | | Independent Bank Group, Inc. | | | 18,195,205 | |
| | 474,249 | | | Lakeland Financial Corp. | | | 21,526,162 | |
| | 1,380,181 | | | LegacyTexas Financial Group, Inc. | | | 58,781,909 | |
| | 1,255,681 | | | MB Financial, Inc. | | | 56,530,759 | |
| | 1,001,765 | | | PacWest Bancorp | | | 55,197,251 | |
| | |
| Common Stocks – (continued) | |
| Banks – (continued) | |
| | 829,980 | | | Pinnacle Financial Partners, Inc. | | | 57,600,612 | |
| | 397,641 | | | PrivateBancorp, Inc. | | | 22,506,481 | |
| | 832,891 | | | Prosperity Bancshares, Inc. | | | 62,083,695 | |
| | 1,098,978 | | | Renasant Corp. | | | 45,102,057 | |
| | 405,649 | | | Sandy Spring Bancorp, Inc. | | | 17,467,246 | |
| | 492,857 | | | South State Corp. | | | 44,110,701 | |
| | 829,617 | | | State Bank Financial Corp. | | | 22,507,509 | |
| | 693,586 | | | Texas Capital Bancshares, Inc.* | | | 61,833,192 | |
| | 414,177 | | | The First of Long Island Corp. | | | 11,389,868 | |
| | 450,547 | | | TriCo Bancshares | | | 16,368,373 | |
| | 1,759,514 | | | Webster Financial Corp. | | | 96,650,104 | |
| | | | | | | | |
| | | | | | | 1,427,400,771 | |
| | |
| Building Products* – 0.9% | |
| | 816,497 | | | Gibraltar Industries, Inc. | | | 33,843,801 | |
| | 148,063 | | | Masonite International Corp. | | | 11,563,720 | |
| | 242,831 | | | Patrick Industries, Inc. | | | 19,390,055 | |
| | | | | | | | |
| | | | | | | 64,797,576 | |
| | |
| Capital Markets – 1.4% | |
| | 426,511 | | | Golub Capital BDC, Inc.(a) | | | 8,163,421 | |
| | 1,640,762 | | | OM Asset Management PLC | | | 24,463,761 | |
| | 996,098 | | | Stifel Financial Corp.* | | | 53,749,448 | |
| | 634,636 | | | Virtu Financial, Inc. Class A(a) | | | 11,010,935 | |
| | | | | | | | |
| | | | | | | 97,387,565 | |
| | |
| Chemicals – 1.9% | |
| | 593,955 | | | Minerals Technologies, Inc. | | | 45,883,024 | |
| | 499,099 | | | Olin Corp. | | | 15,511,997 | |
| | 148,534 | | | Quaker Chemical Corp. | | | 19,558,957 | |
| | 318,234 | | | Trinseo SA | | | 22,005,881 | |
| | 638,241 | | | Tronox Ltd. Class A | | | 11,060,716 | |
| | 285,288 | | | W.R. Grace & Co. | | | 20,209,802 | |
| | | | | | | | |
| | | | | | | 134,230,377 | |
| | |
| Commercial Services & Supplies – 1.3% | |
| | 1,189,816 | | | ABM Industries, Inc. | | | 48,532,595 | |
| | 1,009,254 | | | Advanced Disposal Services, Inc.* | | | 22,082,477 | |
| | 682,026 | | | Mobile Mini, Inc. | | | 22,199,946 | |
| | | | | | | | |
| | | | | | | 92,815,018 | |
| | |
| Communications Equipment* – 1.5% | |
| | 1,056,133 | | | Ixia | | | 20,700,207 | |
| | 1,058,074 | | | NetScout Systems, Inc. | | | 39,095,834 | |
| | 4,609,873 | | | Viavi Solutions, Inc. | | | 46,190,928 | |
| | | | | | | | |
| | | | | | | 105,986,969 | |
| | |
| Construction & Engineering – 0.9% | |
| | 735,815 | | | EMCOR Group, Inc. | | | 45,237,906 | |
| | 362,657 | | | Granite Construction, Inc. | | | 19,224,448 | |
| | | | | | | | |
| | | | | | | 64,462,354 | |
| | |
| | |
| 48 | | The accompanying notes are an integral part of these financial statements. |
GOLDMAN SACHS SMALL CAP VALUE FUND
| | | | | | | | |
Shares | | | Description | | Value | |
| Common Stocks – (continued) | |
| Construction Materials – 1.0% | |
| | 433,938 | | | Eagle Materials, Inc. | | $ | 45,003,710 | |
| | 1,130,176 | | | Summit Materials, Inc. Class A* | | | 26,999,905 | |
| | | | | | | | |
| | | | | | | 72,003,615 | |
| | |
| Containers & Packaging* – 0.6% | |
| | 896,236 | | | Berry Plastics Group, Inc. | | | 45,107,558 | |
| | |
| Electric Utilities – 2.4% | |
| | 641,476 | | | IDACORP, Inc. | | | 53,197,605 | |
| | 1,582,484 | | | PNM Resources, Inc. | | | 57,444,169 | |
| | 1,277,981 | | | Portland General Electric Co. | | | 57,930,879 | |
| | | | | | | | |
| | | | | | | 168,572,653 | |
| | |
| Electrical Equipment* – 0.3% | |
| | 1,012,731 | | | Thermon Group Holdings, Inc. | | | 20,416,657 | |
| | |
| Electronic Equipment, Instruments & Components – 2.6% | |
| | 446,551 | | | Anixter International, Inc.* | | | 37,197,698 | |
| | 1,030,580 | | | CTS Corp. | | | 22,569,702 | |
| | 303,037 | | | OSI Systems, Inc.* | | | 22,855,051 | |
| | 414,609 | | | SYNNEX Corp. | | | 48,476,084 | |
| | 564,761 | | | Tech Data Corp.* | | | 49,134,207 | |
| | | | | | | | |
| | | | | | | 180,232,742 | |
| | |
| Energy Equipment & Services – 1.0% | |
| | 470,826 | | | Basic Energy Services, Inc.* | | | 18,541,128 | |
| | 353,752 | | | C&J Energy Services, Inc.* | | | 14,150,080 | |
| | 2,083,707 | | | Fairmount Santrol Holdings, Inc.* | | | 19,753,542 | |
| | 307,178 | | | Keane Group, Inc.* | | | 5,381,759 | |
| | 936,611 | | | Superior Energy Services, Inc. | | | 15,454,081 | |
| | | | | | | | |
| | | | | | | 73,280,590 | |
| | |
| Equity Real Estate Investment Trusts (REITs) – 7.9% | |
| | 1,568,988 | | | Acadia Realty Trust | | | 50,254,686 | |
| | 1,734,569 | | | Care Capital Properties, Inc. | | | 45,601,819 | |
| | 2,431,592 | | | Chesapeake Lodging Trust | | | 58,747,263 | |
| | 605,567 | | | Columbia Property Trust, Inc. | | | 13,982,542 | |
| | 1,002,344 | | | CyrusOne, Inc. | | | 51,019,310 | |
| | 437,848 | | | Highwoods Properties, Inc. | | | 22,982,642 | |
| | 890,808 | | | Hudson Pacific Properties, Inc. | | | 32,585,757 | |
| | 762,538 | | | Life Storage, Inc. | | | 67,583,743 | |
| | 467,851 | | | Mid-America Apartment Communities, Inc. | | | 48,062,333 | |
| | 2,502,671 | | | Pebblebrook Hotel Trust | | | 71,951,791 | |
| | 290,031 | | | PS Business Parks, Inc. | | | 33,704,502 | |
| | 1,262,708 | | | RLJ Lodging Trust | | | 28,739,234 | |
| | 962,342 | | | Terreno Realty Corp. | | | 26,656,873 | |
| | | | | | | | |
| | | | | | | 551,872,495 | |
| | |
| Food & Staples Retailing – 0.4% | |
| | 334,602 | | | SpartanNash Co. | | | 11,677,610 | |
| | 3,403,772 | | | SUPERVALU, Inc.* | | | 12,866,258 | |
| | | | | | | | |
| | | | | | | 24,543,868 | |
| | |
| Common Stocks – (continued) | |
| Food Products – 1.1% | |
| | 1,371,358 | | | AdvancePierre Foods Holdings, Inc. | | | 39,714,527 | |
| | 600,352 | | | Pinnacle Foods, Inc. | | | 34,298,110 | |
| | | | | | | | |
| | | | | | | 74,012,637 | |
| | |
| Gas Utilities – 2.1% | |
| | 1,669,431 | | | New Jersey Resources Corp. | | | 65,775,581 | |
| | 12,218 | | | ONE Gas, Inc. | | | 800,890 | |
| | 1,375,575 | | | South Jersey Industries, Inc. | | | 48,172,637 | |
| | 392,828 | | | Southwest Gas Holdings, Inc. | | | 33,598,579 | |
| | | | | | | | |
| | | | | | | 148,347,687 | |
| | |
| Health Care Equipment & Supplies – 1.8% | |
| | 646,037 | | | CONMED Corp. | | | 26,888,060 | |
| | 374,923 | | | Hill-Rom Holdings, Inc. | | | 24,913,633 | |
| | 125,528 | | | ICU Medical, Inc.* | | | 18,879,411 | |
| | 657,887 | | | Integra LifeSciences Holdings Corp.* | | | 28,118,090 | |
| | 985,728 | | | Wright Medical Group NV*(a) | | | 27,482,097 | |
| | | | | | | | |
| | | | | | | 126,281,291 | |
| | |
| Health Care Providers & Services* – 1.4% | |
| | 611,644 | | | Acadia Healthcare Co., Inc.(a) | | | 27,352,720 | |
| | 356,647 | | | Almost Family, Inc. | | | 17,707,524 | |
| | 468,310 | | | American Renal Associates Holdings, Inc.(a) | | | 10,583,806 | |
| | 443,069 | | | AMN Healthcare Services, Inc. | | | 18,232,289 | |
| | 324,100 | | | Envision Healthcare Corp. | | | 22,687,000 | |
| | | | | | | | |
| | | | | | | 96,563,339 | |
| | |
| Health Care Technology* – 0.2% | |
| | 627,036 | | | HMS Holdings Corp. | | | 11,681,681 | |
| | |
| Hotels, Restaurants & Leisure – 2.6% | |
| | 329,029 | | | Bojangles’, Inc.* | | | 6,926,060 | |
| | 1,030,380 | | | Extended Stay America, Inc. | | | 17,825,574 | |
| | 466,368 | | | Jack in the Box, Inc. | | | 43,703,345 | |
| | 527,077 | | | Marriott Vacations Worldwide Corp. | | | 49,508,343 | |
| | 1,050,184 | | | Red Rock Resorts, Inc. Class A | | | 23,072,543 | |
| | 274,962 | | | Sonic Corp. | | | 6,951,039 | |
| | 201,965 | | | Vail Resorts, Inc. | | | 36,592,019 | |
| | | | | | | | |
| | | | | | | 184,578,923 | |
| | |
| Household Durables – 0.7% | |
| | 98,484 | | | CalAtlantic Group, Inc.(a) | | | 3,479,440 | |
| | 470,449 | | | Meritage Homes Corp.* | | | 16,724,462 | |
| | 557,771 | | | TopBuild Corp.* | | | 23,415,227 | |
| | 454,259 | | | William Lyon Homes Class A*(a) | | | 8,371,993 | |
| | | | | | | | |
| | | | | | | 51,991,122 | |
| | |
| Household Products – 0.3% | |
| | 173,508 | | | Spectrum Brands Holdings, Inc. | | | 23,548,506 | |
| | |
| Insurance – 4.0% | |
| | 246,384 | | | Allied World Assurance Co. Holdings AG | | | 13,014,003 | |
| | 301,370 | | | AMERISAFE, Inc. | | | 19,378,091 | |
| | |
| | |
| The accompanying notes are an integral part of these financial statements. | | 49 |
GOLDMAN SACHS SMALL CAP VALUE FUND
Schedule of Investments (continued)
February 28, 2017 (Unaudited)
| | | | | | | | |
Shares | | | Description | | Value | |
| Common Stocks – (continued) | |
| Insurance – (continued) | |
| | 743,878 | | | AmTrust Financial Services, Inc. | | $ | 17,109,194 | |
| | 2,760,043 | | | CNO Financial Group, Inc. | | | 57,712,499 | |
| | 86,280 | | | Enstar Group Ltd.* | | | 16,716,750 | |
| | 469,037 | | | Kinsale Capital Group, Inc. | | | 13,766,236 | |
| | 1,735,573 | | | Maiden Holdings Ltd. | | | 26,814,603 | |
| | 1,330,252 | | | National General Holdings Corp. | | | 32,378,333 | |
| | 304,632 | | | Primerica, Inc. | | | 24,599,034 | |
| | 503,038 | | | ProAssurance Corp. | | | 29,729,546 | |
| | 537,894 | | | RLI Corp. | | | 31,439,904 | |
| | 14,346 | | | Selective Insurance Group, Inc. | | | 635,528 | |
| | | | | | | | |
| | | | | | | 283,293,721 | |
| | |
| Internet Software & Services* – 0.4% | |
| | 671,105 | | | Cornerstone OnDemand, Inc. | | | 28,032,056 | |
| | |
| IT Services – 0.7% | |
| | 905,651 | | | Convergys Corp. | | | 19,815,644 | |
| | 229,568 | | | DST Systems, Inc. | | | 27,456,333 | |
| | | | | | | | |
| | | | | | | 47,271,977 | |
| | |
| Life Sciences Tools & Services* – 0.8% | |
| | 490,789 | | | PRA Health Sciences, Inc. | | | 28,961,459 | |
| | 895,853 | | | VWR Corp. | | | 25,173,469 | |
| | | | | | | | |
| | | | | | | 54,134,928 | |
| | |
| Machinery – 3.4% | |
| | 553,870 | | | Barnes Group, Inc. | | | 27,754,426 | |
| | 211,323 | | | CIRCOR International, Inc. | | | 13,125,271 | |
| | 1,385,471 | | | Federal Signal Corp. | | | 20,615,808 | |
| | 1,030,168 | | | ITT, Inc. | | | 42,205,983 | |
| | 152,882 | | | RBC Bearings, Inc.* | | | 14,263,891 | |
| | 608,097 | | | Rexnord Corp.* | | | 13,481,510 | |
| | 192,616 | | | Standex International Corp. | | | 18,394,828 | |
| | 979,216 | | | Terex Corp. | | | 30,590,708 | |
| | 1,515,219 | | | TriMas Corp.* | | | 33,410,579 | |
| | 427,067 | | | Watts Water Technologies, Inc. Class A | | | 27,310,935 | |
| | | | | | | | |
| | | | | | | 241,153,939 | |
| | |
| Media – 2.1% | |
| | 1,627,282 | | | Live Nation Entertainment, Inc.* | | | 46,231,082 | |
| | 526,614 | | | Nexstar Media Group, Inc. | | | 36,310,035 | |
| | 1,299,855 | | | Regal Entertainment Group Class A(a) | | | 28,050,871 | |
| | 912,145 | | | TEGNA, Inc. | | | 23,378,276 | |
| | 876,012 | | | Time, Inc. | | | 15,374,011 | |
| | | | | | | | |
| | | | | | | 149,344,275 | |
| | |
| Metals & Mining – 1.7% | |
| | 4,105,141 | | | AK Steel Holding Corp.* | | | 34,195,825 | |
| | 239,120 | | | Allegheny Technologies, Inc.(a) | | | 4,593,495 | |
| | 482,253 | | | Century Aluminum Co.* | | | 6,792,533 | |
| | 1,154,713 | | | Cliffs Natural Resources, Inc.* | | | 12,309,241 | |
| | 691,242 | | | Commercial Metals Co. | | | 14,605,943 | |
| | 1,909,172 | | | Hecla Mining Co. | | | 10,653,180 | |
| | 204,394 | | | Kaiser Aluminum Corp. | | | 16,112,379 | |
| | |
| Common Stocks – (continued) | |
| Metals & Mining – (continued) | |
| | 157,941 | | | Royal Gold, Inc. | | | 10,432,003 | |
| | 857,760 | | | Ryerson Holding Corp.* | | | 9,306,696 | |
| | | | | | | | |
| | | | | | | 119,001,295 | |
| | |
| Mortgage Real Estate Investment Trusts (REITs) – 1.8% | |
| | 1,488,147 | | | Blackstone Mortgage Trust, Inc. Class A | | | 46,340,898 | |
| | 1,866,419 | | | PennyMac Mortgage Investment Trust | | | 31,467,824 | |
| | 5,128,614 | | | Two Harbors Investment Corp. | | | 47,696,110 | |
| | | | | | | | |
| | | | | | | 125,504,832 | |
| | |
| Multi-Utilities – 0.7% | |
| | 758,136 | | | Black Hills Corp. | | | 49,187,864 | |
| | |
| Multiline Retail*(a) – 0.0% | |
| | 503,185 | | | J.C. Penney Co., Inc. | | | 3,190,193 | |
| | |
| Oil, Gas & Consumable Fuels – 4.5% | |
| | 2,232,967 | | | Callon Petroleum Co.* | | | 28,180,043 | |
| | 665,914 | | | Carrizo Oil & Gas, Inc.* | | | 21,675,501 | |
| | 1,437,633 | | | Golar LNG Ltd. | | | 39,261,757 | |
| | 1,316,854 | | | Jagged Peak Energy, Inc.*(a) | | | 18,133,080 | |
| | 728,402 | | | PDC Energy, Inc.* | | | 49,232,691 | |
| | 1,521,260 | | | Rice Energy, Inc.* | | | 28,371,499 | |
| | 1,476,046 | | | RSP Permian, Inc.* | | | 58,289,056 | |
| | 652,543 | | | SM Energy Co. | | | 16,085,185 | |
| | 2,671,134 | | | Synergy Resources Corp.* | | | 21,823,165 | |
| | 2,750,742 | | | WPX Energy, Inc.* | | | 35,484,572 | |
| | | | | | | | |
| | | | | | | 316,536,549 | |
| | |
| Paper & Forest Products – 0.5% | |
| | 1,305,054 | | | KapStone Paper & Packaging Corp. | | | 29,494,220 | |
| | 400,639 | | | Mercer International, Inc. | | | 4,827,700 | |
| | | | | | | | |
| | | | | | | 34,321,920 | |
| | |
| Personal Products* – 0.0% | |
| | 580,086 | | | Avon Products, Inc. | | | 2,552,378 | |
| | |
| Pharmaceuticals* – 0.5% | |
| | 862,420 | | | Catalent, Inc. | | | 24,751,454 | |
| | 132,607 | | | Prestige Brands Holdings, Inc. | | | 7,508,208 | |
| | | | | | | | |
| | | | | | | 32,259,662 | |
| | |
| Professional Services* – 0.5% | |
| | 672,480 | | | On Assignment, Inc. | | | 31,734,331 | |
| | |
| Real Estate Management & Development – 0.6% | |
| | 2,007,638 | | | Kennedy-Wilson Holdings, Inc. | | | 44,268,418 | |
| | |
| Road & Rail – 0.7% | |
| | 592,542 | | | Knight Transportation, Inc. | | | 19,376,123 | |
| | 216,176 | | | Marten Transport Ltd. | | | 5,307,121 | |
| | 500,434 | | | Saia, Inc.* | | | 24,195,984 | |
| | | | | | | | |
| | | | | | | 48,879,228 | |
| | |
| | |
| 50 | | The accompanying notes are an integral part of these financial statements. |
GOLDMAN SACHS SMALL CAP VALUE FUND
| | | | | | | | |
Shares | | | Description | | Value | |
| Common Stocks – (continued) | |
| Semiconductors & Semiconductor Equipment – 3.1% | |
| | 313,197 | | | Cabot Microelectronics Corp. | | $ | 21,679,496 | |
| | 2,499,086 | | | Cypress Semiconductor Corp. | | | 33,162,871 | |
| | 2,410,872 | | | Entegris, Inc.* | | | 51,110,486 | |
| | 449,580 | | | MACOM Technology Solutions Holdings, Inc.* | | | 20,721,142 | |
| | 530,103 | | | MKS Instruments, Inc. | | | 34,774,757 | |
| | 1,151,858 | | | Semtech Corp.* | | | 38,529,650 | |
| | 208,549 | | | Silicon Laboratories, Inc.* | | | 14,077,058 | |
| | | | | | | | |
| | | | | | | 214,055,460 | |
| | |
| Software* – 1.8% | |
| | 714,368 | | | Bottomline Technologies de, Inc. | | | 17,823,482 | |
| | 849,684 | | | CommVault Systems, Inc. | | | 41,677,000 | |
| | 319,173 | | | Imperva, Inc. | | | 13,086,093 | |
| | 1,429,184 | | | Verint Systems, Inc. | | | 53,951,696 | |
| | | | | | | | |
| | | | | | | 126,538,271 | |
| | |
| Specialty Retail – 2.4% | |
| | 929,614 | | | Boot Barn Holdings, Inc.*(a) | | | 9,547,136 | |
| | 660,756 | | | Burlington Stores, Inc.* | | | 58,813,892 | |
| | 501,995 | | | DSW, Inc. Class A | | | 10,556,955 | |
| | 382,220 | | | Lithia Motors, Inc. Class A | | | 36,566,987 | |
| | 166,121 | | | Monro Muffler Brake, Inc. | | | 9,551,957 | |
| | 2,193,611 | | | Office Depot, Inc. | | | 9,147,358 | |
| | 960,899 | | | Party City Holdco, Inc.*(a) | | | 13,884,990 | |
| | 166,366 | | | The Children’s Place, Inc. | | | 16,852,876 | |
| | | | | | | | |
| | | | | | | 164,922,151 | |
| | |
| Technology Hardware, Storage & Peripherals* – 0.3% | |
| | 476,109 | | | Electronics For Imaging, Inc. | | | 21,934,342 | |
| | |
| Textiles, Apparel & Luxury Goods – 0.5% | |
| | 183,942 | | | Columbia Sportswear Co. | | | 10,105,773 | |
| | 1,082,517 | | | Wolverine World Wide, Inc. | | | 27,246,953 | |
| | | | | | | | |
| | | | | | | 37,352,726 | |
| | |
| Thrifts & Mortgage Finance – 2.8% | |
| | 473,834 | | | Dime Community Bancshares, Inc. | | | 10,187,431 | |
| | 511,248 | | | OceanFirst Financial Corp. | | | 14,923,329 | |
| | 602,624 | | | Oritani Financial Corp. | | | 10,365,133 | |
| | 1,105,661 | | | Provident Financial Services, Inc. | | | 29,355,299 | |
| | 3,916,988 | | | Radian Group, Inc. | | | 72,895,147 | |
| | 919,761 | | | Washington Federal, Inc. | | | 31,133,910 | |
| | 534,702 | | | WSFS Financial Corp. | | | 24,382,411 | |
| | | | | | | | |
| | | | | | | 193,242,660 | |
| | |
| Trading Companies & Distributors – 3.1% | |
| | 861,136 | | | Beacon Roofing Supply, Inc.* | | | 39,130,020 | |
| | 1,453,021 | | | Foundation Building Materials, Inc.* | | | 23,742,363 | |
| | 744,363 | | | Herc Holdings, Inc.* | | | 38,476,123 | |
| | 655,636 | | | Kaman Corp. | | | 33,942,276 | |
| | 513,352 | | | NOW, Inc.* | | | 9,825,557 | |
| | 1,424,405 | | | Univar, Inc.* | | | 45,865,841 | |
| | 404,548 | | | WESCO International, Inc.* | | | 28,116,086 | |
| | | | | | | | |
| | | | | | | 219,098,266 | |
| | |
| Common Stocks – (continued) | |
| Water Utilities – 0.3% | |
| | 555,757 | | | California Water Service Group | | | 20,424,070 | |
| | |
| | TOTAL COMMON STOCKS | | | | |
| | (Cost $5,087,805,274) | | $ | 6,811,917,816 | |
| | |
| | | | | | | | |
| Exchange Traded Fund(a) – 1.7% | |
| | 984,796 | | | iShares Russell 2000 Value ETF | | $ | 117,771,754 | |
| | (Cost $110,413,236) | | | | |
| | |
| | | | | | | | |
| Shares | | Distribution
Rate | | | Value | |
| Investment Company(b)(c) – 0.0% | |
Goldman Sachs Financial Square Government Fund – Institutional Shares | |
| 2,892 | | | 0.470 | % | | $ | 2,892 | |
| (Cost $2,892) | | | | | |
| |
| TOTAL INVESTMENTS BEFORE SECURITIES LENDING REINVESTMENT VEHICLE | |
| (Cost $5,198,221,402) | | | $ | 6,929,692,462 | |
| |
| | | | | | | | |
| Securities Lending Reinvestment Vehicle(b)(c) – 1.2% | |
Goldman Sachs Financial Square Government Fund – Institutional Shares | |
84,954,058 | | | 0.470 | % | | | 84,954,058 | |
| (Cost $84,954,058) | | | | | |
| |
| TOTAL INVESTMENTS – 100.0% | |
| (Cost $5,283,175,460) | | | $ | 7,014,646,520 | |
| |
LIABILITIES IN EXCESS OF OTHER ASSETS – (0.0)% | | | | (3,174,942 | ) |
| |
| NET ASSETS – 100.0% | | | $ | 7,011,471,578 | |
| |
| | |
| The percentage shown for each investment category reflects the value of investments in that category as a percentage of net assets. |
* | | Non-income producing security. |
(a) | | All or a portion of security is on loan. |
(b) | | Represents an Affiliated fund. |
(c) | | Variable rate security. Interest rate or distribution rate disclosed is that which is in effect on February 28, 2017. |
| | |
|
Investment Abbreviations: |
ETF | | —Exchange Traded Fund |
PLC | | —Public Limited Company |
|
| | |
| The accompanying notes are an integral part of these financial statements. | | 51 |
GOLDMAN SACHS SMALL/MID CAP VALUE FUND
Schedule of Investments
February 28, 2017 (Unaudited)
| | | | | | | | |
Shares | | | Description | | Value | |
| Common Stocks – 98.0% | |
| Aerospace & Defense – 1.4% | |
| | 2,405 | | | Curtiss-Wright Corp. | | $ | 235,281 | |
| | 1,629 | | | Huntington Ingalls Industries, Inc. | | | 355,937 | |
| | 2,501 | | | KLX, Inc.* | | | 125,900 | |
| | | | | | | | |
| | | | | | | 717,118 | |
| | |
| Air Freight & Logistics* – 0.9% | |
| | 8,787 | | | XPO Logistics, Inc. | | | 448,049 | |
| | |
| Airlines* – 0.6% | |
| | 2,284 | | | JetBlue Airways Corp. | | | 45,589 | |
| | 4,391 | | | Spirit Airlines, Inc. | | | 229,254 | |
| | | | | | | | |
| | | | | | | 274,843 | |
| | |
| Auto Components – 0.8% | |
| | 192 | | | Lear Corp. | | | 27,262 | |
| | 10,619 | | | The Goodyear Tire & Rubber Co. | | | 372,196 | |
| | | | | | | | |
| | | | | | | 399,458 | |
| | |
| Automobiles – 0.5% | |
| | 2,140 | | | Thor Industries, Inc. | | | 237,155 | |
| | |
| Banks – 13.6% | |
| | 6,499 | | | Bank of Hawaii Corp. | | | 548,906 | |
| | 5,189 | | | Bank of the Ozarks, Inc. | | | 283,994 | |
| | 8,048 | | | BankUnited, Inc. | | | 318,942 | |
| | 2,875 | | | BOK Financial Corp.(a) | | | 237,072 | |
| | 6,003 | | | Commerce Bancshares, Inc. | | | 354,297 | |
| | 13,318 | | | East West Bancorp, Inc. | | | 720,770 | |
| | 6,068 | | | First Republic Bank | | | 569,360 | |
| | 7,217 | | | Glacier Bancorp, Inc. | | | 266,452 | |
| | 8,862 | | | Home BancShares, Inc. | | | 249,377 | |
| | 9,629 | | | PacWest Bancorp | | | 530,558 | |
| | 4,184 | | | Prosperity Bancshares, Inc. | | | 311,875 | |
| | 3,737 | | | Signature Bank* | | | 588,615 | |
| | 3,002 | | | South State Corp. | | | 268,679 | |
| | 14,307 | | | Synovus Financial Corp. | | | 604,042 | |
| | 4,072 | | | Texas Capital Bancshares, Inc.* | | | 363,019 | |
| | 12,056 | | | Webster Financial Corp. | | | 662,236 | |
| | | | | | | | |
| | | | | | | 6,878,194 | |
| | |
| Beverages – 0.0% | |
| | 160 | | | Molson Coors Brewing Co. Class B | | | 16,062 | |
| | |
| Building Products – 1.1% | |
| | 1,789 | | | Fortune Brands Home & Security, Inc. | | | 103,458 | |
| | 10,060 | | | JELD-WEN Holding, Inc.* | | | 314,275 | |
| | 4,647 | | | USG Corp.* | | | 156,743 | |
| | | | | | | | |
| | | | | | | 574,476 | |
| | |
| Capital Markets – 2.1% | |
| | 15,282 | | | E*TRADE Financial Corp.* | | | 527,382 | |
| | 8,447 | | | OM Asset Management PLC | | | 125,945 | |
| | 6,021 | | | Stifel Financial Corp.* | | | 324,893 | |
| | 4,439 | | | Virtu Financial, Inc. Class A | | | 77,016 | |
| | | | | | | | |
| | | | | | | 1,055,236 | |
| | |
| Common Stocks – (continued) | |
| Chemicals – 1.9% | |
| | 1,198 | | | Albemarle Corp. | | | 121,609 | |
| | 847 | | | Axalta Coating Systems Ltd.* | | | 24,656 | |
| | 1,823 | | | Ingevity Corp.* | | | 98,387 | |
| | 3,402 | | | Minerals Technologies, Inc. | | | 262,805 | |
| | 2,747 | | | Olin Corp. | | | 85,377 | |
| | 1,741 | | | W.R. Grace & Co. | | | 123,332 | |
| | 4,025 | | | Westlake Chemical Corp. | | | 255,306 | |
| | | | | | | | |
| | | | | | | 971,472 | |
| | |
| Commercial Services & Supplies – 1.1% | |
| | 6,212 | | | Waste Connections, Inc. | | | 542,867 | |
| | |
| Communications Equipment* – 0.9% | |
| | 8,016 | | | CommScope Holding Co., Inc. | | | 305,009 | |
| | 16,987 | | | Viavi Solutions, Inc. | | | 170,209 | |
| | | | | | | | |
| | | | | | | 475,218 | |
| | |
| Construction & Engineering – 1.0% | |
| | 8,655 | | | Jacobs Engineering Group, Inc. | | | 488,228 | |
| | |
| Construction Materials – 1.2% | |
| | 3,273 | | | Eagle Materials, Inc. | | | 339,443 | |
| | 1,245 | | | Martin Marietta Materials, Inc. | | | 268,858 | |
| | | | | | | | |
| | | | | | | 608,301 | |
| | |
| Containers & Packaging* – 0.7% | |
| | 6,467 | | | Berry Plastics Group, Inc. | | | 325,484 | |
| | |
| Electric Utilities – 2.7% | |
| | 11,097 | | | Alliant Energy Corp. | | | 438,110 | |
| | 4,679 | | | IDACORP, Inc. | | | 388,029 | |
| | 6,435 | | | Pinnacle West Capital Corp. | | | 528,893 | |
| | | | | | | | |
| | | | | | | 1,355,032 | |
| | |
| Electrical Equipment – 1.3% | |
| | 5,350 | | | AMETEK, Inc. | | | 288,740 | |
| | 3,273 | | | Hubbell, Inc. | | | 388,243 | |
| | | | | | | | |
| | | | | | | 676,983 | |
| | |
| Electronic Equipment, Instruments & Components – 1.8% | |
| | 2,077 | | | Anixter International, Inc.* | | | 173,014 | |
| | 6,170 | | | Avnet, Inc. | | | 284,314 | |
| | 6,308 | | | National Instruments Corp. | | | 203,370 | |
| | 2,939 | | | Tech Data Corp.* | | | 255,693 | |
| | | | | | | | |
| | | | | | | 916,391 | |
| | |
| Energy Equipment & Services – 2.3% | |
| | 12,427 | | | Fairmount Santrol Holdings, Inc.* | | | 117,808 | |
| | 2,200 | | | Keane Group, Inc.* | | | 38,544 | |
| | 13,461 | | | Patterson-UTI Energy, Inc. | | | 371,793 | |
| | 13,493 | | | Superior Energy Services, Inc. | | | 222,634 | |
| | 13,109 | | | TechnipFMC PLC* | | | 423,683 | |
| | | | | | | | |
| | | | | | | 1,174,462 | |
| | |
| Equity Real Estate Investment Trusts (REITs) – 11.3% | |
| | 27,592 | | | Brixmor Property Group, Inc. | | | 643,997 | |
| | 15,202 | | | Care Capital Properties, Inc. | | | 399,661 | |
| | |
| | |
| 52 | | The accompanying notes are an integral part of these financial statements. |
GOLDMAN SACHS SMALL/MID CAP VALUE FUND
| | | | | | | | |
Shares | | | Description | | Value | |
| Common Stocks – (continued) | |
| Equity Real Estate Investment Trusts (REITs) – (continued) | |
| | 4,487 | | | Columbia Property Trust, Inc. | | $ | 103,605 | |
| | 23,456 | | | Empire State Realty Trust, Inc. Class A | | | 511,575 | |
| | 3,194 | | | Federal Realty Investment Trust | | | 449,492 | |
| | 9,708 | | | Highwoods Properties, Inc. | | | 509,573 | |
| | 2,539 | | | Life Storage, Inc. | | | 225,032 | |
| | 13,604 | | | Mid-America Apartment Communities, Inc. | | | 1,397,539 | |
| | 17,501 | | | Pebblebrook Hotel Trust | | | 503,154 | |
| | 1,597 | | | PS Business Parks, Inc. | | | 185,587 | |
| | 16,495 | | | RLJ Lodging Trust | | | 375,426 | |
| | 5,748 | | | Taubman Centers, Inc. | | | 400,980 | |
| | | | | | | | |
| | | | | | | 5,705,621 | |
| | |
| Food & Staples Retailing* – 0.4% | |
| | 6,563 | | | US Foods Holding Corp. | | | 180,811 | |
| | |
| Food Products – 0.9% | |
| | 8,040 | | | Pinnacle Foods, Inc. | | | 459,325 | |
| | |
| Gas Utilities – 1.7% | |
| | 7,473 | | | Atmos Energy Corp. | | | 585,061 | |
| | 7,185 | | | New Jersey Resources Corp. | | | 283,089 | |
| | | | | | | | |
| | | | | | | 868,150 | |
| | |
| Health Care Equipment & Supplies – 1.4% | |
| | 5,046 | | | Hill-Rom Holdings, Inc. | | | 335,306 | |
| | 1,854 | | | Teleflex, Inc. | | | 354,448 | |
| | | | | | | | |
| | | | | | | 689,754 | |
| | |
| Health Care Providers & Services* – 1.7% | |
| | 7,569 | | | Acadia Healthcare Co., Inc. | | | 338,486 | |
| | 4,503 | | | Envision Healthcare Corp. | | | 315,210 | |
| | 2,764 | | | MEDNAX, Inc. | | | 196,769 | |
| | | | | | | | |
| | | | | | | 850,465 | |
| | |
| Health Care Technology* – 0.3% | |
| | 10,715 | | | Allscripts Healthcare Solutions, Inc. | | | 130,509 | |
| | |
| Hotels, Restaurants & Leisure – 1.4% | |
| | 799 | | | Cracker Barrel Old Country Store, Inc.(a) | | | 128,631 | |
| | 3,055 | | | Jack in the Box, Inc. | | | 286,284 | |
| | 1,502 | | | Vail Resorts, Inc. | | | 272,132 | |
| | | | | | | | |
| | | | | | | 687,047 | |
| | |
| Household Durables – 0.7% | |
| | 9,884 | | | D.R. Horton, Inc. | | | 316,288 | |
| | 1,086 | | | Lennar Corp. Class A | | | 52,986 | |
| | | | | | | | |
| | | | | | | 369,274 | |
| | |
| Household Products – 0.3% | |
| | 1,214 | | | Spectrum Brands Holdings, Inc. | | | 164,764 | |
| | |
| Industrial Conglomerates – 0.8% | |
| | 3,897 | | | Carlisle Cos., Inc. | | | 402,560 | |
| | |
| Common Stocks – (continued) | |
| Insurance – 8.2% | |
| | 1,296 | | | Allied World Assurance Co. Holdings AG | | | 68,455 | |
| | 6,339 | | | American Financial Group, Inc. | | | 596,246 | |
| | 12,047 | | | AmTrust Financial Services, Inc. | | | 277,081 | |
| | 6,946 | | | Arch Capital Group Ltd.* | | | 656,883 | |
| | 14,786 | | | CNO Financial Group, Inc. | | | 309,175 | |
| | 2,193 | | | Primerica, Inc. | | | 177,085 | |
| | 6,212 | | | ProAssurance Corp. | | | 367,129 | |
| | 3,773 | | | The Hanover Insurance Group, Inc. | | | 339,645 | |
| | 4,906 | | | Torchmark Corp. | | | 380,362 | |
| | 7,330 | | | Validus Holdings Ltd. | | | 422,648 | |
| | 7,728 | | | W.R. Berkley Corp. | | | 548,843 | |
| | | | | | | | |
| | | | | | | 4,143,552 | |
| | |
| Internet Software & Services – 0.8% | |
| | 3,657 | | | IAC/InterActiveCorp.* | | | 270,399 | |
| | 1,630 | | | LogMeIn, Inc. | | | 149,552 | |
| | | | | | | | |
| | | | | | | 419,951 | |
| | |
| IT Services – 1.5% | |
| | 7,330 | | | Booz Allen Hamilton Holding Corp. | | | 262,194 | |
| | 2,110 | | | DST Systems, Inc. | | | 252,356 | |
| | 4,791 | | | Total System Services, Inc. | | | 261,014 | |
| | | | | | | | |
| | | | | | | 775,564 | |
| | |
| Leisure Products – 0.6% | |
| | 5,163 | | | Brunswick Corp. | | | 309,212 | |
| | |
| Life Sciences Tools & Services – 0.5% | |
| | 4,711 | | | PerkinElmer, Inc. | | | 255,619 | |
| | |
| Machinery – 4.6% | |
| | 9,676 | | | Colfax Corp.* | | | 368,172 | |
| | 5,284 | | | Flowserve Corp. | | | 245,442 | |
| | 9,980 | | | ITT, Inc. | | | 408,881 | |
| | 7,697 | | | Terex Corp. | | | 240,454 | |
| | 8,546 | | | The Timken Co. | | | 377,733 | |
| | 15,584 | | | Trinity Industries, Inc. | | | 418,275 | |
| | 5,446 | | | Xylem, Inc. | | | 262,061 | |
| | | | | | | | |
| | | | | | | 2,321,018 | |
| | |
| Media – 2.5% | |
| | 2,954 | | | Liberty Broadband Corp. Class C* | | | 253,867 | |
| | 14,779 | | | Live Nation Entertainment, Inc.* | | | 419,871 | |
| | 3,753 | | | Nexstar Media Group, Inc. | | | 258,769 | |
| | 11,944 | | | TEGNA, Inc. | | | 306,125 | |
| | | | | | | | |
| | | | | | | 1,238,632 | |
| | |
| Metals & Mining – 2.5% | |
| | 2,827 | | | Reliance Steel & Aluminum Co. | | | 239,305 | |
| | 2,491 | | | Royal Gold, Inc. | | | 164,531 | |
| | 14,725 | | | Steel Dynamics, Inc. | | | 538,935 | |
| | 8,080 | | | United States Steel Corp. | | | 312,858 | |
| | | | | | | | |
| | | | | | | 1,255,629 | |
| | |
| | |
| The accompanying notes are an integral part of these financial statements. | | 53 |
GOLDMAN SACHS SMALL/MID CAP VALUE FUND
Schedule of Investments (continued)
February 28, 2017 (Unaudited)
| | | | | | | | |
Shares | | | Description | | Value | |
| Common Stocks – (continued) | |
| Mortgage Real Estate Investment Trusts (REITs) – 1.5% | |
| | 13,007 | | | PennyMac Mortgage Investment Trust | | $ | 219,298 | |
| | 10,267 | | | Starwood Property Trust, Inc. | | | 234,704 | |
| | 32,638 | | | Two Harbors Investment Corp. | | | 303,533 | |
| | | | | | | | |
| | | | | | | 757,535 | |
| | |
| Multi-Utilities – 1.1% | |
| | 6,118 | | | CMS Energy Corp. | | | 272,374 | |
| | 5,318 | | | Vectren Corp. | | | 299,669 | |
| | | | | | | | |
| | | | | | | 572,043 | |
| | |
| Multiline Retail*(a) – 0.1% | |
| | 7,223 | | | J.C. Penney Co., Inc. | | | 45,794 | |
| | |
| Oil, Gas & Consumable Fuels – 4.5% | |
| | 12,215 | | | Callon Petroleum Co.* | | | 154,153 | |
| | 22,594 | | | Encana Corp. | | | 250,793 | |
| | 9,677 | | | Extraction Oil & Gas, Inc.* | | | 171,283 | |
| | 8,064 | | | Golar LNG Ltd. | | | 220,228 | |
| | 10,740 | | | Jagged Peak Energy, Inc.* | | | 147,890 | |
| | 5,010 | | | Newfield Exploration Co.* | | | 182,665 | |
| | 5,496 | | | Parsley Energy, Inc. Class A* | | | 167,023 | |
| | 13,732 | | | Rice Energy, Inc.* | | | 256,102 | |
| | 8,780 | | | RSP Permian, Inc.* | | | 346,722 | |
| | 27,581 | | | WPX Energy, Inc.* | | | 355,795 | |
| | | | | | | | |
| | | | | | | 2,252,654 | |
| | |
| Paper & Forest Products – 0.3% | |
| | 7,497 | | | KapStone Paper & Packaging Corp. | | | 169,432 | |
| | |
| Pharmaceuticals* – 0.4% | |
| | 7,346 | | | Catalent, Inc. | | | 210,830 | |
| | |
| Real Estate Management & Development – 0.6% | |
| | 12,583 | | | Kennedy-Wilson Holdings, Inc. | | | 277,455 | |
| | |
| Road & Rail – 0.7% | |
| | 3,641 | | | Old Dominion Freight Line, Inc. | | | 334,098 | |
| | |
| Semiconductors & Semiconductor Equipment – 1.9% | |
| | 23,106 | | | Cypress Semiconductor Corp. | | | 306,617 | |
| | 23,872 | | | Marvell Technology Group Ltd. | | | 372,403 | |
| | 3,570 | | | Microchip Technology, Inc. | | | 258,896 | |
| | | | | | | | |
| | | | | | | 937,916 | |
| | |
| Software* – 2.7% | |
| | 3,050 | | | ANSYS, Inc. | | | 325,618 | |
| | 3,928 | | | CommVault Systems, Inc. | | | 192,668 | |
| | 5,973 | | | Fortinet, Inc. | | | 223,092 | |
| | 12,998 | | | Nuance Communications, Inc. | | | 221,356 | |
| | 10,204 | | | Verint Systems, Inc. | | | 385,201 | |
| | | | | | | | |
| | | | | | | 1,347,935 | |
| | |
| Specialty Retail – 2.5% | |
| | 5,653 | | | Burlington Stores, Inc.* | | | 503,174 | |
| | 6,260 | | | CarMax, Inc.* | | | 404,020 | |
| | 1,040 | | | Foot Locker, Inc. | | | 78,697 | |
| | |
| Common Stocks – (continued) | |
| Specialty Retail – (continued) | |
| | 2,594 | | | Lithia Motors, Inc. Class A | | | 248,168 | |
| | 6,979 | | | Office Depot, Inc. | | | 29,102 | |
| | | | | | | | |
| | | | | | | 1,263,161 | |
| | |
| Textiles, Apparel & Luxury Goods – 0.1% | |
| | 609 | | | Carter’s, Inc. | | | 53,598 | |
| | |
| Thrifts & Mortgage Finance – 1.1% | |
| | 22,115 | | | Radian Group, Inc. | | | 411,560 | |
| | 4,398 | | | Washington Federal, Inc. | | | 148,872 | |
| | | | | | | | |
| | | | | | | 560,432 | |
| | |
| Trading Companies & Distributors* – 1.9% | |
| | 4,359 | | | Beacon Roofing Supply, Inc. | | | 198,073 | |
| | 1,271 | | | United Rentals, Inc. | | | 162,726 | |
| | 9,294 | | | Univar, Inc. | | | 299,267 | |
| | 4,216 | | | WESCO International, Inc. | | | 293,012 | |
| | | | | | | | |
| | | | | | | 953,078 | |
| | |
| Water Utilities – 0.6% | |
| | 9,517 | | | Aqua America, Inc. | | | 302,070 | |
| | |
| | TOTAL COMMON STOCKS | | | | |
| | (Cost $42,874,714) | | $ | 49,400,517 | |
| | |
| | | | | | | | |
| Shares | | Distribution
Rate | | | Value | |
| Investment Company(b)(c) – 0.4% | |
Goldman Sachs Financial Square Government Fund – Institutional Shares | |
| 218,509 | | | 0.470 | % | | $ | 218,509 | |
| (Cost $218,509) | | | | | |
| |
| TOTAL INVESTMENTS BEFORE SECURITIES LENDING REINVESTMENT VEHICLE | |
| (Cost $43,093,223) | | | $ | 49,619,026 | |
| |
| | | | | | | | |
| Securities Lending Reinvestment Vehicle(b)(c) – 0.6% | |
Goldman Sachs Financial Square Government Fund – Institutional Shares | |
| 311,389 | | | 0.470 | % | | $ | 311,389 | |
| (Cost $311,389) | | | | | |
| |
| TOTAL INVESTMENTS – 99.0% | |
| (Cost $43,404,612) | | | $ | 49,930,415 | |
| |
OTHER ASSETS IN EXCESS OF LIABILITIES – 1.0% | | | | 492,186 | |
| |
| NET ASSETS – 100.0% | | | $ | 50,422,601 | |
| |
| | |
| 54 | | The accompanying notes are an integral part of these financial statements. |
GOLDMAN SACHS SMALL/MID CAP VALUE FUND
| | |
The percentage shown for each investment category reflects the value of investments in that category as a percentage of net assets. |
* | | Non-income producing security. |
(a) | | All or a portion of security is on loan. |
(b) | | Represents an Affiliated fund. |
(c) | | Variable rate security. Interest rate or distribution rate disclosed is that which is in effect on February 28, 2017. |
| | |
|
Investment Abbreviations: |
PLC | | —Public Limited Company |
REIT | | —Real Estate Investment Trust |
|
| | |
| The accompanying notes are an integral part of these financial statements. | | 55 |
GOLDMAN SACHS FUNDAMENTAL EQUITY VALUE FUNDS
Statements of Assets and Liabilities
February 28, 2017 (Unaudited)
| | | | | | |
| | | | | Focused
Value Fund | |
| | Assets: | | | | |
| | Investments of unaffiliated issuers, at value (cost $3,233,767, $347,691,001, $906,945,654, $3,918,318,953, $5,198,218,510 and $42,874,714)(a) | | $ | 3,667,523 | |
| | Investments of affiliated issuers, at value (cost $94,608, $0, $2,284,991, $70,854,621, $2,892 and $218,509) | | | 94,608 | |
| | Investments in securities lending reinvestment vehicle — affiliated issuer, at value which equals cost | | | — | |
| | Collateral received for securities on loan | | | — | |
| | Cash | | | 56,944 | |
| | Receivables: | | | | |
| | Reimbursement from investment adviser | | | 26,015 | |
| | Dividends and interest | | | 8,489 | |
| | Investments sold | | | — | |
| | Fund shares sold | | | — | |
| | Securities lending income | | | — | |
| | Foreign tax reclaims | | | — | |
| | Other assets | | | 77 | |
| | Total assets | | | 3,853,656 | |
| | | | | | |
| | Liabilities: | | | | |
| | Payables: | | | | |
| | Investments purchased | | | 44,368 | |
| | Management fees | | | 1,949 | |
| | Distribution and Service fees and Transfer Agency fees | | | 186 | |
| | Payable upon return of securities loaned | | | — | |
| | Fund shares redeemed | | | — | |
| | Accrued expenses | | | 57,473 | |
| | Total liabilities | | | 103,976 | |
| | | | | | |
| | Net Assets: | | | | |
| | Paid-in capital | | | 3,335,580 | |
| | Undistributed (distributions in excess of) net investment income | | | 9,953 | |
| | Accumulated net realized gain (loss) | | | (29,609 | ) |
| | Net unrealized gain | | | 433,756 | |
| | | NET ASSETS | | $ | 3,749,680 | |
| | | Net Assets: | | | | |
| | | Class A | | $ | 46,079 | |
| | | Class C | | | 47,509 | |
| | | Institutional | | | 3,573,442 | |
| | | Service | | | — | |
| | | Class IR | | | 27,598 | |
| | | Class R | | | 27,380 | |
| | | Class R6 | | | 27,672 | |
| | | Total Net Assets | | $ | 3,749,680 | |
| | | Shares Outstanding $0.001 par value (unlimited number of shares authorized): | | | | |
| | | Class A | | | 4,250 | |
| | | Class C | | | 4,386 | |
| | | Institutional | | | 328,997 | |
| | | Service | | | — | |
| | | Class IR | | | 2,542 | |
| | | Class R | | | 2,525 | |
| | | Class R6 | | | 2,547 | |
| | | Net asset value, offering and redemption price per share:(b) | | | | |
| | | Class A | | | $10.84 | |
| | | Class C | | | 10.83 | |
| | | Institutional | | | 10.86 | |
| | | Service | | | — | |
| | | Class IR | | | 10.86 | |
| | | Class R | | | 10.84 | |
| | | Class R6 | | | 10.86 | |
| | (a) | | Includes loaned securities having a market value of $20,867,865, $83,078,711 and $302,922 for the Mid Cap Value, Small Cap Value and Small/Mid Cap Value Funds, respectively. |
| | (b) | | Maximum public offering price per share for Class A Shares of the Focused Value, Growth and Income, Large Cap Value, Mid Cap Value, Small Cap Value and Small/Mid Cap Value Funds is $11.47, $37.78, $18.40, $40.43, $60.67 and $13.19, respectively. At redemption, Class C Shares may be subject to a contingent deferred sales charge (“CDSC”), assessed on the amount equal to the lesser of the current net asset value (“NAV”) or the original purchase price of the shares. |
| | |
| 56 | | The accompanying notes are an integral part of these financial statements. |
GOLDMAN SACHS FUNDAMENTAL EQUITY VALUE FUNDS
| | | | | | | | | | | | | | | | | | | | | | | | | | | | |
| | | Growth and Income Fund | | | | | Large Cap Value Fund | | | | | Mid Cap Value Fund | | | | | Small Cap Value Fund | | | | | Small/Mid Cap
Value Fund | |
| | | | | | | | | | | | | | | | | | | | | | | | | | | | |
| | $ | 419,059,537 | | | | | $ | 1,109,061,550 | | | | | $ | 4,574,683,258 | | | | | $ | 6,929,689,570 | | | | | $ | 49,400,517 | |
| | | — | | | | | | 2,284,991 | | | | | | 70,854,621 | | | | | | 2,892 | | | | | | 218,509 | |
| | | — | | | | | | — | | | | | | 21,380,300 | | | | | | 84,954,058 | | | | | | 311,389 | |
| | | — | | | | | | — | | | | | | — | | | | | | 43,682 | | | | | | — | |
| | | 4,523,482 | | | | | | 16,974,892 | | | | | | 72,199,802 | | | | | | 97,093,216 | | | | | | 753,754 | |
| | | | | | | | | | | | | | | | | | | | | | | | | | | | |
| | | 30,773 | | | | | | 30,166 | | | | | | — | | | | | | 64,960 | | | | | | 25,920 | |
| | | 1,719,986 | | | | | | 3,265,030 | | | | | | 5,352,394 | | | | | | 2,864,706 | | | | | | 44,183 | |
| | | ��� | | | | | | 1,712,175 | | | | | | 70,874,815 | | | | | | 58,411,009 | | | | | | 943,875 | |
| | | 77,376 | | | | | | 9,871,884 | | | | | | 3,513,065 | | | | | | 15,055,170 | | | | | | 250 | |
| | | — | | | | | | — | | | | | | 4,693 | | | | | | 32,593 | | | | | | 231 | |
| | | 37,173 | | | | | | 32,564 | | | | | | — | | | | | | — | | | | | | — | |
| | | 2,463 | | | | | | 5,798 | | | | | | 26,639 | | | | | | 36,040 | | | | | | 15,395 | |
| | | 425,450,790 | | | | | | 1,143,239,050 | | | | | | 4,818,889,587 | | | | | | 7,188,247,896 | | | | | | 51,714,023 | |
| | | | | | | | | | | | | | | | | | | | | | | | | | | | |
| | | | | | | | | | | | | | | | | | | | | | | | | | | | |
| | | | | | | | | | | | | | | | | | | | | | | | | | | | |
| | | — | | | | | | 3,793,252 | | | | | | 44,610,505 | | | | | | 72,898,635 | | | | | | 827,219 | |
| | | 222,390 | | | | | | 638,815 | | | | | | 2,612,783 | | | | | | 4,808,082 | | | | | | 32,064 | |
| | | 143,490 | | | | | | 122,271 | | | | | | 636,933 | | | | | | 636,664 | | | | | | 3,396 | |
| | | — | | | | | | — | | | | | | 21,380,300 | | | | | | 84,997,740 | | | | | | 311,389 | |
| | | 476,374 | | | | | | 3,035,048 | | | | | | 41,759,932 | | | | | | 12,958,348 | | | | | | 6,941 | |
| | | 132,636 | | | | | | 152,569 | | | | | | 577,355 | | | | | | 476,849 | | | | | | 110,413 | |
| | | 974,890 | | | | | | 7,741,955 | | | | | | 111,577,808 | | | | | | 176,776,318 | | | | | | 1,291,422 | |
| | | | | | | | | | | | | | | | | | | | | | | | | | | | |
| | | | | | | | | | | | | | | | | | | | | | | | | | | | |
| | | 463,933,076 | | | | | | 945,418,589 | | | | | | 4,243,661,657 | | | | | | 5,050,481,537 | | | | | | 42,686,938 | |
| | | 1,521,237 | | | | | | 4,408,058 | | | | | | (1,635,259 | ) | | | | | (3,936,467 | ) | | | | | 114,416 | |
| | | (112,346,949 | ) | | | | | (16,445,448 | ) | | | | | (191,078,924 | ) | | | | | 233,455,448 | | | | | | 1,095,444 | |
| | | 71,368,536 | | | | | | 202,115,896 | | | | | | 656,364,305 | | | | | | 1,731,471,060 | | | | | | 6,525,803 | |
| | | $ | 424,475,900 | | | | | $ | 1,135,497,095 | | | | | $ | 4,707,311,779 | | | | | $ | 7,011,471,578 | | | | | $ | 50,422,601 | |
| | | | | | | | | | | | | | | | | | | | | | | | | | | | | |
| | | | $359,340,531 | | | | | $ | 192,223,096 | | | | | $ | 1,056,679,637 | | | | | $ | 969,668,355 | | | | | $ | 1,110,658 | |
| | | | 23,155,016 | | | | | | 45,075,092 | | | | | | 131,940,999 | | | | | | 48,218,309 | | | | | | 1,159,846 | |
| | | | 37,621,898 | | | | | | 752,219,227 | | | | | | 2,698,338,101 | | | | | | 4,945,599,733 | | | | | | 44,776,420 | |
| | | | 354,003 | | | | | | 3,291,982 | | | | | | 106,353,401 | | | | | | 130,292,144 | | | | | | — | |
| | | | 2,421,475 | | | | | | 6,670,324 | | | | | | 242,299,215 | | | | | | 196,858,005 | | | | | | 3,234,105 | |
| | | | 1,571,656 | | | | | | 6,929,446 | | | | | | 39,930,953 | | | | | | 136,331,924 | | | | | | 130,104 | |
| | | | 11,321 | | | | | | 129,087,928 | | | | | | 431,769,473 | | | | | | 584,503,108 | | | | | | 11,468 | |
| | | | $424,475,900 | | | | | $ | 1,135,497,095 | | | | | $ | 4,707,311,779 | | | | | $ | 7,011,471,578 | | | | | $ | 50,422,601 | |
| | | | | | | | | | | | | | | | | | | | | | | | | | | | | |
| | | | 10,065,436 | | | | | | 11,054,444 | | | | | | 27,651,957 | | | | | | 16,912,506 | | | | | | 89,103 | |
| | | | 680,624 | | | | | | 2,697,729 | | | | | | 3,795,564 | | | | | | 1,066,303 | | | | | | 94,457 | |
| | | | 1,036,518 | | | | | | 42,903,341 | | | | | | 70,003,913 | | | | | | 80,529,211 | | | | | | 3,562,771 | |
| | | | 9,914 | | | | | | 190,294 | | | | | | 2,830,339 | | | | | | 2,336,961 | | | | | | — | |
| | | | 67,915 | | | | | | 383,327 | | | | | | 6,468,319 | | | | | | 3,456,944 | | | | | | 258,274 | |
| | | | 44,257 | | | | | | 407,120 | | | | | | 1,071,216 | | | | | | 2,418,984 | | | | | | 10,447 | |
| | | | 312 | | | | | | 7,363,063 | | | | | | 11,206,844 | | | | | | 9,520,001 | | | | | | 912 | |
| | | | | | | | | | | | | | | | | | | | | | | | | | | | | |
| | | | $35.70 | | | | | | $17.39 | | | | | | $38.21 | | | | | | $57.33 | | | | | | $12.46 | |
| | | | 34.02 | | | | | | 16.71 | | | | | | 34.76 | | | | | | 45.22 | | | | | | 12.28 | |
| | | | 36.30 | | | | | | 17.53 | | | | | | 38.55 | | | | | | 61.41 | | | | | | 12.57 | |
| | | | 35.71 | | | | | | 17.30 | | | | | | 37.58 | | | | | | 55.75 | | | | | | — | |
| | | | 35.65 | | | | | | 17.40 | | | | | | 37.46 | | | | | | 56.95 | | | | | | 12.52 | |
| | | | 35.51 | | | | | | 17.02 | | | | | | 37.28 | | | | | | 56.36 | | | | | | 12.45 | |
| | | | 36.29 | | | | | | 17.53 | | | | | | 38.53 | | | | | | 61.40 | | | | | | 12.57 | |
| | |
| The accompanying notes are an integral part of these financial statements. | | 57 |
GOLDMAN SACHS FUNDAMENTAL EQUITY VALUE FUNDS
Statements of Operations
For the Six Months Ended February 28, 2017 (Unaudited)
| | | | | | |
| | | | | Focused
Value Fund | |
| | Investment income: | | | | |
| | Dividends — unaffiliated issuers | | $ | 33,192 | |
| | Dividends — affiliated issuers | | | 166 | |
| | Securities lending income — affiliated issuer | | | — | |
| | Total investment income | | | 33,358 | |
| | | | | | |
| | Expenses: | | | | |
| | Management fees | | | 12,951 | |
| | Transfer Agency fees(a) | | | 773 | |
| | Distribution and Service fees(a) | | | 256 | |
| | Printing and mailing costs | | | 6,144 | |
| | Custody, accounting and administrative services | | | 15,143 | |
| | Service Share fees — Service Plan | | | — | |
| | Service Share fees — Shareholder Administration Plan | | | — | |
| | Registration fees | | | 53,782 | |
| | Professional fees | | | 37,356 | |
| | Trustee fees | | | 8,267 | |
| | Other | | | 1,488 | |
| | Total expenses | | | 136,160 | |
| | Less — expense reductions | | | (123,216 | ) |
| | Net expenses | | | 12,944 | |
| | NET INVESTMENT INCOME | | | 20,414 | |
| | | | | | |
| | Realized and unrealized gain (loss): | | | | |
| | Net realized gain from: | | | | |
| | Investments — unaffiliated issuers (including commission recapture of $0, $6,538, $38,155, $121,252, $188,224 and $425) | | | 138,652 | |
| | Net change in unrealized gain on: | | | | |
| | Investments — unaffiliated issuers | | | 206,251 | |
| | Net realized and unrealized gain | | | 344,903 | |
| | NET INCREASE IN NET ASSETS RESULTING FROM OPERATIONS | | $ | 365,317 | |
| | (a) | | Class specific Distribution and Service and Transfer Agency fees were as follows: |
| | | | | | | | | | | | | | | | | | | | | | | | | | | | | | | | | | | | | | | | |
| | | Distribution and Service Fees | | | Transfer Agency Fees | |
Fund | | Class A | | | Class C | | | Class R | | | Class A | | | Class C | | | Institutional | | | Class R6 | | | Service | | | Class IR | | | Class R | |
Focused Value | | $ | 41 | | | $ | 151 | | | $ | 64 | | | $ | 31 | | | $ | 29 | | | $ | 663 | | | $ | 2 | | | $ | — | | | $ | 24 | | | $ | 24 | |
Growth and Income | | | 437,909 | | | | 110,402 | | | | 3,719 | | | | 332,811 | | | | 20,976 | | | | 6,833 | | | | 2 | | | | 63 | | | | 995 | | | | 1,413 | |
Large Cap Value | | | 236,832 | | | | 212,067 | | | | 17,042 | | | | 179,993 | | | | 40,293 | | | | 166,304 | | | | 12,275 | | | | 652 | | | | 3,476 | | | | 6,476 | |
Mid Cap Value | | | 1,480,296 | | | | 670,909 | | | | 97,411 | | | | 1,125,025 | | | | 127,473 | | | | 611,210 | | | | 39,708 | | | | 22,662 | | | | 195,413 | | | | 37,016 | |
Small Cap Value | | | 1,169,241 | | | | 235,165 | | | | 318,996 | | | | 888,623 | | | | 44,681 | | | | 909,364 | | | | 42,610 | | | | 24,104 | | | | 164,664 | | | | 121,219 | |
Small/Mid Cap Value | | | 1,540 | | | | 4,172 | | | | 322 | | | | 1,171 | | | | 793 | | | | 8,659 | | | | 2 | | | | — | | | | 2,567 | | | | 122 | |
| | |
| 58 | | The accompanying notes are an integral part of these financial statements. |
GOLDMAN SACHS FUNDAMENTAL EQUITY VALUE FUNDS
| | | | | | | | | | | | | | | | | | | | | | | | | | | | |
| | | Growth and
Income Fund | | | | | Large Cap
Value Fund | | | | | Mid Cap
Value Fund | | | | | Small Cap
Value Fund | | | | | Small/Mid Cap
Value Fund | |
| | | | | | | | | | | | | | | | | | | | | | | | | | | | |
| | $ | 5,841,003 | | | | | $ | 13,312,616 | | | | | $ | 43,827,832 | | | | | $ | 55,658,133 | | | | | $ | 412,276 | |
| | | 4,378 | | | | | | 14,727 | | | | | | 67,160 | | | | | | 55,152 | | | | | | 448 | |
| | | — | | | | | | — | | | | | | 22,449 | | | | | | 118,558 | | | | | | 879 | |
| | | 5,845,381 | | | | | | 13,327,343 | | | | | | 43,917,441 | | | | | | 55,831,843 | | | | | | 413,603 | |
| | | | | | | | | | | | | | | | | | | | | | | | | | | | |
| | | | | | | | | | | | | | | | | | | | | | | | | | | | |
| | | 1,433,011 | | | | | | 4,426,737 | | | | | | 18,101,677 | | | | | | 29,403,785 | | | | | | 204,872 | |
| | | 363,093 | | | | | | 409,469 | | | | | | 2,158,507 | | | | | | 2,195,265 | | | | | | 13,314 | |
| | | 552,030 | | | | | | 465,941 | | | | | | 2,248,616 | | | | | | 1,723,402 | | | | | | 6,034 | |
| | | 53,097 | | | | | | 44,623 | | | | | | 292,360 | | | | | | 185,696 | | | | | | 15,558 | |
| | | 36,156 | | | | | | 57,795 | | | | | | 143,737 | | | | | | 174,725 | | | | | | 37,032 | |
| | | 394 | | | | | | 4,077 | | | | | | 141,637 | | | | | | 150,651 | | | | | | — | |
| | | 394 | | | | | | 4,077 | | | | | | 141,637 | | | | | | 150,651 | | | | | | — | |
| | | 43,991 | | | | | | 45,484 | | | | | | 80,881 | | | | | | 78,173 | | | | | | 43,920 | |
| | | 43,631 | | | | | | 45,626 | | | | | | 44,688 | | | | | | 43,629 | | | | | | 45,101 | |
| | | 8,699 | | | | | | 9,480 | | | | | | 14,184 | | | | | | 14,301 | | | | | | 8,309 | |
| | | 9,985 | | | | | | 19,213 | | | | | | 49,042 | | | | | | 67,380 | | | | | | 4,034 | |
| | | 2,544,481 | | | | | | 5,532,522 | | | | | | 23,416,966 | | | | | | 34,187,658 | | | | | | 378,174 | |
| | | (210,269 | ) | | | | | (234,785 | ) | | | | | (33,766 | ) | | | | | (1,156,468 | ) | | | | | (165,254 | ) |
| | | 2,334,212 | | | | | | 5,297,737 | | | | | | 23,383,200 | | | | | | 33,031,190 | | | | | | 212,920 | |
| | | 3,511,169 | | | | | | 8,029,606 | | | | | | 20,534,241 | | | | | | 22,800,653 | | | | | | 200,683 | |
| | | | | | | | | | | | | | | | | | | | | | | | | | | | |
| | | | | | | | | | | | | | | | | | | | | | | | | | | | |
| | | | | | | | | | | | | | | | | | | | | | | | | | | | |
| | | 7,839,788 | | | | | | 68,118,478 | | | | | | 459,731,609 | | | | | | 373,175,066 | | | | | | 2,820,768 | |
| | | | | | | | | | | | | | | | | | | | | | | | | | | | |
| | | 30,977,408 | | | | | | 40,802,601 | | | | | | (22,992,085 | ) | | | | | 390,280,707 | | | | | | 2,625,592 | |
| | | 38,817,196 | | | | | | 108,921,079 | | | | | | 436,739,524 | | | | | | 763,455,773 | | | | | | 5,446,360 | |
| | $ | 42,328,365 | | | | | $ | 116,950,685 | | | | | $ | 457,273,765 | | | | | $ | 786,256,426 | | | | | $ | 5,647,043 | |
| | |
| The accompanying notes are an integral part of these financial statements. | | 59 |
GOLDMAN SACHS FUNDAMENTAL EQUITY VALUE FUNDS
Statements of Changes in Net Assets
| | | | | | | | | | |
| | | | | Focused Value Fund | |
| | | | | For the
Six Months Ended
February 28, 2017
(Unaudited) | | | For the Fiscal
Year Ended
August 31, 2016 | |
| | From operations: | |
| | Net investment income | | $ | 20,414 | | | $ | 47,668 | |
| | Net realized gain (loss) | | | 138,652 | | | | (162,280 | ) |
| | Net change in unrealized gain (loss) | | | 206,251 | | | | 366,284 | |
| | Net increase in net assets resulting from operations | | | 365,317 | | | | 251,672 | |
| | | | | | | | | | |
| | Distributions to shareholders: | | | | | | | | |
| | From net investment income | | | | | | | | |
| | Class A Shares | | | (365 | ) | | | (81 | ) |
| | Class C Shares | | | (80 | ) | | | (9 | ) |
| | Institutional Shares | | | (45,341 | ) | | | (13,283 | ) |
| | Service Shares | | | — | | | | — | |
| | Class IR Shares | | | (317 | ) | | | (105 | ) |
| | Class R Shares | | | (198 | ) | | | (57 | ) |
| | Class R6 Shares | | | (359 | ) | | | (122 | ) |
| | From net realized gains | | | | | | | | |
| | Class A Shares | | | — | | | | — | |
| | Class C Shares | | | — | | | | — | |
| | Institutional Shares | | | — | | | | — | |
| | Service Shares | | | — | | | | — | |
| | Class IR Shares | | | — | | | | — | |
| | Class R Shares | | | — | | | | — | |
| | Class R6 Shares | | | — | | | | — | |
| | Total distributions to shareholders | | | (46,660 | ) | | | (13,657 | ) |
| | | | | | | | | | |
| | From share transactions: | | | | | | | | |
| | Proceeds from sales of shares | | | 64,533 | | | | 1,241,520 | |
| | Reinvestment of distributions | | | 46,660 | | | | 13,656 | |
| | Cost of shares redeemed | | | (10,005 | ) | | | (20,643 | ) |
| | Net increase (decrease) in net assets resulting from share transactions | | | 101,188 | | | | 1,234,533 | |
| | TOTAL INCREASE (DECREASE) | | | 419,845 | | | | 1,472,548 | |
| | | | | | | | | | |
| | Net assets: | | | | | | | | |
| | Beginning of period | | | 3,329,835 | | | | 1,857,287 | |
| | End of period | | $ | 3,749,680 | | | $ | 3,329,835 | |
| | Undistributed (distributions in excess of) net investment income | | $ | 9,953 | | | $ | 36,199 | |
| | |
| 60 | | The accompanying notes are an integral part of these financial statements. |
GOLDMAN SACHS FUNDAMENTAL EQUITY VALUE FUNDS
| | | | | | | | | | | | | | | | | | | | | | |
| | | Growth and Income Fund | | | | | Large Cap Value Fund | |
| | | For the Six Months Ended
February 28, 2017
(Unaudited) | | | | | For the Fiscal Year Ended
August 31, 2016 | | | | | For the Six Months Ended
February 28, 2017
(Unaudited) | | | | | For the Fiscal Year Ended August 31, 2016 | |
| | | | | | | | | | | | | | | | | | | | | | |
| | $ | 3,511,169 | | | | | $ | 9,129,312 | | | | | $ | 8,029,606 | | | | | $ | 23,490,510 | |
| | | 7,839,788 | | | | | | (1,546,227 | ) | | | | | 68,118,478 | | | | | | (79,500,175 | ) |
| | | 30,977,408 | | | | | | 27,651,809 | | | | | | 40,802,601 | | | | | | 155,911,654 | |
| | | 42,328,365 | | | | | | 35,234,894 | | | | | | 116,950,685 | | | | | | 99,901,989 | |
| | | | | | | | | | | | | | | | | | | | | | |
| | | | | | | | | | | | | | | | | | | | | | |
| | | | | | | | | | | | | | | | | | | | | | |
| | | (3,336,357 | ) | | | | | (7,510,203 | ) | | | | | (3,168,556 | ) | | | | | (1,835,132 | ) |
| | | (134,919 | ) | | | | | (341,165 | ) | | | | | (479,583 | ) | | | | | (16,247 | ) |
| | | (388,211 | ) | | | | | (727,273 | ) | | | | | (15,369,112 | ) | | | | | (10,860,853 | ) |
| | | (2,727 | ) | | | | | (5,397 | ) | | | | | (46,424 | ) | | | | | (27,148 | ) |
| | | (9,686 | ) | | | | | (12,891 | ) | | | | | (60,284 | ) | | | | | (63,987 | ) |
| | | (11,965 | ) | | | | | (24,426 | ) | | | | | (99,802 | ) | | | | | (44,370 | ) |
| | | (120 | ) | | | | | (234 | ) | | | | | (2,620,640 | ) | | | | | (1,585,777 | ) |
| | | | | | | | | | | | | | | | | | | | | | |
| | | — | | | | | | — | | | | | | — | | | | | | (20,098,855 | ) |
| | | — | | | | | | — | | | | | | — | | | | | | (3,706,735 | ) |
| | | — | | | | | | — | | | | | | — | | | | | | (77,563,606 | ) |
| | | — | | | | | | — | | | | | | — | | | | | | (354,118 | ) |
| | | — | | | | | | — | | | | | | — | | | | | | (531,543 | ) |
| | | — | | | | | | — | | | | | | — | | | | | | (683,585 | ) |
| | | — | | | | | | — | | | | | | — | | | | | | (10,757,503 | ) |
| | | (3,883,985 | ) | | | | | (8,621,589 | ) | | | | | (21,844,401 | ) | | | | | (128,129,459 | ) |
| | | | | | | | | | | | | | | | | | | | | | |
| | | | | | | | | | | | | | | | | | | | | | |
| | | 17,473,232 | | | | | | 20,994,089 | | | | | | 87,466,401 | | | | | | 315,581,215 | |
| | | 3,789,422 | | | | | | 8,417,238 | | | | | | 20,260,815 | | | | | | 120,394,537 | |
| | | (50,567,315 | ) | | | | | (64,767,655 | ) | | | | | (348,183,473 | ) | | | | | (460,476,523 | ) |
| | | (29,304,661 | ) | | | | | (35,356,328 | ) | | | | | (240,456,257 | ) | | | | | (24,500,771 | ) |
| | | 9,139,719 | | | | | | (8,743,023 | ) | | | | | (145,349,973 | ) | | | | | (52,728,241 | ) |
| | | | | | | | | | | | | | | | | | | | | | |
| | | | | | | | | | | | | | | | | | | | | | |
| | | 415,336,181 | | | | | | 424,079,204 | | | | | | 1,280,847,068 | | | | | | 1,333,575,309 | |
| | $ | 424,475,900 | | | | | $ | 415,336,181 | | | | | $ | 1,135,497,095 | | | | | $ | 1,280,847,068 | |
| | $ | 1,521,237 | | | | | $ | 1,894,053 | | | | | $ | 4,408,058 | | | | | $ | 18,222,853 | |
| | |
| The accompanying notes are an integral part of these financial statements. | | 61 |
GOLDMAN SACHS FUNDAMENTAL EQUITY VALUE FUNDS
Statements of Changes in Net Assets (continued)
| | | | | | | | | | |
| | | | | Mid Cap Value Fund | |
| | | | | For the Six Months Ended
February 28, 2017
(Unaudited) | | | For the Fiscal Year Ended August 31, 2016 | |
| | From operations: | | | | | | | | |
| | Net investment income | | $ | 20,534,241 | | | $ | 85,311,197 | |
| | Net realized gain (loss) | | | 459,731,609 | | | | (616,500,387 | ) |
| | Net change in unrealized gain (loss) | | | (22,992,085 | ) | | | 659,084,221 | |
| | Net increase in net assets resulting from operations | | | 457,273,765 | | | | 127,895,031 | |
| | | | | | | | | | |
| | Distributions to shareholders: | | | | | | | | |
| | From net investment income | | | | | | | | |
| | Class A Shares | | | (11,704,983 | ) | | | (5,185,015 | ) |
| | Class C Shares | | | (608,413 | ) | | | — | |
| | Institutional Shares | | | (43,679,489 | ) | | | (38,827,756 | ) |
| | Service Shares | | | (1,007,350 | ) | | | (392,088 | ) |
| | Class IR Shares | | | (2,803,522 | ) | | | (1,578,650 | ) |
| | Class R Shares | | | (350,898 | ) | | | (58,485 | ) |
| | Class R6 Shares | | | (5,955,039 | ) | | | (2,752,664 | ) |
| | From net realized gains | | | | | | | | |
| | Class A Shares | | | — | | | | (198,998,854 | ) |
| | Class C Shares | | | — | | | | (20,878,172 | ) |
| | Institutional Shares | | | — | | | | (584,837,789 | ) |
| | Service Shares | | | — | | | | (24,166,112 | ) |
| | Class IR Shares | | | — | | | | (31,136,007 | ) |
| | Class R Shares | | | — | | | | (4,906,942 | ) |
| | Class R6 Shares | | | — | | | | (37,233,452 | ) |
| | Total distributions to shareholders | | | (66,109,694 | ) | | | (950,951,986 | ) |
| | | | | | | | | | |
| | From share transactions: | | | | | | | | |
| | Proceeds from sales of shares | | | 533,908,118 | | | | 1,696,909,879 | |
| | Reinvestment of distributions | | | 60,932,584 | | | | 863,240,443 | |
| | Cost of shares redeemed | | | (2,243,078,035 | ) | | | (4,266,756,472 | ) |
| | Net increase (decrease) in net assets resulting from share transactions | | | (1,648,237,333 | ) | | | (1,706,606,150 | ) |
| | TOTAL INCREASE (DECREASE) | | | (1,257,073,262 | ) | | | (2,529,663,105 | ) |
| | | | | | | | | | |
| | Net assets: | | | | | | | | |
| | Beginning of period | | | 5,964,385,041 | | | | 8,494,048,146 | |
| | End of period | | $ | 4,707,311,779 | | | $ | 5,964,385,041 | |
| | Undistributed (distributions in excess of) net investment income | | $ | (1,635,259 | ) | | $ | 43,940,194 | |
| | |
| 62 | | The accompanying notes are an integral part of these financial statements. |
GOLDMAN SACHS FUNDAMENTAL EQUITY VALUE FUNDS
| | | | | | | | | | | | | | | | | | | | | | |
| | | Small Cap Value Fund | | | | | Small/Mid Cap Value Fund | |
| | | For the Six Months Ended
February 28, 2017
(Unaudited) | | | | | For the Fiscal Year Ended August 31, 2016 | | | | | For the Six Months Ended
February 28, 2017
(Unaudited) | | | | | For the Fiscal Year Ended
August 31, 2016 | |
| | | | | | | | | | | | | | | | | | | | | | |
| | $ | 22,800,653 | | | | | $ | 41,052,168 | | | | | $ | 200,683 | | | | | $ | 400,670 | |
| | | 373,175,066 | | | | | | 84,626,845 | | | | | | 2,820,768 | | | | | | (1,516,138 | ) |
| | | 390,280,707 | | | | | | 521,918,591 | | | | | | 2,625,592 | | | | | | 4,624,271 | |
| | | 786,256,426 | | | | | | 647,597,604 | | | | | | 5,647,043 | | | | | | 3,508,803 | |
| | | | | | | | | | | | | | | | | | | | | | |
| | | | | | | | | | | | | | | | | | | | | | |
| | | | | | | | | | | | | | | | | | | | | | |
| | | (3,930,212 | ) | | | | | (2,980,112 | ) | | | | | (8,340 | ) | | | | | (434 | ) |
| | | — | | | | | | (9 | ) | | | | | (1,887 | ) | | | | | — | |
| | | (33,806,922 | ) | | | | | (30,748,151 | ) | | | | | (435,647 | ) | | | | | (61,810 | ) |
| | | (405,224 | ) | | | | | (294,661 | ) | | | | | — | | | | | | — | |
| | | (1,144,758 | ) | | | | | (951,071 | ) | | | | | (17,996 | ) | | | | | (10,063 | ) |
| | | (268,369 | ) | | | | | (64,171 | ) | | | | | (338 | ) | | | | | — | |
| | | (3,388,115 | ) | | | | | (357,573 | ) | | | | | (99 | ) | | | | | (19 | ) |
| | | | | | | | | | | | | | | | | | | | | | |
| | | (29,858,961 | ) | | | | | (44,642,227 | ) | | | | | — | | | | | | (3,634 | ) |
| | | (1,859,091 | ) | | | | | (3,294,839 | ) | | | | | — | | | | | | (1,782 | ) |
| | | (135,269,543 | ) | | | | | (194,855,378 | ) | | | | | — | | | | | | (130,208 | ) |
| | | (3,933,444 | ) | | | | | (6,631,448 | ) | | | | | — | | | | | | — | |
| | | (5,441,781 | ) | | | | | (7,430,439 | ) | | | | | — | | | | | | (25,440 | ) |
| | | (4,176,976 | ) | | | | | (6,298,200 | ) | | | | | — | | | | | | (294 | ) |
| | | (12,010,906 | ) | | | | | (2,172,148 | ) | | | | | — | | | | | | (48 | ) |
| | | (235,494,302 | ) | | | | | (300,720,427 | ) | | | | | (464,307 | ) | | | | | (233,732 | ) |
| | | | | | | | | | | | | | | | | | | | | | |
| | | | | | | | | | | | | | | | | | | | | | |
| | | 1,267,868,012 | | | | | | 1,486,570,672 | | | | | | 11,631,630 | | | | | | 29,746,543 | |
| | | 225,307,018 | | | | | | 287,034,432 | | | | | | 462,700 | | | | | | 233,709 | |
| | | (1,207,120,660 | ) | | | | | (1,885,709,406 | ) | | | | | (10,764,180 | ) | | | | | (16,212,125 | ) |
| | | 286,054,370 | | | | | | (112,104,302 | ) | | | | | 1,330,150 | | | | | | 13,768,127 | |
| | | 836,816,494 | | | | | | 234,772,875 | | | | | | 6,512,886 | | | | | | 17,043,198 | |
| | | | | | | | | | | | | | | | | | | | | | |
| | | | | | | | | | | | | | | | | | | | | | |
| | | 6,174,655,084 | | | | | | 5,939,882,209 | | | | | | 43,909,715 | | | | | | 26,866,517 | |
| | $ | 7,011,471,578 | | | | | $ | 6,174,655,084 | | | | | $ | 50,422,601 | | | | | $ | 43,909,715 | |
| | $ | (3,936,467 | ) | | | | $ | 16,206,480 | | | | | $ | 114,416 | | | | | $ | 378,040 | |
| | |
| The accompanying notes are an integral part of these financial statements. | | 63 |
GOLDMAN SACHS FOCUSED VALUE FUND
Financial Highlights
Selected Data for a Share Outstanding Throughout Each Period
| | | | | | | | | | | | | | | | | | | | | | |
| | | | | | | | From
investment operations | | | | |
| | | Year - Share Class | | Net asset
value,
beginning
of period | | | Net
investment
income(a) | | | Net realized
and unrealized
gain (loss) | | | Total from
investment
operations | | | Distributions
to shareholders
from net
investment
income | |
| | FOR THE SIX MONTHS ENDED FEBRUARY 28, (UNAUDITED) | |
| | 2017 - A | | $ | 9.89 | | | $ | 0.04 | | | $ | 1.02 | | | $ | 1.06 | | | $ | (0.11 | ) |
| | 2017 - C | | | 9.84 | | | | — | (e) | | | 1.02 | | | | 1.02 | | | | (0.03 | ) |
| | 2017 - Institutional | | | 9.92 | | | | 0.06 | | | | 1.02 | | | | 1.08 | | | | (0.14 | ) |
| | 2017 - IR | | | 9.91 | | | | 0.05 | | | | 1.03 | | | | 1.08 | | | | (0.13 | ) |
| | 2017 - R | | | 9.88 | | | | 0.03 | | | | 1.01 | | | | 1.04 | | | | (0.08 | ) |
| | 2017 - R6 | | | 9.92 | | | | 0.06 | | | | 1.02 | | | | 1.08 | | | | (0.14 | ) |
| | | | | | | | | | | | | | | | | | | | | | |
| | FOR THE FISCAL YEAR ENDED AUGUST 31, | |
| | 2016 - A | | | 9.28 | | | | 0.12 | | | | 0.52 | | | | 0.64 | | | | (0.03 | ) |
| | 2016 - C | | | 9.28 | | | | 0.05 | | | | 0.51 | | | | 0.56 | | | | — | (e) |
| | 2016 - Institutional | | | 9.29 | | | | 0.16 | | | | 0.52 | | | | 0.68 | | | | (0.05 | ) |
| | 2016 - IR | | | 9.29 | | | | 0.15 | | | | 0.51 | | | | 0.66 | | | | (0.04 | ) |
| | 2016 - R | | | 9.28 | | | | 0.10 | | | | 0.52 | | | | 0.62 | | | | (0.02 | ) |
| | 2016 - R6 | | | 9.29 | | | | 0.16 | | | | 0.52 | | | | 0.68 | | | | (0.05 | ) |
| | | | | | | | | | | | | | | | | | | | | | |
| | FOR THE PERIOD ENDED AUGUST 31, | |
| | 2015 - A (Commenced July 31, 2015) | | | 10.00 | | | | 0.01 | | | | (0.73 | ) | | | (0.72 | ) | | | — | |
| | 2015 - C (Commenced July 31, 2015) | | | 10.00 | | | | — | (e) | | | (0.72 | ) | | | (0.72 | ) | | | — | |
| | 2015 - Institutional (Commenced July 31, 2015) | | | 10.00 | | | | 0.01 | | | | (0.72 | ) | | | (0.71 | ) | | | — | |
| | 2015 - IR (Commenced July 31, 2015) | | | 10.00 | | | | 0.01 | | | | (0.72 | ) | | | (0.71 | ) | | | — | |
| | 2015 - R (Commenced July 31, 2015) | | | 10.00 | | | | 0.01 | | | | (0.73 | ) | | | (0.72 | ) | | | — | |
| | 2015 - R6 (Commenced July 31, 2015) | | | 10.00 | | | | 0.01 | | | | (0.72 | ) | | | (0.71 | ) | | | — | |
| | (a) | | Calculated based on the average shares outstanding methodology. |
| | (b) | | Assumes investment at the NAV at the beginning of the period, reinvestment of all dividends and distributions, a complete redemption of the investment at the NAV at the end of the period and no sales or redemption charges. Total returns would be reduced if a sales or redemption charge was taken into account. Returns do not reflect the impact of taxes to shareholder relating to Fund distributions or the redemption of Fund shares. Total returns for periods less than one full year are not annualized. |
| | (c) | | The Fund’s portfolio turnover rate is calculated in accordance with regulatory requirements, without regard to transactions involving short term investments. If such transactions were included, the Fund’s portfolio turnover rate may be higher. |
| | (e) | | Amount is less than $0.005 per share. |
| | |
| 64 | | The accompanying notes are an integral part of these financial statements. |
GOLDMAN SACHS FOCUSED VALUE FUND
| | | | | | | | | | | | | | | | | | | | | | | | | | | | | | | | | | | | | | | | |
| | | | | | | | | | | | | | | | | | | | | | | | | | | | | | | | | | |
| | | Net asset
value, end
of period | | | | | Total
return(b) | | | | | Net assets,
end of
period
(in 000s) | | | | | Ratio of
net expenses
to average
net assets | | | | | Ratio of
total expenses
to average
net assets | | | | | Ratio of
net investment
income
to average
net assets | | | | | Portfolio
turnover
rate(c) | |
| | | | | | | | | | | | | | | | | | | | | | | | | | | | | | | | | | | | | | | | |
| | $ | 10.84 | | | | | | 10.76 | % | | | | $ | 46 | | | | | | 1.13 | %(d) | | | | | 8.53 | %(d) | | | | | 0.80 | %(d) | | | | | 54 | % |
| | | 10.83 | | | | | | 10.39 | | | | | | 48 | | | | | | 1.88 | (d) | | | | | 9.19 | (d) | | | | | 0.10 | (d) | | | | | 54 | |
| | | 10.86 | | | | | | 10.93 | | | | | | 3,573 | | | | | | 0.73 | (d) | | | | | 7.86 | (d) | | | | | 1.20 | (d) | | | | | 54 | |
| | | 10.86 | | | | | | 10.89 | | | | | | 28 | | | | | | 0.88 | (d) | | | | | 8.01 | (d) | | | | | 1.05 | (d) | | | | | 54 | |
| | | 10.84 | | | | | | 10.53 | | | | | | 27 | | | | | | 1.38 | (d) | | | | | 8.51 | (d) | | | | | 0.55 | (d) | | | | | 54 | |
| | | 10.86 | | | | | | 10.95 | | | | | | 28 | | | | | | 0.70 | (d) | | | | | 7.84 | (d) | | | | | 1.23 | (d) | | | | | 54 | |
| | | | | | | | | | | | | | | | | | | | | | | | | | | | | | | | | | | | | | | | |
| | | | | | | | | | | | | | | | | | | | | | | | | | | | | | | | | | | | | | | | |
| | | 9.89 | | | | | | 6.93 | | | | | | 25 | | | | | | 1.13 | | | | | | 14.54 | | | | | | 1.33 | | | | | | 161 | |
| | | 9.84 | | | | | | 6.06 | | | | | | 25 | | | | | | 1.88 | | | | | | 15.30 | | | | | | 0.58 | | | | | | 161 | |
| | | 9.92 | | | | | | 7.33 | | | | | | 3,206 | | | | | | 0.73 | | | | | | 13.52 | | | | | | 1.73 | | | | | | 161 | |
| | | 9.91 | | | | | | 7.26 | | | | | | 25 | | | | | | 0.88 | | | | | | 14.28 | | | | | | 1.58 | | | | | | 161 | |
| | | 9.88 | | | | | | 6.60 | | | | | | 25 | | | | | | 1.38 | | | | | | 14.79 | | | | | | 1.08 | | | | | | 161 | |
| | | 9.92 | | | | | | 7.34 | | | | | | 25 | | | | | | 0.71 | | | | | | 14.11 | | | | | | 1.75 | | | | | | 161 | |
| | | | | | | | | | | | | | | | | | | | | | | | | | | | | | | | | | | | | | | | |
| | | | | | | | | | | | | | | | | | | | | | | | | | | | | | | | | | | | | | | | |
| | | 9.28 | | | | | | (7.20 | ) | | | | | 23 | | | | | | 1.13 | (d) | | | | | 25.55 | (d) | | | | | 0.97 | (d) | | | | | 2 | |
| | | 9.28 | | | | | | (7.20 | ) | | | | | 23 | | | | | | 1.89 | (d) | | | | | 26.30 | (d) | | | | | 0.21 | (d) | | | | | 2 | |
| | | 9.29 | | | | | | (7.10 | ) | | | | | 1,741 | | | | | | 0.74 | (d) | | | | | 25.15 | (d) | | | | | 1.37 | (d) | | | | | 2 | |
| | | 9.29 | | | | | | (7.20 | ) | | | | | 23 | | | | | | 0.89 | (d) | | | | | 25.30 | (d) | | | | | 1.21 | (d) | | | | | 2 | |
| | | 9.28 | | | | | | (7.10 | ) | | | | | 23 | | | | | | 1.39 | (d) | | | | | 25.80 | (d) | | | | | 0.71 | (d) | | | | | 2 | |
| | | 9.29 | | | | | | (7.10 | ) | | | | | 23 | | | | | | 0.72 | (d) | | | | | 25.14 | (d) | | | | | 1.39 | (d) | | | | | 2 | |
| | |
| The accompanying notes are an integral part of these financial statements. | | 65 |
GOLDMAN SACHS GROWTH AND INCOME FUND
Financial Highlights
Selected Data for a Share Outstanding Throughout Each Period
| | | | | | | | | | | | | | | | | | | | | | |
| | | | | | | | From
investment operations | | | | |
| | | Year - Share Class | |
Net asset
value,
beginning
of period | | | Net
investment
income(a) | | | Net realized
and unrealized
gain (loss) | | | Total from
investment
operations | | | Distributions to shareholders from net
investment
income | |
| | FOR THE SIX MONTHS ENDED FEBRUARY 28, (UNAUDITED) | |
| | 2017 - A | | $ | 32.53 | | | $ | 0.29 | | | $ | 3.20 | | | $ | 3.49 | | | $ | (0.32 | ) |
| | 2017 - C | | | 31.01 | | | | 0.16 | | | | 3.04 | | | | 3.20 | | | | (0.19 | ) |
| | 2017 - Institutional | | | 33.07 | | | | 0.36 | | | | 3.26 | | | | 3.62 | | | | (0.39 | ) |
| | 2017 - Service | | | 32.53 | | | | 0.27 | | | | 3.21 | | | | 3.48 | | | | (0.30 | ) |
| | 2017 - IR | | | 32.49 | | | | 0.39 | | | | 3.13 | | | | 3.52 | | | | (0.36 | ) |
| | 2017 - R | | | 32.35 | | | | 0.24 | | | | 3.19 | | | | 3.43 | | | | (0.27 | ) |
| | 2017 - R6 | | | 33.06 | | | | 0.36 | | | | 3.26 | | | | 3.62 | | | | (0.39 | ) |
| | | | | | | | | | | | | | | | | | | | | | |
| | FOR THE FISCAL YEARS ENDED AUGUST 31, | | | | | | | | | | | | | | | | | | | | |
| | 2016 - A | | | 30.47 | | | | 0.68 | | | | 2.02 | | | | 2.70 | | | | (0.64 | ) |
| | 2016 - C | | | 29.08 | | | | 0.43 | | | | 1.93 | | | | 2.36 | | | | (0.43 | ) |
| | 2016 - Institutional | | | 30.96 | | | | 0.82 | | | | 2.06 | | | | 2.88 | | | | (0.77 | ) |
| | 2016 - Service | | | 30.46 | | | | 0.65 | | | | 2.02 | | | | 2.67 | | | | (0.60 | ) |
| | 2016 - IR | | | 30.41 | | | | 0.76 | | | | 2.02 | | | | 2.78 | | | | (0.70 | ) |
| | 2016 - R | | | 30.32 | | | | 0.60 | | | | 2.00 | | | | 2.60 | | | | (0.57 | ) |
| | 2016 - R6 | | | 30.97 | | | | 0.82 | | | | 2.04 | | | | 2.86 | | | | (0.77 | ) |
| | 2015 - A | | | 32.21 | | | | 0.55 | | | | (1.80 | ) | | | (1.25 | ) | | | (0.49 | ) |
| | 2015 - C | | | 30.77 | | | | 0.29 | | | | (1.72 | ) | | | (1.43 | ) | | | (0.26 | ) |
| | 2015 - Institutional | | | 32.72 | | | | 0.69 | | | | (1.83 | ) | | | (1.14 | ) | | | (0.62 | ) |
| | 2015 - Service | | | 32.20 | | | | 0.51 | | | | (1.79 | ) | | | (1.28 | ) | | | (0.46 | ) |
| | 2015 - IR | | | 32.15 | | | | 0.62 | | | | (1.79 | ) | | | (1.17 | ) | | | (0.57 | ) |
| | 2015 - R | | | 32.05 | | | | 0.46 | | | | (1.78 | ) | | | (1.32 | ) | | | (0.41 | ) |
| | 2015 - R6 (Commenced July 31, 2015) | | | 33.24 | | | | 0.08 | | | | (2.35 | ) | | | (2.27 | ) | | | — | |
| | 2014 - A | | | 26.70 | | | | 0.42 | | | | 5.48 | | | | 5.90 | | | | (0.39 | ) |
| | 2014 - C | | | 25.54 | | | | 0.19 | | | | 5.23 | | | | 5.42 | | | | (0.19 | ) |
| | 2014 - Institutional | | | 27.12 | | | | 0.55 | | | | 5.56 | | | | 6.11 | | | | (0.51 | ) |
| | 2014 - Service | | | 26.69 | | | | 0.39 | | | | 5.48 | | | | 5.87 | | | | (0.36 | ) |
| | 2014 - IR | | | 26.65 | | | | 0.51 | | | | 5.46 | | | | 5.97 | | | | (0.47 | ) |
| | 2014 - R | | | 26.60 | | | | 0.35 | | | | 5.45 | | | | 5.80 | | | | (0.35 | ) |
| | 2013 - A | | | 21.68 | | | | 0.29 | | | | 5.02 | | | | 5.31 | | | | (0.29 | ) |
| | 2013 - C | | | 20.78 | | | | 0.11 | | | | 4.80 | | | | 4.91 | | | | (0.15 | ) |
| | 2013 - Institutional | | | 22.01 | | | | 0.40 | | | | 5.09 | | | | 5.49 | | | | (0.38 | ) |
| | 2013 - Service | | | 21.66 | | | | 0.27 | | | | 5.02 | | | | 5.29 | | | | (0.26 | ) |
| | 2013 - IR | | | 21.64 | | | | 0.38 | | | | 4.97 | | | | 5.35 | | | | (0.34 | ) |
| | 2013 - R | | | 21.60 | | | | 0.23 | | | | 5.00 | | | | 5.23 | | | | (0.23 | ) |
| | 2012 - A | | | 19.04 | | | | 0.32 | (e) | | | 2.58 | | | | 2.90 | | | | (0.26 | ) |
| | 2012 - C | | | 18.28 | | | | 0.16 | (e) | | | 2.48 | | | | 2.64 | | | | (0.14 | ) |
| | 2012 - Institutional | | | 19.33 | | | | 0.41 | (e) | | | 2.61 | | | | 3.02 | | | | (0.34 | ) |
| | 2012 - Service | | | 19.04 | | | | 0.30 | (e) | | | 2.56 | | | | 2.86 | | | | (0.24 | ) |
| | 2012 - IR | | | 19.02 | | | | 0.36 | (e) | | | 2.58 | | | | 2.94 | | | | (0.32 | ) |
| | 2012 - R | | | 18.99 | | | | 0.26 | (e) | | | 2.57 | | | | 2.83 | | | | (0.22 | ) |
| | (a) | | Calculated based on the average shares outstanding methodology. |
| | (b) | | Assumes investment at the NAV at the beginning of the period, reinvestment of all dividends and distributions, a complete redemption of the investment at the NAV at the end of the period and no sales or redemption charges. Total returns would be reduced if a sales or redemption charge was taken into account. Returns do not reflect the impact of taxes to shareholder relating to Fund distributions or the redemption of Fund shares. Total returns for periods less than one full year are not annualized. |
| | (c) | | The Fund’s portfolio turnover rate is calculated in accordance with regulatory requirements, without regard to transactions involving short term investments. If such transactions were included, the Fund’s portfolio turnover rate may be higher. |
| | (e) | | Reflects income recognized from special dividends which amounted to $0.06 per share and 0.28% of average net assets. |
| | |
| 66 | | The accompanying notes are an integral part of these financial statements. |
GOLDMAN SACHS GROWTH AND INCOME FUND
| | | | | | | | | | | | | | | | | | | | | | | | | | | | | | | | | | | | | | | | |
| | | | | | | | | | | | | | | | | | | | | | | | | | | | | | | | | | |
| | | Net asset
value, end
of period | | | | | Total
return(b) | | | | | Net assets,
end of period
(in 000s) | | | | | Ratio of
net expenses
to average
net assets | | | | | Ratio of
total expenses
to average
net assets | | | | | Ratio of
net investment
income
to average
net assets | | | | | Portfolio
turnover
rate(c) | |
| | | | | | | | | | | | | | | | | | | | | | | | | | | | | | | | | | | | | | | | |
| | $ | 35.70 | | | | | | 10.78 | % | | | | $ | 359,341 | | | | | | 1.13 | %(d) | | | | | 1.23 | %(d) | | | | | 1.72 | %(d) | | | | | 13 | % |
| | | 34.02 | | | | | | 10.37 | | | | | | 23,155 | | | | | | 1.88 | (d) | | | | | 1.98 | (d) | | | | | 0.98 | (d) | | | | | 13 | |
| | | 36.30 | | | | | | 11.02 | | | | | | 37,622 | | | | | | 0.73 | (d) | | | | | 0.84 | (d) | | | | | 2.15 | (d) | | | | | 13 | |
| | | 35.71 | | | | | | 10.75 | | | | | | 354 | | | | | | 1.23 | (d) | | | | | 1.34 | (d) | | | | | 1.63 | (d) | | | | | 13 | |
| | | 35.65 | | | | | | 10.92 | | | | | | 2,421 | | | | | | 0.88 | (d) | | | | | 0.99 | (d) | | | | | 2.30 | (d) | | | | | 13 | |
| | | 35.51 | | | | | | 10.66 | | | | | | 1,572 | | | | | | 1.38 | (d) | | | | | 1.48 | (d) | | | | | 1.48 | (d) | | | | | 13 | |
| | | 36.29 | | | | | | 11.02 | | | | | | 11 | | | | | | 0.73 | (d) | | | | | 0.83 | (d) | | | | | 2.14 | (d) | | | | | 13 | |
| | | | | | | | | | | | | | | | | | | | | | | | | | | | | | | | | | | | | | | | |
| | | | | | | | | | | | | | | | | | | | | | | | | | | | | | | | | | | | | | | | |
| | | 32.53 | | | | | | 9.01 | | | | | | 359,003 | | | | | | 1.13 | | | | | | 1.26 | | | | | | 2.22 | | | | | | 61 | |
| | | 31.01 | | | | | | 8.21 | | | | | | 22,371 | | | | | | 1.88 | | | | | | 2.01 | | | | | | 1.47 | | | | | | 61 | |
| | | 33.07 | | | | | | 9.46 | | | | | | 31,409 | | | | | | 0.73 | | | | | | 0.86 | | | | | | 2.61 | | | | | | 61 | |
| | | 32.53 | | | | | | 8.88 | | | | | | 324 | | | | | | 1.23 | | | | | | 1.36 | | | | | | 2.11 | | | | | | 61 | |
| | | 32.49 | | | | | | 9.27 | | | | | | 743 | | | | | | 0.88 | | | | | | 1.01 | | | | | | 2.47 | | | | | | 61 | |
| | | 32.35 | | | | | | 8.71 | | | | | | 1,477 | | | | | | 1.38 | | | | | | 1.51 | | | | | | 1.96 | | | | | | 61 | |
| | | 33.06 | | | | | | 9.40 | | | | | | 10 | | | | | | 0.73 | | | | | | 0.86 | | | | | | 2.62 | | | | | | 61 | |
| | | 30.47 | | | | | | (3.98 | ) | | | | | 369,115 | | | | | | 1.14 | | | | | | 1.22 | | | | | | 1.68 | | | | | | 47 | |
| | | 29.08 | | | | | | (4.70 | ) | | | | | 23,534 | | | | | | 1.89 | | | | | | 1.97 | | | | | | 0.93 | | | | | | 47 | |
| | | 30.96 | | | | | | (3.59 | ) | | | | | 29,243 | | | | | | 0.74 | | | | | | 0.82 | | | | | | 2.09 | | | | | | 47 | |
| | | 30.46 | | | | | | (4.06 | ) | | | | | 397 | | | | | | 1.24 | | | | | | 1.32 | | | | | | 1.58 | | | | | | 47 | |
| | | 30.41 | | | | | | (3.74 | ) | | | | | 614 | | | | | | 0.89 | | | | | | 0.97 | | | | | | 1.90 | | | | | | 47 | |
| | | 30.32 | | | | | | (4.19 | ) | | | | | 1,167 | | | | | | 1.39 | | | | | | 1.47 | | | | | | 1.44 | | | | | | 47 | |
| | | 30.97 | | | | | | (6.83 | ) | | | | | 9 | | | | | | 0.69 | (d) | | | | | 0.84 | (d) | | | | | 2.79 | (d) | | | | | 47 | |
| | | 32.21 | | | | | | 22.27 | | | | | | 414,276 | | | | | | 1.18 | | | | | | 1.24 | | | | | | 1.42 | | | | | | 40 | |
| | | 30.77 | | | | | | 21.32 | | | | | | 26,742 | | | | | | 1.93 | | | | | | 1.99 | | | | | | 0.67 | | | | | | 40 | |
| | | 32.72 | | | | | | 22.73 | | | | | | 29,476 | | | | | | 0.78 | | | | | | 0.84 | | | | | | 1.82 | | | | | | 40 | |
| | | 32.20 | | | | | | 22.12 | | | | | | 368 | | | | | | 1.28 | | | | | | 1.34 | | | | | | 1.33 | | | | | | 40 | |
| | | 32.15 | | | | | | 22.58 | | | | | | 3,937 | | | | | | 0.93 | | | | | | 0.98 | | | | | | 1.71 | | | | | | 40 | |
| | | 32.05 | | | | | | 21.94 | | | | | | 1,462 | | | | | | 1.43 | | | | | | 1.49 | | | | | | 1.16 | | | | | | 40 | |
| | | 26.70 | | | | | | 24.68 | | | | | | 379,500 | | | | | | 1.19 | | | | | | 1.24 | | | | | | 1.21 | | | | | | 83 | |
| | | 25.54 | | | | | | 23.77 | | | | | | 24,154 | | | | | | 1.94 | | | | | | 1.99 | | | | | | 0.46 | | | | | | 83 | |
| | | 27.12 | | | | | | 25.20 | | | | | | 19,279 | | | | | | 0.79 | | | | | | 0.84 | | | | | | 1.60 | | | | | | 83 | |
| | | 26.69 | | | | | | 24.62 | | | | | | 356 | | | | | | 1.29 | | | | | | 1.34 | | | | | | 1.09 | | | | | | 83 | |
| | | 26.65 | | | | | | 24.98 | | | | | | 2,158 | | | | | | 0.94 | | | | | | 1.01 | | | | | | 1.54 | | | | | | 83 | |
| | | 26.60 | | | | | | 24.41 | | | | | | 609 | | | | | | 1.44 | | | | | | 1.49 | | | | | | 0.94 | | | | | | 83 | |
| | | 21.68 | | | | | | 15.36 | | | | | | 374,273 | | | | | | 1.19 | | | | | | 1.22 | | | | | | 1.63 | (e) | | | | | 115 | |
| | | 20.78 | | | | | | 14.49 | | | | | | 20,726 | | | | | | 1.94 | | | | | | 1.97 | | | | | | 0.85 | (e) | | | | | 115 | |
| | | 22.01 | | | | | | 15.81 | | | | | | 18,001 | | | | | | 0.79 | | | | | | 0.82 | | | | | | 2.06 | (e) | | | | | 115 | |
| | | 21.66 | | | | | | 15.16 | | | | | | 566 | | | | | | 1.29 | | | | | | 1.32 | | | | | | 1.50 | (e) | | | | | 115 | |
| | | 21.64 | | | | | | 15.61 | | | | | | 480 | | | | | | 0.94 | | | | | | 0.97 | | | | | | 1.78 | (e) | | | | | 115 | |
| | | 21.60 | | | | | | 14.99 | | | | | | 801 | | | | | | 1.44 | | | | | | 1.47 | | | | | | 1.31 | (e) | | | | | 115 | |
| | |
| The accompanying notes are an integral part of these financial statements. | | 67 |
GOLDMAN SACHS LARGE CAP VALUE FUND
Financial Highlights
Selected Data for a Share Outstanding Throughout Each Period
| | | | | | | | | | | | | | | | | | | | | | | | | | | | | | |
| | | | | | | | From
investment operations | | | Distributions
to shareholders | |
| | | Year - Share Class | | Net asset
value,
beginning
of period | | | Net
investment
income(a) | | | Net realized
and unrealized
gain (loss) | | | Total from
investment
operations | | | From net
investment
income | | | From net
realized
gains | | | Total
distributions | |
| | FOR THE SIX MONTHS ENDED FEBRUARY 28, (UNAUDITED) | |
| | 2017 - A | | $ | 16.08 | | | $ | 0.09 | | | $ | 1.50 | | | $ | 1.59 | | | $ | (0.28 | ) | | $ | — | | | $ | (0.28 | ) |
| | 2017 - C | | | 15.43 | | | | 0.03 | | | | 1.43 | | | | 1.46 | | | | (0.18 | ) | | | — | | | | (0.18 | ) |
| | 2017 - Institutional | | | 16.25 | | | | 0.12 | | | | 1.51 | | | | 1.63 | | | | (0.35 | ) | | | — | | | | (0.35 | ) |
| | 2017 - Service | | | 15.99 | | | | 0.08 | | | | 1.48 | | | | 1.56 | | | | (0.25 | ) | | | — | | | | (0.25 | ) |
| | 2017 - IR | | | 16.11 | | | | 0.12 | | | | 1.48 | | | | 1.60 | | | | (0.31 | ) | | | — | | | | (0.31 | ) |
| | 2017 - R | | | 15.73 | | | | 0.07 | | | | 1.46 | | | | 1.53 | | | | (0.24 | ) | | | — | | | | (0.24 | ) |
| | 2017 - R6 | | | 16.25 | | | | 0.12 | | | | 1.51 | | | | 1.63 | | | | (0.35 | ) | | | — | | | | (0.35 | ) |
| | | | | | | | | | | | | | | | | | | | | | | | | | | | | | |
| | FOR THE FISCAL YEARS ENDED DECEMBER 31, | |
| | 2016 - A | | | 16.45 | | | | 0.24 | | | | 0.95 | | | | 1.19 | | | | (0.12 | ) | | | (1.44 | ) | | | (1.56 | ) |
| | 2016 - C | | | 15.83 | | | | 0.12 | | | | 0.93 | | | | 1.05 | | | | (0.01 | ) | | | (1.44 | ) | | | (1.45 | ) |
| | 2016 - Institutional | | | 16.61 | | | | 0.30 | | | | 0.97 | | | | 1.27 | | | | (0.19 | ) | | | (1.44 | ) | | | (1.63 | ) |
| | 2016 - Service | | | 16.36 | | | | 0.22 | | | | 0.96 | | | | 1.18 | | | | (0.11 | ) | | | (1.44 | ) | | | (1.55 | ) |
| | 2016 - IR | | | 16.47 | | | | 0.27 | | | | 0.97 | | | | 1.24 | | | | (0.16 | ) | | | (1.44 | ) | | | (1.60 | ) |
| | 2016 - R | | | 16.12 | | | | 0.20 | | | | 0.94 | | | | 1.14 | | | | (0.09 | ) | | | (1.44 | ) | | | (1.53 | ) |
| | 2016 - R6 | | | 16.61 | | | | 0.31 | | | | 0.96 | | | | 1.27 | | | | (0.19 | ) | | | (1.44 | ) | | | (1.63 | ) |
| | 2015 - A | | | 18.50 | | | | 0.16 | | | | (1.11 | ) | | | (0.95 | ) | | | (0.14 | ) | | | (0.96 | ) | | | (1.10 | ) |
| | 2015 - C | | | 17.86 | | | | 0.03 | | | | (1.08 | ) | | | (1.05 | ) | | | (0.02 | ) | | | (0.96 | ) | | | (0.98 | ) |
| | 2015 - Institutional | | | 18.67 | | | | 0.24 | | | | (1.12 | ) | | | (0.88 | ) | | | (0.22 | ) | | | (0.96 | ) | | | (1.18 | ) |
| | 2015 - Service | | | 18.42 | | | | 0.15 | | | | (1.11 | ) | | | (0.96 | ) | | | (0.14 | ) | | | (0.96 | ) | | | (1.10 | ) |
| | 2015 - IR | | | 18.34 | | | | 0.21 | | | | (1.12 | ) | | | (0.91 | ) | | | — | | | | (0.96 | ) | | | (0.96 | ) |
| | 2015 - R | | | 18.17 | | | | 0.12 | | | | (1.09 | ) | | | (0.97 | ) | | | (0.12 | ) | | | (0.96 | ) | | | (1.08 | ) |
| | 2015- R6 (Commenced July 31, 2015) | | | 17.88 | | | | 0.03 | | | | (1.30 | ) | | | (1.27 | ) | | | — | | | | — | | | | — | |
| | 2014 - A | | | 15.06 | | | | 0.13 | | | | 3.41 | | | | 3.54 | | | | (0.10 | ) | | | — | | | | (0.10 | ) |
| | 2014 - C | | | 14.56 | | | | — | (e) | | | 3.31 | | | | 3.31 | | | | (0.01 | ) | | | — | | | | (0.01 | ) |
| | 2014 - Institutional | | | 15.20 | | | | 0.19 | | | | 3.45 | | | | 3.64 | | | | (0.17 | ) | | | — | | | | (0.17 | ) |
| | 2014 - Service | | | 14.99 | | | | 0.11 | | | | 3.40 | | | | 3.51 | | | | (0.08 | ) | | | — | | | | (0.08 | ) |
| | 2014 - IR | | | 14.94 | | | | 0.17 | | | | 3.38 | | | | 3.55 | | | | (0.15 | ) | | | — | | | | (0.15 | ) |
| | 2014 - R | | | 14.80 | | | | 0.08 | | | | 3.36 | | | | 3.44 | | | | (0.07 | ) | | | — | | | | (0.07 | ) |
| | 2013 - A | | | 12.13 | | | | 0.12 | | | | 2.95 | | | | 3.07 | | | | (0.14 | ) | | | — | | | | (0.14 | ) |
| | 2013 - C | | | 11.74 | | | | 0.01 | | | | 2.86 | | | | 2.87 | | | | (0.05 | ) | | | — | | | | (0.05 | ) |
| | 2013 - Institutional | | | 12.26 | | | | 0.17 | | | | 2.97 | | | | 3.14 | | | | (0.20 | ) | | | — | | | | (0.20 | ) |
| | 2013 - Service | | | 12.06 | | | | 0.10 | | | | 2.94 | | | | 3.04 | | | | (0.11 | ) | | | — | | | | (0.11 | ) |
| | 2013 - IR | | | 12.05 | | | | 0.15 | | | | 2.92 | | | | 3.07 | | | | (0.18 | ) | | | — | | | | (0.18 | ) |
| | 2013 - R | | | 11.93 | | | | 0.08 | | | | 2.90 | | | | 2.98 | | | | (0.11 | ) | | | — | | | | (0.11 | ) |
| | 2012 - A | | | 10.70 | | | | 0.15 | (f) | | | 1.41 | | | | 1.56 | | | | (0.13 | ) | | | — | | | | (0.13 | ) |
| | 2012 - C | | | 10.33 | | | | 0.06 | (f) | | | 1.38 | | | | 1.44 | | | | (0.03 | ) | | | — | | | | (0.03 | ) |
| | 2012 - Institutional | | | 10.82 | | | | 0.20 | (f) | | | 1.42 | | | | 1.62 | | | | (0.18 | ) | | | — | | | | (0.18 | ) |
| | 2012 - Service | | | 10.64 | | | | 0.14 | (f) | | | 1.40 | | | | 1.54 | | | | (0.12 | ) | | | — | | | | (0.12 | ) |
| | 2012 - IR | | | 10.64 | | | | 0.17 | (f) | | | 1.41 | | | | 1.58 | | | | (0.17 | ) | | | — | | | | (0.17 | ) |
| | 2012 - R | | | 10.54 | | | | 0.11 | (f) | | | 1.40 | | | | 1.51 | | | | (0.12 | ) | | | — | | | | (0.12 | ) |
| | (a) | | Calculated based on the average shares outstanding methodology. |
| | (b) | | Assumes investment at the NAV at the beginning of the period, reinvestment of all dividends and distributions, a complete redemption of the investment at the NAV at the end of the period and no sales or redemption charges. Total returns would be reduced if a sales or redemption charge was taken into account. Returns do not reflect the impact of taxes to shareholder relating to Fund distributions or the redemption of Fund shares. Total returns for periods less than one full year are not annualized. |
| | (c) | | The Fund’s portfolio turnover rate is calculated in accordance with regulatory requirements, without regard to transactions involving short term investments. If such transactions were included, the Fund’s portfolio turnover rate may be higher. |
| | (e) | | Amount is less than $0.005 per share. |
| | (f) | | Reflects income recognized from special dividends which amounted to $0.02 per share and 0.21% of average net assets. |
| | |
| 68 | | The accompanying notes are an integral part of these financial statements. |
GOLDMAN SACHS LARGE CAP VALUE FUND
| | | | | | | | | | | | | | | | | | | | | | | | | | | | | | | | | | | | | | | | |
| | | | | | | | | | | | | | | | | | | | | | | | | | | | | | | | | | |
| | | Net asset
value, end
of period | | | | | Total
return(b) | | | | | Net assets, end of period (in 000s) | | | | | Ratio of
net expenses
to average
net assets | | | | | Ratio of
total expenses
to average
net assets | | | | | Ratio of
net investment
income (loss)
to average net assets | | | | | Portfolio
turnover
rate(c) | |
| | | | | | | | | | | | | | | | | | | | | | | | | | | | | | | | | | | | | | | | |
| | $ | 17.39 | | | | | | 9.93 | % | | | | $ | 192,223 | | | | | | 1.16 | %(d) | | | | | 1.22 | %(d) | | | | | 1.08 | %(d) | | | | | 50 | % |
| | | 16.71 | | | | | | 9.49 | | | | | | 45,075 | | | | | | 1.91 | (d) | | | | | 1.97 | (d) | | | | | 0.35 | (d) | | | | | 50 | |
| | | 17.53 | | | | | | 10.10 | | | | | | 752,219 | | | | | | 0.78 | (d) | | | | | 0.81 | (d) | | | | | 1.43 | (d) | | | | | 50 | |
| | | 17.30 | | | | | | 9.82 | | | | | | 3,292 | | | | | | 1.28 | (d) | | | | | 1.31 | (d) | | | | | 0.96 | (d) | | | | | 50 | |
| | | 17.40 | | | | | | 10.02 | | | | | | 6,670 | | | | | | 0.90 | (d) | | | | | 0.97 | (d) | | | | | 1.43 | (d) | | | | | 50 | |
| | | 17.02 | | | | | | 9.76 | | | | | | 6,929 | | | | | | 1.41 | (d) | | | | | 1.47 | (d) | | | | | 0.83 | (d) | | | | | 50 | |
| | | 17.53 | | | | | | 10.13 | | | | | | 129,088 | | | | | | 0.76 | (d) | | | | | 0.80 | (d) | | | | | 1.48 | (d) | | | | | 50 | |
| | | | | | | | | | | | | | | | | | | | | | | | | | | | | | | | | | | | | | | | |
| | | | | | | | | | | | | | | | | | | | | | | | | | | | | | | | | | | | | | | | |
| | | 16.08 | | | | | | 7.73 | | | | | | 197,754 | | | | | | 1.18 | | | | | | 1.22 | | | | | | 1.54 | | | | | | 116 | |
| | | 15.43 | | | | | | 7.01 | | | | | | 41,587 | | | | | | 1.93 | | | | | | 1.97 | | | | | | 0.79 | | | | | | 116 | |
| | | 16.25 | | | | | | 8.17 | | | | | | 905,400 | | | | | | 0.78 | | | | | | 0.82 | | | | | | 1.93 | | | | | | 116 | |
| | | 15.99 | | | | | | 7.67 | | | | | | 3,549 | | | | | | 1.28 | | | | | | 1.32 | | | | | | 1.45 | | | | | | 116 | |
| | | 16.11 | | | | | | 8.05 | | | | | | 3,654 | | | | | | 0.93 | | | | | | 0.97 | | | | | | 1.77 | | | | | | 116 | |
| | | 15.73 | | | | | | 7.51 | | | | | | 7,130 | | | | | | 1.43 | | | | | | 1.47 | | | | | | 1.30 | | | | | | 116 | |
| | | 16.25 | | | | | | 8.21 | | | | | | 121,773 | | | | | | 0.76 | | | | | | 0.80 | | | | | | 2.05 | | | | | | 116 | |
| | | 16.45 | | | | | | (5.51 | ) | | | | | 234,810 | | | | | | 1.17 | | | | | | 1.20 | | | | | | 0.92 | | | | | | 79 | |
| | | 15.83 | | | | | | (6.28 | ) | | | | | 42,221 | | | | | | 1.92 | | | | | | 1.95 | | | | | | 0.16 | | | | | | 79 | |
| | | 16.61 | | | | | | (5.13 | ) | | | | | 1,037,653 | | | | | | 0.77 | | | | | | 0.80 | | | | | | 1.31 | | | | | | 79 | |
| | | 16.36 | | | | | | (5.63 | ) | | | | | 4,294 | | | | | | 1.27 | | | | | | 1.30 | | | | | | 0.84 | | | | | | 79 | |
| | | 16.47 | | | | | | (5.29 | ) | | | | | 6,878 | | | | | | 0.92 | | | | | | 0.95 | | | | | | 1.17 | | | | | | 79 | |
| | | 16.12 | | | | | | (5.77 | ) | | | | | 7,710 | | | | | | 1.42 | | | | | | 1.45 | | | | | | 0.66 | | | | | | 79 | |
| | | 16.61 | | | | | | (7.10 | ) | | | | | 9 | | | | | | 0.77 | (d) | | | | | 0.81 | (d) | | | | | 2.01 | (d) | | | | | 79 | |
| | | 18.50 | | | | | | 23.62 | | | | | | 260,256 | | | | | | 1.19 | | | | | | 1.20 | | | | | | 0.74 | | | | | | 67 | |
| | | 17.86 | | | | | | 22.73 | | | | | | 45,535 | | | | | | 1.94 | | | | | | 1.95 | | | | | | (0.01 | ) | | | | | 67 | |
| | | 18.67 | | | | | | 24.15 | | | | | | 1,206,895 | | | | | | 0.79 | | | | | | 0.80 | | | | | | 1.14 | | | | | | 67 | |
| | | 18.42 | | | | | | 23.53 | | | | | | 3,185 | | | | | | 1.29 | | | | | | 1.30 | | | | | | 0.64 | | | | | | 67 | |
| | | 18.34 | | | | | | 23.93 | | | | | | 6,618 | | | | | | 0.95 | | | | | | 0.95 | | | | | | 1.05 | | | | | | 67 | |
| | | 18.17 | | | | | | 23.33 | | | | | | 7,705 | | | | | | 1.44 | | | | | | 1.45 | | | | | | 0.49 | | | | | | 67 | |
| | | 15.06 | | | | | | 25.56 | | | | | | 229,781 | | | | | | 1.20 | | | | | | 1.20 | | | | | | 0.89 | | | | | | 98 | |
| | | 14.56 | | | | | | 24.56 | | | | | | 37,763 | | | | | | 1.95 | | | | | | 1.95 | | | | | | 0.08 | | | | | | 98 | |
| | | 15.20 | | | | | | 25.95 | | | | | | 1,048,489 | | | | | | 0.80 | | | | | | 0.80 | | | | | | 1.22 | | | | | | 98 | |
| | | 14.99 | | | | | | 25.39 | | | | | | 2,985 | | | | | | 1.30 | | | | | | 1.30 | | | | | | 0.74 | | | | | | 98 | |
| | | 14.94 | | | | | | 25.82 | | | | | | 141,673 | | | | | | 0.95 | | | | | | 0.95 | | | | | | 1.07 | | | | | | 98 | |
| | | 14.80 | | | | | | 25.22 | | | | | | 6,702 | | | | | | 1.45 | | | | | | 1.45 | | | | | | 0.58 | | | | | | 98 | |
| | | 12.13 | | | | | | 14.69 | | | | | | 418,274 | | | | | | 1.19 | | | | | | 1.19 | | | | | | 1.31 | (f) | | | | | 123 | |
| | | 11.74 | | | | | | 13.89 | | | | | | 34,854 | | | | | | 1.94 | | | | | | 1.94 | | | | | | 0.55 | (f) | | | | | 123 | |
| | | 12.26 | | | | | | 15.19 | | | | | | 900,661 | | | | | | 0.79 | | | | | | 0.79 | | | | | | 1.75 | (f) | | | | | 123 | |
| | | 12.06 | | | | | | 14.63 | | | | | | 3,424 | | | | | | 1.29 | | | | | | 1.29 | | | | | | 1.23 | (f) | | | | | 123 | |
| | | 12.05 | | | | | | 14.99 | | | | | | 103,975 | | | | | | 0.94 | | | | | | 0.94 | | | | | | 1.52 | (f) | | | | | 123 | |
| | | 11.93 | | | | | | 14.38 | | | | | | 5,411 | | | | | | 1.44 | | | | | | 1.44 | | | | | | 1.02 | (f) | | | | | 123 | |
| | |
| The accompanying notes are an integral part of these financial statements. | | 69 |
GOLDMAN SACHS MID CAP VALUE FUND
Financial Highlights
Selected Data for a Share Outstanding Throughout Each Period
| | | | | | | | | | | | | | | | | | | | | | | | | | | | | | |
| | | | | | | | From
investment operations | | | Distributions
to shareholders | |
| | | Year - Share Class | |
Net asset
value,
beginning
of period | | | Net
investment
income (loss)(a) | | | Net realized
and unrealized
gain (loss) | | | Total from
investment
operations | | | From net
investment
income | | | From net
realized
gains | | | Total
distributions | |
| | FOR THE SIX MONTHS ENDED FEBRUARY 28, (UNAUDITED) | |
| | 2017 - A | | $ | 35.25 | | | $ | 0.10 | | | $ | 3.23 | | | $ | 3.33 | | | $ | (0.37 | ) | | $ | — | | | $ | (0.37 | ) |
| | 2017 - C | | | 32.00 | | | | (0.04 | ) | | | 2.95 | | | | 2.91 | | | | (0.15 | ) | | | — | | | | (0.15 | ) |
| | 2017 - Institutional | | | 35.64 | | | | 0.17 | | | | 3.29 | | | | 3.46 | | | | (0.55 | ) | | | — | | | | (0.55 | ) |
| | 2017 - Service | | | 34.63 | | | | 0.08 | | | | 3.19 | | | | 3.27 | | | | (0.32 | ) | | | — | | | | (0.32 | ) |
| | 2017 - IR | | | 34.63 | | | | 0.14 | | | | 3.19 | | | | 3.33 | | | | (0.50 | ) | | | — | | | | (0.50 | ) |
| | 2017 - R | | | 34.38 | | | | 0.05 | | | | 3.17 | | | | 3.22 | | | | (0.32 | ) | | | — | | | | (0.32 | ) |
| | 2017 - R6 | | | 35.64 | | | | 0.17 | | | | 3.28 | | | | 3.45 | | | | (0.56 | ) | | | — | | | | (0.56 | ) |
| | | | | | | | | | | | | | | | | | | | | | | | | | | | | | |
| | FOR THE FISCAL YEARS ENDED AUGUST 31 | |
| | 2016 - A | | | 38.81 | | | | 0.32 | | | | 0.56 | | | | 0.88 | | | | (0.10 | ) | | | (4.34 | ) | | | (4.44 | ) |
| | 2016 - C | | | 35.80 | | | | 0.05 | | | | 0.49 | | | | 0.54 | | | | — | | | | (4.34 | ) | | | (4.34 | ) |
| | 2016 - Institutional | | | 39.22 | | | | 0.46 | | | | 0.56 | | | | 1.02 | | | | (0.26 | ) | | | (4.34 | ) | | | (4.60 | ) |
| | 2016 - Service | | | 38.21 | | | | 0.28 | | | | 0.54 | | | | 0.82 | | | | (0.06 | ) | | | (4.34 | ) | | | (4.40 | ) |
| | 2016 - IR | | | 38.23 | | | | 0.39 | | | | 0.55 | | | | 0.94 | | | | (0.20 | ) | | | (4.34 | ) | | | (4.54 | ) |
| | 2016 - R | | | 38.00 | | | | 0.22 | | | | 0.55 | | | | 0.77 | | | | (0.05 | ) | | | (4.34 | ) | | | (4.39 | ) |
| | 2016 - R6 | | | 39.23 | | | | 0.47 | | | | 0.56 | | | | 1.03 | | | | (0.28 | ) | | | (4.34 | ) | | | (4.62 | ) |
| | 2015 - A | | | 49.03 | | | | 0.13 | | | | (1.75 | ) | | | (1.62 | ) | | | (0.13 | ) | | | (8.47 | ) | | | (8.60 | ) |
| | 2015 - C | | | 46.05 | | | | (0.19 | ) | | | (1.59 | ) | | | (1.78 | ) | | | — | (e) | | | (8.47 | ) | | | (8.47 | ) |
| | 2015 - Institutional | | | 49.55 | | | | 0.29 | | | | (1.75 | ) | | | (1.46 | ) | | | (0.40 | ) | | | (8.47 | ) | | | (8.87 | ) |
| | 2015 - Service | | | 48.40 | | | | 0.08 | | | | (1.71 | ) | | | (1.63 | ) | | | (0.09 | ) | | | (8.47 | ) | | | (8.56 | ) |
| | 2015 - IR | | | 48.52 | | | | 0.22 | | | | (1.70 | ) | | | (1.48 | ) | | | (0.34 | ) | | | (8.47 | ) | | | (8.81 | ) |
| | 2015 - R | | | 48.28 | | | | — | (e) | | | (1.69 | ) | | | (1.69 | ) | | | (0.12 | ) | | | (8.47 | ) | | | (8.59 | ) |
| | 2015 - R6 (Commenced July 31, 2015) | | | 41.24 | | | | (0.02 | ) | | | (1.99 | ) | | | (2.01 | ) | | | — | | | | — | | | | — | |
| | 2014 - A | | | 46.08 | | | | 0.18 | | | | 10.10 | | | | 10.28 | | | | (0.22 | ) | | | (7.11 | ) | | | (7.33 | ) |
| | 2014 - C | | | 43.79 | | | | (0.17 | ) | | | 9.54 | | | | 9.37 | | | | — | | | | (7.11 | ) | | | (7.11 | ) |
| | 2014 - Institutional | | | 46.52 | | | | 0.36 | | | | 10.19 | | | | 10.55 | | | | (0.41 | ) | | | (7.11 | ) | | | (7.52 | ) |
| | 2014 - Service | | | 45.59 | | | | 0.13 | | | | 9.97 | | | | 10.10 | | | | (0.18 | ) | | | (7.11 | ) | | | (7.29 | ) |
| | 2014 - IR | | | 45.70 | | | | 0.30 | | | | 9.98 | | | | 10.28 | | | | (0.35 | ) | | | (7.11 | ) | | | (7.46 | ) |
| | 2014 - R | | | 45.54 | | | | 0.05 | | | | 9.97 | | | | 10.02 | | | | (0.17 | ) | | | (7.11 | ) | | | (7.28 | ) |
| | 2013 - A | | | 37.43 | | | | 0.24 | | | | 8.75 | | | | 8.99 | | | | (0.34 | ) | | | — | | | | (0.34 | ) |
| | 2013 - C | | | 35.57 | | | | (0.07 | ) | | | 8.34 | | | | 8.27 | | | | (0.05 | ) | | | — | | | | (0.05 | ) |
| | 2013 - Institutional | | | 37.77 | | | | 0.41 | | | | 8.83 | | | | 9.24 | | | | (0.49 | ) | | | — | | | | (0.49 | ) |
| | 2013 - Service | | | 37.02 | | | | 0.19 | | | | 8.67 | | | | 8.86 | | | | (0.29 | ) | | | — | | | | (0.29 | ) |
| | 2013 - IR | | | 37.12 | | | | 0.34 | | | | 8.68 | | | | 9.02 | | | | (0.44 | ) | | | — | | | | (0.44 | ) |
| | 2013 - R | | | 37.04 | | | | 0.12 | | | | 8.67 | | | | 8.79 | | | | (0.29 | ) | | | — | | | | (0.29 | ) |
| | 2012 - A | | | 33.41 | | | | 0.31 | (f) | | | 3.88 | | | | 4.19 | | | | (0.17 | ) | | | — | | | | (0.17 | ) |
| | 2012 - C | | | 31.83 | | | | 0.05 | (f) | | | 3.69 | | | | 3.74 | | | | — | | | | — | | | | — | |
| | 2012 - Institutional | | | 33.74 | | | | 0.46 | (f) | | | 3.89 | | | | 4.35 | | | | (0.32 | ) | | | — | | | | (0.32 | ) |
| | 2012 - Service | | | 33.06 | | | | 0.27 | (f) | | | 3.83 | | | | 4.10 | | | | (0.14 | ) | | | — | | | | (0.14 | ) |
| | 2012 - IR | | | 33.18 | | | | 0.41 | (f) | | | 3.82 | | | | 4.23 | | | | (0.29 | ) | | | — | | | | (0.29 | ) |
| | 2012 - R | | | 33.14 | | | | 0.25 | (f) | | | 3.81 | | | | 4.06 | | | | (0.16 | ) | | | — | | | | (0.16 | ) |
| | (a) | | Calculated based on the average shares outstanding methodology. |
| | (b) | | Assumes investment at the NAV at the beginning of the period, reinvestment of all dividends and distributions, a complete redemption of the investment at the NAV at the end of the period and no sales or redemption charges. Total returns would be reduced if a sales or redemption charge was taken into account. Returns do not reflect the impact of taxes to shareholder relating to Fund distributions or the redemption of Fund shares. Total returns for periods less than one full year are not annualized. |
| | (c) | | The Fund’s portfolio turnover rate is calculated in accordance with regulatory requirements, without regard to transactions involving short term investments. If such transactions were included, the Fund’s portfolio turnover rate may be higher. |
| | (e) | | Amount is less than $0.005 per share. |
| | (f) | | Reflects income recognized from special dividends which amounted to $0.09 per share and 0.25% of average net assets. |
| | |
| 70 | | The accompanying notes are an integral part of these financial statements. |
GOLDMAN SACHS MID CAP VALUE FUND
| | | | | | | | | | | | | | | | | | | | | | | | | | | | | | | | | | | | | | | | |
| | | | | | | | | | | | | | | | | | | | | | | | | | | | | | | | | | |
| | | Net asset
value, end
of period | | | | | Total
return(b) | | | | | Net assets,
end of
period
(in 000s) | | | | | Ratio of
net expenses
to average
net assets | | | | | Ratio of
total expenses
to average
net assets | | | | | Ratio of
net investment
income (loss)
to average
net assets | | | | | Portfolio
turnover
rate(c) | |
| | | | | | | | | | | | | | | | | | | | | | | | | | | | | | | | | | | | | | | | |
| | $ | 38.21 | | | | | | 9.49 | % | | | | $ | 1,056,680 | | | | | | 1.17 | %(d) | | | | | 1.17 | %(d) | | | | | 0.54 | %(d) | | | | | 61 | % |
| | | 34.76 | | | | | | 9.11 | | | | | | 131,941 | | | | | | 1.92 | (d) | | | | | 1.92 | (d) | | | | | (0.22 | )(d) | | | | | 61 | |
| | | 38.55 | | | | | | 9.75 | | | | | | 2,698,338 | | | | | | 0.77 | (d) | | | | | 0.77 | (d) | | | | | 0.95 | (d) | | | | | 61 | |
| | | 37.58 | | | | | | 9.48 | | | | | | 106,353 | | | | | | 1.27 | (d) | | | | | 1.27 | (d) | | | | | 0.44 | (d) | | | | | 61 | |
| | | 37.46 | | | | | | 9.65 | | | | | | 242,299 | | | | | | 0.92 | (d) | | | | | 0.92 | (d) | | | | | 0.78 | (d) | | | | | 61 | |
| | | 37.28 | | | | | | 9.40 | | | | | | 39,931 | | | | | | 1.42 | (d) | | | | | 1.42 | (d) | | | | | 0.27 | (d) | | | | | 61 | |
| | | 38.53 | | | | | | 9.73 | | | | | | 431,769 | | | | | | 0.75 | (d) | | | | | 0.75 | (d) | | | | | 0.93 | (d) | | | | | 61 | |
| | | | | | | | | | | | | | | | | | | | | | | | | | | | | | | | | | | | | | | | |
| | | | | | | | | | | | | | | | | | | | | | | | | | | | | | | | | | | | | | | | |
| | | 35.25 | | | | | | 3.00 | | | | | | 1,363,093 | | | | | | 1.15 | | | | | | 1.15 | | | | | | 0.92 | | | | | | 111 | |
| | | 32.00 | | | | | | 2.20 | | | | | | 141,081 | | | | | | 1.90 | | | | | | 1.90 | | | | | | 0.16 | | | | | | 111 | |
| | | 35.64 | | | | | | 3.39 | | | | | | 3,687,681 | | | | | | 0.75 | | | | | | 0.75 | | | | | | 1.31 | | | | | | 111 | |
| | | 34.63 | | | | | | 2.87 | | | | | | 139,677 | | | | | | 1.25 | | | | | | 1.25 | | | | | | 0.84 | | | | | | 111 | |
| | | 34.63 | | | | | | 3.24 | | | | | | 220,429 | | | | | | 0.90 | | | | | | 0.90 | | | | | | 1.16 | | | | | | 111 | |
| | | 34.38 | | | | | | 2.72 | | | | | | 40,111 | | | | | | 1.40 | | | | | | 1.40 | | | | | | 0.66 | | | | | | 111 | |
| | | 35.64 | | | | | | 3.41 | | | | | | 372,313 | | | | | | 0.73 | | | | | | 0.73 | | | | | | 1.39 | | | | | | 111 | |
| | | 38.81 | | | | | | (4.21 | ) | | | | | 1,876,387 | | | | | | 1.14 | | | | | | 1.14 | | | | | | 0.31 | | | | | | 95 | |
| | | 35.80 | | | | | | (4.91 | ) | | | | | 180,780 | | | | | | 1.89 | | | | | | 1.89 | | | | | | (0.47 | ) | | | | | 95 | |
| | | 39.22 | | | | | | (3.82 | ) | | | | | 5,868,055 | | | | | | 0.74 | | | | | | 0.74 | | | | | | 0.68 | | | | | | 95 | |
| | | 38.21 | | | | | | (4.30 | ) | | | | | 222,149 | | | | | | 1.24 | | | | | | 1.24 | | | | | | 0.19 | | | | | | 95 | |
| | | 38.23 | | | | | | (3.96 | ) | | | | | 304,390 | | | | | | 0.89 | | | | | | 0.89 | | | | | | 0.52 | | | | | | 95 | |
| | | 38.00 | | | | | | (4.45 | ) | | | | | 42,277 | | | | | | 1.39 | | | | | | 1.39 | | | | | | 0.01 | | | | | | 95 | |
| | | 39.23 | | | | | | (4.87 | ) | | | | | 10 | | | | | | 0.73 | (d) | | | | | 0.73 | (d) | | | | | (0.62 | )(d) | | | | | 95 | |
| | | 49.03 | | | | | | 24.77 | | | | | | 3,153,971 | | | | | | 1.14 | | | | | | 1.14 | | | | | | 0.38 | | | | | | 87 | |
| | | 46.05 | | | | | | 23.81 | | | | | | 202,083 | | | | | | 1.89 | | | | | | 1.89 | | | | | | (0.38 | ) | | | | | 87 | |
| | | 49.55 | | | | | | 25.25 | | | | | | 6,347,006 | | | | | | 0.74 | | | | | | 0.74 | | | | | | 0.77 | | | | | | 87 | |
| | | 48.40 | | | | | | 24.63 | | | | | | 368,720 | | | | | | 1.24 | | | | | | 1.24 | | | | | | 0.28 | | | | | | 87 | |
| | | 48.52 | | | | | | 25.07 | | | | | | 295,017 | | | | | | 0.89 | | | | | | 0.89 | | | | | | 0.66 | | | | | | 87 | |
| | | 48.28 | | | | | | 24.44 | | | | | | 35,896 | | | | | | 1.39 | | | | | | 1.39 | | | | | | 0.12 | | | | | | 87 | |
| | | 46.08 | | | | | | 24.20 | | | | | | 3,297,185 | | | | | | 1.14 | | | | | | 1.14 | | | | | | 0.58 | | | | | | 103 | |
| | | 43.79 | | | | | | 23.29 | | | | | | 174,875 | | | | | | 1.89 | | | | | | 1.89 | | | | | | (0.18 | ) | | | | | 103 | |
| | | 46.52 | | | | | | 24.74 | | | | | | 5,328,684 | | | | | | 0.74 | | | | | | 0.74 | | | | | | 0.96 | | | | | | 103 | |
| | | 45.59 | | | | | | 24.11 | | | | | | 334,583 | | | | | | 1.24 | | | | | | 1.24 | | | | | | 0.47 | | | | | | 103 | |
| | | 45.70 | | | | | | 24.54 | | | | | | 97,243 | | | | | | 0.89 | | | | | | 0.89 | | | | | | 0.80 | | | | | | 103 | |
| | | 45.54 | | | | | | 23.91 | | | | | | 24,201 | | | | | | 1.39 | | | | | | 1.39 | | | | | | 0.28 | | | | | | 103 | |
| | | 37.43 | | | | | | 12.56 | | | | | | 3,074,173 | | | | | | 1.15 | | | | | | 1.15 | | | | | | 0.91 | (f) | | | | | 80 | |
| | | 35.57 | | | | | | 11.72 | | | | | | 160,062 | | | | | | 1.90 | | | | | | 1.90 | | | | | | 0.16 | (f) | | | | | 80 | |
| | | 37.77 | | | | | | 12.96 | | | | | | 3,985,625 | | | | | | 0.75 | | | | | | 0.75 | | | | | | 1.31 | (f) | | | | | 80 | |
| | | 37.02 | | | | | | 12.41 | | | | | | 268,412 | | | | | | 1.25 | | | | | | 1.25 | | | | | | 0.81 | (f) | | | | | 80 | |
| | | 37.12 | | | | | | 12.83 | | | | | | 70,409 | | | | | | 0.90 | | | | | | 0.90 | | | | | | 1.20 | (f) | | | | | 80 | |
| | | 37.04 | | | | | | 12.28 | | | | | | 13,255 | | | | | | 1.40 | | | | | | 1.40 | | | | | | 0.73 | (f) | | | | | 80 | |
| | |
| The accompanying notes are an integral part of these financial statements. | | 71 |
GOLDMAN SACHS SMALL CAP VALUE FUND
Financial Highlights
Selected Data for a Share Outstanding Throughout Each Period
| | | | | | | | | | | | | | | | | | | | | | | | | | | | | | |
| | | | | | | | From
investment operations | | | Distributions
to shareholders | |
| | | Year - Share Class | |
Net asset
value,
beginning
of period | | | Net
investment
income (loss)(a) | | | Net realized
and unrealized
gain (loss) | | | Total from
investment
operations | | | From net
investment
income | | | From net
realized
gains | | | Total
distributions | |
| | FOR THE SIX MONTHS ENDED FEBRUARY 28, (UNAUDITED) | |
| | 2017 - A | | $ | 52.52 | | | $ | 0.11 | | | $ | 6.67 | | | $ | 6.78 | | | $ | (0.22 | ) | | $ | (1.75 | ) | | $ | (1.97 | ) |
| | 2017 - C | | | 41.75 | | | | (0.07 | ) | | | 5.29 | | | | 5.22 | | | | — | | | | (1.75 | ) | | | (1.75 | ) |
| | 2017 - Institutional | | | 56.20 | | | | 0.24 | | | | 7.14 | | | | 7.38 | | | | (0.42 | ) | | | (1.75 | ) | | | (2.17 | ) |
| | 2017 - Service | | | 51.10 | | | | 0.08 | | | | 6.49 | | | | 6.57 | | | | (0.17 | ) | | | (1.75 | ) | | | (1.92 | ) |
| | 2017 - IR | | | 52.23 | | | | 0.17 | | | | 6.65 | | | | 6.82 | | | | (0.35 | ) | | | (1.75 | ) | | | (2.10 | ) |
| | 2017 - R | | | 51.62 | | | | 0.04 | | | | 6.56 | | | | 6.60 | | | | (0.11 | ) | | | (1.75 | ) | | | (1.86 | ) |
| | 2017 - R6 | | | 56.19 | | | | 0.22 | | | | 7.18 | | | | 7.40 | | | | (0.44 | ) | | | (1.75 | ) | | | (2.19 | ) |
| | | | | | | | | | | | | | | | | | | | | | | | | | | | | | |
| | FOR THE FISCAL YEARS ENDED AUGUST 31, | |
| | 2016 - A | | | 49.78 | | | | 0.20 | | | | 5.11 | | | | 5.31 | | | | (0.16 | ) | | | (2.41 | ) | | | (2.57 | ) |
| | 2016 - C | | | 40.23 | | | | (0.13 | ) | | | 4.06 | | | | 3.93 | | | | — | (e) | | | (2.41 | ) | | | (2.41 | ) |
| | 2016 - Institutional | | | 53.10 | | | | 0.42 | | | | 5.45 | | | | 5.87 | | | | (0.36 | ) | | | (2.41 | ) | | | (2.77 | ) |
| | 2016 - Service | | | 48.50 | | | | 0.15 | | | | 4.96 | | | | 5.11 | | | | (0.10 | ) | | | (2.41 | ) | | | (2.51 | ) |
| | 2016 - IR | | | 49.55 | | | | 0.32 | | | | 5.07 | | | | 5.39 | | | | (0.30 | ) | | | (2.41 | ) | | | (2.71 | ) |
| | 2016 - R | | | 48.95 | | | | 0.08 | | | | 5.03 | | | | 5.11 | | | | (0.03 | ) | | | (2.41 | ) | | | (2.44 | ) |
| | 2016 - R6 | | | 53.10 | | | | 0.37 | | | | 5.51 | | | | 5.88 | | | | (0.38 | ) | | | (2.41 | ) | | | (2.79 | ) |
| | 2015 - A | | | 55.40 | | | | 0.16 | (f) | | | (1.32 | ) | | | (1.16 | ) | | | (0.10 | ) | | | (4.36 | ) | | | (4.46 | ) |
| | 2015 - C | | | 45.84 | | | | (0.19 | )(f) | | | (1.06 | ) | | | (1.25 | ) | | | — | | | | (4.36 | ) | | | (4.36 | ) |
| | 2015 - Institutional | | | 58.80 | | | | 0.39 | (f) | | | (1.40 | ) | | | (1.01 | ) | | | (0.33 | ) | | | (4.36 | ) | | | (4.69 | ) |
| | 2015 - Service | | | 54.08 | | | | 0.11 | (f) | | | (1.29 | ) | | | (1.18 | ) | | | (0.04 | ) | | | (4.36 | ) | | | (4.40 | ) |
| | 2015 - IR | | | 55.18 | | | | 0.28 | (f) | | | (1.30 | ) | | | (1.02 | ) | | | (0.25 | ) | | | (4.36 | ) | | | (4.61 | ) |
| | 2015 - R | | | 54.58 | | | | 0.03 | (f) | | | (1.30 | ) | | | (1.27 | ) | | | — | | | | (4.36 | ) | | | (4.36 | ) |
| | 2015 - R6 (Commenced July 31, 2015) | | | 56.15 | | | | (0.03 | )(f) | | | (3.02 | ) | | | (3.05 | ) | | | — | | | | — | | | | — | |
| | 2014 - A | | | 50.43 | | | | 0.12 | | | | 9.94 | | | | 10.06 | | | | (0.18 | ) | | | (4.91 | ) | | | (5.09 | ) |
| | 2014 - C | | | 42.64 | | | | (0.25 | ) | | | 8.36 | | | | 8.11 | | | | — | | | | (4.91 | ) | | | (4.91 | ) |
| | 2014 - Institutional | | | 53.22 | | | | 0.33 | | | | 10.53 | | | | 10.86 | | | | (0.37 | ) | | | (4.91 | ) | | | (5.28 | ) |
| | 2014 - Service | | | 49.36 | | | | 0.05 | | | | 9.74 | | | | 9.79 | | | | (0.16 | ) | | | (4.91 | ) | | | (5.07 | ) |
| | 2014 - IR | | | 50.25 | | | | 0.23 | | | | 9.93 | | | | 10.16 | | | | (0.32 | ) | | | (4.91 | ) | | | (5.23 | ) |
| | 2014 - R | | | 49.80 | | | | (0.03 | ) | | | 9.82 | | | | 9.79 | | | | (0.10 | ) | | | (4.91 | ) | | | (5.01 | ) |
| | 2013 - A | | | 43.11 | | | | 0.35 | (g) | | | 9.73 | | | | 10.08 | | | | (0.48 | ) | | | (2.28 | ) | | | (2.76 | ) |
| | 2013 - C | | | 36.89 | | | | 0.01 | (g) | | | 8.25 | | | | 8.26 | | | | (0.23 | ) | | | (2.28 | ) | | | (2.51 | ) |
| | 2013 - Institutional | | | 45.36 | | | | 0.55 | (g) | | | 10.26 | | | | 10.81 | | | | (0.67 | ) | | | (2.28 | ) | | | (2.95 | ) |
| | 2013 - Service | | | 42.30 | | | | 0.30 | (g) | | | 9.52 | | | | 9.82 | | | | (0.48 | ) | | | (2.28 | ) | | | (2.76 | ) |
| | 2013 - IR | | | 43.00 | | | | 0.41 | (g) | | | 9.74 | | | | 10.15 | | | | (0.62 | ) | | | (2.28 | ) | | | (2.90 | ) |
| | 2013 - R | | | 42.65 | | | | 0.19 | (g) | | | 9.65 | | | | 9.84 | | | | (0.41 | ) | | | (2.28 | ) | | | (2.69 | ) |
| | 2012 - A | | | 37.73 | | | | 0.27 | (h) | | | 5.86 | | | | 6.13 | | | | (0.08 | ) | | | (0.67 | ) | | | (0.75 | ) |
| | 2012 - C | | | 32.55 | | | | (0.03 | )(h) | | | 5.04 | | | | 5.01 | | | | — | | | | (0.67 | ) | | | (0.67 | ) |
| | 2012 - Institutional | | | 39.65 | | | | 0.46 | (h) | | | 6.15 | | | | 6.61 | | | | (0.23 | ) | | | (0.67 | ) | | | (0.90 | ) |
| | 2012 - Service | | | 37.01 | | | | 0.23 | (h) | | | 5.75 | | | | 5.98 | | | | (0.02 | ) | | | (0.67 | ) | | | (0.69 | ) |
| | 2012 - IR | | | 37.65 | | | | 0.36 | (h) | | | 5.85 | | | | 6.21 | | | | (0.19 | ) | | | (0.67 | ) | | | (0.86 | ) |
| | 2012 - R | | | 37.39 | | | | 0.17 | (h) | | | 5.81 | | | | 5.98 | | | | (0.05 | ) | | | (0.67 | ) | | | (0.72 | ) |
| | (a) | | Calculated based on the average shares outstanding methodology. |
| | (b) | | Assumes investment at the NAV at the beginning of the period, reinvestment of all dividends and distributions, a complete redemption of the investment at the NAV at the end of the period and no sales or redemption charges. Total returns would be reduced if a sales or redemption charge was taken into account. Returns do not reflect the impact of taxes to shareholder relating to Fund distributions or the redemption of Fund shares. Total returns for periods less than one full year are not annualized. |
| | (c) | | The Fund’s portfolio turnover rate is calculated in accordance with regulatory requirements, without regard to transactions involving short term investments. If such transactions were included, the Fund’s portfolio turnover rate may be higher. |
| | (e) | | Amount is less than $0.005 per share. |
| | (f) | | Reflects income recognized from special dividends which amounted to $0.10 per share and 0.18% of average net assets. |
| | (g) | | Reflects income recognized from special dividends which amounted to $0.26 per share and 0.55% of average net assets. |
| | (h) | | Reflects income recognized from special dividends which amounted to $0.17 per share and 0.41% of average net assets. |
| | |
| 72 | | The accompanying notes are an integral part of these financial statements. |
GOLDMAN SACHS SMALL CAP VALUE FUND
| | | | | | | | | | | | | | | | | | | | | | | | | | | | | | | | | | | | | | | | |
| | | | | | | | | | | | | | | | | | | | | | | | | | | | | | | | | | |
| | | Net asset
value, end
of period | | | | | Total
return(b) | | | | | Net assets,
end of period (in 000s) | | | | | Ratio of
net expenses
to average
net assets | | | | | Ratio of
total expenses
to average
net assets | | | | | Ratio of
net investment
income (loss)
to average
net assets | | | | | Portfolio
turnover
rate(c) | |
| | | | | | | | | | | | | | | | | | | | | | | | | | | | | | | | | | | | | | | | |
| | $ | 57.33 | | | | | | 12.93 | % | | | | $ | 969,668 | | | | | | 1.34 | %(d) | | | | | 1.38 | %(d) | | | | | 0.41 | %(d) | | | | | 37 | % |
| | | 45.22 | | | | | | 12.51 | | | | | | 48,218 | | | | | | 2.09 | (d) | | | | | 2.13 | (d) | | | | | (0.34 | )(d) | | | | | 37 | |
| | | 61.41 | | | | | | 13.16 | | | | | | 4,945,600 | | | | | | 0.94 | (d) | | | | | 0.98 | (d) | | | | | 0.81 | (d) | | | | | 37 | |
| | | 55.75 | | | | | | 12.88 | | | | | | 130,292 | | | | | | 1.44 | (d) | | | | | 1.48 | (d) | | | | | 0.31 | (d) | | | | | 37 | |
| | | 56.95 | | | | | | 13.09 | | | | | | 196,858 | | | | | | 1.09 | (d) | | | | | 1.13 | (d) | | | | | 0.65 | (d) | | | | | 37 | |
| | | 56.36 | | | | | | 12.80 | | | | | | 136,332 | | | | | | 1.59 | (d) | | | | | 1.63 | (d) | | | | | 0.16 | (d) | | | | | 37 | |
| | | 61.40 | | | | | | 13.19 | | | | | | 584,503 | | | | | | 0.92 | (d) | | | | | 0.96 | (d) | | | | | 0.76 | (d) | | | | | 37 | |
| | | | | | | | | | | | | | | | | | | | | | | | | | | | | | | | | | | | | | | | |
| | | | | | | | | | | | | | | | | | | | | | | | | | | | | | | | | | | | | | | | |
| | | 52.52 | | | | | | 11.22 | | | | | | 928,091 | | | | | | 1.35 | | | | | | 1.39 | | | | | | 0.42 | | | | | | 46 | |
| | | 41.75 | | | | | | 10.40 | | | | | | 47,925 | | | | | | 2.10 | | | | | | 2.14 | | | | | | (0.33 | ) | | | | | 46 | |
| | | 56.20 | | | | | | 11.66 | | | | | | 4,476,848 | | | | | | 0.95 | | | | | | 0.99 | | | | | | 0.82 | | | | | | 46 | |
| | | 51.10 | | | | | | 11.11 | | | | | | 119,315 | | | | | | 1.45 | | | | | | 1.49 | | | | | | 0.32 | | | | | | 46 | |
| | | 52.23 | | | | | | 11.50 | | | | | | 162,661 | | | | | | 1.10 | | | | | | 1.14 | | | | | | 0.67 | | | | | | 46 | |
| | | 51.62 | | | | | | 10.96 | | | | | | 122,526 | | | | | | 1.60 | | | | | | 1.64 | | | | | | 0.18 | | | | | | 46 | |
| | | 56.19 | | | | | | 11.68 | | | | | | 317,289 | | | | | | 0.93 | | | | | | 0.98 | | | | | | 0.71 | | | | | | 46 | |
| | | 49.78 | | | | | | (2.31 | ) | | | | | 950,196 | | | | | | 1.34 | | | | | | 1.39 | | | | | | 0.30 | (f) | | | | | 49 | |
| | | 40.23 | | | | | | (3.04 | ) | | | | | 59,341 | | | | | | 2.09 | | | | | | 2.14 | | | | | | (0.45 | )(f) | | | | | 49 | |
| | | 53.10 | | | | | | (1.92 | ) | | | | | 4,503,821 | | | | | | 0.94 | | | | | | 0.99 | | | | | | 0.70 | (f) | | | | | 49 | |
| | | 48.50 | | | | | | (2.41 | ) | | | | | 134,195 | | | | | | 1.44 | | | | | | 1.49 | | | | | | 0.21 | (f) | | | | | 49 | |
| | | 49.55 | | | | | | (2.07 | ) | | | | | 128,838 | | | | | | 1.09 | | | | | | 1.14 | | | | | | 0.54 | (f) | | | | | 49 | |
| | | 48.95 | | | | | | (2.56 | ) | | | | | 136,644 | | | | | | 1.59 | | | | | | 1.64 | | | | | | 0.05 | (f) | | | | | 49 | |
| | | 53.10 | | | | | | (5.43 | ) | | | | | 26,847 | | | | | | 0.93 | (d) | | | | | 1.00 | (d) | | | | | (0.62 | )(d)(f) | | | | | 49 | |
| | | 55.40 | | | | | | 20.72 | | | | | | 1,080,393 | | | | | | 1.35 | | | | | | 1.40 | | | | | | 0.22 | | | | | | 46 | |
| | | 45.84 | | | | | | 19.85 | | | | | | 69,319 | | | | | | 2.10 | | | | | | 2.15 | | | | | | (0.55 | ) | | | | | 46 | |
| | | 58.80 | | | | | | 21.22 | | | | | | 4,694,737 | | | | | | 0.95 | | | | | | 1.00 | | | | | | 0.58 | | | | | | 46 | |
| | | 54.08 | | | | | | 20.62 | | | | | | 176,500 | | | | | | 1.45 | | | | | | 1.50 | | | | | | 0.10 | | | | | | 46 | |
| | | 55.18 | | | | | | 21.05 | | | | | | 121,895 | | | | | | 1.10 | | | | | | 1.15 | | | | | | 0.43 | | | | | | 46 | |
| | | 54.58 | | | | | | 20.44 | | | | | | 139,858 | | | | | | 1.60 | | | | | | 1.65 | | | | | | (0.06 | ) | | | | | 46 | |
| | | 50.43 | | | | | | 24.86 | | | | | | 1,141,424 | | | | | | 1.38 | | | | | | 1.42 | | | | | | 0.75 | (g) | | | | | 57 | |
| | | 42.64 | | | | | | 23.89 | | | | | | 64,751 | | | | | | 2.13 | | | | | | 2.17 | | | | | | 0.03 | (g) | | | | | 57 | |
| | | 53.22 | | | | | | 25.34 | | | | | | 2,891,932 | | | | | | 0.98 | | | | | | 1.02 | | | | | | 1.12 | (g) | | | | | 57 | |
| | | 49.36 | | | | | | 24.70 | | | | | | 162,696 | | | | | | 1.48 | | | | | | 1.52 | | | | | | 0.65 | (g) | | | | | 57 | |
| | | 50.25 | | | | | | 25.16 | | | | | | 73,723 | | | | | | 1.13 | | | | | | 1.17 | | | | | | 0.86 | (g) | | | | | 57 | |
| | | 49.80 | | | | | | 24.51 | | | | | | 101,060 | | | | | | 1.63 | | | | | | 1.67 | | | | | | 0.40 | (g) | | | | | 57 | |
| | | 43.11 | | | | | | 16.43 | | | | | | 931,473 | | | | | | 1.41 | | | | | | 1.44 | | | | | | 0.68 | (h) | | | | | 50 | |
| | | 36.89 | | | | | | 15.59 | | | | | | 58,926 | | | | | | 2.16 | | | | | | 2.19 | | | | | | (0.07 | )(h) | | | | | 50 | |
| | | 45.36 | | | | | | 16.91 | | | | | | 1,852,215 | | | | | | 1.01 | | | | | | 1.04 | | | | | | 1.07 | (h) | | | | | 50 | |
| | | 42.30 | | | | | | 16.33 | | | | | | 115,385 | | | | | | 1.51 | | | | | | 1.54 | | | | | | 0.57 | (h) | | | | | 50 | |
| | | 43.00 | | | | | | 16.74 | | | | | | 24,332 | | | | | | 1.16 | | | | | | 1.19 | | | | | | 0.90 | (h) | | | | | 50 | |
| | | 42.65 | | | | | | 16.17 | | | | | | 45,525 | | | | | | 1.66 | | | | | | 1.69 | | | | | | 0.42 | (h) | | | | | 50 | |
| | |
| The accompanying notes are an integral part of these financial statements. | | 73 |
GOLDMAN SACHS SMALL/MID CAP VALUE FUND
Financial Highlights
Selected Data for a Share Outstanding Throughout Each Period
| | | | | | | | | | | | | | | | | | | | | | | | | | | | | | |
| | | | | | | | From
investment operations | | | Distributions
to shareholders | |
| | | Year - Share Class | |
Net asset
value,
beginning
of period | | | Net
investment
income (loss)(a) | | | Net realized
and unrealized
gain (loss) | | | Total from
investment
operations | | | From net
investment
income | | | From net
realized
gains | | | Total
distributions | |
| | FOR THE SIX MONTHS ENDED FEBRUARY 28, (UNAUDITED) | |
| | 2017 - A | | $ | 11.18 | | | $ | 0.03 | (d) | | $ | 1.32 | | | $ | 1.35 | | | $ | (0.07 | ) | | $ | — | | | $ | (0.07 | ) |
| | 2017 - C | | | 11.01 | | | | (0.02 | )(d) | | | 1.31 | | | | 1.29 | | | | (0.02 | ) | | | — | | | | (0.02 | ) |
| | 2017 - Institutional | | | 11.29 | | | | 0.05 | (d) | | | 1.34 | | | | 1.39 | | | | (0.11 | ) | | | — | | | | (0.11 | ) |
| | 2017 - IR | | | 11.23 | | | | 0.04 | (d) | | | 1.33 | | | | 1.37 | | | | (0.08 | ) | | | — | | | | (0.08 | ) |
| | 2017 - R | | | 11.15 | | | | 0.01 | (d) | | | 1.32 | | | | 1.33 | | | | (0.03 | ) | | | — | | | | (0.03 | ) |
| | 2017 - R6 | | | 11.29 | | | | 0.05 | (d) | | | 1.34 | | | | 1.39 | | | | (0.11 | ) | | | — | | | | (0.11 | ) |
| | | | | | | | | | | | | | | | | | | | | | | | | | | | | | |
| | FOR THE FISCAL YEAR ENDED AUGUST 31, | |
| | 2016 - A | | | 10.46 | | | | 0.08 | (f) | | | 0.70 | | | | 0.78 | | | | (0.01 | ) | | | (0.05 | ) | | | (0.06 | ) |
| | 2016 - C | | | 10.37 | | | | — | (g) | | | 0.69 | | | | 0.69 | | | | — | | | | (0.05 | ) | | | (0.05 | ) |
| | 2016 - Institutional | | | 10.53 | | | | 0.12 | (f) | | | 0.71 | | | | 0.83 | | | | (0.02 | ) | | | (0.05 | ) | | | (0.07 | ) |
| | 2016 - IR | | | 10.49 | | | | 0.11 | (f) | | | 0.71 | | | | 0.82 | | | | (0.03 | ) | | | (0.05 | ) | | | (0.08 | ) |
| | 2016 - R | | | 10.45 | | | | 0.05 | (f) | | | 0.70 | | | | 0.75 | | | | — | | | | (0.05 | ) | | | (0.05 | ) |
| | 2016 - R6 | | | 10.53 | | | | 0.12 | (f) | | | 0.72 | | | | 0.84 | | | | (0.03 | ) | | | (0.05 | ) | | | (0.08 | ) |
| | 2015 - A | | | 11.01 | | | | 0.02 | | | | (0.38 | ) | | | (0.36 | ) | | | (0.03 | ) | | | (0.16 | ) | | | (0.19 | ) |
| | 2015 - C | | | 10.97 | | | | (0.07 | ) | | | (0.37 | ) | | | (0.44 | ) | | | — | | | | (0.16 | ) | | | (0.16 | ) |
| | 2015 - Institutional | | | 11.04 | | | | 0.06 | | | | (0.36 | ) | | | (0.30 | ) | | | (0.05 | ) | | | (0.16 | ) | | | (0.21 | ) |
| | 2015 - IR | | | 11.03 | | | | 0.05 | | | | (0.39 | ) | | | (0.34 | ) | | | (0.04 | ) | | | (0.16 | ) | | | (0.20 | ) |
| | 2015 - R | | | 11.00 | | | | (0.02 | ) | | | (0.37 | ) | | | (0.39 | ) | | | — | | | | (0.16 | ) | | | (0.16 | ) |
| | 2015 - R6 (Commenced July 31, 2015) | | | 11.14 | | | | — | (g) | | | (0.61 | ) | | | (0.61 | ) | | | — | | | | — | | | | — | |
| | | | | | | | | | | | | | | | | | | | | | | | | | | | | | |
| | FOR THE PERIOD ENDED AUGUST 31, | |
| | 2014 - A (Commenced January 31, 2014) | | | 10.00 | | | | (0.02 | ) | | | 1.03 | | | | 1.01 | | | | — | | | | — | | | | — | |
| | 2014 - C (Commenced January 31, 2014) | | | 10.00 | | | | (0.06 | ) | | | 1.03 | | | | 0.97 | | | | — | | | | — | | | | — | |
| | 2014 - Institutional (Commenced January 31, 2014) | | | 10.00 | | | | 0.03 | | | | 1.01 | | | | 1.04 | | | | — | | | | — | | | | — | |
| | 2014 - IR (Commenced January 31, 2014) | | | 10.00 | | | | 0.02 | | | | 1.01 | | | | 1.03 | | | | — | | | | — | | | | — | |
| | 2014 - R (Commenced January 31, 2014) | | | 10.00 | | | | (0.01 | ) | | | 1.01 | | | | 1.00 | | | | — | | | | — | | | | — | |
| | (a) | | Calculated based on the average shares outstanding methodology. |
| | (b) | | Assumes investment at the NAV at the beginning of the period, reinvestment of all dividends and distributions, a complete redemption of the investment at the NAV at the end of the period and no sales or redemption charges. Total returns would be reduced if a sales or redemption charge was taken into account. Returns do not reflect the impact of taxes to shareholder relating to Fund distributions or the redemption of Fund shares. Total returns for periods less than one full year are not annualized. |
| | (c) | | The Fund’s portfolio turnover rate is calculated in accordance with regulatory requirements, without regard to transactions involving short term investments. If such transactions were included, the Fund’s portfolio turnover rate may be higher. |
| | (d) | | Reflects income recognized from special dividends which amounted to $0.01 per share and 0.23% of average net assets. |
| | (f) | | Reflects income recognized from special dividends which amounted to $0.03 per share and 0.29% of average net assets. |
| | (g) | | Amount is less than $0.005 per share. |
| | |
| 74 | | The accompanying notes are an integral part of these financial statements. |
GOLDMAN SACHS SMALL/MID CAP VALUE FUND
| | | | | | | | | | | | | | | | | | | | | | | | | | | | | | | | | | | | | | | | |
| | | | | | | | | | | | | | | | | | | | | | | | | | | | | | | | | | |
| | | Net asset
value, end
of period | | | | | Total
return(b) | | | | | Net assets,
end of
period
(in 000s) | | | | | Ratio of
net expenses
to average
net assets | | | | | Ratio of
total expenses
to average
net assets | | | | | Ratio of
net investment
income (loss)
to average
net assets | | | | | Portfolio
turnover
rate(c) | |
| | | | | | | | | | | | | | | | | | | | | | | | | | | | | | | | | | | | | | | | |
| | $ | 12.46 | | | | | | 12.20 | % | | | | $ | 1,111 | | | | | | 1.24 | %(e) | | | | | 1.93 | %(e) | | | | | 0.47 | %(d)(e) | | | | | 62 | % |
| | | 12.28 | | | | | | 11.76 | | | | | | 1,160 | | | | | | 1.99 | (e) | | | | | 2.68 | (e) | | | | | (0.28 | )(d)(e) | | | | | 62 | |
| | | 12.57 | | | | | | 12.33 | | | | | | 44,776 | | | | | | 0.84 | (e) | | | | | 1.53 | (e) | | | | | 0.87 | (d)(e) | | | | | 62 | |
| | | 12.52 | | | | | | 12.23 | | | | | | 3,234 | | | | | | 0.99 | (e) | | | | | 1.68 | (e) | | | | | 0.71 | (d)(e) | | | | | 62 | |
| | | 12.45 | | | | | | 11.96 | | | | | | 130 | | | | | | 1.49 | (e) | | | | | 2.18 | (e) | | | | | 0.21 | (d)(e) | | | | | 62 | |
| | | 12.57 | | | | | | 12.33 | | | | | | 11 | | | | | | 0.84 | (e) | | | | | 1.53 | (e) | | | | | 0.87 | (d)(e) | | | | | 62 | |
| | | | | | | | | | | | | | | | | | | | | | | | | | | | | | | | | | | | | | | | |
| | | | | | | | | | | | | | | | | | | | | | | | | | | | | | | | | | | | | | | | |
| | | 11.18 | | | | | | 7.49 | | | | | | 1,128 | | | | | | 1.26 | | | | | | 2.25 | | | | | | 0.78 | (f) | | | | | 109 | |
| | | 11.01 | | | | | | 6.71 | | | | | | 618 | | | | | | 2.01 | | | | | | 2.99 | | | | | | 0.04 | (f) | | | | | 109 | |
| | | 11.29 | | | | | | 7.96 | | | | | | 39,176 | | | | | | 0.87 | | | | | | 1.84 | | | | | | 1.18 | (f) | | | | | 109 | |
| | | 11.23 | | | | | | 7.81 | | | | | | 2,846 | | | | | | 1.01 | | | | | | 2.03 | | | | | | 1.08 | (f) | | | | | 109 | |
| | | 11.15 | | | | | | 7.24 | | | | | | 132 | | | | | | 1.52 | | | | | | 2.50 | | | | | | 0.49 | (f) | | | | | 109 | |
| | | 11.29 | | | | | | 7.98 | | | | | | 10 | | | | | | 0.88 | | | | | | 1.90 | | | | | | 1.14 | (f) | | | | | 109 | |
| | | 10.46 | | | | | | (3.34 | ) | | | | | 530 | | | | | | 1.34 | | | | | | 4.38 | | | | | | 0.14 | | | | | | 122 | |
| | | 10.37 | | | | | | (4.02 | ) | | | | | 321 | | | | | | 2.09 | | | | | | 5.25 | | | | | | (0.61 | ) | | | | | 122 | |
| | | 10.53 | | | | | | (2.79 | ) | | | | | 25,756 | | | | | | 0.93 | | | | | | 3.41 | | | | | | 0.51 | | | | | | 122 | |
| | | 10.49 | | | | | | (3.11 | ) | | | | | 119 | | | | | | 1.09 | | | | | | 4.00 | | | | | | 0.43 | | | | | | 122 | |
| | | 10.45 | | | | | | (3.55 | ) | | | | | 130 | | | | | | 1.59 | | | | | | 3.81 | | | | | | (0.19 | ) | | | | | 122 | |
| | | 10.53 | | | | | | (5.48 | ) | | | | | 9 | | | | | | 0.94 | (e) | | | | | 4.88 | (e) | | | | | (0.43 | )(e) | | | | | 122 | |
| | | | | | | | | | | | | | | | | | | | | | | | | | | | | | | | | | | | | | | | |
| | | | | | | | | | | | | | | | | | | | | | | | | | | | | | | | | | | | | | | | |
| | | 11.01 | | | | | | 10.10 | | | | | | 150 | | | | | | 1.33 | (e) | | | | | 6.90 | (e) | | | | | (0.27 | )(e) | | | | | 53 | |
| | | 10.97 | | | | | | 9.70 | | | | | | 105 | | | | | | 2.08 | (e) | | | | | 8.31 | (e) | | | | | (1.01 | )(e) | | | | | 53 | |
| | | 11.04 | | | | | | 10.40 | | | | | | 3,755 | | | | | | 0.93 | (e) | | | | | 12.86 | (e) | | | | | 0.49 | (e) | | | | | 53 | |
| | | 11.03 | | | | | | 10.30 | | | | | | 28 | | | | | | 1.08 | (e) | | | | | 13.25 | (e) | | | | | 0.39 | (e) | | | | | 53 | |
| | | 11.00 | | | | | | 10.00 | | | | | | 28 | | | | | | 1.58 | (e) | | | | | 13.76 | (e) | | | | | (0.11 | )(e) | | | | | 53 | |
| | |
| The accompanying notes are an integral part of these financial statements. | | 75 |
GOLDMAN SACHS FUNDAMENTAL EQUITY VALUE FUNDS
Notes to Financial Statements
February 28, 2017 (Unaudited)
Goldman Sachs Trust (the “Trust”) is a Delaware statutory trust registered under the Investment Company Act of 1940, as amended (the “Act”), as an open-end management investment company. The following table lists those series of the Trust that are included in this report (collectively, the “Funds” or individually a “Fund”), along with their corresponding share classes and respective diversification status under the Act:
| | | | | | | | |
| Fund | | | | Share Classes Offered | | | | Diversified/
Non-diversified |
Focused Value | | | | A, C, Institutional, IR, R and R6 | | | | Non-diversified |
Growth and Income, Large Cap Value, Mid Cap Value, Small Cap Value | | | | A, C, Institutional, Service, IR, R and R6 | | | | Diversified |
Small/Mid Cap Value | | | | A, C, Institutional, IR, R and R6 | | | | Diversified |
Class A Shares are sold with a front-end sales charge of up to 5.50%. Class C Shares are sold with a CDSC of 1.00%, which is imposed on redemptions made within 12 months of purchase. Institutional, Service, Class IR, Class R and Class R6 Shares are not subject to a sales charge.
Goldman Sachs Asset Management, L.P. (“GSAM”), an affiliate of Goldman, Sachs & Co. (“Goldman Sachs”), serves as investment adviser to the Funds pursuant to a management agreement (the “Agreement”) with the Trust.
|
| 2. SIGNIFICANT ACCOUNTING POLICIES |
The financial statements have been prepared in accordance with accounting principles generally accepted in the United States of America (“GAAP”) and require management to make estimates and assumptions that may affect the reported amounts and disclosures. Actual results may differ from those estimates and assumptions.
A. Investment Valuation — The Funds’ valuation policy is to value investments at fair value.
B. Investment Income and Investments — Investment income includes interest income, dividend income, net of any foreign withholding taxes, less any amounts reclaimable, and securities lending income. Interest income is accrued daily and adjusted for amortization of premiums and accretion of discounts. Dividend income is recognized on ex-dividend date or, for certain foreign securities, as soon as such information is obtained subsequent to the ex-dividend date. Investment transactions are reflected on trade date. Realized gains and losses are calculated using identified cost. Investment transactions are recorded on the following business day for daily net asset value (“NAV”) calculations. Any foreign capital gains tax is accrued daily based upon net unrealized gains, and is payable upon sale of such investments. Distributions received from the Funds’ investments in U.S. real estate investment trusts (“REITs”) may be characterized as ordinary income, net capital gain or a return of capital. A return of capital is recorded by the Funds as a reduction to the cost basis of the REIT.
C. Class Allocations and Expenses — Investment income, realized and unrealized gain (loss), and non-class specific expenses of each Fund are allocated daily based upon the proportion of net assets of each class. Non-class specific expenses directly incurred by a Fund are charged to that Fund, while such expenses incurred by the Trust are allocated across the applicable Funds on a straight-line and/or pro-rata basis depending upon the nature of the expenses. Class specific expenses, where applicable, are borne by the respective share classes and include Distribution and Service, Transfer Agency and Service and Shareholder Administration fees.
76
GOLDMAN SACHS FUNDAMENTAL EQUITY VALUE FUNDS
|
| 2. SIGNIFICANT ACCOUNTING POLICIES (continued) |
D. Federal Taxes and Distributions to Shareholders — It is each Fund’s policy to comply with the requirements of the Internal Revenue Code of 1986, as amended (the “Code”), applicable to regulated investment companies (mutual funds) and to distribute each year substantially all of its investment company taxable income and capital gains to its shareholders. Accordingly, the Funds are not required to make any provisions for the payment of federal income tax. Distributions to shareholders are recorded on the ex-dividend date. Income and capital gains distributions, if any, are declared and paid according to the following schedule:
| | | | | | |
| Fund | | | | Income Distributions Declared/Paid | | Capital Gains Distributions Declared/Paid |
Growth and Income | | | | Quarterly | | Annually |
Focused Value, Large Cap Value, Mid Cap Value, Small Cap Value and Small/Mid Cap Value | | | | Annually | | Annually |
Net capital losses, if any, are carried forward to future fiscal years and may be used to the extent allowed by the Code to offset any future capital gains. Losses that are carried forward will retain their character as either short-term or long-term capital losses. Utilization of capital loss carryforwards will reduce the requirement of future capital gains distributions.
The characterization of distributions to shareholders for financial reporting purposes is determined in accordance with federal income tax rules, which may differ from GAAP. The source of each Fund’s distributions may be shown in the accompanying financial statements as either from net investment income, net realized gain or capital. Certain components of the Funds’ net assets on the Statements of Assets and Liabilities reflect permanent GAAP/tax differences based on the appropriate tax character.
E. Foreign Currency Translation — The accounting records and reporting currency of the Funds are maintained in U.S. dollars. Assets and liabilities denominated in foreign currencies are translated into U.S. dollars using the current exchange rates at the close of each business day. The effect of changes in foreign currency exchange rates on investments is included within net realized and unrealized gain (loss) on investments. Changes in the value of other assets and liabilities as a result of fluctuations in foreign exchange rates are included in the Statements of Operations within net change in unrealized gain (loss) on foreign currency translations. Transactions denominated in foreign currencies are translated into U.S. dollars on the date the transaction occurred, the effects of which are included within net realized gain (loss) on foreign currency transactions.
F. Commission Recapture — GSAM, on behalf of certain Funds, may direct portfolio trades, subject to seeking best execution, to various brokers who have agreed to rebate a portion of the commissions generated. Such rebates are made directly to a Fund as cash payments and are included in net realized gain (loss) from investments on the Statements of Operations.
|
| 3. INVESTMENTS AND FAIR VALUE MEASUREMENTS |
The fair value of a financial instrument is the amount that would be received to sell an asset or paid to transfer a liability in an orderly transaction between market participants at the measurement date (i.e., the exit price). GAAP establishes a fair value hierarchy that prioritizes the inputs to valuation techniques used to measure fair value. The hierarchy gives the highest priority to unadjusted quoted prices in active markets for identical assets or liabilities (Level 1 measurements) and the lowest priority to unobservable inputs (Level 3 measurements). The levels used for classifying investments are not necessarily an indication of the risk associated with investing in these investments. The three levels of the fair value hierarchy are described below:
Level 1 — Unadjusted quoted prices in active markets that are accessible at the measurement date for identical, unrestricted assets or liabilities;
77
GOLDMAN SACHS FUNDAMENTAL EQUITY VALUE FUNDS
Notes to Financial Statements (continued)
February 28, 2017 (Unaudited)
|
| 3. INVESTMENTS AND FAIR VALUE MEASUREMENTS (continued) |
Level 2 — Quoted prices in markets that are not active or financial instruments for which significant inputs are observable (including, but not limited to, quoted prices for similar investments, interest rates, foreign exchange rates, volatility and credit spreads), either directly or indirectly;
Level 3 — Prices or valuations that require significant unobservable inputs (including GSAM’s assumptions in determining fair value measurement).
Changes in valuation techniques may result in transfers into or out of an assigned level within the hierarchy. In accordance with the Funds’ policy, transfers between different levels of the fair value hierarchy resulting from such changes are deemed to have occurred as of the beginning of the reporting period.
The Board of Trustees (“Trustees”) has approved Valuation Procedures that govern the valuation of the portfolio investments held by the Funds, including investments for which market quotations are not readily available. The Trustees have delegated to GSAM day-to-day responsibility for implementing and maintaining internal controls and procedures related to the valuation of the Funds’ portfolio investments. To assess the continuing appropriateness of pricing sources and methodologies, GSAM regularly performs price verification procedures and issues challenges as necessary to third party pricing vendors or brokers, and any differences are reviewed in accordance with the Valuation Procedures.
A. Level 1 and Level 2 Fair Value Investments — The valuation techniques and significant inputs used in determining the fair values for investments classified as Level 1 and Level 2 are as follows:
Equity Securities — Equity securities traded on a United States (“U.S.”) securities exchange or the NASDAQ system, or those located on certain foreign exchanges, including but not limited to the Americas, are valued daily at their last sale price or official closing price on the principal exchange or system on which they are traded. If there is no sale or official closing price or such price is believed by GSAM to not represent fair value, equity securities are valued at the last bid price for long positions and at the last ask price for short positions. To the extent these investments are actively traded, they are classified as Level 1 of the fair value hierarchy, otherwise they are generally classified as Level 2.
Unlisted equity securities for which market quotations are available are valued at the last sale price on the valuation date, or if no sale occurs, at the last bid price. Securities traded on certain foreign securities exchanges are valued daily at fair value determined by an independent fair value service (if available) under Valuation Procedures approved by the Trustees and consistent with applicable regulatory guidance. The independent fair value service takes into account multiple factors including, but not limited to, movements in the securities markets, certain depositary receipts, futures contracts and foreign currency exchange rates that have occurred subsequent to the close of the foreign securities exchange. These investments are generally classified as Level 2 of the fair value hierarchy.
Underlying Funds (including Money Market Funds) — Underlying Funds (“Underlying Funds”) include other investment companies and exchange-traded funds (“ETFs”). Investments in the Underlying Funds (except ETFs) are valued at the NAV per share of the Institutional Share class on the day of valuation. ETFs are valued daily at the last sale price or official closing price on the principal exchange or system on which the investment is traded. Because the Funds invest in Underlying Funds that fluctuate in value, the Funds’ shares will correspondingly fluctuate in value. To the extent these investments are actively traded, they are classified as Level 1 of the fair value hierarchy, otherwise they are generally classified as Level 2. For information regarding an Underlying Fund’s accounting policies and investment holdings, please see the Underlying Fund’s shareholder report.
Short Term Investments — Short-term investments having a maturity of 60 days or less are valued using available market quotations as provided by a third party pricing vendor or broker. Prior to October 11, 2016, such securities were valued at amortized cost. These investments are classified as Level 2 of the fair value hierarchy.
78
GOLDMAN SACHS FUNDAMENTAL EQUITY VALUE FUNDS
|
| 3. INVESTMENTS AND FAIR VALUE MEASUREMENTS (continued) |
B. Level 3 Fair Value Investments — To the extent that significant inputs to valuation models and other alternative pricing sources are unobservable, or if quotations are not readily available, or if GSAM believes that such quotations do not accurately reflect fair value, the fair value of the Funds’ investments may be determined under Valuation Procedures approved by the Trustees. GSAM, consistent with its procedures and applicable regulatory guidance, may make an adjustment to the most recent valuation prices of either domestic or foreign securities in light of significant events to reflect what it believes to be the fair value of the securities at the time of determining a Fund’s NAV. Significant events which could affect a large number of securities in a particular market may include, but are not limited to: significant fluctuations in U.S. or foreign markets; market dislocations; market disruptions; or unscheduled market closings. Significant events which could also affect a single issuer may include, but are not limited to: corporate actions such as reorganizations, mergers and buy-outs; ratings downgrades; and bankruptcies.
C. Fair Value Hierarchy — The following is a summary of the Funds’ investments classified in the fair value hierarchy as of February 28, 2017:
| | | | | | | | | | | | |
| | | |
| FOCUSED VALUE | | | | | | | | | | | | |
| | | |
| Investment Type | | Level 1 | | | Level 2 | | | Level 3 | |
| Assets | |
Common Stock and/or Other Equity Investments(a) | | | | | | | | | | | | |
Europe | | $ | 57,751 | | | $ | — | | | $ | — | |
North America | | | 3,609,772 | | | | — | | | | — | |
Investment Company | | | 94,608 | | | | — | | | | — | |
| Total | | $ | 3,762,131 | | | $ | — | | | $ | — | |
| | | |
| GROWTH AND INCOME | | | | | | | | | | | | |
| | | |
| Investment Type | | Level 1 | | | Level 2 | | | Level 3 | |
| Assets | |
Common Stock and/or Other Equity Investments(a) | | | | | | | | | | | | |
Europe | | $ | 7,907,498 | | | $ | — | | | $ | — | |
North America | | | 411,152,039 | | | | — | | | | — | |
| Total | | $ | 419,059,537 | | | $ | — | | | $ | — | |
| | | |
| LARGE CAP VALUE | | | | | | | | | | | | |
| | | |
| Investment Type | | Level 1 | | | Level 2 | | | Level 3 | |
| Assets | |
Common Stock and/or Other Equity Investments(a) | | | | | | | | | | | | |
Europe | | $ | 54,573,312 | | | $ | — | | | $ | — | |
North America | | | 1,054,488,238 | | | | — | | | | — | |
Investment Company | | | 2,284,991 | | | | — | | | | — | |
| Total | | $ | 1,111,346,541 | | | $ | — | | | $ | — | |
79
GOLDMAN SACHS FUNDAMENTAL EQUITY VALUE FUNDS
Notes to Financial Statements (continued)
February 28, 2017 (Unaudited)
|
| 3. INVESTMENTS AND FAIR VALUE MEASUREMENTS (continued) |
| | | | | | | | | | | | |
| | | |
| MID CAP VALUE | | | | | | | | | | | | |
| | | |
| Investment Type | | Level 1 | | | Level 2 | | | Level 3 | |
| Assets | |
Common Stock and/or Other Equity Investments(a) | | | | | | | | | | | | |
Europe | | $ | 36,747,064 | | | $ | — | | | $ | — | |
North America | | | 4,537,936,194 | | | | — | | | | — | |
Investment Company | | | 70,854,621 | | | | — | | | | — | |
Securities Lending Reinvestment Vehicle | | | 21,380,300 | | | | — | | | | — | |
| Total | | $ | 4,666,918,179 | | | $ | — | | | $ | — | |
| | | |
| SMALL CAP VALUE | | | | | | | | | | | | |
| | | |
| Investment Type | | Level 1 | | | Level 2 | | | Level 3 | |
| Assets | |
Common Stock and/or Other Equity Investments(a) | | | | | | | | | | | | |
Europe | | $ | 64,959,861 | | | $ | — | | | $ | — | |
North America | | | 6,746,957,955 | | | | — | | | | — | |
Exchange Traded Fund | | | 117,771,754 | | | | — | | | | — | |
Investment Company | | | 2,892 | | | | — | | | | — | |
Securities Lending Reinvestment Vehicle | | | 84,954,058 | | | | — | | | | — | |
| Total | | $ | 7,014,646,520 | | | $ | — | | | $ | — | |
| | | |
| SMALL/MID CAP VALUE | | | | | | | | | | | | |
| | | |
| Investment Type | | Level 1 | | | Level 2 | | | Level 3 | |
| Assets | |
Common Stock and/or Other Equity Investments(a) | | | | | | | | | | | | |
Europe | | $ | 618,083 | | | $ | — | | | $ | — | |
North America | | | 48,782,434 | | | | — | | | | — | |
Investment Company | | | 218,509 | | | | — | | | | — | |
Securities Lending Reinvestment Vehicle | | | 311,389 | | | | — | | | | — | |
| Total | | $ | 49,930,415 | | | $ | — | | | $ | — | |
| (a) | | Amounts are disclosed by continent to highlight the impact of time zone differences between local market close and the calculation of net asset value. Security valuations are based on the principle exchange or system on which they are traded, which may differ from country of domicile noted in table. |
For further information regarding security characteristics, see the Schedules of Investments.
80
GOLDMAN SACHS FUNDAMENTAL EQUITY VALUE FUNDS
|
| 4. AGREEMENTS AND AFFILIATED TRANSACTIONS |
A. Management Agreement — Under the Agreement, GSAM manages the Funds, subject to the general supervision of the Trustees.
As compensation for the services rendered pursuant to the Agreement, the assumption of the expenses related thereto and administration of the Funds’ business affairs, including providing facilities, GSAM is entitled to a management fee, accrued daily and paid monthly, equal to an annual percentage rate of each Fund’s average daily net assets. For the six months ended February 28, 2017, contractual and effective net management fees with GSAM were at the following rates:
| | | | | | | | | | | | | | | | | | | | | | | | | | | | | | |
| | | | | Contractual Management Rate | | | Effective Net
Management
Rate | |
| Fund | | | | First $1 Billion | | | Next $1 Billion | | | Next $3 Billion | | | Next $3 Billion | | | Over $8 Billion | | | Effective
Rate | | |
Focused Value | | | | | 0.75 | % | | | 0.68 | % | | | 0.64 | % | | | 0.63 | % | | | 0.62 | % | | | 0.75 | % | | | 0.69 | %* |
Growth and Income | | | | | 0.70 | | | | 0.63 | | | | 0.60 | | | | 0.59 | | | | 0.58 | | | | 0.70 | | | | 0.69 | * |
Large Cap Value | | | | | 0.75 | | | | 0.68 | | | | 0.65 | | | | 0.64 | | | | 0.63 | | | | 0.74 | | | | 0.74 | |
Mid Cap Value | | | | | 0.75 | | | | 0.75 | | | | 0.68 | | | | 0.65 | | | | 0.64 | | | | 0.71 | | | | 0.71 | |
Small Cap Value | | | | | 1.00 | | | | 1.00 | | | | 0.90 | | | | 0.86 | | | | 0.84 | | | | 0.92 | | | | 0.90 | * |
Small/Mid Cap Value | | | | | 0.85 | | | | 0.85 | | | | 0.77 | | | | 0.73 | | | | 0.71 | | | | 0.85 | | | | 0.80 | * |
| * | | GSAM has agreed to waive a portion of its management fee in order to achieve net management rates, as define in the Funds’ most recent prospectuses. In addition, the Effective Net Management Rate includes the impact of management fee waivers of affiliated underlying funds, if any. These waivers will be effective through at least December 29, 2017, and prior to such date GSAM may not terminate the arrangements without the approval of the Trustees. |
The Funds invest in Institutional Shares of the Goldman Sachs Financial Square Government Fund, which is an affiliated Underlying Fund. GSAM has agreed to waive a portion of its management fee payable by the Funds in an amount equal to the management fee it earns as an investment adviser to any of the affiliated Underlying Funds in which the Funds invest. For the six months ended February 28, 2017, the management fee waived by GSAM for each Fund was as follows:
| | | | | | |
| Fund | | | | Management
Fee Waived | |
Focused Value | | | | $ | 69 | |
Growth and Income | | | | | 2,425 | |
Large Cap Value | | | | | 6,724 | |
Mid Cap Value | | | | | 33,766 | |
Small Cap Value | | | | | 25,853 | |
Small/Mid Cap Value | | | | | 214 | |
B. Distribution and/or Service (12b-1) Plans — The Trust, on behalf of Class A and Class R Shares of each applicable Fund, has adopted Distribution and Service Plans subject to Rule 12b-1 under the Act. Under the Distribution and Service Plans, Goldman Sachs, which serves as distributor (the “Distributor”), is entitled to a fee accrued daily and paid monthly for distribution services and personal and account maintenance services, which may then be paid by Goldman Sachs to authorized dealers. These fees are equal to an annual percentage rate of the average daily net assets attributable to Class A or Class R Shares of the Funds, as applicable.
81
GOLDMAN SACHS FUNDAMENTAL EQUITY VALUE FUNDS
Notes to Financial Statements (continued)
February 28, 2017 (Unaudited)
|
| 4. AGREEMENTS AND AFFILIATED TRANSACTIONS (continued) |
The Trust, on behalf of Class C Shares of each applicable Fund, has adopted a Distribution Plan subject to Rule 12b-1 under the Act. Under the Distribution Plan, Goldman Sachs as Distributor is entitled to a fee accrued daily and paid monthly for distribution services, which may then be paid by Goldman Sachs to authorized dealers. These fees are equal to an annual percentage rate of the average daily net assets attributable to Class C Shares of the Funds.
The Trust, on behalf of Services Shares of each applicable Fund, has adopted a Service Plan subject to Rule 12b-1 under the Act to allow Service Shares to compensate service organizations (including Goldman Sachs) for providing personal account maintenance to their customers who are beneficial owners of such shares. The Service Plan provides for compensation to the service organizations equal to an annual percentage rate of the average daily net assets attributable to Services Shares of the Funds.
| | | | | | | | | | | | |
| | | Distribution and Service Plan Rates | |
| | | Class A* | | | Class C | | | Class R* | |
Distribution Plan | | | 0.25 | % | | | 0.75 | % | | | 0.50 | % |
Service Plan | | | — | | | | 0.25 | | | | — | |
| * | | With respect to Class A and Class R Shares, the Distributor at its discretion may use compensation for distribution services paid under the Distribution Plan to compensate service organizations for personal and account maintenance services and expenses as long as such total compensation does not exceed the maximum cap on “service fees” imposed by the Financial Industry Regulatory Authority. |
C. Distribution Agreement — Goldman Sachs, as Distributor of the shares of the Funds pursuant to a Distribution Agreement, may retain a portion of the Class A Shares’ front end sales charge and Class C Shares’ CDSC. During the six months ended February 28, 2017, Goldman Sachs advised that it retained the following amounts:
| | | | | | | | | | |
| | | | | Front End
Sales Charge | | | Contingent Deferred
Sales Charge | |
| Fund | | | | Class A | | | Class C | |
Growth and Income | | | | $ | 8,850 | | | $ | — | |
Large Cap Value | | | | | 3,997 | | | | 8 | |
Mid Cap Value | | | | | 26,395 | | | | 26 | |
Small Cap Value | | | | | 4,990 | | | | 1 | |
Small/Mid Cap Value | | | | | 895 | | | | — | |
D. Service and/or Shareholder Administration Plans — The Trust, on behalf of each applicable Fund, has adopted Service and/or Shareholder Administration Plans to allow Class C and Service Shares, respectively, to compensate service organizations (including Goldman Sachs) for providing varying levels of personal and account maintenance and/or shareholder administration services to their customers who are beneficial owners of such shares. The Service and/or Shareholder Administration Plans each provide for compensation to the service organizations equal to an annual percentage rate of the average daily net assets attributable to Class C or Service Shares of the Funds, respectively.
E. Transfer Agency Agreement — Goldman Sachs also serves as the transfer agent of the Funds for a fee pursuant to the Transfer Agency Agreement. The fees charged for such transfer agency services are accrued daily and paid monthly at annual rates as follows: 0.19% of the average daily net assets of Class A, Class C, Class IR and Class R Shares; 0.02% of the average daily net assets of Class R6 Shares; and 0.04% of the average daily net assets of Institutional and Service Shares.
82
GOLDMAN SACHS FUNDAMENTAL EQUITY VALUE FUNDS
|
| 4. AGREEMENTS AND AFFILIATED TRANSACTIONS (continued) |
Effective December 29, 2016, Goldman Sachs has agreed to waive a portion of its transfer agency fee equal to 0.07% as an annual percentage rate of the average daily net assets attributable to Class A, Class C, Class IR and Class R Shares of the Large Cap Value Fund. This arrangement will remain in effect through at least December 29, 2017, and prior to such date, the Investment Advisor may not terminate the arrangement without the approval of the Board of Trustees.
F. Other Expense Agreements and Affiliated Transactions — GSAM has agreed to limit certain “Other Expenses” of the Funds (excluding acquired fund fees and expenses, transfer agency fees and expenses, service fees and shareholder administration fees (as applicable), taxes, interest, brokerage fees, shareholder meeting, litigation, indemnification and extraordinary expenses) to the extent such expenses exceed, on an annual basis, a percentage rate of the average daily net assets of each Fund. Such Other Expense reimbursements, if any, are accrued daily and paid monthly. In addition, the Funds are not obligated to reimburse GSAM for prior fiscal year expense reimbursements, if any. The Other Expense limitations as an annual percentage rate of average daily net assets for Focused Value, Growth and Income, Large Cap Value, Small Cap Value and Small/Mid Cap Value Funds is 0.004%. These Other Expense limitations will remain in place through at least December 29, 2017, and prior to such date GSAM may not terminate the arrangements without the approval of the Trustees. In addition, the Funds have entered into certain offset arrangements with the transfer agent, which may result in a reduction of the Funds’ expenses and are received irrespective of the application of the “Other Expense” limitations described above.
For the six months ended February 28, 2017, these expense reductions, including any fee waivers and Other Expense reimbursements, were as follows:
| | | | | | | | | | | | | | | | | | |
| Fund | | | | Management
Fee Waiver | | | Transfer Agency
Fee Waiver | | | Other Expense Reimbursements | | | Total
Expense
Reductions | |
Focused Value | | | | $ | 1,106 | | | $ | — | | | $ | 122,110 | | | $ | 123,216 | |
Growth and Income | | | | | 22,897 | | | | — | | | | 187,372 | | | | 210,269 | |
Large Cap Value | | | | | 6,724 | | | | 29,837 | | | | 198,224 | | | | 234,785 | |
Mid Cap Value | | | | | 33,766 | | | | — | | | | — | | | | 33,766 | |
Small Cap Value | | | | | 694,247 | | | | — | | | | 462,221 | | | | 1,156,468 | |
Small/Mid Cap Value | | | | | 12,265 | | | | — | | | | 152,989 | | | | 165,254 | |
G. Line of Credit Facility — As of February 28, 2017, the Funds participated in a $1,100,000,000 committed, unsecured revolving line of credit facility (the “facility”) together with other funds of the Trust and certain registered investment companies having management agreements with GSAM or its affiliates. This facility is to be used for temporary emergency purposes, or to allow for an orderly liquidation of securities to meet redemption requests. The interest rate on borrowings is based on the federal funds rate. The facility also requires a fee to be paid by the Funds based on the amount of the commitment that has not been utilized. For the six months ended February 28, 2017, the Funds did not have any borrowings under the facility.
H. Other Transactions with Affiliates — For the six months ended February 28, 2017 , Goldman Sachs earned $151,380, $118,049 and $393, in brokerage commissions from portfolio transactions, on behalf of the Mid Cap Value, Small Cap Value and Small/Mid Cap Value Funds, respectively.
83
GOLDMAN SACHS FUNDAMENTAL EQUITY VALUE FUNDS
Notes to Financial Statements (continued)
February 28, 2017 (Unaudited)
|
| 4. AGREEMENTS AND AFFILIATED TRANSACTIONS (continued) |
The table below shows the transactions in and earnings from the investments by the Funds in the Underlying Fund for the period ended February 28, 2017:
| | | | | | | | | | | | | | | | | | | | | | |
| Fund | | Underlying Fund | | Market Value 8/31/16 | | | Purchases at Cost | | | Proceeds from Sales | | | Market Value 2/28/17 | | | Dividend Income | |
Focused Value | | Goldman Sachs Financial Square Government Fund | | $ | 98,592 | | | $ | 402,971 | | | $ | (406,955 | ) | | $ | 94,608 | | | $ | 166 | |
Growth and Income | | Goldman Sachs Financial Square Government Fund | | | — | | | | 23,857,664 | | | | (23,857,664 | ) | | | — | | | | 4,378 | |
Large Cap Value | | Goldman Sachs Financial Square Government Fund | | | 6,290,932 | | | | 147,886,342 | | | | (151,892,283 | ) | | | 2,284,991 | | | | 14,727 | |
Mid Cap Value | | Goldman Sachs Financial Square Government Fund | | | 81,376,569 | | | | 1,114,550,613 | | | | (1,125,072,561 | ) | | | 70,854,621 | | | | 67,160 | |
Small Cap Value | | Goldman Sachs Financial Square Government Fund | | | 1,568 | | | | 570,209,101 | | | | (570,207,777 | ) | | | 2,892 | | | | 55,152 | |
Small/Mid Cap Value | | Goldman Sachs Financial Square Government Fund | | | — | | | | 5,167,973 | | | | (4,949,464 | ) | | | 218,509 | | | | 448 | |
As of February 28, 2017 the Goldman Sachs Group, Inc. was the beneficial owner of 5% or more of total outstanding shares of the following funds:
| | | | | | | | | | | | | | | | | | | | | | | | | | |
| Fund | | | | Class A | | | Class C | | | Institutional | | | Class IR | | | Class R | | | Class R6 | |
Focused Value | | | | | 60 | % | | | 57 | % | | | 58 | % | | | 100 | % | | | 100 | % | | | 100 | % |
Growth and Income | | | | | — | | | | — | | | | — | | | | — | | | | — | | | | 100 | |
Small/Mid Cap Value | | | | | — | | | | — | | | | — | | | | — | | | | — | | | | 100 | |
|
| 5. PORTFOLIO SECURITIES TRANSACTIONS |
The cost of purchases and proceeds from sales and maturities of long-term securities For the six months ended February 28, 2017, were:
| | | | | | | | | | |
| Fund | | | | Purchases | | | Sales and Maturities | |
Focused Value | | | | $ | 1,958,585 | | | $ | 1,805,706 | |
Growth and Income | | | | | 52,610,202 | | | | 66,441,699 | |
Large Cap Value | | | | | 589,763,140 | | | | 832,295,199 | |
Mid Cap Value | | | | | 3,082,282,449 | | | | 4,718,905,119 | |
Small Cap Value | | | | | 2,389,894,859 | | | | 2,351,839,458 | |
Small/Mid Cap Value | | | | | 30,160,139 | | | | 29,259,296 | |
84
GOLDMAN SACHS FUNDAMENTAL EQUITY VALUE FUNDS
The Mid Cap Value, Small Cap Value and Small/Mid Cap Value Funds may lend their securities through a securities lending agent, the Bank of New York Mellon (“BNYM”), to certain qualified borrowers. In accordance with the Funds’ securities lending procedures, the Funds receive cash and/or U.S. Treasury securities collateral at least equal to the market value of the securities on loan. The market value of the loaned securities is determined at the close of business of the Funds at their last sale price or official closing price on the principal exchange or system on which they are traded, and any additional required collateral is delivered to the Funds on the next business day. As with other extensions of credit, the Funds may experience delay in the recovery of their securities or incur a loss should the borrower of the securities breach its agreement with the Funds or become insolvent at a time when the collateral is insufficient to cover the cost of repurchasing securities on loan. Dividend income received from securities on loan may not be subject to withholding taxes and therefore withholding taxes paid may differ from the amounts listed in the Statements of Operations. Loans of securities are terminable at any time and as such 1) the remaining contractual maturities of the outstanding securities lending transactions are considered to be overnight and continuous and 2) the borrower, after notice, is required to return borrowed securities within the standard time period for settlement of securities transactions.
Effective December 31, 2016, the Mid Cap Value, Small Cap Value and Small/Mid Cap Value Funds began lending their securities and investing the cash collateral received in connection with securities lending transactions in the Goldman Sachs Financial Square Government Fund (“Government Money Market Fund”), an affiliated series of the Trust. The Government Money Market Fund is registered under the Act as an open end investment company, is subject to Rule 2a-7 under the Act, and is managed by GSAM, for which GSAM may receive an investment advisory fee of up to 0.205% on an annualized basis of the average daily net assets of the Government Money Market Fund.
In the event of a default by a borrower with respect to any loan, BNYM may exercise any and all remedies provided under the applicable borrower agreement to make the Funds whole. These remedies include purchasing replacement securities by applying the collateral held from the defaulting broker against the purchase cost of the replacement securities. If BNYM is unable to purchase replacement securities, BNYM will indemnify the Funds by paying the Funds an amount equal to the market value of the securities loaned minus the value of cash and/or U.S. Treasury securities collateral received from the borrower for the loan, subject to an exclusion for any shortfalls resulting from a loss of value in such cash and/or U.S. Treasury securities collateral due to reinvestment risk. The amounts of the Funds’ overnight and continuous agreements which represent the gross amounts of recognized liabilities for securities lending transactions outstanding as of February 28, 2017 are disclosed as “Payable upon return of securities loaned” on the Statements of Assets and Liabilities.
Each of the Mid Cap Value, Small Cap Value and Small/Mid Cap Value Funds and BNYM received compensation relating to the lending of the Funds’ securities. The amounts earned, if any, by the Funds’ for the six months ended February 28, 2017, are reported under Investment Income on the Statements of Operations.
The following table provides information about the Funds’ investment of cash collateral in the Goldman Sachs Financial Square Government Fund for the six months ended February 28, 2017:
| | | | | | | | | | | | | | | | | | |
| Fund | | Underlying Fund | | Market
Value
8/31/16 | | | Purchases
at Cost | | | Proceeds
from Sales | | | Market
Value
2/28/17 | |
Mid Cap Value | | Goldman Sachs Financial Square Government Fund | | $ | — | | | | 62,774,680 | | | | 41,394,399 | | | $ | 21,380,280 | |
Small Cap Value | | Goldman Sachs Financial Square Government Fund | | | — | | | | 356,771,143 | | | | 271,817,178 | | | | 84,953,965 | |
Small/Mid Cap Value | | Goldman Sachs Financial Square Government Fund | | | — | | | | 2,528,253 | | | | 2,216,864 | | | | 311,388 | |
85
GOLDMAN SACHS FUNDAMENTAL EQUITY VALUE FUNDS
Notes to Financial Statements (continued)
February 28, 2017 (Unaudited)
As of the Funds’ most recent fiscal year end, August 31, 2016, the Funds’ capital loss carryforwards and certain timing differences, on a tax basis were as follows:
| | | | | | | | | | | | | | | | | | | | | | | | |
| | | Focused Value | | | Growth and Income | | | Large Cap Value | | | Mid Cap Value | | | Small Cap Value | | | Small/Mid Cap Value | |
Capital loss carryforwards: | | | | | | | | | | | | | | | | | | | | | | | | |
Expiring 2018 | | $ | — | | | $ | (114,821,092 | ) | | $ | — | | | $ | — | | | $ | — | | | $ | — | |
Perpetual Short-term | | | (20,098 | ) | | | — | | | | (9,271,203 | ) | | | (92,372,425 | ) | | | — | | | | (168,549 | ) |
Perpetual Long-term | | | — | | | | — | | | | — | | | | (80,340,016 | ) | | | — | | | | — | |
Total capital loss carryforwards | | $ | (20,098 | ) | | $ | (114,821,092 | ) | | $ | (9,271,203 | ) | | $ | (172,712,441 | ) | | $ | — | | | $ | (168,549 | ) |
Timing Differences (Qualified Late Year Loss Deferral/ Post October Loss Deferral) | | $ | (124,140 | ) | | $ | (5,172,381 | ) | | $ | (60,919,808 | ) | | $ | (409,474,868 | ) | | $ | (5,078 | ) | | $ | (632,179 | ) |
| (1) | | With the exception of perpetual capital loss carryforwards, expiration occurs on August 31 of the year indicated. |
As of February 28, 2017, the Funds’ aggregate security unrealized gains and losses based on cost for U.S. federal income tax purposes were as follows:
| | | | | | | | | | | | | | | | | | | | | | | | |
| | | Focused Value | | | Growth and Income | | | Large Cap Value | | | Mid Cap Value | | | Small Cap Value | | | Small/Mid Cap Value | |
Tax Cost | | $ | 3,352,398 | | | $ | 347,448,231 | | | $ | 923,560,572 | | | $ | 4,078,384,470 | | | $ | 5,305,047,112 | | | $ | 44,328,389 | |
Gross unrealized gain | | | 477,743 | | | | 80,431,738 | | | | 211,576,062 | | | | 710,501,968 | | | | 1,823,321,540 | | | | 7,124,418 | |
Gross unrealized loss | | | (68,010 | ) | | | (8,820,432 | ) | | | (23,790,093 | ) | | | (121,968,259 | ) | | | (113,722,132 | ) | | | (1,522,392 | ) |
Net unrealized security gain | | $ | 409,733 | | | $ | 71,611,306 | | | $ | 187,785,969 | | | $ | 588,533,709 | | | $ | 1,709,599,408 | | | $ | 5,602,026 | |
The difference between GAAP- basis and tax-basis unrealized gains (losses) is attributable to wash sales, differences related to the tax treatment of partnerships, underlying fund investments and real estate investment trusts.
GSAM has reviewed the Funds’ tax positions for all open tax years (the current and prior three years, as applicable) and has concluded that no provision for income tax is required in the Funds’ financial statements. Such open tax years remain subject to examination and adjustment by tax authorities.
The Funds’ risks include, but are not limited to, the following:
Foreign Countries Risk — Investing in foreign markets may involve special risks and considerations not typically associated with investing in the United States. Foreign securities may be subject to risk of loss because of more or less foreign government regulation, less public information and less economic, political and social stability in the countries in which a Fund invests. The imposition of exchange controls, confiscations, trade restrictions (including tariffs) and other government restrictions by the United States or other governments, or from problems in share registration, settlement or custody, may also result in losses. Foreign risk also involves the risk of negative foreign currency rate fluctuations, which may cause the value of securities denominated in such foreign currency (or other instruments through which a Fund has exposure to foreign currencies) to decline in value. Currency exchange rates may fluctuate significantly over short periods of time.
86
GOLDMAN SACHS FUNDAMENTAL EQUITY VALUE FUNDS
|
| 8. OTHER RISKS (continued) |
Investments in Other Investment Companies — As a shareholder of another investment company, including an exchange-traded fund (“ETF”), a Fund will indirectly bear its proportionate share of any net management fees and other expenses paid by such other investment companies, in addition to the fees and expenses regularly borne by the Fund. ETFs are subject to risks that do not apply to conventional mutual funds, including but not limited to the following: (i) the market price of the ETF’s shares may trade at a premium or a discount to their NAV; and (ii) an active trading market for an ETF’s shares may not develop or be maintained.
Large Shareholder Transactions Risk — A Fund may experience adverse effects when certain large shareholders, such as other funds, institutional investors (including those trading by use of non-discretionary mathematical formulas), financial intermediaries (who may make investment decisions on behalf of underlying clients and/or include a Fund in their investment model), individuals, accounts and Goldman Sachs affiliates, purchase or redeem large amounts of shares of a Fund. Such large shareholder redemptions may cause a Fund to sell portfolio securities at times when it would not otherwise do so, which may negatively impact a Fund’s NAV and liquidity. These transactions may also accelerate the realization of taxable income to shareholders if such sales of investments resulted in gains, and may also increase transaction costs. In addition, a large redemption could result in a Fund’s current expenses being allocated over a smaller asset base, leading to an increase in the Fund’s expense ratio. Similarly, large Fund share purchases may adversely affect a Fund’s performance to the extent that the Fund is delayed in investing new cash and is required to maintain a larger cash position than it ordinarily would.
Liquidity Risk — A Fund may make investments that are illiquid or that may become less liquid in response to market developments or adverse investor perceptions. Illiquid investments may be more difficult to value. Liquidity risk may also refer to the risk that a Fund will not be able to pay redemption proceeds within the allowable time period because of unusual market conditions, an unusually high volume of redemption requests, or other reasons. To meet redemption requests, a Fund may be forced to sell investments at an unfavorable time and/or under unfavorable conditions.
Market and Credit Risks — In the normal course of business, the Funds trade financial instruments and enter into financial transactions where risk of potential loss exists due to changes in the market (market risk). Additionally, the Funds may also be exposed to credit risk in the event that an issuer or guarantor fails to perform or that an institution or entity with which the Funds have unsettled or open transactions defaults.
Non-Diversification Risk — The Focused Value Fund is non-diversified, meaning that it is permitted to invest a larger percentage of its assets in fewer issuers than diversified mutual funds. Thus, the Fund may be more susceptible to adverse developments affecting any single issuer held in its portfolio, and may be more susceptible to greater losses because of these developments.
Sector Risk — To the extent a Fund focuses its investments in securities of issuers in one or more sectors (such as the financial services or telecommunications sectors), the Fund will be subject, to a greater extent than if its investments were diversified across different sectors, to the risks of volatile economic cycles and/or conditions and developments that may be particular to that sector, such as: adverse economic, business, political, environmental or other developments.
Under the Trust’s organizational documents, its Trustees, officers, employees and agents are indemnified, to the extent permitted by the Act and state law, against certain liabilities that may arise out of performance of their duties to the Funds. Additionally, in the course of business, the Funds enter into contracts that contain a variety of indemnification clauses. The Funds’s maximum exposure under these arrangements is unknown, as this would involve future claims that may be made against the Funds that have not yet occurred. However, GSAM believes the risk of loss under these arrangements to be remote.
87
GOLDMAN SACHS FUNDAMENTAL EQUITY VALUE FUNDS
Notes to Financial Statements (continued)
February 28, 2017 (Unaudited)
Subsequent events after the Statements of Assets and Liabilities date have been evaluated and GSAM has concluded that there is no impact requiring adjustment or disclosure in the financial statements.
88
GOLDMAN SACHS FUNDAMENTAL EQUITY VALUE FUNDS
|
| 11. SUMMARY OF SHARE TRANSACTIONS |
Share activity is as follows:
| | | | | | | | | | | | | | | | |
| | | Focused Value Fund | |
| | | | |
| | | For the Six Months Ended
February 28, 2017
(Unaudited) | | | For the Fiscal Year Ended
August 31, 2016
| |
| | | | |
| | | Shares | | | Dollars | | | Shares | | | Dollars | |
| | | | |
| Class A Shares | | | | | | | | | | | | | | | | |
Shares sold | | | 1,707 | | | $ | 17,933 | | | | 1 | | | $ | 5 | |
Reinvestment of distributions | | | 34 | | | | 365 | | | | 9 | | | | 81 | |
Shares redeemed | | | (1 | ) | | | (5 | ) | | | (1 | ) | | | (5 | ) |
| | | | 1,740 | | | | 18,293 | | | | 9 | | | | 81 | |
| Class C Shares | | | | | | | | | | | | | | | | |
Shares sold | | | 1,877 | | | | 20,000 | | | | — | | | | — | |
Reinvestment of distributions | | | 8 | | | | 80 | | | | 1 | | | | 9 | |
| | | | 1,885 | | | | 20,080 | | | | 1 | | | | 9 | |
| Institutional Shares | | | | | | | | | | | | | | | | |
Shares sold | | | 2,471 | | | | 26,600 | | | | 136,539 | | | | 1,241,515 | |
Reinvestment of distributions | | | 4,273 | | | | 45,341 | | | | 1,471 | | | | 13,283 | |
Shares redeemed | | | (1,007 | ) | | | (10,000 | ) | | | (2,250 | ) | | | (20,638 | ) |
| | | | 5,737 | | | | 61,941 | | | | 135,760 | | | | 1,234,160 | |
| Class IR Shares | | | | | | | | | | | | | | | | |
Reinvestment of distributions | | | 30 | | | | 317 | | | | 12 | | | | 105 | |
| | | | 30 | | | | 317 | | | | 12 | | | | 105 | |
| Class R Shares | | | | | | | | | | | | | | | | |
Reinvestment of distributions | | | 19 | | | | 198 | | | | 6 | | | | 56 | |
| | | | 19 | | | | 198 | | | | 6 | | | | 56 | |
| Class R6 Shares | | | | | | | | | | | | | | | | |
Reinvestment of distributions | | | 34 | | | | 359 | | | | 13 | | | | 122 | |
| | | | 34 | | | | 359 | | | | 13 | | | | 122 | |
NET INCREASE | | | 9,445 | | | $ | 101,188 | | | | 135,801 | | | $ | 1,234,533 | |
89
GOLDMAN SACHS FUNDAMENTAL EQUITY VALUE FUNDS
Notes to Financial Statements (continued)
February 28, 2017 (Unaudited)
|
| 11. SUMMARY OF SHARE TRANSACTIONS (continued) |
Share activity is as follows:
| | | | | | | | | | | | | | | | |
| | | Growth and Income Fund | |
| | | | |
| | | For the Six Months Ended
February 28, 2017
(Unaudited) | | | For the Fiscal Year Ended
August 31, 2016
| |
| | | | |
| | | Shares | | | Dollars | | | Shares | | | Dollars | |
| | | | |
| Class A Shares | | | | | | | | | | | | | | | | |
Shares sold | | | 147,136 | | | $ | 5,001,621 | | | | 342,897 | | | $ | 10,501,962 | |
Reinvestment of distributions | | | 97,979 | | | | 3,278,704 | | | | 242,552 | | | | 7,386,341 | |
Shares redeemed | | | (1,217,145 | ) | | | (40,710,603 | ) | | | (1,662,316 | ) | | | (51,415,996 | ) |
| | | | (972,030 | ) | | | (32,430,278 | ) | | | (1,076,867 | ) | | | (33,527,693 | ) |
| Class C Shares | | | | | | | | | | | | | | | | |
Shares sold | | | 33,397 | | | | 1,096,074 | | | | 59,369 | | | | 1,746,612 | |
Reinvestment of distributions | | | 3,652 | | | | 117,014 | | | | 10,108 | | | | 294,790 | |
Shares redeemed | | | (77,938 | ) | | | (2,492,495 | ) | | | (157,161 | ) | | | (4,599,071 | ) |
| | | | (40,889 | ) | | | (1,279,407 | ) | | | (87,684 | ) | | | (2,557,669 | ) |
| Institutional Shares | | | | | | | | | | | | | | | | |
Shares sold | | | 279,898 | | | | 9,349,485 | | | | 248,012 | | | | 7,964,100 | |
Reinvestment of distributions | | | 11,010 | | | | 374,554 | | | | 22,754 | | | | 703,391 | |
Shares redeemed | | | (204,241 | ) | | | (6,828,516 | ) | | | (265,314 | ) | | | (8,153,380 | ) |
| | | | 86,667 | | | | 2,895,523 | | | | 5,452 | | | | 514,111 | |
| Service Shares | | | | | | | | | | | | | | | | |
Shares sold | | | 1,381 | | | | 47,251 | | | | 1,875 | | | | 55,691 | |
Reinvestment of distributions | | | 28 | | | | 930 | | | | 62 | | | | 1,874 | |
Shares redeemed | | | (1,449 | ) | | | (46,391 | ) | | | (5,024 | ) | | | (152,217 | ) |
| | | | (40 | ) | | | 1,790 | | | | (3,087 | ) | | | (94,652 | ) |
| Class IR Shares | | | | | | | | | | | | | | | | |
Shares sold | | | 55,160 | | | | 1,900,672 | | | | 10,920 | | | | 345,895 | |
Reinvestment of distributions | | | 289 | | | | 9,686 | | | | 423 | | | | 12,891 | |
Shares redeemed | | | (10,388 | ) | | | (353,451 | ) | | | (8,671 | ) | | | (261,484 | ) |
| | | | 45,061 | | | | 1,556,907 | | | | 2,672 | | | | 97,302 | |
| Class R Shares | | | | | | | | | | | | | | | | |
Shares sold | | | 2,326 | | | | 78,129 | | | | 12,666 | | | | 379,829 | |
Reinvestment of distributions | | | 252 | | | | 8,414 | | | | 583 | | | | 17,717 | |
Shares redeemed | | | (3,977 | ) | | | (135,859 | ) | | | (6,081 | ) | | | (185,507 | ) |
| | | | (1,399 | ) | | | (49,316 | ) | | | 7,168 | | | | 212,039 | |
| Class R6 Shares | | | | | | | | | | | | | | | | |
Reinvestment of distributions | | | 4 | | | | 120 | | | | 7 | | | | 234 | |
| | | | 4 | | | | 120 | | | | 7 | | | | 234 | |
NET DECREASE | | | (882,626 | ) | | $ | (29,304,661 | ) | | | (1,152,339 | ) | | $ | (35,356,328 | ) |
90
GOLDMAN SACHS FUNDAMENTAL EQUITY VALUE FUNDS
|
| 11. SUMMARY OF SHARE TRANSACTIONS (continued) |
Share activity is as follows:
| | | | | | | | | | | | | | | | |
| | | Large Cap Value Fund | |
| | | | |
| | | For the Six Months Ended
February 28, 2017
(Unaudited) | | | For the Fiscal Year Ended
August 31, 2016
| |
| | | | |
| | | Shares | | | Dollars | | | Shares | | | Dollars | |
| | | | |
| Class A Shares | | | | | | | | | | | | | | | | |
Shares sold | | | 1,114,655 | | | $ | 18,597,909 | | | | 2,885,635 | | | $ | 43,866,574 | |
Reinvestment of distributions | | | 181,127 | | | | 3,055,620 | | | | 1,381,919 | | | | 21,255,786 | |
Shares redeemed | | | (2,538,001 | ) | | | (41,811,184 | ) | | | (6,248,569 | ) | | | (96,897,243 | ) |
| | | | (1,242,219 | ) | | | (20,157,655 | ) | | | (1,981,015 | ) | | | (31,774,883 | ) |
| Class C Shares | | | | | | | | | | | | | | | | |
Shares sold | | | 216,252 | | | | 3,447,801 | | | | 411,235 | | | | 6,024,820 | |
Reinvestment of distributions | | | 26,278 | | | | 426,759 | | | | 216,657 | | | | 3,197,552 | |
Shares redeemed | | | (240,554 | ) | | | (3,822,267 | ) | | | (598,844 | ) | | | (8,936,943 | ) |
| | | | 1,976 | | | | 52,293 | | | | 29,048 | | | | 285,429 | |
| Institutional Shares | | | | | | | | | | | | | | | | |
Shares sold | | | 3,256,088 | | | | 54,685,804 | | | | 8,029,852 | | | | 124,203,173 | |
Reinvestment of distributions | | | 822,932 | | | | 13,989,850 | | | | 5,291,545 | | | | 82,208,815 | |
Shares redeemed | | | (16,890,382 | ) | | | (288,447,488 | ) | | | (20,093,530 | ) | | | (326,391,476 | ) |
| | | | (12,811,362 | ) | | | (219,771,834 | ) | | | (6,772,133 | ) | | | (119,979,488 | ) |
| Service Shares | | | | | | | | | | | | | | | | |
Shares sold | | | 10,782 | | | | 179,474 | | | | 69,996 | | | | 1,054,317 | |
Reinvestment of distributions | | | 654 | | | | 10,985 | | | | 6,411 | | | | 98,009 | |
Shares redeemed | | | (43,158 | ) | | | (705,948 | ) | | | (116,934 | ) | | | (1,790,061 | ) |
| | | | (31,722 | ) | | | (515,489 | ) | | | (40,527 | ) | | | (637,735 | ) |
| Class IR Shares | | | | | | | | | | | | | | | | |
Shares sold | | | 219,958 | | | | 3,757,424 | | | | 79,726 | | | | 1,274,606 | |
Reinvestment of distributions | | | 3,571 | | | | 60,284 | | | | 38,678 | | | | 595,530 | |
Shares redeemed | | | (67,061 | ) | | | (1,105,165 | ) | | | (309,166 | ) | | | (4,895,897 | ) |
| | | | 156,468 | | | | 2,712,543 | | | | (190,762 | ) | | | (3,025,761 | ) |
| Class R Shares | | | | | | | | | | | | | | | | |
Shares sold | | | 47,842 | | | | 767,141 | | | | 82,228 | | | | 1,247,761 | |
Reinvestment of distributions | | | 5,852 | | | | 96,677 | | | | 46,232 | | | | 695,565 | |
Shares redeemed | | | (99,888 | ) | | | (1,576,620 | ) | | | (153,436 | ) | | | (2,332,484 | ) |
| | | | (46,194 | ) | | | (712,802 | ) | | | (24,976 | ) | | | (389,158 | ) |
| Class R6 Shares | | | | | | | | | | | | | | | | |
Shares sold | | | 356,996 | | | | 6,030,848 | | | | 7,942,737 | | | | 137,909,964 | |
Reinvestment of distributions | | | 154,155 | | | | 2,620,640 | | | | 794,300 | | | | 12,343,280 | |
Shares redeemed | | | (640,649 | ) | | | (10,714,801 | ) | | | (1,245,035 | ) | | | (19,232,419 | ) |
| | | | (129,498 | ) | | | (2,063,313 | ) | | | 7,492,002 | | | | 131,020,825 | |
NET DECREASE | | | (14,102,551 | ) | | $ | (240,456,257 | ) | | | (1,488,363 | ) | | $ | (24,500,771 | ) |
91
GOLDMAN SACHS FUNDAMENTAL EQUITY VALUE FUNDS
Notes to Financial Statements (continued)
February 28, 2017 (Unaudited)
|
| 11. SUMMARY OF SHARE TRANSACTIONS (continued) |
Share activity is as follows:
| | | | | | | | | | | | | | | | |
| | | Mid Cap Value Fund | |
| | | | |
| | | For the Six Months Ended
February 28, 2017
(Unaudited) | | | For the Fiscal Year Ended
August 31, 2016
| |
| | | | |
| | | Shares | | | Dollars | | | Shares | | | Dollars | |
| | | | |
| Class A Shares | | | | | | | | | | | | | | | | |
Shares sold | | | 2,086,067 | | | $ | 76,413,805 | | | | 6,355,588 | | | $ | 216,420,779 | |
Reinvestment of distributions | | | 285,115 | | | | 10,617,685 | | | | 5,591,955 | | | | 185,793,826 | |
Shares redeemed | | | (13,393,096 | ) | | | (487,420,153 | ) | | | (21,620,247 | ) | | | (734,771,946 | ) |
| | | | (11,021,914 | ) | | | (400,388,663 | ) | | | (9,672,704 | ) | | | (332,557,341 | ) |
| Class C Shares | | | | | | | | | | | | | | | | |
Shares sold | | | 83,260 | | | | 2,780,494 | | | | 377,449 | | | | 11,755,203 | |
Reinvestment of distributions | | | 14,976 | | | | 508,148 | | | | 571,513 | | | | 17,294,001 | |
Shares redeemed | | | (710,918 | ) | | | (23,521,661 | ) | | | (1,590,480 | ) | | | (49,300,924 | ) |
| | | | (612,682 | ) | | | (20,233,019 | ) | | | (641,518 | ) | | | (20,251,720 | ) |
| Institutional Shares | | | | | | | | | | | | | | | | |
Shares sold | | | 7,839,830 | | | | 290,000,524 | | | | 25,105,530 | | | | 849,735,755 | |
Reinvestment of distributions | | | 1,061,528 | | | | 39,849,763 | | | | 16,670,552 | | | | 560,463,699 | |
Shares redeemed | | | (42,358,901 | ) | | | (1,545,637,576 | ) | | | (87,925,338 | ) | | | (3,039,743,596 | ) |
| | | | (33,457,543 | ) | | | (1,215,787,289 | ) | | | (46,149,256 | ) | | | (1,629,544,142 | ) |
| Service Shares | | | | | | | | | | | | | | | | |
Shares sold | | | 170,988 | | | | 6,148,187 | | | | 721,569 | | | | 24,266,187 | |
Reinvestment of distributions | | | 24,888 | | | | 911,644 | | | | 697,149 | | | | 22,758,583 | |
Shares redeemed | | | (1,398,545 | ) | | | (49,521,296 | ) | | | (3,199,705 | ) | | | (104,551,077 | ) |
| | | | (1,202,669 | ) | | | (42,461,465 | ) | | | (1,780,987 | ) | | | (57,526,307 | ) |
| Class IR Shares | | | | | | | | | | | | | | | | |
Shares sold | | | 2,403,189 | | | | 88,405,889 | | | | 2,045,977 | | | | 70,085,435 | |
Reinvestment of distributions | | | 76,806 | | | | 2,802,661 | | | | 1,001,683 | | | | 32,713,762 | |
Shares redeemed | | | (2,376,812 | ) | | | (84,947,262 | ) | | | (4,644,981 | ) | | | (157,407,717 | ) |
| | | | 103,183 | | | | 6,261,288 | | | | (1,597,321 | ) | | | (54,608,520 | ) |
| Class R Shares | | | | | | | | | | | | | | | | |
Shares sold | | | 117,066 | | | | 4,175,337 | | | | 405,682 | | | | 13,700,699 | |
Reinvestment of distributions | | | 7,913 | | | | 287,644 | | | | 130,451 | | | | 4,230,456 | |
Shares redeemed | | | (220,356 | ) | | | (7,803,340 | ) | | | (482,052 | ) | | | (16,053,475 | ) |
| | | | (95,377 | ) | | | (3,340,359 | ) | | | 54,081 | | | | 1,877,680 | |
| Class R6 Shares | | | | | | | | | | | | | | | | |
Shares sold | | | 1,793,247 | | | | 65,983,882 | | | | 13,963,340 | | | | 510,945,821 | |
Reinvestment of distributions | | | 158,716 | | | | 5,955,039 | | | | 1,189,720 | | | | 39,986,116 | |
Shares redeemed | | | (1,192,961 | ) | | | (44,226,747 | ) | | | (4,705,460 | ) | | | (164,927,737 | ) |
| | | | 759,002 | | | | 27,712,174 | | | | 10,447,600 | | | | 386,004,200 | |
NET DECREASE | | | (45,528,000 | ) | | $ | (1,648,237,333 | ) | | | (49,340,105 | ) | | $ | (1,706,606,150 | ) |
92
GOLDMAN SACHS FUNDAMENTAL EQUITY VALUE FUNDS
|
| 11. SUMMARY OF SHARE TRANSACTIONS (continued) |
Share activity is as follows:
| | | | | | | | | | | | | | | | |
| | | Small Cap Value Fund | |
| | | | |
| | | For the Six Months Ended
February 28, 2017
(Unaudited) | | | For the Fiscal Year Ended
August 31, 2016
| |
| | | | |
| | | Shares | | | Dollars | | | Shares | | | Dollars | |
| | | | |
| Class A Shares | | | | | | | | | | | | | | | | |
Shares sold | | | 2,088,777 | | | $ | 115,611,277 | | | | 3,238,202 | | | $ | 154,375,191 | |
Reinvestment of distributions | | | 526,209 | | | | 30,118,450 | | | | 901,558 | | | | 42,559,273 | |
Shares redeemed | | | (3,373,531 | ) | | | (185,601,319 | ) | | | (5,556,748 | ) | | | (264,856,085 | ) |
| | | | (758,545 | ) | | | (39,871,592 | ) | | | (1,416,988 | ) | | | (67,921,621 | ) |
| Class C Shares | | | | | | | | | | | | | | | | |
Shares sold | | | 43,053 | | | | 1,887,678 | | | | 85,898 | | | | 3,279,343 | |
Reinvestment of distributions | | | 34,974 | | | | 1,576,275 | | | | 68,406 | | | | 2,576,165 | |
Shares redeemed | | | (159,714 | ) | | | (6,851,684 | ) | | | (481,475 | ) | | | (18,395,042 | ) |
| | | | (81,687 | ) | | | (3,387,731 | ) | | | (327,171 | ) | | | (12,539,534 | ) |
| Institutional Shares | | | | | | | | | | | | | | | | |
Shares sold | | | 13,834,646 | | | | 817,236,939 | | | | 17,427,197 | | | | 886,530,469 | |
Reinvestment of distributions | | | 2,661,796 | | | | 163,363,244 | | | | 4,333,376 | | | | 218,630,055 | |
Shares redeemed | | | (15,624,534 | ) | | | (903,411,491 | ) | | | (26,928,367 | ) | | | (1,386,761,311 | ) |
| | | | 871,908 | | | | 77,188,692 | | | | (5,167,794 | ) | | | (281,600,787 | ) |
| Service Shares | | | | | | | | | | | | | | | | |
Shares sold | | | 312,312 | | | | 16,843,781 | | | | 715,838 | | | | 33,131,625 | |
Reinvestment of distributions | | | 74,473 | | | | 4,143,684 | | | | 144,414 | | | | 6,634,801 | |
Shares redeemed | | | (384,719 | ) | | | (20,303,386 | ) | | | (1,292,420 | ) | | | (59,025,815 | ) |
| | | | 2,066 | | | | 684,079 | | | | (432,168 | ) | | | (19,259,389 | ) |
| Class IR Shares | | | | | | | | | | | | | | | | |
Shares sold | | | 838,249 | | | | 46,112,058 | | | | 1,414,732 | | | | 67,475,547 | |
Reinvestment of distributions | | | 115,731 | | | | 6,586,540 | | | | 178,553 | | | | 8,381,286 | |
Shares redeemed | | | (611,389 | ) | | | (33,445,957 | ) | | | (1,079,227 | ) | | | (51,005,223 | ) |
| | | | 342,591 | | | | 19,252,641 | | | | 514,058 | | | | 24,851,610 | |
| Class R Shares | | | | | | | | | | | | | | | | |
Shares sold | | | 387,464 | | | | 20,966,002 | | | | 627,785 | | | | 29,542,384 | |
Reinvestment of distributions | | | 73,501 | | | | 4,131,777 | | | | 123,318 | | | | 5,723,131 | |
Shares redeemed | | | (415,693 | ) | | | (22,540,361 | ) | | | (1,168,739 | ) | | | (55,180,884 | ) |
| | | | 45,272 | | | | 2,557,418 | | | | (417,636 | ) | | | (19,915,369 | ) |
| Class R6 Shares | | | | | | | | | | | | | | | | |
Shares sold | | | 4,214,284 | | | | 249,210,277 | | | | 6,108,964 | | | | 312,236,113 | |
Reinvestment of distributions | | | 250,770 | | | | 15,387,048 | | | | 50,143 | | | | 2,529,721 | |
Shares redeemed | | | (591,299 | ) | | | (34,966,462 | ) | | | (1,018,482 | ) | | | (50,485,046 | ) |
| | | | 3,873,755 | | | | 229,630,863 | | | | 5,140,625 | | | | 264,280,788 | |
NET INCREASE (DECREASE) | | | 4,295,360 | | | $ | 286,054,370 | | | | (2,107,074 | ) | | $ | (112,104,302 | ) |
93
GOLDMAN SACHS FUNDAMENTAL EQUITY VALUE FUNDS
Notes to Financial Statements (continued)
February 28, 2017 (Unaudited)
|
| 11. SUMMARY OF SHARE TRANSACTIONS (continued) |
Share activity is as follows:
| | | | | | | | | | | | | | | | |
| | | Small/Mid Cap Value Fund | |
| | | | |
| | | For the Six Months Ended
February 28, 2017
(Unaudited) | | | For the Fiscal Year Ended
August 31, 2016
| |
| | | | |
| | | Shares | | | Dollars | | | Shares | | | Dollars | |
| | | | |
| Class A Shares | | | | | | | | | | | | | | | | |
Shares sold | | | 40,728 | | | $ | 487,339 | | | | 62,953 | | | $ | 638,988 | |
Reinvestment of distributions | | | 685 | | | | 8,317 | | | | 394 | | | | 4,068 | |
Shares redeemed | | | (53,180 | ) | | | (652,597 | ) | | | (13,144 | ) | | | (133,211 | ) |
| | | | (11,767 | ) | | | (156,941 | ) | | | 50,203 | | | | 509,845 | |
| Class C Shares | | | | | | | | | | | | | | | | |
Shares sold | | | 39,031 | | | | 454,252 | | | | 28,884 | | | | 281,741 | |
Reinvestment of distributions | | | 157 | | | | 1,874 | | | | 172 | | | | 1,759 | |
Shares redeemed | | | (826 | ) | | | (8,945 | ) | | | (3,950 | ) | | | (36,741 | ) |
| | | | 38,362 | | | | 447,181 | | | | 25,106 | | | | 246,759 | |
| Institutional Shares | | | | | | | | | | | | | | | | |
Shares sold | | | 834,949 | | | | 10,115,737 | | | | 2,311,718 | | | | 23,637,673 | |
Reinvestment of distributions | | | 35,493 | | | | 434,076 | | | | 18,556 | | | | 192,017 | |
Shares redeemed | | | (779,019 | ) | | | (9,604,055 | ) | | | (1,305,658 | ) | | | (13,429,411 | ) |
| | | | 91,423 | | | | 945,758 | | | | 1,024,616 | | | | 10,400,279 | |
| Class IR Shares | | | | | | | | | | | | | | | | |
Shares sold | | | 46,070 | | | | 571,040 | | | | 477,865 | | | | 5,127,405 | |
Reinvestment of distributions | | | 1,476 | | | | 17,996 | | | | 3,440 | | | | 35,503 | |
Shares redeemed | | | (42,787 | ) | | | (478,497 | ) | | | (239,140 | ) | | | (2,537,181 | ) |
| | | | 4,759 | | | | 110,539 | | | | 242,165 | | | | 2,625,727 | |
| Class R Shares | | | | | | | | | | | | | | | | |
Shares sold | | | 282 | | | | 3,262 | | | | 6,481 | | | | 60,736 | |
Reinvestment of distributions | | | 28 | | | | 338 | | | | 28 | | | | 294 | |
Shares redeemed | | | (1,708 | ) | | | (20,086 | ) | | | (7,144 | ) | | | (75,581 | ) |
| | | | (1,398 | ) | | | (16,486 | ) | | | (635 | ) | | | (14,551 | ) |
| Class R6 Shares | | | | | | | | | | | | | | | | |
Reinvestment of distributions | | | 8 | | | | 99 | | | | 6 | | | | 68 | |
| | | | 8 | | | | 99 | | | | 6 | | | | 68 | |
NET INCREASE | | | 121,387 | | | $ | 1,330,150 | | | | 1,341,461 | | | $ | 13,768,127 | |
94
GOLDMAN SACHS FUNDAMENTAL EQUITY VALUE FUNDS
Fund Expenses — Six Month Period Ended February 28, 2017 (Unaudited)
As a shareholder of Class A, Class C, Institutional, Service, Class IR, Class R and Class R6 Shares of a Fund, you incur two types of costs: (1) transaction costs, including sales charges on purchase payments (with respect to Class A Shares), contingent deferred sales charges on redemptions (with respect to Class C Shares), and (2) ongoing costs, including management fees; distribution and/or service (12b-1) fees (with respect to Class A, Class C, Service and Class R Shares); and other Fund expenses. This Example is intended to help you understand your ongoing costs (in dollars) of investing in Class A, Class C, Institutional, Service, Class IR, Class R or Class R6 Shares of the Funds and to compare these costs with the ongoing costs of investing in other mutual funds.
The Example is based on an investment of $1,000 invested at the beginning of the period and held for the entire period from September 1, 2016 through February 28, 2017, which represents a period of 181 days in a 365-day year.
Actual Expenses — The first line under each share class in the table below provides information about actual account values and actual expenses. You may use the information in this line, together with the amount you invested, to estimate the expenses that you paid over the period. Simply divide your account value by $1,000 (for example, an $8,600 account value divided by $1,000=8.6), then multiply the result by the number in the first line under the heading entitled “Expenses Paid” to estimate the expenses you paid on your account during this period.
Hypothetical Example for Comparison Purposes — The second line under each share class in the table below provides information about hypothetical account values and hypothetical expenses based on the Funds’ actual net expense ratios and an assumed rate of return of 5% per year before expenses, which is not the Funds’ actual return. The hypothetical account values and expenses may not be used to estimate the actual ending account balance or expenses you paid for the period. You may use this information to compare the ongoing costs of investing in the Funds and other funds. To do so, compare this 5% hypothetical example with the 5% hypothetical examples that appear in the shareholder reports of the other funds.
Please note that the expenses shown in the table are meant to highlight your ongoing costs only and do not reflect any transactional costs, such as sales charges, redemption fees, or exchange fees. Therefore, the second line of the table is useful in comparing ongoing costs only, and will not help you determine the relative total costs of owning different funds. In addition, if these transactional costs were included, your costs would have been higher.
| | | | | | | | | | | | | | | | | | | | | | | | | | | | | | | | | | | | |
| | | Focused Value Fund | | | Growth and Income Fund | | | Large Cap Value Fund | |
| Share Class | | Beginning
Account
Value
9/1/16 | | | Ending
Account
Value
2/28/17 | | | Expenses
Paid for the
6 months ended
2/28/17* | | | Beginning
Account
Value
9/1/16 | | | Ending
Account
Value
2/28/17 | | | Expenses
Paid for the
6 months ended
2/28/17* | | | Beginning
Account
Value
9/1/16 | | | Ending
Account
Value
2/28/17 | | | Expenses
Paid for the
6 months ended
2/28/17* | |
| Class A | | | | | | | | | | | | | | | | | | | | | | | | | | | | | | | | | | | | |
Actual | | $ | 1,000.00 | | | $ | 1,107.60 | | | $ | 5.91 | | | $ | 1,000.00 | | | $ | 1,107.80 | | | $ | 5.91 | | | $ | 1,000.00 | | | $ | 1,099.30 | | | $ | 6.04 | |
Hypothetical 5% return | | | 1,000.00 | | | | 1,019.19 | + | | | 5.66 | | | | 1,000.00 | | | | 1,019.19 | + | | | 5.66 | | | | 1,000.00 | | | | 1,019.04 | + | | | 5.81 | |
| Class C | | | | | | | | | | | | | | | | | | | | | | | | | | | | | | | | | | | | |
Actual | | | 1,000.00 | | | | 1,103.90 | | | | 9.81 | | | | 1,000.00 | | | | 1,103.70 | | | | 9.81 | | | | 1,000.00 | | | | 1,094.90 | | | | 9.92 | |
Hypothetical 5% return | | | 1,000.00 | | | | 1,015.47 | + | | | 9.39 | | | | 1,000.00 | | | | 1,015.47 | + | | | 9.39 | | | | 1,000.00 | | | | 1,015.32 | + | | | 9.54 | |
| Institutional | | | | | | | | | | | | | | | | | | | | | | | | | | | | | | | | | | | | |
Actual | | | 1,000.00 | | | | 1,109.30 | | | | 3.82 | | | | 1,000.00 | | | | 1,110.20 | | | | 3.82 | | | | 1,000.00 | | | | 1,101.00 | | | | 4.06 | |
Hypothetical 5% return | | | 1,000.00 | | | | 1,021.18 | + | | | 3.66 | | | | 1,000.00 | | | | 1,021.18 | + | | | 3.66 | | | | 1,000.00 | | | | 1,020.93 | + | | | 3.91 | |
| Service | | | | | | | | | | | | | | | | | | | | | | | | | | | | | | | | | | | | |
Actual | | | N/A | | | | N/A | | | | — | | | | 1,000.00 | | | | 1,107.50 | | | | 6.43 | | | | 1,000.00 | | | | 1,098.20 | | | | 6.66 | |
Hypothetical 5% return | | | N/A | | | | N/A | + | | | N/A | | | | 1,000.00 | | | | 1,018.70 | + | | | 6.16 | | | | 1,000.00 | | | | 1,018.45 | + | | | 6.41 | |
| Class IR | | | | | | | | | | | | | | | | | | | | | | | | | | | | | | | | | | | | |
Actual | | | 1,000.00 | | | | 1,108.90 | | | | 4.60 | | | | 1,000.00 | | | | 1,109.20 | | | | 4.60 | | | | 1,000.00 | | | | 1,100.20 | | | | 4.69 | |
Hypothetical 5% return | | | 1,000.00 | | | | 1,020.43 | + | | | 4.41 | | | | 1,000.00 | | | | 1,020.43 | + | | | 4.41 | | | | 1,000.00 | | | | 1,020.33 | + | | | 4.51 | |
| Class R | | | | | | | | | | | | | | | | | | | | | | | | | | | | | | | | | | | | |
Actual | | | 1,000.00 | | | | 1,105.30 | | | | 7.20 | | | | 1,000.00 | | | | 1,106.60 | | | | 7.21 | | | | 1,000.00 | | | | 1,097.60 | | | | 7.33 | |
Hypothetical 5% return | | | 1,000.00 | | | | 1,017.95 | + | | | 6.90 | | | | 1,000.00 | | | | 1,017.95 | + | | | 6.90 | | | | 1,000.00 | | | | 1,017.80 | + | | | 7.05 | |
| Class R6 | | | | | | | | | | | | | | | | | | | | | | | | | | | | | | | | | | | | |
Actual | | | 1,000.00 | | | | 1,109.50 | | | | 3.66 | | | | 1,000.00 | | | | 1,110.20 | | | | 3.82 | | | | 1,000.00 | | | | 1,101.30 | | | | 3.96 | |
Hypothetical 5% return | | | 1,000.00 | | | | 1,021.32 | + | | | 3.51 | | | | 1,000.00 | | | | 1,021.18 | + | | | 3.66 | | | | 1,000.00 | | | | 1,021.03 | + | | | 3.81 | |
95
GOLDMAN SACHS FUNDAMENTAL EQUITY VALUE FUNDS
Fund Expenses — Six Month Period Ended February 28, 2017 (Unaudited) (continued)
| | | | | | | | | | | | | | | | | | | | | | | | | | | | | | | | | | | | |
| | | Mid Cap Value Fund | | | Small Cap Value Fund | | | Small/Mid Cap Value Fund | |
| Share Class | | Beginning
Account
Value
9/1/16 | | | Ending
Account
Value
2/28/17 | | | Expenses
Paid for the
6 months ended
2/28/17* | | | Beginning
Account
Value
9/1/16 | | | Ending
Account
Value
2/28/17 | | | Expenses
Paid for the
6 months ended
2/28/17* | | | Beginning
Account
Value
9/1/16 | | | Ending
Account
Value
2/28/17 | | | Expenses
Paid for the
6 months ended
2/28/17* | |
| Class A | | | | | | | | | | | | | | | | | | | | | | | | | | | | | | | | | | | | |
Actual | | $ | 1,000.00 | | | $ | 1,094.90 | | | $ | 6.08 | | | $ | 1,000.00 | | | $ | 1,129.30 | | | $ | 7.07 | | | $ | 1,000.00 | | | $ | 1,122.00 | | | $ | 6.52 | |
Hypothetical 5% return | | | 1,000.00 | | | | 1,018.99 | + | | | 5.86 | | | | 1,000.00 | | | | 1,018.15 | + | | | 6.71 | | | | 1,000.00 | | | | 1,018.65 | + | | | 6.21 | |
| Class C | | | | | | | | | | | | | | | | | | | | | | | | | | | | | | | | | | | | |
Actual | | | 1,000.00 | | | | 1,091.10 | | | | 9.95 | | | | 1,000.00 | | | | 1,125.10 | | | | 11.01 | | | | 1,000.00 | | | | 1,117.60 | | | | 10.45 | |
Hypothetical 5% return | | | 1,000.00 | | | | 1,015.27 | + | | | 9.59 | | | | 1,000.00 | | | | 1,014.43 | + | | | 10.44 | | | | 1,000.00 | | | | 1,014.93 | + | | | 9.94 | |
| Institutional | | | | | | | | | | | | | | | | | | | | | | | | | | | | | | | | | | | | |
Actual | | | 1,000.00 | | | | 1,097.50 | | | | 4.00 | | | | 1,000.00 | | | | 1,131.60 | | | | 4.97 | | | | 1,000.00 | | | | 1,123.30 | | | | 4.42 | |
Hypothetical 5% return | | | 1,000.00 | | | | 1,020.98 | + | | | 3.86 | | | | 1,000.00 | | | | 1,020.13 | + | | | 4.71 | | | | 1,000.00 | | | | 1,020.63 | + | | | 4.21 | |
| Service | | | | | | | | | | | | | | | | | | | | | | | | | | | | | | | | | | | | |
Actual | | | 1,000.00 | | | | 1,094.80 | | | | 6.60 | | | | 1,000.00 | | | | 1,128.80 | | | | 7.60 | | | | N/A | | | | N/A | | | | — | |
Hypothetical 5% return | | | 1,000.00 | | | | 1,018.50 | + | | | 6.36 | | | | 1,000.00 | | | | 1,017.65 | + | | | 7.20 | | | | N/A | | | | N/A | | | | N/A | |
| Class IR | | | | | | | | | | | | | | | | | | | | | | | | | | | | | | | | | | | | |
Actual | | | 1,000.00 | | | | 1,096.50 | | | | 4.78 | | | | 1,000.00 | | | | 1,130.90 | | | | 5.76 | | | | 1,000.00 | | | | 1,122.30 | | | | 5.21 | |
Hypothetical 5% return | | | 1,000.00 | | | | 1,020.23 | + | | | 4.61 | | | | 1,000.00 | | | | 1,019.39 | + | | | 5.46 | | | | 1,000.00 | | | | 1,019.89 | + | | | 4.96 | |
| Class R | | | | | | | | | | | | | | | | | | | | | | | | | | | | | | | | | | | | |
Actual | | | 1,000.00 | | | | 1,094.00 | | | | 7.37 | | | | 1,000.00 | | | | 1,128.00 | | | | 8.39 | | | | 1,000.00 | | | | 1,119.60 | | | | 7.83 | |
Hypothetical 5% return | | | 1,000.00 | | | | 1,017.75 | + | | | 7.10 | | | | 1,000.00 | | | | 1,016.91 | + | | | 7.95 | | | | 1,000.00 | | | | 1,017.41 | + | | | 7.45 | |
| Class R6 | | | | | | | | | | | | | | | | | | | | | | | | | | | | | | | | | | | | |
Actual | | | 1,000.00 | | | | 1,097.30 | | | | 3.90 | | | | 1,000.00 | | | | 1,131.90 | | | | 4.86 | | | | 1,000.00 | | | | 1,123.30 | | | | 4.42 | |
Hypothetical 5% return | | | 1,000.00 | | | | 1,021.08 | + | | | 3.76 | | | | 1,000.00 | | | | 1,020.23 | + | | | 4.61 | | | | 1,000.00 | | | | 1,020.63 | + | | | 4.21 | |
| * | | Expenses for each share class are calculated using each Fund’s annualized net expense ratio for each class, which represents the ongoing expenses as a percentage of net assets for the six months ended February 28, 2017. Expenses are calculated by multiplying the annualized net expense ratio by the average account value for the period; then multiplying the result by the number of days in the most recent fiscal half year; and then dividing that result by the number of days in the fiscal year. The annualized net expense ratios for the period were as follows: |
| | | | | | | | | | | | | | | | | | | | | | | | | | | | |
| Fund | | Class A | | | Class C | | | Institutional | | | Service | | | Class IR | | | Class R | | | Class R6 | |
Focused Value+ | | | 1.13 | % | | | 1.88 | % | | | 0.73 | % | | | N/A | | | | 0.88 | % | | | 1.38 | % | | | 0.68 | % |
Growth and Income+ | | | 1.13 | | | | 1.88 | | | | 0.73 | | | | 1.23 | % | | | 0.88 | | | | 1.38 | | | | 0.73 | |
Large Cap Value+ | | | 1.16 | | | | 1.91 | | | | 0.78 | | | | 1.28 | | | | 0.90 | | | | 1.41 | | | | 0.76 | |
Mid Cap Value+ | | | 1.17 | | | | 1.92 | | | | 0.77 | | | | 1.27 | | | | 0.92 | | | | 1.42 | | | | 0.75 | |
Small Cap Value+ | | | 1.34 | | | | 2.09 | | | | 0.94 | | | | 1.44 | | | | 1.09 | | | | 1.59 | | | | 0.92 | |
Small/Mid Cap Value+ | | | 1.24 | | | | 1.99 | | | | 0.84 | | | | N/A | | | | 0.99 | | | | 1.49 | | | | 0.84 | |
| + | | Hypothetical expenses are based on each Fund’s actual annualized net expense ratios and an assumed rate of return of 5% per year before expenses. |
96
FUNDS PROFILE
Goldman Sachs Funds
Goldman Sachs is a premier financial services firm, known since 1869 for creating thoughtful and customized investment solutions in complex global markets.
Today, the Investment Management Division of Goldman Sachs serves a diverse set of clients worldwide, including private institutions, public entities and individuals. With approximately $1.17 trillion in assets under supervision as of December 31, 2016, Goldman Sachs Asset Management (“GSAM”) has portfolio management teams located around the world and our investment professionals bring firsthand knowledge of local markets to every investment decision. Assets under supervision includes assets under management and other client assets for which Goldman Sachs does not have full discretion. GSAM leverages the resources of Goldman, Sachs & Co. subject to legal, internal and regulatory restrictions.
Money Market
Financial Square FundsSM
| ∎ | | Financial Square Treasury Solutions Fund1 |
| ∎ | | Financial Square Government Fund1 |
| ∎ | | Financial Square Money Market Fund2 |
| ∎ | | Financial Square Prime Obligations Fund2 |
| ∎ | | Financial Square Treasury Instruments Fund1 |
| ∎ | | Financial Square Treasury Obligations Fund1 |
| ∎ | | Financial Square Federal Instruments Fund1 |
| ∎ | | Financial Square Tax-Exempt Money Market Fund2 |
Investor FundsSM
| ∎ | | Investor Money Market Fund3 |
| ∎ | | Investor Tax-Exempt Money Market Fund3 |
Fixed Income
Short Duration and Government
| ∎ | | High Quality Floating Rate Fund |
| ∎ | | Short-Term Conservative Income Fund4 |
| ∎ | | Short Duration Government Fund |
| ∎ | | Short Duration Income Fund |
| ∎ | | Inflation Protected Securities Fund |
Multi-Sector
Municipal and Tax-Free
| ∎ | | High Yield Municipal Fund |
| ∎ | | Dynamic Municipal Income Fund |
| ∎ | | Short Duration Tax-Free Fund |
Single Sector
| ∎ | | Investment Grade Credit Fund |
| ∎ | | High Yield Floating Rate Fund |
| ∎ | | Emerging Markets Debt Fund |
| ∎ | | Local Emerging Markets Debt Fund |
| ∎ | | Dynamic Emerging Markets Debt Fund |
Fixed Income Alternatives
| ∎ | | Long Short Credit Strategies Fund |
| ∎ | | Fixed Income Macro Strategies Fund |
Fundamental Equity
| ∎ | | Small/Mid Cap Value Fund |
| ∎ | | Small/Mid Cap Growth Fund |
| ∎ | | Flexible Cap Growth Fund |
| ∎ | | Concentrated Growth Fund |
| ∎ | | Technology Opportunities Fund |
| ∎ | | Growth Opportunities Fund |
| ∎ | | Rising Dividend Growth Fund |
| ∎ | | Dynamic U.S. Equity Fund |
Tax-Advantaged Equity
| ∎ | | U.S. Tax-Managed Equity Fund |
| ∎ | | International Tax-Managed Equity Fund |
| ∎ | | U.S. Equity Dividend and Premium Fund |
| ∎ | | International Equity Dividend and Premium Fund |
Equity Insights
| ∎ | | Small Cap Equity Insights Fund |
| ∎ | | U.S. Equity Insights Fund |
| ∎ | | Small Cap Growth Insights Fund |
| ∎ | | Large Cap Growth Insights Fund |
| ∎ | | Large Cap Value Insights Fund |
| ∎ | | Small Cap Value Insights Fund |
| ∎ | | International Small Cap Insights Fund |
| ∎ | | International Equity Insights Fund |
| ∎ | | Emerging Markets Equity Insights Fund |
Fundamental Equity International
| ∎ | | Strategic International Equity Fund |
| ∎ | | Focused International Equity Fund |
| ∎ | | Emerging Markets Equity Fund |
Select Satellite
| ∎ | | Real Estate Securities Fund |
| ∎ | | International Real Estate Securities Fund |
| ∎ | | Commodity Strategy Fund |
| ∎ | | Global Real Estate Securities Fund |
| ∎ | | Dynamic Allocation Fund |
| ∎ | | Absolute Return Tracker Fund |
| ∎ | | Managed Futures Strategy Fund |
| ∎ | | MLP Energy Infrastructure Fund |
| ∎ | | Multi-Manager Alternatives Fund |
| ∎ | | Absolute Return Multi-Asset Fund |
| ∎ | | Global Infrastructure Fund |
Total Portfolio Solutions
| ∎ | | Global Managed Beta Fund |
| ∎ | | Multi-Manager Non-Core Fixed Income Fund |
| ∎ | | Multi-Manager U.S. Dynamic Equity Fund |
| ∎ | | Multi-Manager Global Equity Fund |
| ∎ | | Multi-Manager International Equity Fund |
| ∎ | | Tactical Tilt Overlay Fund5 |
| ∎ | | Balanced Strategy Portfolio |
| ∎ | | Multi-Manager U.S. Small Cap Equity Fund |
| ∎ | | Multi-Manager Real Assets Strategy Fund |
| ∎ | | Growth and Income Strategy Portfolio |
| ∎ | | Growth Strategy Portfolio |
| ∎ | | Equity Growth Strategy Portfolio |
| ∎ | | Satellite Strategies Portfolio |
| ∎ | | Enhanced Dividend Global Equity Portfolio |
| ∎ | | Tax-Advantaged Global Equity Portfolio |
| ∎ | | Strategic Factor Allocation Fund |
| ∎ | | Target Date 2020 Portfolio |
| ∎ | | Target Date 2025 Portfolio |
| ∎ | | Target Date 2030 Portfolio |
| ∎ | | Target Date 2035 Portfolio |
| ∎ | | Target Date 2040 Portfolio |
| ∎ | | Target Date 2045 Portfolio |
| ∎ | | Target Date 2050 Portfolio |
| ∎ | | Target Date 2055 Portfolio |
| ∎ | | GQG Partners International Opportunities Fund |
| 1 | | You could lose money by investing in the Fund. Although the Fund seeks to preserve the value of your investment at $1.00 per share, it cannot guarantee it will do so. An investment in the Fund is not a deposit of a bank and is not insured or guaranteed by the Federal Deposit Insurance Corporation or any other government agency. The Fund’s sponsor has no legal obligation to provide financial support to the Fund, and you should not expect that the sponsor will provide financial support to the Fund at any time. |
| 2 | | You could lose money by investing in the Fund. Because the share price of the Fund will fluctuate, when you sell your shares they may be worth more or less than what you originally paid for them. The Fund may impose a fee upon sale of your shares or may temporarily suspend your ability to sell shares if the Fund’s liquidity falls below required minimums because of market conditions or other factors. An investment in the Fund is not a deposit of a bank and is not insured or guaranteed by the Federal Deposit Insurance Corporation or any other government agency. The Fund’s sponsor has no legal obligation to provide financial support to the Fund, and you should not expect that the sponsor will provide financial support to the Fund at any time. |
| 3 | | You could lose money by investing in the Fund. Although the Fund seeks to preserve the value of your investment at $1.00 per share, it cannot guarantee it will do so. The Fund may impose a fee upon sale of your shares or may temporarily suspend your ability to sell shares if the Fund’s liquidity falls below required minimums because of market conditions or other factors. An investment in the Fund is not a deposit of a bank and is not insured or guaranteed by the Federal Deposit Insurance Corporation or any other government agency. The Fund’s sponsor has no legal obligation to provide financial support to the Fund, and you should not expect that the sponsor will provide financial support to the Fund at any time. |
| 4 | | Effective on July 29, 2016, the Goldman Sachs Limited Maturity Obligations Fund was renamed the Goldman Sachs Short-Term Conservative Income Fund. |
| 5 | | Effective on June 1, 2016, the Goldman Sachs Tactical Tilt Implementation Fund was renamed the Goldman Sachs Tactical Tilt Overlay Fund. Financial Square FundsSM and Investor FundsSM are registered service marks of Goldman, Sachs & Co. |
*This list covers open-end funds only. Please visit our website at www.GSAMFUNDS.com to learn about our closed-end funds and exchange-traded funds.
| | |
TRUSTEES Ashok N. Bakhru, Chairman Kathryn A. Cassidy Diana M. Daniels Herbert J. Markley James A. McNamara Jessica Palmer Roy W. Templin Gregory G. Weaver | | OFFICERS James A. McNamara, President Scott M. McHugh, Treasurer, Senior Vice President and Principal Financial Officer Caroline L. Kraus, Secretary |
| |
GOLDMAN, SACHS & CO. Distributor and Transfer Agent | | GOLDMAN SACHS ASSET MANAGEMENT, L.P. Investment Adviser |
Visit our web site at www.GSAMFUNDS.com to obtain the most recent month-end returns.
Goldman Sachs Asset Management, L.P. 200 West Street, New York, New York 10282
The reports concerning the Funds included in this shareholder report may contain certain forward-looking statements about the factors that may affect the performance of the Funds in the future. These statements are based on Fund management’s predictions and expectations concerning certain future events and their expected impact on the Funds, such as performance of the economy as a whole and of specific industry sectors, changes in the levels of interest rates, the impact of developing world events, and other factors that may influence the future performance of the Funds. Management believes these forward-looking statements to be reasonable, although they are inherently uncertain and difficult to predict. Actual events may cause adjustments in portfolio management strategies from those currently expected to be employed.
A description of the policies and procedures that the Funds use to determine how to vote proxies relating to portfolio securities and information regarding how a Fund voted proxies relating to portfolio securities during the most recent 12-month period ended June 30 is available (i) without charge, upon request by calling 1-800-526-7384 (for Retail Shareholders) or 1-800-621-2550 (for Institutional Shareholders); and (ii) on the Securities and Exchange Commission (“SEC”) web site at http://www.sec.gov.
The Funds file their complete schedule of portfolio holdings with the SEC for the first and third quarters of each fiscal year on Form N-Qs. The Funds’ Form N-Qs are available on the SEC’s web site at http://www.sec.gov within 60 days after the Funds’ first and third fiscal quarters. The Funds’ Form N-Qs may be reviewed and copied at the SEC’s Public Reference Room in Washington, D.C. and information on the operation of the Public Reference Room may also be obtained by calling 1-800-SEC-0330. Form N-Qs may be obtained upon request and without charge by calling 1-800-526-7384 (for Retail Shareholders) or 1-800-621-2550 (for Institutional Shareholders).
Goldman, Sachs & Co. (‘‘Goldman Sachs’’) does not provide legal, tax or accounting advice. Any statement contained in this communication (including any attachments) concerning U.S. tax matters was not intended or written to be used, and cannot be used, for the purpose of avoiding penalties under the Internal Revenue Code, and was written to support the promotion or marketing of the transaction(s) or matter(s) addressed. Clients of Goldman Sachs should obtain their own independent tax advice based on their particular circumstances.
Fund holdings and allocations shown are as of February 28, 2017 and may not be representative of future investments. Fund holdings should not be relied on in making investment decisions and should not be construed as research or investment advice regarding particular securities. Current and future holdings are subject to risk.
The Global Industry Classification Standard (GICS) was developed by and is the exclusive property and a service mark of Morgan Stanley Capital International Inc. (MSCI) and Standard & Poor’s, a division of The McGraw-Hill Companies, Inc. (S&P) and is licensed for use by Goldman Sachs. Neither MSCI, S&P nor any other party involved in making or compiling the GICS or any GICS classifications makes any express or implied warranties or representations with respect to such standard or classification (or the results to be obtained by the use thereof), and all such parties hereby expressly disclaim all warranties of originality, accuracy, completeness, merchantability or fitness for a particular purpose with respect to any of such standard or classification. Without limiting any of the foregoing, in no event shall MSCI, S&P, any of their affiliates or any third party involved in making or compiling the GICS or any GICS classifications have any liability for any direct, indirect, special, punitive, consequential or any other damages (including lost profits) even if notified of the possibility of such damages.
The portfolio risk management process includes an effort to monitor and manage risk, but does not imply low risk.
This material is not authorized for distribution to prospective investors unless preceded or accompanied by a current Prospectus or summary prospectus, if applicable. Investors should consider a Fund’s objective, risks, and charges and expenses, and read the summary prospectus, if available, and/or the Prospectus carefully before investing or sending money. The summary prospectus, if available, and the Prospectus contain this and other information about a Fund and may be obtained from your Authorized Institution or from Goldman, Sachs & Co. by calling (retail – 1-800-526-7384) (institutional – 1-800-621-2550).
© 2017 Goldman Sachs. All rights reserved. 88025-TMPL-04/2017-514103 EQVALSAR-17/164K
Goldman Sachs Funds

| | | | |
| | |
| Semi-Annual Report | | | | February 28, 2017 |
| | |
| | | | Global Tax-Aware Equity Portfolios |
| | | | Enhanced Dividend Global Equity Portfolio |
| | | | Tax-Advantaged Global Equity Portfolio |

Goldman Sachs Global Tax-Aware Equity Portfolios
| ∎ | | ENHANCED DIVIDEND GLOBAL EQUITY PORTFOLIO |
| ∎ | | TAX-ADVANTAGED GLOBAL EQUITY PORTFOLIO |
| | | | |
TABLE OF CONTENTS | | | | |
| |
Market Review | | | 1 | |
| |
Portfolio Management Discussion and Performance Summaries | | | 5 | |
| |
Schedules of Investments | | | 16 | |
| |
Financial Statements | | | 19 | |
| |
Financial Highlights | | | 22 | |
| |
Notes to Financial Statements | | | 26 | |
| |
Other Information | | | 40 | |
| | | | |
| | | |
| NOT FDIC-INSURED | | May Lose Value | | No Bank Guarantee |
MARKET REVIEW
Goldman Sachs Global Tax-Aware Equity Portfolios
|
| |
| Investment Strategy |
| |
| The Portfolios invest in a strategic mix of Underlying Funds and other securities with the goal of achieving long-term growth of capital (both Portfolios) and current income (Goldman Sachs Enhanced Dividend Global Equity Portfolio only). Under normal conditions, at least 80% of the Portfolios’ total assets measured at the time of purchase will be allocated among the Underlying Funds that currently exist or that may become available for investment in the future for which Goldman Sachs Asset Management (“GSAM”) or an affiliate, now or in the future, acts as investment adviser or principal underwriter. Some of the Underlying Funds invest primarily in fixed income or money market instruments, and other Underlying Funds invest primarily in equity securities. The Portfolios may also invest directly in the Underlying Tactical Fund (as defined below) and other securities or instruments, including unaffiliated exchange-traded funds and derivatives, and can use these investments for implementing tactical tilts. Under normal circumstances, each of the Portfolios also has a small strategic allocation to U.S. investment grade corporate bonds, which is used to help fund the tactical tilts. |
Market Review
During the six months ended February 28, 2017 (the “Reporting Period”), the performance of the financial markets was influenced by unexpected political events in the U.S. and abroad as well as by global central bank monetary policy. In this environment, U.S. and international equities notched solid gains, while the broad fixed income market generally produced negative returns.
Equity Markets
As the Reporting Period began in early September 2016, U.S. and international equities alike fell as the European Central Bank (“ECB”) disappointed markets with its lack of commitment to extend quantitative easing. Later in the month, the Federal Reserve (the “Fed”) left its monetary policy unchanged, and the Bank of Japan (“BoJ”) introduced a 0% target for its 10-year government bond yield to exercise “yield curve control.” (The yield curve control framework is designed to steepen Japan’s government bond yield curve and alleviate the impact on financial institutions of low longer-term rates. Yield curve is a spectrum of maturities.) U.S. and international equities rebounded following the Fed and BoJ decisions, which the markets appeared to view as generally benign. In October 2016, a combination of hawkish Fed commentary and mounting strong U.S. economic data led to increased market pricing for a December 2016 interest rate hike. (Hawkish tends to suggest higher interest rates; opposite of dovish.) The U.S. Department of Commerce announced the U.S. Gross Domestic Product (“GDP”) increased by 3.5% on an annualized basis for the third quarter of 2016, above consensus expectations and the strongest growth rate in two years. Meanwhile, ECB minutes stressed a commitment to ongoing monthly bond-buying of 80 billion euros through at least March 2017, helping to dispel market concerns about potential tapering. The U.K.’s first official GDP growth figure since the Brexit referendum, the U.K.’s June 2016 vote to leave the European Union, was more robust than consensus-expected at 0.5%. Japanese equities enjoyed strong performance owing to weakness in the Japanese yen, as BoJ governor Haruhiko Kuroda stated there was room for further easing if necessary to achieve the BoJ’s 2% inflation target. Following the unexpected victory of Donald Trump in the November 2016 U.S. elections, U.S. and international equities rallied on anticipation of a pro-growth effect of
1
MARKET REVIEW
Mr. Trump’s fiscal stimulus plan, though international equities recorded a modest decline for the month overall. The Fed raised rates 0.25% in December 2016, for the first time in a year but as had largely been anticipated, and set a more hawkish rate hike path for 2017. Although U.S. equities declined modestly after the announcement, they advanced for December 2016 overall. International equities also posted solid gains during the month, which was highlighted by the resignation of Prime Minister Matteo Renzi after Italian voters’ rejection of that nation’s constitutional reform referendum and the ECB’s decision to slow its monthly pace of quantitative easing while extending the program to the end of 2017.
In January 2017, investors searched for details on the timing and scope behind President Trump’s proclamations during his press conferences, inaugural speech and first days in office. In this environment, U.S. and international equities rallied to new highs on the prospect of deregulation following executive orders on oil pipelines and on optimism around infrastructure spending after a $1 trillion proposal from Senate Democrats made headlines. U.S. and international equities subsequently retreated on political uncertainty and market concerns about protectionism following President Trump’s executive orders on immigration, a border wall and U.S. withdrawal from the Trans-Pacific Partnership, popularly known as TPP. Amid a busy political agenda, U.S. economic data released in January 2017 remained encouraging. U.K. equities fell after a speech by Prime Minister Theresa May was interpreted by the markets as increasing the possibility of a “hard Brexit.” (In a hard Brexit, the U.K. would leave the European Union, as well as its single market for goods, quickly and completely.) In France, allegations about the employment in parliament of presidential candidate Francois Fillon’s wife increased uncertainty about the country’s upcoming election. The Japanese yen appreciated sharply, and Japanese equities retreated.
In February 2017, U.S. and international equities posted gains, as investors continued to assess the outlook for potential tax reform, deregulation and other economic policies out of the Trump administration, while also heeding the tone of Fed officials. The U.S. dollar strengthened during the month, as the market-implied probability of a March 2017 interest rate hike increased with Fed Chair Janet Yellen’s testimony before Congress and hawkish comments from other Fed officials. Solid U.S. economic data also supported the market’s advance, with the Institute of Supply Management’s manufacturing and non-manufacturing indices rising to a two-year and six-year high, respectively, during February 2017. Meanwhile, the Markit Eurozone Composite Flash Purchasing Managers’ Index (“PMI”) reached its highest level in nearly six years.
Fixed Income Markets
During September 2016, spread, or non-government bond, sectors outperformed U.S. Treasury securities. The Fed kept the target range for the federal funds rate unchanged at its September 2016 policy meeting after a summer of speeches by Fed officials that fluctuated between dovish and hawkish tones. The ECB also left its monetary policy unchanged during the month, while the BoJ extended its quantitative and qualitative monetary easing framework to include “yield curve control.”
In the fourth quarter of 2016, spread sectors generally outpaced U.S. Treasury securities. In early November 2016, Donald Trump’s victory in the U.S. Presidential election led to a change in investor expectations for future monetary, fiscal and regulatory policy. More specifically, investors appeared to anticipate fiscal stimulus, a looser regulatory agenda and a faster pace of Fed monetary policy tightening. After the U.S. election, global interest rates rose and the U.S. dollar strengthened versus other developed markets and emerging markets currencies.
2
MARKET REVIEW
Meanwhile, the U.S. economy continued to strengthen, with strong jobs growth and increased consumer spending reported. In December 2016, the Fed raised the targeted federal funds rate 0.25% to a range of between 0.50% and 0.75%. The rate hike resulted in a further rise in U.S. Treasury yields, with a notable increase in shorter-term yields, and additional appreciation in the U.S. dollar. In Europe, the ECB announced it would reduce its monthly pace of asset purchases starting in April 2017 but stated it would extend its quantitative easing program to the end of 2017. On the political front, Italy voted to reject constitutional reforms, while the outcome of Austria’s election defied the populist tide that had claimed victories in the U.K. and U.S. during 2016. In the fourth quarter of 2016, the Japanese economy expanded by 1.2%, annualized, from the previous calendar quarter. Crude oil prices rose following an agreement by the Organization of the Petroleum Exporting Countries (“OPEC”) and non-OPEC producers to cut production, which provided support for energy issuers within the corporate credit market as well as for oil-exporting emerging economies.
During January 2017, spread sectors generally outperformed U.S. Treasury securities. The U.S. dollar fluctuated on comments from President Trump as well as on protectionist measures, such as the U.S. withdrawal from the TPP. Major developed markets’ central banks kept monetary policy unchanged at their first meetings of the year. Global economic activity improved, with the global manufacturing PMI rising for a fifth consecutive month, driven mainly by emerging markets countries.
Most spread sectors outpaced U.S. Treasury securities during February 2017, with improved global economic growth and a recovery in commodity prices providing support to riskier asset classes, including high yield corporate bonds. Strong U.S. economic data and hawkish comments from Fed policymakers increased market expectations for an interest rate hike in March 2017. In Europe, uncertainty surrounding upcoming political events clouded marginal improvements in economic data. U.K. economic data, which had been resilient since the Brexit vote, began to deteriorate.
Looking Ahead
At the end of the Reporting Period, our views were based primarily on our three strongest convictions. First, we believe that relative to the rest of the world, the U.S. economy has the best potential to strengthen in 2017. Second, we think economic growth and monetary policy across countries is continuing to diverge. Third, we anticipate volatility in the financial markets to trend higher.
During 2017, we expect global economic growth to pick up, led by the U.S. and followed by Japan. The U.S. economy was already strengthening, in our view, before the November 2016 election, and we believe proposed fiscal stimulus and the potential loosening of regulations could provide additional support. We see the U.S. economy growing 2.3% in 2017, with consumption underpinned in the near term by rising wages amid a labor market near full employment. (Full employment means the highest amount of skilled and unskilled labor that can be employed within an economy at any given time.) We also see scope for marginal improvements in business investment. That said, we remain alert to potential policy changes
3
MARKET REVIEW
and geopolitical tensions, largely related to a more protectionist stance on trade, that might be associated with the Trump administration. We will also closely monitor inflationary pressures arising from potential fiscal expansion, deregulation and trade policy changes as well as the recent rebound in commodity prices. Should overall U.S. financial conditions remain supportive for economic growth, we expect the Fed to raise interest rates at least three times in 2017.
Outside the U.S., we think innovative central bank monetary policy and modest fiscal stimulus will likely continue to support Japan’s economic growth. In Europe, we expect political uncertainties to weigh on its growth outlook, particularly after the Brexit process commences.
4
PORTFOLIO RESULTS
Goldman Sachs Enhanced Dividend
Global Equity Portfolio
Investment Objective
The Portfolio seeks long-term growth of capital and current income.
Portfolio Management Discussion and Analysis
Below, the Goldman Sachs Quantitative Investment Strategies Team discusses the Goldman Sachs Enhanced Dividend Global Equity Portfolio’s (the “Portfolio”) performance and positioning for the six-month period ended February 28, 2017 (the “Reporting Period”).
| Q | | How did the Portfolio perform during the Reporting Period? |
| A | | During the Reporting Period, the Portfolio’s Class A and Institutional Shares generated cumulative total returns, without sales charges, of 7.29% and 7.46%, respectively. These returns compare to the 6.65% cumulative total return of the Portfolio’s blended benchmark, the Enhanced Dividend Global Equity Composite Index (“EDGE Composite Index”), over the same time period. The components of the EDGE Composite Index generated cumulative total returns of -2.19% and 7.66% for the Bloomberg Barclays U.S. Aggregate Bond Index and the MSCI All Country World Index (ACWI) Investable Market Index® (“MSCI ACWI IMI”), respectively, during the Reporting Period. |
| Q | | What key factors affected the Portfolio’s performance during the Reporting Period? |
| A | | During the Reporting Period, the Portfolio benefited from its strategic weightings and tactical asset allocation decisions (“tactical tilts”). The performance of the Underlying Funds detracted from the Portfolio’s performance versus the EDGE Composite Index. |
| Q | | How were the Portfolio’s tactical asset allocation decisions managed during the Reporting Period? |
| A | | In keeping with our investment process, we develop views regarding near-term expected market returns and implement tactical tilts in an attempt to enhance performance. These tactical tilts are implemented through an investment in the Goldman Sachs Tactical Tilt Overlay Fund (the “Underlying Tactical Fund”), which seeks long-term total return through the implementation of investment ideas that are generally derived from short-term or medium-term market views on a variety of asset classes and instruments. As mentioned previously, the Portfolio’s tactical tilts added to its results during the Reporting Period. |
| Q | | How did the Portfolio’s Underlying Funds perform relative to their respective benchmark indices during the Reporting Period? |
| A | | To implement our strategic and tactical asset allocation decisions, the Portfolio invests in eight Underlying Funds. Seven of these Underlying Funds may be used to implement strategic asset allocation decisions (“Underlying Strategic Funds”). The Underlying Tactical Fund, as mentioned previously, is used to implement tactical tilts. |
| | During the Reporting Period, the Portfolio was invested in six of the seven Underlying Strategic Funds, three of which outperformed their respective benchmark indices. (The Portfolio did not have an allocation to the Goldman Sachs Core Fixed Income Fund during the Reporting Period.) The Goldman Sachs Emerging Markets Equity Insights Fund, the Goldman Sachs MLP Energy Infrastructure Fund and the Goldman Sachs International Small Cap Insights Fund outperformed their respective benchmark indices. |
| | The Goldman Sachs U.S. Equity Dividend and Premium Fund, the Goldman Sachs International Equity Dividend and Premium Fund and the Goldman Sachs Small Cap Equity Insights Fund underperformed their respective benchmark indices during the Reporting Period. Two of these Underlying Strategic Funds that underperformed in relative terms — the Goldman Sachs U.S. Equity Dividend and Premium Fund and the Goldman Sachs International Equity Dividend and Premium Fund — are those in which the Portfolio invested a significant percentage of its equity allocation. |
| | The Portfolio’s Underlying Tactical Fund outperformed its benchmark index by more than 250 basis points1 during the Reporting Period. (A basis point is 1/100th of a percent.) |
| | 1 | | Performance quoted is for Institutional Shares. |
5
PORTFOLIO RESULTS
| Q | | How did call writing affect performance? |
| A | | As mentioned above, the Portfolio’s two largest allocations were to the Goldman Sachs U.S. Equity Dividend and Premium Fund and the Goldman Sachs International Equity Dividend and Premium Fund, which earn premiums through an equity index call writing strategy. When equity markets are down, flat or only modestly positive, these Underlying Strategic Funds tend to outperform their respective benchmark indices because of the premiums they earn from call writing. When equity markets rally strongly, these two Underlying Strategic Funds are likely to trail their respective benchmark indices. Although the Underlying Strategic Funds keep the premiums they earn from call writing, they can underperform when the call options are exercised. |
| | As the U.S. and international equity markets advanced during the Reporting Period, the call writing strategies of the Goldman Sachs U.S. Equity Dividend and Premium Fund and the Goldman Sachs International Equity Dividend and Premium Fund detracted from performance. |
| Q | | How did the Portfolio use derivatives and similar instruments during the Reporting Period? |
| A | | The Portfolio used forward foreign currency exchange contracts to obtain exposure to the British pound, euro, Australian dollar, Swiss franc and Japanese yen. Collectively, these forward foreign currency exchange contracts added slightly to relative returns. |
| | The Portfolio also employed Standard & Poor’s 500® Index (“S&P 500® Index”) futures as part of its strategic weightings in U.S. large-cap growth stocks and U.S. large-cap value stocks. Overall, the Portfolio’s strategic weightings contributed positively to its performance. In addition, some of the Portfolio’s Underlying Funds, including the Portfolio’s Underlying Tactical Fund, used derivatives during the Reporting Period to apply their active investment views with greater versatility or to afford greater risk management precision. As market conditions warranted during the Reporting Period, some of these Underlying Funds engaged in forward foreign currency exchange contracts, financial futures contracts, options and swap contracts to enhance portfolio return and for hedging purposes. |
| Q | | What changes did you make during the Reporting Period within the Portfolio? |
| A | | No significant changes were made within the Portfolio during the Reporting Period. |
| Q | | What was the Portfolio’s strategy at the end of the Reporting Period? |
| A | | Going forward, we plan to maintain a diversified equity portfolio that implements our strategic and tactical views as we continue to seek long-term growth of capital and current income. |
6
FUND BASICS
Enhanced Dividend Global Equity Portfolio
as of February 28, 2017
| | | | | | | | | | | | | | | | | | |
| | PERFORMANCE REVIEW | |
| | | September 1, 2016–February 28, 2017 | | Portfolio Total Return
(based on NAV)1 | | | EDGE
Composite
Index2 | | | Bloomberg
Barclays U.S.
Aggregate Bond
Index3 | | | MSCI ACWI
IMI4 | |
| | Class A | | | 7.29 | % | | | 6.65 | % | | | -2.19 | % | | | 7.66 | % |
| | | Institutional | | | 7.46 | | | | 6.65 | | | | -2.19 | | | | 7.66 | |
| | 1 | | The net asset value (“NAV”) represents the net assets of the class of the Portfolio (ex-dividend) divided by the total number of shares of the class outstanding. The Portfolio’s performance reflects the reinvestment of dividends and other distributions. The Portfolio’s performance does not reflect the deduction of any applicable sales charges. |
| | 2 | | The EDGE Composite Index (“EDGE Composite”) is a composite representation prepared by the investment adviser of the performance of the Portfolio’s asset classes weighted according to their respective weightings in the Portfolio’s target range. |
| | | | The EDGE Composite is comprised of MSCI ACWI IMI (90%) and the Bloomberg Barclays U.S. Aggregate Bond Index (10%). The EDGE Composite figures do not reflect any deduction for fees, expenses or taxes. |
| | 3 | | The Bloomberg Barclays U.S. Aggregate Bond Index represents an unmanaged diversified portfolio of fixed income securities, including U.S. Treasuries, investment grade corporate bonds and mortgage backed and asset-backed securities. |
| | 4 | | The MSCI ACWI IMI captures large, mid and small cap representation across 23 developed markets and 23 emerging markets. With 8,605 constituents, the MSCI ACWI IMI is comprehensive, covering approximately 99% of the global equity investment opportunity set. As of February 28, 2017, the 23 developed markets in the MSCI ACWI IMI include Australia, Austria, Belgium, Canada, Denmark, Finland, France, Germany, Hong Kong, Ireland, Israel, Italy, Japan, Netherlands, New Zealand, Norway, Portugal, Singapore, Spain, Sweden, Switzerland, the U.K. and the U.S. The 23 emerging markets include Brazil, Chile, China, Colombia, Czech Republic, Egypt, Greece, Hungary, India, Indonesia, South Korea, Malaysia, Mexico, Peru, Philippines, Poland, Russia, Qatar, South Africa, Taiwan, Thailand, Turkey and United Arab Emirates. |
| | | | | | | | | | | | | | | | |
| | STANDARDIZED TOTAL RETURNS5 |
| | | For the period ended 12/31/16 | | One Year | | | Five Years | | | Since Inception | | | Inception Date |
| | Class A | | | 3.85 | % | | | 7.57 | % | | | 4.29 | % | | 4/30/08 |
| | | Institutional | | | 10.30 | | | | 9.25 | | | | 5.41 | | | 4/30/08 |
| | 5 | | The Standardized Total Returns are average annual total returns or cumulative total returns (only if the performance period is one year or less) as of the most recent calendar quarter-end. They assume reinvestment of all distributions at NAV. These returns reflect a maximum initial sales charge of 5.5% for Class A Shares. Because Institutional Shares do not involve a sales charge, such a charge is not applied to their Standardized Total Returns. |
The returns set forth in the tables above represent past performance. Past performance does not guarantee future results. The Portfolio’s investment return and principal value will fluctuate so that an investor’s shares, when redeemed, may be worth more or less than their original cost. Current performance may be lower or higher than the performance quoted above. Please visit our web site at www.GSAMFUNDS.com to obtain the most recent month-end returns. Performance reflects applicable fee waivers and/or expense limitations in effect during the periods shown. In their absence, performance would be reduced. Returns do not reflect the deduction of taxes that a shareholder would pay on Portfolio distributions or the redemption of Portfolio shares.
7
FUND BASICS
| | | | | | | | | | |
| | EXPENSE RATIOS6 | |
| | | | | Net Expense Ratio (Current) | | | Gross Expense Ratio (Before Waivers) | |
| | Class A | | | 1.37 | % | | | 1.48 | % |
| | | Institutional | | | 0.97 | | | | 1.08 | |
| | 6 | | The expense ratios of the Portfolio, both current (net of applicable fee waivers and/or expense limitations) and before waivers (gross of applicable fee waivers and/or expense limitations), are as set forth above according to the most recent publicly available Prospectus for the Portfolio and may differ from the expense ratios disclosed in the Financial Highlights in this report. Pursuant to a contractual arrangement, the Portfolio’s waivers and/or expense limitations will remain in place through at least December 29, 2017, and prior to such date the Investment Adviser may not terminate the arrangements without the approval of the Portfolio’s Board of Trustees. If these arrangements are discontinued in the future, the expense ratios may change without shareholder approval. |
| | | | | | | | | | | | | | |
| | STANDARDIZED AFTER-TAX PERFORMANCE AS OF 12/31/167 | |
| | | Class A Shares | | One Year | | | Five Years | | | Since Inception
(4/30/08) | |
| | Return before taxes* | | | 3.85 | % | | | 7.57 | % | | | 4.29 | % |
| | Return after taxes on distributions** | | | 3.19 | | | | 6.38 | | | | 3.44 | |
| | | Return after taxes on distributions***
and sale of Portfolio shares | | | 2.73 | | | | 5.85 | | | | 3.33 | |
| 7 | | The after-tax returns are calculated using the historically highest individual federal marginal income tax rates at the time of distributions (currently 23.8% for qualifying ordinary income dividends and long-term capital gain distributions and 43.4% for non-qualifying ordinary income dividends) and do not reflect state and local taxes. Actual after-tax returns will be calculated at calendar year-end and depend on an investor’s tax situation and may differ from those shown. In addition, the after-tax returns shown are not relevant to investors who hold Portfolio shares through tax-deferred arrangements such as 401(k) plans or individual retirement accounts. Under certain circumstances, the addition of the tax benefits from capital losses resulting from redemptions may cause the Returns After Taxes on Distributions and Sale of Portfolio Shares to be greater than the Returns After Taxes on Distributions or even Returns Before Taxes. Standardized after-tax returns assume reinvestment of all distributions at NAV and reflect a maximum initial sales charge of 5.5% for Class A Shares. |
| * | | Returns Before Taxes do not reflect taxes on distributions on the Portfolio’s Class A Shares nor do they show how performance can be impacted by taxes when shares are redeemed. |
| ** | | Returns After Taxes on Distributions assume that taxes are paid on distributions on the Portfolio’s Class A Shares (i.e., dividends and capital gains) but do not reflect taxes that may be incurred upon redemption of the Class A Shares at the end of the performance period. |
| *** | | Returns After Taxes on Distributions and Sale of Portfolio Shares reflect taxes paid on distributions on the Portfolio’s Class A Shares and taxes applicable when the shares are redeemed. |
8
FUND BASICS
| | |
| | OVERALL UNDERLYING FUND WEIGHTINGS8* |
| | | Percentage of Net Assets |
| 8 | | The Portfolio is actively managed and, as such, its composition may differ over time. The percentage shown for each Underlying Fund reflects the value of that Underlying Fund as a percentage of net assets of the Portfolio. Figures in the graph above may not sum to 100% due to rounding and/or exclusion of other assets and liabilities. The above graph depicts the Portfolio’s investments but may not represent the Portfolio’s market exposure due to the exclusion of certain derivatives, if any, as listed in the Additional Investment Information section of the Schedule of Investments. |
| * | | Represents affiliated Funds. |
9
PORTFOLIO RESULTS
Goldman Sachs Tax-Advantaged
Global Equity Portfolio
Investment Objective
The Portfolio seeks long-term growth of capital.
Portfolio Management Discussion and Analysis
Below, the Goldman Sachs Quantitative Investment Strategies Team discusses the Goldman Sachs Tax-Advantaged Global Equity Portfolio’s (the “Portfolio”) performance and positioning for the six-month period ended February 28, 2017 (the “Reporting Period”).
| Q | | How did the Portfolio perform during the Reporting Period? |
| A | | During the Reporting Period, the Portfolio’s Class A and Institutional Shares generated cumulative total returns, without sales charges, of 9.07% and 9.37%, respectively. These returns compare to the 6.65% cumulative total return of the Portfolio’s blended benchmark, the Tax-Advantaged Global Equity Composite Index (“TAG Composite Index”), over the same time period. The components of the TAG Composite Index generated cumulative total returns of -2.19% and 7.66% for the Bloomberg Barclays U.S. Aggregate Bond Index and the MSCI All Country World Index (ACWI) Investable Market Index® (“MSCI ACWI IMI”), respectively, during the Reporting Period. |
| Q | | What key factors affected the Portfolio’s performance during the Reporting Period? |
| A | | During the Reporting Period, the Portfolio benefited from its strategic weightings and tactical asset allocation decisions (“tactical tilts”). The performance of the Underlying Funds also added to the Portfolio’s performance versus the TAG Composite Index. |
| Q | | How were the Portfolio’s tactical asset allocation decisions managed during the Reporting Period? |
| A | | In keeping with our investment process, we develop views regarding near-term expected market returns and implement tactical tilts in an attempt to enhance performance. These tactical tilts are implemented through an investment in the Goldman Sachs Tactical Tilt Overlay Fund (the “Underlying Tactical Fund”), which seeks long-term total return through the implementation of investment ideas that are generally derived from short-term or medium-term market views on a variety of asset classes and instruments. As mentioned previously, the Portfolio’s tactical tilts contributed positively to performance during the Reporting Period. |
| Q | | How did the Portfolio’s Underlying Funds perform relative to their respective benchmark indices during the Reporting Period? |
| A | | To implement our strategic and tactical asset allocation decisions, the Portfolio invests in seven Underlying Funds. Six of these Underlying Funds may be used to implement strategic asset allocation decisions (“Underlying Strategic Funds”). The Underlying Tactical Fund, as mentioned previously, is used to implement tactical tilts. |
| | During the Reporting Period, the Portfolio was invested in five of the six Underlying Strategic Funds, all of which outperformed their respective benchmark indices. (The Portfolio did not have an allocation to the Goldman Sachs Core Fixed Income Fund during the Reporting Period.) |
| | Two of the Underlying Strategic Funds that outperformed in relative terms — the Goldman Sachs U.S. Tax-Managed Equity Fund and the Goldman Sachs International Tax-Managed Equity Fund — are those in which the Portfolio held its largest weightings. In addition, the Goldman Sachs Emerging Markets Equity Insights Fund, the Goldman Sachs MLP Energy Infrastructure Fund and the Goldman Sachs International Small Cap Insights Fund outperformed their respective benchmark indices. |
| | The Portfolio’s Underlying Tactical Fund outperformed its benchmark index by more than 250 basis points1 during the Reporting Period. (A basis point is 1/100th of a percent.) |
| | 1 | | Performance quoted is for Institutional Shares. |
10
PORTFOLIO RESULTS
| Q | | How did the Portfolio use derivatives and similar instruments during the Reporting Period? |
| A | | The Portfolio used forward foreign currency exchange contracts to obtain exposure to the British pound, euro, Australian dollar, Swiss franc and Japanese yen. Collectively, these forward foreign currency exchange contracts added slightly to relative returns. |
| | The Portfolio also employed Standard & Poor’s 500® Index (“S&P 500® Index”) futures as part of its strategic weightings in U.S. large-cap growth stocks and U.S. large-cap value stocks. Overall, the Portfolio’s strategic weightings contributed positively to performance. In addition, some of the Portfolio’s Underlying Funds, including the Portfolio’s Underlying Tactical Fund, used derivatives during the Reporting Period to apply their active investment views with greater versatility or to afford greater risk management precision. As market conditions warranted during the Reporting Period, some of these Underlying Funds engaged in forward foreign currency exchange contracts, financial futures contracts, options and swap contracts to enhance portfolio return and for hedging purposes. |
| Q | | What changes did you make during the Reporting Period within the Portfolio? |
| A | | No significant changes were made within the Portfolio during the Reporting Period. |
| Q | | What was the Portfolio’s strategy at the end of the Reporting Period? |
| A | | Going forward, we plan to maintain a diversified equity portfolio that implements our strategic and tactical views as we continue to seek long-term growth of capital. |
11
FUND BASICS
Tax-Advantaged Global Equity Portfolio
as of February 28, 2017
| | | | | | | | | | | | | | | | | | |
| | PERFORMANCE REVIEW | |
| | | September 1, 2016–February 28, 2017 | | Portfolio Total Return
(based on NAV)1 | | | TAG
Composite
Index2 | | | Bloomberg
Barclays U.S.
Aggregate
Bond Index3 | | | MSCI ACWI
IMI4 | |
| | Class A | | | 9.07 | % | | | 6.65 | % | | | -2.19 | % | | | 7.66 | % |
| | | Institutional | | | 9.37 | | | | 6.65 | | | | -2.19 | | | | 7.66 | |
| | 1 | | The net asset value (“NAV”) represents the net assets of the class of the Portfolio (ex-dividend) divided by the total number of shares of the class outstanding. The Portfolio’s performance reflects the reinvestment of dividends and other distributions. The Portfolio’s performance does not reflect the deduction of any applicable sales charges. |
| | 2 | | The TAG Composite Index (“TAG Composite”) is a composite representation prepared by the investment adviser of the performance of the Portfolio’s asset classes weighted according to their respective weightings in the Portfolio’s target range. |
| | | | The TAG Composite is comprised of the MSCI ACWI IMI (90%) and the Bloomberg Barclays U.S. Aggregate Bond Index (10%). The TAG Composite figures do not reflect any deduction for fees, expenses or taxes. |
| | 3 | | The Bloomberg Barclays U.S. Aggregate Bond Index represents an unmanaged diversified portfolio of fixed income securities, including U.S. Treasuries, investment grade corporate bonds and mortgage-backed and asset-backed securities. |
| | 4 | | The MSCI ACWI IMI captures large, mid and small cap representation across 23 developed markets and 23 emerging markets. With 8,605 constituents, the MSCI ACWI IMI is comprehensive, covering approximately 99% of the global equity investment opportunity set. As of February 28, 2017, the 23 developed markets in the MSCI ACWI IMI include Australia, Austria, Belgium, Canada, Denmark, Finland, France, Germany, Hong Kong, Ireland, Israel, Italy, Japan, Netherlands, New Zealand, Norway, Portugal, Singapore, Spain, Sweden, Switzerland, the U.K. and the U.S. The 23 emerging markets include Brazil, Chile, China, Colombia, Czech Republic, Egypt, Greece, Hungary, India, Indonesia, South Korea, Malaysia, Mexico, Peru, Philippines, Poland, Russia, Qatar, South Africa, Taiwan, Thailand, Turkey and United Arab Emirates. |
| | | | | | | | | | | | | | | | |
| | STANDARDIZED TOTAL RETURNS5 |
| | | For the period ended 12/31/16 | | One Year | | | Five Years | | | Since Inception | | | Inception Date |
| | Class A | | | 1.72 | % | | | 9.69 | % | | | 4.71 | % | | 4/30/08 |
| | | Institutional | | | 8.02 | | | | 11.39 | | | | 5.81 | | | 4/30/08 |
| | 5 | | The Standardized Total Returns are average annual total returns or cumulative total returns (only if the performance period is one year or less) as of the most recent calendar quarter-end. They assume reinvestment of all distributions at NAV. These returns reflect a maximum initial sales charge of 5.5% for Class A Shares. Because Institutional Shares do not involve a sales charge, such a charge is not applied to their Standardized Total Returns. |
The returns set forth in the tables above represent past performance. Past performance does not guarantee future results. The Portfolio’s investment return and principal value will fluctuate so that an investor’s shares, when redeemed, may be worth more or less than their original cost. Current performance may be lower or higher than the performance quoted above. Please visit our web site at www.GSAMFUNDS.com to obtain the most recent month-end returns. Performance reflects applicable fee waivers and/or expense limitations in effect during the periods shown. In their absence, performance would be reduced. Returns do not reflect the deduction of taxes that a shareholder would pay on Portfolio distributions or the redemption of Portfolio shares.
12
FUND BASICS
| | | | | | | | | | |
| | EXPENSE RATIOS6 | |
| | | | | Net Expense Ratio (Current) | | | Gross Expense Ratio (Before Waivers) | |
| | Class A | | | 1.36 | % | | | 1.44 | % |
| | | Institutional | | | 0.96 | | | | 1.04 | |
| | 6 | | The expense ratios of the Portfolio, both current (net of applicable fee waivers and/or expense limitations) and before waivers (gross of applicable fee waivers and/or expense limitations) are as set forth above according to the most recent publicly available Prospectus for the Portfolio and may differ from the expense ratios disclosed in the Financial Highlights in this report. Pursuant to a contractual arrangement, the Portfolio’s waivers and/or expense limitations will remain in place through at least December 29, 2017, and prior to such date the Investment Adviser may not terminate the arrangements without the approval of the Portfolio’s Board of Trustees. If these arrangements are discontinued in the future, the expense ratios may change without shareholder approval. |
| | | | | | | | | | | | | | |
| | STANDARDIZED AFTER-TAX PERFORMANCE AS OF 12/31/167 | |
| | | Class A Shares | | One Year | | | Five Years | | | Since Inception
(4/30/08) | |
| | Return before taxes* | | | 1.72 | % | | | 9.69 | % | | | 4.71 | % |
| | Return after taxes on distributions** | | | 1.59 | | | | 9.16 | | | | 4.28 | |
| | | Return after taxes on distributions***
and sale of Portfolio shares | | | 1.14 | | | | 7.61 | | | | 3.67 | |
| 7 | | The after-tax returns are calculated using the historically highest individual federal marginal income tax rates at the time of distributions (currently 23.8% for qualifying ordinary income dividends and long-term capital gain distributions and 43.4% for non-qualifying ordinary income dividends) and do not reflect state and local taxes. Actual after-tax returns will be calculated at calendar year-end and depend on an investor’s tax situation and may differ from those shown. In addition, the after-tax returns shown are not relevant to investors who hold Portfolio shares through tax-deferred arrangements such as 401(k) plans or individual retirement accounts. Under certain circumstances, the addition of the tax benefits from capital losses resulting from redemptions may cause the Returns After Taxes on Distributions and Sale of Portfolio Shares to be greater than the Returns After Taxes on Distributions or even Returns Before Taxes. Standardized after-tax returns assume reinvestment of all distributions at NAV and reflect a maximum initial sales charge of 5.5% for Class A Shares. |
| * | | Returns Before Taxes do not reflect taxes on distributions on the Portfolio’s Class A Shares nor do they show how performance can be impacted by taxes when shares are redeemed. |
| ** | | Returns After Taxes on Distributions assume that taxes are paid on distributions on the Portfolio’s Class A Shares (i.e., dividends and capital gains) but do not reflect taxes that may be incurred upon redemption of the Class A Shares at the end of the performance period. |
| *** | | Returns After Taxes on Distributions and Sale of Portfolio Shares reflect taxes paid on distributions on the Portfolio’s Class A Shares and taxes applicable when the shares are redeemed. |
13
FUND BASICS
| | | | |
| | OVERALL UNDERLYING FUND WEIGHTINGS8* |
| | | Percentage of Net Assets |
| 8 | | The Portfolio is actively managed and, as such, its composition may differ over time. The percentage shown for each Underlying Fund reflects the value of that Underlying Fund as a percentage of net assets of the Portfolio. Figures in the graph above may not sum to 100% due to rounding and/or exclusion of other assets and liabilities. The above graph depicts the Portfolio’s investments but may not represent the Portfolio’s market exposure due to the exclusion of certain derivatives, if any, as listed in the Additional Investment Information section of the Schedule of Investments. |
| * | | Represents affiliated Funds. |
14
GOLDMAN SACHS GLOBAL TAX-AWARE EQUITY PORTFOLIOS
Index Definitions
The S&P 500® Index is the Standard & Poor’s 500 Composite Index of 500 stocks, an unmanaged index of common stock prices. The Index figures do not reflect any deduction for fees, expenses or taxes. It is not possible to invest directly in an index.
15
GOLDMAN SACHS ENHANCED DIVIDEND GLOBAL EQUITY PORTFOLIO
Schedule of Investments
February 28, 2017 (Unaudited)
| | | | | | | | |
Shares | | | Description | | Value | |
| Underlying Funds (Institutional Shares)(a) – 99.0% | |
| Equity – 99.0% | |
| | 19,668,141 | | | Goldman Sachs U.S. Equity Dividend and Premium Fund | | $ | 247,228,527 | |
| | 20,529,731 | | | Goldman Sachs International Equity Dividend and Premium Fund | | | 136,317,414 | |
| | 5,676,389 | | | Goldman Sachs Tactical Tilt Overlay Fund | | | 55,685,377 | |
| | 1,989,315 | | | Goldman Sachs Small Cap Equity Insights Fund | | | 46,888,146 | |
| | 3,819,609 | | | Goldman Sachs Emerging Markets Equity Insights Fund | | | 34,032,721 | |
| | 3,794,206 | | | Goldman Sachs MLP Energy Infrastructure Fund | | | 32,554,287 | |
| | 2,013,489 | | | Goldman Sachs International Small Cap Insights Fund | | | 22,289,322 | |
| | |
| | TOTAL INVESTMENTS – 99.0% | | | | |
| | (Cost $493,144,194) | | $ | 574,995,794 | |
| | |
| OTHER ASSETS IN EXCESS OF
LIABILITIES – 1.0% | | | 5,849,704 | |
| | |
| | NET ASSETS – 100.0% | | $ | 580,845,498 | |
| | |
| | |
| The percentage shown for each investment and investment category reflects the value of the respective investment or category as a percentage of net assets. |
(a) | | Represents affiliated Funds. |
| | |
|
Investment Abbreviations: |
AUD | | —Australian Dollar |
CHF | | —Swiss Franc |
EUR | | —Euro |
GBP | | —British Pound |
JPY | | —Japanese Yen |
USD | | —United States Dollar |
|
|
| ADDITIONAL INVESTMENT INFORMATION |
FORWARD FOREIGN CURRENCY EXCHANGE CONTRACTS — At February 28, 2017, the Portfolio had the following forward foreign currency exchange contracts:
FORWARD FOREIGN CURRENCY EXCHANGE CONTRACTS WITH UNREALIZED GAIN
| | | | | | | | | | | | | | | | | | | | | | | | |
| Counterparty | | Currency Purchased | | | Currency Sold | | | Settlement Date | | | Current Value | | | Unrealized Gain | |
Morgan Stanley Co., Inc. | | USD | | | 5,953,167 | | | CHF | | | 5,960,844 | | | | 03/15/17 | | | $ | 5,939,405 | | | $ | 13,762 | |
| | USD | | | 19,747,189 | | | EUR | | | 18,264,225 | | | | 03/15/17 | | | | 19,360,182 | | | | 387,007 | |
| | | USD | | | 12,733,490 | | | GBP | | | 10,069,415 | | | | 03/15/17 | | | | 12,498,332 | | | | 235,158 | |
| TOTAL | | | | | | | | | | | | | | $ | 635,927 | |
FORWARD FOREIGN CURRENCY EXCHANGE CONTRACTS WITH UNREALIZED LOSS
| | | | | | | | | | | | | | | | | | | | | | | | |
| Counterparty | | Currency Purchased | | | Currency Sold | | | Settlement Date | | | Current Value | | | Unrealized Loss | |
Morgan Stanley Co., Inc. | | USD | | | 5,589,590 | | | AUD | | | 7,529,962 | | | | 03/15/17 | | | $ | 5,771,388 | | | $ | (181,798 | ) |
| | USD | | | 454,110 | | | CHF | | | 460,000 | | | | 03/15/17 | | | | 458,346 | | | | (4,236 | ) |
| | USD | | | 3,005,035 | | | EUR | | | 2,840,000 | | | | 03/15/17 | | | | 3,010,416 | | | | (5,381 | ) |
| | USD | | | 890,128 | | | GBP | | | 720,000 | | | | 03/15/17 | | | | 893,676 | | | | (3,548 | ) |
| | | USD | | | 18,041,427 | | | JPY | | | 2,050,272,100 | | | | 03/15/17 | | | | 18,258,446 | | | | (217,019 | ) |
| TOTAL | | | | | | | | | | $ | (411,982 | ) |
| | |
| 16 | | The accompanying notes are an integral part of these financial statements. |
GOLDMAN SACHS ENHANCED DIVIDEND GLOBAL EQUITY PORTFOLIO
|
| ADDITIONAL INVESTMENT INFORMATION (continued) |
FUTURES CONTRACTS — At February 28, 2017, the Portfolio had the following futures contracts:
| | | | | | | | | | | | |
| | |
| Type | | Number of
Contracts
Long (Short) | | Expiration
Date | | Current
Value | | | Unrealized
Gain (Loss) | |
S&P 500 E-Mini Index | | 48 | | March 2017 | | $ | 5,670,720 | | | $ | 269,215 | |
| | |
| The accompanying notes are an integral part of these financial statements. | | 17 |
GOLDMAN SACHS TAX-ADVANTAGED GLOBAL EQUITY PORTFOLIO
Schedule of Investments
February 28, 2017 (Unaudited)
| | | | | | | | |
Shares | | | Description | | Value | |
| Underlying Funds (Institutional Shares)(a) – 99.2% | |
| Equity – 99.2% | |
| | 51,788,274 | | | Goldman Sachs U.S. Tax-Managed Equity Fund | | $ | 1,039,908,549 | |
| | 52,852,939 | | | Goldman Sachs International Tax-Managed Equity Fund | | | 477,262,036 | |
| | 19,814,776 | | | Goldman Sachs Tactical Tilt Overlay Fund | | | 194,382,957 | |
| | 13,290,641 | | | Goldman Sachs Emerging Markets Equity Insights Fund | | | 118,419,608 | |
| | 13,101,173 | | | Goldman Sachs MLP Energy Infrastructure Fund | | | 112,408,065 | |
| | 7,007,635 | | | Goldman Sachs International Small Cap Insights Fund | | | 77,574,515 | |
| | |
| | TOTAL INVESTMENTS – 99.2% | | | | |
| | (Cost $1,572,939,963) | | $ | 2,019,955,730 | |
| | |
| OTHER ASSETS IN EXCESS OF
LIABILITIES – 0.8% | | | 16,499,585 | |
| | |
| | NET ASSETS – 100.0% | | $ | 2,036,455,315 | |
| | |
| | |
| The percentage shown for each investment and investment category reflects the value of the respective investment or category as a percentage of net assets. |
(a) | | Represents affiliated Funds. |
| | |
|
Investment Abbreviations: |
AUD | | —Australian Dollar |
CHF | | —Swiss Franc |
EUR | | —Euro |
GBP | | —British Pound |
JPY | | —Japanese Yen |
USD | | —United States Dollar |
|
|
| ADDITIONAL INVESTMENT INFORMATION |
FORWARD FOREIGN CURRENCY EXCHANGE CONTRACTS — At February 28, 2017, the Portfolio had the following forward foreign currency exchange contracts:
FORWARD FOREIGN CURRENCY EXCHANGE CONTRACTS WITH UNREALIZED GAIN
| | | | | | | | | | | | | | | | | | | | | | | | |
| Counterparty | | Currency Purchased | | | Currency Sold | | | Settlement Date | | | Current Value | | | Unrealized Gain | |
Morgan Stanley Co., Inc. | | USD | | | 20,736,242 | | | CHF | | | 20,762,984 | | | | 03/15/17 | | | $ | 20,688,304 | | | $ | 47,938 | |
| | USD | | | 69,135,888 | | | EUR | | | 63,943,958 | | | | 03/15/17 | | | | 67,780,957 | | | | 1,354,931 | |
| | | USD | | | 44,577,606 | | | GBP | | | 35,251,169 | | | | 03/15/17 | | | | 43,754,362 | | | | 823,244 | |
| TOTAL | | | | | | | | | | | | | | $ | 2,226,113 | |
FORWARD FOREIGN CURRENCY EXCHANGE CONTRACTS WITH UNREALIZED LOSS
| | | | | | | | | | | | | | | | | | | | | | | | |
| Counterparty | | Currency Purchased | | | Currency Sold | | | Settlement Date | | | Current Value | | | Unrealized Loss | |
Morgan Stanley Co., Inc. | | USD | | | 19,889,298 | | | AUD | | | 26,774,774 | | | | 03/15/17 | | | $ | 20,521,699 | | | $ | (632,401 | ) |
| | USD | | | 2,023,750 | | | CHF | | | 2,050,000 | | | | 03/15/17 | | | | 2,042,627 | | | | (18,877 | ) |
| | USD | | | 11,702,708 | | | EUR | | | 11,060,000 | | | | 03/15/17 | | | | 11,723,663 | | | | (20,955 | ) |
| | USD | | | 3,807,770 | | | GBP | | | 3,080,000 | | | | 03/15/17 | | | | 3,822,950 | | | | (15,180 | ) |
| | | USD | | | 64,116,965 | | | JPY | | | 7,289,154,282 | | | | 03/15/17 | | | | 64,912,666 | | | | (795,701 | ) |
| TOTAL | | | | | | | | | | | | | | $ | (1,483,114 | ) |
FUTURES CONTRACTS — At February 28, 2017, the Portfolio had the following futures contracts:
| | | | | | | | | | | | |
| Type | | Number of Contracts Long (Short) | | Expiration Date | | Current Value | | | Unrealized Gain (Loss) | |
S&P 500 E-Mini Index | | 169 | | March 2017 | | $ | 19,965,660 | | | $ | 947,861 | |
| | |
| 18 | | The accompanying notes are an integral part of these financial statements. |
GOLDMAN SACHS GLOBAL TAX-AWARE EQUITY PORTFOLIOS
Statements of Assets and Liabilities
February 28, 2017 (Unaudited)
| | | | | | | | | | |
| | | | | Enhanced Dividend Global Equity Portfolio | | | Tax-Advantaged Global Equity Portfolio | |
| | Assets: | |
| | Investments in affiliated Underlying Funds, at value (cost $493,144,194 and $1,572,939,963) | | $ | 574,995,794 | | | $ | 2,019,955,730 | |
| | Cash | | | 4,525,333 | | | | 15,341,258 | |
| | Receivables: | | | | | | | | |
| | Portfolio shares sold | | | 1,656,364 | | | | 6,771,076 | |
| | Collateral on certain derivative contracts(a) | | | 450,000 | | | | 1,060,000 | |
| | Reimbursement from investment adviser | | | 15,268 | | | | 18,329 | |
| | Unrealized gain on forward foreign currency exchange contracts | | | 635,927 | | | | 2,226,113 | |
| | Other assets | | | 3,121 | | | | 10,936 | |
| | Total assets | | | 582,281,807 | | | | 2,045,383,442 | |
| | | | | | | | | | |
| | Liabilities: | | | | | | | | |
| | Unrealized loss on forward foreign currency exchange contracts | | | 411,982 | | | | 1,483,114 | |
| | Variation margin on certain derivative contracts | | | 13,199 | | | | 46,472 | |
| | Payables: | | | | | | | | |
| | Investments purchased | | | 427,574 | | | | 887,953 | |
| | Portfolio shares redeemed | | | 290,533 | | | | 5,662,498 | |
| | Collateral on certain derivative contracts(a) | | | 180,000 | | | | 570,000 | |
| | Management fees | | | 35,116 | | | | 123,956 | |
| | Distribution and Service fees and Transfer Agency fees | | | 19,744 | | | | 62,138 | |
| | Accrued expenses | | | 58,161 | | | | 91,996 | |
| | Total liabilities | | | 1,436,309 | | | | 8,928,127 | |
| | | | | | | | | | |
| | Net Assets: | | | | | | | | |
| | Paid-in capital | | | 511,871,550 | | | | 1,639,808,222 | |
| | Undistributed (distributions in excess of) net investment income | | | (1,353,603 | ) | | | 997,347 | |
| | Accumulated net realized loss | | | (12,017,209 | ) | | | (53,056,881 | ) |
| | Net unrealized gain | | | 82,344,760 | | | | 448,706,627 | |
| | | NET ASSETS | | $ | 580,845,498 | | | $ | 2,036,455,315 | |
| | | Net Assets: | | | | | | | | |
| | | Class A | | $ | 7,382,641 | | | $ | 526,596 | |
| | | Institutional | | | 573,462,857 | | | | 2,035,928,719 | |
| | | Total Net Assets | | $ | 580,845,498 | | | $ | 2,036,455,315 | |
| | | Shares outstanding $0.001 par value (unlimited shares authorized): | | | | | | | | |
| | | Class A | | | 656,525 | | | | 37,642 | |
| | | Institutional | | | 50,575,908 | | | | 146,412,937 | |
| | | Net asset value, offering and redemption price per share:(b) | | | | | | | | |
| | | Class A | | | $11.25 | | | | $13.99 | |
| | | Institutional | | | 11.34 | | | | 13.91 | |
| | (a) | | Segregated for initial margin and/or collateral on transactions as follows: |
| | | | | | | | |
| Portfolio | | Forwards | | | Futures | |
Enhanced Dividend Global Equity | | $ | (180,000 | ) | | $ | 450,000 | |
Tax-Advantaged Global Equity | | | (570,000 | ) | | | 1,060,000 | |
| | (b) | | Maximum public offering price per share for Class A Shares of the Enhanced Dividend Global Equity and Tax-Advantaged Global Equity Portfolios is $11.90 and $14.80, respectively. |
| | |
| The accompanying notes are an integral part of these financial statements. | | 19 |
GOLDMAN SACHS GLOBAL TAX-AWARE EQUITY PORTFOLIOS
Statements of Operations
For the Six Months Ended February 28, 2017 (Unaudited)
| | | | | | | | | | |
| | | | | Enhanced Dividend
Global Equity
Portfolio | | | Tax-Advantaged
Global Equity
Portfolio | |
| | Investment income: | |
| | Dividends from affiliated Underlying Funds | | $ | 5,855,495 | | | $ | 24,969,311 | |
| | | | | | | | | | |
| | Expenses: | | | | | | | | |
| | Management fees | | | 396,438 | | | | 1,397,841 | |
| | Transfer Agency fees(a) | | | 110,225 | | | | 373,159 | |
| | Custody, accounting and administrative services | | | 40,811 | | | | 126,034 | |
| | Professional fees | | | 29,973 | | | | 30,163 | |
| | Registration fees | | | 28,638 | | | | 30,740 | |
| | Printing and mailing costs | | | 18,639 | | | | 30,411 | |
| | Trustee fees | | | 9,171 | | | | 10,645 | |
| | Distribution and Service fees — Class A Shares | | | 7,515 | | | | 670 | |
| | Other | | | 7,925 | | | | 25,392 | |
| | Total expenses | | | 649,335 | | | | 2,025,055 | |
| | Less — expense reductions | | | (285,383 | ) | | | (783,284 | ) |
| | Net expenses | | | 363,952 | | | | 1,241,771 | |
| | NET INVESTMENT INCOME | | | 5,491,543 | | | | 23,727,540 | |
| | | | | | | | | | |
| | Realized and unrealized gain (loss): | | | | | | | | |
| | Net realized gain (loss) from: | | | | | | | | |
| | Investments in affiliated Underlying Funds | | | (184,174 | ) | | | (1,967,757 | ) |
| | Futures contracts | | | 421,239 | | | | 1,480,517 | |
| | Forward foreign currency exchange contracts | | | 3,430,582 | | | | 12,163,919 | |
| | Foreign currency transactions | | | (56 | ) | | | (169 | ) |
| | Capital gain distributions from affiliated Underlying Funds | | | 8,161,937 | | | | — | |
| | Net change in unrealized gain (loss) on: | | | | | | | | |
| | Investments in affiliated Underlying Funds | | | 21,425,907 | | | | 135,182,930 | |
| | Futures contracts | | | 71,043 | | | | 252,727 | |
| | Forward foreign currency exchange contracts | | | (127,500 | ) | | | (606,117 | ) |
| | Net realized and unrealized gain | | | 33,198,978 | | | | 146,506,050 | |
| | NET INCREASE IN NET ASSETS RESULTING FROM OPERATIONS | | $ | 38,690,521 | | | $ | 170,233,590 | |
| | (a) | | Class specific Transfer Agency fees were as follows: |
| | | | | | | | |
| | | Transfer Agency Fees | |
Portfolio | | Class A | | | Institutional | |
Enhanced Dividend Global Equity | | $ | 5,711 | | | $ | 104,514 | |
Tax-Advantaged Global Equity | | | 509 | | | | 372,650 | |
| | |
| 20 | | The accompanying notes are an integral part of these financial statements. |
GOLDMAN SACHS GLOBAL TAX-AWARE EQUITY PORTFOLIOS
Statements of Changes in Net Assets
| | | | | | | | | | | | | | | | | | | | | | |
| | | | | Enhanced Dividend
Global Equity Portfolio | | | | | | Tax-Advantaged
Global Equity Portfolio | |
| | | | | For the
Six Months Ended
February 28, 2017 (Unaudited) | | | For the Fiscal Year Ended
August 31, 2016 | | | | | | For the
Six Months Ended
February 28, 2017 (Unaudited) | | | For the Fiscal Year Ended
August 31, 2016 | |
| | From operations: | |
| | Net investment income | | $ | 5,491,543 | | | $ | 7,274,603 | | | | | | | $ | 23,727,540 | | | $ | 15,969,302 | |
| | Net realized gain (loss) | | | 11,829,528 | | | | (3,065,544 | ) | | | | | | | 11,676,510 | | | | (42,049,388 | ) |
| | Net change in unrealized gain | | | 21,369,450 | | | | 31,435,529 | | | | | | | | 134,829,540 | | | | 118,927,022 | |
| | Net increase in net assets resulting from operations | | | 38,690,521 | | | | 35,644,588 | | | | | | | | 170,233,590 | | | | 92,846,936 | |
| | | | | | | | | | | | | | | | | | | | | | |
| | Distributions to shareholders: | | | | | | | | | | | | | | | | | | | | |
| | From net investment income | | | | | | | | | | | | | | | | | | | | |
| | Class A Shares | | | (78,491 | ) | | | (72,552 | ) | | | | | | | (3,269 | ) | | | (9,103 | ) |
| | Institutional Shares | | | (6,766,657 | ) | | | (14,729,798 | ) | | | | | | | (21,198,986 | ) | | | (30,328,763 | ) |
| | From net realized gains | | | | | | | | | | | | | | | | | | | | |
| | Class A Shares | | | (41,151 | ) | | | (64,848 | ) | | | | | | | — | | | | (4,676 | ) |
| | Institutional Shares | | | (3,506,959 | ) | | | (13,622,832 | ) | | | | | | | — | | | | (12,749,009 | ) |
| | Total distributions to shareholders | | | (10,393,258 | ) | | | (28,490,030 | ) | | | | | | | (21,202,255 | ) | | | (43,091,551 | ) |
| | | | | | | | | | | | | | | | | | | | | | |
| | From share transactions: | | | | | | | | | | | | | | | | | | | | |
| | Proceeds from sales of shares | | | 53,452,333 | | | | 137,088,130 | | | | | | | | 170,589,474 | | | | 357,491,366 | |
| | Reinvestment of distributions | | | 10,371,566 | | | | 28,464,540 | | | | | | | | 21,200,470 | | | | 43,074,642 | |
| | Cost of shares redeemed | | | (24,113,626 | ) | | | (85,794,058 | ) | | | | | | | (121,867,405 | ) | | | (334,588,511 | ) |
| | Net increase in net assets resulting from share transactions | | | 39,710,273 | | | | 79,758,612 | | | | | | | | 69,922,539 | | | | 65,977,497 | |
| | TOTAL INCREASE | | | 68,007,536 | | | | 86,913,170 | | | | | | | | 218,953,874 | | | | 115,732,882 | |
| | | | | | | | | | | | | | | | | | | | | | |
| | Net assets: | | | | | | | | | | | | | | | | | | | | |
| | Beginning of period | | | 512,837,962 | | | | 425,924,792 | | | | | | | | 1,817,501,441 | | | | 1,701,768,559 | |
| | End of period | | $ | 580,845,498 | | | $ | 512,837,962 | | | | | | | $ | 2,036,455,315 | | | $ | 1,817,501,441 | |
| | Undistributed (distributions in excess of) net
investment income | | $ | (1,353,603 | ) | | $ | 2 | | | | | | | $ | 997,347 | | | $ | (1,527,938 | ) |
| | |
| The accompanying notes are an integral part of these financial statements. | | 21 |
GOLDMAN SACHS ENHANCED DIVIDEND GLOBAL EQUITY PORTFOLIO
Financial Highlights
Selected Data for a Share Outstanding Throughout Each Period
| | | | | | | | | | | | | | | | | | | | | | | | | | | | | | |
| | | | | | | | Income (loss) from
investment operations | | | Distributions
to shareholders | |
| | | Year - Share Class | | Net asset value, beginning of period | | | Net investment income(a)(b) | | | Net realized and unrealized gain (loss) | | | Total from investment operations | | | From net investment income | | | From net realized gains | | | Total distributions | |
| | FOR THE SIX MONTHS ENDED FEBRUARY 28, (UNAUDITED) | |
| | 2017 - A | | $ | 10.68 | | | $ | 0.09 | | | $ | 0.68 | | | $ | 0.77 | | | $ | (0.13 | ) | | $ | (0.07 | ) | | $ | (0.20 | ) |
| | 2017 - Institutional | | | 10.76 | | | | 0.11 | | | | 0.68 | | | | 0.79 | | | | (0.14 | ) | | | (0.07 | ) | | | (0.21 | ) |
| | | | | | | | | | | | | | | | | | | | | | | | | | | | | | |
| | FOR THE FISCAL YEARS ENDED AUGUST 31, | |
| | 2016 - A | | | 10.69 | | | | 0.11 | | | | 0.52 | | | | 0.63 | | | | (0.31 | ) | | | (0.33 | ) | | | (0.64 | ) |
| | 2016 - Institutional | | | 10.76 | | | | 0.16 | | | | 0.51 | | | | 0.67 | | | | (0.34 | ) | | | (0.33 | ) | | | (0.67 | ) |
| | 2015 - A | | | 11.83 | | | | 0.16 | | | | (0.73 | ) | | | (0.57 | ) | | | (0.21 | ) | | | (0.36 | ) | | | (0.57 | ) |
| | 2015 - Institutional | | | 11.89 | | | | 0.22 | | | | (0.74 | ) | | | (0.52 | ) | | | (0.25 | ) | | | (0.36 | ) | | | (0.61 | ) |
| | 2014 - A | | | 10.64 | | | | 0.23 | | | | 1.62 | | | | 1.85 | | | | (0.24 | ) | | | (0.42 | ) | | | (0.66 | ) |
| | 2014 - Institutional | | | 10.69 | | | | 0.28 | | | | 1.62 | | | | 1.90 | | | | (0.28 | ) | | | (0.42 | ) | | | (0.70 | ) |
| | 2013 - A | | | 9.73 | | | | 0.21 | | | | 1.08 | | | | 1.29 | | | | (0.27 | ) | | | (0.11 | ) | | | (0.38 | ) |
| | 2013 - Institutional | | | 9.76 | | | | 0.26 | | | | 1.09 | | | | 1.35 | | | | (0.31 | ) | | | (0.11 | ) | | | (0.42 | ) |
| | 2012 - A | | | 9.23 | | | | 0.19 | | | | 0.58 | | | | 0.77 | | | | (0.26 | ) | | | (0.01 | ) | | | (0.27 | ) |
| | 2012 - Institutional | | | 9.27 | | | | 0.23 | | | | 0.57 | | | | 0.80 | | | | (0.30 | ) | | | (0.01 | ) | | | (0.31 | ) |
| | (a) | | Calculated based on the average shares outstanding methodology. |
| | (b) | | Recognition of net investment income by the Portfolio is affected by the timing of declaration of dividends by the Underlying Funds in which the Portfolio invests. |
| | (c) | | Assumes investment at the net asset value at the beginning of the period, reinvestment of all distributions, a complete redemption of the investment at the net asset value at the end of the period and no sales or redemption charges. Total returns would be reduced if a sales or redemption charge was taken into account. Returns do not reflect the impact of taxes to shareholders relating to Portfolio distributions or the redemption of Portfolio shares. Total returns for periods less than one full year are not annualized. |
| | (d) | | Expense ratios exclude the expenses of the Underlying Funds in which the Portfolio invests. |
| | (e) | | The portfolio turnover rate is calculated in accordance with regulatory requirements, without regard to transactions involving short term investments and certain derivatives. If such transactions were included, the portfolio turnover rate may be higher. |
| | |
| 22 | | The accompanying notes are an integral part of these financial statements. |
GOLDMAN SACHS ENHANCED DIVIDEND GLOBAL EQUITY PORTFOLIO
| | | | | | | | | | | | | | | | | | | | | | | | | | | | | | | | | | | | | | | | |
| | | | | | | | | | | | | | | | | | | | | | | | | | | | | | | | | | |
| | | Net asset
value, end
of period | | | | | Total
return(c) | | | | | Net assets,
end of period (in 000s) | | | | | Ratio of
net expenses
to average
net assets(d) | | | | | Ratio of
total expenses
to average
net assets(d) | | | | | Ratio of
net investment
income to average net assets(b) | | | | | Portfolio
turnover
rate(e) | |
| | | | | | | | | | | | | | | | | | | | | | | | | | | | | | | | | | | | | | | | |
| | $ | 11.25 | | | | | | 7.29 | % | | | | $ | 7,383 | | | | | | 0.53 | %(f) | | | | | 0.64 | %(f) | | | | | 1.74 | %(f) | | | | | 4 | % |
| | | 11.34 | | | | | | 7.46 | | | | | | 573,463 | | | | | | 0.13 | (f) | | | | | 0.24 | (f) | | | | | 2.08 | (f) | | | | | 4 | |
| | | | | | | | | | | | | | | | | | | | | | | | | | | | | | | | | | | | | | | | |
| | | | | | | | | | | | | | | | | | | | | | | | | | | | | | | | | | | | | | | | |
| | | 10.68 | | | | | | 6.32 | | | | | | 4,993 | | | | | | 0.53 | | | | | | 0.64 | | | | | | 1.09 | | | | | | 19 | |
| | | 10.76 | | | | | | 6.67 | | | | | | 507,845 | | | | | | 0.13 | | | | | | 0.24 | | | | | | 1.58 | | | | | | 19 | |
| | | 10.69 | | | | | | (4.82 | ) | | | | | 1,729 | | | | | | 0.55 | | | | | | 0.66 | | | | | | 1.40 | | | | | | 25 | |
| | | 10.76 | | | | | | (4.29 | ) | | | | | 424,196 | | | | | | 0.17 | | | | | | 0.26 | | | | | | 1.95 | | | | | | 25 | |
| | | 11.83 | | | | | | 17.92 | | | | | | 220 | | | | | | 0.60 | | | | | | 0.66 | | | | | | 2.02 | | | | | | 14 | |
| | | 11.89 | | | | | | 18.29 | | | | | | 373,665 | | | | | | 0.20 | | | | | | 0.26 | | | | | | 2.43 | | | | | | 14 | |
| | | 10.64 | | | | | | 13.61 | | | | | | 133 | | | | | | 0.60 | | | | | | 0.68 | | | | | | 2.13 | | | | | | 40 | |
| | | 10.69 | | | | | | 14.21 | | | | | | 284,539 | | | | | | 0.20 | | | | | | 0.29 | | | | | | 2.49 | | | | | | 40 | |
| | | 9.73 | | | | | | 8.51 | | | | | | 127,290 | | | | | | 0.60 | | | | | | 0.70 | | | | | | 2.02 | | | | | | 32 | |
| | | 9.76 | | | | | | 8.79 | | | | | | 75,735 | | | | | | 0.20 | | | | | | 0.30 | | | | | | 2.42 | | | | | | 32 | |
| | |
| The accompanying notes are an integral part of these financial statements. | | 23 |
GOLDMAN SACHS TAX-ADVANTAGED GLOBAL EQUITY PORTFOLIO
Financial Highlights
Selected Data for a Share Outstanding Throughout Each Period
| | | | | | | | | | | | | | | | | | | | | | | | | | | | | | |
| | | | | | | | Income (loss) from
investment operations | | | Distributions
to shareholders | |
| | | Year - Share Class | | Net asset value, beginning of period | | | Net investment income(a)(b) | | | Net realized
and unrealized
gain (loss) | | | Total from investment operations | | | From net investment income | | | From net realized gains | | | Total
distributions | |
| | FOR THE SIX MONTHS ENDED FEBRUARY 28, (UNAUDITED) | |
| | 2017 - A | | $ | 12.91 | | | $ | 0.13 | | | $ | 1.04 | | | $ | 1.17 | | | $ | (0.09 | ) | | $ | — | | | $ | (0.09 | ) |
| | 2017 - Institutional | | | 12.86 | | | | 0.17 | | | | 1.03 | | | | 1.20 | | | | (0.15 | ) | | | — | | | | (0.15 | ) |
| | | | | | | | | | | | | | | | | | | | | | | | | | | | | | |
| | FOR THE FISCAL YEARS ENDED AUGUST 31, | |
| | 2016 - A | | | 12.58 | | | | 0.08 | | | | 0.52 | | | | 0.60 | | | | (0.18 | ) | | | (0.09 | ) | | | (0.27 | ) |
| | 2016 - Institutional | | | 12.53 | | | | 0.11 | | | | 0.53 | | | | 0.64 | | | | (0.22 | ) | | | (0.09 | ) | | | (0.31 | ) |
| | 2015 - A | | | 13.51 | | | | 0.09 | | | | (0.69 | ) | | | (0.60 | ) | | | (0.10 | ) | | | (0.23 | ) | | | (0.33 | ) |
| | 2015 - Institutional | | | 13.48 | | | | 0.17 | | | | (0.71 | ) | | | (0.54 | ) | | | (0.18 | ) | | | (0.23 | ) | | | (0.41 | ) |
| | 2014 - A | | | 11.31 | | | | 0.20 | | | | 2.31 | | | | 2.51 | | | | — | | | | (0.31 | ) | | | (0.31 | ) |
| | 2014 - Institutional | | | 11.38 | | | | 0.18 | | | | 2.39 | | | | 2.57 | | | | (0.16 | ) | | | (0.31 | ) | | | (0.47 | ) |
| | 2013 - A | | | 9.78 | | | | 0.32 | | | | 1.41 | | | | 1.73 | | | | (0.17 | ) | | | (0.03 | ) | | | (0.20 | ) |
| | 2013 - Institutional | | | 9.84 | | | | 0.15 | | | | 1.63 | | | | 1.78 | | | | (0.21 | ) | | | (0.03 | ) | | | (0.24 | ) |
| | 2012 - A | | | 8.98 | | | | 0.15 | | | | 0.79 | | | | 0.94 | | | | (0.13 | ) | | | (0.01 | ) | | | (0.14 | ) |
| | 2012 - Institutional | | | 9.04 | | | | 0.17 | | | | 0.81 | | | | 0.98 | | | | (0.17 | ) | | | (0.01 | ) | | | (0.18 | ) |
| | (a) | | Calculated based on the average shares outstanding methodology. |
| | (b) | | Recognition of net investment income by the Portfolio is affected by the timing of declaration of dividends by the Underlying Funds in which the Portfolio invests. |
| | (c) | | Assumes investment at the net asset value at the beginning of the period, reinvestment of all distributions, a complete redemption of the investment at the net asset value at the end of the period and no sales or redemption charges. Total returns would be reduced if a sales or redemption charge was taken into account. Returns do not reflect the impact of taxes to shareholders relating to Portfolio distributions or the redemption of Portfolio shares. Total returns for periods less than one full year are not annualized. |
| | (d) | | Expense ratios exclude the expenses of the Underlying Funds in which the Portfolio invests. |
| | (e) | | The portfolio turnover rate is calculated in accordance with regulatory requirements, without regard to transactions involving short term investments and certain derivatives. If such transactions were included, the portfolio turnover rate may be higher. |
| | |
| 24 | | The accompanying notes are an integral part of these financial statements. |
GOLDMAN SACHS TAX-ADVANTAGED GLOBAL EQUITY PORTFOLIO
| | | | | | | | | | | | | | | | | | | | | | | | | | | | | | | | | | | | | | | | |
| | | | | | | | | | | | | | | | | | | | | | | | | | | | | | | | | | |
| | | Net asset
value, end
of period | | | | | Total
return(c) | | | | | Net assets, end of period (in 000s) | | | | | Ratio of
net expenses
to average
net assets(d) | | | | | Ratio of
total expenses
to average
net assets(d) | | | | | Ratio of
net investment
income
to average
net assets(b) | | | | | Portfolio
turnover
rate(e) | |
| | | | | | | | | | | | | | | | | | | | | | | | | | | | | | | | | | | | | | | | |
| | $ | 13.99 | | | | | | 9.07 | % | | | | $ | 527 | | | | | | 0.53 | %(f) | | | | | 0.62 | %(f) | | | | | 1.92 | %(f) | | | | | 5 | % |
| | | 13.91 | | | | | | 9.37 | | | | | | 2,035,929 | | | | | | 0.13 | (f) | | | | | 0.22 | (f) | | | | | 2.54 | (f) | | | | | 5 | |
| | | | | | | | | | | | | | | | | | | | | | | | | | | | | | | | | | | | | | | | |
| | | | | | | | | | | | | | | | | | | | | | | | | | | | | | | | | | | | | | | | |
| | | 12.91 | | | | | | 4.88 | | | | | | 591 | | | | | | 0.53 | | | | | | 0.61 | | | | | | 0.64 | | | | | | 19 | |
| | | 12.86 | | | | | | 5.22 | | | | | | 1,816,911 | | | | | | 0.13 | | | | | | 0.21 | | | | | | 0.92 | | | | | | 19 | |
| | | 12.58 | | | | | | (4.39 | ) | | | | | 543 | | | | | | 0.56 | | | | | | 0.61 | | | | | | 0.66 | | | | | | 22 | |
| | | 12.53 | | | | | | (3.96 | ) | | | | | 1,701,226 | | | | | | 0.17 | | | | | | 0.21 | | | | | | 1.31 | | | | | | 22 | |
| | | 13.51 | | | | | | 22.55 | | | | | | 235 | | | | | | 0.60 | | | | | | 0.62 | | | | | | 1.56 | | | | | | 9 | |
| | | 13.48 | | | | | | 23.05 | | | | | | 1,233,566 | | | | | | 0.20 | | | | | | 0.22 | | | | | | 1.43 | | | | | | 9 | |
| | | 11.31 | | | | | | 18.12 | | | | | | 636 | | | | | | 0.60 | | | | | | 0.64 | | | | | | 3.16 | | | | | | 36 | |
| | | 11.38 | | | | | | 18.45 | | | | | | 739,859 | | | | | | 0.20 | | | | | | 0.24 | | | | | | 1.34 | | | | | | 36 | |
| | | 9.78 | | | | | | 10.52 | | | | | | 243,892 | | | | | | 0.60 | | | | | | 0.65 | | | | | | 1.62 | | | | | | 24 | |
| | | 9.84 | | | | | | 11.02 | | | | | | 207,103 | | | | | | 0.20 | | | | | | 0.25 | | | | | | 1.88 | | | | | | 24 | |
| | |
| The accompanying notes are an integral part of these financial statements. | | 25 |
GOLDMAN SACHS GLOBAL TAX-AWARE EQUITY PORTFOLIOS
Notes to Financial Statements
February 28, 2017 (Unaudited)
Goldman Sachs Trust (the “Trust”) is a Delaware statutory trust registered under the Investment Company Act of 1940, as amended (the “Act”), as an open-end management investment company. The following table lists those series of the Trust that are included in this report (collectively, the “Portfolios” or individually a “Portfolio”), along with their corresponding share classes and respective diversification status under the Act:
| | | | |
| Portfolio | | Share Classes Offered | | Diversified/ Non-diversified |
Enhanced Dividend Global Equity and Tax-Advantaged Global Equity | | A and Institutional | | Diversified |
Class A Shares are sold with a front-end sales charge of up to 5.50%. Institutional Shares are not subject to a sales charge.
Goldman Sachs Asset Management, L.P. (“GSAM”), an affiliate of Goldman, Sachs & Co. (“Goldman Sachs”), serves as investment adviser to the Portfolios pursuant to a management agreement (the “Agreement”) with the Trust.
The Portfolios are expected to invest primarily in a combination of domestic and international equity and fixed income underlying funds (“Underlying Funds”) which are registered under the Act, for which GSAM or Goldman Sachs Asset Management International (“GSAMI”), also an affiliate of Goldman Sachs, act as investment advisers. Additionally, these Portfolios may invest a portion of their assets directly in other securities and instruments, including unaffiliated exchange traded funds.
|
| 2. SIGNIFICANT ACCOUNTING POLICIES |
The financial statements have been prepared in accordance with accounting principles generally accepted in the United States of America (“GAAP”) and require management to make estimates and assumptions that may affect the reported amounts and disclosures. Actual results may differ from those estimates and assumptions.
A. Investment Valuation — The Portfolios’ valuation policy, as well as the Underlying Funds’, is to value investments at fair value.
B. Investment Income and Investments — Investment income includes interest income, dividend income, net of any foreign withholding taxes, less any amounts reclaimable, and securities lending income. Interest income is accrued daily and adjusted for amortization of premiums and accretion of discounts. Dividend income is recognized on ex-dividend date or, for certain foreign securities, as soon as such information is obtained subsequent to the ex-dividend date. Investment transactions are reflected on trade date. Realized gains and losses are calculated using identified cost. Investment transactions are recorded on the following business day for daily net asset value (“NAV”) calculations. Any foreign capital gains tax is accrued daily based upon net unrealized gains, and is payable upon sale of such investments. Distributions from master limited partnerships (“MLPs”), as may be received by certain Underlying Funds, are generally recorded based on the characterization reported on the MLP’s tax return. The Goldman Sachs MLP Energy Infrastructure Fund (the “Underlying MLP Fund”) records its pro-rata share of the income/loss and capital gains/losses, allocated from the underlying partnerships and adjusts the cost basis of the underlying partnerships accordingly. Income distributions are recognized as capital gains or income in the financial statements in accordance with the character that is distributed.
For derivative contracts, realized gains and losses are recorded upon settlement of the contract.
26
GOLDMAN SACHS GLOBAL TAX-AWARE EQUITY PORTFOLIOS
|
| 2. SIGNIFICANT ACCOUNTING POLICIES (continued) |
C. Class Allocations and Expenses — Investment income, realized and unrealized gain (loss), and non-class specific expenses of each Portfolio are allocated daily based upon the proportion of net assets of each class. Non-class specific expenses directly incurred by a Portfolio are charged to that Portfolio, while such expenses incurred by the Trust are allocated across the applicable Portfolios on a straight-line and/or pro-rata basis depending upon the nature of the expenses. Class specific expenses, where applicable, are borne by the respective share classes and include Distribution and Service and Transfer Agency fees. Expenses included in the accompanying financial statements reflect the expenses of each Portfolio and do not include any expenses associated with the Underlying Funds. Because the Underlying Funds have varied expense and fee levels and the Portfolios may own different proportions of the Underlying Funds at different times, the amount of fees and expenses incurred indirectly by each Portfolio will vary.
D. Federal Taxes and Distributions to Shareholders — It is each Portfolio’s policy to comply with the requirements of the Internal Revenue Code of 1986, as amended (the “Code”), applicable to regulated investment companies (mutual funds) and to distribute each year substantially all of its investment company taxable income and capital gains to its shareholders. Accordingly, each Portfolio is not required to make any provisions for the payment of federal income tax. Distributions to shareholders are recorded on the ex-dividend date. Income and capital gains distributions, if any, are declared and paid according to the following schedule:
| | | | | | |
| Portfolio | | | | Income Distributions Declared/Paid | | Capital Gains Distributions
Declared/Paid |
Enhanced Dividend Global Equity | | | | Quarterly | | Annually |
Tax-Advantaged Global Equity | | | | Annually | | Annually |
Net capital losses, if any, are carried forward to future fiscal years and may be used to the extent allowed by the Code to offset any future capital gains. Losses that are carried forward will retain their character as either short-term or long-term capital losses. Utilization of capital loss carryforwards will reduce the requirement of future capital gains distributions.
The characterization of distributions to shareholders for financial reporting purposes is determined in accordance with federal income tax rules, which may differ from GAAP. The source of each Portfolio’s distributions may be shown in the accompanying financial statements as either from net investment income, net realized gain or capital. Certain components of the Portfolios’ net assets on the Statements of Assets and Liabilities reflect permanent GAAP/tax differences based on the appropriate tax character.
E. Foreign Currency Translation — The accounting records and reporting currency of a Portfolio are maintained in United States (“U.S.”) dollars. Assets and liabilities denominated in foreign currencies are translated into U.S. dollars using the current exchange rates at the close of each business day. The effect of changes in foreign currency exchange rates on investments is included within net realized and unrealized gain (loss) on investments. Changes in the value of other assets and liabilities as a result of fluctuations in foreign exchange rates are included in the Statements of Operations within net change in unrealized gain (loss) on foreign currency translations. Transactions denominated in foreign currencies are translated into U.S. dollars on the date the transaction occurred, the effects of which are included within net realized gain (loss) on foreign currency transactions.
27
GOLDMAN SACHS GLOBAL TAX-AWARE EQUITY PORTFOLIOS
Notes to Financial Statements (continued)
February 28, 2017 (Unaudited)
|
| 3. INVESTMENTS AND FAIR VALUE MEASUREMENTS |
The fair value of a financial instrument is the amount that would be received to sell an asset or paid to transfer a liability in an orderly transaction between market participants at the measurement date (i.e., the exit price). GAAP establishes a fair value hierarchy that prioritizes the inputs to valuation techniques used to measure fair value. The hierarchy gives the highest priority to unadjusted quoted prices in active markets for identical assets or liabilities (Level 1 measurements) and the lowest priority to unobservable inputs (Level 3 measurements). The levels used for classifying investments are not necessarily an indication of the risk associated with investing in these investments. The three levels of the fair value hierarchy are described below:
Level 1 — Unadjusted quoted prices in active markets that are accessible at the measurement date for identical, unrestricted assets or liabilities;
Level 2 — Quoted prices in markets that are not active or financial instruments for which significant inputs are observable (including, but not limited to, quoted prices for similar investments, interest rates, foreign exchange rates, volatility and credit spreads), either directly or indirectly;
Level 3 — Prices or valuations that require significant unobservable inputs (including GSAM’s assumptions in determining fair value measurement).
Changes in valuation techniques may result in transfers into or out of an assigned level within the hierarchy. In accordance with the Portfolios’ policy, transfers between different levels of the fair value hierarchy resulting from such changes are deemed to have occurred as of the beginning of the reporting period.
The Board of Trustees (“Trustees”) has approved Valuation Procedures that govern the valuation of the portfolio investments held by the Portfolios, including investments for which market quotations are not readily available. The Trustees have delegated to GSAM day-to-day responsibility for implementing and maintaining internal controls and procedures related to the valuation of the Portfolios’ investments. To assess the continuing appropriateness of pricing sources and methodologies, GSAM regularly performs price verification procedures and issues challenges as necessary to third party pricing vendors or brokers, and any differences are reviewed in accordance with the Valuation Procedures.
A. Level 1 and Level 2 Fair Value Investments — The valuation techniques and significant inputs used in determining the fair values for investments classified as Level 1 and Level 2 are as follows:
Underlying Funds — Investments in the Underlying Funds are valued at the NAV per share of the Institutional Share class of each Underlying Fund on the day of valuation. Because each Portfolio invests primarily in other mutual funds that fluctuate in value, the Portfolios’ shares will correspondingly fluctuate in value. These investments are generally classified as Level 1 of the fair value hierarchy. For information regarding an Underlying Fund’s accounting policies and investment holdings, please see the Underlying Fund’s shareholder report.
Derivative Contracts — A derivative is an instrument whose value is derived from underlying assets, indices, reference rates or a combination of these factors. A Portfolio enters into derivative transactions to hedge against changes in interest rates, securities prices, and/or currency exchange rates, to increase total return, or to gain access to certain markets or attain exposure to other underliers.
28
GOLDMAN SACHS GLOBAL TAX-AWARE EQUITY PORTFOLIOS
|
| 3. INVESTMENTS AND FAIR VALUE MEASUREMENTS (continued) |
Exchange-traded derivatives, including futures and options contracts, are valued at the last sale or settlement price and typically fall within Level 1 of the fair value hierarchy. Over-the-counter (“OTC”) and centrally cleared derivatives are valued using market transactions and other market evidence, including market-based inputs to models, calibration to market-clearing transactions, broker or dealer quotations, or other alternative pricing sources. Where models are used, the selection of a particular model to value OTC and centrally cleared derivatives depends upon the contractual terms of, and specific risks inherent in, the instrument, as well as the availability of pricing information in the market. Valuation models require a variety of inputs, including contractual terms, market prices, yield curves, credit curves, measures of volatility, voluntary and involuntary prepayment rates, loss severity rates and correlations of such inputs. For OTC and centrally cleared derivatives that trade in liquid markets, model inputs can generally be verified and model selection does not involve significant management judgment. OTC and centrally cleared derivatives are classified within Level 2 of the fair value hierarchy when significant inputs are corroborated by market evidence.
i. Forward Contracts — A forward contract is a contract between two parties to buy or sell an asset at a specified price on a future date. A forward contract settlement can occur on a cash or delivery basis. Forward contracts are marked-to-market daily using independent vendor prices, and the change in value, if any, is recorded as an unrealized gain or loss. Cash and certain investments may be used to collateralize forward contracts.
A forward foreign currency contract is a forward contract in which a Portfolio agrees to receive or deliver a fixed quantity of one currency for another, at a pre-determined price at a future date. All forward foreign currency exchange contracts are marked-to-market daily at the applicable forward rate. Non-deliverable forward foreign currency exchange contracts are settled with the counterparty in cash without the delivery of foreign currency.
ii. Futures Contracts — Futures contracts are contracts to buy or sell a standardized quantity of a specified commodity or security and are valued based on exchanged settlement prices or independent market quotes. Futures contracts are valued at the last settlement price, or in the absence of a sale, the last bid price for long positions and at the last ask price for short positions, at the end of each day on the board of trade or exchange upon which they are traded. Upon entering into a futures contract, a Portfolio deposits cash or securities in an account on behalf of the broker in an amount sufficient to meet the initial margin requirement. Subsequent payments are made or received by a Portfolio equal to the daily change in the contract value and are recorded as variation margin receivable or payable with a corresponding offset to unrealized gains or losses.
B. Level 3 Fair Value Investments — To the extent that significant inputs to valuation models and other alternative pricing sources are unobservable, or if quotations are not readily available, or if GSAM believes that such quotations do not accurately reflect fair value, the fair value of a Portfolio’s investments may be determined under Valuation Procedures approved by the Trustees. GSAM, consistent with its procedures and applicable regulatory guidance, may make an adjustment to the most recent valuation prices of either domestic or foreign securities in light of significant events to reflect what it believes to be the fair value of the securities at the time of determining a Portfolio’s NAV. Significant events which could affect a large number of securities in a particular market may include, but are not limited to: significant fluctuations in U.S. or foreign markets; market dislocations; market disruptions; or unscheduled market closings. Significant events which could also affect a single issuer may include, but are not limited to: corporate actions such as reorganizations, mergers and buy-outs; ratings downgrades; and bankruptcies.
29
GOLDMAN SACHS GLOBAL TAX-AWARE EQUITY PORTFOLIOS
Notes to Financial Statements (continued)
February 28, 2017 (Unaudited)
|
| 3. INVESTMENTS AND FAIR VALUE MEASUREMENTS (continued) |
C. Fair Value Hierarchy — The following is a summary of the Portfolios’ investments and derivatives classified in the fair value hierarchy as of February 28, 2017:
| | | | | | | | | | | | |
| | | |
| ENHANCED DIVIDEND GLOBAL EQUITY | | | | | | | | | | | | |
| | | |
| Investment Type | | Level 1 | | | Level 2 | | | Level 3 | |
| Assets | | | | | | | | | | | | |
Equity Underlying Funds | | $ | 574,995,794 | | | $ | — | | | $ | — | |
| | | |
| Derivative Type | | | | | | | | | |
| Assets(a) | | | | | | | | | | | | |
Forward Foreign Currency Exchange Contracts | | $ | — | | | $ | 635,927 | | | $ | — | |
Futures Contracts | | | 269,215 | | | | — | | | | — | |
| Total | | $ | 269,215 | | | $ | 635,927 | | | $ | — | |
| Liabilities(a) | | | | | | | | | | | | |
Forward Foreign Currency Exchange Contracts | | $ | — | | | $ | (411,982 | ) | | $ | — | |
| | | |
| TAX-ADVANTAGED GLOBAL EQUITY | | | | | | | | | | | | |
| | | |
| Investment Type | | Level 1 | | | Level 2 | | | Level 3 | |
| Assets | | | | | | | | | | | | |
Equity Underlying Funds | | $ | 2,019,955,730 | | | $ | — | | | $ | — | |
| | | |
| Derivative Type | | | | | | | | | |
| Assets(a) | | | | | | | | | | | | |
Forward Foreign Currency Exchange Contracts | | $ | — | | | $ | 2,226,113 | | | $ | — | |
Futures Contracts | | | 947,861 | | | | — | | | | — | |
| Total | | $ | 947,861 | | | $ | 2,226,113 | | | $ | — | |
| Liabilities(a) | | | | | | | | | | | | |
Forward Foreign Currency Exchange Contracts | | $ | — | | | $ | (1,483,114 | ) | | $ | — | |
| (a) | | Amount shown represents unrealized gain (loss) at period end. |
For further information regarding security characteristics, see the Schedules of Investments.
30
GOLDMAN SACHS GLOBAL TAX-AWARE EQUITY PORTFOLIOS
|
| 4. INVESTMENTS IN DERIVATIVES |
The following tables set forth, by certain risk types, the gross value of derivative contracts as of February 28, 2017. These instruments were used as part of the Portfolios’ investment strategies and to obtain and/or manage exposure related to the risks below. The values in the tables below exclude the effects of cash collateral received or posted pursuant to these derivative contracts, and therefore are not representative of the Portfolios’ net exposure:
| | | | | | | | | | | | |
|
Enhanced Dividend Global Equity | |
| Risk | | Statements of Assets
and Liabilities | | Assets | | | Statements of Assets
and Liabilities | | Liabilities | |
Currency | | Receivable for unrealized gain on forward foreign currency exchange contracts | | $ | 635,927 | | | Payable for unrealized loss on forward foreign currency exchange contracts | | $ | (411,982) | |
Equity | | Variation margin on certain derivative contracts | | | 269,215 | (a) | | — | | | — | |
| Total | | | | $ | 905,142 | | | | | $ | (411,982) | |
|
Tax-Advantaged Global Equity | |
| Risk | | Statements of Assets
and Liabilities | | Assets | | | Statements of Assets
and Liabilities | | Liabilities | |
Currency | | Receivable for unrealized gain on forward foreign currency exchange contracts | | $ | 2,226,113 | | | Payable for unrealized loss on forward foreign currency exchange contracts | | $ | (1,483,114) | |
Equity | | Variation margin on certain derivative contracts | | | 947,861 | (a) | | — | | | — | |
| Total | | | | $ | 3,173,974 | | | | | $ | (1,483,114) | |
| (a) | | Includes unrealized gain (loss) on futures contracts described in the Additional Investment Information sections of the Schedules of Investments. Only the variation margin as of February 28, 2017 is reported within the Statements of Assets and Liabilities. |
The following tables set forth, by certain risk types, the Portfolios’ gains (losses) related to these derivatives and their indicative volumes for the six months ended February 28, 2017. These gains (losses) should be considered in the context that these derivative contracts may have been executed to create investment opportunities and/or economically hedge certain investments, and accordingly, certain gains (losses) on such derivative contracts may offset certain (losses) gains attributable to investments. These gains (losses) are included in “Net realized gain (loss)” or “Net change in unrealized gain (loss)” on the Statements of Operations:
| | | | | | | | | | | | | | |
| | |
| Enhanced Dividend Global Equity | | | | | | | | | |
| Risk | | Statements of Operations | | Net
Realized
Gain (Loss) | | | Net Change in
Unrealized
Gain (Loss) | | | Average
Number of
Contracts(a) | |
| Currency | | Net realized gain (loss) from forward foreign currency exchange contracts/Net change in unrealized gain (loss) from forward foreign currency exchange contracts | | $ | 3,430,582 | | | $ | (127,500 | ) | | | 9 | |
| Equity | | Net realized gain (loss) from futures contracts/Net change in unrealized gain (loss) on futures contracts | | | 421,239 | | | | 71,043 | | | | 48 | |
| Total | | | | $ | 3,851,821 | | | $ | (56,457 | ) | | | 57 | |
31
GOLDMAN SACHS GLOBAL TAX-AWARE EQUITY PORTFOLIOS
Notes to Financial Statements (continued)
February 28, 2017 (Unaudited)
|
| 4. INVESTMENTS IN DERIVATIVES (continued) |
| | | | | | | | | | | | | | |
|
| Tax-Advantaged Global Equity | |
| Risk | | Statements of Operations | | Net
Realized
Gain (Loss) | | | Net Change in
Unrealized
Gain (Loss) | | | Average
Number of
Contracts(a) | |
| Currency | | Net realized gain (loss) from forward foreign currency exchange contracts/Net change in unrealized gain (loss) from forward foreign currency exchange contracts | | $ | 12,163,919 | | | $ | (606,117 | ) | | | 10 | |
| Equity | | Net realized gain (loss) from futures contracts/Net change in unrealized gain (loss) on futures contracts | | | 1,480,517 | | | | 252,727 | | | | 169 | |
| Total | | | | $ | 13,644,436 | | | $ | (353,390 | ) | | | 179 | |
| (a) | | Average number of contracts is based on the average of month end balances for the period ended February 28, 2017. |
|
| 5. AGREEMENTS AND AFFILIATED TRANSACTIONS |
A. Management Agreement — Under the Agreement, GSAM manages the Portfolios, subject to the general supervision of the Trustees.
As compensation for the services rendered pursuant to the Agreement, the assumption of the expenses related thereto and administration of the Portfolios’ business affairs, including providing facilities, GSAM is entitled to a management fee, accrued daily and paid monthly, equal to an annual percentage rate of 0.15% of the Portfolio’s average daily net assets. GSAM has agreed to waive a portion of its management fee in order to achieve an effective rate of 0.08% as an annual percentage rate of average daily net assets of each Portfolio through at least December 29, 2017, and prior to such date, GSAM may not terminate the arrangement without the approval of the Trustees.
B. Distribution and Service (12b-1) Plan — The Trust, on behalf of Class A Shares of each Portfolio, has adopted a Distribution and Service Plan subject to Rule 12b-1 under the Act. Under the Distribution and Service Plan, Goldman Sachs, which serves as distributor (the “Distributor”), is entitled to a fee accrued daily and paid monthly for distribution services and personal and account maintenance services, which may then be paid by Goldman Sachs to authorized dealers. These fees are equal to an annual percentage rate of 0.25% of the average daily net assets attributable to Class A Shares of the Portfolios.
C. Distribution Agreement — Goldman Sachs, as Distributor of the shares of the Portfolios pursuant to a Distribution Agreement, may retain a portion of the Class A Shares’ front end sales charge. During the six months ended February 28, 2017, Goldman Sachs advised that it retained front-end sales charges of $4,329 for the Enhanced Dividend Global Equity Portfolio.
D. Transfer Agency Agreement — Goldman Sachs also serves as the transfer agent of the Portfolios for a fee pursuant to the Transfer Agency Agreement. The fees charged for such transfer agency services are accrued daily and paid monthly at annual rates as follows: 0.19% of the average daily net assets of Class A Shares and 0.04% of the average daily net assets of Institutional Shares.
E. Other Expense Agreements and Affiliated Transactions — GSAM has agreed to limit certain “Other Expenses” of the Portfolios (excluding acquired fund fees and expenses, transfer agency fees and expenses, service fees and shareholder administration fees (as applicable), taxes, interest, brokerage fees, shareholder meeting, litigation, indemnification and extraordinary expenses) to the extent such expenses exceed, on an annual basis, a percentage rate of the average daily net assets of each Portfolio. Such Other Expense reimbursements, if any, are accrued daily and paid monthly. In addition, the Portfolios are not obligated to reimburse GSAM for prior fiscal year expense reimbursements, if any. The Other Expense limitation as an annual percentage rate of average daily net assets for the Portfolios is 0.014%. The Other Expense limitation will remain in place through at least December 29, 2017, and prior to such date GSAM may not terminate the arrangements without the approval of the Trustees. In addition, the Portfolios have entered into certain offset arrangements with the custodian and the transfer agent, which
32
GOLDMAN SACHS GLOBAL TAX-AWARE EQUITY PORTFOLIOS
|
| 5. AGREEMENTS AND AFFILIATED TRANSACTIONS (continued) |
may result in a reduction of the Portfolios’ expenses and are received irrespective of the application of the “Other Expense” limitations described above.
For the six months ended February 28, 2017, these expense reductions, including any fee waivers and Other Expense reimbursements, were as follows:
| | | | | | | | | | | | | | | | | | |
| Portfolio | | | | Management
Fee Waiver | | | Other
Expense
Reimbursement | | | Custody Fee
Credits | | | Total
Expense
Reductions | |
Enhanced Dividend Global Equity | | | | $ | 185,005 | | | $ | 96,583 | | | $ | 3,795 | | | $ | 285,383 | |
Tax-Advantaged Global Equity | | | | | 652,327 | | | | 117,175 | | | | 13,782 | | | | 783,284 | |
F. Line of Credit Facility — As of February 28, 2017, the Portfolios participated in a $1,100,000,000 committed, unsecured revolving line of credit facility (the “facility”) together with other funds of the Trust and certain registered investment companies having management agreements with GSAM or its affiliates. This facility is to be used for temporary emergency purposes, or to allow for an orderly liquidation of securities to meet redemption requests. The interest rate on borrowings is based on the federal funds rate. The facility also requires a fee to be paid by the Portfolios based on the amount of the commitment that has not been utilized. For the six months ended February 28, 2017, the Portfolios did not have any borrowings under the facility.
G. Other Transactions with Affiliates — The Portfolios invest primarily in the Institutional Shares of the Underlying Funds. These Underlying Funds are considered to be affiliated with the Portfolios. The tables below show the transactions in and earnings from investments in these Underlying Funds for the six months ended February 28, 2017:
| | | | | | | | | | | | | | | | | | | | | | | | | | | | | | | | | | | | |
|
| Enhanced Dividend Global Equity | |
| Underlying Funds | | Market Value 08/31/2016 | | | Purchases at Cost* | | | Proceeds from Sales | | | ROC Dividend | | | Net
Realized
Gain (Loss) | | | Change in
Unrealized
Appreciation
(Depreciation) | | | Market Value 02/28/2017 | | | Dividend Income | | | Capital Gain Distributions | |
Goldman Sachs Emerging Markets Equity Insights Fund | | $ | 29,257,840 | | | $ | 4,581,993 | | | $ | (1,725,938 | ) | | $ | — | | | $ | (17,856 | ) | | $ | 1,936,682 | | | $ | 34,032,721 | | | $ | 365,707 | | | $ | — | |
Goldman Sachs International Equity Dividend and Premium Fund | | | 119,638,684 | | | | 17,211,249 | | | | (4,371,568 | ) | | | — | | | | (638,027 | ) | | | 4,477,076 | | | | 136,317,414 | | | | 1,183,762 | | | | — | |
Goldman Sachs International Small Cap Insights Fund | | | 19,487,429 | | | | 2,923,114 | | | | (843,306 | ) | | | — | | | | 18,518 | | | | 703,567 | | | | 22,289,322 | | | | 520,119 | | | | — | |
Goldman Sachs MLP Energy Infrastructure Fund | | | 27,501,403 | | | | 3,510,088 | | | | (555,939 | ) | | | (368,702 | ) | | | (6,824 | ) | | | 2,474,261 | | | | 32,554,287 | | | | 405,101 | | | | — | |
Goldman Sachs Small Cap Equity Insights Fund | | | 44,708,447 | | | | 3,460,700 | | | | (6,203,409 | ) | | | — | | | | 573,527 | | | | 4,348,881 | | | | 46,888,146 | | | | 288,171 | | | | — | |
33
GOLDMAN SACHS GLOBAL TAX-AWARE EQUITY PORTFOLIOS
Notes to Financial Statements (continued)
February 28, 2017 (Unaudited)
|
| 5. AGREEMENTS AND AFFILIATED TRANSACTIONS (continued) |
| | | | | | | | | | | | | | | | | | | | | | | | | | | | | | | | | | | | |
|
| Enhanced Dividend Global Equity (continued) | |
| Underlying Funds | | Market Value 08/31/2016 | | | Purchases at Cost* | | | Proceeds from Sales | | | ROC Dividend | | | Net
Realized
Gain (Loss) | | | Change in
Unrealized
Appreciation
(Depreciation) | | | Market Value 02/28/2017 | | | Dividend Income | | | Capital Gain Distributions | |
Goldman Sachs Tactical Tilt Overlay Fund | | $ | 49,452,111 | | | $ | 6,658,500 | | | $ | (998,095 | ) | | $ | — | | | $ | (66,675 | ) | | $ | 639,536 | | | $ | 55,685,377 | | | $ | 979,065 | | | $ | — | |
Goldman Sachs U.S. Equity Dividend and Premium Fund | | | 217,157,439 | | | | 29,204,902 | | | | (5,932,881 | ) | | | — | | | | (46,837 | ) | | | 6,845,904 | | | | 247,228,527 | | | | 2,113,570 | | | | 8,161,937 | |
Total | | $ | 507,203,353 | | | $ | 67,550,546 | | | $ | (20,631,136 | ) | | $ | (368,702 | ) | | $ | (184,174 | ) | | $ | 21,425,907 | | | $ | 574,995,794 | | | $ | 5,855,495 | | | $ | 8,161,937 | |
| | | | | | | | | | | | | | | | | | | | | | | | | | | | | | | | |
|
| Tax-Advantaged Global Equity | |
| Underlying Funds | | Market Value 08/31/2016 | | | Purchases at Cost* | | | Proceeds from Sales | | | ROC Dividend | | | Net Realized Gain (Loss) | | | Change in
Unrealized
Appreciation (Depreciation) | | | Market Value 02/28/2017 | | | Dividend Income | |
Goldman Sachs Emerging Markets Equity Insights Fund | | $ | 104,981,126 | | | $ | 15,155,503 | | | $ | (8,585,999 | ) | | $ | — | | | $ | (130,211 | ) | | $ | 6,999,189 | | | $ | 118,419,608 | | | $ | 1,287,552 | |
Goldman Sachs International Small Cap Insights Fund | | | 69,371,196 | | | | 9,700,788 | | | | (4,092,054 | ) | | | — | | | | 113,247 | | | | 2,481,338 | | | | 77,574,515 | | | | 1,830,637 | |
Goldman Sachs International Tax-Managed Equity Fund | | | 419,846,351 | | | | 56,964,119 | | | | (18,614,549 | ) | | | — | | | | (584,386 | ) | | | 19,650,501 | | | | 477,262,036 | | | | 7,608,041 | |
Goldman Sachs MLP Energy Infrastructure Fund | | | 97,868,709 | | | | 10,286,675 | | | | (3,185,999 | ) | | | (1,286,948 | ) | | | (818,529 | ) | | | 9,544,157 | | | | 112,408,065 | | | | 1,411,775 | |
Goldman Sachs Tactical Tilt Overlay Fund | | | 175,989,714 | | | | 22,129,748 | | | | (5,719,926 | ) | | | — | | | | (398,852 | ) | | | 2,382,273 | | | | 194,382,957 | | | | 3,452,079 | |
Goldman Sachs U.S. Tax-Managed Equity Fund | | | 931,079,503 | | | | 66,281,346 | | | | (51,428,746 | ) | | | — | | | | (149,026 | ) | | | 94,125,472 | | | | 1,039,908,549 | | | | 9,379,227 | |
Total | | $ | 1,799,136,599 | | | $ | 180,518,179 | | | $ | (91,627,273 | ) | | $ | (1,286,948 | ) | | $ | (1,967,757 | ) | | $ | 135,182,930 | | | $ | 2,019,955,730 | | | $ | 24,969,311 | |
| * | | Includes reinvestment of distributions. |
34
GOLDMAN SACHS GLOBAL TAX-AWARE EQUITY PORTFOLIOS
|
| 5. AGREEMENTS AND AFFILIATED TRANSACTIONS (continued) |
As of February 28, 2017, the Goldman Sachs Global Tax-Aware Equity Portfolios were beneficial owners of 5% or more of total outstanding shares of the following Funds:
| | | | | | | | | | |
| Underlying Funds | | | | Enhanced Dividend
Global Equity | | | Tax-Advantaged
Global Equity | |
Goldman Sachs Emerging Markets Equity Insights Fund | | | | | — | % | | | 13 | % |
Goldman Sachs International Equity Dividend and Premium Fund | | | | | 39 | | | | — | |
Goldman Sachs International Tax-Managed Equity Fund | | | | | — | | | | 89 | |
Goldman Sachs Small Cap Equity Insights Fund | | | | | 18 | | | | — | |
Goldman Sachs U.S. Equity Dividend and Premium Fund | | | | | 8 | | | | — | |
Goldman Sachs U.S. Tax-Managed Equity Fund | | | | | — | | | | 85 | |
|
| 6. PORTFOLIO SECURITIES TRANSACTIONS |
The cost of purchases and proceeds from sales and maturities of long-term securities for the six months ended February 28, 2017 were as follows:
| | | | | | | | | | |
| Portfolio | | | | Purchases | | | Sales | |
Enhanced Dividend Global Equity | | | | $ | 67,550,546 | | | $ | 20,631,136 | |
Tax-Advantaged Global Equity | | | | | 180,518,179 | | | | 91,627,273 | |
As of the Portfolios’ most recent fiscal year end, August 31, 2016, the Portfolios’ capital loss carryforwards and certain timing differences, on a tax-basis were as follows:
| | | | | | | | |
| | | Enhanced Dividend
Global Equity | | | Tax-Advantaged
Global Equity | |
Capital Loss Carryforwards | | | | | | | | |
Perpetual Long-Term | | $ | — | | | $ | (247,758 | ) |
Timing differences (Post October Loss Deferral/Qualified Late Year Loss Deferral) | | | (272,438 | ) | | | (17,375,788 | ) |
As of February 28, 2017, the Portfolios’ aggregate security unrealized gains and losses based on cost for U.S. federal income tax purposes were as follows:
| | | | | | | | |
| | | Enhanced Dividend
Global Equity | | | Tax-Advantaged
Global Equity | |
Tax cost | | $ | 514,923,362 | | | $ | 1,619,552,488 | |
Gross unrealized gain | | | 83,388,515 | | | | 454,363,343 | |
Gross unrealized loss | | | (23,316,083 | ) | | | (53,960,101 | ) |
Net unrealized security gain | | $ | 60,072,432 | | | $ | 400,403,242 | |
35
GOLDMAN SACHS GLOBAL TAX-AWARE EQUITY PORTFOLIOS
Notes to Financial Statements (continued)
February 28, 2017 (Unaudited)
|
| 7. TAX INFORMATION (continued) |
The difference between GAAP-basis and tax-basis unrealized gains (losses) is attributable primarily to wash sales, net mark to market gains (losses) on regulated futures and net mark to market gains (losses) on foreign currency contracts.
GSAM has reviewed the Portfolios’ tax positions for all open tax years (the current and prior three years, as applicable) and has concluded that no provision for income tax is required in the Portfolios’ financial statements. Such open tax years remain subject to examination and adjustment by tax authorities.
The Portfolios’ and Underlying Funds’ risks include, but are not limited to, the following:
Derivatives Risk — The Portfolios’ use of derivatives may result in loss. Derivative instruments, which may pose risks in addition to and greater than those associated with investing directly in securities, currencies or other instruments, may be illiquid or less liquid, volatile, difficult to price and leveraged so that small changes in the value of the underlying instruments may produce disproportionate losses to the Portfolios. Derivatives are also subject to counterparty risk, which is the risk that the other party in the transaction will not fulfill its contractual obligation. The use of derivatives is a highly specialized activity that involves investment techniques and risks different from those associated with investments in more traditional securities and instruments. Losses from derivatives can also result from a lack of correlation between changes in the value of derivative instruments and the portfolio assets (if any) being hedged.
Energy Sector Risk — The Underlying MLP Fund concentrates its investments in the energy sector, and will therefore be susceptible to adverse economic, environmental, business, regulatory or other occurrences affecting that sector. The energy sector has historically experienced substantial price volatility. MLPs and other companies operating in the energy sector are subject to specific risks, including, among others: fluctuations in commodity prices; reduced consumer demand for commodities such as oil, natural gas or petroleum products; reduced availability of natural gas or other commodities for transporting, processing, storing or delivering; slowdowns in new construction; extreme weather or other natural disasters; and threats of attack by terrorists on energy assets. Additionally, changes in the regulatory environment for energy companies may adversely impact their profitability. Over time, depletion of natural gas reserves and other energy reserves may also affect the profitability of energy companies.
Foreign and Emerging Countries Risk — Investing in foreign markets may involve special risks and considerations not typically associated with investing in the U.S. Foreign securities may be subject to risk of loss because of more or less foreign government regulation, less public information and less economic, political and social stability in the countries in which a Portfolio or an Underlying Fund invests. The imposition of exchange controls, confiscations, trade restrictions (including tariffs) and other government restrictions by the U.S. or other governments, or from problems in share registration, settlement or custody, may also result in losses. Foreign risk also involves the risk of negative foreign currency rate fluctuations, which may cause the value of securities denominated in such foreign currency (or other instruments through which a Portfolio or an Underlying Fund has exposure to currencies) to decline in value. Currency exchange rates may fluctuate significantly over short periods of time. To the extent that a Portfolio or an Underlying Fund also invests in securities of issuers located in emerging markets, these risks may be more pronounced.
Investments in the Underlying Funds — The Portfolios invest primarily in a combination of Underlying Funds, and are subject to the risk factors associated with the investments of those Underlying Funds in direct proportion to the amount of assets allocated to each. As of February 28, 2017, the Enhanced Dividend Global Equity Portfolio invested 42.6% and 23.5% of its net assets in the Goldman Sachs U.S. Equity Dividend and Premium Fund (the “U.S. Equity Dividend and Premium Fund”) and the Goldman Sachs International Equity Dividend and Premium Fund (the “International Equity Dividend and Premium Fund”), respectively. Because of the high concentration of its assets in these Underlying Funds, the Enhanced Dividend Global Equity Portfolio has greater exposure to the risks associated with these Underlying Funds than it does to the risks associated with the other Underlying Funds in which it invests. The U.S. Equity Dividend and Premium Fund invests primarily in dividend paying equity investments in large-capitalization U.S. equity issuers, with public stock market capitalizations within the range of the market
36
GOLDMAN SACHS GLOBAL TAX-AWARE EQUITY PORTFOLIOS
|
| 8. OTHER RISKS (continued) |
capitalization of the S&P 500® at the time of investment. This Underlying Fund expects that, under normal circumstances, it will write call options on the S&P 500® Index or related exchange-traded funds in an amount that is between 25% and 75% of the value of its portfolio. The International Equity Dividend and Premium Fund invests primarily in dividend-paying equity investments in companies that are organized outside the U.S. or whose securities are principally traded outside the U.S. with public stock market capitalizations within the range of capitalization of the Morgan Stanley Capital International (“MSCI”) Europe, Australasia, Far East (“EAFE”) Index (“MSCI EAFE Index”) at the time of investment. This Underlying Fund expects that, under normal circumstances, it will write call options on the MSCI EAFE Index, other national or regional stock market indices or related exchange-traded funds in an amount that is between 25% and 75% of the value of its portfolio.
As February 28, 2017, the Tax-Advantaged Global Equity Portfolio invested 51.1% and 23.4% of its net assets in the Goldman Sachs U.S. Tax-Managed Equity Fund (the “U.S. Tax-Managed Equity Fund”) and the Goldman Sachs International Tax-Managed Equity Fund (the “International Tax-Managed Equity Fund”), respectively. Because of the high concentration of its assets in these Underlying Funds, the Tax-Advantaged Global Equity Portfolio has greater exposure to the risks associated with these Underlying Funds than it does to the risks associated with the other Underlying Funds in which it invests. The U.S. Tax-Managed Equity Fund invests in a broadly diversified portfolio of equity investments in U.S. issuers, including foreign issuers that are traded in the U.S. This Underlying Fund will seek to maintain risk, style, capitalization and industry characteristics similar to the Russell 3000 Index. The International Tax-Managed Equity Fund invests primarily in international equity securities. This Underlying Fund will seek to maintain risk, style, capitalization and industry characteristics similar to the MSCI EAFE Index. The investment adviser may seek tax-efficiency by offsetting gains and losses, limiting portfolio turnover or selling high tax basis securities for both Underlying Funds.
The Portfolios do not invest in the Underlying Funds for the purpose of exercising management or control; however, investments by the Portfolios within their principal investment strategies may represent a significant portion of an Underlying Fund’s net assets.
Large Shareholder Transactions Risk — A Portfolio or an Underlying Fund may experience adverse effects when certain large shareholders, such as other funds, institutional investors (including those trading by use of non-discretionary mathematical formulas), financial intermediaries (who may make investment decisions on behalf of underlying clients and/or include a Portfolio or an Underlying Fund in their investment model), individuals, accounts and Goldman Sachs affiliates, purchase or redeem large amounts of shares of a Portfolio or an Underlying Fund. Such large shareholder redemptions may cause a Portfolio or an Underlying Fund to sell portfolio securities at times when it would not otherwise do so, which may negatively impact a Portfolio’s or an Underlying Fund’s NAV and liquidity. These transactions may also accelerate the realization of taxable income to shareholders if such sales of investments resulted in gains, and may also increase transaction costs. In addition, a large redemption could result in a Portfolio’s or an Underlying Fund’s current expenses being allocated over a smaller asset base, leading to an increase in the Portfolio’s or the Underlying Fund’s expense ratio. Similarly, large Portfolio or Underlying Fund share purchases may adversely affect the Portfolio’s or an Underlying Fund’s performance to the extent that the Portfolio or the Underlying Fund is delayed in investing new cash and is required to maintain a larger cash position than it ordinarily would.
Liquidity Risk — An Underlying Fund may make investments that are illiquid or that may become less liquid in response to market developments or adverse investor perceptions. Illiquid investments may be more difficult to value. Liquidity risk may also refer to the risk that a Portfolio will not be able to pay redemption proceeds within the allowable time period because of unusual market conditions, an unusually high volume of redemption requests, or other reasons. To meet redemption requests, a Portfolio may be forced to sell investments at an unfavorable time and/or under unfavorable conditions. Liquidity risk may be the result of, among other things, the reduced number and capacity of traditional market participants to make a market in fixed income securities or the lack of an active market. The potential for liquidity risk may be magnified by a rising interest rate environment or other circumstances where investor redemptions from fixed income mutual funds may be higher than normal, potentially causing increased supply in the market due to selling activity.
37
GOLDMAN SACHS GLOBAL TAX-AWARE EQUITY PORTFOLIOS
Notes to Financial Statements (continued)
February 28, 2017 (Unaudited)
|
| 8. OTHER RISKS (continued) |
Market and Credit Risks — In the normal course of business, a Portfolio and an Underlying Fund trade financial instruments and enter into financial transactions where risk of potential loss exists due to changes in the market (market risk). Additionally, a Portfolio and/or an Underlying Fund may also be exposed to credit risk in the event that an issuer or guarantor fails to perform or that an institution or entity with which the Portfolio and the Underlying Fund have unsettled or open transactions defaults.
Under the Trust’s organizational documents, its Trustees, officers, employees and agents are indemnified, to the extent permitted by the Act and state law, against certain liabilities that may arise out of performance of their duties to the Portfolios. Additionally, in the course of business, the Portfolios enter into contracts that contain a variety of indemnification clauses. The Portfolios’ maximum exposure under these arrangements is unknown, as this would involve future claims that may be made against the Portfolios that have not yet occurred. However, GSAM believes the risk of loss under these arrangements to be remote.
Subsequent events after the Statements of Assets and Liabilities date have been evaluated and GSAM has concluded that there is no impact requiring adjustment or disclosure in the financial statements.
38
GOLDMAN SACHS GLOBAL TAX-AWARE EQUITY PORTFOLIOS
|
| 11. SUMMARY OF SHARE TRANSACTIONS |
Share activity is as follows:
| | | | | | | | | | | | | | | | |
| | | Enhanced Dividend Global Equity Portfolio | |
| | | | |
| | | For the Six Months Ended
February 28, 2017
(Unaudited) | | | For the Fiscal Year Ended
August 31, 2016 | |
| | | | |
| | | Shares | | | Dollars | | | Shares | | | Dollars | |
| | | | |
| Class A Shares | | | | | | | | | | | | | | | | |
Shares sold | | | 279,853 | | | $ | 3,050,407 | | | | 333,387 | | | $ | 3,394,652 | |
Reinvestment of distributions | | | 10,642 | | | | 115,865 | | | | 12,636 | | | | 128,549 | |
Shares redeemed | | | (101,239 | ) | | | (1,100,861 | ) | | | (40,422 | ) | | | (412,570 | ) |
| | | | 189,256 | | | | 2,065,411 | | | | 305,601 | | | | 3,110,631 | |
| Institutional Shares | | | | | | | | | | | | | | | | |
Shares sold | | | 4,563,876 | | | | 50,401,926 | | | | 13,147,341 | | | | 133,693,478 | |
Reinvestment of distributions | | | 934,501 | | | | 10,255,701 | | | | 2,766,887 | | | | 28,335,991 | |
Shares redeemed | | | (2,105,947 | ) | | | (23,012,765 | ) | | | (8,171,797 | ) | | | (85,381,488 | ) |
| | | | 3,392,430 | | | | 37,644,862 | | | | 7,742,431 | | | | 76,647,981 | |
NET INCREASE | | | 3,581,686 | | | $ | 39,710,273 | | | | 8,048,032 | | | $ | 79,758,612 | |
Share activity is as follows:
| | | | | | | | | | | | | | | | |
| | | Tax-Advantaged Global Equity Portfolio | |
| | | | |
| | | For the Six Months Ended
February 28, 2017
(Unaudited) | | | For the Fiscal Year Ended
August 31, 2016 | |
| | | | |
| | | Shares | | | Dollars | | | Shares | | | Dollars | |
| | | | |
| Class A Shares | | | | | | | | | | | | | | | | |
Shares sold | | | — | | | $ | 5 | | | | 13,301 | | | $ | 169,147 | |
Reinvestment of distributions | | | 245 | | | | 3,269 | | | | 1,101 | | | | 13,779 | |
Shares redeemed | | | (8,364 | ) | | | (108,850 | ) | | | (11,788 | ) | | | (142,955 | ) |
| | | | (8,119 | ) | | | (105,576 | ) | | | 2,614 | | | | 39,971 | |
| Institutional Shares | | | | | | | | | | | | | | | | |
Shares sold | | | 12,790,300 | | | | 170,589,469 | | | | 29,366,174 | | | | 357,322,219 | |
Reinvestment of distributions | | | 1,596,175 | | | | 21,197,201 | | | | 3,455,621 | | | | 43,060,863 | |
Shares redeemed | | | (9,225,780 | ) | | | (121,758,555 | ) | | | (27,315,060 | ) | | | (334,445,556 | ) |
| | | | 5,160,695 | | | | 70,028,115 | | | | 5,506,735 | | | | 65,937,526 | |
NET INCREASE | | | 5,152,576 | | | $ | 69,922,539 | | | | 5,509,349 | | | $ | 65,977,497 | |
39
GOLDMAN SACHS GLOBAL TAX-AWARE EQUITY PORTFOLIOS
| | |
Portfolio Expenses — Six Month Period Ended February 28, 2017 (Unaudited) | | |
As a shareholder of Class A or Institutional Shares of a Portfolio, you incur two types of costs: (1) transaction costs, including sales charges on purchase payments (with respect to Class A Shares), and (2) ongoing costs, including management fees; distribution and/or service (12b-1) fees (with respect to Class A Shares); and other Portfolio expenses. This example is intended to help you understand your ongoing costs (in dollars) of investing in Class A and Institutional Shares of the Portfolios and to compare these costs with the ongoing costs of investing in other mutual funds.
The example is based on an investment of $1,000 invested at the beginning of the period and held for the entire period from September 1, 2016 through February 28, 2017, which represents a period of 181 days of a 365 day year.
Actual Expenses — The first line under each share class in the table below provides information about actual account values and actual expenses. You may use the information in this line, together with the amount you invested, to estimate the expenses that you paid over the period. Simply divide your account value by $1,000 (for example, an $8,600 account value divided by $1,000=8.6), then multiply the result by the number in the first line under the heading entitled “Expenses Paid” to estimate the expenses you paid on your account during this period.
Hypothetical Example for Comparison Purposes — The second line under each share class in the table below provides information about hypothetical account values and hypothetical expenses based on the Portfolios’ actual net expense ratios and an assumed rate of return of 5% per year before expenses, which is not the Portfolios’ actual return. The hypothetical account values and expenses may not be used to estimate the actual ending account balance or expenses you paid for the period. You may use this information to compare the ongoing costs of investing in the Portfolios and other funds. To do so, compare this 5% hypothetical example with the 5% hypothetical examples that appear in the shareholder reports of the other funds.
Please note that the expenses shown in the table are meant to highlight your ongoing costs only and do not reflect any transactional costs, such as sales charges, redemption fees, or exchange fees and do not include expenses of Underlying Funds in which the Portfolios invest. Therefore, the second line of the table is useful in comparing ongoing costs only and will not help you determine the relative total costs of owning different funds. In addition, if these transactional costs were included, your costs would have been higher.
| | | | | | | | | | | | | | | | | | | | | | | | |
| | | Enhanced Dividend Global Equity Portfolio | | | Tax-Advantaged Global Equity Portfolio | |
| Share Class | | Beginning
Account Value
9/01/16 | | | Ending
Account Value
2/28/17 | | | Expenses
Paid for the
6 Months
Ended
2/28/17* | | | Beginning
Account Value
9/01/16 | | | Ending
Account Value
2/28/17 | | | Expenses
Paid for the
6 Months
Ended
2/28/17* | |
| Class A | | | | | | | | | | | | | | | | | | | | | | | | |
Actual | | $ | 1,000 | | | $ | 1,072.90 | | | $ | 2.72 | | | $ | 1,000 | | | $ | 1,090.70 | | | $ | 2.75 | |
Hypothetical 5% return | | | 1,000 | | | | 1,022.17 | + | | | 2.66 | | | | 1,000 | | | | 1,022.17 | + | | | 2.66 | |
| Institutional | | | | | | | | | | | | | | | | | | | | | | | | |
Actual | | | 1,000 | | | | 1,074.60 | | | | 0.67 | | | | 1,000 | | | | 1,093.70 | | | | 0.67 | |
Hypothetical 5% return | | | 1,000 | | | | 1,024.15 | + | | | 0.65 | | | | 1,000 | | | | 1,024.15 | + | | | 0.65 | |
| | * | | Expenses are calculated using each Portfolio’s annualized net expense ratio for each class, which represents the ongoing expenses as a percentage of net assets for the six months ended February 28, 2017. Expenses are calculated by multiplying the annualized net expense ratio by the average account value for the period; then multiplying the result by the number of days in the most recent fiscal half year; and then dividing that result by the number of days in the fiscal year. The annualized net expense ratios for the period were as follows: | |
| | | | | | | | |
| Portfolio | | Class A | | | Institutional | |
Enhanced Dividend Global Equity | | | 0.53 | % | | | 0.13 | % |
Tax-Advantaged Global Equity | | | 0.53 | | | | 0.13 | |
| | + | | Hypothetical expenses are based on each Portfolio’s actual annualized net expense ratios and an assumed rate of return of 5% per year before expenses. | |
40
FUNDS PROFILE
Goldman Sachs Funds
Goldman Sachs is a premier financial services firm, known since 1869 for creating thoughtful and customized investment solutions in complex global markets.
Today, the Investment Management Division of Goldman Sachs serves a diverse set of clients worldwide, including private institutions, public entities and individuals. With approximately $1.17 trillion in assets under supervision as of December 31, 2016, Goldman Sachs Asset Management (“GSAM”) has portfolio management teams located around the world and our investment professionals bring firsthand knowledge of local markets to every investment decision. Assets under supervision includes assets under management and other client assets for which Goldman Sachs does not have full discretion. GSAM leverages the resources of Goldman, Sachs & Co. subject to legal, internal and regulatory restrictions.
Money Market
Financial Square FundsSM
| ∎ | | Financial Square Treasury Solutions Fund1 |
| ∎ | | Financial Square Government Fund1 |
| ∎ | | Financial Square Money Market Fund2 |
| ∎ | | Financial Square Prime Obligations Fund2 |
| ∎ | | Financial Square Treasury Instruments Fund1 |
| ∎ | | Financial Square Treasury Obligations Fund1 |
| ∎ | | Financial Square Federal Instruments Fund1 |
| ∎ | | Financial Square Tax-Exempt Money Market Fund2 |
Investor FundsSM
| ∎ | | Investor Money Market Fund3 |
| ∎ | | Investor Tax-Exempt Money Market Fund3 |
Fixed Income
Short Duration and Government
| ∎ | | High Quality Floating Rate Fund |
| ∎ | | Short-Term Conservative Income Fund4 |
| ∎ | | Short Duration Government Fund |
| ∎ | | Short Duration Income Fund |
| ∎ | | Inflation Protected Securities Fund |
Multi-Sector
Municipal and Tax-Free
| ∎ | | High Yield Municipal Fund |
| ∎ | | Dynamic Municipal Income Fund |
| ∎ | | Short Duration Tax-Free Fund |
Single Sector
| ∎ | | Investment Grade Credit Fund |
| ∎ | | High Yield Floating Rate Fund |
| ∎ | | Emerging Markets Debt Fund |
| ∎ | | Local Emerging Markets Debt Fund |
| ∎ | | Dynamic Emerging Markets Debt Fund |
Fixed Income Alternatives
| ∎ | | Long Short Credit Strategies Fund |
| ∎ | | Fixed Income Macro Strategies Fund |
Fundamental Equity
| ∎ | | Small/Mid Cap Value Fund |
| ∎ | | Small/Mid Cap Growth Fund |
| ∎ | | Flexible Cap Growth Fund |
| ∎ | | Concentrated Growth Fund |
| ∎ | | Technology Opportunities Fund |
| ∎ | | Growth Opportunities Fund |
| ∎ | | Rising Dividend Growth Fund |
| ∎ | | Dynamic U.S. Equity Fund |
Tax-Advantaged Equity
| ∎ | | U.S. Tax-Managed Equity Fund |
| ∎ | | International Tax-Managed Equity Fund |
| ∎ | | U.S. Equity Dividend and Premium Fund |
| ∎ | | International Equity Dividend and Premium Fund |
Equity Insights
| ∎ | | Small Cap Equity Insights Fund |
| ∎ | | U.S. Equity Insights Fund |
| ∎ | | Small Cap Growth Insights Fund |
| ∎ | | Large Cap Growth Insights Fund |
| ∎ | | Large Cap Value Insights Fund |
| ∎ | | Small Cap Value Insights Fund |
| ∎ | | International Small Cap Insights Fund |
| ∎ | | International Equity Insights Fund |
| ∎ | | Emerging Markets Equity Insights Fund |
Fundamental Equity International
| ∎ | | Strategic International Equity Fund |
| ∎ | | Focused International Equity Fund |
| ∎ | | Emerging Markets Equity Fund |
Select Satellite
| ∎ | | Real Estate Securities Fund |
| ∎ | | International Real Estate Securities Fund |
| ∎ | | Commodity Strategy Fund |
| ∎ | | Global Real Estate Securities Fund |
| ∎ | | Dynamic Allocation Fund |
| ∎ | | Absolute Return Tracker Fund |
| ∎ | | Managed Futures Strategy Fund |
| ∎ | | MLP Energy Infrastructure Fund |
| ∎ | | Multi-Manager Alternatives Fund |
| ∎ | | Absolute Return Multi-Asset Fund |
| ∎ | | Global Infrastructure Fund |
Total Portfolio Solutions
| ∎ | | Global Managed Beta Fund |
| ∎ | | Multi-Manager Non-Core Fixed Income Fund |
| ∎ | | Multi-Manager U.S. Dynamic Equity Fund |
| ∎ | | Multi-Manager Global Equity Fund |
| ∎ | | Multi-Manager International Equity Fund |
| ∎ | | Tactical Tilt Overlay Fund5 |
| ∎ | | Balanced Strategy Portfolio |
| ∎ | | Multi-Manager U.S. Small Cap Equity Fund |
| ∎ | | Multi-Manager Real Assets Strategy Fund |
| ∎ | | Growth and Income Strategy Portfolio |
| ∎ | | Growth Strategy Portfolio |
| ∎ | | Equity Growth Strategy Portfolio |
| ∎ | | Satellite Strategies Portfolio |
| ∎ | | Enhanced Dividend Global Equity Portfolio |
| ∎ | | Tax-Advantaged Global Equity Portfolio |
| ∎ | | Strategic Factor Allocation Fund |
| ∎ | | Target Date 2020 Portfolio |
| ∎ | | Target Date 2025 Portfolio |
| ∎ | | Target Date 2030 Portfolio |
| ∎ | | Target Date 2035 Portfolio |
| ∎ | | Target Date 2040 Portfolio |
| ∎ | | Target Date 2045 Portfolio |
| ∎ | | Target Date 2050 Portfolio |
| ∎ | | Target Date 2055 Portfolio |
| ∎ | | GQG Partners International Opportunities Fund |
| 1 | | You could lose money by investing in the Fund. Although the Fund seeks to preserve the value of your investment at $1.00 per share, it cannot guarantee it will do so. An investment in the Fund is not a deposit of a bank and is not insured or guaranteed by the Federal Deposit Insurance Corporation or any other government agency. The Fund’s sponsor has no legal obligation to provide financial support to the Fund, and you should not expect that the sponsor will provide financial support to the Fund at any time. |
| 2 | | You could lose money by investing in the Fund. Because the share price of the Fund will fluctuate, when you sell your shares they may be worth more or less than what you originally paid for them. The Fund may impose a fee upon sale of your shares or may temporarily suspend your ability to sell shares if the Fund’s liquidity falls below required minimums because of market conditions or other factors. An investment in the Fund is not a deposit of a bank and is not insured or guaranteed by the Federal Deposit Insurance Corporation or any other government agency. The Fund’s sponsor has no legal obligation to provide financial support to the Fund, and you should not expect that the sponsor will provide financial support to the Fund at any time. |
| 3 | | You could lose money by investing in the Fund. Although the Fund seeks to preserve the value of your investment at $1.00 per share, it cannot guarantee it will do so. The Fund may impose a fee upon sale of your shares or may temporarily suspend your ability to sell shares if the Fund’s liquidity falls below required minimums because of market conditions or other factors. An investment in the Fund is not a deposit of a bank and is not insured or guaranteed by the Federal Deposit Insurance Corporation or any other government agency. The Fund’s sponsor has no legal obligation to provide financial support to the Fund, and you should not expect that the sponsor will provide financial support to the Fund at any time. |
| 4 | | Effective on July 29, 2016, the Goldman Sachs Limited Maturity Obligations Fund was renamed the Goldman Sachs Short-Term Conservative Income Fund. |
| 5 | | Effective on June 1, 2016, the Goldman Sachs Tactical Tilt Implementation Fund was renamed the Goldman Sachs Tactical Tilt Overlay Fund. |
| | | Financial Square FundsSM and Investor FundsSM are registered service marks of Goldman, Sachs & Co. |
| * | | This list covers open-end funds only. Please visit our website at www.GSAMFUNDS.com to learn about our closed-end funds and exchange-traded funds. |
| | |
TRUSTEES Ashok N. Bakhru, Chairman Kathryn A. Cassidy Diana M. Daniels Herbert J. Markley James A. McNamara Jessica Palmer Roy W. Templin Gregory G. Weaver | | OFFICERS James A. McNamara, President Scott M. McHugh, Principal Financial Officer, Senior Vice President and Treasurer Caroline L. Kraus, Secretary |
| |
GOLDMAN, SACHS & CO. Distributor and Transfer Agent | | GOLDMAN SACHS ASSET MANAGEMENT, L.P. Investment Adviser |
Visit our web site at www.GSAMFUNDS.com to obtain the most recent month-end returns.
Goldman Sachs Asset Management, L.P., 200 West Street, New York, New York 10282
The reports concerning the Portfolios included in this shareholder report may contain certain forward-looking statements about the factors that may affect the performance of the Portfolios in the future. These statements are based on Portfolio management’s predictions and expectations concerning certain future events and their expected impact on the Portfolios, such as performance of the economy as a whole and of specific industry sectors, changes in the levels of interest rates, the impact of developing world events, and other factors that may influence the future performance of the Portfolios. Management believes these forward-looking statements to be reasonable, although they are inherently uncertain and difficult to predict. Actual events may cause adjustments in portfolio management strategies from those currently expected to be employed.
A description of the policies and procedures that the Portfolios use to determine how to vote proxies relating to portfolio securities and information regarding how a Portfolio voted proxies relating to portfolio securities during the most recent 12-month period ended June 30 is available (i) without charge, upon request by calling 1-800-526-7384 (for Retail Shareholders) or 1-800-621-2550 (for Institutional Shareholders); and (ii) on the Securities and Exchange Commission (“SEC”) web site at http://www.sec.gov.
The Portfolios file their complete schedule of portfolio holdings with the SEC for the first and third quarters of each fiscal year on Form N-Qs. The Portfolios’ Form N-Qs are available on the SEC’s web site at http://www.sec.gov within 60 days after the Portfolios’ first and third fiscal quarters. The Portfolios’ Form N-Qs may be reviewed and copied at the SEC’s Public Reference Room in Washington, D.C. and information on the operation of the Public Reference Room may also be obtained by calling 1-800-SEC-0330. Forms N-Qs may be obtained upon request and without charge by calling 1-800-526-7384 (for Retail Shareholders) or 1-800-621-2550 (for Institutional Shareholders).
Economic and market forecasts presented herein reflect our judgment as of the date of this report and are subject to change without notice. These forecasts do not take into account the specific investment objectives, restrictions, tax and financial situation or other needs of any specific client. Actual data will vary and may not be reflected here. These forecasts are subject to high levels of uncertainty that may affect actual performance. Accordingly, these forecasts should be viewed as merely representative of a broad range of possible outcomes. These forecasts are estimated, based on assumptions, and are subject to significant revision and may change materially as economic and market conditions change. Goldman Sachs has no obligation to provide updates or changes to these forecasts. Case studies and examples are for illustrative purposes only.
Goldman, Sachs & Co. (“Goldman Sachs”) does not provide legal, tax or accounting advice. Any statement contained in this communication (including any attachments) concerning U.S. tax matters was not intended or written to be used, and cannot be used, for the purpose of avoiding penalties under the Internal Revenue Code, and was written to support the promotion or marketing of the transaction(s) or matter(s) addressed. Clients of Goldman Sachs should obtain their own independent tax advice based on their particular circumstances.
Fund holdings and allocations shown are as of February 28, 2017 and may not be representative of future investments. Portfolio holdings should not be relied on in making investment decisions and should not be construed as research or investment advice regarding particular securities. Current and future holdings are subject to risk. Diversification does not protect an investor from market risk and does not ensure a profit.
This material is not authorized for distribution to prospective investors unless preceded or accompanied by a current Prospectus or summary prospectus, if applicable. Investors should consider a Portfolio’s objective, risks, and charges and expenses, and read the summary prospectus, if available, and/or the Prospectus carefully before investing or sending money. The summary prospectus, if available, and the Prospectus contain this and other information about a Portfolio and may be obtained from your authorized dealer or from Goldman, Sachs & Co. by calling (retail – 1-800-526-7384) (institutional – 1-800-621-2550).
Goldman, Sachs & Co. is the distributor of the Goldman Sachs Funds.
© 2017 Goldman Sachs. All rights reserved. 88127-TMPL-04/2017-516491/TAGEDSAR-17/2.8K
Goldman Sachs Funds

| | | | |
| | |
| Semi-Annual Report | | | | February 28, 2017 |
| | |
| | | | Strategic Factor Allocation Fund |

Goldman Sachs Strategic Factor Allocation Fund
| | | | |
TABLE OF CONTENTS | | | | |
| |
Portfolio Management Discussions and Performance Summary | | | 1 | |
| |
Index Definition | | | 6 | |
| |
Schedule of Investments | | | 7 | |
| |
Financial Statements | | | 9 | |
| |
Financial Highlights | | | 12 | |
| |
Notes to the Financial Statements | | | 14 | |
| |
Other Information | | | 24 | |
| | | | |
| | | |
| NOT FDIC-INSURED | | May Lose Value | | No Bank Guarantee |
PORTFOLIO RESULTS
Goldman Sachs Strategic Factor Allocation Fund
Investment Objective and Principal Strategy
The Portfolio seeks long-term total return.
Portfolio Management Discussion and Analysis
Below, the Goldman Sachs Quantitative Investment Strategies Team (“QIS Team”) discusses the Goldman Sachs Strategic Factor Allocation Fund’s (the “Portfolio”) performance and positioning for the six-month period ended February 28, 2017 (the “Reporting Period”).
| Q | | How did the Portfolio perform during the Reporting Period? |
| A | | During the Reporting Period, the Portfolio’s Institutional Shares generated a cumulative total return of 2.79%. This compares to the 3.80% cumulative total return of the Portfolio’s blended benchmark, the Strategic Factor Allocation Composite Index (the “Index”), which is composed 50% of the S&P 500® Index and 50% of the Bloomberg Barclays U.S. Aggregate Bond Index, during the same period. |
| | The components of the Portfolio’s blended benchmark, the S&P 500® Index and the Bloomberg Barclays U.S. Aggregate Bond Index, generated cumulative total returns of 10.01% and -2.19%, respectively, during the Reporting Period. |
| Q | | What economic and market factors most influenced the Portfolio as a whole during the Reporting Period? |
| A | | During the Reporting Period, unexpected political events in the U.S. and abroad, as well as global central bank monetary policy, influenced the performance of the financial markets and the Portfolio. Overall, U.S. and international equities notched solid gains, while the broad fixed income market generally produced negative returns. |
| | As the Reporting Period began in early September 2016, U.S. and international equities alike fell, as the European Central Bank (“ECB”) disappointed markets with its lack of commitment to extend quantitative easing. Later in the month, the Federal Reserve (the “Fed”) left its monetary policy unchanged, and the Bank of Japan (“BoJ”) introduced a 0% target for its 10-year government bond yield to exercise “yield curve control.” (The yield curve control framework is designed to steepen Japan’s government bond yield curve and alleviate the impact on financial institutions of low longer-term rates. Yield curve is a spectrum of maturities.) U.S. and international equities rebounded following the Fed and BoJ decisions, which the markets appeared to view as generally benign. In October 2016, a combination of hawkish Fed commentary and mounting strong U.S. economic data led to increased market pricing for a December 2016 interest rate hike. (Hawkish tends to suggest higher interest rates; opposite of dovish.) The U.S. Department of Commerce announced the U.S. Gross Domestic Product (“GDP”) increased by 3.5% on an annualized basis for the third quarter of 2016, above consensus expectations and the strongest growth rate in two years. Meanwhile, ECB minutes stressed a commitment to ongoing monthly bond-buying of 80 billion euros through at least March 2017, helping to dispel market concerns about potential tapering. The U.K.’s first official GDP growth figure since the Brexit referendum, the U.K.’s June 2016 vote to leave the European Union, was more robust than consensus-expected at 0.5%. Japanese equities enjoyed strong performance owing to weakness in the Japanese yen, as BoJ governor Haruhiko Kuroda stated there was room for further easing if necessary to achieve the BoJ’s 2% inflation target. Following the unexpected victory of Donald Trump in the November 2016 U.S. elections, U.S. and international equities rallied on anticipation of a pro-growth effect of Mr. Trump’s fiscal stimulus plan, though international equities recorded a modest decline for the month overall. The Fed raised rates 0.25% in December 2016, for the first time in a year but as had largely been anticipated, and set a more hawkish rate hike path for 2017. Although U.S. equities declined modestly after the announcement, they advanced for December 2016 overall. International equities also posted solid gains during the month, which was highlighted by the resignation of Prime Minister Matteo Renzi after Italian voters’ rejection of that nation’s constitutional reform referendum and the ECB’s decision to slow its monthly pace of quantitative easing while extending the program to the end of 2017. In January 2017, investors searched for details on the timing and scope |
1
PORTFOLIO RESULTS
| | behind President Trump’s proclamations during his press conferences, inaugural speech and first days in office. In this environment, U.S. and international equities rallied to new highs on the prospect of deregulation following executive orders on oil pipelines and on optimism around infrastructure spending after a $1 trillion proposal from Senate Democrats made headlines. U.S. and international equities subsequently retreated on political uncertainty and market concerns about protectionism following President Trump’s executive orders on immigration, a border wall and U.S. withdrawal from the Trans-Pacific Partnership, popularly known as TPP. Amid a busy political agenda, U.S. economic data released in January 2017 remained encouraging. U.K. equities fell after a speech by Prime Minister Theresa May was interpreted by the markets as increasing the possibility of a “hard Brexit.” (In a hard Brexit, the U.K. would leave the European Union, as well as its single market for goods, quickly and completely.) In France, allegations about the employment in parliament of presidential candidate Francois Fillon’s wife increased market uncertainty about the country’s upcoming election. The Japanese yen appreciated sharply and Japanese equities retreated. In February 2017, U.S. and international equities posted gains as investors continued to assess the outlook for potential tax reform, deregulation and other economic policies out of the Trump administration, while also heeding the tone of Fed officials. The U.S. dollar strengthened during the month, as the market-implied probability of a March 2017 interest rate hike increased with Fed Chair Janet Yellen’s testimony before Congress and hawkish comments from other Fed officials. Solid U.S. economic data also supported the market’s advance, with the Institute of Supply Management’s manufacturing and non-manufacturing indices rising to a two-year and six-year high, respectively, during February 2017. Meanwhile, the Markit Eurozone Composite Flash Purchasing Managers’ Index (“PMI”) reached its highest levels in nearly six years. |
| | In the fixed income markets during September 2016, spread, or non-government bond, sectors outperformed U.S. Treasury securities. The Fed kept the target range for the federal funds rate unchanged at its September 2016 policy meeting after a summer of speeches by Fed officials that fluctuated between dovish and hawkish tones. The ECB also left its monetary policy unchanged during the month, while the BoJ extended its quantitative and qualitative monetary easing framework to include “yield curve control.” In the fourth quarter of 2016, spread sectors generally outpaced U.S. Treasury securities. In early November 2016, Donald Trump’s victory in the U.S. Presidential election led to a change in investor expectations for future monetary, fiscal and regulatory policy. More specifically, investors appeared to anticipate fiscal stimulus, a looser regulatory agenda and a faster pace of Fed monetary policy tightening. After the U.S. election, global interest rates rose and the U.S. dollar strengthened versus other developed markets and emerging markets currencies. Meanwhile, the U.S. economy continued to strengthen, with strong jobs growth and increased consumer spending reported. In December 2016, the Fed raised the targeted federal funds rate 0.25% to a range of between 0.50% and 0.75%. The interest rate hike resulted in a further rise in U.S. Treasury yields, with a notable increase in shorter-term yields, and additional appreciation in the U.S. dollar. In Europe, the ECB announced it would reduce its monthly pace of asset purchases starting in April 2017, but stated it would extend its quantitative easing program to the end of 2017. On the political front, Italy voted to reject constitutional reforms, while the outcome of Austria’s election defied the populist tide that had claimed victories in the U.K. and U.S. during 2016. In the fourth quarter of 2016, the Japanese economy expanded by 1.2%, annualized, from the previous calendar quarter. Crude oil prices rose following an agreement by the Organization of the Petroleum Exporting Countries (“OPEC”) and non-OPEC producers to cut production, which provided support for energy issuers within the corporate credit market as well as for oil-exporting emerging economies. During January 2017, spread sectors generally outperformed U.S. Treasury securities. The U.S. dollar fluctuated on comments from President Trump as well as on protectionist measures, such as the U.S. withdrawal from the TPP. Major developed markets’ central banks kept monetary policy unchanged at their first meetings of the year. Global economic activity improved, with the global manufacturing PMI rising for a fifth consecutive month, driven mainly by emerging markets countries. Most spread sectors outpaced U.S. Treasury securities during February 2017, with improved global economic growth and a recovery in commodity prices providing support to riskier asset classes, including high yield corporate bonds. Strong U.S. economic data and hawkish comments from Fed policymakers increased market expectations for a rate hike in March 2017. In Europe, uncertainty surrounding upcoming political events clouded marginal improvements in economic data. U.K. economic data, which had been resilient since the Brexit vote, began to deteriorate. |
2
PORTFOLIO RESULTS
| Q | | What were the primary contributors to and detractors from the Portfolio’s performance during the Reporting Period? |
| A | | The Portfolio seeks to achieve its investment objective through the implementation of the Goldman Sachs Strategic Factor Allocation process (“Strategic Allocation”), which is derived from the Goldman Sachs Investment Strategy Group’s (“ISG”) market views on a variety of asset classes and instruments. The Strategic Allocation was developed to provide exposure to “factors,” which are academically derived drivers of investment returns that the Goldman Sachs ISG believes offer the potential for greater and more consistent returns in various market environments. These factors include, but are not limited to, Equity, Term, Flow and Volatility. The Equity factor seeks to capture the premium associated with equity risk. The Term factor seeks to capture the premium associated with interest rate and inflation risk. The Flow factor seeks to systematically capitalize on flows within and across asset classes. The Volatility factor seeks to capture the “fear premium” associated with equity risk. (The fear premium is the amount investors tend to overpay to preserve capital during periods of financial market volatility.) The QIS Team implements the Strategic Allocation by investing primarily in derivatives; pooled investment vehicles, such as exchange-traded funds (“ETFs”), exchange-traded notes (“ETNs”) and underlying funds; and equities, fixed income and currencies. |
| | During the Reporting Period, the Strategic Allocation overall detracted from the Portfolio’s performance relative to the Index. The Term and Flow factors hurt the Portfolio’s results, while the Equity and Volatility factors contributed positively. |
| | In terms of underlying asset classes and instruments, the Portfolio’s allocation to U.S. fixed income hampered its relative returns. An allocation to listed U.S. equity index options added to performance. Holdings of U.S. equities and the Portfolio’s cash position also bolstered results. |
| | Positions in developed markets currencies, accomplished through foreign currency exchange forward contracts, was mixed. The Portfolio’s exposure to the Japanese yen and the New Zealand dollar hurt performance. These results were largely offset by positions in the euro and Canadian dollar, which added to returns. The Portfolio’s positions in the British pound and the Swiss franc did not have a meaningful impact on results. During the Reporting Period, the Portfolio did not have an allocation to the Australian dollar. |
| Q | | How was the Portfolio positioned at the beginning of the Reporting Period? |
| A | | In terms of its Strategic Allocation at the start of the Reporting Period, the Portfolio had relatively equal weightings in the Equity, Flow and Volatility factors. It had a relatively smaller weighting in the Term factor. |
| | In terms of underlying asset classes and instruments, the Portfolio maintained positions in U.S. equities, listed U.S. equity index options and U.S. fixed income. In terms of currencies, it held long positions versus the U.S. dollar in the Canadian dollar and the British pound. It held short positions versus the U.S. dollar in the Japanese yen and the Swiss franc. |
| Q | | How did the Portfolio use derivatives and similar instruments during the Reporting Period? |
| A | | The Portfolio uses derivatives for both hedging and non-hedging purposes in the implementation of the Strategic Allocation. During the Reporting Period, the Portfolio employed listed equity index options to implement views on the U.S. equity market, which added to performance. It used bond futures to express views on the U.S. fixed income market. The bond futures position detracted from results. In addition, the Portfolio utilized foreign currency exchange forward contracts to take long and short positions in select developed markets currencies. Foreign currency exchange forward contracts had a relatively neutral impact on the Portfolio’s results during the Reporting Period. |
| Q | | How was the Portfolio positioned at the end of the Reporting Period? |
| A | | In terms of its Strategic Allocation at the end of the Reporting Period, the Portfolio maintained relatively equal weightings in the Equity, Flow and Volatility factors. It continued to have a relatively smaller weighting in the Term factor. |
| | In terms of underlying asset classes and instruments, the Portfolio maintained positions in U.S. equities, listed U.S. equity index options and U.S. fixed income. In terms of currencies, it held long positions versus the U.S. dollar in the Japanese yen and the British pound. It held short positions versus the U.S. dollar in the Swiss franc and the euro. |
| Q | | What was the Portfolio’s strategy at the end of the Reporting Period? |
| A | | Going forward, the QIS Team plans to continue implementing the Strategic Allocation process as it seeks long-term total return. |
3
FUND BASICS
Strategic Factor Allocation Fund
as of February 28, 2017
| | | | | | | | | | | | | | | | | | |
| | PERFORMANCE REVIEW | |
| | | September 1, 2016– February 28, 2017 | | Portfolio Total Return (based on NAV)1 | | | Strategic Factor Allocation Composite Index2 | | | S&P 500® Index3 | | | Bloomberg Barclays
U.S. Aggregate
Bond Index4 | |
| | | Institutional | | | 2.79 | % | | | 3.80 | % | | | 10.01 | % | | | -2.19 | % |
| | 1 | | The net asset value (“NAV”) represents the net assets of the class of the Portfolio (ex-dividend) divided by the total number of shares of the class outstanding. The Portfolio’s performance assumes the reinvestment of dividends and other distributions. The Portfolio’s performance does not reflect the deduction of any applicable sales charges. |
| | 2 | | The Strategic Factor Composite Index is a blend of 50% the S&P 500® Index and 50% the Bloomberg Barclays U.S. Aggregate Bond Index. It is not possible to invest in an unmanaged index. |
| | 3 | | The S&P 500® Index is the Standard & Poor’s Composite Index of 500 stocks, an unmanaged index of common stock prices. The index figure do not reflect any deduction for fees, expenses or taxes. It is not possible to invest directly in an index. |
| | 4 | | The Bloomberg Barclays U.S. Aggregate Bond Index represents an unmanaged diversified portfolio of fixed income securities, including U.S. Treasuries, investment-grade corporate bonds and mortgage-backed and asset-backed securities. The index figure does not reflect any deduction for fees, expenses or taxes. It is not possible to invest directly in an index. |
| | | | | | | | |
| | STANDARDIZED TOTAL RETURNS5 |
| | | For the period ended 12/31/16 | | Since Inception | | | Inception Date |
| | | Institutional | | | 3.16 | % | | 5/31/16 |
| | 5 | | The Standardized Total Returns are average annual total returns or cumulative total returns (only if the performance period is one year or less) as of the most recent calendar quarter-end. They assume reinvestment of all distributions at NAV. Because Institutional Shares do not involve a sales charge, such a charge is not applied to their Standardized Total Returns. |
The returns set forth in the tables above represent past performance. Past performance does not guarantee future results. The Portfolio’s investment return and principal value will fluctuate so that an investor’s shares, when redeemed, may be worth more or less than their original cost. Current performance may be lower or higher than the performance quoted above. Please visit our web site at www.GSAMFUNDS.com to obtain the most recent month-end returns. Performance reflects applicable fee waivers and/or expense limitations in effect during the periods shown. In their absence, performance would be reduced. Returns do not reflect the deduction of taxes that a shareholder would pay on Portfolio distributions or the redemption of Portfolio shares.
4
FUND BASICS
| | | | | | | | | | |
| | EXPENSE RATIOS6 | |
| | | | | Net Expense Ratio (Current) | | | Gross Expense Ratio (Before Waivers) | |
| | | Institutional | | | 0.95 | % | | | 1.21 | % |
| | 6 | | The expense ratios of the Portfolio, both current (net of applicable fee waivers and/or expense limitations) and before waivers (gross of applicable fee waivers and/or expense limitations) are as set forth above according to the most recent publicly available Prospectus for the Portfolio and may differ from the expense ratios disclosed in the Financial Highlights in this report. Pursuant to a contractual arrangement, the Portfolio’s waivers and/or expense limitations will remain in place through at least December 29, 2017, and prior to such date the Goldman Sachs Asset Management, L.P., the Portfolio’s investment adviser, may not terminate the arrangements without the approval of the Portfolio’s Board of Trustees. If these arrangements are discontinued in the future, the expense ratios may change without shareholder approval. |
| | | | | | | | |
| | HOLDINGS AS OF 2/28/177 |
| | | Holding | | % of Net Assets | | | Line of Business |
| | Goldman Sachs Financial Square | | | 52.9 | % | | Investment Companies |
| | Government Fund – Institutional Shares | | | | | | |
| | | SPDR S&P 500 ETF Trust | | | 41.4 | | | Exchange Traded Funds |
| | 7 | | The holdings may not be representative of the Portfolio’s future investments. Figures in the table above may not sum to 100% due to the exclusion of other assets and liabilities. |
5
GOLDMAN SACHS STRATEGIC FACTOR ALLOCATION
Index Definitions
The Eurozone PMI (Purchasing Managers’ Index) is produced by Markit and is based on original survey data collected from a representative panel of around 5,000 companies based in the euro area manufacturing and service sectors.
6
GOLDMAN SACHS STRATEGIC FACTOR ALLOCATION FUND
Schedule of Investments
February 28, 2017 (Unaudited)
| | | | | | | | |
Shares | | | Description | | Value | |
| Exchange Traded Fund – 41.4% | |
| | 1,250,400 | | | SPDR S&P 500 ETF Trust | | | | |
| | (Cost $282,198,385) | | $ | 295,682,088 | |
| | |
| | | | | | | | |
| Shares | | | Distribution Rate | | Value | |
| Investment Company(a)(b) – 52.9% | |
| Goldman Sachs Financial Square Government Fund –
Institutional Shares |
|
| | 378,122,755 | | | 0.470% | | $ | 378,122,755 | |
| | (Cost $378,122,755) | |
| | |
| | TOTAL INVESTMENTS – 94.3% | |
| | (Cost $660,321,140) | | $ | 673,804,843 | |
| | |
| OTHER ASSETS IN EXCESS OF
LIABILITIES – 5.7% | | | 40,562,057 | |
| | |
| | NET ASSETS – 100.0% | | $ | 714,366,900 | |
| | |
| | |
| The percentage shown for each investment category reflects the value of investments in that category as a percentage of net assets. |
(a) | | Represents an Affiliated fund. |
(b) | | Variable rate security. Interest rate or distribution rate disclosed is that which is in effect on February 28, 2017. |
| | |
|
Currency Legend |
CAD | | —Canadian Dollar |
CHF | | —Swiss Franc |
EUR | | —Euro |
GBP | | —British Pound |
JPY | | —Japanese Yen |
NZD | | —New Zealand Dollar |
USD | | —United States Dollar |
|
Investment Abbreviations: |
ETF | | —Exchange Traded Fund |
PLC | | —Public Limited Company |
|
|
| ADDITIONAL INVESTMENT INFORMATION |
FORWARD FOREIGN CURRENCY EXCHANGE CONTRACTS — At February 28, 2017, the Portfolio had the following forward foreign currency exchange contracts:
FORWARD FOREIGN CURRENCY EXCHANGE CONTRACTS WITH UNREALIZED GAIN
| | | | | | | | | | | | | | | | | | | | | | | | |
| Counterparty | | Currency Purchased | | | Currency Sold | | | Current Value | | | Settlement Date | | | Unrealized
Gain | |
Citibank NA | | USD | | | 722,943 | | | CAD | | | 950,000 | | | $ | 715,374 | | | | 03/23/17 | | | $ | 7,569 | |
Deutsche Bank AG | | GBP | | | 18,360,000 | | | USD | | | 22,792,361 | | | | 22,796,018 | | | | 03/23/17 | | | | 3,657 | |
| | NZD | | | 1,010,000 | | | USD | | | 721,947 | | | | 726,959 | | | | 03/23/17 | | | | 5,012 | |
Morgan Stanley & Co. International | | USD | | | 43,316,371 | | | EUR | | | 40,830,000 | | | | 43,303,658 | | | | 03/23/17 | | | | 12,713 | |
Royal Bank of Scotland PLC | | JPY | | | 94,160,000 | | | USD | | | 836,207 | | | | 838,988 | | | | 03/23/17 | | | | 2,781 | |
Societe Generale SA | | NZD | | | 14,280,000 | | | USD | | | 10,217,576 | | | | 10,278,193 | | | | 03/23/17 | | | | 60,618 | |
| | USD | | | 20,220,673 | | | CAD | | | 26,630,000 | | | | 20,053,072 | | | | 03/23/17 | | | | 167,602 | |
UBS AG (London) | | JPY | | | 1,182,470,000 | | | USD | | | 10,463,799 | | | | 10,536,094 | | | | 03/23/17 | | | | 72,296 | |
| TOTAL | | | | | | | | | | | | | | | | | | | | | | $ | 332,248 | |
FORWARD FOREIGN CURRENCY EXCHANGE CONTRACTS WITH UNREALIZED LOSS
| | | | | | | | | | | | | | | | | | | | | | | | |
| Counterparty | | Currency Purchased | | | Currency Sold | | | Current Value | | | Settlement Date | | | Unrealized
Loss | |
HSBC Bank PLC | | USD | | | 19,940,781 | | | CHF | | | 20,150,000 | | | $ | 20,091,455 | | | | 03/23/17 | | | $ | (150,674 | ) |
State Street Bank and Trust | | CAD | | | 27,580,000 | | | USD | | | 20,782,723 | | | | 20,768,446 | | | | 03/23/17 | | | | (14,277 | ) |
UBS AG (London) | | JPY | | | 1,288,560,000 | | | USD | | | 11,499,209 | | | | 11,481,382 | | | | 03/23/17 | | | | (17,828 | ) |
| | | USD | | | 23,335,769 | | | CHF | | | 23,410,000 | | | | 23,341,983 | | | | 03/23/17 | | | | (6,215 | ) |
| TOTAL | | | | | | | | | | | | | | | | | | | | | | $ | (188,994 | ) |
| | |
| The accompanying notes are an integral part of these financial statements. | | 7 |
GOLDMAN SACHS STRATEGIC FACTOR ALLOCATION FUND
Schedule of Investments (continued)
February 28, 2017 (Unaudited)
|
| ADDITIONAL INVESTMENT INFORMATION (continued) |
FUTURES CONTRACTS — At February 28, 2017, the Portfolio had the following futures contracts:
| | | | | | | | | | | | |
| Type | | Number of Contracts Long (Short) | | Expiration Date | | Current Value | | | Unrealized Gain (Loss) | |
20 Year U.S. Treasury Bonds | | 2,103 | | June 2017 | | $ | 318,933,094 | | | $ | 2,257,157 | |
WRITTEN OPTIONS CONTRACTS — For the period ended February 28, 2017 the Portfolio had following written options:
OPTIONS ON EQUITIES CONTRACTS
| | | | | | | | | | | | | | | | | | |
| Counterparty | | Description | | Contracts | | | Expiration Date | | | Strike Price | | | Value | |
Citibank NA (London) (Premium received $3,510,573) | | Put — S&P 500 Index | | | 2,299 | | | | 04/21/17 | | | | 2,275 | % | | $ | (3,609,430 | ) |
For the six months ended February 28, 2017, the Portfolio had the following written options activity:
OPTIONS ON EQUITIES
| | | | | | | | |
| | | Contracts | | | Premiums Received | |
Contracts Outstanding August 31, 2016 | | | 1,196 | | | $ | 1,877,720 | |
Contracts Written | | | 12,664 | | | | 19,885,659 | |
Contracts Bought to Close | | | (11,561 | ) | | | (18,252,806 | ) |
Contracts Outstanding February 28, 2017 | | | 2,299 | | | $ | 3,510,573 | |
| | |
| 8 | | The accompanying notes are an integral part of these financial statements. |
GOLDMAN SACHS STRATEGIC FACTOR ALLOCATION FUND
Statement of Assets and Liabilities
February 28, 2017 (Unaudited)
| | | | | | |
| | | | | | |
| | Assets: | | | | |
| | Investments of unaffiliated issuers, at value (cost $282,198,385) | | $ | 295,682,088 | |
| | Investments of affiliated issuers, at value (cost $378,122,755) | | | 378,122,755 | |
| | Cash | | | 20,124,334 | |
| | Variation margin on certain derivative contracts | | | 483,143 | |
| | Unrealized gain on forward foreign currency exchange contracts | | | 332,248 | |
| | Receivables: | | | | |
| | Collateral on certain derivatives contracts(a) | | | 61,498,898 | |
| | Investments sold | | | 11,195,599 | |
| | Portfolio Shares sold | | | 6,421,350 | |
| | Dividends and interest | | | 141,687 | |
| | Deferred offering costs | | | 14,420 | |
| | Other assets | | | 3,228 | |
| | Total assets | | | 774,019,750 | |
| | | | | | |
| | Liabilities: | | | | |
| | Written option contracts, at value (premium received $3,510,573) | | | 3,609,430 | |
| | Unrealized loss on forward foreign currency exchange contracts | | | 188,994 | |
| | Payables: | | | | |
| | Investments purchased | | | 55,245,662 | |
| | Management fees | | | 341,178 | |
| | Portfolio shares redeemed | | | 134,595 | |
| | Transfer Agency fees | | | 20,728 | |
| | Accrued expenses | | | 112,263 | |
| | Total liabilities | | | 59,652,850 | |
| | | | | | |
| | Net Assets: | | | | |
| | Paid-in capital | | | 695,721,328 | |
| | Distributions in excess of net investment loss | | | (1,158,648 | ) |
| | Accumulated net realized gain | | | 4,018,963 | |
| | Net unrealized gain | | | 15,785,257 | |
| | NET ASSETS | | $ | 714,366,900 | |
| | Shares Outstanding $0.001 par value (unlimited number of shares authorized): | | | 67,806,191 | |
| | Net asset value, offering and redemption price per share: | | | $10.54 | |
| | (a) | | Includes amounts segregated for initial margin requirements and/or collateral on futures, options and forward foreign currency exchange contract transactions of $10,128,520, $50,130,378 and $1,190,000, respectively. |
| | |
| The accompanying notes are an integral part of these financial statements. | | 9 |
GOLDMAN SACHS STRATEGIC FACTOR ALLOCATION FUND
Statement of Operations
For the Six Months Ended February 28, 2017 (Unaudited)
| | | | | | |
| | | | | | |
| | Investment income: | | | | |
| | Dividends — unaffiliated issuers | | $ | 1,018,469 | |
| | Dividends — affiliated issuers | | | 621,818 | |
| | Interest | | | 4,277 | |
| | Total investment income | | | 1,644,564 | |
| | | | | | |
| | Expenses: | | | | |
| | Management fees | | | 1,960,097 | |
| | Transfer Agency fees | | | 104,539 | |
| | Professional fees | | | 71,172 | |
| | Amortization of offering costs | | | 51,979 | |
| | Custody, accounting and administrative services | | | 46,492 | |
| | Registration fees | | | 44,651 | |
| | Printing and mailing costs | | | 24,338 | |
| | Trustee fees | | | 10,304 | |
| | Prime Broker Fees | | | 5,044 | |
| | Other | | | 7,377 | |
| | Total expenses | | | 2,325,993 | |
| | Less — expense reductions | | | (258,334 | ) |
| | Net expenses | | | 2,067,659 | |
| | NET INVESTMENT LOSS | | | (423,095 | ) |
| | | | | | |
| | Realized and unrealized gain (loss): | | | | |
| | Net realized gain (loss) from: | | | | |
| | Investments — unaffiliated issuers | | | (1,862,403 | ) |
| | Futures contracts | | | (5,912,660 | ) |
| | Written options | | | 12,554,195 | |
| | Forward foreign currency exchange contracts | | | (165,433 | ) |
| | Foreign currency transactions | | | 803,006 | |
| | Net change in unrealized gain (loss) on: | | | | |
| | Investments — unaffiliated issuers | | | 12,296,302 | |
| | Futures contracts | | | 2,226,447 | |
| | Written options | | | (98,857 | ) |
| | Forward foreign currency exchange contracts | | | (586,990 | ) |
| | Net realized and unrealized gain | | | 19,253,607 | |
| | NET INCREASE IN NET ASSETS RESULTING FROM OPERATIONS | | $ | 18,830,512 | |
| | |
| 10 | | The accompanying notes are an integral part of these financial statements. |
GOLDMAN SACHS STRATEGIC FACTOR ALLOCATION FUND
Statements of Changes in Net Assets
| | | | | | | | | | |
| | | | | For the Six Months Ended February 28, 2017 (Unaudited) | | | For the Fiscal Period Ended August 31, 2016(a) | |
| | From operations: | | | | | | | | |
| | Net investment loss | | $ | (423,095 | ) | | $ | (237,259 | ) |
| | Net realized gain | | | 5,416,705 | | | | 2,566,252 | |
| | Net change in unrealized gain | | | 13,836,902 | | | | 1,948,355 | |
| | Net increase in net assets resulting from operations | | | 18,830,512 | | | | 4,277,348 | |
| | | | | | | | | | |
| | Distributions to shareholders: | | | | | | | | |
| | From net investment income | | | (120,094 | ) | | | — | |
| | From net realized gains | | | (4,375,157 | ) | | | — | |
| | Total distributions to shareholders | | | (4,495,251 | ) | | | — | |
| | | | | | | | | | |
| | From share transactions: | | | | | | | | |
| | Proceeds from sales of shares | | | 381,542,063 | | | | 337,652,314 | |
| | Reinvestment of distributions | | | 4,495,251 | | | | — | |
| | Cost of shares redeemed | | | (24,597,419 | ) | | | (3,337,918 | ) |
| | Net increase in net assets resulting from share transactions | | | 361,439,895 | | | | 334,314,396 | |
| | TOTAL INCREASE | | | 375,775,156 | | | | 338,591,744 | |
| | | | | | | | | | |
| | Net assets: | | | | | | | | |
| | Beginning of period | | | 338,591,744 | | | | — | |
| | End of period | | $ | 714,366,900 | | | $ | 338,591,744 | |
| | Distributions in excess of net investment income (loss) | | $ | (1,158,648 | ) | | $ | (615,459 | ) |
| | (a) | | The Portfolio commenced operations on May 31, 2016. |
| | |
| The accompanying notes are an integral part of these financial statements. | | 11 |
GOLDMAN SACHS STRATEGIC FACTOR ALLOCATION FUND
Financial Highlights
Selected Data for a Share Outstanding Throughout Each Period
| | | | | | | | | | | | | | | | | | | | | | | | | | | | | | |
| | | | | | | | Income (loss) from
investment operations | | | Distributions
to shareholders | |
| | | Year - Share Class | | Net asset value, beginning of period | | | Net investment loss(a) | | | Net realized and unrealized gain | | | Total from investment operations | | | From net investment income | | | From net realized gains | | | Total distributions | |
| | FOR THE SIX MONTHS ENDED FEBRUARY 28, (UNAUDITED) | |
| | 2017 - Institutional Shares | | $ | 10.34 | | | $ | (0.01 | ) | | $ | 0.30 | | | $ | 0.29 | | | $ | (0.01 | ) | | $ | (0.08 | ) | | $ | (0.09 | ) |
| | | | | | | | | | | | | | | | | | | | | | | | | | | | | | |
| FOR THE PERIOD ENDED AUGUST 31, | | | | | |
| | 2016 - Institutional Shares (Commenced May 31, 2016) | | | 10.00 | | | | (0.01 | ) | | | 0.35 | | | | 0.34 | | | | — | | | | — | | | | — | |
| | (a) | | Calculated based on the average shares outstanding methodology. |
| | (b) | | Assumes investment at the NAV at the beginning of the period, reinvestment of all dividends and distributions, a complete redemption of the investment at the NAV at the end of the period and no sales or redemption charges. Total returns would be reduced if a sales or redemption charge was taken into account. Returns do not reflect the impact of taxes to shareholder relating to Portfolio distributions or the redemption of Portfolio shares. Total returns for periods less than one full year are not annualized. |
| | (d) | | The Portfolio’s portfolio turnover rate is calculated in accordance with regulatory requirements, without regard to transactions involving short term investments and certain derivatives. If such transactions were included, the Portfolio’s portfolio turnover rate may be higher. |
| | |
| 12 | | The accompanying notes are an integral part of these financial statements. |
GOLDMAN SACHS STRATEGIC FACTOR ALLOCATION FUND
| | | | | | | | | | | | | | | | | | | | | | | | | | | | | | | | | | | | | | | | |
| | | | | | | | | | | | | |
| | | Net asset value, end of period | | | | | Total return(b) | | | | | Net assets, end of period (in 000s) | | | | | Ratio of net expenses to average net assets(c) | | | | | Ratio of total expenses to average net assets(c) | | | | | Ratio of net investment income (loss) to average net assets(c) | | | | | Portfolio turnover rate(d) | |
| | | | | | | | | | | | | | | | | | | | | | | | | | | | | | | | | | | | | | | | |
| | $ | 10.54 | | | | | | 2.79 | % | | | | $ | 714,367 | | | | | | 0.79 | % | | | | | 0.88 | % | | | | | (0.16 | )% | | | | | 268 | % |
| | | | | | | | | | | | | | | | | | | | | | | | | | | | | | | | | | | | | | | | |
| | | | | | | | | | | | | | | | | | | | | | | | | | | | | | | | | | | | | | | | |
| | | 10.34 | | | | | | 3.40 | | | | | | 338,592 | | | | | | 0.87 | | | | | | 1.07 | | | | | | (0.51 | ) | | | | | 86 | |
| | |
| The accompanying notes are an integral part of these financial statements. | | 13 |
GOLDMAN SACHS STRATEGIC FACTOR ALLOCATION FUND
Notes to Financial Statements
February 28, 2017 (Unaudited)
Goldman Sachs Trust (the “Trust”) is a Delaware statutory trust registered under the Investment Company Act of 1940, as amended (the “Act”), as an open-end management investment company. Goldman Sachs Strategic Factor Allocation Fund (the “Portfolio”) is a non-diversified portfolio and currently offers one share class — Institutional Shares. Goldman Sachs Asset Management, L.P. (“GSAM”), an affiliate of Goldman, Sachs & Co. (“Goldman Sachs”), serves as investment adviser to the Portfolio pursuant to a management agreement (the “Agreement”) with the Trust.
|
| 2. SIGNIFICANT ACCOUNTING POLICIES |
The financial statements have been prepared in accordance with accounting principles generally accepted in the United States of America (“GAAP”) and require management to make estimates and assumptions that may affect the reported amounts and disclosures. Actual results may differ from those estimates and assumptions.
A. Investment Valuation — The Portfolio’s valuation policy is to value investments at fair value.
B. Investment Income and Investments — Investment income includes interest income, dividend income, net of any foreign withholding taxes, less any amounts reclaimable, and securities lending income. Interest income is accrued daily and adjusted for amortization of premiums and accretion of discounts. Dividend income is recognized on ex-dividend date or, for certain foreign securities, as soon as such information is obtained subsequent to the ex-dividend date. Investment transactions are reflected on trade date. Realized gains and losses are calculated using identified cost. Investment transactions are recorded on the following business day for daily net asset value (“NAV”) calculations. Any foreign capital gains tax is accrued daily based upon net unrealized gains, and is payable upon sale of such investments. For derivative contracts, realized gains and losses are recorded upon settlement of the contract.
C. Expenses — Expenses incurred directly by the Portfolio are charged to the Portfolio, and certain expenses incurred by the Trust that may not solely relate to the Portfolio are allocated to the Portfolio and the other applicable funds of the Trust on a straight-line and/or pro-rata basis, depending upon the nature of the expenses, and are accrued daily.
D. Offering Costs — Offering costs paid in connection with the initial offering of shares are being amortized on a straight line basis over 12 months from the date of commencement of operations.
E. Federal Taxes and Distributions to Shareholders — It is the Portfolio’s policy to comply with the requirements of the Internal Revenue Code of 1986, as amended (the “Code”), applicable to regulated investment companies (mutual funds) and to distribute each year substantially all of its investment company taxable income and capital gains to its shareholders. Accordingly, the Portfolio is not required to make any provisions for the payment of federal income tax. Distributions to shareholders are recorded on the ex-dividend date. Income and capital gains distributions, if any, are declared and paid annually.
Net capital losses are carried forward to future fiscal years and may be used to the extent allowed by the Code to offset any future capital gains. Losses that are carried forward will retain their character as either short-term or long-term capital losses. Utilization of capital loss carryforwards will reduce the requirement of future capital gains distributions.
The characterization of distributions to shareholders for financial reporting purposes is determined in accordance with federal income tax rules, which may differ from GAAP. The source of the Portfolio’s distributions may be shown in the accompanying financial statements as either from net investment income, net realized gain or capital. Certain components of the Portfolio’s net assets on the Statement of Assets and Liabilities reflect permanent GAAP/tax differences based on the appropriate tax character.
F. Foreign Currency Translation — The accounting records and reporting currency of the Portfolio are maintained in U.S. dollars. Assets and liabilities denominated in foreign currencies are translated into U.S. dollars using the current exchange rates at the close of each business day. The effect of changes in foreign currency exchange rates on investments is included within net realized and unrealized gain (loss) on investments. Changes in the value of other assets and liabilities as a result of fluctuations in foreign exchange rates are included in the Statement of Operations within net change in unrealized gain (loss) on foreign currency
14
GOLDMAN SACHS STRATEGIC FACTOR ALLOCATION FUND
|
| 2. SIGNIFICANT ACCOUNTING POLICIES (continued) |
translations. Transactions denominated in foreign currencies are translated into U.S. dollars on the date the transaction occurred, the effects of which are included within net realized gain (loss) on foreign currency transactions.
|
| 3. INVESTMENT AND FAIR VALUE MEASUREMENTS |
The fair value of a financial instrument is the amount that would be received to sell an asset or paid to transfer a liability in an orderly transaction between market participants at the measurement date (i.e., the exit price). GAAP establishes a fair value hierarchy that prioritizes the inputs to valuation techniques used to measure fair value. The hierarchy gives the highest priority to unadjusted quoted prices in active markets for identical assets or liabilities (Level 1 measurements) and the lowest priority to unobservable inputs (Level 3 measurements). The levels used for classifying investments are not necessarily an indication of the risk associated with investing in these investments. The three levels of the fair value hierarchy are described below:
Level 1 — Unadjusted quoted prices in active markets that are accessible at the measurement date for identical, unrestricted assets or liabilities;
Level 2 — Quoted prices in markets that are not active or financial instruments for which significant inputs are observable (including, but not limited to, quoted prices for similar investments, interest rates, foreign exchange rates, volatility and credit spreads), either directly or indirectly;
Level 3 — Prices or valuations that require significant unobservable inputs (including GSAM’s assumptions in determining fair value measurement).
Changes in valuation techniques may result in transfers into or out of an assigned level within the hierarchy. In accordance with the Portfolio’s policy, transfers between different levels of the fair value hierarchy resulting from such changes are deemed to have occurred as of the beginning of the reporting period.
The Board of Trustees (“Trustees”) has approved Valuation Procedures that govern the valuation of the portfolio investments held by the Portfolio, including investments for which market quotations are not readily available. The Trustees have delegated to GSAM day-to-day responsibility for implementing and maintaining internal controls and procedures related to the valuation of the Portfolio’s portfolio investments. To assess the continuing appropriateness of pricing sources and methodologies, GSAM regularly performs price verification procedures and issues challenges as necessary to third party pricing vendors or brokers, and any differences are reviewed in accordance with the Valuation Procedures.
A. Level 1 and Level 2 Fair Value Investments — The valuation techniques and significant inputs used in determining the fair values for investments classified as Level 1 and Level 2 are as follows:
Equity Securities — Equity securities traded on a United States (“U.S.”) securities exchange or the NASDAQ system, or those located on certain foreign exchanges, including but not limited to the Americas, are valued daily at their last sale price or official closing price on the principal exchange or system on which they are traded. If there is no sale or official closing price or such price is believed by GSAM to not represent fair value, equity securities are valued at the last bid price for long positions and at the last ask price for short positions. To the extent these investments are actively traded, they are classified as Level 1 of the fair value hierarchy, otherwise they are generally classified as Level 2.
Unlisted equity securities for which market quotations are available are valued at the last sale price on the valuation date, or if no sale occurs, at the last bid price. Securities traded on certain foreign securities exchanges are valued daily at fair value determined by an independent fair value service (if available) under Valuation Procedures approved by the Trustees and consistent with applicable regulatory guidance. The independent fair value service takes into account multiple factors including, but not limited to, movements in the securities markets, certain depositary receipts, futures contracts and foreign currency exchange rates that have occurred subsequent to the close of the foreign securities exchange. These investments are generally classified as Level 2 of the fair value hierarchy.
Underlying Funds (including Money Market Funds) — Underlying Funds (“Underlying Funds”) include other investment companies and exchange-traded funds (“ETFs”). Investments in the Underlying Funds (except ETFs) are valued at the NAV per
15
GOLDMAN SACHS STRATEGIC FACTOR ALLOCATION FUND
Notes to Financial Statements (continued)
February 28, 2017 (Unaudited)
|
| 3. INVESTMENT AND FAIR VALUE MEASUREMENTS (continued) |
share of the Institutional Share class on the day of valuation. ETFs are valued daily at the last sale price or official closing price on the principal exchange or system on which the investment is traded. Because the Portfolio invests in Underlying Funds that fluctuate in value, the Portfolio’s shares will correspondingly fluctuate in value. To the extent these investments are actively traded, they are classified as Level 1 of the fair value hierarchy, otherwise they are generally classified as Level 2. For information regarding an Underlying Fund’s accounting policies and investment holdings, please see the Underlying Fund’s shareholder report.
Derivative Contracts — A derivative is an instrument whose value is derived from underlying assets, indices, reference rates or a combination of these factors. The Portfolio enters into derivative transactions to hedge against changes in interest rates, securities prices, and/or currency exchange rates, to increase total return, or to gain access to certain markets or attain exposure to other underliers.
Exchange-traded derivatives, including futures and options contracts, are valued at the last sale or settlement price and typically fall within Level 1 of the fair value hierarchy. Over-the-counter (“OTC”) and centrally cleared derivatives are valued using market transactions and other market evidence, including market-based inputs to models, calibration to market-clearing transactions, broker or dealer quotations, or other alternative pricing sources. Where models are used, the selection of a particular model to value OTC and centrally cleared derivatives depends upon the contractual terms of, and specific risks inherent in, the instrument, as well as the availability of pricing information in the market. Valuation models require a variety of inputs, including contractual terms, market prices, yield curves, credit curves, measures of volatility, voluntary and involuntary prepayment rates, loss severity rates and correlations of such inputs. For OTC and centrally cleared derivatives that trade in liquid markets, model inputs can generally be verified and model selection does not involve significant management judgment. OTC and centrally cleared derivatives are classified within Level 2 of the fair value hierarchy when significant inputs are corroborated by market evidence.
i. Forward Contracts — A forward contract is a contract between two parties to buy or sell an asset at a specified price on a future date. A forward contract settlement can occur on a cash or delivery basis. Forward contracts are marked-to-market daily using independent vendor prices, and the change in value, if any, is recorded as an unrealized gain or loss. Cash and certain investments may be used to collateralize forward contracts.
A forward foreign currency contract is a forward contract in which the Portfolio agrees to receive or deliver a fixed quantity of one currency for another, at a pre-determined price at a future date. All forward foreign currency exchange contracts are marked-to-market daily at the applicable forward rate. Non-deliverable forward foreign currency exchange contracts are settled with the counterparty in cash without the delivery of foreign currency.
ii. Futures Contracts — Futures contracts are contracts to buy or sell a standardized quantity of a specified commodity or security and are valued based on exchanged settlement prices or independent market quotes. Futures contracts are valued at the last settlement price, or in the absence of a sale, the last bid price for long positions and at the last ask price for short positions, at the end of each day on the board of trade or exchange upon which they are traded. Upon entering into a futures contract, the Portfolio deposits cash or securities in an account on behalf of the broker in an amount sufficient to meet the initial margin requirement. Subsequent payments are made or received by the Portfolio equal to the daily change in the contract value and are recorded as variation margin receivable or payable with a corresponding offset to unrealized gains or losses.
iii. Option Contracts — When the Portfolio writes call or put option contracts, an amount equal to the premium received is recorded as a liability and is subsequently marked-to-market to reflect the current value of the option written. Swaptions are options on interest rate swap contracts.
Upon the purchase of a call option or a put option by the Portfolio, the premium paid is recorded as an investment and subsequently marked-to-market to reflect the current value of the option. Certain options may be purchased with premiums to be determined on a future date. The premiums for these options are based upon implied volatility parameters at specified terms.
B. Level 3 Fair Value Investments — To the extent that significant inputs to valuation models and other alternative pricing sources are unobservable, or if quotations are not readily available, or if GSAM believes that such quotations do not accurately
16
GOLDMAN SACHS STRATEGIC FACTOR ALLOCATION FUND
|
| 3. INVESTMENT AND FAIR VALUE MEASUREMENTS (continued) |
reflect fair value, the fair value of the Portfolio’s investments may be determined under Valuation Procedures approved by the Trustees. GSAM, consistent with its procedures and applicable regulatory guidance, may make an adjustment to the most recent valuation prices of either domestic or foreign securities in light of significant events to reflect what it believes to be the fair value of the securities at the time of determining the Portfolio’s NAV. Significant events which could affect a large number of securities in a particular market may include, but are not limited to: significant fluctuations in U.S. or foreign markets; market dislocations; market disruptions; or unscheduled market closings. Significant events which could also affect a single issuer may include, but are not limited to: corporate actions such as reorganizations, mergers and buy-outs; ratings downgrades; and bankruptcies.
C. Fair Value Hierarchy — The following is a summary of the Portfolio’s investments and derivatives classified in the fair value hierarchy as of February 28, 2017:
| | | | | | | | | | | | |
| | | |
| STRATEGIC FACTOR ALLOCATION | | | | | | | | | | | | |
| | | |
| Investment Type | | Level 1 | | | Level 2 | | | Level 3 | |
| Assets | | | | | | | | | | | | |
Exchange Traded Fund | | $ | 295,682,088 | | | $ | — | | | $ | — | |
Investment Company | | | 378,122,755 | | | | — | | | | — | |
| Total | | $ | 673,804,843 | | | $ | — | | | $ | — | |
| | | |
| Derivative Type | | | | | | | | | |
| Assets(a) | | | | | | | | | | | | |
Forward Foreign Currency Exchange Contracts | | $ | — | | | $ | 332,248 | | | $ | — | |
Futures Contracts | | | 2,257,157 | | | | — | | | | — | |
| Total | | $ | 2,257,157 | | | $ | 332,248 | | | $ | — | |
| Liabilities(a) | | | | | | | | | | | | |
Forward Foreign Currency Exchange Contracts | | $ | — | | | $ | (188,994 | ) | | $ | — | |
Written Options Contracts | | | — | | | | (3,609,430 | ) | | | — | |
| Total | | $ | — | | | $ | (3,798,424 | ) | | $ | — | |
| (a) | | Amount shown represents unrealized gain (loss) at period end. |
For further information regarding security characteristics, see the Schedule of Investments.
17
GOLDMAN SACHS STRATEGIC FACTOR ALLOCATION FUND
Notes to Financial Statements (continued)
February 28, 2017 (Unaudited)
|
| 4. INVESTMENTS IN DERIVATIVES |
The following table sets forth, by certain risk types, the gross value of derivative contracts as of February 28, 2017. These instruments were used as part of the Portfolio’s investment strategies and to obtain and/or manage exposure related to the risks below. The values in the tables below exclude the effects of cash collateral received or posted pursuant to these derivative contracts, and therefore are not representative of the Portfolio’s net exposure.
| | | | | | | | | | | | |
| Risk | | Statement of Assets and Liabilities | | Assets | | | Statement of Assets and Liabilities | | Liabilities | |
Interest rate | | Variation margin on certain derivative contracts | | $ | 2,257,157 | (a) | | — | | | — | |
Currency | | Receivable for unrealized gain on forward foreign currency exchange contracts | | | 332,248 | | | Payable for unrealized loss on forward foreign currency exchange contracts | | $ | (188,994) | |
Equity | | — | | | — | | | Written options, at value | | | (3,609,430) | |
| Total | | | | $ | 2,589,405 | | | | | $ | (3,798,424) | |
| (a) | | Includes unrealized gain (loss) on futures contracts described in the Additional Investment Information sections of the Schedule of Investments. Only current day’s variation margin is reported within the Statement of Assets and Liabilities. |
The following table sets forth, by certain risk types, the Portfolio’s gains (losses) related to these derivatives and their indicative volumes for the six months ended February 28, 2017. These gains (losses) should be considered in the context that these derivative contracts may have been executed to create investment opportunities and/or economically hedge certain investments, and accordingly, certain gains (losses) on such derivative contracts may offset certain (losses) gains attributable to investments. These gains (losses) are included in “Net realized gain (loss)” or “Net change in unrealized gain (loss)” on the Statement of Operations:
| | | | | | | | | | | | | | |
| Risk | | Statement of Operations | | Net Realized Gain (Loss) | | | Net Change in Unrealized Gain (Loss) | | | Average Number of Contracts(a) | |
| Interest rate | | Net realized gain (loss) from futures contracts/Net change in unrealized gain (loss) on futures contracts | | $ | (5,912,660 | ) | | $ | 2,226,447 | | | | 1,103 | |
| Currency | | Net realized gain (loss) from forward foreign currency exchange contracts/Net change in unrealized gain (loss) on forward foreign currency exchange contracts | | | (165,433 | ) | | | (586,990 | ) | | | 13 | |
| Equity | | Net realized gain (loss) from written options/Net change in unrealized gain (loss) on written options | | | 12,554,195 | | | | (98,857 | ) | | | 1 | |
| Total | | | | $ | 6,476,102 | | | $ | 1,540,600 | | | | 1,117 | |
| (a) | | Average number of contracts is based on the average of month end balances for the period ended February 28, 2017. |
In order to better define its contractual rights and to secure rights that will help the Portfolio mitigate its counterparty risk, the Portfolio may enter into an International Swaps and Derivatives Association, Inc. Master Agreement (“ISDA Master Agreement”) or similar agreement with its derivatives counterparties. An ISDA Master Agreement is a bilateral agreement between the Portfolio and a counterparty that governs OTC derivatives (including forward foreign currency exchange contracts, and certain options and swaps), and typically contains, among other things, collateral posting terms and netting provisions in the event of a default and/or termination event. The provisions of the ISDA Master Agreement typically permit a single net payment in the event of a default (close-out netting) or similar event, including the bankruptcy or insolvency of the counterparty.
Collateral and margin requirements differ between exchange traded derivatives and OTC derivatives. Margin requirements are established by the broker or clearing house for exchange-traded and centrally cleared derivatives (financial futures contracts, options and centrally cleared swaps) pursuant to governing agreements for those instrument types. Brokers can ask for margin in excess of the minimum in certain circumstances. Collateral terms are contract-specific for OTC derivatives. For derivatives traded under an ISDA Master Agreement, the collateral requirements are typically calculated by netting the marked to market amount for
18
GOLDMAN SACHS STRATEGIC FACTOR ALLOCATION FUND
|
| 4. INVESTMENTS IN DERIVATIVES (continued) |
each transaction under such agreement and comparing that amount to the value of any collateral currently pledged by the Portfolio and the counterparty. Additionally, the Portfolio may be required to post initial margin to the counterparty, the terms of which would be outlined in the confirmation of the OTC transaction.
For financial reporting purposes, cash collateral that has been pledged to cover obligations of the Portfolio and cash collateral received from the counterparty, if any, is reported separately on the Statement of Assets and Liabilities as receivables/payables for collateral on certain derivative contracts. Non-cash collateral pledged by the Portfolio, if any, is noted in the Schedules of Investments. Generally, the amount of collateral due from or to a counterparty must exceed a minimum transfer amount threshold before a transfer is required to be made. To the extent amounts due to the Portfolio from its counterparties are not fully collateralized, contractually or otherwise, the Portfolio bears the risk of loss from counterparty nonperformance. The Portfolio attempts to mitigate counterparty risk by only entering into agreements with counterparties that the Investment Adviser believes to be of good standing and by monitoring the financial stability of those counterparties.
Additionally, the netting of assets and liabilities and the offsetting of collateral pledged or received are based on contractual netting/set-off provisions in the ISDA Master Agreement or similar agreements. However, in the event of a default or insolvency of a counterparty, a court could determine that such rights are not enforceable due to the restrictions or prohibitions against the right of setoff that may be imposed in accordance with a particular jurisdiction’s bankruptcy or insolvency laws.
|
| 5. AGREEMENTS AND AFFILIATED TRANSACTIONS |
A. Management Agreement — Under the Agreement, GSAM manages the Portfolio, subject to the general supervision of the Trustees.
As compensation for the services rendered pursuant to the Agreement, the assumption of the expenses related thereto and administration of the Portfolio’s business affairs, including providing facilities, GSAM is entitled to a management fee, accrued daily and paid monthly, equal to an annual percentage rate of the Portfolio’s average daily net assets.
For the six months ended February 28, 2017, contractual and effective net management fees with GSAM were at the following rates:
| | | | | | | | | | | | | | | | | | | | | | |
| Contractual Management Rate | | | Effective Net Management Rate*^ | |
First $2 billion | | | Next $3 billion | | | Next $3 billion | | | Over $8 billion | | | Effective Rate | | |
| | 0.75% | | | | 0.68% | | | | 0.64% | | | | 0.62% | | | | 0.75% | | | | 0.65% | |
| * | | GSAM has agreed to waive a portion of its management fee payable by the Portfolio in an amount equal to any management fee it earns as an investment adviser to any of the affiliated funds in which the Portfolio invests through at least December 29, 2017. Prior to such date GSAM may not terminate the arrangement without the approval of the Trustees. |
| ^ | | Effective Net Management Rate includes the impact of management fee waivers of affiliated underlying funds, if any. |
The Portfolio invests in Institutional Shares of the Goldman Sachs Financial Square Government Fund, which is an affiliated Underlying Portfolio. GSAM has agreed to waive a portion of its management fee payable by the Portfolio in an amount equal to the management fee it earns as an investment adviser to any of the affiliated Underlying Portfolios in which the Portfolio invests. For the six months ended February 28, 2017, GSAM waived $258,334 of the Portfolio’s management fee.
B. Transfer Agency Agreement — Goldman Sachs also serves as the transfer agent of the Portfolio for a fee pursuant to the Transfer Agency Agreement. The fees charged for such transfer agency services are accrued daily and paid monthly at annual rates as follows: 0.04% of the average daily net assets of Institutional Shares.
C. Other Expense Agreements and Affiliated Transactions — GSAM has agreed to limit certain “Other Expenses” of the Portfolio (excluding acquired fund fees and expenses, transfer agency fees and expenses, service fees and shareholder administration fees (as applicable), taxes, interest, brokerage fees, shareholder meeting, litigation, indemnification and extraordinary expenses) to the extent such expenses exceed, on an annual basis, a percentage rate of the average daily net assets of
19
GOLDMAN SACHS STRATEGIC FACTOR ALLOCATION FUND
Notes to Financial Statements (continued)
February 28, 2017 (Unaudited)
|
| 5. AGREEMENTS AND AFFILIATED TRANSACTIONS (continued) |
the Portfolio. Such Other Expense reimbursements, if any, are accrued daily and paid monthly. In addition, the Portfolio is not obligated to reimburse GSAM for prior fiscal year expense reimbursements, if any. The Other Expense limitations as an annual percentage rate of average daily net assets for the Portfolio are 0.164%. These Other Expense limitations will remain in place through at least December 29, 2017, and prior to such date GSAM may not terminate the arrangements without the approval of the Trustees. In addition, the Portfolio has entered into certain offset arrangements with the transfer agent, which may result in a reduction of the Portfolio’s expenses and are received irrespective of the application of the “Other Expense” limitations described above.
D. Other Transactions with Affiliates — For the six months ended February 28, 2017 , Goldman Sachs did not earn any brokerage commissions from portfolio transactions on behalf of the Portfolio.
The table below shows the transactions in and earnings from investments in the Goldman Sachs Financial Square Government Fund for the six months ended February 28, 2017:
| | | | | | | | | | | | | | | | | | | | |
| Underlying Fund | | Market Value 8/31/16 | | | Purchases at Cost | | | Proceeds from Sales | | | Market Value 2/28/17 | | | Dividend Income | |
Goldman Sachs Financial Square Government Fund —Institutional Shares | | $ | 184,645,717 | | | $ | 707,497,969 | | | $ | (514,020,931 | ) | | $ | 378,122,755 | | | $ | 621,818 | |
|
| 6. PORTFOLIO SECURITIES TRANSACTIONS |
The cost of purchases and proceeds from sales and maturities of long-term securities for the period ended February 28, 2017, were: $673,789,402 and $499,283,405, respectively.
As of the Portfolio’s most recent period ended August 31, 2016 the Portfolio had no capital loss carryforwards and certain timing differences on a tax basis.
As of February 28, 2017, the Portfolio’s aggregate security unrealized gains and losses based on cost for U.S. federal income tax purposes were as follows:
| | | | |
Tax Cost | | $ | 660,585,339 | |
Gross unrealized gain | | | 13,483,703 | |
Gross unrealized loss | | | (264,199 | ) |
Net unrealized gains | | $ | 13,219,504 | |
The difference between GAAP-basis and tax-basis unrealized gains (losses) is attributable primarily to wash sales and net to market gains/(losses) on regulated futures, options contracts and foreign currency contracts.
GSAM has reviewed the Portfolio’s tax positions for all open tax years (the current and prior three years, as applicable) and has concluded that no provision for income tax is required in the Portfolio’s financial statements. Such open tax years remain subject to examination and adjustment by tax authorities.
20
GOLDMAN SACHS STRATEGIC FACTOR ALLOCATION FUND
The Portfolio’s risks include, but are not limited to, the following:
Derivatives Risk — The Portfolio’s use of derivatives may result in loss. Derivative instruments, which may pose risks in addition to and greater than those associated with investing directly in securities, currencies or other instruments, may be illiquid or less liquid, volatile, difficult to price and leveraged so that small changes in the value of the underlying instruments may produce disproportionate losses to the Portfolio. Derivatives are also subject to counterparty risk, which is the risk that the other party in the transaction will not fulfill its contractual obligation. The use of derivatives is a highly specialized activity that involves investment techniques and risks different from those associated with investments in more traditional securities and instruments. Losses from derivatives can also result from a lack of correlation between changes in the value of derivative instruments and the portfolio assets (if any) being hedged.
Foreign Countries Risk — Investing in foreign markets may involve special risks and considerations not typically associated with investing in the United States. Foreign securities may be subject to risk of loss because of more or less foreign government regulation, less public information and less economic, political and social stability in the countries in which the Portfolio invests. The imposition of exchange controls, confiscations, trade restrictions (including tariffs) and other government restrictions by the United States or other governments, or from problems in share registration, settlement or custody, may also result in losses. Foreign risk also involves the risk of negative foreign currency rate fluctuations, which may cause the value of securities denominated in such foreign currency (or other instruments through which the Portfolio has exposure to foreign currencies) to decline in value. Currency exchange rates may fluctuate significantly over short periods of time.
Foreign Custody Risk — If the Portfolio invests in foreign securities, the Portfolio may hold such securities and cash with foreign banks, agents, and securities depositories appointed by the Portfolio’s custodian (each a “Foreign Custodian”). Some foreign custodians may be recently organized or new to the foreign custody business. In some countries, Foreign Custodians may be subject to little or no regulatory oversight over, or independent evaluation of, their operations. Further, the laws of certain countries may place limitations on the Portfolio’s ability to recover its assets if a Foreign Custodian enters bankruptcy.
Geographic Risk — If the Portfolio focuses its investments in the securities of issuers located in particular country or geographic region, it will subject the Portfolio to a greater extent than if its investments were less focused, to the risks of volatile economic cycles and/or conditions and developments that may be particular to that country or region, such as: adverse securities markets; adverse exchange rates; adverse social, political, regulatory, economic, business, environmental or other developments disasters.
Interest Rate Risk — When interest rates increase, fixed income securities or instruments held by the Portfolio will generally decline in value. Long-term fixed income securities or instruments will normally have more price volatility because of this risk than short-term fixed income securities or instruments. The risks associated with increasing rates are heightened given that interest rates are near historic lows, but may be expected to increase in the future with unpredictable effects on the markets and the Portfolio’s investments. Fluctuations in interest rates may also affect the liquidity of fixed income securities and instruments held by the Portfolio.
Investments in Other Investment Companies — As a shareholder of another investment company, including an ETF, the Portfolio will indirectly bear its proportionate share of any net management fees and other expenses paid by such other investment companies, in addition to the fees and expenses regularly borne by the Portfolio. ETFs are subject to risks that do not apply to conventional mutual funds, including but not limited to the following: (i) the market price of the ETF’s shares may trade at a premium or a discount to their NAV; and (ii) an active trading market for an ETF’s shares may not develop or be maintained.
Large Shareholder Transactions Risk — The Portfolio may experience adverse effects when certain large shareholders, such as other funds, institutional investors (including those trading by use of non-discretionary mathematical formulas), financial intermediaries (who may make investment decisions on behalf of underlying clients and/or include the Portfolio in their investment model), individuals, accounts and Goldman Sachs affiliates, purchase or redeem large amounts of shares of a Portfolio. Such large shareholder redemptions may cause the Portfolio to sell portfolio securities at times when it would not otherwise do so, which may negatively impact the Portfolio’s NAV and liquidity. These transactions may also accelerate the realization of taxable income to
21
GOLDMAN SACHS STRATEGIC FACTOR ALLOCATION FUND
Notes to Financial Statements (continued)
February 28, 2017 (Unaudited)
|
| 8. OTHER RISKS (continued) |
shareholders if such sales of investments resulted in gains, and may also increase transaction costs. In addition, a large redemption could result in the Portfolio’s current expenses being allocated over a smaller asset base, leading to an increase in the Portfolio’s expense ratio. Similarly, large Portfolio share purchases may adversely affect the Portfolio’s performance to the extent that the Portfolio is delayed in investing new cash and is required to maintain a larger cash position than it ordinarily would.
Liquidity Risk — The Portfolio may make investments that are illiquid or that may become less liquid in response to market developments or adverse investor perceptions. Illiquid investments may be more difficult to value. Liquidity risk may also refer to the risk that the Portfolio will not be able to pay redemption proceeds within the allowable time period because of unusual market conditions, an unusually high volume of redemption requests, or other reasons. To meet redemption requests, the Portfolio may be forced to sell investments at an unfavorable time and/or under unfavorable conditions.
Market and Credit Risks — In the normal course of business, the Portfolio trades financial instruments and enters into financial transactions where risk of potential loss exists due to changes in the market (market risk). Additionally, the Portfolio may also be exposed to credit risk in the event that an issuer or guarantor fails to perform or that an institution or entity with which the Portfolio has unsettled or open transactions defaults.
Non-Diversification Risk — The Portfolio is non-diversified, meaning that it is permitted to invest a larger percentage of its assets in fewer issuers than diversified mutual funds. Thus, the Portfolio may be more susceptible to adverse developments affecting any single issuer held in its portfolio, and may be more susceptible to greater losses because of these developments.
Under the Trust’s organizational documents, its Trustees, officers, employees and agents are indemnified, to the extent permitted by the Act and state law, against certain liabilities that may arise out of performance of their duties to the Portfolio. Additionally, in the course of business, the Portfolio enters into contracts that contain a variety of indemnification clauses. The Portfolio’s maximum exposure under these arrangements is unknown, as this would involve future claims that may be made against the Portfolio that have not yet occurred. However, GSAM believes the risk of loss under these arrangements to be remote.
Subsequent events after the Statement of Assets and Liabilities date have been evaluated and GSAM has concluded that there is no impact requiring adjustment or disclosure in the financial statements.
22
GOLDMAN SACHS STRATEGIC FACTOR ALLOCATION FUND
|
| 11. SUMMARY OF SHARE TRANSACTIONS |
Share activity is as follows:
| | | | | | | | | | | | | | | | |
| | | Strategic Factor Allocation Fund | |
| | | | |
| | | For the Six Months Ended February 28, 2017 (Unaudited) | | | For the Period Ended August 31, 2016(a) | |
| | | | |
| | | Shares | | | Dollars | | | Shares | | | Dollars | |
| | | | |
| Institutional Shares | | | | | | | | | | | | | | | | |
Shares sold | | | 37,005,306 | | | | 381,542,063 | | | | 33,081,728 | | | $ | 337,652,314 | |
Reinvestment of distributions | | | 439,814 | | | | 4,495,251 | | | | — | | | | — | |
Shares redeemed | | | (2,391,740 | ) | | | (24,597,419 | ) | | | (328,917 | ) | | | (3,337,918 | ) |
NET INCREASE | | | 35,053,380 | | | $ | 361,439,895 | | | | 32,752,811 | | | $ | 334,314,396 | |
| (a) | | The Portfolio commenced operations on May 31, 2016. |
23
GOLDMAN SACHS STRATEGIC FACTOR ALLOCATION FUND
| | |
Portfolio Expenses — Period Ended February 28, 2017 (Unaudited) | | |
As a shareholder of Institutional Shares of the Portfolio, you incur two types of costs: ongoing costs, including management fees; and other Portfolio expenses. This Example is intended to help you understand your ongoing costs (in dollars) of investing in the Portfolio and to compare these costs with the ongoing costs of investing in other mutual funds.
The Example is based on an investment of $1,000 invested at the beginning of the period and held for the entire period from September 1, 2016 through February 28, 2017, which represents a period of 181 days in a 365-day year.
Actual Expenses — The first line in the table below provides information about actual account values and actual expenses. You may use the information in this line, together with the amount you invested, to estimate the expenses that you paid over the period. Simply divide your account value by $1,000 (for example, an $8,600 account value divided by $1,000=8.6), then multiply the result by the number in the first line under the heading entitled “Expenses Paid” to estimate the expenses you paid on your account during this period.
Hypothetical Example for Comparison Purposes — The second line in the table below provides information about hypothetical account values and hypothetical expenses based on the Portfolio’s actual net expense ratios and an assumed rate of return of 5% per year before expenses, which is not the Portfolio’s actual return. The hypothetical account values and expenses may not be used to estimate the actual ending account balance or expenses you paid for the period. You may use this information to compare the ongoing costs of investing in the Portfolio and other funds. To do so, compare this 5% hypothetical example with the 5% hypothetical examples that appear in the shareholder reports of the other funds.
Please note that the expenses shown in the table are meant to highlight your ongoing costs only and do not reflect any transactional costs, such as sales charges, redemption fees, or exchange fees. Therefore, the second line of the table is useful in comparing ongoing costs only, and will not help you determine the relative total costs of owning different funds. In addition, if these transactional costs were included, your costs would have been higher.
| | | | | | | | | | | | |
| | | Strategic Factor Allocation Fund | |
| Share Class | | Beginning
Account Value
9/1/16 | | | Ending
Account Value
2/28/17 | | | Expenses Paid for the
6 months ended
2/28/17* | |
| Institutional | | | | | | | | | | | | |
Actual | | $ | 1,000.00 | | | $ | 1,027.90 | | | $ | 3.97 | |
Hypothetical 5% return | | | 1,000.00 | | | | 1,020.88 | + | | | 3.96 | |
| | + | | Hypothetical expenses are based on the Portfolio’s actual annualized net expense ratios and an assumed rate of return of 5% per year before expenses. | |
| | * | | Expenses are calculated using the Portfolio’s annualized net expense ratio for each class, which represents the ongoing expenses as a percentage of net assets for the six months ended February 28, 2017. Expenses are calculated by multiplying the annualized net expense ratio by the average account value for the period; then multiplying the result by the number of days in the most recent fiscal half year; and then dividing that result by the number of days in the fiscal year. The annualized net expense ratios for the period was 0.79%. | |
24
FUND PROFILE
Goldman Sachs Funds
Goldman Sachs is a premier financial services firm, known since 1869 for creating thoughtful and customized investment solutions in complex global markets.
Today, the Investment Management Division of Goldman Sachs serves a diverse set of clients worldwide, including private institutions, public entities and individuals. With approximately $1.17 trillion in assets under supervision as of December 31, 2016, Goldman Sachs Asset Management (“GSAM”) has portfolio management teams located around the world and our investment professionals bring firsthand knowledge of local markets to every investment decision. Assets under supervision includes assets under management and other client assets for which Goldman Sachs does not have full discretion. GSAM leverages the resources of Goldman, Sachs & Co. subject to legal, internal and regulatory restrictions.
Money Market
Financial Square FundsSM
| ∎ | | Financial Square Treasury Solutions Fund1 |
| ∎ | | Financial Square Government Fund1 |
| ∎ | | Financial Square Money Market Fund2 |
| ∎ | | Financial Square Prime Obligations Fund2 |
| ∎ | | Financial Square Treasury Instruments Fund1 |
| ∎ | | Financial Square Treasury Obligations Fund1 |
| ∎ | | Financial Square Federal Instruments Fund1 |
| ∎ | | Financial Square Tax-Exempt Money Market Fund2 |
Investor FundsSM
| ∎ | | Investor Money Market Fund3 |
| ∎ | | Investor Tax-Exempt Money Market Fund3 |
Fixed Income
Short Duration and Government
| ∎ | | High Quality Floating Rate Fund |
| ∎ | | Short-Term Conservative Income Fund4 |
| ∎ | | Short Duration Government Fund |
| ∎ | | Short Duration Income Fund |
| ∎ | | Inflation Protected Securities Fund |
Multi-Sector
Municipal and Tax-Free
| ∎ | | High Yield Municipal Fund |
| ∎ | | Dynamic Municipal Income Fund |
| ∎ | | Short Duration Tax-Free Fund |
Single Sector
| ∎ | | Investment Grade Credit Fund |
| ∎ | | High Yield Floating Rate Fund |
| ∎ | | Emerging Markets Debt Fund |
| ∎ | | Local Emerging Markets Debt Fund |
| ∎ | | Dynamic Emerging Markets Debt Fund |
Fixed Income Alternatives
| ∎ | | Long Short Credit Strategies Fund |
| ∎ | | Fixed Income Macro Strategies Fund |
Fundamental Equity
| ∎ | | Small/Mid Cap Value Fund |
| ∎ | | Small/Mid Cap Growth Fund |
| ∎ | | Flexible Cap Growth Fund |
| ∎ | | Concentrated Growth Fund |
| ∎ | | Technology Opportunities Fund |
| ∎ | | Growth Opportunities Fund |
| ∎ | | Rising Dividend Growth Fund |
| ∎ | | Dynamic U.S. Equity Fund |
Tax-Advantaged Equity
| ∎ | | U.S. Tax-Managed Equity Fund |
| ∎ | | International Tax-Managed Equity Fund |
| ∎ | | U.S. Equity Dividend and Premium Fund |
| ∎ | | International Equity Dividend and Premium Fund |
Equity Insights
| ∎ | | Small Cap Equity Insights Fund |
| ∎ | | U.S. Equity Insights Fund |
| ∎ | | Small Cap Growth Insights Fund |
| ∎ | | Large Cap Growth Insights Fund |
| ∎ | | Large Cap Value Insights Fund |
| ∎ | | Small Cap Value Insights Fund |
| ∎ | | International Small Cap Insights Fund |
| ∎ | | International Equity Insights Fund |
| ∎ | | Emerging Markets Equity Insights Fund |
Fundamental Equity International
| ∎ | | Strategic International Equity Fund |
| ∎ | | Focused International Equity Fund |
| ∎ | | Emerging Markets Equity Fund |
Select Satellite
| ∎ | | Real Estate Securities Fund |
| ∎ | | International Real Estate Securities Fund |
| ∎ | | Commodity Strategy Fund |
| ∎ | | Global Real Estate Securities Fund |
| ∎ | | Dynamic Allocation Fund |
| ∎ | | Absolute Return Tracker Fund |
| ∎ | | Managed Futures Strategy Fund |
| ∎ | | MLP Energy Infrastructure Fund |
| ∎ | | Multi-Manager Alternatives Fund |
| ∎ | | Absolute Return Multi-Asset Fund |
| ∎ | | Global Infrastructure Fund |
Total Portfolio Solutions
| ∎ | | Global Managed Beta Fund |
| ∎ | | Multi-Manager Non-Core Fixed Income Fund |
| ∎ | | Multi-Manager U.S. Dynamic Equity Fund |
| ∎ | | Multi-Manager Global Equity Fund |
| ∎ | | Multi-Manager International Equity Fund |
| ∎ | | Tactical Tilt Overlay Fund5 |
| ∎ | | Balanced Strategy Portfolio |
| ∎ | | Multi-Manager U.S. Small Cap Equity Fund |
| ∎ | | Multi-Manager Real Assets Strategy Fund |
| ∎ | | Growth and Income Strategy Portfolio |
| ∎ | | Growth Strategy Portfolio |
| ∎ | | Equity Growth Strategy Portfolio |
| ∎ | | Satellite Strategies Portfolio |
| ∎ | | Enhanced Dividend Global Equity Portfolio |
| ∎ | | Tax-Advantaged Global Equity Portfolio |
| ∎ | | Strategic Factor Allocation Fund |
| ∎ | | Target Date 2020 Portfolio |
| ∎ | | Target Date 2025 Portfolio |
| ∎ | | Target Date 2030 Portfolio |
| ∎ | | Target Date 2035 Portfolio |
| ∎ | | Target Date 2040 Portfolio |
| ∎ | | Target Date 2045 Portfolio |
| ∎ | | Target Date 2050 Portfolio |
| ∎ | | Target Date 2055 Portfolio |
| ∎ | | GQG Partners International Opportunities Fund |
| 1 | | You could lose money by investing in the Fund. Although the Fund seeks to preserve the value of your investment at $1.00 per share, it cannot guarantee it will do so. An investment in the Fund is not a deposit of a bank and is not insured or guaranteed by the Federal Deposit Insurance Corporation or any other government agency. The Fund’s sponsor has no legal obligation to provide financial support to the Fund, and you should not expect that the sponsor will provide financial support to the Fund at any time. |
| 2 | | You could lose money by investing in the Fund. Because the share price of the Fund will fluctuate, when you sell your shares they may be worth more or less than what you originally paid for them. The Fund may impose a fee upon sale of your shares or may temporarily suspend your ability to sell shares if the Fund’s liquidity falls below required minimums because of market conditions or other factors. An investment in the Fund is not a deposit of a bank and is not insured or guaranteed by the Federal Deposit Insurance Corporation or any other government agency. The Fund’s sponsor has no legal obligation to provide financial support to the Fund, and you should not expect that the sponsor will provide financial support to the Fund at any time. |
| 3 | | You could lose money by investing in the Fund. Although the Fund seeks to preserve the value of your investment at $1.00 per share, it cannot guarantee it will do so. The Fund may impose a fee upon sale of your shares or may temporarily suspend your ability to sell shares if the Fund’s liquidity falls below required minimums because of market conditions or other factors. An investment in the Fund is not a deposit of a bank and is not insured or guaranteed by the Federal Deposit Insurance Corporation or any other government agency. The Fund’s sponsor has no legal obligation to provide financial support to the Fund, and you should not expect that the sponsor will provide financial support to the Fund at any time. |
| 4 | | Effective on July 29, 2016, the Goldman Sachs Limited Maturity Obligations Fund was renamed the Goldman Sachs Short-Term Conservative Income Fund. |
| 5 | | Effective on June 1, 2016, the Goldman Sachs Tactical Tilt Implementation Fund was renamed the Goldman Sachs Tactical Tilt Overlay Fund. Financial Square FundsSM and Investor FundsSM are registered service marks of Goldman, Sachs & Co. |
| * | | This list covers open-end funds only. Please visit our website at www.GSAMFUNDS.com to learn about our closed-end funds and exchange-traded funds. |
| | |
TRUSTEES Ashok N. Bakhru, Chairman Kathryn Cassidy Diana M. Daniels Herbert J. Markley James A. McNamara Jessica Palmer Roy W. Templin Gregory G. Weaver | | OFFICERS James A. McNamara, President Scott M. McHugh, Principal Financial Officer, Senior Vice President and Treasurer Caroline L. Kraus, Secretary |
| |
GOLDMAN, SACHS & CO. Distributor and Transfer Agent | | GOLDMAN SACHS ASSET MANAGEMENT, L.P. Investment Adviser |
Visit our web site at www.GSAMFUNDS.com to obtain the most recent month-end returns.
Goldman Sachs Asset Management, L.P. 200 West Street, New York, New York 10282
The reports concerning the Portfolio included in this shareholder report may contain certain forward-looking statements about the factors that may affect the performance of the Portfolio in the future. These statements are based on Portfolio management’s predictions and expectations concerning certain future events and their expected impact on the Portfolio, such as performance of the economy as a whole and of specific industry sectors, changes in the levels of interest rates, the impact of developing world events, and other factors that may influence the future performance of the Portfolio. Management believes these forward-looking statements to be reasonable, although they are inherently uncertain and difficult to predict. Actual events may cause adjustments in portfolio management strategies from those currently expected to be employed.
A description of the policies and procedures that the Portfolio uses to determine how to vote proxies relating to portfolio securities and information regarding how the Portfolio voted proxies relating to portfolio securities for the most recent 12-month period ended June 30, are available (I) without charge, upon request by calling 1-800-526-7384; and (II) on the Securities and Exchange Commission (“SEC’’) web site at http://www.sec.gov.
The Portfolio files its complete schedule of portfolio holdings with the SEC for the first and third quarters of each fiscal year on Forms N-Q. The Portfolio’s Forms N-Q are available on the SEC’s web site at http://www.sec.gov within 60 days after the Portfolio’s first and third fiscal quarters. The Portfolio’s Forms N-Q may be reviewed and copied at the SEC’s Public Reference Room in Washington, D.C. and information on the operation of the Public Reference Room may also be obtained by calling 1-800-SEC-0330. Form N-Qs may be obtained upon request and without charge by calling 1-800-621-2550. Portfolio holdings and allocations shown are as of February 28, 2017 and may not be representative of future investments. Portfolio holdings should not be relied on in making investment decisions and should not be construed as research or investment advice regarding particular securities. Current and future holdings are subject to risk.
The portfolio risk management process includes an effort to monitor and manage risk, but does not imply low risk.
This material is not authorized for distribution to prospective investors unless preceded or accompanied by a current Prospectus or summary prospectus, if applicable. Investors should consider the Portfolio’s objective, risks, and charges and expenses, and read the summary prospectus, if available, and/or the Prospectus carefully before investing or sending money. The summary prospectus, if available, and the Prospectus contain this and other information about the Portfolio and may be obtained from your authorized dealer or from Goldman, Sachs & Co. by calling 1-800-621-2550.
© 2017 Goldman Sachs. All rights reserved. 88295-TMPL-04/2017-517514/STRATFACALSAR-17/406
(a) As of the end of the period covered by this report, the registrant has adopted a code of ethics that applies to the registrant’s principal executive officer, principal financial officer, principal accounting officer or controller, or persons performing similar functions, regardless of whether these individuals are employed by the registrant or a third party (the “Code of Ethics”).
(b) During the period covered by this report, no amendments were made to the provisions of the Code of Ethics.
(c) During the period covered by this report, the registrant did not grant any waivers, including an implicit waiver, from any provision of the Code of Ethics.
(d) A copy of the Code of Ethics is available as provided in Item 12(a)(1) of this report.
| ITEM 3. | AUDIT COMMITTEE FINANCIAL EXPERT. |
The registrant’s board of trustees has determined that the registrant has at least one “audit committee financial expert” (as defined in Item 3 of Form N-CSR) serving on its audit committee. Gregory G. Weaver is the “audit committee financial expert” and is “independent” (as each term is defined in Item 3 of Form N-CSR).
| ITEM 4. | PRINCIPAL ACCOUNTANT FEES AND SERVICES. |
The information required by this Item is only required in an annual report on this Form N-CSR.
| ITEM 5. | AUDIT COMMITTEE OF LISTED REGISTRANTS. |
| ITEM 6. | SCHEDULE OF INVESTMENTS. |
| | Schedule of Investments is included as part of the Report to Shareholders filed under Item 1. |
| ITEM 7. | DISCLOSURE OF PROXY VOTING POLICIES AND PROCEDURES FOR CLOSED-END MANAGEMENT INVESTMENT COMPANIES. |
| ITEM 8. | PORTFOLIO MANAGERS OF CLOSED-END MANAGEMENT INVESTMENT COMPANIES. |
| ITEM 9. | PURCHASES OF EQUITY SECURITIES BY CLOSED-END MANAGEMENT INVESTMENT COMPANY AND AFFILIATED PURCHASERS. |
| ITEM 10. | SUBMISSION OF MATTERS TO A VOTE OF SECURITY HOLDERS. |
| | There have been no material changes to the procedures by which shareholders may recommend nominees to the registrant’s board of trustees. |
| ITEM 11. | CONTROLS AND PROCEDURES. |
| | (a) | The registrant’s principal executive and principal financial officers, or persons performing similar functions have concluded that the registrant’s disclosure controls and procedures (as defined in Rule 30a-3(c) under the Investment Company Act of 1940, as amended (the “1940 Act”)) are effective as of a date within 90 days of the filing of this report that includes the disclosure required by this paragraph, based on the evaluation of these controls and procedures required by Rule 30a-3(b) under the 1940 Act and 15d-15(b) under the Securities Exchange Act of 1934, as amended. |
| | (b) | There were no changes in the registrant’s internal control over financial reporting (as defined in Rule 30a-3(d) under the 1940 Act) that occurred during the registrant’s second fiscal quarter of the period covered by this report that have materially affected, or are reasonably likely to materially affect, the registrant’s internal control over financial reporting. |
| | | | |
| (a)(1) | | Goldman Sachs Trust’s Code of Ethics for Principal Executive and Senior Financial Officers is incorporated by reference to Exhibit 12(a)(1) of the registrant’s Form N-CSR filed on July 8, 2015 for its International Equity Insights Funds. |
| | |
| (a)(2) | | Exhibit 99.CERT | | Certifications pursuant to Section 302 of the Sarbanes-Oxley Act of 2002 filed herewith. |
| | |
| (b) | | Exhibit 99.906CERT | | Certifications pursuant to Section 906 of the Sarbanes-Oxley Act of 2002 filed herewith. |
SIGNATURES
Pursuant to the requirements of the Securities Exchange Act of 1934 and the Investment Company Act of 1940, the registrant has duly caused this report to be signed on its behalf by the undersigned, thereunto duly authorized.
| | |
| | | Goldman Sachs Trust |
| |
| By: | | /s/ James A. McNamara |
| |
| | |
| | James A. McNamara |
| | President/Chief Executive Officer |
| | Goldman Sachs Trust |
| |
| Date: | | May 2, 2017 |
Pursuant to the requirements of the Securities Exchange Act of 1934 and the Investment Company Act of 1940, this report has been signed below by the following persons on behalf of the registrant and in the capacities and on the dates indicated.
| | |
| By: | | /s/ James A. McNamara |
| |
| | |
| | James A. McNamara |
| | President/Chief Executive Officer |
| | Goldman Sachs Trust |
| |
| Date: | | May 2, 2017 |
| |
| By: | | /s/ Scott McHugh |
| |
| | |
| | Scott McHugh |
| | Principal Financial Officer |
| | Goldman Sachs Trust |
| |
| Date: | | May 2, 2017 |