UNITED STATES
SECURITIES AND EXCHANGE COMMISSION
Washington, D.C. 20549
FORM N-CSR
CERTIFIED SHAREHOLDER REPORT OF REGISTERED
MANAGEMENT INVESTMENT COMPANIES
Investment Company Act file number 811-05349
Goldman Sachs Trust
(Exact name of registrant as specified in charter)
71 South Wacker Drive, Chicago, Illinois 60606
(Address of principal executive offices) (Zip code)
| Caroline Kraus, Esq. | Copies to: | |
| Goldman Sachs & Co. LLC | Geoffrey R.T. Kenyon, Esq. | |
| 200 West Street | Dechert LLP | |
| New York, New York 10282 | 100 Oliver Street | |
| 40th Floor | ||
| Boston, MA 02110-2605 |
(Name and address of agents for service)
Registrant’s telephone number, including area code: (312) 655-4400
Date of fiscal year end: December 31
Date of reporting period: June 30, 2017
| ITEM 1. | REPORTS TO STOCKHOLDERS. |
| The Semi-Annual Report to Shareholders is filed herewith. |
Goldman Sachs Funds

| Semi-Annual Report | June 30, 2017 | |||
Fund of Funds Portfolios | ||||
Balanced Strategy | ||||
Equity Growth Strategy | ||||
Growth and Income Strategy | ||||
Growth Strategy | ||||
Satellite Strategies | ||||

Goldman Sachs Fund of Funds Portfolios
| ∎ | BALANCED STRATEGY |
| ∎ | EQUITY GROWTH STRATEGY |
| ∎ | GROWTH AND INCOME STRATEGY |
| ∎ | GROWTH STRATEGY |
| ∎ | SATELLITE STRATEGIES |
| 1 | ||||
| 5 | ||||
| 7 | ||||
| 35 | ||||
| 37 | ||||
| 52 | ||||
| 60 | ||||
| 70 | ||||
| 95 | ||||
| NOT FDIC-INSURED | May Lose Value | No Bank Guarantee | ||
MARKET REVIEW
Fund of Funds Portfolios
Dear Shareholder:
This report provides an overview of regional and sector preferences of the Goldman Sachs Fund of Funds Portfolios (each, a “Portfolio,” and collectively, the “Portfolios”) during the six-month period ended June 30, 2017 (the “Reporting Period”).
During the six months ended June 30, 2017 (the “Reporting Period”), the U.S. and international equity markets produced positive returns, with international equities recording double-digit gains. The broad fixed income market generated modestly positive returns.
U.S. EQUITIES
As the Reporting Period began in January 2017, U.S. equities rallied to new highs on the prospect of deregulation following executive orders on oil pipelines and on further optimism around infrastructure spending after a $1 trillion proposal from Senate Democrats. Despite political uncertainty and protectionism concerns, U.S. equities continued to rally in February 2017, driven by “risk on” sentiment, or reduced risk aversion, owing to potential U.S. tax reform and deregulation as well as by stronger economic data. In March 2017, the U.S. Federal Reserve (the “Fed”) raised interest rates for the third time since the 2008-2009 global financial crisis, while maintaining projections for three rate hikes this year. However, a seemingly cautious stance on the future path of monetary tightening from the Fed Chair and the presence of a dissenter on the policy committee led to a dovish market reaction. (Dovish tends to suggest lower interest rates; opposite of hawkish.) Political risks subsequently drove U.S. equities lower in the wake of House Republicans’ struggle to schedule a vote on health care. For the month of March 2017, U.S. equities were virtually flat.
U.S. equities fell in April 2017, as Fed minutes suggested stocks were overvalued. However, U.S. equities subsequently rebounded on strong first quarter 2017 earnings results and on receding European political risk following the centrist candidate’s win in the French election. Although the U.S. labor market remained strong, economic activity and inflation data appeared to be moderating during the second quarter of 2017. Core inflation softened to 1.7% year-over-year in May 2017, marking a third consecutive month of weakness, while core personal consumption expenditures remained below the Fed’s 2% target at just 1.4% year-over-year. In addition, market expectations for pro-growth U.S. fiscal policy were dampened by domestic political developments. Nonetheless, the Fed proceeded to raise the targeted federal funds rate by 25 basis points in June 2017, citing ongoing strength in the labor market and a pick-up in household spending and business fixed investment. (A basis point is 1/100th of a percentage point.) The results of the Fed’s 2017 Comprehensive Capital Analysis and Review stress test for banks were encouraging, with improving payout ratios. (Payout ratio is the proportion of earnings paid out as dividends to shareholders.)
U.S. equities, as represented by the Standard & Poor’s 500® Index (the “S&P 500® Index”) gained 9.34% during the Reporting Period. Information technology, health care and consumer discretionary were the best performing sectors in the S&P 500® Index by a wide margin. The weakest performing sectors in the S&P 500® Index were energy and telecommunication services, the only two to post negative absolute returns, followed by real estate and financials, which were comparatively weak but generated positive returns during the Reporting Period. Within the U.S. equity market, there was significant disparity in performance not only among sectors but also among the various capitalization and style segments. While all capitalization
1
MARKET REVIEW
segments posted positive returns, large-cap stocks, as measured by the Russell 1000® Index, performed best, followed by mid-cap stocks, as measured by the Russell Midcap® Index, and then at some distance by small-cap stocks, as measured by the Russell 2000® Index. From a style perspective, growth-oriented stocks significantly outpaced value-oriented stocks across the capitalization spectrum. (All as measured by the Russell Investments indices.)
INTERNATIONAL EQUITIES
When the Reporting Period started, international equities rallied on the prospect of deregulation in the U.S. following executive orders on oil pipelines and further optimism around infrastructure. However, international equity markets subsequently retreated on political uncertainty and protectionism concerns. In February 2017, international equities were buoyed by “risk on” sentiment, or reduced risk aversion, owing to potential U.S. tax reform and deregulation as well as by stronger economic data. In March 2017, the Fed raised interest rates. However, a seemingly cautious stance on the future path of monetary tightening from the Fed Chair and the presence of a dissenter on the policy committee led to a dovish market reaction and Japanese yen appreciation, despite the Bank of Japan (“BoJ”) maintaining its policy rate. Meanwhile the European Central Bank (“ECB”) kept its policy unchanged at its March 2017 meeting but revised its growth and inflation forecasts upwards. Markets interpreted the positive economic assessment as hawkish, sparking concerns around the sequencing of the ECB’s policy steps — namely, whether rates will rise before quantitative easing ends. Still, international equities gained ground in March 2017.
During the second quarter of 2017, international equities were buoyed by receding political risk, as the centrist candidate defeated the nationalist candidate in the French election and successfully secured a parliamentary majority. Political risk also declined in Italy, as the anti-establishment Five Star Movement saw a setback in local elections, and market expectations for parliamentary elections this year declined. However, market optimism for pro-growth fiscal policy was dampened by political developments in the U.S. Strong first quarter 2017 corporate earnings results, with double-digit growth across virtually all major developed market regions, were supportive for international equity markets. The U.S. labor market remained strong during the second quarter of 2017, but economic activity and inflation data appeared to be moderating. Nonetheless, the Fed proceeded to raise the targeted federal funds rate by 25 basis points in June 2017. In the same month, European markets reacted hawkishly to the ECB President’s sanguine outlook for recovering inflation and cautious reference to tapering of asset purchases. Japanese equities saw a temporary pullback in June 2017, as market sentiment deteriorated and as the Japanese yen strengthened immediately after the Fed interest rate hike, but quickly rebounded.
For the Reporting Period as a whole, international equities, as measured by the MSCI EAFE Index, posted a return of 13.81%.1 Information technology, consumer staples, industrials and
| 1 | All MSCI EAFE returns are net of fees and in U.S. dollar terms. |
2
MARKET REVIEW
health care were the best performing sectors in the MSCI EAFE Index. The weakest performing sector in the MSCI EAFE Index during the Reporting Period was energy, the only one to post a negative absolute return during the Reporting Period. Telecommunication services, consumer discretionary and real estate were relatively weak compared to the MSCI EAFE Index, but each still generated a double-digit gain.
From a country perspective, China was the best performing equity market in the MSCI EAFE Index by a wide margin during the Reporting Period, followed by Spain, Denmark, Finland and Hong Kong. Ireland was the weakest individual country constituent in the MSCI EAFE Index during the Reporting Period, followed by Australia, Japan and the U.K.
FIXED INCOME MARKETS
At the beginning of the Reporting Period, spread (or non-government bond) sectors generally posted gains. Investors focused on the prospect of pro-growth policies from the new U.S. Administration, which we believe helped boost business and consumer sentiment to near record levels. Investors also evaluated the positive impact of earlier fiscal stimulus in China. Global purchasing managers’ indices pointed to solid and synchronized global expansion, led by developed markets, most notably the U.S. In Europe, economic data strengthened and political risk remained contained, as markets weathered the official start of Brexit negotiations. (Brexit refers to the U.K.’s efforts to exit the European Union.) The far right lost to centrists in the Netherlands’ election. In France, polls reflected a relatively low chance of victory for the far-right candidate in the country’s then-upcoming presidential vote. Monetary policy presented few surprises during the first calendar quarter, as the ECB, BoJ and Bank of England (“BoE”) kept their respective monetary policies unchanged. In March 2017, the ECB raised its economic growth and inflation forecast, while the Fed raised its target range for the federal funds rate by 25 basis points. Minutes from the meeting raised expectations that Fed balance sheet normalization would begin in 2017. Despite the Fed’s monetary policy tightening, the U.S. dollar weakened versus both developed and emerging markets currencies during the first calendar quarter.
In the second quarter of 2017, spread sectors overall recorded positive returns. Political developments led to temporary bouts of volatility early in the quarter, driving weakness in Brazilian, U.S. and U.K. fixed income assets as well as a credit rating downgrade of South Africa’s sovereign debt. Political risks receded in May 2017 on the centrist candidate’s victory in the French presidential election, which was supportive of French and European peripheral bonds broadly. On the economic front, U.S. core inflation weakened for the third consecutive month in May 2017, casting uncertainty over the pace of Fed monetary tightening. Nonetheless, comments included in minutes from the Fed’s May and June 2017 policy meetings suggested an announcement about how and when the Fed would begin reducing the size of its balance sheet would be made sooner than the markets had previously anticipated. In Europe, economic data continued to surprise to the upside. At its June 2017 policy meeting, the ECB provided a sanguine assessment of the risks to growth, but revised downward its medium-term inflation forecasts. The ECB, BoJ and BoE left their respective monetary
3
MARKET REVIEW
policies unchanged during the second calendar quarter, while the Fed raised interest rates for the second time in 2017 and the fourth time in a decade at its June 2017 policy meeting. As the quarter came to an end, a string of comments from global central bankers triggered a hawkish market reaction. (A hawkish market reaction suggests investors expect higher interest rates; opposite of dovish.) Global interest rates rose as the market anticipated a faster than expected pace of monetary policy tightening by the BoE, ECB and Bank of Canada. During the second quarter of 2017, the U.S. dollar continued to weaken versus many global currencies.
For the Reporting Period overall, sovereign emerging markets debt and high yield corporate bonds produced solid gains, outperforming U.S. Treasury securities. Investment grade corporate bonds also outpaced U.S. Treasuries, followed at a distance by agency securities, asset-backed securities and commercial mortgage-backed securities. Mortgage-backed securities slightly underperformed U.S. Treasuries. The U.S. Treasury yield curve flattened slightly during the Reporting Period, as yields on longer- and intermediate-term maturities fell and yields on shorter-term maturities rose. The yield on the bellwether 10-year U.S. Treasury fell approximately 32 basis points to end the Reporting Period at 2.11%. (A flattening yield curve is one wherein the differential in yields between longer-term and shorter-term maturities narrows.)
Looking Ahead
At the end of the Reporting Period, we expected the global economy to continue expanding during 2017, improving on the progress it made in 2016. We believed the markets were underestimating the pace of Fed rate hikes, given that the U.S. labor market was at what is defined by the government as full employment when the Reporting Period ended. Although we did not see a pickup in inflation during the Reporting Period, we expected this to be temporary as it was not consistent with U.S. economic data, in our view.
With regard to equities, we expect limited but positive returns in the near term, given the supportive investment environment and the appreciation in stock prices during the Reporting Period. As for fixed income, we are bearish on government bonds and believe we could see temporary selloffs in riskier asset classes, driven by inflation scares. At the end of the Reporting Period, we generally preferred corporate credit over government bonds, though the compression in spreads during the Reporting Period has made corporate credit less attractive than earlier in 2017, in our view. (Spreads are yield differentials between bonds of comparable maturity.) As for emerging markets assets versus developed markets assets, we remain more constructive on emerging markets assets given what we consider to be their attractive relative valuations and because we believe emerging markets growth has room to rebound.
4
GOLDMAN SACHS FUND OF FUNDS PORTFOLIOS
What Differentiates Goldman Sachs’
Approach to Asset Allocation?
We believe that strong investment results through asset allocation are best achieved through teams of experts working together on a global scale:
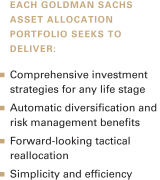
| ∎ | Goldman Sachs’ Global Portfolio Solutions Group determines the strategic and tactical asset allocations. The team is comprised of over 125* professionals with significant academic and practitioner experience. |
| ∎ | Goldman Sachs’ Portfolio Management Teams offer expert management of the mutual funds that are contained within each Portfolio. These same teams manage portfolios for institutional and high net worth investors. |
Goldman Sachs Asset Allocation Investment Process

Global Portfolio Solutions Group
Each Portfolio represents a diversified global portfolio on the efficient frontier.† The Portfolios differ in their long-term objective, and therefore, their asset allocation mix. The long-term strategic asset allocation is the primary source of risk and the corresponding primary determinant of total return. It therefore represents an anchor, or neutral starting point, from which tactical asset allocation decisions are made.

Global Portfolio Solutions Group
For each Portfolio, the long-term strategic asset allocation is adjusted through a tactical investment process that seeks to react to and capitalize on changes in the market, the economic cycle, and macroeconomic environment. Within each strategy, we shift assets away from the strategic allocation by over and underweighting certain asset classes and by taking long or short positions in specific sectors, regions and countries. Using a proprietary fundamental analysis and portfolio construction process, the team develops views based on its current market and economic outlook across asset classes like global developed equity, emerging market equity, investment grade and non-investment grade fixed income, and currency markets.
| *As | of June 2017. |
| †Portfolios | on the efficient frontier are optimal in both the sense that they offer maximal expected return for some given level of risk and minimal risk for some given level of expected return. The efficient frontier is the line created from the risk-reward graph, comprised of optimal portfolios. The optimal portfolios plotted along the curve have the highest expected return possible for the given amount of risk. |
5
GOLDMAN SACHS FUND OF FUNDS PORTFOLIOS

Portfolio Management Teams
Each Portfolio is predominantly comprised of underlying Goldman Sachs funds managed by broad, deep portfolio management teams. In addition to global tactical asset allocation, we seek to generate excess returns through security selection within each underlying fund. Whether in the equity or fixed income arenas, these portfolio management teams share a commitment to firsthand fundamental research and seek performance driven by successful security selection.
6
PORTFOLIO RESULTS
Fund of Funds Portfolios
Investment Objectives
The Goldman Sachs Balanced Strategy Portfolio seeks current income and long-term capital appreciation. The Goldman Sachs Equity Growth Strategy Portfolio seeks long-term capital appreciation. The Goldman Sachs Growth and Income Strategy Portfolio seeks long-term capital appreciation and current income. The Goldman Sachs Growth Strategy Portfolio seeks long-term capital appreciation and, secondarily, current income.
Portfolio Management Discussion and Analysis
Effective April 28, 2017, the Goldman Sachs Global Portfolio Solutions (“GPS”) Group assumed day-to-day management of the Fund of Funds Portfolios (the “Portfolios”) from the Goldman Sachs Quantitative Investment Strategies (“QIS”) Team. In connection with the change in portfolio management, the Portfolios underwent certain changes to their principal investment strategies and underlying funds. The performance information reported below is the combined performance of each of the Portfolios, reflecting current and prior investment objectives, strategies and policies.
Below, the Goldman Sachs QIS Team and the Goldman Sachs GPS Group discuss the Portfolios’ performance and positioning for the six-month period ended June 30, 2017 (the “Reporting Period”).
| Q | How did the Portfolios perform during the Reporting Period? |
| A | Goldman Sachs Balanced Strategy Portfolio — During the Reporting Period, the Balanced Strategy Portfolio’s Class A, C, Institutional, Service, IR, R and R6 Shares generated cumulative total returns of 5.28%, 4.86%, 5.48%, 5.17%, 5.43%, 5.11% and 5.48%, respectively. This compares to the 5.40% cumulative total return of the Portfolio’s blended benchmark, which is composed 60% of the Bloomberg Barclays Global Aggregate Bond Index (Gross, USD, Hedged) (“Bloomberg Barclays Global Index”) and 40% of the MSCI All Country World Index (Net, USD, Unhedged) (“MSCI ACWI Index”), during the same period. |
| The components of the Portfolio’s blended benchmark, the Bloomberg Barclays Global Index and the MSCI ACWI Index, generated cumulative total returns of 1.43% and 11.48%, respectively, during the Reporting Period. |
| Goldman Sachs Equity Growth Strategy Portfolio — During the Reporting Period, the Equity Growth Strategy Portfolio’s Class A, C, Institutional, Service, IR, R and R6 Shares generated cumulative total returns of 12.07%, 11.73%, 12.29%, 11.98%, 12.31%, 12.01% and 12.36%, respectively. This compares to the 11.48% cumulative total return of the Portfolio’s benchmark, the MSCI ACWI Index, during the same period. |
| Goldman Sachs Growth and Income Strategy Portfolio — During the Reporting Period, the Growth and Income Strategy Portfolio’s Class A, C, Institutional, Service, IR, R and R6 Shares generated cumulative total returns of 7.56%, 7.23%, 7.74%, 7.53%, 7.64%, 7.46% and 7.83%, respectively. This compares to the 7.41% cumulative total return of the Portfolio’s blended benchmark, which is composed 40% of the Bloomberg Barclays Global Index and 60% of the MSCI ACWI Index, during the same period. |
| The components of the Portfolio’s blended benchmark, the Bloomberg Barclays Global Index and the MSCI ACWI Index, generated cumulative total returns of 1.43% and 11.48%, respectively, during the Reporting Period. |
| Goldman Sachs Growth Strategy Portfolio — During the Reporting Period, the Growth Strategy Portfolio’s Class A, C, Institutional, Service, IR, R and R6 Shares generated cumulative total returns of 9.63%, 9.27%, 9.87%, 9.59%, 9.77%, 9.48% and 9.95%, respectively. This compares to the 9.43% cumulative total return of the Portfolio’s blended benchmark, which is composed 80% of the MSCI ACWI Index and 20% of the Bloomberg Barclays Global Index, during the same period. |
7
PORTFOLIO RESULTS
| The components of the Portfolio’s blended benchmark, the Bloomberg Barclays Global Index and the MSCI ACWI Index, generated cumulative total returns of 1.43% and 11.48%, respectively, during the Reporting Period. |
| Q | How did the Portfolios’ investment strategies and underlying funds change as a result of the change in portfolio management on April 28, 2017? |
| A | The GPS Group, which assumed management of the Portfolios on April 28, 2017, applies a factor-based risk budgeting approach to develop strategic allocations among the various asset classes. To establish a diversified strategic asset allocation, the GPS Group seeks to budget or allocate portfolio risk, as opposed to capital, across a set of asset allocation risk factors, including but not limited to, equity, interest rate, emerging markets, credit, momentum and active risk. The allocation process is done relative to the Portfolios’ respective benchmarks such that the sources of tracking error to the respective benchmarks are relatively balanced across the asset allocation factors. The resulting strategic asset allocations are implemented using a range of bottom-up security selection strategies across equity, fixed income and dynamic asset classes, which may utilize fundamental or quantitative investment techniques. The strategic asset allocation is adjusted by the GPS Group as part of its tactical investment process in order to react to changes in the markets, the economic cycle and the macroeconomic environment. Each Portfolio’s positioning may therefore change over time based on these short- to medium-term market views on dislocations and attractive investment opportunities. These views may impact the relative weighting across asset classes, the allocation to geographies, sectors and industries as well as the Portfolios’ duration and sensitivity to inflation. Market views may be developed from multiple sources, including fundamental analysis of the economy, the market cycle, asset class valuation, regulatory and policy action, and market technical or trading factors. By allocating across different factors, regions, investment styles and strategies, the GPS Group seeks to achieve diversified, dynamic portfolios that offer consistent positive performance in excess of their respective benchmarks. |
| The Portfolios seek to achieve their respective investment objectives by investing in a combination of underlying funds. With the change in portfolio management, the Portfolios may also invest directly in affiliated and unaffiliated exchange-traded funds (“ETFs”) and in derivatives for both hedging and non-hedging purposes. Overall, some of the Portfolios’ underlying funds invest primarily in fixed income or money market instruments (the “underlying fixed income funds”), some of the underlying funds invest primarily in equity securities (the “underlying equity funds”) and other underlying funds invest dynamically across equity, fixed income, commodity and other markets through a managed-volatility or trend-following approach (the “underlying dynamic funds”). |
| Q | What key factors were responsible for the Portfolios’ performance from January 1, 2017 through April 27, 2017 (“the initial part of the Reporting Period”)? |
| A | During the initial part of the Reporting Period, the Portfolios generated positive results on an absolute basis, with those having greater equity exposure performing more strongly. In addition, all four of the Portfolios outperformed their respective benchmark indices during the initial part of the Reporting Period. Overall, security selection within the underlying funds added significantly to the performance of each of the Portfolios. The QIS Team’s strategic, long-term asset allocation contributed positively to the performance of the Goldman Sachs Balanced Strategy Portfolio and the Goldman Sachs Growth and Income Strategy Portfolio. It detracted from the performance of the Goldman Sachs Growth Strategy Portfolio and the Goldman Sachs Equity Growth Strategy Portfolio.* The implementation of tactical views detracted from the returns of all four of the Portfolios during the initial part of the Reporting Period. |
| Q | How did tactical asset allocation decisions affect the Portfolios’ performance during the initial part of the Reporting Period? |
| A | During the initial part of Reporting Period, the implementation of the QIS Team’s tactical views detracted from the performance of all four of the Portfolios. Overall, the Portfolios were hampered by their overweight positions in U.S. value stocks versus U.S. growth stocks and in local emerging markets debt versus developed markets debt. In addition, the QIS Team’s decision to shift the Portfolios from overweight to underweight positions in emerging markets equities versus developed markets equities hurt relative returns. Only the Portfolios’ overweight positions in high yield corporate bonds versus core fixed income added to |
| * | As measured by Institutional Shares. |
8
PORTFOLIO RESULTS
performance in a meaningful way during the initial part of the Reporting Period. |
| Q | How did the Portfolios’ underlying funds perform relative to their respective benchmark indices during the initial part of the Reporting Period? |
| A | Of the Portfolios’ underlying equity funds, the Goldman Sachs Strategic Growth Fund, the Goldman Sachs Large Cap Value Insights Fund and the Goldman Sachs International Equity Insights Fund outperformed their respective benchmark indices most during the initial part of the Reporting Period. The Goldman Sachs Small Cap Equity Insights Fund, the Goldman Sachs Emerging Markets Equity Insights Fund and the Goldman Sachs Large Cap Growth Insights Fund underperformed their respective benchmark indices most. |
| Of the underlying fixed income funds, the Goldman Sachs Local Emerging Markets Debt Fund and the Goldman Sachs Strategic Income Fund outperformed their respective benchmark indices most during the initial part of the Reporting Period. The Goldman Sachs High Yield Floating Rate Fund, the Goldman Sachs High Yield Fund and the Goldman Sachs Emerging Markets Debt Fund each underperformed their respective benchmark indices the most. |
| Among alternative and dynamic investment strategies, the Goldman Sachs Managed Futures Strategy Fund and the Goldman Sachs Dynamic Allocation Fund outperformed their respective benchmark indices most. The Goldman Sachs Real Estate Securities Fund underperformed its benchmark index most during the initial part of the Reporting Period. The Goldman Sachs International Real Estate Securities Fund and the Goldman Sachs Commodity Strategy Fund also underperformed their respective benchmark indices, albeit only slightly. |
| Q | What key factors were responsible for the Fund’s performance between April 28, 2017 and June 30, 2017 (“the latter part of the Reporting Period”)? |
| A | During the latter part of the Reporting Period, the Portfolios generated positive results on an absolute basis, with those having greater equity exposure performing best. Only one of the Portfolios — the Goldman Sachs Equity Growth Strategy Portfolio — outperformed its benchmark index. The Goldman Sachs Balanced Strategy Portfolio, the Goldman Sachs Growth and Income Strategy Portfolio and the Goldman Sachs Growth Strategy Portfolio underperformed their respective benchmark indices.* Overall, the GPS Group’s long-term, strategic asset allocation had a flat to slightly positive impact on the performance of the Portfolios. Tactical asset allocations decisions overall detracted from results. Although the implementation of the GPS Group’s medium-term cycle-aware dynamic views added to returns, its short-term tactical views as well as security selection within the underlying funds detracted from the performance of each of the Portfolios during the latter part of the Reporting Period. |
| Q | How did tactical asset allocation decisions affect the Portfolios’ performance during the latter part of the Reporting Period? |
| A | As mentioned previously, the Portfolios’ strategic asset allocation is adjusted by the GPS Group as part of its tactical investment process in order to react to changes in the markets, the economic cycle and the macroeconomic environment. Each Portfolio’s positioning may therefore change over time based on these short- to medium-term market views. During the latter part of the Reporting Period, the GPS Group’s medium-term cycle-aware dynamic views contributed positively to the Portfolios’ returns, while the implementation of its short-term tactical decisions detracted from performance. |
Medium-term cycle-aware dynamic positioning within equities proved particularly helpful during the latter part of the Reporting Period when the Portfolios expressed a view wherein they were long emerging markets equities versus developed markets equities. This positioning added to the Portfolios’ returns, with the weak U.S. dollar, easier financial conditions and stable macro environment providing a favorable backdrop for emerging markets equities. Within fixed income, we held the view that each of the Portfolios should have a short duration bias. (Duration is a measure of the Fund’s sensitivity to changes in interest rates.) We expressed this view in two ways. First, the Portfolios were short long-maturity German government bonds, which added to performance on hawkish commentary from Germany’s central bank toward the end of the latter part of the Reporting Period. (Hawkish tends to imply higher interest rates; opposite of dovish.) Second, the Portfolios held steepening positions along the U.S. interest rate yield curve, which bolstered performance as longer-term yields rose near the |
9
| * | As measured by Institutional Shares. |
PORTFOLIO RESULTS
end of the latter part of the Reporting Period. (A steepening yield curve is one wherein the differential in yields between longer-term and shorter-term maturities widens; opposite of flattening. Yield curve is a spectrum of maturities.) |
| Our short-term tactical decisions, which seek to take advantage of what we consider short-term market mispricing, detracted from the Portfolios’ returns. The negative performance was driven by our tactical equity views. Our decision to reduce equity risk hurt the Portfolios’ results, as riskier asset classes rallied during the latter part of the Reporting Period. In addition, a relative value view, wherein the Portfolios held long positions in offshore Chinese equities versus onshore Chinese equities, detracted from returns. Onshore Chinese equities significantly outperformed offshore Chinese equities on the announcement in June 2017 that they would be gradually added to MSCI indices. Also detracting was the Portfolios’ tactical allocation to a basket of emerging markets currencies. On the positive side, our country-specific tactical views, expressed through long positions in Indian and South African equities, contributed positively to performance during the latter part of the Reporting Period. |
| Q | How did the Portfolios’ underlying funds perform relative to their respective benchmark indices during the latter part of the Reporting Period? |
| A | During the latter part of the Reporting Period, security selection within the underlying funds hurt the Portfolios’ results. This was concentrated in the Goldman Sachs Dynamic Allocation Fund, which generated rather flat performance, underperforming relative to our expectations and compared to a broad universe of liquid hedge funds. The Goldman Sachs Global Infrastructure Fund also underperformed its benchmark index during the latter part of the Reporting Period. In addition, among underlying equity funds, the Goldman Sachs Large Cap Growth Insights Fund, the Goldman Sachs International Small Cap Insights Fund and the Goldman Sachs Small Cap Equity Insights Fund underperformed their respective benchmark indices. On the positive side, the Goldman Sachs Emerging Markets Equity Insights Fund and the Goldman Sachs International Equity Insights Fund outperformed their respective benchmark indices during the latter part of the Reporting Period. |
| Q | How did the Portfolios use derivatives and similar instruments during the Reporting Period? |
| A | During the initial part of the Reporting Period, the Portfolios did not directly invest in derivatives. |
| During the latter part of the Reporting Period, the Portfolios used derivatives primarily to express tactical views across developed and emerging markets equities as well as fixed income. The Portfolios employed equity index futures to gain tactical exposure to U.K. large-cap equities (positive impact), European equities (negative impact), Indian equities (positive impact), Australian equity futures (neutral impact), South African equities (positive impact), Spanish equities (negative impact), and Chinese offshore-listed equities versus onshore-listed equities (negative impact). Additionally, to modulate risk, the Portfolios used options on European equities (negative impact) and large-cap U.S. equities (neutral impact). Within fixed income, the Portfolios used interest rate futures to express views on the U.S. Treasury yield curve and on long-term German interest rates (both had a positive impact). The Portfolios also used credit default swaps to gain exposure to the high yield corporate bond market (neutral impact). Within a tactical basket of currencies, the Portfolios employed foreign exchange forwards to go long and/or short select developed and emerging markets currencies (negative impact). |
| During the Reporting Period overall, some of the Portfolios’ underlying funds used derivatives to apply their active investment views with greater versatility and potentially to afford greater risk management precision. As market conditions warranted during the Reporting Period, some of these underlying funds engaged in forward foreign currency exchange contracts, financial futures contracts, options, swap contracts and structured securities to attempt to enhance portfolio return and for hedging purposes. |
| Q | What changes did you make during the Reporting Period within both the equity and fixed income portions of the Portfolios? |
| A | At the beginning of the Reporting Period, the QIS Team held a bullish view on equities versus fixed income due to strong momentum in the equity markets. In the first quarter of 2017, the QIS Team shifted to a bullish view on fixed income versus equities because of what we considered to be less attractive valuations in the equity markets. |
Within equities, at the beginning of the Reporting Period, we favored U.S. stocks over international stocks because of strong short-term momentum and investment flows into the |
10
PORTFOLIO RESULTS
U.S. stock market. We adopted a neutral view on U.S. stocks versus international stocks during the first quarter of 2017. Among U.S. equities, we began the Reporting Period bullish on value stocks versus growth stocks due to positive market sentiment for value stocks. We continued to favor value stocks over growth stocks in the first quarter of 2017 because of what we considered attractive risk premiums for value stocks. At the start of the Reporting Period, we were slightly bullish on large-cap stocks versus small-cap stocks because of the relatively more attractive valuations of large-cap stocks. We grew more bullish on large-cap stocks relative to small-cap stocks during the first quarter of 2017 as a result of improved investor sentiment for large-cap stocks. When the Reporting Period began, we held a bullish view on emerging markets equities versus developed markets equities due to what we considered less attractive valuations, weaker momentum and diminished investor risk appetite for developed markets equities. In the first quarter of 2017, we remained bullish on emerging markets equities versus developed markets equities because of what we viewed as less attractive valuations and weaker momentum for developed markets equities. |
| Within fixed income, at the start of the Reporting Period, we had a bullish view of international fixed income over U.S. fixed income because of what we considered less attractive yields and weaker momentum in the U.S. fixed income market. We shifted to a neutral view on international fixed income versus U.S. fixed income in the first quarter of 2017. At the beginning of the Reporting Period, we had a modestly bullish view of high yield corporate bonds relative to investment grade corporate bonds because of what we considered positive, but declining, risk premiums. We remained bullish on high yield corporate bonds versus investment grade corporate bonds in the first quarter of 2017 due to strong momentum in the high yield corporate bond market. When the Reporting Period began, we had a bullish view of developed markets debt versus U.S. dollar-denominated emerging markets debt because of weak momentum in emerging markets debt, emerging markets equities and emerging markets currencies. At the same time, we were bullish on developed markets debt versus local emerging markets debt due to strong momentum in developed markets currencies. In the first quarter of 2017, we became bullish on both U.S. dollar-denominated emerging markets debt and local emerging markets debt versus developed markets debt as a result of weaker momentum in developed markets debt, developed markets equities and developed markets currencies. |
| On April 28, 2017, the GPS Group took over management responsibilities for the Portfolios and transitioned them to new long-term strategic asset allocations. We added positions in global infrastructure securities as well as in a macroeconomic fixed income strategy that seeks to profit when interest rates decrease or remain flat. We eliminated the Portfolios’ allocation to unconstrained fixed income. In addition, we expanded the Portfolios’ investment universe through the use of ETFs and derivatives, which we employ to express both strategic and tactical asset allocation views. |
| Overall, during the latter part of the Reporting Period, we implemented three medium-term cycle-aware dynamic views, expressed through: 1) long positions in emerging markets equities; 2) short positions in long-maturity German government bonds; and 3) steepening positions on the U.S. interest rate yield curve. (The Goldman Sachs Equity Growth Strategy Portfolio did not adopt any of our strategic fixed income and currency views as it is an all-equity portfolio.) |
| Within the Portfolios’ short-term tactical asset allocation, we decreased equity risk by reducing exposure to global equities broadly, as we believed the markets would be volatile heading into the summer of 2017. Among equities, we established and maintained country-level positions in India, Singapore, South Africa and Japan. We also established and maintained relative value positions, such as long positions in offshore Chinese stocks versus onshore Chinese stocks and long positions in Spanish equities versus short positions in Australian equities. Within fixed income, we established and then increased the size of a basket containing relative value positions in the interest rates of various countries. The largest exposures were short positions in Australian and U.S. interest rates versus those of other countries, including long positions in Canadian interest rates. Among other relative value trades were long positions in U.S. high yield corporate bonds versus European high yield corporate bonds, wherein we sought to take advantage of what we believed to be an overvalued European high yield corporate bond market. We also initiated long relative value positions in seven-to-10-year U.S. Treasuries versus short positions in the Japanese yen. In addition, during the latter part of the Reporting Period, we added a basket that contained relative value positions in emerging markets currencies. (The Goldman Sachs Equity Growth Strategy Portfolio did not adopt any of our tactical fixed income and currency views as it is an all-equity portfolio.) |
11
PORTFOLIO RESULTS
| Q | Were there any changes to the Portfolios’ portfolio management team during the Reporting Period? |
| A | When the Reporting Period began, William Fallon, James Park, Nicholas Chan and Edward J. Tostanoski III of the QIS Team served as portfolio managers of the Portfolios. Effective April 3, 2017, William Fallon no longer served as a portfolio manager. On April 28, 2017, the GPS Group assumed day-to-day management of the Portfolios, with Raymond Chan and Christopher Lvoff becoming portfolio managers of the Portfolios. Edward J. Tostanoski III joined the GPS Group in April 2017 and remained a portfolio manager of the Portfolios, while James Park and Nicholas Chan no longer served as portfolio managers of the Portfolios. |
12
FUND BASICS
Balanced Strategy
as of June 30, 2017
| PERFORMANCE REVIEW | ||||||||||||||||||
| January 1, 2017– June 30, 2017 | Portfolio Total Return (based on NAV)1 | Balanced Strategy Composite Index2 | Bloomberg Barclays Global Index | MSCI ACWI Index | ||||||||||||||
| Class A | 5.28 | % | 5.40 | % | 1.43 | % | 11.48 | % | ||||||||||
| Class C | 4.86 | 5.40 | 1.43 | 11.48 | ||||||||||||||
| Institutional | 5.48 | 5.40 | 1.43 | 11.48 | ||||||||||||||
| Service | 5.17 | 5.40 | 1.43 | 11.48 | ||||||||||||||
| Class IR | 5.43 | 5.40 | 1.43 | 11.48 | ||||||||||||||
| Class R | 5.11 | 5.40 | 1.43 | 11.48 | ||||||||||||||
| Class R6 | 5.48 | 5.40 | 1.43 | 11.48 | ||||||||||||||
| 1 | The net asset value (“NAV”) represents the net assets of the class of the Portfolio (ex-dividend) divided by the total number of shares of the class outstanding. The Portfolio’s performance assumes the reinvestment of dividends and other distributions. The Portfolio’s performance does not reflect the deduction of any applicable sales charges. |
| 2 | The Balanced Strategy Composite Index (“Balanced Composite”) is a composite representation prepared by the Investment Adviser of the performance of the Portfolio’s asset classes weighted according to their respective weightings in the Portfolio’s target range. The Balanced Composite is comprised of a blend of the Bloomberg Barclays Global Aggregate Bond Index (Gross, USD, Hedged) (“Bloomberg Barclays Global Index”) (60%) and the MSCI All Country World Index (Net, USD, Unhedged) (“MSCI® ACWI Index”) (40%). The Bloomberg Barclays Global Index is an unmanaged index, provides a broad-based measure of the global investment grade fixed-rate debt markets and covers the most liquid portion of the global investment grade fixed-rate bond market, including government, credit and collateralized securities. The index figures do not include any deduction for fees, expenses or taxes. It is not possible to invest directly in an unmanaged index. The MSCI® ACWI Index is a free float-adjusted market capitalization weighted index that is designed to measure the equity market performance of developed and emerging markets. The MSCI® ACWI Index consists of 46 country indices comprising 23 developed and 23 emerging market country indices. The developed market country indices included are: Australia, Austria, Belgium, Canada, Denmark, Finland, France, Germany, Hong Kong, Ireland, Israel, Italy, Japan, Netherlands, New Zealand, Norway, Portugal, Singapore, Spain, Sweden, Switzerland, the United Kingdom and the United States. The emerging market country indices are: Brazil, Chile, China, Colombia, Czech Republic, Egypt, Greece, Hungary, India, Indonesia, South Korea, Malaysia, Mexico, Peru, Philippines, Poland, Russia, Qatar, South Africa, Taiwan, Thailand, Turkey and the United Arab Emirates. The index figures do not include any deduction for fees or expenses. It is not possible to invest directly in an unmanaged index. |
The returns set forth in the table above represent past performance. Past performance does not guarantee future results. The Portfolio’s investment return and principal value will fluctuate so that an investor’s shares, when redeemed, may be worth more or less than their original cost. Current performance may be lower or higher than the performance quoted above. Please visit our web site at www.gsamfunds.com to obtain the most recent month-end returns. Performance reflects applicable fee waivers and/or expense limitations in effect during the periods shown. In their absence, performance would be reduced. Returns do not reflect the deduction of taxes that a shareholder would pay on Portfolio distributions or the redemption of Portfolio shares.
13
FUND BASICS
| STANDARDIZED TOTAL RETURNS3 | ||||||||||||||||||||
| For the period ended 6/30/17 | One Year | Five Years | Ten Years | Since Inception | Inception Date | |||||||||||||||
| Class A | 2.03 | % | 3.96 | % | 2.57 | % | 4.15 | % | 1/2/98 | |||||||||||
| Class C | 6.24 | 4.36 | 2.39 | 3.68 | 1/2/98 | |||||||||||||||
| Institutional | 8.43 | 5.54 | 3.56 | 4.87 | 1/2/98 | |||||||||||||||
| Service | 7.79 | 5.18 | 3.12 | 4.39 | 1/2/98 | |||||||||||||||
| Class IR | 8.29 | 5.41 | N/A | 3.44 | 11/30/07 | |||||||||||||||
| Class R | 7.70 | 4.92 | N/A | 2.96 | 11/30/07 | |||||||||||||||
| Class R6 | 8.42 | N/A | N/A | 4.60 | 7/31/15 | |||||||||||||||
| 3 | The Standardized Total Returns are average annual total returns or cumulative total returns (only if the performance period is one year or less) as of the most recent calendar quarter-end. They assume reinvestment of all distributions at NAV. These returns reflect a maximum initial sales charge of 5.5% for Class A Shares and the assumed contingent deferred sales charge for Class C Shares (1% if redeemed within 12 months of purchase). Because Institutional, Service, Class IR, Class R and Class R6 Shares do not involve a sales charge, such a charge is not applied to their Standardized Total Returns. |
The returns set forth in the table above represent past performance. Past performance does not guarantee future results. The Portfolio’s investment return and principal value will fluctuate so that an investor’s shares, when redeemed, may be worth more or less than their original cost. Current performance may be lower or higher than the performance quoted above. Please visit our web site at www.gsamfunds.com to obtain the most recent month-end returns. Performance reflects applicable fee waivers and/or expense limitations in effect during the periods shown. In their absence, performance would be reduced. Returns do not reflect the deduction of taxes that a shareholder would pay on Portfolio distributions or the redemption of Portfolio shares.
| EXPENSE RATIOS4 | ||||||||||
| Net Expense Ratio (Current) | Gross Expense Ratio (Before Waivers) | |||||||||
| Class A | 1.36 | % | 1.44 | % | ||||||
| Class C | 2.11 | 2.19 | ||||||||
| Institutional | 0.96 | 1.04 | ||||||||
| Service | 1.46 | 1.54 | ||||||||
| Class IR | 1.11 | 1.19 | ||||||||
| Class R | 1.61 | 1.69 | ||||||||
| Class R6 | 0.94 | 1.02 | ||||||||
| 4 | The expense ratios of the Portfolio, both current (net of applicable fee waivers and/or expense limitations) and before waivers (gross of applicable fee waivers and/or expense limitations) are as set forth above according to the most recent publicly available prospectus for the Portfolio and may differ from the expense ratios disclosed in the Financial Highlights in this report. The Portfolio’s waivers and/or expense limitations will remain in place through at least April 28, 2018, and prior to such date the Investment Adviser may not terminate the arrangements without the approval of the Portfolio’s Board of Trustees. The expense limitation may be modified or terminated by the Investment Adviser at its discretion and without shareholder approval after such date, although the Investment Adviser does not presently intend to do so. If these arrangements are discontinued in the future, the expense ratios may change without shareholder approval. |
14
FUND BASICS
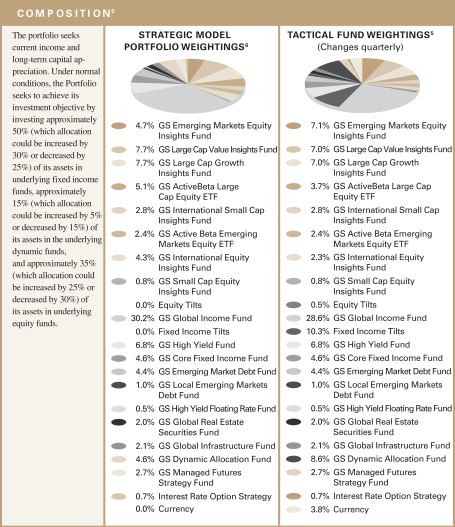
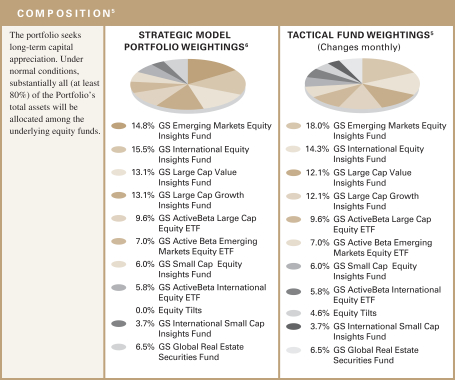
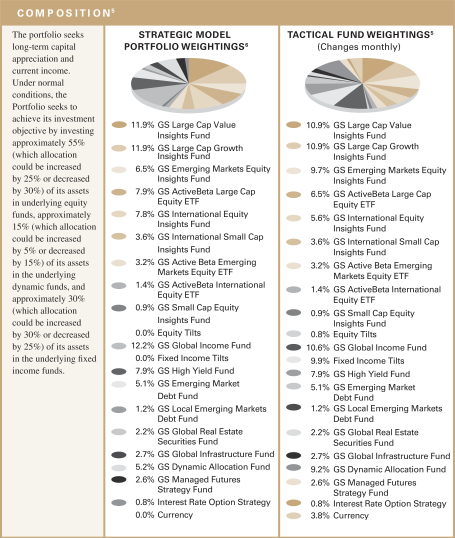
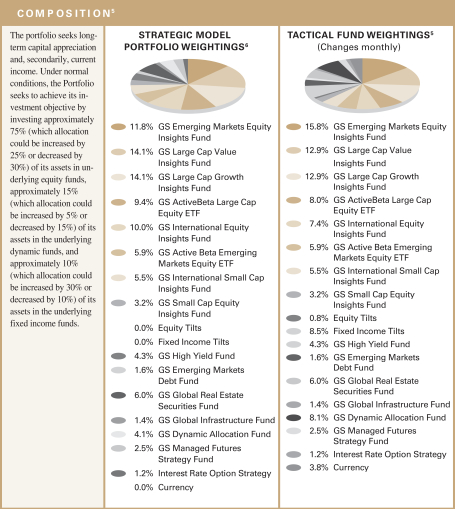
| 5 | Generally, tactical fund weightings are rebalanced approximately monthly, but they may be rebalanced more or less frequently at the discretion of the Investment Adviser based on the market environment and its macro views. The weightings in the chart above reflect the allocations as of June 30, 2017. Actual Fund weighting in the Portfolio may differ from the figures shown above due to rounding, differences in returns of the Underlying Funds, or both. The above figures are not indicative of future allocations. |
| 6 | Strategic allocation is the process of determining the areas of the global markets in which to invest, and in what long-term proportion, for each underlying fund. Our global approach attempts to generate strong long-term returns across geographies and asset classes, and is determined through a careful review of market opportunities and risk/return tradeoffs. On a monthly basis or as needed, we shift assets around the strategic allocation, over and under-weighting asset classes and countries relative to the neutral starting point, seeking to benefit from changing short-term conditions in global capital markets. This is called tactical asset allocation. |
15
FUND BASICS
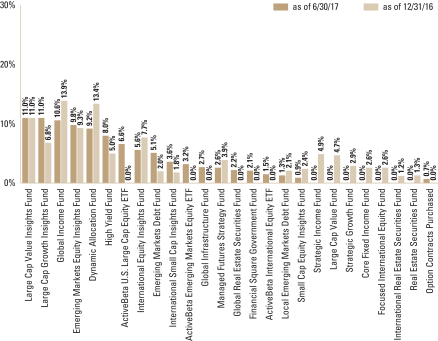
| OVERALL UNDERLYING FUND WEIGHTINGS7 |
| Percentage of Net Assets |
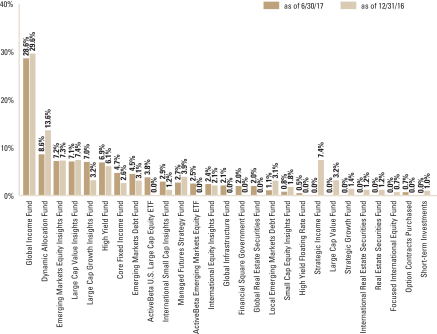
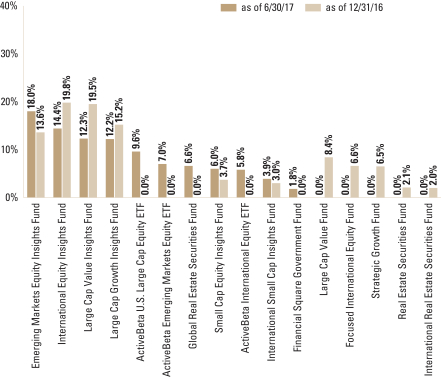
| 7 | The Portfolio is actively managed and, as such, its composition may differ over time. The percentage shown for each underlying fund reflects the value of that underlying fund as a percentage of net assets of the Portfolio. Short-term investments represent repurchase agreements as of December 31, 2016. Figures in the above graph may not sum to 100% due to rounding and/or the exclusion of other assets and liabilities. The graph depicts the Portfolio’s investments but may not represent the Portfolio’s market exposure due to the exclusion of certain derivatives, if any, as listed in the Additional Investment Information section of the Schedule of Investments. |
16
FUND BASICS
Equity Growth Strategy
as of June 30, 2017

| PERFORMANCE REVIEW | ||||||||||
| January 1, 2017–June 30, 2017 | Portfolio Total Return (based on NAV)1 | MSCI® ACWI Index 2 | ||||||||
| Class A | 12.07 | % | 11.48 | % | ||||||
| Class C | 11.73 | 11.48 | ||||||||
| Institutional | 12.29 | 11.48 | ||||||||
| Service | 11.98 | 11.48 | ||||||||
| Class IR | 12.31 | 11.48 | ||||||||
| Class R | 12.01 | 11.48 | ||||||||
| Class R6 | 12.36 | 11.48 | ||||||||
| 1 | The net asset value (“NAV”) represents the net assets of the class of the Portfolio (ex-dividend) divided by the total number of shares of the class outstanding. The Portfolio’s performance assumes the reinvestment of dividends and other distributions. The Portfolio’s performance does not reflect the deduction of any applicable sales charges. |
| 2 | The Portfolio’s benchmark is the MSCI All Country World Index (Net, USD, Unhedged) (“MSCI® ACWI Index”). The MSCI® ACWI Index is a free float-adjusted market capitalization weighted index that is designed to measure the equity market performance of developed and emerging markets. The MSCI® ACWI Index consists of 46 country indices comprising 23 developed and 23 emerging market country indices. The developed market country indices included are: Australia, Austria, Belgium, Canada, Denmark, Finland, France, Germany, Hong Kong, Ireland, Israel, Italy, Japan, Netherlands, New Zealand, Norway, Portugal, Singapore, Spain, Sweden, Switzerland, the United Kingdom and the United States. The emerging market country indices are: Brazil, Chile, China, Colombia, Czech Republic, Egypt, Greece, Hungary, India, Indonesia, South Korea, Malaysia, Mexico, Peru, Philippines, Poland, Russia, Qatar, South Africa, Taiwan, Thailand, Turkey and the United Arab Emirates. The index figures do not include any deduction for fees or expenses. It is not possible to invest directly in an unmanaged index. |
The returns set forth in the table above represent past performance. Past performance does not guarantee future results. The Portfolio’s investment return and principal value will fluctuate so that an investor’s shares, when redeemed, may be worth more or less than their original cost. Current performance may be lower or higher than the performance quoted above. Please visit our web site at www.gsamfunds.com to obtain the most recent month-end returns. Performance reflects applicable fee waivers and/or expense limitations in effect during the periods shown. In their absence, performance would be reduced. Returns do not reflect the deduction of taxes that a shareholder would pay on Portfolio distributions or the redemption of Portfolio shares.
17
FUND BASICS
| STANDARDIZED TOTAL RETURNS3 | ||||||||||||||||||||
| For the period ended 6/30/17 | One Year | Five Years | Ten Years | Since Inception | Inception Date | |||||||||||||||
| Class A | 12.77 | % | 9.71 | % | 2.46 | % | 4.73 | % | 1/2/98 | |||||||||||
| Class C | 17.48 | 10.16 | 2.28 | 4.27 | 1/2/98 | |||||||||||||||
| Institutional | 19.72 | 11.41 | 3.46 | 5.44 | 1/2/98 | |||||||||||||||
| Service | 19.13 | 10.84 | 2.94 | 4.93 | 1/2/98 | |||||||||||||||
| Class IR | 19.67 | 11.27 | N/A | 3.59 | 11/30/07 | |||||||||||||||
| Class R | 19.05 | 10.69 | N/A | 3.12 | 11/30/07 | |||||||||||||||
| Class R6 | 19.81 | N/A | N/A | 7.87 | 7/31/15 | |||||||||||||||
| 3 | The Standardized Total Returns are average annual total returns or cumulative total returns (only if the performance period is one year or less) as of the most recent calendar quarter-end. They assume reinvestment of all distributions at NAV. These returns reflect a maximum initial sales charge of 5.5% for Class A Shares and the assumed contingent deferred sales charge for Class C Shares (1% if redeemed within 12 months of purchase). Because Institutional, Service, Class IR, Class R and Class R6 Shares do not involve a sales charge, such a charge is not applied to their Standardized Total Returns. |
The returns set forth in the table above represent past performance. Past performance does not guarantee future results. The Portfolio’s investment return and principal value will fluctuate so that an investor’s shares, when redeemed, may be worth more or less than their original cost. Current performance may be lower or higher than the performance quoted above. Please visit our web site at www.gsamfunds.com to obtain the most recent month-end returns. Performance reflects applicable fee waivers and/or expense limitations in effect during the periods shown. In their absence, performance would be reduced. Returns do not reflect the deduction of taxes that a shareholder would pay on Portfolio distributions or the redemption of Portfolio shares.
| EXPENSE RATIOS4 | ||||||||||
| Net Expense��Ratio (Current) | Gross Expense Ratio (Before Waivers) | |||||||||
| Class A | 1.37 | % | 1.47 | % | ||||||
| Class C | 2.12 | 2.22 | ||||||||
| Institutional | 0.97 | 1.07 | ||||||||
| Service | 1.47 | 1.57 | ||||||||
| Class IR | 1.12 | 1.22 | ||||||||
| Class R | 1.62 | 1.72 | ||||||||
| Class R6 | 0.95 | 1.05 | ||||||||
| 4 | The expense ratios of the Portfolio, both current (net of applicable fee waivers and/or expense limitations) and before waivers (gross of applicable fee waivers and/or expense limitations) are as set forth above according to the most recent publicly available prospectus for the Portfolio and may differ from the expense ratios disclosed in the Financial Highlights in this report. The Portfolio’s waivers and/or expense limitations will remain in place through at least April 28, 2018, and prior to such date the Investment Adviser may not terminate the arrangements without the approval of the Portfolio’s Board of Trustees. The expense limitation may be modified or terminated by the Investment Adviser at its discretion and without shareholder approval after such date, although the Investment Adviser does not presently intend to do so. If these arrangements are discontinued in the future, the expense ratios may change without shareholder approval. |
18
FUND BASICS
| 5 | Generally, tactical fund weightings are rebalanced approximately monthly, but they may be rebalanced more or less frequently at the discretion of the Investment Adviser based on the market environment and its macro views. The weightings in the chart above reflect the allocations as of June 30, 2017. Actual underlying fund weighting in the Portfolio may differ from the figures shown above due to rounding, differences in returns of the underlying funds, or both. The above figures are not indicative of future allocations. |
| 6 | Strategic allocation is the process of determining the areas of the global markets in which to invest, and in what long-term proportion, for each underlying fund. Our global approach attempts to generate strong long-term returns across geographies and asset classes, and is determined through a careful review of market opportunities and risk/return tradeoffs. On a monthly basis or as needed, we shift assets around the strategic allocation, over and under-weighting asset classes and countries relative to the neutral starting point, seeking to benefit from changing short-term conditions in global capital markets. This is called tactical asset allocation. |
19
FUND BASICS
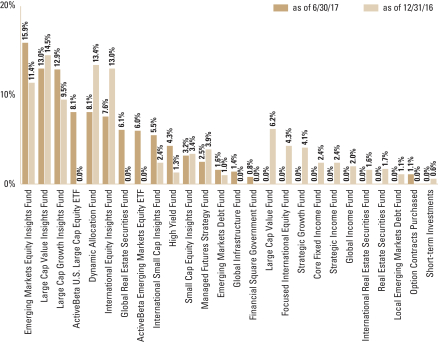
| OVERALL UNDERLYING FUND WEIGHTINGS7 |
| Percentage of Net Assets |
| 7 | The Portfolio is actively managed and, as such, its composition may differ over time. The percentage shown for each underlying fund reflects the value of that underlying fund as a percentage of net assets of the Portfolio. Figures in the above graph may not sum to 100% due to rounding and/or the exclusion of other assets and liabilities. The graph depicts the Portfolio’s investments but may not represent the Portfolio’s market exposure due to the exclusion of certain derivatives, if any, as listed in the Additional Investment Information section of the Schedule of Investments. |
20
FUND BASICS
Growth and Income Strategy
as of June 30, 2017
| PERFORMANCE REVIEW | ||||||||||||||||||
| January 1, 2017– June 30, 2017 | Portfolio Total Return (based on NAV)1 | Growth and Income Composite Index2 | Bloomberg Barclays Global Index | MSCI ACWI Index | ||||||||||||||
| Class A | 7.56 | % | 7.41 | % | 1.43 | % | 11.48 | % | ||||||||||
| Class C | 7.23 | 7.41 | 1.43 | 11.48 | ||||||||||||||
| Institutional | 7.74 | 7.41 | 1.43 | 11.48 | ||||||||||||||
| Service | 7.53 | 7.41 | 1.43 | 11.48 | ||||||||||||||
| Class IR | 7.64 | 7.41 | 1.43 | 11.48 | ||||||||||||||
| Class R | 7.46 | 7.41 | 1.43 | 11.48 | ||||||||||||||
| Class R6 | 7.83 | 7.41 | 1.43 | 11.48 | ||||||||||||||
| 1 | The net asset value (“NAV”) represents the net assets of the class of the Portfolio (ex-dividend) divided by the total number of shares of the class outstanding. The Portfolio’s performance assumes the reinvestment of dividends and other distributions. The Portfolio’s performance does not reflect the deduction of any applicable sales charges. |
| 2 | The Growth and Income Strategy Composite Index (“Growth and Income Composite”) is a composite representation prepared by the Investment Adviser of the performance of the Portfolio’s asset classes weighted according to their respective weightings in the Portfolio’s target range. The Growth and Income Composite is comprised of a blend of the Bloomberg Barclays Global Aggregate Bond Index (Gross, USD, Hedged) (“Bloomberg Barclays Global Index”) (40%) and the MSCI All Country World Index (Net, USD, Unhedged) (“MSCI® ACWI Index”) (60%). The Growth and Income Composite figures do not reflect any deduction for fees, expenses or taxes. The Bloomberg Barclays Global Index is an unmanaged index, provides a broad-based measure of the global investment-grade fixed-rate debt markets and covers the most liquid portion of the global investment grade fixed-rate bond market, including government, credit and collateralized securities. The index figures do not include any deduction for fees, expenses or taxes. It is not possible to invest directly in an unmanaged index. The MSCI® ACWI Index is a free float-adjusted market capitalization weighted index that is designed to measure the equity market performance of developed and emerging markets. The MSCI® ACWI Index consists of 46 country indices comprising 23 developed and 23 emerging market country indices. The developed market country indices included are: Australia, Austria, Belgium, Canada, Denmark, Finland, France, Germany, Hong Kong, Ireland, Israel, Italy, Japan, Netherlands, New Zealand, Norway, Portugal, Singapore, Spain, Sweden, Switzerland, the United Kingdom and the United States. The emerging market country indices are: Brazil, Chile, China, Colombia, Czech Republic, Egypt, Greece, Hungary, India, Indonesia, South Korea, Malaysia, Mexico, Peru, Philippines, Poland, Qatar, Russia, South Africa, Taiwan, Thailand, Turkey and the United Arab Emirates. The index figures do not include any deduction for fees or expenses. It is not possible to invest directly in an unmanaged index. |
The returns set forth in the table above represent past performance. Past performance does not guarantee future results. The Portfolio’s investment return and principal value will fluctuate so that an investor’s shares, when redeemed, may be worth more or less than their original cost. Current performance may be lower or higher than the performance quoted above. Please visit our web site at www.gsamfunds.com to obtain the most recent month-end returns. Performance reflects applicable fee waivers and/or expense limitations in effect during the periods shown. In their absence, performance would be reduced. Returns do not reflect the deduction of taxes that a shareholder would pay on Portfolio distributions or the redemption of Portfolio shares.
21
FUND BASICS
| STANDARDIZED TOTAL RETURNS3 | ||||||||||||||||||||
| For the period ended 6/30/17 | One Year | Five Years | Ten Years | Since Inception | Inception Date | |||||||||||||||
| Class A | 5.83 | % | 5.75 | % | 2.34 | % | 4.50 | % | 1/2/98 | |||||||||||
| Class C | 10.18 | 6.17 | 2.15 | 4.02 | 1/2/98 | |||||||||||||||
| Institutional | 12.43 | 7.38 | 3.33 | 5.22 | 1/2/98 | |||||||||||||||
| Service | 11.95 | 6.86 | 2.83 | 4.70 | 1/2/98 | |||||||||||||||
| Class IR | 12.28 | 7.22 | N/A | 3.23 | 11/30/07 | |||||||||||||||
| Class R | 11.81 | 6.71 | N/A | 2.74 | 11/30/07 | |||||||||||||||
| Class R6 | 12.54 | N/A | N/A | 5.64 | 7/31/15 | |||||||||||||||
| 3 | The Standardized Total Returns are average annual total returns or cumulative total returns (only if the performance period is one year or less) as of the most recent calendar quarter-end. They assume reinvestment of all distributions at NAV. These returns reflect a maximum initial sales charge of 5.5% for Class A Shares and the assumed contingent deferred sales charge for Class C Shares (1% if redeemed within 12 months of purchase). Because Institutional, Service, Class IR, Class R and Class R6 Shares do not involve a sales charge, such a charge is not applied to their Standardized Total Returns. |
The returns set forth in the table above represent past performance. Past performance does not guarantee future results. The Portfolio’s investment return and principal value will fluctuate so that an investor’s shares, when redeemed, may be worth more or less than their original cost. Current performance may be lower or higher than the performance quoted above. Please visit our web site at www.gsamfunds.com to obtain the most recent month-end returns. Performance reflects applicable fee waivers and/or expense limitations in effect during the periods shown. In their absence, performance would be reduced. Returns do not reflect the deduction of taxes that a shareholder would pay on Portfolio distributions or the redemption of Portfolio shares.
| EXPENSE RATIOS4 | ||||||||||
| Net Expense Ratio (Current) | Gross Expense Ratio (Before Waivers) | |||||||||
| Class A | 1.37 | % | 1.42 | % | ||||||
| Class C | 2.12 | 2.17 | ||||||||
| Institutional | 0.97 | 1.02 | ||||||||
| Service | 1.47 | 1.52 | ||||||||
| Class IR | 1.12 | 1.17 | ||||||||
| Class R | 1.62 | 1.67 | ||||||||
| Class R6 | 0.95 | 1.00 | ||||||||
| 4 | The expense ratios of the Portfolio, both current (net of applicable fee waivers and/or expense limitations) and before waivers (gross of applicable fee waivers and/or expense limitations) are as set forth above according to the most recent publicly available prospectus for the Portfolio and may differ from the expense ratios disclosed in the Financial Highlights in this report. The Portfolio’s waivers and/or expense limitations will remain in place through at least April 28, 2018, and prior to such date the Investment Adviser may not terminate the arrangements without the approval of the Portfolio’s Board of Trustees. The expense limitation may be modified or terminated by the Investment Adviser at its discretion and without shareholder approval after such date, although the Investment Adviser does not presently intend to do so. If these arrangements are discontinued in the future, the expense ratios may change without shareholder approval. |
22
FUND BASICS
| 5 | Generally, tactical fund weightings are rebalanced approximately monthly, but they may be rebalanced more or less frequently at the discretion of the Investment Adviser based on the market environment and its macro views. The weightings in the chart above reflect the allocations as of June 30, 2017. Actual underlying fund weighting in the Portfolio may differ from the figures shown above due to rounding, differences in returns of the underlying funds, or both. The above figures are not indicative of future allocations. |
| 6 | Strategic allocation is the process of determining the areas of the global markets in which to invest, and in what long-term proportion, for each underlying fund. Our global approach attempts to generate strong long-term returns across geographies and asset classes, and is determined through a careful review of market opportunities and risk/return tradeoffs. On a monthly basis or as needed, we shift assets around the strategic allocation, over and under-weighting asset classes and countries relative to the neutral starting point, seeking to benefit from changing short-term conditions in global capital markets. This is called tactical asset allocation. |
23
FUND BASICS
| OVERALL UNDERLYING FUND WEIGHTINGS7 |
| Percentage of Net Assets |
| 7 | The Portfolio is actively managed and, as such, its composition may differ over time. The percentage shown for each underlying fund reflects the value of that underlying fund as a percentage of net assets of the Portfolio. Figures in the above graph may not sum to 100% due to rounding and/or the exclusion of other assets and liabilities. The graph depicts the Portfolio’s investments but may not represent the Portfolio’s market exposure due to the exclusion of certain derivatives, if any, as listed in the Additional Investment Information section of the Schedule of Investments. |
24
FUND BASICS
Growth Strategy
as of June 30, 2017
| PERFORMANCE REVIEW | ||||||||||||||||||
January 1, 2017– June 30, 2017 | Portfolio Total Return (based on NAV)1 | Growth Strategy Composite Index2 | Bloomberg Barclays Global Index | MSCI ACWI Index | ||||||||||||||
| Class A | 9.63 | % | 9.43 | % | 1.43 | % | 11.48 | % | ||||||||||
| Class C | 9.27 | 9.43 | 1.43 | 11.48 | ||||||||||||||
| Institutional | 9.87 | 9.43 | 1.43 | 11.48 | ||||||||||||||
| Service | 9.59 | 9.43 | 1.43 | 11.48 | ||||||||||||||
| Class IR | 9.77 | 9.43 | 1.43 | 11.48 | ||||||||||||||
| Class R | 9.48 | 9.43 | 1.43 | 11.48 | ||||||||||||||
| Class R6 | 9.95 | 9.43 | 1.43 | 11.48 | ||||||||||||||
| 1 | The net asset value (“NAV”) represents the net assets of the class of the Portfolio (ex-dividend) divided by the total number of shares of the class outstanding. The Portfolio’s performance assumes the reinvestment of dividends and other distributions. The Portfolio’s performance does not reflect the deduction of any applicable sales charges. |
| 2 | The Growth Strategy Composite Index (“Growth Composite”) is a composite representation prepared by the Investment Advisor of the performance of the Portfolio’s asset classes weighted according to their respective weightings in the Portfolio’s target range. The Growth Composite is comprised of a blend of the Bloomberg Barclays Global Aggregate Bond Index (Gross, USD, Hedged) (“Bloomberg Barclays Global Index”) (20%) and the MSCI All Country World Index (Net, USD, Unhedged) (“MSCI® ACWI Index”) (80%). The Growth Strategy Composite figures do not reflect any deduction for fees, expenses or taxes. The Bloomberg Barclays Global Index is an unmanaged index, provides a broad-based measure of the global investment-grade fixed-rate debt markets and covers the most liquid portion of the global investment grade fixed-rate bond market, including government, credit and collateralized securities. The index figures do not include any deduction for fees, expenses or taxes. It is not possible to invest directly in an unmanaged index. The MSCI® ACWI Index is a free floatadjusted market capitalization weighted index that is designed to measure the equity market performance of developed and emerging markets. The MSCI® ACWI Index consists of 46 country indices comprising 23 developed and 23 emerging market country indices. The developed market country indices included are: Australia, Austria, Belgium, Canada, Denmark, Finland, France, Germany, Hong Kong, Ireland, Israel, Italy, Japan, Netherlands, New Zealand, Norway, Portugal, Singapore, Spain, Sweden, Switzerland, the United Kingdom and the United States. The emerging market country indices are: Brazil, Chile, China, Colombia, Czech Republic, Egypt, Greece, Hungary, India, Indonesia, South Korea, Malaysia, Mexico, Peru, Philippines, Poland, Qatar, Russia, South Africa, Taiwan, Thailand, Turkey and the United Arab Emirates. The index figures do not include any deduction for fees or expenses. It is not possible to invest directly in an unmanaged index. |
The returns set forth in the table above represent past performance. Past performance does not guarantee future results. The Portfolio’s investment return and principal value will fluctuate so that an investor’s shares, when redeemed, may be worth more or less than their original cost. Current performance may be lower or higher than the performance quoted above. Please visit our web site at www.gsamfunds.com to obtain the most recent month-end returns. Performance reflects applicable fee waivers and/or expense limitations in effect during the periods shown. In their absence, performance would be reduced. Returns do not reflect the deduction of taxes that a shareholder would pay on Portfolio distributions or the redemption of Portfolio shares.
25
FUND BASICS
| STANDARDIZED TOTAL RETURNS3 | ||||||||||||||||||||
| For the period ended 6/30/17 | One Year | Five Years | Ten Years | Since Inception | Inception Date | |||||||||||||||
| Class A | 9.49 | % | 7.62 | % | 2.01 | % | 4.38 | % | 1/2/98 | |||||||||||
| Class C | 14.01 | 8.04 | 1.83 | 3.90 | 1/2/98 | |||||||||||||||
| Institutional | 16.31 | 9.28 | 3.00 | 5.09 | 1/2/98 | |||||||||||||||
| Service | 15.73 | 8.77 | 2.50 | 4.57 | 1/2/98 | |||||||||||||||
| Class IR | 16.13 | 9.13 | N/A | 3.06 | 11/30/07 | |||||||||||||||
| Class R | 15.50 | 8.59 | N/A | 2.55 | 11/30/07 | |||||||||||||||
| Class R6 | 16.40 | N/A | N/A | 6.62 | 7/31/15 | |||||||||||||||
| 3 | The Standardized Total Returns are average annual total returns or cumulative total returns (only if the performance period is one year or less) as of the most recent calendar quarter-end. They assume reinvestment of all distributions at NAV. These returns reflect a maximum initial sales charge of 5.5% for Class A Shares and the assumed contingent deferred sales charge for Class C Shares (1% if redeemed within 12 months of purchase). Because Institutional, Service, Class IR, Class R and Class R6 Shares do not involve a sales charge, such a charge is not applied to their Standardized Total Returns. |
The returns represent past performance. Past performance does not guarantee future results. The Portfolio’s investment return and principal value will fluctuate so that an investor’s shares, when redeemed, may be worth more or less than their original cost. Current performance may be lower or higher than the performance quoted above. Please visit our web site at www.GSAMFUNDS.com to obtain the most recent month-end returns. Performance reflects applicable fee waivers and/or expense limitations in effect during the periods shown. In their absence, performance would be reduced. Returns do not reflect the deduction of taxes that a shareholder would pay on Portfolio distributions or the redemption of Portfolio shares.
| EXPENSE RATIOS4 | ||||||||||
| Net Expense Ratio (Current) | Gross Expense Ratio (Before Waivers) | |||||||||
| Class A | 1.38 | % | 1.44 | % | ||||||
| Class C | 2.13 | 2.19 | ||||||||
| Institutional | 0.98 | 1.04 | ||||||||
| Service | 1.48 | 1.54 | ||||||||
| Class IR | 1.13 | 1.19 | ||||||||
| Class R | 1.63 | 1.69 | ||||||||
| Class R6 | 0.96 | 1.02 | ||||||||
| 4 | The expense ratios of the Portfolio, both current (net of applicable fee waivers and/or expense limitations) and before waivers (gross of applicable fee waivers and/or expense limitations) are as set forth above according to the most recent publicly available prospectus for the Portfolio and may differ from the expense ratios disclosed in the Financial Highlights in this report. The Portfolio’s waivers and/or expense limitations will remain in place through at least April 28, 2018, and prior to such date the Investment Adviser may not terminate the arrangements without the approval of the Portfolio’s Board of Trustees. The expense limitation may be modified or terminated by the Investment Adviser at its discretion and without shareholder approval after such date, although the Investment Adviser does not presently intend to do so. If these arrangements are discontinued in the future, the expense ratios may change without shareholder approval. |
26
FUND BASICS
| 5 | Generally, tactical fund weightings are rebalanced approximately monthly, but they may be rebalanced more or less frequently at the discretion of the Investment Adviser based on the market environment and its macro views. The weightings in the chart above reflect the allocations as of June 30, 2017. Actual underlying fund weighting in the Portfolio may differ from the figures shown above due to rounding, differences in returns of the underlying funds, or both. The above figures are not indicative of future allocations. |
| 6 | Strategic allocation is the process of determining the areas of the global markets in which to invest, and in what long-term proportion, for each underlying fund. Our global approach attempts to generate strong long-term returns across geographies and asset classes, and is determined through a careful review of market opportunities and risk/return tradeoffs. On a monthly basis or as needed, we shift assets around the strategic allocation, over and under-weighting asset classes and countries relative to the neutral starting point, seeking to benefit from changing short-term conditions in global capital markets. This is called tactical asset allocation. |
27
FUND BASICS
| OVERALL UNDERLYING FUND WEIGHTINGS7 |
| Percentage of Net Assets |
| 7 | The Portfolio is actively managed and, as such, its composition may differ over time. The percentage shown for each underlying fund reflects the value of that underlying fund as a percentage of net assets of the Portfolio. Short-term investments represent repurchase agreements as of December 31, 2016. Figures in the above graph may not sum to 100% due to rounding and/or the exclusion of other assets and liabilities. The graph depicts the Portfolio’s investments but may not represent the Portfolio’s market exposure due to the exclusion of certain derivatives, if any, as listed in the Additional Investment Information section of the Schedule of Investments. |
28
PORTFOLIO RESULTS
Goldman Sachs Satellite Strategies Portfolio
Investment Objective
The Portfolio seeks long-term capital appreciation.
Portfolio Management Discussion and Analysis
Effective April 28, 2017, the Goldman Sachs Global Portfolio Solutions (“GPS”) Group assumed day-to-day management of the Satellite Strategies Portfolio (the “Portfolio”) from the Goldman Sachs Quantitative Investment Strategies (“QIS”) Team. In connection with the change in portfolio management, the Portfolio underwent certain changes to its principal investment strategies and underlying funds. The performance information reported below is the combined performance of the Portfolio, reflecting current and prior investment objectives, strategies and policies.
Below, the Goldman Sachs QIS Team and the Goldman Sachs GPS Group discuss the Portfolio’s performance and positioning for the six-month period ended June 30, 2017 (the “Reporting Period”).
| Q | How did the Portfolio perform during the Reporting Period? |
| A | During the Reporting Period, the Portfolio’s Class A, C, Institutional, Service, IR, R and R6 Shares generated cumulative total returns of 7.08%, 6.60%, 7.31%, 7.04%, 7.23%, 6.86% and 7.31%, respectively. This compares to the 7.90% cumulative total return of the Fund’s blended benchmark, which is composed 40% of the Bloomberg Barclays U.S. Aggregate Bond Index, 30% of the Standard & Poor’s 500 Index (the “S&P 500® Index”) and 30% of the MSCI EAFE Index (Gross, USD, Unhedged), during the same period. |
| The components of the blended benchmark, the Bloomberg Barclays U.S. Aggregate Bond Index, the S&P 500® Index and the MSCI EAFE Index, generated cumulative total returns of 2.27%, 9.34% and 14.23%, respectively, during the same period. |
| Q | How did the Portfolio’s investment strategies change as a result of the change in portfolio management on April 28, 2017? |
| A | The GPS Group, which assumed management of the Portfolio on April 28, 2017, applies a factor-based risk budgeting approach to develop a strategic allocation across the satellite asset classes included in the Portfolio. In contrast to traditional equity and fixed income selection strategies, which focus on individual stocks and bonds, the GPS Group’s model focuses on broad asset classes, such as emerging markets, high yield credit and real assets. To establish a diversified strategic asset allocation, the GPS Group seeks to budget or allocate portfolio risk, as opposed to capital, across a set of asset allocation risk factors, including but not limited to, equity, interest rate, emerging markets, credit, momentum and active risk. The GPS Group employs a proprietary asset allocation process and other techniques to deliver what we believe is the best strategic allocation in the Portfolio. |
| The Portfolio seeks to achieve its investment objective by investing in a combination of underlying funds. With the change in portfolio management, the Portfolio may also invest directly in affiliated and unaffiliated ETFs and in derivatives for both hedging and non-hedging purposes. Overall, some of the Portfolio’s underlying funds invest primarily in fixed income or money market instruments (the “underlying fixed income funds”), some of the underlying funds invest primarily in equity securities (the “underlying equity funds”). |
| Q | How did the various satellite asset classes perform during the Reporting Period? |
| A | During the Reporting Period, all satellite asset classes, with the exception of commodities, generated positive absolute returns. However, some satellite asset classes struggled to outperform traditional equity and fixed income asset classes. |
Among equity satellite asset classes, emerging markets equities performed best during the Reporting Period, returning more than 18%, as measured by the MSCI Emerging Markets Index. The strong performance was |
29
PORTFOLIO RESULTS
driven by a weaker U.S. dollar, easier financial conditions and a stable macro environment. For the same reasons, international small-cap stocks performed well, up 16.72%, as measured by the MSCI EAFE Small Cap Index. Meanwhile, U.S. and international real estate securities, as represented by the Wilshire Real Estate Securities Index and the FTSE/ NAREIT Developed ex U.S. Real Estate Index, respectively, were challenged during the Reporting Period. Although they recorded positive returns of 2.42% and 5.37%, respectively, they underperformed U.S. and international stocks, as represented by the S&P 500® Index and the MSCI EAFE Index, which were up approximately 9.34% and 13.81%, respectively. Commodities, as measured by the S&P GSCI Commodity Index, posted negative returns, down more than 10% during the Reporting Period. The decline was spurred by investor concerns that extended output cuts by the Organization of the Petroleum Exporting Countries would not be able to curb oversupply fueled by an increasing number of U.S. producers. |
| Among fixed income satellite asset classes, U.S. dollar-denominated emerging markets debt, as represented by the J.P. Morgan Emerging Market Bond Index — Global Diversified Index, and local emerging markets debt, as measured by the J.P. Morgan Government Bond Index — Emerging Markets Global Diversified Index, were the strongest performers, up 6.19% and 10.36%, respectively. Local emerging markets debt benefited from strength in local currencies, while both U.S. dollar-denominated emerging markets debt and local emerging markets debt benefited from continued accommodative monetary policy by global central banks. High yield corporate bonds also recorded a gain, up 4.92%, as measured by the Bloomberg Barclays U.S. High-Yield 2% Issuer Capped Bond Index, outperforming the broad U.S. fixed income market, as represented by the Bloomberg Barclays U.S. Aggregate Bond Index, which returned 2.27%. Meanwhile, high yield loans, as represented by the Credit Suisse Leveraged Loan Index, underperformed the broad U.S. fixed income market, advancing only 1.9% during the Reporting Period. |
| Q | What key factors were responsible for the Portfolio’s performance from January 1, 2017 through April 27, 2017 (“the initial part of the Reporting Period”)? |
| A | During the initial part of the Reporting Period, the Portfolio benefited most relative to its blended benchmark from exposures to emerging markets equities. Also contributing positively were the Portfolio’s exposures to international small-cap stocks. Conversely, the Portfolio’s exposure to commodities detracted from results during the initial part of the Reporting Period. In keeping with our investment approach, we dynamically adjusted Portfolio weights to ensure that overall risk and individual underlying fund contributions to risk remained within the ranges we feel are appropriate for a diversified satellite portfolio. |
| Q | How did the Portfolio’s underlying funds perform relative to their respective benchmark indices during the initial part of the Reporting Period? |
| A | Overall, security selection within the underlying funds detracted from the Portfolio’s performance during the initial part of the Reporting Period. The Goldman Sachs Real Estate Securities Fund underperformed its benchmark index the most. Slightly underperforming their respective benchmark indices were the Goldman Sachs Emerging Markets Equity Insights Fund, the Goldman Sachs High Yield Floating Rate Fund, the Goldman Sachs International Real Estate Securities Fund, the Goldman Sachs Commodity Strategy Fund, the Goldman Sachs High Yield Fund and the Goldman Sachs Emerging Markets Debt Fund. Conversely, the Goldman Sachs Emerging Markets Equity Fund outperformed its benchmark index most during the initial part of the Reporting Period. The Goldman Sachs International Small Cap Equity Insights Fund and the Goldman Sachs Local Emerging Markets Debt Fund also outperformed their respective benchmark indices, albeit to a lesser extent. |
| Q | What key factors were responsible for the Portfolio’s performance between April 28, 2017 and June 30, 2017 (“the latter part of the Reporting Period”)? |
| A | As mentioned previously, the GPS Group applies a factor- based risk budgeting approach to develop a strategic allocation across the satellite asset classes included in the Portfolio. Our model focuses on broad asset classes, such as emerging markets, high yield credit and real assets. To establish a diversified strategic asset allocation, we seek to budget or allocate portfolio risk, as opposed to capital, across a set of asset allocation risk factors, including but not limited to, equity, interest rate, emerging markets, credit, momentum and active risk. |
| Overall, during the latter part of the Reporting Period, our strategic asset allocation had a rather neutral impact on results, while security selection within the underlying funds detracted from performance. |
30
PORTFOLIO RESULTS
| Within equity satellite asset classes, the Portfolio’s strategic allocations to international small-cap equities and emerging markets equities outperformed the equity component of the blended benchmark, benefiting from positive macro data and a weaker U.S. dollar. Strategic allocations to U.S. and international real estate securities as well as to global infrastructure securities generated positive returns in absolute terms but detracted from performance relative to the equity component of the blended benchmark. These asset classes, which many investors consider proxies for fixed income, struggled, as hawkish comments from the Fed led to an uptick in interest rates near the end of the latter part of the Reporting Period. (Hawkish comments tend to suggest higher interest rates; opposite of dovish.) |
| Within fixed income satellite asset classes, strategic allocations to local emerging markets debt and U.S. dollar-denominated emerging markets debt outperformed the fixed income component of the blended benchmark. The positive performance was driven by the appreciation of emerging markets currencies and easy financial conditions in the emerging markets. Relative to the fixed income component of the blended benchmark, a strategic allocation to high yield corporate bonds outperformed and a strategic allocation to high yield loans underperformed during the latter part of the Reporting Period. |
| Q | How did the Portfolio’s underlying funds perform relative to their respective benchmark indices during the latter part of the Reporting Period? |
| A | Overall, security selection within the underlying funds detracted from the Portfolio’s performance. The underperformance was concentrated in underlying funds that invested in equity satellite asset classes, led by the Goldman Sachs Global Infrastructure Fund, which lagged its benchmark index. Additionally, the Goldman Sachs International Real Estate Securities Fund and the Goldman Sachs International Small Cap Insights Fund slightly underperformed their respective benchmark indices during the latter part of the Reporting Period. |
| Q | How did the Portfolio use derivatives and similar instruments during the Reporting Period? |
| A | During the Reporting Period, the Portfolio did not directly invest in derivatives. However, some of the underlying funds used derivatives to apply their active investment views with greater versatility and to potentially afford greater risk management precision. As market conditions warranted, some of these underlying funds engaged in forward foreign currency exchange contracts, financial futures contracts, options, swap contracts and structured securities to attempt to enhance portfolio return and for hedging purposes. |
| Q | What changes did you make during the Reporting Period within the Portfolio? |
| A | During the first quarter of 2017, through its underlying funds, the QIS Team rebalanced the Portfolio to maintain its target risk objectives. More specifically, the QIS Team significantly increased the Portfolio’s exposure to high yield corporate bonds. Conversely, the QIS Team decreased its exposures to U.S. dollar-denominated emerging markets debt and to high yield loans. |
| After assuming management of the Portfolio, the GPS Group focused on adjusting the Portfolio’s strategic asset allocation to be in line with its factor-based model. The GPS Group did not make any dynamic adjustments to this strategic asset allocation during the rest of the Reporting Period. |
| Q | Were there any changes to the Portfolio’s portfolio management team during the Reporting Period? |
| A | When the Reporting Period began, William Fallon, James Park, Nicholas Chan and Edward J. Tostanoski III of the QIS Team served as portfolio managers of the Portfolio. Effective April 3, 2017, William Fallon no longer served as a portfolio manager. On April 28, 2017, the GPS Group assumed day-to-day management of the Portfolio, with Raymond Chan and Christopher Lvoff becoming portfolio managers of the Portfolio. Edward J. Tostanoski III joined the GPS Group in April 2017 and remained a portfolio manager of the Portfolio, while James Park and Nicholas Chan no longer served as portfolio managers of the Portfolios. |
31
FUND BASICS
Satellite Strategies Portfolio
as of June 30, 2017
| PERFORMANCE REVIEW | ||||||||||||||||||||||
| January 1, 2017– June 30, 2017 | Fund Total Return (based on NAV)1 | Satellite Strategies Composite Index2 | Bloomberg Barclays U.S. Aggregate Bond Index | MSCI® EAFE® Index | S&P 500® Index | |||||||||||||||||
| Class A | 7.08 | % | 7.90 | % | 2.27 | % | 14.23 | % | 9.34 | % | ||||||||||||
| Class C | 6.60 | 7.90 | 2.27 | 14.23 | 9.34 | |||||||||||||||||
| Institutional | 7.31 | 7.90 | 2.27 | 14.23 | 9.34 | |||||||||||||||||
| Service | 7.04 | 7.90 | 2.27 | 14.23 | 9.34 | |||||||||||||||||
| Class IR | 7.23 | 7.90 | 2.27 | 14.23 | 9.34 | |||||||||||||||||
| Class R | 6.86 | 7.90 | 2.27 | 14.23 | 9.34 | |||||||||||||||||
| Class R6 | 7.31 | 7.90 | 2.27 | 14.23 | 9.34 | |||||||||||||||||
| 1 | The net asset value (“NAV”) represents the net assets of the class of the Portfolio (ex-dividend) divided by the total number of shares of the class outstanding. The Portfolio’s performance reflects the reinvestment of dividends and other distributions. The Portfolio’s performance does not reflect the deduction of any applicable sales charges. |
| 2 | The Satellite Strategies Composite Index (“Satellite Composite”) is a composite representation prepared by the Investment Adviser of the performance of the Portfolio’s asset classes weighted according to their respective weightings in the Portfolio’s target range. The Satellite Composite is comprised of the Bloomberg Barclays U.S. Aggregate Bond Index (40%), the S&P 500® Index (30%), and the MSCI® EAFE Index (Gross, USD, Unhedged) (30%). The Satellite Composite figures do not reflect any deduction for fees, expenses or taxes. The Bloomberg Barclays U.S. Aggregate Bond Index represents an unmanaged diversified portfolio of fixed income securities, including U.S. Treasuries, investment-grade corporate bonds, and mortgage-backed and asset-backed securities. The S&P 500® Index is the Standard & Poor’s 500 Composite Index of 500 stocks, an unmanaged index of common stock prices. The unmanaged MSCI® EAFE® Index is a market capitalization weighted composite of securities in 21 developed markets. The index figures do not include any deduction for fees, expenses or taxes. It is not possible to invest directly in an unmanaged index. The S&P 500® Index is an unmanaged composite index of 500 common stock prices. The index figures do not include any deduction for fees, expenses or taxes. It is not possible to invest directly in an index. |
| STANDARDIZED TOTAL RETURNS3 | ||||||||||||||||||||
| For the period ended 6/30/17 | One Year | Five Years | Ten Years | Since Inception | Inception Date | |||||||||||||||
| Class A | 2.10 | % | 3.07 | % | 1.14 | % | 1.34 | 3/30/07 | ||||||||||||
| Class C | 6.12 | 3.45 | 0.94 | 1.13 | 3/30/07 | |||||||||||||||
| Institutional | 8.39 | 4.65 | 2.09 | 2.28 | 3/30/07 | |||||||||||||||
| Service | 7.96 | 4.15 | N/A | 2.42 | 8/29/08 | |||||||||||||||
| Class IR | 8.22 | 4.49 | N/A | 1.66 | 11/30/07 | |||||||||||||||
| Class R | 7.71 | 3.95 | N/A | 1.14 | 11/30/07 | |||||||||||||||
| Class R6 | 8.55 | N/A | N/A | 4.66 | 7/31/15 | |||||||||||||||
| 3 | The Standardized Total Returns are average annual total returns or cumulative total returns (only if the performance period is one year or less) as of the most recent calendar quarter-end. They assume reinvestment of all distributions at NAV. These returns reflect a maximum initial sales charge of 5.5% for Class A Shares and the assumed contingent deferred sales charge for Class C Shares (1% if redeemed within 12 months of purchase). Because Institutional, Service, Class IR, Class R and Class R6 Shares do not involve a sales charge, such a charge is not applied to their Standardized Total Returns. |
The returns set forth in the tables above represent past performance. Past performance does not guarantee future results. The Portfolio’s investment return and principal value will fluctuate so that an investor’s shares, when redeemed, may be worth more or less than their original cost. Current performance may be lower or higher than the performance quoted above. Please visit our web site at www.GSAMFUNDS.com to obtain the most recent month-end returns. Performance reflects applicable fee waivers and/or expense limitations in effect during the periods shown. In their absence, performance would be reduced. Returns do not reflect the deduction of taxes that a shareholder would pay on Portfolio distributions or the redemption of Portfolio shares.
32
FUND BASICS
| EXPENSE RATIOS4 | ||||||||||
| Net Expense Ratio (Current) | Gross Expense Ratio (Before Waivers) | |||||||||
| Class A | 1.45 | % | 1.49 | % | ||||||
| Class C | 2.20 | 2.24 | ||||||||
| Institutional | 1.05 | 1.09 | ||||||||
| Service | 1.55 | 1.59 | ||||||||
| Class IR | 1.20 | 1.24 | ||||||||
| Class R | 1.70 | 1.74 | ||||||||
| Class R6 | 1.03 | 1.07 | ||||||||
| 4 | The expense ratios of the Portfolio, both current (net of applicable fee waivers and/or expense limitations) and before waivers (gross of applicable fee waivers and/or expense limitations) are as set forth above according to the most recent publicly available prospectus for the Portfolio and may differ from the expense ratios disclosed in the Financial Highlights in this report. The Portfolio’s waivers and/or expense limitations will remain in place through at least April 28, 2018, and prior to such date the Investment Adviser may not terminate the arrangements without the approval of the Portfolio’s Board of Trustees. The expense limitation may be modified or terminated by the Investment Adviser at its discretion and without shareholder approval after such date, although the Investment Adviser does not presently intend to do so. If these arrangements are discontinued in the future, the expense ratios may change without shareholder approval. |
| TARGET RISK-CONTRIBUTION INVESTMENT PORTFOLIO5 AS OF 6/30/17 | ||||||
| Percentage of Investment Portfolio | ||||||
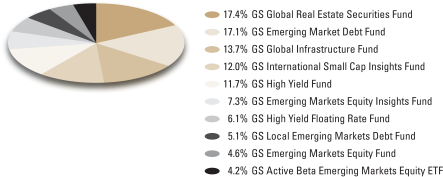 | ||||||
| 5 | Generally, tactical fund weightings are rebalanced approximately monthly, but they may be rebalanced more or less frequently at the discretion of the Investment Adviser based on the market environment and its macro views. The weightings in the chart above reflect the allocations as of June 30, 2017. Actual underlying fund weighting in the Portfolio may differ from the figures shown above due to rounding, differences in returns of the underlying funds, or both. The above figures are not indicative of future allocations. |
33
FUND BASICS
| OVERALL UNDERLYING FUND WEIGHTINGS6 |
| Percentage of Net Assets |
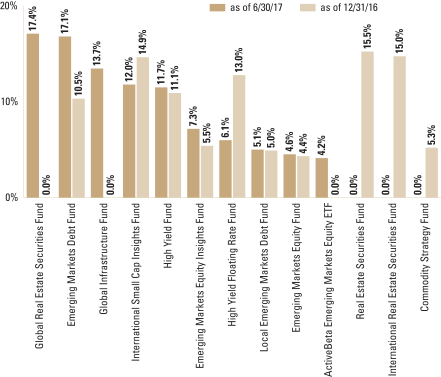
| 6 | The Portfolio is actively managed and, as such, its composition may differ over time. The percentage shown for each underlying fund reflects the value of that underlying fund as a percentage of net assets of the Portfolio. Figures in the above graph may not sum to 100% due to rounding and/or the exclusion of other assets and liabilities. |
34
GOLDMAN SACHS FUND OF FUNDS PORTFOLIOS
Russell 1000® Index measures the performance of the large-cap segment of the U.S. equity universe. The Russell 1000® Index is a subset of the Russell 3000® Index and includes approximately 1000 of the largest securities based on a combination of their market cap and current index membership. The Russell 1000® Index represents approximately 92% of the U.S. market. The Russell 1000® Index is constructed to provide a comprehensive and unbiased barometer for the large-cap segment and is completely reconstituted annually to ensure new and growing equities are reflected.
Russell Midcap® Index measures the performance of the mid-cap segment of the U.S. equity universe. The Russell Midcap® Index is a subset of the Russell 1000® Index. The Russell Midcap® Index includes approximately 800 of the smallest securities based on a combination of their market cap and current index membership. The Russell Midcap® Index represents approximately 31% of the total market capitalization of the Russell 1000® Index companies. The Russell Midcap® Index is constructed to provide a comprehensive and unbiased barometer for the mid-cap segment. The Russell Midcap® Index is completely reconstituted annually to ensure larger stocks do not distort the performance and characteristics of the true mid-cap opportunity set.
Russell 2000® Index measures the performance of the small-cap segment of the U.S. equity universe. The Russell 2000® Index is a subset of the Russell 3000® Index representing approximately 10% of the total market capitalization of that index. The Russell 2000® Index includes approximately 2000 of the smallest securities based on a combination of their market cap and current index membership. The Russell 2000® Index is constructed to provide a comprehensive and unbiased small-cap barometer and is completely reconstituted annually to ensure larger stocks do not distort the performance and characteristics of the true small-cap opportunity set.
The Bloomberg Barclays U.S. Aggregate Bond Index represents an unmanaged diversified portfolio of fixed income securities, including U.S. Treasuries, investment grade corporate bonds, and mortgage-backed securities and asset-backed securities.
The Bloomberg Barclays U.S. Corporate High-Yield 2% Issuer Capped Bond Index, an unmanaged index, covers the universe of U.S. dollar denominated, non-convertible, fixed rate, non-investment grade debt. Index holdings must have at least one year to final maturity, at least $150 million par amount outstanding, and be publicly issued with a rating of Ba1 or lower.
The Credit Suisse Leveraged Loan Index (Gross, USD, Unhedged) is designed to mirror the investable universe of the U.S. dollar-denominated leveraged loan market.
The FTSE/NAREIT Developed ex U.S. Real Estate Index is a market capitalization weighted index composed of REITs and non-REITs within the international (global, excluding the U.S.) real estate securities market. The market capitalization for each constituent is adjusted for free float.
The J.P. Morgan Emerging Market Bond Index – Global Diversified Index is an unmanaged index of external debt instruments of emerging countries. The index is positioned as the investable benchmark that includes only those countries that are accessible by most of the international investor base and is popular largely due to its diversification weighting scheme and country coverage.
The J.P. Morgan Government Bond Index – Emerging Markets Global Diversified Index is an unmanaged index of debt instruments issued by emerging markets governments in local currency. As emerging markets look increasingly toward their domestic market for sources of finance, investors are looking more closely at local markets in search for higher yield and greater diversification.
The MSCI EAFE Index is an equity index that captures large-cap and mid-cap representation across 21 developed markets countries around the world, excluding the U.S. and Canada. The index covers approximately 85% of the free float-adjusted market capitalization in each country. Developed markets countries in the index include Australia, Austria, Belgium, Denmark, Finland, France, Germany, Hong Kong, Ireland, Israel, Italy, Japan, the Netherlands, New Zealand, Norway, Portugal, Singapore, Spain, Sweden, Switzerland and the U.K.
35
GOLDMAN SACHS FUND OF FUNDS PORTFOLIOS
The MSCI EAFE Small Cap Index is an equity index that captures small-cap representation across 21 developed markets countries around the world, excluding the U.S. and Canada. The index covers approximately 14% of the free float-adjusted market capitalization in each country. Developed markets countries in the index include Australia, Austria, Belgium, Denmark, Finland, France, Germany, Hong Kong, Ireland, Israel, Italy, Japan, the Netherlands, New Zealand, Norway, Portugal, Singapore, Spain, Sweden, Switzerland and the U.K.
The MSCI Emerging Markets Index captures large-cap and mid-cap representation across 24 emerging markets countries. The index covers approximately 85% of the free float-adjusted market capitalization in each country.
The S&P 500® Index is an unmanaged index of 500 stocks that is generally representative of the performance of larger companies in the U.S.
The Wilshire Real Estate Securities Index measures U.S. publicly-traded real estate securities. Designed to offer a market-based index that is more reflective of real estate held by pension funds, the Wilshire U.S. Real Estate Securities Index is composed of publicly-traded real estate equity securities and unencumbered by limitations of other appraisal-based indexes. It can serve as a proxy for direct real estate investing by excluding securities whose value is not always tied to the value of the underlying real estate. Exclusions include: mortgage REITs, net-lease REITs, real estate finance companies, mortgage brokers and bankers, commercial and residential real estate brokers, home builders, large landowners and sub-dividers of unimproved land, hybrid REITs and timber REITs. The rationale for the exclusions is that factors other than real estate supply and demand, such as interest rates, can influence the market value of these companies.
It is not possible to invest directly in an unmanaged index.
36
GOLDMAN SACHS BALANCED STRATEGY PORTFOLIO
June 30, 2017 (Unaudited)
| Shares | Description | Value | ||||||
| Underlying Funds (Institutional Shares)(a) – 95.3% | ||||||||
| Dynamic – 11.4% | ||||||||
| 4,139,156 | Goldman Sachs Dynamic Allocation Fund | $ | 43,957,834 | |||||
| 1,332,008 | Goldman Sachs Managed Futures Strategy Fund | 13,666,398 | ||||||
|
| |||||||
| 57,624,232 | ||||||||
|
| |||||||
| Equity – 31.5% | ||||||||
| 3,792,112 | Goldman Sachs Emerging Markets Equity Insights Fund | 36,593,879 | ||||||
| 1,807,502 | Goldman Sachs Large Cap Value Insights Fund | 35,951,205 | ||||||
| 1,248,007 | Goldman Sachs Large Cap Growth Insights Fund | 35,356,050 | ||||||
| 1,209,514 | Goldman Sachs International Small Cap Insights Fund | 14,768,160 | ||||||
| 966,906 | Goldman Sachs International Equity Insights Fund | 12,018,642 | ||||||
| 1,020,013 | Goldman Sachs Global Infrastructure Fund | 10,771,338 | ||||||
| 1,003,681 | Goldman Sachs Global Real Estate Securities Fund | 10,327,880 | ||||||
| 169,372 | Goldman Sachs Small Cap Equity Insights Fund | 4,015,814 | ||||||
|
| |||||||
| 159,802,968 | ||||||||
|
| |||||||
| Exchange Traded Funds – 6.2% | ||||||||
| 401,634 | Goldman Sachs ActiveBeta Emerging Markets Equity ETF | 12,547,046 | ||||||
| 398,561 | Goldman Sachs ActiveBeta U.S. Large Cap Equity ETF | 19,174,770 | ||||||
|
| |||||||
| 31,721,816 | ||||||||
|
| |||||||
| Fixed Income – 46.2% | ||||||||
| 11,829,445 | Goldman Sachs Global Income Fund | 145,028,994 | ||||||
| 5,319,823 | Goldman Sachs High Yield Fund | 35,004,432 | ||||||
| 2,248,791 | Goldman Sachs Core Fixed Income Fund | 23,679,769 | ||||||
| 1,770,108 | Goldman Sachs Emerging Markets Debt Fund | 22,852,092 | ||||||
| 837,891 | Goldman Sachs Local Emerging Markets Debt Fund | 5,437,912 | ||||||
| 263,530 | Goldman Sachs High Yield Floating Rate Fund | 2,558,873 | ||||||
|
| |||||||
| 234,562,072 | ||||||||
|
| |||||||
| | TOTAL UNDERLYING FUNDS (INSTITUTIONAL SHARES) | |||||||
| (Cost $485,072,064) | $ | 483,711,088 | ||||||
|
| |||||||
| Shares | Distribution Rate | Value | ||||||
| Investment Company(a)(b) – 2.0% | ||||||||
| | Goldman Sachs Financial Square Government Fund – | | ||||||
| 10,365,471 | 0.845% | $ | 10,365,471 | |||||
| (Cost $10,365,471) | ||||||||
|
| |||||||
| Contracts | Exercise Price | Expiration Date | Value | |||||||||||
| Option Contracts Purchased – 0.7% | ||||||||||||||
| Options on Equities – 0.0% | ||||||||||||||
Citibank NA (London) Call – S&P 500 Index | ||||||||||||||
| 19 | $ | 2,535.00 | 12/29/17 | $ | 48,659 | |||||||||
Morgan Stanley & Co. International PLC Call – Euro Stoxx 50 | ||||||||||||||
| 1,151 | 3,735.76 | 12/29/17 | 40,440 | |||||||||||
|
| |||||||||||||
| 89,099 | ||||||||||||||
|
| |||||||||||||
| Options on Futures – 0.7% | ||||||||||||||
Credit Suisse International (London) Call – Eurodollar Futures | ||||||||||||||
| 494 | $ | 98.00 | 09/18/17 | 796,575 | ||||||||||
Credit Suisse International (London) Call – Eurodollar Futures | ||||||||||||||
| 363 | 98.13 | 09/18/17 | 471,900 | |||||||||||
Credit Suisse International (London) Call – Eurodollar Futures | ||||||||||||||
| 551 | 97.88 | 12/18/17 | 895,375 | |||||||||||
Credit Suisse International (London) Call – Eurodollar Futures | ||||||||||||||
| 426 | 97.75 | 03/19/18 | 734,850 | |||||||||||
Credit Suisse International (London) Call – Eurodollar Futures | ||||||||||||||
| 2,824 | 99.00 | 12/17/18 | 123,550 | |||||||||||
Credit Suisse International (London) Call – Eurodollar Futures | ||||||||||||||
| 2,098 | 99.00 | 03/18/19 | 144,237 | |||||||||||
Credit Suisse International (London) Call – Eurodollar Futures | ||||||||||||||
| 1,149 | 99.00 | 06/17/19 | 100,538 | |||||||||||
|
| |||||||||||||
| 3,267,025 | ||||||||||||||
|
| |||||||||||||
| TOTAL OPTION CONTRACTS PURCHASED | ||||||||||||||
| (Cost $3,712,363) | $ | 3,356,124 | ||||||||||||
|
| |||||||||||||
| TOTAL INVESTMENTS – 98.0% | ||||||||||||||
| (Cost $499,149,898) | $ | 497,432,683 | ||||||||||||
|
| |||||||||||||
| | OTHER ASSETS IN EXCESS OF LIABILITIES – 2.0% | | 10,039,628 | |||||||||||
|
| |||||||||||||
| NET ASSETS – 100.0% | $ | 507,472,311 | ||||||||||||
|
| |||||||||||||
| The percentage shown for each investment category reflects the value of investments in that category as a percentage of net assets. | ||
(a) | Represents Affiliated funds. | |
(b) | Variable rate security. Interest rate or distribution rate disclosed is that which is in effect on June 30, 2017. | |
| The accompanying notes are an integral part of these financial statements. | 37 |
GOLDMAN SACHS BALANCED STRATEGY PORTFOLIO
Schedule of Investments (continued)
June 30, 2017 (Unaudited)
| ||
Currency Abbreviations: | ||
AUD | —Australian Dollar | |
BRL | —Brazilian Real | |
CAD | —Canadian Dollar | |
CHF | —Swiss Franc | |
COP | —Colombian Peso | |
CZK | —Czech Koruna | |
EUR | —Euro | |
GBP | —British Pound | |
HKD | —Hong Kong Dollar | |
HUF | —Hungarian Forint | |
IDR | —Indonesian Rupiah | |
INR | —Indian Rupee | |
JPY | —Japanese Yen | |
KRW | —South Korean Won | |
NOK | —Norwegian Krone | |
PHP | —Philippine Peso | |
RUB | —Russian Ruble | |
SEK | —Swedish Krona | |
SGD | —Singapore Dollar | |
THB | —Thai Baht | |
TRY | —Turkish Lira | |
TWD | —Taiwan Dollar | |
ZAR | —South African Rand | |
Investment Abbreviations: | ||
ETF | —Exchange Traded Fund | |
LLC | —Limited Liability Company | |
PLC | —Public Limited Company | |
| ||
| ADDITIONAL INVESTMENT INFORMATION |
FORWARD FOREIGN CURRENCY EXCHANGE CONTRACTS — At June 30, 2017, the Portfolio had the following forward foreign currency exchange contracts:
FORWARD FOREIGN CURRENCY EXCHANGE CONTRACTS WITH UNREALIZED GAIN
| Counterparty | Currency Purchased | Currency Sold | Current Value | Settlement Date | Unrealized Gain | |||||||||||||||||||
Bank of America Securities LLC | CZK | 60,600,000 | USD | 2,605,520 | $ | 2,663,992 | 09/20/17 | $ | 58,472 | |||||||||||||||
| USD | 17,606 | KRW | 20,000,000 | 17,485 | 09/20/17 | 121 | ||||||||||||||||||
| USD | 19,760 | TWD | 600,000 | 19,741 | 09/20/17 | 19 | ||||||||||||||||||
Citibank NA (London) | TRY | 5,460,000 | USD | 1,495,358 | 1,516,377 | 09/20/17 | 21,019 | |||||||||||||||||
JPMorgan Securities, Inc. | BRL | 5,060,000 | USD | 1,506,962 | 1,516,252 | 08/02/17 | 9,290 | |||||||||||||||||
| USD | 1,484,127 | COP | 4,488,000,000 | 1,457,032 | 09/20/17 | 27,095 | ||||||||||||||||||
Morgan Stanley & Co. | EUR | 1,380,000 | USD | 1,547,422 | 1,582,955 | 09/20/17 | 35,533 | |||||||||||||||||
| USD | 1,550,596 | KRW | 1,730,000,000 | 1,512,414 | 09/20/17 | 38,182 | ||||||||||||||||||
| USD | 2,063,784 | TWD | 61,800,000 | 2,033,274 | 09/20/17 | 30,510 | ||||||||||||||||||
Royal Bank of Scotland PLC | NOK | 13,000,000 | USD | 1,532,524 | 1,559,604 | 09/20/17 | 27,081 | |||||||||||||||||
| SEK | 31,350,000 | USD | 3,623,559 | 3,738,478 | 09/20/17 | 114,918 | ||||||||||||||||||
State Street Bank and Trust | NOK | 50,000 | USD | 5,901 | 5,998 | 09/20/17 | 97 | |||||||||||||||||
UBS AG (London) | USD | 7,677 | INR | 500,000 | 7,667 | 09/20/17 | 10 | |||||||||||||||||
| USD | 7,291,553 | JPY | 800,000,000 | 7,138,106 | 09/20/17 | 153,446 | ||||||||||||||||||
| TOTAL | $ | 515,793 | ||||||||||||||||||||||
| 38 | The accompanying notes are an integral part of these financial statements. |
GOLDMAN SACHS BALANCED STRATEGY PORTFOLIO
| ADDITIONAL INVESTMENT INFORMATION (continued) |
FORWARD FOREIGN CURRENCY EXCHANGE CONTRACTS WITH UNREALIZED LOSS
| Counterparty | Currency Purchased | Currency Sold | Current Value | Settlement Date | Unrealized Loss | |||||||||||||||||||
Bank of America Securities LLC | INR | 199,000,000 | USD | 3,060,474 | $ | 3,051,445 | 09/20/17 | $ | (9,029 | ) | ||||||||||||||
| PHP | 500,000 | USD | 9,940 | 9,839 | 09/20/17 | (102 | ) | |||||||||||||||||
Deutsche Bank AG | THB | 300,000 | USD | 8,835 | 8,832 | 09/20/17 | (3 | ) | ||||||||||||||||
| USD | 3,127,029 | CHF | 3,000,000 | 3,144,984 | 09/20/17 | (17,954 | ) | |||||||||||||||||
| USD | 2,052,731 | THB | 69,900,000 | 2,057,789 | 09/20/17 | (5,058 | ) | |||||||||||||||||
JPMorgan Securities, Inc. | COP | 4,488,000,000 | USD | 1,526,401 | 1,457,032 | 09/20/17 | (69,369 | ) | ||||||||||||||||
| RUB | 2,000,000 | USD | 33,608 | 33,342 | 09/20/17 | (266 | ) | |||||||||||||||||
| USD | 1,515,878 | BRL | 5,060,000 | 1,525,619 | 07/05/17 | (9,742 | ) | |||||||||||||||||
| USD | 25,692 | CZK | 600,000 | 26,376 | 09/20/17 | (684 | ) | |||||||||||||||||
| USD | 1,539,526 | GBP | 1,205,000 | 1,573,404 | 09/20/17 | (33,878 | ) | |||||||||||||||||
| USD | 13,845 | TRY | 50,000 | 13,886 | 09/20/17 | (41 | ) | |||||||||||||||||
Morgan Stanley & Co. | BRL | 5,060,000 | USD | 1,531,709 | 1,525,619 | 07/05/17 | (6,089 | ) | ||||||||||||||||
| IDR | 61,470,000,000 | USD | 4,584,576 | 4,571,167 | 09/20/17 | (13,410 | ) | |||||||||||||||||
| PHP | 102,000,000 | USD | 2,048,193 | 2,007,084 | 09/20/17 | (41,109 | ) | |||||||||||||||||
Royal Bank of Scotland PLC | USD | 4,664,554 | EUR | 4,130,000 | 4,737,395 | 09/20/17 | (72,841 | ) | ||||||||||||||||
Standard Chartered Bank | RUB | 87,000,000 | USD | 1,502,526 | 1,450,383 | 09/20/17 | (52,143 | ) | ||||||||||||||||
State Street Bank and Trust | USD | 2,064,535 | HUF | 564,000,000 | 2,092,876 | 09/20/17 | (28,341 | ) | ||||||||||||||||
UBS AG (London) | USD | 8,623 | SEK | 75,000 | 8,944 | 09/20/17 | (321 | ) | ||||||||||||||||
| TOTAL | $ | (360,380 | ) | |||||||||||||||||||||
FUTURES CONTRACTS — At June 30, 2017, the Portfolio had the following futures contracts:
| Type | Number of Contracts Long (Short) | Expiration Date | Current Value | Unrealized Gain (Loss) | ||||||||||||
10 Year German Euro-Bund | 55 | September 2017 | $10,168,387 | $(145,926) | ||||||||||||
10 Year U.K. Long Gilt | (14 | ) | September 2017 | (2,289,680 | ) | 17,547 | ||||||||||
10 Year U.S. Treasury Notes | 6 | September 2017 | 753,187 | (5,410 | ) | |||||||||||
Australian 10 Year Government Bonds | (53 | ) | September 2017 | (5,265,499 | ) | 81,598 | ||||||||||
Canada 10 Year Government Bonds | (10 | ) | September 2017 | (1,083,822 | ) | 13,834 | ||||||||||
Euro Buxl 30 Year Bonds | (58 | ) | September 2017 | (10,832,330 | ) | 320,682 | ||||||||||
Euro Stoxx 50 Index | 12 | September 2017 | 470,246 | (16,054 | ) | |||||||||||
Euro Stoxx 50 Index Dividend | 311 | December 2019 | 4,251,846 | 578 | ||||||||||||
Eurodollars | 1,123 | December 2017 | 276,608,937 | (155,256 | ) | |||||||||||
Eurodollars | (1,124 | ) | March 2020 | (275,127,100 | ) | 261,216 | ||||||||||
FTSE 250 Index | (41 | ) | September 2017 | (2,051,752 | ) | 57,957 | ||||||||||
FTSE China A50 Index | (224 | ) | July 2017 | (2,545,200 | ) | (17,964 | ) | |||||||||
FTSE/JSE Top 40 Index | (65 | ) | September 2017 | (2,269,696 | ) | 15,566 | ||||||||||
H-Shares Index | 23 | July 2017 | 1,501,675 | (3,905 | ) | |||||||||||
IBEX 35 Index | 10 | July 2017 | 1,188,510 | (40,471 | ) | |||||||||||
Japan 10 Year Government Bonds | 1 | September 2017 | 1,334,608 | (3,627 | ) | |||||||||||
Mini MSCI EAFE Index | (35 | ) | September 2017 | (3,306,800 | ) | (4,620 | ) | |||||||||
Mini MSCI Emerging Market | 58 | September 2017 | 2,924,070 | (28,681 | ) | |||||||||||
MSCI Singapore Index | 99 | July 2017 | 2,577,559 | 5,521 | ||||||||||||
S&P 500 E-Mini Index | (30 | ) | September 2017 | (3,631,350 | ) | 13,822 | ||||||||||
SGX Nifty 50 Index | 135 | July 2017 | 2,569,995 | (25,328 | ) | |||||||||||
SPI 200 Index | (20 | ) | September 2017 | (2,170,910 | ) | (19,920 | ) | |||||||||
TOPIX Index | 10 | September 2017 | 1,432,763 | 2,006 | ||||||||||||
| TOTAL | $ | 323,165 | ||||||||||||||
| The accompanying notes are an integral part of these financial statements. | 39 |
GOLDMAN SACHS BALANCED STRATEGY PORTFOLIO
Schedule of Investments (continued)
June 30, 2017 (Unaudited)
| ADDITIONAL INVESTMENT INFORMATION (continued) |
SWAP CONTRACTS — At June 30, 2017, the Portfolio had the following swap contracts:
CENTRALLY CLEARED CREDIT DEFAULT SWAP CONTRACTS
| Market Value | ||||||||||||||||||||||||
| Referenced Obligation | Notional Amount (000s) | Rates Received (Paid) | Termination Date | Credit Spread at June 30, 2017(a) | Upfront Payments Made (Received) | Unrealized Gain (Loss) | ||||||||||||||||||
Protection Purchased: | ||||||||||||||||||||||||
iTraxx Europe Crossover Series 27 | 4,530 | (5.000 | )% | 06/20/22 | 2.475 | % | $ | (579,678 | ) | $ | (86,885 | ) | ||||||||||||
Protection Sold: | ||||||||||||||||||||||||
CDX North America High Yield Index 28 | 5,080 | 5.000 | 06/20/22 | 3.390 | 382,617 | 40,575 | ||||||||||||||||||
| TOTAL | $ | (197,061 | ) | $ | (46,310 | ) | ||||||||||||||||||
| (a) | Credit spread on the referenced obligation, together with the term of the swap contract, are indicators of payment/performance risk. The likelihood of a credit event occurring which would require a fund or its counterparty to make a payment or otherwise be required to perform under the swap contract is generally greater as the credit spread and the term of the swap contract increase. |
WRITTEN OPTIONS CONTRACTS — At June 30, 2017 the Portfolio had following written options:
OPTIONS ON EQUITY CONTRACTS
| Counterparty | Description | Contracts | Expiration Date | Strike Price | Value | |||||||||||||
Citibank NA (London) | Put - iShares MSCI Emerging Markets ETF | 61,920 | 07/19/17 | $ | 40.52 | $ | (13,040 | ) | ||||||||||
| Call - iShares MSCI Emerging Markets ETF | 61,920 | 07/19/17 | 42.15 | (11,059 | ) | |||||||||||||
| TOTAL (Premiums Received $31,703) | 123,840 | $ | (24,099 | ) | ||||||||||||||
For the period ended June 30, 2017, the Portfolio had the following written options activity:
OPTIONS ON EQUITY CONTRACTS
| Contracts | Premiums Received | |||||||
Contracts Outstanding December 31, 2016 | — | $ | — | |||||
Contracts Written | 248,104 | 76,711 | ||||||
Contracts Expired | (124,264 | ) | (45,008 | ) | ||||
Contracts Outstanding June 30, 2017 | 123,840 | $ | 31,703 | |||||
| 40 | The accompanying notes are an integral part of these financial statements. |
GOLDMAN SACHS EQUITY GROWTH STRATEGY PORTFOLIO
Schedule of Investments
June 30, 2017 (Unaudited)
| Shares | Description | Value | ||||||
| Underlying Funds (Institutional Shares)(a) – 95.8% | ||||||||
| Equity – 73.3% | ||||||||
| 6,453,934 | Goldman Sachs Emerging Markets Equity Insights Fund | $ | 62,280,459 | |||||
| 3,995,734 | Goldman Sachs International Equity Insights Fund | 49,666,973 | ||||||
| 2,130,246 | Goldman Sachs Large Cap Value Insights Fund | 42,370,596 | ||||||
| 1,484,891 | Goldman Sachs Large Cap Growth Insights Fund | 42,066,966 | ||||||
| 2,222,152 | Goldman Sachs Global Real Estate Securities Fund | 22,865,941 | ||||||
| 870,008 | Goldman Sachs Small Cap Equity Insights Fund | 20,627,897 | ||||||
| 1,088,296 | Goldman Sachs International Small Cap Insights Fund | 13,288,093 | ||||||
|
| |||||||
| 253,166,925 | ||||||||
|
| |||||||
| Exchange Traded Funds – 22.5% | ||||||||
| 775,371 | Goldman Sachs ActiveBeta Emerging Markets Equity ETF | 24,222,590 | ||||||
| 725,273 | Goldman Sachs ActiveBeta International Equity ETF | 20,075,557 | ||||||
| 689,312 | Goldman Sachs ActiveBeta U.S. Large Cap Equity ETF | 33,162,800 | ||||||
|
| |||||||
| 77,460,947 | ||||||||
|
| |||||||
| | TOTAL UNDERLYING FUNDS (INSTITUTIONAL SHARES) – 95.8% | |||||||
| (Cost $300,185,811) | $ | 330,627,872 | ||||||
|
| |||||||
| Shares | Distribution Rate | Value | ||||||||||||
| Investment Company(a)(b) – 1.8% | ||||||||||||||
| | Goldman Sachs Financial Square Government Fund – | | ||||||||||||
| 6,365,064 | 0.845% | $ | 6,365,064 | |||||||||||
| (Cost $6,365,064) | ||||||||||||||
|
| |||||||||||||
| Contracts | Exercise Price | Expiration Date | Value | |||||||||||
| Option Contracts Purchased – 0.0% | ||||||||||||||
| Options on Equities – 0.0% | ||||||||||||||
Citibank NA (London) Call – S&P 500 Index | ||||||||||||||
| 13 | $ | 2,535.00 | 12/29/17 | $ | 33,293 | |||||||||
Morgan Stanley & Co. International PLC Call – Euro Stoxx 50 | ||||||||||||||
| 783 | 3,735.76 | 12/29/17 | 27,510 | |||||||||||
|
| |||||||||||||
| TOTAL OPTION CONTRACTS PURCHASED – 0.0% | ||||||||||||||
| (Cost $107,046) | $ | 60,803 | ||||||||||||
|
| |||||||||||||
| TOTAL INVESTMENTS – 95.8% | ||||||||||||||
| (Cost $306,657,921) | $ | 337,053,739 | ||||||||||||
|
| |||||||||||||
| | OTHER ASSETS IN EXCESS OF LIABILITIES – 4.2% | | 8,235,868 | |||||||||||
|
| |||||||||||||
| NET ASSETS – 100.0% | $ | 345,289,607 | ||||||||||||
|
| |||||||||||||
| The percentage shown for each investment category reflects the value of investments in that category as a percentage of net assets. | ||
(a) | Represents Affiliated Funds. | |
(b) | Variable rate security. Interest rate or distribution rate disclosed is that which is in effect on June 30, 2017. | |
| ||
Investment Abbreviations: | ||
ETF | —Exchange Traded Fund | |
PLC | —Public Limited Company | |
| ||
| The accompanying notes are an integral part of these financial statements. | 41 |
GOLDMAN SACHS EQUITY GROWTH STRATEGY PORTFOLIO
Schedule of Investments (continued)
June 30, 2017 (Unaudited)
| ADDITIONAL INVESTMENT INFORMATION |
FUTURES CONTRACTS — At June 30, 2017, the Portfolio had the following futures contracts:
| Type | Number of Contracts Long (Short) | Expiration Date | Current Value | Unrealized Gain (Loss) | ||||||||||
Euro Stoxx 50 Index | 8 | September 2017 | $ | 313,497 | $ | (10,702 | ) | |||||||
Euro Stoxx 50 Index Dividend | 211 | December 2019 | 2,884,693 | 395 | ||||||||||
FTSE 250 Index | (28 | ) | September 2017 | (1,401,196 | ) | 38,894 | ||||||||
FTSE China A50 Index | (152 | ) | July 2017 | (1,727,100 | ) | (12,190 | ) | |||||||
FTSE/JSE Top 40 Index | (44 | ) | September 2017 | (1,536,410 | ) | 10,673 | ||||||||
H-Shares Index | 16 | July 2017 | 1,044,643 | (2,717 | ) | |||||||||
IBEX 35 Index | 7 | July 2017 | 831,957 | (28,330 | ) | |||||||||
Mini MSCI EAFE Index | (4 | ) | September 2017 | (377,920 | ) | (528 | ) | |||||||
Mini MSCI Emerging Market | 50 | September 2017 | 2,520,750 | (24,725 | ) | |||||||||
MSCI Singapore Index | 67 | July 2017 | 1,744,409 | 3,736 | ||||||||||
S&P 500 E-Mini Index | 61 | September 2017 | 7,383,745 | (28,636 | ) | |||||||||
SGX Nifty 50 Index | 92 | July 2017 | 1,751,404 | (17,260 | ) | |||||||||
SPI 200 Index | (14 | ) | September 2017 | (1,519,637 | ) | (13,944 | ) | |||||||
TOPIX Index | 7 | September 2017 | 1,002,934 | 1,404 | ||||||||||
| TOTAL | $ | (83,930 | ) | |||||||||||
WRITTEN OPTIONS CONTRACTS — At June 30, 2017 the Portfolio had following written options:
OPTIONS ON EQUITY CONTRACTS
| Counterparty | Description | Contracts | Expiration Date | Strike Price | Value | |||||||||||||
Citibank NA (London) | Put - iShares MSCI Emerging Markets ETF | 41,940 | 07/19/17 | $ | 40.52 | $ | (8,832 | ) | ||||||||||
| Call - iShares MSCI Emerging Markets ETF | 41,940 | 07/19/17 | 42.15 | (7,491 | ) | |||||||||||||
| TOTAL (Premiums Received $21,473) | 83,880 | $ | (16,323 | ) | ||||||||||||||
For the period ended June 30, 2017, the Portfolio had the following written options activity:
OPTIONS ON EQUITY CONTRACTS
| Contracts | Premiums Received | |||||||
Contracts Outstanding December 31, 2016 | — | $ | — | |||||
Contracts Written | 168,970 | 52,293 | ||||||
Contracts Expired | (85,090 | ) | (30,820 | ) | ||||
Contracts Outstanding June 30, 2017 | 83,880 | $ | 21,473 | |||||
| 42 | The accompanying notes are an integral part of these financial statements. |
GOLDMAN SACHS GROWTH AND INCOME STRATEGY PORTFOLIO
Schedule of Investments
June 30, 2017 (Unaudited)
| Shares | Description | Value | ||||||||||||
| Underlying Funds (Institutional Shares)(a) – 95.0% | ||||||||||||||
| Equity – 47.0% | ||||||||||||||
| 5,056,555 | Goldman Sachs Large Cap Value Insights Fund | $ | 100,574,879 | |||||||||||
| 3,534,943 | Goldman Sachs Large Cap Growth Insights Fund | 100,144,928 | ||||||||||||
| 9,213,339 | Goldman Sachs Emerging Markets Equity Insights Fund | 88,908,718 | ||||||||||||
| 4,138,520 | Goldman Sachs International Equity Insights Fund | 51,441,808 | ||||||||||||
| 2,706,167 | Goldman Sachs International Small Cap Insights Fund | 33,042,305 | ||||||||||||
| 2,364,094 | Goldman Sachs Global Infrastructure Fund | 24,964,834 | ||||||||||||
| 1,990,229 | Goldman Sachs Global Real Estate Securities Fund | 20,479,458 | ||||||||||||
| 340,995 | Goldman Sachs Small Cap Equity Insights Fund | 8,084,990 | ||||||||||||
|
| |||||||||||||
| 427,641,920 | ||||||||||||||
|
| |||||||||||||
| Exchange Traded Funds – 11.2% | ||||||||||||||
| 934,006 | Goldman Sachs ActiveBeta Emerging Markets Equity ETF | 29,178,347 | ||||||||||||
| 479,554 | Goldman Sachs ActiveBeta International Equity ETF | 13,274,055 | ||||||||||||
| 1,240,082 | Goldman Sachs ActiveBeta U.S. Large Cap Equity ETF | 59,660,345 | ||||||||||||
|
| |||||||||||||
| 102,112,747 | ||||||||||||||
|
| |||||||||||||
| Fixed Income – 25.0% | ||||||||||||||
| 7,869,731 | Goldman Sachs Global Income Fund | 96,482,897 | ||||||||||||
| 11,128,084 | Goldman Sachs High Yield Fund | 73,222,794 | ||||||||||||
| 3,616,425 | Goldman Sachs Emerging Markets Debt Fund | 46,688,048 | ||||||||||||
| 1,787,007 | Goldman Sachs Local Emerging Markets Debt Fund | 11,597,676 | ||||||||||||
|
| |||||||||||||
| 227,991,415 | ||||||||||||||
|
| |||||||||||||
| Dynamic – 11.8% | ||||||||||||||
| 7,887,961 | Goldman Sachs Dynamic Allocation Fund | 83,770,148 | ||||||||||||
| 2,312,332 | Goldman Sachs Managed Futures Strategy Fund | 23,724,529 | ||||||||||||
|
| |||||||||||||
| 107,494,677 | ||||||||||||||
|
| |||||||||||||
| | TOTAL UNDERLYING FUNDS (INSTITUTIONAL SHARES) – 95.0% | |||||||||||||
| (Cost $831,851,901) | $ | 865,240,759 | ||||||||||||
|
| |||||||||||||
| Shares | Distribution Rate | Value | ||||||||||||
| Investment Company(a)(b) – 2.1% | ||||||||||||||
| | Goldman Sachs Financial Square Government Fund – | | ||||||||||||
| 18,736,833 | 0.845% | $ | 18,736,833 | |||||||||||
| (Cost $18,736,833) | ||||||||||||||
|
| |||||||||||||
| Contracts | Exercise Price | Expiration Date | Value | |||||||||||
| Option Contracts Purchased – 0.7% | ||||||||||||||
| Options on Equities – 0.0% | ||||||||||||||
Citibank NA (London) Call – S&P 500 Index | ||||||||||||||
| 34 | $ | 2,535.00 | 12/29/17 | $ | 87,074 | |||||||||
Morgan Stanley & Co. International PLC Call – Euro Stoxx 50 | ||||||||||||||
| 2,069 | 3,735.76 | 12/29/17 | 72,694 | |||||||||||
|
| |||||||||||||
| 159,768 | ||||||||||||||
|
| |||||||||||||
| Options on Futures – 0.7% | ||||||||||||||
Credit Suisse International (London) Call – Eurodollar Futures | ||||||||||||||
| 1,003 | 98.00 | 09/18/17 | 1,617,337 | |||||||||||
Credit Suisse International (London) Call – Eurodollar Futures | ||||||||||||||
| 758 | 98.13 | 09/18/17 | 985,400 | |||||||||||
Credit Suisse International (London) Call – Eurodollar Futures | ||||||||||||||
| 1,135 | 97.88 | 12/18/17 | 1,844,375 | |||||||||||
Credit Suisse International (London) Call – Eurodollar Futures | ||||||||||||||
| 866 | 97.75 | 03/19/18 | 1,493,850 | |||||||||||
Credit Suisse International (London) Call – Eurodollar Futures | ||||||||||||||
| 5,800 | 99.00 | 12/17/18 | 253,750 | |||||||||||
Credit Suisse International (London) Call – Eurodollar Futures | ||||||||||||||
| 4,310 | 99.00 | 03/18/19 | 296,312 | |||||||||||
Credit Suisse International (London) Call – Eurodollar Futures | ||||||||||||||
| 2,363 | 99.00 | 06/17/19 | 206,763 | |||||||||||
|
| |||||||||||||
| 6,697,787 | ||||||||||||||
|
| |||||||||||||
| TOTAL OPTION CONTRACTS PURCHASED – 0.7% | ||||||||||||||
| (Cost $7,567,661) | $ | 6,857,555 | ||||||||||||
|
| |||||||||||||
| TOTAL INVESTMENTS – 97.8% | ||||||||||||||
| (Cost $858,156,395) | $ | 890,835,147 | ||||||||||||
|
| |||||||||||||
| | OTHER ASSETS IN EXCESS OF LIABILITIES – 2.2% | | 20,034,921 | |||||||||||
|
| |||||||||||||
| NET ASSETS – 100.0% | $ | 910,870,068 | ||||||||||||
|
| |||||||||||||
| The percentage shown for each investment category reflects the value of investments in that category as a percentage of net assets. | ||
(a) | Represents Affiliated funds. | |
(b) | Variable rate security. Interest rate or distribution rate disclosed is that which is in effect on June 30, 2017. | |
| The accompanying notes are an integral part of these financial statements. | 43 |
GOLDMAN SACHS GROWTH AND INCOME STRATEGY PORTFOLIO
Schedule of Investments (continued)
June 30, 2017 (Unaudited)
| ||
Currency Abbreviations: | ||
AUD | —Australian Dollar | |
BRL | —Brazilian Real | |
CAD | —Canadian Dollar | |
CHF | —Swiss Franc | |
COP | —Colombian Peso | |
CZK | —Czech Koruna | |
EUR | —Euro | |
GBP | —British Pound | |
IDR | —Indonesian Rupiah | |
INR | —Indian Rupee | |
JPY | —Japanese Yen | |
KRW | —South Korean Won | |
NOK | —Norwegian Krone | |
PHP | —Philippine Peso | |
RUB | —Russian Ruble | |
SEK | —Swedish Krona | |
SGD | —Singapore Dollar | |
THB | —Thai Baht | |
TRY | —Turkish Lira | |
TWD | —Taiwan Dollar | |
USD | —U.S. Dollar | |
Investment Abbreviations: | ||
ETF | —Exchange Traded Fund | |
LLC | —Limited Liability Company | |
PLC | —Public Limited Company | |
| ||
| ADDITIONAL INVESTMENT INFORMATION |
FORWARD FOREIGN CURRENCY EXCHANGE CONTRACTS — At June 30, 2017, the Portfolio had the following forward foreign currency exchange contracts:
FORWARD FOREIGN CURRENCY EXCHANGE CONTRACTS WITH UNREALIZED GAIN
| Counterparty | Currency Purchased | Currency Sold | Current Value | Settlement Date | Unrealized Gain | |||||||||||||||||||
Bank of America Securities LLC | CZK | 109,000,000 | USD | 4,686,497 | $ | 4,791,669 | 09/20/17 | $ | 105,172 | |||||||||||||||
| USD | 8,803 | KRW | 10,000,000 | 8,742 | 09/20/17 | 61 | ||||||||||||||||||
| USD | 9,880 | TWD | 300,000 | 9,870 | 09/20/17 | 10 | ||||||||||||||||||
Citibank NA (London) | TRY | 9,810,000 | USD | 2,686,715 | 2,724,480 | 09/20/17 | 37,765 | |||||||||||||||||
| USD | 46,997 | IDR | 630,000,000 | 46,849 | 09/20/17 | 148 | ||||||||||||||||||
Deutsche Bank AG | HUF | 6,000,000 | USD | 21,824 | 22,265 | 09/20/17 | 441 | |||||||||||||||||
JPMorgan Securities, Inc. | BRL | 9,040,000 | USD | 2,692,279 | 2,708,877 | 08/02/17 | 16,598 | |||||||||||||||||
| CHF | 30,000 | USD | 30,966 | 31,450 | 09/20/17 | 484 | ||||||||||||||||||
| USD | 2,669,974 | COP | 8,074,000,000 | 2,621,229 | 09/20/17 | 48,745 | ||||||||||||||||||
Morgan Stanley & Co. International PLC | EUR | 2,500,000 | USD | 2,803,301 | 2,867,672 | 09/20/17 | 64,371 | |||||||||||||||||
| USD | 2,787,488 | KRW | 3,110,000,000 | 2,718,848 | 09/20/17 | 68,639 | ||||||||||||||||||
| USD | 3,706,796 | TWD | 111,000,000 | 3,651,997 | 09/20/17 | 54,799 | ||||||||||||||||||
Royal Bank of Scotland PLC | NOK | 23,350,000 | USD | 2,752,649 | 2,801,290 | 09/20/17 | 48,641 | |||||||||||||||||
| SEK | 56,325,000 | USD | 6,510,271 | 6,716,738 | 09/20/17 | 206,468 | ||||||||||||||||||
UBS AG (London) | USD | 38,385 | INR | 2,500,000 | 38,335 | 09/20/17 | 50 | |||||||||||||||||
| USD | 13,106,566 | JPY | 1,438,000,000 | 12,830,747 | 09/20/17 | 275,819 | ||||||||||||||||||
| USD | 9,934 | PHP | 500,000 | 9,839 | 09/20/17 | 96 | ||||||||||||||||||
| TOTAL | $ | 928,307 | ||||||||||||||||||||||
| 44 | The accompanying notes are an integral part of these financial statements. |
GOLDMAN SACHS GROWTH AND INCOME STRATEGY PORTFOLIO
| ADDITIONAL INVESTMENT INFORMATION (continued) |
FORWARD FOREIGN CURRENCY EXCHANGE CONTRACTS WITH UNREALIZED LOSS
| Counterparty | Currency Purchased | Currency Sold | Current Value | Settlement Date | Unrealized Loss | |||||||||||||||||||
Bank of America Securities LLC | INR | 357,000,000 | USD | 5,490,399 | $ | 5,474,201 | 09/20/17 | $ | (16,198 | ) | ||||||||||||||
Barclays Bank PLC | JPY | 6,000,000 | USD | 54,093 | 53,536 | 09/20/17 | (557 | ) | ||||||||||||||||
Deutsche Bank AG | THB | 1,200,000 | USD | 35,340 | 35,327 | 09/20/17 | (13 | ) | ||||||||||||||||
| USD | 5,618,229 | CHF | 5,390,000 | 5,650,487 | 09/20/17 | (32,258 | ) | |||||||||||||||||
| USD | 3,691,391 | THB | 125,700,000 | 3,700,487 | 09/20/17 | (9,096 | ) | |||||||||||||||||
JPMorgan Securities, Inc. | COP | 8,074,000,000 | USD | 2,746,025 | 2,621,229 | 09/20/17 | (124,796 | ) | ||||||||||||||||
| RUB | 2,500,000 | USD | 42,010 | 41,678 | 09/20/17 | (332 | ) | |||||||||||||||||
| USD | 2,708,209 | BRL | 9,040,000 | 2,725,612 | 07/05/17 | (17,404 | ) | |||||||||||||||||
| USD | 77,077 | CZK | 1,800,000 | 79,128 | 09/20/17 | (2,051 | ) | |||||||||||||||||
| USD | 2,746,872 | GBP | 2,150,000 | 2,807,318 | 09/20/17 | (60,446 | ) | |||||||||||||||||
| USD | 41,535 | TRY | 150,000 | 41,659 | 09/20/17 | (124 | ) | |||||||||||||||||
Morgan Stanley & Co. International PLC | BRL | 9,040,000 | USD | 2,736,492 | 2,725,612 | 07/05/17 | (10,879 | ) | ||||||||||||||||
| IDR | 110,430,000,000 | USD | 8,236,128 | 8,212,037 | 09/20/17 | (24,091 | ) | |||||||||||||||||
| PHP | 183,500,000 | USD | 3,684,739 | 3,610,783 | 09/20/17 | (73,956 | ) | |||||||||||||||||
Royal Bank of Scotland PLC | USD | 8,369,091 | EUR | 7,410,000 | 8,499,781 | 09/20/17 | (130,690 | ) | ||||||||||||||||
Standard Chartered Bank | RUB | 156,500,000 | USD | 2,702,819 | 2,609,022 | 09/20/17 | (93,798 | ) | ||||||||||||||||
State Street Bank and Trust | USD | 3,719,091 | HUF | 1,016,000,000 | 3,770,145 | 09/20/17 | (51,054 | ) | ||||||||||||||||
UBS AG (London) | USD | 5,900 | NOK | 50,000 | 5,998 | 09/20/17 | (99 | ) | ||||||||||||||||
| USD | 51,736 | SEK | 450,000 | 53,662 | 09/20/17 | (1,927 | ) | |||||||||||||||||
| TOTAL | $ | (649,769 | ) | |||||||||||||||||||||
FUTURES CONTRACTS — At June 30, 2017, the Portfolio had the following futures contracts:
| Type | Number of Contracts Long (Short) | Expiration Date | Current Value | Unrealized Gain (Loss) | ||||||||||||
10 Year German Euro-Bund | 98 | September 2017 | $ | 18,118,217 | $ | (256,661 | ) | |||||||||
10 Year U.K. Long Gilt | (25 | ) | September 2017 | (4,088,715 | ) | 28,195 | ||||||||||
10 Year U.S. Treasury Notes | 12 | September 2017 | 1,506,375 | (10,674 | ) | |||||||||||
Australian 10 Year Government Bonds | (95 | ) | September 2017 | (9,438,158 | ) | 145,990 | ||||||||||
Canada 10 Year Government Bonds | (19 | ) | September 2017 | (2,059,261 | ) | 26,898 | ||||||||||
Euro Buxl 30 Year Bonds | (121 | ) | September 2017 | (22,598,482 | ) | 669,020 | ||||||||||
Euro Stoxx 50 Index | 23 | September 2017 | 901,305 | (30,769 | ) | |||||||||||
Euro Stoxx 50 Index Dividend | 560 | December 2019 | 7,656,058 | 984 | ||||||||||||
Eurodollars | 2,342 | December 2017 | 576,863,875 | (345,098 | ) | |||||||||||
Eurodollars | (2,343 | ) | March 2020 | (573,507,825 | ) | 591,413 | ||||||||||
FTSE 250 Index | (73 | ) | September 2017 | (3,653,119 | ) | 102,385 | ||||||||||
FTSE China A50 Index | (402 | ) | July 2017 | (4,567,725 | ) | (32,239 | ) | |||||||||
FTSE/JSE Top 40 Index | (116 | ) | September 2017 | (4,050,535 | ) | 28,351 | ||||||||||
H-Shares Index | 42 | July 2017 | 2,742,188 | (7,131 | ) | |||||||||||
IBEX 35 Index | 18 | July 2017 | 2,139,317 | (72,848 | ) | |||||||||||
Japan 10 Year Government Bonds | 3 | September 2017 | 4,003,823 | (10,746 | ) | |||||||||||
Mini MSCI EAFE Index | (63 | ) | September 2017 | (5,952,240 | ) | (8,316 | ) | |||||||||
Mini MSCI Emerging Market | 105 | September 2017 | 5,293,575 | (51,922 | ) | |||||||||||
MSCI Singapore Index | 180 | July 2017 | 4,686,472 | 10,038 | ||||||||||||
S&P 500 E-Mini Index | (54 | ) | September 2017 | (6,536,430 | ) | 24,879 | ||||||||||
SGX Nifty 50 Index | 244 | July 2017 | 4,645,028 | (45,777 | ) | |||||||||||
SPI 200 Index | (35 | ) | September 2017 | (3,799,093 | ) | (34,860 | ) | |||||||||
TOPIX Index | 19 | September 2017 | 2,722,249 | 3,811 | ||||||||||||
| TOTAL | $ | 724,923 | ||||||||||||||
| The accompanying notes are an integral part of these financial statements. | 45 |
GOLDMAN SACHS GROWTH AND INCOME STRATEGY PORTFOLIO
Schedule of Investments (continued)
June 30, 2017 (Unaudited)
| ADDITIONAL INVESTMENT INFORMATION (continued) |
SWAP CONTRACTS — At June 30, 2017, the Portfolio had the following swap contracts:
CENTRALLY CLEARED CREDIT DEFAULT SWAP CONTRACTS
| Market Value | ||||||||||||||||||||||||
| Referenced Obligation | Notional Amount (000s) | Rates Received (Paid) | Termination Date | Credit 2017(a) | Upfront Payments Made (Received) | Unrealized Gain (Loss) | ||||||||||||||||||
Protection Purchased: | ||||||||||||||||||||||||
iTraxx Europe Crossover Series 27 | $8,180 | (5.000 | )% | 06/20/22 | 2.475 | % | $ | (1,048,999 | ) | $ | (154,639 | ) | ||||||||||||
Protection Sold: | ||||||||||||||||||||||||
CDX North America High Yield Index 28 | 9,190 | 5.000 | 06/20/22 | 3.389 | 693,890 | 71,685 | ||||||||||||||||||
| TOTAL | $ | (355,109 | ) | $ | (82,954 | ) | ||||||||||||||||||
| (a) | Credit spread on the referenced obligation, together with the term of the swap contract, are indicators of payment/performance risk. The likelihood of a credit event occurring which would require a fund or its counterparty to make a payment or otherwise be required to perform under the swap contract is generally greater as the credit spread and the term of the swap contract increase. |
WRITTEN OPTIONS CONTRACTS — At June 30, 2017 the Portfolio had following written options:
OPTIONS ON EQUITY CONTRACTS
| Counterparty | Description | Contracts | Expiration Date | Strike Price | Value | |||||||||||||
Citibank NA (London) | Put - iShares MSCI Emerging Markets ETF | 110,632 | 07/19/17 | $ | 40.52 | $ | (23,298 | ) | ||||||||||
| Call - iShares MSCI Emerging Markets ETF | 110,632 | 07/19/17 | 42.15 | (19,760 | ) | |||||||||||||
| TOTAL (Premiums Received $56,643) | 221,264 | $ | (43,058 | ) | ||||||||||||||
During the period ended June 30, 2017, the Portfolio had the following written options activities:
OPTIONS ON EQUITY CONTRACTS
| Contracts | Premiums Received | |||||||
Contracts Outstanding December 31, 2016 | — | $ | — | |||||
Contracts Written | 445,706 | 137,936 | ||||||
Contracts Expired | (224,442 | ) | (81,293 | ) | ||||
Contracts Outstanding June 30, 2017 | 221,264 | $ | 56,643 | |||||
| 46 | The accompanying notes are an integral part of these financial statements. |
GOLDMAN SACHS GROWTH STRATEGY PORTFOLIO
Schedule of Investments
June 30, 2017 (Unaudited)
| Shares | Description | Value | ||||||||||||
| Underlying Funds (Institutional Shares)(a) – 96.1% | ||||||||||||||
| Dynamic – 10.6% | ||||||||||||||
| 6,468,604 | Goldman Sachs Dynamic Allocation Fund | $ | 68,696,573 | |||||||||||
| 2,046,465 | Goldman Sachs Managed Futures Strategy Fund | 20,996,733 | ||||||||||||
|
| |||||||||||||
| 89,693,306 | ||||||||||||||
|
| |||||||||||||
| Equity – 65.4% | ||||||||||||||
| 13,947,780 | Goldman Sachs Emerging Markets Equity Insights Fund | 134,596,074 | ||||||||||||
| 5,543,614 | Goldman Sachs Large Cap Value Insights Fund | 110,262,488 | ||||||||||||
| 3,845,056 | Goldman Sachs Large Cap Growth Insights Fund | 108,930,444 | ||||||||||||
| 5,152,123 | Goldman Sachs International Equity Insights Fund | 64,040,892 | ||||||||||||
| 4,995,708 | Goldman Sachs Global Real Estate Securities Fund | 51,405,833 | ||||||||||||
| 3,800,332 | Goldman Sachs International Small Cap Insights Fund | 46,402,059 | ||||||||||||
| 1,127,473 | Goldman Sachs Small Cap Equity Insights Fund | 26,732,382 | ||||||||||||
| 1,128,222 | Goldman Sachs Global Infrastructure Fund | 11,914,020 | ||||||||||||
|
| |||||||||||||
| 554,284,192 | ||||||||||||||
|
| |||||||||||||
| Exchange Traded Funds – 14.1% | ||||||||||||||
| 1,636,461 | Goldman Sachs ActiveBeta Emerging Markets Equity ETF | 51,123,042 | ||||||||||||
| 1,428,293 | Goldman Sachs ActiveBeta U.S. Large Cap Equity ETF | 68,715,176 | ||||||||||||
|
| |||||||||||||
| 119,838,218 | ||||||||||||||
|
| |||||||||||||
| Fixed Income – 6.0% | ||||||||||||||
| 5,578,346 | Goldman Sachs High Yield Fund | 36,705,517 | ||||||||||||
| 1,072,746 | Goldman Sachs Emerging Markets Debt Fund | 13,849,148 | ||||||||||||
|
| |||||||||||||
| 50,554,665 | ||||||||||||||
|
| |||||||||||||
| | TOTAL UNDERLYING FUNDS (INSTITUTIONAL SHARES) – 96.1% | |||||||||||||
| (Cost $762,019,031) | $ | 814,370,381 | ||||||||||||
|
| |||||||||||||
| Shares | Distribution Rate | Value | ||||||||||||
| Investment Company(a)(b) – 0.9% | ||||||||||||||
| | Goldman Sachs Financial Square Government Fund – | | ||||||||||||
| 7,079,841 | 0.845% | $ | 7,079,841 | |||||||||||
| (Cost $7,079,841) | ||||||||||||||
|
| |||||||||||||
| Contracts | Exercise Price | Expiration Date | Value | |||||||||||
| Option Contracts Purchased – 1.1% | ||||||||||||||
| Options on Equities – 0.0% | ||||||||||||||
Citibank NA (London) Call – S&P 500 Index | ||||||||||||||
| 32 | $ | 2,535.00 | 12/29/17 | $ | 81,951 | |||||||||
Morgan Stanley & Co. International PLC Call – Euro Stoxx 50 | ||||||||||||||
| 1,915 | 3,735.76 | 12/29/17 | 67,284 | |||||||||||
|
| |||||||||||||
| 149,235 | ||||||||||||||
|
| |||||||||||||
| Options on Futures – 1.1% | ||||||||||||||
Credit Suisse International (London) Call – Eurodollar Futures | ||||||||||||||
| 1,390 | 98.00 | 09/18/17 | 2,241,375 | |||||||||||
Credit Suisse International (London) Call – Eurodollar Futures | ||||||||||||||
| 1,061 | 98.13 | 09/18/17 | 1,379,300 | |||||||||||
Credit Suisse International (London) Call – Eurodollar Futures | ||||||||||||||
| 1,580 | 97.88 | 12/18/17 | 2,567,500 | |||||||||||
Credit Suisse International (London) Call – Eurodollar Futures | ||||||||||||||
| 1,199 | 97.75 | 03/19/18 | 2,068,275 | |||||||||||
Credit Suisse International (London) Call – Eurodollar Futures | ||||||||||||||
| 8,067 | 99.00 | 12/17/18 | 352,931 | |||||||||||
Credit Suisse International (London) Call – Eurodollar Futures | ||||||||||||||
| 5,996 | 99.00 | 03/18/19 | 412,225 | |||||||||||
Credit Suisse International (London) Call – Eurodollar Futures | ||||||||||||||
| 3,288 | 99.00 | 06/17/19 | 287,700 | |||||||||||
|
| |||||||||||||
| 9,309,306 | ||||||||||||||
|
| |||||||||||||
| TOTAL OPTION CONTRACTS PURCHASED – 1.1% | ||||||||||||||
| (Cost $10,391,969) | $ | 9,458,541 | ||||||||||||
|
| |||||||||||||
| TOTAL INVESTMENTS – 98.1% | ||||||||||||||
| (Cost $779,490,841) | $ | 830,908,763 | ||||||||||||
|
| |||||||||||||
| | OTHER ASSETS IN EXCESS OF LIABILITIES – 1.9% | | 16,482,013 | |||||||||||
|
| |||||||||||||
| NET ASSETS – 100.0% | $ | 847,390,776 | ||||||||||||
|
| |||||||||||||
| The percentage shown for each investment category reflects the value of investments in that category as a percentage of net assets. | ||
(a) | Represents Affiliated funds. | |
(b) | Variable rate security. Interest rate or distribution rate disclosed is that which is in effect on June 30, 2017. | |
| The accompanying notes are an integral part of these financial statements. | 47 |
GOLDMAN SACHS GROWTH STRATEGY PORTFOLIO
Schedule of Investments (continued)
June 30, 2017 (Unaudited)
| ||
Currency Abbreviations: | ||
AUD | —Australian Dollar | |
BRL | —Brazilian Real | |
CAD | —Canadian Dollar | |
CHF | —Swiss Franc | |
COP | —Colombian Peso | |
CZK | —Czech Koruna | |
EUR | —Euro | |
GBP | —British Pound | |
HKD | —Hong Kong Dollar | |
HUF | —Hungarian Forint | |
IDR | —Indonesian Rupiah | |
INR | —Indian Rupee | |
JPY | —Japanese Yen | |
KRW | —South Korean Won | |
NOK | —Norwegian Krone | |
PHP | —Philippine Peso | |
RUB | —Russian Ruble | |
SEK | —Swedish Krona | |
SGD | —Singapore Dollar | |
THB | —Thai Baht | |
TRY | —Turkish Lira | |
TWD | —Taiwan Dollar | |
ZAR | —South African Rand | |
Investment Abbreviations: | ||
ETF | —Exchange Traded Fund | |
LLC | —Limited Liability Company | |
PLC | —Public Limited Company | |
| ||
| ADDITIONAL INVESTMENT INFORMATION |
FORWARD FOREIGN CURRENCY EXCHANGE CONTRACTS — At June 30, 2017, the Portfolio had the following forward foreign currency exchange contracts:
FORWARD FOREIGN CURRENCY EXCHANGE CONTRACTS WITH UNREALIZED GAIN
| Counterparty | Currency Purchased | Currency Sold | Current Value | Settlement Date | Unrealized Gain | |||||||||||||||||||
Bank of America Securities LLC | CZK | 100,800,000 | USD | 4,333,935 | $ | 4,431,195 | 09/20/17 | $ | 97,260 | |||||||||||||||
| USD | 26,408 | KRW | 30,000,000 | 26,227 | 09/20/17 | 182 | ||||||||||||||||||
| USD | 29,639 | TWD | 900,000 | 29,611 | 09/20/17 | 29 | ||||||||||||||||||
Citibank NA (London) | TRY | 9,080,000 | USD | 2,486,786 | 2,521,741 | 09/20/17 | 34,955 | |||||||||||||||||
JPMorgan Securities, Inc. | BRL | 8,420,000 | USD | 2,507,632 | 2,523,091 | 08/02/17 | 15,459 | |||||||||||||||||
| USD | 2,466,270 | COP | 7,458,000,000 | 2,421,244 | 09/20/17 | 45,026 | ||||||||||||||||||
Morgan Stanley & Co. | EUR | 2,280,000 | USD | 2,556,611 | 2,615,317 | 09/20/17 | 58,706 | |||||||||||||||||
| USD | 2,581,339 | KRW | 2,880,000,000 | 2,517,776 | 09/20/17 | 63,563 | ||||||||||||||||||
| USD | 3,426,282 | TWD | 102,600,000 | 3,375,629 | 09/20/17 | 50,652 | ||||||||||||||||||
Royal Bank of Scotland PLC | NOK | 21,600,000 | USD | 2,546,347 | 2,591,343 | 09/20/17 | 44,995 | |||||||||||||||||
| SEK | 52,125,000 | USD | 6,024,818 | 6,215,890 | 09/20/17 | 191,072 | ||||||||||||||||||
State Street Bank and Trust | NOK | 100,000 | USD | 11,802 | 11,997 | 09/20/17 | 195 | |||||||||||||||||
UBS AG (London) | USD | 7,677 | INR | 500,000 | 7,667 | 09/20/17 | 9 | |||||||||||||||||
| USD | 12,103,977 | JPY | 1,328,000,000 | 11,849,257 | 09/20/17 | 254,720 | ||||||||||||||||||
| TOTAL | $ | 856,823 | ||||||||||||||||||||||
| 48 | The accompanying notes are an integral part of these financial statements. |
GOLDMAN SACHS GROWTH STRATEGY PORTFOLIO
| ADDITIONAL INVESTMENT INFORMATION (continued) |
FORWARD FOREIGN CURRENCY EXCHANGE CONTRACTS WITH UNREALIZED LOSS
| Counterparty | Currency Purchased | Currency Sold | Current Value | Settlement Date | Unrealized Loss | |||||||||||||||||||
Bank of America Securities LLC | IDR | 90,000,000 | USD | 6,714 | 6,693 | 09/20/17 | $ | (21 | ) | |||||||||||||||
| INR | 330,500,000 | USD | 5,082,848 | 5,067,852 | 09/20/17 | (14,996 | ) | |||||||||||||||||
| PHP | 500,000 | USD | 9,940 | 9,839 | 09/20/17 | (102 | ) | |||||||||||||||||
Deutsche Bank AG | THB | 300,000 | USD | 8,835 | 8,832 | 09/20/17 | (3 | ) | ||||||||||||||||
| USD | 5,201,292 | CHF | 4,990,000 | 5,231,156 | 09/20/17 | (29,864 | ) | |||||||||||||||||
| USD | 3,418,281 | THB | 116,400,000 | 3,426,704 | 09/20/17 | (8,423 | ) | |||||||||||||||||
JPMorgan Securities, Inc. | COP | 7,458,000,000 | USD | 2,536,519 | 2,421,244 | 09/20/17 | (115,275 | ) | ||||||||||||||||
| RUB | 3,250,000 | USD | 54,613 | 54,181 | 09/20/17 | (432 | ) | |||||||||||||||||
| USD | 2,522,469 | BRL | 8,420,000 | 2,538,679 | 07/05/17 | (16,210 | ) | |||||||||||||||||
| USD | 42,821 | CZK | 1,000,000 | 43,960 | 09/20/17 | (1,139 | ) | |||||||||||||||||
| USD | 2,555,230 | GBP | 2,000,000 | 2,611,459 | 09/20/17 | (56,229 | ) | |||||||||||||||||
| USD | 24,921 | TRY | 90,000 | 24,995 | 09/20/17 | (74 | ) | |||||||||||||||||
Morgan Stanley & Co. | BRL | 8,420,000 | USD | 2,548,812 | 2,538,679 | 07/05/17 | (10,133 | ) | ||||||||||||||||
| IDR | 102,150,000,000 | USD | 7,618,586 | 7,596,302 | 09/20/17 | (22,284 | ) | |||||||||||||||||
| PHP | 170,000,000 | USD | 3,413,655 | 3,345,140 | 09/20/17 | (68,515 | ) | |||||||||||||||||
Royal Bank of Scotland PLC | USD | 7,747,904 | EUR | 6,860,000 | 7,868,893 | 09/20/17 | (120,989 | ) | ||||||||||||||||
Standard Chartered Bank | RUB | 144,750,000 | USD | 2,499,892 | 2,413,137 | 09/20/17 | (86,755 | ) | ||||||||||||||||
State Street Bank and Trust | USD | 3,440,892 | HUF | 940,000,000 | 3,488,127 | 09/20/17 | (47,235 | ) | ||||||||||||||||
UBS AG (London) | USD | 8,623 | SEK | 75,000 | 8,944 | 09/20/17 | (321 | ) | ||||||||||||||||
| TOTAL | $ | (599,000 | ) | |||||||||||||||||||||
FUTURES CONTRACTS — At June 30, 2017, the Portfolio had the following futures contracts:
| Type | Number of Contracts Long (Short) | Expiration Date | Current Value | Unrealized Gain (Loss) | ||||||||||
10 Year German Euro-Bund | 91 | September 2017 | $ | 16,824,059 | $ | (242,021 | ) | |||||||
10 Year U.K. Long Gilt | (24 | ) | September 2017 | (3,925,166 | ) | 29,363 | ||||||||
10 Year U.S. Treasury Notes | 10 | September 2017 | 1,255,313 | (8,903 | ) | |||||||||
Australian 10 Year Government Bonds | (88 | ) | September 2017 | (8,742,715 | ) | 135,219 | ||||||||
Canada 10 Year Government Bonds | (17 | ) | September 2017 | (1,842,497 | ) | 23,920 | ||||||||
Euro Buxl 30 Year Bonds | (169 | ) | September 2017 | (31,563,169 | ) | 929,889 | ||||||||
Euro Stoxx 50 Index | 21 | September 2017 | 822,930 | (28,094 | ) | |||||||||
Euro Stoxx 50 Index Dividend | 516 | December 2019 | 7,054,510 | 924 | ||||||||||
Eurodollars | 2,843 | December 2017 | 700,266,437 | (455,842 | ) | |||||||||
Eurodollars | (2,844 | ) | March 2020 | (696,140,100 | ) | 807,579 | ||||||||
FTSE 250 Index | (67 | ) | September 2017 | (3,352,862 | ) | 93,496 | ||||||||
FTSE China A50 Index | (370 | ) | July 2017 | (4,204,125 | ) | (29,673 | ) | |||||||
FTSE/JSE Top 40 Index | (108 | ) | September 2017 | (3,771,187 | ) | 25,796 | ||||||||
H-Shares Index | 39 | July 2017 | 2,546,318 | (6,621 | ) | |||||||||
IBEX 35 Index | 17 | July 2017 | 2,020,466 | (68,801 | ) | |||||||||
Japan 10 Year Government Bonds | 2 | September 2017 | 2,669,215 | (7,186 | ) | |||||||||
Mini MSCI EAFE Index | (58 | ) | September 2017 | (5,479,840 | ) | (7,656 | ) | |||||||
Mini MSCI Emerging Market | 97 | September 2017 | 4,890,255 | (47,966 | ) | |||||||||
MSCI Singapore Index | 165 | July 2017 | 4,295,932 | 9,202 | ||||||||||
S&P 500 E-Mini Index | (50 | ) | September 2017 | (6,052,250 | ) | 23,036 | ||||||||
SGX Nifty 50 Index | 225 | July 2017 | 4,283,325 | (42,213 | ) | |||||||||
SPI 200 Index | (32 | ) | September 2017 | (3,473,457 | ) | (31,872 | ) | |||||||
TOPIX Index | 18 | September 2017 | 2,578,973 | 3,611 | ||||||||||
| TOTAL | $ | 1,105,187 | ||||||||||||
| The accompanying notes are an integral part of these financial statements. | 49 |
GOLDMAN SACHS GROWTH STRATEGY PORTFOLIO
Schedule of Investments (continued)
June 30, 2017 (Unaudited)
| ADDITIONAL INVESTMENT INFORMATION (continued) |
CENTRALLY CLEARED CREDIT DEFAULT SWAP CONTRACTS
| Market Value | ||||||||||||||||||||||
| Referenced Obligation | Notional Amount (000s) | Rates Received (Paid) | Termination Date | Credit Spread at June 30, 2017(a) | Upfront Payments Made (Received) | Unrealized Gain (Loss) | ||||||||||||||||
Protection Purchased: | ||||||||||||||||||||||
iTraxx Europe Crossover Series 27 | 7,580 | (5.000 | )% | 06/20/22 | 2.475 | % | $ | (970,959 | ) | $ | (144,393 | ) | ||||||||||
Protection Sold: | ||||||||||||||||||||||
CDX North America High Yield Index 28 | 8,510 | 5.000 | 06/20/22 | 3.390 | 642,463 | 66,465 | ||||||||||||||||
| TOTAL | $ | (328,496 | ) | $ | (77,928 | ) | ||||||||||||||||
| (a) | Credit spread on the referenced obligation, together with the term of the swap contract, are indicators of payment/performance risk. The likelihood of a credit event occurring which would require a fund or its counterparty to make a payment or otherwise be required to perform under the swap contract is generally greater as the credit spread and the term of the swap contract increase. |
WRITTEN OPTIONS CONTRACTS — At June 30, 2017 the Portfolio had following written options:
OPTIONS ON EQUITY CONTRACTS
| Counterparty | Description | Contracts | Expiration Date | Strike Price | Value | |||||||||||||
Citibank NA (London) | Put - iShares MSCI Emerging Markets ETF | $ | 102,981 | 07/19/17 | $ | 40.52 | $ | (21,687 | ) | |||||||||
| Call - iShares MSCI Emerging Markets ETF | 102,981 | 07/19/17 | 42.15 | (18,393 | ) | |||||||||||||
| TOTAL (Premiums Received $52,726) | 205,962 | $ | (40,080 | ) | ||||||||||||||
For the period ended June 30, 2017, the Portfolio had the following written options activity:
OPTIONS ON EQUITY CONTRACTS
| Contracts | Premiums Received | |||||||
Contracts Outstanding December 31, 2016 | — | $ | — | |||||
Contracts Written | 413,338 | 127,838 | ||||||
Contracts Expired | (207,376 | ) | (75,112 | ) | ||||
Contracts Outstanding June 30, 2017 | 205,962 | $ | 52,726 | |||||
| 50 | The accompanying notes are an integral part of these financial statements. |
GOLDMAN SACHS SATELLITE STRATEGIES PORTFOLIO
Schedule of Investments
June 30, 2017 (Unaudited)
| Shares | Description | Value | ||||||
| Underlying Funds (Institutional Shares)(a) – 99.2% | ||||||||
| Equity – 54.9% | ||||||||
| 11,888,158 | Goldman Sachs Global Real Estate Securities Fund | $ | 122,329,146 | |||||
| 9,120,898 | Goldman Sachs Global Infrastructure Fund | 96,316,678 | ||||||
| 6,908,331 | Goldman Sachs International Small Cap Insights Fund | 84,350,715 | ||||||
| 5,305,045 | Goldman Sachs Emerging Markets Equity Insights Fund | 51,193,686 | ||||||
| 1,672,445 | Goldman Sachs Emerging Markets Equity Fund | 32,863,549 | ||||||
|
| |||||||
| 387,053,774 | ||||||||
|
| |||||||
| Exchange Traded Funds – 4.2% | ||||||||
| 952,022 | Goldman Sachs ActiveBeta Emerging Markets Equity ETF | 29,741,167 | ||||||
|
| |||||||
| 29,741,167 | ||||||||
|
| |||||||
| Fixed Income – 40.1% | ||||||||
| 9,354,010 | Goldman Sachs Emerging Markets Debt Fund | 120,760,276 | ||||||
| 12,512,177 | Goldman Sachs High Yield Fund | 82,330,123 | ||||||
| 4,399,819 | Goldman Sachs High Yield Floating Rate Fund | 42,722,242 | ||||||
| 5,594,154 | Goldman Sachs Local Emerging Markets Debt Fund | 36,306,059 | ||||||
|
| |||||||
| 282,118,700 | ||||||||
|
| |||||||
| | TOTAL UNDERLYING FUNDS (INSTITUTIONAL SHARES) | |||||||
| (Cost $641,588,801) | $ | 698,913,641 | ||||||
|
| |||||||
| | OTHER ASSETS IN EXCESS OF LIABILITIES – 0.8% | 5,457,785 | ||||||
|
| |||||||
| NET ASSETS – 100.0% | $ | 704,371,426 | ||||||
|
| |||||||
| The percentage shown for each investment category reflects the value of investments in that category as a percentage of net assets. | ||
(a) | Represents Affiliated funds. | |
| ||||
Investment Abbreviations: | ||||
ETF | —Exchange Traded Fund | |||
| ||||
| The accompanying notes are an integral part of these financial statements. | 51 |
GOLDMAN SACHS FUND OF FUNDS PORTFOLIOS
Statements of Assets and Liabilities
June 30, 2017 (Unaudited)
| Balanced Strategy Portfolio | ||||||
| Assets: | ||||||
Investments in Affiliated Funds, at value (cost $495,437,535, $306,550,875, $850,588,734, $769,098,872 and $0) | $ | 494,076,559 | ||||
Purchased Options, at value (cost $3,712,363, $107,046, $7,567,661, $10,391,969 and $641,588,801) | 3,356,124 | |||||
Cash | 8,077,239 | |||||
Foreign currencies, at value (cost $12,077, $21,850, $1,671, $13,697 and $0) | 12,320 | |||||
Unrealized gain on forward foreign currency exchange contracts | 515,793 | |||||
Variation margin on certain derivative contracts | 169,368 | |||||
Receivables: | ||||||
Collateral on certain derivative contracts(a) | 2,047,739 | |||||
Portfolio shares sold | 546,439 | |||||
Dividends | 538,197 | |||||
Reimbursement from investment adviser | 16,678 | |||||
Investments sold | — | |||||
Other assets | 1,504 | |||||
| Total assets | 509,357,960 | |||||
| Liabilities: | ||||||
Unrealized loss on forward foreign currency exchange contracts | 360,380 | |||||
Written option contracts, at value (premiums received $31,703, $21,473, $56,643, $52,726 and $0) | 24,099 | |||||
Payables: | ||||||
Portfolio shares redeemed | 681,589 | |||||
Investments purchased | 537,019 | |||||
Distribution and Service fees and Transfer Agency fees | 98,424 | |||||
Management fees | 63,464 | |||||
Accrued expenses | 120,674 | |||||
| Total liabilities | 1,885,649 | |||||
| Net Assets: | ||||||
Paid-in capital | 509,100,730 | |||||
Undistributed net investment income | 318,514 | |||||
Accumulated net realized loss | (668,502 | ) | ||||
Net unrealized gain (loss) | (1,278,431 | ) | ||||
| NET ASSETS | $ | 507,472,311 | ||||
Net Assets: | ||||||
Class A | $ | 123,075,283 | ||||
Class C | 36,971,161 | |||||
Institutional | 334,433,603 | |||||
Service | 838,294 | |||||
Class IR | 4,904,693 | |||||
Class R | 7,238,379 | |||||
Class R6 | 10,898 | |||||
Total Net Assets | $ | 507,472,311 | ||||
Shares Outstanding $0.001 par value (unlimited number of shares authorized): | ||||||
Class A | 10,852,428 | |||||
Class C | 3,261,129 | |||||
Institutional | 29,487,671 | |||||
Service | 73,129 | |||||
Class IR | 434,220 | |||||
Class R | 640,412 | |||||
Class R6 | 960 | |||||
Net asset value, offering and redemption price per share:(b) | ||||||
Class A | $11.34 | |||||
Class C | 11.34 | |||||
Institutional | 11.34 | |||||
Service | 11.46 | |||||
Class IR | 11.30 | |||||
Class R | 11.30 | |||||
Class R6 | 11.35 | |||||
| (a) | Segregated for initial margin and/or collateral on futures transactions of $1,651,567, $1,182,151, $3,089,872 and $3,215,300 for the Balanced Strategy, Equity Growth Strategy, Growth and Income Strategy and Growth Strategy Portfolios, respectively. Also includes amounts segregated for initial margin and/or collateral on swap transactions of $396,172, $716,225 and $663,395 for the Balanced Strategy, Growth and Income Strategy and Growth Strategy Portfolios, respectively. Also includes amounts segregated for initial margin and/or collateral on forwards transactions of $400,000 and $370,000 for the Growth and Income Strategy and Growth Strategy Portfolios, respectively. |
| (b) | Maximum public offering price per share for Class A Shares of the Balanced Strategy, Equity Growth Strategy, Growth and Income Strategy, Growth Strategy and Satellite Strategies Portfolios is $12.00, $18.08, $13.81, $15.53 and $8.57, respectively. At redemption, Class C Shares may be subject to a contingent deferred sales charge, assessed on the amount equal to the lesser of the current NAV or the original purchase price of the shares. |
| 52 | The accompanying notes are an integral part of these financial statements. |
GOLDMAN SACHS FUND OF FUNDS PORTFOLIOS
| Equity Growth Strategy Portfolio | Growth and Income Strategy Portfolio | Growth Strategy Portfolio | Satellite Strategies Portfolio | |||||||||||||||||||
| $ | 336,992,936 | $ | 883,977,592 | $ | 821,450,222 | $ | 698,913,641 | |||||||||||||||
| 60,803 | 6,857,555 | 9,458,541 | — | |||||||||||||||||||
| 5,604,068 | 14,858,096 | 14,180,221 | 5,858,119 | |||||||||||||||||||
| 22,055 | 22,423 | 36,057 | — | |||||||||||||||||||
| — | 928,307 | 856,823 | — | |||||||||||||||||||
| 9,054 | 338,621 | 419,337 | — | |||||||||||||||||||
| 1,182,151 | 4,206,097 | 4,248,695 | — | |||||||||||||||||||
| 163,148 | 617,648 | 943,310 | 380,324 | |||||||||||||||||||
| 4,939 | 737,922 | 237,681 | 1,245,441 | |||||||||||||||||||
| 17,474 | 20,442 | 20,408 | 20,729 | |||||||||||||||||||
| 2,074,160 | 1,962,117 | — | 829,073 | |||||||||||||||||||
| 1,116 | 2,921 | 2,578 | 2,387 | |||||||||||||||||||
| 346,131,904 | 914,529,741 | 851,853,873 | 707,249,714 | |||||||||||||||||||
| — | 649,769 | 599,000 | ��� | |||||||||||||||||||
| 16,323 | 43,058 | 40,080 | — | |||||||||||||||||||
| 538,250 | 1,778,786 | 3,112,266 | 1,409,230 | |||||||||||||||||||
| 4,939 | 736,515 | 234,650 | 1,245,673 | |||||||||||||||||||
| 121,478 | 226,672 | 253,997 | 97,891 | |||||||||||||||||||
| 42,998 | 113,389 | 105,408 | 72,839 | |||||||||||||||||||
| 118,309 | 111,484 | 117,696 | 52,655 | |||||||||||||||||||
| 842,297 | 3,659,673 | 4,463,097 | 2,878,288 | |||||||||||||||||||
| 485,119,829 | 1,411,791,840 | 1,324,983,773 | 713,909,078 | |||||||||||||||||||
| 37,611 | 130,360 | 1,116,077 | 360,114 | |||||||||||||||||||
| (170,185,077 | ) | (534,686,667 | ) | (531,444,858 | ) | (67,222,606 | ) | |||||||||||||||
| 30,317,244 | 33,634,535 | 52,735,784 | 57,324,840 | |||||||||||||||||||
| $ | 345,289,607 | $ | 910,870,068 | $ | 847,390,776 | $ | 704,371,426 | |||||||||||||||
| $130,906,272 | $ | 299,016,231 | $ | 309,554,366 | $ | 63,303,060 | ||||||||||||||||
| 65,569,777 | 95,798,098 | 123,567,904 | 46,940,412 | |||||||||||||||||||
| 136,170,391 | 501,472,911 | 398,503,904 | 500,136,980 | |||||||||||||||||||
| 603,511 | 3,416,831 | 2,559,488 | 379,348 | |||||||||||||||||||
| 6,497,018 | 6,174,896 | 5,564,724 | 55,063,705 | |||||||||||||||||||
| 5,170,711 | 4,929,264 | 5,098,416 | 2,633,205 | |||||||||||||||||||
| 371,927 | 61,837 | 2,541,974 | 35,914,716 | |||||||||||||||||||
| $345,289,607 | $ | 910,870,068 | $ | 847,390,776 | $ | 704,371,426 | ||||||||||||||||
| 7,659,606 | 22,910,161 | 21,080,051 | 7,814,764 | |||||||||||||||||||
| 4,025,955 | 7,509,503 | 8,457,921 | 5,827,518 | |||||||||||||||||||
| 7,882,810 | 38,311,116 | 27,118,956 | 61,871,897 | |||||||||||||||||||
| 35,470 | 262,450 | 174,920 | 46,917 | |||||||||||||||||||
| 385,006 | 475,251 | 384,010 | 6,811,436 | |||||||||||||||||||
| 304,753 | 380,442 | 355,920 | 326,515 | |||||||||||||||||||
| 21,533 | 4,724 | 172,963 | 4,440,559 | |||||||||||||||||||
| $17.09 | $13.05 | $14.68 | $8.10 | |||||||||||||||||||
| 16.29 | 12.76 | 14.61 | 8.05 | |||||||||||||||||||
| 17.27 | 13.09 | 14.69 | 8.08 | |||||||||||||||||||
| 17.01 | 13.02 | 14.63 | 8.09 | |||||||||||||||||||
| 16.88 | 12.99 | 14.49 | 8.08 | |||||||||||||||||||
| 16.97 | 12.96 | 14.32 | 8.06 | |||||||||||||||||||
| 17.27 | 13.09 | 14.70 | 8.09 | |||||||||||||||||||
| The accompanying notes are an integral part of these financial statements. | 53 |
GOLDMAN SACHS FUND OF FUNDS PORTFOLIOS
Statements of Operations
For the Six Months Ended June 30, 2017 (Unaudited)
| Balanced Strategy Portfolio | ||||||
| Investment income: | ||||||
Dividends from Affiliated Funds | $ | 3,752,090 | ||||
Interest | 1,596 | |||||
| Total investment income | 3,753,686 | |||||
| Expenses: | ||||||
Distribution and Service fees(a) | 393,065 | |||||
Management fees | 379,977 | |||||
Transfer Agency fees(a) | 236,356 | |||||
Registration fees | 39,129 | |||||
Professional fees | 33,296 | |||||
Custody, accounting and administrative services | 24,292 | |||||
Printing and mailing costs | 23,404 | |||||
Trustee fees | 8,689 | |||||
Service Share fees — Service Plan | 1,037 | |||||
Service Share fees — Shareholder Administration Plan | 1,037 | |||||
Other | 7,224 | |||||
| Total expenses | 1,147,506 | |||||
Less — expense reductions | (125,020 | ) | ||||
| Net expenses | 1,022,486 | |||||
| NET INVESTMENT INCOME (LOSS) | 2,731,200 | |||||
| Realized and unrealized gain (loss): | ||||||
Net realized gain (loss) from: | ||||||
Affiliated Funds | 5,792,432 | |||||
Purchased Options | 558 | |||||
Futures contracts | 2,821 | |||||
Written options | 45,008 | |||||
Swap contracts | 5,227 | |||||
Forward foreign currency exchange contracts | (263,124 | ) | ||||
Foreign currency transactions | 13,555 | |||||
Net change in unrealized gain (loss) on: | ||||||
Affiliated Funds | 18,055,090 | |||||
Purchased Options | (356,239 | ) | ||||
Futures contracts | 323,165 | |||||
Written options | 7,604 | |||||
Swap contracts | (46,310 | ) | ||||
Forward foreign currency exchange contracts | 155,413 | |||||
Foreign currency translation | (1,088 | ) | ||||
| Net realized and unrealized gain | 23,734,112 | |||||
| NET INCREASE IN NET ASSETS RESULTING FROM OPERATIONS | $ | 26,465,312 | ||||
| (a) | Class specific Distribution and Service and Transfer Agent fees were as follows: |
| Distribution and Service Fees | Transfer Agency Fees | |||||||||||||||||||||||||||||||||||||||
Portfolio | Class A | Class C | Class R | Class A | Class C | Institutional | Service | Class IR | Class R | Class R6 | ||||||||||||||||||||||||||||||
Balanced Strategy | $ | 156,090 | $ | 221,129 | $ | 15,846 | $ | 118,629 | $ | 42,014 | $ | 65,152 | $ | 166 | $ | 4,372 | $ | 6,021 | $ | 2 | ||||||||||||||||||||
Equity Growth Strategy | 159,302 | 366,467 | 7,160 | 121,069 | 69,629 | 25,793 | 111 | 5,789 | 2,721 | 9 | ||||||||||||||||||||||||||||||
Growth and Income Strategy | 370,944 | 572,856 | 7,769 | 281,917 | 108,843 | 98,233 | 665 | 5,384 | 2,952 | 3 | ||||||||||||||||||||||||||||||
Growth Strategy | 378,807 | 696,220 | 8,189 | 287,893 | 132,282 | 75,212 | 462 | 4,666 | 3,112 | 54 | ||||||||||||||||||||||||||||||
Satellite Strategies | 90,617 | 249,036 | 6,578 | 68,869 | 47,317 | 102,649 | 81 | 54,191 | 2,499 | 3,477 | ||||||||||||||||||||||||||||||
| 54 | The accompanying notes are an integral part of these financial statements. |
GOLDMAN SACHS FUND OF FUNDS PORTFOLIOS
| Equity Growth Strategy Portfolio | Growth and Income Strategy Portfolio | Growth Strategy Portfolio | Satellite Strategies Portfolio | |||||||||||||||||||
| $ | 981,829 | $ | 5,649,594 | $ | 3,187,981 | $ | 9,596,455 | |||||||||||||||
| 433 | 1,593 | 1,762 | 228 | |||||||||||||||||||
| 982,262 | 5,651,187 | 3,189,743 | 9,596,683 | |||||||||||||||||||
| 532,929 | 951,569 | 1,083,216 | 346,231 | |||||||||||||||||||
| 254,471 | 685,965 | 622,039 | 452,841 | |||||||||||||||||||
| 225,121 | 497,997 | 503,681 | 279,083 | |||||||||||||||||||
| 38,908 | 42,524 | 40,791 | 54,681 | |||||||||||||||||||
| 33,296 | 33,296 | 33,315 | 33,296 | |||||||||||||||||||
| 19,413 | 23,854 | 21,127 | 23,961 | |||||||||||||||||||
| 29,173 | 42,158 | 53,289 | 38,383 | |||||||||||||||||||
| 8,575 | 9,133 | 9,028 | 9,002 | |||||||||||||||||||
| 693 | 4,156 | 2,889 | 505 | |||||||||||||||||||
| 693 | 4,156 | 2,889 | 505 | |||||||||||||||||||
| 6,603 | 10,285 | 10,665 | 8,127 | |||||||||||||||||||
| 1,149,875 | 2,305,093 | 2,382,929 | 1,246,615 | |||||||||||||||||||
| (128,177 | ) | (141,394 | ) | (149,141 | ) | (131,002 | ) | |||||||||||||||
| 1,021,698 | 2,163,699 | 2,233,788 | 1,115,613 | |||||||||||||||||||
| (39,436 | ) | 3,487,488 | 955,955 | 8,481,070 | ||||||||||||||||||
| 25,639,106 | 21,912,458 | 32,994,500 | 41,498,294 | |||||||||||||||||||
| — | 1,269 | 1,587 | — | |||||||||||||||||||
| 311,823 | (16,082 | ) | 45,870 | — | ||||||||||||||||||
| 30,820 | 81,293 | 75,111 | — | |||||||||||||||||||
| — | 9,266 | 8,631 | — | |||||||||||||||||||
| — | (478,416 | ) | (444,140 | ) | — | |||||||||||||||||
| 177 | (116 | ) | (104 | ) | — | |||||||||||||||||
| 12,954,223 | 42,284,082 | 42,744,270 | 1,668,385 | |||||||||||||||||||
| (46,243 | ) | (710,106 | ) | (933,428 | ) | — | ||||||||||||||||
| (83,930 | ) | 724,923 | 1,105,187 | — | ||||||||||||||||||
| 5,150 | 13,585 | 12,646 | — | |||||||||||||||||||
| — | (82,954 | ) | (77,928 | ) | — | |||||||||||||||||
| — | 278,538 | 257,823 | — | |||||||||||||||||||
| 206 | 21,691 | 20,134 | — | |||||||||||||||||||
| 38,811,332 | 64,039,431 | 75,810,159 | 43,166,679 | |||||||||||||||||||
| $ | 38,771,896 | $ | 67,526,919 | $ | 76,766,114 | $ | 51,647,749 | |||||||||||||||
| The accompanying notes are an integral part of these financial statements. | 55 |
GOLDMAN SACHS FUND OF FUNDS PORTFOLIOS
Statements of Changes in Net Assets
| Balanced Strategy Portfolio | ||||||||||
| For the Six Months Ended June 30, 2017 (Unaudited) | For the Fiscal Year Ended December 31, 2016 | |||||||||
| From operations: | ||||||||||
Net investment income (loss) | $ | 2,731,200 | $ | 5,272,405 | ||||||
Net realized gain | 5,596,477 | 7,312,704 | ||||||||
Net change in unrealized gain (loss) | 18,137,635 | 10,525,081 | ||||||||
| Net increase in net assets resulting from operations | 26,465,312 | 23,110,190 | ||||||||
| Distributions to shareholders: | ||||||||||
From net investment income | ||||||||||
Class A Shares | (563,577 | ) | (1,431,001 | ) | ||||||
Class C Shares | (24,260 | ) | (187,674 | ) | ||||||
Institutional Shares | (2,134,816 | ) | (3,861,868 | ) | ||||||
Service Shares | (3,351 | ) | (7,950 | ) | ||||||
Class IR Shares | (27,340 | ) | (62,622 | ) | ||||||
Class R Shares | (24,934 | ) | (50,552 | ) | ||||||
Class R6 Shares | (69 | ) | (150 | ) | ||||||
| Total distributions to shareholders | (2,778,347 | ) | (5,601,817 | ) | ||||||
| From share transactions: | ||||||||||
Proceeds from sales of shares | 88,775,143 | 128,946,276 | ||||||||
Reinvestment of distributions | 2,723,245 | 5,450,926 | ||||||||
Cost of shares redeemed | (81,931,780 | ) | (122,305,387 | ) | ||||||
| Net increase (decrease) in net assets resulting from share transactions | 9,566,608 | 12,091,815 | ||||||||
| TOTAL INCREASE (DECREASE) | 33,253,573 | 29,600,188 | ||||||||
| Net assets: | ||||||||||
Beginning of period | 474,218,738 | 444,618,550 | ||||||||
End of period | $ | 507,472,311 | $ | 474,218,738 | ||||||
| Undistributed net investment income | $ | 318,514 | $ | 365,661 | ||||||
| 56 | The accompanying notes are an integral part of these financial statements. |
GOLDMAN SACHS FUND OF FUNDS PORTFOLIOS
| Equity Growth Strategy Portfolio | Growth and Income Strategy Portfolio | |||||||||||||||||||
| For the Six Months Ended June 30, 2017 (Unaudited) | For the Fiscal Year Ended December 31, 2016 | For the Six Months Ended June 30, 2017 (Unaudited) | For the Fiscal Year Ended December 31, 2016 | |||||||||||||||||
| $ | (39,436 | ) | $ | 3,618,085 | $ | 3,487,488 | $9,504,544 | |||||||||||||
| 25,981,926 | 38,022,767 | 21,509,672 | 35,297,888 | |||||||||||||||||
| 12,829,406 | (20,062,207 | ) | 42,529,759 | 5,740,702 | ||||||||||||||||
| 38,771,896 | 21,578,645 | 67,526,919 | 50,543,134 | |||||||||||||||||
| — | (1,438,497 | ) | (923,437 | ) | (2,983,993) | |||||||||||||||
| — | (333,408 | ) | — | (776,082) | ||||||||||||||||
| — | (1,833,363 | ) | (2,476,751 | ) | (6,099,777) | |||||||||||||||
| — | (4,961 | ) | (9,002 | ) | (29,340) | |||||||||||||||
| — | (78,416 | ) | (26,256 | ) | (56,795) | |||||||||||||||
| — | (22,591 | ) | (11,186 | ) | (21,905) | |||||||||||||||
| — | (159 | ) | (214 | ) | (140) | |||||||||||||||
| — | (3,711,395 | ) | (3,446,846 | ) | (9,968,032) | |||||||||||||||
| 30,552,392 | 20,190,800 | 85,194,801 | 111,176,894 | |||||||||||||||||
| — | 3,533,154 | 3,354,732 | 9,557,323 | |||||||||||||||||
| (50,857,171 | ) | (58,373,346 | ) | (132,359,472 | ) | (193,346,065) | ||||||||||||||
| (20,304,779 | ) | (34,649,392 | ) | (43,809,939 | ) | (72,611,848) | ||||||||||||||
| 18,467,117 | (16,782,142 | ) | 20,270,134 | (32,036,746) | ||||||||||||||||
| 326,822,490 | 343,604,632 | 890,599,934 | 922,636,680 | |||||||||||||||||
| $ | 345,289,607 | $ | 326,822,490 | $ | 910,870,068 | $890,599,934 | ||||||||||||||
| $ | 37,611 | $ | 77,047 | $ | 130,360 | $89,718 | ||||||||||||||
| The accompanying notes are an integral part of these financial statements. | 57 |
GOLDMAN SACHS FUND OF FUNDS PORTFOLIOS
Statements of Changes in Net Assets (continued)
| Growth Strategy Portfolio | ||||||||||
| For the Six Months Ended June 30, 2017 (Unaudited) | For the Fiscal Year Ended December 31, 2016 | |||||||||
| From operations: | ||||||||||
Net investment income | $ | 955,955 | $ | 6,858,664 | ||||||
Net realized gain (loss) | 32,681,455 | 55,228,578 | ||||||||
Net change in unrealized gain (loss) | 43,128,704 | (14,016,866 | ) | |||||||
| Net increase in net assets resulting from operations | 76,766,114 | 48,070,376 | ||||||||
| Distributions to shareholders: | ||||||||||
From net investment income | ||||||||||
Class A Shares | — | (2,754,301 | ) | |||||||
Class C Shares | — | (192,382 | ) | |||||||
Institutional Shares | — | (4,305,425 | ) | |||||||
Service Shares | — | (19,237 | ) | |||||||
Class IR Shares | — | (51,626 | ) | |||||||
Class R Shares | — | (19,732 | ) | |||||||
Class R6 Shares | — | (137 | ) | |||||||
Return of capital | ||||||||||
Class A Shares | — | — | ||||||||
Class C Shares | — | — | ||||||||
Institutional Shares | — | — | ||||||||
Service Shares | — | — | ||||||||
Class IR Shares | — | — | ||||||||
Class R Shares | — | — | ||||||||
Class R6 Shares | — | — | ||||||||
| Total distributions to shareholders | — | (7,342,840 | ) | |||||||
| From share transactions: | ||||||||||
Proceeds from sales of shares | 80,543,061 | 78,370,140 | ||||||||
Reinvestment of distributions | — | 7,099,351 | ||||||||
Cost of shares redeemed | (99,926,048 | ) | (146,620,200 | ) | ||||||
| Net decrease in net assets resulting from share transactions | (19,382,987 | ) | (61,150,709 | ) | ||||||
| TOTAL INCREASE (DECREASE) | 57,383,127 | (20,423,173 | ) | |||||||
| Net assets: | ||||||||||
Beginning of period | 790,007,649 | 810,430,822 | ||||||||
End of period | $ | 847,390,776 | $ | 790,007,649 | ||||||
| Undistributed net investment income | $ | 1,116,077 | $ | 160,122 | ||||||
| 58 | The accompanying notes are an integral part of these financial statements. |
GOLDMAN SACHS FUND OF FUNDS PORTFOLIOS
| Satellite Strategies Portfolio | ||||||||||
| For the Six Months Ended June 30, 2017 (Unaudited) | For the Fiscal Year Ended December 31, 2016 | |||||||||
| $ | 8,481,070 | $ | 24,437,036 | |||||||
| 41,498,294 | (18,747,170 | ) | ||||||||
| 1,668,385 | 43,658,744 | |||||||||
| 51,647,749 | 49,348,610 | |||||||||
| (648,617 | ) | (3,051,540 | ) | |||||||
| (307,580 | ) | (1,422,156 | ) | |||||||
| (6,080,916 | ) | (20,063,446 | ) | |||||||
| (3,795 | ) | (13,881 | ) | |||||||
| (631,815 | ) | (2,135,752 | ) | |||||||
| (23,381 | ) | (86,828 | ) | |||||||
| (424,852 | ) | (583,898 | ) | |||||||
| — | (38,772 | ) | ||||||||
| — | (18,070 | ) | ||||||||
| — | (254,923 | ) | ||||||||
| — | (176 | ) | ||||||||
| — | (27,137 | ) | ||||||||
| — | (1,103 | ) | ||||||||
| — | (7,419 | ) | ||||||||
| (8,120,956 | ) | (27,705,101 | ) | |||||||
| 62,598,181 | 167,197,541 | |||||||||
| 7,088,937 | 23,519,413 | |||||||||
| (152,368,295 | ) | (382,875,703 | ) | |||||||
| (82,681,177 | ) | (192,158,749 | ) | |||||||
| (39,154,384 | ) | (170,515,240 | ) | |||||||
| 743,525,810 | 914,041,050 | |||||||||
| $ | 704,371,426 | $ | 743,525,810 | |||||||
| $ | 360,114 | $ | — | |||||||
| The accompanying notes are an integral part of these financial statements. | 59 |
GOLDMAN SACHS BALANCED STRATEGY PORTFOLIO
Selected Data for a Share Outstanding Throughout Each Period
| From investment operations | Distributions to shareholders | |||||||||||||||||||||||||||||
| Year - Share Class | Net asset value, beginning of period | Net investment income(a)(b) | Net realized and unrealized gain (loss) | Total from investment operations | From net investment income | From capital | Total distributions | |||||||||||||||||||||||
| FOR THE SIX MONTHS ENDED JUNE 30, (UNAUDITED) | ||||||||||||||||||||||||||||||
2017 - A | $ | 10.82 | $ | 0.05 | $ | 0.52 | $ | 0.57 | $ | (0.05 | ) | $ | — | $ | (0.05 | ) | ||||||||||||||
2017 - C | 10.82 | 0.01 | 0.52 | 0.53 | (0.01 | ) | — | (0.01 | ) | |||||||||||||||||||||
2017 - Institutional | 10.82 | 0.07 | 0.52 | 0.59 | (0.07 | ) | — | (0.07 | ) | |||||||||||||||||||||
2017 - Service | 10.94 | 0.04 | 0.53 | 0.57 | (0.05 | ) | — | (0.05 | ) | |||||||||||||||||||||
2017 - IR | 10.78 | 0.06 | 0.52 | 0.58 | (0.06 | ) | — | (0.06 | ) | |||||||||||||||||||||
2017 - R | 10.79 | 0.04 | 0.51 | 0.55 | (0.04 | ) | — | (0.04 | ) | |||||||||||||||||||||
2017 - R6 | 10.83 | 0.07 | 0.52 | 0.59 | (0.07 | ) | — | (0.07 | ) | |||||||||||||||||||||
| FOR THE FISCAL YEARS DECEMBER 31, | ||||||||||||||||||||||||||||||
2016 - A | 10.41 | 0.11 | 0.41 | 0.52 | (0.11 | ) | — | (0.11 | ) | |||||||||||||||||||||
2016 - C | 10.41 | 0.03 | 0.42 | 0.45 | (0.04 | ) | — | (0.04 | ) | |||||||||||||||||||||
2016 - Institutional | 10.42 | 0.16 | 0.40 | 0.56 | (0.16 | ) | — | (0.16 | ) | |||||||||||||||||||||
2016 - Service | 10.45 | 0.10 | 0.49 | 0.59 | (0.10 | ) | — | (0.10 | ) | |||||||||||||||||||||
2016 - IR | 10.37 | 0.14 | 0.41 | 0.55 | (0.14 | ) | — | (0.14 | ) | |||||||||||||||||||||
2016 - R | 10.36 | 0.09 | 0.43 | 0.52 | (0.09 | ) | — | (0.09 | ) | |||||||||||||||||||||
2016 - R6 | 10.42 | 0.15 | 0.42 | 0.57 | (0.16 | ) | — | (0.16 | ) | |||||||||||||||||||||
2015 - A | 11.06 | 0.33 | (0.43 | ) | (0.10 | ) | (0.38 | ) | (0.17 | ) | (0.55 | ) | ||||||||||||||||||
2015 - C | 11.07 | 0.24 | (0.43 | ) | (0.19 | ) | (0.32 | ) | (0.15 | ) | (0.47 | ) | ||||||||||||||||||
2015 - Institutional | 11.07 | 0.39 | (0.44 | ) | (0.05 | ) | (0.40 | ) | (0.20 | ) | (0.60 | ) | ||||||||||||||||||
2015 - Service | 11.10 | 0.39 | (0.50 | ) | (0.11 | ) | (0.36 | ) | (0.18 | ) | (0.54 | ) | ||||||||||||||||||
2015 - IR | 11.03 | 0.36 | (0.44 | ) | (0.08 | ) | (0.39 | ) | (0.19 | ) | (0.58 | ) | ||||||||||||||||||
2015 - R | 11.02 | 0.36 | (0.49 | ) | (0.13 | ) | (0.34 | ) | (0.19 | ) | (0.53 | ) | ||||||||||||||||||
2015 - R6 (Commenced July 31,2015) | 11.16 | 0.30 | (0.52 | ) | (0.22 | ) | (0.35 | ) | (0.17 | ) | (0.52 | ) | ||||||||||||||||||
2014 - A | 11.13 | 0.21 | 0.06 | 0.27 | (0.34 | ) | — | (0.34 | ) | |||||||||||||||||||||
2014 - C | 11.13 | 0.12 | 0.07 | 0.19 | (0.25 | ) | — | (0.25 | ) | |||||||||||||||||||||
2014 - Institutional | 11.13 | 0.25 | 0.07 | 0.32 | (0.38 | ) | — | (0.38 | ) | |||||||||||||||||||||
2014 - Service | 11.16 | 0.19 | 0.08 | 0.27 | (0.33 | ) | — | (0.33 | ) | |||||||||||||||||||||
2014 - IR | 11.09 | 0.25 | 0.06 | 0.31 | (0.37 | ) | — | (0.37 | ) | |||||||||||||||||||||
2014 - R | 11.08 | 0.18 | 0.07 | 0.25 | (0.31 | ) | — | (0.31 | ) | |||||||||||||||||||||
2013 - A | 10.56 | 0.25 | 0.61 | 0.86 | (0.29 | ) | — | (0.29 | ) | |||||||||||||||||||||
2013 - C | 10.56 | 0.17 | 0.61 | 0.78 | (0.21 | ) | — | (0.21 | ) | |||||||||||||||||||||
2013 - Institutional | 10.56 | 0.33 | 0.58 | 0.91 | (0.34 | ) | — | (0.34 | ) | |||||||||||||||||||||
2013 - Service | 10.59 | 0.23 | 0.62 | 0.85 | (0.28 | ) | — | (0.28 | ) | |||||||||||||||||||||
2013 - IR | 10.53 | 0.37 | 0.51 | 0.88 | (0.32 | ) | — | (0.32 | ) | |||||||||||||||||||||
2013 - R | 10.51 | 0.23 | 0.61 | 0.84 | (0.27 | ) | — | (0.27 | ) | |||||||||||||||||||||
2012 - A | 9.86 | 0.16 | 0.82 | 0.98 | (0.28 | ) | — | (0.28 | ) | |||||||||||||||||||||
2012 - C | 9.86 | 0.09 | 0.81 | 0.90 | (0.20 | ) | — | (0.20 | ) | |||||||||||||||||||||
2012 - Institutional | 9.87 | 0.23 | 0.79 | 1.02 | (0.33 | ) | — | (0.33 | ) | |||||||||||||||||||||
2012 - Service | 9.88 | 0.15 | 0.83 | 0.98 | (0.27 | ) | — | (0.27 | ) | |||||||||||||||||||||
2012 - IR | 9.83 | 0.22 | 0.79 | 1.01 | (0.31 | ) | — | (0.31 | ) | |||||||||||||||||||||
2012 - R | 9.82 | 0.15 | 0.80 | 0.95 | (0.26 | ) | — | (0.26 | ) | |||||||||||||||||||||
| (a) | Calculated based on the average shares outstanding methodology. |
| (b) | Recognition of net investment income by the Portfolio is affected by the timing of declaration of dividends by the Underlying Funds in which the Portfolio invests. |
| (c) | Assumes investment at the NAV at the beginning of the period, reinvestment of all dividends and distributions, a complete redemption of the investment at the NAV at the end of the period and no sales or redemption charges. Total returns would be reduced if a sales or redemption charge was taken into account. Returns do not reflect the impact of taxes to shareholder relating to Portfolio distributions or the redemption of Portfolio shares. Total returns for periods less than one full year are not annualized. |
| (d) | Expense ratios exclude the expenses of the Underlying Funds in which the Portfolio invests. |
| (e) | The Portfolio’s portfolio turnover rate is calculated in accordance with regulatory requirements, without regard to transactions involving short term investments and certain derivatives. If such transactions were included, the Portfolio’s portfolio turnover rate may be higher. |
| (f) | Annualized. |
| 60 | The accompanying notes are an integral part of these financial statements. |
GOLDMAN SACHS BALANCED STRATEGY PORTFOLIO
| Net asset value, end of period | Total return(c) | Net assets, end of period (in 000s) | Ratio of net expenses to average net assets(d) | Ratio of total expenses to average net assets(d) | Ratio of net investment income to average net assets(b) | Portfolio turnover rate(e) | ||||||||||||||||||||||||||||||||||
| $ | 11.34 | 5.28 | % | $ | 123,075 | 0.59 | %(f) | 0.64 | %(f) | 0.88 | %(f) | 54 | % | |||||||||||||||||||||||||||
| 11.34 | 4.86 | 36,971 | 1.34 | (f) | 1.39 | (f) | 0.11 | (f) | 54 | |||||||||||||||||||||||||||||||
| 11.34 | 5.48 | 334,434 | 0.19 | (f) | 0.24 | (f) | 1.29 | (f) | 54 | |||||||||||||||||||||||||||||||
| 11.46 | 5.17 | 838 | 0.69 | (f) | 0.74 | (f) | 0.79 | (f) | 54 | |||||||||||||||||||||||||||||||
| 11.30 | 5.43 | 4,905 | 0.34 | (f) | 0.39 | (f) | 1.14 | (f) | 54 | |||||||||||||||||||||||||||||||
| 11.30 | 5.11 | 7,238 | 0.84 | (f) | 0.89 | (f) | 0.65 | (f) | 54 | |||||||||||||||||||||||||||||||
| 11.35 | 5.48 | 11 | 0.19 | (f) | 0.24 | (f) | 1.30 | (f) | 54 | |||||||||||||||||||||||||||||||
| 10.82 | 5.04 | 129,445 | 0.59 | 0.67 | 1.01 | 76 | ||||||||||||||||||||||||||||||||||
| 10.82 | 4.24 | 47,217 | 1.34 | 1.42 | 0.27 | 76 | ||||||||||||||||||||||||||||||||||
| 10.82 | 5.36 | 285,795 | 0.19 | 0.27 | 1.46 | 76 | ||||||||||||||||||||||||||||||||||
| 10.94 | 5.67 | 831 | 0.69 | 0.77 | 0.93 | 76 | ||||||||||||||||||||||||||||||||||
| 10.78 | 5.33 | 4,810 | 0.34 | 0.42 | 1.30 | 76 | ||||||||||||||||||||||||||||||||||
| 10.79 | 5.02 | 6,110 | 0.84 | 0.92 | 0.85 | 76 | ||||||||||||||||||||||||||||||||||
| 10.83 | 5.46 | 10 | 0.19 | 0.27 | 1.45 | 76 | ||||||||||||||||||||||||||||||||||
| 10.41 | (0.90 | ) | 146,047 | 0.59 | 0.65 | 2.95 | 48 | |||||||||||||||||||||||||||||||||
| 10.41 | (1.65 | ) | 53,734 | 1.34 | 1.40 | 2.20 | 48 | |||||||||||||||||||||||||||||||||
| 10.42 | (0.49 | ) | 234,110 | 0.19 | 0.25 | 3.48 | 48 | |||||||||||||||||||||||||||||||||
| 10.45 | (0.99 | ) | 967 | 0.69 | 0.75 | 3.47 | 48 | |||||||||||||||||||||||||||||||||
| 10.37 | (0.73 | ) | 4,555 | 0.34 | 0.40 | 3.29 | 48 | |||||||||||||||||||||||||||||||||
| 10.36 | (1.23 | ) | 5,196 | 0.84 | 0.90 | 3.22 | 48 | |||||||||||||||||||||||||||||||||
| 10.42 | (2.01 | ) | 10 | 0.19 | (f) | 0.23 | (f) | 6.52 | (f) | 48 | ||||||||||||||||||||||||||||||
| 11.06 | 2.40 | 173,813 | 0.60 | 0.66 | 1.85 | 38 | ||||||||||||||||||||||||||||||||||
| 11.07 | 1.71 | 63,726 | 1.35 | 1.41 | 1.05 | 38 | ||||||||||||||||||||||||||||||||||
| 11.07 | 2.90 | 254,620 | 0.20 | 0.26 | 2.22 | 38 | ||||||||||||||||||||||||||||||||||
| 11.10 | 2.38 | 1,391 | 0.70 | 0.75 | 1.65 | 38 | ||||||||||||||||||||||||||||||||||
| 11.03 | 2.76 | 4,980 | 0.35 | 0.41 | 2.23 | 38 | ||||||||||||||||||||||||||||||||||
| 11.02 | 2.25 | 5,436 | 0.85 | 0.90 | 1.61 | 38 | ||||||||||||||||||||||||||||||||||
| 11.13 | 8.23 | 186,034 | 0.60 | 0.65 | 2.29 | 63 | ||||||||||||||||||||||||||||||||||
| 11.13 | 7.42 | 74,053 | 1.34 | 1.40 | 1.57 | 63 | ||||||||||||||||||||||||||||||||||
| 11.13 | 8.67 | 287,623 | 0.20 | 0.25 | 2.99 | 63 | ||||||||||||||||||||||||||||||||||
| 11.16 | 8.08 | 1,736 | 0.69 | 0.75 | 2.14 | 63 | ||||||||||||||||||||||||||||||||||
| 11.09 | 8.45 | 3,938 | 0.35 | 0.40 | 3.37 | 63 | ||||||||||||||||||||||||||||||||||
| 11.08 | 8.00 | 5,615 | 0.84 | 0.90 | 2.07 | 63 | ||||||||||||||||||||||||||||||||||
| 10.56 | 9.96 | 219,919 | 0.59 | 0.65 | 1.55 | 66 | ||||||||||||||||||||||||||||||||||
| 10.56 | 9.16 | 81,123 | 1.34 | 1.40 | 0.87 | 66 | ||||||||||||||||||||||||||||||||||
| 10.56 | 10.32 | 247,494 | 0.19 | 0.25 | 2.23 | 66 | ||||||||||||||||||||||||||||||||||
| 10.59 | 9.95 | 2,022 | 0.69 | 0.75 | 1.48 | 66 | ||||||||||||||||||||||||||||||||||
| 10.53 | 10.29 | 920 | 0.34 | 0.40 | 2.14 | 66 | ||||||||||||||||||||||||||||||||||
| 10.51 | 9.66 | 8,237 | 0.84 | 0.90 | 1.49 | 66 | ||||||||||||||||||||||||||||||||||
| The accompanying notes are an integral part of these financial statements. | 61 |
GOLDMAN SACHS EQUITY GROWTH STRATEGY PORTFOLIO
Financial Highlights
Selected Data for a Share Outstanding Throughout Each Period
| From investment operations | ||||||||||||||||||||||
| Year - Share Class | Net asset value, beginning of period | Net investment income (loss)(a)(b) | Net realized and unrealized gain (loss) | Total from investment operations | Distributions to shareholders from net investment income | |||||||||||||||||
| FOR THE SIX MONTHS ENDED JUNE 30, (UNAUDITED) | ||||||||||||||||||||||
2017 - A | $ | 15.25 | $ | — | (f) | $ | 1.84 | $ | 1.84 | $ | — | |||||||||||
2017 - C | 14.58 | (0.06 | ) | 1.77 | 1.71 | — | ||||||||||||||||
2017 - Institutional | 15.38 | 0.03 | 1.86 | 1.89 | — | |||||||||||||||||
2017 - Service | 15.19 | (0.01 | ) | 1.83 | 1.82 | — | ||||||||||||||||
2017 - IR | 15.03 | 0.02 | 1.83 | 1.85 | — | |||||||||||||||||
2017 - R | 15.15 | — | (f) | 1.82 | 1.82 | — | ||||||||||||||||
2017 - R6 | 15.37 | 0.14 | 1.76 | 1.90 | — | |||||||||||||||||
| FOR THE FISCAL YEARS ENDED DECEMBER 31, | ||||||||||||||||||||||
2016 - A | 14.44 | 0.16 | 0.83 | 0.99 | (0.18 | ) | ||||||||||||||||
2016 - C | 13.82 | 0.05 | 0.78 | 0.83 | (0.07 | ) | ||||||||||||||||
2016 - Institutional | 14.57 | 0.23 | 0.82 | 1.05 | (0.24 | ) | ||||||||||||||||
2016 - Service | 14.39 | 0.15 | 0.81 | 0.96 | (0.16 | ) | ||||||||||||||||
2016 - IR | 14.25 | 0.21 | 0.79 | 1.00 | (0.22 | ) | ||||||||||||||||
2016 - R | 14.37 | 0.16 | 0.78 | 0.94 | (0.16 | ) | ||||||||||||||||
2016 - R6 | 14.57 | 0.24 | 0.80 | 1.04 | (0.24 | ) | ||||||||||||||||
2015 - A | 14.46 | 0.09 | 0.03 | 0.12 | (0.14 | ) | ||||||||||||||||
2015 - C | 13.83 | (0.02 | ) | 0.04 | 0.02 | (0.03 | ) | |||||||||||||||
2015 - Institutional | 14.58 | 0.16 | 0.03 | 0.19 | (0.20 | ) | ||||||||||||||||
2015 - Service | 14.40 | 0.08 | 0.03 | 0.11 | (0.12 | ) | ||||||||||||||||
2015 - IR | 14.27 | 0.13 | 0.03 | 0.16 | (0.18 | ) | ||||||||||||||||
2015 - R | 14.37 | 0.04 | 0.05 | 0.09 | (0.09 | ) | ||||||||||||||||
2015 - R6 (Commenced July 31, 2015) | 15.38 | 0.14 | (0.74 | ) | (0.60 | ) | (0.21 | ) | ||||||||||||||
2014 - A | 14.29 | 0.23 | 0.20 | 0.43 | (0.26 | ) | ||||||||||||||||
2014 - C | 13.68 | 0.10 | 0.20 | 0.30 | (0.15 | ) | ||||||||||||||||
2014 - Institutional | 14.41 | 0.29 | 0.20 | 0.49 | (0.32 | ) | ||||||||||||||||
2014 - Service | 14.22 | 0.19 | 0.23 | 0.42 | (0.24 | ) | ||||||||||||||||
2014 - IR | 14.11 | 0.32 | 0.14 | 0.46 | (0.30 | ) | ||||||||||||||||
2014 - R | 14.17 | 0.13 | 0.26 | 0.39 | (0.19 | ) | ||||||||||||||||
2013 - A | 11.75 | 0.19 | 2.57 | 2.76 | (0.22 | ) | ||||||||||||||||
2013 - C | 11.26 | 0.08 | 2.46 | 2.54 | (0.12 | ) | ||||||||||||||||
2013 - Institutional | 11.85 | 0.27 | 2.57 | 2.84 | (0.28 | ) | ||||||||||||||||
2013 - Service | 11.71 | 0.19 | 2.54 | 2.73 | (0.22 | ) | ||||||||||||||||
2013 - IR | 11.62 | 0.47 | 2.29 | 2.76 | (0.27 | ) | ||||||||||||||||
2013 - R | 11.64 | 0.11 | 2.59 | 2.70 | (0.17 | ) | ||||||||||||||||
2012 - A | 10.23 | 0.21 | 1.53 | 1.74 | (0.22 | ) | ||||||||||||||||
2012 - C | 9.82 | 0.12 | 1.46 | 1.58 | (0.14 | ) | ||||||||||||||||
2012 - Institutional | 10.33 | 0.28 | 1.52 | 1.80 | (0.28 | ) | ||||||||||||||||
2012 - Service | 10.14 | 0.16 | 1.55 | 1.71 | (0.14 | ) | ||||||||||||||||
2012 - IR | 10.13 | 0.24 | 1.51 | 1.75 | (0.26 | ) | ||||||||||||||||
2012 - R | 10.16 | 0.20 | 1.49 | 1.69 | (0.21 | ) | ||||||||||||||||
| (a) | Calculated based on the average shares outstanding methodology. |
| (b) | Recognition of net investment income by the Portfolio is affected by the timing of declaration of dividends by the Underlying Funds in which the Portfolio invests. |
| (c) | Assumes investment at the NAV at the beginning of the period, reinvestment of all dividends and distributions, a complete redemption of the investment at the NAV at the end of the period and no sales or redemption charges. Total returns would be reduced if a sales or redemption charge was taken into account. Returns do not reflect the impact of taxes to shareholder relating to Portfolio distributions or the redemption of Portfolio shares. Total returns for periods less than one full year are not annualized. |
| (d) | Expense ratios exclude the expenses of the Underlying Funds in which the Portfolio invests. |
| (e) | The Portfolio’s portfolio turnover rate is calculated in accordance with regulatory requirements, without regard to transactions involving short term investments and certain derivatives. If such transactions were included, the Portfolio’s portfolio turnover rate may be higher. |
| (f) | Amount is less than $0.005 per share. |
| (g) | Annualized. |
| 62 | The accompanying notes are an integral part of these financial statements. |
GOLDMAN SACHS EQUITY GROWTH STRATEGY PORTFOLIO
| Net asset value, end of period | Total return(c) | Net assets, end of period (in 000s) | Ratio of net expenses to average net assets(d) | Ratio of total expenses to average net assets(d) | Ratio of net investment income (loss) to average net assets(b) | Portfolio turnover rate(e) | ||||||||||||||||||||||||||||||||||
| $ | 17.09 | 12.07 | % | $ | 130,906 | 0.59 | %(g) | 0.67 | %(g) | (0.01 | )%(g) | 51 | % | |||||||||||||||||||||||||||
| 16.29 | 11.73 | 65,570 | 1.34 | (g) | 1.42 | (g) | (0.81 | )(g) | 51 | |||||||||||||||||||||||||||||||
| 17.27 | 12.29 | 136,170 | 0.19 | (g) | 0.27 | (g) | 0.40 | (g) | 51 | |||||||||||||||||||||||||||||||
| 17.01 | 11.98 | 604 | 0.69 | (g) | 0.77 | (g) | (0.08 | )(g) | 51 | |||||||||||||||||||||||||||||||
| 16.88 | 12.31 | 6,497 | 0.34 | (g) | 0.42 | (g) | 0.26 | (g) | 51 | |||||||||||||||||||||||||||||||
| 16.97 | 12.01 | 5,171 | 0.84 | (g) | 0.92 | (g) | 0.01 | (g) | 51 | |||||||||||||||||||||||||||||||
| 17.27 | 12.36 | 372 | 0.18 | (g) | 0.24 | (g) | 1.63 | (g) | 51 | |||||||||||||||||||||||||||||||
| 15.25 | 6.81 | 124,514 | 0.59 | 0.69 | 1.12 | 39 | ||||||||||||||||||||||||||||||||||
| 14.58 | 5.95 | 75,027 | 1.34 | 1.44 | 0.33 | 39 | ||||||||||||||||||||||||||||||||||
| 15.38 | 7.18 | 119,108 | 0.19 | 0.29 | 1.55 | 39 | ||||||||||||||||||||||||||||||||||
| 15.19 | 6.66 | 470 | 0.69 | 0.79 | 1.01 | 39 | ||||||||||||||||||||||||||||||||||
| 15.03 | 6.99 | 5,663 | 0.34 | 0.44 | 1.47 | 39 | ||||||||||||||||||||||||||||||||||
| 15.15 | 6.49 | 2,031 | 0.84 | 0.94 | 1.10 | 39 | ||||||||||||||||||||||||||||||||||
| 15.37 | 7.12 | 10 | 0.19 | 0.28 | 1.63 | 39 | ||||||||||||||||||||||||||||||||||
| 14.44 | 0.83 | 134,851 | 0.59 | 0.67 | 0.63 | 18 | ||||||||||||||||||||||||||||||||||
| 13.82 | 0.13 | 83,743 | 1.34 | 1.42 | (0.15 | ) | 18 | |||||||||||||||||||||||||||||||||
| 14.57 | 1.31 | 117,357 | 0.19 | 0.27 | 1.05 | 18 | ||||||||||||||||||||||||||||||||||
| 14.39 | 0.78 | 577 | 0.69 | 0.77 | 0.52 | 18 | ||||||||||||||||||||||||||||||||||
| 14.57 | (3.93 | ) | 10 | 0.18 | (g) | 0.29 | (g) | 2.32 | (g) | 18 | ||||||||||||||||||||||||||||||
| 14.25 | 1.11 | 5,282 | 0.34 | 0.42 | 0.91 | 18 | ||||||||||||||||||||||||||||||||||
| 14.37 | 0.61 | 1,785 | 0.84 | 0.92 | 0.28 | 18 | ||||||||||||||||||||||||||||||||||
| 14.46 | 3.01 | 148,611 | 0.60 | 0.68 | 1.56 | 23 | ||||||||||||||||||||||||||||||||||
| 13.83 | 2.18 | 96,667 | 1.35 | 1.42 | 0.71 | 23 | ||||||||||||||||||||||||||||||||||
| 14.58 | 3.38 | 130,499 | 0.20 | 0.28 | 1.96 | 23 | ||||||||||||||||||||||||||||||||||
| 14.40 | 2.94 | 626 | 0.70 | 0.77 | 1.27 | 23 | ||||||||||||||||||||||||||||||||||
| 14.27 | 3.27 | 5,280 | 0.35 | 0.43 | 2.19 | 23 | ||||||||||||||||||||||||||||||||||
| 14.37 | 2.77 | 2,339 | 0.85 | 0.92 | 0.86 | 23 | ||||||||||||||||||||||||||||||||||
| 14.29 | 23.51 | 152,264 | 0.60 | 0.68 | 1.45 | 21 | ||||||||||||||||||||||||||||||||||
| 13.68 | 22.60 | 106,208 | 1.35 | 1.43 | 0.68 | 21 | ||||||||||||||||||||||||||||||||||
| 14.41 | 23.96 | 124,275 | 0.20 | 0.28 | 2.07 | 21 | ||||||||||||||||||||||||||||||||||
| 14.22 | 23.28 | 715 | 0.70 | 0.78 | 1.48 | 21 | ||||||||||||||||||||||||||||||||||
| 14.11 | 23.77 | 3,735 | 0.35 | 0.43 | 3.55 | 21 | ||||||||||||||||||||||||||||||||||
| 14.17 | 23.17 | 3,740 | 0.84 | 0.93 | 0.85 | 21 | ||||||||||||||||||||||||||||||||||
| 11.75 | 16.95 | 147,814 | 0.59 | 0.68 | 1.85 | 23 | ||||||||||||||||||||||||||||||||||
| 11.26 | 16.10 | 102,156 | 1.34 | 1.43 | 1.10 | 23 | ||||||||||||||||||||||||||||||||||
| 11.85 | 17.45 | 92,696 | 0.19 | 0.26 | 2.45 | 23 | ||||||||||||||||||||||||||||||||||
| 11.71 | 16.85 | 488 | 0.70 | 0.78 | 1.43 | 23 | ||||||||||||||||||||||||||||||||||
| 11.62 | 17.30 | 494 | 0.34 | 0.42 | 2.20 | 23 | ||||||||||||||||||||||||||||||||||
| 11.64 | 16.59 | 4,946 | 0.84 | 0.92 | 1.79 | 23 | ||||||||||||||||||||||||||||||||||
| The accompanying notes are an integral part of these financial statements. | 63 |
GOLDMAN SACHS GROWTH AND INCOME STRATEGY PORTFOLIO
Financial Highlights
Selected Data for a Share Outstanding Throughout Each Period
| From investment operations | ||||||||||||||||||||||
| Year - Share Class | Net asset value, beginning of period | Net investment income (loss)(a)(b) | Net realized and unrealized gain (loss) | Total from investment operations | Distributions to shareholders from net investment income | |||||||||||||||||
| FOR THE SIX MONTHS ENDED JUNE 30, (UNAUDITED) | ||||||||||||||||||||||
2017 - A | $ | 12.17 | $ | 0.04 | $ | 0.88 | $ | 0.92 | $ | (0.04 | ) | |||||||||||
2017 - C | 11.90 | (0.01 | ) | 0.87 | 0.86 | — | ||||||||||||||||
2017 - Institutional | 12.21 | 0.07 | 0.87 | 0.94 | (0.06 | ) | ||||||||||||||||
2017 - Service | 12.14 | 0.03 | 0.88 | 0.91 | (0.03 | ) | ||||||||||||||||
2017 - IR | 12.12 | 0.06 | 0.87 | 0.93 | (0.06 | ) | ||||||||||||||||
2017 - R | 12.09 | 0.03 | 0.87 | 0.90 | (0.03 | ) | ||||||||||||||||
2017 - R6 | 12.20 | 0.09 | 0.87 | 0.96 | (0.07 | ) | ||||||||||||||||
| FOR THE FISCAL YEARS ENDED DECEMBER 31, | ||||||||||||||||||||||
2016 - A | 11.62 | 0.11 | 0.56 | 0.67 | (0.12 | ) | ||||||||||||||||
2016 - C | 11.42 | 0.02 | 0.54 | 0.56 | (0.08 | ) | ||||||||||||||||
2016 - Institutional | 11.66 | 0.17 | 0.55 | 0.72 | (0.17 | ) | ||||||||||||||||
2016 - Service | 11.60 | 0.11 | 0.54 | 0.65 | (0.11 | ) | ||||||||||||||||
2016 - IR | 11.57 | 0.16 | 0.54 | 0.70 | (0.15 | ) | ||||||||||||||||
2016 - R | 11.56 | 0.09 | 0.54 | 0.63 | (0.10 | ) | ||||||||||||||||
2016 - R6 | 11.66 | 0.17 | 0.54 | 0.71 | (0.17 | ) | ||||||||||||||||
2015 - A | 12.10 | 0.25 | (0.31 | ) | (0.06 | ) | (0.42 | ) | ||||||||||||||
2015 - C | 11.91 | 0.16 | (0.31 | ) | (0.15 | ) | (0.34 | ) | ||||||||||||||
2015 - Institutional | 12.14 | 0.32 | (0.33 | ) | (0.01 | ) | (0.47 | ) | ||||||||||||||
2015 - Service | 12.07 | 0.25 | (0.32 | ) | (0.07 | ) | (0.40 | ) | ||||||||||||||
2015 - IR | 12.05 | 0.29 | (0.32 | ) | (0.03 | ) | (0.45 | ) | ||||||||||||||
2015 - R | 12.03 | 0.23 | (0.31 | ) | (0.08 | ) | (0.39 | ) | ||||||||||||||
2015 - R6 (Commenced July 31, 2015) | 12.42 | 0.26 | (0.62 | ) | (0.36 | ) | (0.40 | ) | ||||||||||||||
2014 - A | 12.14 | 0.20 | 0.07 | 0.27 | (0.31 | ) | ||||||||||||||||
2014 - C | 11.99 | 0.10 | 0.08 | 0.18 | (0.26 | ) | ||||||||||||||||
2014 - Institutional | 12.18 | 0.26 | 0.06 | 0.32 | (0.36 | ) | ||||||||||||||||
2014 - Service | 12.11 | 0.20 | 0.06 | 0.26 | (0.30 | ) | ||||||||||||||||
2014 - IR | 12.09 | 0.25 | 0.05 | 0.30 | (0.34 | ) | ||||||||||||||||
2014 - R | 12.08 | 0.16 | 0.07 | 0.23 | (0.28 | ) | ||||||||||||||||
2013 - A | 10.95 | 0.20 | 1.23 | 1.43 | (0.24 | ) | ||||||||||||||||
2013 - C | 10.85 | 0.12 | 1.22 | 1.34 | (0.20 | ) | ||||||||||||||||
2013 - Institutional | 10.98 | 0.28 | 1.21 | 1.49 | (0.29 | ) | ||||||||||||||||
2013 - Service | 10.92 | 0.20 | 1.23 | 1.43 | (0.24 | ) | ||||||||||||||||
2013 - IR | 10.91 | 0.29 | 1.16 | 1.45 | (0.27 | ) | ||||||||||||||||
2013 - R | 10.90 | 0.16 | 1.24 | 1.40 | (0.22 | ) | ||||||||||||||||
2012 - A | 9.98 | 0.17 | 1.07 | 1.24 | (0.27 | ) | ||||||||||||||||
2012 - C | 9.92 | 0.09 | 1.04 | 1.13 | (0.20 | ) | ||||||||||||||||
2012 - Institutional | 10.02 | 0.24 | 1.03 | 1.27 | (0.31 | ) | ||||||||||||||||
2012 - Service | 9.97 | 0.17 | 1.04 | 1.21 | (0.26 | ) | ||||||||||||||||
2012 - IR | 9.95 | 0.20 | 1.05 | 1.25 | (0.29 | ) | ||||||||||||||||
2012 - R | 9.94 | 0.16 | 1.04 | 1.20 | (0.24 | ) | ||||||||||||||||
| (a) | Calculated based on the average shares outstanding methodology. |
| (b) | Recognition of net investment income by the Portfolio is affected by the timing of declaration of dividends by the Underlying Funds in which the Portfolio invests. |
| (c) | Assumes investment at the NAV at the beginning of the period, reinvestment of all dividends and distributions, a complete redemption of the investment at the NAV at the end of the period and no sales or redemption charges. Total returns would be reduced if a sales or redemption charge was taken into account. Returns do not reflect the impact of taxes to shareholder relating to Portfolio distributions or the redemption of Portfolio shares. Total returns for periods less than one full year are not annualized. |
| (d) | Expense ratios exclude the expenses of the Underlying Funds in which the Portfolio invests. |
| (e) | The Portfolio’s portfolio turnover rate is calculated in accordance with regulatory requirements, without regard to transactions involving short term investments and certain derivatives. If such transactions were included, the Portfolio’s portfolio turnover rate may be higher. |
| (f) | Annualized. |
| 64 | The accompanying notes are an integral part of these financial statements. |
GOLDMAN SACHS GROWTH AND INCOME STRATEGY PORTFOLIO
| Net asset value, end of period | Total return(c) | Net assets, end of period (in 000s) | Ratio of net expenses to average net assets(d) | Ratio of total expenses to average net assets(d) | Ratio of net investment income (loss) to average net assets(b) | Portfolio turnover rate(e) | ||||||||||||||||||||||||||||||||||
| $ | 13.05 | 7.56 | % | $ | 299,016 | 0.59 | %(f) | 0.62 | %(f) | 0.64 | %(f) | 55 | % | |||||||||||||||||||||||||||
| 12.76 | 7.23 | 95,798 | 1.34 | (f) | 1.37 | (f) | (0.15 | )(f) | 55 | |||||||||||||||||||||||||||||||
| 13.09 | 7.74 | 501,473 | 0.19 | (f) | 0.23 | (f) | 1.05 | (f) | 55 | |||||||||||||||||||||||||||||||
| 13.02 | 7.53 | 3,417 | 0.69 | (f) | 0.72 | (f) | 0.55 | (f) | 55 | |||||||||||||||||||||||||||||||
| 12.99 | 7.64 | 6,175 | 0.34 | (f) | 0.37 | (f) | 0.92 | (f) | 55 | |||||||||||||||||||||||||||||||
| 12.96 | 7.46 | 4,929 | 0.84 | (f) | 0.87 | (f) | 0.54 | (f) | 55 | |||||||||||||||||||||||||||||||
| 13.09 | 7.83 | 62 | 0.18 | (f) | 0.21 | (f) | 1.34 | (f) | 55 | |||||||||||||||||||||||||||||||
| 12.17 | 5.75 | 302,858 | 0.59 | 0.64 | 0.95 | 67 | ||||||||||||||||||||||||||||||||||
| 11.90 | 4.86 | 121,778 | 1.34 | 1.39 | 0.18 | 67 | ||||||||||||||||||||||||||||||||||
| 12.21 | 6.15 | 455,273 | 0.19 | 0.24 | 1.42 | 67 | ||||||||||||||||||||||||||||||||||
| 12.14 | 5.58 | 3,253 | 0.69 | 0.74 | 0.90 | 67 | ||||||||||||||||||||||||||||||||||
| 12.12 | 6.04 | 4,769 | 0.34 | 0.39 | 1.37 | 67 | ||||||||||||||||||||||||||||||||||
| 12.09 | 5.40 | 2,659 | 0.84 | 0.89 | 0.75 | 67 | ||||||||||||||||||||||||||||||||||
| 12.20 | 6.07 | 10 | 0.19 | 0.23 | 1.43 | 67 | ||||||||||||||||||||||||||||||||||
| 11.62 | (0.54 | ) | 341,468 | 0.59 | 0.63 | 2.08 | 40 | |||||||||||||||||||||||||||||||||
| 11.42 | (1.24 | ) | 143,257 | 1.34 | 1.38 | 1.30 | 40 | |||||||||||||||||||||||||||||||||
| 11.66 | (0.13 | ) | 429,243 | 0.19 | 0.23 | 2.59 | 40 | |||||||||||||||||||||||||||||||||
| 11.60 | (0.56 | ) | 3,246 | 0.69 | 0.73 | 2.03 | 40 | |||||||||||||||||||||||||||||||||
| 11.57 | (0.29 | ) | 3,085 | 0.34 | 0.38 | 2.42 | 40 | |||||||||||||||||||||||||||||||||
| 11.56 | (0.69 | ) | 2,330 | 0.84 | 0.88 | 1.89 | 40 | |||||||||||||||||||||||||||||||||
| 11.66 | (2.87 | ) | 10 | 0.19 | (f) | 0.21 | (f) | 5.04 | (f) | 40 | ||||||||||||||||||||||||||||||
| 12.10 | 2.22 | 408,488 | 0.60 | 0.63 | 1.64 | 35 | ||||||||||||||||||||||||||||||||||
| 11.91 | 1.46 | 169,745 | 1.35 | 1.38 | 0.80 | 35 | ||||||||||||||||||||||||||||||||||
| 12.14 | 2.62 | 421,720 | 0.20 | 0.23 | 2.11 | 35 | ||||||||||||||||||||||||||||||||||
| 12.07 | 2.11 | 3,725 | 0.70 | 0.73 | 1.58 | 35 | ||||||||||||||||||||||||||||||||||
| 12.05 | 2.49 | 3,478 | 0.35 | 0.38 | 2.00 | 35 | ||||||||||||||||||||||||||||||||||
| 12.03 | 1.97 | 2,438 | 0.85 | 0.88 | 1.27 | 35 | ||||||||||||||||||||||||||||||||||
| 12.14 | 13.10 | 435,812 | 0.60 | 0.63 | 1.74 | 50 | ||||||||||||||||||||||||||||||||||
| 11.99 | 12.32 | 196,121 | 1.34 | 1.38 | 1.02 | 50 | ||||||||||||||||||||||||||||||||||
| 12.18 | 13.63 | 353,203 | 0.20 | 0.23 | 2.36 | 50 | ||||||||||||||||||||||||||||||||||
| 12.11 | 13.08 | 3,917 | 0.70 | 0.73 | 1.71 | 50 | ||||||||||||||||||||||||||||||||||
| 12.09 | 13.36 | 2,796 | 0.35 | 0.38 | 2.46 | 50 | ||||||||||||||||||||||||||||||||||
| 12.08 | 12.76 | 3,430 | 0.85 | 0.88 | 4.42 | 50 | ||||||||||||||||||||||||||||||||||
| 10.95 | 12.40 | 491,921 | 0.59 | 0.63 | 1.61 | 47 | ||||||||||||||||||||||||||||||||||
| 10.85 | 11.42 | 210,201 | 1.34 | 1.38 | 0.89 | 47 | ||||||||||||||||||||||||||||||||||
| 10.98 | 12.69 | 267,744 | 0.19 | 0.22 | 2.21 | 47 | ||||||||||||||||||||||||||||||||||
| 10.92 | 12.13 | 3,848 | 0.69 | 0.73 | 1.59 | 47 | ||||||||||||||||||||||||||||||||||
| 10.91 | 12.62 | 1,519 | 0.34 | 0.38 | 1.90 | 47 | ||||||||||||||||||||||||||||||||||
| 10.90 | 12.12 | 4,068 | 0.84 | 0.88 | 1.54 | 47 | ||||||||||||||||||||||||||||||||||
| The accompanying notes are an integral part of these financial statements. | 65 |
GOLDMAN SACHS GROWTH STRATEGY PORTFOLIO
Financial Highlights
Selected Data for a Share Outstanding Throughout Each Period
| From investment operations | ||||||||||||||||||||||
| Year - Share Class | Net asset value, beginning of period | Net investment income (loss)(a)(b) | Net realized and unrealized gain (loss) | Total from investment operations | Distributions to shareholders from net investment income | |||||||||||||||||
| FOR THE SIX MONTHS ENDED JUNE 30, (UNAUDITED) | ||||||||||||||||||||||
2017 - A | $ | 13.39 | $ | 0.01 | $ | 1.28 | $ | 1.29 | $ | — | ||||||||||||
2017 - C | 13.37 | (0.04 | ) | 1.28 | 1.24 | — | ||||||||||||||||
2017 - Institutional | 13.37 | 0.04 | 1.28 | 1.32 | — | |||||||||||||||||
2017 - Service | 13.35 | 0.01 | 1.27 | 1.28 | — | |||||||||||||||||
2017 - IR | 13.20 | 0.03 | 1.26 | 1.29 | — | |||||||||||||||||
2017 - R | 13.08 | — | (g) | 1.24 | 1.24 | — | ||||||||||||||||
2017 - R6 | 13.37 | 0.11 | 1.22 | 1.33 | — | |||||||||||||||||
| FOR THE FISCAL YEARS ENDED DECEMBER 31, | ||||||||||||||||||||||
2016 - A | 12.70 | 0.11 | 0.70 | 0.81 | (0.12 | ) | ||||||||||||||||
2016 - C | 12.68 | 0.01 | 0.70 | 0.71 | (0.02 | ) | ||||||||||||||||
2016 - Institutional | 12.69 | 0.17 | 0.69 | 0.86 | (0.18 | ) | ||||||||||||||||
2016 - Service | 12.67 | 0.10 | 0.69 | 0.79 | (0.11 | ) | ||||||||||||||||
2016 - IR | 12.52 | 0.15 | 0.69 | 0.84 | (0.16 | ) | ||||||||||||||||
2016 - R | 12.41 | 0.08 | 0.69 | 0.77 | (0.10 | ) | ||||||||||||||||
2016 - R6 | 12.68 | 0.17 | 0.70 | 0.87 | (0.18 | ) | ||||||||||||||||
2015 - A | 12.91 | 0.15 | (0.16 | ) | (0.01 | ) | (0.20 | ) | ||||||||||||||
2015 - C | 12.88 | 0.05 | (0.15 | ) | (0.10 | ) | (0.10 | ) | ||||||||||||||
2015 - Institutional | 12.90 | 0.22 | (0.17 | ) | 0.05 | (0.26 | ) | |||||||||||||||
2015 - Service | 12.88 | 0.14 | (0.16 | ) | (0.02 | ) | (0.19 | ) | ||||||||||||||
2015 - IR | 12.73 | 0.19 | (0.16 | ) | 0.03 | (0.24 | ) | |||||||||||||||
2015 - R | 12.62 | 0.12 | (0.16 | ) | (0.04 | ) | (0.17 | ) | ||||||||||||||
2015 - R6 (Commenced July 31, 2015) | 13.44 | 0.18 | (0.68 | ) | (0.50 | ) | (0.26 | ) | ||||||||||||||
2014 - A | 12.89 | 0.19 | 0.12 | 0.31 | (0.29 | ) | ||||||||||||||||
2014 - C | 12.85 | 0.07 | 0.13 | 0.20 | (0.17 | ) | ||||||||||||||||
2014 - Institutional | 12.88 | 0.24 | 0.12 | 0.36 | (0.34 | ) | ||||||||||||||||
2014 - Service | 12.84 | 0.15 | 0.15 | 0.30 | (0.26 | ) | ||||||||||||||||
2014 - IR | 12.72 | 0.25 | 0.08 | 0.33 | (0.32 | ) | ||||||||||||||||
2014 - R | 12.59 | 0.11 | 0.15 | 0.26 | (0.23 | ) | ||||||||||||||||
2013 - A | 11.05 | 0.14 | 1.88 | 2.02 | (0.18 | ) | ||||||||||||||||
2013 - C | 11.02 | 0.05 | 1.86 | 1.91 | (0.08 | ) | ||||||||||||||||
2013 - Institutional | 11.04 | 0.21 | 1.87 | 2.08 | (0.24 | ) | ||||||||||||||||
2013 - Service | 11.01 | 0.14 | 1.86 | 2.00 | (0.17 | ) | ||||||||||||||||
2013 - IR | 10.91 | 0.26 | 1.77 | 2.03 | (0.22 | ) | ||||||||||||||||
2013 - R | 10.80 | 0.10 | 1.84 | 1.94 | (0.15 | ) | ||||||||||||||||
2012 - A | 9.86 | 0.18 | 1.25 | 1.43 | (0.24 | ) | ||||||||||||||||
2012 - C | 9.83 | 0.10 | 1.25 | 1.35 | (0.16 | ) | ||||||||||||||||
2012 - Institutional | 9.87 | 0.23 | 1.24 | 1.47 | (0.30 | ) | ||||||||||||||||
2012 - Service | 9.83 | 0.17 | 1.25 | 1.42 | (0.24 | ) | ||||||||||||||||
2012 - IR | 9.75 | 0.22 | 1.22 | 1.44 | (0.28 | ) | ||||||||||||||||
2012 - R | 9.65 | 0.17 | 1.21 | 1.38 | (0.23 | ) | ||||||||||||||||
| (a) | Calculated based on the average shares outstanding methodology. |
| (b) | Recognition of net investment income by the Portfolio is affected by the timing of declaration of dividends by the Underlying Funds in which the Portfolio invests. |
| (c) | Assumes investment at the NAV at the beginning of the period, reinvestment of all dividends and distributions, a complete redemption of the investment at the NAV at the end of the period and no sales or redemption charges. Total returns would be reduced if a sales or redemption charge was taken into account. Returns do not reflect the impact of taxes to shareholder relating to Portfolio distributions or the redemption of Portfolio shares. Total returns for periods less than one full year are not annualized. |
| (d) | Expense ratios exclude the expenses of the Underlying Funds in which the Portfolio invests. |
| (e) | The Portfolio’s portfolio turnover rate is calculated in accordance with regulatory requirements, without regard to transactions involving short term investments and certain derivatives. If such transactions were included, the Portfolio’s portfolio turnover rate may be higher. |
| (f) | Annualized. |
| (g) | Amount is less than $0.005 per share. |
| 66 | The accompanying notes are an integral part of these financial statements. |
GOLDMAN SACHS GROWTH STRATEGY PORTFOLIO
| Net asset value, end of period | Total return(c) | Net assets, end of period (in 000s) | Ratio of net expenses to average net assets(d) | Ratio of total expenses to average net assets(d) | Ratio of net investment income (loss) to average net assets(b) | Portfolio turnover rate(e) | ||||||||||||||||||||||||||||||||||
| $ | 14.68 | 9.63 | % | $ | 309,554 | 0.59 | %(f) | 0.63 | %(f) | 0.17 | %(f) | 63 | % | |||||||||||||||||||||||||||
| 14.61 | 9.27 | 123,568 | 1.34 | (f) | 1.38 | (f) | (0.61 | )(f) | 63 | |||||||||||||||||||||||||||||||
| 14.69 | 9.87 | 398,504 | 0.19 | (f) | 0.23 | (f) | 0.59 | (f) | 63 | |||||||||||||||||||||||||||||||
| 14.63 | 9.59 | 2,559 | 0.69 | (f) | 0.73 | (f) | 0.09 | (f) | 63 | |||||||||||||||||||||||||||||||
| 14.49 | 9.77 | 5,565 | 0.34 | (f) | 0.38 | (f) | 0.46 | (f) | 63 | |||||||||||||||||||||||||||||||
| 14.32 | 9.48 | 5,098 | 0.84 | (f) | 0.88 | (f) | 0.04 | (f) | 63 | |||||||||||||||||||||||||||||||
| 14.70 | 9.95 | 2,542 | 0.18 | (f) | 0.21 | (f) | 1.46 | (f) | 63 | |||||||||||||||||||||||||||||||
| 13.39 | 6.38 | 301,331 | 0.59 | 0.65 | 0.83 | 59 | ||||||||||||||||||||||||||||||||||
| 13.37 | 5.57 | 144,292 | 1.34 | 1.40 | 0.08 | 59 | ||||||||||||||||||||||||||||||||||
| 13.37 | 6.76 | 335,237 | 0.19 | 0.25 | 1.33 | 59 | ||||||||||||||||||||||||||||||||||
| 13.35 | 6.26 | 2,237 | 0.69 | 0.75 | 0.81 | 59 | ||||||||||||||||||||||||||||||||||
| 13.20 | 6.70 | 4,352 | 0.34 | 0.40 | 1.18 | 59 | ||||||||||||||||||||||||||||||||||
| 13.08 | 6.16 | 2,548 | 0.84 | 0.90 | 0.65 | 59 | ||||||||||||||||||||||||||||||||||
| 13.37 | 6.76 | 10 | 0.19 | 0.25 | 1.33 | 59 | ||||||||||||||||||||||||||||||||||
| 12.70 | (0.08 | ) | 336,880 | 0.59 | 0.64 | 1.15 | 38 | |||||||||||||||||||||||||||||||||
| 12.68 | (0.82 | ) | 161,733 | 1.34 | 1.39 | 0.39 | 38 | |||||||||||||||||||||||||||||||||
| 12.69 | 0.35 | 303,237 | 0.19 | 0.23 | 1.68 | 38 | ||||||||||||||||||||||||||||||||||
| 12.67 | (0.17 | ) | 2,135 | 0.69 | 0.74 | 1.09 | 38 | |||||||||||||||||||||||||||||||||
| 12.52 | 0.20 | 4,114 | 0.34 | 0.39 | 1.50 | 38 | ||||||||||||||||||||||||||||||||||
| 12.41 | (0.31 | ) | 2,323 | 0.84 | 0.89 | 0.95 | 38 | |||||||||||||||||||||||||||||||||
| 12.68 | (3.66 | ) | 10 | 0.21 | (f) | 0.25 | (f) | 3.22 | (f) | 38 | ||||||||||||||||||||||||||||||
| 12.91 | 2.36 | 385,409 | 0.60 | 0.64 | 1.46 | 26 | ||||||||||||||||||||||||||||||||||
| 12.88 | 1.59 | 190,125 | 1.35 | 1.39 | 0.57 | 26 | ||||||||||||||||||||||||||||||||||
| 12.90 | 2.76 | 267,677 | 0.20 | 0.24 | 1.84 | 26 | ||||||||||||||||||||||||||||||||||
| 12.88 | 2.32 | 2,509 | 0.70 | 0.74 | 1.11 | 26 | ||||||||||||||||||||||||||||||||||
| 12.73 | 2.58 | 4,496 | 0.35 | 0.39 | 1.92 | 26 | ||||||||||||||||||||||||||||||||||
| 12.62 | 2.06 | 2,461 | 0.85 | 0.89 | 0.84 | 26 | ||||||||||||||||||||||||||||||||||
| 12.89 | 18.31 | 389,445 | 0.60 | 0.64 | 1.19 | 32 | ||||||||||||||||||||||||||||||||||
| 12.85 | 17.37 | 218,776 | 1.35 | 1.39 | 0.42 | 32 | ||||||||||||||||||||||||||||||||||
| 12.88 | 18.81 | 246,229 | 0.20 | 0.24 | 1.77 | 32 | ||||||||||||||||||||||||||||||||||
| 12.84 | 18.19 | 3,419 | 0.70 | 0.74 | 1.14 | 32 | ||||||||||||||||||||||||||||||||||
| 12.72 | 18.65 | 3,598 | 0.35 | 0.39 | 2.17 | 32 | ||||||||||||||||||||||||||||||||||
| 12.59 | 17.93 | 4,208 | 0.85 | 0.89 | 0.84 | 32 | ||||||||||||||||||||||||||||||||||
| 11.05 | 14.49 | 398,487 | 0.59 | 0.64 | 1.65 | 47 | ||||||||||||||||||||||||||||||||||
| 11.02 | 13.72 | 224,471 | 1.34 | 1.39 | 0.92 | 47 | ||||||||||||||||||||||||||||||||||
| 11.04 | 14.89 | 173,180 | 0.19 | 0.23 | 2.10 | 47 | ||||||||||||||||||||||||||||||||||
| 11.01 | 14.42 | 3,185 | 0.69 | 0.74 | 1.60 | 47 | ||||||||||||||||||||||||||||||||||
| 10.91 | 14.79 | 1,483 | 0.34 | 0.38 | 2.05 | 47 | ||||||||||||||||||||||||||||||||||
| 10.80 | 14.31 | 4,885 | 0.84 | 0.88 | 1.64 | 47 | ||||||||||||||||||||||||||||||||||
| The accompanying notes are an integral part of these financial statements. | 67 |
GOLDMAN SACHS SATELLITE STRATEGIES PORTFOLIO
Financial Highlights
Selected Data for a Share Outstanding Throughout Each Period
| From investment operations | Distributions to shareholders | |||||||||||||||||||||||||||||||||
| Year - Share Class | Net asset value, beginning of period | Net investment income(a)(b) | Net realized and unrealized gain (loss) | Total from investment operations | From net investment income | From net realized gains | From capital | Total distributions | ||||||||||||||||||||||||||
| FOR THE SIX MONTHS ENDED JUNE 30, (UNAUDITED) | ||||||||||||||||||||||||||||||||||
2017 - A | $ | 7.64 | $ | 0.08 | $ | 0.46 | $ | 0.54 | $ | (0.08 | ) | $ | — | $ | — | $ | (0.08 | ) | ||||||||||||||||
2017 - C | 7.60 | 0.05 | 0.45 | 0.50 | (0.05 | ) | — | — | (0.05 | ) | ||||||||||||||||||||||||
2017 - Institutional | 7.62 | 0.10 | 0.46 | 0.56 | (0.10 | ) | — | — | (0.10 | ) | ||||||||||||||||||||||||
2017 - Service | 7.63 | 0.08 | 0.46 | 0.54 | (0.08 | ) | — | — | (0.08 | ) | ||||||||||||||||||||||||
2017 - IR | 7.62 | 0.09 | 0.46 | 0.55 | (0.09 | ) | — | — | (0.09 | ) | ||||||||||||||||||||||||
2017 - R | 7.61 | 0.07 | 0.45 | 0.52 | (0.07 | ) | — | — | (0.07 | ) | ||||||||||||||||||||||||
2017 - R6 | 7.63 | 0.10 | 0.46 | 0.56 | (0.10 | ) | — | — | (0.10 | ) | ||||||||||||||||||||||||
| FOR THE FISCAL YEARS ENDED DECEMBER 31, | ||||||||||||||||||||||||||||||||||
2016 - A | 7.45 | 0.20 | 0.24 | 0.44 | (0.25 | ) | — | — | (g) | (0.25 | ) | |||||||||||||||||||||||
2016 - C | 7.41 | 0.15 | 0.23 | 0.38 | (0.19 | ) | — | — | (g) | (0.19 | ) | |||||||||||||||||||||||
2016 - Institutional | 7.43 | 0.23 | 0.24 | 0.47 | (0.28 | ) | — | — | (g) | (0.28 | ) | |||||||||||||||||||||||
2016 - Service | 7.43 | 0.18 | 0.26 | 0.44 | (0.24 | ) | — | — | (g) | (0.24 | ) | |||||||||||||||||||||||
2016 - IR | 7.43 | 0.23 | 0.23 | 0.46 | (0.27 | ) | — | — | (g) | (0.27 | ) | |||||||||||||||||||||||
2016 - R | 7.42 | 0.19 | 0.23 | 0.42 | (0.23 | ) | — | — | (g) | (0.23 | ) | |||||||||||||||||||||||
2016 - R6 | 7.44 | 0.63 | (0.15 | ) | 0.48 | (0.28 | ) | — | (0.01 | ) | (0.29 | ) | ||||||||||||||||||||||
2015 - A | 7.89 | 0.19 | (0.44 | ) | (0.25 | ) | (0.19 | ) | — | — | (0.19 | ) | ||||||||||||||||||||||
2015 - C | 7.84 | 0.13 | (0.43 | ) | (0.30 | ) | (0.13 | ) | — | — | (0.13 | ) | ||||||||||||||||||||||
2015 - Institutional | 7.87 | 0.23 | (0.45 | ) | (0.22 | ) | (0.22 | ) | — | — | (0.22 | ) | ||||||||||||||||||||||
2015 - Service | 7.84 | 0.14 | (0.40 | ) | (0.26 | ) | (0.15 | ) | — | — | (0.15 | ) | ||||||||||||||||||||||
2015 - IR | 7.87 | 0.21 | (0.44 | ) | (0.23 | ) | (0.21 | ) | — | — | (0.21 | ) | ||||||||||||||||||||||
2015 - R | 7.86 | 0.18 | (0.45 | ) | (0.27 | ) | (0.17 | ) | — | — | (0.17 | ) | ||||||||||||||||||||||
2015 - R6 (Commenced July 31, 2015) | 7.91 | 0.11 | (0.46 | ) | (0.35 | ) | (0.12 | ) | — | — | (0.12 | ) | ||||||||||||||||||||||
2014 - A | 8.16 | 0.21 | (0.23 | ) | (0.02 | ) | (0.21 | ) | (0.04 | ) | — | (0.25 | ) | |||||||||||||||||||||
2014 - C | 8.12 | 0.15 | (0.24 | ) | (0.09 | ) | (0.15 | ) | (0.04 | ) | — | (0.19 | ) | |||||||||||||||||||||
2014 - Institutional | 8.15 | 0.25 | (0.24 | ) | 0.01 | (0.25 | ) | (0.04 | ) | — | (0.29 | ) | ||||||||||||||||||||||
2014 - Service | 8.12 | 0.19 | (0.22 | ) | (0.03 | ) | (0.21 | ) | (0.04 | ) | — | (0.25 | ) | |||||||||||||||||||||
2014 - IR | 8.15 | 0.23 | (0.24 | ) | (0.01 | ) | (0.23 | ) | (0.04 | ) | — | (0.27 | ) | |||||||||||||||||||||
2014 - R | 8.13 | 0.18 | (0.22 | ) | (0.04 | ) | (0.19 | ) | (0.04 | ) | — | (0.23 | ) | |||||||||||||||||||||
2013 - A | 8.22 | 0.25 | (0.04 | ) | 0.21 | (0.27 | ) | — | — | (0.27 | ) | |||||||||||||||||||||||
2013 - C | 8.18 | 0.19 | (0.04 | ) | 0.15 | (0.21 | ) | — | — | (0.21 | ) | |||||||||||||||||||||||
2013 - Institutional | 8.21 | 0.29 | (0.04 | ) | 0.25 | (0.31 | ) | — | — | (0.31 | ) | |||||||||||||||||||||||
2013 - Service | 8.19 | 0.24 | (0.04 | ) | 0.20 | (0.27 | ) | — | — | (0.27 | ) | |||||||||||||||||||||||
2013 - IR | 8.21 | 0.28 | (0.04 | ) | 0.24 | (0.30 | ) | — | — | (0.30 | ) | |||||||||||||||||||||||
2013 - R | 8.19 | 0.24 | (0.04 | ) | 0.20 | (0.26 | ) | — | — | (0.26 | ) | |||||||||||||||||||||||
2012 - A | 7.39 | 0.33 | 0.86 | 1.19 | (0.34 | ) | (0.02 | ) | — | (0.36 | ) | |||||||||||||||||||||||
2012 - C | 7.36 | 0.26 | 0.86 | 1.12 | (0.28 | ) | (0.02 | ) | — | (0.30 | ) | |||||||||||||||||||||||
2012 - Institutional | 7.38 | 0.36 | 0.86 | 1.22 | (0.37 | ) | (0.02 | ) | — | (0.39 | ) | |||||||||||||||||||||||
2012 - Service | 7.36 | 0.32 | 0.87 | 1.19 | (0.34 | ) | (0.02 | ) | — | (0.36 | ) | |||||||||||||||||||||||
2012 - IR | 7.38 | 0.35 | 0.86 | 1.21 | (0.36 | ) | (0.02 | ) | — | (0.38 | ) | |||||||||||||||||||||||
2012 - R | 7.37 | 0.31 | 0.86 | 1.17 | (0.33 | ) | (0.02 | ) | — | (0.35 | ) | |||||||||||||||||||||||
| (a) | Calculated based on the average shares outstanding methodology. |
| (b) | Recognition of net investment income by the Portfolio is affected by the timing of declaration of dividends by the Underlying Funds in which the Portfolio invests. |
| (c) | Assumes investment at the NAV at the beginning of the period, reinvestment of all dividends and distributions, a complete redemption of the investment at the NAV at the end of the period and no sales or redemption charges. Total returns would be reduced if a sales or redemption charge was taken into account. Returns do not reflect the impact of taxes to shareholder relating to Portfolio distributions or the redemption of Portfolio shares. Total returns for periods less than one full year are not annualized. |
| (d) | Expense ratios exclude the expenses of the Underlying Funds in which the Portfolio invests. |
| (e) | The Portfolio’s portfolio turnover rate is calculated in accordance with regulatory requirements, without regard to transactions involving short term investments. If such transactions were included, the Portfolio’s portfolio turnover rate may be higher. |
| (f) | Annualized. |
| (g) | Amount is less than $0.005 per share. |
| 68 | The accompanying notes are an integral part of these financial statements. |
GOLDMAN SACHS SATELLITE STRATEGIES PORTFOLIO
| Net asset value, end of period | Total return(c) | Net assets, end of period (in 000s) | Ratio of net expenses to average net assets(d) | Ratio of total expenses to average net assets(d) | Ratio of net investment income to average net assets(b) | Portfolio turnover rate(e) | ||||||||||||||||||||||||||||||||||
| $ | 8.10 | 7.08 | % | $ | 63,303 | 0.57 | %(f) | 0.61 | %(f) | 1.99 | %(f) | 51 | % | |||||||||||||||||||||||||||
| 8.05 | 6.60 | 46,940 | 1.32 | (f) | 1.36 | (f) | 1.29 | (f) | 51 | |||||||||||||||||||||||||||||||
| 8.08 | 7.31 | 500,137 | 0.17 | (f) | 0.21 | (f) | 2.46 | (f) | 51 | |||||||||||||||||||||||||||||||
| 8.09 | 7.04 | 379 | 0.67 | (f) | 0.71 | (f) | 1.95 | (f) | 51 | |||||||||||||||||||||||||||||||
| 8.08 | 7.23 | 55,064 | 0.32 | (f) | 0.36 | (f) | 2.31 | (f) | 51 | |||||||||||||||||||||||||||||||
| 8.06 | 6.86 | 2,633 | 0.82 | (f) | 0.86 | (f) | 1.82 | (f) | 51 | |||||||||||||||||||||||||||||||
| 8.09 | 7.31 | 35,915 | 0.15 | (f) | 0.19 | (f) | 2.50 | (f) | 51 | |||||||||||||||||||||||||||||||
| 7.64 | 5.92 | 84,529 | 0.57 | 0.61 | 2.62 | 22 | ||||||||||||||||||||||||||||||||||
| 7.60 | 5.17 | 53,575 | 1.32 | 1.36 | 1.94 | 22 | ||||||||||||||||||||||||||||||||||
| 7.62 | 6.38 | 509,681 | 0.17 | 0.21 | 3.08 | 22 | ||||||||||||||||||||||||||||||||||
| 7.63 | 5.92 | 408 | 0.67 | 0.71 | 2.40 | 22 | ||||||||||||||||||||||||||||||||||
| 7.62 | 6.22 | 58,740 | 0.32 | 0.36 | 3.02 | 22 | ||||||||||||||||||||||||||||||||||
| 7.61 | 5.71 | 2,788 | 0.82 | 0.86 | 2.49 | 22 | ||||||||||||||||||||||||||||||||||
| 7.63 | 6.40 | 33,805 | 0.15 | 0.17 | 8.15 | 22 | ||||||||||||||||||||||||||||||||||
| 7.45 | (3.24 | ) | 118,345 | 0.57 | 0.60 | 2.43 | 22 | |||||||||||||||||||||||||||||||||
| 7.41 | (3.89 | ) | 68,765 | 1.32 | 1.35 | 1.66 | 22 | |||||||||||||||||||||||||||||||||
| 7.43 | (2.84 | ) | 655,268 | 0.17 | 0.20 | 2.85 | 22 | |||||||||||||||||||||||||||||||||
| 7.43 | (3.32 | ) | 988 | 0.67 | 0.70 | 1.81 | 22 | |||||||||||||||||||||||||||||||||
| 7.43 | (2.99 | ) | 67,547 | 0.32 | 0.35 | 2.69 | 22 | |||||||||||||||||||||||||||||||||
| 7.42 | (3.49 | ) | 3,119 | 0.82 | 0.85 | 2.24 | 22 | |||||||||||||||||||||||||||||||||
| 7.44 | (4.43 | ) | 10 | 0.15 | (f) | 0.18 | (f) | 3.58 | (f) | 22 | ||||||||||||||||||||||||||||||
| 7.89 | (0.28 | ) | 177,204 | 0.58 | 0.60 | 2.50 | 20 | |||||||||||||||||||||||||||||||||
| 7.84 | (1.16 | ) | 102,605 | 1.33 | 1.35 | 1.79 | 20 | |||||||||||||||||||||||||||||||||
| 7.87 | — | (g) | 833,657 | 0.18 | 0.20 | 2.97 | 20 | |||||||||||||||||||||||||||||||||
| 7.84 | (0.39 | ) | 14,085 | 0.68 | 0.70 | 2.30 | 20 | |||||||||||||||||||||||||||||||||
| 7.87 | (0.15 | ) | 86,018 | 0.33 | 0.35 | 2.78 | 20 | |||||||||||||||||||||||||||||||||
| 7.86 | (0.54 | ) | 3,495 | 0.83 | 0.85 | 2.23 | 20 | |||||||||||||||||||||||||||||||||
| 8.16 | 2.67 | 231,868 | 0.58 | 0.60 | 3.08 | 36 | ||||||||||||||||||||||||||||||||||
| 8.12 | 1.91 | 118,153 | 1.33 | 1.35 | 2.35 | 36 | ||||||||||||||||||||||||||||||||||
| 8.15 | 3.09 | 853,543 | 0.18 | 0.20 | 3.53 | 36 | ||||||||||||||||||||||||||||||||||
| 8.12 | 2.45 | 28,483 | 0.68 | 0.70 | 2.96 | 36 | ||||||||||||||||||||||||||||||||||
| 8.15 | 2.94 | 91,493 | 0.33 | 0.35 | 3.39 | 36 | ||||||||||||||||||||||||||||||||||
| 8.13 | 2.44 | 3,765 | 0.83 | 0.85 | 2.91 | 36 | ||||||||||||||||||||||||||||||||||
| 8.22 | 16.30 | 250,407 | 0.57 | 0.60 | 4.13 | 14 | ||||||||||||||||||||||||||||||||||
| 8.18 | 15.37 | 130,446 | 1.32 | 1.35 | 3.32 | 14 | ||||||||||||||||||||||||||||||||||
| 8.21 | 16.77 | 803,541 | 0.17 | 0.20 | 4.56 | 14 | ||||||||||||||||||||||||||||||||||
| 8.19 | 16.26 | 37,068 | 0.67 | 0.70 | 4.04 | 14 | ||||||||||||||||||||||||||||||||||
| 8.21 | 16.60 | 74,216 | 0.32 | 0.35 | 4.37 | 14 | ||||||||||||||||||||||||||||||||||
| 8.19 | 15.96 | 2,804 | 0.82 | 0.85 | 3.86 | 14 | ||||||||||||||||||||||||||||||||||
| The accompanying notes are an integral part of these financial statements. | 69 |
GOLDMAN SACHS FUND OF FUNDS PORTFOLIOS
June 30, 2017 (Unaudited)
| 1. ORGANIZATION |
Goldman Sachs Trust (the “Trust”) is a Delaware statutory trust registered under the Investment Company Act of 1940, as amended (the “Act”), as an open-end management investment company. The following table lists those series of the Trust that are included in this report (collectively, the “Portfolios” or individually a “Portfolio”), along with their corresponding share classes and respective diversification status under the Act:
| Portfolio | Share Classes Offered | Diversified/ Non-diversified | ||
All Portfolios | A, C, Institutional, Service, IR, R, R6 | Diversified |
Class A Shares are sold with a front-end sales charge of up to 5.50%. Class C Shares are sold with a contingent deferred sales charge (“CDSC”) of 1.00%, which is imposed on redemptions made within 12 months of purchase. Institutional, Service, Class IR, Class R and Class R6 Shares are not subject to a sales charge.
Goldman Sachs Asset Management, L.P. (“GSAM”), an affiliate of Goldman Sachs & Co. LLC (formerly Goldman, Sachs & Co.) (“Goldman Sachs”), serves as investment adviser to the Portfolios pursuant to a management agreement (the “Agreement”) with the Trust.
The Portfolios are expected to invest primarily in a combination of domestic and international equity and fixed income underlying funds (“Underlying Funds”) which are registered under the Act, for which GSAM or Goldman Sachs Asset Management International (“GSAMI”), also an affiliate of Goldman Sachs, act as investment advisers.
| 2. SIGNIFICANT ACCOUNTING POLICIES |
The financial statements have been prepared in accordance with accounting principles generally accepted in the United States of America (“GAAP”) and require management to make estimates and assumptions that may affect the reported amounts and disclosures. Actual results may differ from those estimates and assumptions.
A. Investment Valuation — The valuation policy of the Portfolios and Underlying Funds is to value investments at fair value.
B. Investment Income and Investments — Investment income includes interest income, dividend income and securities lending income. Interest income is accrued daily and adjusted for amortization of premiums and accretion of discounts. Dividend income is recognized on ex-dividend date or, for certain foreign securities, as soon as such information is obtained subsequent to the ex-dividend date. Investment transactions are reflected on trade date. Realized gains and losses are calculated using identified cost. Investment transactions are recorded on the following business day for daily net asset value (“NAV”) calculations. Income distributions are recognized as capital gains or income in the financial statements in accordance with the character that is distributed.
For derivative contracts, realized gains and losses are recorded upon settlement of the contract. Upfront payments, if any, are made or received upon entering into a swap agreement and are reflected in the Statements of Assets and Liabilities. Upfront payments are recognized over the contract’s term/event as realized gains or losses, with the exception of forward starting interest rate swaps whose realized gains or losses are recognized from the effective start date.
C. Class Allocations and Expenses — Investment income, realized and unrealized gain (loss), and non-class specific expenses of each Portfolio are allocated daily based upon the proportion of net assets of each class. Non-class specific expenses directly incurred by a Portfolio are charged to that Portfolio, while such expenses incurred by the Trust are allocated across the applicable Portfolios on a straight-line and/or pro-rata basis depending upon the nature of the expenses. Class specific expenses, where applicable, are borne by the respective share classes and include Distribution and Service, Transfer Agency and Service and Shareholder Administration fees.
Expenses included in the accompanying financial statements reflect the expenses of each Portfolio and do not include any expenses associated with the Underlying Funds (“Underlying Funds”). Because the Underlying Funds have varied expense and fee levels and the Portfolios may own different proportions of the Underlying Funds at different times, the amount of fees and expenses incurred indirectly by each Portfolio will vary.
70
GOLDMAN SACHS FUND OF FUNDS PORTFOLIOS
| 2. SIGNIFICANT ACCOUNTING POLICIES (continued) |
D. Federal Taxes and Distributions to Shareholders — It is each Portfolio’s policy to comply with the requirements of the Internal Revenue Code of 1986, as amended (the “Code”), applicable to regulated investment companies (mutual funds) and to distribute each year substantially all of its investment company taxable income and capital gains to its shareholders. Accordingly, the Portfolios are not required to make any provisions for the payment of federal income tax. Distributions to shareholders are recorded on the ex-dividend date. Income and capital gains distributions, if any, are declared and paid according to the following schedule:
| Portfolio | Income Distributions Declared/Paid | Capital Gains Distributions Declared/Paid | ||||
Balanced Strategy, Growth and Income Strategy and Satellite Strategies | Quarterly | Annually | ||||
Equity Growth Strategy and Growth Strategy | Annually | Annually |
Net capital losses, if any, are carried forward to future fiscal years and may be used to the extent allowed by the Code to offset any future capital gains. Losses that are carried forward will retain their character as either short-term or long-term capital losses. Utilization of capital loss carryforwards will reduce the requirement of future capital gains distributions.
The characterization of distributions to shareholders for financial reporting purposes is determined in accordance with federal income tax rules, which may differ from GAAP. The source of each Portfolio’s distributions may be shown in the accompanying financial statements as either from net investment income, net realized gain or capital. Certain components of the Portfolios’ net assets on the Statements of Assets and Liabilities reflect permanent GAAP/tax differences based on the appropriate tax character.
E. Foreign Currency Translation — The accounting records and reporting currency of the Portfolios are maintained in U.S. dollars. Assets and liabilities denominated in foreign currencies are translated into U.S. dollars using the current exchange rates at the close of each business day. The effect of changes in foreign currency exchange rates on investments is included within net realized and unrealized gain (loss) on investments. Changes in the value of other assets and liabilities as a result of fluctuations in foreign exchange rates are included in the Statements of Operations within net change in unrealized gain (loss) on foreign currency translations. Transactions denominated in foreign currencies are translated into U.S. dollars on the date the transaction occurred, the effects of which are included within net realized gain (loss) on foreign currency transactions.
| 3. INVESTMENTS AND FAIR VALUE MEASUREMENTS |
U.S. GAAP defines the fair value of a financial instrument as the amount that would be received to sell an asset or paid to transfer a liability in an orderly transaction between market participants at the measurement date (i.e., the exit price); the Portfolios’ policy is to use the market approach. GAAP establishes a fair value hierarchy that prioritizes the inputs to valuation techniques used to measure fair value. The hierarchy gives the highest priority to unadjusted quoted prices in active markets for identical assets or liabilities (Level 1 measurements) and the lowest priority to unobservable inputs (Level 3 measurements). The levels used for classifying investments are not necessarily an indication of the risk associated with investing in these investments. The three levels of the fair value hierarchy are described below:
Level 1 — Unadjusted quoted prices in active markets that are accessible at the measurement date for identical, unrestricted assets or liabilities;
Level 2 — Quoted prices in markets that are not active or financial instruments for which significant inputs are observable (including, but not limited to, quoted prices for similar investments, interest rates, foreign exchange rates, volatility and credit spreads), either directly or indirectly;
Level 3 — Prices or valuations that require significant unobservable inputs (including GSAM’s assumptions in determining fair value measurement).
Changes in valuation techniques may result in transfers into or out of an assigned level within the hierarchy. In accordance with the Portfolios’ policy, transfers between different levels of the fair value hierarchy resulting from such changes are deemed to have occurred as of the beginning of the reporting period.
71
GOLDMAN SACHS FUND OF FUNDS PORTFOLIOS
Notes to Financial Statements (continued)
June 30, 2017 (Unaudited)
| 3. INVESTMENTS AND FAIR VALUE MEASUREMENTS (continued) |
The Board of Trustees (“Trustees”) has approved Valuation Procedures that govern the valuation of the portfolio investments held by the Portfolios, including investments for which market quotations are not readily available. The Trustees have delegated to GSAM day-to-day responsibility for implementing and maintaining internal controls and procedures related to the valuation of the Portfolios’ portfolio investments. To assess the continuing appropriateness of pricing sources and methodologies, GSAM regularly performs price verification procedures and issues challenges as necessary to third party pricing vendors or brokers, and any differences are reviewed in accordance with the Valuation Procedures.
A. Level 1 and Level 2 Fair Value Investments — The valuation techniques and significant inputs used in determining the fair values for investments classified as Level 1 and Level 2 are as follows:
Underlying Funds (including Money Market Funds) — Underlying Funds (“Underlying Funds”) include other investment companies and exchange-traded funds (“ETFs”). Investments in the Underlying Funds (except ETFs) are valued at the NAV per share of the Institutional Share class on the day of valuation. ETFs are valued daily at the last sale price or official closing price on the principal exchange or system on which the investment is traded. Because the Portfolios invest in Underlying Funds that fluctuate in value, the Portfolios’ shares will correspondingly fluctuate in value. To the extent these investments are actively traded, they are classified as Level 1 of the fair value hierarchy, otherwise they are generally classified as Level 2. For information regarding an Underlying Fund’s accounting policies and investment holdings, please see the Underlying Fund’s shareholder report.
Derivative Contracts — A derivative is an instrument whose value is derived from underlying assets, indices, reference rates or a combination of these factors. A Portfolio enters into derivative transactions to hedge against changes in interest rates, securities prices, and/or currency exchange rates, to increase total return, or to gain access to certain markets or attain exposure to other underliers.
Exchange-traded derivatives, including futures and options contracts, are valued at the last sale or settlement price and typically fall within Level 1 of the fair value hierarchy. Over-the-counter (“OTC”) and centrally cleared derivatives are valued using market transactions and other market evidence, including market-based inputs to models, calibration to market-clearing transactions, broker or dealer quotations, or other alternative pricing sources. Where models are used, the selection of a particular model to value OTC and centrally cleared derivatives depends upon the contractual terms of, and specific risks inherent in, the instrument, as well as the availability of pricing information in the market. Valuation models require a variety of inputs, including contractual terms, market prices, yield curves, credit curves, measures of volatility, voluntary and involuntary prepayment rates, loss severity rates and correlations of such inputs. For OTC and centrally cleared derivatives that trade in liquid markets, model inputs can generally be verified and model selection does not involve significant management judgment. OTC and centrally cleared derivatives are classified within Level 2 of the fair value hierarchy when significant inputs are corroborated by market evidence.
i. Forward Contracts — A forward contract is a contract between two parties to buy or sell an asset at a specified price on a future date. A forward contract settlement can occur on a cash or delivery basis. Forward contracts are marked-to-market daily using independent vendor prices, and the change in value, if any, is recorded as an unrealized gain or loss. Cash and certain investments may be used to collateralize forward contracts.
A forward foreign currency contract is a forward contract in which a Portfolio agrees to receive or deliver a fixed quantity of one currency for another, at a pre-determined price at a future date. All forward foreign currency exchange contracts are marked-to-market daily at the applicable forward rate. Non-deliverable forward foreign currency exchange contracts are settled with the counterparty in cash without the delivery of foreign currency.
ii. Futures Contracts — Futures contracts are contracts to buy or sell a standardized quantity of a specified commodity or security and are valued based on exchanged settlement prices or independent market quotes. Futures contracts are valued at the last settlement price, or in the absence of a sale, the last bid price for long positions and at the last ask price for short positions, at the end of each day on the board of trade or exchange upon which they are traded. Upon entering into a futures contract, a Portfolio deposits cash or securities in an account on behalf of the broker in an amount sufficient to meet the initial margin requirement. Subsequent payments are made or received by a Portfolio equal to the daily change in the contract value and are recorded as variation margin receivable or payable with a corresponding offset to unrealized gains or losses. For
72
GOLDMAN SACHS FUND OF FUNDS PORTFOLIOS
| 3. INVESTMENTS AND FAIR VALUE MEASUREMENTS (continued) |
financial reporting purposes, cash collateral that has been pledged to cover obligations of a Portfolio and cash collateral received, if any, is reported separately on the Statements of Assets and Liabilities as receivables/payables for collateral on certain derivatives contracts. Non-cash collateral pledged by a Portfolio, if any, is noted in the Schedules of Investments.
iii. Options — When a Portfolio writes call or put options, an amount equal to the premium received is recorded as a liability and is subsequently marked-to-market to reflect the current value of the option written. Swaptions are options on interest rate swap contracts.
Upon the purchase of a call option or a put option by a Portfolio, the premium paid is recorded as an investment and subsequently marked-to-market to reflect the current value of the option. Certain options may be purchased with premiums to be determined on a future date. The premiums for these options are based upon implied volatility parameters at specified terms.
iv. Swap Contracts — Bilateral swap contracts are agreements in which a Portfolio and a counterparty agree to exchange periodic payments on a specified notional amount or make a net payment upon termination. Bilateral swap transactions are privately negotiated in the OTC market and payments are settled through direct payments between a Portfolio and the counterparty. By contrast, certain swap transactions are subject to mandatory central clearing. These swaps are executed through a derivatives clearing member (“DCM”), acting in an agency capacity, and submitted to a central counterparty (“CCP”) (“centrally cleared swaps”), in which case all payments are settled with the CCP through the DCM. Swaps are marked-to-market daily using pricing vendor quotations, counterparty or clearinghouse prices or model prices, and the change in value, if any, is recorded as an unrealized gain or loss. Upon entering into a swap contract, a Portfolio is required to satisfy an initial margin requirement by delivering cash or securities to the counterparty (or in some cases, segregated in a triparty account on behalf of the counterparty), which can be adjusted by any mark-to-market gains or losses pursuant to bilateral or centrally cleared arrangements. For centrally cleared swaps the daily change in valuation, if any, is recorded as a receivable or payable for variation margin.
A credit default swap is an agreement that involves one party (the buyer of protection) making a stream of payments to another party (the seller of protection) in exchange for the right to receive protection on a reference security or obligation, including a group of assets or exposure to the performance of an index. A Portfolio’s investment in credit default swaps may involve greater risks than if the Portfolio had invested in the referenced obligation directly. Credit events are contract specific but may include bankruptcy, failure to pay, restructuring and obligation acceleration. If a Portfolio buys protection through a credit default swap and no credit event occurs, its payments are limited to the periodic payments previously made to the counterparty. Upon the occurrence of a specified credit event, a Portfolio, as a buyer of credit protection, is entitled to receive an amount equal to the notional amount of the swap and deliver to the seller the defaulted reference obligation in a physically settled trade. A Portfolio may also receive a net settlement amount in the form of cash or securities equal to the notional amount of the swap reduced by the recovery value of the reference obligation in a cash settled trade.
As a seller of protection, a Portfolio generally receives a payment stream throughout the term of the swap, provided that there is no credit event. In addition, if a Portfolio sells protection through a credit default swap, a Portfolio could suffer a loss because the value of the referenced obligation and the premium payments received may be less than the notional amount of the swap paid to the buyer of protection. Upon the occurrence of a specified credit event, a Portfolio, as a seller of credit protection, may be required to take possession of the defaulted reference obligation and pay the buyer an amount equal to the notional amount of the swap in a physically settled trade. A Portfolio may also pay a net settlement amount in the form of cash or securities equal to the notional amount of the swap reduced by the recovery value of the reference obligation in a cash settled trade. Recovery values are at times established through the credit event auction process in which market participants are ensured that a transparent price has been set for the defaulted security or obligation. In addition, a Portfolio is entitled to a return of any assets, which have been pledged as collateral to the counterparty upon settlement.
The maximum potential amount of future payments (undiscounted) that a Portfolio as seller of protection could be required to make under a credit default swap would be an amount equal to the notional amount of the agreement. These potential amounts would be partially offset by any recovery values of the respective referenced obligations or net amounts received from a settlement of a credit default swap for the same reference security or obligation where a Portfolio bought credit protection.
73
GOLDMAN SACHS FUND OF FUNDS PORTFOLIOS
Notes to Financial Statements (continued)
June 30, 2017 (Unaudited)
| 3. INVESTMENTS AND FAIR VALUE MEASUREMENTS (continued) |
Short Term Investments — Short-term investments having a maturity of 60 days or less are valued using available market quotations as provided by a third party pricing vendor or broker. These investments are classified as Level 2 of the fair value hierarchy.
B. Level 3 Fair Value Investments — To the extent that significant inputs to valuation models and other alternative pricing sources are unobservable, or if quotations are not readily available, or if GSAM believes that such quotations do not accurately reflect fair value, the fair value of the Portfolios’ investments may be determined under Valuation Procedures approved by the Trustees. GSAM, consistent with its procedures and applicable regulatory guidance, may make an adjustment to the most recent valuation prices of either domestic or foreign securities in light of significant events to reflect what it believes to be the fair value of the securities at the time of determining a Portfolio’s NAV. Significant events which could affect a large number of securities in a particular market may include, but are not limited to: significant fluctuations in U.S. or foreign markets; market dislocations; market disruptions; or unscheduled market closings. Significant events which could also affect a single issuer may include, but are not limited to: corporate actions such as reorganizations, mergers and buy-outs; ratings downgrades; and bankruptcies.
C. Fair Value Hierarchy — The following is a summary of the Portfolios’ investments and derivatives classified in the fair value hierarchy as of June 30, 2017:
| BALANCED STRATEGY | ||||||||||||
| Investment Type | Level 1 | Level 2 | Level 3 | |||||||||
| Assets | ||||||||||||
Underlying Funds | ||||||||||||
Dynamic | $ | 57,624,232 | $ | — | $ | — | ||||||
Equity | 159,802,968 | — | — | |||||||||
Exchange-Traded Funds | 31,721,816 | — | — | |||||||||
Fixed Income | 234,562,072 | — | — | |||||||||
Investment Company | 10,365,471 | — | — | |||||||||
| Total | $ | 494,076,559 | $ | — | $ | — | ||||||
| Assets | ||||||||||||
Options Purchased | $ | 3,267,025 | $ | 89,099 | $ | — | ||||||
Forward Foreign Currency Exchange Contracts(a) | — | 515,793 | — | |||||||||
Futures Contracts(a) | 790,327 | — | — | |||||||||
Credit Default Swap Contracts(a) | — | 40,575 | — | |||||||||
| Total | $ | 4,057,352 | $ | 645,467 | $ | — | ||||||
| Liabilities | ||||||||||||
Forward Foreign Currency Exchange Contracts(a) | $ | — | $ | (360,380 | ) | $ | — | |||||
Futures Contracts(a) | (467,162 | ) | — | — | ||||||||
Credit Default Swap Contracts(a) | — | (86,885 | ) | — | ||||||||
Written Options | — | (24,099 | ) | — | ||||||||
| Total | $ | (467,162 | ) | $ | (471,364 | ) | $ | — | ||||
74
GOLDMAN SACHS FUND OF FUNDS PORTFOLIOS
| 3. INVESTMENTS AND FAIR VALUE MEASUREMENTS (continued) |
| EQUITY GROWTH STRATEGY | ||||||||||||
| Investment Type | Level 1 | Level 2 | Level 3 | |||||||||
| Assets | ||||||||||||
Underlying Funds | $ | $ | $ | |||||||||
Equity | 253,166,925 | — | — | |||||||||
Exchange-Traded Funds | 77,460,947 | — | — | |||||||||
Investment Company | 6,365,064 | — | — | |||||||||
| Total | $ | 336,992,936 | $ | — | $ | — | ||||||
| Derivative Type | ||||||||||||
| Assets | ||||||||||||
Options Purchased | $ | — | $ | 60,803 | $ | — | ||||||
Futures Contracts(a) | 55,102 | — | — | |||||||||
| Total | $ | 55,102 | $ | 60,803 | $ | — | ||||||
| Liabilities | ||||||||||||
Futures Contracts(a) | $ | (139,032 | ) | $ | — | $ | — | |||||
Written Options | — | (16,323 | ) | — | ||||||||
| Total | $ | (139,032 | ) | $ | (16,323 | ) | $ | — | ||||
| GROWTH AND INCOME STRATEGY | ||||||||||||
| Investment Type | Level 1 | Level 2 | Level 3 | |||||||||
| Assets | ||||||||||||
Underlying Funds | ||||||||||||
Equity | $ | 427,641,920 | $ | — | $ | — | ||||||
Exchange-Traded Funds | 102,112,747 | — | — | |||||||||
Fixed Income | 227,991,415 | — | — | |||||||||
Dynamic | 107,494,677 | — | — | |||||||||
Investment Company | 18,736,833 | — | — | |||||||||
| Total | $ | 883,977,592 | $ | — | $ | — | ||||||
| Derivative Type | ||||||||||||
| Assets | ||||||||||||
Options Purchased | $ | 6,697,787 | $ | 159,768 | $ | — | ||||||
Forward Foreign Currency Exchange Contracts(a) | — | 928,307 | — | |||||||||
Futures Contracts(a) | 1,631,964 | — | — | |||||||||
Credit Default Swap Contracts(a) | — | 71,685 | — | |||||||||
| Total | $ | 8,329,751 | $ | 1,159,760 | $ | — | ||||||
| Liabilities | ||||||||||||
Forward Foreign Currency Exchange Contracts(a) | $ | — | $ | (649,769 | ) | $ | — | |||||
Futures Contracts(a) | (907,041 | ) | — | — | ||||||||
Credit Default Swap Contracts(a) | — | (154,639 | ) | — | ||||||||
Written Options | — | (43,058 | ) | — | ||||||||
| Total | $ | (907,041 | ) | $ | (847,466 | ) | $ | — | ||||
75
GOLDMAN SACHS FUND OF FUNDS PORTFOLIOS
Notes to Financial Statements (continued)
June 30, 2017 (Unaudited)
| 3. INVESTMENTS AND FAIR VALUE MEASUREMENTS (continued) |
| GROWTH STRATEGY | ||||||||||||
| Investment Type | Level 1 | Level 2 | Level 3 | |||||||||
| Assets | ||||||||||||
Underlying Funds | ||||||||||||
Dynamic | $ | 89,693,307 | $ | — | $ | — | ||||||
Equity | 554,284,192 | — | — | |||||||||
Exchange-Traded Funds | 119,838,218 | — | — | |||||||||
Fixed Income | 50,554,665 | — | — | |||||||||
Investment Company | 7,079,840 | — | — | |||||||||
| Total | $ | 821,450,222 | $ | — | $ | — | ||||||
| Derivative Type | Level 1 | Level 2 | Level 3 | |||||||||
| Assets | ||||||||||||
Options Purchased | $ | 9,309,306 | $ | 149,235 | $ | — | ||||||
Forward Foreign Currency Exchange Contracts(a) | — | 856,823 | — | |||||||||
Futures Contracts(a) | 2,082,035 | — | — | |||||||||
Credit Default Swap Contracts(a) | — | 66,465 | — | |||||||||
| Total | $ | 11,391,341 | $ | 1,072,523 | $ | — | ||||||
| Liabilities | ||||||||||||
Forward Foreign Currency Exchange Contracts(a) | $ | — | $ | (599,000 | ) | $ | — | |||||
Futures Contracts(a) | (976,848 | ) | — | — | ||||||||
Credit Default Swap Contracts(a) | — | (144,393 | ) | — | ||||||||
Written Option | — | (40,080 | ) | |||||||||
| Total | $ | (976,848 | ) | $ | (783,473 | ) | $ | — | ||||
| SATELLITE STRATEGIES | ||||||||||||
| Investment Type | Level 1 | Level 2 | Level 3 | |||||||||
| Assets | ||||||||||||
Underlying Funds | ||||||||||||
Equity | $ | 387,053,774 | $ | — | $ | — | ||||||
Exchange-Traded Fund | 29,741,167 | — | — | |||||||||
Fixed Income | 282,118,700 | — | — | |||||||||
| Total | $ | 698,913,641 | $ | — | $ | — | ||||||
| (a) | Amount shown represents unrealized gain (loss) at period end. |
For further information regarding security characteristics, see the Schedules of Investments.
76
GOLDMAN SACHS FUND OF FUNDS PORTFOLIOS
| 4. INVESTMENTS IN DERIVATIVES |
The following tables set forth, by certain risk types, the gross value of derivative contracts as of June 30, 2017. These instruments were used as part of the Portfolios’ investment strategies and to obtain and/or manage exposure related to the risks below. The values in the tables below exclude the effects of cash collateral received or posted pursuant to these derivative contracts, and therefore are not representative of the Portfolios’ net exposure.
| Balanced Strategy | ||||||||||||
| Risk | Statements of Assets and Liabilities | Assets | Statements of Assets and Liabilities | Liabilities | ||||||||
Interest rate | Variation margin on certain derivative contracts; Purchased options, at value | $ | 3,961,902 | (a) | Variation margin on certain derivative contracts | $ | (310,219) | (a) | ||||
Credit | Variation margin on certain derivative contracts | 40,575 | (a) | Variation margin on certain derivative contracts | (86,885) | (a) | ||||||
Currency | Receivable for unrealized gain on forward foreign currency exchange contracts | 515,793 | Payable for unrealized loss on forward foreign currency exchange contracts | (360,380) | ||||||||
Equity | Variation margin on certain derivative contracts; Purchased options, at value | 184,549 | (a) | Variation margin on certain derivative contracts; Written options, at value | (181,042) | (a) | ||||||
| Total | $ | 4,702,819 | $ | (938,526) | ||||||||
| Equity Growth Strategy | ||||||||||||
| Risk | Statements of Assets and Liabilities | Assets | Statements of Assets and Liabilities | Liabilities | ||||||||
Equity | Variation margin on certain derivative contracts; Purchased options, at value | 115,905 | (a) | Variation margin on certain derivative contracts; Written options, at value | (155,355) | (a) | ||||||
| Growth and Income Strategy | ||||||||||||
| Risk | Statements of Assets and Liabilities | Assets | Statements of Assets and Liabilities | Liabilities | ||||||||
Interest rate | Variation margin on certain derivative contracts; Purchased options, at value | $ | 8,159,303 | (a) | Variation margin on certain derivative contracts | $ | (623,179) | (a) | ||||
Credit | Variation margin on certain derivative contracts | 71,685 | (a) | Variation margin on certain derivative contracts | (154,639) | (a) | ||||||
Currency | Receivable for unrealized gain on forward foreign currency exchange contracts | 928,307 | Payable for unrealized loss on forward foreign currency exchange contracts | (649,769) | ||||||||
Equity | Variation margin on certain derivative contracts; Purchased options, at value | 330,216 | (a) | Variation margin on certain derivative contracts; Written options, at value | (326,920) | (a) | ||||||
| Total | $ | 9,489,511 | $ | (1,754,507) | ||||||||
77
GOLDMAN SACHS FUND OF FUNDS PORTFOLIOS
Notes to Financial Statements (continued)
June 30, 2017 (Unaudited)
| 4. INVESTMENTS IN DERIVATIVES (continued) |
| Growth Strategy | ||||||||||||
| Risk | Statements of Assets and Liabilities | Assets | Statements of Assets and Liabilities | Liabilities | ||||||||
Interest rate | Variation margin on certain derivative contracts; Purchased options, at value | $ | 11,235,276 | (a) | Variation margin on certain derivative contracts | $ | (713,952) | (a) | ||||
Credit | Variation margin on certain derivative contracts | 66,465 | (a) | Variation margin on certain derivative contracts | (144,393) | (a) | ||||||
Currency | Receivable for unrealized gain on forward foreign currency exchange contracts | 856,823 | Payable for unrealized loss on forward foreign currency exchange contracts | (599,000) | ||||||||
Equity | Variation margin on certain derivative contracts; Purchased options, at value | 305,300 | (a) | Variation margin on certain derivative contracts; Written options, at value | (302,976) | (a) | ||||||
| Total | $ | 12,463,864 | $ | (1,760,321) | ||||||||
| (a) | Includes unrealized gain (loss) on futures contracts and centrally cleared swaps described in the Additional Investment Information sections of the Schedules of Investments. Only current day’s variation margin is reported within the Statements of Assets and Liabilities. |
The following tables set forth, by certain risk types, the Portfolios’ gains (losses) related to these derivatives and their indicative volumes For the six months ended June 30, 2017. These gains (losses) should be considered in the context that these derivative contracts may have been executed to create investment opportunities and/or economically hedge certain investments, and accordingly, certain gains (losses) on such derivative contracts may offset certain (losses) gains attributable to investments. These gains (losses) are included in “Net realized gain (loss)” or “Net change in unrealized gain (loss)” on the Statements of Operations:
| Balanced Strategy | ||||||||||||||
| Risk | Statements of Operations | Net Realized Gain (Loss) | Net Change in Unrealized Gain (Loss) | Average Number of Contracts(a) | ||||||||||
| Interest rate | Net realized gain (loss) from purchased options and futures contracts/Net change in unrealized gain (loss) on purchased options and futures contracts | $ | (117,717 | ) | $ | 96,347 | 509 | |||||||
| Credit | Net realized gain (loss) from swap contracts/Net change in unrealized gain (loss) on swap contracts | 5,227 | (46,310 | ) | 1 | |||||||||
| Currency | Net realized gain (loss) from forward foreign currency exchange contracts/Net change in unrealized gain (loss) on forward foreign currency exchange contracts | (263,124 | ) | 155,413 | 14 | |||||||||
| Equity | Net realized gain (loss) from futures contracts and written options/Net change in unrealized gain (loss) on futures contracts and written options | 166,104 | (121,818 | ) | 367 | |||||||||
| Total | $ | (209,510 | ) | $ | 83,632 | 891 | ||||||||
| Equity Growth Strategy | ||||||||||||||
| Risk | Statements of Operations | Net Realized Gain (Loss) | Net Change in Unrealized Gain (Loss) | Average Number of Contracts(a) | ||||||||||
| Equity | Net realized gain (loss) from futures contracts and written options/Net change in unrealized gain (loss) on investment and futures and written options | $ | 342,643 | $ | (125,023 | ) | 255 | |||||||
78
GOLDMAN SACHS FUND OF FUNDS PORTFOLIOS
| 4. INVESTMENTS IN DERIVATIVES (continued) |
| Growth and Income Strategy | ||||||||||||||
| Risk | Statements of Operations | Net Realized Gain (Loss) | Net Change in Unrealized Gain (Loss) | Average Number of Contracts(a) | ||||||||||
| Interest rate | Net realized gain (loss) from purchased options and futures contracts/Net change in unrealized gain (loss) on purchased options and futures contracts | $ | (238,432 | ) | $ | 250,272 | 1,205 | |||||||
| Credit | Net realized gain (loss) from swap contracts/Net change in unrealized gain (loss) on swap contracts | 9,266 | (82,954 | ) | 1 | |||||||||
| Currency | Net realized gain (loss) from forward foreign currency exchange contracts/Net change in unrealized gain (loss) on forward foreign currency exchange contracts | (478,416 | ) | 278,538 | 14 | |||||||||
| Equity | Net realized gain (loss) from purchased options, futures contracts and written options/Net change in unrealized gain (loss) on purchased options, futures contracts and written options | 304,912 | (221,870 | ) | 659 | |||||||||
| Total | $(402,670) | $ | 223,986 | 1,879 | ||||||||||
| Growth Strategy | ||||||||||||||
| Risk | Statements of Operations | Net Realized Gain (Loss) | Net Change in Unrealized Gain (Loss) | Average Number of Contracts(a) | ||||||||||
| Interest rate | Net realized gain (loss) from purchased options and futures contracts/Net change in unrealized gain (loss) on purchased options and futures contracts | $ | (3,047 | ) | $ | 391,774 | 1,183 | |||||||
| Credit | Net realized gain (loss) from swap contracts/Net change in unrealized gain (loss) on swap contracts | 8,631 | (77,928 | ) | 1 | |||||||||
| Currency | Net realized gain (loss) from forward foreign currency exchange contracts/Net change in unrealized gain (loss) on forward foreign currency exchange contracts | (444,140 | ) | 257,823 | 14 | |||||||||
| Equity | Net realized gain (loss) from futures contracts and written options/Net change in unrealized gain (loss) on futures contracts and written options | 125,615 | (207,369 | ) | 636 | |||||||||
| Total | $ | (312,941 | ) | $ | 364,300 | 1,834 | ||||||||
| (a) | Average number of contracts is based on the average of month end balances for the period ended June 30, 2017. |
In order to better define its contractual rights and to secure rights that will help a Portfolio mitigate its counterparty risk, a Portfolio may enter into an International Swaps and Derivatives Association, Inc. Master Agreement (“ISDA Master Agreement”) or similar agreement with its derivatives counterparties. An ISDA Master Agreement is a bilateral agreement between a Portfolio and a counterparty that governs OTC derivatives (including forward foreign currency exchange contracts, and certain options and swaps), and typically contains, among other things, collateral posting terms and netting provisions in the event of a default and/or termination event. The provisions of the ISDA Master Agreement typically permit a single net payment in the event of a default (close-out netting) or similar event, including the bankruptcy or insolvency of the counterparty.
Collateral and margin requirements differ between exchange traded derivatives and OTC derivatives. Margin requirements are established by the broker or clearing house for exchange-traded and centrally cleared derivatives (financial futures contracts, options and centrally cleared swaps) pursuant to governing agreements for those instrument types. Brokers can ask for margin in excess of the minimum in certain circumstances. Collateral terms are contract-specific for OTC derivatives. For derivatives traded under an ISDA Master Agreement, the collateral requirements are typically calculated by netting the marked to market amount for each transaction under such agreement and comparing that amount to the value of any collateral currently pledged by a Portfolio
79
GOLDMAN SACHS FUND OF FUNDS PORTFOLIOS
Notes to Financial Statements (continued)
June 30, 2017 (Unaudited)
| 4. INVESTMENTS IN DERIVATIVES (continued) |
and the counterparty. Additionally, a Portfolio may be required to post initial margin to the counterparty, the terms of which would be outlined in the confirmation of the OTC transaction.
For financial reporting purposes, cash collateral that has been pledged to cover obligations of a Portfolio and cash collateral received from the counterparty, if any, is reported separately on the Statements of Assets and Liabilities as receivables/payables for collateral on certain derivative contracts. Non-cash collateral pledged by a Portfolio, if any, is noted in the Schedules of Investments. Generally, the amount of collateral due from or to a counterparty must exceed a minimum transfer amount threshold before a transfer is required to be made. To the extent amounts due to a Portfolio from its counterparties are not fully collateralized, contractually or otherwise, the Portfolio bears the risk of loss from counterparty nonperformance. A Portfolio attempts to mitigate counterparty risk by only entering into agreements with counterparties that the Investment Adviser believes to be of good standing and by monitoring the financial stability of those counterparties.
Additionally, the netting of assets and liabilities and the offsetting of collateral pledged or received are based on contractual netting/set-off provisions in the ISDA Master Agreement or similar agreements. However, in the event of a default or insolvency of a counterparty, a court could determine that such rights are not enforceable due to the restrictions or prohibitions against the right of setoff that may be imposed in accordance with a particular jurisdiction’s bankruptcy or insolvency laws.
| 5. AGREEMENTS AND AFFILIATED TRANSACTIONS |
A. Management Agreement — Under the Agreement, GSAM manages the Portfolios, subject to the general supervision of the Trustees.
As compensation for the services rendered pursuant to the Agreement, the assumption of the expenses related thereto and administration of the Portfolios’ business affairs, including providing facilities, GSAM is entitled to a management fee, accrued daily and paid monthly, equal to an annual percentage rate of average daily net assets of 0.124% for the Satellite Strategies Portfolio and 0.15% for each of the other Portfolios.
B. Distribution and/or Service (12b-1) Plans — The Trust, on behalf of Class A and Class R Shares of each applicable Portfolio, has adopted Distribution and Service Plans subject to Rule 12b-1 under the Act. Under the Distribution and Service Plans, Goldman Sachs, which serves as distributor (the “Distributor”), is entitled to a fee accrued daily and paid monthly, for distribution services and personal and account maintenance services, which may then be paid by Goldman Sachs to authorized dealers. These fees are equal to an annual percentage rate of the average daily net assets attributable to Class A or Class R Shares of the Portfolios, as applicable, as set forth below.
The Trust, on behalf of Class C Shares of each applicable Portfolio, has adopted a Distribution Plan subject to Rule 12b-1 under the Act. Under the Distribution Plan, Goldman Sachs as Distributor is entitled to a fee accrued daily and paid monthly for distribution services, which may then be paid by Goldman Sachs to authorized dealers. These fees are equal to an annual percentage rate of the average daily net assets attributable to Class C Shares of the Portfolios, as set forth below.
The Trust, on behalf of Service Shares of each applicable Portfolio, has adopted a Service Plan subject to Rule 12b-1 under the Act to allow Service Shares to compensate service organizations (including Goldman Sachs) for providing personal and account maintenance services to their customers who are beneficial owners of such shares. The Service Plan provides for compensation to the service organizations equal to an annual percentage rate of the average daily net assets attributable to Services Shares of the Portfolios, as set forth below.
| Distribution and Service Plan Rates | ||||||||||||||||
| Class A* | Class C | Class R* | Service | |||||||||||||
Distribution Plan | 0.25 | % | 0.75 | % | 0.50 | % | — | |||||||||
Service Plan | — | — | — | 0.25 | % | |||||||||||
| * | With respect to Class A and Class R Shares, the Distributor at its discretion may use compensation for distribution services paid under the Distribution Plan to compensate service organizations for personal and account maintenance services and expenses as long as such total compensation does not exceed the maximum cap on “service fees” imposed by the Financial Industry Regulatory Authority. |
80
GOLDMAN SACHS FUND OF FUNDS PORTFOLIOS
| 5. AGREEMENTS AND AFFILIATED TRANSACTIONS (continued) |
C. Distribution Agreement — Goldman Sachs, as Distributor of the shares of the Portfolios pursuant to a Distribution Agreement, may retain a portion of the Class A Shares’ front end sales charge and Class C Shares’ CDSC. During the six months ended June 30, 2017, Goldman Sachs advised that it retained the following amounts:
| Front End Sales Charge | Contingent Deferred Sales Charge | |||||||||
| Portfolio | Class A | Class C | ||||||||
Balanced Strategy | $ | 4,669 | $ | 44 | ||||||
Equity Growth Strategy | 5,051 | 138 | ||||||||
Growth and Income Strategy | 9,817 | 395 | ||||||||
Growth Strategy | 10,234 | 315 | ||||||||
Satellite Strategies | 853 | — | ||||||||
D. Service and/or Shareholder Administration Plans — The Trust, on behalf of each applicable Portfolio, has adopted Service and/or Shareholder Administration Plans to allow Class C and Service Shares, respectively, to compensate service organizations (including Goldman Sachs) for providing varying levels of personal and account maintenance and/or shareholder administration services to their customers who are beneficial owners of such shares. The Service and/or Shareholder Administration Plans each provide for compensation to the service organizations equal to an annual percentage rate of 0.25% of the average daily net assets attributable to Class C or Service Shares of the Portfolios, respectively.
E. Transfer Agency Agreement — Goldman Sachs also serves as the transfer agent of the Portfolios for a fee pursuant to the Transfer Agency Agreement. The fees charged for such transfer agency services are accrued daily and paid monthly at annual rates as follows: 0.19% of the average daily net assets of Class A, Class C, Class IR and Class R Shares; 0.02% of the average daily net assets of Class R6 Shares; and 0.04% of the average daily net assets of Institutional and Service Shares. Effective July 28, 2017, the annual rates were amended for the Class A, Class C, Class IR and Class R Shares to 0.18% of average daily net assets, and for Class R6 Shares to 0.03% of average daily net assets.
F. Other Expense Agreements and Affiliated Transactions — GSAM has agreed to limit certain “Other Expenses” of the Portfolios (excluding acquired fund fees and expenses, transfer agency fees and expenses, service fees and shareholder administration fees (as applicable), taxes, interest, brokerage fees, shareholder meeting, litigation, indemnification and extraordinary expenses) to the extent such expenses exceed, on an annual basis, a percentage rate of the average daily net assets of each Portfolio. Such Other Expense reimbursements, if any, are accrued daily and paid monthly. In addition, the Portfolios are not obligated to reimburse GSAM for prior fiscal year expense reimbursements, if any. The Other Expense limitations as an annual percentage rate of average daily net assets are 0.01% for the Satellite Strategies Portfolio and 0.004% for each other Portfolio. These Other Expense limitations will remain in place through at least April 28, 2018, and prior to such date GSAM may not terminate the arrangements without the approval of the Trustees. In addition, the Portfolios have entered into certain offset arrangements with the transfer agent, which may result in a reduction of the Portfolios’ expenses and are received irrespective of the application of the “Other Expense” limitations described above.
81
GOLDMAN SACHS FUND OF FUNDS PORTFOLIOS
Notes to Financial Statements (continued)
June 30, 2017 (Unaudited)
| 5. AGREEMENTS AND AFFILIATED TRANSACTIONS (continued) |
For the six months ended June 30, 2017, these expense reductions, including any fee waivers and Other Expense reimbursements, were as follows:
| Portfolio | Other Expense Reimbursements | |||||
Balanced Strategy | $ | 125,020 | ||||
Equity Growth Strategy | 128,177 | |||||
Growth and Income Strategy | 141,394 | |||||
Growth Strategy | 149,141 | |||||
Satellite Strategies | 131,002 | |||||
G. Line of Credit Facility — As of June 30, 2017, the Portfolios participated in a $1,100,000,000 committed, unsecured revolving line of credit facility (the “facility”) together with other funds of the Trust and certain registered investment companies having management agreements with GSAM or its affiliates. This facility is to be used for temporary emergency purposes, or to allow for an orderly liquidation of securities to meet redemption requests. The interest rate on borrowings is based on the federal funds rate. The facility also requires a fee to be paid by the Portfolios based on the amount of the commitment that has not been utilized. For the six months ended June 30, 2017, the Portfolios did not have any borrowings under the facility.
H. Other Transactions with Affiliates — As of June 30, 2017, The Goldman Sachs Group, Inc. was the beneficial owner of 100% and 18% or more of Class R6 Shares of the Balanced Strategy Portfolio and the Growth and Income Strategy Portfolio, respectively.
The Portfolios invest primarily in the Institutional Shares of the Underlying Funds. These Underlying Funds are considered to be affiliated with the Portfolios. The tables below show the transactions in and earnings from investments in these Underlying Funds For the six months ended June 30, 2017 (in thousands):
| Balanced Strategy Portfolio | ||||||||||||||||||||||||||||
| Underlying Funds | Market Value 12/31/2016 | Purchases at Cost* | Proceeds from Sales | Net Realized Gain (Loss) | Change in Unrealized Gain (Loss) | Market Value 6/30/2017 | Dividend Income | |||||||||||||||||||||
Goldman Sachs ActiveBeta Emerging Markets Equity ETF | $ | — | $ | 12,268 | $ | — | $ | — | $ | 279 | $ | 12,547 | $ | 62 | ||||||||||||||
Goldman Sachs ActiveBeta U.S. Large Cap Equity ETF | — | 18,871 | — | — | 304 | 19,175 | 83 | |||||||||||||||||||||
Goldman Sachs Core Fixed Income Fund | 12,405 | 34,307 | (23,110 | ) | 11 | 67 | 23,680 | 165 | ||||||||||||||||||||
Goldman Sachs Dynamic Allocation Fund | 64,299 | 5,621 | (29,039 | ) | 699 | 2,378 | 43,958 | — | ||||||||||||||||||||
Goldman Sachs Emerging Markets Debt Fund | 14,484 | 19,649 | (12,110 | ) | 158 | 671 | 22,852 | 464 | ||||||||||||||||||||
Goldman Sachs Emerging Markets Equity Insights Fund | 34,493 | 24,384 | (27,759 | ) | 2,111 | 3,365 | 36,594 | — | ||||||||||||||||||||
Goldman Sachs Focused International Equity Fund | 3,347 | 5,519 | (9,497 | ) | 445 | 186 | — | — | ||||||||||||||||||||
Goldman Sachs Global Income Fund | 140,600 | 28,324 | (25,107 | ) | 116 | 1,096 | 145,029 | 1,012 | ||||||||||||||||||||
82
GOLDMAN SACHS FUND OF FUNDS PORTFOLIOS
| 5. AGREEMENTS AND AFFILIATED TRANSACTIONS (continued) |
| Balanced Strategy Portfolio (continued) | ||||||||||||||||||||||||||||
| Underlying Funds | Market Value 12/31/2016 | Purchases at Cost* | Proceeds from Sales | Net Realized Gain (Loss) | Change in Unrealized Gain (Loss) | Market Value 6/30/2017 | Dividend Income | |||||||||||||||||||||
Goldman Sachs Global Infrastructure Fund | $ | — | $ | 10,832 | $ | — | $ | — | $ | (61 | ) | $ | 10,771 | $ | 114 | |||||||||||||
Goldman Sachs Global Real Estate Securities Fund | — | 10,248 | — | — | 80 | 10,328 | 40 | |||||||||||||||||||||
Goldman Sachs High Yield Floating Rate Fund | — | 2,570 | — | — | (11 | ) | 2,559 | 16 | ||||||||||||||||||||
Goldman Sachs High Yield Fund | 28,725 | 8,126 | (2,184 | ) | 127 | 210 | 35,004 | 884 | ||||||||||||||||||||
Goldman Sachs International Equity Insights Fund | 10,123 | 16,106 | (16,785 | ) | 998 | 1,577 | 12,019 | — | ||||||||||||||||||||
Goldman Sachs International Real Estate Securities Fund | 5,481 | 537 | (6,422 | ) | (168 | ) | 572 | — | — | |||||||||||||||||||
Goldman Sachs International Small Cap Insights Fund | 5,721 | 8,595 | (783 | ) | 162 | 1,073 | 14,768 | — | ||||||||||||||||||||
Goldman Sachs Large Cap Growth Insights Fund | 15,409 | 28,587 | (11,144 | ) | 1,353 | 1,151 | 35,356 | — | ||||||||||||||||||||
Goldman Sachs Large Cap Value Fund | 14,980 | 4,124 | (19,748 | ) | 350 | 294 | — | — | ||||||||||||||||||||
Goldman Sachs Large Cap Value Insights Fund | 34,947 | 9,843 | (11,110 | ) | 1,593 | 678 | 35,951 | 253 | ||||||||||||||||||||
Goldman Sachs Local Emerging Markets Debt Fund | 14,671 | 10,145 | (20,625 | ) | 137 | 1,110 | 5,438 | 406 | ||||||||||||||||||||
Goldman Sachs Managed Futures Strategy Fund | 18,744 | 2,319 | (7,388 | ) | 381 | (390 | ) | 13,666 | — | |||||||||||||||||||
Goldman Sachs Real Estate Securities Fund | 5,642 | 860 | (6,401 | ) | (448 | ) | 347 | — | 43 | |||||||||||||||||||
Goldman Sachs Small Cap Equity Insights Fund | 8,697 | 1,381 | (6,127 | ) | 844 | (779 | ) | 4,016 | — | |||||||||||||||||||
Goldman Sachs Strategic Growth Fund | 6,566 | 2,195 | (9,700 | ) | 304 | 635 | — | — | ||||||||||||||||||||
Goldman Sachs Strategic Income Fund | 35,308 | 4,055 | (39,205 | ) | (3,381 | ) | 3,223 | — | 194 | |||||||||||||||||||
Total | $ | 474,642 | $ | 269,466 | $ | (284,244 | ) | $ | 5,792 | $ | 18,055 | $ | 483,711 | $ | 3,736 | |||||||||||||
| Equity Growth Strategy Portfolio | ||||||||||||||||||||||||||||
| Underlying Funds | Market Value 12/31/2016 | Purchases at Cost* | Proceeds from Sales | Net Realized Gain (Loss) | Change in Unrealized Gain (Loss) | Market Value 6/30/2017 | Dividend Income | |||||||||||||||||||||
Goldman Sachs ActiveBeta Emerging Markets Equity ETF | $ | — | $ | 24,344 | $ | (679 | ) | $ | 20 | $ | 538 | $ | 24,223 | $ | 124 | |||||||||||||
Goldman Sachs ActiveBeta International Equity ETF | — | 20,086 | (705 | ) | 29 | 665 | 20,075 | 204 | ||||||||||||||||||||
Goldman Sachs ActiveBeta U.S. Large Cap Equity ETF | — | 33,311 | (689 | ) | 16 | 525 | 33,163 | 147 | ||||||||||||||||||||
Goldman Sachs Emerging Markets Equity Insights Fund | 44,450 | 30,191 | (20,583 | ) | 1,952 | 6,270 | 62,280 | — | ||||||||||||||||||||
Goldman Sachs Focused International Equity Fund | 21,457 | 3,916 | (27,697 | ) | 1,240 | 1,084 | — | — | ||||||||||||||||||||
Goldman Sachs Global Real Estate Securities Fund | — | 22,689 | — | — | 177 | 22,866 | 89 | |||||||||||||||||||||
83
GOLDMAN SACHS FUND OF FUNDS PORTFOLIOS
Notes to Financial Statements (continued)
June 30, 2017 (Unaudited)
| 5. AGREEMENTS AND AFFILIATED TRANSACTIONS (continued) |
| Equity Growth Strategy Portfolio (continued) | ||||||||||||||||||||||||||||
| Underlying Funds | Market Value 12/31/2016 | Purchases at Cost* | Proceeds from Sales | Net Realized Gain (Loss) | Change in Unrealized Gain (Loss) | Market Value 6/30/2017 | Dividend Income | |||||||||||||||||||||
Goldman Sachs International Equity Insights Fund | $ | 64,676 | $ | 9,583 | $ | (34,772 | ) | $ | 4,670 | $ | 5,510 | $ | 49,667 | $ | — | |||||||||||||
Goldman Sachs International Real Estate Securities Fund | 6,566 | 196 | (7,233 | ) | (342 | ) | 813 | — | — | |||||||||||||||||||
Goldman Sachs International Small Cap Insights Fund | 9,770 | 2,647 | (843 | ) | 407 | 1,307 | 13,288 | — | ||||||||||||||||||||
Goldman Sachs Large Cap Growth Insights Fund | 49,733 | 236 | (14,017 | ) | 3,505 | 2,610 | 42,067 | — | ||||||||||||||||||||
Goldman Sachs Large Cap Value Fund | 27,367 | 2,773 | (31,253 | ) | 1,772 | (659 | ) | — | — | |||||||||||||||||||
Goldman Sachs Large Cap Value Insights Fund | 63,857 | 6,746 | (31,846 | ) | 9,559 | (5,945 | ) | 42,371 | 359 | |||||||||||||||||||
Goldman Sachs Real Estate Securities Fund | 6,775 | 485 | (7,149 | ) | 321 | (432 | ) | — | 49 | |||||||||||||||||||
Goldman Sachs Small Cap Equity Insights Fund | 12,230 | 12,455 | (4,126 | ) | 771 | (702 | ) | 20,628 | — | |||||||||||||||||||
Goldman Sachs Strategic Growth Fund | 21,188 | 101 | (24,201 | ) | 1,719 | 1,193 | — | — | ||||||||||||||||||||
Total | $ | 328,069 | $ | 169,759 | $ | (205,793 | ) | $ | 25,639 | $ | 12,954 | $ | 330,628 | $ | 972 | |||||||||||||
| Growth and Income Strategy Portfolio | ||||||||||||||||||||||||||||
| Underlying Funds | Market Value 12/31/2016 | Purchases at Cost* | Proceeds from Sales | Net Realized Gain (Loss) | Change in Unrealized Gain (Loss) | Market Value 6/30/2017 | Dividend Income | |||||||||||||||||||||
Goldman Sachs ActiveBeta Emerging Markets Equity ETF | $ | — | $ | 29,458 | $ | (956 | ) | $ | 28 | $ | 648 | $ | 29,178 | $ | 150 | |||||||||||||
Goldman Sachs ActiveBeta International Equity ETF | — | 12,834 | — | — | 440 | 13,274 | 130 | |||||||||||||||||||||
Goldman Sachs ActiveBeta U.S. Large Cap Equity ETF | — | 59,700 | (1,007 | ) | 22 | 945 | 59,660 | 264 | ||||||||||||||||||||
Goldman Sachs Core Fixed Income Fund | 23,107 | 23,077 | (46,164 | ) | 25 | (45 | ) | — | 116 | |||||||||||||||||||
Goldman Sachs Dynamic Allocation Fund | 119,606 | 6,618 | (48,066 | ) | 343 | 5,269 | 83,770 | — | ||||||||||||||||||||
Goldman Sachs Emerging Markets Debt Fund | 18,133 | 45,279 | (17,883 | ) | 156 | 1,003 | 46,688 | 752 | ||||||||||||||||||||
Goldman Sachs Emerging Markets Equity Insights Fund | 83,128 | 46,012 | (53,783 | ) | 4,057 | 9,495 | 88,909 | — | ||||||||||||||||||||
Goldman Sachs Focused International Equity Fund | 22,715 | 10,119 | (35,610 | ) | 1,579 | 1,197 | — | — | ||||||||||||||||||||
Goldman Sachs Global Income Fund | 123,543 | 32,039 | (60,008 | ) | 157 | 752 | 96,483 | 797 | ||||||||||||||||||||
Goldman Sachs Global Infrastructure Fund | — | 25,105 | — | — | (140 | ) | 24,965 | 264 | ||||||||||||||||||||
Goldman Sachs Global Real Estate Securities Fund | — | 20,321 | — | — | 158 | 20,479 | 80 | |||||||||||||||||||||
Goldman Sachs High Yield Fund | 44,534 | 31,637 | (3,367 | ) | 196 | 223 | 73,223 | 1,516 | ||||||||||||||||||||
Goldman Sachs International Equity Insights Fund | 68,609 | 28,126 | (57,020 | ) | 5,164 | 6,563 | 51,442 | — | ||||||||||||||||||||
84
GOLDMAN SACHS FUND OF FUNDS PORTFOLIOS
| 5. AGREEMENTS AND AFFILIATED TRANSACTIONS (continued) |
| Growth and Income Strategy Portfolio (continued) | ||||||||||||||||||||||||||||
| Underlying Funds | Market Value 12/31/2016 | Purchases at Cost* | Proceeds from Sales | Net Realized Gain (Loss) | Change in Unrealized Gain (Loss) | Market Value 6/30/2017 | Dividend Income | |||||||||||||||||||||
Goldman Sachs International Real Estate Securities Fund | $ | 10,727 | $ | 366 | $ | (11,865 | ) | $ | (70 | ) | $ | 842 | $ | — | $ | — | ||||||||||||
Goldman Sachs International Small Cap Insights Fund | 15,961 | 17,105 | (3,200 | ) | 1,594 | 1,582 | 33,042 | — | ||||||||||||||||||||
Goldman Sachs Large Cap Growth Insights Fund | 60,925 | 54,146 | (23,732 | ) | 3,394 | 5,412 | 100,145 | — | ||||||||||||||||||||
Goldman Sachs Large Cap Value Fund | 41,995 | 6,774 | (50,520 | ) | 1,044 | 707 | — | — | ||||||||||||||||||||
Goldman Sachs Large Cap Value Insights Fund | 97,914 | 16,430 | (20,010 | ) | 3,098 | 3,143 | 100,575 | 668 | ||||||||||||||||||||
Goldman Sachs Local Emerging Markets Debt Fund | 18,405 | 17,173 | (25,651 | ) | 199 | 1,472 | 11,598 | 573 | ||||||||||||||||||||
Goldman Sachs Managed Futures Strategy Fund | 34,842 | 3,103 | (14,228 | ) | 734 | (726 | ) | 23,725 | — | |||||||||||||||||||
Goldman Sachs Real Estate Securities Fund | 11,058 | 946 | (11,823 | ) | 645 | (826 | ) | — | 80 | |||||||||||||||||||
Goldman Sachs Small Cap Equity Insights Fund | 21,556 | 691 | (14,395 | ) | 2,220 | (1,987 | ) | 8,085 | — | |||||||||||||||||||
Goldman Sachs Strategic Growth Fund | 25,965 | 3,274 | (32,908 | ) | 1,867 | 1,802 | — | — | ||||||||||||||||||||
Goldman Sachs Strategic Income Fund | 43,757 | 3,719 | (47,292 | ) | (4,539 | ) | 4,355 | — | 234 | |||||||||||||||||||
Total | $ | 886,480 | $ | 494,052 | $ | (579,488 | ) | $ | 21,913 | $ | 42,284 | $ | 865,241 | $ | 5,624 | |||||||||||||
| Growth Strategy Portfolio | ||||||||||||||||||||||||||||
| Underlying Funds | Market Value 12/31/2016 | Purchases at Cost* | Proceeds from Sales | Net Realized Gain (Loss) | Change in Unrealized Gain (Loss) | Market Value 6/30/2017 | Dividend Income | |||||||||||||||||||||
Goldman Sachs ActiveBeta Emerging Markets Equity ETF | $ | — | $ | 49,988 | $ | — | $ | — | $ | 1,135 | $ | 51,123 | $ | 254 | ||||||||||||||
Goldman Sachs ActiveBeta U.S. Large Cap Equity ETF | — | 67,626 | — | — | 1,089 | 68,715 | 299 | |||||||||||||||||||||
Goldman Sachs Core Fixed Income Fund | 19,182 | 13,983 | (33,142 | ) | 15 | (38 | ) | — | 70 | |||||||||||||||||||
Goldman Sachs Dynamic Allocation Fund | 105,698 | 7,416 | (49,481 | ) | (50 | ) | 5,114 | 68,697 | — | |||||||||||||||||||
Goldman Sachs Emerging Markets Debt Fund | 8,243 | 33,862 | (28,931 | ) | 206 | 469 | 13,849 | 297 | ||||||||||||||||||||
Goldman Sachs Emerging Markets Equity Insights Fund | 90,182 | 66,103 | (38,394 | ) | 3,524 | 13,181 | 134,596 | — | ||||||||||||||||||||
Goldman Sachs Focused International Equity Fund | 34,172 | 9,875 | (47,960 | ) | 2,168 | 1,745 | — | — | ||||||||||||||||||||
Goldman Sachs Global Income Fund | 15,399 | 16,298 | (31,594 | ) | (103 | ) | — | — | 32 | |||||||||||||||||||
Goldman Sachs Global Infrastructure Fund | — | 11,981 | — | — | (67 | ) | 11,914 | 126 | ||||||||||||||||||||
Goldman Sachs Global Real Estate Securities Fund | — | 51,009 | — | — | 397 | 51,406 | 201 | |||||||||||||||||||||
Goldman Sachs High Yield Fund | 10,256 | 35,025 | (8,433 | ) | 204 | (346 | ) | 36,706 | 709 | |||||||||||||||||||
85
GOLDMAN SACHS FUND OF FUNDS PORTFOLIOS
Notes to Financial Statements (continued)
June 30, 2017 (Unaudited)
| 5. AGREEMENTS AND AFFILIATED TRANSACTIONS (continued) |
| Growth Strategy Portfolio (continued) | ||||||||||||||||||||||||||||
| Underlying Funds | Market Value 12/31/2016 | Purchases at Cost* | Proceeds from Sales | Net Realized Gain (Loss) | Change in Unrealized Gain (Loss) | Market Value 6/30/2017 | Dividend Income | |||||||||||||||||||||
Goldman Sachs International Equity Insights Fund | $ | 103,077 | $ | 27,519 | $ | (82,730 | ) | $ | 10,971 | $ | 5,204 | $ | 64,041 | $ | — | |||||||||||||
Goldman Sachs International Real Estate Securities Fund | 12,636 | 516 | (14,076 | ) | (266 | ) | 1,190 | — | — | |||||||||||||||||||
Goldman Sachs International Small Cap Insights Fund | 18,806 | 26,966 | (3,389 | ) | 1,716 | 2,303 | 46,402 | — | ||||||||||||||||||||
Goldman Sachs Large Cap Growth Insights Fund | 75,394 | 42,242 | (19,733 | ) | 2,968 | 8,059 | 108,930 | — | ||||||||||||||||||||
Goldman Sachs Large Cap Value Fund | 49,049 | 5,148 | (56,310 | ) | 2,469 | (356 | ) | — | — | |||||||||||||||||||
Goldman Sachs Large Cap Value Insights Fund | 114,234 | 12,737 | (24,065 | ) | 4,988 | 2,368 | 110,262 | 741 | ||||||||||||||||||||
Goldman Sachs Local Emerging Markets Debt Fund | 8,349 | 13,194 | (22,328 | ) | 110 | 675 | — | 245 | ||||||||||||||||||||
Goldman Sachs Managed Futures Strategy Fund | 30,798 | 3,220 | (13,034 | ) | 676 | (663 | ) | 20,997 | — | |||||||||||||||||||
Goldman Sachs Real Estate Securities Fund | 13,026 | 1,201 | (14,008 | ) | 424 | (643 | ) | — | 96 | |||||||||||||||||||
Goldman Sachs Small Cap Equity Insights Fund | 26,500 | 12,038 | (11,999 | ) | 2,048 | (1,855 | ) | 26,732 | — | |||||||||||||||||||
Goldman Sachs Strategic Growth Fund | 32,113 | 4,882 | (41,792 | ) | 2,930 | 1,867 | — | — | ||||||||||||||||||||
Goldman Sachs Strategic Income Fund | 19,335 | 1,947 | (21,194 | ) | (2,004 | ) | 1,916 | — | 104 | |||||||||||||||||||
Total | $ | 786,449 | $ | 514,776 | $ | (562,593 | ) | $ | 32,994 | $ | 42,744 | $ | 814,370 | $ | 3,174 | |||||||||||||
| Satellite Strategies Portfolio | ||||||||||||||||||||||||||||
| Underlying Funds | Market Value 12/31/2016 | Purchases at Cost* | Proceeds from Sales | Net Realized Gain (Loss) | Change in Unrealized Gain (Loss) | Market Value 6/30/2017 | Dividend Income | |||||||||||||||||||||
Goldman Sachs ActiveBeta Emerging Markets Equity ETF | $ | — | $ | 30,872 | $ | (1,832 | ) | $ | 41 | $ | 660 | $ | 29,741 | $ | 152 | |||||||||||||
Goldman Sachs Commodity Strategy Fund | 39,652 | 3,517 | (40,351 | ) | (5,379 | ) | 2,561 | — | — | |||||||||||||||||||
Goldman Sachs Emerging Markets Debt Fund | 78,328 | 61,600 | (22,219 | ) | 1,424 | 1,627 | 120,760 | 2,123 | ||||||||||||||||||||
Goldman Sachs Emerging Markets Equity Fund | 32,570 | 98 | (6,685 | ) | 1,186 | 5,695 | 32,864 | — | ||||||||||||||||||||
Goldman Sachs Emerging Markets Equity Insights Fund | 40,977 | 13,620 | (10,979 | ) | 1,004 | 6,572 | 51,194 | — | ||||||||||||||||||||
Goldman Sachs Global Infrastructure Fund | — | 100,017 | (3,200 | ) | 41 | (541 | ) | 96,317 | 1,017 | |||||||||||||||||||
Goldman Sachs Global Real Estate Securities Fund | — | 127,477 | (6,200 | ) | 106 | 946 | 122,329 | 477 | ||||||||||||||||||||
Goldman Sachs High Yield Floating Rate Fund | 96,678 | 1,949 | (55,819 | ) | (883 | ) | 797 | 42,722 | 1,503 | |||||||||||||||||||
Goldman Sachs High Yield Fund | 82,283 | 21,930 | (22,909 | ) | (339 | ) | 1,365 | 82,330 | 2,445 | |||||||||||||||||||
Goldman Sachs International Real Estate Securities Fund | 111,754 | 904 | (120,446 | ) | 6,458 | 1,330 | — | — | ||||||||||||||||||||
86
GOLDMAN SACHS FUND OF FUNDS PORTFOLIOS
| 5. AGREEMENTS AND AFFILIATED TRANSACTIONS (continued) |
| Satellite Strategies Portfolio (continued) | ||||||||||||||||||||||||||||
| Underlying Funds | Market Value 12/31/2016 | Purchases at Cost* | Proceeds from Sales | Net Realized Gain (Loss) | Change in Unrealized Gain (Loss) | Market Value 6/30/2017 | Dividend Income | |||||||||||||||||||||
Goldman Sachs International Small Cap Insights Fund | $ | 110,733 | $ | 327 | $ | (43,948 | ) | $ | 9,530 | $ | 7,709 | $ | 84,351 | $ | — | |||||||||||||
Goldman Sachs Local Emerging Markets Debt Fund | 37,037 | 3,635 | (7,363 | ) | (2,435 | ) | 5,432 | 36,306 | 1,084 | |||||||||||||||||||
Goldman Sachs Real Estate Securities Fund | 115,284 | 5,298 | (118,841 | ) | 30,744 | (32,485 | ) | — | 795 | |||||||||||||||||||
Total | $ | 745,296 | $ | 371,244 | $ | (460,792 | ) | $ | 41,498 | $ | 1,668 | $ | 698,914 | $ | 9,596 | |||||||||||||
| * | Includes reinvestment of distributions. |
The table below shows the transactions in and earnings from investments in the Goldman Sachs Financial Square Government Fund for the six months ended June 30, 2017 (in thousands):
| Portfolio | Market Value 12/31/2016 | Purchases at Cost | Proceeds from Sales | Market Value 6/30/2017 | Dividend Income | |||||||||||||||
Balanced Strategy | $ | — | $ | 48,514 | $ | (38,149 | ) | $ | 10,365 | $ | 16 | |||||||||
Equity Growth | — | 27,350 | (20,985 | ) | 6,365 | 10 | ||||||||||||||
Growth and Income | — | 70,732 | (51,995 | ) | 18,737 | 26 | ||||||||||||||
Growth Strategy | — | 56,496 | (49,416 | ) | 7,080 | — | ||||||||||||||
Satellite Strategies | — | 7,681 | (7,681 | ) | — | — | ||||||||||||||
| 6. PORTFOLIO SECURITIES TRANSACTIONS |
The cost of purchases and proceeds from sales and maturities of long-term securities for the six months ended June 30, 2017, were:
| Portfolio | Purchases | Sales | ||||||||
Balanced Strategy | $ | 270,045,549 | $ | 284,244,349 | ||||||
Equity Growth Strategy | 169,759,961 | 205,794,326 | ||||||||
Growth and Income Strategy | 495,242,785 | 579,488,070 | ||||||||
Growth Strategy | 516,432,564 | 562,594,166 | ||||||||
Satellite Strategies | 371,244,616 | 460,793,525 | ||||||||
| 7. TAX INFORMATION |
As of the Portfolios’ most recent fiscal year end, December 31, 2016, the Portfolios’ capital loss carryforwards were as follows:
| Balanced Strategy | Equity Growth Strategy | Growth and Strategy | Growth Strategy | Satellite Strategies | ||||||||||||||||
Capital loss carryforwards:(1) | ||||||||||||||||||||
Expiring 2017 | $ | — | $ | (109,415,161 | ) | $ | (357,560,631 | ) | $ | (372,899,651 | ) | $ | — | |||||||
Expiring 2018 | (3,815,061 | ) | (76,608,179 | ) | (187,607,636 | ) | (181,275,105 | ) | (853,855 | ) | ||||||||||
Perpetual Long-term | — | — | — | — | (42,176,721 | ) | ||||||||||||||
Total capital loss carryforwards | $ | (3,815,061 | ) | $ | (186,023,340 | ) | $ | (545,168,267 | ) | $ | (554,174,756 | ) | $ | (43,030,576 | ) | |||||
| (1) | Expiration occurs on December 31 of the year indicated. |
87
GOLDMAN SACHS FUND OF FUNDS PORTFOLIOS
Notes to Financial Statements (continued)
June 30, 2017 (Unaudited)
| 7. TAX INFORMATION (continued) |
As of June 30, 2017, the Portfolios’ aggregate security unrealized gains and losses based on cost for U.S. federal income tax purposes were as follows:
| Balanced Strategy | Equity Growth Strategy | Growth and Income Strategy | Growth Strategy | Satellite Strategies | ||||||||||||||||
Tax Cost | $ | 501,406,494 | $ | 316,800,879 | $ | 869,179,615 | $ | 789,439,369 | $ | 707,279,125 | ||||||||||
Gross unrealized gain | 11,470,772 | 30,442,061 | 40,610,878 | 53,684,368 | 60,210,886 | |||||||||||||||
Gross unrealized loss | (15,444,583 | ) | (10,189,201 | ) | (18,955,346 | ) | (12,214,974 | ) | (68,576,370 | ) | ||||||||||
Net unrealized security gain (loss) | $ | (3,973,811 | ) | $ | 20,252,860 | $ | 21,655,532 | $ | 41,469,394 | $ | (8,365,484 | ) | ||||||||
The difference between GAAP-basis and tax basis unrealized gains (losses) is attributable primarily to wash sales and differences in the tax treatment of underlying fund investments.
GSAM has reviewed the Portfolios’ tax positions for all open tax years (the current and prior three years, as applicable) and has concluded that no provision for income tax is required in the Portfolios’ financial statements. Such open tax years remain subject to examination and adjustment by tax authorities.
| 8. OTHER RISKS |
The Portfolios’ risks include, but are not limited to, the following:
Derivatives Risk — The Portfolios’ use of derivatives may result in loss. Derivative instruments, which may pose risks in addition to and greater than those associated with investing directly in securities, currencies or other instruments, may be illiquid or less liquid, volatile, difficult to price and leveraged so that small changes in the value of the underlying instruments may produce disproportionate losses to the Portfolios. Derivatives are also subject to counterparty risk, which is the risk that the other party in the transaction will not fulfill its contractual obligation. The use of derivatives is a highly specialized activity that involves investment techniques and risks different from those associated with investments in more traditional securities and instruments. Losses from derivatives can also result from a lack of correlation between changes in the value of derivative instruments and the portfolio assets (if any) being hedged.
Foreign and Emerging Countries Risk — Investing in foreign markets may involve special risks and considerations not typically associated with investing in the United States. Foreign securities may be subject to risk of loss because of more or less foreign government regulation, less public information and less economic, political and social stability in the countries in which the Portfolios invest. The imposition of exchange controls, confiscations, trade restrictions (including tariffs) and other government restrictions by the United States or other governments, or from problems in share registration, settlement or custody, may also result in losses. Foreign risk also involves the risk of negative foreign currency rate fluctuations, which may cause the value of securities denominated in such foreign currency (or other instruments through which the Portfolios have exposure to foreign currencies) to decline in value. Currency exchange rates may fluctuate significantly over short periods of time. To the extent that the Portfolios also invest in securities of issuers located in emerging markets, these risks may be more pronounced.
Investments in the Underlying Funds — The investments of a Portfolio are concentrated in the Underlying Funds, and the Portfolio’s investment performance is directly related to the investment performance of the Underlying Funds it holds. A Portfolio is subject to the risk factors associated with the investments of the Underlying Funds in direct proportion to the amount of assets allocated to each. A Portfolio that has a relative concentration of its portfolio in a single Underlying Fund may be more susceptible to adverse developments affecting that Underlying Fund, and may be more susceptible to losses because of these developments.
88
GOLDMAN SACHS FUND OF FUNDS PORTFOLIOS
| 8. OTHER RISKS (continued) |
Large Shareholder Transactions Risk — A Portfolio or an Underlying Fund may experience adverse effects when certain large shareholders, such as other funds, institutional investors (including those trading by use of non-discretionary mathematical formulas), financial intermediaries (who may make investment decisions on behalf of underlying clients and/or include a Portfolio or an Underlying Fund in their investment model), individuals, accounts and Goldman Sachs affiliates, purchase or redeem large amounts of shares of a Portfolio or an Underlying Fund. Such large shareholder redemptions may cause a Portfolio or an Underlying Fund to sell portfolio securities at times when it would not otherwise do so, which may negatively impact the Portfolio’s or the Underlying Fund’s NAV and liquidity. These transactions may also accelerate the realization of taxable income to shareholders if such sales of investments resulted in gains, and may also increase transaction costs. In addition, a large redemption could result in a Portfolio’s or an Underlying Fund’s current expenses being allocated over a smaller asset base, leading to an increase in the expense ratio of the Portfolio or the Underlying Fund. Similarly, large Portfolio or Underlying Fund share purchases may adversely affect a Portfolio’s or an Underlying Fund’s performance to the extent that the Portfolio or the Underlying Fund is delayed in investing new cash and is required to maintain a larger cash position than it ordinarily would.
Liquidity Risk — A Portfolio may make investments that are illiquid or that may become less liquid in response to market developments or adverse investor perceptions. Illiquid investments may be more difficult to value. Liquidity risk may also refer to the risk that a Portfolio will not be able to pay redemption proceeds within the allowable time period because of unusual market conditions, an unusually high volume of redemption requests, or other reasons. To meet redemption requests, a Portfolio may be forced to sell investments at an unfavorable time and/or under unfavorable conditions. Liquidity risk may be the result of, among other things, the reduced number and capacity of traditional market participants to make a market in fixed income securities or the lack of an active market. The potential for liquidity risk may be magnified by a rising interest rate environment or other circumstances where investor redemptions from fixed income mutual funds may be higher than normal, potentially causing increased supply in the market due to selling activity
Market and Credit Risks — In the normal course of business, the Portfolios trade financial instruments and enter into financial transactions where risk of potential loss exists due to changes in the market (market risk). Additionally, the Portfolios may also be exposed to credit risk in the event that an issuer or guarantor fails to perform or that an institution or entity with which the Portfolios have unsettled or open transactions defaults.
Short Position Risk — A Portfolio may enter into a short position through a futures contract, an option or swap agreement or through short sales of any instrument that a Portfolio may purchase for investment. Taking short positions involves leverage of a Portfolio’s assets and presents various risks, including counterparty risk. If the value of the underlying instrument or market in which a Portfolio has taken a short position increases, then the Portfolio will incur a loss equal to the increase in value from the time that the short position was entered into plus any related interest payments or other fees. Taking short positions involves the risk that losses may be disproportionate, may exceed the amount invested, and may be unlimited.
| 9. INDEMNIFICATIONS |
Under the Trust’s organizational documents, its Trustees, officers, employees and agents are indemnified, to the extent permitted by the Act and state law, against certain liabilities that may arise out of performance of their duties to the Portfolios. Additionally, in the course of business, the Portfolios enter into contracts that contain a variety of indemnification clauses. The Portfolios’ maximum exposure under these arrangements is unknown, as this would involve future claims that may be made against the Portfolios that have not yet occurred. However, GSAM believes the risk of loss under these arrangements to be remote.
| 10. SUBSEQUENT EVENTS |
Subsequent events after the Statements of Assets and Liabilities date have been evaluated and GSAM has concluded that there is no impact requiring adjustment or disclosure in the financial statements.
89
GOLDMAN SACHS FUND OF FUNDS PORTFOLIOS
Notes to Financial Statements (continued)
June 30, 2017 (Unaudited)
| 11. SUMMARY OF SHARE TRANSACTIONS |
Share activity is as follows:
| Balanced Strategy Portfolio | ||||||||||||||||
|
| |||||||||||||||
| For the Six Months Ended June 30, 2017 (Unaudited) | For the Fiscal Year Ended December 31, 2016 | |||||||||||||||
|
| |||||||||||||||
| Shares | Dollars | Shares | Dollars | |||||||||||||
|
| |||||||||||||||
| Class A Shares | ||||||||||||||||
Shares sold | 1,562,861 | $ | 17,661,594 | 1,304,992 | $ | 13,770,277 | ||||||||||
Reinvestment of distributions | 46,588 | 524,364 | 137,043 | 1,356,933 | ||||||||||||
Shares redeemed | (2,718,282 | ) | (30,468,856 | ) | (3,507,542 | ) | (37,361,092 | ) | ||||||||
| (1,108,833 | ) | (12,282,898 | ) | (2,065,507 | ) | (22,233,882 | ) | |||||||||
| Class C Shares | ||||||||||||||||
Shares sold | 110,239 | 1,231,412 | 385,990 | 4,076,638 | ||||||||||||
Reinvestment of distributions | 1,868 | 20,919 | 17,705 | 157,731 | ||||||||||||
Shares redeemed | (1,216,847 | ) | (13,677,358 | ) | (1,197,111 | ) | (12,685,410 | ) | ||||||||
| (1,104,740 | ) | (12,425,027 | ) | (793,416 | ) | (8,451,041 | ) | |||||||||
| Institutional Shares | ||||||||||||||||
Shares sold | 6,015,739 | 66,382,399 | 10,147,524 | 108,227,941 | ||||||||||||
Reinvestment of distributions | 188,803 | 2,125,409 | 372,619 | 3,823,276 | ||||||||||||
Shares redeemed | (3,127,412 | ) | (34,933,516 | ) | (6,585,129 | ) | (69,890,047 | ) | ||||||||
| 3,077,130 | 33,574,292 | 3,935,014 | 42,161,170 | |||||||||||||
| Service Shares | ||||||||||||||||
Shares sold | 642 | 7,260 | 3,381 | 35,124 | ||||||||||||
Reinvestment of distributions | 65 | 732 | 168 | 1,696 | ||||||||||||
Shares redeemed | (3,511 | ) | (39,368 | ) | (20,210 | ) | (206,451 | ) | ||||||||
| (2,804 | ) | (31,376 | ) | (16,661 | ) | (169,631 | ) | |||||||||
| Class IR Shares | ||||||||||||||||
Shares sold | 141,938 | 1,577,855 | 111,987 | 1,176,013 | ||||||||||||
Reinvestment of distributions | 2,438 | 27,340 | 6,210 | 62,622 | ||||||||||||
Shares redeemed | (156,452 | ) | (1,720,763 | ) | (111,022 | ) | (1,171,660 | ) | ||||||||
| (12,076 | ) | (115,568 | ) | 7,175 | 66,975 | |||||||||||
| Class R Shares | ||||||||||||||||
Shares sold | 169,520 | 1,914,623 | 155,682 | 1,660,283 | ||||||||||||
Reinvestment of distributions | 2,173 | 24,412 | 4,880 | 48,518 | ||||||||||||
Shares redeemed | (97,572 | ) | (1,091,919 | ) | (95,680 | ) | (990,727 | ) | ||||||||
| 74,121 | 847,116 | 64,882 | 718,074 | |||||||||||||
| Class R6 Shares | ||||||||||||||||
Reinvestment of distributions | 6 | 69 | 14 | 150 | ||||||||||||
| 6 | 69 | 14 | 150 | |||||||||||||
NET INCREASE | 922,804 | $ | 9,566,608 | 1,131,501 | $ | 12,091,815 | ||||||||||
90
GOLDMAN SACHS FUND OF FUNDS PORTFOLIOS
| 11. SUMMARY OF SHARE TRANSACTIONS (continued) |
| Equity Growth Strategy Portfolio | ||||||||||||||||
|
| |||||||||||||||
| For the Six Months Ended June 30, 2017 (Unaudited) | For the Fiscal Year Ended December 31, 2016 | |||||||||||||||
|
| |||||||||||||||
| Shares | Dollars | Shares | Dollars | |||||||||||||
|
| |||||||||||||||
| Class A Shares | ||||||||||||||||
Shares sold | 846,588 | $ | 14,187,350 | 570,623 | $ | 8,318,394 | ||||||||||
Reinvestment of distributions | — | — | 86,684 | 1,323,668 | ||||||||||||
Shares redeemed | (1,354,382 | ) | (22,326,815 | ) | (1,825,945 | ) | (26,736,792 | ) | ||||||||
| (507,794 | ) | (8,139,465 | ) | (1,168,638 | ) | (17,094,730 | ) | |||||||||
| Class C Shares | ||||||||||||||||
Shares sold | 104,375 | 1,625,614 | 202,232 | 2,792,612 | ||||||||||||
Reinvestment of distributions | — | — | 19,813 | 289,463 | ||||||||||||
Shares redeemed | (1,223,396 | ) | (19,377,876 | ) | (1,135,691 | ) | (15,834,867 | ) | ||||||||
| (1,119,021 | ) | (17,752,262 | ) | (913,646 | ) | (12,752,792 | ) | |||||||||
| Institutional Shares | ||||||||||||||||
Shares sold | 593,822 | 9,745,894 | 488,723 | 7,044,754 | ||||||||||||
Reinvestment of distributions | — | — | 117,877 | 1,815,311 | ||||||||||||
Shares redeemed | (455,841 | ) | (7,584,411 | ) | (916,564 | ) | (13,784,924 | ) | ||||||||
| 137,981 | 2,161,483 | (309,964 | ) | (4,924,859 | ) | |||||||||||
| Service Shares | ||||||||||||||||
Shares sold | 5,420 | 87,378 | 2,466 | 37,207 | ||||||||||||
Reinvestment of distributions | — | — | 266 | 4,050 | ||||||||||||
Shares redeemed | (873 | ) | (14,373 | ) | (11,914 | ) | (173,518 | ) | ||||||||
| 4,547 | 73,005 | (9,182 | ) | (132,261 | ) | |||||||||||
| Class IR Shares | ||||||||||||||||
Shares sold | 97,088 | 1,579,720 | 70,515 | 1,041,662 | ||||||||||||
Reinvestment of distributions | — | — | 5,207 | 78,416 | ||||||||||||
Shares redeemed | (88,741 | ) | (1,443,373 | ) | (69,690 | ) | (1,001,202 | ) | ||||||||
| 8,347 | 136,347 | 6,032 | 118,876 | |||||||||||||
| Class R Shares | ||||||||||||||||
Shares sold | 177,632 | 2,968,005 | 65,279 | 956,171 | ||||||||||||
Reinvestment of distributions | — | — | 1,455 | 22,087 | ||||||||||||
Shares redeemed | (6,916 | ) | (110,323 | ) | (56,858 | ) | (842,043 | ) | ||||||||
| 170,716 | 2,857,682 | 9,876 | 136,215 | |||||||||||||
| Class R6 Shares | ||||||||||||||||
Shares sold | 20,863 | 358,431 | — | — | ||||||||||||
Reinvestment of distributions | — | — | 11 | 159 | ||||||||||||
| 20,863 | 358,431 | 11 | 159 | |||||||||||||
NET DECREASE | (1,284,361 | ) | $ | (20,304,779 | ) | (2,385,511 | ) | $ | (34,649,392 | ) | ||||||
91
GOLDMAN SACHS FUND OF FUNDS PORTFOLIOS
Notes to Financial Statements (continued)
June 30, 2017 (Unaudited)
| 11. SUMMARY OF SHARE TRANSACTIONS (continued) |
| Growth and Income Strategy Portfolio | ||||||||||||||||
|
| |||||||||||||||
| For the Six Months Ended June 30, 2017 (Unaudited) | For the Fiscal Year Ended December 31, 2016 | |||||||||||||||
|
| |||||||||||||||
| Shares | Dollars | Shares | Dollars | |||||||||||||
|
| |||||||||||||||
| Class A Shares | ||||||||||||||||
Shares sold | 2,032,250 | $ | 26,338,012 | 1,365,273 | $ | 16,166,069 | ||||||||||
Reinvestment of distributions | 65,673 | 850,072 | 239,415 | 2,792,520 | ||||||||||||
Shares redeemed | (4,070,476 | ) | (51,886,731 | ) | (6,101,239 | ) | (72,491,545 | ) | ||||||||
| (1,972,553 | ) | (24,698,647 | ) | (4,496,551 | ) | (53,532,956 | ) | |||||||||
| Class C Shares | ||||||||||||||||
Shares sold | 177,423 | 2,200,896 | 456,253 | 5,256,192 | ||||||||||||
Reinvestment of distributions | — | — | 56,296 | 633,984 | ||||||||||||
Shares redeemed | (2,897,914 | ) | (36,437,289 | ) | (2,831,028 | ) | (32,844,634 | ) | ||||||||
| (2,720,491 | ) | (34,236,393 | ) | (2,318,479 | ) | (26,954,458 | ) | |||||||||
| Institutional Shares | ||||||||||||||||
Shares sold | 4,127,104 | 51,850,949 | 7,260,475 | 86,374,463 | ||||||||||||
Reinvestment of distributions | 190,158 | 2,465,978 | 511,172 | 6,047,403 | ||||||||||||
Shares redeemed | (3,307,220 | ) | (42,277,378 | ) | (7,281,211 | ) | (86,086,481 | ) | ||||||||
| 1,010,042 | 12,039,549 | 490,436 | 6,335,385 | |||||||||||||
| Service Shares | ||||||||||||||||
Shares sold | 13,669 | 172,858 | 22,623 | 266,472 | ||||||||||||
Reinvestment of distributions | 169 | 2,188 | 669 | 7,816 | ||||||||||||
Shares redeemed | (19,284 | ) | (243,084 | ) | (35,261 | ) | (418,442 | ) | ||||||||
| (5,446 | ) | (68,038 | ) | (11,969 | ) | (144,154 | ) | |||||||||
| Class IR Shares | ||||||||||||||||
Shares sold | 168,463 | 2,121,713 | 173,666 | 2,050,582 | ||||||||||||
Reinvestment of distributions | 2,039 | 26,256 | 4,805 | 56,795 | ||||||||||||
Shares redeemed | (88,855 | ) | (1,122,799 | ) | (51,436 | ) | (612,640 | ) | ||||||||
| 81,647 | 1,025,170 | 127,035 | 1,494,737 | |||||||||||||
| Class R Shares | ||||||||||||||||
Shares sold | 191,169 | 2,460,554 | 91,561 | 1,063,116 | ||||||||||||
Reinvestment of distributions | 776 | 10,024 | 1,597 | 18,665 | ||||||||||||
Shares redeemed | (31,446 | ) | (392,172 | ) | (74,830 | ) | (892,323 | ) | ||||||||
| 160,499 | 2,078,406 | 18,328 | 189,458 | |||||||||||||
| Class R6 Shares | ||||||||||||||||
Shares sold | 3,864 | 49,819 | — | — | ||||||||||||
Reinvestment of distributions | 16 | 214 | 12 | 140 | ||||||||||||
Shares redeemed | (1 | ) | (19 | ) | — | — | ||||||||||
| 3,879 | 50,014 | 12 | 140 | |||||||||||||
NET DECREASE | (3,442,423 | ) | $ | (43,809,939 | ) | (6,191,188 | ) | $ | (72,611,848 | ) | ||||||
92
GOLDMAN SACHS FUND OF FUNDS PORTFOLIOS
| 11. SUMMARY OF SHARE TRANSACTIONS (continued) |
| Growth Strategy Portfolio | ||||||||||||||||
|
| |||||||||||||||
| For the Six Months Ended June 30, 2017 (Unaudited) | For the Fiscal Year Ended December 31, 2016 | |||||||||||||||
|
| |||||||||||||||
| Shares | Dollars | Shares | Dollars | |||||||||||||
|
| |||||||||||||||
| Class A Shares | ||||||||||||||||
Shares sold | 1,757,457 | $ | 25,485,562 | 1,150,609 | $ | 14,703,864 | ||||||||||
Reinvestment of distributions | 28 | — | 194,046 | 2,600,263 | ||||||||||||
Shares redeemed | (3,182,110 | ) | (45,311,580 | ) | (5,363,707 | ) | (69,349,359 | ) | ||||||||
| (1,424,625 | ) | (19,826,018 | ) | (4,019,052 | ) | (52,045,232 | ) | |||||||||
| Class C Shares | ||||||||||||||||
Shares sold | 198,306 | 2,800,968 | 387,445 | 4,902,656 | ||||||||||||
Reinvestment of distributions | — | — | 12,122 | 162,306 | ||||||||||||
Shares redeemed | (2,531,819 | ) | (36,235,571 | ) | (2,363,647 | ) | (30,366,375 | ) | ||||||||
| (2,333,513 | ) | (33,434,603 | ) | (1,964,080 | ) | (25,301,413 | ) | |||||||||
| Institutional Shares | ||||||||||||||||
Shares sold | 3,197,608 | 44,523,600 | 4,285,762 | 56,142,009 | ||||||||||||
Reinvestment of distributions | — | — | 318,476 | 4,264,396 | ||||||||||||
Shares redeemed | (1,147,495 | ) | (16,311,982 | ) | (3,435,572 | ) | (44,292,820 | ) | ||||||||
| 2,050,113 | 28,211,618 | 1,168,666 | 16,113,585 | |||||||||||||
| Service Shares | ||||||||||||||||
Shares sold | 14,609 | 219,436 | 22,477 | 283,463 | ||||||||||||
Reinvestment of distributions | — | — | 307 | 4,099 | ||||||||||||
Shares redeemed | (7,288 | ) | (105,254 | ) | (23,697 | ) | (304,647 | ) | ||||||||
| 7,321 | 114,182 | (913 | ) | (17,085 | ) | |||||||||||
| Class IR Shares | ||||||||||||||||
Shares sold | 147,703 | 2,062,090 | 91,395 | 1,177,569 | ||||||||||||
Reinvestment of distributions | — | — | 3,908 | 51,626 | ||||||||||||
Shares redeemed | (93,488 | ) | (1,295,089 | ) | (94,057 | ) | (1,191,165 | ) | ||||||||
| 54,215 | 767,001 | 1,246 | 38,030 | |||||||||||||
| Class R Shares | ||||||||||||||||
Shares sold | 208,391 | 2,945,858 | 93,988 | 1,160,579 | ||||||||||||
Reinvestment of distributions | — | — | 1,262 | 16,524 | ||||||||||||
Shares redeemed | (47,334 | ) | (666,572 | ) | (87,493 | ) | (1,115,834 | ) | ||||||||
| 161,057 | 2,279,286 | 7,757 | 61,269 | |||||||||||||
| Class R6 Shares | ||||||||||||||||
Shares sold | 172,194 | 2,505,547 | — | — | ||||||||||||
Reinvestment of distributions | — | — | 10 | 137 | ||||||||||||
| 172,194 | 2,505,547 | 10 | 137 | |||||||||||||
NET DECREASE | (1,313,238 | ) | $ | (19,382,987 | ) | (4,806,366 | ) | $ | (61,150,709 | ) | ||||||
93
GOLDMAN SACHS FUND OF FUNDS PORTFOLIOS
Notes to Financial Statements (continued)
June 30, 2017 (Unaudited)
| 11. SUMMARY OF SHARE TRANSACTIONS (continued) |
| Satellite Strategies Portfolio | ||||||||||||||||
|
| |||||||||||||||
| For the Six Months Ended June 30, 2017 (Unaudited) | For the Fiscal Year Ended December 31, 2016 | |||||||||||||||
|
| |||||||||||||||
| Shares | Dollars | Shares | Dollars | |||||||||||||
|
| |||||||||||||||
| Class A Shares | ||||||||||||||||
Shares sold | 539,500 | $ | 4,305,705 | 1,455,140 | $ | 11,045,563 | ||||||||||
Reinvestment of distributions | 75,478 | 605,640 | 377,839 | 2,903,993 | ||||||||||||
Shares redeemed | (3,863,783 | ) | (30,715,190 | ) | (6,662,149 | ) | (50,979,543 | ) | ||||||||
| (3,248,805 | ) | (25,803,845 | ) | (4,829,170 | ) | (37,029,987 | ) | |||||||||
| Class C Shares | ||||||||||||||||
Shares sold | 65,959 | 521,683 | 174,372 | 1,322,001 | ||||||||||||
Reinvestment of distributions | 32,522 | 259,831 | 155,698 | 1,186,774 | ||||||||||||
Shares redeemed | (1,321,092 | ) | (10,411,859 | ) | (2,562,350 | ) | (19,337,931 | ) | ||||||||
| (1,222,611 | ) | (9,630,345 | ) | (2,232,280 | ) | (16,829,156 | ) | |||||||||
| Institutional Shares | ||||||||||||||||
Shares sold | 5,496,017 | 43,642,154 | 13,139,193 | 100,348,717 | ||||||||||||
Reinvestment of distributions | 642,701 | 5,144,326 | 2,162,310 | 16,589,842 | ||||||||||||
Shares redeemed | (11,112,855 | ) | (88,684,086 | ) | (36,608,793 | ) | (277,861,660 | ) | ||||||||
| (4,974,137 | ) | (39,897,606 | ) | (21,307,290 | ) | (160,923,101 | ) | |||||||||
| Service Shares | ||||||||||||||||
Shares sold | 1,776 | 14,010 | 5,394 | 40,928 | ||||||||||||
Reinvestment of distributions | 245 | 1,966 | 782 | 5,995 | ||||||||||||
Shares redeemed | (8,611 | ) | (68,912 | ) | (85,614 | ) | (636,161 | ) | ||||||||
| (6,590 | ) | (52,936 | ) | (79,438 | ) | (589,238 | ) | |||||||||
| Class IR Shares | ||||||||||||||||
Shares sold | 1,549,121 | 12,243,136 | 2,466,382 | 18,843,524 | ||||||||||||
Reinvestment of distributions | 78,881 | 631,762 | 282,060 | 2,162,105 | ||||||||||||
Shares redeemed | (2,520,283 | ) | (19,941,143 | ) | (4,131,549 | ) | (31,588,948 | ) | ||||||||
| (892,281 | ) | (7,066,245 | ) | (1,383,107 | ) | (10,583,319 | ) | |||||||||
| Class R Shares | ||||||||||||||||
Shares sold | 30,625 | 241,931 | 68,607 | 512,208 | ||||||||||||
Reinvestment of distributions | 2,572 | 20,560 | 10,387 | 79,387 | ||||||||||||
Shares redeemed | (73,109 | ) | (571,458 | ) | (132,999 | ) | (1,003,830 | ) | ||||||||
| (39,912 | ) | (308,967 | ) | (54,005 | ) | (412,235 | ) | |||||||||
| Class R6 Shares | ||||||||||||||||
Shares sold | 205,163 | 1,629,562 | 4,543,035 | 35,084,600 | ||||||||||||
Reinvestment of distributions | 52,996 | 424,852 | 77,800 | 591,317 | ||||||||||||
Shares redeemed | (248,927 | ) | (1,975,647 | ) | (190,793 | ) | (1,467,630 | ) | ||||||||
| 9,232 | 78,767 | 4,430,042 | 34,208,287 | |||||||||||||
NET DECREASE | (10,375,104 | ) | $ | (82,681,177 | ) | (25,455,248 | ) | $ | (192,158,749 | ) | ||||||
94
GOLDMAN SACHS FUND OF FUNDS PORTFOLIOS
Portfolio Expenses — Six Month Period Ended June 30, 2017 (Unaudited)
As a shareholder of Class A, Class C, Institutional, Service, Class IR, Class R and Class R6 Shares of a Portfolio, you incur two types of costs: (1) transaction costs, including sales charges on purchase payments (with respect to Class A Shares), contingent deferred sales charges on redemptions (with respect to Class C Shares), and (2) ongoing costs, including management fees; distribution and/or service (12b-1) fees (with respect to Class A, Class C and Class R Shares); and other Portfolio expenses. This Example is intended to help you understand your ongoing costs (in dollars) of investing in Class A, Class C, Institutional, Service, Class IR, Class R and Class R6 Shares of the Portfolios and to compare these costs with the ongoing costs of investing in other mutual funds.
The Example is based on an investment of $1,000 invested at the beginning of the period and held for the entire period from January 1, 2017 through June 30, 2017, which represents a period of 181 days in a 365 day year.
Actual Expenses — The first line under each share class in the table below provides information about actual account values and actual expenses. You may use the information in this line, together with the amount you invested, to estimate the expenses that you paid over the period. Simply divide your account value by $1,000 (for example, an $8,600 account value divided by $1,000=8.6), then multiply the result by the number in the first line under the heading entitled “Expenses Paid” to estimate the expenses you paid on your account during this period.
Hypothetical Example for Comparison Purposes — The second line under each share class in the table below provides information about hypothetical account values and hypothetical expenses based on the Portfolio’s actual net expense ratios and an assumed rate of return of 5% per year before expenses, which is not the Portfolio’s actual return. The hypothetical account values and expenses may not be used to estimate the actual ending account balance or expenses you paid for the period. You may use this information to compare the ongoing costs of investing in the Portfolios and other funds. To do so, compare this 5% hypothetical example with the 5% hypothetical examples that appear in the shareholder reports of the other funds.
Please note that the expenses shown in the table are meant to highlight your ongoing costs only and do not reflect any transactional costs, such as sales charges, redemption fees, or exchange fees and do not include expenses of Underlying Funds in which the Portfolios invest. Therefore, the second line of the table is useful in comparing ongoing costs only, and will not help you determine the relative total costs of owning different funds. In addition, if these transactional costs were included, your costs would have been higher.
| Balanced Strategy Portfolio | Equity Growth Strategy Portfolio | Growth and Income Strategy Portfolio | Growth Strategy Portfolio | Satellite Strategies Portfolio | ||||||||||||||||||||||||||||||||||||||||||||||||||||||||
| Share Class | Beginning Account Value 1/1/17 | Ending Account Value 6/30/17 | Expenses Paid for the 6 months ended 6/30/17** | Beginning Account Value 1/1/17 | Ending Account Value 6/30/17 | Expenses Paid for the 6 months ended 6/30/17** | Beginning Account Value 1/1/17 | Ending Account Value 6/30/17 | Expenses Paid for the 6 months ended 6/30/17** | Beginning Account Value 1/1/17 | Ending Account Value 6/30/17 | Expenses Paid for the 6 months ended 6/30/17** | Beginning Account Value 1/1/17 | Ending Account Value 6/30/17 | Expenses Paid for the 6 months ended 6/30/17** | |||||||||||||||||||||||||||||||||||||||||||||
| Class A | ||||||||||||||||||||||||||||||||||||||||||||||||||||||||||||
Actual | $ | 1,000.00 | $ | 1,052.80 | $ | 3.00 | $ | 1,000.00 | $ | 1,120.70 | $ | 3.10 | $ | 1,000.00 | $ | 1,075.60 | $ | 3.04 | $ | 1,000.00 | $ | 1,096.30 | $ | 3.07 | $ | 1,000.00 | $ | 1,070.80 | $ | 2.93 | ||||||||||||||||||||||||||||||
Hypothetical 5% return | 1,000.00 | 1,021.87 | + | 2.96 | 1,000.00 | 1,021.87 | + | 2.96 | 1,000.00 | 1,021.87 | + | 2.96 | 1,000.00 | 1,021.87 | + | 2.96 | 1,000.00 | 1,021.97 | + | 2.86 | ||||||||||||||||||||||||||||||||||||||||
| Class C | ||||||||||||||||||||||||||||||||||||||||||||||||||||||||||||
Actual | 1,000.00 | 1,048.60 | 6.81 | 1,000.00 | 1,117.30 | 7.03 | 1,000.00 | 1,072.30 | 6.89 | 1,000.00 | 1,092.70 | 6.95 | 1,000.00 | 1,066.00 | 6.76 | |||||||||||||||||||||||||||||||||||||||||||||
Hypothetical 5% return | 1,000.00 | 1,018.15 | + | 6.71 | 1,000.00 | 1,018.15 | + | 6.71 | 1,000.00 | 1,018.15 | + | 6.71 | 1,000.00 | 1,018.15 | + | 6.71 | 1,000.00 | 1,018.25 | + | 6.61 | ||||||||||||||||||||||||||||||||||||||||
| Institutional | ||||||||||||||||||||||||||||||||||||||||||||||||||||||||||||
Actual | 1,000.00 | 1,054.80 | 0.97 | 1,000.00 | 1,122.90 | 1.00 | 1,000.00 | 1,077.40 | 0.98 | 1,000.00 | 1,098.70 | 0.99 | 1,000.00 | 1,073.10 | 0.87 | |||||||||||||||||||||||||||||||||||||||||||||
Hypothetical 5% return | 1,000.00 | 1,023.85 | + | 0.95 | 1,000.00 | 1,023.85 | + | 0.95 | 1,000.00 | 1,023.85 | + | 0.95 | 1,000.00 | 1,023.85 | + | 0.95 | 1,000.00 | 1,023.95 | + | 0.85 | ||||||||||||||||||||||||||||||||||||||||
| Service | ||||||||||||||||||||||||||||||||||||||||||||||||||||||||||||
Actual | 1,000.00 | 1,051.70 | 3.51 | 1,000.00 | 1,119.80 | 3.63 | 1,000.00 | 1,075.30 | 3.55 | 1,000.00 | 1,095.90 | 3.59 | 1,000.00 | 1,070.40 | 3.44 | |||||||||||||||||||||||||||||||||||||||||||||
Hypothetical 5% return | 1,000.00 | 1,021.37 | + | 3.46 | 1,000.00 | 1,021.37 | + | 3.46 | 1,000.00 | 1,021.37 | + | 3.46 | 1,000.00 | 1,021.37 | + | 3.46 | 1,000.00 | 1,021.47 | + | 3.36 | ||||||||||||||||||||||||||||||||||||||||
| Class IR | ||||||||||||||||||||||||||||||||||||||||||||||||||||||||||||
Actual | 1,000.00 | 1,054.30 | 1.73 | 1,000.00 | 1,123.10 | 1.79 | 1,000.00 | 1,076.40 | 1.75 | 1,000.00 | 1,097.70 | 1.77 | 1,000.00 | 1,072.30 | 1.64 | |||||||||||||||||||||||||||||||||||||||||||||
Hypothetical 5% return | 1,000.00 | 1,023.11 | + | 1.71 | 1,000.00 | 1,023.11 | + | 1.71 | 1,000.00 | 1,023.11 | + | 1.71 | 1,000.00 | 1,023.11 | + | 1.71 | 1,000.00 | 1,023.21 | + | 1.61 | ||||||||||||||||||||||||||||||||||||||||
| Class R | ||||||||||||||||||||||||||||||||||||||||||||||||||||||||||||
Actual | 1,000.00 | 1,051.10 | 4.27 | 1,000.00 | 1,120.10 | 4.42 | 1,000.00 | 1,074.60 | 4.32 | 1,000.00 | 1,094.80 | 4.36 | 1,000.00 | 1,068.60 | 4.21 | |||||||||||||||||||||||||||||||||||||||||||||
Hypothetical 5% return | 1,000.00 | 1,020.63 | + | 4.21 | 1,000.00 | 1,020.63 | + | 4.21 | 1,000.00 | 1,020.63 | + | 4.21 | 1,000.00 | 1,020.63 | + | 4.21 | 1,000.00 | 1,020.73 | + | 4.11 | ||||||||||||||||||||||||||||||||||||||||
| Class R6 | ||||||||||||||||||||||||||||||||||||||||||||||||||||||||||||
Actual | 1,000.00 | 1,054.80 | 0.97 | 1,000.00 | 1,123.60 | 0.95 | 1,000.00 | 1,078.30 | 0.93 | 1,000.00 | 1,099.50 | 0.94 | 1,000.00 | 1,073.10 | 0.77 | |||||||||||||||||||||||||||||||||||||||||||||
Hypothetical 5% return | 1,000.00 | 1,023.85 | + | 0.95 | 1,000.00 | 1,023.90 | + | 0.90 | 1,000.00 | 1,023.90 | + | 0.90 | 1,000.00 | 1,023.90 | + | 0.90 | 1,000.00 | 1,024.05 | + | 0.75 | ||||||||||||||||||||||||||||||||||||||||
| * | Expenses for each share class are calculated using each Portfolio’s annualized net expense ratio for each class, which represents the ongoing expenses as a percentage of net assets for the six months ended June 30, 2017. Expenses are calculated by multiplying the annualized net expense ratio by the average account value for the period; then multiplying the result by the number of days in the most recent fiscal half year; and then dividing that result by the number of days in the fiscal year. The annualized net expense ratios for the period were as follows: |
| Fund | Class A | Class C | Institutional | Service | Class IR | Class R | Class R6 | |||||||||||||||||||||
Balanced Strategy | 0.59 | % | 1.34 | % | 0.19 | % | 0.69 | % | 0.34 | % | 0.84 | % | 0.19 | % | ||||||||||||||
Equity Growth Strategy | 0.59 | 1.34 | 0.19 | 0.69 | 0.34 | 0.84 | 0.18 | |||||||||||||||||||||
Growth and Income Strategy | 0.59 | 1.34 | 0.19 | 0.69 | 0.34 | 0.84 | 0.18 | |||||||||||||||||||||
Growth Strategy | 0.59 | 1.34 | 0.19 | 0.69 | 0.34 | 0.84 | 0.18 | |||||||||||||||||||||
Satellite Strategies | 0.57 | 1.32 | 0.17 | 0.67 | 0.32 | 0.82 | 0.15 | |||||||||||||||||||||
95
GOLDMAN SACHS FUND OF FUNDS PORTFOLIOS
Statement Regarding Basis for Approval of Management Agreement (Unaudited)
Background
The Goldman Sachs Balanced Strategy Portfolio, Goldman Sachs Equity Growth Strategy Portfolio, Goldman Sachs Growth and Income Strategy Portfolio, Goldman Sachs Growth Strategy Portfolio, and Goldman Sachs Satellite Strategies Portfolio (the “Portfolios”) are investment portfolios of Goldman Sachs Trust (the “Trust”). The Board of Trustees oversees the management of the Trust and reviews the investment performance and expenses of the Portfolios at regularly scheduled meetings held throughout the year. In addition, the Board of Trustees determines annually whether to approve the continuance of the Trust’s investment management agreement (the “Management Agreement”) with Goldman Sachs Asset Management, L.P. (the “Investment Adviser”) on behalf of the Portfolios.
The Management Agreement was most recently approved for continuation until June 30, 2018 by the Board of Trustees, including those Trustees who are not parties to the Management Agreement or “interested persons” (as defined in the Investment Company Act of 1940, as amended) of any party thereto (the “Independent Trustees”), at a meeting held on June 14-15, 2017 (the “Annual Meeting”).
The review process undertaken by the Trustees spans the course of the year and culminates with the Annual Meeting. To assist the Trustees in their deliberations, the Trustees have established a Contract Review Committee (the “Committee”), comprised of the Independent Trustees. The Committee held four meetings over the course of the year since the Management Agreement was last approved. At those Committee meetings, regularly scheduled Board or other committee meetings, and/or the Annual Meeting, matters relevant to the renewal of the Management Agreement were considered by the Board, or the Independent Trustees, as applicable. With respect to each Portfolio, such matters included:
| (a) | the nature and quality of the advisory, administrative, and other services provided to the Portfolio and the underlying funds in which it invests (the “Underlying Funds”) by the Investment Adviser and its affiliates, including information about: |
| (i) | the structure, staff, and capabilities of the Investment Adviser and its portfolio management teams; |
| (ii) | the groups within the Investment Adviser and its affiliates that support the portfolio management teams or provide other types of necessary services, including fund services groups (e.g., accounting and financial reporting, tax, shareholder services, and operations); controls and risk management groups (e.g., legal, compliance, valuation oversight, credit risk management, internal audit, compliance testing, market risk analysis, finance, and central funding); sales and distribution support groups, and others (e.g., information technology and training); |
| (iii) | trends in employee headcount; |
| (iv) | the Investment Adviser’s financial resources and ability to hire and retain talented personnel and strengthen its operations; and |
| (v) | the parent company’s support of the Investment Adviser and its mutual fund business, as expressed by the firm’s senior management; |
| (b) | information on the investment performance of the Portfolio and Underlying Funds, including comparisons to the performance of similar mutual funds, as provided by a third-party mutual fund data provider engaged as part of the contract review process (the “Outside Data Provider”), and a benchmark performance index; and information on general investment outlooks in the markets in which the Underlying Funds invest; |
| (c) | information provided by the Investment Adviser indicating the Investment Adviser’s views on whether the Portfolio’s peer group and/or benchmark index had high, medium, or low relevance given the Portfolio’s particular investment strategy; |
| (d) | the terms of the Management Agreement and other agreements with affiliated service providers entered into by the Trust on behalf of the Portfolio; |
| (e) | fee and expense information for the Portfolio, including: |
| (i) | the relative management fee and expense levels of the Portfolio as compared to those of comparable funds managed by other advisers, as provided by the Outside Data Provider; |
| (ii) | the Portfolio’s expense trends over time; and |
| (iii) | to the extent the Investment Adviser manages other types of accounts (such as bank collective trusts, private wealth management accounts, institutional separate accounts, sub-advised mutual funds, and non-U.S. funds) having investment objectives and policies similar to those of the Portfolio, comparative information on the advisory fees charged and services provided to those accounts by the Investment Adviser; |
| (f) | with respect to the extensive investment performance and expense comparison data provided by the Outside Data Provider, its processes in producing that data for the Portfolio; |
96
GOLDMAN SACHS FUND OF FUNDS PORTFOLIOS
Statement Regarding Basis for Approval of Management Agreement (Unaudited) (continued)
| (g) | the undertakings of the Investment Adviser and its affiliates to implement fee waivers and/or expense limitations of the Portfolio and the Underlying Funds; |
| (h) | information relating to the profitability of the Management Agreement and the transfer agency and distribution and service arrangements of the Portfolio to the Investment Adviser and its affiliates; |
| (i) | whether the Portfolio’s existing management fee schedule, together with the management fee schedules of the Underlying Funds, adequately addressed any economies of scale; |
| (j) | a summary of the “fall-out” benefits derived by the Investment Adviser and its affiliates from their relationships with the Portfolio and/or the Underlying Funds, including the fees received by the Investment Adviser’s affiliates from the Portfolio and/or the Underlying Funds for transfer agency, securities lending, portfolio trading, distribution and other services; |
| (k) | a summary of potential benefits derived by the Portfolio and/or the Underlying Funds as a result of their relationship with the Investment Adviser; |
| (l) | with respect to the applicable Underlying Funds, information regarding commissions paid by the Underlying Equity Funds and broker oversight, an update on the Investment Adviser’s soft dollars practices, other information regarding portfolio trading, and how the Investment Adviser carries out its duty to seek best execution; |
| (m) | portfolio manager ownership of Portfolio shares; the manner in which portfolio manager compensation is determined; and the number and types of accounts managed by the portfolio managers; |
| (n) | the nature and quality of the services provided to the Portfolio and the Underlying Funds by their unaffiliated service providers, and the Investment Adviser’s general oversight and evaluation (including reports on due diligence) of those service providers as part of the administrative services provided under the Management Agreement; and |
| (o) | the Investment Adviser’s processes and policies addressing various types of potential conflicts of interest; its approach to risk management; the annual review of the effectiveness of the Portfolio’s compliance program; and periodic compliance reports. |
The Trustees also received an overview of the Portfolios’ distribution arrangements. They received information regarding the Portfolios’ assets, share purchase and redemption activity, and payment of distribution, service, and shareholder administration fees, as applicable. Information was also provided to the Trustees relating to revenue sharing payments made by and services provided by the Investment Adviser and its affiliates to intermediaries that promote the sale, distribution, and/or servicing of Portfolio shares. The Independent Trustees also discussed the broad range of other investment choices that are available to Portfolio investors, including the availability of comparable funds managed by other advisers.
The presentations made at the Board and Committee meetings and at the Annual Meeting encompassed the Portfolios and other mutual funds for which the Board of Trustees has responsibility. In evaluating the Management Agreement at the Annual Meeting, the Trustees relied upon their knowledge, resulting from their meetings and other interactions throughout the year, of the Investment Adviser and its affiliates, their services, and the Portfolios. In conjunction with these meetings, the Trustees received written materials and oral presentations on the topics covered, and the Investment Adviser addressed the questions and concerns of the Trustees, including concerns regarding the investment performance of certain of the funds they oversee. The Independent Trustees were advised by their independent legal counsel regarding their responsibilities and other regulatory requirements related to the approval and continuation of mutual fund investment management agreements under applicable law. In addition, the Investment Adviser and its affiliates provided the Independent Trustees with a written response to a formal request for information sent on behalf of the Independent Trustees by their independent legal counsel. During the course of their deliberations, the Independent Trustees met in executive sessions with their independent legal counsel, without representatives of the Investment Adviser or its affiliates present.
Nature, Extent, and Quality of the Services Provided Under the Management Agreement
As part of their review, the Trustees considered the nature, extent, and quality of the services provided to the Portfolios and the Underlying Funds by the Investment Adviser. In this regard, the Trustees considered both the investment advisory services and non-advisory services that are provided by the Investment Adviser and its affiliates. The Trustees noted the transition in the leadership and changes in personnel of various of the Investment Adviser’s portfolio management teams that had occurred in recent periods, and the ongoing recruitment efforts aimed at bringing high quality investment talent to the Investment Adviser. They also noted the Investment Adviser’s commitment to maintaining high quality systems and expending substantial resources to respond to ongoing changes to the regulatory and control environment in which the Portfolios and the Underlying Funds and their service providers operate, as well as the efforts of the Investment Adviser and its affiliates to combat cyber security risks. The Trustees concluded that the Investment Adviser continued to commit substantial financial and operational resources to the
97
GOLDMAN SACHS FUND OF FUNDS PORTFOLIOS
Statement Regarding Basis for Approval of Management Agreement (Unaudited) (continued)
Portfolios and expressed confidence that the Investment Adviser would continue to do so in the future. The Trustees also recognized that the Investment Adviser had made significant commitments to address regulatory compliance requirements applicable to the Portfolios, the Underlying Funds, and the Investment Adviser and its affiliates.
Investment Performance
The Trustees also considered the investment performance of the Portfolios and the Underlying Funds. In this regard, they compared the investment performance of each Portfolio to its peers using rankings and ratings compiled by the Outside Data Provider as of December 31, 2016, and updated performance information prepared by the Investment Adviser using the peer group identified by the Outside Data Provider as of March 31, 2017. The information on each Portfolio’s investment performance was provided for the one-, three-, five-, and ten-year periods ending on the applicable dates, to the extent that each Portfolio had been in existence for those periods. The Trustees also reviewed each Portfolio’s investment performance relative to its performance benchmark. As part of this review, they considered the investment performance trends of the Portfolios over time, and reviewed the investment performance of each Portfolio in light of its investment objective and policies and market conditions.
In addition, the Trustees considered materials prepared and presentations made by the Investment Adviser’s senior management and portfolio management personnel in which Portfolio performance was assessed. The Trustees also considered the Investment Adviser’s periodic reports with respect to the Underlying Funds’ risk profiles, and how the Investment Adviser’s approach to risk monitoring and management influences portfolio management. They noted the efforts of the portfolio management team of certain Underlying Funds to continue to enhance the investment models used in managing the Underlying Funds.
The Trustees observed that the Balanced Strategy Portfolio’s Institutional Shares had placed in the second quartile of the Portfolio’s peer group for the three-, five-, and ten-year periods and in the third quartile for the one-year period, and had outperformed the Portfolio’s benchmark index for the one-year period and underperformed for the three-, five-, and ten-year periods ended March 31, 2017. The Trustees further observed that the Equity Growth Strategy Portfolio’s Institutional Shares had placed in the top half of the Portfolio’s peer group for the one-, three-, and five-year periods and in the third quartile for the ten-year period, and had outperformed the Portfolio’s benchmark index for the one-, three- and five-year periods and underperformed for the ten-year period ended March 31, 2017. They noted that the Growth and Income Strategy Portfolio’s Institutional Shares had placed in the top half of the Portfolio’s peer group for the one-, three-, and five-year periods and in the third quartile for the ten-year period, and had outperformed the Portfolio’s benchmark index for the one-year period and underperformed for the three-, five-, and ten-year periods ended March 31, 2017. They observed that the Growth Strategy Portfolio’s Institutional Shares had placed in the first quartile of the Portfolio’s peer group for the one-, three-, and five-year periods and in the third quartile for the ten-year period, and had outperformed the Portfolio’s benchmark index for the one- and five-year periods and underperformed for the three- and ten-year periods ended March 31, 2017. They noted that the Satellite Strategies Portfolio’s Institutional Shares had placed in the third quartile of the Portfolio’s peer group for the one-, three-, and five-year periods and in the fourth quartile for the ten-year period, and had underperformed the Portfolio’s benchmark index for the one-, three-, five-, and ten-year periods ended March 31, 2017. The Trustees noted that the Satellite Strategies Portfolio had certain significant differences from both the Portfolio’s peer group and benchmark index that caused the peer group and benchmark index to be imperfect bases for performance comparison. They also noted that the Portfolios had experienced certain portfolio management changes in the first half of 2017.
Costs of Services Provided and Competitive Information
The Trustees considered the contractual terms of the Management Agreement and the fee rates payable by each Portfolio thereunder. In this regard, the Trustees considered information on the services rendered by the Investment Adviser to the Portfolios, which included both advisory and administrative services that were directed to the needs and operations of the Portfolios as registered mutual funds.
In particular, the Trustees reviewed analyses prepared by the Outside Data Provider regarding the expense rankings of the Portfolios. The analyses provided a comparison of each Portfolio’s management fee to those of a relevant peer group and category universe; an expense analysis which compared each Portfolio’s overall net and gross expenses to a peer group and a category universe; and data comparing each Portfolio’s net expenses to the peer and category medians. The analyses also compared each Portfolio’s transfer agency, custody, and distribution fees, other expenses and fee waivers/reimbursements to those of the peer group and category medians. The Trustees concluded that the comparisons provided by the Outside Data Provider were useful in evaluating the reasonableness of the management fees and total expenses paid by the Portfolios.
98
GOLDMAN SACHS FUND OF FUNDS PORTFOLIOS
Statement Regarding Basis for Approval of Management Agreement (Unaudited) (continued)
In addition, the Trustees considered the Investment Adviser’s undertakings to implement fee waivers and/or expense limitations of the Portfolios and the Underlying Funds. They also considered, to the extent that the Investment Adviser manages other types of accounts having investment objectives and policies similar to those of the Portfolios, comparative fee information for services provided by the Investment Adviser to those accounts, and information that indicated that services provided to the Portfolios differed in various significant respects from the services provided to other types of accounts which, in many cases, operated under less stringent legal and regulatory structures, required fewer services from the Investment Adviser to a smaller number of client contact points, and were less time-intensive.
In addition, the Trustees noted that shareholders are able to redeem their Portfolio shares at any time if shareholders believe that the Portfolio fees and expenses are too high or if they are dissatisfied with the performance of the Portfolio.
Profitability
The Trustees reviewed each Portfolio’s contribution to the Investment Adviser’s revenues and pre-tax profit margins. In this regard the Trustees noted that they had received, among other things, profitability analyses and summaries, revenue and expense schedules by Portfolio and by function (i.e., investment management, transfer agency and distribution and service), and information on the Investment Adviser’s expense allocation methodology. They observed that the profitability and expense figures are substantially similar to those used by the Investment Adviser for many internal purposes, including compensation decisions among various business groups, and are thus subject to a vigorous internal debate about how certain revenue and expenses should be allocated. The Trustees also noted that the internal audit group within the Goldman Sachs organization had audited the expense allocation methodology and that the internal audit group was satisfied with the reasonableness, consistency, and accuracy of the Investment Adviser’s expense allocation methodology and profitability analysis calculations. Profitability data for each Portfolio were provided for 2016 and 2015, and the Trustees considered this information in relation to the Investment Adviser’s overall profitability.
Economies of Scale
The Trustees considered the information that had been provided regarding the Investment Adviser’s profitability.
The Trustees noted that, although the Portfolios themselves do not have breakpoints in their management fee schedules, any benefits of the breakpoints in the management fee schedules of certain Underlying Funds, when reached, would pass through to the shareholders in the Portfolios at the specified asset levels. The Trustees considered the amounts of assets in the Portfolios; the Portfolios’ recent purchase and redemption activity; the information provided by the Investment Adviser relating to the costs of the services provided by the Investment Adviser and its affiliates and the profits realized by them; information comparing the fee rates charged by the Investment Adviser with fee rates charged to other funds in the peer groups; and the Investment Adviser’s undertaking to limit certain expenses of the Portfolios and Underlying Funds that exceed specified levels. They also considered the services provided to the Portfolios under the Management Agreement and the fees and expenses borne by the Underlying Funds, and determined that the management fees payable by the Portfolios were not duplicative of the management fees paid at the Underlying Fund level.
Other Benefits to the Investment Adviser and Its Affiliates
The Trustees also considered the other benefits derived by the Investment Adviser and its affiliates from their relationships with the Portfolios and/or the Underlying Funds as stated above, including: (a) transfer agency fees received by Goldman Sachs & Co. LLC (“Goldman Sachs”); (b) brokerage and futures commissions earned by Goldman Sachs for executing securities and futures transactions on behalf of certain Underlying Funds; (c) research received by the Investment Adviser from broker-dealers in exchange for executing certain transactions on behalf of certain Underlying Funds; (d) trading efficiencies resulting from aggregation of orders of the Underlying Funds with those for other funds or accounts managed by the Investment Adviser; (e) fees earned by Goldman Sachs Agency Lending (“GSAL”), an affiliate of the Investment Adviser, as securities lending agent for certain Underlying Funds (and fees earned by the Investment Adviser for managing the fund in which those Underlying Funds’ cash collateral is invested); (f) the Investment Adviser’s ability to leverage the infrastructure designed to service the Portfolios on behalf of its other clients; (g) the Investment Adviser’s ability to cross-market other products and services to Portfolio shareholders; (h) Goldman Sachs’ retention of certain fees as Portfolio Distributor; (i) the Investment Adviser’s ability to negotiate better pricing with custodians on behalf of its other clients, as a result of the relationship with the Portfolios and Underlying Funds; and (j) the possibility that the working relationship between the Investment Adviser and the Portfolios’ and Underlying Funds’ third-party service providers may cause those service providers to be more likely to do business with other areas of Goldman
99
GOLDMAN SACHS FUND OF FUNDS PORTFOLIOS
Statement Regarding Basis for Approval of Management Agreement (Unaudited) (continued)
Sachs. In the course of considering the foregoing, the Independent Trustees requested and received further information quantifying certain of these fall-out benefits.
Other Benefits to the Portfolios and Their Shareholders
The Trustees also noted that the Portfolios and/or the Underlying Funds receive certain potential benefits as a result of their relationship with the Investment Adviser, including: (a) trading efficiencies resulting from aggregation of orders of the Underlying Funds with those of other funds or accounts managed by the Investment Adviser; (b) enhanced servicing from vendors because of the volume of business generated by the Investment Adviser and its affiliates; (c) with respect to the Underlying Funds, enhanced servicing from broker-dealers because of the volume of business generated by the Investment Adviser and its affiliates; (d) with respect to certain Underlying Funds, the Investment Adviser’s ability to negotiate favorable terms with derivatives counterparties as a result of the size and reputation of the Goldman Sachs organization; (e) the Investment Adviser’s knowledge and experience gained from managing other accounts and products; (f) the Investment Adviser’s ability to hire and retain qualified personnel to provide services to the Portfolios and the Underlying Funds because of the reputation of the Goldman Sachs organization; (g) the Portfolios’ and Underlying Funds’ access, through the Investment Adviser, to certain firmwide resources (e.g., proprietary risk management systems and databases), subject to certain restrictions; (h) with respect to certain Underlying Funds, the ability to participate in the securities lending program administered by GSAL, as measured by the revenue received by the Underlying Funds in connection with the program; and (i) the Portfolios’ access to certain affiliated distribution channels. In addition, the Trustees noted the competitive nature of the mutual fund marketplace, and considered that many of the Portfolios’ shareholders invested in the Portfolios in part because of the Portfolios’ relationship with the Investment Adviser and that those shareholders have a general expectation that the relationship will continue.
Conclusion
In connection with their consideration of the Management Agreement, the Trustees gave weight to each of the factors described above, but did not identify any particular factor as controlling their decision. After deliberation and consideration of all of the information provided, including the factors described above, the Trustees concluded, in the exercise of their business judgment, that the management fees paid by each of the Portfolios were reasonable in light of the services provided to it by the Investment Adviser, the Investment Adviser’s costs and each Portfolio’s current and reasonably foreseeable asset levels. The Trustees unanimously concluded that the Investment Adviser’s continued management likely would benefit each Portfolio and its shareholders and that the Management Agreement should be approved and continued with respect to each Portfolio until June 30, 2018.
100
FUNDS PROFILE
Goldman Sachs Funds
Goldman Sachs is a premier financial services firm, known since 1869 for creating thoughtful and customized investment solutions in complex global markets.
Today, the Investment Management Division of Goldman Sachs serves a diverse set of clients worldwide, including private institutions, public entities and individuals. With approximately $1.21 trillion in assets under supervision as of June 30, 2017, Goldman Sachs Asset Management (“GSAM”) has portfolio management teams located around the world and our investment professionals bring firsthand knowledge of local markets to every investment decision. Assets under supervision includes assets under management and other client assets for which Goldman Sachs does not have full discretion. GSAM leverages the resources of Goldman Sachs & Co. LLC subject to legal, internal and regulatory restrictions.
Money Market
Financial Square FundsSM
| ∎ | Financial Square Treasury Solutions Fund1 |
| ∎ | Financial Square Government Fund1 |
| ∎ | Financial Square Money Market Fund2 |
| ∎ | Financial Square Prime Obligations Fund2 |
| ∎ | Financial Square Treasury Instruments Fund1 |
| ∎ | Financial Square Treasury Obligations Fund1 |
| ∎ | Financial Square Federal Instruments Fund1 |
| ∎ | Financial Square Tax-Exempt Money Market Fund2 |
Investor FundsSM
| ∎ | Investor Money Market Fund3 |
| ∎ | Investor Tax-Exempt Money Market Fund3 |
Fixed Income
Short Duration and Government
| ∎ | Enhanced Income Fund |
| ∎ | High Quality Floating Rate Fund |
| ∎ | Short-Term Conservative Income Fund |
| ∎ | Short Duration Government Fund |
| ∎ | Short Duration Income Fund |
| ∎ | Government Income Fund |
| ∎ | Inflation Protected Securities Fund |
Multi-Sector
| ∎ | Bond Fund |
| ∎ | Core Fixed Income Fund |
| ∎ | Global Income Fund |
| ∎ | Strategic Income Fund |
Municipal and Tax-Free
| ∎ | High Yield Municipal Fund |
| ∎ | Dynamic Municipal Income Fund |
| ∎ | Short Duration Tax-Free Fund |
Single Sector
| ∎ | Investment Grade Credit Fund |
| ∎ | U.S. Mortgages Fund |
| ∎ | High Yield Fund |
| ∎ | High Yield Floating Rate Fund |
| ∎ | Emerging Markets Debt Fund |
| ∎ | Local Emerging Markets Debt Fund |
| ∎ | Dynamic Emerging Markets Debt Fund |
Fixed Income Alternatives
| ∎ | Long Short Credit Strategies Fund |
| ∎ | Strategic Macro Fund4 |
Fundamental Equity
| ∎ | Equity Income Fund5 |
| ∎ | Small Cap Value Fund |
| ∎ | Small/Mid Cap Value Fund |
| ∎ | Mid Cap Value Fund |
| ∎ | Large Cap Value Fund |
| ∎ | Focused Value Fund |
| ∎ | Capital Growth Fund |
| ∎ | Strategic Growth Fund |
| ∎ | Small/Mid Cap Growth Fund |
| ∎ | Flexible Cap Fund6 |
| ∎ | Concentrated Growth Fund7 |
| ∎ | Technology Opportunities Fund |
| ∎ | Growth Opportunities Fund |
| ∎ | Rising Dividend Growth Fund |
| ∎ | Dynamic U.S. Equity Fund |
| ∎ | Income Builder Fund |
Tax-Advantaged Equity
| ∎ | U.S. Tax-Managed Equity Fund |
| ∎ | International Tax-Managed Equity Fund |
| ∎ | U.S. Equity Dividend and Premium Fund |
| ∎ | International Equity Dividend and Premium Fund |
Equity Insights
| ∎ | Small Cap Equity Insights Fund |
| ∎ | U.S. Equity Insights Fund |
| ∎ | Small Cap Growth Insights Fund |
| ∎ | Large Cap Growth Insights Fund |
| ∎ | Large Cap Value Insights Fund |
| ∎ | Small Cap Value Insights Fund |
| ∎ | International Small Cap Insights Fund |
| ∎ | International Equity Insights Fund |
| ∎ | Emerging Markets Equity Insights Fund |
Fundamental Equity International
| ∎ | Strategic International Equity Fund |
| ∎ | Focused International Equity Fund |
| ∎ | Asia Equity Fund |
| ∎ | Emerging Markets Equity Fund |
| ∎ | N-11 Equity Fund |
Select Satellite
| ∎ | Real Estate Securities Fund |
| ∎ | International Real Estate Securities Fund |
| ∎ | Commodity Strategy Fund |
| ∎ | Global Real Estate Securities Fund |
| ∎ | Dynamic Allocation Fund |
| ∎ | Absolute Return Tracker Fund |
| ∎ | Long Short Fund |
| ∎ | Managed Futures Strategy Fund |
| ∎ | MLP Energy Infrastructure Fund |
| ∎ | Multi-Manager Alternatives Fund |
| ∎ | Absolute Return Multi-Asset Fund |
| ∎ | Global Infrastructure Fund |
Total Portfolio Solutions
| ∎ | Global Managed Beta Fund |
| ∎ | Multi-Manager Non-Core Fixed Income Fund |
| ∎ | Multi-Manager U.S. Dynamic Equity Fund |
| ∎ | Multi-Manager Global Equity Fund |
| ∎ | Multi-Manager International Equity Fund |
| ∎ | Tactical Tilt Overlay Fund |
| ∎ | Balanced Strategy Portfolio |
| ∎ | Multi-Manager U.S. Small Cap Equity Fund |
| ∎ | Multi-Manager Real Assets Strategy Fund |
| ∎ | Growth and Income Strategy Portfolio |
| ∎ | Growth Strategy Portfolio |
| ∎ | Equity Growth Strategy Portfolio |
| ∎ | Satellite Strategies Portfolio |
| ∎ | Enhanced Dividend Global Equity Portfolio |
| ∎ | Tax-Advantaged Global Equity Portfolio |
| ∎ | Strategic Factor Allocation Fund |
| ∎ | Target Date 2020 Portfolio |
| ∎ | Target Date 2025 Portfolio |
| ∎ | Target Date 2030 Portfolio |
| ∎ | Target Date 2035 Portfolio |
| ∎ | Target Date 2040 Portfolio |
| ∎ | Target Date 2045 Portfolio |
| ∎ | Target Date 2050 Portfolio |
| ∎ | Target Date 2055 Portfolio |
| ∎ | GQG Partners International Opportunities Fund |
| 1 | You could lose money by investing in the Fund. Although the Fund seeks to preserve the value of your investment at $1.00 per share, it cannot guarantee it will do so. An investment in the Fund is not a deposit of a bank and is not insured or guaranteed by the Federal Deposit Insurance Corporation or any other government agency. The Fund’s sponsor has no legal obligation to provide financial support to the Fund, and you should not expect that the sponsor will provide financial support to the Fund at any time. |
| 2 | You could lose money by investing in the Fund. Because the share price of the Fund will fluctuate, when you sell your shares they may be worth more or less than what you originally paid for them. The Fund may impose a fee upon sale of your shares or may temporarily suspend your ability to sell shares if the Fund’s liquidity falls below required minimums because of market conditions or other factors. An investment in the Fund is not a deposit of a bank and is not insured or guaranteed by the Federal Deposit Insurance Corporation or any other government agency. The Fund’s sponsor has no legal obligation to provide financial support to the Fund, and you should not expect that the sponsor will provide financial support to the Fund at any time. |
| 3 | You could lose money by investing in the Fund. Although the Fund seeks to preserve the value of your investment at $1.00 per share, it cannot guarantee it will do so. The Fund may impose a fee upon sale of your shares or may temporarily suspend your ability to sell shares if the Fund’s liquidity falls below required minimums because of market conditions or other factors. An investment in the Fund is not a deposit of a bank and is not insured or guaranteed by the Federal Deposit Insurance Corporation or any other government agency. The Fund’s sponsor has no legal obligation to provide financial support to the Fund, and you should not expect that the sponsor will provide financial support to the Fund at any time. |
| 4 | Effective on June 20, 2017, the Goldman Sachs Fixed Income Macro Strategies Fund was renamed the Goldman Sachs Strategic Macro Fund. |
| 5 | Effective on June 20, 2017, the Goldman Sachs Growth and Income Fund was renamed the Goldman Sachs Equity Income Fund. |
| 6 | Effective on August 31, 2017, the Goldman Sachs Flexible Cap Growth Fund was renamed the Goldman Sachs Flexible Cap Fund. |
| 7 | Effective on July 28, 2017, the Goldman Sachs Focused Growth Fund was reorganized with and into the Goldman Sachs Concentrated Growth Fund. Financial Square FundsSM and Investor FundsSM are registered service marks of Goldman Sachs & Co. LLC. |
| * | This list covers open-end funds only. Please visit our website at www.GSAMFUNDS.com to learn about our closed-end funds and exchange-traded funds. |
TRUSTEES Ashok N. Bakhru, Chairman Kathryn A. Cassidy Diana M. Daniels Herbert J. Markley James A. McNamara Jessica Palmer Roy W. Templin Gregory G. Weaver | OFFICERS James A. McNamara, President Scott M. McHugh, Treasurer, Senior Vice President and Principal Financial Officer Joseph F. DiMaria, Assistant Treasurer and Principal Accounting Officer Caroline L. Kraus, Secretary | |
GOLDMAN SACHS & CO. LLC Distributor and Transfer Agent | GOLDMAN SACHS ASSET MANAGEMENT, L.P. Investment Adviser | |
Visit our web site at www.GSAMFUNDS.com to obtain the most recent month-end returns.
Goldman Sachs Asset Management, L.P. 200 West Street, New York, New York 10282
The portfolio risk management process includes an effort to monitor and manage risk, but does not imply low risk.
The reports concerning the Portfolios included in this shareholder report may contain certain forward-looking statements about the factors that may affect the performance of the Portfolios in the future. These statements are based on Portfolio management’s predictions and expectations concerning certain future events and their expected impact on the Portfolios, such as performance of the economy as a whole and of specific industry sectors, changes in the levels of interest rates, the impact of developing world events, and other factors that may influence the future performance of the Portfolios. Management believes these forward-looking statements to be reasonable, although they are inherently uncertain and difficult to predict. Actual events may cause adjustments in portfolio management strategies from those currently expected to be employed.
Diversification does not protect an investor from market risk and does not ensure a profit.
Views and opinions expressed are for informational purposes only and do not constitute a recommendation by GSAM to buy, sell, or hold any security. Views and opinions are current as of the date of this presentation and may be subject to change. They should not be construed as investment advice.
A description of the policies and procedures that the Portfolios use to determine how to vote proxies relating to portfolio securities and information regarding how a Portfolio voted proxies relating to portfolio securities during the most recent 12-month period ended June 30 is available (i) without charge, upon request by calling 1-800-526-7384 (for Retail Shareholders) or 1-800-621-2550 (for Institutional Shareholders); and (ii) on the Securities and Exchange Commission (“SEC”) web site at http://www.sec.gov.
References to indices, benchmarks or other measures of relative market performance over a specified period of time are provided for your information only and do not imply that the portfolio will achieve similar results. The index composition may not reflect the manner in which a portfolio is constructed. While an adviser seeks to design a portfolio which reflects appropriate risk and return features, portfolio characteristics may deviate from those of the benchmark.
The Portfolios file their complete schedule of portfolio holdings with the SEC for the first and third quarters of each fiscal year on Form N-Q. The Portfolios’ Forms N-Q are available on the SEC’s web site at http://www.sec.gov within 60 days after the Portfolios’ first and third fiscal quarters. When available, the Portfolios’ Forms N-Q may be reviewed and copied at the SEC’s Public Reference Room in Washington, D.C. and information on the operation of the Public Reference Room may also be obtained by calling 1-800-SEC-0330. Forms N-Q may be obtained upon request and without charge by calling 1-800-526-7384 (for Retail Shareholders) or 1-800-621-2550 (for Institutional Shareholders).
Holdings and allocations shown are as of June 30, 2017 and may not be representative of future investments. Portfolio holdings should not be relied on in making investment decisions and should not be construed as research or investment advice regarding particular securities. Current and future holdings are subject to risk.
THIS MATERIAL IS FOR INFORMATIONAL PURPOSES ONLY AND IS PROVIDED SOLELY ON THE BASIS THAT IT WILL NOT CONSTITUTE INVESTMENT OR OTHER ADVICE OR A RECOMMENDATION RELATING TO ANY PERSON’S OR PLAN’S INVESTMENT OR OTHER DECISIONS, AND GOLDMAN SACHS IS NOT A FIDUCIARY OR ADVISOR WITH RESPECT TO ANY PERSON OR PLAN BY REASON OF PROVIDING THE MATERIAL OR CONTENT HEREIN INCLUDING UNDER THE EMPLOYEE RETIREMENT INCOME SECURITY ACT OF 1974 OR DEPARTMENT OF LABOR REGULATIONS. PLAN SPONSORS AND OTHER FIDUCIARIES SHOULD CONSIDER THEIR OWN CIRCUMSTANCES IN ASSESSING ANY POTENTIAL COURSE OF ACTION.
This material is not authorized for distribution to prospective investors unless preceded or accompanied by a current prospectus or summary prospectus, if applicable. Investors should consider a Portfolio’s objective, risks, and charges and expenses, and read the summary prospectus, if available, and/or the prospectus carefully before investing or sending money. The summary prospectus, if available, and the prospectus contain this and other information about a Portfolio and may be obtained from your authorized dealer or from Goldman Sachs & Co. LLC by calling (retail – 1-800-526-7384) (institutional – 1-800-621-2550).
© 2017 Goldman Sachs. All rights reserved. 101458-TMPL-08/2017-592264 FFSAR-17/ 52.7K
Goldman Sachs Funds

| Semi-Annual Report | June 30, 2017 | |||
Global Infrastructure Fund | ||||

Goldman Sachs Global Infrastructure Fund
| 1 | ||||
| 9 | ||||
| 11 | ||||
| 14 | ||||
| 16 | ||||
| 24 | ||||
| NOT FDIC-INSURED | May Lose Value | No Bank Guarantee | ||
PORTFOLIO RESULTS
Goldman Sachs Global Infrastructure Fund
Investment Objective
The Goldman Sachs Global Infrastructure Fund (“the Fund”) seeks total return comprised of long-term growth of capital and income.
Portfolio Management Discussion and Analysis
Below, the Goldman Sachs Global Infrastructure Team discusses the Goldman Sachs Global Infrastructure Fund’s (the “Fund”) performance and positioning for the six-month period ended June 30, 2017 (the “Reporting Period”).
| Q | How did the Fund perform during the Reporting Period? |
| A | During the Reporting Period, the Fund’s Class A, C, Institutional, IR, R and R6 Shares generated cumulative total returns, without sales charges, of 8.01%, 7.64%, 8.21%, 8.13%, 7.88% and 8.22%, respectively. These returns compare to the 12.01% cumulative total return of the Dow Jones Brookfield Global Infrastructure Index (the “Index”). The Index is intended to measure all sectors of the infrastructure market.1 |
| Q | What economic and market factors most influenced global infrastructure companies during the Reporting Period? |
| A | During January 2017, when the Reporting Period began, the global infrastructure market posted a modest gain. Overall, investors searched for details about the timing and scope of the U.S. Administration’s plans for fiscal stimulus. U.S. equities rallied on the prospect of deregulation following executive orders on oil pipelines and optimism around infrastructure spending. However, U.S. equities subsequently retreated on political uncertainty and protectionism concerns. Europe also grappled with political uncertainty. U.K. equities fell after a speech by the U.K. Prime Minister was interpreted by the markets as increasing the possibility of a “hard Brexit.” (In a hard Brexit, the U.K. would leave the European Union, as well as its single market for goods, quickly and completely.) In France, allegations about the employment in parliament of a presidential candidate’s wife increased uncertainty about the country’s upcoming election. The Japanese yen appreciated sharply, and Japanese equities retreated. |
| 1 | Source: Dow Jones. The Index includes companies domiciled globally that qualify as “pure-play” infrastructure companies — companies whose primary business is the ownership and operation of infrastructure assets, activities that generally generate long-term stable cash flows. It includes Master Limited Partnerships (MLPs) in addition to other equity securities. |
| In February 2017, the global infrastructure market generated a positive return. Investors continued to assess the outlook for potential tax reform, deregulation and other fiscal policies from the U.S. Administration, while also heeding the tone of Federal Reserve (“Fed”) officials. The U.S. dollar strengthened during the month, as the market-implied probability of a March 2017 interest rate hike increased with the Fed Chair’s testimony before Congress and hawkish comments from other Fed officials. (Hawkish language implies higher interest rates; opposite of dovish.) Solid U.S. economic data also supported the market’s advance, with the Institute of Supply Management’s manufacturing and non-manufacturing indices rising to a two-year and six-year high, respectively, during February 2017. Meanwhile, the Markit Eurozone Composite Flash Purchasing Managers’ Index (“PMI”) reached its highest levels in nearly six years. In Japan, the government reported that the country’s Gross Domestic Product (“GDP”) had expanded by 0.2% in the fourth quarter 2016, the fourth consecutive quarter of growth. In mid-February 2017, investors focused on a high-profile meeting between the U.S. President and Japanese Prime Minister, which featured pledges for a new bilateral trade framework and a unified front against North Korea’s nuclear threat. |
In March 2017, the global infrastructure market continued to advance. The Fed raised short-term interest rates during the month for the third time since the 2008-2009 global financial crisis. However, a seemingly cautious stance on the future path of monetary tightening from the Fed chair and the presence of a dissenter on the Fed’s policy-making committee led to a dovish market reaction and the appreciation of the Japanese yen, despite the Bank of Japan maintaining its policy rate. Meanwhile, the European Central Bank (“ECB”) kept its monetary policy unchanged at its March 2017 meeting but revised its economic growth and inflation forecasts upwards. Equity markets interpreted the |
1
PORTFOLIO RESULTS
positive economic assessment as hawkish, sparking concerns around the sequencing of the ECB’s policy steps—namely, whether interest rates might rise before quantitative easing ends. |
| During April 2017, the global infrastructure market recorded another gain as political risks appeared to recede. More specifically, market sentiment improved with the first-round results in France’s presidential election, which were widely interpreted by investors as pro-market. Strong first quarter 2017 corporate earnings results and a firm economic backdrop across the developed markets also supported global equities. In the U.S., economic activity and inflation data appeared to moderate, though the labor market remained strong. However, political turmoil dampened expectations for near-term progress on the U.S. Administration’s fiscal stimulus policies. In Europe, solid economic data and dovish statements by the ECB president strengthened European equity markets. The potential of Italian elections during 2017 increased after the country’s main political parties reached an agreement on electoral law. In Japan, preliminary first quarter 2017 GDP growth came in at 2.2% . |
| During May 2017, the global infrastructure market produced solidly positive returns amid fading political risks, continued strong corporate earnings reports and a solid economic backdrop. In the U.S., an ambitious tax reform proposal from the White House lifted market sentiment. In Japan, equities were hurt early in the month by the strength of the Japanese yen, which appreciated amid global political uncertainty and geopolitical tensions, including a North Korean ballistic missile launch, a U.S. airstrike in Syria and terrorism in Russia. Japanese equities rebounded late in the month, as Japanese yen strength faded with recovering global risk appetite. |
| The global infrastructure market fell back slightly in June 2017. Investor sentiment was buoyed by receding political risk, as the centrist candidate won France’s presidential election and secured a parliamentary majority. Political risk also declined in Italy where an anti-establishment party lost ground in local elections and expectations for parliamentary elections being held in 2017 declined. Corporate earnings reports remained strong, with double-digit growth seen across most developed markets regions. In Europe, equity markets rallied on the ECB president’s sanguine outlook for recovering inflation and his cautious reference to the potential tapering of quantitative easing. In the U.S., market optimism about potentially pro-growth fiscal policy was dampened by political developments. At the same time, the U.S. labor market remained strong, though economic activity and inflation data moderated. Also, during June 2017, the Fed raised short-term interest rates by another 0.25% . |
| For the Reporting Period overall, the global infrastructure market, as measured by the Index, generated a cumulative total return of 12.01% . The top performing markets during the Reporting Period were Canada and Italy, while the worst performing markets were the U.S. and Spain. Regulated infrastructure companies, such as diversified utilities companies, benefited from the unexpected decline in global interest rates. Investors generally favored infrastructure assets for their relatively predictable cash flows. Energy master limited partnerships (“MLPs”) were challenged during the Reporting Period by intense volatility in commodity prices, as U.S. energy production continued to boost inventories. |
| Q | What key factors were responsible for the Fund’s performance during the Reporting Period? |
| A | During the Reporting Period, security selection and an overweight position in the energy sector detracted from relative returns. More specifically, the Fund’s large overweight position in the midstream2 energy segment, which was predicated on our thesis that growing production would necessitate infrastructure and that the U.S. Administration would be energy-friendly, hampered relative performance. During the second quarter of 2017, the energy commodity markets were particularly volatile, as U.S. production volume showed no signs of slowing and inventories continued to build. This volatility manifested itself in the energy equity markets, hurting upstream3 producers and, to a lesser extent, midstream companies. Elsewhere, the Fund was hurt by its underweight in the transportation and communication sectors, led by an allocation to airports. Among countries, security selection in the U.S. and an underweight position in Spain detracted from relative returns. On the positive side, the Fund was helped by an underweight position and security selection in Canada. Security selection in Italy also added value. |
| 2 | The midstream component of the energy industry is usually defined as those companies providing products or services that help link the supply side, i.e. energy producers, and the demand side, i.e. energy end- users, for any type of energy commodity. Such midstream businesses can include, but are not limited to, those that process, store, market and transport various energy commodities. |
| 3 | The upstream component of the energy industry is usually defined as those operations stages in the oil and gas industry that involve exploration and production. Upstream operations deal primarily with the exploration stages of the oil and gas industry, with upstream firms taking the first steps to first locate, test and drill for oil and gas. Later, once reserves are proven, upstream firms will extract any oil and gas from the reserve. |
2
PORTFOLIO RESULTS
| Q | What individual holdings detracted most from the Fund’s relative performance during the Reporting Period? |
| A | The top detractors from the Fund’s results during the Reporting Period were Plains All American Pipeline, L.P.; Enterprise Products Partners L.P.; and Targa Resources. |
| Plains All American Pipeline, L.P. (PAA), a U.S. midstream energy company with significant crude oil-focused assets, was a leading detractor from the Fund’s relative returns. Shares of PAA declined along with crude oil prices, which were volatile throughout much of the Reporting Period on concerns about continued U.S. energy production and its effect on inventory levels. Overall, lower than market expected first quarter 2017 financial results and the security’s high beta to crude oil served as headwinds for performance. (Beta is a measure of the volatility, or systematic risk, of a security compared to the market as a whole.) Although we remained confident that PAA’s exposure to the Permian Basin would likely lead to increased cash flows in conjunction with U.S. energy production growth, we exited the Fund’s position during the Reporting Period to reduce exposure to fluctuating commodity prices. |
| Enterprise Products Partners L.P. (EPD), a provider of processing and transportation services to producers and consumers of natural gas liquids, also detracted from the Fund’s relative performance during the Reporting Period. The Fund’s position in EPD, which was initiated in late February 2017, dampened returns after the stock tumbled alongside the rest of the energy market amid commodity price volatility. In addition, investors reacted negatively to the termination of certain of the company’s transportation contracts and its growing debt levels. At the end of the Reporting Period, we believed EPD had the necessary scale and diversification to drive a strong backlog of infrastructure projects, and we expect it to continue growing its distribution. The Fund continued to hold EPD at the end of the Reporting Period. |
| Targa Resources (TRGP) was another notable detractor from Fund results during the Reporting Period. TRGP provides midstream natural gas and natural gas liquids services, which include the gathering, compressing, treating, processing and selling of natural gas. Its shares retreated after the company reported first quarter 2017 financial results that fell below consensus estimates. The miss was largely driven by the company’s logistics and marketing segment, specifically its lower margins on exports and the roll-off of some higher priced legacy contracts. In our view, these results are transitory, and, at the end of the Reporting Period, we remained positive on TRGP’s low cost of capital and its exposure to key U.S. production basins at what we viewed as attractive valuations. At the end of the Reporting Period, the Fund continued to own TRGP. |
| Q | What individual holdings added most to the Fund’s relative performance during the Reporting Period? |
| A | During the Reporting Period, the leading positive contributors to the Fund’s relative returns were Enbridge, Cellnex Telecom and American Tower. |
| Our decision to underweight Enbridge (ENB) added to the Fund’s performance during the Reporting Period. The underweight position was predicated on our view that the operator of crude oil and liquids pipelines did not have robust enough growth prospects to support its valuations relative to higher-growth names. Indeed, ENB’s shares slumped after a first quarter 2017 earnings report, which included disappointing results from its liquids segment as well as lower than market expected 2017 guidance. At the end of the Reporting Period, ENB remained a strategic core holding in the Fund because of what we consider to be its diversified asset footprint, the deep visibility it provides into its cash flows, and its operational efficiency through economies of scale. |
| Cellnex Telecom (CLNX), a telecommunications infrastructure company based in Spain, also added to the Fund’s relative performance. Its shares appreciated following strong first quarter 2017 financial results that were supported by data-driven demand growth. Additionally, the market reacted positively to CLNX’s successful bid for Sunrise Communications’ Switzerland-based towers plus an unconfirmed press report that the company itself might attract bidders. We eliminated the Fund’s position in CLNX near the end of the Reporting Period as the stock reached our price target and we saw better return potential in other telecommunications infrastructure companies at what we considered more attractive valuations. |
American Tower (AMT), an owner and operator of wireless communications and broadcast towers, was a key contributor to the Fund’s relative returns during the Reporting Period. AMT’s shares appreciated as major U.S. telecommunications providers announced plans to unroll unlimited data plans and next-generation network coverage, necessitating increased broadcast infrastructure. Additionally, fears about an increase in the company’s churn rate because of a potential merger |
3
PORTFOLIO RESULTS
between T-Mobile and Sprint were eased when Sprint entered exclusive talks with Charter Communications and Comcast to explore a partnership or wireless deal. (The churn rate, also known as the rate of attrition, is the percentage of subscribers to a service who discontinue their subscriptions to that service within a given time period.) In our opinion, AMT’s diversified portfolio of high quality assets should continue to benefit from secular trends toward growing data usage and rising penetration levels in developing countries. At the end of the Reporting Period, we also remained constructive on AMT’s healthy balance sheet and highly predictable revenue stream, stemming from long-term escalator clauses and master lease agreements with tenants that have strong credit. (An escalator clause is a contract provision allowing for an increase in costs to be passed on to another party.) Accordingly, the Fund maintained a position in AMT at the end of the Reporting Period. |
| Q | Were there any notable purchases or sales during the Reporting Period? |
| A | Among the purchases made during the Reporting Period was an investment in Williams Partners L.P. (WPZ), a natural gas-focused midstream energy company with operations in numerous U.S. basins. We believe the position could allow the Fund to capture relative value opportunities between WPZ and its parent company, Williams Companies, which trades at a premium despite its incremental leverage, identical economic exposure and lower distribution yield. |
| The Fund established a position in Edison International (EIX), an integrated electric company with regulated operations in California. In our view, EIX represents an attractive investment opportunity due to what we consider to be its inexpensive relative valuation, the benign regulatory environment and the company’s strengthened relative financial position. We believe EIX’s solid growth prospects may translate to above-average dividends. |
| In addition to the sale of PAA, already mentioned, notable sales included Williams Companies (WMB), an energy infrastructure company focused on connecting North America’s natural gas and natural gas liquids markets. Although we believe WMB offers exposure to well- positioned natural gas assets, we exited the name to purchase its subsidiary, WPZ, which offers identical economic exposure at what we consider to be a more attractive valuation. |
| Q | How did the Fund use derivatives and similar instruments during the Reporting Period? |
| A | The Fund did not use derivatives or similar instruments within its investment process during the Reporting Period. |
| Q | Were there any notable changes in the Fund’s weightings during the Reporting Period? |
| A | In constructing the Fund’s portfolio, we focus on picking securities rather than on making sector, subsector or country bets. We seek to outpace the Index by overweighting securities we expect to outperform and underweighting those that we think may lag. Consequently, changes in the Fund’s sector or country weights are generally the direct result of individual security selection and/or the appreciation or depreciation of particular Fund holdings. That said, during the Reporting Period, the Fund moved from a substantial overweight position relative to the Index in the energy sector to a slightly overweight position. In addition, the size of its underweight position in the utilities sector decreased. From a country perspective, compared to the Index, the Fund’s overweight position in the U.S. and its underweight position in Canada diminished. Its overweight position in Italy increased. |
| Q | How was the Fund positioned relative to the Index at the end of the Reporting Period? |
| A | At the end of the Reporting Period, the Fund was overweight compared to the Index in the real estate sector and was slightly overweight in the energy sector. It was underweight the utilities sector and relatively neutral versus the Index in the transportation and communication sectors. In geographic terms, the Fund was overweight the U.S. and underweight in Canada and Spain at the end of the Reporting Period. |
| Q | What is the Fund’s tactical view and strategy for the months ahead? |
| A | At the end of the Reporting Period, investor interest in global infrastructure securities appeared strong, and we believed it was likely to remain strong over the long run. Based on surveys of institutional investors, we think investors overall remain underinvested in global infrastructure securities, suggesting to us that there is room for growth as confidence in and understanding of the asset class matures. In the near term, we believe the focus on economic stimulus is shifting toward fiscal spending. This “monetary-to-fiscal” theme is, in our opinion, a tailwind for global infrastructure securities, given that increased infrastructure spending in the U.S. and around the world should bode well for infrastructure |
4
PORTFOLIO RESULTS
developers and owners. As for the midstream energy sector, we believe the fundamental outlook remains strong given that energy production growth necessitates energy infrastructure and because balance sheets, in our view, continue to improve in the wake of financial actions such as distribution cuts, equity issuance and capital spending reductions. That said, we think the sector may be subject to near-term volatility as commodity markets struggle to stabilize and seek to find their footing. |
| Broadly speaking, we believe low interest rates and modest economic growth provide an excellent backdrop for global infrastructure securities. We believe the financing environment is accommodative; fundamentals with respect to supply and demand are healthy; and investment attributes of global infrastructure securities continue to be viewed favorably, especially relative to fixed income. As a consequence, investor demand is likely, in our view, to increase, which could be supportive of valuations. Despite the more uncertain and volatile global macro environment, we believe infrastructure companies hold unique positions in the global economy and can benefit from their strong business models, which typically feature stable demand, high barriers to entry and regulated or contract-based businesses. We further believe the financing environment for global infrastructure companies is likely to continue to be accommodative, which is particularly important given the capital intensive nature of these businesses. Additionally, we believe that incremental infrastructure spending, as global governments transition from monetary stimulus to fiscal spending to spur economic growth, could lead to the creation of public-private partnerships and increase the number of infrastructure assets available to investors. In the near term, we believe divergent global central bank monetary policies and varying fundamentals at the sub-sector level may present compelling investment opportunities. We think global infrastructure securities can provide investors with attractive yields and lower volatility relative to the broader equity market. Compared to bonds, we believe they offer long-term growth potential, inflation hedging benefits and resiliency to interest rate fluctuations. |
5
FUND BASICS
Global Infrastructure Fund
as of June 30, 2017
| PERFORMANCE REVIEW | ||||||||||
| January 1, 2016–June 30, 2017 | Fund Total Return (based on NAV)1 | Dow Jones Brookfield Global Infrastructure Index2 | ||||||||
| Class A | 8.01 | % | 12.01 | % | ||||||
| Class C | 7.64 | 12.01 | ||||||||
| Institutional | 8.21 | 12.01 | ||||||||
| Class IR | 8.13 | 12.01 | ||||||||
| Class R | 7.88 | 12.01 | ||||||||
| Class R6 | 8.22 | 12.01 | ||||||||
| 1 | The net asset value (“NAV”) represents the net assets of the class of the Fund (ex-dividend) divided by the total number of shares of the class outstanding. The Fund’s performance reflects the reinvestment of dividends and other distributions. The Fund’s performance does not reflect the deduction of any applicable sales charges. |
| 2 | The Dow Jones Brookfield Global Infrastructure Index intends to measure the stock performance of “pure-play” infrastructure companies domiciled globally. The index covers all sectors of the infrastructure market. Components are required to have more than 70% of cash flows derived from infrastructure lines of business. It is not possible to invest directly in an index. |
| STANDARDIZED TOTAL RETURNS3 | ||||||||||||||
| For the period ended 6/30/17 | One Year | Since Inception | Inception Date | |||||||||||
| Class A | -2.19 | % | 2.77 | % | 6/27/16 | |||||||||
| Class C | 1.71 | 7.88 | 6/27/16 | |||||||||||
| Institutional | 3.88 | 9.07 | 6/27/16 | |||||||||||
| Class IR | 3.73 | 8.91 | 6/27/16 | |||||||||||
| Class R | 3.23 | 8.39 | 6/27/16 | |||||||||||
| Class R6 | 3.90 | 9.10 | 6/27/16 | |||||||||||
| 3 | The Standardized Total Returns are average annual total returns or cummulative total returns (only if the performance period is one year or less) of the most recent calendar quarter-end. They assume reinvestment of all distributions at NAV. These returns reflect a maximum initial sales charge of 5.5% for Class A Shares, and the assumed contingent deferred sales charge for Class C Shares (1% if redeemed within 12 months of purchase). Because Institutional, Class IR, Class R and Class R6 Shares do not involve a sales charge, such a charge is not applied to their Standardized Total Returns. |
The returns set forth in the tables above represent past performance. Past performance does not guarantee future results. The Fund’s investment return and principal value will fluctuate so that an investor’s shares, when redeemed, may be worth more or less than their original cost. Current performance may be lower or higher than the performance quoted above. Please visit our web site at www.GSAMFUNDS.com to obtain the most recent month-end returns. Performance reflects applicable fee waivers and/or expense limitations in effect during the periods shown. In their absence, performance would be reduced. Returns do not reflect the deduction of taxes that a shareholder would pay on Fund distributions or the redemption of Fund shares.
6
FUND BASICS
| EXPENSE RATIOS4 | ||||||||||
| Net Expense Ratio (Current) | Gross Expense Ratio (Before Waivers) | |||||||||
| Class A | 1.39 | % | 15.83 | % | ||||||
| Class C | 2.14 | 18.08 | ||||||||
| Institutional | 0.99 | 15.43 | ||||||||
| Class IR | 1.14 | 15.58 | ||||||||
| Class R | 1.64 | 16.08 | ||||||||
| Class R6 | 0.97 | 15.41 | ||||||||
| 4 | The expense ratios of the Fund, both current (net of applicable fee waivers and/or expense limitations) and before waivers (gross of applicable fee waivers and/or expense limitations) are as set forth above according to the most recent publicly available Prospectus for the Fund and may differ from the expense ratios disclosed in the Financial Highlights in this report. Pursuant to a contractual arrangement, the Fund’s waivers and/or expense limitations will remain in place through at least April 28, 2018, and prior to such date the Investment Adviser may not terminate the arrangements without the approval of the Fund’s Board of Trustees. If these arrangements are discontinued in the future, the expense ratios may change without shareholder approval. |
| TOP TEN HOLDINGS AS OF 6/30/175 | ||||||||||
| Holding | % of Total Net Assets | Line of Business | Country | |||||||
| American Tower Corp. | 7.1 | % | Equity Real Estate Investment Trusts (REITs) | United States | ||||||
| Vinci SA | 5.9 | Construction & Engineering | France | |||||||
| National Grid PLC | 5.8 | Multi-Utilities | United Kingdom | |||||||
| Williams Partners LP | 5.5 | Oil, Gas & Consumable Fuels | United States | |||||||
| PG&E Corp. | 5.1 | Electric Utilities | United States | |||||||
| Crown Castle International Corp. | 4.5 | Equity Real Estate Investment Trusts (REITs) | United States | |||||||
| TransCanada Corp. | 4.3 | Oil, Gas & Consumable Fuels | Canada | |||||||
| Kinder Morgan, Inc. | 4.1 | Oil, Gas & Consumable Fuels | United States | |||||||
| Enbridge, Inc. | 3.4 | Oil, Gas & Consumable Fuels | Canada | |||||||
| American Water Works Co., Inc. | 3.3 | Water Utilities | United States | |||||||
| 5 | The top 10 holdings may not be representative of the Fund’s future investments. |
7
FUND BASICS
| FUND VS. BENCHMARK SECTOR ALLOCATION6 |
| As of June 30, 2017 |
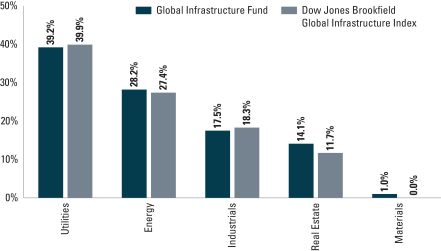
| 6 | The Fund is actively managed and, as such, its composition may differ over time. Consequently, the Fund’s overall sector allocations may differ from the percentages contained in the graph above. The graph categorizes investments using the Global Industry Classification Standard (“GICS”), however, the sector classifications used by the portfolio management team may differ from GICS. The percentage shown for each investment category reflects the value of investments in that category as a percentage of market value. The graph depicts the Fund’s investments but may not represent the Fund’s market exposure due to the exclusion of certain derivatives, if any, as listed in the Additional Investment Information section of the Schedule of Investments. |
8
GOLDMAN SACHS GLOBAL INFRASTRUCTURE FUND
June 30, 2017 (Unaudited)
| Shares | Description | Value | ||||||
| Common Stocks – 98.2% | ||||||||
| Australia – 4.4% | ||||||||
| 149,032 | APA Group (Gas Utilities) | $ | 1,050,111 | |||||
| 323,462 | Macquarie Atlas Roads Group (Transportation Infrastructure) | 1,394,950 | ||||||
| 371,130 | Sydney Airport (Transportation Infrastructure) | 2,021,653 | ||||||
| 227,737 | Transurban Group (Transportation Infrastructure) | 2,074,092 | ||||||
|
| |||||||
| 6,540,806 | ||||||||
|
| |||||||
| Canada – 10.9% | ||||||||
| 126,009 | Enbridge, Inc. (Oil, Gas & Consumable Fuels) | 5,019,760 | ||||||
| 110,960 | Fortis, Inc. (Electric Utilities) | 3,900,029 | ||||||
| 67,155 | Kinder Morgan Canada Ltd.*(a) (Oil, Gas & Consumable Fuels) | 819,759 | ||||||
| 133,666 | TransCanada Corp. (Oil, Gas & Consumable Fuels) | 6,372,017 | ||||||
|
| |||||||
| 16,111,565 | ||||||||
|
| |||||||
| France – 5.9% | ||||||||
| 101,153 | Vinci SA (Construction & Engineering) | 8,628,499 | ||||||
|
| |||||||
| Hong Kong – 4.3% | ||||||||
| 2,660,000 | Beijing Enterprises Water Group Ltd.* (Water Utilities) | 2,064,247 | ||||||
| 904,000 | China Gas Holdings Ltd. (Gas Utilities) | 1,825,031 | ||||||
| 1,299,100 | Hong Kong & China Gas Co. Ltd. (Gas Utilities) | 2,443,189 | ||||||
|
| |||||||
| 6,332,467 | ||||||||
|
| |||||||
| Italy – 6.0% | ||||||||
| 166,814 | Atlantia SpA (Transportation Infrastructure) | 4,692,377 | ||||||
| 357,212 | Enav SpA(a) (Transportation Infrastructure) | 1,540,492 | ||||||
| 495,422 | Terna Rete Elettrica Nazionale SpA (Electric Utilities) | 2,675,838 | ||||||
|
| |||||||
| 8,908,707 | ||||||||
|
| |||||||
| Japan – 2.5% | ||||||||
| 18,100 | East Japan Railway Co. (Road & Rail) | 1,733,911 | ||||||
| 371,000 | Tokyo Gas Co. Ltd. (Gas Utilities) | 1,932,425 | ||||||
|
| |||||||
| 3,666,336 | ||||||||
|
| |||||||
| Spain – 3.0% | ||||||||
| 143,935 | Ferrovial SA (Construction & Engineering) | 3,197,253 | ||||||
| 56,980 | Red Electrica Corp. SA (Electric Utilities) | 1,192,045 | ||||||
|
| |||||||
| 4,389,298 | ||||||||
|
| |||||||
| United Kingdom – 6.9% | ||||||||
| 683,490 | National Grid PLC (Multi-Utilities) | 8,468,769 | ||||||
| 58,476 | Severn Trent PLC (Water Utilities) | 1,662,377 | ||||||
|
| |||||||
| 10,131,146 | ||||||||
|
| |||||||
| Common Stocks – (continued) | ||||||||
| United States – 54.3% | ||||||||
| 78,800 | American Tower Corp. (Equity Real Estate Investment Trusts (REITs)) | 10,426,816 | ||||||
| 62,806 | American Water Works Co., Inc. (Water Utilities) | 4,895,728 | ||||||
| 141,897 | Antero Midstream GP LP* (Oil, Gas & Consumable Fuels) | 3,118,896 | ||||||
| 85,488 | Archrock Partners LP (Energy Equipment & Services) | 1,274,626 | ||||||
| 39,777 | Atmos Energy Corp. (Gas Utilities) | 3,299,502 | ||||||
| 83,123 | Cheniere Energy, Inc.* (Oil, Gas & Consumable Fuels) | 4,048,921 | ||||||
| 66,301 | Crown Castle International Corp. (Equity Real Estate Investment Trusts (REITs)) | 6,642,034 | ||||||
| 18,773 | Dominion Energy, Inc. (Multi-Utilities) | 1,438,575 | ||||||
| 51,070 | Edison International (Electric Utilities) | 3,993,163 | ||||||
| 96,959 | Enterprise Products Partners LP (Oil, Gas & Consumable Fuels) | 2,625,650 | ||||||
| 3,460 | Equinix, Inc. (Equity Real Estate Investment Trusts (REITs)) | 1,484,894 | ||||||
| 65,352 | Eversource Energy (Electric Utilities) | 3,967,520 | ||||||
| 313,016 | Kinder Morgan, Inc. (Oil, Gas & Consumable Fuels) | 5,997,386 | ||||||
| 112,460 | PG&E Corp. (Electric Utilities) | 7,463,970 | ||||||
| 13,983 | SBA Communications Corp.* (Equity Real Estate Investment Trusts (REITs)) | 1,886,307 | ||||||
| 39,557 | Sempra Energy (Multi-Utilities) | 4,460,052 | ||||||
| 74,428 | Targa Resources Corp. (Oil, Gas & Consumable Fuels) | 3,364,146 | ||||||
| 11,515 | Vulcan Materials Co. (Construction Materials) | 1,458,720 | ||||||
| 201,453 | Williams Partners LP (Oil, Gas & Consumable Fuels) | 8,080,280 | ||||||
|
| |||||||
| 79,927,186 | ||||||||
|
| |||||||
| TOTAL COMMON STOCKS | ||||||||
| (Cost $144,939,775) | $ | 144,636,010 | ||||||
|
| |||||||
| Shares | Distribution Rate | Value | ||||||
| Investment Company(b)(c) – 0.0% | ||||||||
| | Goldman Sachs Financial Square Government Fund – | | ||||||
| 15 | 0.845% | $ | 15 | |||||
| (Cost $15) | ||||||||
|
| |||||||
| TOTAL INVESTMENTS – 98.2% | ||||||||
| (Cost $144,939,790) | $ | 144,636,025 | ||||||
|
| |||||||
| | OTHER ASSETS IN EXCESS OF LIABILITIES – 1.8% | 2,663,024 | ||||||
|
| |||||||
| NET ASSETS – 100.0% | $ | 147,299,049 | ||||||
|
| |||||||
| The accompanying notes are an integral part of these financial statements. | 9 |
GOLDMAN SACHS GLOBAL INFRASTRUCTURE FUND
Schedule of Investments (continued)
June 30, 2017 (Unaudited)
| The percentage shown for each investment category reflects the value of investments in that category as a percentage of net assets. | ||
* | Non-income producing security. | |
(a) | Exempt from registration under Rule 144A of the Securities Act of 1933. Such securities may be deemed liquid by the investment adviser and may be resold, normally to qualified institutional buyers in transactions exempt from registration. Total market value of Rule 144A securities amounts to $2,360,251, which represents approximately 1.6% of net assets as of June 30, 2017. | |
(b) | Represents an Affiliated fund. | |
(c) | Variable rate security. Interest rate or distribution rate disclosed is that which is in effect on June 30, 2017. | |
| ||||
Investment Abbreviations: | ||||
GP | —General Partnership | |||
LP | —Limited Partnership | |||
PLC | —Public Limited Company | |||
REIT | —Real Estate Investment Trust | |||
| ||||
| 10 | The accompanying notes are an integral part of these financial statements. |
GOLDMAN SACHS GLOBAL INFRASTRUCTURE FUND
Statement of Assets and Liabilities
June 30, 2017 (Unaudited)
| Assets: | ||||||
Investments of unaffiliated issuers, at value (cost $144,939,775) | $ | 144,636,010 | ||||
Investments of affiliated issuers, at value (cost $15) | 15 | |||||
Cash | 2,142,393 | |||||
Foreign currencies, at value (cost $443,245) | 443,219 | |||||
Receivables: | ||||||
Dividends | 593,322 | |||||
Reimbursement from investment adviser | 24,461 | |||||
Foreign tax reclaims | 27,959 | |||||
Other assets | 15,175 | |||||
| Total assets | 147,882,554 | |||||
| Liabilities: | ||||||
Payables: | ||||||
Investments purchased | 422,224 | |||||
Management Fees | 109,875 | |||||
Distribution and Service fees and Transfer Agency fees | 4,964 | |||||
Accrued expenses | 46,442 | |||||
| Total liabilities | 583,505 | |||||
| Net Assets: | ||||||
Paid-in capital | 147,876,993 | |||||
Undistributed net investment income | 205,856 | |||||
Accumulated net realized loss | (484,340 | ) | ||||
Net unrealized loss | (299,460 | ) | ||||
| NET ASSETS | $ | 147,299,049 | ||||
Net Assets: | ||||||
Class A | $ | 37,770 | ||||
Class C | 54,623 | |||||
Institutional | 147,124,961 | |||||
Class IR | 27,261 | |||||
Class R | 27,124 | |||||
Class R6 | 27,310 | |||||
Total Net Assets | $ | 147,299,049 | ||||
Shares Outstanding $0.001 par value (unlimited number of shares authorized): | ||||||
Class A | 3,576 | |||||
Class C | 5,179 | |||||
Institutional | 13,931,186 | |||||
Class IR | 2,581 | |||||
Class R | 2,568 | |||||
Class R6 | 2,585 | |||||
Net asset value, offering and redemption price per share:(a) | ||||||
Class A | $10.56 | |||||
Class C | 10.55 | |||||
Institutional | 10.56 | |||||
Class IR | 10.56 | |||||
Class R | 10.56 | |||||
Class R6 | 10.56 | |||||
| (a) | Maximum public offering price per share for Class A Shares is $11.17. At redemption, Class C Shares may be subject to a contingent deferred sales charge, assessed on the amount equal to the lesser of the current net asset value (“NAV”) or the original purchase price of the shares. |
| The accompanying notes are an integral part of these financial statements. | 11 |
GOLDMAN SACHS GLOBAL INFRASTRUCTURE FUND
Statement of Operations
For the Six Months Ended June 30, 2017 (Unaudited)
| Investment income: | ||||||
Dividends — unaffiliated issuers (net of foreign withholding taxes of $128,238) | $ | 2,023,323 | ||||
Dividends — affiliated issuers | 3,741 | |||||
| Total investment income | 2,027,064 | |||||
| Expenses: | ||||||
Management fees | 233,540 | |||||
Amortization of offering costs | 142,198 | |||||
Professional fees | 42,469 | |||||
Custody, accounting and administrative services | 13,951 | |||||
Registration fees | 13,567 | |||||
Transfer Agency fees(a) | 10,482 | |||||
Trustee fees | 8,234 | |||||
Printing and mailing costs | 996 | |||||
Distribution and Service fees(a) | 375 | |||||
Other | 4,008 | |||||
| Total expenses | 469,820 | |||||
Less — expense reductions | (212,342 | ) | ||||
| Net expenses | 257,478 | |||||
| NET INVESTMENT INCOME | 1,769,586 | |||||
| Realized and unrealized gain (loss): | ||||||
Net realized gain (loss) from: | ||||||
Investments | (493,248 | ) | ||||
Foreign currency transactions | 38,309 | |||||
Net change in unrealized gain (loss) on: | ||||||
Investments | (304,885 | ) | ||||
Foreign currency translation | 4,406 | |||||
| Net realized and unrealized loss | (755,418 | ) | ||||
| NET INCREASE IN NET ASSETS RESULTING FROM OPERATIONS | $ | 1,014,168 | ||||
| (a) | Class specific Distribution and Service and Transfer Agency fees were as follows: |
| Distribution and Service Fees | Transfer Agency Fees | |||||||||||||||||||||||||||||||||
Class A | Class C | Class R | Class A | Class C | Institutional | Class IR | Class R | Class R6 | ||||||||||||||||||||||||||
| $ | 44 | $ | 265 | $ | 66 | $ | 34 | $ | 50 | $ | 10,346 | $ | 25 | $ | 25 | $ | 2 | |||||||||||||||||
| 12 | The accompanying notes are an integral part of these financial statements. |
GOLDMAN SACHS GLOBAL INFRASTRUCTURE FUND
Statements of Changes in Net Assets
| For the Six Months Ended June 30, 2017 (Unaudited) | For the Period Ended December 31, 2016(a) | |||||||||
| From operations: | ||||||||||
Net investment income | $ | 1,769,586 | $ | 24,829 | ||||||
Net realized gain (loss) | (454,939 | ) | 1,226 | |||||||
Net change in unrealized gain (loss) | (300,479 | ) | 1,019 | |||||||
| Net increase in net assets resulting from operations | 1,014,168 | 27,074 | ||||||||
| Distributions to shareholders: | ||||||||||
From net investment income | ||||||||||
Class A Shares | (433 | ) | (130 | ) | ||||||
Class C Shares | (437 | ) | (104 | ) | ||||||
Institutional Shares | (1,561,897 | ) | (19,157 | ) | ||||||
Class IR Shares | (342 | ) | (152 | ) | ||||||
Class R Shares | (278 | ) | (106 | ) | ||||||
Class R6 Shares | (364 | ) | (169 | ) | ||||||
From net realized gains | ||||||||||
Class A Shares | — | (299 | ) | |||||||
Class C Shares | — | (567 | ) | |||||||
Institutional Shares | — | (35,490 | ) | |||||||
Class IR Shares | — | (304 | ) | |||||||
Class R Shares | — | (293 | ) | |||||||
Class R6 Shares | — | (309 | ) | |||||||
Return of capital | ||||||||||
Class A Shares | — | (25 | ) | |||||||
Class C Shares | — | (20 | ) | |||||||
Institutional Shares | — | (3,740 | ) | |||||||
Class IR Shares | — | (30 | ) | |||||||
Class R Shares | — | (21 | ) | |||||||
Class R6 Shares | — | (33 | ) | |||||||
| Total distributions to shareholders | (1,563,751 | ) | (60,949 | ) | ||||||
| From share transactions: | ||||||||||
Proceeds from sales of shares | 146,427,403 | 3,030,465 | ||||||||
Reinvestment of distributions | 1,563,751 | 60,948 | ||||||||
Cost of shares redeemed | (3,200,000 | ) | (60 | ) | ||||||
| Net increase in net assets resulting from share transactions | 144,791,154 | 3,091,353 | ||||||||
| TOTAL INCREASE | 144,241,571 | 3,057,478 | ||||||||
| Net assets: | ||||||||||
Beginning of period | 3,057,478 | — | ||||||||
End of period | $ | 147,299,049 | $ | 3,057,478 | ||||||
| Undistributed net investment income | $ | 205,856 | $ | 21 | ||||||
| (a) | Commenced operations on June 27, 2016. |
| The accompanying notes are an integral part of these financial statements. | 13 |
GOLDMAN SACHS GLOBAL INFRASTRUCTURE FUND
Selected Data for a Share Outstanding Throughout Each Period
| From investment operations | Distributions to shareholders | |||||||||||||||||||||||||||||||||
| Year - Share Class | Net asset value, beginning of period | Net investment income(a) | Net realized and unrealized gain | Total from investment operations | From net investment income | From net realized gains | From capital | Total distributions | ||||||||||||||||||||||||||
| FOR THE SIX MONTHS ENDED JUNE 30, (UNAUDITED) | ||||||||||||||||||||||||||||||||||
2017 - A | $ | 9.89 | $ | 0.18 | (e) | $ | 0.61 | $ | 0.79 | $ | (0.12 | ) | $ | — | $ | — | $ | (0.12 | ) | |||||||||||||||
2017 - C | 9.88 | 0.13 | (e) | 0.63 | 0.76 | (0.09 | ) | — | — | (0.09 | ) | |||||||||||||||||||||||
2017 - Institutional | 9.89 | 0.36 | (e) | 0.45 | 0.81 | (0.14 | ) | — | — | (0.14 | ) | |||||||||||||||||||||||
2017 - IR | 9.89 | 0.18 | (e) | 0.62 | 0.80 | (0.13 | ) | — | — | (0.13 | ) | |||||||||||||||||||||||
2017 - R | 9.89 | 0.15 | (e) | 0.63 | 0.78 | (0.11 | ) | — | — | (0.11 | ) | |||||||||||||||||||||||
2017- R6 | 9.89 | 0.19 | (e) | 0.62 | 0.81 | (0.14 | ) | — | — | (0.14 | ) | |||||||||||||||||||||||
| FOR THE PERIOD ENDED DECEMBER 31, | ||||||||||||||||||||||||||||||||||
2016 - A (Commenced on June 27, 2016) | 10.00 | 0.06 | 0.01 | 0.07 | (0.05 | ) | (0.12 | ) | (0.01 | ) | (0.18 | ) | ||||||||||||||||||||||
2016 - C (Commenced on June 27, 2016) | 10.00 | 0.02 | 0.01 | 0.03 | (0.02 | ) | (0.12 | ) | (0.01 | ) | (0.15 | ) | ||||||||||||||||||||||
2016 - Institutional | 10.00 | 0.08 | 0.01 | 0.09 | (0.07 | ) | (0.12 | ) | (0.01 | ) | (0.20 | ) | ||||||||||||||||||||||
2016 - IR (Commenced on June 27, 2016) | 10.00 | 0.08 | — | (f) | 0.08 | (0.06 | ) | (0.12 | ) | (0.01 | ) | (0.19 | ) | |||||||||||||||||||||
2016 - R (Commenced on June 27, 2016) | 10.00 | 0.05 | 0.01 | 0.06 | (0.04 | ) | (0.12 | ) | (0.01 | ) | (0.17 | ) | ||||||||||||||||||||||
2016 - R6 (Commenced on June 27, 2016) | 10.00 | 0.09 | — | (f) | 0.09 | (0.07 | ) | (0.12 | ) | (0.01 | ) | (0.20 | ) | |||||||||||||||||||||
| (a) | Calculated based on the average shares outstanding methodology. |
| (b) | Assumes investment at the NAV at the beginning of the period, reinvestment of all dividends and distributions, a complete redemption of the investment at the NAV at the end of the period and no sales or redemption charges. Total returns would be reduced if a sales or redemption charge was taken into account. Returns do not reflect the impact of taxes to shareholder relating to Fund distributions or the redemption of Fund shares. Total returns for periods less than one full year are not annualized. |
| (c) | Annualized. |
| (d) | The Fund’s portfolio turnover rate is calculated in accordance with regulatory requirements, without regard to transactions involving short term investments. If such transactions were included, the Fund’s portfolio turnover rate may be higher. |
| (e) | Reflects income recognized from special dividends which amounted to $0.17 per share and 3.23% of average net assets. |
| (f) | Amount is less than $0.005 per share. |
| 14 | The accompanying notes are an integral part of these financial statements. |
GOLDMAN SACHS GLOBAL INFRASTRUCTURE FUND
| Net asset value, end of period | Total return(b) | Net assets, end of period (in 000s) | Ratio of net expenses to average net assets(c) | Ratio of total expenses to average net assets(c) | Ratio of net investment income to average net assets(c) | Portfolio turnover rate(d) | ||||||||||||||||||||||||||||||||||
| $ | 10.56 | 8.01 | % | $ | 38 | 1.39 | % | 7.87 | % | 3.39 | %(e) | 77 | % | |||||||||||||||||||||||||||
| 10.55 | 7.64 | 55 | 2.14 | 8.63 | 2.49 | (e) | 77 | |||||||||||||||||||||||||||||||||
| 10.56 | 8.21 | 147,125 | 0.99 | 1.51 | 6.82 | (e) | 77 | |||||||||||||||||||||||||||||||||
| 10.56 | 8.13 | 27 | 1.14 | 7.62 | 3.49 | (e) | 77 | |||||||||||||||||||||||||||||||||
| 10.56 | 7.88 | 27 | 1.64 | 8.12 | 2.99 | (e) | 77 | |||||||||||||||||||||||||||||||||
| 10.56 | 8.22 | 27 | 0.97 | 7.47 | 3.67 | (e) | 77 | |||||||||||||||||||||||||||||||||
| 9.89 | 0.69 | 25 | 1.40 | 15.63 | 1.19 | 59 | ||||||||||||||||||||||||||||||||||
| 9.88 | 0.30 | 51 | 2.14 | 16.73 | 0.46 | 59 | ||||||||||||||||||||||||||||||||||
| 9.89 |
| 0.89 | 2,906 | 0.99 | 15.23 | 1.59 | 59 | ||||||||||||||||||||||||||||||||
| 9.89 | 0.82 | 25 | 1.15 | 15.38 | 1.44 | 59 | ||||||||||||||||||||||||||||||||||
| 9.89 | 0.56 | 25 | 1.65 | 15.88 | 0.93 | 59 | ||||||||||||||||||||||||||||||||||
| 9.89 | 0.91 | 25 | 0.95 | 15.19 | 1.63 | 59 | ||||||||||||||||||||||||||||||||||
| The accompanying notes are an integral part of these financial statements. | 15 |
GOLDMAN SACHS GLOBAL INFRASTRUCTURE FUND
June 30, 2017 (Unaudited)
| 1. ORGANIZATION |
Goldman Sachs Trust (the “Trust”) is a Delaware statutory trust registered under the Investment Company Act of 1940, as amended (the “Act”), as an open-end management investment company. Goldman Sachs Global Infrastructure Fund (the “Fund”) is a non-diversified portfolio and currently offers six classes of shares: Class A, Class C, Institutional, Class IR, Class R, and Class R6 Shares. The Fund commenced operations on June 27, 2016.
Class A Shares are sold with a front-end sales charge of up to 5.50%. Class C Shares are sold with a contingent deferred sales charge (“CDSC”) of 1.00%, which is imposed on redemptions made within 12 months of purchase. Institutional, Class IR, Class R and Class R6 shares are not subject to a sales charge.
Goldman Sachs Asset Management, L.P. (“GSAM”), an affiliate of Goldman Sachs & Co. LLC (formerly Goldman, Sachs & Co.) (“Goldman Sachs”), serves as investment adviser to the Fund pursuant to a management agreement (the “Agreement”) with the Trust.
| 2. SIGNIFICANT ACCOUNTING POLICIES |
The financial statements have been prepared in accordance with accounting principles generally accepted in the United States of America (“GAAP”) and require management to make estimates and assumptions that may affect the reported amounts and disclosures. Actual results may differ from those estimates and assumptions.
A. Investment Valuation — The Fund’s valuation policy is to value investments at fair value.
B. Investment Income and Investments — Investment income includes interest income, dividend income, and securities lending income. Interest income is accrued daily and adjusted for amortization of premiums and accretion of discounts. Dividend income is recognized on ex-dividend date or, for certain foreign securities, as soon as such information is obtained subsequent to the ex-dividend date. Investment transactions are reflected on trade date. Realized gains and losses are calculated using identified cost. Investment transactions are recorded on the following business day for daily net asset value (“NAV”) calculations. Investment income is recorded net of any foreign withholding taxes, less any amounts reclaimable. The Fund may file withholding tax reclaims in certain jurisdictions to recover a portion of amounts previously withheld. Any foreign capital gains tax is accrued daily based upon net unrealized gains, and is payable upon sale of such investments. Distributions received from the Fund’s investments in U.S. real estate investment trusts (“REITs”) may be characterized as ordinary income, net capital gain or a return of capital. A return of capital is recorded by the Fund as a reduction to the cost basis of the REIT. Distributions from master limited partnerships (“MLPs”) are generally recorded based on the characterization reported on the MLP’s tax return. The Fund records its pro-rata share of the income/loss and capital gains/losses, allocated from the underlying partnerships and adjusts the cost basis of the underlying partnerships accordingly.
C. Class Allocations and Expenses — Investment income, realized and unrealized gain (loss), and non-class specific expenses of the Fund are allocated daily based upon the proportion of net assets of each class. Non-class specific expenses directly incurred by the Fund are charged to the Fund, while such expenses incurred by the Trust are allocated across the Fund on a straight-line and/or pro-rata basis depending upon the nature of the expenses. Class specific expenses, where applicable, are borne by the respective share classes and include Distribution and Service, Transfer Agency and Service and Shareholder Administration fees.
D. Offering Costs — Offering costs paid in connection with the initial offering of shares of the Fund were amortized on a straight-line basis over 12 months from the date of commencement of operations.
E. Federal Taxes and Distributions to Shareholders — It is the Fund’s policy to comply with the requirements of the Internal Revenue Code of 1986, as amended (the “Code”), applicable to regulated investment companies (mutual funds) and to distribute each year substantially all of its investment company taxable income and capital gains to its shareholders. Accordingly, the Fund is not required to make any provisions for the payment of federal income tax. Distributions to shareholders are recorded on the ex-dividend date. Distributions from net investment income are declared and paid quarterly, and distributions from net capital gains, if any, are declared and paid annually.
16
GOLDMAN SACHS GLOBAL INFRASTRUCTURE FUND
| 2. SIGNIFICANT ACCOUNTING POLICIES (continued) |
Net capital losses, if any, are carried forward to future fiscal years and may be used to the extent allowed by the Code to offset any future capital gains. Losses that are carried forward will retain their character as either short-term or long-term capital losses. Utilization of capital loss carryforwards will reduce the requirement of future capital gains distributions.
The characterization of distributions to shareholders for financial reporting purposes is determined in accordance with federal income tax rules, which may differ from GAAP. The source of the Fund’s distributions may be shown in the accompanying financial statements as either from net investment income, net realized gain or capital. Certain components of the Fund’s net assets on the Statement of Assets and Liabilities reflect permanent GAAP/tax differences based on the appropriate tax character.
F. Foreign Currency Translation — The accounting records and reporting currency of the Fund are maintained in U.S. dollars. Assets and liabilities denominated in foreign currencies are translated into U.S. dollars using the current exchange rates at the close of each business day. The effect of changes in foreign currency exchange rates on investments is included within net realized and unrealized gain (loss) on investments. Changes in the value of other assets and liabilities as a result of fluctuations in foreign exchange rates are included in the Statement of Operations within net change in unrealized gain (loss) on foreign currency translations. Transactions denominated in foreign currencies are translated into U.S. dollars on the date the transaction occurred, the effects of which are included within net realized gain (loss) on foreign currency transactions.
| 3. INVESTMENTS AND FAIR VALUE MEASUREMENTS |
U.S. GAAP defines the fair value of a financial instrument as the amount that would be received to sell an asset or paid to transfer a liability in an orderly transaction between market participants at the measurement date (i.e., the exit price); the Fund’s policy is to use the market approach, GAAP establishes a fair value hierarchy that prioritizes the inputs to valuation techniques used to measure fair value. The hierarchy gives the highest priority to unadjusted quoted prices in active markets for identical assets or liabilities (Level 1 measurements) and the lowest priority to unobservable inputs (Level 3 measurements). The levels used for classifying investments are not necessarily an indication of the risk associated with investing in these investments. The three levels of the fair value hierarchy are described below:
Level 1 — Unadjusted quoted prices in active markets that are accessible at the measurement date for identical, unrestricted assets or liabilities;
Level 2 — Quoted prices in markets that are not active or financial instruments for which significant inputs are observable (including, but not limited to, quoted prices for similar investments, interest rates, foreign exchange rates, volatility and credit spreads), either directly or indirectly;
Level 3 — Prices or valuations that require significant unobservable inputs (including GSAM’s assumptions in determining fair value measurement).
Changes in valuation techniques may result in transfers into or out of an assigned level within the hierarchy. In accordance with the Fund’s policy, transfers between different levels of the fair value hierarchy resulting from such changes are deemed to have occurred as of the beginning of the reporting period.
The Board of Trustees (“Trustees”) has approved Valuation Procedures that govern the valuation of the portfolio investments held by the Fund, including investments for which market quotations are not readily available. The Trustees have delegated to GSAM day-to-day responsibility for implementing and maintaining internal controls and procedures related to the valuation of the Fund’s portfolio investments. To assess the continuing appropriateness of pricing sources and methodologies, GSAM regularly performs price verification procedures and issues challenges as necessary to third party pricing vendors or brokers, and any differences are reviewed in accordance with the Valuation Procedures.
A. Level 1 and Level 2 Fair Value Investments — The valuation techniques and significant inputs used in determining the fair values for investments classified as Level 1 and Level 2 are as follows:
Equity Securities — Equity securities traded on a United States (“U.S.”) securities exchange or the NASDAQ system, or those located on certain foreign exchanges, including but not limited to the Americas, are valued daily at their last sale price or official
17
GOLDMAN SACHS GLOBAL INFRASTRUCTURE FUND
Notes to Financial Statements (continued)
June 30, 2017 (Unaudited)
| 3. INVESTMENTS AND FAIR VALUE MEASUREMENTS (continued) |
closing price on the principal exchange or system on which they are traded. If there is no sale or official closing price or such price is believed by GSAM to not represent fair value, equity securities are valued at the last bid price for long positions and at the last ask price for short positions. To the extent these investments are actively traded, they are classified as Level 1 of the fair value hierarchy, otherwise they are generally classified as Level 2.
Unlisted equity securities for which market quotations are available are valued at the last sale price on the valuation date, or if no sale occurs, at the last bid price. Securities traded on certain foreign securities exchanges are valued daily at fair value determined by an independent fair value service (if available) under Valuation Procedures approved by the Trustees and consistent with applicable regulatory guidance. The independent fair value service takes into account multiple factors including, but not limited to, movements in the securities markets, certain depositary receipts, futures contracts and foreign currency exchange rates that have occurred subsequent to the close of the foreign securities exchange. These investments are generally classified as Level 2 of the fair value hierarchy.
Money Market Funds — Investments in the Goldman Sachs Financial Square Government Fund (“Underlying Fund”) are valued at the NAV of the Institutional Share class on the day of valuation. These investments are generally classified as Level 1 of the fair value hierarchy. For information regarding an Underlying Fund’s accounting policies and investment holdings, please see the Underlying Fund’s shareholder report.
B. Level 3 Fair Value Investments — To the extent that significant inputs to valuation models and other alternative pricing sources are unobservable, or if quotations are not readily available, or if GSAM believes that such quotations do not accurately reflect fair value, the fair value of the Fund’s investments may be determined under Valuation Procedures approved by the Trustees. GSAM, consistent with its procedures and applicable regulatory guidance, may make an adjustment to the most recent valuation prices of either domestic or foreign securities in light of significant events to reflect what it believes to be the fair value of the securities at the time of determining the Fund’s NAV. Significant events which could affect a large number of securities in a particular market may include, but are not limited to: significant fluctuations in U.S. or foreign markets; market dislocations; market disruptions; or unscheduled market closings. Significant events which could also affect a single issuer may include, but are not limited to: corporate actions such as reorganizations, mergers and buy-outs; ratings downgrades; and bankruptcies.
C. Fair Value Hierarchy — The following is a summary of the Fund’s investments classified in the fair value hierarchy as of June 30, 2017:
| GLOBAL INFRASTRUCTURE FUND | ||||||||||||
| Investment Type | Level 1 | Level 2 | Level 3 | |||||||||
| Assets | ||||||||||||
Common Stock and/or Other Equity Investments(a) | ||||||||||||
Asia | $ | — | $ | 9,998,803 | $ | — | ||||||
Australia and Oceania | — | 6,540,806 | — | |||||||||
Europe | — | 32,057,650 | — | |||||||||
North America | 96,038,751 | — | — | |||||||||
Investment Company | 15 | — | — | |||||||||
| Total | $ | 96,038,766 | $ | 48,597,259 | $ | — | ||||||
| (a) | Amounts are disclosed by continent to highlight the impact of time zone differences between local market close and the calculation of net asset value. Security valuations are based on the principal exchange or system on which they are traded, which may differ from country of domicile noted in the table. The Fund utilizes fair value model prices provided by an independent fair value service for certain international equity securities, resulting in a Level 2 classification. |
For further information regarding security characteristics, see the Schedule of Investments.
18
GOLDMAN SACHS GLOBAL INFRASTRUCTURE FUND
| 4. AGREEMENTS AND AFFILIATED TRANSACTIONS |
A. Management Agreement — Under the Agreement, GSAM manages the Fund, subject to the general supervision of the Trustees.
As compensation for the services rendered pursuant to the Agreement, the assumption of the expenses related thereto and administration of the Fund’s business affairs, including providing facilities, GSAM is entitled to a management fee, accrued daily and paid monthly, equal to an annual percentage rate of the Fund’s average daily net assets. For the six months ended June 30, 2017, contractual and effective net management fees with GSAM were at the following rates:
| Contractual Management Rate | Effective Net Management Rate* | |||||||||||||||||||||||||
First $1 billion | Next $1 billion | Next $3 billion | Next $3 billion | Over $8 billion | Effective Rate | |||||||||||||||||||||
| 0.90% | 0.81% | 0.77% | 0.75% | 0.74% | 0.90% | 0.90% | ||||||||||||||||||||
| * | Effective Net Management Rate includes the impact of management fee waivers of affiliated underlying funds, if any. |
The Fund invests in Institutional Shares of the Goldman Sachs Financial Square Government Fund, which is an affiliated Underlying Fund. GSAM has agreed to waive a portion of its management fee payable by the Fund in an amount equal to the management fee it earns as an investment adviser to any of the affiliated Underlying Funds in which the Fund invests. For the six months ended June 30, 2017, GSAM waived $930 of the Fund’s management fee.
B. Distribution and/or Service (12b-1) Plans — The Trust, on behalf of Class A and Class R Shares of the Fund, has adopted Distribution and Service Plans subject to Rule 12b-1 under the Act. Under the Distribution and Service Plans, Goldman Sachs, which serves as distributor (the “Distributor”), is entitled to a fee accrued daily and paid monthly for distribution services and personal and account maintenance services, which may then be paid by Goldman Sachs to authorized dealers. These fees are equal to an annual percentage rate of the average daily net assets attributable to Class A or Class R Shares of the Fund, as applicable, as set forth below.
The Trust, on behalf of Class C Shares of the Fund, has adopted a Distribution Plan subject to Rule 12b-1 under the Act. Under the Distribution Plan, Goldman Sachs as Distributor is entitled to a fee accrued daily and paid monthly for distribution services, which may then be paid by Goldman Sachs to authorized dealers. These fees are equal to an annual percentage rate of the average daily net assets attributable to Class C Shares of the Fund, as set forth below.
| Distribution and Service Plan Rates | ||||||||||||
| Class A* | Class C | Class R* | ||||||||||
Distribution Plan | 0.25 | % | 0.75 | % | 0.50 | % | ||||||
| * | With respect to Class A and Class R Shares, the Distributor at its discretion may use compensation for distribution services paid under the Distribution Plan to compensate service organizations for personal and account maintenance services and expenses as long as such total compensation does not exceed the maximum cap on “service fees” imposed by the Financial Industry Regulatory Authority. |
C. Distribution Agreement — Goldman Sachs, as Distributor of the shares of the Fund pursuant to a Distribution Agreement, may retain a portion of the Class A Shares’ front end sales charge and Class C Shares’ CDSC. During the six months ended June 30, 2017, Goldman Sachs did not retain any portion of the sales charges or CDSC for this fund.
D. Service Plan — The Trust, on behalf of the Fund, has adopted a Service Plan to allow Class C Shares to compensate service organizations (including Goldman Sachs) for providing varying levels of personal and account maintenance services to their customers who are beneficial owners of such shares. The Service Plan provides for compensation to the service organizations equal to an annual percentage rate of 0.25% of the average daily net assets attributable to Class C Shares of the Fund.
E. Transfer Agency Agreement — Goldman Sachs also serves as the transfer agent of the Fund for a fee pursuant to the Transfer Agency Agreement. The fees charged for such transfer agency services are accrued daily and paid monthly at annual rates as follows: 0.19% of the average daily net assets of Class A, Class C, Class IR and Class R Shares; 0.02% of the average daily net assets of Class R6 Shares; and 0.04% of the average daily net assets of Institutional Shares. Effective July 28, 2017, the annual
19
GOLDMAN SACHS GLOBAL INFRASTRUCTURE FUND
Notes to Financial Statements (continued)
June 30, 2017 (Unaudited)
| 4. AGREEMENTS AND AFFILIATED TRANSACTIONS (continued) |
rates were amended for Class A, Class C, Class IR and Class R Shares to 0.18% of average daily net assets, and for Class R6 Shares to 0.03% of average daily net assets.
F. Other Expense Agreements and Affiliated Transactions — GSAM has agreed to limit certain “Other Expenses” of the Fund (excluding acquired fund fees and expenses, transfer agency fees and expenses, service fees and shareholder administration fees (as applicable), taxes, interest, brokerage fees, shareholder meeting, litigation, indemnification and extraordinary expenses) to the extent such expenses exceed, on an annual basis, a percentage rate of the average daily net assets of the Fund. Such Other Expense reimbursements, if any, are accrued daily and paid monthly. In addition, the Fund is not obligated to reimburse GSAM for prior fiscal year expense reimbursements, if any. The Other Expense limitations as an annual percentage rate of average daily net assets for the Fund are 0.054%. These Other Expense limitations will remain in place through at least April 28, 2018, and prior to such date GSAM may not terminate the arrangements without the approval of the Trustees. In addition, the Fund has entered into certain offset arrangements with the transfer agent, which may result in a reduction of the Fund’s expenses and are received irrespective of the application of the “Other Expense” limitations described above.
For the six months ended June 30, 2017, these expense reductions, including any fee waivers and Other Expense reimbursements, were as follows:
| Management Fee Waiver | Other Expense Reimbursements | Total Expense Reductions | ||||||||
| $ | 930 | $ | 211,412 | $ | 212,342 | |||||
G. Line of Credit Facility — As of June 30, 2017, the Fund participated in a $1,100,000,000 committed, unsecured revolving line of credit facility (the “facility”) together with other funds of the Trust and certain registered investment companies having management agreements with GSAM or its affiliates. This facility is to be used for temporary emergency purposes, or to allow for an orderly liquidation of securities to meet redemption requests. The interest rate on borrowings is based on the federal funds rate. The facility also requires a fee to be paid by the Fund based on the amount of the commitment that has not been utilized. For the six months ended June 30, 2017, the Fund did not have any borrowings under the facility.
H. Other Transactions with Affiliates — For the six months ended June 30, 2017, Goldman Sachs earned $53 in brokerage commissions from portfolio transactions on behalf of the Fund.
As of June 30, 2017, The Goldman Sachs Group, Inc. was the beneficial owner of approximately 72% of Class A, 49% of Class C and 100% of each of Class IR, Class R and Class R6 shares of the Fund, respectively.
The following table provides information about the Fund’s investment in the Goldman Sachs Financial Square Government Fund as of and for the six months ended June 30, 2017:
| Underlying Fund | Market Value 12/31/16 | Purchases at Cost | Proceeds from Sales | Market Value 6/30/2017 | Dividend Income | |||||||||||||
Goldman Sachs Financial Square Government Fund | $12,015 | $ | 139,205,005 | $ | (139,217,005 | ) | $ | 15 | $ | 3,741 | ||||||||
| 5. PORTFOLIO SECURITIES TRANSACTIONS |
The cost of purchases and proceeds from sales and maturities of long-term securities for the six months ended June 30, 2017, were $192,056,411 and $49,471,986 respectively.
| 6. TAX INFORMATION |
As of the Fund’s most recent fiscal year end, December 31, 2016 the Fund’s timing differences on a tax basis was $(22,742).
20
GOLDMAN SACHS GLOBAL INFRASTRUCTURE FUND
| 6. TAX INFORMATION (continued) |
As of June 30, 2017, the Fund’s aggregate security unrealized gains and losses based on cost for U.S. federal income tax purposes were as follows:
Tax Cost | $ | 144,946,698 | ||
Gross unrealized gain | 3,356,845 | |||
Gross unrealized loss | (3,667,518 | ) | ||
Net unrealized loss | $ | (310,673 | ) |
The difference between GAAP-basis and tax basis unrealized gains (losses) is attributable primarily to wash sales.
GSAM has reviewed the Fund’s tax positions for all open tax years (the current and prior year, as applicable) and has concluded that no provision for income tax is required in the Fund’s financial statements. Such open tax years remain subject to examination and adjustment by tax authorities.
| 7. OTHER RISKS |
The Fund’s risks include, but are not limited to, the following:
Foreign Countries Risk — Investing in foreign markets may involve special risks and considerations not typically associated with investing in the United States. Foreign securities may be subject to risk of loss because of more or less foreign government regulation, less public information and less economic, political and social stability in the countries in which the Fund invests. The imposition of exchange controls, confiscations, trade restrictions (including tariffs) and other government restrictions by the United States or other governments, or from problems in share registration, settlement or custody, may also result in losses. Foreign risk also involves the risk of negative foreign currency rate fluctuations, which may cause the value of securities denominated in such foreign currency (or other instruments through which the Fund has exposure to foreign currencies) to decline in value. Currency exchange rates may fluctuate significantly over short periods of time.
Foreign Custody Risk — If the Fund invests in foreign securities may hold such securities and cash with foreign banks, agents, and securities depositories appointed by the Fund’s custodian (each a “Foreign Custodian”). Some foreign custodians may be recently organized or new to the foreign custody business. In some countries, Foreign Custodians may be subject to little or no regulatory oversight over, or independent evaluation of, their operations. Further, the laws of certain countries may place limitations on the Fund’s ability to recover its assets if a Foreign Custodian enters bankruptcy.
Geographic Risk — If the Fund focuses its investments in securities of issuers located in a particular country or geographic region, it will subject the Fund, to a greater extent than if its investments were less focused, to the risks of volatile economic cycles and/or conditions and developments that may be particular to that country or region, such as: adverse securities markets; adverse exchange rates; adverse social, political, regulatory, economic, business, environmental or other developments; or natural disasters.
Industry Concentration Risk — Concentrating Fund investments in a limited number of issuers conducting business in the same industry or group of industries will subject the Fund to a greater risk of loss as a result of adverse economic, business, political, environmental or other developments than if its investments were diversified across different industries.
Investments in Other Investment Companies — As a shareholder of another investment company, including an exchange-traded fund (“ETF”), the Fund will indirectly bear its proportionate share of any net management fees and other expenses paid by such other investment companies, in addition to the fees and expenses regularly borne by the Fund. ETFs are subject to risks that do not apply to conventional mutual funds, including but not limited to the following: (i) the market price of the ETF’s shares may trade at a premium or a discount to their NAV; and (ii) an active trading market for an ETF’s shares may not develop or be maintained.
21
GOLDMAN SACHS GLOBAL INFRASTRUCTURE FUND
Notes to Financial Statements (continued)
June 30, 2017 (Unaudited)
| 7. OTHER RISKS (continued) |
Large Shareholder Transactions Risk — The Fund may experience adverse effects when certain large shareholders, such as other funds, institutional investors (including those trading by use of non-discretionary mathematical formulas), financial intermediaries (who may make investment decisions on behalf of underlying clients and/or include the Fund in their investment model), individuals, accounts and Goldman Sachs affiliates, purchase or redeem large amounts of shares of the Fund. Such large shareholder redemptions may cause the Fund to sell portfolio securities at times when it would not otherwise do so, which may negatively impact the Fund’s NAV and liquidity. These transactions may also accelerate the realization of taxable income to shareholders if such sales of investments resulted in gains, and may also increase transaction costs. In addition, a large redemption could result in the Fund’s current expenses being allocated over a smaller asset base, leading to an increase in the Fund’s expense ratio. Similarly, large Fund share purchases may adversely affect the Fund’s performance to the extent that the Fund is delayed in investing new cash and is required to maintain a larger cash position than it ordinarily would.
Liquidity Risk — The Fund may make investments that are illiquid or that may become less liquid in response to market developments or adverse investor perceptions. Illiquid investments may be more difficult to value. Liquidity risk may also refer to the risk that the Fund will not be able to pay redemption proceeds within the allowable time period because of unusual market conditions, an unusually high volume of redemption requests, or other reasons. To meet redemption requests, the Fund may be forced to sell investments at an unfavorable time and/or under unfavorable conditions.
Market and Credit Risks — In the normal course of business, the Fund trades financial instruments and enters into financial transactions where risk of potential loss exists due to changes in the market (market risk). Additionally, the Fund may also be exposed to credit risk in the event that an issuer or guarantor fails to perform or that an institution or entity with which the Fund has unsettled or open transactions defaults.
Master Limited Partnership Risk — Investments in securities of MLPs involve risks that differ from investments in common stock, including risks related to limited control and limited rights to vote on matters affecting the MLP, risks related to potential conflicts of interest between the MLP and the MLP’s general partner, cash flow risks, dilution risks, limited liquidity and risks related to the general partner’s right to require unit-holders to sell their common units at an undesirable time or price.
Non-Diversification Risk — The Fund is non-diversified, meaning that it is permitted to invest a larger percentage of its assets in fewer issuers than diversified mutual funds. Thus, the Fund may be more susceptible to adverse developments affecting any single issuer held in its portfolio, and may be more susceptible to greater losses because of these developments.
| 8. INDEMNIFICATIONS |
Under the Trust’s organizational documents, its Trustees, officers, employees and agents are indemnified, to the extent permitted by the Act and state law, against certain liabilities that may arise out of performance of their duties to the Fund. Additionally, in the course of business, the Fund enters into contracts that contain a variety of indemnification clauses. The Fund’s maximum exposure under these arrangements is unknown, as this would involve future claims that may be made against the Fund that have not yet occurred. However, GSAM believes the risk of loss under these arrangements to be remote.
| 9. SUBSEQUENT EVENTS |
Subsequent events after the Statement of Assets and Liabilities date have been evaluated and GSAM has concluded that there is no impact requiring adjustment or disclosure in the financial statements.
22
GOLDMAN SACHS GLOBAL INFRASTRUCTURE FUND
| 10. SUMMARY OF SHARE TRANSACTIONS |
Share activity is as follows:
| For the Six Months Ended June 30, 2017 (Unaudited) | For the Period Ended December 31, 2016(a) | |||||||||||||||
| Shares | Dollars | Shares | Dollars | |||||||||||||
|
| |||||||||||||||
| Class A Shares | ||||||||||||||||
Shares sold | 989 | $ | 10,000 | 2,502 | $ | 25,015 | ||||||||||
Reinvestment of distributions | 41 | 433 | 45 | 454 | ||||||||||||
Shares redeemed | — | — | (1 | ) | (10 | ) | ||||||||||
| 1,030 | 10,433 | 2,546 | 25,459 | |||||||||||||
| Class C Shares | ||||||||||||||||
Shares sold | — | — | 5,068 | 50,409 | ||||||||||||
Reinvestment of distributions | 42 | 437 | 70 | 691 | ||||||||||||
Shares redeemed | — | — | (1 | ) | (10 | ) | ||||||||||
| 42 | 437 | 5,137 | 51,090 | |||||||||||||
| Institutional Shares | ||||||||||||||||
Shares sold | 13,786,947 | 146,417,403 | 287,969 | 2,880,011 | ||||||||||||
Reinvestment of distributions | 147,913 | 1,561,897 | 5,808 | 58,387 | ||||||||||||
Shares redeemed | (297,450 | ) | (3,200,000 | ) | (1 | ) | (10 | ) | ||||||||
| 13,637,410 | 144,779,300 | 293,776 | 2,938,388 | |||||||||||||
| Class IR Shares | ||||||||||||||||
Shares sold | — | — | 2,501 | 25,010 | ||||||||||||
Reinvestment of distributions | 33 | 342 | 48 | 486 | ||||||||||||
Shares redeemed | — | — | (1 | ) | (10 | ) | ||||||||||
| 33 | 342 | 2,548 | 25,486 | |||||||||||||
| Class R Shares | ||||||||||||||||
Shares sold | — | — | 2,501 | 25,010 | ||||||||||||
Reinvestment of distributions | 26 | 278 | 42 | 420 | ||||||||||||
Shares redeemed | — | — | (1 | ) | (10 | ) | ||||||||||
| 26 | 278 | 2,542 | 25,420 | |||||||||||||
| Class R6 Shares | ||||||||||||||||
Shares sold | — | — | 2,501 | 25,010 | ||||||||||||
Reinvestment of distributions | 34 | 364 | 51 | 510 | ||||||||||||
Shares redeemed | — | — | (1 | ) | (10 | ) | ||||||||||
| 34 | 364 | 2,551 | 25,510 | |||||||||||||
NET INCREASE | 13,638,575 | $ | 144,791,154 | 309,100 | $ | 3,091,353 | ||||||||||
| (a) | Commenced operations on June 27, 2016. |
23
GOLDMAN SACHS GLOBAL INFRASTRUCTURE FUND
As a shareholder of Class A, Class C, Institutional, Class IR, Class R or Class R6 Shares of the Fund you incur two types of costs: (1) transaction costs, including sales charges on purchase payments (with respect to Class A Shares) and contingent deferred sales charges on redemptions (with respect to Class C Shares); and (2) ongoing costs, including management fees; distribution and service (12b-1) fees (with respect to Class A, Class C and Class R Shares); and other Fund expenses. This example is intended to help you understand your ongoing costs (in dollars) of investing in Class A, Class C, Institutional, Class IR, Class R and Class R6 Shares of the Fund and to compare these costs with the ongoing costs of investing in other mutual funds.
The example is based on an investment of $1,000 invested at the beginning of the period and held for the entire period from January 1, 2017, through June 30, 2017, which represents a period of 181 days of a 365 day year.
Actual Expenses — The first line under each share class in the table below provides information about actual account values and actual expenses. You may use the information in this line, together with the amount you invested, to estimate the expenses that you paid over the period. Simply divide your account value by $1,000 (for example, an $8,600 account value divided by $1,000=8.6), then multiply the result by the number in the first line under the heading entitled “Expenses Paid” to estimate the expenses you paid on your account during this period.
Hypothetical Example for Comparison Purposes — The second line under each share class in the table below provides information about hypothetical account values and hypothetical expenses based on the Fund’s actual net expense ratio and an assumed rate of return of 5% per year before expenses, which is not the Fund’s actual return. The hypothetical account values and expenses may not be used to estimate the actual ending account balance or expenses you paid for the period. You may use this information to compare the ongoing costs of investing in the Fund and other funds. To do so, compare this 5% hypothetical example with the 5% hypothetical examples that appear in the shareholder reports of the other funds.
Please note that the expenses shown in the table are meant to highlight your ongoing costs only and do not reflect any transactional costs, such as sales charges, redemption fees, or exchange fees. Therefore, the second line of the table is useful in comparing ongoing costs only, and will not help you determine the relative total costs of owning different funds. In addition, if these transactional costs were included, your costs would have been higher.
| Global Infrastructure Fund | ||||||||||||
| Share Class | Beginning Account Value 1/1/17 | Ending Account Value 6/30/17 | Expenses Paid for the 6 months ended 6/30/17** | |||||||||
| Class A | ||||||||||||
Actual | $ | 1,000.00 | $ | 1,080.10 | $ | 7.17 | ||||||
Hypothetical 5% return | 1,000.00 | 1,017.90 | + | 6.95 | ||||||||
| Class C | ||||||||||||
Actual | 1,000.00 | 1,076.40 | 11.02 | |||||||||
Hypothetical 5% return | 1,000.00 | 1,014.18 | + | 10.69 | ||||||||
| Institutional | ||||||||||||
Actual | 1,000.00 | 1,082.10 | 5.11 | |||||||||
Hypothetical 5% return | 1,000.00 | 1,019.89 | + | 4.96 | ||||||||
| Class IR | ||||||||||||
Actual | 1,000.00 | 1,081.30 | 5.88 | |||||||||
Hypothetical 5% return | 1,000.00 | 1,019.14 | + | 5.71 | ||||||||
| Class R | ||||||||||||
Actual | 1,000.00 | 1,078.80 | 8.45 | |||||||||
Hypothetical 5% return | 1,000.00 | 1,016.66 | + | 8.20 | ||||||||
| Class R6 | ||||||||||||
Actual | 1,000.00 | 1,082.20 | 5.01 | |||||||||
Hypothetical 5% return | 1,000.00 | 1,019.98 | + | 4.86 | ||||||||
| * | Expenses for each share class are calculated using the Fund’s annualized net expense ratio for each class, which represents the ongoing expenses as a percentage of net assets for the six months ended June 30, 2017. Expenses are calculated by multiplying the annualized net expense ratio by the average account value for the period; then multiplying the result by the number of days in the most recent fiscal half year; and then dividing that result by the number of days in the fiscal year. The annualized net expense ratios for the period were as follows: |
| Class A | Class C | Institutional | Class IR | Class R | Class R6 | |||||
1.39% | 2.14% | 0.99% | 1.14% | 1.64% | 0.97% |
| + | Hypothetical expenses are based on the Fund’s actual annualized net expense ratios and an assumed rate of return of 5% per year before expenses. |
24
GOLDMAN SACHS GLOBAL INFRASTRUCTURE FUND
Statement Regarding Basis for Approval of Management Agreement (Unaudited)
Background
The Goldman Sachs Global Infrastructure Fund (the “Fund”) is an investment portfolio of Goldman Sachs Trust (the “Trust”). The Board of Trustees oversees the management of the Trust and reviews the investment performance and expenses of the Fund at regularly scheduled meetings held throughout the year. In addition, the Board of Trustees determines annually whether to approve the continuance of the Trust’s investment management agreement (the “Management Agreement”) with Goldman Sachs Asset Management, L.P. (the “Investment Adviser”) on behalf of the Fund.
The Management Agreement was most recently approved for continuation until June 30, 2018 by the Board of Trustees, including those Trustees who are not parties to the Management Agreement or “interested persons” (as defined in the Investment Company Act of 1940, as amended) of any party thereto (the “Independent Trustees”), at a meeting held on June 14-15, 2017 (the “Annual Meeting”).
The review process undertaken by the Trustees spans the course of the year and culminates with the Annual Meeting. To assist the Trustees in their deliberations, the Trustees have established a Contract Review Committee (the “Committee”), comprised of the Independent Trustees. The Committee held four meetings over the course of the year since the Management Agreement was last approved. At those Committee meetings, regularly scheduled Board or other committee meetings, and/or the Annual Meeting, matters relevant to the renewal of the Management Agreement were considered by the Board, or the Independent Trustees, as applicable. With respect to the Fund, such matters included:
| (a) | the nature and quality of the advisory, administrative, and other services provided to the Fund by the Investment Adviser and its affiliates, including information about: |
| (i) | the structure, staff, and capabilities of the Investment Adviser and its portfolio management teams; |
| (ii) | the groups within the Investment Adviser and its affiliates that support the portfolio management teams or provide other types of necessary services, including fund services groups (e.g., accounting and financial reporting, tax, shareholder services, and operations); controls and risk management groups (e.g., legal, compliance, valuation oversight, credit risk management, internal audit, compliance testing, market risk analysis, finance, and central funding); sales and distribution support groups, and others (e.g., information technology and training); |
| (iii) | trends in employee headcount; |
| (iv) | the Investment Adviser’s financial resources and ability to hire and retain talented personnel and strengthen its operations; and |
| (v) | the parent company’s support of the Investment Adviser and its mutual fund business, as expressed by the firm’s senior management; |
| (b) | information on the investment performance of the Fund, including comparisons to the performance of similar mutual funds, as provided by a third-party mutual fund data provider engaged as part of the contract review process (the “Outside Data Provider”), and a benchmark performance index; and information on general investment outlooks in the markets in which the Fund invests; |
| (c) | information provided by the Investment Adviser indicating the Investment Adviser’s views on whether the Fund’s peer group and/or benchmark index had high, medium, or low relevance given the Fund’s particular investment strategy; |
| (d) | the terms of the Management Agreement and other agreements with affiliated service providers entered into by the Trust on behalf of the Fund; |
| (e) | fee and expense information for the Fund, including: |
| (i) | the relative management fee and expense levels of the Fund as compared to those of comparable funds managed by other advisers, as provided by the Outside Data Provider; and |
| (ii) | to the extent the Investment Adviser manages other types of accounts (such as bank collective trusts, private wealth management accounts, institutional separate accounts, sub-advised mutual funds, and non-U.S. funds) having investment objectives and policies similar to those of the Fund, comparative information on the advisory fees charged and services provided to those accounts by the Investment Adviser; |
| (f) | with respect to the investment performance and expense comparison data provided by the Outside Data Provider, its processes in producing that data for the Fund; |
| (g) | the undertakings of the Investment Adviser and its affiliates to implement fee waivers and/or expense limitations; |
| (h) | information relating to the profitability of the Management Agreement and the transfer agency and distribution and service arrangements of the Fund to the Investment Adviser and its affiliates; |
| (i) | whether the Fund’s existing management fee schedule adequately addressed any economies of scale; |
| (j) | a summary of the “fall-out” benefits derived by the Investment Adviser and its affiliates from their relationships with the Fund, including the fees received by the Investment Adviser’s affiliates from the Fund for transfer agency, portfolio trading, distribution and other services; |
25
GOLDMAN SACHS GLOBAL INFRASTRUCTURE FUND
Statement Regarding Basis for Approval of Management Agreement (Unaudited) (continued)
| (k) | a summary of potential benefits derived by the Fund as a result of its relationship with the Investment Adviser; |
| (l) | information regarding commissions paid by the Fund and broker oversight, an update on the Investment Adviser’s soft dollars practices, other information regarding portfolio trading, and how the Investment Adviser carries out its duty to seek best execution; |
| (m) | portfolio manager ownership of Fund shares; the manner in which portfolio manager compensation is determined; and the number and types of accounts managed by the portfolio managers; |
| (n) | the nature and quality of the services provided to the Fund by its unaffiliated service providers, and the Investment Adviser’s general oversight and evaluation (including reports on due diligence) of those service providers as part of the administrative services provided under the Management Agreement; and |
| (o) | the Investment Adviser’s processes and policies addressing various types of potential conflicts of interest; its approach to risk management; the annual review of the effectiveness of the Fund’s compliance program; and periodic compliance reports. |
The Trustees also received an overview of the Fund’s distribution arrangements. They received information regarding the Fund’s assets, share purchase and redemption activity, and payment of distribution and service fees. Information was also provided to the Trustees relating to revenue sharing payments made by and services provided by the Investment Adviser and its affiliates to intermediaries that promote the sale, distribution, and/or servicing of Fund shares. The Independent Trustees also discussed the broad range of other investment choices that are available to Fund investors, including the availability of comparable funds managed by other advisers.
The presentations made at the Board and Committee meetings and at the Annual Meeting encompassed the Fund and other mutual funds for which the Board of Trustees has responsibility. In evaluating the Management Agreement at the Annual Meeting, the Trustees relied upon their knowledge, resulting from their meetings and other interactions throughout the year, of the Investment Adviser and its affiliates, their services, and the Fund. In conjunction with these meetings, the Trustees received written materials and oral presentations on the topics covered, and the Investment Adviser addressed the questions and concerns of the Trustees, including concerns regarding the investment performance of certain of the funds they oversee. The Independent Trustees were advised by their independent legal counsel regarding their responsibilities and other regulatory requirements related to the approval and continuation of mutual fund investment management agreements under applicable law. In addition, the Investment Adviser and its affiliates provided the Independent Trustees with a written response to a formal request for information sent on behalf of the Independent Trustees by their independent legal counsel. During the course of their deliberations, the Independent Trustees met in executive sessions with their independent legal counsel, without representatives of the Investment Adviser or its affiliates present.
Nature, Extent, and Quality of the Services Provided Under the Management Agreement
As part of their review, the Trustees considered the nature, extent, and quality of the services provided to the Fund by the Investment Adviser. In this regard, the Trustees considered both the investment advisory services and non-advisory services that are provided by the Investment Adviser and its affiliates. The Trustees noted the transition in the leadership and changes in personnel of various of the Investment Adviser’s portfolio management teams that had occurred in recent periods, and the ongoing recruitment efforts aimed at bringing high quality investment talent to the Investment Adviser. They also noted the Investment Adviser’s commitment to maintaining high quality systems and expending substantial resources to respond to ongoing changes to the regulatory and control environment in which the Fund and its service providers operate, as well as the efforts of the Investment Adviser and its affiliates to combat cyber security risks. The Trustees concluded that the Investment Adviser continued to commit substantial financial and operational resources to the Fund and expressed confidence that the Investment Adviser would continue to do so in the future. The Trustees also recognized that the Investment Adviser had made significant commitments to address regulatory compliance requirements applicable to the Fund and the Investment Adviser and its affiliates.
Investment Performance
The Trustees noted that the Fund had launched on June 27, 2016 and did not yet have a meaningful performance history.
Costs of Services Provided and Competitive Information
The Trustees considered the contractual terms of the Management Agreement and the fee rates payable by the Fund thereunder. In this regard, the Trustees considered information on the services rendered by the Investment Adviser to the Fund, which included both advisory and administrative services that were directed to the needs and operations of the Fund as a registered mutual fund.
26
GOLDMAN SACHS GLOBAL INFRASTRUCTURE FUND
Statement Regarding Basis for Approval of Management Agreement (Unaudited) (continued)
In particular, the Trustees reviewed analyses prepared by the Outside Data Provider regarding the expense rankings of the Fund. The analyses provided a comparison of the Fund’s management fee and breakpoints to those of a relevant peer group and category universe; an expense analysis which compared the Fund’s overall net and gross expenses to a peer group and a category universe; and data comparing the Fund’s net expenses to the peer and category medians. The analyses also compared the Fund’s transfer agency, custody, and distribution fees, other expenses and fee waivers/reimbursements to those of the peer group and category medians. The Trustees concluded that the comparisons provided by the Outside Data Provider were useful in evaluating the reasonableness of the management fees and total expenses paid by the Fund.
In addition, the Trustees considered the Investment Adviser’s undertakings to implement fee waivers and/or expense limitations. They also considered, to the extent that the Investment Adviser manages other types of accounts having investment objectives and policies similar to those of the Fund, comparative fee information for services provided by the Investment Adviser to those accounts, and information that indicated that services provided to the Fund differed in various significant respects from the services provided to other types of accounts which, in many cases, operated under less stringent legal and regulatory structures, required fewer services from the Investment Adviser to a smaller number of client contact points, and were less time-intensive.
In addition, the Trustees noted that shareholders are able to redeem their Fund shares at any time if shareholders believe that the Fund fees and expenses are too high or if they are dissatisfied with the performance of the Fund.
Profitability
The Trustees reviewed the Fund’s contribution to the Investment Adviser’s revenues and pre-tax profit margins. In this regard the Trustees noted that they had received, among other things, profitability analyses and summaries, revenue and expense schedules by Fund and by function (i.e., investment management, transfer agency and distribution and service), and information on the Investment Adviser’s expense allocation methodology. They observed that the profitability and expense figures are substantially similar to those used by the Investment Adviser for many internal purposes, including compensation decisions among various business groups, and are thus subject to a vigorous internal debate about how certain revenue and expenses should be allocated. The Trustees also noted that the internal audit group within the Goldman Sachs organization had audited the expense allocation methodology and that the internal audit group was satisfied with the reasonableness, consistency, and accuracy of the Investment Adviser’s expense allocation methodology and profitability analysis calculations. Profitability data for the Fund were provided for 2016, and the Trustees considered this information in relation to the Investment Adviser’s overall profitability.
Economies of Scale
The Trustees considered the information that had been provided regarding the Investment Adviser’s profitability. The Trustees also considered the breakpoints in the fee rate payable under the Management Agreement for the Fund at the following annual percentage rates of the average daily net assets of the Fund:
First $1 billion | 0.90 | % | ||
Next $1 billion | 0.81 | |||
Next $3 billion | 0.77 | |||
Next $3 billion | 0.75 | |||
Over $8 billion | 0.74 |
The Trustees noted that the breakpoints were designed to share potential economies of scale, if any, with the Fund and its shareholders as assets under management reach those asset levels. The Trustees considered the amounts of assets in the Fund; the Fund’s recent share purchase and redemption activity; the information provided by the Investment Adviser relating to the costs of the services provided by the Investment Adviser and its affiliates and their realized profits; information comparing fee rates charged by the Investment Adviser with fee rates charged to other funds in the peer group; and the Investment Adviser’s undertaking to limit certain expenses of the Fund that exceed a specified level. Upon reviewing these matters at the Annual Meeting, the Trustees concluded that the fee breakpoints represented a means of assuring that benefits of scalability, if any, would be passed along to shareholders at the specified asset levels.
Other Benefits to the Investment Adviser and Its Affiliates
The Trustees also considered the other benefits derived by the Investment Adviser and its affiliates from their relationships with the Fund as stated above, including: (a) transfer agency fees received by Goldman Sachs & Co. LLC (“Goldman Sachs”); (b) brokerage and futures commissions earned by Goldman Sachs for executing securities and futures transactions on behalf of the Fund; (c) research received by the Investment Adviser from broker-dealers in exchange for executing certain transactions on behalf of the Fund; (d) trading efficiencies resulting from aggregation of orders of the Fund with those for other funds or accounts
27
GOLDMAN SACHS GLOBAL INFRASTRUCTURE FUND
Statement Regarding Basis for Approval of Management Agreement (Unaudited) (continued)
managed by the Investment Adviser; (e) the Investment Adviser’s ability to leverage the infrastructure designed to service the Fund on behalf of its other clients; (f) the Investment Adviser’s ability to cross-market other products and services to Fund shareholders; (g) Goldman Sachs’ retention of certain fees as Fund Distributor; (h) the Investment Adviser’s ability to negotiate better pricing with custodians on behalf of its other clients, as a result of the relationship with the Fund; and (i) the possibility that the working relationship between the Investment Adviser and the Fund’s third-party service providers may cause those service providers to be more likely to do business with other areas of Goldman Sachs. In the course of considering the foregoing, the Independent Trustees requested and received further information quantifying certain of these fall-out benefits.
Other Benefits to the Fund and Its Shareholders
The Trustees also noted that the Fund receives certain potential benefits as a result of its relationship with the Investment Adviser, including: (a) trading efficiencies resulting from aggregation of orders of the Fund with those of other funds or accounts managed by the Investment Adviser; (b) enhanced servicing from vendors because of the volume of business generated by the Investment Adviser and its affiliates; (c) enhanced servicing from broker-dealers because of the volume of business generated by the Investment Adviser and its affiliates; (d) the Investment Adviser’s ability to negotiate favorable terms with derivatives counterparties on behalf of the Fund as a result of the size and reputation of the Goldman Sachs organization; (e) the Investment Adviser’s knowledge and experience gained from managing other accounts and products; (f) the Investment Adviser’s ability to hire and retain qualified personnel to provide services to the Fund because of the reputation of the Goldman Sachs organization; (g) the Fund’s access, through the Investment Adviser, to certain firmwide resources (e.g., proprietary risk management systems and databases), subject to certain restrictions; and (h) the Fund’s access to certain affiliated distribution channels. In addition, the Trustees noted the competitive nature of the mutual fund marketplace, and considered that many of the Fund’s shareholders invested in the Fund in part because of the Fund’s relationship with the Investment Adviser and that those shareholders have a general expectation that the relationship will continue.
Conclusion
In connection with their consideration of the Management Agreement, the Trustees gave weight to each of the factors described above, but did not identify any particular factor as controlling their decision. After deliberation and consideration of all of the information provided, including the factors described above, the Trustees concluded, in the exercise of their business judgment, that the management fees paid by the Fund were reasonable in light of the services provided to it by the Investment Adviser, the Investment Adviser’s costs and the Fund’s current and reasonably foreseeable asset levels. The Trustees unanimously concluded that the Investment Adviser’s continued management likely would benefit the Fund and its shareholders and that the Management Agreement should be approved and continued with respect to the Fund until June 30, 2018.
28
FUNDS PROFILE
Goldman Sachs Funds
Goldman Sachs is a premier financial services firm, known since 1869 for creating thoughtful and customized investment solutions in complex global markets.
Today, the Investment Management Division of Goldman Sachs serves a diverse set of clients worldwide, including private institutions, public entities and individuals. With approximately $1.21 trillion in assets under supervision as of June 30, 2017, Goldman Sachs Asset Management (“GSAM”) has portfolio management teams located around the world and our investment professionals bring firsthand knowledge of local markets to every investment decision. Assets under supervision includes assets under management and other client assets for which Goldman Sachs does not have full discretion. GSAM leverages the resources of Goldman Sachs & Co. LLC subject to legal, internal and regulatory restrictions.
Money Market
| ∎ | Financial Square FundsSM |
| ∎ | Financial Square Treasury Solutions Fund1 |
| ∎ | Financial Square Government Fund1 |
| ∎ | Financial Square Money Market Fund2 |
| ∎ | Financial Square Prime Obligations Fund2 |
| ∎ | Financial Square Treasury Instruments Fund1 |
| ∎ | Financial Square Treasury Obligations Fund1 |
| ∎ | Financial Square Federal Instruments Fund1 |
| ∎ | Financial Square Tax-Exempt Money Market Fund2 |
Investor FundsSM
| ∎ | Investor Money Market Fund3 |
| ∎ | Investor Tax-Exempt Money Market Fund3 |
Fixed Income
Short Duration and Government
| ∎ | Enhanced Income Fund |
| ∎ | High Quality Floating Rate Fund |
| ∎ | Short-Term Conservative Income Fund |
| ∎ | Short Duration Government Fund |
| ∎ | Short Duration Income Fund |
| ∎ | Government Income Fund |
| ∎ | Inflation Protected Securities Fund |
Multi-Sector
| ∎ | Bond Fund |
| ∎ | Core Fixed Income Fund |
| ∎ | Global Income Fund |
| ∎ | Strategic Income Fund |
Municipal and Tax-Free
| ∎ | High Yield Municipal Fund |
| ∎ | Dynamic Municipal Income Fund |
| ∎ | Short Duration Tax-Free Fund |
Single Sector
| ∎ | Investment Grade Credit Fund |
| ∎ | U.S. Mortgages Fund |
| ∎ | High Yield Fund |
| ∎ | High Yield Floating Rate Fund |
| ∎ | Emerging Markets Debt Fund |
| ∎ | Local Emerging Markets Debt Fund |
| ∎ | Dynamic Emerging Markets Debt Fund |
Fixed Income Alternatives
| ∎ | Long Short Credit Strategies Fund |
| ∎ | Strategic Macro Fund4 |
Fundamental Equity
| ∎ | Equity Income Fund5 |
| ∎ | Small Cap Value Fund |
| ∎ | Small/Mid Cap Value Fund |
| ∎ | Mid Cap Value Fund |
| ∎ | Large Cap Value Fund |
| ∎ | Focused Value Fund |
| ∎ | Capital Growth Fund |
| ∎ | Strategic Growth Fund |
| ∎ | Small/Mid Cap Growth Fund |
| ∎ | Flexible Cap Fund6 |
| ∎ | Concentrated Growth Fund7 |
| ∎ | Technology Opportunities Fund |
| ∎ | Growth Opportunities Fund |
| ∎ | Rising Dividend Growth Fund |
| ∎ | Dynamic U.S. Equity Fund |
| ∎ | Income Builder Fund |
Tax-Advantaged Equity
| ∎ | U.S. Tax-Managed Equity Fund |
| ∎ | International Tax-Managed Equity Fund |
| ∎ | U.S. Equity Dividend and Premium Fund |
| ∎ | International Equity Dividend and Premium Fund |
Equity Insights
| ∎ | Small Cap Equity Insights Fund |
| ∎ | U.S. Equity Insights Fund |
| ∎ | Small Cap Growth Insights Fund |
| ∎ | Large Cap Growth Insights Fund |
| ∎ | Large Cap Value Insights Fund |
| ∎ | Small Cap Value Insights Fund |
| ∎ | International Small Cap Insights Fund |
| ∎ | International Equity Insights Fund |
| ∎ | Emerging Markets Equity Insights Fund |
Fundamental Equity International
| ∎ | Strategic International Equity Fund |
| ∎ | Focused International Equity Fund |
| ∎ | Asia Equity Fund |
| ∎ | Emerging Markets Equity Fund |
| ∎ | N-11 Equity Fund |
Select Satellite
| ∎ | Real Estate Securities Fund |
| ∎ | International Real Estate Securities Fund |
| ∎ | Commodity Strategy Fund |
| ∎ | Global Real Estate Securities Fund |
| ∎ | Dynamic Allocation Fund |
| ∎ | Absolute Return Tracker Fund |
| ∎ | Long Short Fund |
| ∎ | Managed Futures Strategy Fund |
| ∎ | MLP Energy Infrastructure Fund |
| ∎ | Multi-Manager Alternatives Fund |
| ∎ | Absolute Return Multi-Asset Fund |
| ∎ | Global Infrastructure Fund |
Total Portfolio Solutions
| ∎ | Global Managed Beta Fund |
| ∎ | Multi-Manager Non-Core Fixed Income Fund |
| ∎ | Multi-Manager U.S. Dynamic Equity Fund |
| ∎ | Multi-Manager Global Equity Fund |
| ∎ | Multi-Manager International Equity Fund |
| ∎ | Tactical Tilt Overlay Fund |
| ∎ | Balanced Strategy Portfolio |
| ∎ | Multi-Manager U.S. Small Cap Equity Fund |
| ∎ | Multi-Manager Real Assets Strategy Fund |
| ∎ | Growth and Income Strategy Portfolio |
| ∎ | Growth Strategy Portfolio |
| ∎ | Equity Growth Strategy Portfolio |
| ∎ | Satellite Strategies Portfolio |
| ∎ | Enhanced Dividend Global Equity Portfolio |
| ∎ | Tax-Advantaged Global Equity Portfolio |
| ∎ | Strategic Factor Allocation Fund |
| ∎ | Target Date 2020 Portfolio |
| ∎ | Target Date 2025 Portfolio |
| ∎ | Target Date 2030 Portfolio |
| ∎ | Target Date 2035 Portfolio |
| ∎ | Target Date 2040 Portfolio |
| ∎ | Target Date 2045 Portfolio |
| ∎ | Target Date 2050 Portfolio |
| ∎ | Target Date 2055 Portfolio |
| ∎ | GQG Partners International Opportunities Fund |
| 1 | You could lose money by investing in the Fund. Although the Fund seeks to preserve the value of your investment at $1.00 per share, it cannot guarantee it will do so. An investment in the Fund is not a deposit of a bank and is not insured or guaranteed by the Federal Deposit Insurance Corporation or any other government agency. The Fund’s sponsor has no legal obligation to provide financial support to the Fund, and you should not expect that the sponsor will provide financial support to the Fund at any time. |
| 2 | You could lose money by investing in the Fund. Because the share price of the Fund will fluctuate, when you sell your shares they may be worth more or less than what you originally paid for them. The Fund may impose a fee upon sale of your shares or may temporarily suspend your ability to sell shares if the Fund’s liquidity falls below required minimums because of market conditions or other factors. An investment in the Fund is not a deposit of a bank and is not insured or guaranteed by the Federal Deposit Insurance Corporation or any other government agency. The Fund’s sponsor has no legal obligation to provide financial support to the Fund, and you should not expect that the sponsor will provide financial support to the Fund at any time. |
| 3 | You could lose money by investing in the Fund. Although the Fund seeks to preserve the value of your investment at $1.00 per share, it cannot guarantee it will do so. The Fund may impose a fee upon sale of your shares or may temporarily suspend your ability to sell shares if the Fund’s liquidity falls below required minimums because of market conditions or other factors. An investment in the Fund is not a deposit of a bank and is not insured or guaranteed by the Federal Deposit Insurance Corporation or any other government agency. The Fund’s sponsor has no legal obligation to provide financial support to the Fund, and you should not expect that the sponsor will provide financial support to the Fund at any time. |
| 4 | Effective on June 20, 2017, the Goldman Sachs Fixed Income Macro Strategies Fund was renamed the Goldman Sachs Strategic Macro Fund. |
| 5 | Effective on June 20, 2017, the Goldman Sachs Growth and Income Fund was renamed the Goldman Sachs Equity Income Fund. |
| 6 | Effective on August 31, 2017, the Goldman Sachs Flexible Cap Growth Fund was renamed the Goldman Sachs Flexible Cap Fund. |
| 7 | Effective on July 28, 2017, the Goldman Sachs Focused Growth Fund was reorganized with and into the Goldman Sachs Concentrated Growth Fund. |
| Financial Square FundsSM and Investor FundsSM are registered service marks of Goldman Sachs & Co. LLC. |
| * | This list covers open-end funds only. Please visit our website at www.GSAMFUNDS.com to learn about our closed-end funds and exchange-traded funds. |
TRUSTEES Ashok N. Bakhru, Chairman Kathryn A. Cassidy Diana M. Daniels Herbert J. Markley James A. McNamara Jessica Palmer Roy W. Templin Gregory G. Weaver | OFFICERS James A. McNamara, President Scott M. McHugh, Principal Financial Officer, Senior Vice President and Treasurer Joseph F. DiMaria, Assistant Treasurer and Principal Accounting Officer Caroline L. Kraus, Secretary | |
GOLDMAN SACHS & CO. LLC Distributor and Transfer Agent | GOLDMAN SACHS ASSET MANAGEMENT, L.P. Investment Adviser | |
Visit our web site at www.GSAMFUNDS.com to obtain the most recent month-end returns.
Goldman Sachs Asset Management, L.P. 200 West Street, New York, New York 10282
The report concerning the Fund included in this shareholder report may contain certain forward-looking statements about the factors that may affect the performance of the Fund in the future. These statements are based on Fund management’s predictions and expectations concerning certain future events and their expected impact on the Fund, such as performance of the economy as a whole and of specific industry sectors, changes in the levels of interest rates, the impact of developing world events, and other factors that may influence the future performance of the Fund. Management believes these forward-looking statements to be reasonable, although they are inherently uncertain and difficult to predict. Actual events may cause adjustments in portfolio management strategies from those currently expected to be employed.
A description of the policies and procedures that the Fund uses to determine how to vote proxies relating to portfolio securities and information regarding how the Fund voted proxies relating to portfolio securities during the most recent 12-month period ended June 30 is available (i) without charge, upon request by calling 1-800-526-7384 (for Retail Shareholders) or 1-800-621-2550 (for Institutional Shareholders); and (ii) on the Securities and Exchange Commission (“SEC”) web site at http://www.sec.gov.
The Global Industry Classification Standard (GICS) was developed by and is the exclusive property and a service mark of Morgan Stanley Capital International Inc. (MSCI) and Standard & Poor’s, a division of The McGraw-Hill Companies, Inc. (S&P) and is licensed for use by Goldman Sachs. Neither MSCI, S&P nor any other party involved in making or compiling the GICS or any GICS classifications makes any express or implied warranties or representations with respect to such standard or classification (or the results to be obtained by the use thereof), and all such parties hereby expressly disclaim all warranties of originality, accuracy, completeness, merchantability or fitness for a particular purpose with respect to any of such standard or classification. Without limiting any of the foregoing, in no event shall MSCI, S&P, any of their affiliates or any third party involved in making or compiling the GICS or any GICS classifications have any liability for any direct, indirect, special, punitive, consequential or any other damages (including lost profits) even if notified of the possibility of such damages.
The Fund files its complete schedule of portfolio holdings with the SEC for the first and third quarters of each fiscal year on Form N-Qs. The Fund’s Form N-Qs are available on the SEC’s web site at http://www.sec.gov within 60 days after the Funds’ first and third fiscal quarters. The Fund’s Form N-Qs may be reviewed and copied at the SEC’s Public Reference Room in Washington, D.C. and information on the operation of the Public Reference Room may also be obtained by calling 1-800-SEC-0330. Form N-Qs may be obtained upon request and without charge by calling 1-800-526-7384 (for Retail Shareholders) or 1-800-621-2550 (for Institutional Shareholders).
Holdings and allocations shown are as of June 30, 2017 and may not be representative of future investments. Fund holdings should not be relied on in making investment decisions and should not be construed as research or investment advice regarding particular securities. Current and future holdings are subject to risk.
THIS MATERIAL IS FOR INFORMATIONAL PURPOSES ONLY AND IS PROVIDED SOLELY ON THE BASIS THAT IT WILL NOT CONSTITUTE INVESTMENT OR OTHER ADVICE OR A RECOMMENDATION RELATING TO ANY PERSON’S OR PLAN’S INVESTMENT OR OTHER DECISIONS, AND GOLDMAN SACHS IS NOT A FIDUCIARY OR ADVISOR WITH RESPECT TO ANY PERSON OR PLAN BY REASON OF PROVIDING THE MATERIAL OR CONTENT HEREIN INCLUDING UNDER THE EMPLOYEE RETIREMENT INCOME SECURITY ACT OF 1974 OR DEPARTMENT OF LABOR REGULATIONS. PLAN SPONSORS AND OTHER FIDUCIARIES SHOULD CONSIDER THEIR OWN CIRCUMSTANCES IN ASSESSING ANY POTENTIAL COURSE OF ACTION.
This material is not authorized for distribution to prospective investors unless preceded or accompanied by a current prospectus or summary prospectus, if applicable. Investors should consider the Fund’s objective, risks, and charges and expenses, and read the summary prospectus, if available, and/or the prospectus carefully before investing or sending money. The summary prospectus, if available, and the prospectus contain this and other information about the Fund and may be obtained from your authorized dealer or from Goldman Sachs & Co. LLC by calling (retail – 1-800-526-7384) (institutional – 1-800-621-2550).
© 2017 Goldman Sachs. All rights reserved. 100876-TMPL-08/2017-591292 GBLINFRASAR-17/172
Goldman Sachs Funds

| Semi-Annual Report | June 30, 2017 | |||
Long Short Fund | ||||

Goldman Sachs Long Short Fund
| 1 | ||||
| 2 | ||||
| 12 | ||||
| 16 | ||||
| 20 | ||||
| 22 | ||||
| 35 | ||||
| NOT FDIC-INSURED | May Lose Value | No Bank Guarantee | ||
GOLDMAN SACHS LONG SHORT FUND
What Differentiates Goldman Sachs’ Long Short Fund Investment Process?
The Goldman Sachs Long Short Fund seeks long-term growth of capital. We pursue potentially attractive risk-adjusted returns through stock selection, market insights, and risk management. Investment ideas are generated from the deep industry knowledge of the GS Investment Strategies (“GSIS”) team and the top-down views of the team’s leadership. Deep fundamental bottom-up research is at the core of every investment in the Fund. Our team-based and opportunistic approach seeks to drive allocations to attractive investment opportunities.

| ∎ | The Fund pursues high conviction investments in global equity markets, focusing on North America and Europe. Investment ideas are generated through fundamental, bottom-up research, and generally based on secular changes that will positively or negatively impact companies. |
| ∎ | We seek to identify idiosyncratic investments with asymmetric risk/return profiles and identifiable catalysts. |

| ∎ | The Fund actively hedges the portfolio’s long positions against security specific and sector risk. We also dynamically adjusts the Fund’s exposure to the broad equity markets, seeking to be less exposed to broader equity market moves. |

| ∎ | Our investment team has a long history extending back four decades and has managed a global long/short strategy since 2008. The team has a global footprint with offices in New York, London, Hong Kong, Tokyo and Bengalaru. |
GS Investment Strategies, LLC, the investment manager of the Fund, is a US-registered investment adviser and is a wholly-owned subsidiary of The Goldman Sachs Group, Inc.
1
PORTFOLIO RESULTS
Goldman Sachs Long Short Fund
Investment Objective And Principal Strategy
The Fund seeks long-term growth of capital.
Portfolio Management Discussion and Analysis
Below, the Goldman Sachs Investment Strategies (“GSIS”) Team (the “Team”) discusses the Goldman Sachs Long Short Fund’s (the “Fund”) performance and positioning for the six-month period ended June 30, 2017 (the “Reporting Period”).
| Q | How did the Fund perform during the Reporting Period? |
| A | During the Reporting Period, the Fund’s Class A, Class C, Institutional, Class IR and Class R Shares generated cumulative total returns of -0.81%, -1.18%, -0.69%, -0.70% and -0.94%, respectively. These returns compare to the 0.49% cumulative total return of the Fund’s primary benchmark, the Bank of America Merrill Lynch U.S. Dollar Three-Month LIBOR Constant Maturity Index (the “Index”) during the same time period. |
| References to the Fund’s benchmark and to other indices mentioned herein are for informational purposes only, and unless otherwise noted, are not an indication of how the Fund is managed. The use of the Index as the Fund’s benchmark does not imply the Fund is being managed like cash and does not imply low risk or low volatility. |
| Q | What economic and market factors most influenced the financial markets as a whole during the Reporting Period? |
| A | Overall, the global equity markets experienced continued momentum during the Reporting Period. The MSCI World Index® (with dividends reinvested), representing global equity markets, posted a return of 10.66%, and the S&P 500® Index (with dividends reinvested), representing U.S. equities, gained 9.34%. The rally in technology shares during the Reporting Period was particularly notable, with the NASDAQ Composite Index up 14.07%. Equity markets in the U.S. generally maintained their post-U.S. elections rally on hopes the new Administration would be successful in implementing regulatory reform, including an overhaul of the Affordable Care Act. U.S. unemployment showed traction, with more than one million non-farm jobs created in 2017 year-to-date through June 30, and the unemployment rate reaching near post-financial crisis lows of 4.4% as of June 2017. International equity markets also performed well. Japanese equity markets, as represented by the Nikkei 225 Index, were up 8.81%, while the yen strengthened during the Reporting Period. In Europe, the Euro Stoxx 50 gained 13.19% during the Reporting Period. Emerging equity markets were especially strong, as measured by the 18.43% return of the MSCI Emerging Markets Index for the Reporting Period. (All returns are in U.S. dollar terms.) At the same time, market volatility, as measured by the CBOE Volatility Index (VIX) reached near all-time lows. The decline in volatility provided some challenges for many long/short hedge funds seeking to generate alpha due to sector rotations, political surprises, shifts in investor sentiment and other factors. (Alpha is defined as a measure of performance on a risk-adjusted basis or the differential in the return from the Fund’s benchmark.) |
| Q | What key factors were responsible for the Fund’s performance during the Reporting Period? |
| A | In seeking to achieve its investment objective, the Fund primarily takes long and/or short positions in the global equity markets, with a focus on securities listed on North American and European exchanges. The Fund may also invest in global fixed income, commodity and currency instruments. The Team employs an opportunistic investment approach and pursues asymmetric risk-reward opportunities, which are those that the Team believes have a greater potential for gains than losses. While the Fund will not be limited to any predetermined investment strategies, the Fund will primarily employ long/short equity and event driven investment strategies. |
The Fund generated negative absolute returns for the Reporting Period overall. From a portfolio construction |
2
PORTFOLIO RESULTS
perspective, we were concerned during the Reporting Period about equity market valuations and macro risks we saw on the horizon, including potential political gridlock in Washington, D.C., the pace of U.S. interest rate hikes, the implementation of Brexit in the U.K. and economic growth in China. We have been managing the Fund’s market exposures given these concerns. However, reflecting on the Fund’s performance during the Reporting Period, managing the Fund’s portfolio with low net exposures and using options to hedge the Fund’s exposures has clearly been costly to its returns, as volatility virtually collapsed during the first half of 2017. (Net exposure is the percentage difference between a fund’s long and short exposure. Net exposure is a measure of the extent to which a fund’s trading book is exposed to market fluctuations.) |
| For the Reporting Period overall, long positions in equities contributed positively to Fund results, while short positions in equities detracted from Fund results. Several of the Fund’s positions had an event-driven component to them. During the Reporting Period, the Fund made no investments in fixed income and commodity instruments. The Fund used currency instruments to manage foreign currency risk. |
| Q | Which equity market sectors most significantly affected Fund performance? |
| A | Detracting most from the Fund’s performance were long positions in the financials, telecommunication services and industrials sectors. The sectors that contributed most positively to the Fund’s results during the Reporting Period were long positions in information technology, materials and health care. Security selection was the main driver of performance across the sector spectrum. |
| Q | Which stocks detracted significantly from the Fund’s performance during the Reporting Period? |
| A | Detracting from the Fund’s results were our strategies in European index and volatility positions and long positions in biotechnology company The Medicines Company and semiconductor company Qorvo. |
| The Fund’s European index and volatility strategies contained call option positions on European market indices, which we had initiated in the Fund during the fourth quarter of 2016. We held the view that implied volatility in European markets was generally inexpensive compared to the potential market movements that might arise following the Italian referendum vote in early December 2016. We felt the referendum was an overhang on the European equity markets and that most outcomes would not lead to a significant tail risk outcome that some had feared. (Tail risk is a form of portfolio risk that arises when the possibility that an investment will move more than three standard deviations from the mean is greater than what is shown by a normal distribution. Tail risks include events that have a small probability of occurring and occur at the ends of a normal distribution curve.) After the referendum, European equity markets rallied, and we used the opportunity to lock in profits on part of the Fund’s position in late December 2016, covering the initial cost of the investments. We continued to hold this strategy in January 2017, with the view that the European markets would continue to perform well. During January 2017, however, European indices realized quite low volatility and underperformed other regions. Indeed, the Euro Stoxx 50 declined 1.8% during the month. We thus crystallized a loss during the first quarter of 2017. We since exited the Fund’s position with the expiration of the options during the month of January, but the position proved to be a significant detractor for the Reporting Period overall. |
| We initiated a long position in The Medicines Company in early February 2017. This biotechnology company has three major pipeline products—cholesterol lowering Inclisiran, antibiotic Carbavance and sedative ABP 700. We believe Inclisiran and Carbavance have especially strong potential that the company could seek to monetize this calendar year through a partnership or sale of Inclisiran and a spin-off of Carbavance along with other antibiotic products. Since we initiated the Fund position, the company’s management publicly stated that it is evaluating all strategic options, including a complete sale of the company and is in conversations with multiple large pharmaceutical companies. However, during the Reporting Period, The Medicines Company saw its share price decline significantly on a lower market expectation that it could be sold in whole or in parts within the near term. At the end of the Reporting Period, we believed its depressed valuation should be temporary and that the company remains open to all strategic options. Indeed, we believe all the ingredients were present at the end of the Reporting Period for a favorable ultimate outcome: 1) a strong portfolio of assets; 2) multiple potentially interested parties; 3) what we consider to be a savvy management team; 4) significant stock ownership by activist investors; and 5) a supportive and experienced board, several members of which have extensive relationships and histories with large pharmaceutical companies. |
Qorvo, a long position newly established for the Fund during the second quarter of 2017, is a leading supplier of radio frequency (“RF”) front-end components primarily for |
3
PORTFOLIO RESULTS
smartphones as well as for defense, communications and infrastructure applications. (In a radio receiver circuit, the RF front end is a generic term for all the circuitry between the antenna up to and including the mixer stage. It consists of all the components in the receiver that process the signal at the original income RF before it is converted to a lower intermediate frequency.) We believe RF is potentially one of the most attractive industries within the semiconductor space today, given robust secular growth and a consolidated industry structure. To meet persistent demand for better cellular performance, the RF front end has become a focus area for investment, as the most significant performance advancements currently can only be solved with increasingly complex RF front ends. Against this favorable long-term outlook, we believe Qorvo has an opportunity to grow meaningfully. We believe a big part of this upside potential may be driven by, among other opportunities, content gains in the 2018 Apple iPhone related to its move to more complex antenna systems. In addition, we believe Qorvo is well positioned with Chinese smartphone original equipment manufacturers, as vendors accelerate their adoption of more complex RF. We further believe Qorvo could experience gross margin expansion as it continues to achieve manufacturing efficiencies. Finally, Qorvo’s infrastructure and defense products business, representing approximately 20% of its total revenue, is a leading global supplier of RF solutions. Its business benefits from double-digit revenue growth, high gross margins and low capital intensity. While Qorvo detracted from the Fund’s results during the Reporting Period, primarily due to timing of the Fund purchase, we remain positive about its prospects given what we view as strong secular trends and our differentiated views on its value and asymmetric risk/return profile. |
| Q | What were some of the Fund’s best-performing individual stocks? |
| A | The Fund benefited most from long positions in Switzerland-based pharmaceutical company Actelion and U.S. semiconductor company Broadcom. |
| During the Reporting Period, Actelion’s shares rose significantly on the announcement and then completion of its being acquired by Johnson & Johnson. On January 26, 2017, Johnson & Johnson announced the acquisition of Actelion for $280 per share, a 23% premium to the closing price the day prior and a 77% premium to the unaffected share price on November 24, 2016. Actelion was the market leader for pulmonary arterial hypertension, a rare, chronic disease characterized by abnormally high blood pressure in the arteries connecting the heart to the lungs. We had started researching Actelion in late 2016 as a merger arbitrage position. We acquired the Fund’s initial position in November 2016 and had an opportunity to increase the Fund’s investment in early 2017. |
| Broadcom’s shares rose significantly during the Reporting Period. The market showed increased enthusiasm for Broadcom during the Reporting Period given its high quality, diversified core franchises, a path for steady cash returns (i.e. a 1.7% dividend yield), and a valuation discount to semiconductor peers on a price/earnings basis. We believe these characteristics helped drive interest from long-term and/or yield-seeking investors and away from their trading-oriented/event driven counterparts. This rotation of investor base likely drove lower trading volatility in Broadcom’s stock, in our view. |
| Q | How did the Fund use derivatives and similar instruments during the Reporting Period? |
| A | During the Reporting Period, the Fund used total return swaps, currency forwards and equivalents, futures and forward contracts and options. Total return swaps were used to gain exposure in a tax-efficient manner to specific securities or a broad market that may be difficult to access. Currency forwards and equivalents were used to gain exposure to specific currencies or to hedge against currency risk. Futures and forward contracts were used primarily for hedging purposes or to gain exposure to specific securities, indices, sectors and geographies. Options were used primarily for hedging purposes either at a strategy level or portfolio level and to gain exposure to specific securities and indices synthetically. The use of total return swaps, listed equity options, currency forwards and equivalents and futures detracted from performance during the Reporting Period. |
| Q | Did the Fund make any significant purchases or sales during the Reporting Period? |
| A | In addition to those purchases already mentioned, we initiated a position in Adobe Systems, a leading digital content and digital market software provider. It is known for its flagship brands, including Photoshop, Acrobat, Flash and Dreamweaver. In our view, the company benefits from a strong competitive moat in its core creative cloud business and has been leveraging it to grow market share in digital marketing. While historically Adobe Systems operated as a premium solution provider to the enterprise market, its transition to a subscription model has helped the company significantly expand its total addressable market. We like the company for several reasons. First, in our view, Adobe |
4
PORTFOLIO RESULTS
Systems has become the de facto standard for creative design in the enterprise market and is poised to grow market share in the small and medium-sized business market and the consumer segment. Second, the company has the potential to increase pricing and focus on cross-selling and upselling opportunities. Third, we believe the digital marketing cloud is an underappreciated asset with strong tailwind potential from industry growth. Fourth, Adobe Systems has room for margin expansion. And finally, we view Adobe Systems as being central to a low turnover business with high barriers to switching and high recurring revenues. |
| Conversely, two of the Fund’s larger special situations positions—Actelion, mentioned earlier, and Syngenta, were eliminated from its portfolio during the Reporting Period due to acquisitions. As indicated, Actelion was acquired by Johnson & Johnson in June 2017, and Syngenta was acquired by ChemChina in May 2017. Both of these positions contributed positively to the Fund’s results during the Reporting Period. Also, during the Reporting Period, we exited a special situations position in Rite Aid. In June 2017, Walgreens called off its long-planned merger with Rite Aid after the deal came under scrutiny by antitrust authorities. It was announced instead that Walgreens would acquire more than 2,100 stores from Rite Aid for $5.2 billion. We decided to exit the Fund’s position leading up to this announcement. Rite Aid detracted from the Fund’s results during the Reporting Period. |
| Q | Were there any notable changes in the Fund’s allocations during the Reporting Period? |
| A | Due both to active management decisions and stock appreciation or depreciation, the Fund’s long exposure to the healthcare and information technology sectors increased and its exposure to the consumer discretionary, materials, real estate and telecommunication services sectors decreased during the Reporting Period. The Fund’s regional exposures are driven by stock selection rather than by any top-down analysis of macro market conditions. |
| Q | How was the Fund positioned at the end of the Reporting Period? |
| A | At the end of June 2017, the Fund had its greatest exposure, based on long market value, to the investment companies, information technology, health care and materials sectors. (Long market value is the current market value of stocks held (i.e. having a long position) in an account, calculated on a daily basis.) The Fund had its lowest exposure, based on long market value, to the energy, consumer discretionary and financial sectors and had no exposure at all on June 30, 2017 to the industrials, real estate and telecommunication services sectors. |
| By region, the Fund had its greatest exposure, based on long market value, to the Americas, followed at some distance by the EMEA region and Asia as of June 30, 2017. |
| Q | What is the Fund’s tactical view and strategy for the months ahead? |
| A | Since the time of the 2009 global financial crisis and the subsequent accommodative stance taken by central banks globally, the global equity markets have, overall, demonstrated robust growth, reaching new highs for many equity market indices. Companies have benefited from an era of low interest rates, which has also supported equity market valuations. At the end of the Reporting Period, we were generally cautious that the period of prolonged low interest rates is nearing an end, which, in our view, will have implications on equity market valuations. We were also focused at the end of the Reporting Period on other potential risks on the horizon, including gridlock in Washington D.C., slowing of the Chinese economy and political events in Europe. We believe equity markets were generally fully valued and expensive in their historical context at the end of June 2017, which may limit their upside potential. |
| Given this view, we are broadly focusing our energies on areas where we believe we have the greatest opportunity to create alpha, or added value, such as special situations opportunities and positions that require a deep level of fundamental research. On the short side, we are seeking to increase the number of single-stock short positions in the Fund’s portfolio and believe the era of low interest rates had led to mal-investment across various sectors and industries. As such, we are particularly exploring short opportunities within the real estate sector, including lodging and office properties. Further, we intend to manage the Fund’s portfolio with low net exposure to limit the directional exposure to the equity markets. (Directional exposure can mean a basic strategy of going long if the market or security is perceived as heading higher, or taking short positions if the direction is downward.) Our use of options to hedge risks during the Reporting Period was costly, as it was one of the lowest volatility quarters in history. Given that we are uncertain of when this low volatility environment could change, we have reduced our use of options within the Fund and have been managing its net exposure. |
5
PORTFOLIO RESULTS
| While the performance of the Fund during the Reporting Period was certainly disappointing, it is important to highlight that our investment philosophy is centered on building and preserving capital over the long term. In the long history of managing our equity long/short strategy, our team has navigated through similarly challenging periods, and we subsequently recovered from these drawdowns within a reasonable time span. |
6
PORTFOLIO RESULTS
Index Definitions
The MSCI® World Index is a free float-adjusted market capitalization weighted index that is designed to measure the equity market performance of developed markets. The MSCI World Index consists of the following 23 developed market country indexes: Australia, Austria, Belgium, Canada, Denmark, Finland, France, Germany, Hong Kong, Ireland, Israel, Italy, Japan, Netherlands, New Zealand, Norway, Portugal, Singapore, Spain, Sweden, Switzerland, the United Kingdom, and the United States. It is not possible to invest in an unmanaged index.
The S&P 500® Index is the Standard & Poor’s 500 Composite Index of 500 stocks, an unmanaged index of common stock prices. It is not possible to invest in an unmanaged index.
The MSCI Emerging Markets Index is a free float-adjusted market capitalization index that is designed to measure equity market performance of emerging markets. As of June 30, 2015, the MSCI Emerging Markets Index consisted of the following 23 emerging market country indices: Brazil, Chile, China, Colombia, Czech Republic, Egypt, Greece, Hungary, India, Indonesia, Korea, Malaysia, Mexico, Peru, Philippines, Poland, Qatar, Russia, South Africa, Taiwan, Thailand, Turkey and United Arab Emirates. It is not possible to invest in an unmanaged index.
The EURO STOXX 50® provides a blue-chip representation of super-sector leaders in the Eurozone. The index covers 50 stocks from 12 Eurozone countries: Austria, Belgium, Finland, France, Germany, Greece, Ireland, Italy, Luxembourg, the Netherlands, Portugal and Spain. It is not possible to invest in an unmanaged index.
The Nikkei 225® Index is a price-weighted equity index, which consists of 225 stocks in the 1st section of the Tokyo Stock Exchange. It is not possible to invest in an unmanaged index.
The Nasdaq Composite Index is the market capitalization-weighted index of approximately 3,000 common equities listed on the Nasdaq stock exchange. It is not possible to invest in an unmanaged index.
The CBOE Volatility Index® (VIX® Index) is a leading measure of market expectations of near-term volatility conveyed by S&P® 500 Index (SPX) option prices. It is not possible to invest in an unmanaged index.
7
FUND BASICS
Goldman Sachs Long Short Fund
as of June 30, 2017
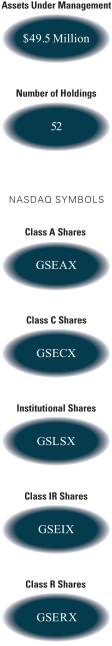
| PERFORMANCE REVIEW | ||||||||||
| January 1, 2017–June 30, 2017 | Fund Total Return (based on NAV)1 | Bank of America Merrill Lynch U.S. Dollar Three- Month LIBOR Constant Maturity Index2 | ||||||||
| Class A | -0.81 | % | 0.49 | % | ||||||
| Class C | -1.18 | 0.49 | ||||||||
| Institutional | -0.69 | 0.49 | ||||||||
| Class IR | -0.70 | 0.49 | ||||||||
| Class R | -0.94 | 0.49 | ||||||||
| 1 | The net asset value (“NAV”) represents the net assets of the class of the Fund (ex-dividend) divided by the total number of shares of the class outstanding. The Fund’s performance assumes the reinvestment of dividends and other distributions. The Fund’s performance does not reflect the deduction of any applicable sales charges. |
| 2 | The Bank of America Merrill Lynch U.S. Dollar Three-Month LIBOR Constant Maturity Index (the “Index”) tracks the performance of a synthetic asset paying LIBOR to a stated maturity. The Index is based on the assumed purchase at par of a synthetic instrument having exactly its stated maturity and with a coupon equal to that day’s fixing rate. That issue is assumed to be sold the following business day (priced at a yield equal to the current day fixing rate) and rolled into a new instrument. The Index figure does not reflect any deductions for fees, expenses, or taxes. It is not possible to invest in an index. |
| STANDARDIZED TOTAL RETURNS3 | ||||||||||||||
| For the period ended 6/30/17 | One Year | Since Inception | Inception Date | |||||||||||
| Class A | -4.16 | % | -7.48 | % | 9/30/2014 | |||||||||
| Class C | -0.40 | -6.28 | 9/30/2014 | |||||||||||
| Institutional | 1.66 | -5.22 | 9/30/2014 | |||||||||||
| Class IR | 1.54 | -5.35 | 9/30/2014 | |||||||||||
| Class R | 1.08 | -5.83 | 9/30/2014 | |||||||||||
| 3 | The Standardized Total Returns are average annual total returns or cumulative total returns (only if the performance period is one year or less) as of the most recent calendar quarter-end. They assume reinvestment of all distributions at net asset value. They assume reinvestment of all distributions at net asset value. These returns reflect a maximum initial sales charge of 5.50% for Class A Shares and the contingent deferred sales charge for Class C Shares (1.00% if shares are redeemed within 12 months of purchase). Because Institutional, Class IR and Class R Shares do not involve a sales charge, such a charge is not applied to their Standardized Total Returns. |
The returns set forth in the tables above represent past performance. Past performance does not guarantee future results. The Fund’s investment return and principal value will fluctuate so that an investor’s shares, when redeemed, may be worth more or less than their original cost. Current performance may be lower or higher than the performance quoted above. Please visit our web site at www.GSAMFUNDS.com to obtain the most recent month-end returns. Performance reflects applicable fee waivers and/or expense limitations in effect during the periods shown. In their absence, performance would be reduced. Returns do not reflect the deduction of taxes that a shareholder would pay on Fund distributions or the redemption of Fund shares.
8
FUND BASICS
| EXPENSE RATIOS4 | ||||||||||
| Net Expense Ratios (current) | Gross Expense Ratios (before waiver) | |||||||||
| Class A | 3.33 | % | 3.98 | % | ||||||
| Class C | 4.08 | 4.73 | ||||||||
| Institutional | 2.93 | 3.58 | ||||||||
| Class IR | 3.08 | 3.73 | ||||||||
| Class R | 3.58 | 4.23 | ||||||||
| 4 | The expense ratios of the Fund, both current (net of applicable fee waivers and/or expense limitations) and before waivers (gross of applicable fee waivers and/or expense limitations) are as set forth above according to the most recent publicly available Prospectus for the Fund and may differ from the expense ratios disclosed in the Financial Highlights in this report. Pursuant to a contractual arrangement, the Fund’s waivers and/or expense limitations will remain in place through at least April 28, 2018, and prior to such date the Investment Adviser may not terminate the arrangements without the approval of the Fund’s Board of Trustees. If these arrangements are discontinued in the future, the expense ratios may change without shareholder approval. |
| TOP TEN HOLDINGS AS OF 6/30/175 | ||||||||
| Holding | % of Net Assets | Line of Business | ||||||
| Broadcom Ltd. | 11.2 | % | Semiconductors & Semiconductor Equipment | |||||
| Qorvo, Inc. | 5.6 | Semiconductors & Semiconductor Equipment | ||||||
| Apple, Inc. | 5.3 | Technology Hardware, Storage & Peripherals | ||||||
| Dentsply Sirona, Inc. | 5.1 | Health Care Equipment & Supplies | ||||||
| Alere, Inc. | 5.1 | Health Care Equipment & Supplies | ||||||
| Reynolds American, Inc. | 4.7 | Tobacco | ||||||
| The Medicines Co. | 4.4 | Pharmaceuticals | ||||||
| PTC, Inc. | 3.8 | Software | ||||||
| Monsanto Co. | 3.1 | Chemicals | ||||||
| Quintiles IMS Holdings, Inc. | 2.8 | Life Sciences Tools & Services | ||||||
| 5 | The top 10 holdings do not include the Fund’s short positions, if any, as listed in the Schedule of Investments and certain derivatives, if any, as listed in the Additional Investment Information section of the Schedule of Investments and may not be representative of the Fund’s future Investments. |
9
FUND BASICS
| FUND COMPOSITION – LONG EXPOSURE6 |
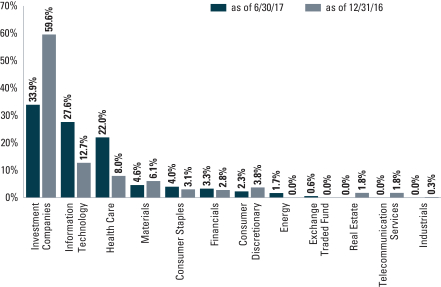
| 6 | The Fund is actively managed and, as such, its composition may differ over time. Consequently, the Fund’s overall sector allocations may differ from the percentages contained in the graph above. The graph categorizes investments using the Global Industry Classification Standard (“GICS”), however, the sector classifications used by the portfolio management team may differ from GICS. The percentage shown for each investment category reflects the value of investments in that category as a percentage of the total value of the Fund’s Long Equity Investments. Underlying sector allocations of Exchange Traded Funds and Investment Companies held by the Fund are not reflected in the graph above. The graph depicts the Fund’s long investments but may not represent the Fund’s market exposure due to the exclusion of the Fund’s short positions, if any, as listed in the Schedule of Investments and certain derivatives, if any, as listed in the Additional Investment Information section of the Schedule of Investments. |
10
FUND BASICS
| FUND COMPOSITION – SHORT EXPOSURE7 |
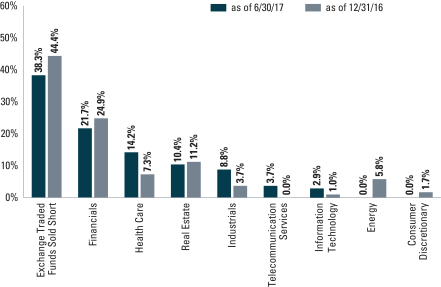
| 7 | The Fund is actively managed and, as such, its composition may differ over time. Consequently, the Fund’s overall sector allocations may differ from the percentages contained in the graph above. The graph categorizes investments using the Global Industry Classification Standard (“GICS”), however, the sector classifications used by the portfolio management team may differ from GICS. The percentage shown for each investment category reflects the value of investments in that category as a percentage of the total value of the Fund’s Short Equity Investments. |
11
GOLDMAN SACHS LONG SHORT FUND
June 30, 2017 (Unaudited)
| Shares | Description | Value | ||||||
| Common Stocks – 78.3% | ||||||||
| Banks – 1.7% | ||||||||
| 62,560 | CaixaBank SA | $ | 299,060 | |||||
| 29,723 | UniCredit SpA* | 556,749 | ||||||
|
| |||||||
| 855,809 | ||||||||
|
| |||||||
| Biotechnology*(a) – 2.3% | ||||||||
| 18,963 | Spark Therapeutics, Inc. | 1,132,850 | ||||||
|
| |||||||
| Chemicals(a) – 3.1% | ||||||||
| 13,022 | Monsanto Co. | 1,541,284 | ||||||
|
| |||||||
| Containers & Packaging*(a) – 2.5% | ||||||||
| 21,270 | Berry Global Group, Inc. | 1,212,603 | ||||||
|
| |||||||
| Health Care Equipment & Supplies(a) – 10.2% | ||||||||
| 50,169 | Alere, Inc.* | 2,517,982 | ||||||
| 39,152 | Dentsply Sirona, Inc. | 2,538,616 | ||||||
|
| |||||||
| 5,056,598 | ||||||||
|
| |||||||
| Health Care Providers & Services – 2.4% | ||||||||
| 12,950 | DaVita, Inc.* | 838,642 | ||||||
| 1,473 | Humana, Inc. | 354,433 | ||||||
|
| |||||||
| 1,193,075 | ||||||||
|
| |||||||
| Insurance – 2.3% | ||||||||
| 31,375 | NN Group NV | 1,113,280 | ||||||
|
| |||||||
| Internet & Direct Marketing Retail* – 0.8% | ||||||||
| 402 | Amazon.com, Inc. | 389,136 | ||||||
|
| |||||||
| Internet Software & Services* – 2.2% | ||||||||
| 2,148 | Alibaba Group Holding Ltd. ADR | 302,653 | ||||||
| 265 | Alphabet, Inc. Class A | 246,365 | ||||||
| 238 | Alphabet, Inc. Class C | 216,278 | ||||||
| 1,949 | Facebook, Inc. Class A | 294,260 | ||||||
|
| |||||||
| 1,059,556 | ||||||||
|
| |||||||
| Life Sciences Tools & Services* – 4.8% | ||||||||
| 11,598 | PAREXEL International Corp. | 1,007,982 | ||||||
| 15,216 | Quintiles IMS Holdings, Inc.(a) | 1,361,832 | ||||||
|
| |||||||
| 2,369,814 | ||||||||
|
| |||||||
| Media – 1.9% | ||||||||
| 9,472 | Time Warner, Inc. | 951,083 | ||||||
|
| |||||||
| Oil, Gas & Consumable Fuels – 2.0% | ||||||||
| 32,340 | The Williams Cos., Inc. | 979,255 | ||||||
|
| |||||||
| Pharmaceuticals* – 6.5% | ||||||||
| 30,554 | Akorn, Inc. | 1,024,781 | ||||||
| 58,003 | The Medicines Co.(a) | 2,204,694 | ||||||
|
| |||||||
| 3,229,475 | ||||||||
|
| |||||||
| Semiconductors & Semiconductor Equipment – 16.8% | ||||||||
| 23,827 | Broadcom Ltd.(a) | 5,552,882 | ||||||
| 43,656 | Qorvo, Inc.* | 2,764,298 | ||||||
|
| |||||||
| 8,317,180 | ||||||||
|
| |||||||
| Common Stocks – (continued) | ||||||||
| Software – 8.8% | ||||||||
| 9,395 | Adobe Systems, Inc.*(a) | 1,328,829 | ||||||
| 14,016 | Microsoft Corp. | 966,123 | ||||||
| 34,400 | PTC, Inc.*(a) | 1,896,128 | ||||||
| 9,536 | Snap, Inc. Class A* | 169,454 | ||||||
|
| |||||||
| 4,360,534 | ||||||||
|
| |||||||
| Technology Hardware, Storage & Peripherals(a) – 5.3% | ||||||||
| 18,108 | Apple, Inc. | 2,607,914 | ||||||
|
| |||||||
| Tobacco(a) – 4.7% | ||||||||
| 36,015 | Reynolds American, Inc. | 2,342,416 | ||||||
|
| |||||||
| TOTAL COMMON STOCKS | ||||||||
| (Cost $34,724,581) | $ | 38,711,862 | ||||||
|
| |||||||
| Exchange Traded Fund – 0.8% | ||||||||
| 2,693 | PowerShares QQQ Trust Series 1 | $ | 370,665 | |||||
| (Cost $369,614) | ||||||||
|
| |||||||
| Shares | Distribution Rate | Value | ||||||
| Investment Company(b)(c) – 40.4% | ||||||||
Goldman Sachs Financial Square Government Fund – Institutional Shares |
| |||||||
| 20,012,416 | 0.845 | % | $ | 20,012,416 | ||||
| (Cost $20,012,416) | ||||||||
| ||||||||
| Contracts | Exercise Price | Expiration Date | Value |
| Option Contracts Purchased – 3.1% | ||||||||||||||
| Options on Equities – 3.1% | ||||||||||||||
| | Bank of America Securities LLC Put – VanEck Vectors | | ||||||||||||
| 539 | $ | 67.50 | 01/19/18 | $ | 102,980 | |||||||||
Bank of America Securities LLC Put – Qorvo, Inc. | ||||||||||||||
| 61 | 100.00 | 01/18/19 | 232,884 | |||||||||||
Citibank NA (London) Call – Bank of America Corp. | ||||||||||||||
| 1,304 | 24.00 | 09/15/17 | 154,524 | |||||||||||
Citibank NA (London) Call – SPDR S&P Regional Banking ETF | ||||||||||||||
| 395 | 53.00 | 09/15/17 | 135,287 | |||||||||||
Citibank NA (London) Put – Powershares QQQ Trust Series 1 | ||||||||||||||
| 54 | 140.00 | 07/21/17 | 17,901 | |||||||||||
Citibank NA (London) Put – S&P 500 Index | ||||||||||||||
| 20 | 2,210.00 | 07/21/17 | 2,000 | |||||||||||
Deutsche Bank AG Call – ESTX Bank | ||||||||||||||
| 1,153 | 135.00 | 09/15/17 | 223,873 | |||||||||||
Deutsche Bank AG Put – Technology Select Sector SPDR | ||||||||||||||
| 288 | 55.00 | 12/15/17 | 72,288 | |||||||||||
Merrill Lynch International PLC Call – ESTX Bank | ||||||||||||||
| 134 | 115.00 | 09/15/17 | 128,560 | |||||||||||
|
| |||||||||||||
| 12 | The accompanying notes are an integral part of these financial statements. |
GOLDMAN SACHS LONG SHORT FUND
| Contracts | Exercise Price | Expiration Date | Value |
| Option Contracts Purchased – (continued) | ||||||||||||||
| Options on Equities – (continued) | ||||||||||||||
Merrill Lynch International PLC Call – ESTX Bank | ||||||||||||||
| 134 | $ | 130.00 | 09/15/17 | $ | 44,001 | |||||||||
Merrill Lynch International PLC Call – Humana, Inc. | ||||||||||||||
| 28 | 250.00 | 08/18/17 | 12,180 | |||||||||||
Merrill Lynch International PLC Call – Humana, Inc. | ||||||||||||||
| 47 | 250.00 | 11/17/17 | 41,830 | |||||||||||
| | Merrill Lynch International PLC Call – Ishares Nasdaq | | ||||||||||||
| 33 | 320.00 | 08/18/17 | 18,315 | |||||||||||
Merrill Lynch International PLC Call – Ishares Russell 2000 ETF | ||||||||||||||
| 49 | 140.00 | 07/21/17 | 9,555 | |||||||||||
| | Merrill Lynch International PLC Put – Technology Select Sector | | ||||||||||||
| 365 | 56.00 | 07/21/17 | 54,567 | |||||||||||
Morgan Stanley & Co. International PLC Call – Microsoft Corp. | ||||||||||||||
| 683 | 80.00 | 01/18/19 | 219,495 | |||||||||||
Morgan Stanley & Co. International PLC Put – Microsoft Corp. | ||||||||||||||
| 113 | 55.00 | 01/19/18 | 9,605 | |||||||||||
UBS AG (London) Put – Powershares QQQ Trust Series 1 | ||||||||||||||
| 47 | 138.00 | 07/21/17 | 10,693 | |||||||||||
UBS AG (London) Call – Wells Fargo & Co. | ||||||||||||||
| 263 | 55.00 | 10/20/17 | 66,276 | |||||||||||
|
| |||||||||||||
| TOTAL OPTION CONTRACTS PURCHASED – 3.1% | ||||||||||||||
| (Cost $1,663,311) | $ | 1,556,814 | ||||||||||||
|
| |||||||||||||
| | TOTAL INVESTMENTS BEFORE SECURITIES SOLD SHORT – 122.6% | |||||||||||||
| (Cost $56,769,922) | $ | 60,651,757 | ||||||||||||
|
| |||||||||||||
| Shares | Description | Value | ||||||
| Common Stocks Sold Short – (16.8)% | ||||||||
| Banks – (1.1)% | ||||||||
| 4,652 | Bank of America Corp. | $ | (112,858 | ) | ||||
| 21,111 | People’s United Financial, Inc. | (372,820 | ) | |||||
| 525 | Wells Fargo & Co. | (29,090 | ) | |||||
|
| |||||||
| (514,768 | ) | |||||||
|
| |||||||
| Capital Markets – (2.0)% | ||||||||
| 17,186 | Deutsche Bank AG | (305,563 | ) | |||||
| 4,222 | T. Rowe Price Group, Inc. | (313,315 | ) | |||||
| 8,010 | The Charles Schwab Corp. | (344,110 | ) | |||||
|
| |||||||
| (962,988 | ) | |||||||
|
| |||||||
| Diversified Telecommunication Services – (1.0)% | ||||||||
| 13,071 | AT&T, Inc. | (493,169 | ) | |||||
|
| |||||||
| Equity Real Estate Investment Trusts (REITs) – (2.8)% | ||||||||
| 868 | AvalonBay Communities, Inc. | (166,804 | ) | |||||
| 1,833 | Equity Residential | (120,666 | ) | |||||
| 40,365 | Host Hotels & Resorts, Inc. | (737,469 | ) | |||||
| 3,175 | Realty Income Corp. | (175,196 | ) | |||||
| 1,932 | SL Green Realty Corp. | (204,406 | ) | |||||
|
| |||||||
| (1,404,541 | ) | |||||||
|
| |||||||
| Common Stocks Sold Short – (continued) | ||||||||
| Health Care Providers & Services – (3.6)% | ||||||||
| 11,016 | MEDNAX, Inc.* | (665,036 | ) | |||||
| 17,800 | Patterson Cos., Inc. | (835,710 | ) | |||||
| 1,546 | UnitedHealth Group, Inc. | (286,659 | ) | |||||
|
| |||||||
| (1,787,405 | ) | |||||||
|
| |||||||
| Insurance – (2.9)% | ||||||||
| 19,208 | Assicurazioni Generali SpA | (317,051 | ) | |||||
| 5,018 | Cincinnati Financial Corp. | (363,554 | ) | |||||
| 6,876 | Great-West Lifeco, Inc. | (186,375 | ) | |||||
| 4,361 | W.R. Berkley Corp. | (301,650 | ) | |||||
| 953 | Zurich Insurance Group AG | (278,132 | ) | |||||
|
| |||||||
| (1,446,762 | ) | |||||||
|
| |||||||
| IT Services – (0.8)% | ||||||||
| 4,239 | Global Payments, Inc. | (382,866 | ) | |||||
|
| |||||||
| Life Sciences Tools & Services* – (0.2)% | ||||||||
| 1,212 | ICON PLC | (118,521 | ) | |||||
|
| |||||||
| Marine* – (2.4)% | ||||||||
| 17,794 | Kirby Corp. | (1,189,529 | ) | |||||
|
| |||||||
| TOTAL COMMON STOCKS SOLD SHORT | ||||||||
| (Cost $(8,063,995)) | $ | (8,300,549 | ) | |||||
|
| |||||||
| Exchange Traded Funds Sold Short – (10.4)% | ||||||||
| 1,743 | Health Care Select Sector SPDR Fund | $ | (138,115 | ) | ||||
| 8,558 | iShares Nasdaq Biotechnology ETF | (2,653,665 | ) | |||||
| 8,014 | iShares Russell 2000 ETF | (1,129,333 | ) | |||||
| 7,367 | Technology Select Sector SPDR Fund | (403,122 | ) | |||||
| 10,193 | VanEck Vectors Semiconductor ETF | (834,399 | ) | |||||
|
| |||||||
| | TOTAL EXCHANGE TRADED FUNDS SOLD SHORT | |||||||
| (Cost $(5,043,896)) | $ | (5,158,634 | ) | |||||
|
| |||||||
| TOTAL SECURITIES SOLD SHORT – (27.2%) | ||||||||
| (Cost $(13,107,891)) | $ | (13,459,183 | ) | |||||
|
| |||||||
| | OTHER ASSETS IN EXCESS OF | 2,288,672 | ||||||
|
| |||||||
| NET ASSETS – 100.0% | $ | 49,481,246 | ||||||
|
| |||||||
| The percentage shown for each investment category reflects the value of investments in that category as a percentage of net assets. | ||
* | Non-income producing security. | |
(a) | All or portion of security is pledged as collateral for short sales. Total market value of securities pledged as collateral on short sales amounts to $26,238,030, which represents approximately 53.0% of net assets as of June 30, 2017. | |
(b) | Represents an Affiliated Fund. | |
(c) | Variable rate security. Interest rate or distribution rate disclosed is that which is in effect on June 30, 2017. | |
| The accompanying notes are an integral part of these financial statements. | 13 |
GOLDMAN SACHS LONG SHORT FUND
Schedule of Investments (continued)
June 30, 2017 (Unaudited)
| ||
Currency Abbreviations: | ||
CAD | —Canadian Dollar | |
CHF | —Swiss Franc | |
EUR | —Euro | |
GBP | —British Pound | |
HKD | —Hong Kong Dollar | |
USD | —U.S. Dollar | |
Investment Abbreviations: | ||
ADR | —American Depositary Receipt | |
ETF | —Exchange Traded Fund | |
LLC | —Limited Liability Company | |
PLC | —Public Limited Company | |
| ||
| ADDITIONAL INVESTMENT INFORMATION |
FORWARD FOREIGN CURRENCY EXCHANGE CONTRACTS — At June 30, 2017, the Fund had the following forward foreign currency exchange contracts:
FORWARD FOREIGN CURRENCY EXCHANGE CONTRACTS WITH UNREALIZED GAIN
| Counterparty | Currency Purchased | Currency Sold | Current Value | Settlement Date | Unrealized Gain | |||||||||||||||||||
Morgan Stanley & Co. International PLC | CAD | 59,722 | USD | 45,199 | $ | 46,113 | 09/20/17 | $ | 914 | |||||||||||||||
| CHF | 230,000 | USD | 238,440 | 241,115 | 09/20/17 | 2,675 | ||||||||||||||||||
| EUR | 700,000 | USD | 793,900 | 802,949 | 09/20/17 | 9,049 | ||||||||||||||||||
| USD | 141,530 | HKD | 1,100,000 | 141,206 | 09/20/17 | 324 | ||||||||||||||||||
| TOTAL | $ | 12,962 | ||||||||||||||||||||||
FORWARD FOREIGN CURRENCY EXCHANGE CONTRACTS WITH UNREALIZED LOSS
| Counterparty | Currency Purchased | Currency Sold | Current Value | Settlement Date | Unrealized Loss | |||||||||||||||||||
Morgan Stanley & Co. International PLC | USD | 45,038 | CAD | 60,000 | $ | 46,327 | 09/20/17 | $ | (1,289 | ) | ||||||||||||||
| USD | 1,352,766 | CHF | 1,305,284 | 1,368,366 | 09/20/17 | (15,600 | ) | |||||||||||||||||
| USD | 5,555,801 | EUR | 4,936,802 | 5,662,853 | 09/20/17 | (107,052 | ) | |||||||||||||||||
| USD | 1,279,400 | GBP | 997,194 | 1,302,066 | 09/20/17 | (22,666 | ) | |||||||||||||||||
| TOTAL | $ | (146,607 | ) | |||||||||||||||||||||
FUTURES CONTRACTS — At June 30, 2017, the Fund had the following futures contracts:
| Type | Number of Contracts Long (Short) | Expiration Date | Current Value | Unrealized Gain (Loss) | ||||||||||
Nasdaq 100 E-Mini Index | (16 | ) | September 2017 | $ | (1,808,880 | ) | $ | 25,540 | ||||||
S&P 500 E-Mini Index | (102 | ) | September 2017 | (12,346,590 | ) | 82,813 | ||||||||
| TOTAL | $ | 108,353 | ||||||||||||
| 14 | The accompanying notes are an integral part of these financial statements. |
GOLDMAN SACHS LONG SHORT FUND
| ADDITIONAL INVESTMENT INFORMATION (continued) |
SWAP CONTRACTS — At June 30, 2017, the Fund had the following swap contracts:
OVER THE COUNTER TOTAL RETURN SWAP CONTRACTS
| Market Value | ||||||||||||||||||||||||||
| Counterparty | Notional Amount (000s) | Reference Security | Termination Date | Rates Received (Paid)(a) | Upfront Payments Made (Received) | Unrealized Gain (Loss) | ||||||||||||||||||||
Credit Suisse International (London) | EUR | 228 | Airpax Electronic Shanghai Co. Ltd. | 03/27/18 | (0.300)% | $ | — | $ | (4,384 | ) | ||||||||||||||||
| GBP | 1,130 | British American Tobacco PLC | 07/19/18 | (0.300) | — | (94,223 | ) | |||||||||||||||||||
| 306 | British Land Co. PLC | 01/17/18 | (0.300) | (1,474 | ) | (3,792 | ) | |||||||||||||||||||
| EUR | 963 | ESTX Bank | 09/20/17 | (0.300) | — | (23,074 | ) | |||||||||||||||||||
| 1,102 | Klepierre | 08/29/18 | (0.300) | — | 1,701 | |||||||||||||||||||||
| 478 | Sanghar Sugar Mills Ltd. | 11/13/18 | (0.300 | ) | — | 15,286 | ||||||||||||||||||||
| TOTAL | $ | (1,474 | ) | $ | (108,486 | ) | ||||||||||||||||||||
| (a) | The Fund pays/receives quarterly coupon payments in accordance with the swap contracts. On the termination date of the swap contracts, the Fund will either receive from or pay to the counterparty an amount equal to the net of the accrued financing fees and the value of the reference security subtracted from the original notional cost (notional multiplied by the price change of the reference security, converted to U.S. Dollars). |
WRITTEN OPTIONS CONTRACTS — At June 30, 2017 the Fund had following written options:
OPTIONS ON EQUITY CONTRACTS
| Counterparty | Description | Contracts | Expiration Date | Strike Price | Value | |||||||||||||
Bank of America Securities LLC | Call - Broadcom Ltd. | 206 | 01/19/18 | $ | 230 | $ | (480,815 | ) | ||||||||||
Morgan Stanley & Co. International PLC | Call - Microsoft Corp. | 1,047 | 01/19/18 | 80 | (71,888 | ) | ||||||||||||
| TOTAL (Premium Received $311,097) | 1,253 | $ | (552,703 | ) | ||||||||||||||
For the period ended June 30, 2017, the Fund had the following written options activity:
| Contracts | Premiums Received | |||||||
Contracts Outstanding December 31, 2016 | 126 | $ | 5,413 | |||||
Contracts Written | 7,756 | 880,380 | ||||||
Contracts Bought to Close | (2,718 | ) | (250,051 | ) | ||||
Contracts Expired | (2,411 | ) | (92,606 | ) | ||||
Contracts Assigned | (1,500 | ) | (232,039 | ) | ||||
Contracts Outstanding June 30, 2017 | 1,253 | $ | 311,097 | |||||
| The accompanying notes are an integral part of these financial statements. | 15 |
GOLDMAN SACHS LONG SHORT FUND
Statement of Assets and Liabilities
June 30, 2017 (Unaudited)
| Assets: | ||||||
Investments of unaffiliated issuers, at value (cost $36,757,506) | $ | 40,639,341 | ||||
Investments of affiliated issuers, at value (cost $20,012,416) | 20,012,416 | |||||
Cash | 1,929,395 | |||||
Foreign currencies, at value (cost $484,828) | 486,797 | |||||
Variation margin on certain derivative contracts | 72,304 | |||||
Unrealized gain on swap contracts | 16,987 | |||||
Unrealized gain on forward foreign currency exchange contracts | 12,962 | |||||
Receivables: | ||||||
Collateral on certain derivative contracts(a) | 1,869,144 | |||||
Investments sold | 1,472,025 | |||||
Due from broker | 66,894 | |||||
Fund shares sold | 374,948 | |||||
Dividends | 62,363 | |||||
Reimbursement from investment adviser | 33,127 | |||||
Foreign tax reclaims | 12,286 | |||||
Other assets | 245 | |||||
| Total assets | 67,061,234 | |||||
| Liabilities: | ||||||
Securities sold short, at value (proceeds received $13,107,891) | 13,459,183 | |||||
Written option contracts, at value (premium received $311,097) | 552,703 | |||||
Unrealized loss on forward foreign currency exchange contracts | 146,607 | |||||
Unrealized loss on swap contracts | 125,473 | |||||
Payables: | ||||||
Investments purchased | 2,937,365 | |||||
Fund shares redeemed | 97,569 | |||||
Management fees | 58,801 | |||||
Dividend Payable on securities sold short | 37,418 | |||||
Distribution and Service fees and Transfer Agency fees | 5,355 | |||||
Upfront payments received on swap contracts | 1,474 | |||||
Accrued expenses | 158,040 | |||||
| Total liabilities | 17,579,988 | |||||
| Net Assets: | ||||||
Paid-in capital | 84,681,652 | |||||
Net Investment loss | (251,153 | ) | ||||
Accumulated net realized loss | (38,105,503 | ) | ||||
Net unrealized gain | 3,156,250 | |||||
| NET ASSETS | $ | 49,481,246 | ||||
Net Assets: | ||||||
Class A | $ | 2,366,478 | ||||
Class C | 2,315,981 | |||||
Institutional | 42,939,491 | |||||
Class IR | 1,838,104 | |||||
Class R | 21,192 | |||||
Total Net Assets | $ | 49,481,246 | ||||
Shares Outstanding $0.001 par value (unlimited number of shares authorized): | ||||||
Class A | 277,897 | |||||
Class C | 277,480 | |||||
Institutional | 4,997,187 | |||||
Class IR | 214,416 | |||||
Class R | 2,504 | |||||
Net asset value, offering and redemption price per share:(b) | ||||||
Class A | $8.52 | |||||
Class C | 8.35 | |||||
Institutional | 8.59 | |||||
Class IR | 8.57 | |||||
Class R | 8.46 | |||||
| (a) | Includes amounts segregated for initial margin and/or collateral on futures transactions, swaps transactions and options transactions of $539,880, $708,651 and $620,613, respectively. |
| (b) | Maximum public offering price per share for Class A Shares is $9.02. At redemption, Class C Shares may be subject to a contingent deferred sales charge, assessed on the amount equal to the lesser of the current net asset value (“NAV”) or the original purchase price of the shares. |
| 16 | The accompanying notes are an integral part of these financial statements. |
GOLDMAN SACHS LONG SHORT FUND
Statement of Operations
For the Six Months Ended June 30, 2017 (Unaudited)
| Investment income: | ||||||
Dividends — unaffiliated issuers (net of foreign withholding taxes of $16,024) | $ | 421,646 | ||||
Dividends — affiliated issuers | 81,217 | |||||
Interest | 461 | |||||
| Total investment income | 503,324 | |||||
| Expenses: | ||||||
Management fees | 439,437 | |||||
Dividend expense on short positions | 260,515 | |||||
Brokerage fees | 115,355 | |||||
Custody, accounting and administrative services | 77,506 | |||||
Professional fees | 56,129 | |||||
Registration fees | 31,237 | |||||
Printing and mailing costs | 24,080 | |||||
Distribution and Service fees(a) | 19,770 | |||||
Transfer Agency fees(a) | 17,926 | |||||
Trustee fees | 8,293 | |||||
Interest expense | 5,042 | |||||
Other | 4,940 | |||||
| Total expenses | 1,060,230 | |||||
Less — expense reductions | (215,776 | ) | ||||
| Net expenses | 844,454 | |||||
| NET INVESTMENT LOSS | (341,130 | ) | ||||
| Realized and unrealized gain (loss): | ||||||
Net realized gain (loss) from: | ||||||
Investments — unaffiliated issuers | 938,055 | |||||
Securities sold short | (2,025,792 | ) | ||||
Futures contracts | (580,420 | ) | ||||
Written options | 157,124 | |||||
Swap contracts | (10,612 | ) | ||||
Forward foreign currency exchange contracts | (408,270 | ) | ||||
Foreign currency transactions | (36,642 | ) | ||||
Net change in unrealized gain (loss) on: | ||||||
Investments — unaffiliated issuers | 1,275,506 | |||||
Securities sold short | 1,015,634 | |||||
Futures contracts | 157,576 | |||||
Written options | (241,034 | ) | ||||
Swap contracts | (85,729 | ) | ||||
Forward foreign currency exchange contracts | (50,793 | ) | ||||
Foreign currency translation | 976 | |||||
| Net realized and unrealized gain | 105,579 | |||||
| NET DECREASE IN NET ASSETS RESULTING FROM OPERATIONS | $ | (235,551 | ) | |||
| (a) | Class specific Distribution and Service and Transfer Agency fees were as follows: |
| Distribution and Service Fees | Transfer Agency Fees | |||||||||||||||||||||||||||||
Class A | Class C | Class R | Class A | Class C | Institutional | Class IR | Class R | |||||||||||||||||||||||
| $ | 5,378 | $ | 14,338 | $ | 54 | $ | 4,088 | $ | 2,724 | $ | 9,135 | $ | 1,959 | $ | 20 | |||||||||||||||
| The accompanying notes are an integral part of these financial statements. | 17 |
GOLDMAN SACHS LONG SHORT FUND
Statements of Changes in Net Assets
| For the Six Months Ended June 30, 2017 (Unaudited) | For the Fiscal Year Ended December 31, 2016 | |||||||||
| From operations: | ||||||||||
Net investment loss | $ | (341,130 | ) | $ | (1,840,012 | ) | ||||
Net realized loss | (1,966,557 | ) | (6,262,505 | ) | ||||||
Net change in unrealized gain (loss) | 2,072,136 | (4,481,466 | ) | |||||||
| Net decrease in net assets resulting from operations | (235,551 | ) | (12,583,983 | ) | ||||||
| From share transactions: | ||||||||||
Proceeds from sales of shares | 5,184,307 | 25,999,667 | ||||||||
Cost of shares redeemed | (12,902,062 | ) | (120,318,413 | ) | ||||||
| Net decrease in net assets resulting from share transactions | (7,717,755 | ) | (94,318,746 | ) | ||||||
| TOTAL DECREASE | (7,953,306 | ) | (106,902,729 | ) | ||||||
| Net assets: | ||||||||||
Beginning of period | 57,434,552 | 164,337,281 | ||||||||
End of period | $ | 49,481,246 | $ | 57,434,552 | ||||||
| Undistributed (distributions in excess of) net investment loss | $ | (251,153 | ) | $ | 89,977 | |||||
| 18 | The accompanying notes are an integral part of these financial statements. |
GOLDMAN SACHS LONG SHORT FUND
Statement of Cash Flows
For the Six Months Ended June 30, 2017 (Unaudited)
Increase/(Decrease) in cash – Cash flows provided by operating activities: | ||||||
Net decrease in net assets from operations | $ | (235,551 | ) | |||
Adjustments to reconcile net decrease in net assets from operations to net cash provided by/(used in) operating activities: | ||||||
Payments for purchases of investments | (76,896,295 | ) | ||||
Proceeds from sales of investments | 70,425,165 | |||||
Payments for closing purchases of securities sold short | (47,031,860 | ) | ||||
Proceeds from sales of securities sold short | 32,678,382 | |||||
Purchases of short-term investments securities, net | 21,735,441 | |||||
Payment for options purchased | (5,987,704 | ) | ||||
Proceeds from options sold | 4,185,681 | |||||
Proceeds from options written | 748,189 | |||||
Proceeds from swaps, net | (7,703 | ) | ||||
Proceeds from corporate actions, net | 1,181,266 | |||||
(Increase) Decrease in Assets: | ||||||
Variation margin on certain derivative contracts | (72,304 | ) | ||||
Unrealized gain on swap contracts | (14,842 | ) | ||||
Unrealized gain on forward foreign currency exchange contracts | 19,167 | |||||
Receivable for collateral on certain derivative contracts | (703,423 | ) | ||||
Receivable for collateral on securities sold short | 9,633,366 | |||||
Receivable for due from broker | (66,894 | ) | ||||
Receivable for investments sold | (1,472,025 | ) | ||||
Receivable for reimbursement from investment adviser | (19,849 | ) | ||||
Receivable for dividends and interest | (31,403 | ) | ||||
Receivable for foreign tax reclaims | (8,992 | ) | ||||
Other assets | (203 | ) | ||||
Increase (Decrease) in Liabilities: | ||||||
Unrealized loss on swaps contracts | 100,571 | |||||
Unrealized loss on forward foreign currency contracts | 31,626 | |||||
Payable for investments purchased | 2,137,482 | |||||
Payable for amounts owed to affiliates | (18,998 | ) | ||||
Payable for dividend payable on securities sold short | 21,226 | |||||
Payable for collateral on certain derivative contracts | (220,000 | ) | ||||
Accrued expenses | (8,121 | ) | ||||
Net realized gain (loss) on: | ||||||
Investments and securities sold short | 1,087,737 | |||||
Derivatives | (146,512 | ) | ||||
Net change in unrealized gain (loss) on: | ||||||
Investments and securities sold short | (2,291,140 | ) | ||||
Derivatives | 326,763 | |||||
| Net cash provided by operating activities | 9,078,243 | |||||
| Net Cash used in financing activities: | ||||||
Proceeds from sales of shares | 4,844,295 | |||||
Cost of shares redeemed | (13,229,781 | ) | ||||
| Net cash used in financing activities | (8,385,486 | ) | ||||
| NET INCREASE IN CASH | $ | 692,757 | ||||
| Cash: | ||||||
Beginning of period | 1,723,435 | |||||
End of period | $ | 2,416,192 | ||||
Supplemental disclosure | ||||||
Cash paid for interest and related fees | 5,042 | |||||
| The accompanying notes are an integral part of these financial statements. | 19 |
GOLDMAN SACHS LONG SHORT FUND
Selected Data for a Share Outstanding Throughout Each Period
| From investment operations | Distributions to shareholders | |||||||||||||||||||||||||||||
| Year - Share Class | Net asset | Net investment loss(a) | Net realized and unrealized gain (loss) | Total from investment operations | From net investment income | From net realized gains | Total distributions | |||||||||||||||||||||||
| FOR THE SIX MONTHS ENDED JUNE 30, (UNAUDITED) | ||||||||||||||||||||||||||||||
2017 - A | $ | 8.59 | $ | (0.07 | ) | $ | — | (d) | $ | (0.07 | ) | $ | — | $ | — | $ | — | |||||||||||||
2017 - C | 8.44 | (0.10 | ) | 0.01 | (0.09 | ) | — | — | — | |||||||||||||||||||||
2017 - Institutional | 8.65 | (0.05 | ) | (0.01 | ) | (0.06 | ) | — | — | — | ||||||||||||||||||||
2017 - IR | 8.63 | (0.06 | ) | — | (d) | (0.06 | ) | — | — | — | ||||||||||||||||||||
2017 - R | 8.54 | (0.08 | ) | — | (d) | (0.08 | ) | — | — | — | ||||||||||||||||||||
| FOR THE FISCAL YEARS ENDED DECEMBER 31, | ||||||||||||||||||||||||||||||
2016 - A | 9.20 | (0.19 | ) | (0.42 | ) | (0.61 | ) | — | — | — | ||||||||||||||||||||
2016 - C | 9.12 | (0.24 | ) | (0.44 | ) | (0.68 | ) | — | — | — | ||||||||||||||||||||
2016 - Institutional | 9.23 | (0.15 | ) | (0.43 | ) | (0.58 | ) | — | — | — | ||||||||||||||||||||
2016 - IR | 9.23 | (0.17 | ) | (0.43 | ) | (0.60 | ) | — | — | — | ||||||||||||||||||||
2016 - R | 9.18 | (0.20 | ) | (0.44 | ) | (0.64 | ) | — | — | — | ||||||||||||||||||||
2015 - A | 10.17 | (0.18 | ) | (0.77 | ) | (0.95 | ) | — | (d) | (0.02 | ) | (0.02 | ) | |||||||||||||||||
2015 - C | 10.15 | (0.25 | ) | (0.76 | ) | (1.01 | ) | — | (0.02 | ) | (0.02 | ) | ||||||||||||||||||
2015 - Institutional | 10.18 | (0.13 | ) | (0.78 | ) | (0.91 | ) | (0.02 | ) | (0.02 | ) | (0.04 | ) | |||||||||||||||||
2015 - IR | 10.18 | (0.14 | ) | (0.78 | ) | (0.92 | ) | (0.01 | ) | (0.02 | ) | (0.03 | ) | |||||||||||||||||
2015 - R | 10.16 | (0.20 | ) | (0.76 | ) | (0.96 | ) | — | (0.02 | ) | (0.02 | ) | ||||||||||||||||||
| FOR THE PERIOD ENDED DECEMBER 31, | ||||||||||||||||||||||||||||||
2014 - A (Commenced September 30, 2014) | 10.00 | (0.06 | ) | 0.23 | 0.17 | — | — | — | ||||||||||||||||||||||
2014 - C (Commenced September 30, 2014) | 10.00 | (0.07 | ) | 0.22 | 0.15 | — | — | — | ||||||||||||||||||||||
2014 - Institutional (Commenced September 30, 2014) | 10.00 | (0.04 | ) | 0.22 | 0.18 | — | — | — | ||||||||||||||||||||||
2014 - IR (Commenced September 30, 2014) | 10.00 | (0.05 | ) | 0.23 | 0.18 | — | — | — | ||||||||||||||||||||||
2014 - R (Commenced September 30, 2014) | 10.00 | (0.05 | ) | 0.21 | 0.16 | — | — | — | ||||||||||||||||||||||
| (a) | Calculated based on the average shares outstanding methodology. |
| (b) | Assumes investment at the NAV at the beginning of the period, reinvestment of all dividends and distributions, a complete redemption of the investment at the NAV at the end of the period and no sales or redemption charges. Total returns would be reduced if a sales or redemption charge was taken into account. Returns do not reflect the impact of taxes to shareholder relating to Fund distributions or the redemption of Fund shares. Total returns for periods less than one full year are not annualized. |
| (c) | The Fund’s portfolio turnover rate is calculated in accordance with regulatory requirements, without regard to transactions involving short term investments and certain derivatives. If such transactions were included, the Fund’s portfolio turnover rate may be higher. |
| (d) | Amount is less than $0.005 per share. |
| (e) | Annualized. |
| (f) | Amount has been revised to exclude prime brokerage expenses relating to short sales. |
| 20 | The accompanying notes are an integral part of these financial statements. |
GOLDMAN SACHS LONG SHORT FUND
| Net asset value, end of period | Total return(b) | Net assets, end of period (in 000s) | Ratio of net expenses to average net assets (including dividend and interest payments and other expenses relating to securities sold short) | Ratio of net expenses to average net assets (excluding dividend and interest payments and other expenses relating to securities sold short) | Ratio of total expenses to average net assets (including dividend and interest payments and other expenses relating to securities sold short) | Ratio of total expenses to average net assets (excluding dividend and interest payments and other expenses relating to securities sold short) | Ratio of net investment income (loss) to average net assets | Portfolio turnover rate(c) | ||||||||||||||||||||||||||||||||||||||||||||||||
| $ | 8.52 | (0.81 | )% | $ | 2,366 | 3.34 | %(e) | 2.00 | %(e) | 4.10 | %(e) | 2.76 | %(e) | (1.67 | )%(e) | 183 | % | |||||||||||||||||||||||||||||||||||||||
| 8.35 | (1.18 | ) | 2,316 | 4.11 | (e) | 2.74 | (e) | 4.89 | (e) | 3.52 | (e) | (2.35 | )(e) | 183 | ||||||||||||||||||||||||||||||||||||||||||
| 8.59 | (0.69 | ) | 42,939 | 2.98 | (e) | 1.59 | (e) | 3.77 | (e) | 2.38 | (e) | (1.13 | )(e) | 183 | ||||||||||||||||||||||||||||||||||||||||||
| 8.57 | (0.70 | ) | 1,838 | 3.15 | (e) | 1.74 | (e) | 3.93 | (e) | 2.52 | (e) | (1.31 | )(e) | 183 | ||||||||||||||||||||||||||||||||||||||||||
| 8.46 | (0.94 | ) | 21 | 3.64 | (e) | 2.24 | (e) | 4.43 | (e) | 3.03 | (e) | (1.75 | )(e) | 183 | ||||||||||||||||||||||||||||||||||||||||||
| 8.59 | (6.61 | ) | 5,687 | 3.45 | 2.06 | 3.81 | 2.42 | (2.16 | ) | 403 | ||||||||||||||||||||||||||||||||||||||||||||||
| 8.44 | (7.33 | ) | 3,285 | 4.31 | 2.81 | 4.73 | 3.23 | (2.78 | ) | 403 | ||||||||||||||||||||||||||||||||||||||||||||||
| 8.65 | (6.27 | ) | 46,497 | 3.10 | 1.66 | 3.49 | 2.05 | (1.69 | ) | 403 | ||||||||||||||||||||||||||||||||||||||||||||||
| 8.63 | (6.48 | ) | 1,943 | 3.22 | 1.81 | 3.59 | 2.18 | (1.91 | ) | 403 | ||||||||||||||||||||||||||||||||||||||||||||||
| 8.54 | (6.95 | ) | 21 | 3.88 | 2.31 | 4.32 | 2.75 | (2.38 | ) | 403 | ||||||||||||||||||||||||||||||||||||||||||||||
| 9.20 | (9.32 | ) | 20,235 | 2.93 | 2.10 | (f) | 3.25 | 2.42 | (f) | (1.82 | ) | 468 | ||||||||||||||||||||||||||||||||||||||||||||
| 9.12 | (9.99 | ) | 5,620 | 3.70 | 2.85 | (f) | 4.01 | 3.16 | (f) | (2.58 | ) | 468 | ||||||||||||||||||||||||||||||||||||||||||||
| 9.23 | (8.93 | ) | 129,206 | 2.44 | 1.71 | (f) | 2.94 | 2.21 | (f) | (1.33 | ) | 468 | ||||||||||||||||||||||||||||||||||||||||||||
| 9.23 | (9.06 | ) | 9,254 | 2.65 | 1.86 | (f) | 2.99 | 2.20 | (f) | (1.43 | ) | 468 | ||||||||||||||||||||||||||||||||||||||||||||
| 9.18 | (9.49 | ) | 23 | 3.00 | 2.37 | (f) | 3.67 | 3.04 | (f) | (1.94 | ) | 468 | ||||||||||||||||||||||||||||||||||||||||||||
| 10.17 | 1.70 | 543 | 3.43 | (e) | 2.14 | (e)(f) | 5.58 | (e) | 4.29 | (e)(f) | (2.40 | )(e) | 118 | |||||||||||||||||||||||||||||||||||||||||||
| 10.15 | 1.50 | 62 | 3.79 | (e) | 2.88 | (e)(f) | 5.64 | (e) | 4.73 | (e)(f) | (2.87 | )(e) | 118 | |||||||||||||||||||||||||||||||||||||||||||
| 10.18 | 1.80 | 52,328 | 2.18 | (e) | 1.75 | (e)(f) | 3.74 | (e) | 3.31 | (e)(f) | (1.47 | )(e) | 118 | |||||||||||||||||||||||||||||||||||||||||||
| 10.18 | 1.80 | 82 | 2.71 | (e) | 1.90 | (e)(f) | 4.50 | (e) | 3.69 | (e)(f) | (1.77 | )(e) | 118 | |||||||||||||||||||||||||||||||||||||||||||
| 10.16 | 1.60 | 25 | 2.82 | (e) | 2.39 | (e)(f) | 4.38 | (e) | 3.95 | (e)(f) | (2.11 | )(e) | 118 | |||||||||||||||||||||||||||||||||||||||||||
| The accompanying notes are an integral part of these financial statements. | 21 |
GOLDMAN SACHS LONG SHORT FUND
June 30, 2017 (Unaudited)
| 1. ORGANIZATION |
Goldman Sachs Trust (the “Trust”) is a Delaware statutory trust registered under the Investment Company Act of 1940, as amended (the “Act”), as an open-end management investment company. The Trust includes the Goldman Sachs Long Short Fund (the “Fund”). The Fund is a non-diversified portfolio and currently offers five classes of shares: Class A, Class C, Institutional, Class IR and Class R Shares.
Class A Shares are sold with a front-end sales charge of up to 5.50%. Class C Shares are sold with a contingent deferred sales charge (“CDSC”) of 1.00%, which is imposed on redemptions made within 12 months of purchase. Institutional, Class IR and Class R are not subject to a sales charge.
GS Investment Strategies, LLC (“GSIS”), an affiliate of Goldman Sachs & Co. LLC (formerly Goldman, Sachs & Co.) (“Goldman Sachs”), serves as investment adviser to the Fund pursuant to a management agreement (the “Agreement”) with the Trust.
| 2. SIGNIFICANT ACCOUNTING POLICIES |
The financial statements have been prepared in accordance with accounting principles generally accepted in the United States of America (“GAAP”) and require management to make estimates and assumptions that may affect the reported amounts and disclosures. Actual results may differ from those estimates and assumptions.
A. Investment Valuation — The Fund’s valuation policy is to value investments at fair value.
B. Investment Income and Investments — Investment income includes interest income, dividend income, and securities lending income. Interest income is accrued daily and adjusted for amortization of premiums and accretion of discounts. Dividend income is recognized on ex-dividend date or, for certain foreign securities, as soon as such information is obtained subsequent to the ex-dividend date. Investment transactions are reflected on trade date. Realized gains and losses are calculated using identified cost. Investment transactions are recorded on the following business day for daily net asset value (“NAV”) calculations. Investment income is recorded net of any foreign withholding taxes, less any amounts reclaimable. The Fund may file withholding tax reclaims in certain jurisdictions to recover a portion of amounts previously withheld. Any foreign capital gains tax is accrued daily based upon net realized gains, and is payable upon sale of such investments. Distributions received from the Fund’s investments in U.S. real estate investment trusts (“REITs”) may be characterized as ordinary income, net capital gain or a return of capital. A return of capital is recorded by the Fund as a reduction to the cost basis of the REIT.
For derivative contracts, realized gains and losses are recorded upon settlement of the contract. Upfront payments, if any, are made or received upon entering into a swap agreement and are reflected in the Statement of Assets and Liabilities. Upfront payments are recognized over the contract’s term/event as realized gains or losses, with the exception of forward starting interest rate swaps whose realized gains or losses are recognized from the effective start date.
C. Class Allocations and Expenses — Investment income, realized and unrealized gain (loss), and non-class specific expenses of the Fund are allocated daily based upon the proportion of net assets of each class. Non-class specific expenses directly incurred by the Fund are charged to the Fund, while such expenses incurred by the Trust are allocated across the Fund on a straight-line and/or pro-rata basis depending upon the nature of the expenses. Class specific expenses, where applicable, are borne by the respective share classes and include Distribution and Service, Transfer Agency and Service and Shareholder Administration fees.
D. Federal Taxes and Distributions to Shareholders — It is the Fund’s policy to comply with the requirements of the Internal Revenue Code of 1986, as amended (the “Code”), applicable to regulated investment companies (mutual funds) and to distribute each year substantially all of its investment company taxable income and capital gains to its shareholders. Accordingly, the Fund is not required to make any provisions for the payment of federal income tax. Distributions to shareholders are recorded on the ex-dividend date. Income and capital gains distributions, if any, are declared and paid annually.
Net capital losses, if any, are carried forward to future fiscal years and may be used to the extent allowed by the Code to offset any future capital gains. Losses that are carried forward will retain their character as either short-term or long-term capital losses. Utilization of capital loss carryforwards will reduce the requirement of future capital gains distributions.
The characterization of distributions to shareholders for financial reporting purposes is determined in accordance with federal income tax rules, which may differ from GAAP. The source of the Fund’s distributions may be shown in the accompanying
22
GOLDMAN SACHS LONG SHORT FUND
| 2. SIGNIFICANT ACCOUNTING POLICIES (continued) |
financial statements as either from net investment income, net realized gain or capital. Certain components of the Fund’s net assets on the Statement of Assets and Liabilities reflect permanent GAAP/tax differences based on the appropriate tax character.
E. Foreign Currency Translation — The accounting records and reporting currency of the Fund are maintained in U.S. dollars. Assets and liabilities denominated in foreign currencies are translated into U.S. dollars using the current exchange rates at the close of each business day. The effect of changes in foreign currency exchange rates on investments is included within net realized and unrealized gain (loss) on investments. Changes in the value of other assets and liabilities as a result of fluctuations in foreign exchange rates are included in the Statement of Operations within net change in unrealized gain (loss) on foreign currency translations. Transactions denominated in foreign currencies are translated into U.S. dollars on the date the transaction occurred, the effects of which are included within net realized gain (loss) on foreign currency transactions.
| 3. INVESTMENTS AND FAIR VALUE MEASUREMENTS |
U.S. GAAP defines the fair value of a financial instrument as the amount that would be received to sell an asset or paid to transfer a liability in an orderly transaction between market participants at the measurement date (i.e., the exit price); the Fund’s policy is to use the market approach. GAAP establishes a fair value hierarchy that prioritizes the inputs to valuation techniques used to measure fair value. The hierarchy gives the highest priority to unadjusted quoted prices in active markets for identical assets or liabilities (Level 1 measurements) and the lowest priority to unobservable inputs (Level 3 measurements). The levels used for classifying investments are not necessarily an indication of the risk associated with investing in these investments. The three levels of the fair value hierarchy are described below:
Level 1 — Unadjusted quoted prices in active markets that are accessible at the measurement date for identical, unrestricted assets or liabilities;
Level 2 — Quoted prices in markets that are not active or financial instruments for which significant inputs are observable (including, but not limited to, quoted prices for similar investments, interest rates, foreign exchange rates, volatility and credit spreads), either directly or indirectly;
Level 3 — Prices or valuations that require significant unobservable inputs (including GSIS’s assumptions in determining fair value measurement).
Changes in valuation techniques may result in transfers into or out of an assigned level within the hierarchy. In accordance with the Fund’s policy, transfers between different levels of the fair value hierarchy resulting from such changes are deemed to have occurred as of the beginning of the reporting period.
The Board of Trustees (“Trustees”) has approved Valuation Procedures that govern the valuation of the portfolio investments held by the Fund, including investments for which market quotations are not readily available. The Trustees have delegated to GSIS day-to-day responsibility for implementing and maintaining internal controls and procedures related to the valuation of the Fund’s portfolio investments. To assess the continuing appropriateness of pricing sources and methodologies, GSIS regularly performs price verification procedures and issues challenges as necessary to third party pricing vendors or brokers, and any differences are reviewed in accordance with the Valuation Procedures.
A. Level 1 and Level 2 Fair Value Investments — The valuation techniques and significant inputs used in determining the fair values for investments classified as Level 1 and Level 2 are as follows:
Equity Securities — Equity securities traded on a United States (“U.S.”) securities exchange or the NASDAQ system, or those located on certain foreign exchanges, including but not limited to the Americas, are valued daily at their last sale price or official closing price on the principal exchange or system on which they are traded. If there is no sale or official closing price or such price is believed by GSIS to not represent fair value, equity securities are valued at the last bid price for long positions and at the last ask price for short positions. To the extent these investments are actively traded, they are classified as Level 1 of the fair value hierarchy, otherwise they are generally classified as Level 2.
23
GOLDMAN SACHS LONG SHORT FUND
Notes to Financial Statements (continued)
June 30, 2017 (Unaudited)
| 3. INVESTMENTS AND FAIR VALUE MEASUREMENTS (continued) |
Unlisted equity securities for which market quotations are available are valued at the last sale price on the valuation date, or if no sale occurs, at the last bid price. Securities traded on certain foreign securities exchanges are valued daily at fair value determined by an independent fair value service (if available) under Valuation Procedures approved by the Trustees and consistent with applicable regulatory guidance. The independent fair value service takes into account multiple factors including, but not limited to, movements in the securities markets, certain depositary receipts, futures contracts and foreign currency exchange rates that have occurred subsequent to the close of the foreign securities exchange. These investments are generally classified as Level 2 of the fair value hierarchy.
Underlying Funds (including Money Market Funds) — Underlying Funds (“Underlying Funds”) include other investment companies and exchange-traded funds (“ETFs”). Investments in the Underlying Funds (except ETFs) are valued at the NAV per share of the Institutional Share class on the day of valuation. ETFs are valued daily at the last sale price or official closing price on the principal exchange or system on which the investment is traded. Because the Fund invests in Underlying Funds that fluctuate in value, the Fund’s shares will correspondingly fluctuate in value. To the extent these investments are actively traded, they are classified as Level 1 of the fair value hierarchy, otherwise they are generally classified as Level 2. For information regarding an Underlying Fund’s accounting policies and investment holdings, please see the Underlying Fund’s shareholder report.
Derivative Contracts — A derivative is an instrument whose value is derived from underlying assets, indices, reference rates or a combination of these factors. The Fund enters into derivative transactions to hedge against changes in interest rates, securities prices, and/or currency exchange rates, to increase total return, or to gain access to certain markets or attain exposure to other underliers.
Exchange-traded derivatives, including futures and options contracts, are valued at the last sale or settlement price and typically fall within Level 1 of the fair value hierarchy. Over-the-counter (“OTC”) and centrally cleared derivatives are valued using market transactions and other market evidence, including market-based inputs to models, calibration to market-clearing transactions, broker or dealer quotations, or other alternative pricing sources. Where models are used, the selection of a particular model to value OTC and centrally cleared derivatives depends upon the contractual terms of, and specific risks inherent in, the instrument, as well as the availability of pricing information in the market. Valuation models require a variety of inputs, including contractual terms, market prices, yield curves, credit curves, measures of volatility, voluntary and involuntary prepayment rates, loss severity rates and correlations of such inputs. For OTC and centrally cleared derivatives that trade in liquid markets, model inputs can generally be verified and model selection does not involve significant management judgment. OTC and centrally cleared derivatives are classified within Level 2 of the fair value hierarchy when significant inputs are corroborated by market evidence.
i. Forward Contracts — A forward contract is a contract between two parties to buy or sell an asset at a specified price on a future date. A forward contract settlement can occur on a cash or delivery basis. Forward contracts are marked-to-market daily using independent vendor prices, and the change in value, if any, is recorded as an unrealized gain or loss. Cash and certain investments may be used to collateralize forward contracts.
A forward foreign currency contract is a forward contract in which the Fund agrees to receive or deliver a fixed quantity of one currency for another, at a pre-determined price at a future date. All forward foreign currency exchange contracts are marked-to-market daily at the applicable forward rate. Non-deliverable forward foreign currency exchange contracts are settled with the counterparty in cash without the delivery of foreign currency.
ii. Futures Contracts — Futures contracts are contracts to buy or sell a standardized quantity of a specified commodity or security and are valued based on exchanged settlement prices or independent market quotes. Futures contracts are valued at the last settlement price, or in the absence of a sale, the last bid price for long positions and at the last ask price for short positions, at the end of each day on the board of trade or exchange upon which they are traded. Upon entering into a futures contract, the Fund deposits cash or securities in an account on behalf of the broker in an amount sufficient to meet the initial margin requirement. Subsequent payments are made or received by the Fund equal to the daily change in the contract value and are recorded as variation margin receivable or payable with a corresponding offset to unrealized gains or losses. For financial reporting purposes, cash collateral that has been pledged to cover obligations of the Fund and cash collateral received, if any, is reported separately on the Statement of Assets and Liabilities as receivables/payables for collateral on certain derivative contracts. Non-cash collateral pledged by the Fund, if any, is noted in the Schedule of Investments.
24
GOLDMAN SACHS LONG SHORT FUND
| 3. INVESTMENTS AND FAIR VALUE MEASUREMENTS (continued) |
iii. Options — When the Fund writes call or put options, an amount equal to the premium received is recorded as a liability and is subsequently marked-to-market to reflect the current value of the option written. Swaptions are options on interest rate swap contracts.
Upon the purchase of a call option or a put option by the Fund, the premium paid is recorded as an investment and subsequently marked-to-market to reflect the current value of the option. Certain options may be purchased with premiums to be determined on a future date. The premiums for these options are based upon implied volatility parameters at specified terms.
iv. Swap Contracts — Bilateral swap contracts are agreements in which the Fund and a counterparty agree to exchange periodic payments on a specified notional amount or make a net payment upon termination. Bilateral swap transactions are privately negotiated in the OTC market and payments are settled through direct payments between the Fund and the counterparty. By contrast, certain swap transactions are subject to mandatory central clearing. These swaps are executed through a derivatives clearing member (“DCM”), acting in an agency capacity, and submitted to a central counterparty (“CCP”)(“centrally cleared swaps”), in which case all payments are settled with the CCP through the DCM. Swaps are marked-to-market daily using pricing vendor quotations, counterparty or clearinghouse prices or model prices, and the change in value, if any, is recorded as an unrealized gain or loss. Upon entering into a swap contract, the Fund is required to satisfy an initial margin requirement by delivering cash or securities to the counterparty (or in some cases, segregated in a triparty account on behalf of the counterparty), which can be adjusted by any mark-to-market gains or losses pursuant to bilateral or centrally cleared arrangements. For centrally cleared swaps the daily change in valuation, if any, is recorded as a receivable or payable for variation margin.
A total return swap is an agreement that gives the Fund the right to receive the appreciation in the value of a specified security, index or other instrument in return for a fee paid to the counterparty, which will typically be an agreed upon interest rate. If the underlying asset declines in value over the term of the swap, the Fund may also be required to pay the dollar value of that decline to the counterparty.
Securities Sold Short — Securities sold short are those securities which the Fund has sold but which it does not own. When the Fund sells a security it does not own, it must borrow the security that was sold and generally delivers the proceeds from the short sale to the broker through which it made the short sale. In addition, cash and certain investments in securities may be used to collateralize the securities sold short. Each day the securities sold short transaction is open, the liability to replace the borrowed security is marked to market and an unrealized gain or loss is recorded. While the transaction remains open, the Fund may also incur expenses for any dividends or interest which will be paid to the lender of the securities as well as a fee to borrow the delivered security. During the term of the short sale, the value of the securities pledged as collateral on short sales is required to exceed the value of the securities sold short. The market value of securities pledged as collateral is included in the Schedule of Investments.
B. Level 3 Fair Value Investments — To the extent that significant inputs to valuation models and other alternative pricing sources are unobservable, or if quotations are not readily available, or if GSIS believes that such quotations do not accurately reflect fair value, the fair value of the Fund’s investments may be determined under Valuation Procedures approved by the Trustees. GSIS, consistent with its procedures and applicable regulatory guidance, may make an adjustment to the most recent valuation prices of either domestic or foreign securities in light of significant events to reflect what it believes to be the fair value of the securities at the time of determining the Fund’s NAV. Significant events which could affect a large number of securities in a particular market may include, but are not limited to: significant fluctuations in U.S. or foreign markets; market dislocations; market disruptions; or unscheduled market closings. Significant events which could also affect a single issuer may include, but are not limited to: corporate actions such as reorganizations, mergers and buy-outs; ratings downgrades; and bankruptcies.
25
GOLDMAN SACHS LONG SHORT FUND
Notes to Financial Statements (continued)
June 30, 2017 (Unaudited)
| 3. INVESTMENTS AND FAIR VALUE MEASUREMENTS (continued) |
C. Fair Value Hierarchy — The following is a summary of the Fund’s investments and derivatives classified in the fair value hierarchy as of June 30, 2017:
| Investment Type | Level 1 | Level 2 | Level 3 | |||||||||
| Assets(a) | ||||||||||||
Common Stock and/or Other Equity Investments | ||||||||||||
Asia | $ | 302,653 | $ | — | $ | — | ||||||
Europe | — | 1,969,089 | — | |||||||||
North America | 36,440,120 | — | — | |||||||||
Exchange Traded Fund | 370,665 | — | — | |||||||||
Investment Company | 20,012,416 | — | — | |||||||||
| Total | $ | 57,125,854 | $ | 1,969,089 | $ | — | ||||||
| Liabilities(a) | ||||||||||||
Common Stocks Sold Short | ||||||||||||
Europe | $ | (118,521 | ) | $ | (900,746 | ) | $ | — | ||||
North America | (7,281,282 | ) | — | — | ||||||||
Exchange Traded Funds Sold Short | (5,158,634 | ) | — | — | ||||||||
| Total | $ | (12,558,437 | ) | $ | (900,746 | ) | $ | — | ||||
| Derivative Type | ||||||||||||
| Assets | ||||||||||||
Options Purchased | $ | 1,001,455 | $ | 555,359 | $ | — | ||||||
Forward Foreign Currency Exchange Contracts(b) | — | 12,962 | — | |||||||||
Futures Contracts(b) | 108,353 | — | — | |||||||||
Total Return Swap Contracts(b) | — | 16,987 | — | |||||||||
| Total | $ | 1,109,808 | $ | 585,308 | $ | — | ||||||
| Liabilities | ||||||||||||
Forward Foreign Currency Exchange Contracts(b) | $ | — | $ | (146,607 | ) | $ | — | |||||
Total Return Swap Contracts(b) | — | (125,473 | ) | — | ||||||||
Written Options Contracts | (32,844 | ) | (519,859 | ) | — | |||||||
| Total | $ | (32,844 | ) | $ | (791,939 | ) | $ | — | ||||
| (a) | Amounts are disclosed by continent to highlight the impact of time zone differences between local market close and the calculation of net asset value. Security valuations are based on the principal exchange or system on which they are traded, which may differ from country of domicile noted in the table. The Fund utilizes fair value model prices provided by an independent fair value service for international equity securities, resulting in a Level 2 classification. |
| (b) | Amount shown represents unrealized gain (loss) at period end. |
For further information regarding security characteristics, see the Schedule of Investments.
26
GOLDMAN SACHS LONG SHORT FUND
| 4. INVESTMENTS IN DERIVATIVES |
The following table sets forth, by certain risk types, the gross value of derivative contracts as of June 30, 2017. These instruments were used as part of the Fund’s investment strategies and to obtain and/or manage exposure related to the risks below. The values in the tables below exclude the effects of cash collateral received or posted pursuant to these derivative contracts, and therefore are not representative of the Fund’s net exposure.
| Risk | Statement of Assets and Liabilities | Assets | Statement of Assets and Liabilities | Liabilities | ||||||||
Equity | Receivable for unrealized gain on swap contracts; Investments, at value | $ | 1,682,154 | Payable for unrealized loss on swap contracts; Variation margin on certain derivative contracts; Written options, at value | $ | (678,176) | ||||||
Currency | Receivable for unrealized gain on forward foreign currency exchange contracts | 12,962 | Payable for unrealized loss on forward foreign currency exchange contracts | $ | (146,607) | |||||||
| Total | $ | 1,695,116 | $ | (824,783) | ||||||||
| (a) | Includes unrealized gain (loss) on futures contracts described in the Additional Investment Information sections of the Schedule of Investments. Only current day’s variation margin is reported within the Statement of Assets and Liabilities. |
The following table sets forth, by certain risk types, the Fund’s gains (losses) related to these derivatives and their indicative volumes for the six months ended June 30, 2017. These gains (losses) should be considered in the context that these derivative contracts may have been executed to create investment opportunities and/or economically hedge certain investments, and accordingly, certain gains (losses) on such derivative contracts may offset certain (losses) gains attributable to investments. These gains (losses) are included in “Net realized gain (loss)” or “Net change in unrealized gain (loss)” on the Statement of Operations:
| Risk | Statement of Operations | Net Realized Gain (Loss) | Net Change in Unrealized Gain (Loss) | Average Number of Contracts(a) | ||||||||||
| Equity | Net realized gain (loss) from investments, futures contracts, swap contracts and written options/Net change in unrealized gain (loss) on investments, futures contracts, swap contracts and written options | $ | (3,207,059 | ) | $ | (820,608 | ) | 104 | ||||||
| Currency | Net realized gain (loss) from forward foreign currency exchange contracts/Net change in unrealized gain (loss) on forward foreign currency exchange contracts | (408,270 | ) | (50,793 | ) | 27 | ||||||||
| Total | $ | (3,615,329 | ) | $ | (871,401 | ) | 131 | |||||||
| (a) | Average number of contracts is based on the average of month end balances for the six months ended June 30, 2017. |
In order to better define its contractual rights and to secure rights that will help the Fund mitigate its counterparty risk, the Fund may enter into an International Swaps and Derivatives Association, Inc. Master Agreement (“ISDA Master Agreement”) or similar agreement with its derivatives counterparties. An ISDA Master Agreement is a bilateral agreement between the Fund and a counterparty that governs OTC derivatives (including forward foreign currency exchange contracts, and certain options and swaps), and typically contains, among other things, collateral posting terms and netting provisions in the event of a default and/or termination event. The provisions of the ISDA Master Agreement typically permit a single net payment in the event of a default (close-out netting) or similar event, including the bankruptcy or insolvency of the counterparty.
Collateral and margin requirements differ between exchange traded derivatives and OTC derivatives. Margin requirements are established by the broker or clearing house for exchange-traded and centrally cleared derivatives (financial futures contracts, options and centrally cleared swaps) pursuant to governing agreements for those instrument types. Brokers can ask for margin in excess of the minimum in certain circumstances. Collateral terms are contract-specific for OTC derivatives. For derivatives traded under an ISDA Master Agreement, the collateral requirements are typically calculated by netting the marked to market amount for each transaction under such agreement and comparing that amount to the value of any collateral currently pledged by the Fund and
27
GOLDMAN SACHS LONG SHORT FUND
Notes to Financial Statements (continued)
June 30, 2017 (Unaudited)
| 4. INVESTMENTS IN DERIVATIVES (continued) |
the counterparty. Additionally, the Fund may be required to post initial margin to the counterparty, the terms of which would be outlined in the confirmation of the OTC transaction.
For financial reporting purposes, cash collateral that has been pledged to cover obligations of the Fund and cash collateral received from the counterparty, if any, is reported separately on the Statement of Assets and Liabilities as receivables/payables for collateral on certain derivative contracts. Non-cash collateral pledged by the Fund, if any, is noted in the Schedules of Investments. Generally, the amount of collateral due from or to a counterparty must exceed a minimum transfer amount threshold before a transfer is required to be made. To the extent amounts due to the Fund from its counterparties are not fully collateralized, contractually or otherwise, the Fund bears the risk of loss from counterparty nonperformance. The Fund attempts to mitigate counterparty risk by only entering into agreements with counterparties that the Investment Adviser believes to be of good standing and by monitoring the financial stability of those counterparties.
Additionally, the netting of assets and liabilities and the offsetting of collateral pledged or received are based on contractual netting/set-off provisions in the ISDA Master Agreement or similar agreements. However, in the event of a default or insolvency of a counterparty, a court could determine that such rights are not enforceable due to the restrictions or prohibitions against the right of setoff that may be imposed in accordance with a particular jurisdiction’s bankruptcy or insolvency laws.
The following tables set forth the Fund’s net exposure for derivative instruments that are subject to enforceable master netting arrangements or similar agreements as of June 30, 2017:
| Derivative Assets(1) | Derivative Liabilities(1) | |||||||||||||||||||||||||||||||||||||||||||
| Counterparty | Options Purchased | Swaps | Forward Currency Contracts | Total | Swaps | Forward Currency Contracts | Options Written | Total | Net Derivative Asset (Liabilities) | Collateral (Received) Pledged(1) | Net Amount(2) | |||||||||||||||||||||||||||||||||
Bank of America Securities LLC | $ | 335,864 | $ | — | $ | — | $ | 335,864 | $ | — | $ | — | $ | (480,815 | ) | $ | (480,815 | ) | $ | (144,951 | ) | $ | 144,951 | $ | — | |||||||||||||||||||
Credit Suisse International (London) | — | 16,987 | — | 16,987 | (125,473 | ) | — | — | (125,473 | ) | (108,486 | ) | 108,486 | — | ||||||||||||||||||||||||||||||
Morgan Stanley & Co. International PLC | 219,495 | — | 12,962 | 232,457 | — | (146,607 | ) | (39,044 | ) | (185,651 | ) | 46,806 | — | 46,806 | ||||||||||||||||||||||||||||||
Total | $ | 555,359 | $ | 16,987 | $ | 12,962 | $ | 585,308 | $ | (125,473 | ) | $ | (146,607 | ) | $ | (519,859 | ) | $ | (791,939 | ) | $ | (206,631 | ) | $ | 253,437 | $ | 46,806 | |||||||||||||||||
| (1) | Gross amounts available for offset but not netted in the Statement of Assets and Liabilities. |
| (2) | Net amount represents the net amount due (to) from counterparty in the event of a default based on the contractual set-off rights under the agreement. Net amount excludes any over-collateralized amounts. |
| 5. AGREEMENTS AND AFFILIATED TRANSACTIONS |
A. Management Agreement — Under the Agreement, GSIS manages the Fund, subject to the general supervision of the Trustees.
As compensation for the services rendered pursuant to the Agreement, the assumption of the expenses related thereto and administration of the Fund’s business affairs, including providing facilities, GSIS is entitled to a management fee, accrued daily
28
GOLDMAN SACHS LONG SHORT FUND
| 5. AGREEMENTS AND AFFILIATED TRANSACTIONS (continued) |
and paid monthly, equal to an annual percentage rate of the Fund’s average daily net assets. For the six months ended June 30, 2017, contractual and effective net management fees with GSIS were at the following rates:
| Contractual Management Rate | ||||||||||||||||||||||
First $2 billion | Next $3 billion | Next $3 billion | Over $8 billion | Effective Management | Effective Net Management | |||||||||||||||||
| 1.60% | 1.44% | 1.37% | 1.34% | 1.60% | 1.46% | |||||||||||||||||
| (1) | GSIS agreed to waive a portion of its management fee rates, set forth in the Fund’s most recent prospectus. In addition, the Effective Net Management Rate includes the impact of management fee waivers of affiliated underlying funds, if any. Effective April 28, 2017, GSIS agreed to waive a portion of its management fee in order to achieve an Effective Net Management Rate of 1.46%. This waiver will be effective through at least April 28, 2018, and prior to such date GSIS may not terminate this arrangement without approval of the Trustees. Prior to April 28, 2017, the Effective Net Management Rate was 1.60%. |
The Fund invests in the Institutional Shares of the Goldman Sachs Financial Square Government Fund, which is an affiliated Underlying Fund. GSIS has agreed to waive a portion of its management fee payable by the Fund in an amount equal to the management fee it earns as an investment adviser to any of the affiliated Underlying Funds in which the Fund invests. For the six months ended June 30, 2017, GSIS waived $22,995 of the Fund’s management fee.
B. Distribution and/or Service (12b-1) Plans — The Trust, on behalf of Class A and Class R Shares of the Fund, has adopted Distribution and Service Plans subject to Rule 12b-1 under the Act. Under the Distribution and Service Plans, Goldman Sachs, which serves as distributor (the “Distributor”), is entitled to a fee accrued daily and paid monthly for distribution services and personal and account maintenance services, which may then be paid by Goldman Sachs to authorized dealers. These fees are equal to an annual percentage rate of the average daily net assets attributable to Class A or Class R Shares of the Fund, as applicable, as set forth below.
The Trust, on behalf of Class C Shares of the Fund, has adopted a Distribution Plan subject to Rule 12b-1 under the Act. Under the Distribution Plan, Goldman Sachs as Distributor is entitled to a fee accrued daily and paid monthly for distribution services, which may then be paid by Goldman Sachs to authorized dealers. These fees are equal to an annual percentage rate of the average daily net assets attributable to Class C Shares of the Fund, as set forth below.
| Distribution and Service Plan Rates | ||||||||||||
| Class A* | Class C | Class R* | ||||||||||
Distribution and/or Service (12b-1) Plan | 0.25 | % | 0.75 | % | 0.50 | % | ||||||
| * | With respect to Class A and Class R Shares, the Distributor at its discretion may use compensation for distribution services paid under the Distribution Plan to compensate service organizations for personal and account maintenance services and expenses as long as such total compensation does not exceed the maximum cap on “service fees” imposed by the Financial Industry Regulatory Authority. |
C. Distribution Agreement — Goldman Sachs, as Distributor of the shares of the Fund pursuant to a Distribution Agreement, may retain a portion of the Class A Shares’ front end sales charge and Class C Shares’ CDSC. During the six months ended June 30, 2017, Goldman Sachs advised that it retained $72 of Class A Shares.
D. Service Plan — The Trust, on behalf of the Fund, has adopted a Service Plan to allow Class C Shares to compensate service organizations (including Goldman Sachs) for providing varying levels of personal and account maintenance services to their customers who are beneficial owners of such shares. The Service Plan provides for compensation to the service organizations equal to an annual percentage rate of 0.25% of the average daily net assets attributable to Class C Shares of the Fund.
E. Transfer Agency Agreement — Goldman Sachs also serves as the transfer agent of the Fund for a fee pursuant to the Transfer Agency Agreement. The fees charged for such transfer agency services are accrued daily and paid monthly at annual rates as follows: 0.19% of the average daily net assets of Class A, Class C, Class IR and Class R Shares; and 0.04% of the average daily net assets of Institutional and Service Shares. Effective July 28, 2017, the annual rates were amended for Class A, Class C, Class IR and Class R Shares to 0.18% of average daily net assets.
29
GOLDMAN SACHS LONG SHORT FUND
Notes to Financial Statements (continued)
June 30, 2017 (Unaudited)
| 5. AGREEMENTS AND AFFILIATED TRANSACTIONS (continued) |
F. Other Expense Agreements and Affiliated Transactions — GSIS has agreed to limit certain “Other Expenses” of the Fund (excluding acquired fund fees and expenses, transfer agency fees and expenses, service fees and shareholder administration fees (as applicable), taxes, dividend and interest payments on securities sold short, interest, brokerage fees, shareholder meeting, litigation, indemnification and extraordinary expenses) to the extent such expenses exceed, on an annual basis, a percentage rate of the average daily net assets of the Fund. Such Other Expense reimbursements, if any, are accrued daily and paid monthly. In addition, the Fund is not obligated to reimburse GSIS for prior fiscal year expense reimbursements, if any. The Other Expense limitations as an annual percentage rate of average daily net assets for the Fund is 0.004%. Prior to April 28, 2017, the Other Expense limitation was 0.114%. The Other Expense limitations will remain in place through at least April 28, 2018, and prior to such date GSIS may not terminate the arrangements without the approval of the Trustees. In addition, the Fund has entered into certain offset arrangements with the transfer agent, which may result in a reduction of the Fund’s expenses and are received irrespective of the application of the “Other Expense” limitations described above.
For the six months ended June 30, 2017, these expense reductions, including any fee waivers and Other Expense reimbursements, were as follows:
| Management Fee Waiver | Other Expense Reimbursements | Total Expense Reductions | ||||||||
| $ | 35,997 | $ | 179,779 | $ | 215,776 | |||||
G. Line of Credit Facility — As of June 30, 2017 the Fund participated in a $1,100,000,000 committed, unsecured revolving line of credit facility (the “facility”) together with other funds of the Trust and certain registered investment companies having management agreements with GSAM or its affiliates. This facility is to be used for temporary emergency purposes, or to allow for an orderly liquidation of securities to meet redemption requests. The interest rate on borrowings is based on the federal funds rate. The facility also requires a fee to be paid by the Fund based on the amount of the commitment that has not been utilized. For the six months ended June 30, 2017, the Fund did not have any borrowings under the facility.
H. Other Transactions with Affiliates — For the six months ended June 30, 2017, Goldman Sachs earned $2,544, in brokerage commissions from portfolio transactions, including futures transactions executed with Goldman Sachs as the Futures Commission Merchant, on behalf of the Fund, respectively.
The table below shows the transactions in and earnings from investments in the Underlying Funds for the six months ended June 30, 2017:
| Underlying Fund | Market Value 12/31/16 | Purchases at Cost | Proceeds from Sales | Market Value 6/30/17 | Dividend Income | |||||||||||||
Goldman Sachs Financial Square Government Fund — Institutional Shares | $41,747,857 | $ | 58,727,298 | $ | (80,462,739 | ) | $ | 20,012,416 | $ | 81,217 | ||||||||
As of June 30, 2017, The Goldman Sachs Group (“GSG”), Inc. was the beneficial owner of approximately 54% and 100% of Institutional and Class R Shares, respectively, of the Fund.
| 6. PORTFOLIO SECURITIES TRANSACTIONS |
The cost of purchases and proceeds from sales and maturities of long-term securities for the six months ended June 30, 2017 were $77,354,934 and $70,995,471, respectively.
30
GOLDMAN SACHS LONG SHORT FUND
| 7. TAX INFORMATION |
As of the Fund’s most recent fiscal year end, December 31, 2016, the Fund’s capital loss carryforwards and certain timing differences on a tax basis were as follows:
Capital loss carryforwards: | ||||
Perpetual Short-term | $ | (28,287,822 | ) | |
Perpetual Long-term | (4,701,964 | ) | ||
Total capital loss carryforwards | $ | (32,989,786 | ) | |
Timing differences (Post October Loss Deferral and Straddle Loss Deferral) | $ | (878,896 | ) |
As of June 30, 2017, the Fund’s aggregate security unrealized gains and losses based on cost for U.S. federal income tax purposes were as follows:
Tax Cost | $ | 61,848,605 | ||
Gross unrealized gain | 4,998,582 | |||
Gross unrealized loss | (3,612,417 | ) | ||
Net unrealized security gain | $ | 1,386,165 |
The difference between GAAP-basis and tax basis unrealized gains (losses) is attributable primarily to wash sales, net mark to market gains (losses) on regulated futures and options contracts, net mark to market on foreign currency contracts and differences in the treatment of swap transactions and underlying fund investments.
GSIS has reviewed the Fund’s tax positions for all open tax years (the current and prior three years, as applicable) and has concluded that no provision for income tax is required in the Fund’s financial statements. Such open tax years remain subject to examination and adjustment by tax authorities.
| 8. OTHER RISKS |
The Fund’s risks include, but are not limited to, the following:
Derivatives Risk — The Fund’s use of derivatives may result in loss. Derivative instruments, which may pose risks in addition to and greater than those associated with investing directly in securities, currencies or other instruments, may be illiquid or less liquid, volatile, difficult to price and leveraged so that small changes in the value of the underlying instruments may produce disproportionate losses to the Fund. Derivatives are also subject to counterparty risk, which is the risk that the other party in the transaction will not fulfill its contractual obligation. The use of derivatives is a highly specialized activity that involves investment techniques and risks different from those associated with investments in more traditional securities and instruments. Losses from derivatives can also result from a lack of correlation between changes in the value of derivative instruments and the portfolio assets (if any) being hedged.
Foreign and Emerging Countries Risk — Investing in foreign markets may involve special risks and considerations not typically associated with investing in the United States. Foreign securities may be subject to risk of loss because of more or less foreign government regulation, less public information and less economic, political and social stability in the countries in which the Fund invests. The imposition of exchange controls, confiscations, trade restrictions (including tariffs) and other government restrictions by the United States or other governments, or from problems in share registration, settlement or custody, may also result in losses. Foreign risk also involves the risk of negative foreign currency rate fluctuations, which may cause the value of securities denominated in such foreign currency (or other instruments through which the Fund has exposure to foreign currencies) to decline in value. Currency exchange rates may fluctuate significantly over short periods of time. To the extent that the Fund also invests in securities of issuers located in emerging markets, these risks may be more pronounced.
31
GOLDMAN SACHS LONG SHORT FUND
Notes to Financial Statements (continued)
June 30, 2017 (Unaudited)
| 8. OTHER RISKS (continued) |
Foreign Custody Risk — If the Fund invests in foreign securities, it may hold such securities and cash with foreign banks, agents, and securities depositories appointed by the Fund’s custodian (each a “Foreign Custodian”). Some foreign custodians may be recently organized or new to the foreign custody business. In some countries, Foreign Custodians may be subject to little or no regulatory oversight over, or independent evaluation of, their operations. Further, the laws of certain countries may place limitations on the Fund’s ability to recover its assets if a Foreign Custodian enters bankruptcy. Investments in emerging markets may be subject to even greater custody risks than investments in more developed markets. Custody services in emerging market countries are very often undeveloped and may be considerably less well regulated than in more developed countries, and thus may not afford the same level of investor protection as would apply in developed countries.
Geographic Risk — If the Fund focuses its investments in securities of issuers located in a particular country or geographic region, it will subject the Fund, to a greater extent than if its investments were less focused, to the risks of volatile economic cycles and/or conditions and developments that may be particular to that country or region, such as: adverse securities markets; adverse exchange rates; adverse social, political, regulatory, economic, business, environmental or other developments; or natural disasters.
Investments in Other Investment Companies — As a shareholder of another investment company, including an exchange-traded fund (“ETF”), the Fund will indirectly bear its proportionate share of any net management fees and other expenses paid by such other investment companies, in addition to the fees and expenses regularly borne by the Fund. ETFs are subject to risks that do not apply to conventional mutual funds, including but not limited to the following: (i) the market price of the ETF’s shares may trade at a premium or a discount to their NAV; and (ii) an active trading market for an ETF’s shares may not develop or be maintained.
Large Shareholder Transactions Risk — The Fund may experience adverse effects when certain large shareholders, such as other funds, institutional investors (including those trading by use of non-discretionary mathematical formulas), financial intermediaries (who may make investment decisions on behalf of underlying clients and/or include the Fund in their investment model), individuals, accounts and Goldman Sachs affiliates, purchase or redeem large amounts of shares of the Fund. Such large shareholder redemptions may cause the Fund to sell portfolio securities at times when it would not otherwise do so, which may negatively impact the Fund’s NAV and liquidity. These transactions may also accelerate the realization of taxable income to shareholders if such sales of investments resulted in gains, and may also increase transaction costs. In addition, a large redemption could result in the Fund’s current expenses being allocated over a smaller asset base, leading to an increase in the Fund’s expense ratio. Similarly, large Fund share purchases may adversely affect the Fund’s performance to the extent that the Fund is delayed in investing new cash and is required to maintain a larger cash position than it ordinarily would.
Leverage Risk — Leverage creates exposure to potential gains and losses in excess of the initial amount invested. Borrowing and the use of derivatives may result in leverage and may make the Fund more volatile. When the Fund uses leverage, the sum of that Fund’s investment exposure may significantly exceed the amount of assets invested in the Fund, although these exposures may vary over time. Relatively small market movements may result in large changes in the value of a leveraged investment. The Fund will identify liquid assets on its books or otherwise cover transactions that may give rise to such risk, to the extent required by applicable law. The use of leverage may cause the Fund to liquidate portfolio positions to satisfy its obligations or to meet segregation requirements when it may not be advantageous to do so. The use of leverage by the Fund can substantially increase the adverse impact to which the Fund’s investment portfolio may be subject.
Liquidity Risk — The Fund may make investments that are illiquid or that may become less liquid in response to market developments or adverse investor perceptions. Illiquid investments may be more difficult to value. Liquidity risk may also refer to the risk that the Fund will not be able to pay redemption proceeds within the allowable time period because of unusual market conditions, an unusually high volume of redemption requests, or other reasons. To meet redemption requests, the Fund may be forced to sell investments at an unfavorable time and/or under unfavorable conditions.
32
GOLDMAN SACHS LONG SHORT FUND
| 8. OTHER RISKS (continued) |
Market and Credit Risks — In the normal course of business, the Fund trades financial instruments and enters into financial transactions where risk of potential loss exists due to changes in the market (market risk). Additionally, the Fund may also be exposed to credit risk in the event that an issuer or guarantor fails to perform or that an institution or entity with which the Fund has unsettled or open transactions defaults.
Non-Diversification Risk — The Fund is non-diversified, meaning that it is permitted to invest a larger percentage of its assets in fewer issuers than diversified mutual funds. Thus, the Fund may be more susceptible to adverse developments affecting any single issuer held in its portfolio, and may be more susceptible to greater losses because of these developments.
Sector Risk — To the extent the Fund focuses its investments in securities of issuers in one or more sectors (such as the financial services or telecommunications sectors), the Fund will be subject, to a greater extent than if its investments were diversified across different sectors, to the risks of volatile economic cycles and/or conditions and developments that may be particular to that sector, such as: adverse economic, business, political, environmental or other developments.
Short Position Risk — The Fund may enter into a short position through a futures contract, an option or swap agreement or through short sales of any instrument that the Fund may purchase for investment. Taking short positions involves leverage of a Fund’s assets and presents various risks, including counterparty risk. If the value of the underlying instrument or market in which the Fund has taken a short position increases, then the Fund will incur a loss equal to the increase in value from the time that the short position was entered into plus any related interest payments or other fees. Taking short positions involves the risk that losses may be disproportionate, may exceed the amount invested, and may be unlimited.
| 9. INDEMNIFICATIONS |
Under the Trust’s organizational documents, its Trustees, officers, employees and agents are indemnified, to the extent permitted by the Act and state law, against certain liabilities that may arise out of performance of their duties to the Fund. Additionally, in the course of business, the Fund enters into contracts that contain a variety of indemnification clauses. The Fund’s maximum exposure under these arrangements is unknown, as this would involve future claims that may be made against the Fund that have not yet occurred. However, GSIS believes the risk of loss under these arrangements to be remote.
| 10. SUBSEQUENT EVENTS |
Subsequent events after the Statement of Assets and Liabilities date have been evaluated and GSIS has concluded that there is no impact requiring adjustment or disclosure in the financial statements.
33
GOLDMAN SACHS LONG SHORT FUND
Notes to Financial Statements (continued)
June 30, 2017 (Unaudited)
| 11. SUMMARY OF SHARE TRANSACTIONS |
Share activity is as follows:
| For the Six Months Ended June 30, 2017 (Unaudited) | For the Fiscal Year Ended December 31, 2016 | |||||||||||||||
| Shares | Dollars | Shares | Dollars | |||||||||||||
|
| |||||||||||||||
| Class A Shares | ||||||||||||||||
Shares sold | 10,019 | $ | 87,305 | 367,388 | $ | 3,200,184 | ||||||||||
Shares redeemed | (394,548 | ) | (3,416,022 | ) | (1,903,802 | ) | (16,166,775 | ) | ||||||||
| (384,529 | ) | (3,328,717 | ) | (1,536,414 | ) | (12,966,591 | ) | |||||||||
| Class C Shares | ||||||||||||||||
Shares sold | 35,145 | 300,404 | 112,534 | 981,495 | ||||||||||||
Shares redeemed | (146,711 | ) | (1,250,286 | ) | (339,410 | ) | (2,868,775 | ) | ||||||||
| (111,566 | ) | (949,882 | ) | (226,876 | ) | (1,887,280 | ) | |||||||||
| Institutional Shares | ||||||||||||||||
Shares sold | 450,318 | 3,930,475 | 1,727,293 | 15,130,395 | ||||||||||||
Shares redeemed | (831,610 | ) | (7,273,021 | ) | (10,342,887 | ) | (88,298,881 | ) | ||||||||
| (381,292 | ) | (3,342,546 | ) | (8,615,594 | ) | (73,168,486 | ) | |||||||||
| Class IR Shares | ||||||||||||||||
Shares sold | 99,071 | 866,123 | 741,054 | 6,687,593 | ||||||||||||
Shares redeemed | (109,819 | ) | (962,733 | ) | (1,518,302 | ) | (12,983,982 | ) | ||||||||
| (10,748 | ) | (96,610 | ) | (777,248 | ) | (6,296,389 | ) | |||||||||
| Class R Shares | ||||||||||||||||
Shares sold | — | — | — | — | ||||||||||||
Shares redeemed | — | — | — | — | ||||||||||||
| — | — | — | — | |||||||||||||
NET DECREASE | (888,135 | ) | $ | (7,717,755 | ) | (11,156,132 | ) | $ | (94,318,746 | ) | ||||||
34
GOLDMAN SACHS LONG SHORT FUND
Fund Expenses — Six Month Period Ended June 30, 2017 (Unaudited) |
As a shareholder of Class A, Class C, Institutional, Class IR, and Class R Shares of the Fund, you incur two types of costs: (1) transaction costs, including sales charges on purchase payments (with respect to Class A Shares), contingent deferred sales charges on redemptions (with respect to Class C Shares), and (2) ongoing costs, including management fees; distribution and service (12b-1) fees (with respect to Class A, Class C and Class R Shares); and other Fund expenses. This Example is intended to help you understand your ongoing costs (in dollars) of investing in Class A, Class C, Institutional, Class IR, and Class R Shares of the Fund and to compare these costs with the ongoing costs of investing in other mutual funds.
The Example is based on an investment of $1,000 invested at the beginning of the period and held for the entire period from January 1, 2017 through June 30, 2016, which represents a period of 181 days in a 365 day year.
Actual Expenses — The first line under each share class in the table below provides information about actual account values and actual expenses. You may use the information in this line, together with the amount you invested, to estimate the expenses that you paid over the period. Simply divide your account value by $1,000 (for example, an $8,600 account value divided by $1,000=8.6), then multiply the result by the number in the first line under the heading entitled “Expenses Paid” to estimate the expenses you paid on your account during this period.
Hypothetical Example for Comparison Purposes — The second line under each share class in the table below provides information about hypothetical account values and hypothetical expenses based on the Fund’s actual net expense ratios and an assumed rate of return of 5% per year before expenses, which is not the Fund’s actual return. The hypothetical account values and expenses may not be used to estimate the actual ending account balance or expenses you paid for the period. You may use this information to compare the ongoing costs of investing in the Fund and other funds. To do so, compare this 5% hypothetical example with the 5% hypothetical examples that appear in the shareholder reports of the other funds.
Please note that the expenses shown in the table are meant to highlight your ongoing costs only and do not reflect any transactional costs, such as sales charges, redemption fees, or exchange fees. Therefore, the second line of the table is useful in comparing ongoing costs only, and will not help you determine the relative total costs of owning different funds. In addition, if these transactional costs were included, your costs would have been higher.
| Long Short Fund | ||||||||||||
| Share Class | Beginning Account Value 1/1/17 | Ending Account Value 6/30/17 | Expenses Paid for the 6 months ended 6/30/17* | |||||||||
| Class A | ||||||||||||
Actual | $ | 1,000.00 | $ | 991.90 | $ | 16.50 | ||||||
Hypothetical 5% return | 1,000.00 | 1,008.23 | + | 16.63 | ||||||||
| Class C | ||||||||||||
Actual | 1,000.00 | 988.20 | 20.26 | |||||||||
Hypothetical 5% return | 1,000.00 | 1,004.41 | + | 20.43 | ||||||||
| Institutional | ||||||||||||
Actual | 1,000.00 | 993.10 | 14.73 | |||||||||
Hypothetical 5% return | 1,000.00 | 1,010.02 | + | 14.85 | ||||||||
| Class IR | ||||||||||||
Actual | 1,000.00 | 993.00 | 15.57 | |||||||||
Hypothetical 5% return | 1,000.00 | 1,009.17 | + | 15.69 | ||||||||
| Class R | ||||||||||||
Actual | 1,000.00 | 990.60 | 17.97 | |||||||||
Hypothetical 5% return | 1,000.00 | 1,006.74 | + | 18.11 | ||||||||
| * | Expenses for each share class are calculated using the Fund’s annualized net expense ratio for each class, which represents the ongoing expenses as a percentage of net assets for the six months ended June 30, 2017. Expenses are calculated by multiplying the annualized net expense ratio by the average account value for the period; then multiplying the result by the number of days in the most recent fiscal half year; and then dividing that result by the number of days in the fiscal year. The annualized net expense ratios for the period were as follows: |
| + | Hypothetical expenses are based on each Fund’s actual annualized net expense ratios and an assumed rate of return of 5% per year before expenses. |
| Fund | Class A | Class C | Institutional | Class IR | Class R | |||||||||||||||
Long Short Fund+ | 3.34 | % | 4.11 | % | 2.98 | % | 3.15 | % | 3.64 | % | ||||||||||
| + | Hypothetical expenses are based on the Fund’s actual annualized net expense ratios and an assumed rate of return of 5% per year before expenses. |
35
GOLDMAN SACHS LONG SHORT FUND
Statement Regarding Basis for Approval of Management Agreement (Unaudited)
Background
The Goldman Sachs Long Short Fund (the “Fund”) is an investment portfolio of Goldman Sachs Trust (the “Trust”). The Board of Trustees oversees the management of the Trust and reviews the investment performance and expenses of the Fund at regularly scheduled meetings held throughout the year. In addition, the Board of Trustees determines annually whether to approve the continuance of the Trust’s investment management agreement (the “Management Agreement”) with GS Investment Strategies, LLC (the “Investment Adviser”) on behalf of the Fund.
The Management Agreement was most recently approved for continuation until June 30, 2018 by the Board of Trustees, including those Trustees who are not parties to the Management Agreement or “interested persons” (as defined in the Investment Company Act of 1940, as amended) of any party thereto (the “Independent Trustees”), at a meeting held on June 14-15, 2017 (the “Annual Meeting”).
The review process undertaken by the Trustees spans the course of the year and culminates with the Annual Meeting. To assist the Trustees in their deliberations, the Trustees have established a Contract Review Committee (the “Committee”), comprised of the Independent Trustees. The Committee held four meetings over the course of the year since the Management Agreement was last approved. At those Committee meetings, regularly scheduled Board or other committee meetings, and/or the Annual Meeting, matters relevant to the renewal of the Management Agreement were considered by the Board, or the Independent Trustees, as applicable. With respect to the Fund, such matters included:
| (a) | the nature and quality of the advisory, administrative, and other services provided to the Fund by the Investment Adviser and its affiliates, including information about: |
| (i) | the structure, staff, and capabilities of the Investment Adviser and its portfolio management teams; |
| (ii) | the groups within the Investment Adviser and its affiliates that support the portfolio management teams or provide other types of necessary services, including fund services groups (e.g., accounting and financial reporting, tax, shareholder services, and operations); controls and risk management groups (e.g., legal, compliance, valuation oversight, credit risk management, internal audit, compliance testing, market risk analysis, finance, and central funding); sales and distribution support groups, and others (e.g., information technology and training); |
| (iii) | trends in employee headcount; |
| (iv) | the Investment Adviser’s financial resources and ability to hire and retain talented personnel and strengthen its operations; and |
| (v) | the parent company’s support of the Investment Adviser and its mutual fund business, as expressed by the firm’s senior management; |
| (b) | information on the investment performance of the Fund, including comparisons to the performance of similar mutual funds, as provided by a third-party mutual fund data provider engaged as part of the contract review process (the “Outside Data Provider”), and a benchmark performance index; and information on general investment outlooks in the markets in which the Fund invests; |
| (c) | information provided by the Investment Adviser indicating the Investment Adviser’s views on whether the Fund’s peer group and/or benchmark index had high, medium, or low relevance given the Fund’s particular investment strategy; |
| (d) | the terms of the Management Agreement and other agreements with affiliated service providers entered into by the Trust on behalf of the Fund; |
| (e) | fee and expense information for the Fund, including: |
| (i) | the relative management fee and expense levels of the Fund as compared to those of comparable funds managed by other advisers, as provided by the Outside Data Provider; |
| (ii) | the Fund’s expense trends over time; and |
| (iii) | to the extent the Investment Adviser manages other types of accounts (such as bank collective trusts, private wealth management accounts, institutional separate accounts, sub-advised mutual funds, and non-U.S. funds) having investment objectives and policies similar to those of the Fund, comparative information on the advisory fees charged and services provided to those accounts by the Investment Adviser; |
36
GOLDMAN SACHS LONG SHORT FUND
Statement Regarding Basis for Approval of Management Agreement (Unaudited) (continued)
| (f) | with respect to the extensive investment performance and expense comparison data provided by the Outside Data Provider, its processes in producing that data for the Fund; |
| (g) | the undertakings of the Investment Adviser and its affiliates to implement fee waivers and/or expense limitations; |
| (h) | information relating to the profitability of the Management Agreement and the transfer agency and distribution and service arrangements of the Fund to the Investment Adviser and its affiliates; |
| (i) | whether the Fund’s existing management fee schedule adequately addressed any economies of scale; |
| (j) | a summary of the “fall-out” benefits derived by the Investment Adviser and its affiliates from their relationships with the Fund, including the fees received by the Investment Adviser’s affiliates from the Fund for transfer agency, portfolio trading, distribution and other services; |
| (k) | a summary of potential benefits derived by the Fund as a result of its relationship with the Investment Adviser; |
| (l) | information regarding commissions paid by the Fund and broker oversight, an update on the Investment Adviser’s soft dollars practices, other information regarding portfolio trading, and how the Investment Adviser carries out its duty to seek best execution; |
| (m) | portfolio manager ownership of Fund shares; the manner in which portfolio manager compensation is determined; and the number and types of accounts managed by the portfolio managers; |
| (n) | the nature and quality of the services provided to the Fund by its unaffiliated service providers, and the Investment Adviser’s general oversight and evaluation (including reports on due diligence) of those service providers as part of the administrative services provided under the Management Agreement; and |
| (o) | the Investment Adviser’s processes and policies addressing various types of potential conflicts of interest; its approach to risk management; the annual review of the effectiveness of the Fund’s compliance program; and periodic compliance reports. |
The Trustees also received an overview of the Fund’s distribution arrangements. They received information regarding the Fund’s assets, share purchase and redemption activity, and payment of distribution and service fees. Information was also provided to the Trustees relating to revenue sharing payments made by and services provided by the Investment Adviser and its affiliates to intermediaries that promote the sale, distribution, and/or servicing of Fund shares. The Independent Trustees also discussed the broad range of other investment choices that are available to Fund investors, including the availability of comparable funds managed by other advisers.
The presentations made at the Board and Committee meetings and at the Annual Meeting encompassed the Fund and other mutual funds for which the Board of Trustees has responsibility. In evaluating the Management Agreement at the Annual Meeting, the Trustees relied upon their knowledge, resulting from their meetings and other interactions throughout the year, of the Investment Adviser and its affiliates, their services, and the Fund. In conjunction with these meetings, the Trustees received written materials and oral presentations on the topics covered, and the Investment Adviser addressed the questions and concerns of the Trustees, including concerns regarding the investment performance of certain of the funds they oversee. The Independent Trustees were advised by their independent legal counsel regarding their responsibilities and other regulatory requirements related to the approval and continuation of mutual fund investment management agreements under applicable law. In addition, the Investment Adviser and its affiliates provided the Independent Trustees with a written response to a formal request for information sent on behalf of the Independent Trustees by their independent legal counsel. During the course of their deliberations, the Independent Trustees met in executive sessions with their independent legal counsel, without representatives of the Investment Adviser or its affiliates present.
Nature, Extent, and Quality of the Services Provided Under the Management Agreement
As part of their review, the Trustees considered the nature, extent, and quality of the services provided to the Fund by the Investment Adviser. In this regard, the Trustees considered both the investment advisory services and non-advisory services that are provided by the Investment Adviser and its affiliates. The Trustees noted the transition in the leadership and changes in personnel of various of the Investment Adviser’s portfolio management teams that had occurred in recent periods, and the ongoing recruitment efforts aimed at bringing high quality investment talent to the Investment Adviser. They also noted the Investment Adviser’s commitment to maintaining high quality systems and expending substantial resources to respond to ongoing changes to
37
GOLDMAN SACHS LONG SHORT FUND
Statement Regarding Basis for Approval of Management Agreement (Unaudited) (continued)
the regulatory and control environment in which the Fund and its service providers operate, as well as the efforts of the Investment Adviser and its affiliates to combat cyber security risks. The Trustees concluded that the Investment Adviser continued to commit substantial financial and operational resources to the Fund and expressed confidence that the Investment Adviser would continue to do so in the future. The Trustees also recognized that the Investment Adviser had made significant commitments to address regulatory compliance requirements applicable to the Fund and the Investment Adviser and its affiliates.
Investment Performance
The Trustees also considered the investment performance of the Fund. In this regard, they compared the investment performance of the Fund to its peers using rankings compiled by the Outside Data Provider as of December 31, 2016, and updated performance information prepared by the Investment Adviser using the peer group identified by the Outside Data Provider as of March 31, 2017. The information on the Fund’s investment performance was provided for the one-year period ending on the applicable dates. The Trustees also reviewed the Fund’s investment performance relative to its performance benchmark. As part of this review, they considered the investment performance trends of the Fund over time, and reviewed the investment performance of the Fund in light of its investment objective and policies and market conditions.
In addition, the Trustees considered materials prepared and presentations made by the Investment Adviser’s senior management and portfolio management personnel in which Fund performance was assessed. The Trustees also considered the Investment Adviser’s periodic reports with respect to the Fund’s risk profile, and how the Investment Adviser’s approach to risk monitoring and management influences portfolio management.
The Trustees observed that the Long Short Fund’s Institutional Shares had placed in the fourth quartile of the Fund’s peer group, had outperformed the Fund’s benchmark index, and had underperformed the average performance of a group of competitor funds, as determined by the Investment Adviser, for the one-year period ended March 31, 2017.
Costs of Services Provided and Competitive Information
The Trustees considered the contractual terms of the Management Agreement and the fee rates payable by the Fund thereunder. In this regard, the Trustees considered information on the services rendered by the Investment Adviser to the Fund, which included both advisory and administrative services that were directed to the needs and operations of the Fund as a registered mutual fund.
In particular, the Trustees reviewed analyses prepared by the Outside Data Provider regarding the expense rankings of the Fund. The analyses provided a comparison of the Fund’s management fee and breakpoints to those of a relevant peer group and category universe; an expense analysis which compared the Fund’s overall net and gross expenses to a peer group and a category universe; and data comparing the Fund’s net expenses to the peer and category medians. The analyses also compared the Fund’s transfer agency, custody, and distribution fees, other expenses and fee waivers/reimbursements to those of the peer group and category medians. The Trustees concluded that the comparisons provided by the Outside Data Provider were useful in evaluating the reasonableness of the management fees and total expenses paid by the Fund.
In addition, the Trustees considered the Investment Adviser’s undertakings to implement fee waivers and/or expense limitations. They also considered, to the extent that the Investment Adviser manages other types of accounts having investment objectives and policies similar to those of the Fund, comparative fee information for services provided by the Investment Adviser to those accounts, and information that indicated that services provided to the Fund differed in various significant respects from the services provided to other types of accounts which, in many cases, operated under less stringent legal and regulatory structures, required fewer services from the Investment Adviser to a smaller number of client contact points, and were less time-intensive.
In addition, the Trustees noted that shareholders are able to redeem their Fund shares at any time if shareholders believe that the Fund fees and expenses are too high or if they are dissatisfied with the performance of the Fund.
Profitability
The Trustees reviewed the Fund’s contribution to the Investment Adviser’s revenues and pre-tax profit margins. In this regard the Trustees noted that they had received, among other things, profitability analyses and summaries, revenue and expense schedules by Fund and by function (i.e., investment management, transfer agency and distribution and service), and information on the Investment Adviser’s expense allocation methodology. They observed that the profitability and expense figures are substantially similar to those used by the Investment Adviser for many internal purposes, including compensation decisions among various business groups, and are thus subject to a vigorous internal debate about how certain revenue and expenses should be
38
GOLDMAN SACHS LONG SHORT FUND
Statement Regarding Basis for Approval of Management Agreement (Unaudited) (continued)
allocated. The Trustees also noted that the internal audit group within the Goldman Sachs organization had audited the expense allocation methodology and that the internal audit group was satisfied with the reasonableness, consistency, and accuracy of the Investment Adviser’s expense allocation methodology and profitability analysis calculations. Profitability data for the Fund were provided for 2016 and 2015, and the Trustees considered this information in relation to the Investment Adviser’s overall profitability.
Economies of Scale
The Trustees considered the information that had been provided regarding the Investment Adviser’s profitability. The Trustees also considered the breakpoints in the fee rate payable under the Management Agreement for the Fund at the following annual percentage rates of the average daily net assets of the Fund:
First $2 billion | 1.60 | % | ||
Next $3 billion | 1.44 | |||
Next $3 billion | 1.37 | |||
Over $8 billion | 1.34 |
The Trustees noted that the breakpoints were designed to share potential economies of scale, if any, with the Fund and its shareholders as assets under management reach those asset levels. The Trustees considered the amount of assets in the Fund; the Fund’s recent share purchase and redemption activity; the information provided by the Investment Adviser relating to the costs of the services provided by the Investment Adviser and its affiliates and their realized profits; information comparing fee rates charged by the Investment Adviser with fee rates charged to other funds in the peer group; and the Investment Adviser’s undertakings to waive a portion of its management fee and to limit certain expenses of the Fund that exceed a specified level. Upon reviewing these matters at the Annual Meeting, the Trustees concluded that the fee breakpoints represented a means of assuring that benefits of scalability, if any, would be passed along to shareholders at the specified asset levels.
Other Benefits to the Investment Adviser and Its Affiliates
The Trustees also considered the other benefits derived by the Investment Adviser and its affiliates from their relationships with the Fund as stated above, including: (a) transfer agency fees received by Goldman Sachs & Co. LLC (“Goldman Sachs”); (b) brokerage and futures commissions earned by Goldman Sachs for executing securities and futures transactions on behalf of the Fund; (c) research received by the Investment Adviser from broker-dealers in exchange for executing certain transactions on behalf of the Fund; (d) trading efficiencies resulting from aggregation of orders of the Fund with those for other funds or accounts managed by the Investment Adviser; (e) the Investment Adviser’s ability to leverage the infrastructure designed to service the Fund on behalf of its other clients; (f) the Investment Adviser’s ability to cross-market other products and services to Fund shareholders; (g) Goldman Sachs’ retention of certain fees as Fund Distributor; (h) the Investment Adviser’s ability to negotiate better pricing with custodians on behalf of its other clients, as a result of the relationship with the Fund; and (i) the possibility that the working relationship between the Investment Adviser and the Fund’s third-party service providers may cause those service providers to be more likely to do business with other areas of Goldman Sachs. In the course of considering the foregoing, the Independent Trustees requested and received further information quantifying certain of these fall-out benefits.
Other Benefits to the Fund and Its Shareholders
The Trustees also noted that the Fund receives certain potential benefits as a result of its relationship with the Investment Adviser, including: (a) trading efficiencies resulting from aggregation of orders of the Fund with those of other funds or accounts managed by the Investment Adviser; (b) enhanced servicing from vendors because of the volume of business generated by the Investment Adviser and its affiliates; (c) enhanced servicing from broker-dealers because of the volume of business generated by the Investment Adviser and its affiliates; (d) the Investment Adviser’s ability to negotiate favorable terms with derivatives counterparties on behalf of the Fund as a result of the size and reputation of the Goldman Sachs organization; (e) the Investment Adviser’s knowledge and experience gained from managing other accounts and products; (f) the Investment Adviser’s ability to hire and retain qualified personnel to provide services to the Fund because of the reputation of the Goldman Sachs organization; (g) the Fund’s access, through the Investment Adviser, to certain firmwide resources (e.g., proprietary risk management systems and databases), subject to certain restrictions; and (h) the Fund’s access to certain affiliated distribution channels. In addition, the Trustees noted the competitive nature of the mutual fund marketplace, and considered that many of the Fund’s shareholders invested in the Fund in part because of the Fund’s relationship with the Investment Adviser and that those shareholders have a general expectation that the relationship will continue.
39
Conclusion
In connection with their consideration of the Management Agreement, the Trustees gave weight to each of the factors described above, but did not identify any particular factor as controlling their decision. After deliberation and consideration of all of the information provided, including the factors described above, the Trustees concluded, in the exercise of their business judgment, that the management fees paid by the Fund were reasonable in light of the services provided to it by the Investment Adviser, the Investment Adviser’s costs and the Fund’s current and reasonably foreseeable asset levels. The Trustees unanimously concluded that the Investment Adviser’s continued management likely would benefit the Fund and its shareholders and that the Management Agreement should be approved and continued with respect to the Fund until June 30, 2018.
40
FUNDS PROFILE
Goldman Sachs Funds
Goldman Sachs is a premier financial services firm, known since 1869 for creating thoughtful and customized investment solutions in complex global markets.
Today, the Investment Management Division of Goldman Sachs serves a diverse set of clients worldwide, including private institutions, public entities and individuals. With approximately $1.21 trillion in assets under supervision as of June 30, 2017, Goldman Sachs Asset Management (“GSAM”) has portfolio management teams located around the world and our investment professionals bring firsthand knowledge of local markets to every investment decision. Assets under supervision includes assets under management and other client assets for which Goldman Sachs does not have full discretion. GSAM leverages the resources of Goldman Sachs & Co. LLC subject to legal, internal and regulatory restrictions.
Money Market
Financial Square FundsSM
| ∎ | Financial Square Treasury Solutions Fund1 |
| ∎ | Financial Square Government Fund1 |
| ∎ | Financial Square Money Market Fund2 |
| ∎ | Financial Square Prime Obligations Fund2 |
| ∎ | Financial Square Treasury Instruments Fund1 |
| ∎ | Financial Square Treasury Obligations Fund1 |
| ∎ | Financial Square Federal Instruments Fund1 |
| ∎ | Financial Square Tax-Exempt Money Market Fund2 |
| ∎ | Investor FundsSM |
| ∎ | Investor Money Market Fund3 |
| ∎ | Investor Tax-Exempt Money Market Fund3 |
Fixed Income
Short Duration and Government
| ∎ | Enhanced Income Fund |
| ∎ | High Quality Floating Rate Fund |
| ∎ | Short-Term Conservative Income Fund |
| ∎ | Short Duration Government Fund |
| ∎ | Short Duration Income Fund |
| ∎ | Government Income Fund |
| ∎ | Inflation Protected Securities Fund |
Multi-Sector
| ∎ | Bond Fund |
| ∎ | Core Fixed Income Fund |
| ∎ | Global Income Fund |
| ∎ | Strategic Income Fund |
Municipal and Tax-Free
| ∎ | High Yield Municipal Fund |
| ∎ | Dynamic Municipal Income Fund |
| ∎ | Short Duration Tax-Free Fund |
Single Sector
| ∎ | Investment Grade Credit Fund |
| ∎ | U.S. Mortgages Fund |
| ∎ | High Yield Fund |
| ∎ | High Yield Floating Rate Fund |
| ∎ | Emerging Markets Debt Fund |
| ∎ | Local Emerging Markets Debt Fund |
| ∎ | Dynamic Emerging Markets Debt Fund |
Fixed Income Alternatives
| ∎ | Long Short Credit Strategies Fund |
| ∎ | Strategic Macro Fund4 |
Fundamental Equity
| ∎ | Equity Income Fund5 |
| ∎ | Small Cap Value Fund |
| ∎ | Small/Mid Cap Value Fund |
| ∎ | Mid Cap Value Fund |
| ∎ | Large Cap Value Fund |
| ∎ | Focused Value Fund |
| ∎ | Capital Growth Fund |
| ∎ | Strategic Growth Fund |
| ∎ | Small/Mid Cap Growth Fund |
| ∎ | Flexible Cap Fund6 |
| ∎ | Concentrated Growth Fund7 |
| ∎ | Technology Opportunities Fund |
| ∎ | Growth Opportunities Fund |
| ∎ | Rising Dividend Growth Fund |
| ∎ | Dynamic U.S. Equity Fund |
| ∎ | Income Builder Fund |
Tax-Advantaged Equity
| ∎ | U.S. Tax-Managed Equity Fund |
| ∎ | International Tax-Managed Equity Fund |
| ∎ | U.S. Equity Dividend and Premium Fund |
| ∎ | International Equity Dividend and Premium Fund |
Equity Insights
| ∎ | Small Cap Equity Insights Fund |
| ∎ | U.S. Equity Insights Fund |
| ∎ | Small Cap Growth Insights Fund |
| ∎ | Large Cap Growth Insights Fund |
| ∎ | Large Cap Value Insights Fund |
| ∎ | Small Cap Value Insights Fund |
| ∎ | International Small Cap Insights Fund |
| ∎ | International Equity Insights Fund |
| ∎ | Emerging Markets Equity Insights Fund |
Fundamental Equity International
| ∎ | Strategic International Equity Fund |
| ∎ | Focused International Equity Fund |
| ∎ | Asia Equity Fund |
| ∎ | Emerging Markets Equity Fund |
| ∎ | N-11 Equity Fund |
Select Satellite
| ∎ | Real Estate Securities Fund |
| ∎ | International Real Estate Securities Fund |
| ∎ | Commodity Strategy Fund |
| ∎ | Global Real Estate Securities Fund |
| ∎ | Dynamic Allocation Fund |
| ∎ | Absolute Return Tracker Fund |
| ∎ | Long Short Fund |
| ∎ | Managed Futures Strategy Fund |
| ∎ | MLP Energy Infrastructure Fund |
| ∎ | Multi-Manager Alternatives Fund |
| ∎ | Absolute Return Multi-Asset Fund |
| ∎ | Global Infrastructure Fund |
Total Portfolio Solutions
| ∎ | Global Managed Beta Fund |
| ∎ | Multi-Manager Non-Core Fixed Income Fund |
| ∎ | Multi-Manager U.S. Dynamic Equity Fund |
| ∎ | Multi-Manager Global Equity Fund |
| ∎ | Multi-Manager International Equity Fund |
| ∎ | Tactical Tilt Overlay Fund |
| ∎ | Balanced Strategy Portfolio |
| ∎ | Multi-Manager U.S. Small Cap Equity Fund |
| ∎ | Multi-Manager Real Assets Strategy Fund |
| ∎ | Growth and Income Strategy Portfolio |
| ∎ | Growth Strategy Portfolio |
| ∎ | Equity Growth Strategy Portfolio |
| ∎ | Satellite Strategies Portfolio |
| ∎ | Enhanced Dividend Global Equity Portfolio |
| ∎ | Tax-Advantaged Global Equity Portfolio |
| ∎ | Strategic Factor Allocation Fund |
| ∎ | Target Date 2020 Portfolio |
| ∎ | Target Date 2025 Portfolio |
| ∎ | Target Date 2030 Portfolio |
| ∎ | Target Date 2035 Portfolio |
| ∎ | Target Date 2040 Portfolio |
| ∎ | Target Date 2045 Portfolio |
| ∎ | Target Date 2050 Portfolio |
| ∎ | Target Date 2055 Portfolio |
| ∎ | GQG Partners International Opportunities Fund |
| 1 | You could lose money by investing in the Fund. Although the Fund seeks to preserve the value of your investment at $1.00 per share, it cannot guarantee it will do so. An investment in the Fund is not a deposit of a bank and is not insured or guaranteed by the Federal Deposit Insurance Corporation or any other government agency. The Fund’s sponsor has no legal obligation to provide financial support to the Fund, and you should not expect that the sponsor will provide financial support to the Fund at any time. |
| 2 | You could lose money by investing in the Fund. Because the share price of the Fund will fluctuate, when you sell your shares they may be worth more or less than what you originally paid for them. The Fund may impose a fee upon sale of your shares or may temporarily suspend your ability to sell shares if the Fund’s liquidity falls below required minimums because of market conditions or other factors. An investment in the Fund is not a deposit of a bank and is not insured or guaranteed by the Federal Deposit Insurance Corporation or any other government agency. The Fund’s sponsor has no legal obligation to provide financial support to the Fund, and you should not expect that the sponsor will provide financial support to the Fund at any time. |
| 3 | You could lose money by investing in the Fund. Although the Fund seeks to preserve the value of your investment at $1.00 per share, it cannot guarantee it will do so. The Fund may impose a fee upon sale of your shares or may temporarily suspend your ability to sell shares if the Fund’s liquidity falls below required minimums because of market conditions or other factors. An investment in the Fund is not a deposit of a bank and is not insured or guaranteed by the Federal Deposit Insurance Corporation or any other government agency. The Fund’s sponsor has no legal obligation to provide financial support to the Fund, and you should not expect that the sponsor will provide financial support to the Fund at any time. |
| 4 | Effective on June 20, 2017, the Goldman Sachs Fixed Income Macro Strategies Fund was renamed the Goldman Sachs Strategic Macro Fund. |
| 5 | Effective on June 20, 2017, the Goldman Sachs Growth and Income Fund was renamed the Goldman Sachs Equity Income Fund. |
| 6 | Effective on August 31, 2017, the Goldman Sachs Flexible Cap Growth Fund was renamed the Goldman Sachs Flexible Cap Fund. |
| 7 | Effective on July 28, 2017, the Goldman Sachs Focused Growth Fund was reorganized with and into the Goldman Sachs Concentrated Growth Fund. Financial Square FundsSM and Investor FundsSM are registered service marks of Goldman Sachs & Co. LLC. |
| * | This list covers open-end funds only. Please visit our website at www.GSAMFUNDS.com to learn about our closed-end funds and exchange-traded funds. |
TRUSTEES Ashok N. Bakhru, Chairman Kathryn A. Cassidy Diana M. Daniels Herbert J. Markley James A. McNamara Jessica Palmer Roy W. Templin Gregory G. Weaver | OFFICERS James A. McNamara, President Scott M. McHugh, Treasurer, Senior Vice President and Principal Financial Officer Joseph F. DiMaria, Assistant Treasurer and Principal Accounting Officer Caroline Kraus, Secretary | |
GOLDMAN SACHS & CO. LLC Distributor and Transfer Agent | GS INVESTMENT STRATEGIES, LLC Investment Adviser | |
Visit our web site at www.GSAMFUNDS.com to obtain the most recent month-end returns.
Goldman Sachs Asset Management, L.P., 200 West Street, New York, New York 10282
The reports concerning the Fund included in this shareholder report may contain certain forward-looking statements about the factors that may affect the performance of the Fund in the future. These statements are based on Fund management’s predictions and expectations concerning certain future events and their expected impact on the Fund, such as performance of the economy as a whole and of specific industry sectors, changes in the levels of interest rates, the impact of developing world events, and other factors that may influence the future performance of the Fund. Management believes these forward-looking statements to be reasonable, although they are inherently uncertain and difficult to predict. Actual events may cause adjustments in portfolio management strategies from those currently expected to be employed.
A description of the policies and procedures that the Fund uses to determine how to vote proxies relating to portfolio securities and information regarding how the Fund voted proxies relating to portfolio securities for the most recent 12-month period ended June 30, are available (I) without charge, upon request by calling 1-800-526-7384; and (II) on the Securities and Exchange Commission (“SEC’’) web site at http://www.sec.gov.
The Fund files its complete schedule of portfolio holdings with the SEC for the first and third quarters of each fiscal year on Forms N-Q. The Fund’s Forms N-Q are available on the SEC’s web site at http://www.sec.gov within 60 days after the Fund’s first and third fiscal quarters. The Fund’s Forms N-Q may be reviewed and copied at the SEC’s Public Reference Room in Washington, D.C. and information on the operation of the Public Reference Room may also be obtained by calling 1-800-SEC-0330. Forms N-Q may be obtained upon request and without charge by calling 1-800-526-7384 (for Retail Shareholders) or 1-800-621-2550 (for Institutional Shareholders).
Fund holdings and allocations shown are as of June 30, 2017 and may not be representative of future investments. Fund holdings should not be relied on in making investment decisions and should not be construed as research or investment advice regarding particular securities. Current and future holdings are subject to risk.
The Global Industry Classification Standard (GICS) was developed by and is the exclusive property and a service mark of Morgan Stanley Capital International Inc. (MSCI) and Standard & Poor’s, a division of The McGraw-Hill Companies, Inc. (S&P) and is licensed for use by Goldman Sachs. Neither MSCI, S&P nor any other party involved in making or compiling the GICS or any GICS classifications makes any express or implied warranties or representations with respect to such standard or classification (or the results to be obtained by the use thereof), and all such parties hereby expressly disclaim all warranties of originality, accuracy, completeness, merchantability or fitness for a particular purpose with respect to any of such standard or classification. Without limiting any of the foregoing, in no event shall MSCI, S&P, any of their affiliates or any third party involved in making or compiling the GICS or any GICS classifications have any liability for any direct, indirect, special, punitive, consequential or any other damages (including lost profits) even if notified of the possibility of such damages.
Goldman Sachs does not provide legal, tax or accounting advice to its clients. All investors are strongly urged to consult with their legal, tax, or accounting advisors regarding any potential transactions or investments. There is no assurance that the tax status or treatment of a proposed transaction or investment will continue in the future. Tax treatment or status may be changed by law or government action in the future or on a retroactive basis.
Economic and market forecasts presented herein reflect our judgment as of the date of this presentation and are subject to change without notice. These forecasts do not take into account the specific investment objectives, restrictions, tax and financial situation or other needs of any specific client. Actual data will vary and may not be reflected here. These forecasts are subject to high levels of uncertainty that may affect actual performance. Accordingly, these forecasts should be viewed as merely representative of a broad range of possible outcomes. These forecasts are estimated, based on assumptions, and are subject to significant revision and may change materially as economic and market conditions change. Goldman Sachs has no obligation to provide updates or changes to these forecasts. Case studies and examples are for illustrative purposes only.
The portfolio risk management process includes an effort to monitor and manage risk, but does not imply low risk.
THIS MATERIAL IS FOR INFORMATIONAL PURPOSES ONLY AND IS PROVIDED SOLELY ON THE BASIS THAT IT WILL NOT CONSTITUTE INVESTMENT OR OTHER ADVICE OR A RECOMMENDATION RELATING TO ANY PERSON’S OR PLAN’S INVESTMENT OR OTHER DECISIONS, AND GOLDMAN SACHS IS NOT A FIDUCIARY OR ADVISOR WITH RESPECT TO ANY PERSON OR PLAN BY REASON OF PROVIDING THE MATERIAL OR CONTENT HEREIN INCLUDING UNDER THE EMPLOYEE RETIREMENT INCOME SECURITY ACT OF 1974 OR DEPARTMENT OF LABOR REGULATIONS. PLAN SPONSORS AND OTHER FIDUCIARIES SHOULD CONSIDER THEIR OWN CIRCUMSTANCES IN ASSESSING ANY POTENTIAL COURSE OF ACTION.
This material is not authorized for distribution to prospective investors unless preceded or accompanied by a current prospectus or summary prospectus, if applicable. Investors should consider the Fund’s objective, risks, and charges and expenses, and read the summary prospectus, if available, and/or the prospectus carefully before investing or sending money. The summary prospectus, if available, and the prospectus contain this and other information about the Fund and may be obtained from your authorized dealer or from Goldman Sachs & Co. LLC by calling (retail – 1-800-526-7384) (institutional – 1-800-621-2550).
© 2017 Goldman Sachs. All rights reserved. 100844-TMPL-08/2017-589867 LONGSHSAR-17 / 475
Goldman Sachs Funds

| Semi-Annual Report | June 30, 2017 | |||
Real Estate Securities Funds | ||||
Global Real Estate Securities | ||||
International Real Estate Securities | ||||
Real Estate Securities | ||||

Goldman Sachs Real Estate Securities Funds
| ∎ | GLOBAL REAL ESTATE SECURITIES |
| ∎ | INTERNATIONAL REAL ESTATE SECURITIES |
| ∎ | REAL ESTATE SECURITIES |
| 2 | ||||
| 22 | ||||
| 23 | ||||
| 28 | ||||
| 32 | ||||
| 38 | ||||
| 52 | ||||
| NOT FDIC-INSURED | May Lose Value | No Bank Guarantee | ||
GOLDMAN SACHS REAL ESTATE SECURITIES FUNDS
What Differentiates the Goldman Sachs Real Estate Securities Investment Process?
The Goldman Sachs Global Real Estate Securities, International Real Estate Securities and Real Estate Securities Funds seek to generate long-term growth of capital and dividend income by investing primarily in real estate industry companies, including real estate investment trusts (“REITs”), on an international or domestic basis, respectively. REITs which offer daily liquidity have historically strong returns, low volatility and low correlation to traditional asset classes.
Goldman Sachs’ Real Estate Securities Investment Process

Buy high quality companies.
We seek to purchase those companies that combine strong market exposures, management teams, capital structures and growth prospects.
Buy at a reasonable price.
We seek to consistently select securities that are trading at discounts to their intrinsic value.
Diversification reduces risk.
We seek to diversify the portfolio holdings based on property type and geographic markets to manage risk without compromising returns.

Team Based:
Portfolio decisions are made by the entire team.
Continuous Scrutiny:
Market, industry and company developments are reviewed daily.
Fundamental Analysis:
Portfolio holdings are determined by the risk/reward characteristics of an issuer and the team’s conviction in the overall business and management’s ability to create value.

Real estate securities portfolio that:
| ∎ | is a high quality portfolio that is strategically positioned for long-term growth potential |
| ∎ | is a result of bottom-up stock selection with a focus on long-term investing |
1
PORTFOLIO RESULTS
Goldman Sachs Global Real Estate Securities Fund
Investment Objective
The Fund seeks total return comprised of long-term growth of capital and dividend income.
Portfolio Management Discussion and Analysis
Below, the Goldman Sachs Real Estate Securities Investment Team discusses the Goldman Sachs Global Real Estate Securities Fund’s (the “Fund”) performance and positioning for the six-month period ended June 30, 2017 (the “Reporting Period”).
| Q | How did the Fund perform during the Reporting Period? |
| A | During the Reporting Period, the Fund’s Class A, C, Institutional, IR, R and R6 Shares generated cumulative total returns, without sales charges, of 3.06%, 2.70%, 3.25%, 3.28%, 2.94% and 3.26%, respectively. These returns compare to the 5.37% cumulative total return of the Fund’s benchmark, the FTSE EPRA/NAREIT Developed Index (Gross, USD, Unhedged) (the “FTSE Index”) during the same period. |
| Q | What economic and market factors most influenced the global real estate securities market as a whole during the Reporting Period? |
| A | For the Reporting Period overall, the global real estate securities market, as measured by the FTSE Index, gained 5.37%. |
| During the Reporting Period, Singapore and Hong Kong were the top performing markets, while Japan was the only country to post a negative absolute return. In Singapore, property sale launches were met with a strong homebuyer response, while loosening government austerity measures prompted further share price recovery. The Hong Kong property market rebounded on the back of mounting consumer spending and higher confidence in the Chinese yuan. As concern about rising U.S. interest rates began to wane, pent-up demand drove increases in prices, sales volumes and market sentiment in the Hong Kong real estate market. The Japan real estate market, on the other hand, reversed its strong 2016 performance during the Reporting Period, as investors expressed concern about a strengthening yen and looming supply risk in the Tokyo office market. |
| Q | What key factors were responsible for the Fund’s performance during the Reporting Period? |
| A | The Fund underperformed the FTSE Index during the Reporting Period. Stock selection in the U.S. detracted most. Stock selection in Canada and having a neutral allocation to Hong Kong, which significantly outpaced the FTSE Index during the Reporting Period, also hurt. Offsetting these detractors was the positive contribution of having an overweighted allocation to continental Europe, which notably outperformed the FTSE Index during the Reporting Period. Stock selection in Singapore and the U.K. added value as well. |
| Q | Which positions detracted significantly from the Fund’s performance during the Reporting Period? |
| A | Brixmor Property Group, an owner of grocery-anchored community shopping centers, was the top detractor from the Fund’s results during the Reporting Period. We believe Brixmor Property Group’s underperformance of the FTSE Index during the Reporting Period was largely due to market concerns around store closures within the industry, resulting from disappointing retail sales. In our view, these fears are overblown, especially given Brixmor Property Group’s base in high quality grocery-anchored shopping centers. Overall, at the end of the Reporting Period, we remained positive on Brixmor Property Group’s long-term growth potential as well as on the company’s portfolio of assets. In our view, fundamentals in the industry remain healthy, as supply, relative to historical levels is low and demand continues to be strong. Finally, we were encouraged by its management’s focus on high return redevelopment projects and on improving the company’s balance sheet. |
DDR, an owner of shopping centers in the U.S. and Puerto Rico, was also a top detractor from the Fund’s returns during the Reporting Period. As with Brixmor Property Group, we |
2
PORTFOLIO RESULTS
believe the majority of DDR’s weak performance during the Reporting Period can be attributed to market concerns around store closures and retailer bankruptcies within the industry, resulting from disappointing retail sales. Despite DDR’s underperformance of the FTSE Index during the Reporting Period, we believe the company’s fundamentals remain healthy and its high quality tenant base provides DDR with an advantage relative to its peers. At the end of the Reporting Period, we maintained a high level of conviction in DDR’s new management team and its extensive experience and deep relationships in the strip mall/power center space. |
| RLJ Lodging Trust, a U.S. hotel REIT, detracted from the Fund’s performance during the Reporting Period. Its stock performed strongly from the time of the U.S. elections through the end of 2016, significantly outperforming the broader FTSE Index. Its industry revenue per available room (“RevPAR”) metric exceeded market expectations at the end of 2016, as investors took a more positive view on the economy due to the possibility of tax reforms, deregulation and a more pro-business U.S. Administration. However, the stock underperformed the FTSE Index during the Reporting Period given that its valuation already reflected a large degree of positive sentiment shift, especially ahead of earnings, as investors waited to hear forward guidance and any commentary on fundamentals. At the end of the Reporting Period, we continued to like RLJ Lodging Trust’s focus on select-service hotels, which have higher margins and free cash flow yields compared to full-service peers, as well as what we view as its attractive valuation and strong balance sheet. |
| Q | What were some of the Fund’s best-performing individual holdings? |
| A | CyrusOne, an owner, operator and developer of data center properties, was the top positive contributor to the Fund’s returns during the Reporting Period. Shares of the company rallied, as positive commentary from industry peers reduced concerns about a slowdown in the sector and all signs indicated that cloud-based technology continued to gain momentum. At the end of the Reporting Period, we continued to believe that the strength of CyrusOne’s sales force and customer penetration among Fortune 1000 companies are meaningful competitive advantages and that the stock remained attractively valued on a relative basis given its growth profile and backlog over the next several years. |
| Vonovia, the largest residential landlord in Germany, was also a top positive contributor to the Fund’s relative results during the Reporting Period. The company benefited from improvement in its assets portfolio through the disposal of non-core assets and its management’s focus on innovation and efficiency. At the end of the Reporting Period, we remained constructive on the company’s ability to quickly integrate acquisitions as well as on encouraging rental growth. |
| City Developments, a Singapore-based diversified real estate developer in the business of condominium development, hotel ownership and office landlord, contributed positively to the Fund’s performance during the Reporting Period. The company saw its share price rise primarily on the consensus expectation that the Singapore government’s austerity on the economy and housing cooling measures may be loosened. At the end of the Reporting Period, we continued to view City Developments favorably due to what we considered to be its sound management team and quality portfolio of assets. |
| Q | How did the Fund use derivatives and similar instruments during the Reporting Period? |
| A | The Fund did not use derivatives during the Reporting Period. |
| Q | Did the Fund make any significant purchases or sales during the Reporting Period? |
| A | We initiated a Fund position in Hudson Pacific Properties, an owner of office properties across the U.S.’ west coast. The company has exposure to what we consider to be some of the best markets in the U.S., characterized by high job growth and relatively low supply. In our view, Hudson Pacific Properties’ internal growth has the potential to drive higher earnings through both lease-up and positive mark-to-market on rental rates. (Lease-up is the time period for a newly available property to attract tenants and reach stabilized occupancy. Mark to market refers to accounting for the fair value of an asset or liability based on the current market price, or for similar assets and liabilities, or based on another objectively assessed fair value.) Furthermore, we believe the company has exhibited strong capital allocation, including its recent acquisition in Los Angeles, and has ample opportunities for future investments. |
We established a Fund position in Link Real Estate Investment Trust, a shopping center REIT based in Hong Kong. We believe volatility in the Hong Kong property market, driven by higher long-term funding costs, has created attractive valuations. In our view, Link Real Estate |
3
PORTFOLIO RESULTS
Investment Trust may be more resilient to cyclicality relative to its development-focused Hong Kong real estate peers. |
| Conversely, we exited the Fund’s position in Sekisui House, a Japanese company engaged in building and selling residential units. The Fund’s position was initially predicated on our positive view of Sekisui House’s management team and its strong track record. However, we believe other names may offer more attractive return profiles given our weakening outlook for Japanese apartment construction and thus decided to sell the position. |
| We sold the Fund’s position in Mitsubishi Estate, a diversified Japanese real estate landlord and developer focused on prime Tokyo office space. The Fund’s position was initially predicated on our belief that the company was well positioned to take advantage of positive trends in the Tokyo office and residential markets. Mitsubishi Estate’s stock price experienced strong performance in the fourth quarter of 2016, but it then corrected at the beginning of 2017. We believe the Japanese yen movement played a role in influencing market expectations on the strength of Japan’s economy and implications on inflation versus deflation. |
| Q | Were there any changes made in the Fund’s investment strategy during the Reporting Period? |
| A | In constructing the Fund’s portfolio, we focus on picking securities rather than on making regional, country or subsector bets. We seek to outpace the benchmark index by overweighting stocks that we expect to outperform and underweighting those that we think may lag. Consequently, changes in the Fund’s regional or subsector weights are generally the direct result of individual stock selection or of real estate securities’ appreciation or depreciation. That said, the Fund’s exposure to Hong Kong increased relative to the FTSE Index during the Reporting Period. The Fund’s allocation to cash decreased during the Reporting Period. |
| Q | How was the Fund positioned relative to its benchmark index at the end of the Reporting Period? |
| A | From a country perspective, the Fund was overweighted relative to the FTSE Index in continental Europe and underweight in the U.S. The Fund was rather neutrally weighted compared to the FTSE Index in the other constituent countries of the FTSE Index at the end of June 2017. |
| Q | What is the Fund’s tactical view and strategy for the months ahead? |
| A | From a fundamental perspective, we remained constructive at the end of the Reporting Period on the asset class given reasonably favorable demand and low vacancy across most subsectors. While new supply is growing due to the attractive spread, or differential, between development yields and capitalization rates, it is still below both demand and the long-term average, and we believe this could lead to further increases in occupancy levels and rental rates. (Capitalization rate is a rate of return on a real estate investment property based on the expected income that the property will generate. Capitalization rate is used to estimate the investor’s potential return on his or her investment.) This encouraging fundamental backdrop, coupled with a solid financing environment, could support additional gains, in our view. Furthermore, we feel REITs could experience a continued increase in investor demand due to record levels of private capital, which has yet to be invested, as well as foreign and institutional investors increasing their allocations to the space due to global uncertainty. In addition, we view the environment as beneficial to the investment attributes of the asset class and believe REITs should continue to be viewed favorably by investors, especially relative to fixed income. If rising interest rates coincide with stronger economic growth, then stronger pricing power and net operating income growth should offset any potential negative impact on REIT valuations. Unlike fixed income, most REITs operate dynamic businesses, which can still create value and growth even with rising interest rates. |
| As fundamental, bottom-up investors, we intend to continue to focus our approach on those companies that have well-capitalized balance sheets and that possess quality attributes, such as a robust business model, a high quality asset exposure and a strong management team with a sound reinvestment strategy. Overall, we believe that global REITs can continue to offer attractive liquidity and risk-adjusted returns, relative to fixed income and direct real estate in particular, given their potential yield, growth, diversification and inflation hedge benefits. |
4
FUND BASICS
Global Real Estate Securities Fund
as of June 30, 2017
| PERFORMANCE REVIEW | ||||||||||
| January 1, 2017–June 30, 2017 | Fund Total Return (based on NAV)1 | FTSE EPRA/NAREIT Developed Index (Gross, USD, Unhedged)2 | ||||||||
| Class A | 3.06 | % | 5.37 | % | ||||||
| Class C | 2.70 | 5.37 | ||||||||
| Institutional | 3.25 | 5.37 | ||||||||
| Class IR | 3.28 | 5.37 | ||||||||
| Class R | 2.94 | 5.37 | ||||||||
| Class R6 | 3.26 | 5.37 | ||||||||
| 1 | The net asset value (“NAV”) represents the net assets of the class of the Fund (ex-dividend) divided by the total number of shares of the class outstanding. The Fund’s performance reflects the reinvestment of dividends and other distributions. The Fund’s performance does not reflect the deduction of any applicable sales charges. |
| 2 | The FTSE EPRA/NAREIT Developed Index is designed to measure the stock performance of companies engaged in specific real estate activities of the North American, European and Asian real estate markets. Relevant real estate activities are defined as the ownership, trading and development of income-producing real estate. |
| STANDARDIZED TOTAL RETURNS3 | ||||||||||||||
| For the period ended 6/30/17 | One Year | Since Inception | Inception Date | |||||||||||
| Class A | -7.53 | % | 2.06 | % | 8/31/15 | |||||||||
| Class C | -3.83 | 4.48 | 8/31/15 | |||||||||||
| Institutional | -1.68 | 5.68 | 8/31/15 | |||||||||||
| Class IR | -1.83 | 5.54 | 8/31/15 | |||||||||||
| Class R | -2.31 | 5.00 | 8/31/15 | |||||||||||
| Class R6 | -1.67 | 5.70 | 8/31/15 | |||||||||||
| 3 | The Standardized Total Returns are average annual total returns or cumulative total returns (only if the performance period is one year or less) as of the most recent calendar quarter-end. They assume reinvestment of all distributions at NAV. These returns reflect a maximum initial sales charge of 5.5% for Class A Shares, and the assumed contingent deferred sales charge for Class C Shares (1% if redeemed within 12 months of purchase). Because Institutional, Class IR, Class R and Class R6 Shares do not involve a sales charge, such a charge is not applied to their Standardized Total Returns. |
The returns set forth in the tables above represent past performance. Past performance does not guarantee future results. The Fund’s investment return and principal value will fluctuate so that an investor’s shares, when redeemed, may be worth more or less than their original cost. Current performance may be lower or higher than the performance quoted above. Please visit our web site at www.GSAMFUNDS.com to obtain the most recent month-end returns. Performance reflects applicable fee waivers and/or expense limitations in effect during the periods shown. In their absence, performance would be reduced. Returns do not reflect the deduction of taxes that a shareholder would pay on Fund distributions or the redemption of Fund shares.
5
FUND BASICS
| EXPENSE RATIOS4 | ||||||||||
| Net Expense Ratio (Current) | Gross Expense Ratio (Before Waivers) | |||||||||
| Class A | 1.40 | % | 3.07 | % | ||||||
| Class C | 2.15 | 3.82 | ||||||||
| Institutional | 1.00 | 2.67 | ||||||||
| Class IR | 1.15 | 2.82 | ||||||||
| Class R | 1.65 | 3.32 | ||||||||
| Class R6 | 0.98 | 2.65 | ||||||||
| 4 | The expense ratios of the Fund, both current (net of applicable fee waivers and/or expense limitations) and before waivers (gross of applicable fee waivers and/or expense limitations) are as set forth above according to the most recent publicly available Prospectus for the Fund and may differ from the expense ratios disclosed in the Financial Highlights in this report. Pursuant to a contractual arrangement, the Fund’s fee waivers and/or expense limitations will remain in place through at least April 28, 2018, and prior to such date the Investment Adviser may not terminate the arrangements without the approval of the Fund’s Board of Trustees. If these arrangements are discontinued in the future, the expense ratios may change without shareholder approval. |
| TOP TEN HOLDINGS AS OF 6/30/175 | ||||||||||
| Holding | % of Total Net Assets | Subsectors | Country | |||||||
| Simon Property Group, Inc. (REIT) | 4.8 | % | Retail | United States | ||||||
| Mid-America Apartment | 3.5 | Residential | United States | |||||||
| Communities, Inc. (REIT) | ||||||||||
| AvalonBay Communities, Inc. (REIT) | 3.5 | Residential | United States | |||||||
| Equity Residential (REIT) | 3.3 | Residential | United States | |||||||
| Vonovia SE | 3.2 | Residential | Germany | |||||||
| Boston Properties, Inc. (REIT) | 3.1 | Office | United States | |||||||
| Welltower, Inc. (REIT) | 3.1 | Health Care | United States | |||||||
| Vornado Realty Trust (REIT) | 2.9 | Office | United States | |||||||
| Mitsui Fudosan Co. Ltd. | 2.6 | Diversified | Japan | |||||||
| Klepierre (REIT) | 2.4 | Retail | France | |||||||
| 5 | The top 10 holdings may not be representative of the Fund’s future investments. |
6
FUND BASICS
| FUND VS. BENCHMARK SECTOR ALLOCATION6 |
| As of June 30, 2017 |
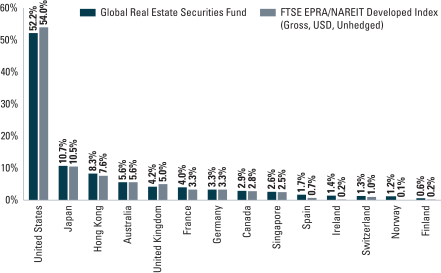
| 6 | The Fund is actively managed and, as such, its composition may differ over time. Consequently, the Fund’s overall country allocations may differ from percentages contained in the graph above. The percentage shown for each investment category reflects the value of investments in that category as a percentage of market value. |
7
PORTFOLIO RESULTS
Goldman Sachs International Real Estate Securities Fund
Investment Objective
The Fund seeks total return comprised of long-term growth of capital and dividend income.
Portfolio Management Discussion and Analysis
Below, the Goldman Sachs Real Estate Securities Investment Team discusses the Goldman Sachs International Real Estate Securities Fund’s (the “Fund”) performance and positioning for the six-month period ended June 30, 2017 (the “Reporting Period”).
| Q | How did the Fund perform during the Reporting Period? |
| A | During the Reporting Period, the Fund’s Class A, C, Institutional, IR and R6 Shares generated cumulative total returns, without sales charges, of 8.91%, 8.62%, 9.24%, 9.13% and 9.26%, respectively. These returns compare to the 10.09% cumulative total return of the Fund’s benchmark, the FTSE EPRA/NAREIT Developed ex-US Real Estate Index (Gross, USD, Unhedged) (the “Real Estate Index”) during the same period. |
| Q | What economic and market factors most influenced the international real estate securities market as a whole during the Reporting Period? |
| A | For the Reporting Period overall, the international real estate securities market, as measured by the Real Estate Index, outperformed the U.S. real estate securities market, as measured by the Wilshire U.S. Real Estate Securities Index (with dividends reinvested), by more than seven percentage points, but underperformed the broad international equity market, as measured by the MSCI EAFE® Index, by more than three percentage points. |
| Singapore and Hong Kong were the best performing markets during the Reporting Period, while Japan was the weakest performer. In Singapore, property sales launches were met with a strong homebuyer response, while loosening government austerity measures prompted further share price recovery. The Hong Kong property market rebounded in the first quarter of 2017 on the back of mounting consumer spending and higher confidence in the Chinese yuan. As concern about rising U.S. interest rates began to wane, pent-up demand drove increases in prices, sales volumes and market sentiment in the Hong Kong real estate market. The Japan real estate market, on the other hand, reversed its strong 2016 performance as investors expressed concern about a strengthening yen and looming supply risk in the Tokyo office market. |
| As the Reporting Period progressed, international equities broadly were buoyed by receding political risk, as the centrist candidate defeated the nationalist candidate in the French election and successfully secured a parliamentary majority. Political risk also declined in Italy, as the anti-establishment Five Star Movement saw a setback in local elections and consensus expectations for parliamentary elections this year declined. However, market optimism for pro-growth fiscal policy was dampened by political developments in the U.S. Strong first quarter 2017 earnings results, with double-digit growth across virtually all major developed markets, were supportive of international equity markets. The U.S. labor market remained strong, but economic activity and inflation data appeared to be moderating. Nonetheless, the Federal Reserve (the “Fed”) proceeded to raise the target range for the federal funds rate 0.25% in June 2017 after having done the same in March 2017. Also in June 2017, European markets reacted hawkishly to European Central Bank (“ECB”) President Mario Draghi’s sanguine outlook for recovering inflation and cautious reference to tapering asset purchases by the ECB. (Hawkish sentiment tends to suggest higher interest rates; opposite of dovish.) Japanese equities saw a temporary pullback in June 2017, as market sentiment deteriorated and as the Japanese yen strengthened immediately after the June 2017 Fed interest rate hike, but quickly rebounded. |
| Q | What key factors were responsible for the Fund’s performance during the Reporting Period? |
| A | The Fund underperformed the Real Estate Index on a relative basis during the Reporting Period. Stock selection in continental Europe, Japan and Canada detracted most from the Fund’s relative results. Having an allocation to cash, albeit modest, during a Reporting Period when the Real |
8
PORTFOLIO RESULTS
Estate Index rallied, further dampened relative results. Partially offsetting these detractors was stock selection in the U.K., which contributed positively. Having exposure to China, which is not a component of the Real Estate Index and which outperformed the Real Estate Index, also helped. Stock selection in Singapore proved effective but was virtually offset by having an underweighted allocation to the strongly performing market. |
| Q | Which positions detracted significantly from the Fund’s performance during the Reporting Period? |
| A | Nomura Real Estate Master Fund (“Nomura”), a diversified Japanese REIT owning office and residential properties, was the top detractor from the Fund’s performance during the Reporting Period. Its share price declined following what had been a recovery in March 2017, as the entire Japanese REIT sector underperformed against real estate developers and broader equities. Relative to its peers, Nomura was particularly hard hit due to some mild yield dilution, or reduction, for the sake of quality, sector and location refinement following several asset acquisitions and disposals earlier in the Reporting Period. As the asset reshuffling partly involved its sponsor company, investors expressed concerns about Nomura’s management team’s intentions and financial benefits. At the end of the Reporting Period, we believed Nomura’s overall asset portfolio quality and management execution remained sound. Still, we will continue to monitor the company’s medium-to-long-term financial benefits against its management’s guidance and execution in the months ahead. |
| Nippon Building Fund, Japan’s largest REIT focused on the Tokyo office market, was also a major detractor from the Fund’s results during the Reporting Period. Shares of Nippon Building Fund traded lower, as the market began to decrease its expectations for rental growth given the backlog of Grade A office supply set to hit the Tokyo market in 2018-2019. Despite this weak performance, we remained constructive on Nippon Building Fund at the end of the Reporting Period, as we believe its high quality asset portfolio and management team may shield the company, at least partially, from adverse cyclicality relative to the rest of the Japan real estate market. |
| Orix JREIT is a Japanese REIT investing in real estate properties that include offices, rental houses and hotels. Its stock performed poorly after its management announced weak lending rates and a property acquisition in June 2017, dampening market sentiment. At the end of the Reporting Period, we believed the company continued to benefit from increased market recognition of what we view as its relatively attractive valuation and strong asset quality as well as the notable efforts by its management team to deliver solid returns by proactively replacing tenants and leveraging the company’s strong sponsor commercial network. Furthermore, in our opinion, its assets in the office subsector continue to benefit from an improving leasing environment in Tokyo. |
| Q | What were some of the Fund’s best-performing individual holdings? |
| A | A position in Vonovia, the largest residential landlord in Germany, was the top positive contributor to the Fund’s relative results during the Reporting Period. The company benefited from improvement in its assets portfolio through the disposal of non-core assets and its management’s focus on innovation and efficiency. At the end of the Reporting Period, we remained constructive on the company’s ability to quickly integrate acquisitions as well as on encouraging rental growth. |
| City Developments, a Singapore-based diversified real estate developer in the business of condominium development, hotel ownership and office landlord, contributed positively to the Fund’s performance. The company saw its share price rise primarily on the consensus expectation that the Singapore government’s austerity on the economy and housing cooling measures may be loosened. At the end of the Reporting Period, we continued to view City Developments favorably due to what we considered to be its sound management team and quality portfolio of assets. |
| Mapletree Greater China Commercial Trust (“MCT”), a new position for the Fund during the Reporting Period, was also a top contributor to the Fund’s performance during the Reporting Period. MCT is a Singapore REIT with a diversified portfolio of primarily retail and office properties. MCT owns a Grade A quality mall located near an island resort that we believe is well positioned to benefit from both domestic consumption and rising tourist volumes. Despite relatively weak retail sales in Singapore for the past few years, the mall’s tenants’ sales have been resilient, while almost no supply has been added in the nearby area. MCT also owns Grade A business parks, which are our preferred asset class within the industrials subsector due to low supply levels. |
9
PORTFOLIO RESULTS
| Q | How did the Fund use derivatives and similar instruments during the Reporting Period? |
| A | The Fund did not use derivatives during the Reporting Period. |
| Q | Did the Fund make any significant purchases or sales during the Reporting Period? |
| A | In addition to the purchase of MCT, already mentioned, we established a Fund position in Link Real Estate Investment Trust, a shopping center REIT based in Hong Kong. We believe volatility in the Hong Kong property market, driven by higher long-term funding costs, has created attractive valuations. In our view, Link Real Estate Investment Trust may be more resilient to cyclicality relative to its development-focused Hong Kong real estate peers. |
| We initiated a Fund position in RioCan Real Estate Investment Trust, which focuses on owning, developing and operating shopping centers in Canada. We are positive on what we view as RioCan Real Estate Investment Trust’s strong management team with a focus on balance sheet quality and earnings per share growth. In our opinion, the company is pursuing a sound strategy in partnering with residential developers to densify occupancy in higher quality urban locations. |
| Conversely, we exited the Fund’s position in Sekisui House, a Japanese company engaged in building and selling residential units. The Fund’s position was initially predicated on our positive view of Sekisui House’s management team and its strong track record. However, we believe other names may offer more attractive return profiles given our weakening outlook for Japanese apartment construction and thus decided to sell the position. |
| We sold the Fund’s position in Charter Hall Group, a diversified Australian REIT managing real estate investment funds and developing commercial, residential and industrial properties. The Fund’s position was initially predicated on our positive view of Charter Hall Group due to its strong track record. Due to its strong performance during the Reporting Period, we exited the position, taking profits. |
| Q | Were there any changes made in the Fund’s investment strategy during the Reporting Period? |
| A | In constructing the Fund’s portfolio, we focus on picking securities rather than on making regional, country or subsector bets. We seek to outpace the benchmark index by overweighting stocks that we expect to outperform and underweighting those that we think may lag. Consequently, changes in its regional or subsector weights are generally the direct result of individual stock selection or of real estate securities’ appreciation or depreciation. That said, during the Reporting Period, the Fund’s exposure to Hong Kong and the U.K. increased relative to the Real Estate Index, and its exposure to continental Europe decreased relative to the Real Estate Index. We eliminated the Fund’s position in China during the Reporting Period, which is not a component of the Real Estate Index. |
| Q | How was the Fund positioned relative to its benchmark index at the end of the Reporting Period? |
| A | From a country perspective, the Fund was overweighted relative to the Real Estate Index in Hong Kong, Japan and continental Europe and was underweighted relative to the Real Estate Index in the U.K. The Fund was rather neutrally weighted compared to the Real Estate Index in the other constituent countries of the Real Estate Index at the end of June 2017. |
| Q | What is the Fund’s tactical view and strategy for the months ahead? |
| A | At the end of the Reporting Period, we believed that international REITs can continue to generate positive returns in 2017 given a favorable supply picture and reasonable demand in most subsectors. The monetary and fiscal policy outlook in the U.S. may attract increased domestic and international capital, and a strengthened U.S. dollar may benefit international REITs via a better trade position and a healthy amount of imported inflation. |
In our view, recent data points in the U.K., continental Europe and Japan may suggest an escape from prolonged disinflation, which could lead to indexed rental uplift due to a common commercial lease structure. Anticipating an eventual rate hike, most international REITs have locked in low-cost debt funding whenever available and have generally maintained, in our opinion, strong balance sheets in the wake of the Great Recession. Despite some rise of both the short-term and long-term end of the rate curve for a few major countries, we observed that the funding environment for REITs remains open and inexpensive relative to the outlook of the long-term cash yield from REITs’ underlying assets. We believe REITs’ attractive yield remains a key driver of global capital, as investors review their asset class allocations. We further believe this favorable backdrop may allow REITs to deploy capital toward high quality projects to |
10
PORTFOLIO RESULTS
potentially drive future growth. Global markets were punctuated by major political events during the Reporting Period, and we expect that the remainder of 2017 may not be too different for continental Europe. However, we believe REITs can stave off this risk and ultimately reflect their underlying fundamentals and yield advantage. |
| Looking ahead, we believe REITs offer attractive liquidity and risk-adjusted returns, relative to fixed income and direct real estate in particular, given their potential yield, growth, diversification and inflation hedge benefits. On a stock by stock basis, we believe opportunities abound around the world. As fundamental, bottom-up investors, we intend to continue to focus our approach on those companies that have what we consider to be well-capitalized balance sheets and that possess quality attributes, such as a robust business model, a high quality asset exposure and a strong management team with a sound reinvestment strategy. |
11
FUND BASICS
International Real Estate Securities Fund
as of June 30, 2017
| PERFORMANCE REVIEW | ||||||||||
| January 1, 2017– June 30, 2017 | Fund Total Return (based on NAV)1 | FTSE EPRA/NAREIT Developed ex US Real Estate Index (Gross, USD, Unhedged)2 | ||||||||
| Class A | 8.91 | % | 10.09 | % | ||||||
| Class C | 8.62 | 10.09 | ||||||||
| Institutional | 9.24 | 10.09 | ||||||||
| Class IR | 9.13 | 10.09 | ||||||||
| Class R6 | 9.26 | 10.09 | ||||||||
| 1 | The net asset value (“NAV”) represents the net assets of the class of the Fund (ex-dividend) divided by the total number of shares of the class outstanding. The Fund’s performance reflects the reinvestment of dividends and other distributions. The Fund’s performance does not reflect the deduction of any applicable sales charges. |
| 2 | The FTSE EPRA/NAREIT Developed ex US Real Estate Index (Gross, USD, Unhedged) is a market capitalization weighted index comprised of REITs and non-REITs within the international (global ex U.S.) real estate securities market. The market capitalization for each constituent is adjusted for free float. It is not possible to invest directly in an index. |
| STANDARDIZED TOTAL RETURNS3 | ||||||||||||||||||||
| For the period ended 6/30/17 | One Year | Five Year | Ten Year | Since Inception | Inception Date | |||||||||||||||
| Class A | -0.91 | % | 4.78 | % | -2.07 | % | 0.27 | % | 7/31/06 | |||||||||||
| Class C | 3.05 | 5.22 | -2.22 | 0.07 | 7/31/06 | |||||||||||||||
| Institutional | 5.15 | 6.40 | -1.26 | 1.06 | 7/31/06 | |||||||||||||||
| Class IR | 5.22 | 6.29 | N/A | -1.20 | 11/30/07 | |||||||||||||||
| Class R6 | 5.35 | N/A | N/A | 1.08 | 7/31/15 | |||||||||||||||
| 3 | The Standardized Total Returns are average annual total returns or cumulative total returns (only if the performance period is one year or less) as of the most recent calendar quarter-end. They assume reinvestment of all distributions at NAV. These returns reflect a maximum initial sales charge of 5.5% for Class A Shares and the assumed contingent deferred sales charge for Class C Shares (1% if redeemed within 12 months of purchase). Because Institutional, Class IR and Class R6 Shares do not involve a sales charge, such a charge is not applied to their Standardized Total Returns. |
The returns set forth in the tables above represent past performance. Past performance does not guarantee future results. The Fund’s investment return and principal value will fluctuate so that an investor’s shares, when redeemed, may be worth more or less than their original cost. Current performance may be lower or higher than the performance quoted above. Please visit our web site at www.GSAMFUNDS.com to obtain the most recent month-end returns.
Performance reflects applicable fee waivers and/or expense limitations in effect during the periods shown. In their absence, performance would be reduced. Returns do not reflect the deduction of taxes that a shareholder would pay on Fund distributions or the redemption of Fund shares.
12
FUND BASICS
| EXPENSE RATIOS4 | ||||||||||
| Net Expense Ratio (Current) | Gross Expense Ratio (Before Waivers) | |||||||||
| Class A | 1.39 | % | 1.62 | % | ||||||
| Class C | 2.14 | 2.37 | ||||||||
| Institutional | 0.99 | 1.22 | ||||||||
| Class IR | 1.14 | 1.37 | ||||||||
| Class R6 | 0.97 | 1.20 | ||||||||
| 4 | The expense ratios of the Fund, both current (net of applicable fee waivers and/or expense limitations) and before waivers (gross of applicable fee waivers and/or expense limitations) are as set forth above according to the most recent publicly available Prospectus for the Fund and may differ from the expense ratios disclosed in the Financial Highlights in this report. Pursuant to a contractual arrangement, the Fund’s fee waivers and/or expense limitations will remain in place through at least April 28, 2018, and prior to such date the Investment Adviser may not terminate the arrangements without the approval of the Fund’s Board of Trustees. If these arrangements are discontinued in the future, the expense ratios may change without shareholder approval. |
| TOP TEN HOLDINGS AS OF 6/30/175 | ||||||||||
| Holding | % of Total Net Assets | Line of Business | Country | |||||||
| Vonovia SE | 6.3 | % | Residential | Germany | ||||||
| Mitsui Fudosan Co. Ltd. | 5.5 | Diversified | Japan | |||||||
| Sun Hung Kai Properties Ltd. | 5.5 | Diversified | Hong Kong | |||||||
| Unibail-Rodamco SE (REIT) | 5.0 | Retail | France | |||||||
| Cheung Kong Property Holdings Ltd. | 4.7 | Diversified | Hong Kong | |||||||
| Klepierre (REIT) | 4.0 | Retail | France | |||||||
| Hongkong Land Holdings Ltd. | 3.6 | Diversified | Hong Kong | |||||||
| Sumitomo Realty & Development Co. Ltd. | 3.5 | Diversified | Japan | |||||||
| GPT Group (The) (REIT) | 3.4 | Diversified | Australia | |||||||
| Mirvac Group (REIT) | 3.4 | Diversified | Australia | |||||||
| 5 | The top 10 holdings may not be representative of the Fund’s future investments. |
13
FUND BASICS
| FUND VS. BENCHMARK COUNTRY ALLOCATION 6 | ||
| As of June 30, 2017 |
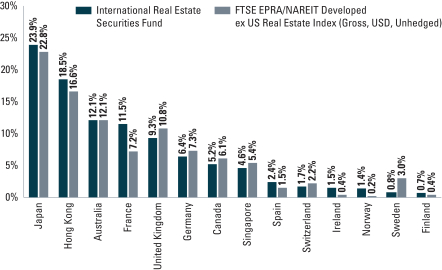
| 6 | The Fund is actively managed and, as such, its composition may differ over time. Consequently, the Fund’s overall country allocations may differ from percentages contained in the graph above. The percentage shown for each investment category reflects the value of investments in that category as a percentage of market value. |
14
PORTFOLIO RESULTS
Goldman Sachs Real Estate Securities Fund
Investment Objective
The Fund seeks total return comprised of long-term growth of capital and dividend income.
Portfolio Management Discussion and Analysis
Below, the Goldman Sachs Real Estate Securities Investment Team discusses the Goldman Sachs Real Estate Securities Fund’s (the “Fund”) performance and positioning for the six-month period ended June 30, 2017 (the “Reporting Period”).
| Q | How did the Fund perform during the Reporting Period? |
| A | During the Reporting Period, the Fund’s Class A, C, Institutional, Service, IR, R and R6 Shares generated cumulative total returns, without sales charges, of -0.03%, -0.39%, 0.21%, -0.02%, 0.10%, -0.11% and 0.17%, respectively. These returns compare to the 2.42% cumulative total return of the Fund’s benchmark, the Wilshire U.S. Real Estate Securities Index (with dividends reinvested) (the “Wilshire Index”) during the same period. |
| Q | What economic and market factors most influenced the U.S. real estate securities market as a whole during the Reporting Period? |
| A | The U.S. real estate securities market, as represented by the Wilshire Index, posted positive absolute returns during the Reporting Period but lagged the broad U.S. equity market, as represented by the S&P 500® Index, which was up 9.34% for the same period. |
| For the first quarter of 2017, the Wilshire Index increased 0.5%. While U.S. REITs underperformed the broader U.S. equity market, at the company level, contained new supply across most property types, stable demand and an accommodative financing environment provided a supportive backdrop for the asset class. Health care and office were the top performing subsectors for the first quarter of 2017, while retail and self-storage underperformed the Wilshire Index most. The failure to pass the President’s proposed health care legislation as well as the decline in the 10-year U.S. Treasury yield benefited the health care subsector. Investor concerns about department store closures, steadily declining sales and the threat of e-commerce negatively affected the retail subsector. |
| The Wilshire Index increased 1.9% during the second quarter of 2017. U.S. REITs continued to lag the broader U.S. equity market due to decelerating fundamentals across most subsectors and particular weakness in the retail subsector. For the second quarter of 2017, technology and health care were the top performing subsectors, while retail and self-storage again underperformed the Wilshire Index most. Technology REITs benefited from a rebound in bookings during the second quarter of 2017, while investor concerns about the retail subsector persisted. |
| For the Reporting Period overall, the strongest subsectors in the Wilshire Index were technology, health care and industrial. Conversely, the retail, self-storage and hotel subsectors were the weakest performers within the Wilshire Index during the Reporting Period, posting negative absolute returns. |
| Q | What key factors were responsible for the Fund’s performance during the Reporting Period? |
| A | The Fund underperformed the return of the Wilshire Index. Detracting most from the Fund’s relative results was stock selection and positioning in the retail, self-storage and office subsectors. Retail REITs in particular experienced material weakness during the Reporting Period, as pressures from the rise of e-commerce continued to mount on traditional retailers, who have been rapidly closing physical stores. To a somewhat lesser degree, stock selection and positioning in the hotel, industrial and health care subsectors also hurt. Partially offsetting these detractors was effective individual stock selection in the technology and residential subsectors, which contributed positively to relative returns. Having an overweighted allocation to the technology subsector, which was the strongest subsector in the Wilshire Index during the Reporting Period, further buoyed relative results. |
15
PORTFOLIO RESULTS
| Q | What were some of the Fund’s weakest-performing individual holdings? |
| A | DDR, an owner of shopping centers in the U.S. and Puerto Rico, was the top detractor from the Fund’s returns during the Reporting Period. We believe the majority of DDR’s weak performance during the Reporting Period can be attributed to market concerns around store closures and retailer bankruptcies within the industry, resulting from disappointing retail sales. Despite DDR’s underperformance of the Wilshire Index during the Reporting Period, we believe the company’s fundamentals remain healthy and its high quality tenant base provides DDR with an advantage relative to its peers. At the end of the Reporting Period, we maintained a high level of conviction in DDR’s new management team and its extensive experience and deep relationships in the strip mall/power center space. |
| Brixmor Property Group, an owner of grocery-anchored community shopping centers, was also a top detractor from the Fund’s results during the Reporting Period. As with DDR, we believe Brixmor Property Group’s underperformance of the Wilshire Index during the Reporting Period was largely due to market concerns around store closures within the industry, resulting from disappointing retail sales. In our view, these fears are overblown, especially given Brixmor Property Group’s base in high quality grocery-anchored shopping centers. Overall, at the end of the Reporting Period, we remained positive on Brixmor Property Group’s long-term growth potential as well as on the company’s portfolio of assets. In our view, fundamentals in the industry remain healthy, as supply, relative to historical levels is low and demand continues to be strong. Finally, we were encouraged by its management’s focus on high return redevelopment projects and on improving the company’s balance sheet. |
| RLJ Lodging Trust, a U.S. hotel REIT, detracted from the Fund’s performance during the Reporting Period. Its stock performed strongly from the time of the U.S. elections through the end of 2016, significantly outperforming the broader FTSE Index. Its industry revenue per available room (“RevPAR”) metric exceeded market expectations at the end of 2016, as investors took a more positive view on the economy due to the possibility of tax reforms, deregulation and a more pro-business Administration. However, the stock underperformed the Wilshire Index during the Reporting Period given that its valuation already reflected a large degree of positive sentiment shift, especially ahead of earnings, as investors waited to hear forward guidance and any commentary on fundamentals. At the end of the Reporting Period, we continued to like RLJ Lodging Trust’s focus on select-service hotels, which have higher margins and free cash flow yields compared to full-service peers, as well as what we view as its attractive valuation and strong balance sheet. |
| Q | What were some of the Fund’s best-performing individual holdings? |
| A | CyrusOne, an owner, operator and developer of data center properties, was the top positive contributor to the Fund’s returns during the Reporting Period. Shares of the company rallied, as positive commentary from industry peers reduced concerns about a slowdown in the sector and all signs indicated that cloud-based technology continued to gain momentum. At the end of the Reporting Period, we continued to believe that the strength of CyrusOne’s sales force and customer penetration among Fortune 1000 companies are meaningful competitive advantages and that the stock remained attractively valued on a relative basis given its growth profile and backlog over the next several years. |
| Mid-America Apartment Communities, which owns and manages apartments in the sunbelt region of the U.S., was a top contributor to Fund returns during the Reporting Period. The company reported better than market expected fourth quarter 2016 earnings and a more positive outlook relative to other apartment REITs, which were seeing a bigger slowdown from increased supply, particularly in urban and coastal markets. Furthermore, Mid-America Apartment Communities’ management provided an update on potential deal synergies with its Post Properties acquisition, which were improved relative to previous market expectations. |
| AvalonBay Communities engages in the development, ownership and operation of multifamily apartment communities in the U.S. It has long been considered by the market a blue-chip apartment REIT with a quality mix of urban and suburban infill residential units in coastal markets. (Infill housing is the insertion of additional housing units into an already approved subdivision or neighborhood. AvalonBay Communities features a sizable development pipeline, fully funded, which lets the REIT drive funds from operations growth even as same-store growth slows, unlike others who rely more on same-store growth for earnings growth. In our view, AvalonBay Communities maintains a strong balance sheet and a superior management team. |
16
PORTFOLIO RESULTS
| Q | How did the Fund use derivatives and similar instruments during the Reporting Period? |
| A | The Fund did not use derivatives during the Reporting Period. |
| Q | Did the Fund make any significant purchases or sales during the Reporting Period? |
| A | During the Reporting Period, we established a Fund position in Hudson Pacific Properties, an owner of office properties across the U.S.’ west coast. The company has exposure to what we consider to be some of the best markets in the U.S., characterized by high job growth and relatively low supply. In our view, Hudson Pacific Properties’ internal growth has the potential to drive higher earnings through both lease-up and positive mark-to-market on rental rates. (Lease-up is the time period for a newly available property to attract tenants and reach stabilized occupancy. Mark to market refers to accounting for the fair value of an asset or liability based on the current market price, or for similar assets and liabilities, or based on another objectively assessed fair value.) Furthermore, we believe the company has exhibited strong capital allocation, including its recent acquisition in Los Angeles, and has ample opportunities for future investments. |
| We initiated a Fund position in Brookdale Senior Living, an owner and operator of senior living communities, as we believe shares of the company were trading at a substantial discount to its net asset value. Additionally, in our view, the company has the potential to benefit from long-term demographic demand drivers. As we look ahead, we believe the Fund’s investment in Brookdale Senior Living presents a compelling risk/reward opportunity given its ongoing strategic review, which could result in the sale of the company or further monetization of real estate. |
| Conversely, we exited the Fund’s position in LaSalle Hotel Properties, a REIT focused primarily on luxury and hotel services in the U.S. We originally initiated the position in its stock due to the company’s high dividend yield and what we viewed as its conservative balance sheet. Shares of LaSalle Hotel Properties appreciated, as investors took a more positive on the economy following the U.S. elections in November 2016. Given its strong performance, we ultimately decided to sell the position to fund higher conviction ideas. |
| We eliminated the Fund’s position in American Tower, a provider of wireless communications infrastructure. We had originally initiated the fund’s position given American Tower’s opportunities for substantial revenue and earnings growth and based on our view that strong free cash flow generation could allow the company to meaningfully increase its dividend over time. In addition, we were encouraged by what we perceived to be its management team’s impressive operational aptitude, disciplined balance sheet management and commitment to high returns on capital. While we continue to view the tower industry favorably, we decided to exit the position during the Reporting Period, as American Tower’s shares had reached our price target. |
| Q | Were there any changes made in the Fund’s investment strategy during the Reporting Period? |
| A | In constructing the Fund’s portfolio, we focus on picking securities rather than on making real estate subsector bets. We seek to outpace the benchmark index by overweighting stocks that we expect to outperform and underweighting those that we think may lag. Consequently, changes in its real estate subsector weights are generally the direct result of individual stock selection or of real estate securities’ appreciation or depreciation. That said, during the Reporting Period, the Fund’s exposure to the office, retail and health care subsectors increased relative to the Wilshire Index and its exposure to the self-storage and technology subsectors decreased relative to the Wilshire Index. |
| Q | Were there any changes to the Fund’s portfolio management team during the Reporting Period? |
| A | During the Reporting Period, Kristin Kuney was named a co-lead portfolio manager of the Fund along with Nora Creedon and Tim Ryan. Kristin has been with Goldman Sachs Asset Management since 2000 and has been a part of the Real Estate Securities Investment Team for 13 years. Over that time, she has had research responsibilities for virtually all the different REIT subsectors. |
| Q | How was the Fund positioned relative to its benchmark index at the end of the Reporting Period? |
| A | From a subsector perspective, the Fund had an overweighted exposure compared to the Wilshire Index in the retail, office and hotel subsectors at the end of the Reporting Period. The Fund was underweighted compared to the Wilshire Index in the self-storage, industrial and technology subsectors and was rather neutrally weighted in the health care and residential subsectors within the Wilshire Index. |
17
PORTFOLIO RESULTS
| Q | What is the Fund’s tactical view and strategy for the months ahead? |
| A | From a fundamental perspective, we remained constructive at the end of the Reporting Period on the asset class given reasonably favorable demand and low vacancy across most subsectors. While new supply is growing due the attractive spread, or differential, between development yields and capitalization rates, it is still below both demand and the long-term average, and we believe this could lead to further increases in occupancy levels and rental rates. (Capitalization rate is a rate of return on a real estate investment property based on the expected income that the property will generate. Capitalization rate is used to estimate the investor’s potential return on his or her investment.) This encouraging fundamental backdrop, coupled with a solid financing environment, could support additional gains, in our view. Furthermore, we feel REITs could experience a continued increase in investor demand due to record levels of private capital, which has yet to be invested, as well as foreign and institutional investors increasing their allocations to the space due to global uncertainty. In addition, we view the environment as beneficial to the investment attributes of the asset class and believe REITs should continue to be viewed favorably by investors, especially relative to fixed income. If rising interest rates coincide with stronger economic growth, then stronger pricing power and net operating income growth should offset any potential negative impact on REIT valuations. Unlike fixed income, most REITs operate dynamic businesses, which can still create value and growth even with rising interest rates. |
| One particular note about the retail subsector. We believe the “death of retail” is an overly alarmist view and believe the market has been indiscriminately discounting retail stocks despite stable fundamentals for many higher quality names—those anchored by experiential (e.g. restaurants/ entertainment) and/or necessity-based (e.g. groceries) tenants, with premium locations (access to wealth demographics, visibility from the road). As such, we see compelling valuations and attractive dividend yields for select names in the subsector. |
| As fundamental, bottom-up investors, we intend to continue to focus our approach on those companies that have strong balance sheets and that possess quality attributes, such as a robust business model, a high quality asset exposure and a strong management team. Overall, we believe that REITs can continue to offer attractive liquidity and risk-adjusted returns, relative to fixed income and direct real estate in particular, given their potential yield, growth, diversification and inflation hedge benefits. |
18
FUND BASICS
Real Estate Securities Fund
as of June 30, 2017
| PERFORMANCE REVIEW | ||||||||||
| January 1, 2017–June 30, 2017 | Fund Total Return (based on NAV)1 | Wilshire U.S. Real Estate Securities Index2 | ||||||||
| Class A | -0.03 | % | 2.42 | % | ||||||
| Class C | -0.39 | 2.42 | ||||||||
| Institutional | 0.21 | 2.42 | ||||||||
| Service | -0.02 | 2.42 | ||||||||
| Class IR | 0.10 | 2.42 | ||||||||
| Class R | -0.11 | 2.42 | ||||||||
| Class R6 | 0.17 | 2.42 | ||||||||
| 1 | The net asset value (“NAV”) represents the net assets of the class of the Fund (ex-dividend) divided by the total number of shares of the class outstanding. The Fund’s performance reflects the reinvestment of dividends and other distributions. The Fund’s performance does not reflect the deduction of any applicable sales charges. |
| 2 | The Wilshire U.S. Real Estate Securities Index is an unmanaged market capitalization-weighted index comprised of publicly traded REITs and real estate operating companies. The figures do not reflect any fees or expenses. It is not possible to invest directly in an index. |
| STANDARDIZED TOTAL RETURNS3 | ||||||||||||||||||||
| For the period ended 6/30/17 | One Year | Five Years | Ten Years | Since Inception | Inception Date | |||||||||||||||
| Class A | -9.27 | % | 6.63 | % | 3.96 | % | 9.09 | % | 7/27/98 | |||||||||||
| Class C | -5.69 | 7.03 | 3.78 | 8.62 | 7/27/98 | |||||||||||||||
| Institutional | -3.58 | 8.28 | 4.99 | 9.87 | 7/27/98 | |||||||||||||||
| Service | -4.04 | 7.73 | 4.45 | 9.33 | 7/27/98 | |||||||||||||||
| Class IR | -3.72 | 8.11 | N/A | 5.57 | 11/30/07 | |||||||||||||||
| Class R | -4.21 | 7.58 | N/A | 5.06 | 11/30/07 | |||||||||||||||
| Class R6 | -3.60 | N/A | N/A | 5.00 | 7/31/15 | |||||||||||||||
| 3 | The Standardized Total Returns are average annual total returns or cumulative total returns (only if the performance period is one year or less) as of the most recent calendar quarter-end. They assume reinvestment of all distributions at NAV. These returns reflect a maximum initial sales charge of 5.5% for Class A Shares and the assumed contingent deferred sales charge for Class C Shares (1% if redeemed within 12 months of purchase). Because Institutional, Service, Class IR, Class R and Class R6 Shares do not involve a sales charge, such a charge is not applied to their Standardized Total Returns. |
The returns set forth in the tables above represent past performance. Past performance does not guarantee future results. The Fund’s investment return and principal value will fluctuate so that an investor’s shares, when redeemed, may be worth more or less than their original cost. Current performance may be lower or higher than the performance quoted above. Please visit our web site at www.GSAMFUNDS.com to obtain the most recent month-end returns. Performance reflects applicable fee waivers and/or expense limitations in effect during the periods shown. In their absence, performance would be reduced. Returns do not reflect the deduction of taxes that a shareholder would pay on Fund distributions or the redemption of Fund shares.
19
FUND BASICS
| EXPENSE RATIOS4 | ||||||||||
| Net Expense Ratio (Current) | Gross Expense Ratio (Before Waivers) | |||||||||
| Class A | 1.31 | % | 1.52 | % | ||||||
| Class C | 2.06 | 2.27 | ||||||||
| Institutional | 0.91 | 1.12 | ||||||||
| Service | 1.41 | 1.62 | ||||||||
| Class IR | 1.06 | 1.27 | ||||||||
| Class R | 1.56 | 1.77 | ||||||||
| Class R6 | 0.89 | 1.10 | ||||||||
| 4 | The expense ratios of the Fund, both current (net of applicable fee waivers and/or expense limitations) and before waivers (gross of applicable fee waivers and/or expense limitations) are as set forth above according to the most recent publicly available Prospectus for the Fund and may differ from the expense ratios disclosed in the Financial Highlights in this report. Pursuant to a contractual arrangement, the Fund’s fee waivers and/or expense limitations will remain in place through at least April 28, 2018, and prior to such date the Investment Adviser may not terminate the arrangements without the approval of the Fund’s Board of Trustees. If these arrangements are discontinued in the future, the expense ratios may change without shareholder approval. |
| TOP TEN HOLDINGS AS OF 6/30/175 | ||||||||
| Holding | % of Total Net Assets | Subsectors | ||||||
| Simon Property Group, Inc. (REIT) | 9.1 | % | Retail | |||||
| AvalonBay Communities, Inc. (REIT) | 6.5 | Residential | ||||||
| Equinix, Inc. (REIT) | 6.0 | Technology | ||||||
| Equity Residential (REIT) | 6.0 | Residential | ||||||
| Mid-America Apartment Communities, Inc. (REIT) | 5.5 | Residential | ||||||
| Vornado Realty Trust (REIT) | 5.4 | Office | ||||||
| Boston Properties, Inc. (REIT) | 5.2 | Office | ||||||
| Welltower, Inc. (REIT) | 4.4 | Health Care | ||||||
| HCP, Inc. (REIT) | 3.7 | Health Care | ||||||
| Public Storage (REIT) | 3.5 | Self Storage | ||||||
| 5 | The top 10 holdings may not be representative of the Fund’s future investments. |
20
FUND BASICS
| FUND VS. BENCHMARK SECTOR ALLOCATION6 |
| As of June 30, 2017 |
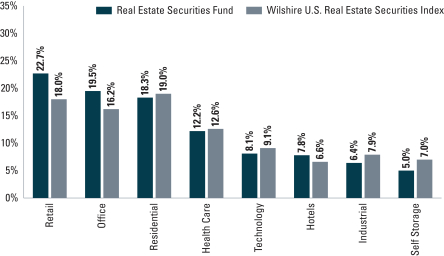
| 6 | The Fund is actively managed and, as such, its composition may differ over time. Consequently, the Fund’s overall industry sector allocations may differ from percentages contained in the graph above. The graph categorizes investments using Global Industry Classification Standard (“GICS”), however, the sector classifications used by the portfolio management team may differ from GICS. The percentage shown for each investment category reflects the value of investments in that category as a percentage of market value. Underlying sector allocations of exchange traded funds and investment companies held by the Fund are not reflected in the graph above |
21
INDEX DEFINITIONS
S&P® 500 Index: The S&P 500 Index is the Standard & Poor’s 500 Composite Index of 500 stocks, an unmanaged index of common stock prices.
MSCI EAFE® Index: The MSCI EAFE Index (Europe, Australasia, Far East) is a free float-adjusted market capitalization index that is designed to measure the equity market performance of developed markets, excluding the US & Canada. As of June 30, 2017, the MSCI EAFE Index consists of the following 21 developed market country indexes: Australia, Austria, Belgium, Denmark, Finland, France, Germany, Hong Kong, Ireland, Israel, Italy, Japan, the Netherlands, New Zealand, Norway, Portugal, Singapore, Spain, Sweden, Switzerland, and the United Kingdom.
The Index figures do not include any deduction for fees, expenses or taxes. It is not possible to invest directly in an unmanaged index.
22
GOLDMAN SACHS GLOBAL REAL ESTATE SECURITIES FUND
June 30, 2017 (Unaudited)
| Shares | Description | Value | ||||||
| Common Stocks – 98.4% | ||||||||
| Australia – 5.5% | ||||||||
| 1,158,570 | GPT Group (The) (REIT) (Diversified) | $ | 4,261,251 | |||||
| 2,410,335 | Mirvac Group (REIT) (Diversified) | 3,941,482 | ||||||
| 1,328,939 | Scentre Group (REIT) (Retail) | 4,131,801 | ||||||
| 793,999 | Vicinity Centres (REIT) (Retail) | 1,566,731 | ||||||
|
| |||||||
| 13,901,265 | ||||||||
|
| |||||||
| Canada – 2.8% | ||||||||
| 44,093 | Allied Properties REIT (REIT) (Office) | 1,323,334 | ||||||
| 64,061 | Canadian REIT (REIT) (Diversified) | 2,265,946 | ||||||
| 108,919 | Chartwell Retirement Residences (REIT) (Health Care) | 1,301,014 | ||||||
| 120,697 | RioCan REIT (REIT) (Retail) | 2,240,266 | ||||||
|
| |||||||
| 7,130,560 | ||||||||
|
| |||||||
| Finland – 0.6% | ||||||||
| 569,150 | Citycon OYJ (Retail) | 1,493,510 | ||||||
|
| |||||||
| France – 3.9% | ||||||||
| 41,702 | Fonciere Des Regions (REIT) (Diversified) | 3,868,226 | ||||||
| 150,126 | Klepierre (REIT) (Retail) | 6,153,031 | ||||||
|
| |||||||
| 10,021,257 | ||||||||
|
| |||||||
| Germany – 3.2% | ||||||||
| 205,601 | Vonovia SE (Residential) | 8,180,078 | ||||||
|
| |||||||
| Hong Kong – 8.1% | ||||||||
| 541,000 | Cheung Kong Property Holdings Ltd. (Diversified) | 4,233,478 | ||||||
| 710,500 | Hongkong Land Holdings Ltd. (Diversified) | 5,228,729 | ||||||
| 532,500 | Link REIT (REIT) (Retail) | 4,050,749 | ||||||
| 1,899,201 | Mapletree Greater China Commercial Trust (REIT) (Retail) | 1,489,427 | ||||||
| 385,000 | Sun Hung Kai Properties Ltd. (Diversified) | 5,655,717 | ||||||
|
| |||||||
| 20,658,100 | ||||||||
|
| |||||||
| Ireland – 1.4% | ||||||||
| 2,171,081 | Green REIT plc (REIT) (Office) | 3,528,613 | ||||||
|
| |||||||
| Japan – 10.6% | ||||||||
| 2,070 | AEON REIT Investment Corp. (REIT) (Retail) | 2,281,230 | ||||||
| 1,054 | Kenedix Retail REIT Corp. (REIT) (Retail) | 2,225,096 | ||||||
| 273,800 | Mitsui Fudosan Co. Ltd. (Diversified) | 6,559,840 | ||||||
| 188 | Nippon Building Fund, Inc. (REIT) (Office) | 959,431 | ||||||
| 2,716 | Nomura Real Estate Master Fund, Inc. (REIT) (Diversified) | 3,711,484 | ||||||
| 4,140 | Orix JREIT, Inc. (REIT) (Diversified) | 6,108,634 | ||||||
| 162,000 | Sumitomo Realty & Development Co. Ltd. (Diversified) | 5,016,858 | ||||||
|
| |||||||
| 26,862,573 | ||||||||
|
| |||||||
| Common Stocks – (continued) | ||||||||
| Norway – 1.2% | ||||||||
| 245,124 | Entra ASA (Office)(a) | 3,053,498 | ||||||
|
| |||||||
| Singapore – 2.5% | ||||||||
| 1,121,200 | Ascendas REIT (REIT) (Industrial) | 2,124,397 | ||||||
| 474,200 | City Developments Ltd. (Diversified) | 3,693,836 | ||||||
| 481,200 | Mapletree Commercial Trust (REIT) (Retail) | 557,482 | ||||||
|
| |||||||
| 6,375,715 | ||||||||
|
| |||||||
| Spain – 1.7% | ||||||||
| 343,614 | Merlin Properties Socimi SA (REIT) (Diversified) | 4,346,939 | ||||||
|
| |||||||
| Switzerland – 1.3% | ||||||||
| 34,729 | PSP Swiss Property AG (Registered) (Office) | 3,249,342 | ||||||
|
| |||||||
| United Kingdom – 4.2% | ||||||||
| 208,305 | Big Yellow Group plc (REIT) (Self Storage) | 2,148,750 | ||||||
| 389,617 | Hammerson plc (REIT) (Retail) | 2,915,076 | ||||||
| 1,372,420 | Tritax Big Box REIT plc (REIT) (Industrial) | 2,613,337 | ||||||
| 347,880 | UNITE Group plc (The) (REIT) (Residential) | 2,940,529 | ||||||
|
| |||||||
| 10,617,692 | ||||||||
|
| |||||||
| United States – 51.4% | ||||||||
| 137,859 | Acadia Realty Trust (REIT) (Retail) | 3,832,480 | ||||||
| 38,575 | Alexandria Real Estate Equities, Inc. (REIT) (Office) | 4,647,130 | ||||||
| 17,638 | American Tower Corp. (REIT) (Technology) | 2,333,860 | ||||||
| 45,848 | AvalonBay Communities, Inc. (REIT) (Residential) | 8,810,610 | ||||||
| 64,521 | Boston Properties, Inc. (REIT) (Office) | 7,937,373 | ||||||
| 276,767 | Brixmor Property Group, Inc. (REIT) (Retail) | 4,948,594 | ||||||
| 136,635 | Chesapeake Lodging Trust (REIT) (Hotel) | 3,343,459 | ||||||
| 163,358 | Columbia Property Trust, Inc. (REIT) (Office) | 3,655,952 | ||||||
| 97,487 | CyrusOne, Inc. (REIT) (Technology) | 5,434,900 | ||||||
| 437,277 | DDR Corp. (REIT) (Retail) | 3,966,102 | ||||||
| 27,525 | EastGroup Properties, Inc. (REIT) (Industrial) | 2,306,595 | ||||||
| 125,460 | Equity Residential (REIT) (Residential) | 8,259,032 | ||||||
| 39,149 | Federal Realty Investment Trust (REIT) (Retail) | 4,948,042 | ||||||
| 164,183 | HCP, Inc. (REIT) (Health Care) | 5,247,289 | ||||||
| 118,357 | Hudson Pacific Properties, Inc. (REIT) (Office) | 4,046,626 | ||||||
| 49,208 | Life Storage, Inc. (REIT) (Self Storage) | 3,646,313 | ||||||
|
| |||||||
| The accompanying notes are an integral part of these financial statements. | 23 |
GOLDMAN SACHS GLOBAL REAL ESTATE SECURITIES FUND
Schedule of Investments (continued)
June 30, 2017 (Unaudited)
| Shares | Description | Value | ||||||
| Common Stocks – (continued) | ||||||||
| United States – (continued) | ||||||||
| 83,637 | Mid-America Apartment Communities, Inc. (REIT) (Residential) | $ | 8,813,667 | |||||
| 64,968 | Pebblebrook Hotel Trust (REIT) (Hotel) | 2,094,568 | ||||||
| 42,610 | Prologis, Inc. (REIT) (Industrial) | 2,498,650 | ||||||
| 24,467 | Public Storage (REIT) (Self Storage) | 5,102,104 | ||||||
| 203,364 | RLJ Lodging Trust (REIT) (Hotel) | 4,040,843 | ||||||
| 75,277 | Simon Property Group, Inc. (REIT) (Retail) | 12,176,808 | ||||||
| 56,538 | Taubman Centers, Inc. (REIT) (Retail) | 3,366,838 | ||||||
| 79,274 | Vornado Realty Trust (REIT) (Office) | 7,443,829 | ||||||
| 103,691 | Welltower, Inc. (REIT) (Health Care) | 7,761,271 | ||||||
|
| |||||||
| 130,662,935 | ||||||||
|
| |||||||
| TOTAL COMMON STOCKS | ||||||||
| (Cost $247,634,281) | $ | 250,082,077 | ||||||
|
| |||||||
| Shares | Distribution Rate | Value | ||||||
| Investment Company(b)(c) – 0.0% | ||||||||
| | Goldman Sachs Financial Square Government Fund – | | ||||||
| 844 | 0.845% | $ | 844 | |||||
| (Cost $844) | ||||||||
|
| |||||||
| TOTAL INVESTMENTS – 98.4% | ||||||||
| (Cost $247,635,125) | $ | 250,082,921 | ||||||
|
| |||||||
| | OTHER ASSETS IN EXCESS OF LIABILITIES – 1.6% | 3,983,697 | ||||||
|
| |||||||
| NET ASSETS – 100.0% | $ | 254,066,618 | ||||||
|
| |||||||
| The percentage shown for each investment category reflects the value of investments in that category as a percentage of net assets. | ||
(a) | Exempt from registration under Rule 144A of the Securities Act of 1933. Under procedures approved by the Board of Trustees, such securities may be deemed liquid by the Investment Adviser and may be resold, normally to qualified institutional buyers in transactions exempt from registration. Total market value of Rule 144A securities amounts to $3,053,498, which represents approximately 1.2% of net assets as of June 30, 2017. | |
(b) | Represents an affiliated issuer. | |
(c) | Variable rate security. Interest rate or distribution rate disclosed is that which is in effect on June 30, 2017. | |
| ||
Investment Abbreviation: | ||
REIT | —Real Estate Investment Trust | |
| ||
| 24 | The accompanying notes are an integral part of these financial statements. |
GOLDMAN SACHS INTERNATIONAL REAL ESTATE SECURITIES FUND
Schedule of Investments
June 30, 2017 (Unaudited)
| Shares | Description | Value | ||||||
| Common Stocks – 98.9% | ||||||||
| Australia – 12.0% | ||||||||
| 1,348,711 | GPT Group (The) (REIT) (Diversified) | $ | 4,960,594 | |||||
| 2,979,462 | Mirvac Group (REIT) (Diversified) | 4,872,143 | ||||||
| 1,502,642 | Scentre Group (REIT) (Retail) | 4,671,860 | ||||||
| 1,454,493 | Vicinity Centres (REIT) (Retail) | 2,870,029 | ||||||
|
| |||||||
| 17,374,626 | ||||||||
|
| |||||||
| Canada – 5.2% | ||||||||
| 70,291 | Allied Properties REIT (REIT) (Office) | 2,109,597 | ||||||
| 60,963 | Canadian REIT (REIT) (Diversified) | 2,156,364 | ||||||
| 83,078 | Chartwell Retirement Residences (REIT) (Health Care) | 992,349 | ||||||
| 120,227 | RioCan REIT (REIT) (Retail) | 2,231,542 | ||||||
|
| |||||||
| 7,489,852 | ||||||||
|
| |||||||
| Finland – 0.7% | ||||||||
| 379,184 | Citycon OYJ (Retail) | 995,019 | ||||||
|
| |||||||
| France – 11.4% | ||||||||
| 36,479 | Fonciere Des Regions (REIT) (Diversified) | 3,383,747 | ||||||
| 143,111 | Klepierre (REIT) (Retail) | 5,865,516 | ||||||
| 28,564 | Unibail-Rodamco SE (REIT) (Retail) | 7,197,468 | ||||||
|
| |||||||
| 16,446,731 | ||||||||
|
| |||||||
| Germany – 6.3% | ||||||||
| 230,469 | Vonovia SE (Residential) | 9,169,480 | ||||||
|
| |||||||
| Hong Kong – 18.3% | ||||||||
| 866,500 | Cheung Kong Property Holdings Ltd. (Diversified) | 6,780,607 | ||||||
| 702,800 | Hongkong Land Holdings Ltd. (Diversified) | 5,172,063 | ||||||
| 575,000 | Link REIT (REIT) (Retail) | 4,374,048 | ||||||
| 2,829,702 | Mapletree Greater China Commercial Trust (REIT) (Retail) | 2,219,162 | ||||||
| 542,475 | Sun Hung Kai Properties Ltd. (Diversified) | 7,969,053 | ||||||
|
| |||||||
| 26,514,933 | ||||||||
|
| |||||||
| Ireland – 1.5% | ||||||||
| 1,364,049 | Green REIT plc (REIT) (Office) | 2,216,961 | ||||||
|
| |||||||
| Japan – 23.6% | ||||||||
| 1,986 | AEON REIT Investment Corp. (REIT) (Retail) | 2,188,659 | ||||||
| 951 | Kenedix Retail REIT Corp. (REIT) (Retail) | 2,007,653 | ||||||
| 189,300 | Mitsubishi Estate Co. Ltd. (Diversified) | 3,538,547 | ||||||
| 333,600 | Mitsui Fudosan Co. Ltd. (Diversified) | 7,992,559 | ||||||
| 876 | Nippon Building Fund, Inc. (REIT) (Office) | 4,470,540 | ||||||
| 3,353 | Nomura Real Estate Master Fund, Inc. (REIT) (Diversified) | 4,581,961 | ||||||
| 2,999 | Orix JREIT, Inc. (REIT) (Diversified) | 4,425,071 | ||||||
|
| |||||||
| Common Stocks – (continued) | ||||||||
| Japan – (continued) | ||||||||
| 162,000 | Sumitomo Realty & Development Co. Ltd. (Diversified) | 5,016,858 | ||||||
|
| |||||||
| 34,221,848 | ||||||||
|
| |||||||
| Norway – 1.4% | ||||||||
| 160,331 | Entra ASA (Office)(a) | 1,997,236 | ||||||
|
| |||||||
| Singapore – 4.5% | ||||||||
| 1,045,000 | Ascendas REIT (REIT) (Industrial) | 1,980,017 | ||||||
| 480,100 | City Developments Ltd. (Diversified) | 3,739,794 | ||||||
| 693,200 | Mapletree Commercial Trust (REIT) (Retail) | 803,090 | ||||||
|
| |||||||
| 6,522,901 | ||||||||
|
| |||||||
| Spain – 2.3% | ||||||||
| 267,469 | Merlin Properties Socimi SA (REIT) (Diversified) | 3,383,656 | ||||||
|
| |||||||
| Sweden – 0.8% | ||||||||
| 71,340 | Hufvudstaden AB Class A (Office) | 1,183,724 | ||||||
|
| |||||||
| Switzerland – 1.7% | ||||||||
| 25,827 | PSP Swiss Property AG (Registered) (Office) | 2,416,446 | ||||||
|
| |||||||
| United Kingdom – 9.2% | ||||||||
| 221,910 | Big Yellow Group plc (REIT) (Self Storage) | 2,289,091 | ||||||
| 233,193 | British Land Co. plc (The) (REIT) (Diversified) | 1,840,953 | ||||||
| 45,775 | Derwent London plc (REIT) (Office) | 1,582,198 | ||||||
| 428,432 | Hammerson plc (REIT) (Retail) | 3,205,485 | ||||||
| 1,092,260 | Tritax Big Box REIT plc (REIT) (Industrial) | 2,079,862 | ||||||
| 284,130 | UNITE Group plc (The) (REIT) (Residential) | 2,401,669 | ||||||
|
| |||||||
| 13,399,258 | ||||||||
|
| |||||||
| TOTAL COMMON STOCKS | ||||||||
| (Cost $146,436,718) | $ | 143,332,671 | ||||||
|
| |||||||
| Shares | Distribution Rate | Value | ||||||
| Investment Company(b)(c) – 0.0% | ||||||||
| | Goldman Sachs Financial Square Government Fund – | | ||||||
| 690 | 0.845% | $ | 690 | |||||
| (Cost $690) | ||||||||
|
| |||||||
| TOTAL INVESTMENTS – 98.9% | ||||||||
| (Cost $146,437,408) | $ | 143,333,361 | ||||||
|
| |||||||
| | OTHER ASSETS IN EXCESS OF LIABILITIES – 1.1% | 1,566,303 | ||||||
|
| |||||||
| NET ASSETS – 100.0% | $ | 144,899,664 | ||||||
|
| |||||||
| The accompanying notes are an integral part of these financial statements. | 25 |
GOLDMAN SACHS INTERNATIONAL REAL ESTATE SECURITIES FUND
Schedule of Investments (continued)
June 30, 2017 (Unaudited)
| The percentage shown for each investment category reflects the value of investments in that category as a percentage of net assets. | ||
(a) | Exempt from registration under Rule 144A of the Securities Act of 1933. Under procedures approved by the Board of Trustees, such securities may be deemed liquid by the Investment Adviser and may be resold, normally to qualified institutional buyers in transactions exempt from registration. Total market value of Rule 144A securities amounts to $1,997,236, which represents approximately 1.4% of net assets as of June 30, 2017. | |
(b) | Represents an affiliated issuer. | |
(c) | Variable rate security. Interest rate or distribution rate disclosed is that which is in effect on June 30, 2017. | |
| ||
Investment Abbreviation: | ||
REIT | —Real Estate Investment Trust | |
| ||
| 26 | The accompanying notes are an integral part of these financial statements. |
GOLDMAN SACHS REAL ESTATE SECURITIES FUND
Schedule of Investments
June 30, 2017 (Unaudited)
| Shares | Description | Value | ||||||
| Common Stocks – 98.0% | ||||||||
| Health Care – 12.0% | ||||||||
| 123,006 | Brookdale Senior Living, Inc.* | $ | 1,809,418 | |||||
| 41,355 | Care Capital Properties, Inc. (REIT) | 1,104,179 | ||||||
| 368,306 | HCP, Inc. (REIT) | 11,771,060 | ||||||
| 133,362 | Ventas, Inc. (REIT) | 9,265,992 | ||||||
| 188,239 | Welltower, Inc. (REIT) | 14,089,689 | ||||||
|
| |||||||
| 38,040,338 | ||||||||
|
| |||||||
| Hotel – 7.6% | ||||||||
| 414,839 | Chesapeake Lodging Trust (REIT) | 10,151,110 | ||||||
| 223,706 | Pebblebrook Hotel Trust (REIT) | 7,212,281 | ||||||
| 343,726 | RLJ Lodging Trust (REIT) | 6,829,836 | ||||||
|
| |||||||
| 24,193,227 | ||||||||
|
| |||||||
| Industrial – 6.2% | ||||||||
| 57,771 | EastGroup Properties, Inc. (REIT) | 4,841,210 | ||||||
| 141,826 | Liberty Property Trust (REIT) | 5,773,736 | ||||||
| 155,647 | Prologis, Inc. (REIT) | 9,127,140 | ||||||
|
| |||||||
| 19,742,086 | ||||||||
|
| |||||||
| Office – 19.1% | ||||||||
| 81,035 | Alexandria Real Estate Equities, Inc. (REIT) | 9,762,286 | ||||||
| 132,982 | Boston Properties, Inc. (REIT) | 16,359,446 | ||||||
| 354,283 | Columbia Property Trust, Inc. (REIT) | 7,928,854 | ||||||
| 276,597 | Hudson Pacific Properties, Inc. (REIT) | 9,456,851 | ||||||
| 182,167 | Vornado Realty Trust (REIT) | 17,105,481 | ||||||
|
| |||||||
| 60,612,918 | ||||||||
|
| |||||||
| Residential – 18.0% | ||||||||
| 107,307 | AvalonBay Communities, Inc. (REIT) | 20,621,186 | ||||||
| 288,460 | Equity Residential (REIT) | 18,989,322 | ||||||
| 165,158 | Mid-America Apartment Communities, Inc. (REIT) | 17,404,350 | ||||||
|
| |||||||
| 57,014,858 | ||||||||
|
| |||||||
| Retail – 22.3% | ||||||||
| 163,830 | Acadia Realty Trust (REIT) | 4,554,474 | ||||||
| 521,434 | Brixmor Property Group, Inc. (REIT) | 9,323,240 | ||||||
| 1,107,236 | DDR Corp. (REIT) | 10,042,631 | ||||||
| 83,709 | Federal Realty Investment Trust (REIT) | 10,579,980 | ||||||
| 179,496 | Simon Property Group, Inc. (REIT) | 29,035,273 | ||||||
| 119,583 | Taubman Centers, Inc. (REIT) | 7,121,168 | ||||||
|
| |||||||
| 70,656,766 | ||||||||
|
| |||||||
| Self Storage – 4.9% | ||||||||
| 60,677 | Life Storage, Inc. (REIT) | 4,496,166 | ||||||
| 53,374 | Public Storage (REIT) | 11,130,080 | ||||||
|
| |||||||
| 15,626,246 | ||||||||
|
| |||||||
| Technology – 7.9% | ||||||||
| 109,275 | CyrusOne, Inc. (REIT) | 6,092,081 | ||||||
| 44,530 | Equinix, Inc. (REIT) | 19,110,495 | ||||||
|
| |||||||
| 25,202,576 | ||||||||
|
| |||||||
| TOTAL COMMON STOCKS | ||||||||
| (Cost $224,687,804) | $ | 311,089,015 | ||||||
|
| |||||||
| Shares | Distribution Rate | Value | ||||||
| Investment Company(a)(b) – 0.0% | ||||||||
| | Goldman Sachs Financial Square Government Fund – | | ||||||
| 15,412 | 0.845% | $ | 15,412 | |||||
| (Cost $15,412) | ||||||||
|
| |||||||
| TOTAL INVESTMENTS – 98.0% | ||||||||
| (Cost $224,703,216) | $ | 311,104,427 | ||||||
|
| |||||||
| | OTHER ASSETS IN EXCESS OF LIABILITIES – 2.0% | 6,367,352 | ||||||
|
| |||||||
| NET ASSETS – 100.0% | $ | 317,471,779 | ||||||
|
| |||||||
| The percentage shown for each investment category reflects the value of investments in that category as a percentage of net assets. | ||
* | Non-income producing security. | |
(a) | Represents an affiliated issuer. | |
(b) | Variable rate security. Interest rate or distribution rate disclosed is that which is in effect on June 30, 2017. | |
| ||
Investment Abbreviation: | ||
REIT | —Real Estate Investment Trust | |
| ||
| The accompanying notes are an integral part of these financial statements. | 27 |
GOLDMAN SACHS REAL ESTATE SECURITIES FUNDS
Statements of Assets and Liabilities
June 30, 2017 (Unaudited)
| Global Real Estate Securities Fund | International Real Estate Securities Fund | Real Estate Securities Fund | ||||||||||||
| Assets: | ||||||||||||||
Investments in unaffiliated issuers, at value (cost $247,634,281, $146,436,718 and $224,687,804) | $ | 250,082,077 | $ | 143,332,671 | $ | 311,089,015 | ||||||||
Investments in affiliated issuers, at value (cost $844, $690 and $15,412) | 844 | 690 | 15,412 | |||||||||||
Cash | 3,049,945 | 1,033,754 | 4,839,157 | |||||||||||
Foreign currencies, at value (cost $29,697, $193,893 and $0) | 34,449 | 194,207 | — | |||||||||||
Receivables: | ||||||||||||||
Dividends | 1,109,098 | 518,504 | 1,247,772 | |||||||||||
Investments sold | 449,314 | 669,364 | 3,601,417 | |||||||||||
Foreign tax reclaims | 68,287 | 211,673 | — | |||||||||||
Reimbursement from investment adviser | 14,249 | 31,344 | 27,256 | |||||||||||
Fund shares sold | 6,161 | 115,516 | 493,598 | |||||||||||
Other assets | 102 | 830 | 1,325 | |||||||||||
| Total assets | 254,814,526 | 146,108,553 | 321,314,952 | |||||||||||
| Liabilities: | ||||||||||||||
Payables: | ||||||||||||||
Investments purchased | 444,057 | 639,698 | 2,280,690 | |||||||||||
Management fees | 198,299 | 116,852 | 230,626 | |||||||||||
Distribution and Service fees and Transfer Agency fees | 8,601 | 7,577 | 43,319 | |||||||||||
Fund shares redeemed | 4,812 | 330,909 | 1,183,262 | |||||||||||
Accrued expenses | 92,139 | 113,853 | 105,276 | |||||||||||
| Total liabilities | 747,908 | 1,208,889 | 3,843,173 | |||||||||||
| Net Assets: | ||||||||||||||
Paid-in capital | 251,816,574 | 417,064,278 | 194,570,117 | |||||||||||
Undistributed (distributions in excess of) net investment income | 179,049 | (3,980,237 | ) | 357,458 | ||||||||||
Accumulated net realized gain (loss) | (384,017 | ) | (265,086,973 | ) | 36,142,993 | |||||||||
Net unrealized gain (loss) | 2,455,012 | (3,097,404 | ) | 86,401,211 | ||||||||||
| NET ASSETS | $ | 254,066,618 | $ | 144,899,664 | $ | 317,471,779 | ||||||||
Net Assets: | ||||||||||||||
Class A | $ | 33,127 | $ | 4,971,215 | $ | 46,970,421 | ||||||||
Class C | 37,253 | 927,109 | 13,616,506 | |||||||||||
Institutional | 253,913,617 | 138,752,820 | 239,548,916 | |||||||||||
Service | — | — | 2,479,276 | |||||||||||
Class IR | 27,595 | 238,318 | 11,480,571 | |||||||||||
Class R | 27,344 | — | 3,321,048 | |||||||||||
Class R6 | 27,682 | 10,202 | 55,041 | |||||||||||
Total Net Assets | $ | 254,066,618 | $ | 144,899,664 | $ | 317,471,779 | ||||||||
Shares outstanding $0.001 par value (unlimited shares authorized): | ||||||||||||||
Class A | 3,222 | 810,900 | 2,578,153 | |||||||||||
Class C | 3,627 | 150,974 | 773,136 | |||||||||||
Institutional | 24,671,459 | 23,389,102 | 12,854,809 | |||||||||||
Service | — | — | 135,220 | |||||||||||
Class IR | 2,682 | 39,214 | 626,800 | |||||||||||
Class R | 2,660 | — | 183,606 | |||||||||||
Class R6 | 2,690 | 1,722 | 2,954 | |||||||||||
Net asset value, offering and redemption price per share:(a) | ||||||||||||||
Class A | $10.28 | $6.13 | $18.22 | |||||||||||
Class C | 10.27 | 6.14 | 17.61 | |||||||||||
Institutional | 10.29 | 5.93 | 18.63 | |||||||||||
Service | — | — | 18.34 | |||||||||||
Class IR | 10.29 | 6.08 | 18.32 | |||||||||||
Class R | 10.28 | — | 18.09 | |||||||||||
Class R6 | 10.29 | 5.93 | 18.63 | |||||||||||
| (a) | Maximum public offering price per share for Class A Shares of the Global Real Estate Securities, International Real Estate Securities and Real Estate Securities Funds is $10.88, $6.49 and $19.28, respectively. At redemption, Class C Shares may be subject to a contingent deferred sales charge assessed on the amount equal to the lesser of the current NAV or the original purchase price of the shares. |
| 28 | The accompanying notes are an integral part of these financial statements. |
GOLDMAN SACHS REAL ESTATE SECURITIES FUNDS
Statements of Operations
For the Six Months Ended June 30, 2017 (Unaudited)
| Global Real Estate Securities Fund | International Real Estate Securities Fund | Real Estate Securities Fund | ||||||||||||
| Investment income: | ||||||||||||||
Dividends — unaffiliated issuers (net of foreign taxes withheld of $129,486, $451,007 and $0) | $ | 1,953,466 | $ | 4,574,502 | $ | 5,588,482 | ||||||||
Dividends — affiliated issuers | 6,779 | 1,560 | 4,533 | |||||||||||
Securities lending income — affiliated issuer | 709 | 40,837 | — | |||||||||||
| Total investment income | 1,960,954 | 4,616,899 | 5,593,015 | |||||||||||
| Expenses: | ||||||||||||||
Management fees | 546,197 | 1,272,271 | 2,093,256 | |||||||||||
Registration fees | 53,118 | 35,092 | 48,250 | |||||||||||
Custody, accounting and administrative services | 49,883 | 74,900 | 46,763 | |||||||||||
Professional fees | 45,324 | 46,601 | 46,006 | |||||||||||
Transfer Agency fees(a) | 20,897 | 53,304 | 142,465 | |||||||||||
Printing and mailing costs | 10,235 | 12,438 | 19,209 | |||||||||||
Trustee fees | 8,253 | 8,427 | 8,632 | |||||||||||
Distribution and Service fees(a) | 291 | 11,737 | 142,923 | |||||||||||
Service share fees — Service Plan | — | — | 3,370 | |||||||||||
Service share fees — Shareholder Administration Plan | — | — | 3,370 | |||||||||||
Other | 3,956 | 12,883 | 15,826 | |||||||||||
| Total expenses | 738,154 | 1,527,653 | 2,570,070 | |||||||||||
Less — expense reductions | (217,174 | ) | (308,044 | ) | (451,571 | ) | ||||||||
| Net expenses | 520,980 | 1,219,609 | 2,118,499 | |||||||||||
| NET INVESTMENT INCOME | 1,439,974 | 3,397,290 | 3,474,516 | |||||||||||
| Realized and unrealized gain (loss): | ||||||||||||||
Net realized gain (loss) from: | ||||||||||||||
Investments | (193,432 | ) | (1,615,687 | ) | 35,586,511 | |||||||||
Foreign currency transactions | 85,608 | 17,796 | — | |||||||||||
Net change in unrealized gain (loss) on: | ||||||||||||||
Investments | 2,307,698 | 21,301,812 | (39,891,291 | ) | ||||||||||
Foreign currency translation | 7,402 | 23,387 | — | |||||||||||
| Net realized and unrealized gain (loss) | 2,207,276 | 19,727,308 | (4,304,780 | ) | ||||||||||
| NET INCREASE (DECREASE) IN NET ASSETS RESULTING FROM OPERATIONS | $ | 3,647,250 | $ | 23,124,598 | $ | (830,264 | ) | |||||||
| (a) | Class specific Distribution and Service, and Transfer Agency fees were as follows: |
| Distribution and Service Fees | Transfer Agency Fees | |||||||||||||||||||||||||||||||||||||||
Fund | Class A | Class C | Class R | Class A | Class C | Institutional | Service | Class IR | Class R | Class R6 | ||||||||||||||||||||||||||||||
Global Real Estate Securities | $ | 41 | $ | 183 | $ | 67 | $ | 31 | $ | 35 | $ | 20,778 | $ | — | $ | 25 | $ | 25 | $ | 3 | ||||||||||||||||||||
International Real Estate Securities | 6,438 | 5,299 | — | 4,893 | 1,007 | 47,176 | — | 226 | — | 2 | ||||||||||||||||||||||||||||||
Real Estate Securities | 61,049 | 72,817 | 9,057 | 46,398 | 13,835 | 67,518 | 539 | 10,729 | 3,442 | 4 | ||||||||||||||||||||||||||||||
| The accompanying notes are an integral part of these financial statements. | 29 |
GOLDMAN SACHS REAL ESTATE SECURITIES FUNDS
Statements of Changes in Net Assets
| Global Real Estate Securities Fund | ||||||||||
| For the Six Months Ended June 30, 2017 (Unaudited) | For the Fiscal Year Ended December 31, 2016 | |||||||||
| From operations: | ||||||||||
Net investment income | $ | 1,439,974 | $ | 419,966 | ||||||
Net realized gain (loss) | (107,824 | ) | 369,985 | |||||||
Net change in unrealized gain (loss) | 2,315,100 | (3,876 | ) | |||||||
| Net increase (decrease) in net assets resulting from operations | 3,647,250 | 786,075 | ||||||||
| Distributions to shareholders: | ||||||||||
From net investment income | ||||||||||
Class A Shares | (246 | ) | (842 | ) | ||||||
Class C Shares | (147 | ) | (700 | ) | ||||||
Institutional Shares | (1,142,460 | ) | (778,447 | ) | ||||||
Service Shares | — | — | ||||||||
Class IR Shares | (236 | ) | (803 | ) | ||||||
Class R Shares | (171 | ) | (674 | ) | ||||||
Class R6 Shares | (258 | ) | (848 | ) | ||||||
From net realized gains | ||||||||||
Class A Shares | — | (519 | ) | |||||||
Class C Shares | — | (598 | ) | |||||||
Institutional Shares | — | (389,818 | ) | |||||||
Service Shares | — | — | ||||||||
Class IR Shares | — | (439 | ) | |||||||
Class R Shares | — | (437 | ) | |||||||
Class R6 Shares | — | (440 | ) | |||||||
Return of capital | ||||||||||
Class A Shares | — | (58 | ) | |||||||
Class C Shares | — | (56 | ) | |||||||
Institutional Shares | — | (50,233 | ) | |||||||
Class IR Shares | — | (53 | ) | |||||||
Class R Shares | — | (48 | ) | |||||||
Class R6 Shares | — | (55 | ) | |||||||
| Total distributions to shareholders | (1,143,518 | ) | (1,225,068 | ) | ||||||
| From share transactions: | ||||||||||
Proceeds from sales of shares | 234,696,662 | �� | 27,993,164 | |||||||
Reinvestment of distributions | 1,143,257 | 1,224,558 | ||||||||
Cost of shares redeemed | (12,087,841 | ) | (4,142,946 | ) | ||||||
| Net increase (decrease) in net assets resulting from share transactions | 223,752,078 | 25,074,776 | ||||||||
| TOTAL INCREASE (DECREASE) | 226,255,810 | 24,635,783 | ||||||||
| Net assets: | ||||||||||
Beginning of period | 27,810,808 | 3,175,025 | ||||||||
End of period | $ | 254,066,618 | $ | 27,810,808 | ||||||
| Undistributed (distributions in excess of) net investment income | $ | 179,049 | $ | (117,407 | ) | |||||
| 30 | The accompanying notes are an integral part of these financial statements. |
GOLDMAN SACHS REAL ESTATE SECURITIES FUNDS
| International Real Estate Securities Fund | Real Estate Securities Fund | |||||||||||||||||||||
| For the Six Months Ended June 30, 2017 (Unaudited) | For the Fiscal Year Ended December 31, 2016 | For the Six Months Ended June 30, 2017 (Unaudited) | For the Fiscal Year Ended December 31, 2016 | |||||||||||||||||||
| $ | 3,397,290 | $ | 7,216,195 | $ | 3,474,516 | $ | 9,946,916 | |||||||||||||||
| (1,597,891 | ) | 6,477,835 | 35,586,511 | 38,429,822 | ||||||||||||||||||
| 21,325,199 | (18,985,322 | ) | (39,891,291 | ) | (19,980,756 | ) | ||||||||||||||||
| 23,124,598 | (5,291,292 | ) | (830,264 | ) | 28,395,982 | |||||||||||||||||
| (88,891 | ) | (241,374 | ) | (456,202 | ) | (964,655 | ) | |||||||||||||||
| (12,559 | ) | (41,069 | ) | (89,804 | ) | (152,384 | ) | |||||||||||||||
| (2,830,212 | ) | (14,133,328 | ) | (3,714,223 | ) | (8,365,302 | ) | |||||||||||||||
| — | — | (24,205 | ) | (47,259 | ) | |||||||||||||||||
| (4,592 | ) | (4,864 | ) | (132,090 | ) | (179,578 | ) | |||||||||||||||
| — | — | (28,958 | ) | (62,336 | ) | |||||||||||||||||
| (208 | ) | (442 | ) | (528 | ) | (492 | ) | |||||||||||||||
| — | — | — | (5,329,661 | ) | ||||||||||||||||||
| — | — | — | (1,539,421 | ) | ||||||||||||||||||
| — | — | — | (37,167,142 | ) | ||||||||||||||||||
| — | — | — | (271,040 | ) | ||||||||||||||||||
| — | — | — | (815,225 | ) | ||||||||||||||||||
| — | — | — | (407,707 | ) | ||||||||||||||||||
| — | — | — | (3,764 | ) | ||||||||||||||||||
| — | — | — | — | |||||||||||||||||||
| — | — | — | — | |||||||||||||||||||
| — | — | — | — | |||||||||||||||||||
| — | — | — | — | |||||||||||||||||||
| — | — | — | — | |||||||||||||||||||
| — | — | — | — | |||||||||||||||||||
| — | — | — | — | |||||||||||||||||||
| (2,936,462 | ) | (14,421,077 | ) | (4,446,010 | ) | (55,305,966 | ) | |||||||||||||||
| 13,679,457 | 68,521,464 | 47,910,650 | 90,156,219 | |||||||||||||||||||
| 2,925,908 | 14,399,299 | 4,336,724 | 53,858,862 | |||||||||||||||||||
| (196,030,951 | ) | (102,095,026 | ) | (212,772,671 | ) | (183,114,394 | ) | |||||||||||||||
| (179,425,586 | ) | (19,174,263 | ) | (160,525,297 | ) | (39,099,313 | ) | |||||||||||||||
| (159,237,450 | ) | (38,886,632 | ) | (165,801,571 | ) | (66,009,297 | ) | |||||||||||||||
| 304,137,114 | 343,023,746 | 483,273,350 | 549,282,647 | |||||||||||||||||||
| $ | 144,899,664 | $ | 304,137,114 | $ | 317,471,779 | $ | 483,273,350 | |||||||||||||||
| $ | (3,980,237 | ) | $ | (4,441,065 | ) | $ | 357,458 | $ | 1,328,952 | |||||||||||||
| The accompanying notes are an integral part of these financial statements. | 31 |
GOLDMAN SACHS GLOBAL REAL ESTATE SECURITIES FUND
Selected Data for a Share Outstanding Throughout Each Period
| Income (loss) from investment operations | Distributions to shareholders | |||||||||||||||||||||||||||||||||
| Year - Share Class | Net asset value, beginning of period | Net investment income(a) | Net realized and unrealized gain (loss) | Total from investment operations | From net investment income | From net realized gains | From capital | Total distributions | ||||||||||||||||||||||||||
| FOR THE SIX MONTHS ENDED JUNE 30, (UNAUDITED) | ||||||||||||||||||||||||||||||||||
2017 - A | $ | 10.05 | $ | 0.09 | $ | 0.22 | $ | 0.31 | $ | (0.08 | ) | $ | — | $ | — | $ | (0.08 | ) | ||||||||||||||||
2017 - C | 10.04 | 0.05 | 0.22 | 0.27 | (0.04 | ) | — | — | (0.04 | ) | ||||||||||||||||||||||||
2017 - Institutional | 10.06 | 0.14 | 0.19 | 0.33 | (0.10 | ) | — | — | (0.10 | ) | ||||||||||||||||||||||||
2017 - IR | 10.05 | 0.10 | 0.23 | 0.33 | (0.09 | ) | — | — | (0.09 | ) | ||||||||||||||||||||||||
2017 - R | 10.05 | 0.08 | 0.21 | 0.29 | (0.06 | ) | — | — | (0.06 | ) | ||||||||||||||||||||||||
2017 - R6 | 10.06 | 0.11 | 0.22 | 0.33 | (0.10 | ) | — | — | (0.10 | ) | ||||||||||||||||||||||||
| FOR THE FISCAL YEARS ENDED DECEMBER 31, | ||||||||||||||||||||||||||||||||||
2016 - A | 10.44 | 0.17 | (0.08 | ) | 0.09 | (0.29 | ) | (0.17 | ) | (0.02 | ) | (0.48 | ) | |||||||||||||||||||||
2016 - C | 10.43 | 0.10 | (0.09 | ) | 0.01 | (0.21 | ) | (0.17 | ) | (0.02 | ) | (0.40 | ) | |||||||||||||||||||||
2016 - Institutional | 10.44 | 0.24 | (0.10 | ) | 0.14 | (0.32 | ) | (0.17 | ) | (0.03 | ) | (0.52 | ) | |||||||||||||||||||||
2016 - IR | 10.44 | 0.20 | (0.09 | ) | 0.11 | (0.31 | ) | (0.17 | ) | (0.02 | ) | (0.50 | ) | |||||||||||||||||||||
2016 - R | 10.44 | 0.14 | (0.08 | ) | 0.06 | (0.26 | ) | (0.17 | ) | (0.02 | ) | (0.45 | ) | |||||||||||||||||||||
2016 - R6 | 10.44 | 0.21 | (0.07 | ) | 0.14 | (0.33 | ) | (0.17 | ) | (0.02 | ) | (0.52 | ) | |||||||||||||||||||||
| FOR THE PERIOD ENDED DECEMBER 31, | ||||||||||||||||||||||||||||||||||
2015 - A (Commenced August 31, 2015) | 10.00 | 0.05 | 0.52 | 0.57 | (0.12 | ) | (0.01 | ) | — | (0.13 | ) | |||||||||||||||||||||||
2015 - C (Commenced August 31, 2015) | 10.00 | 0.02 | 0.52 | 0.54 | (0.10 | ) | (0.01 | ) | — | (0.11 | ) | |||||||||||||||||||||||
2015 - Institutional (Commenced August 31, 2015) | 10.00 | 0.06 | 0.52 | 0.58 | (0.13 | ) | (0.01 | ) | — | (0.14 | ) | |||||||||||||||||||||||
2015 - IR (Commenced August 31, 2015) | 10.00 | 0.06 | 0.51 | 0.57 | (0.12 | ) | (0.01 | ) | — | (0.13 | ) | |||||||||||||||||||||||
2015 - R (Commenced August 31, 2015) | 10.00 | 0.04 | 0.52 | 0.56 | (0.11 | ) | (0.01 | ) | — | (0.12 | ) | |||||||||||||||||||||||
2015 - R6 (Commenced August 31, 2015) | 10.00 | 0.06 | 0.52 | 0.58 | (0.13 | ) | (0.01 | ) | — | (0.14 | ) | |||||||||||||||||||||||
| (a) | Calculated based on the average shares outstanding methodology. |
| (b) | Assumes investment at the net asset value at the beginning of the period, reinvestment of all distributions, a complete redemption of the investment at the net asset value at the end of the period and no sales or redemption charges. Total returns would be reduced if a sales or redemption charge was taken into account. Returns do not reflect the impact of taxes to shareholders relating to Fund distributions or the redemption of Fund shares. Total returns for periods less than one full year are not annualized. |
| (c) | The Fund’s portfolio turnover rate is calculated in accordance with regulatory requirements, without regard to transactions involving short term investments. If such transactions were included, the Fund’s portfolio turnover rate may be higher. |
| (d) | Annualized. |
| 32 | The accompanying notes are an integral part of these financial statements. |
GOLDMAN SACHS GLOBAL REAL ESTATE SECURITIES FUND
| Net asset value, end of period | Total return(b) | Net assets, end of period (in 000s) | Ratio of net expenses to average net assets | Ratio of total expenses to average net assets | Ratio of net investment income to average net assets | Portfolio turnover rate(c) | ||||||||||||||||||||||||||||||||||
| $ | 10.28 | 3.06 | % | $ | 33 | 1.40 | %(d) | 2.48 | %(d) | 1.80 | %(d) | 35 | % | |||||||||||||||||||||||||||
| 10.27 | 2.70 | 37 | 2.15 | (d) | 3.22 | (d) | 1.04 | (d) | 35 | |||||||||||||||||||||||||||||||
| 10.29 | 3.25 | 253,914 | 1.00 | (d) | 1.42 | (d) | 2.77 | (d) | 35 | |||||||||||||||||||||||||||||||
| 10.29 | 3.28 | 28 | 1.15 | (d) | 2.20 | (d) | 2.04 | (d) | 35 | |||||||||||||||||||||||||||||||
| 10.28 | 2.94 | 27 | 1.65 | (d) | 2.70 | (d) | 1.54 | (d) | 35 | |||||||||||||||||||||||||||||||
| 10.29 | 3.26 | 28 | 0.98 | (d) | 2.03 | (d) | 2.21 | (d) | 35 | |||||||||||||||||||||||||||||||
| 10.05 | 0.82 | 32 | 1.44 | 4.34 | 1.57 | 60 | ||||||||||||||||||||||||||||||||||
| 10.04 | 0.11 | 36 | 2.15 | 5.31 | 0.93 | 60 | ||||||||||||||||||||||||||||||||||
| 10.06 | 1.30 | 27,663 | 1.00 | 2.82 | 2.23 | 60 | ||||||||||||||||||||||||||||||||||
| 10.05 | 1.05 | 27 | 1.15 | 4.22 | 1.85 | 60 | ||||||||||||||||||||||||||||||||||
| 10.05 | 0.57 | 27 | 1.65 | 4.73 | 1.35 | 60 | ||||||||||||||||||||||||||||||||||
| 10.06 | 1.31 | 27 | 0.98 | 4.05 | 2.02 | 60 | ||||||||||||||||||||||||||||||||||
| 10.44 | 5.71 | 26 | 1.40 | (d) | 15.24 | (d) | 1.43 | (d) | 14 | |||||||||||||||||||||||||||||||
| 10.43 | 5.41 | 26 | 2.15 | (d) | 16.01 | (d) | 0.68 | (d) | 14 | |||||||||||||||||||||||||||||||
| 10.44 | 5.81 | 3,043 | 1.00 | (d) | 14.86 | (d) | 1.83 | (d) | 14 | |||||||||||||||||||||||||||||||
| 10.44 | 5.78 | 26 | 1.15 | (d) | 15.02 | (d) | 1.68 | (d) | 14 | |||||||||||||||||||||||||||||||
| 10.44 | 5.65 | 26 | 1.65 | (d) | 15.51 | (d) | 1.18 | (d) | 14 | |||||||||||||||||||||||||||||||
| 10.44 | 5.82 | 26 | 0.97 | (d) | 14.85 | (d) | 1.85 | (d) | 14 | |||||||||||||||||||||||||||||||
| The accompanying notes are an integral part of these financial statements. | 33 |
GOLDMAN SACHS INTERNATIONAL REAL ESTATE SECURITIES FUND
Financial Highlights
Selected Data for a Share Outstanding Throughout Each Period
| Income (loss) from investment operations | ||||||||||||||||||||||
| Year - Share Class | Net asset value, beginning of period | Net investment income(a) | Net realized and unrealized gain (loss) | Total from investment operations | Distributions to shareholders from net investment income | |||||||||||||||||
| FOR THE SIX MONTHS ENDED JUNE 30, (UNAUDITED) | ||||||||||||||||||||||
2017 - A | $ | 5.73 | $ | 0.08 | $ | 0.43 | $ | 0.51 | $ | (0.11 | ) | |||||||||||
2017 - C | 5.73 | 0.05 | 0.44 | 0.49 | (0.08 | ) | ||||||||||||||||
2017 - Institutional | 5.54 | 0.08 | 0.43 | 0.51 | (0.12 | ) | ||||||||||||||||
2017 - IR | 5.68 | 0.10 | 0.42 | 0.52 | (0.12 | ) | ||||||||||||||||
2017 - R6 | 5.54 | 0.09 | 0.42 | 0.51 | (0.12 | ) | ||||||||||||||||
| FOR THE FISCAL YEARS ENDED DECEMBER 31, | ||||||||||||||||||||||
2016 - A | 6.09 | 0.12 | (0.23 | ) | (0.11 | ) | (0.25 | ) | ||||||||||||||
2016 - C | 6.09 | 0.07 | (0.23 | ) | (0.16 | ) | (0.20 | ) | ||||||||||||||
2016 - Institutional | 5.91 | 0.14 | (0.24 | ) | (0.10 | ) | (0.27 | ) | ||||||||||||||
2016 - IR | 6.04 | 0.12 | (0.22 | ) | (0.10 | ) | (0.26 | ) | ||||||||||||||
2016 - R6 | 5.91 | 0.13 | (0.23 | ) | (0.10 | ) | (0.27 | ) | ||||||||||||||
2015 - A | 6.38 | 0.10 | (0.24 | ) | (0.14 | ) | (0.15 | ) | ||||||||||||||
2015 - C | 6.38 | 0.05 | (0.24 | ) | (0.19 | ) | (0.10 | ) | ||||||||||||||
2015 - Institutional | 6.19 | 0.12 | (0.22 | ) | (0.10 | ) | (0.18 | ) | ||||||||||||||
2015 - IR | 6.33 | 0.11 | (0.24 | ) | (0.13 | ) | (0.16 | ) | ||||||||||||||
2015 - R6 (Commenced July 31, 2015) | 6.33 | 0.05 | (0.37 | ) | (0.32 | ) | (0.10 | ) | ||||||||||||||
2014 - A | 6.54 | 0.21 | (e) | (0.14 | ) | 0.07 | (0.23 | ) | ||||||||||||||
2014 - C | 6.53 | 0.16 | (e) | (0.13 | ) | 0.03 | (0.18 | ) | ||||||||||||||
2014 - Institutional | 6.35 | 0.22 | (e) | (0.12 | ) | 0.10 | (0.26 | ) | ||||||||||||||
2014 - IR | 6.48 | 0.20 | (e) | (0.11 | ) | 0.09 | (0.24 | ) | ||||||||||||||
2013 - A | 6.46 | 0.15 | (f) | 0.22 | 0.37 | (0.29 | ) | |||||||||||||||
2013 - C | 6.46 | 0.11 | (f) | 0.20 | 0.31 | (0.24 | ) | |||||||||||||||
2013 - Institutional | 6.29 | 0.18 | (f) | 0.20 | 0.38 | (0.32 | ) | |||||||||||||||
2013 - IR | 6.40 | 0.18 | (f) | 0.20 | 0.38 | (0.30 | ) | |||||||||||||||
2012 - A | 4.94 | 0.12 | 1.95 | 2.07 | (0.55 | ) | ||||||||||||||||
2012 - C | 4.95 | 0.07 | 1.96 | 2.03 | (0.52 | ) | ||||||||||||||||
2012 - Institutional | 4.84 | 0.14 | 1.91 | 2.05 | (0.60 | ) | ||||||||||||||||
2012 - IR | 4.92 | 0.14 | 1.93 | 2.07 | (0.59 | ) | ||||||||||||||||
| (a) | Calculated based on the average shares outstanding methodology. |
| (b) | Assumes investment at the net asset value at the beginning of the period, reinvestment of all distributions, a complete redemption of the investment at the net asset value at the end of the period and no sales or redemption charges. Total returns would be reduced if a sales or redemption charge was taken into account. Returns do not reflect the impact of taxes to shareholders relating to Fund distributions or the redemption of Fund shares. Total returns for periods less than one full year are not annualized. |
| (c) | The Fund’s portfolio turnover rate is calculated in accordance with regulatory requirements, without regard to transactions involving short term investments. If such transactions were included, the Fund’s portfolio turnover rate may be higher. |
| (d) | Annualized. |
| (e) | Reflects income recognized from a corporate action which amounted to $0.10 per share and 1.50% of average net assets. |
| (f) | Reflects income recognized from special dividends which amounted to $0.04 per share and 0.65% of average net assets. |
| 34 | The accompanying notes are an integral part of these financial statements. |
GOLDMAN SACHS INTERNATIONAL REAL ESTATE SECURITIES FUND
| Net asset value, end of period | Total return(b) | Net assets, end of period (in 000s) | Ratio of net expenses to average net assets | Ratio of total expenses to average net assets | Ratio of net investment income to average net assets | Portfolio turnover rate(c) | ||||||||||||||||||||||||||||||||||
| $ | 6.13 | 8.91 | % | $ | 4,971 | 1.39 | %(d) | 1.66 | %(d) | 2.61 | %(d) | 21 | % | |||||||||||||||||||||||||||
| 6.14 | 8.62 | 927 | 2.14 | (d) | 2.41 | (d) | 1.81 | (d) | 21 | |||||||||||||||||||||||||||||||
| 5.93 | 9.24 | 138,753 | 0.99 | (d) | 1.25 | (d) | 2.81 | (d) | 21 | |||||||||||||||||||||||||||||||
| 6.08 | 9.13 | 238 | 1.14 | (d) | 1.42 | (d) | 3.33 | (d) | 21 | |||||||||||||||||||||||||||||||
| 5.93 | 9.26 | 10 | 0.99 | (d) | 1.22 | (d) | 3.09 | (d) | 21 | |||||||||||||||||||||||||||||||
| 5.73 | (1.84 | ) | 5,400 | 1.39 | 1.62 | 1.90 | 41 | |||||||||||||||||||||||||||||||||
| 5.73 | (2.65 | ) | 1,148 | 2.14 | 2.37 | 1.12 | 41 | |||||||||||||||||||||||||||||||||
| 5.54 | (1.63 | ) | 297,473 | 0.99 | 1.22 | 2.28 | 41 | |||||||||||||||||||||||||||||||||
| 5.68 | (1.57 | ) | 107 | 1.14 | 1.37 | 2.05 | 41 | |||||||||||||||||||||||||||||||||
| 5.54 | (1.61 | ) | 9 | 1.02 | 1.18 | 2.26 | 41 | |||||||||||||||||||||||||||||||||
| 6.09 | (2.25 | ) | 7,702 | 1.41 | 1.62 | 1.50 | 45 | |||||||||||||||||||||||||||||||||
| 6.09 | (3.03 | ) | 1,622 | 2.16 | 2.37 | 0.76 | 45 | |||||||||||||||||||||||||||||||||
| 5.91 | (1.73 | ) | 333,601 | 1.01 | 1.22 | 1.92 | 45 | |||||||||||||||||||||||||||||||||
| 6.04 | (2.04 | ) | 88 | 1.17 | 1.37 | 1.64 | 45 | |||||||||||||||||||||||||||||||||
| 5.91 | (5.03 | ) | 9 | 0.99 | (d) | 1.15 | (d) | 1.91 | (d) | 45 | ||||||||||||||||||||||||||||||
| 6.38 | 1.05 | 10,017 | 1.46 | 1.61 | 3.13 | (e) | 50 | |||||||||||||||||||||||||||||||||
| 6.38 | 0.44 | 1,962 | 2.21 | 2.36 | 2.42 | (e) | 50 | |||||||||||||||||||||||||||||||||
| 6.19 | 1.53 | 379,651 | 1.05 | 1.21 | 3.42 | (e) | 50 | |||||||||||||||||||||||||||||||||
| 6.33 | 1.38 | 193 | 1.21 | 1.35 | 2.98 | (e) | 50 | |||||||||||||||||||||||||||||||||
| 6.54 | 5.81 | 14,542 | 1.48 | 1.60 | 2.24 | (f) | 45 | |||||||||||||||||||||||||||||||||
| 6.53 | 4.90 | 2,514 | 2.23 | 2.35 | 1.65 | (f) | 45 | |||||||||||||||||||||||||||||||||
| 6.35 | 6.15 | 387,178 | 1.08 | 1.20 | 2.79 | (f) | 45 | |||||||||||||||||||||||||||||||||
| 6.48 | 6.11 | 944 | 1.23 | 1.35 | 2.70 | (f) | 45 | |||||||||||||||||||||||||||||||||
| 6.46 | 42.31 | 23,019 | 1.52 | 1.63 | 2.01 | 55 | ||||||||||||||||||||||||||||||||||
| 6.46 | 41.43 | 2,253 | 2.27 | 2.37 | 1.23 | 55 | ||||||||||||||||||||||||||||||||||
| 6.29 | 42.78 | 314,518 | 1.12 | 1.22 | 2.35 | 55 | ||||||||||||||||||||||||||||||||||
| 6.40 | 42.62 | 2,043 | 1.27 | 1.36 | 2.25 | 55 | ||||||||||||||||||||||||||||||||||
| The accompanying notes are an integral part of these financial statements. | 35 |
GOLDMAN SACHS REAL ESTATE SECURITIES FUND
Financial Highlights
Selected Data for a Share Outstanding Throughout Each Period
| Income (loss) from investment operations | Distributions to shareholders | |||||||||||||||||||||||||||||
| Year - Share Class | Net asset value, beginning of period | Net investment income(a) | Net realized and unrealized gain (loss) | Total from investment operations | From net investment income | From net realized gains | Total distributions | |||||||||||||||||||||||
| FOR THE SIX MONTHS ENDED JUNE 30, (UNAUDITED) | ||||||||||||||||||||||||||||||
2017 - A | $ | 18.40 | $ | 0.13 | $ | (0.14 | ) | $ | (0.01 | ) | $ | (0.17 | ) | $ | — | $ | (0.17 | ) | ||||||||||||
2017 - C | 17.79 | 0.06 | (0.13 | ) | (0.07 | ) | (0.11 | ) | — | (0.11 | ) | |||||||||||||||||||
2017 - Institutional | 18.81 | 0.16 | (0.13 | ) | 0.03 | (0.21 | ) | — | (0.21 | ) | ||||||||||||||||||||
2017 - Service | 18.52 | 0.13 | (0.14 | ) | (0.01 | ) | (0.17 | ) | — | (0.17 | ) | |||||||||||||||||||
2017 - IR | 18.50 | 0.17 | (0.15 | ) | 0.02 | (0.20 | ) | — | (0.20 | ) | ||||||||||||||||||||
2017 - R | 18.27 | 0.11 | (0.14 | ) | (0.03 | ) | (0.15 | ) | — | (0.15 | ) | |||||||||||||||||||
2017 - R6 | 18.81 | 0.18 | (0.15 | ) | 0.03 | (0.21 | ) | — | (0.21 | ) | ||||||||||||||||||||
| FOR THE FISCAL YEARS ENDED DECEMBER 31, | ||||||||||||||||||||||||||||||
2016 - A | 19.59 | 0.33 | 0.71 | 1.04 | (0.32 | ) | (1.91 | ) | (2.23 | ) | ||||||||||||||||||||
2016 - C | 19.03 | 0.18 | 0.68 | 0.86 | (0.19 | ) | (1.91 | ) | (2.10 | ) | ||||||||||||||||||||
2016 - Institutional | 19.97 | 0.41 | 0.74 | 1.15 | (0.40 | ) | (1.91 | ) | (2.31 | ) | ||||||||||||||||||||
2016 - Service | 19.71 | 0.31 | 0.72 | 1.03 | (0.31 | ) | (1.91 | ) | (2.22 | ) | ||||||||||||||||||||
2016 - IR | 19.68 | 0.39 | 0.71 | 1.10 | (0.37 | ) | (1.91 | ) | (2.28 | ) | ||||||||||||||||||||
2016 - R | 19.47 | 0.29 | 0.70 | 0.99 | (0.28 | ) | (1.91 | ) | (2.19 | ) | ||||||||||||||||||||
2016 - R6 | 19.98 | 0.46 | 0.68 | 1.14 | (0.40 | ) | (1.91 | ) | (2.31 | ) | ||||||||||||||||||||
2015 - A | 19.83 | 0.29 | 0.30 | 0.59 | (0.31 | ) | (0.52 | ) | (0.83 | ) | ||||||||||||||||||||
2015 - C | 19.32 | 0.14 | 0.30 | 0.44 | (0.21 | ) | (0.52 | ) | (0.73 | ) | ||||||||||||||||||||
2015 - Institutional | 20.18 | 0.38 | 0.30 | 0.68 | (0.37 | ) | (0.52 | ) | (0.89 | ) | ||||||||||||||||||||
2015 - Service | 19.94 | 0.27 | 0.32 | 0.59 | (0.30 | ) | (0.52 | ) | (0.82 | ) | ||||||||||||||||||||
2015 - IR | 19.90 | 0.35 | 0.30 | 0.65 | (0.35 | ) | (0.52 | ) | (0.87 | ) | ||||||||||||||||||||
2015 - R | 19.73 | 0.27 | 0.27 | 0.54 | (0.28 | ) | (0.52 | ) | (0.80 | ) | ||||||||||||||||||||
2015 - R6 (Commenced July 31, 2015) | 19.93 | 0.22 | 0.48 | 0.70 | (0.13 | ) | (0.52 | ) | (0.65 | ) | ||||||||||||||||||||
2014 - A | 15.54 | 0.21 | (e) | 4.36 | 4.57 | (0.28 | ) | — | (0.28 | ) | ||||||||||||||||||||
2014 - C | 15.18 | 0.07 | (e) | 4.25 | 4.32 | (0.18 | ) | — | (0.18 | ) | ||||||||||||||||||||
2014 - Institutional | 15.80 | 0.27 | (e) | 4.44 | 4.71 | (0.33 | ) | — | (0.33 | ) | ||||||||||||||||||||
2014 - Service | 15.63 | 0.18 | (e) | 4.39 | 4.57 | (0.26 | ) | — | (0.26 | ) | ||||||||||||||||||||
2014 - IR | �� | 15.59 | 0.31 | (e) | 4.31 | 4.62 | (0.31 | ) | — | (0.31 | ) | |||||||||||||||||||
2014 - R | 15.48 | 0.19 | (e) | 4.31 | 4.50 | (0.25 | ) | — | (0.25 | ) | ||||||||||||||||||||
2013 - A | 15.44 | 0.16 | 0.18 | 0.34 | (0.24 | ) | — | (0.24 | ) | |||||||||||||||||||||
2013 - C | 15.12 | 0.05 | 0.16 | 0.21 | (0.15 | ) | — | (0.15 | ) | |||||||||||||||||||||
2013 - Institutional | 15.68 | 0.24 | 0.17 | 0.41 | (0.29 | ) | — | (0.29 | ) | |||||||||||||||||||||
2013 - Service | 15.53 | 0.14 | 0.18 | 0.32 | (0.22 | ) | — | (0.22 | ) | |||||||||||||||||||||
2013 - IR | 15.49 | 0.22 | 0.15 | 0.37 | (0.27 | ) | — | (0.27 | ) | |||||||||||||||||||||
2013 - R | 15.39 | 0.14 | 0.16 | 0.30 | (0.21 | ) | — | (0.21 | ) | |||||||||||||||||||||
2012 - A | 13.48 | 0.12 | 2.05 | 2.17 | (0.21 | ) | — | (0.21 | ) | |||||||||||||||||||||
2012 - C | 13.22 | 0.04 | 1.99 | 2.03 | (0.13 | ) | — | (0.13 | ) | |||||||||||||||||||||
2012 - Institutional | 13.67 | 0.21 | 2.05 | 2.26 | (0.25 | ) | — | (0.25 | ) | |||||||||||||||||||||
2012 - Service | 13.57 | 0.14 | 2.02 | 2.16 | (0.20 | ) | — | (0.20 | ) | |||||||||||||||||||||
2012 - IR | 13.51 | 0.19 | 2.03 | 2.22 | (0.24 | ) | — | (0.24 | ) | |||||||||||||||||||||
2012 - R | 13.45 | 0.13 | 2.00 | 2.13 | (0.19 | ) | — | (0.19 | ) | |||||||||||||||||||||
| (a) | Calculated based on the average shares outstanding methodology. |
| (b) | Assumes investment at the net asset value at the beginning of the period, reinvestment of all distributions, a complete redemption of the investment at the net asset value at the end of the period and no sales or redemption charges. Total returns would be reduced if a sales or redemption charge was taken into account. Returns do not reflect the impact of taxes to shareholders relating to Fund distributions or the redemption of Fund shares. Total returns for periods less than one full year are not annualized. |
| (c) | The Fund’s portfolio turnover rate is calculated in accordance with regulatory requirements, without regard to transactions involving short term investments. If such transactions were included, the Fund’s portfolio turnover rate may be higher. |
| (d) | Annualized. |
| (e) | Reflects income recognized from special dividends which amounted to $0.07 per share and 0.37% of average net assets. |
| 36 | The accompanying notes are an integral part of these financial statements. |
GOLDMAN SACHS REAL ESTATE SECURITIES FUND
| Net asset value, end of period | Total return(b) | Net assets, end of period (in 000s) | Ratio of net expenses to average net assets | Ratio of total expenses to average net assets | Ratio of net investment income to average net assets | Portfolio turnover rate(c) | ||||||||||||||||||||||||||||||||||
| $ | 18.22 | (0.03 | )% | $ | 46,970 | 1.31 | %(d) | 1.53 | %(d) | 1.47 | %(d) | 16 | % | |||||||||||||||||||||||||||
| 17.61 | (0.39 | ) | 13,617 | 2.06 | (d) | 2.28 | (d) | 0.73 | (d) | 16 | ||||||||||||||||||||||||||||||
| 18.63 | 0.21 | 239,549 | 0.91 | (d) | 1.13 | (d) | 1.73 | (d) | 16 | |||||||||||||||||||||||||||||||
| 18.34 | (0.02 | ) | 2,479 | 1.41 | (d) | 1.63 | (d) | 1.41 | (d) | 16 | ||||||||||||||||||||||||||||||
| 18.32 | 0.10 | 11,481 | 1.06 | (d) | 1.28 | (d) | 1.85 | (d) | 16 | |||||||||||||||||||||||||||||||
| 18.09 | (0.11 | ) | 3,321 | 1.56 | (d) | 1.78 | (d) | 1.25 | (d) | 16 | ||||||||||||||||||||||||||||||
| 18.63 | 0.17 | 55 | 0.89 | (d) | 1.11 | (d) | 1.95 | (d) | 16 | |||||||||||||||||||||||||||||||
| 18.40 | 5.38 | 54,869 | 1.31 | 1.52 | 1.62 | 31 | ||||||||||||||||||||||||||||||||||
| 17.79 | 4.56 | 15,578 | 2.06 | 2.27 | 0.91 | 31 | ||||||||||||||||||||||||||||||||||
| 18.81 | 5.81 | 397,211 | 0.91 | 1.12 | 2.03 | 31 | ||||||||||||||||||||||||||||||||||
| 18.52 | 5.20 | 2,951 | 1.41 | 1.62 | 1.55 | 31 | ||||||||||||||||||||||||||||||||||
| 18.50 | 5.65 | 8,467 | 1.06 | 1.27 | 1.92 | �� | 31 | |||||||||||||||||||||||||||||||||
| 18.27 | 5.08 | 4,156 | 1.56 | 1.77 | 1.44 | 31 | ||||||||||||||||||||||||||||||||||
| 18.81 | 5.77 | 42 | 0.90 | 1.09 | 2.25 | 31 | ||||||||||||||||||||||||||||||||||
| 19.59 | 3.14 | 57,936 | 1.26 | 1.51 | 1.44 | 41 | ||||||||||||||||||||||||||||||||||
| 19.03 | 2.39 | 15,056 | 2.01 | 2.26 | 0.73 | 41 | ||||||||||||||||||||||||||||||||||
| 19.97 | 3.56 | 463,105 | 0.86 | 1.11 | 1.88 | 41 | ||||||||||||||||||||||||||||||||||
| 19.71 | 3.09 | 2,744 | 1.36 | 1.61 | 1.35 | 41 | ||||||||||||||||||||||||||||||||||
| 19.68 | 3.44 | 7,283 | 1.01 | 1.26 | 1.77 | 41 | ||||||||||||||||||||||||||||||||||
| 19.47 | 2.89 | 3,149 | 1.50 | 1.77 | 1.38 | 41 | ||||||||||||||||||||||||||||||||||
| 19.98 | 3.64 | 10 | 0.91 | (d) | 1.07 | (d) | 2.65 | (d) | 41 | |||||||||||||||||||||||||||||||
| 19.83 | 29.63 | 73,103 | 1.39 | 1.52 | 1.15 | (e) | 52 | |||||||||||||||||||||||||||||||||
| 19.32 | 28.64 | 16,497 | 2.14 | 2.26 | 0.39 | (e) | 52 | |||||||||||||||||||||||||||||||||
| 20.18 | 30.10 | 502,407 | 0.99 | 1.11 | 1.49 | (e) | 52 | |||||||||||||||||||||||||||||||||
| 19.94 | 29.49 | 3,527 | 1.49 | 1.61 | 0.98 | (e) | 52 | |||||||||||||||||||||||||||||||||
| 19.90 | 29.94 | 6,900 | 1.14 | 1.27 | 1.70 | (e) | 52 | |||||||||||||||||||||||||||||||||
| 19.73 | 29.29 | 1,877 | 1.64 | 1.77 | 1.05 | (e) | 52 | |||||||||||||||||||||||||||||||||
| 15.54 | 2.13 | 51,599 | 1.41 | 1.51 | 0.99 | 61 | ||||||||||||||||||||||||||||||||||
| 15.18 | 1.35 | 12,375 | 2.16 | 2.26 | 0.29 | 61 | ||||||||||||||||||||||||||||||||||
| 15.80 | 2.54 | 419,564 | 1.01 | 1.11 | 1.46 | 61 | ||||||||||||||||||||||||||||||||||
| 15.63 | 2.03 | 3,342 | 1.51 | 1.61 | 0.88 | 61 | ||||||||||||||||||||||||||||||||||
| 15.59 | 2.33 | 808 | 1.16 | 1.26 | 1.33 | 61 | ||||||||||||||||||||||||||||||||||
| 15.48 | 1.90 | 802 | 1.66 | 1.76 | 0.90 | 61 | ||||||||||||||||||||||||||||||||||
| 15.44 | 16.11 | 63,171 | 1.44 | 1.51 | 0.80 | 40 | ||||||||||||||||||||||||||||||||||
| 15.12 | 15.34 | 12,403 | 2.19 | 2.26 | 0.25 | 40 | ||||||||||||||||||||||||||||||||||
| 15.68 | 16.59 | 381,641 | 1.04 | 1.11 | 1.40 | 40 | ||||||||||||||||||||||||||||||||||
| 15.53 | 15.93 | 4,694 | 1.54 | 1.61 | 0.91 | 40 | ||||||||||||||||||||||||||||||||||
| 15.49 | 16.45 | 540 | 1.19 | 1.26 | 1.26 | 40 | ||||||||||||||||||||||||||||||||||
| 15.39 | 15.90 | 521 | 1.69 | 1.76 | 0.88 | 40 | ||||||||||||||||||||||||||||||||||
| The accompanying notes are an integral part of these financial statements. | 37 |
GOLDMAN SACHS REAL ESTATE SECURITIES FUNDS
June 30, 2017 (Unaudited)
| 1. ORGANIZATION |
Goldman Sachs Trust (the “Trust”) is a Delaware statutory trust registered under the Investment Company Act of 1940, as amended (the “Act”), as an open-end management investment company. The following table lists those series of the Trust that are included in this report (collectively, the “Funds” or individually a “Fund”), along with their corresponding share classes and respective diversification status under the Act:
| Fund | Share Classes Offered | Diversified/ Non-diversified | ||
Global Real Estate Securities | A, C, Institutional, IR, R and R6 | Non-diversified | ||
International Real Estate Securities | A, C, Institutional, IR and R6 | Non-diversified | ||
Real Estate Securities | A, C, Institutional, Service, IR, R and R6 | Non-diversified |
Class A Shares of the Global Real Estate Securities, International Real Estate Securities, and Real Estate Securities Funds are sold with a front-end sales charge of up to 5.50%. Class C Shares are sold with a contingent deferred sales charge (“CDSC”) of 1.00%, which is imposed on redemptions made within 12 months of purchase. Institutional, Service, Class IR, Class R and Class R6 Shares are not subject to a sales charge.
Goldman Sachs Asset Management, L.P. (“GSAM”), an affiliate of Goldman Sachs & Co. LLC (formerly Goldman, Sachs & Co.) (“Goldman Sachs”), serves as Investment Adviser to the Funds pursuant to management agreements (the “Agreements”) with the Trust.
| 2. SIGNIFICANT ACCOUNTING POLICIES |
The financial statements have been prepared in accordance with accounting principles generally accepted in the United States of America (“GAAP”) and require management to make estimates and assumptions that may affect the reported amounts and disclosures. Actual results may differ from those estimates and assumptions.
A. Investment Valuation — The Funds’ valuation policy is to value investments at fair value.
B. Investment Income and Investments — Investment income includes interest income, dividend income and securities lending income. Interest income is accrued daily and adjusted for amortization of premiums and accretion of discounts. Dividend income is recognized on ex-dividend date or, for certain foreign securities, as soon as such information is obtained subsequent to the ex-dividend date. Investment transactions are reflected on trade date. Realized gains and losses are calculated using identified cost. Investment transactions are recorded on the following business day for daily net asset value (“NAV”) calculations. Investment income is recorded net of any foreign withholding taxes, less any amounts reclaimable. The Funds may file withholding tax reclaims in certain jurisdictions to recover a portion of amounts previously withheld. Any foreign capital gains tax is accrued daily based upon net unrealized gains, and is payable upon sale of such investments. Distributions received from the Funds’ investments in United States (“U.S.”) real estate investment trusts (“REITs”) may be characterized as ordinary income, net capital gain or a return of capital. A return of capital is recorded by the Funds as a reduction to the cost basis of the REIT.
C. Class Allocations and Expenses — Investment income, realized and unrealized gain (loss), and non-class specific expenses of each Fund are allocated daily based upon the proportion of net assets of each class. Non-class specific expenses directly incurred by a Fund are charged to that Fund, while such expenses incurred by the Trust are allocated across the applicable Funds on a straight-line and/or pro-rata basis depending upon the nature of the expenses. Class-specific expenses, where applicable, are borne by the respective share classes and include Distribution and Service, Transfer Agency and Service and Shareholder Administration fees.
D. Federal Taxes and Distributions to Shareholders — It is each Fund’s policy to comply with the requirements of the Internal Revenue Code of 1986, as amended (the “Code”), applicable to regulated investment companies (mutual funds) and to distribute each year substantially all of its investment company taxable income and capital gains to its shareholders. Accordingly,
38
GOLDMAN SACHS REAL ESTATE SECURITIES FUNDS
| 2. SIGNIFICANT ACCOUNTING POLICIES (continued) |
each Fund is not required to make any provisions for the payment of federal income tax. Distributions to shareholders are recorded on the ex-dividend date. Income and capital gains distributions, if any, are declared and paid according to the following schedule:
| Fund | Income Distributions Declared/Paid | Capital Gains Distributions Declared/Paid | ||||
Global Real Estate Securities and Real Estate Securities | Quarterly | Annually | ||||
International Real Estate Securities | Semi-Annually | Annually |
Net capital losses, if any, are carried forward to future fiscal years and may be used to the extent allowed by the Code to offset any future capital gains. Losses that are carried forward will retain their character as either short-term or long-term capital losses. Utilization of capital loss carryforwards will reduce the requirement of future capital gains distributions.
The characterization of distributions to shareholders for financial reporting purposes is determined in accordance with federal income tax rules, which may differ from GAAP. The source of each Fund’s distributions may be shown in the accompanying financial statements as either from net investment income, net realized gain or capital. Certain components of the Funds’ net assets on the Statements of Assets and Liabilities reflect permanent GAAP/tax differences based on the appropriate tax character.
E. Foreign Currency Translation — The accounting records and reporting currency of a Fund are maintained in U.S. dollars. Assets and liabilities denominated in foreign currencies are translated into U.S. dollars using the current exchange rates at the close of each business day. The effect of changes in foreign currency exchange rates on investments is included within net realized and unrealized gain (loss) on investments. Changes in the value of other assets and liabilities as a result of fluctuations in foreign exchange rates are included in the Statements of Operations within net change in unrealized gain (loss) on foreign currency translations. Transactions denominated in foreign currencies are translated into U.S. dollars on the date the transaction occurred, the effects of which are included within net realized gain (loss) on foreign currency transactions.
| 3. INVESTMENTS AND FAIR VALUE MEASUREMENTS |
U.S. GAAP defines the fair value of a financial instrument as the amount that would be received to sell an asset or paid to transfer a liability in an orderly transaction between market participants at the measurement date (i.e., the exit price); the Funds’ policy is to use the market approach. GAAP establishes a fair value hierarchy that prioritizes the inputs to valuation techniques used to measure fair value. The hierarchy gives the highest priority to unadjusted quoted prices in active markets for identical assets or liabilities (Level 1 measurements) and the lowest priority to unobservable inputs (Level 3 measurements). The levels used for classifying investments are not necessarily an indication of the risk associated with investing in these investments. The three levels of the fair value hierarchy are described below:
Level 1 — Unadjusted quoted prices in active markets that are accessible at the measurement date for identical, unrestricted assets or liabilities;
Level 2 — Quoted prices in markets that are not active or financial instruments for which significant inputs are observable (including, but not limited to, quoted prices for similar investments, interest rates, foreign exchange rates, volatility and credit spreads), either directly or indirectly;
Level 3 — Prices or valuations that require significant unobservable inputs (including GSAM’s assumptions in determining fair value measurement).
Changes in valuation techniques may result in transfers into or out of an assigned level within the hierarchy. In accordance with the Funds’ policy, transfers between different levels of the fair value hierarchy resulting from such changes are deemed to have occurred as of the beginning of the reporting period.
The Board of Trustees (“Trustees”) has approved Valuation Procedures that govern the valuation of the portfolio investments held by the Funds, including investments for which market quotations are not readily available. The Trustees have delegated to GSAM day-to-day responsibility for implementing and maintaining internal controls and procedures related to the valuation of the
39
GOLDMAN SACHS REAL ESTATE SECURITIES FUNDS
Notes to Financial Statements (continued)
June 30, 2017 (Unaudited)
| 3. INVESTMENTS AND FAIR VALUE MEASUREMENTS (continued) |
Funds’ portfolio investments. To assess the continuing appropriateness of pricing sources and methodologies, GSAM regularly performs price verification procedures and issues challenges as necessary to third party pricing vendors or brokers, and any differences are reviewed in accordance with the Valuation Procedures.
A. Level 1 and Level 2 Fair Value Investments — The valuation techniques and significant inputs used in determining the fair values for investments classified as Level 1 and Level 2 are as follows:
Equity Securities — Equity securities traded on a U.S. securities exchange or the NASDAQ system, or those located on certain foreign exchanges, including but not limited to the Americas, are valued daily at their last sale price or official closing price on the principal exchange or system on which they are traded. If there is no sale or official closing price or such price is believed by GSAM to not represent fair value, equity securities are valued at the last bid price for long positions and at the last ask price for short positions. To the extent these investments are actively traded, they are classified as Level 1 of the fair value hierarchy, otherwise they are generally classified as Level 2.
Unlisted equity securities for which market quotations are available are valued at the last sale price on the valuation date, or if no sale occurs, at the last bid price. Securities traded on certain foreign securities exchanges are valued daily at fair value determined by an independent fair value service (if available) under Valuation Procedures approved by the Trustees and consistent with applicable regulatory guidance. The independent fair value service takes into account multiple factors including, but not limited to, movements in the securities markets, certain depositary receipts, futures contracts and foreign currency exchange rates that have occurred subsequent to the close of the foreign securities exchange. These investments are generally classified as Level 2 of the fair value hierarchy.
Money Market Funds — Investments in the Goldman Sachs Financial Square Government Fund (“Underlying Fund”) are valued at the NAV of the Institutional Share class on the day of valuation. These investments are generally classified as Level 1 of the fair value hierarchy. For information regarding an Underlying Fund’s accounting policies and investment holdings, please see the Underlying Fund’s shareholder report.
B. Level 3 Fair Value Investments — To the extent that significant inputs to valuation models and other alternative pricing sources are unobservable, or if quotations are not readily available, or if GSAM believes that such quotations do not accurately reflect fair value, the fair value of a Fund’s investments may be determined under Valuation Procedures approved by the Trustees. GSAM, consistent with its procedures and applicable regulatory guidance, may make an adjustment to the most recent valuation prices of either domestic or foreign securities in light of significant events to reflect what it believes to be the fair value of the securities at the time of determining a Fund’s NAV. Significant events which could affect a large number of securities in a particular market may include, but are not limited to: significant fluctuations in U.S. or foreign markets; market dislocations; market disruptions; or unscheduled market closings. Significant events which could also affect a single issuer may include, but are not limited to: corporate actions such as reorganizations, mergers and buy-outs; ratings downgrades; and bankruptcies.
40
GOLDMAN SACHS REAL ESTATE SECURITIES FUNDS
| 3. INVESTMENTS AND FAIR VALUE MEASUREMENTS (continued) |
C. Fair Value Hierarchy — The following is a summary of the Funds’ investments classified in the fair value hierarchy as of June 30, 2017:
| GLOBAL REAL ESTATE SECURITIES | ||||||||||||
| Investment Type | Level 1 | Level 2 | Level 3 | |||||||||
| Assets | ||||||||||||
Common Stock and/or Other Equity Investments(a) | ||||||||||||
Asia | $ | — | $ | 53,896,388 | $ | — | ||||||
Australia and Oceania | — | 13,901,265 | — | |||||||||
Europe | — | 44,490,929 | — | |||||||||
North America | 137,793,495 | — | — | |||||||||
Investment Company | 844 | — | — | |||||||||
| Total | $ | 137,794,339 | $ | 112,288,582 | $ | — | ||||||
| INTERNATIONAL REAL ESTATE SECURITIES | ||||||||||||
| Investment Type | Level 1 | Level 2 | Level 3 | |||||||||
| Assets | ||||||||||||
Common Stock and/or Other Equity Investments(a) | ||||||||||||
Asia | $ | — | $ | 67,259,682 | $ | — | ||||||
Australia and Oceania | — | 17,374,626 | — | |||||||||
Europe | — | 51,208,511 | — | |||||||||
North America | 7,489,852 | — | — | |||||||||
Investment Company | 690 | — | — | |||||||||
| Total | $ | 7,490,542 | $ | 135,842,819 | $ | — | ||||||
| REAL ESTATE SECURITIES | ||||||||||||
| Investment Type | Level 1 | Level 2 | Level 3 | |||||||||
| Assets | ||||||||||||
Common Stock and/or Other Equity Investments(a) | ||||||||||||
North America | $ | 311,089,015 | $ | — | $ | — | ||||||
Investment Company | 15,412 | — | — | |||||||||
| Total | $ | 311,104,427 | $ | — | $ | — | ||||||
| (a) | Amounts are disclosed by continent to highlight the impact of time zone differences between local market close and the calculation of NAV. Security valuations are based on the principal exchange or system on which they are traded, which may differ from country of domicile noted in the table. The Funds utilize fair value model prices provided by an independent fair value service for certain international equity securities, resulting in a Level 2 classification. |
For further information regarding security characteristics, see the Schedules of Investments.
| 4. AGREEMENTS AND AFFILIATED TRANSACTIONS |
A. Management Agreement — Under the Agreement, GSAM manages the Funds, subject to the general supervision of the Trustees.
As compensation for the services rendered pursuant to the Agreement, the assumption of the expenses related thereto and administration of the Funds’ business affairs, including providing facilities, GSAM is entitled to a management fee, accrued daily and paid monthly, equal to an annual percentage rate of each Fund’s average daily net assets.
41
GOLDMAN SACHS REAL ESTATE SECURITIES FUNDS
Notes to Financial Statements (continued)
June 30, 2017 (Unaudited)
| 4. AGREEMENTS AND AFFILIATED TRANSACTIONS (continued) |
For the six months ended June 30, 2017, contractual and effective net management fees with GSAM were at the following rates:
| Contractual Management Rate | Effective Net Management Rate^ | |||||||||||||||||||||||||||||
| Fund | First $1 billion | Next $1 billion | Next $3 billion | Next $3 billion | Over $8 billion | Effective Rate | ||||||||||||||||||||||||
Global Real Estate Securities | 1.05 | % | 0.95 | % | 0.90 | % | 0.88 | % | 0.86 | % | 1.05 | % | 0.93 | %(1) | ||||||||||||||||
International Real Estate Securities | 1.05 | 1.05 | 0.95 | 0.90 | 0.88 | 1.05 | 0.95 | (1) | ||||||||||||||||||||||
Real Estate Securities | 1.00 | 0.90 | 0.86 | 0.84 | 0.82 | 1.00 | 0.87 | (1) | ||||||||||||||||||||||
| ^ | Effective Net Management Rate includes the impact of management fee waivers of affiliated Underlying Funds, if any. |
| (1) | GSAM agreed to waive a portion of its management fee in order to achieve net management rates, as defined in the Funds’ most recent prospectuses. These waivers will be effective through at least April 28, 2018, and prior to such date GSAM may not terminate the arrangements without approval of the Trustees. |
The Global Real Estate Securities, International Real Estate Securities and Real Estate Securities Funds invest in Institutional Shares of Goldman Sachs Financial Square Government Fund, which is an affiliated Underlying Fund. GSAM has agreed to waive a portion of its management fee payable by the Funds in an amount equal to the management fee it earns as an investment adviser to any of the affiliated Underlying Funds in which the Funds invest. For the six months ended June 30, 2017, GSAM waived $1,670, $360 and $1,287 of the Funds’ management fees, respectively.
B. Distribution and/or Service (12b-1) Plans — The Trust, on behalf of Class A and Class R Shares of each applicable Fund, has adopted Distribution and Service Plans subject to Rule 12b-1 under the Act. Under the Distribution and Service Plans, Goldman Sachs, which serves as distributor (the “Distributor”), is entitled to a fee accrued daily and paid monthly for distribution services and personal and account maintenance services, which may then be paid by Goldman Sachs to authorized dealers. These fees are equal to an annual percentage rate of the average daily net assets attributable to Class A or Class R Shares of the Funds, as applicable, as set forth below.
The Trust, on behalf of Class C Shares of each applicable Fund, has adopted a Distribution Plan subject to Rule 12b-1 under the Act. Under the Distribution Plan, Goldman Sachs as Distributor is entitled to a fee accrued daily and paid monthly for distribution services, which may then be paid by Goldman Sachs to authorized dealers. These fees are equal to an annual percentage rate of the average daily net assets attributable to Class C Shares of the Funds, as set forth below.
The Trust, on behalf of Service Shares of each applicable Fund, has adopted a Service Plan subject to Rule 12b-1 under the Act to allow Service Shares to compensate service organizations (including Goldman Sachs) for providing personal and account maintenance services to their customers who are beneficial owners of such shares. The Service Plan provides for compensation to the service organizations equal to an annual percentage rate of the average daily net assets attributable to Service Shares of the Funds, as set forth below.
| Distribution and Service Plan Rates | ||||||||||||||||
| Class A* | Class C | Class R* | Service | |||||||||||||
Distribution Plan | 0.25 | % | 0.75 | % | 0.50 | % | — | % | ||||||||
Service Plan | — | — | — | 0.25 | ||||||||||||
| * | With respect to Class A and Class R Shares, the Distributor at its discretion may use compensation for distribution services paid under the Distribution Plan to compensate service organizations for personal and account maintenance services and expenses as long as such total compensation does not exceed the maximum cap on “service fees” imposed by the Financial Industry Regulatory Authority. |
C. Distribution Agreement — Goldman Sachs, as Distributor of the shares of the Funds pursuant to a Distribution Agreement, may retain a portion of the Class A Shares’ front end sales charge and Class C Shares’ CDSC. During the six months ended June 30, 2017, Goldman Sachs advised that it retained front end sales charges of $146 and $1,402 for the International Real Estate Securities and Real Estate Securities Funds, respectively.
42
GOLDMAN SACHS REAL ESTATE SECURITIES FUNDS
| 4. AGREEMENTS AND AFFILIATED TRANSACTIONS (continued) |
D. Service and/or Shareholder Administration Plans — The Trust, on behalf of each applicable Fund, has adopted Service and/or Shareholder Administration Plans to allow Class C and Service Shares, respectively, to compensate service organizations (including Goldman Sachs) for providing varying levels of personal and account maintenance and/or shareholder administration services to their customers who are beneficial owners of such shares. The Service and/or Shareholder Administration Plans each provide for compensation to the service organizations equal to 0.25% of the average daily net assets attributable to Class C or Service Shares of the Funds, respectively.
E. Transfer Agency Agreement — Goldman Sachs also serves as the transfer agent of the Funds for a fee pursuant to the Transfer Agency Agreement. The fees charged for such transfer agency services are accrued daily and paid monthly at annual rates as follows: 0.19% of the average daily net assets of Class A, Class C, Class IR and Class R Shares; 0.02% of the average daily net assets of Class R6 Shares; and 0.04% of the average daily net assets of Institutional and Service Shares. Effective July 28, 2017, the annual rates were amended for Class A, Class C, Class IR and Class R Shares to 0.18% of average daily net assets, and for Class R6 Shares to 0.03% of average daily net assets.
F. Other Expense Agreements and Affiliated Transactions — GSAM has agreed to limit certain “Other Expenses” of the Funds (excluding acquired fund fees and expenses, transfer agency fees and expenses, service fees and shareholder administration fees (as applicable), taxes, interest, brokerage fees, shareholder meeting, litigation, indemnification and extraordinary expenses) to the extent such expenses exceed, on an annual basis, a percentage rate of the average daily net assets of each Fund. Such Other Expense reimbursements, if any, are accrued daily and paid monthly. In addition, the Funds are not obligated to reimburse GSAM for prior fiscal year expense reimbursements, if any. The Other Expense limitations as an annual percentage rate of average daily net assets for the Global Real Estate Securities, International Real Estate Securities and Real Estate Securities Funds are 0.034%, 0.004% and 0.004%, respectively. These Other Expense limitations will remain in place through at least April 28, 2018, and prior to such date GSAM may not terminate the arrangements without the approval of the Trustees. In addition, the Funds have entered into certain offset arrangements with the custodian and the transfer agent, which may result in a reduction of the Funds’ expenses and are received irrespective of the application of the “Other Expense” limitations described above.
For the six months ended June 30, 2017, these expense reductions, including any fee waivers and Other Expense reimbursements, were as follows:
| Fund | Management Fee Waiver | Other Expense Reimbursement | Custody Fee Credits | Total Expense Reductions | ||||||||||||||
Global Real Estate Securities | $ | 64,093 | $ | 153,081 | $ | — | $ | 217,174 | ||||||||||
International Real Estate Securities | 121,528 | 185,491 | 1,025 | 308,044 | ||||||||||||||
Real Estate Securities | 273,407 | 176,313 | 1,851 | 451,571 | ||||||||||||||
G. Line of Credit Facility — As of June 30, 2017, the Funds participated in a $1,100,000,000 committed, unsecured revolving line of credit facility (the “facility”) together with other funds of the Trust and certain registered investment companies having management agreements with GSAM or its affiliates. This facility is to be used for temporary emergency purposes, or to allow for an orderly liquidation of securities to meet redemption requests. The interest rate on borrowings is based on the federal funds rate. The facility also requires a fee to be paid by the Funds based on the amount of the commitment that has not been utilized. For the six months ended June 30, 2017, the Funds did not have any borrowings under the facility.
43
GOLDMAN SACHS REAL ESTATE SECURITIES FUNDS
Notes to Financial Statements (continued)
June 30, 2017 (Unaudited)
| 4. AGREEMENTS AND AFFILIATED TRANSACTIONS (continued) |
H. Other Transactions with Affiliates — The Funds may purchase securities from, or sell securities to, an affiliated fund provided the affiliation is solely due to having a common investment adviser, common officers, or common trustees. For the six months ended June 30, 2017, the purchase and sale transactions and related net realized gain (loss) for the Funds with an affiliated fund in compliance with Rule 17a-7 under the Act were as follows:
| Fund | Purchases | Sales | Net Realized Gain (Loss) | |||||||||||
Global Real Estate Securities | $ | 210,752,178 | $ | — | $ | — | ||||||||
International Real Estate Securities | — | 97,438,059 | 437,853 | |||||||||||
Real Estate Securities | — | 113,314,118 | 14,249,057 | |||||||||||
The following table provides information about the Funds’ investment in the Goldman Sachs Financial Square Government Fund as of and for the six months ended June 30, 2017:
| Fund | Market Value 12/31/2016 | Purchases at Cost | Proceeds from Sales | Market Value 06/30/2017 | Dividend Interest Income | |||||||||||||||||
Global Real Estate Securities | $ | 117,074 | $ | 96,085,854 | $ | (96,202,084 | ) | $ | 844 | $ | 6,779 | |||||||||||
International Real Estate Securities | 311 | 10,459,255 | (10,458,876 | ) | 690 | 1,560 | ||||||||||||||||
Real Estate Securities | 623 | 52,556,967 | (52,542,178 | ) | 15,412 | 4,533 | ||||||||||||||||
As of June 30, 2017, The Goldman Sachs Group, Inc. was the beneficial owner of the following Funds:
| Percent of Share Class owned by Goldman Sachs Group, Inc. | ||||||||||||||||||||||
| Fund | Class A | Class C | Class IR | Class R | Class R6 | |||||||||||||||||
Global Real Estate Securities | 83 | % | 73 | % | 100 | % | 100 | % | 100 | % | ||||||||||||
International Real Estate Securities | — | — | — | — | 100 | |||||||||||||||||
Real Estate Securities | — | — | — | — | 20 | |||||||||||||||||
As of June 30, 2017, the following Goldman Sachs Fund of Funds Portfolios were the beneficial owner of 5% or more of the total outstanding shares of the following Funds:
| Fund | Goldman Sachs Growth and Income Strategy Portfolio | Goldman Sachs Growth Strategy Portfolio | Goldman Sachs Satellite Strategies Portfolio | Goldman Sachs Equity Growth Strategy Portfolio | ||||||||||||||
Global Real Estate Securities | 8 | % | 20 | % | 48 | % | 9 | % | ||||||||||
44
GOLDMAN SACHS REAL ESTATE SECURITIES FUNDS
| 5. PORTFOLIO SECURITIES TRANSACTIONS |
The cost of purchases and proceeds from sales and maturities of long-term securities for the six months ended June 30, 2017, were as follows:
| Fund | Purchases | Sales | ||||||||
Global Real Estate Securities | $ | 253,790,738 | $ | 31,973,233 | ||||||
International Real Estate Securities | 52,105,136 | 227,258,168 | ||||||||
Real Estate Securities | 68,520,411 | 220,654,923 | ||||||||
| 6. SECURITIES LENDING |
Pursuant to exemptive relief granted by the Securities and Exchange Commission (“SEC”) and the terms and conditions contained therein, the Global Real Estate Securities and International Real Estate Securities Funds may lend their securities through a securities lending agent, Goldman Sachs Agency Lending (“GSAL”), a wholly-owned subsidiary of Goldman Sachs, to certain qualified borrowers including Goldman Sachs and affiliates. In accordance with the Funds’ securities lending procedures, the Funds receive cash collateral at least equal to the market value of the securities on loan. The market value of the loaned securities is determined at the close of business of the Funds, at their last sale price or official closing price on the principal exchange or system on which they are traded, and any additional required collateral is delivered to the Funds on the next business day. As with other extensions of credit, the Funds may experience delay in the recovery of their securities or incur a loss should the borrower of the securities breach its agreement with the Funds or become insolvent at a time when the collateral is insufficient to cover the cost of repurchasing securities on loan. Dividend income received from securities on loan may not be subject to withholding taxes and therefore withholding taxes paid may differ from the amounts listed in the Statements of Operations. Loans of securities are terminable at any time and as such 1) the remaining contractual maturities of the outstanding securities lending transactions are considered to be overnight and continuous and 2) the borrower, after notice, is required to return borrowed securities within the standard time period for settlement of securities transactions.
The Global Real Estate Securities and International Real Estate Securities Funds invest the cash collateral received in connection with securities lending transactions in the Goldman Sachs Financial Square Government Fund (“Government Money Market Fund”), an affiliated series of the Trust. The Government Money Market Fund is registered under the Act as an open end investment company, is subject to Rule 2a-7 under the Act, and is managed by GSAM, for which GSAM may receive a management fee of up to 0.205% on an annualized basis of the average daily net assets of the Government Money Market Fund.
In the event of a default by a borrower with respect to any loan, GSAL will exercise any and all remedies provided under the applicable borrower agreement to make the Funds whole. These remedies include purchasing replacement securities by applying the collateral held from the defaulting broker against the purchase cost of the replacement securities. If GSAL is unable to purchase replacement securities, GSAL will indemnify the Funds by paying the Funds an amount equal to the market value of the securities loaned minus the value of cash collateral received from the borrower for the loan, subject to an exclusion for any shortfalls resulting from a loss of value in such cash collateral due to reinvestment risk. The amounts of the Funds’ overnight and continuous agreements represent the gross amounts of recognized liabilities for securities lending transactions outstanding as of June 30, 2017 are disclosed as “Payable upon return of securities loaned” on the Statements of Assets and Liabilities.
Each of the Global Real Estate Securities and International Real Estate Securities Funds and GSAL received compensation relating to the lending of the Funds’ securities. The amounts earned, if any, by the Funds for the six months ended June 30, 2017, are reported under Investment Income on the Statements of Operations.
45
GOLDMAN SACHS REAL ESTATE SECURITIES FUNDS
Notes to Financial Statements (continued)
June 30, 2017 (Unaudited)
| 6. SECURITIES LENDING (continued) |
The table below details securities lending activity with affiliates of Goldman Sachs:
| For the Six Months ended June 30, 2017 | ||||||||||
| Fund | Earnings of GSAL Relating to Securities Loaned | Amounts Received by the Funds from Lending to Goldman Sachs | ||||||||
Global Real Estate Securities | $ | 490 | $ | — | ||||||
International Real Estate Securities | 4,537 | 30,478 | ||||||||
The following table provides information about the Funds’ investment in the Government Money Market Fund for the six months ended June 30, 2017:
| Fund | Market Value 12/31/16 | Purchases at Cost | Proceeds from Sales | Market Value 6/30/17 | ||||||||||||||
Global Real Estate Securities | $ | — | $ | 9,232,025 | $ | (9,232,025 | ) | $ | — | |||||||||
International Real Estate Securities | — | 37,153,417 | (37,153,417 | ) | — | |||||||||||||
| 7. TAX INFORMATION |
As of the Funds’ most recent fiscal year end, December 31, 2016, the Funds’ capital loss carryforwards and certain timing differences, on a tax-basis were as follows:
| Global Real Estate Securities | International Real Estate Securities | Real Estate Securities | ||||||||||
Capital loss carryforwards:(1) | ||||||||||||
Expiring 2017 | $ | — | $ | (239,206,981 | ) | $ | — | |||||
Expiring 2018 | — | (18,621,372 | ) | — | ||||||||
Perpetual Long-term | — | (3,206,861 | ) | — | ||||||||
Total capital loss carryforwards | $ | — | $ | (261,035,214 | ) | $ | — | |||||
Timing differences (Qualified Late Year Loss Deferral/Post October PFIC Loss Deferral/Certain REIT Dividends) | $ | (13,695 | ) | $ | (1,528,868 | ) | $ | 231,120 | ||||
| (1) | Expiration occurs on December 31 of the year indicated. |
As of June 30, 2017, the Funds’ aggregate security unrealized gains and losses based on cost for U.S. federal income tax purposes were as follows:
| Global Real Estate Securities | International Real Estate Securities | Real Estate Securities | ||||||||||
Tax cost | $ | 248,015,017 | $ | 151,803,473 | $ | 225,868,101 | ||||||
Gross unrealized gain | 7,194,100 | 5,320,452 | 93,233,777 | |||||||||
Gross unrealized loss | (5,126,196 | ) | (13,790,564 | ) | (7,997,451 | ) | ||||||
Net unrealized security gain (loss) | $ | 2,067,904 | $ | (8,470,112 | ) | $ | 85,236,326 | |||||
46
GOLDMAN SACHS REAL ESTATE SECURITIES FUNDS
| 7. TAX INFORMATION (continued) |
The difference between GAAP-basis and tax-basis unrealized gains (losses) is attributable primarily to wash sales, net mark to market gains/(losses) on foreign currency contracts and differences related to the tax treatment of passive foreign investment companies and real estate investment trust investments.
GSAM has reviewed the Funds’ tax positions for all open tax years (the current and prior three years, as applicable) and has concluded that no provision for income tax is required in the Funds’ financial statements. Such open tax years remain subject to examination and adjustment by tax authorities.
| 8. OTHER RISKS |
The Funds’ risks include, but are not limited to, the following:
Foreign and Emerging Countries Risk — Investing in foreign markets may involve special risks and considerations not typically associated with investing in the U.S. Foreign securities may be subject to risk of loss because of more or less foreign government regulation, less public information and less economic, political and social stability in the countries in which a Fund invests. The imposition of exchange controls, confiscations, trade restrictions (including tariffs) and other government restrictions by the U.S. or other governments, or from problems in share registration, settlement or custody, may also result in losses. Foreign risk also involves the risk of negative foreign currency rate fluctuations, which may cause the value of securities denominated in such foreign currency (or other instruments through which a Fund has exposure to foreign currencies) to decline in value. Currency exchange rates may fluctuate significantly over short periods of time. To the extent that a Fund also invests in securities of issuers located in emerging markets, these risks may be more pronounced.
Foreign Custody Risk — If a Fund invests in foreign securities, the Fund may hold such securities and cash with foreign banks, agents, and securities depositories appointed by the Fund’s custodian (each a “Foreign Custodian”). Some foreign custodians may be recently organized or new to the foreign custody business. In some countries, Foreign Custodians may be subject to little or no regulatory oversight over, or independent evaluation of, their operations. Further, the laws of certain countries may place limitations on a Fund’s ability to recover its assets if a Foreign Custodian enters bankruptcy. Investments in emerging markets may be subject to even greater custody risks than investments in more developed markets. Custody services in emerging market countries are very often undeveloped and may be considerably less well regulated than in more developed countries, and thus may not afford the same level of investor protection as would apply in developed countries.
Geographic Risk — If a Fund focuses its investments in securities of issuers located in a particular country or geographic region, it will subject the Fund, to a greater extent than if its investments were less focused, to the risks of volatile economic cycles and/or conditions and developments that may be particular to that country or region, such as: adverse securities markets; adverse exchange rates; adverse social, political, regulatory, economic, business, environmental or other developments; or natural disasters.
Industry Concentration Risk — Concentrating Fund investments in a limited number of issuers conducting business in the same industry or group of industries will subject a Fund to a greater risk of loss as a result of adverse economic, business, political, environmental or other developments than if its investments were diversified across different industries.
Investments in Other Investment Companies — As a shareholder of another investment company, including an exchange-traded fund (“ETF”), a Fund will indirectly bear its proportionate share of any net management fees and other expenses paid by such other investment companies, in addition to the fees and expenses regularly borne by the Fund. ETFs are subject to risks that do not apply to conventional mutual funds, including but not limited to the following: (i) the market price of the ETF’s shares may trade at a premium or a discount to their NAV; and (ii) an active trading market for an ETF’s shares may not develop or be maintained.
Large Shareholder Transactions Risk — A Fund may experience adverse effects when certain large shareholders, such as other funds, institutional investors (including those trading by use of non-discretionary mathematical formulas), financial intermediaries (who may make investment decisions on behalf of underlying clients and/or include a Fund in their investment
47
GOLDMAN SACHS REAL ESTATE SECURITIES FUNDS
Notes to Financial Statements (continued)
June 30, 2017 (Unaudited)
| 8. OTHER RISKS (continued) |
model), individuals, accounts and Goldman Sachs affiliates, purchase or redeem large amounts of shares of a Fund. Such large shareholder redemptions may cause a Fund to sell portfolio securities at times when it would not otherwise do so, which may negatively impact a Fund’s NAV and liquidity. These transactions may also accelerate the realization of taxable income to shareholders if such sales of investments resulted in gains, and may also increase transaction costs. In addition, a large redemption could result in a Fund’s current expenses being allocated over a smaller asset base, leading to an increase in the Fund’s expense ratio. Similarly, large Fund share purchases may adversely affect a Fund’s performance to the extent that the Fund is delayed in investing new cash and is required to maintain a larger cash position than it ordinarily would.
Liquidity Risk — A Fund may make investments that are illiquid or that may become less liquid in response to market developments or adverse investor perceptions. Illiquid investments may be more difficult to value. Liquidity risk may also refer to the risk that a Fund will not be able to pay redemption proceeds within the allowable time period because of unusual market conditions, an unusually high volume of redemption requests, or other reasons. To meet redemption requests, a Fund may be forced to sell investments at an unfavorable time and/or under unfavorable conditions.
Market and Credit Risks — In the normal course of business, a Fund trades financial instruments and enters into financial transactions where risk of potential loss exists due to changes in the market (market risk). Additionally, a Fund may also be exposed to credit risk in the event that an issuer or guarantor fails to perform or that an institution or entity with which the Fund has unsettled or open transactions defaults.
Non-Diversification Risk — The Funds are non-diversified, meaning that they are permitted to invest a larger percentage of their assets in fewer issuers than diversified mutual funds. Thus, a Fund may be more susceptible to adverse developments affecting any single issuer held in its portfolio, and may be more susceptible to greater losses because of these developments.
| 9. INDEMNIFICATIONS |
Under the Trust’s organizational documents, its Trustees, officers, employees and agents are indemnified, to the extent permitted by the Act and state law, against certain liabilities that may arise out of performance of their duties to the Funds. Additionally, in the course of business, the Funds enter into contracts that contain a variety of indemnification clauses. The Funds’ maximum exposure under these arrangements is unknown, as this would involve future claims that may be made against the Funds that have not yet occurred. However, GSAM believes the risk of loss under these arrangements to be remote.
| 10. SUBSEQUENT EVENTS |
Subsequent events after the Statements of Assets and Liabilities date have been evaluated and GSAM has concluded that there is no impact requiring adjustment or disclosure in the financial statements.
48
GOLDMAN SACHS REAL ESTATE SECURITIES FUNDS
| 11. SUMMARY OF SHARE TRANSACTIONS |
Share activity is as follows:
| Global Real Estate Securities Fund | ||||||||||||||||
|
| |||||||||||||||
| For the Six Months Ended June 30, 2017 (Unaudited) | For the Fiscal Year Ended December 31, 2016 | |||||||||||||||
|
| |||||||||||||||
| Shares | Dollars | Shares | Dollars | |||||||||||||
|
| |||||||||||||||
| Class A Shares | ||||||||||||||||
Shares sold | 53 | $ | 550 | 475 | $ | 5,305 | ||||||||||
Reinvestment of distributions | 24 | 246 | 139 | 1,419 | ||||||||||||
Shares redeemed | — | — | (1 | ) | (5 | ) | ||||||||||
| 77 | 796 | 613 | 6,719 | |||||||||||||
| Class C Shares | ||||||||||||||||
Shares sold | (1 | ) | — | 953 | 10,000 | |||||||||||
Reinvestment of distributions | 15 | 147 | 134 | 1,354 | ||||||||||||
| 14 | 147 | 1,087 | 11,354 | |||||||||||||
| Institutional Shares | ||||||||||||||||
Shares sold | 22,986,532 | 234,696,112 | 2,751,238 | 27,977,859 | ||||||||||||
Reinvestment of distributions | 110,822 | 1,142,199 | 118,942 | 1,217,987 | ||||||||||||
Shares redeemed | (1,176,379 | ) | (12,087,841 | ) | (411,089 | ) | (4,142,941 | ) | ||||||||
| 21,920,975 | 223,750,470 | 2,459,091 | 25,052,905 | |||||||||||||
| Class IR Shares | ||||||||||||||||
Reinvestment of distributions | 23 | 236 | 126 | 1,296 | ||||||||||||
| 23 | 236 | 126 | 1,296 | |||||||||||||
| Class R Shares | ||||||||||||||||
Reinvestment of distributions | 17 | 171 | 113 | 1,159 | ||||||||||||
| 17 | 171 | 113 | 1,159 | |||||||||||||
| Class R6 Shares | ||||||||||||||||
Shares sold | 1 | — | — | — | ||||||||||||
Reinvestment of distributions | 25 | 258 | 130 | 1,343 | ||||||||||||
| 26 | 258 | 130 | 1,343 | |||||||||||||
NET INCREASE | 21,921,132 | $ | 223,752,078 | 2,461,160 | $ | 25,074,776 | ||||||||||
49
GOLDMAN SACHS REAL ESTATE SECURITIES FUNDS
Notes to Financial Statements (continued)
June 30, 2017 (Unaudited)
| 11. SUMMARY OF SHARE TRANSACTIONS (continued) |
| International Real Estate Securities Fund | ||||||||||||||||
|
| |||||||||||||||
| For the Six Months Ended June 30, 2017 (Unaudited) | For the Fiscal Year Ended December 31, 2016 | |||||||||||||||
|
| |||||||||||||||
| Shares | Dollars | Shares | Dollars | |||||||||||||
|
| |||||||||||||||
| Class A Shares | ||||||||||||||||
Shares sold | 51,944 | $ | 312,932 | 101,846 | $ | 617,864 | ||||||||||
Reinvestment of distributions | 14,350 | 88,393 | 41,743 | 239,950 | ||||||||||||
Shares redeemed | (198,400 | ) | (1,194,107 | ) | (465,021 | ) | (2,840,370 | ) | ||||||||
| (132,106 | ) | (792,782 | ) | (321,432 | ) | (1,982,556 | ) | |||||||||
| Class C Shares | ||||||||||||||||
Shares sold | 1,400 | 8,351 | 1,497 | 9,086 | ||||||||||||
Reinvestment of distributions | 1,995 | 12,312 | 6,536 | 37,507 | ||||||||||||
Shares redeemed | (52,769 | ) | (319,492 | ) | (73,960 | ) | (444,281 | ) | ||||||||
| (49,374 | ) | (298,829 | ) | (65,927 | ) | (397,688 | ) | |||||||||
| Institutional Shares | ||||||||||||||||
Shares sold | 2,283,782 | 13,074,446 | 11,735,695 | 67,851,273 | ||||||||||||
Reinvestment of distributions | 473,222 | 2,820,403 | 2,537,732 | 14,116,536 | ||||||||||||
Shares redeemed | (33,036,667 | ) | (194,346,521 | ) | (17,067,955 | ) | (98,788,023 | ) | ||||||||
| (30,279,663 | ) | (178,451,672 | ) | (2,794,528 | ) | (16,820,214 | ) | |||||||||
| Class IR Shares | ||||||||||||||||
Shares sold | 48,141 | 283,727 | 7,170 | 43,241 | ||||||||||||
Reinvestment of distributions | 753 | 4,592 | 853 | 4,864 | ||||||||||||
Shares redeemed | (28,456 | ) | (170,831 | ) | (3,830 | ) | (22,352 | ) | ||||||||
| 20,438 | 117,488 | 4,193 | 25,753 | |||||||||||||
| Class R6 Shares | ||||||||||||||||
Shares sold | — | 1 | — | — | ||||||||||||
Reinvestment of distributions | 35 | 208 | 80 | 442 | ||||||||||||
| 35 | 209 | 80 | 442 | |||||||||||||
NET DECREASE | (30,440,670 | ) | $ | (179,425,586 | ) | (3,177,614 | ) | $ | (19,174,263 | ) | ||||||
50
GOLDMAN SACHS REAL ESTATE SECURITIES FUNDS
| 11. SUMMARY OF SHARE TRANSACTIONS (continued) |
| Real Estate Securities Fund | ||||||||||||||||
|
| |||||||||||||||
| For the Six Months Ended June 30, 2017 (Unaudited) | For the Fiscal Year Ended December 31, 2016 | |||||||||||||||
|
| |||||||||||||||
| Shares | Dollars | Shares | Dollars | |||||||||||||
|
| |||||||||||||||
| Class A Shares | ||||||||||||||||
Shares sold | 375,666 | $ | 6,868,761 | 938,986 | $ | 19,066,528 | ||||||||||
Reinvestment of distributions | 21,468 | 391,199 | 295,910 | 5,518,009 | ||||||||||||
Shares redeemed | (801,229 | ) | (14,697,766 | ) | (1,209,837 | ) | (24,118,655 | ) | ||||||||
| (404,095 | ) | (7,437,806 | ) | 25,059 | 465,882 | |||||||||||
| Class C Shares | ||||||||||||||||
Shares sold | 26,294 | 468,917 | 155,632 | 3,114,856 | ||||||||||||
Reinvestment of distributions | 4,707 | 82,917 | 85,909 | 1,539,136 | ||||||||||||
Shares redeemed | (133,375 | ) | (2,362,399 | ) | (157,241 | ) | (2,994,007 | ) | ||||||||
| (102,374 | ) | (1,810,565 | ) | 84,300 | 1,659,985 | |||||||||||
| Institutional Shares | ||||||||||||||||
Shares sold | 1,824,328 | 34,132,071 | 2,771,649 | 56,468,817 | ||||||||||||
Reinvestment of distributions | 198,503 | 3,698,085 | 2,369,689 | 45,314,393 | ||||||||||||
Shares redeemed | (10,285,380 | ) | (191,049,966 | ) | (7,208,641 | ) | (146,350,507 | ) | ||||||||
| (8,262,549 | ) | (153,219,810 | ) | (2,067,303 | ) | (44,567,297 | ) | |||||||||
| Service Shares | ||||||||||||||||
Shares sold | 12,843 | 237,618 | 61,950 | 1,241,007 | ||||||||||||
Reinvestment of distributions | 698 | 12,793 | 8,748 | 163,823 | ||||||||||||
Shares redeemed | (37,712 | ) | (695,514 | ) | (50,536 | ) | (1,042,478 | ) | ||||||||
| (24,171 | ) | (445,103 | ) | 20,162 | 362,352 | |||||||||||
| Class IR Shares | ||||||||||||||||
Shares sold | 305,456 | 5,694,010 | 363,452 | 7,322,119 | ||||||||||||
Reinvestment of distributions | 7,210 | 132,090 | 52,887 | 994,803 | ||||||||||||
Shares redeemed | (143,562 | ) | (2,647,968 | ) | (328,703 | ) | (6,595,715 | ) | ||||||||
| 169,104 | 3,178,132 | 87,636 | 1,721,207 | |||||||||||||
| Class R Shares | ||||||||||||||||
Shares sold | 27,279 | 495,837 | 145,944 | 2,810,331 | ||||||||||||
Reinvestment of distributions | 1,057 | 19,112 | 17,558 | 324,442 | ||||||||||||
Shares redeemed | (72,245 | ) | (1,319,018 | ) | (97,719 | ) | (1,914,365 | ) | ||||||||
| (43,909 | ) | (804,069 | ) | 65,783 | 1,220,408 | |||||||||||
| Class R6 Shares | ||||||||||||||||
Shares sold | 718 | 13,436 | 5,887 | 132,561 | ||||||||||||
Reinvestment of distributions | 28 | 528 | 225 | 4,256 | ||||||||||||
Shares redeemed | (2 | ) | (40 | ) | (4,421 | ) | (98,667 | ) | ||||||||
| 744 | 13,924 | 1,691 | 38,150 | |||||||||||||
NET DECREASE | (8,667,250 | ) | $ | (160,525,297 | ) | (1,782,672 | ) | $ | (39,099,313 | ) | ||||||
51
GOLDMAN SACHS REAL ESTATE SECURITIES FUNDS
Fund Expenses — Six Month Period Ended June 30, 2017 (Unaudited)
As a shareholder of Class A, Class C, Institutional, Service, Class IR, Class R or Class R6 Shares of a Fund you incur two types of costs: (1) transaction costs, including sales charges on purchase payments (with respect to Class A Shares) and contingent deferred sales charges on redemptions (with respect to Class C Shares); and (2) ongoing costs, including management fees; distribution and/or service (12b-1) fees (with respect to Class A, Class C and Class R Shares); and other Fund expenses. This example is intended to help you understand your ongoing costs (in dollars) of investing in Class A, Class C, Institutional, Service, Class IR, Class R and Class R6 Shares of the Funds and to compare these costs with the ongoing costs of investing in other mutual funds.
The example is based on an investment of $1,000 invested at the beginning of the period and held for the entire period from January 1, 2017 through June 30, 2017, which represents a period of 181 days of a 365 day year.
Actual Expenses — The first line under each share class in the table below provides information about actual account values and actual expenses. You may use the information in this line, together with the amount you invested, to estimate the expenses that you paid over the period. Simply divide your account value by $1,000 (for example, an $8,600 account value divided by $1,000=8.6), then multiply the result by the number in the first line under the heading entitled “Expenses Paid” to estimate the expenses you paid on your account during this period.
Hypothetical Example for Comparison Purposes — The second line under each share class in the table below provides information about hypothetical account values and hypothetical expenses based on the Funds’ actual net expense ratio and an assumed rate of return of 5% per year before expenses, which is not the Funds’ actual return. The hypothetical account values and expenses may not be used to estimate the actual ending account balance or expenses you paid for the period. You may use this information to compare the ongoing costs of investing in the Funds and other funds. To do so, compare this 5% hypothetical example with the 5% hypothetical examples that appear in the shareholder reports of the other funds.
Please note that the expenses shown in the table are meant to highlight your ongoing costs only and do not reflect any transactional costs, such as sales charges, redemption fees, or exchange fees. Therefore, the second line of the table is useful in comparing ongoing costs only and will not help you determine the relative total costs of owning different funds. In addition, if these transactional costs were included, your costs would have been higher.
| Global Real Estate Securities Fund | International Real Estate Securities Fund | Real Estate Securities Fund | ||||||||||||||||||||||||||||||||||
| Share Class | Beginning Account 01/01/17 | Ending Account 06/30/17 | Expenses Paid for the 6 Months Ended 06/30/17* | Beginning Account 01/01/17 | Ending Account 06/30/17 | Expenses Paid for the 6 Months Ended 06/30/17* | Beginning Account 01/01/17 | Ending Account 06/30/17 | Expenses Paid for the 6 Months Ended 06/30/17* | |||||||||||||||||||||||||||
| Class A | ||||||||||||||||||||||||||||||||||||
Actual | $ | 1,000 | $ | 1,030.60 | $ | 7.05 | $ | 1,000 | $ | 1,089.10 | $ | 7.20 | $ | 1,000 | $ | 999.70 | $ | 6.50 | ||||||||||||||||||
Hypothetical 5% return | 1,000 | 1,017.85 | + | 7.00 | 1,000 | 1,017.90 | + | 6.95 | 1,000 | 1,018.30 | + | 6.56 | ||||||||||||||||||||||||
| Class C | ||||||||||||||||||||||||||||||||||||
Actual | 1,000 | 1,027.00 | 10.81 | 1,000 | 1,086.20 | 11.07 | 1,000 | 996.10 | 10.20 | |||||||||||||||||||||||||||
Hypothetical 5% return | 1,000 | 1,014.13 | + | 10.74 | 1,000 | 1,014.18 | + | 10.69 | 1,000 | 1,014.58 | + | 10.29 | ||||||||||||||||||||||||
| Institutional | ||||||||||||||||||||||||||||||||||||
Actual | 1,000 | 1,032.50 | 5.04 | 1,000 | 1,092.40 | 5.14 | 1,000 | 1,002.10 | 4.52 | |||||||||||||||||||||||||||
Hypothetical 5% return | 1,000 | 1,019.84 | + | 5.01 | 1,000 | 1,019.89 | + | 4.96 | 1,000 | 1,020.28 | + | 4.56 | ||||||||||||||||||||||||
| Service | ||||||||||||||||||||||||||||||||||||
Actual | N/A | N/A | N/A | N/A | N/A | N/A | 1,000 | 999.80 | 6.99 | |||||||||||||||||||||||||||
Hypothetical 5% return | N/A | N/A | N/A | N/A | N/A | N/A | 1,000 | 1,017.80 | + | 7.05 | ||||||||||||||||||||||||||
| Class IR | ||||||||||||||||||||||||||||||||||||
Actual | 1,000 | 1,032.80 | 5.80 | 1,000 | 1,091.30 | 5.91 | 1,000 | 1,001.00 | 5.26 | |||||||||||||||||||||||||||
Hypothetical 5% return | 1,000 | 1,019.09 | + | 5.76 | 1,000 | 1,019.14 | + | 5.71 | 1,000 | 1,019.54 | + | 5.31 | ||||||||||||||||||||||||
| Class R | ||||||||||||||||||||||||||||||||||||
Actual | 1,000 | 1,029.40 | 8.30 | N/A | N/A | N/A | 1,000 | 998.90 | 7.73 | |||||||||||||||||||||||||||
Hypothetical 5% return | 1,000 | 1,016.61 | + | 8.25 | N/A | N/A | N/A | 1,000 | 1,017.06 | + | 7.80 | |||||||||||||||||||||||||
| Class R6 | ||||||||||||||||||||||||||||||||||||
Actual | 1,000 | 1,032.60 | 4.94 | 1,000 | 1,092.60 | 5.14 | 1,000 | 1,001.70 | 4.42 | |||||||||||||||||||||||||||
Hypothetical 5% return | 1,000 | 1,019.93 | + | 4.91 | 1,000 | 1,019.89 | + | 4.96 | 1,000 | 1,020.38 | + | 4.46 | ||||||||||||||||||||||||
| * | Expenses are calculated using each Fund’s annualized net expense ratio for each class, which represents the ongoing expenses as a percentage of net assets for the six months ended June 30, 2017. Expenses are calculated by multiplying the annualized net expense ratio by the average account value for the period; then multiplying the result by the number of days in the most recent fiscal half year; and then dividing that result by the number of days in the fiscal year. The annualized net expense ratios for the period were as follows: |
| Fund | Class A | Class C | Institutional | Service | Class IR | Class R | Class R6 | |||||||||||||||||||||
Global Real Estate Securities | 1.40 | % | 2.15 | % | 1.00 | % | N/A | 1.15 | % | 1.65 | % | 0.98 | % | |||||||||||||||
International Real Estate Securities | 1.39 | 2.14 | 0.99 | N/A | 1.14 | N/A | 0.99 | |||||||||||||||||||||
Real Estate Securities | 1.31 | 2.06 | 0.91 | 1.41 | % | 1.06 | 1.56 | 0.89 | ||||||||||||||||||||
| + | Hypothetical expenses are based on each Fund’s actual annualized net expense ratios and an assumed rate of return of 5% per year before expenses. |
52
GOLDMAN SACHS REAL ESTATE SECURITIES FUNDS
Statement Regarding Basis for Approval of Management Agreement (Unaudited)
Background
The Goldman Sachs Global Real Estate Securities Fund, Goldman Sachs International Real Estate Securities Fund, and Goldman Sachs Real Estate Securities Fund (the “Funds”) are investment portfolios of Goldman Sachs Trust (the “Trust”). The Board of Trustees oversees the management of the Trust and reviews the investment performance and expenses of the Funds at regularly scheduled meetings held throughout the year. In addition, the Board of Trustees determines annually whether to approve the continuance of the Trust’s investment management agreement (the “Management Agreement”) with Goldman Sachs Asset Management, L.P. (the “Investment Adviser”) on behalf of the Funds.
The Management Agreement was most recently approved for continuation until June 30, 2018 by the Board of Trustees, including those Trustees who are not parties to the Management Agreement or “interested persons” (as defined in the Investment Company Act of 1940, as amended) of any party thereto (the “Independent Trustees”), at a meeting held on June 14-15, 2017 (the “Annual Meeting”).
The review process undertaken by the Trustees spans the course of the year and culminates with the Annual Meeting. To assist the Trustees in their deliberations, the Trustees have established a Contract Review Committee (the “Committee”), comprised of the Independent Trustees. The Committee held four meetings over the course of the year since the Management Agreement was last approved. At those Committee meetings, regularly scheduled Board or other committee meetings, and/or the Annual Meeting, matters relevant to the renewal of the Management Agreement were considered by the Board, or the Independent Trustees, as applicable. With respect to each Fund, such matters included:
| (a) | the nature and quality of the advisory, administrative, and other services provided to the Fund by the Investment Adviser and its affiliates, including information about: |
| (i) | the structure, staff, and capabilities of the Investment Adviser and its portfolio management teams; |
| (ii) | the groups within the Investment Adviser and its affiliates that support the portfolio management teams or provide other types of necessary services, including fund services groups (e.g., accounting and financial reporting, tax, shareholder services, and operations); controls and risk management groups (e.g., legal, compliance, valuation oversight, credit risk management, internal audit, compliance testing, market risk analysis, finance, and central funding); sales and distribution support groups, and others (e.g., information technology and training); |
| (iii) | trends in employee headcount; |
| (iv) | the Investment Adviser’s financial resources and ability to hire and retain talented personnel and strengthen its operations; and |
| (v) | the parent company’s support of the Investment Adviser and its mutual fund business, as expressed by the firm’s senior management; |
| (b) | information on the investment performance of the Fund, including comparisons to the performance of similar mutual funds, as provided by a third-party mutual fund data provider engaged as part of the contract review process (the “Outside Data Provider”), a benchmark performance index, and (in the case of the International Real Estate Securities Fund) a composite of accounts with comparable investment strategies managed by the Investment Adviser; and information on general investment outlooks in the markets in which the Fund invests; |
| (c) | information provided by the Investment Adviser indicating the Investment Adviser’s views on whether the Fund’s peer group and/or benchmark index had high, medium, or low relevance given the Fund’s particular investment strategy; |
| (d) | the terms of the Management Agreement and other agreements with affiliated service providers entered into by the Trust on behalf of the Fund; |
| (e) | fee and expense information for the Fund, including: |
| (i) | the relative management fee and expense levels of the Fund as compared to those of comparable funds managed by other advisers, as provided by the Outside Data Provider; |
| (ii) | the Fund’s expense trends over time; and |
| (iii) | to the extent the Investment Adviser manages other types of accounts (such as bank collective trusts, private wealth management accounts, institutional separate accounts, sub-advised mutual funds, and non-U.S. funds) having investment objectives and policies similar to those of the Fund, comparative information on the advisory fees charged and services provided to those accounts by the Investment Adviser; |
| (f) | with respect to the extensive investment performance and expense comparison data provided by the Outside Data Provider, its processes in producing that data for the Fund; |
| (g) | the undertakings of the Investment Adviser and its affiliates to implement fee waivers and/or expense limitations; |
| (h) | information relating to the profitability of the Management Agreement and the transfer agency and distribution and service arrangements of the Fund to the Investment Adviser and its affiliates; |
| (i) | whether the Fund’s existing management fee schedule adequately addressed any economies of scale; |
53
GOLDMAN SACHS REAL ESTATE SECURITIES FUNDS
Statement Regarding Basis for Approval of Management Agreement (Unaudited) (continued)
| (j) | a summary of the “fall-out” benefits derived by the Investment Adviser and its affiliates from their relationships with the Fund, including the fees received by the Investment Adviser’s affiliates from the Fund for transfer agency, portfolio trading, distribution and other services; |
| (k) | a summary of potential benefits derived by the Fund as a result of its relationship with the Investment Adviser; |
| (l) | information regarding commissions paid by the Fund and broker oversight, an update on the Investment Adviser’s soft dollars practices, other information regarding portfolio trading, and how the Investment Adviser carries out its duty to seek best execution; |
| (m) | portfolio manager ownership of Fund shares; the manner in which portfolio manager compensation is determined; and the number and types of accounts managed by the portfolio managers; |
| (n) | the nature and quality of the services provided to the Fund by its unaffiliated service providers, and the Investment Adviser’s general oversight and evaluation (including reports on due diligence) of those service providers as part of the administrative services provided under the Management Agreement; and |
| (o) | the Investment Adviser’s processes and policies addressing various types of potential conflicts of interest; its approach to risk management; the annual review of the effectiveness of the Fund’s compliance program; and periodic compliance reports. |
The Trustees also received an overview of the Funds’ distribution arrangements. They received information regarding the Funds’ assets, share purchase and redemption activity, and payment of distribution, service, and shareholder administration fees, as applicable. Information was also provided to the Trustees relating to revenue sharing payments made by and services provided by the Investment Adviser and its affiliates to intermediaries that promote the sale, distribution, and/or servicing of Fund shares. The Independent Trustees also discussed the broad range of other investment choices that are available to Fund investors, including the availability of comparable funds managed by other advisers.
The presentations made at the Board and Committee meetings and at the Annual Meeting encompassed the Funds and other mutual funds for which the Board of Trustees has responsibility. In evaluating the Management Agreement at the Annual Meeting, the Trustees relied upon their knowledge, resulting from their meetings and other interactions throughout the year, of the Investment Adviser and its affiliates, their services, and the Funds. In conjunction with these meetings, the Trustees received written materials and oral presentations on the topics covered, and the Investment Adviser addressed the questions and concerns of the Trustees, including concerns regarding the investment performance of certain of the funds they oversee. The Independent Trustees were advised by their independent legal counsel regarding their responsibilities and other regulatory requirements related to the approval and continuation of mutual fund investment management agreements under applicable law. In addition, the Investment Adviser and its affiliates provided the Independent Trustees with a written response to a formal request for information sent on behalf of the Independent Trustees by their independent legal counsel. During the course of their deliberations, the Independent Trustees met in executive sessions with their independent legal counsel, without representatives of the Investment Adviser or its affiliates present.
Nature, Extent, and Quality of the Services Provided Under the Management Agreement
As part of their review, the Trustees considered the nature, extent, and quality of the services provided to the Funds by the Investment Adviser. In this regard, the Trustees considered both the investment advisory services and non-advisory services that are provided by the Investment Adviser and its affiliates. The Trustees noted the transition in the leadership and changes in personnel of various of the Investment Adviser’s portfolio management teams that had occurred in recent periods, and the ongoing recruitment efforts aimed at bringing high quality investment talent to the Investment Adviser. They also noted the Investment Adviser’s commitment to maintaining high quality systems and expending substantial resources to respond to ongoing changes to the regulatory and control environment in which the Funds and their service providers operate, as well as the efforts of the Investment Adviser and its affiliates to combat cyber security risks. The Trustees concluded that the Investment Adviser continued to commit substantial financial and operational resources to the Funds and expressed confidence that the Investment Adviser would continue to do so in the future. The Trustees also recognized that the Investment Adviser had made significant commitments to address regulatory compliance requirements applicable to the Funds and the Investment Adviser and its affiliates.
Investment Performance
The Trustees also considered the investment performance of the Funds. In this regard, they compared the investment performance of each Fund to its peers using rankings and (except the Global Real Estate Securities Fund) ratings compiled by the Outside Data Provider as of December 31, 2016, and updated performance information prepared by the Investment Adviser using the peer group identified by the Outside Data Provider as of March 31, 2017. The information on each Fund’s investment performance was provided for the one-, three-, five-, and ten-year periods ending on the applicable dates, to the extent that each Fund had been in existence for those periods. The Trustees also reviewed each Fund’s investment performance relative to its
54
GOLDMAN SACHS REAL ESTATE SECURITIES FUNDS
Statement Regarding Basis for Approval of Management Agreement (Unaudited) (continued)
performance benchmark. As part of this review, they considered the investment performance trends of the Funds over time, and reviewed the investment performance of each Fund in light of its investment objective and policies and market conditions. The Trustees also received information comparing the International Real Estate Securities Fund’s performance to that of a composite of accounts with comparable investment strategies managed by the Investment Adviser.
In addition, the Trustees considered materials prepared and presentations made by the Investment Adviser’s senior management and portfolio management personnel in which Fund performance was assessed. The Trustees also considered the Investment Adviser’s periodic reports with respect to the Funds’ risk profiles, and how the Investment Adviser’s approach to risk monitoring and management influences portfolio management.
The Trustees noted that the Global Real Estate Securities Fund’s Institutional Shares had placed in the third quartile of the Fund’s peer group and had underperformed the Fund’s benchmark index for the one-year period ended March 31, 2017. They noted that the International Real Estate Securities Fund’s Institutional Shares had placed in the third quartile of the Fund’s peer group for the one- and five-year periods and in the fourth quartile for the three- and ten-year periods, and had underperformed the Fund’s benchmark index for the one-, three-, five-, and ten-year periods ended March 31, 2017. They considered that the International Real Estate Securities Fund has a “global” peer group and benchmark that contemplates investments in U.S. and non-U.S. securities, whereas the Fund invests only in non-U.S. securities. The Trustees observed that the Real Estate Securities Fund’s Institutional Shares had placed in the second quartile of the Fund’s peer group for the three- and five-year periods, in the third quartile for the ten-year period, and in the fourth quartile for the one-year period ended March 31, 2017, and had underperformed the Fund’s benchmark index for the one-, three-, five-, and ten-year periods ended April 30, 2017.
Costs of Services Provided and Competitive Information
The Trustees considered the contractual terms of the Management Agreement and the fee rates payable by each Fund thereunder. In this regard, the Trustees considered information on the services rendered by the Investment Adviser to the Funds, which included both advisory and administrative services that were directed to the needs and operations of the Funds as registered mutual funds.
In particular, the Trustees reviewed analyses prepared by the Outside Data Provider regarding the expense rankings of the Funds. The analyses provided a comparison of each Fund’s management fee and breakpoints to those of a relevant peer group and category universe; an expense analysis which compared each Fund’s overall net and gross expenses to a peer group and a category universe; and data comparing each Fund’s net expenses to the peer and category medians. The analyses also compared each Fund’s transfer agency, custody, and distribution fees, other expenses and fee waivers/reimbursements to those of the peer group and category medians. The Trustees concluded that the comparisons provided by the Outside Data Provider were useful in evaluating the reasonableness of the management fees and total expenses paid by the Funds.
The Trustees noted that each Fund’s management fee breakpoint schedule was being reduced at all asset levels. In addition, the Trustees considered the Investment Adviser’s undertakings to implement fee waivers and/or expense limitations. The Trustees also noted that certain changes were being made to existing fee waiver or expense limitation arrangements of the Global Real Estate Fund that would have the effect of decreasing total Fund expenses, with such changes taking effect in connection with the Fund’s next annual registration statement update. They also considered, to the extent that the Investment Adviser manages other types of accounts having investment objectives and policies similar to those of the Funds, comparative fee information for services provided by the Investment Adviser to those accounts, and information that indicated that services provided to the Funds differed in various significant respects from the services provided to other types of accounts which, in many cases, operated under less stringent legal and regulatory structures, required fewer services from the Investment Adviser to a smaller number of client contact points, and were less time-intensive.
In addition, the Trustees noted that shareholders are able to redeem their Fund shares at any time if shareholders believe that the Fund fees and expenses are too high or if they are dissatisfied with the performance of the Fund.
Profitability
The Trustees reviewed each Fund’s contribution to the Investment Adviser’s revenues and pre-tax profit margins. In this regard the Trustees noted that they had received, among other things, profitability analyses and summaries, revenue and expense schedules by Fund and by function (i.e., investment management, transfer agency and distribution and service), and information on the Investment Adviser’s expense allocation methodology. They observed that the profitability and expense figures are substantially similar to those used by the Investment Adviser for many internal purposes, including compensation decisions among various business groups, and are thus subject to a vigorous internal debate about how certain revenue and expenses should be allocated. The Trustees also noted that the internal audit group within the Goldman Sachs organization had audited the expense allocation methodology and that the internal audit group was satisfied with the reasonableness, consistency, and accuracy of the Investment Adviser’s expense allocation methodology and profitability analysis calculations. Profitability data for each Fund were provided for 2016 and 2015, and the Trustees considered this information in relation to the Investment Adviser’s overall profitability.
55
GOLDMAN SACHS REAL ESTATE SECURITIES FUNDS
Statement Regarding Basis for Approval of Management Agreement (Unaudited) (continued)
Economies of Scale
The Trustees considered the information that had been provided regarding the Investment Adviser’s profitability. The Trustees also considered the breakpoints in the fee rate payable under the Management Agreement for each of the Funds at the following annual percentage rates of the average daily net assets of the Funds:
Real Estate Fund | International Real Estate Securities Fund | Global Real Estate Fund | ||||||||||
| First $1 billion | 1.00 | % | 1.05 | % | 1.05 | % | ||||||
| Next $1 billion | 0.90 | 1.05 | 0.95 | |||||||||
| Next $3 billion | 0.86 | 0.95 | 0.90 | |||||||||
| Next $3 billion | 0.84 | 0.90 | 0.88 | |||||||||
| Over $8 billion | 0.82 | 0.88 | 0.86 | |||||||||
The Trustees noted that the breakpoints were designed to share potential economies of scale, if any, with the Funds and their shareholders as assets under management reach those asset levels. The Trustees considered the amounts of assets in the Funds; the Funds’ recent share purchase and redemption activity; the information provided by the Investment Adviser relating to the costs of the services provided by the Investment Adviser and its affiliates and their realized profits; information comparing fee rates charged by the Investment Adviser with fee rates charged to other funds in the peer groups; and the Investment Adviser’s undertakings to waive a portion of its management fees and to limit certain expenses of the Funds that exceed specified levels. Upon reviewing these matters at the Annual Meeting, the Trustees concluded that the fee breakpoints represented a means of assuring that benefits of scalability, if any, would be passed along to shareholders at the specified asset levels.
Other Benefits to the Investment Adviser and Its Affiliates
The Trustees also considered the other benefits derived by the Investment Adviser and its affiliates from their relationships with the Funds as stated above, including: (a) transfer agency fees received by Goldman Sachs & Co. LLC (“Goldman Sachs”); (b) brokerage commissions earned by Goldman Sachs for executing securities transactions on behalf of the Funds; (c) research received by the Investment Adviser from broker-dealers in exchange for executing certain transactions on behalf of the Funds; (d) trading efficiencies resulting from aggregation of orders of the Funds with those for other funds or accounts managed by the Investment Adviser; (e) the Investment Adviser’s ability to leverage the infrastructure designed to service the Funds on behalf of its other clients; (f) the Investment Adviser’s ability to cross-market other products and services to Fund shareholders; (g) Goldman Sachs’ retention of certain fees as Fund Distributor; (h) the Investment Adviser’s ability to negotiate better pricing with custodians on behalf of its other clients, as a result of the relationship with the Funds; and (i) the possibility that the working relationship between the Investment Adviser and the Funds’ third-party service providers may cause those service providers to be more likely to do business with other areas of Goldman Sachs. In the course of considering the foregoing, the Independent Trustees requested and received further information quantifying certain of these fall-out benefits.
Other Benefits to the Funds and Their Shareholders
The Trustees also noted that the Funds receive certain potential benefits as a result of their relationship with the Investment Adviser, including: (a) trading efficiencies resulting from aggregation of orders of the Funds with those of other funds or accounts managed by the Investment Adviser; (b) enhanced servicing from vendors because of the volume of business generated by the Investment Adviser and its affiliates; (c) enhanced servicing from broker-dealers because of the volume of business generated by the Investment Adviser and its affiliates; (d) the Investment Adviser’s knowledge and experience gained from managing other accounts and products; (e) the Investment Adviser’s ability to hire and retain qualified personnel to provide services to the Funds because of the reputation of the Goldman Sachs organization; (f) the Funds’ access, through the Investment Adviser, to certain firmwide resources (e.g., proprietary risk management systems and databases), subject to certain restrictions; (g) the Funds’ access to certain affiliated distribution channels. In addition, the Trustees noted the competitive nature of the mutual fund marketplace, and considered that many of the Funds’ shareholders invested in the Funds in part because of the Funds’ relationship with the Investment Adviser and that those shareholders have a general expectation that the relationship will continue.
Conclusion
In connection with their consideration of the Management Agreement, the Trustees gave weight to each of the factors described above, but did not identify any particular factor as controlling their decision. After deliberation and consideration of all of the information provided, including the factors described above, the Trustees concluded, in the exercise of their business judgment, that the management fees paid by each of the Funds were reasonable in light of the services provided to it by the Investment Adviser, the Investment Adviser’s costs and each Fund’s current and reasonably foreseeable asset levels. The Trustees unanimously concluded that the Investment Adviser’s continued management likely would benefit each Fund and its shareholders and that the Management Agreement should be approved and continued with respect to each Fund until June 30, 2018.
56
FUNDS PROFILE
Goldman Sachs Funds
Goldman Sachs is a premier financial services firm, known since 1869 for creating thoughtful and customized investment solutions in complex global markets.
Today, the Investment Management Division of Goldman Sachs serves a diverse set of clients worldwide, including private institutions, public entities and individuals. With approximately $1.21 trillion in assets under supervision as of June 30, 2017, Goldman Sachs Asset Management (“GSAM”) has portfolio management teams located around the world and our investment professionals bring firsthand knowledge of local markets to every investment decision. Assets under supervision includes assets under management and other client assets for which Goldman Sachs does not have full discretion. GSAM leverages the resources of Goldman Sachs & Co. LLC subject to legal, internal and regulatory restrictions.
Money Market
Financial Square FundsSM
| ∎ | Financial Square Treasury Solutions Fund1 |
| ∎ | Financial Square Government Fund1 |
| ∎ | Financial Square Money Market Fund2 |
| ∎ | Financial Square Prime Obligations Fund2 |
| ∎ | Financial Square Treasury Instruments Fund1 |
| ∎ | Financial Square Treasury Obligations Fund1 |
| ∎ | Financial Square Federal Instruments Fund1 |
| ∎ | Financial Square Tax-Exempt Money Market Fund2 |
Investor FundsSM
| ∎ | Investor Money Market Fund3 |
| ∎ | Investor Tax-Exempt Money Market Fund3 |
Fixed Income
Short Duration and Government
| ∎ | Enhanced Income Fund |
| ∎ | High Quality Floating Rate Fund |
| ∎ | Short-Term Conservative Income Fund |
| ∎ | Short Duration Government Fund |
| ∎ | Short Duration Income Fund |
| ∎ | Government Income Fund |
| ∎ | Inflation Protected Securities Fund |
Multi-Sector
| ∎ | Bond Fund |
| ∎ | Core Fixed Income Fund |
| ∎ | Global Income Fund |
| ∎ | Strategic Income Fund |
Municipal and Tax-Free
| ∎ | High Yield Municipal Fund |
| ∎ | Dynamic Municipal Income Fund |
| ∎ | Short Duration Tax-Free Fund |
Single Sector
| ∎ | Investment Grade Credit Fund |
| ∎ | U.S. Mortgages Fund |
| ∎ | High Yield Fund |
| ∎ | High Yield Floating Rate Fund |
| ∎ | Emerging Markets Debt Fund |
| ∎ | Local Emerging Markets Debt Fund |
| ∎ | Dynamic Emerging Markets Debt Fund |
Fixed Income Alternatives
| ∎ | Long Short Credit Strategies Fund |
| ∎ | Strategic Macro Fund4 |
Fundamental Equity
| ∎ | Equity Income Fund5 |
| ∎ | Small Cap Value Fund |
| ∎ | Small/Mid Cap Value Fund |
| ∎ | Mid Cap Value Fund |
| ∎ | Large Cap Value Fund |
| ∎ | Focused Value Fund |
| ∎ | Capital Growth Fund |
| ∎ | Strategic Growth Fund |
| ∎ | Small/Mid Cap Growth Fund |
| ∎ | Flexible Cap Fund6 |
| ∎ | Concentrated Growth Fund7 |
| ∎ | Technology Opportunities Fund |
| ∎ | Growth Opportunities Fund |
| ∎ | Rising Dividend Growth Fund |
| ∎ | Dynamic U.S. Equity Fund |
| ∎ | Income Builder Fund |
Tax-Advantaged Equity
| ∎ | U.S. Tax-Managed Equity Fund |
| ∎ | International Tax-Managed Equity Fund |
| ∎ | U.S. Equity Dividend and Premium Fund |
| ∎ | International Equity Dividend and Premium Fund |
Equity Insights
| ∎ | Small Cap Equity Insights Fund |
| ∎ | U.S. Equity Insights Fund |
| ∎ | Small Cap Growth Insights Fund |
| ∎ | Large Cap Growth Insights Fund |
| ∎ | Large Cap Value Insights Fund |
| ∎ | Small Cap Value Insights Fund |
| ∎ | International Small Cap Insights Fund |
| ∎ | International Equity Insights Fund |
| ∎ | Emerging Markets Equity Insights Fund |
Fundamental Equity International
| ∎ | Strategic International Equity Fund |
| ∎ | Focused International Equity Fund |
| ∎ | Asia Equity Fund |
| ∎ | Emerging Markets Equity Fund |
| ∎ | N-11 Equity Fund |
Select Satellite
| ∎ | Real Estate Securities Fund |
| ∎ | International Real Estate Securities Fund |
| ∎ | Commodity Strategy Fund |
| ∎ | Global Real Estate Securities Fund |
| ∎ | Dynamic Allocation Fund |
| ∎ | Absolute Return Tracker Fund |
| ∎ | Long Short Fund |
| ∎ | Managed Futures Strategy Fund |
| ∎ | MLP Energy Infrastructure Fund |
| ∎ | Multi-Manager Alternatives Fund |
| ∎ | Absolute Return Multi-Asset Fund |
| ∎ | Global Infrastructure Fund |
Total Portfolio Solutions
| ∎ | Global Managed Beta Fund |
| ∎ | Multi-Manager Non-Core Fixed Income Fund |
| ∎ | Multi-Manager U.S. Dynamic Equity Fund |
| ∎ | Multi-Manager Global Equity Fund |
| ∎ | Multi-Manager International Equity Fund |
| ∎ | Tactical Tilt Overlay Fund |
| ∎ | Balanced Strategy Portfolio |
| ∎ | Multi-Manager U.S. Small Cap Equity Fund |
| ∎ | Multi-Manager Real Assets Strategy Fund |
| ∎ | Growth and Income Strategy Portfolio |
| ∎ | Growth Strategy Portfolio |
| ∎ | Equity Growth Strategy Portfolio |
| ∎ | Satellite Strategies Portfolio |
| ∎ | Enhanced Dividend Global Equity Portfolio |
| ∎ | Tax-Advantaged Global Equity Portfolio |
| ∎ | Strategic Factor Allocation Fund |
| ∎ | Target Date 2020 Portfolio |
| ∎ | Target Date 2025 Portfolio |
| ∎ | Target Date 2030 Portfolio |
| ∎ | Target Date 2035 Portfolio |
| ∎ | Target Date 2040 Portfolio |
| ∎ | Target Date 2045 Portfolio |
| ∎ | Target Date 2050 Portfolio |
| ∎ | Target Date 2055 Portfolio |
| ∎ | GQG Partners International Opportunities Fund |
| 1 | You could lose money by investing in the Fund. Although the Fund seeks to preserve the value of your investment at $1.00 per share, it cannot guarantee it will do so. An investment in the Fund is not a deposit of a bank and is not insured or guaranteed by the Federal Deposit Insurance Corporation or any other government agency. The Fund’s sponsor has no legal obligation to provide financial support to the Fund, and you should not expect that the sponsor will provide financial support to the Fund at any time. |
| 2 | You could lose money by investing in the Fund. Because the share price of the Fund will fluctuate, when you sell your shares they may be worth more or less than what you originally paid for them. The Fund may impose a fee upon sale of your shares or may temporarily suspend your ability to sell shares if the Fund’s liquidity falls below required minimums because of market conditions or other factors. An investment in the Fund is not a deposit of a bank and is not insured or guaranteed by the Federal Deposit Insurance Corporation or any other government agency. The Fund’s sponsor has no legal obligation to provide financial support to the Fund, and you should not expect that the sponsor will provide financial support to the Fund at any time. |
| 3 | You could lose money by investing in the Fund. Although the Fund seeks to preserve the value of your investment at $1.00 per share, it cannot guarantee it will do so. The Fund may impose a fee upon sale of your shares or may temporarily suspend your ability to sell shares if the Fund’s liquidity falls below required minimums because of market conditions or other factors. An investment in the Fund is not a deposit of a bank and is not insured or guaranteed by the Federal Deposit Insurance Corporation or any other government agency. The Fund’s sponsor has no legal obligation to provide financial support to the Fund, and you should not expect that the sponsor will provide financial support to the Fund at any time. |
| 4 | Effective on June 20, 2017, the Goldman Sachs Fixed Income Macro Strategies Fund was renamed the Goldman Sachs Strategic Macro Fund. |
| 5 | Effective on June 20, 2017, the Goldman Sachs Growth and Income Fund was renamed the Goldman Sachs Equity Income Fund. |
| 6 | Effective on August 31, 2017, the Goldman Sachs Flexible Cap Growth Fund was renamed the Goldman Sachs Flexible Cap Fund. |
| 7 | Effective on July 28, 2017, the Goldman Sachs Focused Growth Fund was reorganized with and into the Goldman Sachs Concentrated Growth Fund. |
Financial Square FundsSM and Investor FundsSM are registered service marks of Goldman Sachs & Co. LLC.
| * | This list covers open-end funds only. Please visit our website at www.GSAMFUNDS.com to learn about our closed-end funds and exchange-traded funds. |
TRUSTEES Ashok N. Bakhru, Chairman Kathryn A. Cassidy Diana M. Daniels Herbert J. Markley James A. McNamara Jessica Palmer Roy W. Templin Gregory G. Weaver | OFFICERS James A. McNamara, President Scott M. McHugh, Treasurer, Senior Vice President and Principal Financial Officer Joseph F. DiMaria, Assistant Treasurer and Principal Accounting Officer Caroline L. Kraus, Secretary | |
GOLDMAN SACHS & CO. LLC Distributor and Transfer Agent | GOLDMAN SACHS ASSET MANAGEMENT, L.P. Investment Adviser | |
Visit our web site at www.GSAMFUNDS.com to obtain the most recent month-end returns.
Goldman Sachs Asset Management, L.P. 200 West Street, New York, New York 10282
Economic and market forecasts presented herein reflect our judgment as of the date of this presentation and are subject to change without notice. These forecasts do not take into account the specific investment objectives, restrictions, tax and financial situation or other needs of any specific client. Actual data will vary and may not be reflected here. These forecasts are subject to high levels of uncertainty that may affect actual performance. Accordingly, these forecasts should be viewed as merely representative of a broad range of possible outcomes. These forecasts are estimated, based on assumptions, and are subject to significant revision and may change materially as economic and market conditions change. Goldman Sachs has no obligation to provide updates or changes to these forecasts. Case studies and examples are for illustrative purposes only.
The portfolio risk management process includes an effort to monitor and manage risk, but does not imply low risk.
The reports concerning the Funds included in this shareholder report may contain certain forward-looking statements about the factors that may affect the performance of the Funds in the future. These statements are based on Fund management’s predictions and expectations concerning certain future events and their expected impact on the Funds, such as performance of the economy as a whole and of specific industry sectors, changes in the levels of interest rates, the impact of developing world events, and other factors that may influence the future performance of the Funds. Management believes these forward-looking statements to be reasonable, although they are inherently uncertain and difficult to predict. Actual events may cause adjustments in portfolio management strategies from those currently expected to be employed.
A description of the policies and procedures that the Funds use to determine how to vote proxies relating to portfolio securities and information regarding how a Fund voted proxies relating to portfolio securities during the most recent 12-month period ended June 30 is available (i) without charge, upon request by calling 1-800-526-7384 (for Retail Shareholders) or 1-800-621-2550 (for Institutional Shareholders); and (ii) on the Securities and Exchange Commission (“SEC”) web site at http://www.sec.gov.
The Global Industry Classification Standard (GICS) was developed by and is the exclusive property and a service mark of Morgan Stanley Capital International Inc. (MSCI) and Standard & Poor’s, a division of The McGraw-Hill Companies, Inc. (S&P) and is licensed for use by Goldman Sachs. Neither MSCI, S&P nor any other party involved in making or compiling the GICS or any GICS classifications makes any express or implied warranties or representations with respect to such standard or classification (or the results to be obtained by the use thereof), and all such parties hereby expressly disclaim all warranties of originality, accuracy, completeness, merchantability or fitness for a particular purpose with respect to any of such standard or classification. Without limiting any of the foregoing, in no event shall MSCI, S&P, any of their affiliates or any third party involved in making or compiling the GICS or any GICS classifications have any liability for any direct, indirect, special, punitive, consequential or any other damages (including lost profits) even if notified of the possibility of such damages.
The Funds file their complete schedule of portfolio holdings with the SEC for the first and third quarters of each fiscal year on Forms N-Q. The Funds’ Forms N-Q are available on the SEC’s web site at http://www.sec.gov within 60 days after the Funds’ first and third fiscal quarters. The Funds’ Forms N-Q may be reviewed and copied at the SEC’s Public Reference Room in Washington, D.C. and information on the operation of the Public Reference Room may also be obtained by calling 1-800-SEC-0330. Forms N-Q may be obtained upon request and without charge by calling 1-800-526-7384 (for Retail Shareholders) or 1-800-621-2550 (for Institutional Shareholders).
Holdings and allocations shown are as of June 30, 2017 and may not be representative of future investments. Fund holdings should not be relied on in making investment decisions and should not be construed as research or investment advice regarding particular securities. Current and future holdings are subject to risk.
THIS MATERIAL IS FOR INFORMATIONAL PURPOSES ONLY AND IS PROVIDED SOLELY ON THE BASIS THAT IT WILL NOT CONSTITUTE INVESTMENT OR OTHER ADVICE OR A RECOMMENDATION RELATING TO ANY PERSON’S OR PLAN’S INVESTMENT OR OTHER DECISIONS, AND GOLDMAN SACHS IS NOT A FIDUCIARY OR ADVISOR WITH RESPECT TO ANY PERSON OR PLAN BY REASON OF PROVIDING THE MATERIAL OR CONTENT HEREIN INCLUDING UNDER THE EMPLOYEE RETIREMENT INCOME SECURITY ACT OF 1974 OR DEPARTMENT OF LABOR REGULATIONS. PLAN SPONSORS AND OTHER FIDUCIARIES SHOULD CONSIDER THEIR OWN CIRCUMSTANCES IN ASSESSING ANY POTENTIAL COURSE OF ACTION.
This material is not authorized for distribution to prospective investors unless preceded or accompanied by a current prospectus or summary prospectus, if applicable. Investors should consider a Fund’s objective, risks, and charges and expenses, and read the summary prospectus, if available, and/or the prospectus carefully before investing or sending money. The summary prospectus, if available, and the prospectus contain this and other information about a Fund and may be obtained from your authorized dealer or from Goldman Sachs & Co. LLC by calling (retail – 1-800-526-7384) (institutional – 1-800-621-2550).
© 2017 Goldman Sachs. All rights reserved. 100843-TMPL-08/2017-586503 RESSAR-17/4.8K
Goldman Sachs Funds

| Semi-Annual Report | June 30, 2017 | |||
Select Satellite Funds | ||||
Absolute Return Tracker | ||||
Commodity Strategy | ||||
Dynamic Allocation | ||||
Managed Futures Strategy | ||||

Goldman Sachs Select Satellite Funds
| ∎ | ABSOLUTE RETURN TRACKER |
| ∎ | COMMODITY STRATEGY |
| ∎ | DYNAMIC ALLOCATION |
| ∎ | MANAGED FUTURES STRATEGY |
| 1 | ||||
| 21 | ||||
| 23 | ||||
| 44 | ||||
| 48 | ||||
| 56 | ||||
| 82 | ||||
| NOT FDIC-INSURED | May Lose Value | No Bank Guarantee | ||
PORTFOLIO RESULTS
Goldman Sachs Absolute Return Tracker Fund
Investment Objective
The Fund’s investment objective is to seek to deliver long-term total return consistent with investment results that approximate the return and risk patterns of a diversified universe of hedge funds.
Portfolio Management Discussion and Analysis
Below, the Goldman Sachs Quantitative Investment Strategies (“QIS”) Team discusses the Goldman Sachs Absolute Return Tracker Fund’s (the “Fund”) performance and positioning for the six-month period ended June 30, 2017 (“the Reporting Period”).
| Q | How did the Fund perform during the Reporting Period? |
| A | During the Reporting Period, the Fund’s Class A, C, Institutional, IR, R and R6 Shares generated cumulative total returns, without sales charges, of 2.99%, 2.61%, 3.36%, 3.16%, 2.83% and 3.25%, respectively. These returns compare to the 2.56% cumulative total return of the Fund’s benchmark, the HFRXTM Global Hedge Fund Index (net of management, administrative and performance/incentive fees) (the “HFRX Global Hedge Fund Index”)1, during the same time period. |
| Q | What economic and market factors most influenced the hedge fund asset class as a whole during the Reporting Period? |
| A | Hedge funds, as measured by the HFRX Global Hedge Fund Index, overall generated positive returns during the Reporting Period. Event driven hedge funds performed best during the Reporting Period, with the HFRX Event Driven Index returning 4.61%. Special situations managers gained most, although activist, distressed restructuring and merger arbitrage managers also posted advances. Equity long/short hedge funds also posted solid positive returns during the Reporting Period, with the HFRX Equity Hedge Index returning 3.73%. Within equity long/short hedge funds, fundamental growth managers performed best by some distance, though fundamental value and equity market neutral managers generated positive returns as well. Relative value hedge funds, as measured by the HFRX Relative Value Arbitrage Index, generated a positive, albeit more modest, return of 1.71%. Fixed income-asset-backed managers gained most among relative value hedge funds. Global macro hedge funds struggled, with the HFRX Macro/CTA Index returning -0.75% for the Reporting Period. Among macro hedge funds, systematic diversified CTA managers were among the weakest. |
As the Reporting Period began, hedge funds were up overall, with the HFRX Global Hedge Fund Index gaining 0.50% for the first month of the new year. The MSCI World Index gained 2.41% in January 2017, while U.S. Treasury yields remained stable, and European government bond yields rose modestly. The U.S. dollar posted steep declines against global currencies, including the euro and Japanese yen. Within commodities, metals and agriculture posted sharp gains, while energy declined, led by natural gas. Hedge funds were mixed across styles in January 2017, with event driven, equity long/short and relative value hedge funds posting gains, while global macro hedge funds declined for the month. Hedge funds remained up overall in February 2017, with the HFRX Global Hedge Fund Index gaining 1.12% for the month. The MSCI World Index gained 2.77% in February 2017, while U.S. and European government bond yields declined across most maturities. In contrast to the prior month, the U.S. dollar gained against the euro, U.K. pound sterling and Swiss franc in February 2017. Within commodities, metals continued to post gains, while natural gas declined. Hedge funds were up across all four major styles in February 2017, with event driven managers the top performers for the fourth month in a row. Hedge funds were flat overall in March 2017, with the HFRX Global Hedge |
1
| 1 | The HFRXTM Global Hedge Fund Index is a trademark of Hedge Fund Research, Inc. (“HFR”). HFR has not participated in the formation of the Fund. HFR does not endorse or approve the Fund or make any recommendation with respect to investing in the Fund. |
PORTFOLIO RESULTS
Fund Index gaining 0.03% for the month. The MSCI World Index gained 1.07%, and the S&P 500 Index was roughly flat in March 2017, gaining 0.12%. Emerging market equities continued to outperform developed equities, with the MSCI Emerging Market Index gaining 2.52% in March 2017. U.S. Treasury yields increased modestly as did European government bond yields, prompted by the Dutch election and Brexit developments. The U.S. dollar depreciated against many European currencies as well as the Japanese yen. Within commodities, crude oil and metals retreated from February 2017 highs, while natural gas rebounded from its sharp declines in February 2017. Hedge funds were mixed across styles in March 2017, with the equity long/short and event driven indices posting gains for the month, while the global macro and relative value indices lost ground. |
| Hedge funds posted positive results overall in April 2017. The HFRX Global Hedge Fund Index gained 0.42% for the month. The MSCI World Index and S&P 500 Index gained 1.48% and 1.03%, respectively. First-round results of the French presidential election buoyed global equities as the diminishing risk of populism in Europe reassured markets. U.S. government bond yields declined slightly, while global government bond yields were little changed over the month. The U.S. dollar depreciated overall, and commodities delivered mixed results, with gains in gold and natural gas offset by declines in oil. Hedge funds were mixed but generally positive across styles in April 2017, with equity long/short, event driven and relative value managers posting gains for the month, while global macro hedge funds were slightly down. Hedge funds remained up overall in May 2017, with the HFRX Global Hedge Fund Index gaining 0.24% for the month. In May 2017, the MSCI World Index posted its seventh consecutive month of gains, as equities were reassured by a centrist victory in the French presidential election. U.S. and European bond yields declined over the month, while the U.S. dollar declined against most currencies. Hedge funds were mixed but generally positive across styles in May 2017, with the event driven, relative value and global macro indices posting gains, while the equity long/short index was slightly down. |
| Hedge funds were slightly up overall in June 2017, with the HFRX Global Hedge Fund Index gaining 0.21% for the month. Equity markets posted mixed performance in June 2017, as U.S. equities posted modest gains, while European equities declined. Government bond yields generally rose on the back of the Fed’s decision to raise interest rates, while the U.S. dollar depreciated against most global currencies. Among commodities, energy continued to decline, while copper and wheat posted gains. Hedge funds were mixed across styles during the month, with equity long/short and relative value managers posting gains, while the global macro index declined for the month and the event driven index was flat. |
| Q | What key factors were responsible for the Fund’s performance during the Reporting Period? |
| A | We believe hedge funds derive a large portion of their returns from exposure to sources of market risk. The Fund uses a quantitative methodology in combination with a qualitative overlay to seek to identify the Market Exposures, or sources of market risk, that approximate the return and risk patterns of specific hedge fund sub-strategies. The Fund’s quantitative methodology seeks to allocate the Fund’s exposure to each Hedge Fund Sub-Strategy such that the Fund’s investment results approximate the return and risk patterns of a diversified universe of hedge funds. During the Reporting Period, the Fund’s Equity Long/Short, Event Driven and Relative Value Hedge Fund Sub-Strategies contributed positively to performance on an absolute basis, while the Macro Hedge Fund Sub-Strategy had a rather neutral effect on absolute performance. |
| The Fund’s Equity Long/Short Hedge Fund Sub-Strategy contributed most positively to the Fund’s absolute return during the Reporting Period. Long exposure to single-name stocks to which hedge funds had large investments (based on 13F filings with the Securities & Exchange Commission (“SEC”)) as well as long exposure to emerging market equities contributed the most. Conversely, short exposure to U.S. growth equities and long exposure to energy-related equities detracted most from the Fund’s results. |
The Fund’s Event Driven Hedge Fund Sub-Strategy was the second strongest contributor to the Fund’s results during the Reporting Period, with the best performance from short positions in put options on the S&P 500 Index and from long exposure to North American high yield credit. (Put options are most commonly used in the stock market to protect against the decline of the price of a stock below a specified price. If the price of the stock declines below the specified price of the put option, the owner/buyer of the put has the right, but not the obligation, to sell the asset at the specified price, while the seller of the put has the obligation to purchase the asset at the strike price if the owner uses the right to do so (the owner/buyer is said to exercise the put or put option).) Short exposure to U.S. small cap equities was |
2
PORTFOLIO RESULTS
the only notable detractor from the Sub-Strategy’s results during the Reporting Period. |
| The Fund’s Relative Value Hedge Fund Sub-Strategy also contributed positively to the Fund’s performance during the Reporting Period. Short positions in put options on the S&P 500 Index as well as long exposure to European high yield credit contributed positively to the Sub-Strategy’s results, while long exposure to Master Limited Partnerships (“MLPs”) detracted. |
| The Fund’s Macro Hedge Fund Sub-Strategy contributed positively, albeit only modestly, to the Fund’s return on an absolute basis. Positive performance from the trend-following strategy was offset by losses in the commodities cross-market momentum strategy. |
| In addition to the asset classes mentioned above, the Fund was invested in a variety of developed and emerging market equities, short-term interest rates, government bonds, currencies, credit, real estate, convertible bonds and commodities during the Reporting Period. |
| Q | How did the Fund use derivatives and similar instruments during the Reporting Period? |
| A | The Fund used exchange-traded index futures contracts to gain exposure to U.S. large-cap and small-cap equities, non-U.S. developed market equities including those in Europe, the U.K. and Japan, emerging markets equities, commodities, government bonds and short-term interest rates. The Fund used currency forward contracts to gain exposure to select developed and emerging market currencies of non-U.S. developed markets. The Fund used total return swaps to gain exposure to U.S. large cap growth and value equities, a broad commodity index and MLPs. The Fund also used listed put options on the S&P 500 Index to gain exposure to U.S. large-cap equities. Lastly, the Fund used exchange-traded credit default swaps to gain exposure to high yield and investment grade credit markets across the U.S. and Europe. Overall, the use of derivatives had a positive impact on the Fund’s performance during the Reporting Period. |
| Q | Were there any changes made in the Fund’s investment strategy during the Reporting Period? |
| A | There were no significant changes made in the Fund’s investment strategy during the Reporting Period. |
| Q | How was the Fund positioned at the end of the Reporting Period? |
| A | At the end of the Reporting Period, the Fund had a 48% allocation to the Equity Long/Short Hedge Fund Sub-Strategy, 22% to the Macro Hedge Fund Sub-Strategy, 20% to the Relative Value Hedge Fund Sub-Strategy and 10% to the Event Driven Hedge Fund Sub-Strategy. |
| Q | Were there any changes to the Fund’s portfolio management team during the Reporting Period? |
| A | It was announced during the Reporting Period that Alex Chung, vice president and portfolio manager on the Alternative Investment Strategies (“AIS”) Team within the QIS Team, will be leaving the firm at the end of 2017. As a result, effective July 14, 2017, we will be transitioning Alex’s portfolio management responsibility to other current members of the AIS Team. |
| Alex shared portfolio management responsibilities for the Fund with Gary Chropuvka and Stephan Kessler. Gary, a managing director and member of the QIS Team since 1999, is the head of the AIS, Customized Beta Strategies and Tax-Advantaged Core Strategies businesses within QIS. Gary has managed the Fund since 2013. Stephan, executive director and head of research for the AIS Team, will also continue to manage the Fund alongside Gary. Stephan has managed the Fund since 2016. |
| Oliver Bunn, vice president, will join Gary and Stephan in managing the Fund effective July 14, 2017. Oliver has five years of investment experience and has been a member of the AIS Team since 2014. |
| Q | What is the Fund’s tactical view and strategy going forward? |
| A | In the coming months, we intend to remain focused on the Fund’s investment objective of seeking to deliver long-term total return consistent with investment results that approximate the return and risk patterns of a diversified universe of hedge funds. We understand that the hedge fund industry is dynamic, and to keep pace, we seek to understand trends in the hedge fund industry by digesting information from a number of sources, including hedge fund return databases, prime brokerage reports, hedge fund consultants, regulatory filings and other public sources. Additionally, we emphasize ongoing research and continued process and model enhancement, which we can implement through our scalable, robust technological platform. |
3
FUND BASICS
Absolute Return Tracker Fund
as of June 30, 2017
| PERFORMANCE REVIEW | ||||||||||
| January 1, 2017–June 30, 2017 | Fund Total Return (based on NAV)1 | HFRX Global Hedge Fund Index2 | ||||||||
| Class A | 2.99 | % | 2.56 | % | ||||||
| Class C | 2.61 | 2.56 | ||||||||
| Institutional | 3.36 | 2.56 | ||||||||
| Class IR | 3.16 | 2.56 | ||||||||
| Class R | 2.83 | 2.56 | ||||||||
| Class R6 | 3.25 | 2.56 | ||||||||
| 1 | The net asset value (“NAV”) represents the net assets of the class of the Fund (ex-dividend) divided by the total number of shares of the class outstanding. The Fund’s performance reflects the reinvestment of dividends and other distributions. The Fund’s performance does not reflect the deduction of any applicable sales charges. |
| 2 | The HFRX Global Hedge Fund Index is designed to be representative of the overall composition of the hedge fund universe. It is comprised of all eligible hedge fund strategies, including but not limited to convertible arbitrage, distressed securities, equity hedge, equity market neutral, event driven, macro, merger arbitrage, and relative value arbitrage. The strategies are asset weighted based on the distribution of assets in the hedge fund industry. The index is investable through products managed by HFR Asset Management, LLC that track HFRX Indices. The HFRX Global Hedge Fund Index is a trademark of HFR. HFR has not participated in the formation of the Fund. HFR does not endorse or approve the Fund or make any recommendation with respect to investing in the Fund. It is not possible to invest directly in an index. |
| STANDARDIZED TOTAL RETURNS3 | ||||||||||||||||
| For the period ended 6/30/17 | One Year | Five Years | Since Inception | Inception Date | ||||||||||||
| Class A | 0.63 | % | 2.27 | % | 0.09 | % | 5/30/08 | |||||||||
| Class C | 4.69 | 2.66 | -0.04 | 5/30/08 | ||||||||||||
| Institutional | 7.03 | 3.85 | 1.12 | 5/30/08 | ||||||||||||
| Class IR | 6.75 | 3.68 | 0.96 | 5/30/08 | ||||||||||||
| Class R | 6.15 | 3.16 | 0.45 | 5/30/08 | ||||||||||||
| Class R6 | 6.94 | N/A | 2.59 | 7/31/15 | ||||||||||||
| 3 | The Standardized Total Returns are average annual total returns or cumulative total returns (only if the performance period is one year or less) as of the most recent calendar quarter-end. They assume reinvestment of all distributions at NAV. These returns reflect a maximum initial sales charge of 5.5% for Class A Shares, and the assumed contingent deferred sales charge for Class C Shares (1% if redeemed within 12 months of purchase). Because Institutional, Class IR, Class R and Class R6 Shares do not involve a sales charge, such a charge is not applied to their Standardized Total Returns. |
The returns set forth in the tables above represent past performance. Past performance does not guarantee future results. The Fund’s investment return and principal value will fluctuate so that an investor’s shares, when redeemed, may be worth more or less than their original cost. Current performance may be lower or higher than the performance quoted above. Please visit our web site at www.GSAMFUNDS.com to obtain the most recent month-end returns. Performance reflects applicable fee waivers and/or expense limitations in effect during the periods shown. In their absence, performance would be reduced. Returns do not reflect the deduction of taxes that a shareholder would pay on Fund distributions or the redemption of Fund shares.
4
FUND BASICS
| EXPENSE RATIOS4 | ||||||||||
| Net Expense Ratio (Current) | Gross Expense Ratio (Before Waivers) | |||||||||
| Class A | 1.18 | % | 1.81 | % | ||||||
| Class C | 1.93 | 2.56 | ||||||||
| Institutional | 0.77 | 1.39 | ||||||||
| Class IR | 0.93 | 1.57 | ||||||||
| Class R | 1.43 | 2.06 | ||||||||
| Class R6 | 0.75 | 1.37 | ||||||||
| 4 | The expense ratios of the Fund, both current (net of applicable fee waivers and/or expense limitations) and before waivers (gross of applicable fee waivers and/or expense limitations) are as set forth above according to the most recent publicly available Prospectus for the Fund and may differ from the expense ratios disclosed in the Financial Highlights in this report. Pursuant to a contractual arrangement, the Fund’s waivers and/or expense limitations will remain in place through at least April 28, 2018, and prior to such date the Investment Adviser may not terminate the arrangements without the approval of the Fund’s Board of Trustees. These arrangements may be modified or terminated by the Investment Adviser at its discretion and without shareholder approval after such date, although the Investment Adviser does not currently intend to do so. If these arrangements are discontinued in the future, the expense ratios may change without shareholder approval. |
| FUND COMPOSITION5 |
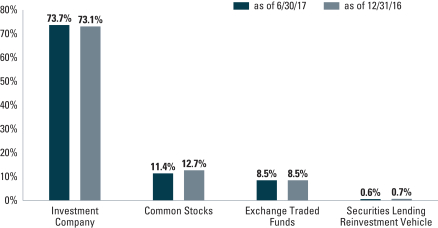
| 5 | The percentage shown for each investment category reflects the value of investments in that category as a percentage of net assets. Figures in the above graph may not sum to 100% due to the exclusion of other assets and liabilities. Underlying sector allocations of exchange traded funds and investment companies held by the Fund are not reflected in the graph above. Consequently, the Fund’s overall sector allocations may differ from the percentages contained in the graph above. The above graph depicts the Fund’s investments but may not represent the Fund’s market exposure due to the exclusion of certain derivatives, if any, as listed in the Additional Investment Information section of the Schedule of Investments. |
5
GOLDMAN SACHS COMMODITY STRATEGY FUND
What Differentiates the Goldman Sachs Commodity Investment Process?
At Goldman Sachs Asset Management, L.P. (“GSAM”), the goal of our commodity investment process is to provide consistent, strong performance by actively managing our portfolios within a research-intensive, risk-managed framework.
Goldman Sachs’ Commodity Investment Process
Our commodity investment process emphasizes the importance of both short-term, tactical opportunities and long-term investment views. Our team-based approach to managing the Fund ensures continuity and idea sharing among some of the industry’s most experienced fixed income specialists. We pursue strong, consistent performance across commodity markets through:

The Goldman Sachs Commodity Strategy Fund primarily gains exposure to the performance of the commodity markets through investment in a wholly-owned subsidiary of the Fund organized as a company under the laws of the Cayman Islands (the “Subsidiary”). The Subsidiary invests primarily in commodity-linked derivative instruments (which may include total return swaps), as well as other commodity-linked securities and derivative instruments that provide exposure to the performance of the commodities markets, and in fixed income and debt instruments. The Fund’s portfolio is designed to provide exposure that corresponds to the investment return of assets that trade in the commodity markets without direct investment in physical commodities.
The Fund implements enhanced cash strategies that capitalize on GSAM’s global fixed income expertise. The Fixed Income Team will employ the full spectrum of capabilities offered, including bottom-up strategies (credit, mortgages, governments /municipals, high yield, and emerging markets debt) and top-down strategies (duration, cross-sector, currency and country) in an attempt to enhance the return of the Fund.

A Commodity Fund that:
| ∎ | Provides exposure to the commodity markets without direct investment in physical commodities |
| ∎ | Utilizes commodity-linked swaps that provide economic exposure to movements in commodity prices |
6
PORTFOLIO RESULTS
Goldman Sachs Commodity Strategy Fund
Investment Objective
The Fund seeks long-term total return.
Portfolio Management Discussion and Analysis
Below, the Goldman Sachs Commodities Team discusses the Goldman Sachs Commodity Strategy Fund’s (the “Fund”) performance and positioning for the six-month period ended June 30, 2017 (the “Reporting Period”).
| Q | How did the Fund perform during the Reporting Period? |
| A | During the Reporting Period, the Fund’s Class A, C, Institutional, IR, R and R6 Shares generated cumulative total returns, without sales charges, of -10.77%, -11.12%, -10.67%, -10.70%, -10.89% and -10.58%, respectively. These returns compare to the -10.24% cumulative total return of the Fund’s benchmark, the S&P GSCI® Total Return Index (Gross, USD, Unhedged, formerly the Goldman Sachs Commodity Index) (the “S&P GSCI®”), during the same period. |
| Q | What economic and market factors most influenced the commodities markets as a whole during the Reporting Period? |
| A | Commodities markets, as measured by the S&P GSCI®, experienced a notable correction during the Reporting Period from the robust returns produced during calendar year 2016. By comparison to the S&P GSCI® return of -10.24% for the Reporting Period, the S&P 500® Index and the U.S. Dollar Index (“DXY”) returned 9.34% and -6.40%, respectively.1 |
| We believe the decline in the commodities markets during the Reporting Period can be attributed to several macro factors, primarily centered on global political and monetary policy developments. Optimism surrounding the post-U.S. election reflationary theme that had initially supported commodity prices, particularly metals, weakened as concern grew about the U.S. Administration’s ability to implement its agenda. (A reflationary theme is one related to an actual or anticipated increase in economic activity.) Also, expectations for Chinese demand and economic growth and the rise of anti-establishment candidates in elections around Europe contributed to volatility in the commodities markets. Geopolitical tensions related to North Korea and political drama from the White House supported precious metals markets, but U.S. Federal Reserve (“Fed”) interest rate hikes and subdued inflation expectations served as headwinds. |
| Q | Which commodity subsectors were strongest during the Reporting Period? |
| A | The industrials metals subsector was the strongest performer during the Reporting Period. The industrial metals subsector, as measured by the S&P GSCI® Industrial Metals Index, returned 8.1% for the Reporting Period overall. Industrial metals rallied primarily during the first quarter of 2017, with aluminum, lead, copper and zinc the strongest performers. Fundamentals for industrial metals had improved based on several factors. These included curbing of aluminum production due to pollution concerns in China, copper supply shocks due to mine strikes, and overall increased expectations for Chinese demand, which was later curtailed in the middle of the Reporting Period with a revision lower of China’s economic growth target. Additionally, supply deficits in zinc markets supported prices. The only exception within the subsector was nickel, which posted a negative return during the Reporting Period. |
| Precious metals also posted positive returns, with the precious metals subsector of the S&P GSCI® returning 6.9% during the Reporting Period, similarly attributable primarily to the first quarter of 2017. Despite rising interest rates, the gold market benefited from a combination of European and U.S. political uncertainty. In Europe, concern surrounded the rise of anti-establishment candidates in elections in the Netherlands, France, Germany and Italy. In the U.S., the effect of the current Administration’s geopolitical rhetoric had also supported investor interest in precious metals. |
| 1 | The S&P 500® Index is the Standard & Poor’s 500 Composite Index of 500 stocks, an unmanaged index of common stock prices. The DXY is a measure of the general international value of the U.S. dollar as calculated by averaging the exchange rates between the U.S. dollar and six major world currencies. |
7
PORTFOLIO RESULTS
| Q | Which commodity subsectors were weakest during the Reporting Period? |
| A | The energy component of the S&P GSCI® was weakest, returning -18.8% during the Reporting Period. Declining oil and natural gas prices were the primary drivers of the subsector’s poor performance. At the start of the Reporting Period, milder than normal winter weather in the U.S. pressured natural gas markets, while news of rapidly increasing U.S. crude inventory threatened the effect of production cuts by the Organization of the Petroleum Exporting Countries (“OPEC”), pushing oil prices down. In the second quarter of 2017, natural gas prices suffered further on the back of cooler weather forecasts for the start of summer and on reports of higher daily production. Meanwhile, oil prices were lower, as U.S. inventories remained elevated. The OPEC decision to extend production cuts by nine months, to March 2018, was interpreted as bearish given the market had expected an increase in the amount of the cut. Although OPEC production cuts were extended, a corresponding drop in oil exports had not materialized to the extent expected. Increases in Nigerian and Libyan exports to the U.S. and expectations of increases in U.S. shale oil production were additional factors that weighed on oil prices during the Reporting Period. |
| Agriculture declined more modestly, with the S&P GSCI® Agriculture Index returning -2.2% for the Reporting Period. However, such a return masks wide diversity within the subsector. Wheat gained strongly, returning 18.3%, and corn returned 2.3% for the Reporting Period. However, soybeans, cotton, sugar, coffee and cocoa all posted negative returns during the Reporting Period, with sugar the weakest commodity within the subsector. |
| Q | What key factors were responsible for the Fund’s performance during the Reporting Period? |
| A | The Fund generated returns that only modestly underperformed the S&P GSCI® during the Reporting Period. The Fund generally matched the exposures of the S&P GSCI® with no material deviations via commodity index-linked swaps, and thus our enhanced roll-timing strategies had a rather neutral effect on performance during the Reporting Period. Our enhanced cash management strategy added value, albeit modest, during the Reporting Period. |
| Q | How did the Fund’s enhanced roll-timing strategies impact performance during the Reporting Period? |
| A | Our enhanced roll-timing strategies, implemented via exposure to commodity index-linked swaps, had a rather neutral effect on the Fund’s performance during the Reporting Period. We employ an approach whereby we do not take active views on individual commodities but rather gain Fund exposure to commodities through investments whose performance is linked to commodity indices. |
| We often implement commodity roll-timing strategies by deviating from the S&P GSCI® roll convention, which typically calls for rolling forward exposure at the front, or near-month, end of the futures curve on a monthly basis. To the extent our team believes fundamental or technical developments will impact the futures roll-timing decision, we will incorporate those views into the portfolio by electing to roll positions earlier, later, forward or in different weights versus the S&P GSCI® roll. However, throughout the Reporting Period, we maintained the Fund’s position along with the S&P GSCI® in the front month across the stack of commodities curves, a position implemented toward the end of 2016. Since the front month contracts are more sensitive to market dynamics, the Fund’s positions reflected our bullish view on commodity markets. |
| Q | How did you implement the Fund’s enhanced cash management strategy? |
| A | In addition to seeking value through management of the commodities portion of the Fund’s portfolio, we also attempt to add a modest amount of excess return through thoughtful management of collateral held in the Fund. The cash portion of the Fund’s portfolio is typically allocated to high-grade collateral that includes U.S. Treasury securities, agency debentures, mortgage-backed securities and short-term fixed income instruments. During the Reporting Period, we favored high quality government and agency securities for the Fund’s collateral allocation. |
| Q | How did the Fund use derivatives and similar instruments during the Reporting Period? |
| A | As mentioned earlier in some detail, the Fund used commodity index-linked total return swaps in implementing our enhanced roll-timing strategies in order to gain exposure to the commodities markets. In implementing our enhanced cash management strategy, the Fund used futures, interest rate swaps and forward sales contracts, which are agency |
8
PORTFOLIO RESULTS
mortgage-backed derivatives used in purchasing a future issuance of agency mortgage-backed securities. The use of these instruments is integral to the Fund’s investment strategy, which, overall, realized negative absolute returns during the Reporting Period. |
| Q | Did you make any changes in the Fund’s strategy or allocations during the Reporting Period? |
| A | We did not make any significant changes in the Fund’s strategy or allocations during the Reporting Period. The Fund continued to hold exposure to the commodities markets primarily in the form of swaps linked to the S&P GSCI® and maintained front month exposures across all commodities to match the S&P GSCI®. |
| Q | How was the Fund positioned at the end of the Reporting Period? |
| A | At the end of the Reporting Period, the Fund was positioned along with S&P GSCI® in the front month across the stack of commodities curves. The Fund held exposure to the commodities underlying the S&P GSCI® through customized swaps in the Subsidiary. (The Subsidiary has the same objective as the Fund but unlike the Fund may invest without limitation in commodity index-linked securities, such as swaps and futures that provide exposure to the performance of the commodity markets.) |
| The cash portion of the Fund’s portfolio was allocated across various fixed income sectors, with an emphasis on the higher quality, lower volatility segments of the market, such as U.S. government and government-sponsored bonds. |
| Q | Were there any changes to the Fund’s portfolio management team during the Reporting Period? |
| A | There were no changes to the Fund’s portfolio management team during the Reporting Period. |
| Q | What is the Fund’s view and strategy going forward? |
| A | At the end of the Reporting Period, we remained moderately constructive on oil prices in the near term, as we expected inventory draws and short-covering rallies in the next few months. However, we were less constructive with a long-term perspective, as we expect to start seeing a stronger response from U.S. shale producers in 2018, a reaction that, in our view, has already started to come into effect this year. We are, on the other hand, constructive on natural gas prices going forward, as we believe that prices have over-corrected downward in the recent sell-off, despite weather that still looks supportive and production figures ranging on the lower end of guidance. |
| In the agriculture subsector, we maintained our belief at the end of the Reporting Period that the market is oversupplied, though we were cautious of recent extreme weather that has impacted the protein content for the current wheat crop, which sent prices rallying significantly. Interestingly, the move in wheat prices triggered aggressive rallies across the entire agriculture complex, including in the prices of soybeans and corn. While we believe these moves are likely to be transitory, we are monitoring the market closely, as any additional loss of supply could have a more lasting impact on inventories, keeping prices elevated. |
| We were moderately constructive on industrial metals at the end of the Reporting Period, particularly on zinc. In our view, zinc is a market in deficit and should remain in deficit in the third quarter of 2017. |
| Irrespective of directionality, we believe the market will continue to hold opportunities for the active, relative value investor, especially amid a heightened volatility regime. Historically, volatility moves prices away from fundamentals and affords opportunities to the active investor. |
9
FUND BASICS
Commodity Strategy Fund
as of June 30, 2017
| PERFORMANCE REVIEW | ||||||||||
| January 1, 2017–June 30, 2017 | Fund Total Return (based on NAV)1 | S&P GSCI®2 Total Return Index | ||||||||
| Class A | -10.77 | % | -10.24 | % | ||||||
| Class C | -11.12 | -10.24 | ||||||||
| Institutional | -10.67 | -10.24 | ||||||||
| Class IR | -10.70 | -10.24 | ||||||||
| Class R | -10.89 | -10.24 | ||||||||
| Class R6 | -10.58 | -10.24 | ||||||||
| 1 | The net asset value (“NAV”) represents the net assets of the class of the Fund (ex-dividend) divided by the total number of shares of the class outstanding. The Fund’s performance reflects the reinvestment of dividends and other distributions. The Fund’s performance does not reflect the deduction of any applicable sales charges. |
| 2 | The S&P GSCI® is an unmanaged composite index of commodity sector returns, representing an unleveraged, long-only investment in commodity futures that is broadly diversified across the spectrum of commodities. Individual components qualify for inclusion in the S&P GSCI® on the basis of liquidity and are weighted by their respective world production quantities. The figures for the S&P GSCI® do not include any deduction for fees, expenses or taxes. It is not possible to invest directly in an index. |
| STANDARDIZED TOTAL RETURNS3 | ||||||||||||||||||||
| For the period ended 6/30/17 | One Year | Five Years | 10 Years | Since Inception | Inception Date | |||||||||||||||
| Class A | -13.41 | % | -14.05 | % | -10.32 | % | -9.94 | % | 3/30/07 | |||||||||||
| Class C | -10.97 | -13.88 | -10.58 | -10.21 | 3/30/07 | |||||||||||||||
| Institutional | -9.12 | -12.99 | -9.64 | -9.27 | 3/30/07 | |||||||||||||||
| Class IR | -9.13 | -13.01 | N/A | -11.42 | 11/30/07 | |||||||||||||||
| Class R | -9.61 | -13.50 | N/A | -11.91 | 11/30/07 | |||||||||||||||
| Class R6 | -9.01 | N/A | N/A | -11.50 | 7/31/15 | |||||||||||||||
| 3 | The Standardized Total Returns are average annual total returns or cumulative total returns (only if the performance period is one year or less) as of the most recent calendar quarter-end. They assume reinvestment of all distributions at NAV. These returns reflect a maximum initial sales charge of 4.5% for Class A Shares and the assumed contingent deferred sales charge for Class C Shares (1% if redeemed within 12 months of purchase). Because Institutional, Class IR, Class R and Class R6 Shares do not involve a sales charge, such a charge is not applied to their Standardized Total Returns. |
The returns set forth in the tables above represent past performance. Past performance does not guarantee future results. The Fund’s investment return and principal value will fluctuate so that an investor’s shares, when redeemed, may be worth more or less than their original cost. Current performance may be lower or higher than the performance quoted above. Please visit our web site at www.GSAMFUNDS.com to obtain the most recent month-end returns. Performance reflects applicable fee waivers and/or expense limitations in effect during the periods shown. In their absence, performance would be reduced. Returns do not reflect the deduction of taxes that a shareholder would pay on Fund distributions or the redemption of Fund shares.
10
FUND BASICS
| EXPENSE RATIOS4 | ||||||||||
| Net Expense Ratio (Current) | Gross Expense Ratio (Before Waivers) | |||||||||
| Class A | 0.96 | % | 1.13 | % | ||||||
| Class C | 1.71 | 1.88 | ||||||||
| Institutional | 0.62 | 0.78 | ||||||||
| Class IR | 0.71 | 0.88 | ||||||||
| Class R | 1.20 | 1.40 | ||||||||
| Class R6 | 0.60 | 0.76 | ||||||||
| 4 | The expense ratios of the Fund, both current (net of applicable fee waivers and/or expense limitations) and before waivers (gross of applicable fee waivers and/or expense limitations) are as set forth above according to the most recent publicly available Prospectus for the Fund and may differ from the expense ratios disclosed in the Financial Highlights in this report. Pursuant to a contractual arrangement, the Fund’s waivers and/or expense limitations will remain in place through at least April 28, 2018, and prior to such date the Investment Adviser may not terminate the arrangements without the approval of the Fund’s Board of Trustees. These arrangements may be modified or terminated by the Investment Adviser at its discretion and without shareholder approval after such date, although the Investment Adviser does not currently intend to do so. If these arrangements are discontinued in the future, the expense ratios may change without shareholder approval. |
| FUND COMPOSITION5 |
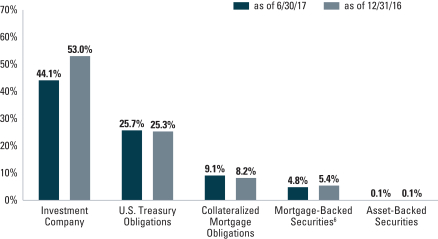
| 5 | The percentage shown for each investment category reflects the value of investments in that category as a percentage of net assets. Figures in the graph may not sum to 100% due to the exclusion of other assets and liabilities. Underlying sector allocations of exchange traded funds and investment companies held by the Fund are not reflected in the graph above. Consequently, the Fund’s overall sector allocations may differ from the percentages contained in the graph above. The above graph depicts the Fund’s investments but may not represent the Fund’s market exposure due to the exclusion of certain derivatives, if any, as listed in the Additional Investment Information section of the Schedule of Investments. |
| 6 | Mortgage-backed securities are guaranteed by the Government National Mortgage Association (“GNMA”), Federal National Mortgage Association (“FNMA”) or Federal Home Loan Mortgage Corp. (“FHLMC”). GNMA instruments are backed by the full faith and credit of the United States Government. |
11
PORTFOLIO RESULTS
Goldman Sachs Dynamic Allocation Fund
Investment Objective
The Fund seeks long-term capital appreciation.
Portfolio Management Discussion and Analysis
Below, the Goldman Sachs Quantitative Investment Strategies (“QIS”) Team discusses the Goldman Sachs Dynamic Allocation Fund’s (the “Fund”) performance and positioning for the six-month period ended June 30, 2017 (the “Reporting Period”).
| Q | How did the Fund perform during the Reporting Period? |
| A | During the Reporting Period, the Fund’s Class A, C, Institutional, IR, R and R6 Shares generated cumulative total returns, without sales charges, of 4.50%, 4.08%, 4.63%, 4.55%, 4.35% and 4.63%, respectively. These returns compare to the 0.43% cumulative total return of the Fund’s primary benchmark, the Bank of America Merrill Lynch USD LIBOR One-Month Constant Maturity Index (the “LIBOR One-Month Index”). The Fund’s secondary benchmark is the Dynamic Allocation Fund Composite Index, which is composed 60% of the MSCI All Country World Index Investable Market Index (Net, USD, Unhedged) (“MSCI ACWI IMI”) and 40% of the Bloomberg Barclays Global Aggregate Bond Index (Gross, USD, Hedged) (“Barclays Bond Index”), returned 7.28% during the same period. The MSCI ACWI IMI and Bloomberg Barclays Bond Index posted cumulative total returns of 11.32% and 1.43%, respectively, during the same period. |
| The Fund’s overall annualized volatility was 5.26% during the Reporting Period. To compare, the overall annualized volatility of the S&P® 500 Index during the same time period was 6.86%. |
| Q | What were the primary contributors to and detractors from the Fund’s performance based on your team’s asset allocation decisions during the Reporting Period? |
| A | The Fund seeks to achieve its investment objective by investing primarily in exchange-traded funds (“ETFs”), stocks, futures, swaps, structured notes and other derivatives |
| that provide exposure to a broad spectrum of asset classes, including but not limited to equities (both in U.S. and non-U.S. companies), fixed income (U.S. and non-U.S., investment grade and high yield) and commodities. Our team manages the Fund dynamically by changing its allocations to these asset classes based on our tactical views and in response to changing market conditions. Our team uses a disciplined, rigorous and quantitative approach, in combination with a qualitative overlay, in allocation to and within the asset classes in which the Fund invests. Allocations are adjusted within the Fund at least monthly based on continuous analysis to help determine which investments are relatively attractive and provide the best opportunities for growth in any given period of time. Since the markets represented by each investment are constantly changing, so are the Fund’s allocations. |
| Overall, the Fund realized positive returns during the Reporting Period. Allocations to U.S. equities, emerging markets equities, Japanese equities, German equities, U.S. fixed income and mortgage real estate investment trusts (“REITs”) contributed most positively to the Fund’s performance. These positive contributors were partially offset by allocations to commodities, Swedish equities, Danish equities, French fixed income, Hong Kong equities and German fixed income, which detracted most from performance, as these assets performed weakly during the Reporting Period. |
12
PORTFOLIO RESULTS
| Q | How did the Goldman Sachs Market Sentiment Indicator factor into risk allocation decisions that were made during the Reporting Period? |
| A | The Goldman Sachs Market Sentiment Indicator (“MSI”) is a proprietary tool that analyzes how the markets will potentially respond to future global changes in financial, economic and sociopolitical events. With the help of the MSI, the Fund seeks to manage risk in unstable markets by reducing volatility. |
| During the Reporting Period, there were no episodes of de-risking decisions made in the Fund, as indicated by MSI readings, and we continued to run the Fund’s portfolio at our long-term risk target. |
| Q | How did the Fund use derivatives and similar instruments during the Reporting Period? |
| A | The Fund invested in futures and total return swaps to achieve exposure to equities (both in U.S. and non-U.S. companies), and the Fund used futures, interest rate swaps, currency forwards and credit default swaps to achieve exposure to fixed income (U.S. and non-U.S., investment grade and high yield) during the Reporting Period. The Fund also used futures, total return swaps and commodity index-linked structured notes to gain exposure to commodities. The use of these instruments is integral to the Fund’s investment strategy, which realized positive absolute returns during the Reporting Period. |
| Q | What changes did you make within the Fund during the Reporting Period? |
| A | During the Reporting Period, the Fund adjusted its exposure to asset classes as market conditions shifted, increasing its exposures to asset classes overall in January and March 2017 and decreasing its exposures to asset classes overall in February, April, May and June 2017. The changes in exposures during the first quarter of 2017 were rather evenly allocated among the U.S. equity, non-U.S. equity and fixed income asset classes. In April 2017, most of the change in total net exposure was due to a decrease in exposure to credit. During May and June 2017, the modest change in exposures was relatively evenly allocated among all asset classes in which the Fund invests. |
| Q | Were there any changes to the Fund’s portfolio management team during the Reporting Period? |
| A | Effective April 2017, Bill Fallon and Ed Tostanoski were no longer portfolio managers of the Fund and Momoko Ono was added as a portfolio manager of the Fund. Momoko has been with the QIS Team since June 2007 and has been involved in managing the Fund since its inception. |
| Q | What is the Fund’s asset allocation view and strategy for the months ahead? |
| A | At the end of June 2017, the Fund held the majority of its exposure in fixed income and global equities and held less exposure to credit and commodities. Going forward, we believe the Fund’s asset allocations are likely to remain fairly similar, absent major dislocations in the markets. |
| We continue to believe the Fund’s dynamic allocation approach is important because it can adapt to changing markets, seeking what we believe are the most attractive opportunities for investment and attempting to manage risk when the markets become unstable. There is no guarantee that the Fund’s dynamic management strategy will cause it to achieve its investment objective. |
13
FUND BASICS
Dynamic Allocation Fund
as of June 30, 2017
| PERFORMANCE REVIEW | ||||||||||||||||||||||
| January 1, 2017– June 30, 2017 | Fund Total Return (based on NAV)1 | BofA Merrill Lynch USD LIBOR One-Month Constant Maturity Index2 | Dynamic Allocation Fund Composite Index3 | MSCI All Country World Index Investable Market Index4 | Bloomberg Barclays Global Aggregate Bond Index5 | |||||||||||||||||
| Class A | 4.50 | % | 0.43 | % | 7.28 | % | 11.32 | % | 1.43 | % | ||||||||||||
| Class C | 4.08 | 0.43 | 7.28 | 11.32 | 1.43 | |||||||||||||||||
| Institutional | 4.63 | 0.43 | 7.28 | 11.32 | 1.43 | |||||||||||||||||
| Class IR | 4.55 | 0.43 | 7.28 | 11.32 | 1.43 | |||||||||||||||||
| Class R | 4.35 | 0.43 | 7.28 | 11.32 | 1.43 | |||||||||||||||||
| Class R6 | 4.63 | 0.43 | 7.28 | 11.32 | 1.43 | |||||||||||||||||
| 1 | The net asset value (“NAV”) represents the net assets of the class of the Fund (ex-dividend) divided by the total number of shares of the class outstanding. The Fund’s performance reflects the reinvestment of dividends and other distributions. The Fund’s performance does not reflect the deduction of any applicable sales charges. |
| 2 | The Bank of America Merrill Lynch USD LIBOR One-Month Constant Maturity Index tracks the performance of a synthetic asset paying Libor to a stated maturity. The Index is based on the assumed purchase at par of a synthetic instrument having exactly its stated maturity and with a coupon equal to that day’s fixing rate. That issue is assumed to be sold the following business day (priced at a yield equal to the current day fixing rate) and rolled into a new instrument. The Index figures do not reflect any deduction for fees, expenses or taxes. It is not possible to invest directly in an index. |
| 3 | The Dynamic Allocation Fund Composite Index is comprised 60% of the MSCI ACWI IMI Index and 40% of the Bloomberg Barclays Global Aggregate Bond Index. |
| 4 | The MSCI All Country World Index Investable Market Index (“MSCI ACWI IMI Index”) is a free float-adjusted market capitalization weighted index that is designed to measure the equity market performance of developed and emerging markets. As of June 30, 2017, the MSCI ACWI IMI Index consists of 47 country indices comprising 23 developed and 24 emerging market country indices. The developed market country indices included are: Australia, Austria, Belgium, Canada, Denmark, Finland, France, Germany, Greece, Hong Kong, Ireland, Israel, Italy, Japan, Netherlands, New Zealand, Norway, Portugal, Singapore, Spain, Sweden, Switzerland, the United Kingdom and the United States. The emerging market country indices included are: Brazil, Chile, China, Colombia, Czech Republic, Egypt, Hungary, India, Indonesia, Korea, Malaysia, Mexico, Morocco, Peru, Philippines, Poland, Russia, South Africa, Taiwan, Thailand, and Turkey. The Index figures do not reflect any deduction for fees, expenses or taxes. It is not possible to invest directly in an index. |
| 5 | The Bloomberg Barclays Global Aggregate Bond Index (the “Bloomberg Barclays Bond Index”) provides a broad-based measure of the global investment-grade fixed income markets. The three major components of the Bloomberg Barclays Bond Index are the U.S. Aggregate, the Pan-European Aggregate, and the Asian-Pacific Aggregate Indices. The Bloomberg Barclays Bond Index also includes Eurodollar and Euro-Yen corporate bonds, Canadian government, agency and corporate securities, and USD investment grade 144A securities. The Bloomberg Barclays Bond Index figures do not reflect any deduction for fees, expenses or taxes. It is not possible to invest directly in an index. |
The returns set forth in the table above represent past performance. Past performance does not guarantee future results. The Fund’s investment return and principal value will fluctuate so that an investor’s shares, when redeemed, may be worth more or less than their original cost. Current performance may be lower or higher than the performance quoted above. Please visit our web site at www.GSAMFUNDS.com to obtain the most recent month-end returns. Performance reflects applicable fee waivers and/or expense limitations in effect during the periods shown. In their absence, performance would be reduced. Returns do not reflect the deduction of taxes that a shareholder would pay on Fund distributions or the redemption of Fund shares
14
FUND BASICS
| STANDARDIZED TOTAL RETURNS6 | ||||||||||||||||
| For the period ended 6/30/17 | One Year | Five Years | Since Inception | Inception Date | ||||||||||||
| Class A | 3.77 | % | 1.77 | % | 2.30 | % | 1/5/10 | |||||||||
| Class C | 7.99 | 2.18 | 2.31 | 1/5/10 | ||||||||||||
| Institutional | 10.17 | 3.34 | 3.48 | 1/5/10 | ||||||||||||
| Class IR | 9.99 | 3.18 | 3.32 | 1/5/10 | ||||||||||||
| Class R | 9.44 | 2.68 | 2.82 | 1/5/10 | ||||||||||||
| Class R6 | 10.17 | N/A | 2.69 | 7/31/15 | ||||||||||||
| 6 | The Standardized Total Returns are average annual total returns or cumulative total returns (only if the performance period is one year or less) as of the most recent calendar quarter-end. They assume reinvestment of all distributions at NAV. These returns reflect a maximum initial sales charge of 5.5% for Class A Shares and the assumed contingent deferred sales charge for Class C Shares (1% if redeemed within 12 months of purchase). Because Institutional, Class IR, Class R and Class R6 Shares do not involve a sales charge, such a charge is not applied to their Standardized Total Returns. |
The returns set forth in the table above represent past performance. Past performance does not guarantee future results. The Fund’s investment return and principal value will fluctuate so that an investor’s shares, when redeemed, may be worth more or less than their original cost. Current performance may be lower or higher than the performance quoted above. Please visit our web site at www.GSAMFUNDS.com to obtain the most recent month-end returns. Performance reflects applicable fee waivers and/or expense limitations in effect during the periods shown. In their absence, performance would be reduced. Returns do not reflect the deduction of taxes that a shareholder would pay on Fund distributions or the redemption of Fund shares.
| EXPENSE RATIOS7 | ||||||||||
| Net Expense Ratio (Current) | Gross Expense Ratio (Before Waivers) | |||||||||
| Class A | 1.24 | % | 1.54 | % | ||||||
| Class C | 1.99 | 2.29 | ||||||||
| Institutional | 0.84 | 1.14 | ||||||||
| Class IR | 0.99 | 1.29 | ||||||||
| Class R | 1.49 | 1.80 | ||||||||
| Class R6 | 0.82 | 1.12 | ||||||||
| 7 | The expense ratios of the Fund, both current (net of applicable fee waivers and/or expense limitations) and before waivers (gross of applicable fee waivers and/or expense limitations) are as set forth above according to the most recent publicly available Prospectus for the Fund and may differ from the expense ratios disclosed in the Financial Highlights in this report. Pursuant to a contractual arrangement, the Fund’s waivers and/or expense limitations will remain in place through at least April 28, 2018, and prior to such date the Investment Adviser may not terminate the arrangements without the approval of the Fund’s Board of Trustees. These arrangements may be modified or terminated by the Investment Adviser at its discretion and without shareholder approval after such date, although the Investment Adviser does not currently intend to do so. If these arrangements are discontinued in the future, the expense ratios may change without shareholder approval. |
15
FUND BASICS
| FUND COMPOSITION8 |
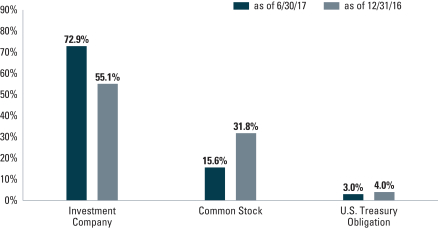
| 8 | The percentage shown for each investment category reflects the value of investments in that category as a percentage of net assets. Figures in the above graph may not sum to 100% due to the exclusion of other assets and liabilities. Underlying sector allocations of exchange traded funds and investment companies held by the Fund are not reflected in the graph above. Consequently, the Fund’s overall sector allocations may differ from the percentages contained in the graph above. The above graph depicts the Fund’s investments but may not represent the Fund’s market exposure due to the exclusion of certain derivatives, if any, as listed in the Additional Investment Information section of the Schedule of Investments. |
16
PORTFOLIO RESULTS
Goldman Sachs Managed Futures Strategy Fund
Investment Objective
The Fund seeks to generate long-term absolute return.
Portfolio Management Discussion and Analysis
Below, the Goldman Sachs Quantitative Investment Strategies Team discusses the Goldman Sachs Managed Futures Strategy Fund’s (the “Fund”) performance and positioning for the six-month period ended June 30, 2017 (the “Reporting Period”).
| Q | How did the Fund perform during the Reporting Period? |
| A | During the Reporting Period, the Fund’s Class A, C, Institutional, IR and R Shares generated cumulative total returns, without sales charges, of -0.49%, -0.92%, -0.29%, -0.39% and -0.60%, respectively. These returns compare to the 0.43% cumulative total return of the Fund’s benchmark, the Bank of America Merrill Lynch USD LIBOR One-Month Constant Maturity Index (the “LIBOR One-Month Index”), during the same time period. |
| We note that the Fund’s benchmark being the LIBOR One-Month Index is a means of emphasizing that the Fund has an unconstrained strategy. That said, this Fund employs a benchmark agnostic strategy and thus comparisons to a benchmark index are not particularly relevant. |
| The Fund’s overall annualized volatility was 6.43% during the Reporting Period, while the overall annualized volatility of the S&P® 500 Index during the same time period was 6.94%. |
| Q | What were the primary contributors to and detractors from the Fund’s performance during the Reporting Period? |
| A | The Fund implements a trend-following strategy that takes long and/or short positions in a wide range of asset classes, including equities, fixed income and currencies, among others, to seek long-term absolute return. The Fund seeks to achieve its investment objective by investing primarily in a portfolio of equities, equity index futures, bonds, bond futures, equity swaps, interest rate swaps, currency forwards and non-deliverable forwards, options, exchange-traded |
| funds (“ETFs”) and structured securities. As a result of the Fund’s use of derivatives, the Fund may also hold significant amounts of U.S. Treasuries or short-term investments. The Fund’s investments are made without restriction as to issuer capitalization, country, currency, maturity or credit rating. |
| Negative Fund performance for the Reporting Period overall was mostly concentrated in June 2017, although the Fund also generated negative performance in January 2017, albeit by a lesser amount. On the upside, the Fund posted positive performance in February, March, April and May 2017. |
| During the Reporting Period, short exposure to developed currencies detracted from the Fund’s returns most, especially short exposures to the Canadian dollar and Japanese yen. Positions in commodities also detracted from the Fund’s performance, particularly positions in silver and gold, as these precious metals’ markets saw several sudden price reversals during the first half of 2017. |
| Conversely, long exposures to developed and emerging markets equities contributed most positively to Fund performance during the Reporting Period. In particular, long exposures to South Korean, U.S., Taiwanese and Hong Kong equities contributed positively. Additionally, positions in event-driven strategies boosted the Fund’s performance during the Reporting Period. |
| Q | How did the Fund use derivatives and similar instruments during the Reporting Period? |
| A | The Fund used derivatives, including futures, swaps and forwards, to implement long and short positions. The Fund invested in equity index futures and currency forwards to |
17
PORTFOLIO RESULTS
achieve exposure to equities (both in U.S. and non-U.S. companies) and currencies (U.S. and non-U.S. currencies), respectively. The Fund used interest rate swaps and currency forwards to achieve exposure to fixed income. We used sector-based commodity-linked structured notes and commodity futures as a means of expressing momentum/ trend views on various commodity assets. The use of these instruments is integral to the Fund’s investment strategy and contributed positively to the Fund’s absolute returns as a whole during the Reporting Period. |
| Q | What changes did you make within the Fund during the Reporting Period? |
| A | In late 2016, equities had rallied, while fixed income prices had declined. Consequently, in January 2017, the Fund was net long a broad basket of international developed market equities, while net short global medium-term and long-term fixed income. Also, due to the U.S. dollar having rallied in late 2016, the Fund was net short developed currencies and had only a modest long exposure to emerging market currencies. As equities continued to rally later in the first quarter of 2017, the Fund maintained its long exposure to global equities and its short exposure to medium-term to long-term global fixed income through the first quarter of 2017. Emerging market currencies continued to appreciate versus the U.S. dollar, and so the Fund increased its long exposure to emerging market currencies in February and March 2017. |
| Throughout the second quarter of 2017, the Fund maintained its long positions in global equities, as momentum in equity markets persisted. However, as fixed income prices started to stabilize, the Fund shifted from a net short exposure to a net long exposure to global fixed income. Additionally, as the U.S. dollar continued to depreciate against global currencies, the Fund continued to increase its long exposure to emerging market currencies throughout the second quarter of 2017. The Fund also switched from a net short exposure to a net long exposure to developed currencies in June 2017. |
| Q | Were there any changes to the Fund’s portfolio management team during the Reporting Period? |
| A | Effective April 2017, Bill Fallon was no longer a portfolio manager of the Fund and Momoko Ono was added as a portfolio manager of the Fund. Momoko has been with the QIS Team since June 2007 and has been involved in managing the Fund since its inception. |
| Q | What is the Fund’s tactical asset allocation view and strategy for the months ahead? |
| A | Going into the second half of 2017, we intend to continue to seek to identify price trends in various asset classes over short-, medium- and long-term horizons via a proprietary investment model. Upon identifying a trend in a given instrument or asset, the Fund will take a long or short position in the instrument or asset. Long positions benefit from an increase in price of the underlying instrument or asset, while short positions benefit from a decrease in price of the underlying instrument or asset. The size of the Fund’s position in an instrument or asset is primarily related to the strength of the overall trend identified by the investment model. |
| We continue to believe that the Fund’s trend-following strategy is important because it attempts to adapt to changing markets, seeking what we believe are the most attractive opportunities for investment and attempting to manage risk when the markets become unstable. There is no guarantee that the Fund’s trend-following strategy will cause it to achieve its investment objective. |
18
FUND BASICS
Managed Futures Strategy Fund
as of June 30, 2017
| PERFORMANCE REVIEW | ||||||||||
| January 1, 2017–June 30, 2017 | Fund Total Return (based on NAV)1 | BofA Merrill Lynch USD LIBOR One-Month Constant Maturity Index2 | ||||||||
| Class A | -0.49 | % | 0.43 | % | ||||||
| Class C | -0.92 | 0.43 | ||||||||
| Institutional | -0.29 | 0.43 | ||||||||
| Class IR | -0.39 | 0.43 | ||||||||
| Class R | -0.60 | 0.43 | ||||||||
| 1 | The net asset value (“NAV”) represents the net assets of the class of the Fund (ex-dividend) divided by the total number of shares of the class outstanding. The Fund’s performance reflects the reinvestment of dividends and other distributions. The Fund’s performance does not reflect the deduction of any applicable sales charges. |
| 2 | The Bank of America Merrill Lynch US Dollar One-Month LIBOR Constant Maturity Index tracks the performance of a synthetic asset paying LIBOR to a stated maturity. The Index is based on the assumed purchase at par of a synthetic instrument having exactly its stated maturity and with a coupon equal to that day’s fixing rate. That issue is assumed to be sold the following business day (priced at a yield equal to the current day fixing rate) and rolled into a new instrument. The Index figures do not reflect any deduction for fees, expenses or taxes. It is not possible to invest directly in an index. |
| STANDARDIZED TOTAL RETURNS3 | ||||||||||||||||
| For the period ended 6/30/17 | One Year | Five Years | Since Inception | Inception Date | ||||||||||||
| Class A | -7.44 | % | 1.08 | % | -0.03 | % | 2/29/12 | |||||||||
| Class C | -3.78 | 1.43 | 0.25 | 2/29/12 | ||||||||||||
| Institutional | -1.62 | 2.63 | 1.42 | 2/29/12 | ||||||||||||
| Class IR | -1.74 | 2.47 | 1.27 | 2/29/12 | ||||||||||||
| Class R | -2.26 | 1.96 | 0.76 | 2/29/12 | ||||||||||||
| 3 | The Standardized Total Returns are average annual total returns or cumulative total returns (only if the performance period is one year or less) as of the most recent calendar quarter-end. They assume reinvestment of all distributions at NAV. These returns reflect a maximum initial sales charge of 5.5% for Class A Shares and the assumed contingent deferred sales charge for Class C Shares (1% if redeemed within 12 months of purchase). Because Institutional, Class IR and Class R Shares do not involve a sales charge, such a charge is not applied to their Standardized Total Returns. |
The returns set forth in the tables above represent past performance. Past performance does not guarantee future results. The Fund’s investment return and principal value will fluctuate so that an investor’s shares, when redeemed, may be worth more or less than their original cost. Current performance may be lower or higher than the performance quoted above. Please visit our web site at www.GSAMFUNDS.com to obtain the most recent month-end returns. Performance reflects applicable fee waivers and/or expense limitations in effect during the periods shown. In their absence, performance would be reduced. Returns do not reflect the deduction of taxes that a shareholder would pay on Fund distributions or the redemption of Fund shares.
19
FUND BASICS
| EXPENSE RATIOS4 | ||||||||||
| Net Expense Ratio (Current) | Gross Expense Ratio (Before Waivers) | |||||||||
| Class A | 1.69 | % | 1.88 | % | ||||||
| Class C | 2.45 | 2.63 | ||||||||
| Institutional | 1.30 | 1.48 | ||||||||
| Class IR | 1.45 | 1.63 | ||||||||
| Class R | 1.95 | 2.13 | ||||||||
| 4 | The expense ratios of the Fund, both current (net of applicable fee waivers and/or expense limitations) and before waivers (gross of applicable fee waivers and/or expense limitations) are as set forth above according to the most recent publicly available Prospectus for the Fund and may differ from the expense ratios disclosed in the Financial Highlights in this report. Pursuant to a contractual arrangement, the Fund’s waivers and/or expense limitations will remain in place through at least April 28, 2018, and prior to such date the Investment Adviser may not terminate the arrangements without the approval of the Fund’s Board of Trustees. These arrangements may be modified or terminated by the Investment Adviser at its discretion and without shareholder approval after such date, although the Investment Adviser does not currently intend to do so. If these arrangements are discontinued in the future, the expense ratios may change without shareholder approval. |
| FUND COMPOSITION5 |
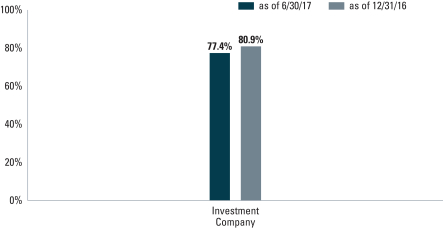
| 5 | The Fund is actively managed and, as such, its composition may differ over time. The percentage shown for each investment category reflects the value of investments in that category as a percentage of net assets. Figures in the above graph may not sum to 100% due to the exclusion of other assets and liabilities. Underlying sector allocations of investment companies held by the Fund, if any, are not reflected in the graph above. Consequently, the Fund’s overall sector allocations may differ from the percentages contained in the graph above. The above graph depicts the Fund’s investments but may not represent the Fund’s market exposure due to the exclusion of certain derivatives, if any, as listed in the Additional Investment Information section of the Schedule of Investments. |
20
INDEX DEFINITIONS
HFRX Event Driven Index: Event Driven Managers maintain positions in companies currently or prospectively involved in corporate transactions of a wide variety including but not limited to mergers, restructurings, financial distress, tender offers, shareholder buybacks, debt exchanges, security issuance or other capital structure adjustments. Security types can range from most senior in the capital structure to most junior or subordinated, and frequently involve additional derivative securities. Event Driven exposure includes a combination of sensitivities to equity markets, credit markets and idiosyncratic, company specific developments. Investment theses are typically predicated on fundamental characteristics (as opposed to quantitative), with the realization of the thesis predicated on a specific development exogenous to the existing capital structure.*
HFRX Relative Value Arbitrage Index: Relative Value investment managers maintain positions in which the investment thesis is predicated on realization of a valuation discrepancy in the relationship between multiple securities. Managers employ a variety of fundamental and quantitative techniques to establish investment theses, and security types range broadly across equity, fixed income, derivative or other security types. Fixed income strategies are typically quantitatively driven to measure the existing relationship between instruments and, in some cases, identify attractive positions in which the risk adjusted spread between these instruments represents an attractive opportunity for the investment manager. Relative Value position may be involved in corporate transactions also, but as opposed to Event Driven exposures, the investment thesis is predicated on realization of a pricing discrepancy between related securities, as opposed to the outcome of the corporate transaction.*
HFRX Equity Hedge Index: Equity Hedge strategies maintain positions both long and short in primarily equity and equity derivative securities. A wide variety of investment processes can be employed to arrive at an investment decision, including both quantitative and fundamental techniques; strategies can be broadly diversified or narrowly focused on specific sectors and can range broadly in terms of levels of net exposure, leverage employed, holding period, concentrations of market capitalizations and valuation ranges of typical portfolios. Equity Hedge managers would typically maintain at least 50%, and may in some cases be substantially entirely invested in equities, both long and short.*
HFRX Global Hedge Fund Index: The HFRX Global Hedge Fund Index is designed to be representative of the overall composition of the hedge fund universe. It is comprised of all eligible hedge fund strategies, including but not limited to convertible arbitrage, distressed securities, equity hedge, equity market neutral, event driven, macro, merger arbitrage, and relative value arbitrage. The strategies are asset weighted based on the distribution of assets in the hedge fund industry. The index is investable through products managed by HFR Asset Management, LLC that track HFRX Indices. The HFRX Global Hedge Fund Index is a trademark of HFR. HFR has not participated in the formation of the Fund. HFR does not endorse or approve the Fund or make any recommendation with respect to investing in the Fund. It is not possible to invest directly in an index.
HFRX Macro/ CTA Index: Active Trading strategies utilize active trading methods, typically with high frequency position turnover or leverage; these may employ components of both Discretionary and Systematic Macro strategies. Strategies may contain distinct, identifiable sub-strategies, such as equity hedge or equity market neutral, or in some cases a number of sub-strategies are blended together without the capacity for portfolio level disaggregation. Strategies employ an investment process based on systematic, quantitative evaluation of macroeconomic variables in which the portfolio positioning is predicated on convergence of differentials between markets, not necessarily highly correlated with each other, but currently diverging from their historical levels of correlation. Strategies focus on fundamental relationships across geographic areas both inter and intra-asset classes, and typical holding periods are shorter than trend following or discretionary strategies. Active Trading strategies are distinct from other macro in that they characteristically emphasize rapid market response to new information and high volume of turnover in liquid but frequently volatile and unstable market positions.*
*Indicates index definition was sourced from Hedge Fund Research (HFR). The indexes are trademarks of HFR. HFR has not participated in the formation of the Funds. HFR does not endorse or approve the Funds or make any recommendation with respect to investing in the Funds.
21
INDEX DEFINITIONS
MSCI World Index: The MSCI World Index is a broad global equity benchmark that represents large and mid-cap equity performance across 23 developed markets countries. It covers approximately 85% of the free float-adjusted market capitalization in each country. The MSCI World Index does not offer exposure to emerging markets.
MSCI Emerging Market Index: MSCI Emerging Markets Index consists of 24 countries representing 10% of world market capitalization. The Index is available for a number of regions, market segments/sizes and covers approximately 85% of the free float-adjusted market capitalization in each of the 24 countries.
S&P® 500 Index: The S&P 500 Index is the Standard & Poor’s 500 Composite Index of 500 stocks, an unmanaged index of common stock prices.
S&P GSCI® Agriculture Index: The S&P GSCI® Agriculture Index, a sub-index of the S&P GSCI, provides investors with a reliable and publicly available benchmark for investment performance in the agricultural commodity markets.
S&P GSCI® Industrial Metals Index: The S&P GSCI® Industrial Metals Index provides investors with a reliable and publicly available benchmark for investment performance in the industrial metals market.
The Index figures do not include any deduction for fees, expenses or taxes. It is not possible to invest directly in an unmanaged index.
22
GOLDMAN SACHS ABSOLUTE RETURN TRACKER FUND
Consolidated Schedule of Investments
June 30, 2017 (Unaudited)
| Shares | Description | Value | ||||||
| Common Stocks – 11.4% | ||||||||
| Automobiles & Components – 0.1% | ||||||||
| 7,800 | Adient plc | $ | 509,964 | |||||
| 3,730 | Lear Corp. | 529,958 | ||||||
|
| |||||||
| 1,039,922 | ||||||||
|
| |||||||
| Banks – 0.6% | ||||||||
| 32,800 | CIT Group, Inc. | 1,597,360 | ||||||
| 34,600 | Citizens Financial Group, Inc. | 1,234,528 | ||||||
| 23,200 | Comerica, Inc. | 1,699,168 | ||||||
| 34,100 | KeyCorp | 639,034 | ||||||
| 40,800 | New York Community Bancorp, Inc. | 535,704 | ||||||
| 50,200 | Regions Financial Corp. | 734,928 | ||||||
| 13,136 | SunTrust Banks, Inc. | 745,074 | ||||||
| 22,730 | Wells Fargo & Co. | 1,259,469 | ||||||
|
| |||||||
| 8,445,265 | ||||||||
|
| |||||||
| Capital Goods – 0.4% | ||||||||
| 2,989 | 3M Co. | 622,280 | ||||||
| 23,100 | BWX Technologies, Inc. | 1,126,125 | ||||||
| 4,600 | Graco, Inc. | 502,688 | ||||||
| 4,600 | Honeywell International, Inc. | 613,134 | ||||||
| 13,227 | Johnson Controls International plc | 573,523 | ||||||
| 40,900 | KBR, Inc. | 622,498 | ||||||
| 8,700 | Owens Corning | 582,204 | ||||||
| 36,500 | Quanta Services, Inc.* | 1,201,580 | ||||||
|
| |||||||
| 5,844,032 | ||||||||
|
| |||||||
| Commercial & Professional Services – 0.1% | ||||||||
| 22,600 | Clean Harbors, Inc.* | 1,261,758 | ||||||
|
| |||||||
| Consumer Durables & Apparel – 0.3% | ||||||||
| 7,400 | Carter’s, Inc. | 658,230 | ||||||
| 12,700 | Coach, Inc. | 601,218 | ||||||
| 14,600 | DR Horton, Inc. | 504,722 | ||||||
| 15,500 | Newell Brands, Inc. | 831,110 | ||||||
| 31,600 | Under Armour, Inc. Class C*(a) | 637,056 | ||||||
| 3,585 | Whirlpool Corp. | 686,958 | ||||||
|
| |||||||
| 3,919,294 | ||||||||
|
| |||||||
| Consumer Services – 0.4% | ||||||||
| 29,000 | Extended Stay America, Inc. | 561,440 | ||||||
| 19,800 | Hilton Worldwide Holdings, Inc. | 1,224,630 | ||||||
| 29,900 | International Game Technology plc | 547,170 | ||||||
| 34,500 | MGM Resorts International | 1,079,505 | ||||||
| 5,400 | Royal Caribbean Cruises Ltd. | 589,842 | ||||||
| 15,700 | ServiceMaster Global Holdings, Inc.* | 615,283 | ||||||
| 16,995 | Starbucks Corp. | 990,978 | ||||||
|
| |||||||
| 5,608,848 | ||||||||
|
| |||||||
| Diversified Financials – 0.5% | ||||||||
| 39,689 | Ally Financial, Inc. | 829,500 | ||||||
| 11,639 | Berkshire Hathaway, Inc. Class B* | 1,971,298 | ||||||
| 6,900 | Capital One Financial Corp. | 570,078 | ||||||
| 5,200 | Credit Acceptance Corp.*(a) | 1,337,128 | ||||||
| 27,572 | Interactive Brokers Group, Inc. Class A | 1,031,744 | ||||||
| 9,200 | Intercontinental Exchange, Inc. | 606,464 | ||||||
|
| |||||||
| 6,346,212 | ||||||||
|
| |||||||
| Shares | Description | Value | ||||||
| Common Stocks – (continued) | ||||||||
| Energy – 0.7% | ||||||||
| 9,500 | Anadarko Petroleum Corp. | 430,730 | ||||||
| 24,800 | Antero Resources Corp.* | 535,928 | ||||||
| 22,000 | Apache Corp. | 1,054,460 | ||||||
| 7,400 | Concho Resources, Inc.* | 899,322 | ||||||
| 10,239 | Diamondback Energy, Inc.* | 909,326 | ||||||
| 9,700 | Halliburton Co. | 414,287 | ||||||
| 31,500 | Kinder Morgan, Inc. | 603,540 | ||||||
| 13,500 | ONEOK, Inc. | 704,160 | ||||||
| 28,800 | Parsley Energy, Inc. Class A* | 799,200 | ||||||
| 4,263 | Pioneer Natural Resources Co. | 680,289 | ||||||
| 24,500 | RPC, Inc.(a) | 495,145 | ||||||
| 26,800 | Targa Resources Corp. | 1,211,360 | ||||||
| 37,700 | WPX Energy, Inc.* | 364,182 | ||||||
|
| |||||||
| 9,101,929 | ||||||||
|
| |||||||
| Food & Staples Retailing – 0.0% | ||||||||
| 6,300 | Walgreens Boots Alliance, Inc. | 493,353 | ||||||
|
| |||||||
| Food, Beverage & Tobacco – 0.2% | ||||||||
| 60,100 | Hain Celestial Group, Inc. (The)* | 2,333,082 | ||||||
| 13,200 | Mondelez International, Inc. Class A | 570,108 | ||||||
|
| |||||||
| 2,903,190 | ||||||||
|
| |||||||
| Health Care Equipment & Services – 0.6% | ||||||||
| 15,400 | Abbott Laboratories | 748,594 | ||||||
| 15,800 | Acadia Healthcare Co., Inc.* | 780,204 | ||||||
| 56,400 | Allscripts Healthcare Solutions, Inc.* | 719,664 | ||||||
| 6,330 | Danaher Corp. | 534,189 | ||||||
| 6,493 | HCA Healthcare, Inc.* | 566,189 | ||||||
| 6,200 | Laboratory Corp. of America Holdings* | 955,668 | ||||||
| 4,800 | McKesson Corp. | 789,792 | ||||||
| 10,000 | MEDNAX, Inc.* | 603,700 | ||||||
| 3,600 | UnitedHealth Group, Inc. | 667,512 | ||||||
| 12,600 | Zimmer Biomet Holdings, Inc. | 1,617,840 | ||||||
|
| |||||||
| 7,983,352 | ||||||||
|
| |||||||
| Household & Personal Products – 0.2% | ||||||||
| 32,800 | Herbalife Ltd.*(a) | 2,339,624 | ||||||
| 6,600 | Procter & Gamble Co. (The) | 575,190 | ||||||
|
| |||||||
| 2,914,814 | ||||||||
|
| |||||||
| Insurance – 0.1% | ||||||||
| 9,091 | American International Group, Inc. | 568,369 | ||||||
| 12,200 | FNF Group | 546,926 | ||||||
| 10,540 | MetLife, Inc. | 579,068 | ||||||
|
| |||||||
| 1,694,363 | ||||||||
|
| |||||||
| Materials – 0.5% | ||||||||
| 15,800 | Alcoa Corp. | 515,870 | ||||||
| 22,300 | Axalta Coating Systems Ltd.* | 714,492 | ||||||
| 6,300 | Celanese Corp. Series A | 598,122 | ||||||
| 8,800 | Dow Chemical Co. (The) | 555,016 | ||||||
| 8,000 | Eastman Chemical Co. | 671,920 | ||||||
| 6,300 | FMC Corp. | 460,215 | ||||||
| 74,692 | Owens-Illinois, Inc.* | 1,786,633 | ||||||
| 16,909 | Royal Gold, Inc. | 1,321,776 | ||||||
| 1,700 | Sherwin-Williams Co. (The) | 596,632 | ||||||
|
| |||||||
| 7,220,676 | ||||||||
|
| |||||||
| The accompanying notes are an integral part of these financial statements. | 23 |
GOLDMAN SACHS ABSOLUTE RETURN TRACKER FUND
Consolidated Schedule of Investments (continued)
June 30, 2017 (Unaudited)
| Shares | Description | Value | ||||||
| Common Stocks – (continued) | ||||||||
| Media – 0.4% | ||||||||
| 23,822 | Comcast Corp. Class A | $ | 927,152 | |||||
| 18,466 | Liberty Broadband Corp. Class C* | 1,601,926 | ||||||
| 14,300 | Liberty Media Corp-Liberty SiriusXM* | 596,310 | ||||||
| 26,400 | Live Nation Entertainment, Inc.* | 920,040 | ||||||
| 6,800 | Walt Disney Co. (The) | 722,500 | ||||||
|
| |||||||
| 4,767,928 | ||||||||
|
| |||||||
| Pharmaceuticals, Biotechnology & Life Sciences – 1.3% | ||||||||
| 8,100 | Alnylam Pharmaceuticals, Inc.* | 646,056 | ||||||
| 4,553 | Amgen, Inc. | 784,163 | ||||||
| 2,800 | Biogen, Inc.* | 759,808 | ||||||
| 8,968 | Bristol-Myers Squibb Co. | 499,697 | ||||||
| 19,432 | Celgene Corp.* | 2,523,634 | ||||||
| 28,632 | Gilead Sciences, Inc. | 2,026,573 | ||||||
| 3,800 | Incyte Corp.* | 478,458 | ||||||
| 9,949 | Johnson & Johnson | 1,316,153 | ||||||
| 16,191 | Merck & Co., Inc. | 1,037,681 | ||||||
| 94,173 | Neurocrine Biosciences, Inc.* | 4,331,958 | ||||||
| 79,259 | Pfizer, Inc. | 2,662,310 | ||||||
| 3,449 | Thermo Fisher Scientific, Inc. | 601,747 | ||||||
| 4,800 | Vertex Pharmaceuticals, Inc.* | 618,576 | ||||||
|
| |||||||
| 18,286,814 | ||||||||
|
| |||||||
| Real Estate – 0.5% | ||||||||
| 8,771 | American Tower Corp. (REIT) | 1,160,579 | ||||||
| 6,200 | Crown Castle International Corp. (REIT) | 621,116 | ||||||
| 35,700 | Forest City Realty Trust, Inc. Class A (REIT) | 862,869 | ||||||
| 5,000 | Howard Hughes Corp. (The)* | 614,200 | ||||||
| 4,600 | Jones Lang LaSalle, Inc. | 575,000 | ||||||
| 28,100 | Quality Care Properties, Inc. (REIT)* | 514,511 | ||||||
| 30,900 | Realogy Holdings Corp. | 1,002,705 | ||||||
| 25,400 | Weyerhaeuser Co. (REIT) | 850,900 | ||||||
|
| |||||||
| 6,201,880 | ||||||||
|
| |||||||
| Retailing – 0.6% | ||||||||
| 3,784 | Amazon.com, Inc.* | 3,662,912 | ||||||
| 10,100 | Dillard’s, Inc. Class A(a) | 582,669 | ||||||
| 10,874 | Dollar General Corp. | 783,906 | ||||||
| 6,615 | Dollar Tree, Inc.* | 462,521 | ||||||
| 3,800 | Home Depot, Inc. (The) | 582,920 | ||||||
| 93 | Liberty Ventures Series A* | 4,863 | ||||||
| 6,800 | Lowe’s Cos., Inc. | 527,204 | ||||||
| 5,300 | Netflix, Inc.* | 791,873 | ||||||
|
| |||||||
| 7,398,868 | ||||||||
|
| |||||||
| Semiconductors & Semiconductor Equipment – 0.5% | ||||||||
| 14,200 | Applied Materials, Inc. | 586,602 | ||||||
| 11,427 | Broadcom Ltd. | 2,663,062 | ||||||
| 74,100 | Marvell Technology Group Ltd. | 1,224,132 | ||||||
| 58,818 | Micron Technology, Inc.* | 1,756,306 | ||||||
| 4,700 | NVIDIA Corp. | 679,432 | ||||||
|
| |||||||
| 6,909,534 | ||||||||
|
| |||||||
| Common Stocks – (continued) | ||||||||
| Software & Services – 2.1% | ||||||||
| 11,200 | Activision Blizzard, Inc. | 644,784 | ||||||
| 16,300 | Akamai Technologies, Inc.* | 811,903 | ||||||
| 3,394 | Alphabet, Inc. Class A* | 3,155,334 | ||||||
| 2,535 | Alphabet, Inc. Class C* | 2,303,631 | ||||||
| 29,800 | Cognizant Technology Solutions Corp. Class A | 1,978,720 | ||||||
| 112,200 | Conduent, Inc.* | 1,788,468 | ||||||
| 19,400 | eBay, Inc.* | 677,448 | ||||||
| 20,881 | Facebook, Inc. Class A* | 3,152,614 | ||||||
| 82,852 | FireEye, Inc.*(a) | 1,260,179 | ||||||
| 10,402 | Mastercard, Inc. Class A | 1,263,323 | ||||||
| 40,657 | Microsoft Corp. | 2,802,487 | ||||||
| 158,400 | Nuance Communications, Inc.* | 2,757,744 | ||||||
| 44,051 | PayPal Holdings, Inc.* | 2,364,217 | ||||||
| 7,400 | salesforce.com, Inc.* | 640,840 | ||||||
| 5,100 | Tyler Technologies, Inc.* | 895,917 | ||||||
| 17,894 | Visa, Inc. Class A | 1,678,099 | ||||||
| 28,167 | Yelp, Inc.* | 845,573 | ||||||
|
| |||||||
| 29,021,281 | ||||||||
|
| |||||||
| Technology Hardware & Equipment – 1.0% | ||||||||
| 21,119 | Apple, Inc. | 3,041,559 | ||||||
| 20,500 | ARRIS International plc* | 574,410 | ||||||
| 22,400 | Cisco Systems, Inc. | 701,120 | ||||||
| 33,100 | CommScope Holding Co., Inc.* | 1,258,793 | ||||||
| 12,509 | EchoStar Corp. Class A* | 759,296 | ||||||
| 400,980 | Fitbit, Inc. Class A*(a) | 2,129,204 | ||||||
| 5,200 | IPG Photonics Corp.* | 754,520 | ||||||
| 10,200 | Motorola Solutions, Inc. | 884,748 | ||||||
| 12,209 | Palo Alto Networks, Inc.* | 1,633,686 | ||||||
| 9,200 | Western Digital Corp. | 815,120 | ||||||
| 11,200 | Zebra Technologies Corp. Class A* | 1,125,824 | ||||||
|
| |||||||
| 13,678,280 | ||||||||
|
| |||||||
| Telecommunication Services – 0.0% | ||||||||
| 7,700 | T-Mobile US, Inc.* | 466,774 | ||||||
|
| |||||||
| Transportation – 0.2% | ||||||||
| 16,939 | Delta Air Lines, Inc. | 910,302 | ||||||
| 10,327 | Macquarie Infrastructure Corp. | 809,637 | ||||||
| 6,744 | Union Pacific Corp. | 734,489 | ||||||
|
| |||||||
| 2,454,428 | ||||||||
|
| |||||||
| Utilities – 0.1% | ||||||||
| 9,252 | American Water Works Co., Inc. | 721,193 | ||||||
|
| |||||||
| TOTAL COMMON STOCKS | ||||||||
| (Cost $136,106,036) | $ | 154,683,988 | ||||||
|
| |||||||
| Exchange Traded Funds – 8.5% | ||||||||
| 175,756 | Energy Select Sector SPDR Fund | $ | 11,410,080 | |||||
| 216,683 | Health Care Select Sector SPDR Fund | 17,169,961 | ||||||
| 132,564 | PowerShares Emerging Markets Sovereign Debt Fund | 3,880,148 | ||||||
| 1,328,442 | PowerShares Senior Loan Fund | 30,740,148 | ||||||
| 350,804 | SPDR Bloomberg Barclays Convertible Securities Fund | 17,406,894 | ||||||
|
| |||||||
| 24 | The accompanying notes are an integral part of these financial statements. |
GOLDMAN SACHS ABSOLUTE RETURN TRACKER FUND
| Shares | Description | Value | ||||||
| Exchange Traded Funds – (continued) | ||||||||
| 25,889 | SPDR Dow Jones International Real Estate Fund | $ | 986,371 | |||||
| 11,900 | SPDR Dow Jones REIT Fund | 1,106,462 | ||||||
| 824,221 | Vanguard FTSE Emerging Markets Fund | 33,652,943 | ||||||
|
| |||||||
| TOTAL EXCHANGE TRADED FUNDS | ||||||||
| (Cost $104,995,039) | $ | 116,353,007 | ||||||
|
| |||||||
| Shares | Distribution Rate | Value | ||||
| Investment Company(b)(c) – 73.7% | ||||||
Goldman Sachs Financial Square Government Fund – Institutional Shares |
| |||||
| 1,003,357,451 | 0.845% | $ | 1,003,357,451 | |||
| (Cost $1,003,357,451) | ||||||
| ||||||
| TOTAL INVESTMENTS BEFORE SECURITIES LENDING REINVESTMENT VEHICLE | ||||||
| (Cost $1,244,458,526) | $ | 1,274,394,446 | ||||
| ||||||
| Securities Lending Reinvestment Vehicle(b)(c) – 0.6% | ||||||
Goldman Sachs Financial Square Government Fund – Institutional Shares |
| |||||
| 8,001,950 | 0.845% | $ | 8,001,950 | |||
| (Cost $8,001,950) | ||||||
| ||||||
| TOTAL INVESTMENTS – 94.2% | ||||||
| (Cost $1,252,460,476) | $ | 1,282,396,396 | ||||
| ||||||
OTHER ASSETS IN EXCESS OF | 78,824,309 | |||||
| ||||||
| NET ASSETS – 100.0% | $ | 1,361,220,705 | ||||
| ||||||
| The percentage shown for each investment category reflects the value of investments in that category as a percentage of net assets. | ||
* | Non-income producing security. | |
(a) | All or a portion of security is on loan. | |
(b) | Represents an affiliated issuer. | |
(c) | Variable rate security. Interest rate or distribution rate disclosed is that which is in effect on June 30, 2017. | |
| ||
Investment Abbreviations: | ||
REIT | —Real Estate Investment Trust | |
SPDR | —Standard and Poor’s Depositary Receipts | |
Currency Abbreviations: | ||
AUD | —Australian Dollar | |
CHF | —Swiss Franc | |
GBP | —British Pound | |
HUF | —Hungarian Forint | |
IDR | —Indonesian Rupiah | |
ILS | —Israel New Shekel | |
INR | —Indian Rupee | |
JPY | —Japanese Yen | |
MXN | —Mexican Peso | |
NOK | —Norwegian Krone | |
NZD | —New Zealand Dollar | |
PHP | —Philippines peso | |
PLN | —Polish Zloty | |
RUB | —Russian Ruble | |
TRY | —Turkish Lira | |
TWD | —Taiwan Dollar | |
USD | —United States Dollar | |
ZAR | —South African Rand | |
| ||
| The accompanying notes are an integral part of these financial statements. | 25 |
GOLDMAN SACHS ABSOLUTE RETURN TRACKER FUND
Consolidated Schedule of Investments (continued)
June 30, 2017 (Unaudited)
| ADDITIONAL INVESTMENT INFORMATION |
FORWARD FOREIGN CURRENCY EXCHANGE CONTRACTS — At June 30, 2017, the Fund had the following forward foreign currency exchange contracts:
FORWARD FOREIGN CURRENCY EXCHANGE CONTRACTS WITH UNREALIZED GAIN
| Counterparty | Currency Purchased | Currency Sold | Settlement Date | Current Value | Unrealized Gain | |||||||||||||||||||
UBS AG | AUD | 4,180,000 | USD | 3,157,482 | 07/25/17 | $ | 3,211,838 | $ | 54,356 | |||||||||||||||
| CHF | 3,840,000 | USD | 3,948,391 | 07/25/17 | 4,010,002 | 61,611 | ||||||||||||||||||
| HUF | 676,540,000 | USD | 2,440,780 | 07/25/17 | 2,504,097 | 63,317 | ||||||||||||||||||
| IDR | 52,957,130,000 | USD | 3,933,823 | 07/03/17 | 3,973,523 | 39,700 | ||||||||||||||||||
| ILS | 21,510,000 | USD | 6,075,322 | 07/25/17 | 6,171,089 | 95,767 | ||||||||||||||||||
| INR | 437,790,000 | USD | 6,755,314 | 07/26/17 | 6,757,231 | 1,917 | ||||||||||||||||||
| MXN | 87,790,000 | USD | 4,809,378 | 07/25/17 | 4,820,622 | 11,244 | ||||||||||||||||||
| NZD | 7,760,000 | USD | 5,602,510 | 07/25/17 | 5,684,398 | 81,888 | ||||||||||||||||||
| PLN | 10,150,000 | USD | 2,665,755 | 07/25/17 | 2,738,770 | 73,015 | ||||||||||||||||||
| RUB | 96,260,000 | USD | 1,593,642 | 07/26/17 | 1,624,840 | 31,198 | ||||||||||||||||||
| TRY | 14,500,000 | USD | 4,069,714 | 07/25/17 | 4,097,370 | 27,656 | ||||||||||||||||||
| TWD | 70,460,000 | USD | 2,315,037 | 07/26/17 | 2,317,815 | 2,778 | ||||||||||||||||||
| USD | 1,427,920 | JPY | 158,690,000 | 07/25/17 | 1,412,177 | 15,743 | ||||||||||||||||||
| USD | 1,604,136 | PHP | 80,680,000 | 07/26/17 | 1,595,443 | 8,693 | ||||||||||||||||||
| ZAR | 22,310,000 | USD | 1,696,570 | 07/25/17 | 1,699,042 | 2,472 | ||||||||||||||||||
| TOTAL | $ | 571,355 | ||||||||||||||||||||||
FORWARD FOREIGN CURRENCY EXCHANGE CONTRACTS WITH UNREALIZED LOSS
| Counterparty | Currency Purchased | Currency Sold | Settlement Date | Current Value | Unrealized Loss | |||||||||||||||||||
UBS AG | IDR | 71,994,350,000 | USD | 5,391,270 | 07/26/17 | $ | 5,387,337 | $ | (3,933 | ) | ||||||||||||||
| USD | 2,751,242 | GBP | 2,170,000 | 07/25/17 | 2,828,257 | (77,015 | ) | |||||||||||||||||
| USD | 3,972,778 | IDR | 52,957,130,000 | 07/03/17 | 3,973,523 | (745 | ) | |||||||||||||||||
| USD | 1,375,070 | NOK | 11,600,000 | 07/25/17 | 1,390,059 | (14,989 | ) | |||||||||||||||||
| USD | 1,752,938 | PHP | 88,760,000 | 07/26/17 | 1,755,224 | (2,286 | ) | |||||||||||||||||
| ZAR | 21,770,000 | USD | 1,658,136 | 07/25/17 | 1,657,918 | (218 | ) | |||||||||||||||||
| TOTAL | $ | (99,186 | ) | |||||||||||||||||||||
FUTURES CONTRACTS — At June 30, 2017, the Fund had the following futures contracts:
| Type | Number of Contracts Long (Short) | Expiration Date | Current Value | Unrealized Gain (Loss) | ||||||||||
90 Day Bank Bill | 23 | September 2017 | $ | 17,602,278 | $ | 633 | ||||||||
90 Day Bank Bill | 47 | December 2017 | 35,967,223 | 626 | ||||||||||
90 Day Bank Bill | 46 | March 2018 | 35,195,914 | (1,983 | ) | |||||||||
90 Day Eurodollar | (1 | ) | September 2017 | (246,613 | ) | (2 | ) | |||||||
90 Day Eurodollar | (47 | ) | December 2017 | (11,576,688 | ) | 5,279 | ||||||||
90 Day Eurodollar | (1 | ) | March 2018 | (246,100 | ) | 10 | ||||||||
90 Day Eurodollar | 29 | June 2018 | 7,131,463 | (3,954 | ) | |||||||||
90 Day Eurodollar | 48 | September 2018 | 11,794,800 | (6,011 | ) | |||||||||
90 Day Eurodollar | 48 | December 2018 | 11,784,000 | (6,598 | ) | |||||||||
90 Day Eurodollar | 53 | March 2019 | 13,004,213 | (6,822 | ) | |||||||||
90 Day Eurodollar | 55 | June 2019 | 13,486,688 | (8,065 | ) | |||||||||
90 Day Sterling | 16 | September 2017 | 2,594,350 | 1,458 | ||||||||||
90 Day Sterling | 19 | December 2017 | 3,077,852 | 72 | ||||||||||
| 26 | The accompanying notes are an integral part of these financial statements. |
GOLDMAN SACHS ABSOLUTE RETURN TRACKER FUND
| ADDITIONAL INVESTMENT INFORMATION (continued) |
FUTURES CONTRACTS (continued)
| Type | Number of Contracts Long (Short) | Expiration Date | Current Value | Unrealized Gain (Loss) | ||||||||||
90 Day Sterling | 20 | March 2018 | $ | 3,237,240 | $ | (1,410 | ) | |||||||
90 Day Sterling | 15 | June 2018 | 2,425,976 | (1,901 | ) | |||||||||
90 Day Sterling | 21 | September 2018 | 3,394,315 | (3,722 | ) | |||||||||
90 Day Sterling | 22 | December 2018 | 3,554,158 | (3,676 | ) | |||||||||
90 Day Sterling | 19 | March 2019 | 3,068,263 | (2,118 | ) | |||||||||
90 Day Sterling | 21 | June 2019 | 3,389,529 | (7,555 | ) | |||||||||
Amsterdam Index | 25 | July 2017 | 2,892,495 | (90,981 | ) | |||||||||
Bank Acceptance Futures | (49 | ) | September 2017 | (9,332,973 | ) | 9,683 | ||||||||
Bank Acceptance Futures | (61 | ) | December 2017 | (11,601,548 | ) | 17,100 | ||||||||
Bank Acceptance Futures | (62 | ) | March 2018 | (11,781,578 | ) | 16,517 | ||||||||
Brent Crude Futures | (59 | ) | July 2017 | (2,877,430 | ) | (103,258 | ) | |||||||
CAC 40 Index | 53 | July 2017 | 3,097,220 | (74,619 | ) | |||||||||
Corn Futures | (76 | ) | September 2017 | (1,447,800 | ) | (50,582 | ) | |||||||
DAX Index | 22 | September 2017 | 7,739,208 | (307,241 | ) | |||||||||
Euro CHF 3-Month ICE | (32 | ) | September 2017 | (8,402,962 | ) | 3,427 | ||||||||
Euro CHF 3-Month ICE | (24 | ) | December 2017 | (6,300,344 | ) | 3,691 | ||||||||
Euro CHF 3-Month ICE | (18 | ) | March 2018 | (4,723,850 | ) | 2,329 | ||||||||
EURO STOXX 50 Index | 1,560 | September 2017 | 61,131,979 | (2,489,361 | ) | |||||||||
Euro-Bobl | 126 | September 2017 | 18,953,065 | (149,581 | ) | |||||||||
Euro-BTP | 42 | September 2017 | 6,482,706 | 54,812 | ||||||||||
Euro-Bund | 139 | September 2017 | 25,698,295 | (373,006 | ) | |||||||||
Euro-Buxl | 6 | September 2017 | 1,120,586 | (23,717 | ) | |||||||||
Euro-OAT | 51 | September 2017 | 8,648,908 | (67,298 | ) | |||||||||
Euro-Schatz | 98 | September 2017 | 12,519,449 | (5,757 | ) | |||||||||
FTSE 100 Index | 267 | September 2017 | 25,186,093 | (690,830 | ) | |||||||||
FTSE/JSE Top 40 Index | (39 | ) | September 2017 | (1,361,818 | ) | (13,476 | ) | |||||||
Gasoline RBOB Futures | (26 | ) | July 2017 | (1,652,960 | ) | (31,740 | ) | |||||||
Gold 100 oz. Futures | (3 | ) | August 2017 | (372,690 | ) | (8 | ) | |||||||
Hang Seng Index | 30 | July 2017 | 4,915,497 | (20,271 | ) | |||||||||
H-Shares Index | 36 | July 2017 | 2,350,447 | (26,573 | ) | |||||||||
IBEX 35 Index | 21 | July 2017 | 2,495,871 | (80,303 | ) | |||||||||
KOSPI 200 Index | 66 | September 2017 | 4,512,389 | 59,743 | ||||||||||
Live Cattle Futures | 27 | August 2017 | 1,256,040 | (59,481 | ) | |||||||||
LME Copper Futures | 21 | September 2017 | 1,423,275 | 77,117 | ||||||||||
LME Lead Futures | 24 | August 2017 | 1,374,000 | (176 | ) | |||||||||
LME Primary Aluminum Futures | 55 | July 2017 | 2,626,938 | 11,627 | ||||||||||
LME Primary Aluminum Futures | (55 | ) | July 2017 | (2,626,938 | ) | (14,223 | ) | |||||||
LME Primary Aluminum Futures | 58 | August 2017 | 2,775,663 | 14,070 | ||||||||||
LME Zinc Futures | 21 | August 2017 | 1,447,688 | 1,263 | ||||||||||
Long Gilt | 68 | September 2017 | 11,121,308 | (184,209 | ) | |||||||||
Low Sulphur Gas Oil Futures | (33 | ) | August 2017 | (1,438,800 | ) | (39,666 | ) | |||||||
MSCI Taiwan Index | 90 | July 2017 | 3,467,700 | (47,025 | ) | |||||||||
NASDAQ 100 E-mini Index | 131 | September 2017 | 14,810,205 | (173,506 | ) | |||||||||
Natural Gas Futures | (48 | ) | July 2017 | (1,456,800 | ) | (57,732 | ) | |||||||
NY Harbor ULSD Futures | (23 | ) | July 2017 | (1,432,675 | ) | (51,454 | ) | |||||||
OMX Stockholm 30 Index | 166 | July 2017 | 3,158,053 | (94,716 | ) | |||||||||
Russell 2000 Mini Index | 299 | September 2017 | 21,143,785 | (49,788 | ) | |||||||||
S&P 500 E-Mini Index | (112 | ) | September 2017 | (13,557,040 | ) | 49,703 | ||||||||
S&P Mid Cap 400 E-mini Index | 30 | September 2017 | 5,238,300 | (32,173 | ) | |||||||||
S&P/TSX 60 Index | 15 | September 2017 | 2,057,064 | (21,265 | ) | |||||||||
SET50 Index | 405 | September 2017 | 2,365,858 | (9,239 | ) | |||||||||
| The accompanying notes are an integral part of these financial statements. | 27 |
GOLDMAN SACHS ABSOLUTE RETURN TRACKER FUND
Consolidated Schedule of Investments (continued)
June 30, 2017 (Unaudited)
| ADDITIONAL INVESTMENT INFORMATION (continued) |
FUTURES CONTRACTS (continued)
| Type | Number of Contracts Long (Short) | Expiration Date | Current Value | Unrealized Gain (Loss) | ||||||||||||
SGX Nifty 50 Equity Index | 167 | July 2017 | $ | 3,179,179 | $ | (38,401 | ) | |||||||||
Silver Futures | (18 | ) | September 2017 | (1,496,430 | ) | (17,830 | ) | |||||||||
Soybean Futures | (87 | ) | November 2017 | (4,153,163 | ) | (82,915 | ) | |||||||||
TSE TOPIX Index | 109 | September 2017 | 15,617,115 | 108,657 | ||||||||||||
U.S. Long Bonds | 73 | September 2017 | 11,219,188 | (5,795 | ) | |||||||||||
Wheat Futures | (60 | ) | September 2017 | (1,578,000 | ) | (202,145 | ) | |||||||||
WTI Crude Oil Futures | (89 | ) | July 2017 | (4,097,560 | ) | (87,095 | ) | |||||||||
2 Year U.S. Treasury Notes | 46 | September 2017 | 9,941,031 | (11,324 | ) | |||||||||||
5 Year U.S. Treasury Notes | 169 | September 2017 | 19,914,273 | (46,233 | ) | |||||||||||
10 Year Australian Government Bonds | 75 | September 2017 | 7,451,178 | (98,707 | ) | |||||||||||
10 Year Canadian Government Bonds | 45 | September 2017 | 4,877,198 | (88,334 | ) | |||||||||||
10 Year Japanese Government Bonds | 3 | September 2017 | 4,003,823 | (11,222 | ) | |||||||||||
10 Year U.S. Treasury Notes | 249 | September 2017 | 31,257,281 | (108,990 | ) | |||||||||||
| TOTAL | $ | (5,848,246 | ) | |||||||||||||
SWAP CONTRACTS — At June 30, 2017, the Fund had the following swap contracts:
CENTRALLY CLEARED CREDIT DEFAULT SWAP CONTRACTS
| Market Value | ||||||||||||||||||||||||
| Referenced Obligation | Notional Amount (000’s) | Rates Received (Paid) | Termination Date | Credit 2017(a) | Upfront Payments Made (Received) | Unrealized Gain (Loss) | ||||||||||||||||||
Protection Sold: |
| |||||||||||||||||||||||
CDX North America High Yield Index | $ | 117,800 | 5.000 | % | 06/20/22 | 3.390 | % | $ | 8,114,731 | $ | 193,406 | |||||||||||||
CDX North America Investment Grade Index | 9,550 | 1.000 | 06/20/22 | 0.605 | 143,124 | 37,078 | ||||||||||||||||||
iTraxx Europe Crossover Index | 46,200 | 5.000 | 06/20/22 | 2.475 | 4,719,712 | 1,420,504 | ||||||||||||||||||
iTraxx Europe Index | 9,650 | 1.000 | 06/20/22 | 0.563 | 145,552 | 95,016 | ||||||||||||||||||
| TOTAL | $ | 13,123,119 | $ | 1,746,004 | ||||||||||||||||||||
| (a) | Credit spread on the referenced obligation, together with the period of expiration, are indicators of payment/performance risk. The likelihood of a credit event occurring which would require a fund or its counterparty to make a payment or otherwise be required to perform under the swap contract is generally greater as the credit spread and term of the swap contract increase. |
| 28 | The accompanying notes are an integral part of these financial statements. |
GOLDMAN SACHS ABSOLUTE RETURN TRACKER FUND
| ADDITIONAL INVESTMENT INFORMATION (continued) |
OVER THE COUNTER TOTAL RETURN SWAP CONTRACTS
| Counterparty | Referenced Obligation | Notional Amount (000’s) | Rate Received (Paid) | Termination Date | Unrealized Gain (Loss)(a) | |||||||||||||
Deutsche Bank AG | Alerian MLP Index Total Return(b) | $ | 11,548 | (1.170 | )% | 07/27/17 | $ | (663,270 | ) | |||||||||
Deutsche Bank AG | Russell Top 200 Growth Index Total Return(b) | 12,429 | 1.186 | 11/24/17 | (277,527 | ) | ||||||||||||
Deutsche Bank AG | Russell Top 200 Growth Index Total Return(b) | 5,502 | 1.296 | 11/24/17 | 76,900 | |||||||||||||
Deutsche Bank AG | Russell Top 200 Value Index Total Return(b) | 5,438 | (1.296 | ) | 11/24/17 | 11,851 | ||||||||||||
Deutsche Bank AG | Russell Top 200 Value Index Total Return(b) | 13,051 | (1.186 | ) | 11/24/17 | 368,496 | ||||||||||||
JPMorgan Chase Bank NA | Bloomberg Roll Select Commodity Total Return Index(c) | 1,590 | 0.000 | 08/22/17 | 79,930 | |||||||||||||
| TOTAL | $ | (403,620 | ) | |||||||||||||||
| (a) | There are no upfront payments on the swap contracts listed above, therefore the unrealized gains (losses) on the swap contracts are equal to their market value. |
| (b) | The Fund receives quarterly payments based on any positive monthly return of the Referenced Obligation. The Fund makes payments on any negative monthly return of such Referenced Obligation. |
| (c) | The Fund receives weekly payments based on any positive weekly return of the Referenced Obligation. The Fund makes payments on any negative weekly return of such Referenced Obligation. |
WRITTEN OPTIONS CONTRACTS — At June 30, 2017, the Fund had the following written options:
| Put Options | Number of Contracts | Exercise Price | Expiration Month | Value | ||||||||||
S&P 500 Index | 54 | $ | 2,125 | July 2017 | $ | (3,240 | ) | |||||||
| 52 | 2,150 | July 2017 | (3,796 | ) | ||||||||||
| 51 | 2,175 | July 2017 | (4,182 | ) | ||||||||||
| 146 | 2,200 | July 2017 | (20,280 | ) | ||||||||||
| 48 | 2,250 | July 2017 | (8,544 | ) | ||||||||||
| 46 | 2,300 | July 2017 | (13,340 | ) | ||||||||||
| 45 | 2,325 | July 2017 | (13,500 | ) | ||||||||||
| 44 | 2,350 | July 2017 | (24,640 | ) | ||||||||||
| 44 | 2,125 | August 2017 | (12,100 | ) | ||||||||||
| 43 | 2,150 | August 2017 | (13,416 | ) | ||||||||||
| 42 | 2,175 | August 2017 | (16,002 | ) | ||||||||||
| 41 | 2,200 | August 2017 | (17,630 | ) | ||||||||||
| 40 | 2,225 | August 2017 | (22,400 | ) | ||||||||||
| 40 | 2,250 | August 2017 | (27,000 | ) | ||||||||||
| 39 | 2,275 | August 2017 | (31,395 | ) | ||||||||||
| 38 | 2,300 | August 2017 | (37,240 | ) | ||||||||||
| 37 | 2,325 | August 2017 | (45,325 | ) | ||||||||||
| 36 | 2,350 | August 2017 | (56,160 | ) | ||||||||||
| 36 | 2,375 | August 2017 | (70,560 | ) | ||||||||||
| 61 | 2,200 | September 2017 | (53,375 | ) | ||||||||||
| 60 | 2,225 | September 2017 | (60,900 | ) | ||||||||||
| 59 | 2,250 | September 2017 | (74,340 | ) | ||||||||||
| 57 | 2,275 | September 2017 | (78,090 | ) | ||||||||||
| 56 | 2,300 | September 2017 | (92,792 | ) | ||||||||||
| 55 | 2,325 | September 2017 | (108,625 | ) | ||||||||||
| 54 | 2,350 | September 2017 | (125,820 | ) | ||||||||||
| 53 | 2,375 | September 2017 | (159,795 | ) | ||||||||||
| 52 | 2,400 | September 2017 | (189,280 | ) | ||||||||||
| 51 | 2,425 | September 2017 | (221,850 | ) | ||||||||||
| Total (Premiums Received $3,644,132) | 1,480 | $ | (1,605,617 | ) | ||||||||||
| The accompanying notes are an integral part of these financial statements. | 29 |
GOLDMAN SACHS ABSOLUTE RETURN TRACKER FUND
Consolidated Schedule of Investments (continued)
June 30, 2017 (Unaudited)
| ADDITIONAL INVESTMENT INFORMATION (continued) |
For the six months ended June 30, 2017, the Fund had the following written options activity:
Number of Contracts | Premiums Received | |||||||
Contracts Outstanding December 31, 2016 | 1,058 | $ | 2,908,757 | |||||
Contracts written | 2,892 | 7,176,917 | ||||||
Contracts bought to close | (37 | ) | (104,786 | ) | ||||
Contracts expired | (2,433 | ) | (6,336,756 | ) | ||||
Contracts Outstanding June 30, 2017 | 1,480 | $ | 3,644,132 | |||||
| 30 | The accompanying notes are an integral part of these financial statements. |
GOLDMAN SACHS COMMODITY STRATEGY FUND
Consolidated Schedule of Investments
June 30, 2017 (Unaudited)
| Principal Amount | Interest Rate | Maturity Date | Value | |||||||||||
| Mortgage-Backed Securities – 4.8% | ||||||||||||||
| FHLMC – 2.5% | ||||||||||||||
| $ | 507 | 5.000 | % | 01/01/18 | $ | 511 | ||||||||
| 6,548 | 5.000 | 02/01/18 | 6,601 | |||||||||||
| 5,500 | 5.000 | 03/01/18 | 5,553 | |||||||||||
| 3,449 | 5.000 | 04/01/18 | 3,487 | |||||||||||
| 2,616 | 5.000 | 05/01/18 | 2,645 | |||||||||||
| 2,403 | 5.000 | 06/01/18 | 2,433 | |||||||||||
| 5,866 | 5.000 | 07/01/18 | 5,947 | |||||||||||
| 899 | 5.000 | 08/01/18 | 913 | |||||||||||
| 1,262 | 5.000 | 10/01/18 | 1,283 | |||||||||||
| 1,933 | 5.000 | 11/01/18 | 1,967 | |||||||||||
| 295 | 5.000 | 02/01/19 | 302 | |||||||||||
| 47,815 | 5.500 | 01/01/20 | 49,296 | |||||||||||
| 59,316 | 5.000 | 11/01/25 | 64,389 | |||||||||||
| 120,678 | 5.000 | 08/01/28 | 130,998 | |||||||||||
| 15,741 | 5.000 | 01/01/33 | 17,197 | |||||||||||
| 1,298 | 5.000 | 03/01/33 | 1,412 | |||||||||||
| 7,899 | 5.000 | 04/01/33 | 8,594 | |||||||||||
| 1,794 | 5.000 | 05/01/33 | 1,951 | |||||||||||
| 5,032 | 5.000 | 06/01/33 | 5,474 | |||||||||||
| 30,622 | 5.000 | 07/01/33 | 33,315 | |||||||||||
| 42,940 | 5.000 | 08/01/33 | 46,733 | |||||||||||
| 3,931 | 5.000 | 09/01/33 | 4,277 | |||||||||||
| 9,048 | 5.000 | 10/01/33 | 9,844 | |||||||||||
| 22,529 | 5.000 | 11/01/33 | 24,511 | |||||||||||
| 10,711 | 5.000 | 12/01/33 | 11,652 | |||||||||||
| 10,166 | 5.000 | 01/01/34 | 11,060 | |||||||||||
| 30,424 | 5.000 | 02/01/34 | 33,140 | |||||||||||
| 14,311 | 5.000 | 03/01/34 | 15,637 | |||||||||||
| 19,343 | 5.000 | 04/01/34 | 21,135 | |||||||||||
| 36,756 | 5.000 | 05/01/34 | 39,997 | |||||||||||
| 443,460 | 5.000 | 06/01/34 | 482,754 | |||||||||||
| 5,857 | 5.000 | 11/01/34 | 6,400 | |||||||||||
| 124,902 | 5.000 | 04/01/35 | 135,885 | |||||||||||
| 2,187,075 | 5.000 | 07/01/35 | 2,389,676 | |||||||||||
| 12,325 | 5.000 | 11/01/35 | 13,409 | |||||||||||
| 87,371 | 5.000 | 03/01/36 | 95,779 | |||||||||||
| 37,683 | 5.000 | 03/01/37 | 41,273 | |||||||||||
| 94,343 | 5.000 | 12/01/37 | 103,341 | |||||||||||
| 177,911 | 5.000 | 02/01/38 | 193,710 | |||||||||||
| 459,157 | 5.000 | 03/01/38 | 499,929 | |||||||||||
| 234,129 | 5.000 | 07/01/38 | 254,919 | |||||||||||
| 222,067 | 5.000 | 11/01/38 | 241,786 | |||||||||||
| 520,082 | 5.000 | 12/01/38 | 569,595 | |||||||||||
| 289,485 | 5.000 | 01/01/39 | 315,191 | |||||||||||
| 67,542 | 5.000 | 02/01/39 | 73,540 | |||||||||||
| 1,683,909 | 7.000 | 02/01/39 | 1,949,753 | |||||||||||
| 475,971 | 5.000 | 06/01/41 | 521,089 | |||||||||||
|
| |||||||||||||
| 8,450,283 | ||||||||||||||
|
| |||||||||||||
| FNMA – 2.3% | ||||||||||||||
| 3,985 | 5.000 | 03/01/18 | 4,021 | |||||||||||
| 16,474 | 5.000 | 04/01/18 | 16,646 | |||||||||||
| 158 | 5.500 | 01/01/19 | 161 | |||||||||||
| 8,337 | 5.500 | 02/01/19 | 8,495 | |||||||||||
| 9,528 | 5.500 | 03/01/19 | 9,740 | |||||||||||
| 4,476 | 5.500 | 04/01/19 | 4,563 | |||||||||||
| 4,653 | 5.500 | 05/01/19 | 4,775 | |||||||||||
| 20,284 | 5.500 | 06/01/19 | 20,717 | |||||||||||
| 60,645 | 5.500 | 07/01/19 | 61,958 | |||||||||||
|
| |||||||||||||
| Mortgage-Backed Securities – (continued) | ||||||||||||||
| FNMA – (continued) | ||||||||||||||
| 58,343 | 5.500 | 08/01/19 | 59,682 | |||||||||||
| 52,738 | 5.500 | 09/01/19 | 54,295 | |||||||||||
| 14,348 | 5.500 | 10/01/19 | 14,753 | |||||||||||
| 18,364 | 5.500 | 11/01/19 | 18,904 | |||||||||||
| 27,305 | 5.500 | 12/01/19 | 28,097 | |||||||||||
| 2,265 | 5.500 | 01/01/20 | 2,343 | |||||||||||
| 894 | 5.500 | 06/01/20 | 914 | |||||||||||
| 332,193 | 5.500 | 07/01/20 | 342,746 | |||||||||||
| 7,072 | 6.000 | 03/01/34 | 8,009 | |||||||||||
| 26,134 | 6.000 | 08/01/34 | 29,644 | |||||||||||
| 118,799 | 6.000 | 08/01/35 | 135,382 | |||||||||||
| 114,787 | 6.000 | 09/01/35 | 131,041 | |||||||||||
| 72,459 | 6.000 | 10/01/35 | 82,688 | |||||||||||
| 203,860 | 6.000 | 11/01/35 | 232,626 | |||||||||||
| 738,085 | 6.000 | 03/01/36 | 841,619 | |||||||||||
| 5,904 | 6.000 | 06/01/36 | 6,736 | |||||||||||
| 1,378,281 | 6.000 | 09/01/36 | 1,549,117 | |||||||||||
| 229,127 | 6.000 | 12/01/36 | 260,852 | |||||||||||
| 20,751 | 6.000 | 02/01/37 | 23,647 | |||||||||||
| 2,267 | 6.000 | 04/01/37 | 2,572 | |||||||||||
| 6,048 | 6.000 | 05/01/37 | 6,891 | |||||||||||
| 102,132 | 6.000 | 06/01/37 | 116,358 | |||||||||||
| 94,649 | 6.000 | 07/01/37 | 107,398 | |||||||||||
| 353,321 | 6.000 | 08/01/37 | 401,007 | |||||||||||
| 81,928 | 6.000 | 09/01/37 | 92,959 | |||||||||||
| 20,032 | 6.000 | 10/01/37 | 22,727 | |||||||||||
| 113,680 | 5.000 | 11/01/37 | 124,867 | |||||||||||
| 71,307 | 6.000 | 11/01/37 | 81,291 | |||||||||||
| 2,763 | 6.000 | 12/01/37 | 3,162 | |||||||||||
| 355,396 | 6.000 | 01/01/38 | 402,944 | |||||||||||
| 63,907 | 6.000 | 03/01/38 | 73,051 | |||||||||||
| 13,409 | 6.000 | 04/01/38 | 15,233 | |||||||||||
| 25,607 | 6.000 | 05/01/38 | 29,084 | |||||||||||
| 2,096 | 6.000 | 09/01/38 | 2,391 | |||||||||||
| 100,389 | 6.000 | 10/01/38 | 114,572 | |||||||||||
| 4,234 | 6.000 | 12/01/38 | 4,807 | |||||||||||
| 3,496 | 6.000 | 01/01/39 | 3,966 | |||||||||||
| 968,259 | 7.000 | 03/01/39 | 1,121,368 | |||||||||||
| 13,322 | 4.000 | 08/01/39 | 14,066 | |||||||||||
| 38,279 | 4.500 | 02/01/40 | 41,056 | |||||||||||
| 4,324 | 6.000 | 04/01/40 | 4,906 | |||||||||||
| 188,156 | 6.000 | 06/01/40 | 213,494 | |||||||||||
| 415,017 | 6.000 | 05/01/41 | 472,173 | |||||||||||
| 294,206 | 5.000 | 07/01/41 | 322,627 | |||||||||||
| 188,483 | 4.500 | 08/01/41 | 203,178 | |||||||||||
|
| |||||||||||||
| 7,952,319 | ||||||||||||||
|
| |||||||||||||
| TOTAL MORTGAGE-BACKED SECURITIES | ||||||||||||||
| (Cost $16,154,440) | $ | 16,402,602 | ||||||||||||
|
| |||||||||||||
| Collateralized Mortgage Obligations – 9.1% | ||||||||||||||
| Agency Multi-Family(a) – 6.6% | ||||||||||||||
| | FHLMC Multifamily Structured Pass-Through Certificates | | ||||||||||||
| $ | 5,500,000 | 4.084 | % | 11/25/20 | $ | 5,860,364 | ||||||||
|
| |||||||||||||
| The accompanying notes are an integral part of these financial statements. | 31 |
GOLDMAN SACHS COMMODITY STRATEGY FUND
Consolidated Schedule of Investments (continued)
June 30, 2017 (Unaudited)
| Principal Amount | Interest Rate | Maturity Date | Value | |||||||||||
| Collateralized Mortgage Obligations – (continued) | ||||||||||||||
| Agency Multi-Family(a) – (continued) | ||||||||||||||
| | FHLMC Multifamily Structured Pass-Through Certificates | | ||||||||||||
| $ | 16,400,000 | 3.034 | % | 10/25/20 | $ | 16,924,087 | ||||||||
|
| |||||||||||||
| 22,784,451 | ||||||||||||||
|
| |||||||||||||
| Regular Floater(a)(b) – 0.9% | ||||||||||||||
FHLMC REMIC Series 3371, Class FA | ||||||||||||||
| 249,755 | 1.759 | 09/15/37 | 252,158 | |||||||||||
NCUA Guaranteed Notes Trust Series 2010-R1, Class 1A | ||||||||||||||
| 403,555 | 1.534 | 10/07/20 | 404,233 | |||||||||||
NCUA Guaranteed Notes Trust Series 2010-R2, Class 1A | ||||||||||||||
| 504,591 | 1.454 | 11/06/17 | 504,591 | |||||||||||
NCUA Guaranteed Notes Trust Series 2011-R2, Class 1A | ||||||||||||||
| 1,341,958 | 1.484 | 02/06/20 | 1,343,111 | |||||||||||
NCUA Guaranteed Notes Trust Series 2011-R3, Class 1A | ||||||||||||||
| 808,729 | 1.517 | 03/11/20 | 809,455 | |||||||||||
NCUA Guaranteed Notes Trust Series 2011-R4, Class 1A | ||||||||||||||
| 126,159 | 1.464 | 03/06/20 | 126,159 | |||||||||||
|
| |||||||||||||
| 3,439,707 | ||||||||||||||
|
| |||||||||||||
| Sequential Fixed Rate – 1.6% | ||||||||||||||
FHLMC REMIC Series 2755, Class ZA(b) | ||||||||||||||
| 576,483 | 5.000 | 02/15/34 | 632,823 | |||||||||||
FHLMC REMIC Series 4273, Class PD(b) | ||||||||||||||
| 1,634,873 | 6.500 | 11/15/43 | 1,884,396 | |||||||||||
FNMA REMIC Series 2012-111, Class B | ||||||||||||||
| 511,623 | 7.000 | 10/25/42 | 589,880 | |||||||||||
FNMA REMIC Series 2012-153, Class B | ||||||||||||||
| 1,771,610 | 7.000 | 07/25/42 | 2,050,601 | |||||||||||
|
| |||||||||||||
| 5,157,700 | ||||||||||||||
|
| |||||||||||||
| TOTAL COLLATERALIZED MORTGAGE OBLIGATIONS | ||||||||||||||
| (Cost $31,483,983) | $ | 31,381,858 | ||||||||||||
|
| |||||||||||||
| Asset-Backed Securities(a)(b) – 0.1% | ||||||||||||||
| Home Equity – 0.1% | ||||||||||||||
GMACM Home Equity Loan Trust Series 2007-HE3, Class 1A1 | ||||||||||||||
| $ | 33,885 | 7.000 | % | 09/25/37 | $ | 34,408 | ||||||||
GMACM Home Equity Loan Trust Series 2007-HE3, Class 2A1 | ||||||||||||||
| 88,471 | 6.809 | 09/25/37 | 91,162 | |||||||||||
NCUA Guaranteed Notes Trust Series 2010-A1, Class A | ||||||||||||||
| 279,599 | 1.446 | 12/07/20 | 279,778 | |||||||||||
|
| |||||||||||||
| 405,348 | ||||||||||||||
|
| |||||||||||||
| TOTAL ASSET-BACKED SECURITIES | ||||||||||||||
| (Cost $402,184) | $ | 405,348 | ||||||||||||
|
| |||||||||||||
| U.S. Treasury Obligations – 25.7% | ||||||||||||||
U.S. Treasury Bonds | ||||||||||||||
| $ | 1,100,000 | 2.750 | % | 11/15/42 | $ | 1,087,460 | ||||||||
| 2,000,000 | 3.625 | 02/15/44 | 2,305,020 | |||||||||||
| 7,700,000 | 3.000 | (c) | 11/15/44 | 7,948,249 | ||||||||||
| 5,170,000 | 3.000 | 05/15/45 | 5,329,857 | |||||||||||
| 2,220,000 | 3.000 | 11/15/45 | 2,287,488 | |||||||||||
|
| |||||||||||||
| U.S. Treasury Obligations – (continued) | ||||||||||||||
U.S. Treasury Bonds – (continued) | ||||||||||||||
| 1,350,000 | 2.875 | 11/15/46 | 1,357,897 | |||||||||||
| 580,000 | 3.000 | 05/15/47 | 598,821 | |||||||||||
U.S. Treasury Inflation Indexed Notes (TIPS) | ||||||||||||||
| 4,548,583 | 0.125 | 04/15/18 | 4,534,391 | |||||||||||
U.S. Treasury Notes | ||||||||||||||
| 7,100,000 | 0.875 | 05/31/18 | 7,074,582 | |||||||||||
| 13,100,000 | 1.625 | 06/30/20 | 13,125,545 | |||||||||||
| 9,200,000 | 1.750 | 12/31/20 | 9,228,980 | |||||||||||
| 4,280,000 | 1.375 | 04/30/21 | 4,225,815 | |||||||||||
| 6,600,000 | 2.250 | 04/30/21 | 6,728,965 | |||||||||||
| 2,720,000 | 1.125 | 06/30/21 | 2,654,992 | |||||||||||
| 6,620,000 | 1.125 | 07/31/21 | 6,453,242 | |||||||||||
| 5,800,000 | 1.750 | 09/30/22 | 5,747,916 | |||||||||||
| 3,700,000 | 1.875 | 10/31/22 | 3,687,198 | |||||||||||
| 770,000 | 2.250 | 01/31/24 | 777,292 | |||||||||||
| 1,280,000 | 2.000 | 04/30/24 | 1,270,349 | |||||||||||
| 910,000 | 2.000 | 05/31/24 | 902,611 | |||||||||||
| 1,620,000 | 2.000 | 06/30/24 | 1,605,695 | |||||||||||
|
| |||||||||||||
| TOTAL U.S. TREASURY OBLIGATIONS | ||||||||||||||
| (Cost $88,337,697) | $ | 88,932,365 | ||||||||||||
|
| |||||||||||||
| Shares | Distribution Rate | Value | ||||||||
| Investment Company(a)(d) – 44.1% | ||||||||||
| | Goldman Sachs Financial Square Government Fund – | | ||||||||
| 152,438,772 | 0.845 | % | $ | 152,438,772 | ||||||
| (Cost $152,438,772) | ||||||||||
|
| |||||||||
| TOTAL INVESTMENTS – 83.8% | ||||||||||
| (Cost $288,817,076) | $ | 289,560,945 | ||||||||
|
| |||||||||
| | OTHER ASSETS IN EXCESS OF LIABILITIES – 16.2% |
| 55,866,214 | |||||||
|
| |||||||||
| NET ASSETS – 100.0% | $ | 345,427,159 | ||||||||
|
| |||||||||
| The percentage shown for each investment category reflects the value of investments in that category as a percentage of net assets. | ||
(a) | Variable rate security. Interest rate or distribution rate disclosed is that which is in effect on June 30, 2017. | |
(b) | Securities with “Call” features. Maturity dates disclosed are the final maturity dates. | |
(c) | All or a portion of security is segregated as collateral for initial margin requirements on futures transactions. | |
(d) | Represents an affiliated issuer. | |
| ||
Investment Abbreviations: | ||
FHLMC | —Federal Home Loan Mortgage Corp. | |
FNMA | —Federal National Mortgage Association | |
LIBOR | —London Interbank Offered Rate | |
REMIC | —Real Estate Mortgage Investment Conduit | |
TIPS | —Treasury Inflation-Protected Securities | |
| ||
| 32 | The accompanying notes are an integral part of these financial statements. |
GOLDMAN SACHS COMMODITY STRATEGY FUND
| ADDITIONAL INVESTMENT INFORMATION |
FUTURES CONTRACTS — At June 30, 2017, the Fund had the following futures contracts:
| Type | Number of Contracts Long (Short) | Expiration Date | Current Value | Unrealized Gain (Loss) | ||||||||||
90 Day Eurodollar | (49 | ) | December 2018 | $ | (12,029,500 | ) | $ | (16,061 | ) | |||||
U.S. Long Bonds | (15 | ) | September 2017 | (2,305,313 | ) | (22,270 | ) | |||||||
U.S. Ultra Long Treasury Bonds | (155 | ) | September 2017 | (25,710,625 | ) | (414,588 | ) | |||||||
2 Year U.S. Treasury Notes | (131 | ) | September 2017 | (28,310,328 | ) | 34,056 | ||||||||
5 Year U.S. Treasury Notes | (792 | ) | September 2017 | (93,326,063 | ) | 193,560 | ||||||||
10 Year U.S. Treasury Notes | 204 | September 2017 | 25,608,375 | (69,404 | ) | |||||||||
| TOTAL | $ | (294,707 | ) | |||||||||||
SWAP CONTRACTS — At June 30, 2017, the Fund had the following swap contracts:
CENTRALLY CLEARED INTEREST RATE SWAP CONTRACTS
| Rates Exchanged | Market Value | |||||||||||||||||
| Notional Amount (000’s)(a) | Termination Date | Payments Received | Payments Made | Upfront Payments Made (Received) | Unrealized Gain (Loss) | |||||||||||||
| $ | 26,470 | 12/20/19 | 2.250% | 3 Month LIBOR | $ | 69,206 | $ | 25,346 | ||||||||||
| 1,000 | 07/03/23 | 3 Month LIBOR | 2.143% | 11 | 289 | |||||||||||||
| 2,360 | 07/03/28 | 2.378 | 3 Month LIBOR | 38 | (5,469 | ) | ||||||||||||
| 3,830 | 12/20/28 | 3 Month LIBOR | 2.790 | (2,035 | ) | (110,745 | ) | |||||||||||
| 600 | 09/20/47 | 3 Month LIBOR | 2.500 | (11,793 | ) | 17,100 | ||||||||||||
| 1,000 | 07/03/48 | 3 Month LIBOR | 2.560 | 36 | 3,904 | |||||||||||||
| TOTAL | $ | 55,463 | $ | (69,575 | ) | |||||||||||||
| (a) | Represents forward starting interest rate swaps whose effective dates of commencement of accruals and cash flows occur subsequent to June 30, 2017. |
OVER THE COUNTER TOTAL RETURN SWAP CONTRACTS(a)
| Counterparty | Referenced Obligation | Notional Amount (000’s) | Rate Received (Paid) | Termination Date | Unrealized Gain (Loss)(b) | |||||||||||||
Macquarie Bank Ltd. | S&P GSCI Energy 1 Month Forward Index | $ | 99,181 | (0.15 | )% | 08/15/17 | $ | (1,647,975 | ) | |||||||||
Merrill Lynch International | S&P GSCI Energy 1 Month Forward Index | 119,359 | (0.15 | ) | 11/22/17 | (2,308,348 | ) | |||||||||||
Societe Generale SA | S&P GSCI Energy 1 Month Forward Index | 100,193 | (0.13 | ) | 12/15/17 | 2,909,509 | ||||||||||||
UBS AG | S&P GSCI Energy 1 Month Forward Index | 35,143 | (0.15 | ) | 02/23/18 | (655,109 | ) | |||||||||||
| TOTAL | $ | (1,701,923 | ) | |||||||||||||||
| (a) | The Fund receives monthly payments based on any positive monthly return of the Referenced Obligation. The Fund makes payments on any negative monthly return of such Referenced Obligation. |
| (b) | There are no upfront payments on the swap contracts listed above, therefore the unrealized gains (losses) on the swap contracts are equal to their market value. |
| The accompanying notes are an integral part of these financial statements. | 33 |
GOLDMAN SACHS DYNAMIC ALLOCATION FUND
Consolidated Schedule of Investments
June 30, 2017 (Unaudited)
Shares | Description | Value | ||||||
| Common Stocks – 15.6% | ||||||||
| Automobiles & Components – 1.3% | ||||||||
| 25,700 | Bridgestone Corp. | $ | 1,111,051 | |||||
| 1,743 | Cie Generale des Etablissements Michelin | 231,983 | ||||||
| 992 | Continental AG | 214,599 | ||||||
| 82,000 | Mazda Motor Corp. | 1,152,009 | ||||||
| 11,210 | Peugeot SA | 223,412 | ||||||
| 32,700 | Subaru Corp. | 1,108,794 | ||||||
| 63,100 | Sumitomo Rubber Industries Ltd. | 1,068,631 | ||||||
|
| |||||||
| 5,110,479 | ||||||||
|
| |||||||
| Banks – 2.4% | ||||||||
| 110,496 | Banco de Sabadell SA | 224,810 | ||||||
| 129,000 | Bank of Kyoto Ltd. (The) | 1,222,412 | ||||||
| 3,178 | BNP Paribas SA | 228,793 | ||||||
| 21,493 | Commerzbank AG* | 256,646 | ||||||
| 14,623 | Credit Agricole SA | 235,553 | ||||||
| 202,300 | Gunma Bank Ltd. (The) | 1,218,195 | ||||||
| 89,000 | Japan Post Bank Co. Ltd. | 1,142,506 | ||||||
| 282,800 | Mebuki Financial Group, Inc. | 1,055,902 | ||||||
| 631,600 | Mizuho Financial Group, Inc. | 1,158,022 | ||||||
| 15,067 | Regions Financial Corp. | 220,581 | ||||||
| 4,264 | Societe Generale SA | 229,939 | ||||||
| 30,200 | Sumitomo Mitsui Financial Group, Inc. | 1,179,143 | ||||||
| 32,700 | Sumitomo Mitsui Trust Holdings, Inc. | 1,174,561 | ||||||
|
| |||||||
| 9,547,063 | ||||||||
|
| |||||||
| Capital Goods – 0.9% | ||||||||
| 1,206 | Acuity Brands, Inc. | 245,156 | ||||||
| 2,011 | Carlisle Cos., Inc. | 191,849 | ||||||
| 206,000 | Fuji Electric Co. Ltd. | 1,089,589 | ||||||
| 12,774 | Leonardo SpA | 212,684 | ||||||
| 77,000 | Mitsubishi Electric Corp. | 1,113,620 | ||||||
| 2,931 | Schneider Electric SE* | 225,246 | ||||||
| 1,244 | Snap-on, Inc. | 196,552 | ||||||
| 3,279 | WESCO International, Inc.* | 187,887 | ||||||
| 1,166 | WW Grainger, Inc. | 210,498 | ||||||
|
| |||||||
| 3,673,081 | ||||||||
|
| |||||||
| Commercial & Professional Services – 0.1% | ||||||||
| 3,905 | Randstad Holding NV | 227,666 | ||||||
| 4,360 | Robert Half International, Inc. | 208,975 | ||||||
|
| |||||||
| 436,641 | ||||||||
|
| |||||||
| Consumer Durables & Apparel – 1.4% | ||||||||
| 782 | Christian Dior SE | 223,603 | ||||||
| 67,300 | Iida Group Holdings Co. Ltd. | 1,123,338 | ||||||
| 5,880 | Michael Kors Holdings Ltd.* | 213,150 | ||||||
| 84,600 | Panasonic Corp. | 1,152,697 | ||||||
| 2,381 | Pandora A/S | 222,206 | ||||||
| 1,927 | PVH Corp. | 220,641 | ||||||
| 2,932 | Ralph Lauren Corp. | 216,382 | ||||||
| 87,600 | Sega Sammy Holdings, Inc. | 1,181,042 | ||||||
| 61,900 | Sekisui Chemical Co. Ltd. | 1,110,699 | ||||||
|
| |||||||
| 5,663,758 | ||||||||
|
| |||||||
| Common Stocks – (continued) | ||||||||
| Diversified Financials – 0.0% | ||||||||
| 5,334 | Legg Mason, Inc. | 203,545 | ||||||
|
| |||||||
| Energy – 0.6% | ||||||||
| 38,200 | Idemitsu Kosan Co. Ltd. | 1,086,740 | ||||||
| 121,000 | Inpex Corp. | 1,168,311 | ||||||
|
| |||||||
| 2,255,051 | ||||||||
|
| |||||||
| Food & Staples Retailing – 0.5% | ||||||||
| 8,594 | Carrefour SA(a) | 217,273 | ||||||
| 2,574 | CVS Health Corp. | 207,104 | ||||||
| 10,282 | Koninklijke Ahold Delhaize NV | 196,255 | ||||||
| 9,600 | Tsuruha Holdings, Inc. | 1,020,132 | ||||||
| 5,773 | Whole Foods Market, Inc. | 243,101 | ||||||
|
| |||||||
| 1,883,865 | ||||||||
|
| |||||||
| Food, Beverage & Tobacco – 0.2% | ||||||||
| 10,956 | Flowers Foods, Inc. | 189,648 | ||||||
| 5,937 | Hormel Foods Corp. | 202,511 | ||||||
| 3,480 | Tyson Foods, Inc. Class A | 217,953 | ||||||
|
| |||||||
| 610,112 | ||||||||
|
| |||||||
| Health Care Equipment & Services – 0.3% | ||||||||
| 3,087 | DaVita, Inc.* | 199,914 | ||||||
| 2,334 | Fresenius Medical Care AG & Co. KGaA | 225,223 | ||||||
| 1,449 | Laboratory Corp. of America Holdings* | 223,349 | ||||||
| 3,692 | MEDNAX, Inc.* | 222,886 | ||||||
| 1,855 | Quest Diagnostics, Inc. | 206,202 | ||||||
|
| |||||||
| 1,077,574 | ||||||||
|
| |||||||
| Household & Personal Products – 0.1% | ||||||||
| 1,582 | Henkel AG & Co. KGaA (Preference)(b) | 218,148 | ||||||
| 3,596 | Nu Skin Enterprises, Inc. Class A | 225,973 | ||||||
|
| |||||||
| 444,121 | ||||||||
|
| |||||||
| Insurance – 0.3% | ||||||||
| 45,497 | Aegon NV | 232,850 | ||||||
| 91,200 | Japan Post Holdings Co. Ltd. | 1,134,471 | ||||||
|
| |||||||
| 1,367,321 | ||||||||
|
| |||||||
| Materials – 1.6% | ||||||||
| 2,649 | Akzo Nobel NV | 230,380 | ||||||
| 114,000 | Asahi Kasei Corp. | 1,229,868 | ||||||
| 93,800 | Daicel Corp. | 1,172,385 | ||||||
| 144,500 | Mitsubishi Chemical Holdings Corp. | 1,203,939 | ||||||
| 2,714 | Reliance Steel & Aluminum Co. | 197,606 | ||||||
| 206,000 | Sumitomo Chemical Co. Ltd. | 1,190,638 | ||||||
| 121,000 | Tosoh Corp. | 1,247,052 | ||||||
|
| |||||||
| 6,471,868 | ||||||||
|
| |||||||
| Media – 0.0% | ||||||||
| 14,006 | TEGNA, Inc. | 201,826 | ||||||
|
| |||||||
| Pharmaceuticals, Biotechnology & Life Sciences – 1.0% | ||||||||
| 6,108 | Akorn, Inc.* | 204,862 | ||||||
| 88,000 | Astellas Pharma, Inc. | 1,078,590 | ||||||
| 1,650 | Bayer AG (Registered) | 213,857 | ||||||
|
| |||||||
| 34 | The accompanying notes are an integral part of these financial statements. |
GOLDMAN SACHS DYNAMIC ALLOCATION FUND
Shares | Description | Value | ||||||
| Common Stocks – (continued) | ||||||||
| Pharmaceuticals, Biotechnology & Life Sciences – (continued) | ||||||||
| 784 | Biogen, Inc.* | $ | 212,746 | |||||
| 3,529 | Bioverativ, Inc.* | 212,340 | ||||||
| 3,097 | Gilead Sciences, Inc. | 219,206 | ||||||
| 19,700 | Kaken Pharmaceutical Co. Ltd. | 1,075,666 | ||||||
| 5,118 | Novo Nordisk A/S Class B | 219,906 | ||||||
| 6,269 | Pfizer, Inc. | 210,576 | ||||||
| 822 | Roche Holding AG | 210,033 | ||||||
| 1,609 | United Therapeutics Corp.* | 208,736 | ||||||
|
| |||||||
| 4,066,518 | ||||||||
|
| |||||||
| Real Estate – 0.3% | ||||||||
| 191,700 | Leopalace21 Corp. | 1,192,510 | ||||||
|
| |||||||
| Retailing – 0.9% | ||||||||
| 18,700 | ABC-Mart, Inc. | 1,102,032 | ||||||
| 5,093 | AutoNation, Inc.*(a) | 214,721 | ||||||
| 5,821 | Bed Bath & Beyond, Inc. | 176,958 | ||||||
| 3,521 | Foot Locker, Inc. | 173,515 | ||||||
| 9,021 | GameStop Corp. Class A | 194,944 | ||||||
| 9,004 | Hennes & Mauritz AB Class B | 224,488 | ||||||
| 8,700 | Shimamura Co. Ltd. | 1,066,550 | ||||||
| 22,286 | Staples, Inc. | 224,420 | ||||||
| 10,903 | Urban Outfitters, Inc.* | 202,142 | ||||||
|
| |||||||
| 3,579,770 | ||||||||
|
| |||||||
| Semiconductors & Semiconductor Equipment – 0.1% | ||||||||
| 5,581 | Intel Corp. | 188,303 | ||||||
| 3,445 | QUALCOMM, Inc. | 190,233 | ||||||
|
| |||||||
| 378,536 | ||||||||
|
| |||||||
| Software & Services – 0.8% | ||||||||
| 2,158 | Capgemini SE | 222,927 | ||||||
| 51,000 | DeNA Co. Ltd. | 1,146,248 | ||||||
| 151,000 | Fujitsu Ltd. | 1,116,836 | ||||||
| 3,828 | Gemalto NV | 229,592 | ||||||
| 4,311 | Manhattan Associates, Inc.* | 207,187 | ||||||
| 2,677 | Synopsys, Inc.* | 195,234 | ||||||
| 7,423 | Teradata Corp.* | 218,904 | ||||||
|
| |||||||
| 3,336,928 | ||||||||
|
| |||||||
| Technology Hardware & Equipment – 1.8% | ||||||||
| 2,683 | Arrow Electronics, Inc.* | 210,401 | ||||||
| 16,006 | Brocade Communications Systems, Inc. | 201,836 | ||||||
| 47,500 | Brother Industries Ltd. | 1,100,244 | ||||||
| 6,385 | Cisco Systems, Inc. | 199,850 | ||||||
| 1,564 | F5 Networks, Inc.* | 198,722 | ||||||
| 30,300 | FUJIFILM Holdings Corp. | 1,092,541 | ||||||
| 11,818 | Hewlett Packard Enterprise Co. | 196,061 | ||||||
| 181,000 | Hitachi Ltd. | 1,115,990 | ||||||
| 6,724 | Juniper Networks, Inc. | 187,465 | ||||||
| 139,500 | Konica Minolta, Inc. | 1,163,828 | ||||||
| 5,203 | NetApp, Inc. | 208,380 | ||||||
| 17,800 | TDK Corp. | 1,176,614 | ||||||
| 7,263 | Xerox Corp. | 208,666 | ||||||
|
| |||||||
| 7,260,598 | ||||||||
|
| |||||||
| Common Stocks – (continued) | ||||||||
| Telecommunication Services – 0.3% | ||||||||
| 45,500 | NTT DOCOMO, Inc. | 1,076,106 | ||||||
| 241,626 | Telecom Italia SpA* | 223,546 | ||||||
|
| |||||||
| 1,299,652 | ||||||||
|
| |||||||
| Transportation – 0.6% | ||||||||
| 3,015 | CH Robinson Worldwide, Inc. | 207,070 | ||||||
| 11,337 | Deutsche Lufthansa AG (Registered) | 258,365 | ||||||
| 6,119 | Deutsche Post AG (Registered) | 229,697 | ||||||
| 29,428 | International Consolidated Airlines Group SA | 233,814 | ||||||
| 38,200 | Japan Airlines Co. Ltd. | 1,183,271 | ||||||
| 8,918 | JetBlue Airways Corp.* | 203,598 | ||||||
|
| |||||||
| 2,315,815 | ||||||||
|
| |||||||
| Utilities – 0.1% | ||||||||
| 42,543 | Enel SpA | 228,179 | ||||||
|
| |||||||
| TOTAL COMMON STOCKS | ||||||||
| (Cost $58,590,980) | $ | 62,604,811 | ||||||
|
| |||||||
| Principal Amount | Interest Rate | Maturity Date | Value | |||||||
| U.S. Treasury Obligation(c) – 3.0% | ||||||||||
U.S. Treasury Inflation Indexed Notes (TIPS) |
| |||||||||
| $12,366,903 | 0.375% | 01/15/27 | $ | 12,156,912 | ||||||
| (Cost $12,337,542) | ||||||||||
| ||||||||||
| Shares | Distribution Rate | Value | ||||||
| Investment Company(d)(e) – 72.9% | ||||||||
Goldman Sachs Financial Square Government Fund – Institutional Shares |
| |||||||
| 293,105,652 | 0.845 | % | $ | 293,105,652 | ||||
| (Cost $293,105,652) | ||||||||
| ||||||||
TOTAL INVESTMENTS BEFORE SECURITIES LENDING REINVESTMENT VEHICLE |
| |||||||
| (Cost $364,034,174) | $ | 367,867,375 | ||||||
| ||||||||
| Securities Lending Reinvestment Vehicle(d)(e) – 0.0% | ||||||||
Goldman Sachs Financial Square Government Fund – Institutional Shares |
| |||||||
| 163,400 | 0.845 | % | $ | 163,400 | ||||
| (Cost $163,400) | ||||||||
| ||||||||
| TOTAL INVESTMENTS – 91.5% | ||||||||
| (Cost $364,197,574) | $ | 368,030,775 | ||||||
| ||||||||
OTHER ASSETS IN EXCESS OF |
| 34,308,049 | ||||||
| ||||||||
| NET ASSETS – 100.0% | $ | 402,338,824 | ||||||
| ||||||||
| The accompanying notes are an integral part of these financial statements. | 35 |
GOLDMAN SACHS DYNAMIC ALLOCATION FUND
Consolidated Schedule of Investments (continued)
June 30, 2017 (Unaudited)
| The percentage shown for each investment category reflects the value of investments in that category as a percentage of net assets. | ||
* | Non-income producing security. | |
(a) | All or a portion of security is on loan. | |
(b) | Preference Shares are a special type of equity investment that shares in the earnings of the company, has limited voting rights, and receives a greater dividend than applicable Common Shares. | |
(c) | All or a portion of security is segregated as collateral for initial margin requirements on futures transactions. | |
(d) | Variable rate security. Interest rate or distribution rate disclosed is that which is in effect on June 30, 2017. | |
(e) | Represents an affiliated issuer. | |
| ||
Investment Abbreviations: | ||
LIBOR | —London Interbank Offered Rate | |
TIPS | —Treasury Inflation-Protected Securities | |
Currency Abbreviations: | ||
CHF | —Swiss Franc | |
DKK | —Denmark krone | |
EUR | —Euro Dollar | |
JPY | —Japanese Yen | |
NOK | —Norwegian Krone | |
SEK | —Swedish Krona | |
USD | —United States Dollar | |
| ||
| ADDITIONAL INVESTMENT INFORMATION |
FORWARD FOREIGN CURRENCY EXCHANGE CONTRACTS — At June 30, 2017, the Fund had the following forward foreign currency exchange contracts:
FORWARD FOREIGN CURRENCY EXCHANGE CONTRACTS WITH UNREALIZED GAIN
| Counterparty | Currency Purchased | Currency Sold | Settlement Date | Current Value | Unrealized Gain | |||||||||||||||||||
Morgan Stanley Co., Inc. | CHF | 10,000 | USD | 10,308 | 09/20/17 | $ | 10,480 | $ | 172 | |||||||||||||||
| DKK | 50,000 | USD | 7,532 | 09/20/17 | 7,714 | 182 | ||||||||||||||||||
| NOK | 100,000 | USD | 11,774 | 09/20/17 | 11,997 | 223 | ||||||||||||||||||
| SEK | 150,000 | USD | 17,234 | 09/20/17 | 17,885 | 651 | ||||||||||||||||||
| USD | 49,491,414 | JPY | 5,430,000,000 | 09/20/17 | 48,442,838 | 1,048,576 | ||||||||||||||||||
| TOTAL | $ | 1,049,804 | ||||||||||||||||||||||
FORWARD FOREIGN CURRENCY EXCHANGE CONTRACTS WITH UNREALIZED LOSS
| Counterparty | Currency Purchased | Currency Sold | Settlement Date | Current Value | Unrealized Loss | |||||||||||||||||||
Morgan Stanley Co., Inc. | JPY | 20,000,000 | USD | 179,690 | 09/20/17 | $ | 178,427 | $ | (1,263 | ) | ||||||||||||||
| USD | 2,293,155 | CHF | 2,200,000 | 09/20/17 | 2,305,846 | (12,691 | ) | |||||||||||||||||
| USD | 2,512,682 | DKK | 16,531,093 | 09/20/17 | 2,550,406 | (37,724 | ) | |||||||||||||||||
| USD | 7,951,201 | EUR | 7,040,000 | 09/20/17 | 8,074,001 | (122,800 | ) | |||||||||||||||||
| USD | 2,040,191 | NOK | 17,300,000 | 09/20/17 | 2,075,356 | (35,165 | ) | |||||||||||||||||
| USD | 2,269,237 | SEK | 19,650,000 | 09/20/17 | 2,342,838 | (73,601 | ) | |||||||||||||||||
| TOTAL | $ | (283,244 | ) | |||||||||||||||||||||
| 36 | The accompanying notes are an integral part of these financial statements. |
GOLDMAN SACHS DYNAMIC ALLOCATION FUND
| ADDITIONAL INVESTMENT INFORMATION (continued) |
FUTURES CONTRACTS — At June 30, 2017, the Fund had the following futures contracts:
| Type | Number of Contracts Long (Short) | Expiration Date | Current Value | Unrealized Gain (Loss) | ||||||||||
Amsterdam Index | 54 | July 2017 | $ | 6,247,789 | $ | (215,117 | ) | |||||||
CAC 40 Index | 130 | July 2017 | 7,596,954 | (172,170 | ) | |||||||||
CBOE Volatility Index | (83 | ) | July 2017 | (1,022,975 | ) | 48,352 | ||||||||
Cocoa Futures | (12 | ) | September 2017 | (232,800 | ) | 8,004 | ||||||||
Coffee ‘C’ Futures | (7 | ) | September 2017 | (329,963 | ) | 10,610 | ||||||||
Corn Futures | (31 | ) | September 2017 | (590,550 | ) | 8,043 | ||||||||
Cotton No. 2 Futures | 17 | December 2017 | 583,015 | (36,299 | ) | |||||||||
DAX Index | 30 | September 2017 | 10,553,466 | (336,300 | ) | |||||||||
Euro-BTP | 109 | September 2017 | 16,824,166 | 124,057 | ||||||||||
Euro-Bund | 38 | September 2017 | 7,025,433 | (115,414 | ) | |||||||||
Euro-OAT | 218 | September 2017 | 36,969,842 | (447,523 | ) | |||||||||
Feeder Cattle Futures | 11 | August 2017 | 813,588 | 18,007 | ||||||||||
FTSE 100 Index | 235 | September 2017 | 22,167,535 | (650,342 | ) | |||||||||
FTSE/MIB Index | 39 | September 2017 | 4,565,522 | (86,144 | ) | |||||||||
Gasoline RBOB Futures | (1 | ) | July 2017 | (63,575 | ) | 636 | ||||||||
Gold 100 oz. Futures | 1 | August 2017 | 124,230 | (3,378 | ) | |||||||||
Hang Seng Index | 25 | July 2017 | 4,096,248 | 7,625 | ||||||||||
IBEX 35 Index | 31 | July 2017 | 3,684,381 | (125,488 | ) | |||||||||
KC HRW Wheat Futures | (13 | ) | September 2017 | (344,175 | ) | (46,679 | ) | |||||||
Lean Hogs Futures | (6 | ) | August 2017 | (201,000 | ) | (6,813 | ) | |||||||
Live Cattle Futures | 8 | August 2017 | 372,160 | (21,509 | ) | |||||||||
LME Copper Futures | 1 | July 2017 | 148,075 | 9,873 | ||||||||||
LME Copper Futures | (1 | ) | July 2017 | (148,075 | ) | (9,527 | ) | |||||||
LME Nickel Futures | 4 | July 2017 | 224,520 | 8,775 | ||||||||||
LME Nickel Futures | (4 | ) | July 2017 | (224,520 | ) | (9,609 | ) | |||||||
LME Nickel Futures | 4 | August 2017 | 224,916 | 9,591 | ||||||||||
LME Primary Aluminum Futures | 15 | July 2017 | 716,438 | (748 | ) | |||||||||
LME Primary Aluminum Futures | (15 | ) | July 2017 | (716,438 | ) | (3,973 | ) | |||||||
LME Primary Aluminum Futures | 15 | August 2017 | 717,844 | 3,996 | ||||||||||
LME Zinc Futures | 3 | July 2017 | 206,756 | 14,843 | ||||||||||
LME Zinc Futures | (3 | ) | July 2017 | (206,756 | ) | (20,013 | ) | |||||||
LME Zinc Futures | 3 | August 2017 | 206,813 | 19,737 | ||||||||||
Long Gilt | 55 | September 2017 | 8,995,175 | (133,344 | ) | |||||||||
Low Sulphur Gas Oil Futures | (2 | ) | August 2017 | (87,200 | ) | (2,404 | ) | |||||||
mini MSCI Emerging Markets Index Futures | 378 | September 2017 | 19,056,870 | 96,524 | ||||||||||
Natural Gas Futures | (2 | ) | July 2017 | (60,700 | ) | 337 | ||||||||
NY Harbor ULSD Futures | (4 | ) | July 2017 | (249,161 | ) | (6,798 | ) | |||||||
OMX Stockholm 30 Index | 118 | July 2017 | 2,244,881 | (64,257 | ) | |||||||||
Russell 2000 Mini Index | (14 | ) | September 2017 | (990,010 | ) | 12,584 | ||||||||
S&P 500 E-Mini Index | 1,117 | September 2017 | 135,207,265 | (524,367 | ) | |||||||||
S&P/TSX 60 Index | 62 | September 2017 | 8,502,529 | (152,769 | ) | |||||||||
Silver Futures | (1 | ) | September 2017 | (83,135 | ) | 5,512 | ||||||||
Soybean Futures | (7 | ) | November 2017 | (334,163 | ) | (6,496 | ) | |||||||
SPI 200 Index | 40 | September 2017 | 4,341,821 | 22,089 | ||||||||||
Sugar #11 (World) Futures | (37 | ) | September 2017 | (572,286 | ) | (1,713 | ) | |||||||
TSE TOPIX Index | (165 | ) | September 2017 | (23,640,587 | ) | (98,876 | ) | |||||||
Wheat Futures | (9 | ) | September 2017 | (236,700 | ) | (32,765 | ) | |||||||
WTI Crude Oil Futures | (10 | ) | July 2017 | (460,400 | ) | 14,672 | ||||||||
10 Year Australian Government Bonds | (5 | ) | September 2017 | (496,745 | ) | 7,719 | ||||||||
10 Year Canadian Government Bonds | (36 | ) | September 2017 | (3,901,758 | ) | 112,367 | ||||||||
10 Year Japanese Government Bonds | 45 | September 2017 | 60,057,346 | (222,169 | ) | |||||||||
| TOTAL | $ | (2,989,051 | ) | |||||||||||
| The accompanying notes are an integral part of these financial statements. | 37 |
GOLDMAN SACHS DYNAMIC ALLOCATION FUND
Consolidated Schedule of Investments (continued)
June 30, 2017 (Unaudited)
| ADDITIONAL INVESTMENT INFORMATION (continued) |
SWAP CONTRACTS — At June 30, 2017, the Fund had the following swap contracts:
CENTRALLY CLEARED CREDIT DEFAULT SWAP CONTRACT
| Market Value | ||||||||||||||||||||||
| Referenced Obligation | Notional Amount (000’s) | Rates Received (Paid) | Termination Date | Credit Spread on June 30, 2017(a) | Upfront Payments Made (Received) | Unrealized Gain | ||||||||||||||||
Protection Sold: |
| |||||||||||||||||||||
| Markit CDX North America Investment Grade Index | $45,250 | 1.000 | % | 06/20/22 | 0.605 | % | $ | 757,638 | $ | 96,200 | ||||||||||||
| (a) | Credit spread on the referenced obligation, together with the period of expiration, are indicators of payment/performance risk. The likelihood of a credit event occurring which would require a fund to make a payment or otherwise be required to perform under the swap contract is generally greater as the credit spread and term of the swap contract increase. |
CENTRALLY CLEARED INTEREST RATE SWAP CONTRACT
| Rates Exchanged | Market Value | |||||||||||||||||
Notional (000’s)(a) | Termination Date | Payments Received | Payments Made | Upfront Made (Received) | Unrealized Gain (Loss) | |||||||||||||
| $ | 78,850 | 09/20/27 | 2.000 | % | 3 Month LIBOR | $ | (1,381,735 | ) | $ | (745,084 | ) | |||||||
| (a) | Represents forward starting interest rate swaps whose effective dates of commencement of accruals and cash flows occur subsequent to June 30, 2017. |
OVER THE COUNTER TOTAL RETURN SWAP CONTRACTS
| Counterparty | Referenced Obligation | Notional Amount (000’s) | Rate Received (Paid) | Termination Date | Unrealized Gain (Loss)(a) | |||||||||||||
Barclays Bank PLC | S&P GSCI Total Return Index(b) | $ | 4,851 | (0.050 | )% | 02/15/18 | $ | 120,957 | ||||||||||
Deutsche Bank AG | FTSE NAREIT Mortgage Index(c) | 10,457 | (1.289 | ) | 06/25/18 | (145,354 | ) | |||||||||||
JPMorgan Chase Bank NA | S&P GSCI Total Return Index(b) | 8,218 | — | 02/01/18 | (153,687 | ) | ||||||||||||
| TOTAL | $ | (178,084 | ) | |||||||||||||||
| (a) | There are no upfront payments on the swap contracts listed above, therefore the unrealized gains (losses) on the swap contracts are equal to their market value. |
| (b) | The Fund pays/receives monthly payments based on any positive monthly return of the Referenced Obligation. The Fund makes payments on any negative monthly return of such Referenced Obligation. |
| (c) | The Fund pays/receives quarterly payments based on any positive monthly return of the Referenced Obligation. The Fund makes payments on any negative monthly return of such Referenced Obligation. |
| 38 | The accompanying notes are an integral part of these financial statements. |
GOLDMAN SACHS MANAGED FUTURES STRATEGY FUND
Consolidated Schedule of Investments
June 30, 2017 (Unaudited)
Shares | Distribution Rate | Value | ||||
| Investment Company(a)(b) – 77.4% | ||||||
Goldman Sachs Financial Square Government Fund – Institutional Shares |
| |||||
| 91,639,677 | 0.845% | $ | 91,639,677 | |||
| ||||||
| TOTAL INVESTMENTS – 77.4% | ||||||
| (Cost $91,639,677) | $ | 91,639,677 | ||||
| ||||||
| OTHER ASSETS IN EXCESS OF LIABILITIES – 22.6% | 26,690,815 | |||||
| ||||||
| NET ASSETS – 100.0% | $ | 118,330,492 | ||||
| ||||||
| The percentage shown for each investment category reflects the value of investments in that category as a percentage of net assets. | ||
(a) | Represents an affiliated issuer. | |
(b) | Variable rate security. Interest rate or distribution rate disclosed is that which is in effect on June 30, 2017. | |
| ||
Investment Abbreviations: | ||
BA | — Banker Acceptance Rate | |
BUBOR | — Budapest Interbank Offered Rate | |
EURIBOR | — Euro Interbank Offered Rate | |
JIBAR | — Johannesburg Interbank Agreed Rate | |
LIBOR | — London Interbank Offered Rate | |
PRIBOR | — Prague Interbank Offered Rate | |
STIBOR | — Stockholm Interbank Offered Rate | |
TIIE | — Interbank Equilibrium Interest Rate | |
WIBOR | — Warsaw Interbank Offered Rate | |
Currency Abbreviations: | ||
AUD | —Australian Dollar | |
BRL | —Brazilian Real | |
CAD | —Canadian Dollar | |
CHF | —Swiss Franc | |
CLP | —Chilean Peso | |
COP | —Colombian Peso | |
CZK | —Czech Koruna | |
EUR | —Euro | |
GBP | —British Pound | |
HUF | —Hungarian Forint | |
IDR | —Indonesian Rupiah | |
INR | —Indian Rupee | |
JPY | —Japanese Yen | |
KRW | —South Korean Won | |
MXN | —Mexican Peso | |
MYR | —Malaysian Ringgit | |
NOK | —Norwegian Krone | |
NZD | —New Zealand Dollar | |
PLN | —Polish Zloty | |
RUB | —Russian Ruble | |
SEK | —Swedish Krona | |
TRY | —Turkish Lira | |
USD | —United States Dollar | |
ZAR | —South African Rand | |
| ||
| The accompanying notes are an integral part of these financial statements. | 39 |
GOLDMAN SACHS MANAGED FUTURES STRATEGY FUND
Consolidated Schedule of Investments (continued)
June 30, 2017 (Unaudited)
| ADDITIONAL INVESTMENT INFORMATION |
FORWARD FOREIGN CURRENCY EXCHANGE CONTRACTS — At June 30, 2017, the Fund had the following forward foreign currency exchange contracts:
FORWARD FOREIGN CURRENCY EXCHANGE CONTRACTS WITH UNREALIZED GAIN
| Counterparty | Currency Purchased | Currency Sold | Settlement Date | Current Value | Unrealized Gain | |||||||||||||||||||
Morgan Stanley Co., Inc. | AUD | 4,820,000 | USD | 3,644,151 | 09/20/17 | $ | 3,700,988 | $ | 56,837 | |||||||||||||||
| BRL | 2,860,000 | USD | 851,761 | 08/02/17 | 857,749 | 5,988 | ||||||||||||||||||
| CAD | 171,600 | USD | 132,214 | 07/05/17 | 132,326 | 112 | ||||||||||||||||||
| CAD | 452,000 | USD | 336,278 | 09/20/17 | 348,985 | 12,707 | ||||||||||||||||||
| CZK | 133,600,000 | USD | 5,741,315 | 09/20/17 | 5,871,884 | 130,569 | ||||||||||||||||||
| EUR | 43,000 | USD | 49,101 | 07/03/17 | 49,113 | 12 | ||||||||||||||||||
| EUR | 7,626,000 | USD | 8,602,695 | 09/20/17 | 8,746,068 | 143,373 | ||||||||||||||||||
| GBP | 231,000 | USD | 300,001 | 07/03/17 | 300,866 | 865 | ||||||||||||||||||
| GBP | 6,325,000 | USD | 8,180,971 | 09/20/17 | 8,257,928 | 76,957 | ||||||||||||||||||
| HUF | 1,436,000,000 | USD | 5,245,026 | 09/20/17 | 5,327,970 | 82,944 | ||||||||||||||||||
| MXN | 61,029,000 | USD | 3,284,660 | 09/20/17 | 3,321,395 | 36,735 | ||||||||||||||||||
| NOK | 15,400,000 | USD | 1,839,206 | 09/20/17 | 1,847,426 | 8,220 | ||||||||||||||||||
| NZD | 8,660,000 | USD | 6,237,794 | 09/20/17 | 6,336,910 | 99,116 | ||||||||||||||||||
| PLN | 16,950,000 | USD | 4,523,571 | 09/20/17 | 4,572,506 | 48,935 | ||||||||||||||||||
| SEK | 31,600,000 | USD | 3,675,896 | 09/20/17 | 3,767,617 | 91,721 | ||||||||||||||||||
| TRY | 2,050,000 | USD | 561,444 | 09/20/17 | 569,781 | 8,337 | ||||||||||||||||||
| USD | 776,935 | BRL | 2,560,000 | 07/05/17 | 772,737 | 4,198 | ||||||||||||||||||
| USD | 2,090,090 | COP | 6,380,000,000 | 09/20/17 | 2,072,033 | 18,057 | ||||||||||||||||||
| USD | 1,010,771 | EUR | 880,000 | 09/20/17 | 1,009,250 | 1,521 | ||||||||||||||||||
| USD | 6,468,438 | JPY | 717,554,000 | 09/20/17 | 6,401,537 | 66,901 | ||||||||||||||||||
| USD | 1,940,035 | KRW | 2,200,000,000 | 09/20/17 | 1,923,216 | 16,819 | ||||||||||||||||||
| USD | 824,750 | MXN | 14,988,000 | 09/20/17 | 815,695 | 9,055 | ||||||||||||||||||
| USD | 1,251,147 | RUB | 75,000,000 | 09/20/17 | 1,251,030 | 117 | ||||||||||||||||||
| USD | 181,119 | ZAR | 2,362,000 | 09/20/17 | 178,179 | 2,940 | ||||||||||||||||||
| TOTAL | $ | 923,036 | ||||||||||||||||||||||
FORWARD FOREIGN CURRENCY EXCHANGE CONTRACTS WITH UNREALIZED LOSS
| Counterparty | Currency Purchased | Currency Sold | Settlement Date | Current Value | Unrealized Loss | |||||||||||||||||||
Morgan Stanley Co., Inc. | BRL | 7,740,000 | USD | 2,347,589 | 07/05/17 | $ | 2,336,322 | $ | (11,267 | ) | ||||||||||||||
| COP | 9,482,000,000 | USD | 3,224,896 | 09/20/17 | 3,079,469 | (145,427 | ) | |||||||||||||||||
| IDR | 79,920,000,000 | USD | 5,960,620 | 09/20/17 | 5,945,009 | (15,611 | ) | |||||||||||||||||
| INR | 386,000,000 | USD | 5,936,397 | 09/20/17 | 5,920,805 | (15,592 | ) | |||||||||||||||||
| JPY | 246,871,000 | USD | 2,252,584 | 09/20/17 | 2,202,418 | (50,166 | ) | |||||||||||||||||
| KRW | 5,980,000,000 | USD | 5,354,860 | 09/20/17 | 5,227,651 | (127,209 | ) | |||||||||||||||||
| MXN | 8,000,000 | USD | 442,673 | 09/20/17 | 435,385 | (7,288 | ) | |||||||||||||||||
| MYR | 18,300,000 | USD | 4,284,505 | 09/20/17 | 4,240,676 | (43,829 | ) | |||||||||||||||||
| RUB | 189,000,000 | USD | 3,264,108 | 09/20/17 | 3,152,595 | (111,513 | ) | |||||||||||||||||
| TRY | 2,480,000 | USD | 692,737 | 09/20/17 | 689,296 | (3,441 | ) | |||||||||||||||||
| USD | 3,633,342 | AUD | 4,820,000 | 09/20/17 | 3,700,988 | (67,646 | ) | |||||||||||||||||
| USD | 1,550,580 | BRL | 5,180,000 | 07/05/17 | 1,563,584 | (13,004 | ) | |||||||||||||||||
| USD | 719,705 | BRL | 2,400,000 | 08/02/17 | 719,790 | (85 | ) | |||||||||||||||||
| USD | 8,020,045 | CAD | 10,812,000 | 09/20/17 | 8,347,849 | (327,804 | ) | |||||||||||||||||
| USD | 542,652 | CHF | 521,000 | 09/20/17 | 546,066 | (3,414 | ) | |||||||||||||||||
| USD | 790,750 | CLP | 530,000,000 | 09/20/17 | 796,591 | (5,841 | ) | |||||||||||||||||
| USD | 886,443 | CZK | 20,279,000 | 09/20/17 | 891,288 | (4,845 | ) | |||||||||||||||||
| USD | 42,566 | EUR | 37,300 | 07/03/17 | 42,602 | (36 | ) | |||||||||||||||||
| USD | 2,281,804 | EUR | 2,020,000 | 09/20/17 | 2,316,688 | (34,884 | ) | |||||||||||||||||
| 40 | The accompanying notes are an integral part of these financial statements. |
GOLDMAN SACHS MANAGED FUTURES STRATEGY FUND
| ADDITIONAL INVESTMENT INFORMATION (continued) |
FORWARD FOREIGN CURRENCY EXCHANGE CONTRACTS WITH UNREALIZED LOSS (continued)
| Counterparty | Currency Purchased | Currency Sold | Settlement Date | Current Value | Unrealized Loss | |||||||||||||||||||
Morgan Stanley Co., Inc. (continued) | USD | 6,408,722 | GBP | 4,994,250 | 09/20/17 | $ | 6,520,499 | $ | (111,777 | ) | ||||||||||||||
| USD | 791,849 | HUF | 214,366,000 | 09/20/17 | 795,359 | (3,510 | ) | |||||||||||||||||
| USD | 2,121,425 | NOK | 17,900,000 | 09/20/17 | 2,147,333 | (25,908 | ) | |||||||||||||||||
| USD | 968,047 | PLN | 3,607,000 | 09/20/17 | 973,040 | (4,993 | ) | |||||||||||||||||
| USD | 104,300 | SEK | 880,000 | 07/05/17 | 104,455 | (155 | ) | |||||||||||||||||
| USD | 1,455,420 | SEK | 12,591,600 | 09/20/17 | 1,501,277 | (45,857 | ) | |||||||||||||||||
| ZAR | 31,360,000 | USD | 2,398,419 | 09/20/17 | 2,365,659 | (32,760 | ) | |||||||||||||||||
| TOTAL | $ | (1,213,862 | ) | |||||||||||||||||||||
FUTURES CONTRACTS — At June 30, 2017, the Fund had the following futures contracts:
Type | Number of Contracts Long (Short) | Expiration Date | Current Value | Unrealized Gain (Loss) | ||||||||||
Amsterdam Index | 37 | July 2017 | $ | 4,280,892 | $ | (72,601 | ) | |||||||
BIST 30 Index | 1,129 | August 2017 | 4,034,263 | 4,978 | ||||||||||
Brent Crude Futures | (20 | ) | July 2017 | (975,400 | ) | 10,280 | ||||||||
CAC 40 Index | 71 | July 2017 | 4,149,105 | (48,537 | ) | |||||||||
Coffee ‘C’ Futures | (18 | ) | September 2017 | (848,475 | ) | 25,615 | ||||||||
Corn Futures | (58 | ) | September 2017 | (1,104,900 | ) | (38,714 | ) | |||||||
Cotton No. 2 Futures | (16 | ) | December 2017 | (548,720 | ) | (12,941 | ) | |||||||
DAX Index | 12 | September 2017 | 4,221,386 | (64,122 | ) | |||||||||
DJIA Mini E-CBOT | 21 | September 2017 | 2,236,500 | 17,183 | ||||||||||
Feeder Cattle Futures | 8 | August 2017 | 591,700 | 24,686 | ||||||||||
FTSE 100 Index | 45 | September 2017 | 4,244,847 | (59,990 | ) | |||||||||
FTSE/JSE Top 40 Index | (147 | ) | September 2017 | (5,133,005 | ) | 2,139 | ||||||||
FTSE/MIB Index | 31 | September 2017 | 3,629,005 | (27,686 | ) | |||||||||
Gasoline RBOB Futures | (16 | ) | July 2017 | (1,017,206 | ) | 1,661 | ||||||||
Gold 100 oz. Futures | 27 | August 2017 | 3,354,210 | (20,344 | ) | |||||||||
Hang Seng Index | 26 | July 2017 | 4,260,098 | 2,334 | ||||||||||
H-Shares Index | 72 | July 2017 | 4,700,895 | (12,213 | ) | |||||||||
IBEX 35 Index | 32 | July 2017 | 3,803,232 | (55,315 | ) | |||||||||
KC HRW Wheat Futures | (1 | ) | September 2017 | (26,475 | ) | (3,591 | ) | |||||||
KOSPI 200 Index | 77 | September 2017 | 5,264,454 | 117,992 | ||||||||||
Lean Hogs Futures | 34 | August 2017 | 1,139,000 | 38,508 | ||||||||||
Live Cattle Futures | 16 | August 2017 | 744,320 | (44,896 | ) | |||||||||
LME Copper Futures | 4 | July 2017 | 592,300 | 36,541 | ||||||||||
LME Copper Futures | (4 | ) | July 2017 | (592,300 | ) | (24,959 | ) | |||||||
LME Copper Futures | 12 | August 2017 | 1,779,450 | 38,172 | ||||||||||
LME Copper Futures | (1 | ) | August 2017 | (148,288 | ) | 123 | ||||||||
LME Lead Futures | 10 | July 2017 | 570,500 | 36,351 | ||||||||||
LME Lead Futures | (10 | ) | July 2017 | (570,500 | ) | (46,273 | ) | |||||||
LME Lead Futures | 15 | August 2017 | 858,750 | (3,710 | ) | |||||||||
LME Lead Futures | (11 | ) | August 2017 | (629,750 | ) | (47,876 | ) | |||||||
LME Nickel Futures | 21 | July 2017 | 1,178,730 | 50,351 | ||||||||||
LME Nickel Futures | (21 | ) | July 2017 | (1,178,730 | ) | (45,607 | ) | |||||||
LME Nickel Futures | 2 | August 2017 | 112,458 | 613 | ||||||||||
LME Nickel Futures | (23 | ) | August 2017 | (1,293,267 | ) | (52,572 | ) | |||||||
LME Primary Aluminum Futures | 37 | July 2017 | 1,767,213 | 5,232 | ||||||||||
LME Primary Aluminum Futures | (37 | ) | July 2017 | (1,767,213 | ) | (9,799 | ) | |||||||
LME Primary Aluminum Futures | 37 | August 2017 | 1,770,681 | 9,857 | ||||||||||
| The accompanying notes are an integral part of these financial statements. | 41 |
GOLDMAN SACHS MANAGED FUTURES STRATEGY FUND
Consolidated Schedule of Investments (continued)
June 30, 2017 (Unaudited)
| ADDITIONAL INVESTMENT INFORMATION (continued) |
FUTURES CONTRACTS (continued)
Type | Number of Contracts Long (Short) | Expiration Date | Current Value | Unrealized Gain (Loss) | ||||||||||||
LME Primary Aluminum Futures | (23 | ) | August 2017 | $ | (1,100,694 | ) | $ | (31,248 | ) | |||||||
LME Zinc Futures | 10 | July 2017 | 689,188 | 42,551 | ||||||||||||
LME Zinc Futures | (10 | ) | July 2017 | (689,188 | ) | (33,099 | ) | |||||||||
LME Zinc Futures | 10 | August 2017 | 689,375 | 8,283 | ||||||||||||
LME Zinc Futures | (7 | ) | August 2017 | (482,563 | ) | (32,541 | ) | |||||||||
Low Sulphur Gas Oil Futures | (24 | ) | August 2017 | (1,046,400 | ) | (17,673 | ) | |||||||||
MSCI Taiwan Index | 134 | July 2017 | 5,163,020 | 11,075 | ||||||||||||
NASDAQ 100 E-mini Index | 18 | September 2017 | 2,034,990 | (82,741 | ) | |||||||||||
Natural Gas Futures | (105 | ) | July 2017 | (3,186,750 | ) | 36,543 | ||||||||||
Nikkei 225 Index | 11 | September 2017 | 1,957,946 | (6,655 | ) | |||||||||||
NY Harbor ULSD Futures | (18 | ) | July 2017 | (1,121,224 | ) | (28,315 | ) | |||||||||
OMX Stockholm 30 Index | 222 | July 2017 | 4,223,420 | (59,149 | ) | |||||||||||
Russell 2000 Mini Index | 27 | September 2017 | 1,909,305 | (10,441 | ) | |||||||||||
S&P 500 E-Mini Index | 36 | September 2017 | 4,357,620 | (8,122 | ) | |||||||||||
S&P/TSX 60 Index | 6 | September 2017 | 822,825 | (15,806 | ) | |||||||||||
SET50 Index | 846 | September 2017 | 4,942,015 | (2,522 | ) | |||||||||||
SGX Nifty 50 Equity Index | 261 | July 2017 | 4,968,657 | (48,967 | ) | |||||||||||
Silver Futures | (29 | ) | September 2017 | (2,410,915 | ) | 117,505 | ||||||||||
Soybean Futures | (23 | ) | November 2017 | (1,097,963 | ) | (22,883 | ) | |||||||||
SPI 200 Index | 34 | September 2017 | 3,690,548 | 881 | ||||||||||||
Sugar #11 (World) Futures | (53 | ) | September 2017 | (819,762 | ) | 6,079 | ||||||||||
TSE TOPIX Index | 29 | September 2017 | 4,155,012 | 3,764 | ||||||||||||
Wheat Futures | (1 | ) | September 2017 | (26,300 | ) | (3,641 | ) | |||||||||
WTI Crude Oil Futures | (21 | ) | July 2017 | (966,840 | ) | 17,642 | ||||||||||
| TOTAL | $ | (428,610 | ) | |||||||||||||
CENTRALLY CLEARED INTEREST RATE SWAP CONTRACTS
| Rates Exchanged | Market Value | |||||||||||||||
Notional (000’s)(a) | Termination Date | Payments Received | Payments Made | Upfront Made (Received) | Unrealized Gain (Loss) | |||||||||||
| EUR | 299,210 | 09/20/18 | 0.000% | 6 Month EURIBOR | $ | (72,441 | ) | $ | 753,602 | |||||||
| GBP | 274,000 | 09/20/18 | 0.500 | 6 Month LIBOR | (959,142 | ) | 474,063 | |||||||||
| SEK | 2,848,150 | 09/20/18 | 0.000 | 3 Month STIBOR | (128,822 | ) | 1,442,703 | |||||||||
| $ | 16,780 | 09/20/18 | 3 Month LIBOR | 1.400 | — | 18,461 | ||||||||||
| EUR | 58,150 | 09/20/19 | 0.000 | 6 Month EURIBOR | (44,145 | ) | 149,335 | |||||||||
| GBP | 75,950 | 09/20/19 | 6 Month LIBOR | 0.500 | 332,661 | 171,686 | ||||||||||
| JPY | 11,893,120 | 09/20/19 | 6 Month LIBOR | 0.000 | 244 | 109,340 | ||||||||||
| $ | 8,670 | 09/20/19 | 1.500 | 3 Month LIBOR | (17,327 | ) | (11,972 | ) | ||||||||
| CZK | 92,570 | 09/20/22 | 6 Month PRIBOR | 1.000 | (73,986 | ) | 79,647 | |||||||||
| HUF | 3,583,270 | 09/20/22 | 2.000 | 6 Month BUBOR | 269,964 | 245,173 | ||||||||||
| MXN | 26,810 | 09/20/22 | 7.750 | 1 Month TIIE | 73,867 | (12,868 | ) | |||||||||
| PLN | 50,620 | 09/20/22 | 2.750 | 6 Month WIBOR | 263,194 | (49,972 | ) | |||||||||
| ZAR | 163,620 | 09/20/22 | 8.000 | 3 Month JIBAR | 155,709 | 94,029 | ||||||||||
| CAD | 7,060 | 09/20/27 | 1.750 | 3 Month BA | (143,956 | ) | (44,554 | ) | ||||||||
| CHF | 1,870 | 09/20/27 | 0.250 | 6 Month LIBOR | 22,458 | (27,797 | ) | |||||||||
| EUR | 18,700 | 09/20/27 | 1.000 | 6 Month EURIBOR | 61,122 | 27,670 | ||||||||||
| GBP | 48,950 | 09/20/27 | 1.000 | 6 Month LIBOR | (1,237,563 | ) | (1,109,813 | ) | ||||||||
| JPY | 2,756,990 | 09/20/27 | 0.250 | 6 Month LIBOR | (26,058 | ) | (41,881 | ) | ||||||||
| 42 | The accompanying notes are an integral part of these financial statements. |
GOLDMAN SACHS MANAGED FUTURES STRATEGY FUND
| ADDITIONAL INVESTMENT INFORMATION (continued) |
CENTRALLY CLEARED INTEREST RATE SWAP CONTRACTS (continued)
| Rates Exchanged | Market Value | |||||||||||||||
Notional (000’s)(a) | Termination Date | Payments Received | Payments Made | Upfront Made (Received) | Unrealized Gain (Loss) | |||||||||||
| SEK | 69,820 | 09/20/27 | 1.250% | 3 Month STIBOR | $ | (52,342 | ) | $ | 15,928 | |||||||
| $ | 52,110 | 09/20/27 | 2.000 | 3 Month LIBOR | (953,993 | ) | (451,569 | ) | ||||||||
| EUR | 12,190 | 09/20/47 | 6 Month EURIBOR | 1.500 | 104,995 | 91,223 | ||||||||||
| GBP | 10,460 | 09/20/47 | 6 Month LIBOR | 1.250 | (855,588 | ) | 2,094,896 | |||||||||
| JPY | 51,050 | 09/20/47 | 6 Month LIBOR | 1.000 | (792 | ) | (18,889 | ) | ||||||||
| $ | 22,420 | 09/20/47 | 3 Month LIBOR | 2.250 | 813,176 | 612,688 | ||||||||||
| TOTAL | $ | (2,468,765 | ) | $ | 4,611,129 | |||||||||||
| (a) | Represents forward starting interest rate swaps whose effective dates of commencement of accruals and cash flows occur subsequent to June 30, 2017. |
| The accompanying notes are an integral part of these financial statements. | 43 |
GOLDMAN SACHS SELECT SATELLITE FUNDS
Consolidated Statements of Assets and Liabilities(a)
June 30, 2017 (Unaudited)
| Absolute Return Tracker Fund | Commodity Strategy Fund | Dynamic Allocation Fund | Managed Futures Strategy Fund | |||||||||||||||
| Assets: | ||||||||||||||||||
Investments in unaffiliated issuers, at value (cost $241,101,075, $136,378,304, $70,928,522 and $0)(b) | $ | 271,036,995 | $ | 137,122,173 | $ | 74,761,723 | $ | — | ||||||||||
Investments in affiliated issuers, at value (cost $1,003,357,451, $152,438,772, $293,105,652 and $91,639,677) | 1,003,357,451 | 152,438,772 | 293,105,652 | 91,639,677 | ||||||||||||||
Investments in affiliated securities lending reinvestment vehicle, at value (cost $8,001,950, $0, $163,400 and $0) | 8,001,950 | — | 163,400 | — | ||||||||||||||
Cash | 21,299,238 | 19,068,986 | 3,580,970 | 5,385,449 | ||||||||||||||
Foreign currencies, at value (cost $161,237, $0, $14,932,343 and $5,993,928) | 165,512 | — | 15,343,842 | 6,264,255 | ||||||||||||||
Receivables: | ||||||||||||||||||
Collateral on certain derivative contracts(c) | 66,236,435 | 36,266,072 | 16,470,699 | 17,577,964 | ||||||||||||||
Fund shares sold | 4,394,471 | 1,045,653 | 145,083 | 775,442 | ||||||||||||||
Dividends and interest | 698,426 | 478,264 | 243,109 | 57,762 | ||||||||||||||
Reimbursement from investment adviser | 34,030 | 18,744 | 39,564 | 10,232 | ||||||||||||||
Securities lending income | 8,697 | — | 3,474 | — | ||||||||||||||
Investments sold | — | 2,088,268 | — | — | ||||||||||||||
Foreign tax reclaims | — | — | 286,200 | — | ||||||||||||||
Unrealized gain on forward foreign currency exchange contracts | 571,355 | — | 1,049,804 | 923,036 | ||||||||||||||
Unrealized gain on swap contracts | 537,177 | 2,909,509 | 120,957 | — | ||||||||||||||
Variation margin on certain derivative contracts | 204,927 | 207,586 | — | — | ||||||||||||||
Other assets | 2,831 | 1,090 | 1,413 | 462 | ||||||||||||||
| Total assets | 1,376,549,495 | 351,645,117 | 405,315,890 | 122,634,279 | ||||||||||||||
| Liabilities: | ||||||||||||||||||
Variation margin on certain derivative contracts | 2,365,801 | 14,542 | 674,678 | 2,071,701 | ||||||||||||||
Written options, at value (premiums received $3,644,132, $0, $0 and $0) | 1,605,617 | — | — | — | ||||||||||||||
Unrealized loss on swap contracts | 940,797 | 4,611,432 | 299,041 | — | ||||||||||||||
Unrealized loss on forward foreign currency exchange contracts | 99,186 | — | 283,244 | 1,213,862 | ||||||||||||||
Payables: | ||||||||||||||||||
Payable upon return of securities loaned | 8,001,950 | — | 163,400 | — | ||||||||||||||
Fund shares redeemed | 1,289,599 | 1,034,266 | 328,107 | 743,513 | ||||||||||||||
Management fees | 644,384 | 115,984 | 230,373 | 85,806 | ||||||||||||||
Distribution and Service fees and Transfer Agency fees | 71,585 | 28,625 | 37,585 | 12,472 | ||||||||||||||
Collateral on certain derivative contracts(c) | — | — | 640,000 | — | ||||||||||||||
Accrued expenses | 309,871 | 413,109 | 320,638 | 176,433 | ||||||||||||||
| Total liabilities | 15,328,790 | 6,217,958 | 2,977,066 | 4,303,787 | ||||||||||||||
| Net Assets: | ||||||||||||||||||
Paid-in capital | 1,301,379,915 | 441,696,946 | 378,948,212 | 114,159,786 | ||||||||||||||
Undistributed (distributions in excess of) net investment income (loss) | 2,009,087 | 15,037,507 | 2,173,725 | (2,717,697 | ) | |||||||||||||
Accumulated net realized gain (loss) | 29,904,344 | (109,984,958 | ) | 20,029,507 | 2,860,129 | |||||||||||||
Net unrealized gain (loss) | 27,927,359 | (1,322,336 | ) | 1,187,380 | 4,028,274 | |||||||||||||
| NET ASSETS | $ | 1,361,220,705 | $ | 345,427,159 | $ | 402,338,824 | $ | 118,330,492 | ||||||||||
Net Assets: | ||||||||||||||||||
Class A | $ | 25,899,598 | $ | 46,641,577 | $ | 18,695,905 | $ | 7,857,950 | ||||||||||
Class C | 12,322,088 | 2,884,564 | 17,069,225 | 3,143,644 | ||||||||||||||
Institutional | 1,272,017,698 | 280,460,608 | 356,325,250 | 83,725,302 | ||||||||||||||
Class IR | 46,384,377 | 10,891,330 | 10,225,605 | 23,162,238 | ||||||||||||||
Class R | 2,561,283 | 3,176,661 | 12,316 | 441,358 | ||||||||||||||
Class R6 | 2,035,661 | 1,372,419 | 10,523 | — | ||||||||||||||
Total Net Assets | $ | 1,361,220,705 | $ | 345,427,159 | $ | 402,338,824 | $ | 118,330,492 | ||||||||||
Shares outstanding $0.001 par value (unlimited shares authorized): | ||||||||||||||||||
Class A | 2,787,005 | 4,484,196 | 1,787,459 | 780,197 | ||||||||||||||
Class C | 1,424,187 | 290,995 | 1,717,423 | 323,976 | ||||||||||||||
Institutional | 133,392,581 | 26,699,550 | 33,540,333 | 8,156,784 | ||||||||||||||
Class IR | 4,902,529 | 1,036,433 | 967,001 | 2,272,744 | ||||||||||||||
Class R | 282,249 | 309,955 | 1,193 | 44,377 | ||||||||||||||
Class R6 | 213,617 | 130,610 | 991 | — | ||||||||||||||
Net asset value, offering and redemption price per share:(d) | ||||||||||||||||||
Class A | $9.29 | $10.40 | $10.46 | $10.07 | ||||||||||||||
Class C | 8.65 | 9.91 | 9.94 | 9.70 | ||||||||||||||
Institutional | 9.54 | 10.50 | 10.62 | 10.26 | ||||||||||||||
Class IR | 9.46 | 10.51 | 10.57 | 10.19 | ||||||||||||||
Class R | 9.07 | 10.25 | 10.32 | 9.95 | ||||||||||||||
Class R6 | 9.53 | 10.51 | 10.62 | — | ||||||||||||||
| (a) | Statements of Assets and Liabilities for Absolute Return Tracker, Commodity Strategy, Dynamic Allocation and Managed Futures Strategy Funds are consolidated and include the balances of Cayman Commodity-ART, Ltd., Cayman Commodity-CSFLtd., Cayman Commodity-DAF, Ltd. and Cayman Commodity-MFS, Ltd. (wholly-owned subsidiaries), respectively. Accordingly, all interfund balances and transactions have been eliminated. |
| (b) | Includes loaned securities having a market value of $7,672,101 and $160,300 for the Absolute Return Tracker and Dynamic Allocation Funds, respectively. |
| (c) | Segregated for initial margin and/or collateral on transactions as follows: |
Fund | Forwards | Futures | Options | Swaps | ||||||||||||
Absolute Return Tracker | $ | — | $ | 16,718,457 | $ | 38,917,926 | $ | 10,600,052 | ||||||||
Commodity Strategy | — | — | — | 36,266,072 | ||||||||||||
Dynamic Allocation | (640,000 | ) | 9,458,280 | — | 7,012,419 | |||||||||||
Managed Futures Strategy | 3,270,000 | 6,512,225 | — | 7,795,739 | ||||||||||||
| (d) | Maximum public offering price per share for Class A Shares of the Absolute Return Tracker, Commodity Strategy, Dynamic Allocation and Managed Futures Strategy Funds is $9.83, $10.89, $11.07 and $10.66 respectively. At redemption, Class C Shares may be subject to a contingent deferred sales charge assessed on the amount equal to the lesser of the current NAV or the original purchase price of the shares. |
| 44 | The accompanying notes are an integral part of these financial statements. |
GOLDMAN SACHS SELECT SATELLITE FUNDS
Consolidated Statements of Operations(a)
For the Six Months Ended June 30, 2017 (Unaudited)
| Absolute Return Tracker Fund | Commodity Strategy Fund | Dynamic Allocation Fund | Managed Futures Strategy Fund | |||||||||||||||
| Investment income: | ||||||||||||||||||
Dividends — affiliated issuers (net of foreign taxes withheld of $0, $0, $763 and $12,598) | $ | 2,589,504 | $ | 562,007 | $ | 748,420 | $ | 317,274 | ||||||||||
Dividends — unaffiliated issuers (net of foreign taxes withheld of $0, $0, $203,141 and $0) | 2,343,411 | — | 2,002,937 | — | ||||||||||||||
Securities lending income — affiliated issuer | 40,042 | — | 9,863 | — | ||||||||||||||
Interest | — | 1,560,570 | 186,227 | — | ||||||||||||||
| Total investment income | 4,972,957 | 2,122,577 | 2,947,447 | 317,274 | ||||||||||||||
| Expenses: | ||||||||||||||||||
Management fees | 6,658,348 | 932,495 | 2,171,219 | 720,095 | ||||||||||||||
Transfer Agency fees(b) | 292,323 | 105,548 | 133,157 | 58,675 | ||||||||||||||
Distribution and Service fees(b) | 108,460 | 90,197 | 119,431 | 33,245 | ||||||||||||||
Professional fees | 108,136 | 87,442 | 105,919 | 97,066 | ||||||||||||||
Custody, accounting and administrative services | 95,550 | 74,693 | 80,862 | 45,636 | ||||||||||||||
Registration fees | 50,264 | 44,422 | 40,411 | 34,006 | ||||||||||||||
Printing and mailing costs | 42,491 | 68,813 | 26,459 | 16,433 | ||||||||||||||
Trustee fees | 9,025 | 8,549 | 8,593 | 8,288 | ||||||||||||||
Other | 13,844 | 6,720 | 8,727 | 40,518 | ||||||||||||||
| Total expenses | 7,378,441 | 1,418,879 | 2,694,778 | 1,053,962 | ||||||||||||||
Less — expense reductions | (3,475,886 | ) | (314,824 | ) | (733,266 | ) | (142,620 | ) | ||||||||||
| Net expenses | 3,902,555 | 1,104,055 | 1,961,512 | 911,342 | ||||||||||||||
| NET INVESTMENT INCOME (LOSS) | 1,070,402 | 1,018,522 | 985,935 | (594,068 | ) | |||||||||||||
| Realized and unrealized gain (loss): | ||||||||||||||||||
Net realized gain (loss) from: | ||||||||||||||||||
Investments | 5,948,027 | (204,107 | ) | 21,285,032 | 7,950 | |||||||||||||
Futures contracts | 11,695,403 | (1,356,600 | ) | 11,145,541 | 5,702,728 | |||||||||||||
Swap contracts | 6,460,298 | (22,213,242 | ) | (615,554 | ) | 2,505,228 | ||||||||||||
Forward foreign currency exchange contracts | (2,248,129 | ) | — | (4,130,291 | ) | (1,337,045 | ) | |||||||||||
Foreign currency transactions | 816,266 | — | 873,445 | 46,606 | ||||||||||||||
Written options | 6,374,633 | — | — | — | ||||||||||||||
Net change in unrealized gain (loss) on: | ||||||||||||||||||
Investments | 15,290,387 | 1,045,842 | (4,834,464 | ) | — | |||||||||||||
Futures contracts | (7,903,499 | ) | (540,492 | ) | (3,277,157 | ) | (1,198,163 | ) | ||||||||||
Swap contracts | (2,702,377 | ) | (19,769,642 | ) | 3,928,146 | (3,334,774 | ) | |||||||||||
Forward foreign currency exchange contracts | 611,098 | — | (1,887,442 | ) | (1,772,578 | ) | ||||||||||||
Foreign currency translation | 119,833 | — | 264,484 | (78,697 | ) | |||||||||||||
Written options | 740,440 | — | — | — | ||||||||||||||
| Net realized and unrealized gain (loss) | 35,202,380 | (43,038,241 | ) | 22,751,740 | 541,255 | |||||||||||||
| NET INCREASE (DECREASE) IN NET ASSETS RESULTING FROM OPERATIONS | $ | 36,272,782 | $ | (42,019,719 | ) | $ | 23,737,675 | $ | (52,813 | ) | ||||||||
| (a) | Statements of Operations for Absolute Return Tracker, Commodity Strategy, Dynamic Allocation and Managed Futures Strategy Funds are consolidated and include the balances of Cayman Commodity-ART, Ltd., Cayman Commodity-CSF, Ltd., Cayman Commodity-DAF, Ltd. and Cayman Commodity-MFS, Ltd. (wholly-owned subsidiaries), respectively. Accordingly, all interfund balances and transactions have been eliminated. |
| (b) | Class specific Distribution and Service, and Transfer Agency fees were as follows: |
| Distribution and Service Fees | Transfer Agency Fees | |||||||||||||||||||||||||||||||||||
Fund | Class A | Class C | Class R | Class A | Class C | Institutional | Class IR | Class R | Class R6 | |||||||||||||||||||||||||||
Absolute Return Tracker | $ | 38,325 | $ | 64,468 | $ | 5,667 | $ | 29,127 | $ | 12,249 | $ | 219,522 | $ | 29,123 | $ | 2,154 | $ | 148 | ||||||||||||||||||
Commodity Strategy | 64,216 | 16,674 | 9,307 | 33,392 | 2,167 | 60,417 | 6,977 | 2,420 | 175 | |||||||||||||||||||||||||||
Dynamic Allocation | 26,457 | 92,944 | 30 | 20,108 | 17,659 | 86,722 | 8,655 | 11 | 2 | |||||||||||||||||||||||||||
Managed Futures Strategy | 14,706 | 17,563 | 976 | 11,177 | 3,337 | 20,838 | 22,952 | 371 | — | |||||||||||||||||||||||||||
| The accompanying notes are an integral part of these financial statements. | 45 |
GOLDMAN SACHS SELECT SATELLITE FUNDS
Consolidated Statements of Changes in Net Assets(a)
| Absolute Return Tracker Fund | ||||||||||
| For the Six Months Ended June 30, 2017 (Unaudited) | For the Fiscal Year Ended December 31, 2016 | |||||||||
| From operations: | ||||||||||
Net investment income (loss) | $ | 1,070,402 | $ | (597,179 | ) | |||||
Net realized gain (loss) | 29,046,498 | 29,724,314 | ||||||||
Net change in unrealized gain (loss) | 6,155,882 | 14,089,271 | ||||||||
| Net increase (decrease) in net assets resulting from operations | 36,272,782 | 43,216,406 | ||||||||
| Distributions to shareholders: | ||||||||||
From net investment income | ||||||||||
Class A Shares | — | — | ||||||||
Institutional Shares | — | (2,285,243 | ) | |||||||
Class IR Shares | — | (18,317 | ) | |||||||
Class R Shares | — | — | ||||||||
Class R6 Shares | — | (70 | ) | |||||||
From net realized gains | ||||||||||
Class A Shares | — | (151,811 | ) | |||||||
Class C Shares | — | (59,552 | ) | |||||||
Institutional Shares | — | (3,675,019 | ) | |||||||
Class IR Shares | — | (52,287 | ) | |||||||
Class R Shares | — | (9,261 | ) | |||||||
Class R6 Shares | — | (107 | ) | |||||||
| Total distributions to shareholders | — | (6,251,667 | ) | |||||||
| From share transactions: | ||||||||||
Proceeds from sales of shares | 506,844,786 | 402,601,286 | ||||||||
Reinvestment of distributions | — | 3,768,394 | ||||||||
Cost of shares redeemed | (220,580,484 | ) | (588,323,678 | ) | ||||||
| Net increase (decrease) in net assets resulting from share transactions | 286,264,302 | (181,953,998 | ) | |||||||
| TOTAL INCREASE (DECREASE) | 322,537,084 | (144,989,259 | ) | |||||||
| Net assets: | ||||||||||
Beginning of period | 1,038,683,621 | 1,183,672,880 | ||||||||
End of period | $ | 1,361,220,705 | $ | 1,038,683,621 | ||||||
| Undistributed (distributions in excess of) net investment income (loss) | $ | 2,009,087 | $ | 938,685 | ||||||
| (a) | Statements of Changes in Net Assets for Absolute Return Tracker, Commodity Strategy, Dynamic Allocation and Managed Futures Strategy Funds are consolidated and include the balances of Cayman Commodity-ART, Ltd., Cayman Commodity-CSF, Ltd., Cayman Commodity-DAF, Ltd. and Cayman Commodity-MFS, Ltd. (wholly-owned subsidiaries), respectively. Accordingly, all interfund balances and transactions have been eliminated. |
| 46 | The accompanying notes are an integral part of these financial statements. |
GOLDMAN SACHS SELECT SATELLITE FUNDS
| Commodity Strategy Fund | Dynamic Allocation Fund | Managed Futures Strategy Fund | |||||||||||||||||||||||||||||||
| For the Six Months Ended June 30, 2017 (Unaudited) | For the Fiscal Year Ended December 31, 2016 | For the Six Months Ended June 30, 2017 (Unaudited) | For the Fiscal Year Ended December 31, 2016 | For the Six Months Ended June 30, 2017 (Unaudited) | For the Fiscal Year Ended December 31, 2016 | |||||||||||||||||||||||||||||
| $ | 1,018,522 | $ | 2,211,663 | $ | 985,935 | $ | 1,069,834 | $ | (594,068 | ) | $ | (1,860,022 | ) | |||||||||||||||||||||
| (23,773,949 | ) | (2,921,887 | ) | 28,558,173 | 22,184,990 | 6,925,467 | (6,515,314 | ) | ||||||||||||||||||||||||||
| (19,264,292 | ) | 63,958,889 | (5,806,433 | ) | 10,065,824 | (6,384,212 | ) | 4,699,660 | ||||||||||||||||||||||||||
| (42,019,719 | ) | 63,248,665 | 23,737,675 | 33,320,648 | (52,813 | ) | (3,675,676 | ) | ||||||||||||||||||||||||||
| (97,498 | ) | (331,991 | ) | — | — | — | — | |||||||||||||||||||||||||||
| (1,077,899 | ) | (2,713,328 | ) | — | — | — | (121,239 | ) | ||||||||||||||||||||||||||
| (37,626 | ) | (51,647 | ) | — | — | — | — | |||||||||||||||||||||||||||
| (1,983 | ) | (13,598 | ) | — | — | — | — | |||||||||||||||||||||||||||
| (5,350 | ) | (14,801 | ) | — | — | — | — | |||||||||||||||||||||||||||
| — | — | — | — | — | — | |||||||||||||||||||||||||||||
| — | — | — | — | — | — | |||||||||||||||||||||||||||||
| — | — | — | — | — | — | |||||||||||||||||||||||||||||
| — | — | — | — | — | — | |||||||||||||||||||||||||||||
| — | — | — | — | — | — | |||||||||||||||||||||||||||||
| — | — | — | — | — | — | |||||||||||||||||||||||||||||
| (1,220,356 | ) | (3,125,365 | ) | — | — | — | (121,239 | ) | ||||||||||||||||||||||||||
| 126,877,147 | 218,297,206 | 34,994,709 | 73,600,104 | 37,069,204 | 147,911,012 | |||||||||||||||||||||||||||||
| 924,912 | 2,112,059 | — | — | — | 116,199 | |||||||||||||||||||||||||||||
| (141,797,820 | ) | (496,045,017 | ) | (178,761,793 | ) | (176,375,763 | ) | (77,166,889 | ) | (107,312,430 | ) | |||||||||||||||||||||||
| (13,995,761 | ) | (275,635,752 | ) | (143,767,084 | ) | (102,775,659 | ) | (40,097,685 | ) | 40,714,781 | ||||||||||||||||||||||||
| (57,235,836 | ) | (215,512,452 | ) | (120,029,409 | ) | (69,455,011 | ) | (40,150,498 | ) | 36,917,866 | ||||||||||||||||||||||||
| 402,662,995 | 618,175,447 | 522,368,233 | 591,823,244 | 158,480,990 | 121,563,124 | |||||||||||||||||||||||||||||
| $ | 345,427,159 | $ | 402,662,995 | $ | 402,338,824 | $ | 522,368,233 | $ | 118,330,492 | $ | 158,480,990 | |||||||||||||||||||||||
| $ | 15,037,507 | $ | 15,239,341 | $ | 2,173,725 | $ | 1,187,790 | $ | (2,717,697 | ) | $ | (2,123,629 | ) | |||||||||||||||||||||
| The accompanying notes are an integral part of these financial statements. | 47 |
GOLDMAN SACHS ABSOLUTE RETURN TRACKER FUND
Consolidated Financial Highlights
Selected Data for a Share Outstanding Throughout Each Period
| Income (loss) from investment operations | Distributions to shareholders | |||||||||||||||||||||||||||||
| Year - Share Class | Net asset value, beginning of period | Net investment income (loss)(a) | Net realized and unrealized gain (loss) | Total from investment operations | From net investment income | From net realized gains | Total distributions | |||||||||||||||||||||||
| FOR THE SIX MONTHS ENDED JUNE 30, (UNAUDITED) | ||||||||||||||||||||||||||||||
2017 - A | $ | 9.02 | $ | (0.01 | ) | $ | 0.28 | $ | 0.27 | $ | — | $ | — | $ | — | |||||||||||||||
2017 - C | 8.43 | (0.04 | ) | 0.26 | 0.22 | — | — | — | ||||||||||||||||||||||
2017 - Institutional | 9.23 | 0.01 | 0.30 | 0.31 | — | — | — | |||||||||||||||||||||||
2017 - IR | 9.17 | — | (e) | 0.29 | 0.29 | — | — | — | ||||||||||||||||||||||
2017 - R | 8.82 | (0.02 | ) | 0.27 | 0.25 | — | — | — | ||||||||||||||||||||||
2017 - R6 | 9.23 | 0.01 | 0.29 | 0.30 | — | — | — | |||||||||||||||||||||||
| FOR THE FISCAL YEARS ENDED DECEMBER 31, | ||||||||||||||||||||||||||||||
2016 - A | 8.67 | (0.04 | ) | 0.43 | 0.39 | — | (0.04 | ) | (0.04 | ) | ||||||||||||||||||||
2016 - C | 8.17 | (0.10 | ) | 0.40 | 0.30 | — | (0.04 | ) | (0.04 | ) | ||||||||||||||||||||
2016 - Institutional | 8.86 | — | (e) | 0.43 | 0.43 | (0.02 | ) | (0.04 | ) | (0.06 | ) | |||||||||||||||||||
2016 - IR | 8.80 | (0.01 | ) | 0.43 | 0.42 | (0.01 | ) | (0.04 | ) | (0.05 | ) | |||||||||||||||||||
2016 - R | 8.50 | (0.06 | ) | 0.42 | 0.36 | — | (0.04 | ) | (0.04 | ) | ||||||||||||||||||||
2016 - R6 | 8.86 | — | (e) | 0.43 | 0.43 | (0.02 | ) | (0.04 | ) | (0.06 | ) | |||||||||||||||||||
2015 - A | 9.01 | (0.07 | ) | (0.15 | ) | (0.22 | ) | (0.02 | ) | (0.10 | ) | (0.12 | ) | |||||||||||||||||
2015 - C | 8.54 | (0.13 | ) | (0.14 | ) | (0.27 | ) | — | (0.10 | ) | (0.10 | ) | ||||||||||||||||||
2015 - Institutional | 9.22 | (0.03 | ) | (0.17 | ) | (0.20 | ) | (0.06 | ) | (0.10 | ) | (0.16 | ) | |||||||||||||||||
2015 - IR | 9.15 | (0.04 | ) | (0.16 | ) | (0.20 | ) | (0.05 | ) | (0.10 | ) | (0.15 | ) | |||||||||||||||||
2015 - R | 8.85 | (0.09 | ) | (0.15 | ) | (0.24 | ) | (0.01 | ) | (0.10 | ) | (0.11 | ) | |||||||||||||||||
2015 - R6 (Commenced July 31, 2015) | 9.30 | (0.01 | ) | (0.26 | ) | (0.27 | ) | (0.07 | ) | (0.10 | ) | (0.17 | ) | |||||||||||||||||
2014 - A | 9.12 | (0.09 | ) | 0.33 | 0.24 | — | (0.35 | ) | (0.35 | ) | ||||||||||||||||||||
2014 - C | 8.72 | (0.15 | ) | 0.32 | 0.17 | — | (0.35 | ) | (0.35 | ) | ||||||||||||||||||||
2014 - Institutional | 9.32 | (0.05 | ) | 0.34 | 0.29 | (0.04 | ) | (0.35 | ) | (0.39 | ) | |||||||||||||||||||
2014 - IR | 9.24 | (0.07 | ) | 0.34 | 0.27 | (0.01 | ) | (0.35 | ) | (0.36 | ) | |||||||||||||||||||
2014 - R | 8.98 | (0.11 | ) | 0.33 | 0.22 | — | (0.35 | ) | (0.35 | ) | ||||||||||||||||||||
2013 - A | 8.95 | (0.12 | ) | 0.82 | 0.70 | — | (0.53 | ) | (0.53 | ) | ||||||||||||||||||||
2013 - C | 8.65 | (0.18 | ) | 0.78 | 0.60 | — | (0.53 | ) | (0.53 | ) | ||||||||||||||||||||
2013 - Institutional | 9.10 | (0.09 | ) | 0.84 | 0.75 | — | (0.53 | ) | (0.53 | ) | ||||||||||||||||||||
2013 - IR | 9.04 | (0.10 | ) | 0.83 | 0.73 | — | (0.53 | ) | (0.53 | ) | ||||||||||||||||||||
2013 - R | 8.85 | (0.14 | ) | 0.80 | 0.66 | — | (0.53 | ) | (0.53 | ) | ||||||||||||||||||||
2012 - A | 8.79 | (0.13 | ) | 0.33 | 0.20 | — | (0.04 | ) | (0.04 | ) | ||||||||||||||||||||
2012 - C | 8.56 | (0.19 | ) | 0.32 | 0.13 | — | (0.04 | ) | (0.04 | ) | ||||||||||||||||||||
2012 - Institutional | 8.90 | (0.09 | ) | 0.33 | 0.24 | — | (0.04 | ) | (0.04 | ) | ||||||||||||||||||||
2012 - IR | 8.86 | (0.11 | ) | 0.33 | 0.22 | — | (0.04 | ) | (0.04 | ) | ||||||||||||||||||||
2012 - R | 8.72 | (0.15 | ) | 0.32 | 0.17 | — | (0.04 | ) | (0.04 | ) | ||||||||||||||||||||
| (a) | Calculated based on the average shares outstanding methodology. |
| (b) | Assumes investment at the net asset value at the beginning of the period, reinvestment of all distributions, a complete redemption of the investment at the net asset value at the end of the period and no sales or redemption charges. Total returns would be reduced if a sales or redemption charge was taken into account. Returns do not reflect the impact of taxes to shareholders relating to Fund distributions or the redemption of Fund shares. Total returns for periods less than one full year are not annualized. |
| (c) | The Fund’s portfolio turnover rate is calculated in accordance with regulatory requirements, without regard to transactions involving short term investments and certain derivatives. If such transactions were included, the Fund’s portfolio turnover rate may be higher. |
| (d) | Annualized. |
| (e) | Amount is less than $0.005 per share. |
| 48 | The accompanying notes are an integral part of these financial statements. |
GOLDMAN SACHS ABSOLUTE RETURN TRACKER FUND
| Net asset value, end of period | Total return(b) | Net assets, end of period (in 000s) | Ratio of net expenses to average net assets | Ratio of total expenses to average net assets | Ratio of net investment income (loss) to average net assets | Portfolio turnover rate(c) | ||||||||||||||||||||||||||||||||||
| $ | 9.29 | 2.99 | % | $ | 25,900 | 1.04 | %(d) | 1.63 | %(d) | (0.21 | )%(d) | 40 | % | |||||||||||||||||||||||||||
| 8.65 | 2.61 | 12,322 | 1.79 | (d) | 2.38 | (d) | (0.95 | )(d) | 40 | |||||||||||||||||||||||||||||||
| 9.54 | 3.36 | 1,272,018 | 0.64 | (d) | 1.23 | (d) | 0.21 | (d) | 40 | |||||||||||||||||||||||||||||||
| 9.46 | 3.16 | 46,384 | 0.78 | (d) | 1.37 | (d) | 0.07 | (d) | 40 | |||||||||||||||||||||||||||||||
| 9.07 | 2.83 | 2,561 | 1.29 | (d) | 1.88 | (d) | (0.45 | )(d) | 40 | |||||||||||||||||||||||||||||||
| 9.53 | 3.25 | 2,036 | 0.62 | (d) | 1.20 | (d) | 0.24 | (d) | 40 | |||||||||||||||||||||||||||||||
| 9.02 | 4.45 | 38,886 | 1.03 | 1.66 | (0.43 | ) | 130 | |||||||||||||||||||||||||||||||||
| 8.43 | 3.62 | 13,490 | 1.78 | 2.41 | (1.18 | ) | 130 | |||||||||||||||||||||||||||||||||
| 9.23 | 4.82 | 970,838 | 0.62 | 1.24 | (0.02 | ) | 130 | |||||||||||||||||||||||||||||||||
| 9.17 | 4.75 | 13,245 | 0.78 | 1.42 | (0.13 | ) | 130 | |||||||||||||||||||||||||||||||||
| 8.82 | 4.19 | 2,197 | 1.28 | 1.91 | (0.66 | ) | 130 | |||||||||||||||||||||||||||||||||
| 9.23 | 4.85 | 27 | 0.64 | 1.24 | 0.01 | 130 | ||||||||||||||||||||||||||||||||||
| 8.67 | (2.45 | ) | 45,207 | 1.04 | 1.60 | (0.74 | ) | 213 | ||||||||||||||||||||||||||||||||
| 8.17 | (3.20 | ) | 18,329 | 1.79 | 2.35 | (1.51 | ) | 213 | ||||||||||||||||||||||||||||||||
| 8.86 | (2.18 | ) | 1,111,353 | 0.64 | 1.20 | (0.36 | ) | 213 | ||||||||||||||||||||||||||||||||
| 8.80 | (2.23 | ) | 6,755 | 0.79 | 1.35 | (0.49 | ) | 213 | ||||||||||||||||||||||||||||||||
| 8.50 | (2.71 | ) | 2,019 | 1.29 | 1.85 | (0.97 | ) | 213 | ||||||||||||||||||||||||||||||||
| 8.86 | (2.98 | ) | 10 | 0.64 | (d) | 1.21 | (d) | (0.22 | )(d) | 213 | ||||||||||||||||||||||||||||||
| 9.01 | 2.61 | 64,120 | 1.05 | 1.59 | (0.96 | ) | 134 | |||||||||||||||||||||||||||||||||
| 8.54 | 1.92 | 28,736 | 1.80 | 2.34 | (1.69 | ) | 134 | |||||||||||||||||||||||||||||||||
| 9.22 | 3.09 | 1,874,703 | 0.65 | 1.19 | (0.54 | ) | 134 | |||||||||||||||||||||||||||||||||
| 9.15 | 2.85 | 8,046 | 0.81 | 1.34 | (0.73 | ) | 134 | |||||||||||||||||||||||||||||||||
| 8.85 | 2.42 | 2,299 | 1.30 | 1.84 | (1.19 | ) | 134 | |||||||||||||||||||||||||||||||||
| 9.12 | 7.90 | 105,432 | 1.55 | 1.59 | (1.33 | ) | 163 | |||||||||||||||||||||||||||||||||
| 8.72 | 7.02 | 29,942 | 2.30 | 2.34 | (2.08 | ) | 163 | |||||||||||||||||||||||||||||||||
| 9.32 | 8.33 | 1,589,475 | 1.15 | 1.19 | (0.92 | ) | 163 | |||||||||||||||||||||||||||||||||
| 9.24 | 8.15 | 21,565 | 1.30 | 1.34 | (1.08 | ) | 163 | |||||||||||||||||||||||||||||||||
| 8.98 | 7.54 | 1,729 | 1.80 | 1.84 | (1.57 | ) | 163 | |||||||||||||||||||||||||||||||||
| 8.95 | 2.30 | 133,654 | 1.55 | 1.59 | (1.44 | ) | 79 | |||||||||||||||||||||||||||||||||
| 8.65 | 1.55 | 37,525 | 2.30 | 2.34 | (2.19 | ) | 79 | |||||||||||||||||||||||||||||||||
| 9.10 | 2.72 | 1,355,193 | 1.15 | 1.19 | (1.04 | ) | 79 | |||||||||||||||||||||||||||||||||
| 9.04 | 2.51 | 17,085 | 1.30 | 1.34 | (1.19 | ) | 79 | |||||||||||||||||||||||||||||||||
| 8.85 | 1.98 | 1,988 | 1.80 | 1.84 | (1.69 | ) | 79 | |||||||||||||||||||||||||||||||||
| The accompanying notes are an integral part of these financial statements. | 49 |
GOLDMAN SACHS COMMODITY STRATEGY FUND
Consolidated Financial Highlights
Selected Data for a Share Outstanding Throughout Each Period
| Income (loss) from investment operations | ||||||||||||||||||||||
| Year - Share Class | Net asset value, beginning of period | Net investment income (loss)(a) | Net realized and unrealized gain (loss) | Total from investment operations | Distributions to shareholders from net investment income | |||||||||||||||||
| FOR THE SIX MONTHS ENDED JUNE 30, (UNAUDITED) | ||||||||||||||||||||||
2017 - A | $ | 11.68 | $ | 0.01 | $ | (1.27 | ) | $ | (1.26 | ) | $ | (0.02 | ) | |||||||||
2017 - C | 11.15 | (0.03 | ) | (1.21 | ) | (1.24 | ) | — | ||||||||||||||
2017 - Institutional | 11.80 | 0.03 | (1.29 | ) | (1.26 | ) | (0.04 | ) | ||||||||||||||
2017 - IR | 11.81 | 0.03 | (1.29 | ) | (1.26 | ) | (0.04 | ) | ||||||||||||||
2017 - R | 11.51 | — | (e) | (1.25 | ) | (1.25 | ) | (0.01 | ) | |||||||||||||
2017 - R6 | 11.80 | 0.03 | (1.28 | ) | (1.25 | ) | (0.04 | ) | ||||||||||||||
| FOR THE FISCAL YEARS ENDED DECEMBER 31,* | ||||||||||||||||||||||
2016 - A | 10.49 | 0.02 | 1.23 | 1.25 | (0.06 | ) | ||||||||||||||||
2016 - C | 10.04 | (0.06 | ) | 1.17 | 1.11 | — | ||||||||||||||||
2016 - Institutional | 10.59 | 0.06 | 1.25 | 1.31 | (0.10 | ) | ||||||||||||||||
2016 - IR | 10.60 | 0.05 | 1.25 | 1.30 | (0.09 | ) | ||||||||||||||||
2016 - R | 10.35 | (0.01 | ) | 1.21 | 1.20 | (0.04 | ) | |||||||||||||||
2016 - R6 | 10.60 | 0.06 | 1.24 | 1.30 | (0.10 | ) | ||||||||||||||||
2015 - A | 15.58 | (0.03 | ) | (5.04 | ) | (5.07 | ) | (0.02 | ) | |||||||||||||
2015 - C | 14.99 | (0.13 | ) | (4.82 | ) | (4.95 | ) | — | ||||||||||||||
2015 - Institutional | 15.72 | 0.02 | (5.10 | ) | (5.08 | ) | (0.05 | ) | ||||||||||||||
2015 - IR | 15.74 | — | (e) | (5.08 | ) | (5.08 | ) | (0.06 | ) | |||||||||||||
2015 - R | 15.38 | (0.06 | ) | (4.97 | ) | (5.03 | ) | — | (e) | |||||||||||||
2015 - R6 (Commenced August 31, 2015) | 13.48 | 0.02 | (2.86 | ) | (2.84 | ) | (0.04 | ) | ||||||||||||||
2014 - A | 22.54 | (0.13 | ) | (6.83 | ) | (6.96 | ) | — | ||||||||||||||
2014 - C | 21.85 | (0.26 | ) | (6.60 | ) | (6.86 | ) | — | ||||||||||||||
2014 - Institutional | 22.69 | (0.04 | ) | (6.91 | ) | (6.95 | ) | (0.02 | ) | |||||||||||||
2014 - IR | 22.72 | (0.05 | ) | (6.93 | ) | (6.98 | ) | — | (e) | |||||||||||||
2014 - R | 22.31 | (0.16 | ) | (6.77 | ) | (6.93 | ) | — | ||||||||||||||
2013 - A | 22.94 | (0.21 | ) | (0.19 | ) | (0.40 | ) | — | ||||||||||||||
2013 - C | 22.40 | (0.36 | ) | (0.19 | ) | (0.55 | ) | — | ||||||||||||||
2013 - Institutional | 23.01 | (0.13 | ) | (0.19 | ) | (0.32 | ) | — | ||||||||||||||
2013 - IR | 23.06 | (0.15 | ) | (0.19 | ) | (0.34 | ) | — | ||||||||||||||
2013 - R | 22.76 | (0.25 | ) | (0.20 | ) | (0.45 | ) | — | ||||||||||||||
2012 - A | 23.53 | (0.14 | ) | (0.29 | ) | (0.43 | ) | (0.16 | ) | |||||||||||||
2012 - C | 23.12 | (0.32 | ) | (0.28 | ) | (0.60 | ) | (0.12 | ) | |||||||||||||
2012 - Institutional | 23.56 | (0.07 | ) | (0.28 | ) | (0.35 | ) | (0.20 | ) | |||||||||||||
2012 - IR | 23.63 | (0.11 | ) | (0.28 | ) | (0.39 | ) | (0.18 | ) | |||||||||||||
2012 - R | 23.38 | (0.20 | ) | (0.27 | ) | (0.47 | ) | (0.15 | ) | |||||||||||||
| * | All per share amounts representing data prior to November 6, 2015 have been restated to reflect a 4 to 1 reverse stock split which occurred on that date. |
| (a) | Calculated based on the average shares outstanding methodology. |
| (b) | Assumes investment at the net asset value at the beginning of the period, reinvestment of all distributions, a complete redemption of the investment at the net asset value at the end of the period and no sales or redemption charges. Total returns would be reduced if a sales or redemption charge was taken into account. Returns do not reflect the impact of taxes to shareholders relating to Fund distributions or the redemption of Fund shares. Total returns for periods less than one full year are not annualized. |
| (c) | The Fund’s portfolio turnover rate is calculated in accordance with regulatory requirements, without regard to transactions involving short term investments and certain derivatives. If such transactions were included, the Fund’s portfolio turnover rate may be higher. |
| (d) | Annualized. |
| (e) | Amount is less than $0.005 per share. |
| 50 | The accompanying notes are an integral part of these financial statements. |
GOLDMAN SACHS COMMODITY STRATEGY FUND
| Net asset value, end of period | Total return(b) | Net assets, end of period (in 000s) | Ratio of net expenses to average net assets | Ratio of total expenses to average net assets | Ratio of net investment income (loss) to average net assets | Portfolio turnover rate(c) | ||||||||||||||||||||||||||||||||||
| $ | 10.40 | (10.77 | )% | $ | 46,642 | 0.87 | %(d) | 1.04 | %(d) | 0.27 | %(d) | 41 | % | |||||||||||||||||||||||||||
| 9.91 | (11.12 | ) | 2,885 | 1.62 | (d) | 1.79 | (d) | (0.48 | )(d) | 41 | ||||||||||||||||||||||||||||||
| 10.50 | (10.67 | ) | 280,461 | 0.53 | (d) | 0.70 | (d) | 0.61 | (d) | 41 | ||||||||||||||||||||||||||||||
| 10.51 | (10.70 | ) | 10,891 | 0.62 | (d) | 0.78 | (d) | 0.54 | (d) | 41 | ||||||||||||||||||||||||||||||
| 10.25 | (10.89 | ) | 3,177 | 1.12 | (d) | 1.29 | (d) | 0.02 | (d) | 41 | ||||||||||||||||||||||||||||||
| 10.51 | (10.58 | ) | 1,372 | 0.51 | (d) | 0.68 | (d) | 0.63 | (d) | 41 | ||||||||||||||||||||||||||||||
| 11.68 | 11.91 | 60,944 | 0.90 | 1.07 | 0.19 | 145 | ||||||||||||||||||||||||||||||||||
| 11.15 | 11.02 | 3,858 | 1.65 | 1.82 | (0.56 | ) | 145 | |||||||||||||||||||||||||||||||||
| 11.80 | 12.32 | 326,270 | 0.56 | 0.72 | 0.53 | 145 | ||||||||||||||||||||||||||||||||||
| 11.81 | 12.21 | 5,265 | 0.65 | 0.82 | 0.44 | 145 | ||||||||||||||||||||||||||||||||||
| 11.51 | 11.60 | 4,419 | 1.14 | 1.34 | (0.07 | ) | 145 | |||||||||||||||||||||||||||||||||
| 11.80 | 12.25 | 1,907 | 0.54 | 0.72 | 0.54 | 145 | ||||||||||||||||||||||||||||||||||
| 10.49 | (32.43 | ) | 58,901 | 0.85 | 0.97 | (0.21 | ) | 506 | ||||||||||||||||||||||||||||||||
| 10.04 | (32.95 | ) | 4,578 | 1.60 | 1.72 | (0.97 | ) | 506 | ||||||||||||||||||||||||||||||||
| 10.59 | (32.38 | ) | 544,699 | 0.51 | 0.63 | 0.12 | 506 | |||||||||||||||||||||||||||||||||
| 10.60 | (32.15 | ) | 6,699 | 0.60 | 0.72 | 0.03 | 506 | |||||||||||||||||||||||||||||||||
| 10.35 | (32.88 | ) | 1,963 | 1.10 | 1.23 | (0.44 | ) | 506 | ||||||||||||||||||||||||||||||||
| 10.60 | (21.23 | ) | 1,336 | 0.51 | (d) | 0.64 | (d) | 0.35 | (d) | 506 | ||||||||||||||||||||||||||||||
| 15.58 | (31.03 | ) | 85,200 | 0.88 | 0.95 | (0.59 | ) | 234 | ||||||||||||||||||||||||||||||||
| 14.99 | (31.32 | ) | 8,149 | 1.62 | 1.71 | (1.27 | ) | 234 | ||||||||||||||||||||||||||||||||
| 15.72 | (30.62 | ) | 764,809 | 0.53 | 0.62 | (0.17 | ) | 234 | ||||||||||||||||||||||||||||||||
| 15.74 | (30.80 | ) | 7,740 | 0.61 | 0.71 | (0.24 | ) | 234 | ||||||||||||||||||||||||||||||||
| 15.38 | (31.00 | ) | 1,542 | 1.12 | 1.21 | (0.77 | ) | 234 | ||||||||||||||||||||||||||||||||
| 22.54 | (1.57 | ) | 401,248 | 0.92 | 0.95 | (0.91 | ) | 266 | ||||||||||||||||||||||||||||||||
| 21.85 | (2.50 | ) | 11,444 | 1.67 | 1.70 | (1.64 | ) | 266 | ||||||||||||||||||||||||||||||||
| 22.69 | (1.39 | ) | 1,039,008 | 0.58 | 0.61 | (0.56 | ) | 266 | ||||||||||||||||||||||||||||||||
| 22.72 | (1.39 | ) | 7,991 | 0.67 | 0.70 | (0.64 | ) | 266 | ||||||||||||||||||||||||||||||||
| 22.31 | (1.93 | ) | 1,528 | 1.17 | 1.20 | (1.13 | ) | 266 | ||||||||||||||||||||||||||||||||
| 22.94 | (1.91 | ) | 353,082 | 0.92 | 0.96 | (0.59 | ) | 690 | ||||||||||||||||||||||||||||||||
| 22.40 | (2.64 | ) | 13,994 | 1.67 | 1.71 | (1.39 | ) | 690 | ||||||||||||||||||||||||||||||||
| 23.01 | (1.57 | ) | 742,974 | 0.58 | 0.62 | (0.29 | ) | 690 | ||||||||||||||||||||||||||||||||
| 23.06 | (1.81 | ) | 7,045 | 0.67 | 0.71 | (0.45 | ) | 690 | ||||||||||||||||||||||||||||||||
| 22.76 | (2.14 | ) | 1,450 | 1.17 | 1.21 | (0.86 | ) | 690 | ||||||||||||||||||||||||||||||||
| The accompanying notes are an integral part of these financial statements. | 51 |
GOLDMAN SACHS DYNAMIC ALLOCATION FUND
Consolidated Financial Highlights
Selected Data for a Share Outstanding Throughout Each Period
| Income (loss) from investment operations | Distributions to shareholders | |||||||||||||||||||||||||||||
| Year - Share Class | Net asset value, beginning of period | Net investment income (loss)(a) | Net realized and unrealized gain (loss) | Total from investment operations | From net investment income | From net realized gains | Total distributions | |||||||||||||||||||||||
| FOR THE SIX MONTHS ENDED JUNE 30, (UNAUDITED) | ||||||||||||||||||||||||||||||
2017 - A | $ | 10.01 | $ | — | (d) | $ | 0.45 | $ | 0.45 | $ | — | $ | — | $ | — | |||||||||||||||
2017 - C | 9.55 | (0.03 | ) | 0.42 | 0.39 | — | — | — | ||||||||||||||||||||||
2017 - Institutional | 10.15 | 0.02 | 0.45 | 0.47 | — | — | — | |||||||||||||||||||||||
2017 - IR | 10.11 | 0.02 | 0.44 | 0.46 | — | — | — | |||||||||||||||||||||||
2017 - R | 9.89 | (0.01 | ) | 0.44 | 0.43 | — | — | — | ||||||||||||||||||||||
2017 - R6 | 10.15 | 0.03 | 0.44 | 0.47 | — | — | — | |||||||||||||||||||||||
| FOR THE FISCAL YEARS ENDED DECEMBER 31, | ||||||||||||||||||||||||||||||
2016 - A | 9.45 | (0.01 | ) | 0.57 | 0.56 | — | — | — | ||||||||||||||||||||||
2016 - C | 9.08 | (0.08 | ) | 0.55 | 0.47 | — | — | — | ||||||||||||||||||||||
2016 - Institutional | 9.54 | 0.03 | 0.58 | 0.61 | — | — | — | |||||||||||||||||||||||
2016 - IR | 9.52 | 0.01 | 0.58 | 0.59 | — | — | — | |||||||||||||||||||||||
2016 - R | 9.36 | (0.04 | ) | 0.57 | 0.53 | — | — | — | ||||||||||||||||||||||
2016 - R6 | 9.54 | 0.02 | 0.59 | 0.61 | — | — | — | |||||||||||||||||||||||
2015 - A | 10.49 | (0.04 | ) | (0.71 | ) | (0.75 | ) | (0.01 | ) | (0.28 | ) | (0.29 | ) | |||||||||||||||||
2015 - C | 10.15 | (0.11 | ) | (0.68 | ) | (0.79 | ) | — | (0.28 | ) | (0.28 | ) | ||||||||||||||||||
2015 - Institutional | 10.61 | — | (d) | (0.72 | ) | (0.72 | ) | (0.07 | ) | (0.28 | ) | (0.35 | ) | |||||||||||||||||
2015 - IR | 10.57 | (0.01 | ) | (0.72 | ) | (0.73 | ) | (0.04 | ) | (0.28 | ) | (0.32 | ) | |||||||||||||||||
2015 - R | 10.40 | (0.05 | ) | (0.71 | ) | (0.76 | ) | — | (0.28 | ) | (0.28 | ) | ||||||||||||||||||
2015 - R6 (Commenced August 3, 2015) | 10.46 | (0.01 | ) | (0.56 | ) | (0.57 | ) | (0.07 | ) | (0.28 | ) | (0.35 | ) | |||||||||||||||||
2014 - A | 10.89 | (0.08 | ) | 0.32 | 0.24 | (0.05 | ) | (0.59 | ) | (0.64 | ) | |||||||||||||||||||
2014 - C | 10.60 | (0.15 | ) | 0.29 | 0.14 | — | (0.59 | ) | (0.59 | ) | ||||||||||||||||||||
2014 - Institutional | 11.02 | (0.03 | ) | 0.32 | 0.29 | (0.11 | ) | (0.59 | ) | (0.70 | ) | |||||||||||||||||||
2014 - IR | 10.99 | (0.05 | ) | 0.31 | 0.26 | (0.09 | ) | (0.59 | ) | (0.68 | ) | |||||||||||||||||||
2014 - R | 10.83 | (0.10 | ) | 0.30 | 0.20 | (0.04 | ) | (0.59 | ) | (0.63 | ) | |||||||||||||||||||
2013 - A | 10.70 | (0.13 | ) | 0.68 | 0.55 | — | (0.36 | ) | (0.36 | ) | ||||||||||||||||||||
2013 - C | 10.50 | (0.20 | ) | 0.66 | 0.46 | — | (0.36 | ) | (0.36 | ) | ||||||||||||||||||||
2013 - Institutional | 10.78 | (0.08 | ) | 0.68 | 0.60 | — | (d) | (0.36 | ) | (0.36 | ) | |||||||||||||||||||
2013 - IR | 10.76 | (0.10 | ) | 0.69 | 0.59 | — | (0.36 | ) | (0.36 | ) | ||||||||||||||||||||
2013 - R | 10.67 | (0.15 | ) | 0.67 | 0.52 | — | (0.36 | ) | (0.36 | ) | ||||||||||||||||||||
2012 - A | 10.29 | (0.07 | ) | 0.86 | 0.79 | — | (0.38 | ) | (0.38 | ) | ||||||||||||||||||||
2012 - C | 10.18 | (0.14 | ) | 0.84 | 0.70 | — | (0.38 | ) | (0.38 | ) | ||||||||||||||||||||
2012 - Institutional | 10.35 | (0.04 | ) | 0.88 | 0.84 | (0.03 | ) | (0.38 | ) | (0.41 | ) | |||||||||||||||||||
2012 - IR | 10.33 | (0.03 | ) | 0.85 | 0.82 | (0.01 | ) | (0.38 | ) | (0.39 | ) | |||||||||||||||||||
2012 - R | 10.28 | (0.09 | ) | 0.86 | 0.77 | — | (0.38 | ) | (0.38 | ) | ||||||||||||||||||||
| (a) | Calculated based on the average shares outstanding methodology. |
| (b) | Assumes investment at the net asset value at the beginning of the period, reinvestment of all distributions, a complete redemption of the investment at the net asset value at the end of the period and no sales or redemption charges. Total returns would be reduced if a sales or redemption charge was taken into account. Returns do not reflect the impact of taxes to shareholders relating to Fund distributions or the redemption of Fund shares. Total returns for periods less than one full year are not annualized. |
| (c) | The Fund’s portfolio turnover rate is calculated in accordance with regulatory requirements, without regard to transactions involving short term investments and certain derivatives. If such transactions were included, the Fund’s portfolio turnover rate may be higher. |
| (d) | Amount is less than $0.005 per share. |
| (e) | Annualized. |
| (f) | Amount is less than 0.005%. |
| 52 | The accompanying notes are an integral part of these financial statements. |
GOLDMAN SACHS DYNAMIC ALLOCATION FUND
| Net asset value, end of period | Total return(b) | Net assets, end of period (in 000s) | Ratio of net expenses to average net assets | Ratio of total expenses to average net assets | Ratio of net investment income (loss) to average net assets | Portfolio turnover rate(c) | ||||||||||||||||||||||||||||||||||
| $ | 10.46 | 4.50 | % | $ | 18,696 | 1.15 | %(e) | 1.45 | %(e) | 0.04 | %(e) | 146 | % | |||||||||||||||||||||||||||
| 9.94 | 4.08 | 17,069 | 1.90 | (e) | 2.20 | (e) | (0.66 | )(e) | 146 | |||||||||||||||||||||||||||||||
| 10.62 | 4.63 | 356,325 | 0.75 | (e) | 1.05 | (e) | 0.47 | (e) | 146 | |||||||||||||||||||||||||||||||
| 10.57 | 4.55 | 10,226 | 0.90 | (e) | 1.20 | (e) | 0.46 | (e) | 146 | |||||||||||||||||||||||||||||||
| 10.32 | 4.35 | 12 | 1.38 | (e) | 1.70 | (e) | (0.12 | )(e) | 146 | |||||||||||||||||||||||||||||||
| 10.62 | 4.63 | 11 | 0.73 | (e) | 1.00 | (e) | 0.52 | (e) | 146 | |||||||||||||||||||||||||||||||
| 10.01 | 5.91 | 27,566 | 1.15 | 1.45 | (0.13 | ) | 272 | |||||||||||||||||||||||||||||||||
| 9.55 | 5.16 | 20,123 | 1.90 | 2.20 | (0.88 | ) | 272 | |||||||||||||||||||||||||||||||||
| 10.15 | 6.38 | 468,924 | 0.75 | 1.05 | 0.27 | 272 | ||||||||||||||||||||||||||||||||||
| 10.11 | 6.18 | 5,733 | 0.90 | 1.20 | 0.10 | 272 | ||||||||||||||||||||||||||||||||||
| 9.89 | 5.65 | 12 | 1.40 | 1.71 | (0.39 | ) | 272 | |||||||||||||||||||||||||||||||||
| 10.15 | 6.38 | 10 | 0.77 | 1.02 | 0.24 | 272 | ||||||||||||||||||||||||||||||||||
| 9.45 | (7.17 | ) | 43,167 | 1.13 | 1.43 | (0.39 | ) | 241 | ||||||||||||||||||||||||||||||||
| 9.08 | (7.82 | ) | 27,914 | 1.88 | 2.18 | (1.14 | ) | 241 | ||||||||||||||||||||||||||||||||
| 9.54 | (6.84 | ) | 510,789 | 0.73 | 1.03 | — | (f) | 241 | ||||||||||||||||||||||||||||||||
| 9.52 | (6.90 | ) | 9,933 | 0.88 | 1.18 | (0.14 | ) | 241 | ||||||||||||||||||||||||||||||||
| 9.36 | (7.35 | ) | 11 | 1.33 | 1.65 | (0.49 | ) | 241 | ||||||||||||||||||||||||||||||||
| 9.54 | (5.48 | ) | 9 | 0.77 | (e) | 0.97 | (e) | (0.21 | )(e) | 241 | ||||||||||||||||||||||||||||||
| 10.49 | 2.19 | 78,100 | 1.23 | 1.42 | (0.70 | ) | 211 | |||||||||||||||||||||||||||||||||
| 10.15 | 1.29 | 41,299 | 1.97 | 2.17 | (1.42 | ) | 211 | |||||||||||||||||||||||||||||||||
| 10.61 | 2.61 | 645,286 | 0.81 | 1.02 | (0.25 | ) | 211 | |||||||||||||||||||||||||||||||||
| 10.57 | 2.33 | 26,862 | 0.97 | 1.17 | (0.43 | ) | 211 | |||||||||||||||||||||||||||||||||
| 10.40 | 1.85 | 12 | 1.49 | 1.62 | (0.92 | ) | 211 | |||||||||||||||||||||||||||||||||
| 10.89 | 5.21 | 169,197 | 1.30 | 1.37 | (1.18 | ) | 311 | |||||||||||||||||||||||||||||||||
| 10.60 | 4.45 | 66,543 | 2.05 | 2.12 | (1.89 | ) | 311 | |||||||||||||||||||||||||||||||||
| 11.02 | 5.65 | 756,409 | 0.90 | 0.97 | (0.74 | ) | 311 | |||||||||||||||||||||||||||||||||
| 10.99 | 5.55 | 46,709 | 1.05 | 1.12 | (0.88 | ) | 311 | |||||||||||||||||||||||||||||||||
| 10.83 | 4.94 | 12 | 1.55 | 1.59 | (1.40 | ) | 311 | |||||||||||||||||||||||||||||||||
| 10.70 | 7.66 | 291,432 | 1.38 | 1.38 | (0.61 | ) | 177 | |||||||||||||||||||||||||||||||||
| 10.50 | 6.86 | 76,580 | 2.13 | 2.13 | (1.32 | ) | 177 | |||||||||||||||||||||||||||||||||
| 10.78 | 8.06 | 853,273 | 0.97 | 0.97 | (0.37 | ) | 177 | |||||||||||||||||||||||||||||||||
| 10.76 | 7.89 | 59,935 | 1.13 | 1.14 | (0.31 | ) | 177 | |||||||||||||||||||||||||||||||||
| 10.67 | 7.48 | 11 | 1.63 | 1.64 | (0.84 | ) | 177 | |||||||||||||||||||||||||||||||||
| The accompanying notes are an integral part of these financial statements. | 53 |
GOLDMAN SACHS MANAGED FUTURES STRATEGY FUND
Consolidated Financial Highlights
Selected Data for a Share Outstanding Throughout Each Period
| Income (loss) from investment operations | Distributions to shareholders | |||||||||||||||||||||||||||||
| Year - Share Class | Net asset value, beginning of period | Net investment loss(a) | Net realized and unrealized gain (loss) | Total from investment operations | From net investment income | From net realized gains | Total distributions | |||||||||||||||||||||||
| FOR THE SIX MONTHS ENDED JUNE 30, (UNAUDITED) | ||||||||||||||||||||||||||||||
2017 - A | $ | 10.12 | $ | (0.06 | ) | $ | 0.01 | $ | (0.05 | ) | $ | — | $ | — | $ | — | ||||||||||||||
2017 - C | 9.79 | (0.10 | ) | 0.01 | (0.09 | ) | — | — | — | |||||||||||||||||||||
2017 - Institutional | 10.29 | (0.04 | ) | 0.01 | (0.03 | ) | — | — | — | |||||||||||||||||||||
2017 - IR | 10.23 | (0.04 | ) | — | (0.04 | ) | — | — | — | |||||||||||||||||||||
2017 - R | 10.00 | (0.07 | ) | 0.02 | (0.05 | ) | — | — | — | |||||||||||||||||||||
| FOR THE FISCAL YEARS ENDED DECEMBER 31, | ||||||||||||||||||||||||||||||
2016 - A | 10.21 | (0.14 | ) | 0.05 | (0.09 | ) | — | — | — | |||||||||||||||||||||
2016 - C | 9.95 | (0.21 | ) | 0.05 | (0.16 | ) | — | — | — | |||||||||||||||||||||
2016 - Institutional | 10.36 | (0.10 | ) | 0.04 | (0.06 | ) | (0.01 | ) | — | (0.01 | ) | |||||||||||||||||||
2016 - IR | 10.30 | (0.11 | ) | 0.04 | (0.07 | ) | — | — | — | |||||||||||||||||||||
2016 - R | 10.12 | (0.16 | ) | 0.04 | (0.12 | ) | — | — | — | |||||||||||||||||||||
2015 - A | 9.67 | (0.16 | ) | 1.10 | 0.94 | (0.40 | ) | — | (0.40 | ) | ||||||||||||||||||||
2015 - C | 9.45 | (0.23 | ) | 1.07 | 0.84 | (0.34 | ) | — | (0.34 | ) | ||||||||||||||||||||
2015 - Institutional | 9.77 | (0.12 | ) | 1.12 | 1.00 | (0.41 | ) | — | (0.41 | ) | ||||||||||||||||||||
2015 - IR | 9.73 | (0.13 | ) | 1.11 | 0.98 | (0.41 | ) | — | (0.41 | ) | ||||||||||||||||||||
2015 - R | 9.59 | (0.18 | ) | 1.09 | 0.91 | (0.38 | ) | — | (0.38 | ) | ||||||||||||||||||||
2014 - A | 10.04 | (0.14 | ) | (0.14 | ) | (0.28 | ) | — | (0.09 | ) | (0.09 | ) | ||||||||||||||||||
2014 - C | 9.89 | (0.21 | ) | (0.14 | ) | (0.35 | ) | — | (0.09 | ) | (0.09 | ) | ||||||||||||||||||
2014 - Institutional | 10.11 | (0.11 | ) | (0.14 | ) | (0.25 | ) | — | (0.09 | ) | (0.09 | ) | ||||||||||||||||||
2014 - IR | 10.08 | (0.12 | ) | (0.14 | ) | (0.26 | ) | — | (0.09 | ) | (0.09 | ) | ||||||||||||||||||
2014 - R | 9.99 | (0.17 | ) | (0.14 | ) | (0.31 | ) | — | (0.09 | ) | (0.09 | ) | ||||||||||||||||||
2013 - A | 10.56 | (0.15 | ) | (0.37 | ) | (0.52 | ) | — | — | — | ||||||||||||||||||||
2013 - C | 10.48 | (0.22 | ) | (0.37 | ) | (0.59 | ) | — | — | — | ||||||||||||||||||||
2013 - Institutional | 10.59 | (0.11 | ) | (0.37 | ) | (0.48 | ) | — | — | — | ||||||||||||||||||||
2013 - IR | 10.58 | (0.13 | ) | (0.37 | ) | (0.50 | ) | — | — | — | ||||||||||||||||||||
2013 - R | 10.53 | (0.17 | ) | (0.37 | ) | (0.54 | ) | — | — | — | ||||||||||||||||||||
| FOR THE PERIOD ENDED DECEMBER 31, | ||||||||||||||||||||||||||||||
2012 - A (Commenced February 29, 2012) | 10.00 | (0.12 | ) | 0.68 | 0.56 | — | — | — | ||||||||||||||||||||||
2012 - C (Commenced February 29, 2012) | 10.00 | (0.19 | ) | 0.67 | 0.48 | — | — | — | ||||||||||||||||||||||
2012 - Institutional (Commenced February 29, 2012) | 10.00 | (0.09 | ) | 0.68 | 0.59 | — | — | — | ||||||||||||||||||||||
2012 - IR (Commenced February 29, 2012) | 10.00 | (0.10 | ) | 0.68 | 0.58 | — | — | — | ||||||||||||||||||||||
2012 - R (Commenced February 29, 2012) | 10.00 | (0.15 | ) | 0.68 | 0.53 | — | — | — | ||||||||||||||||||||||
| (a) | Calculated based on the average shares outstanding methodology. |
| (b) | Assumes investment at the net asset value at the beginning of the period, reinvestment of all distributions, a complete redemption of the investment at the net asset value at the end of the period and no sales or redemption charges. Total returns would be reduced if a sales or redemption charge was taken into account. Returns do not reflect the impact of taxes to shareholders relating to Fund distributions or the redemption of Fund shares. Total returns for periods less than one full year are not annualized. |
| (c) | The Fund’s portfolio turnover rate is calculated in accordance with regulatory requirements, without regard to transactions involving short term investments and certain derivatives. If such transactions were included, the Fund’s portfolio turnover rate may be higher. |
| (d) | Annualized. |
| 54 | The accompanying notes are an integral part of these financial statements. |
GOLDMAN SACHS MANAGED FUTURES STRATEGY FUND
| Net asset value, end of period | Total return(b) | Net assets, end of period (in 000s) | Ratio of net expenses to average net assets | Ratio of total expenses to average net assets | Ratio of net investment loss to average net assets | Portfolio turnover rate(c) | ||||||||||||||||||||||||||||||||||
| $ | 10.07 | (0.49 | )% | $ | 7,858 | 1.58 | %(d) | 1.78 | %(d) | (1.16 | )%(d) | — | % | |||||||||||||||||||||||||||
| 9.70 | (0.92 | ) | 3,144 | 2.33 | (d) | 2.53 | (d) | (1.89 | )(d) | — | ||||||||||||||||||||||||||||||
| 10.26 | (0.29 | ) | 83,725 | 1.18 | (d) | 1.38 | (d) | (0.74 | )(d) | — | ||||||||||||||||||||||||||||||
| 10.19 | (0.39 | ) | 23,162 | 1.33 | (d) | 1.53 | (d) | (0.87 | )(d) | — | ||||||||||||||||||||||||||||||
| 9.95 | (0.60 | ) | 441 | 1.83 | (d) | 2.03 | (d) | (1.37 | )(d) | — | ||||||||||||||||||||||||||||||
| 10.12 | (0.88 | ) | 23,174 | 1.55 | 1.74 | (1.33 | ) | 529 | ||||||||||||||||||||||||||||||||
| 9.79 | (1.60 | ) | 4,054 | 2.31 | 2.49 | (2.09 | ) | 529 | ||||||||||||||||||||||||||||||||
| 10.29 | (0.57 | ) | 110,763 | 1.16 | 1.34 | (0.94 | ) | 529 | ||||||||||||||||||||||||||||||||
| 10.23 | (0.68 | ) | 20,181 | 1.31 | 1.49 | (1.09 | ) | 529 | ||||||||||||||||||||||||||||||||
| 10.00 | (1.18 | ) | 309 | 1.81 | 1.99 | (1.59 | ) | 529 | ||||||||||||||||||||||||||||||||
| 10.21 | 9.69 | 24,000 | 1.56 | 1.84 | (1.53 | ) | 196 | |||||||||||||||||||||||||||||||||
| 9.95 | 8.93 | 3,056 | 2.30 | 2.60 | (2.28 | ) | 196 | |||||||||||||||||||||||||||||||||
| 10.36 | 10.24 | 87,820 | 1.14 | 1.46 | (1.12 | ) | 196 | |||||||||||||||||||||||||||||||||
| 10.30 | 10.08 | 6,489 | 1.31 | 1.60 | (1.26 | ) | 196 | |||||||||||||||||||||||||||||||||
| 10.12 | 9.47 | 197 | 1.79 | 2.11 | (1.77 | ) | 196 | |||||||||||||||||||||||||||||||||
| 9.67 | (2.75 | ) | 2,698 | 1.51 | 1.96 | (1.50 | ) | 343 | ||||||||||||||||||||||||||||||||
| 9.45 | (3.50 | ) | 897 | 2.26 | 2.69 | (2.26 | ) | 343 | ||||||||||||||||||||||||||||||||
| 9.77 | (2.43 | ) | 88,381 | 1.11 | 1.54 | (1.10 | ) | 343 | ||||||||||||||||||||||||||||||||
| 9.73 | (2.54 | ) | 391 | 1.26 | 1.69 | (1.25 | ) | 343 | ||||||||||||||||||||||||||||||||
| 9.59 | (3.06 | ) | 85 | 1.76 | 2.20 | (1.75 | ) | 343 | ||||||||||||||||||||||||||||||||
| 10.04 | (4.83 | ) | 1,344 | 1.46 | 2.64 | (1.54 | ) | — | ||||||||||||||||||||||||||||||||
| 9.89 | (5.63 | ) | 1,536 | 2.21 | 3.34 | (2.28 | ) | — | ||||||||||||||||||||||||||||||||
| 10.11 | (4.44 | ) | 106,635 | 1.07 | 2.18 | (1.12 | ) | — | ||||||||||||||||||||||||||||||||
| 10.08 | (4.64 | ) | 384 | 1.21 | 2.32 | (1.27 | ) | — | ||||||||||||||||||||||||||||||||
| 9.99 | (5.13 | ) | 89 | 1.69 | 2.82 | (1.79 | ) | — | ||||||||||||||||||||||||||||||||
| 10.56 | 5.50 | 272 | 1.44 | (d) | 8.63 | (d) | (1.47 | )(d) | — | |||||||||||||||||||||||||||||||
| 10.48 | 4.80 | 339 | 2.15 | (d) | 7.43 | (d) | (2.18 | )(d) | — | |||||||||||||||||||||||||||||||
| 10.59 | 5.80 | 19,401 | 1.06 | (d) | 8.04 | (d) | (1.09 | )(d) | — | |||||||||||||||||||||||||||||||
| 10.58 | 5.70 | 410 | 1.20 | (d) | 5.65 | (d) | (1.21 | )(d) | — | |||||||||||||||||||||||||||||||
| 10.53 | 5.30 | 11 | 1.72 | (d) | 8.98 | (d) | (1.75 | )(d) | — | |||||||||||||||||||||||||||||||
| The accompanying notes are an integral part of these financial statements. | 55 |
GOLDMAN SACHS SELECT SATELLITE FUNDS
June 30, 2017 (Unaudited)
| 1. ORGANIZATION |
Goldman Sachs Trust (the “Trust”) is a Delaware statutory trust registered under the Investment Company Act of 1940, as amended (the “Act”), as an open-end management investment company. The following table lists those series of the Trust that are included in this report (collectively, the “Funds” or individually a “Fund”), along with their corresponding share classes and respective diversification status under the Act:
| Fund | Share Classes Offered | Diversified/ Non-diversified | ||
Absolute Return Tracker | A, C, Institutional, IR, R and R6 | Diversified | ||
Commodity Strategy and Dynamic Allocation | A, C, Institutional, IR, R and R6 | Non-diversified | ||
Managed Futures Strategy | A, C, Institutional, IR and R | Non-diversified |
Class A Shares of the Absolute Return Tracker, Dynamic Allocation and Managed Futures Strategy Funds are sold with a front-end sales charge of up to 5.50%. Class A Shares of the Commodity Strategy Fund are sold with a front-end sales charge of up to 4.50%. Class C Shares are sold with a contingent deferred sales charge (“CDSC”) of 1.00%, which is imposed on redemptions made within 12 months of purchase. Institutional, Class IR, Class R and Class R6 Shares are not subject to a sales charge.
Goldman Sachs Asset Management, L.P. (“GSAM”), an affiliate of Goldman Sachs & Co. LLC (formerly Goldman, Sachs & Co.) (“Goldman Sachs”), serves as Investment Adviser to the Funds pursuant to management agreements (the “Agreements”) with the Trust.
| 2. SIGNIFICANT ACCOUNTING POLICIES |
The financial statements have been prepared in accordance with accounting principles generally accepted in the United States of America (“GAAP”) and require management to make estimates and assumptions that may affect the reported amounts and disclosures. Actual results may differ from those estimates and assumptions.
A. Basis of Consolidation for Absolute Return Tracker, Commodity Strategy, Dynamic Allocation and Managed Futures Strategy Funds — Cayman Commodity-ART, Ltd., Cayman Commodity-CSF, Ltd., Cayman Commodity-DAF, Ltd. and Cayman Commodity-MFS, Ltd. (each a “Subsidiary” and collectively, the “Subsidiaries”), Cayman Islands exempted companies, were incorporated on September 11, 2013, April 2, 2009, September 11, 2014 and June 16, 2016, respectively and are currently wholly-owned subsidiaries of the Absolute Return Tracker, Commodity Strategy, Dynamic Allocation and Managed Futures Strategy Funds, respectively. The Subsidiaries act as investment vehicles for the Funds to enable the Funds to gain exposure to certain types of commodity-linked derivative instruments. The Funds are the sole shareholders of the Subsidiaries pursuant to subscription agreements dated as of June 20, 2014, June 17, 2009, November 17, 2014 and July 18, 2016 respectively, and it is intended that each Fund will remain the sole shareholder and will continue to control its respective Subsidiary. Under the Memorandum and Articles of Association of each Subsidiary, shares issued by the Subsidiary confer upon a shareholder the right to vote at general meetings of the Subsidiary and certain rights in connection with any winding-up or repayment of capital, as well as the right to participate in the profits or assets of the Subsidiary. All inter-fund balances and transactions have been eliminated in consolidation.
56
GOLDMAN SACHS SELECT SATELLITE FUNDS
| 2. SIGNIFICANT ACCOUNTING POLICIES (continued) |
As of June 30, 2017, the Fund and Subsidiary net assets were as follows:
| Fund | Fund Net Assets | Subsidiary Net Assets | % Represented by Subsidiary’s Net Assets | |||
Absolute Return Tracker | $1,361,220,705 | $13,896,392 | 1% | |||
Commodity Strategy | 345,427,159 | 66,858,066 | 19 | |||
Dynamic Allocation | 402,338,824 | 11,359,342 | 3 | |||
Managed Futures Strategy | 118,330,492 | 23,586,183 | 20 |
B. Investment Valuation — The Funds’ valuation policy is to value investments at fair value.
C. Investment Income and Investments — Investment income includes interest income, dividend income and securities lending income. Interest income is accrued daily and adjusted for amortization of premiums and accretion of discounts. Dividend income is recognized on ex-dividend date or, for certain foreign securities, as soon as such information is obtained subsequent to the ex-dividend date. Investment transactions are reflected on trade date. Realized gains and losses are calculated using identified cost. Investment transactions are recorded on the following business day for daily net asset value (“NAV”) calculations. Investment income is recorded net of any foreign withholding taxes, less any amounts reclaimable. The Funds may file withholding tax reclaims in certain jurisdictions to recover a portion of amounts previously withheld. Any foreign capital gains tax is accrued daily based upon net unrealized gains, and is payable upon sale of such investments. Distributions received from the Funds’ investments in United States (“U.S.”) real estate investment trusts (“REITs”) may be characterized as ordinary income, net capital gain or a return of capital. A return of capital is recorded by the Funds as a reduction to the cost basis of the REIT.
For derivative contracts, realized gains and losses are recorded upon settlement of the contract. Upfront payments, if any, are made or received upon entering into a swap agreement and are reflected in the Consolidated Statements of Assets and Liabilities. Upfront payments are recognized over the contract’s term/event as realized gains or losses, with the exception of forward starting interest rate swaps whose realized gains or losses are recognized from the effective start date. For securities with paydown provisions, principal payments received are treated as a proportionate reduction to the cost basis of the securities, and excess or shortfall amounts are recorded as income. For treasury inflation protected securities (“TIPS”), adjustments to principal due to inflation/deflation are reflected as increases/decreases to interest income with a corresponding adjustment to cost.
D. Class Allocations and Expenses — Investment income, realized and unrealized gain (loss), and non-class specific expenses of each Fund are allocated daily based upon the proportion of net assets of each class. Non-class specific expenses directly incurred by a Fund are charged to that Fund, while such expenses incurred by the Trust are allocated across the applicable Funds on a straight-line and/or pro-rata basis depending upon the nature of the expenses. Class specific expenses, where applicable, are borne by the respective share classes and include Distribution and Service, Transfer Agency and Service and Shareholder Administration fees.
E. Federal Taxes and Distributions to Shareholders — It is each Fund’s policy to comply with the requirements of the Internal Revenue Code of 1986, as amended (the “Code”), applicable to regulated investment companies (mutual funds) and to distribute each year substantially all of its investment company taxable income and capital gains to its shareholders. Accordingly, each Fund is not required to make any provisions for the payment of federal income tax. Distributions to shareholders are recorded on the ex-dividend date. Income and capital gains distributions, if any, are declared and paid according to the following schedule:
| Fund | Income Distributions Declared/Paid | Capital Gains Distributions Declared/Paid | ||||
Absolute Return Tracker, Dynamic Allocation and Managed Futures Strategy | Annually | Annually | ||||
Commodity Strategy | Semi-Annually | Annually |
57
GOLDMAN SACHS SELECT SATELLITE FUNDS
Notes to Financial Statements (continued)
June 30, 2017 (Unaudited)
| 2. SIGNIFICANT ACCOUNTING POLICIES (continued) |
Net capital losses, if any, are carried forward to future fiscal years and may be used to the extent allowed by the Code to offset any future capital gains. Losses that are carried forward will retain their character as either short-term or long-term capital losses. Utilization of capital loss carryforwards will reduce the requirement of future capital gains distributions.
The Subsidiaries are classified as controlled foreign corporations under the Code. Therefore, the Funds are required to increase their taxable income by their share of their Subsidiary’s income. Net losses of a Subsidiary cannot be deducted by the Funds in the current period nor carried forward to offset taxable income in future periods.
The characterization of distributions to shareholders for financial reporting purposes is determined in accordance with federal income tax rules, which may differ from GAAP. The source of each Fund’s distributions may be shown in the accompanying financial statements as either from net investment income, net realized gain or capital. Certain components of the Funds’ net assets on the Consolidated Statements of Assets and Liabilities reflect permanent GAAP/tax differences based on the appropriate tax character.
F. Foreign Currency Translation — The accounting records and reporting currency of a Fund are maintained in U.S. dollars. Assets and liabilities denominated in foreign currencies are translated into U.S. dollars using the current exchange rates at the close of each business day. The effect of changes in foreign currency exchange rates on investments is included within net realized and unrealized gain (loss) on investments. Changes in the value of other assets and liabilities as a result of fluctuations in foreign exchange rates are included in the Consolidated Statements of Operations within net change in unrealized gain (loss) on foreign currency translations. Transactions denominated in foreign currencies are translated into U.S. dollars on the date the transaction occurred, the effects of which are included within net realized gain (loss) on foreign currency transactions.
| 3. INVESTMENTS AND FAIR VALUE MEASUREMENTS |
U.S. GAAP defines the fair value of a financial instrument as the amount that would be received to sell an asset or paid to transfer a liability in an orderly transaction between market participants at the measurement date (i.e., the exit price); the Funds’ policy is to use the market approach. GAAP establishes a fair value hierarchy that prioritizes the inputs to valuation techniques used to measure fair value. The hierarchy gives the highest priority to unadjusted quoted prices in active markets for identical assets or liabilities (Level 1 measurements) and the lowest priority to unobservable inputs (Level 3 measurements). The levels used for classifying investments are not necessarily an indication of the risk associated with investing in these investments. The three levels of the fair value hierarchy are described below:
Level 1 — Unadjusted quoted prices in active markets that are accessible at the measurement date for identical, unrestricted assets or liabilities;
Level 2 — Quoted prices in markets that are not active or financial instruments for which significant inputs are observable (including, but not limited to, quoted prices for similar investments, interest rates, foreign exchange rates, volatility and credit spreads), either directly or indirectly;
Level 3 — Prices or valuations that require significant unobservable inputs (including GSAM’s assumptions in determining fair value measurement).
Changes in valuation techniques may result in transfers into or out of an assigned level within the hierarchy. In accordance with the Funds’ policy, transfers between different levels of the fair value hierarchy resulting from such changes are deemed to have occurred as of the beginning of the reporting period.
The Board of Trustees (“Trustees”) has approved Valuation Procedures that govern the valuation of the portfolio investments held by the Funds, including investments for which market quotations are not readily available. The Trustees have delegated to GSAM day-to-day responsibility for implementing and maintaining internal controls and procedures related to the valuation of the Funds’ portfolio investments. To assess the continuing appropriateness of pricing sources and methodologies, GSAM regularly performs price verification procedures and issues challenges as necessary to third party pricing vendors or brokers, and any differences are reviewed in accordance with the Valuation Procedures.
58
GOLDMAN SACHS SELECT SATELLITE FUNDS
| 3. INVESTMENTS AND FAIR VALUE MEASUREMENTS (continued) |
A. Level 1 and Level 2 Fair Value Investments — The valuation techniques and significant inputs used in determining the fair values for investments classified as Level 1 and Level 2 are as follows:
Equity Securities — Equity securities traded on a U.S. securities exchange or the NASDAQ system, or those located on certain foreign exchanges, including but not limited to the Americas, are valued daily at their last sale price or official closing price on the principal exchange or system on which they are traded. If there is no sale or official closing price or such price is believed by GSAM to not represent fair value, equity securities are valued at the last bid price for long positions and at the last ask price for short positions. To the extent these investments are actively traded, they are classified as Level 1 of the fair value hierarchy, otherwise they are generally classified as Level 2.
Unlisted equity securities for which market quotations are available are valued at the last sale price on the valuation date, or if no sale occurs, at the last bid price. Securities traded on certain foreign securities exchanges are valued daily at fair value determined by an independent fair value service (if available) under Valuation Procedures approved by the Trustees and consistent with applicable regulatory guidance. The independent fair value service takes into account multiple factors including, but not limited to, movements in the securities markets, certain depositary receipts, futures contracts and foreign currency exchange rates that have occurred subsequent to the close of the foreign securities exchange. These investments are generally classified as Level 2 of the fair value hierarchy.
Underlying Funds (including Money Market Funds) — Underlying Funds (“Underlying Funds”) include other investment companies and exchange traded funds (“ETFs”). Investments in the Underlying Funds (except ETFs) are valued at the NAV per share of the Institutional Share class on the day of valuation. ETFs are valued daily at the last sale price or official closing price on the principal exchange or system on which the investment is traded. Because the Funds invest in Underlying Funds that fluctuate in value, the Funds’ shares will correspondingly fluctuate in value. To the extent these investments are actively traded, they are classified as Level 1 of the fair value hierarchy, otherwise they are generally classified as Level 2. For information regarding an Underlying Fund’s accounting policies and investment holdings, please see the Underlying Fund’s shareholder report.
Debt Securities — Debt securities for which market quotations are readily available are valued daily on the basis of quotations supplied by dealers or an independent pricing service approved by the Trustees. The pricing services may use valuation models or matrix pricing, which consider: (i) yield or price with respect to bonds that are considered comparable in characteristics such as rating, interest rate and maturity date or (ii) quotations from securities dealers to determine current value. With the exception of treasury securities of G8 countries, which are generally classified as Level 1, these investments are generally classified as Level 2 of the fair value hierarchy.
i. Mortgage-Backed and Asset-Backed Securities — Mortgage-backed securities represent direct or indirect participations in, or are collateralized by and payable from, mortgage loans secured by residential and/or commercial real estate property. Asset-backed securities include securities whose principal and interest payments are collateralized by pools of other assets or receivables. The value of certain mortgage-backed and asset-backed securities (including adjustable rate mortgage loans) may be particularly sensitive to changes in prevailing interest rates. The value of these securities may also fluctuate in response to the market’s perception of the creditworthiness of the issuers.
Asset-backed securities may present credit risks that are not presented by mortgage-backed securities because they generally do not have the benefit of a security interest in collateral that is comparable to mortgage assets. Some asset-backed securities may only have a subordinated claim on collateral.
Stripped mortgage-backed securities are usually structured with two different classes: one that receives substantially all interest payments (interest-only, or “IO” and/or high coupon rate with relatively low principal amount, or “IOette”), and the other that receives substantially all principal payments (principal-only, or “PO”) from a pool of mortgage loans. Little to no principal will be received at the maturity of an IO; as a result, periodic adjustments are recorded to reduce the cost of the security until maturity. These adjustments are included in interest income.
ii. Mortgage Dollar Rolls — Mortgage dollar rolls are transactions whereby a Fund sells mortgage-backed-securities and simultaneously contracts with the same counterparty to repurchase similar securities on a specified future date. During the
59
GOLDMAN SACHS SELECT SATELLITE FUNDS
Notes to Financial Statements (continued)
June 30, 2017 (Unaudited)
| 3. INVESTMENTS AND FAIR VALUE MEASUREMENTS (continued) |
settlement period, a Fund will not be entitled to accrue interest and receive principal payments on the securities sold. The Funds account for mortgage dollar roll transactions as purchases and sales and realize gains and losses on these transactions.
iii. Treasury Inflation Protected Securities — TIPS are treasury securities in which the principal amount is adjusted daily to keep pace with inflation, as measured by the U.S. Consumer Pricing Index for Urban Consumers. The repayment of the original bond principal upon maturity is guaranteed by the full faith and credit of the U.S. Government.
iv. When-Issued Securities and Forward Commitments — When-issued securities, including TBA (“To Be Announced”) securities, are securities that are authorized but not yet issued in the market and purchased in order to secure what is considered to be an advantageous price or yield to a Fund. A forward commitment involves entering into a contract to purchase or sell securities, typically on an extended settlement basis, for a fixed price at a future date. The purchase of securities on a when-issued or forward commitment basis involves a risk of loss if the value of the security to be purchased declines before the settlement date. Conversely, the sale of securities on a forward commitment basis involves the risk that the value of the securities sold may increase before the settlement date. Although a Fund will generally purchase securities on a when-issued or forward commitment basis with the intention of acquiring the securities for its portfolio, the Fund may dispose of when-issued securities or forward commitments prior to settlement, which may result in a realized gain or loss.
Derivative Contracts — A derivative is an instrument whose value is derived from underlying assets, indices, reference rates or a combination of these factors. A Fund enters into derivative transactions to hedge against changes in interest rates, securities prices, and/or currency exchange rates, to increase total return, or to gain access to certain markets or attain exposure to other underliers.
Exchange-traded derivatives, including futures and options contracts, are valued at the last sale or settlement price and typically fall within Level 1 of the fair value hierarchy. Over-the-counter (“OTC”) and centrally cleared derivatives are valued using market transactions and other market evidence, including market-based inputs to models, calibration to market-clearing transactions, broker or dealer quotations, or other alternative pricing sources. Where models are used, the selection of a particular model to value OTC and centrally cleared derivatives depends upon the contractual terms of, and specific risks inherent in, the instrument, as well as the availability of pricing information in the market. Valuation models require a variety of inputs, including contractual terms, market prices, yield curves, credit curves, measures of volatility, voluntary and involuntary prepayment rates, loss severity rates and correlations of such inputs. For OTC and centrally cleared derivatives that trade in liquid markets, model inputs can generally be verified and model selection does not involve significant management judgment. OTC and centrally cleared derivatives are classified within Level 2 of the fair value hierarchy when significant inputs are corroborated by market evidence.
i. Forward Contracts — A forward contract is a contract between two parties to buy or sell an asset at a specified price on a future date. A forward contract settlement can occur on a cash or delivery basis. Forward contracts are marked-to-market daily using independent vendor prices, and the change in value, if any, is recorded as an unrealized gain or loss. Cash and certain investments may be used to collateralize forward contracts.
A forward foreign currency contract is a forward contract in which a Fund agrees to receive or deliver a fixed quantity of one currency for another, at a pre-determined price at a future date. All forward foreign currency exchange contracts are marked-to-market daily at the applicable forward rate. Non-deliverable forward foreign currency exchange contracts are settled with the counterparty in cash without the delivery of foreign currency.
ii. Futures Contracts — Futures contracts are contracts to buy or sell a standardized quantity of a specified commodity or security and are valued based on exchanged settlement prices or independent market quotes. Futures contracts are valued at the last settlement price, or in the absence of a sale, the last bid price for long positions and at the last ask price for short positions, at the end of each day on the board of trade or exchange upon which they are traded. Upon entering into a futures contract, a Fund deposits cash or securities in an account on behalf of the broker in an amount sufficient to meet the initial margin requirement. Subsequent payments are made or received by a Fund equal to the daily change in the contract value and are recorded as variation margin receivable or payable with a corresponding offset to unrealized gains or losses. For financial reporting purposes, cash collateral that has been pledged to cover obligations of the Funds and cash collateral received, if any, is reported separately on the Consolidated Statements of Assets and Liabilities as receivables/payables for collateral on certain derivative contracts. Non-cash collateral pledged by the Funds, if any, is noted in the Consolidated Schedules of Investments.
60
GOLDMAN SACHS SELECT SATELLITE FUNDS
| 3. INVESTMENTS AND FAIR VALUE MEASUREMENTS (continued) |
iii. Options — When a Fund writes call or put options, an amount equal to the premium received is recorded as a liability and is subsequently marked-to-market to reflect the current value of the option written. Swaptions are options on interest rate swap contracts.
Upon the purchase of a call option or a put option by a Fund, the premium paid is recorded as an investment and subsequently marked-to-market to reflect the current value of the option. Certain options may be purchased with premiums to be determined on a future date. The premiums for these options are based upon implied volatility parameters at specified terms.
iv. Swap Contracts — Bilateral swap contracts are agreements in which a Fund and a counterparty agree to exchange periodic payments on a specified notional amount or make a net payment upon termination. Bilateral swap transactions are privately negotiated in the OTC market and payments are settled through direct payments between a Fund and the counterparty. By contrast, certain swap transactions are subject to mandatory central clearing. These swaps are executed through a derivatives clearing member (“DCM”), acting in an agency capacity, and submitted to a central counterparty (“CCP”) (“centrally cleared swaps”), in which case all payments are settled with the CCP through the DCM. Swaps are marked-to-market daily using pricing vendor quotations, counterparty or clearinghouse prices or model prices, and the change in value, if any, is recorded as an unrealized gain or loss. Upon entering into a swap contract, a Fund is required to satisfy an initial margin requirement by delivering cash or securities to the counterparty (or in some cases, segregated in a triparty account on behalf of the counterparty), which can be adjusted by any mark-to-market gains or losses pursuant to bilateral or centrally cleared arrangements. For centrally cleared swaps the daily change in valuation, if any, is recorded as a receivable or payable for variation margin.
An interest rate swap is an agreement that obligates two parties to exchange a series of cash flows at specified intervals, based upon or calculated by reference to changes in interest rates on a specified notional principal amount. The payment flows are usually netted against each other, with the difference being paid by one party to the other.
A credit default swap is an agreement that involves one party (the buyer of protection) making a stream of payments to another party (the seller of protection) in exchange for the right to receive protection on a reference security or obligation, including a group of assets or exposure to the performance of an index. A Fund’s investment in credit default swaps may involve greater risks than if the Fund had invested in the referenced obligation directly. Credit events are contract specific but may include bankruptcy, failure to pay, restructuring and obligation acceleration. If a Fund buys protection through a credit default swap and no credit event occurs, its payments are limited to the periodic payments previously made to the counterparty. Upon the occurrence of a specified credit event, a Fund, as a buyer of credit protection, is entitled to receive an amount equal to the notional amount of the swap and deliver to the seller the defaulted reference obligation in a physically settled trade. A Fund may also receive a net settlement amount in the form of cash or securities equal to the notional amount of the swap reduced by the recovery value of the reference obligation in a cash settled trade.
As a seller of protection, a Fund generally receives a payment stream throughout the term of the swap, provided that there is no credit event. In addition, if a Fund sells protection through a credit default swap, a Fund could suffer a loss because the value of the referenced obligation and the premium payments received may be less than the notional amount of the swap paid to the buyer of protection. Upon the occurrence of a specified credit event, a Fund, as a seller of credit protection, may be required to take possession of the defaulted reference obligation and pay the buyer an amount equal to the notional amount of the swap in a physically settled trade. A Fund may also pay a net settlement amount in the form of cash or securities equal to the notional amount of the swap reduced by the recovery value of the reference obligation in a cash settled trade. Recovery values are at times established through the credit event auction process in which market participants are ensured that a transparent price has been set for the defaulted security or obligation. In addition, a Fund is entitled to a return of any assets, which have been pledged as collateral to the counterparty upon settlement.
The maximum potential amount of future payments (undiscounted) that a Fund as seller of protection could be required to make under a credit default swap would be an amount equal to the notional amount of the agreement. These potential amounts would be partially offset by any recovery values of the respective referenced obligations or net amounts received from a settlement of a credit default swap for the same reference security or obligation where a Fund bought credit protection.
61
GOLDMAN SACHS SELECT SATELLITE FUNDS
Notes to Financial Statements (continued)
June 30, 2017 (Unaudited)
| 3. INVESTMENTS AND FAIR VALUE MEASUREMENTS (continued) |
A total return swap is an agreement that gives a Fund the right to receive the appreciation in the value of a specified security, index or other instrument in return for a fee paid to the counterparty, which will typically be an agreed upon interest rate. If the underlying asset declines in value over the term of the swap, a Fund may also be required to pay the dollar value of that decline to the counterparty.
Short Term Investments — Short-term investments having a maturity of 60 days or less are valued using available market quotations as provided by a third party pricing vendor or broker. These investments are classified as Level 2 of the fair value hierarchy.
B. Level 3 Fair Value Investments — To the extent that significant inputs to valuation models and other alternative pricing sources are unobservable, or if quotations are not readily available, or if GSAM believes that such quotations do not accurately reflect fair value, the fair value of a Fund’s investments may be determined under Valuation Procedures approved by the Trustees. GSAM, consistent with its procedures and applicable regulatory guidance, may make an adjustment to the most recent valuation prices of either domestic or foreign securities in light of significant events to reflect what it believes to be the fair value of the securities at the time of determining a Fund’s NAV. Significant events which could affect a large number of securities in a particular market may include, but are not limited to: significant fluctuations in U.S. or foreign markets; market dislocations; market disruptions; or unscheduled market closings. Significant events which could also affect a single issuer may include, but are not limited to: corporate actions such as reorganizations, mergers and buy-outs; ratings downgrades; and bankruptcies.
C. Fair Value Hierarchy — The following is a summary of the Funds’ investments and derivatives classified in the fair value hierarchy as of June 30, 2017:
| ABSOLUTE RETURN TRACKER | ||||||||||||
| Investment Type | Level 1 | Level 2 | Level 3 | |||||||||
| Assets | ||||||||||||
Common Stock and/or Other Equity Investments(a) | ||||||||||||
North America | $ | 154,683,988 | $ | — | $ | — | ||||||
Exchange Traded Funds | 116,353,007 | — | — | |||||||||
Investment Company | 1,003,357,451 | — | — | |||||||||
Securities Lending Reinvestment Vehicle | 8,001,950 | — | — | |||||||||
| Total | $ | 1,282,396,396 | $ | — | $ | — | ||||||
| Derivative Type | ||||||||||||
| Assets(b) | ||||||||||||
Forward Foreign Currency Exchange Contracts | $ | — | $ | 571,355 | $ | — | ||||||
Futures Contracts | 437,817 | — | — | |||||||||
Credit Default Swap Contracts | — | 1,746,004 | — | |||||||||
Total Return Swap Contracts | — | 537,177 | — | |||||||||
| Total | $ | 437,817 | $ | 2,854,536 | $ | — | ||||||
| Liabilities | ||||||||||||
Forward Foreign Currency Exchange Contracts(b) | $ | — | $ | (99,186 | ) | $ | — | |||||
Futures Contracts(b) | (6,286,063 | ) | — | — | ||||||||
Total Return Swap Contracts(b) | — | (940,797 | ) | — | ||||||||
Written Options Contracts | (1,605,617 | ) | — | — | ||||||||
| Total | $ | (7,891,680 | ) | $ | (1,039,983 | ) | $ | — | ||||
62
GOLDMAN SACHS SELECT SATELLITE FUNDS
| 3. INVESTMENTS AND FAIR VALUE MEASUREMENTS (continued) |
| COMMODITY STRATEGY | ||||||||||||
| Investment Type | Level 1 | Level 2 | Level 3 | |||||||||
| Assets | ||||||||||||
Fixed Income | ||||||||||||
Mortgage-Backed Securities | $ | — | $ | 16,402,602 | $ | — | ||||||
Collateralized Mortgage Obligations | — | 31,381,858 | — | |||||||||
Asset-Backed Securities | — | 405,348 | — | |||||||||
U.S. Treasury Obligations and/or Other U.S. Government Agencies | 88,932,365 | — | — | |||||||||
Investment Company | 152,438,772 | — | — | |||||||||
| Total | $ | 241,371,137 | $ | 48,189,808 | $ | — | ||||||
| Derivative Type | ||||||||||||
| Assets(b) | ||||||||||||
Futures Contracts | $ | 227,616 | $ | — | $ | — | ||||||
Interest Rate Swap Contracts | — | 46,639 | — | |||||||||
Total Return Swap Contracts | — | 2,909,509 | — | |||||||||
| Total | $ | 227,616 | $ | 2,956,148 | $ | — | ||||||
| Liabilities(b) | ||||||||||||
Futures Contracts | $ | (522,323 | ) | $ | — | $ | — | |||||
Interest Rate Swap Contracts | — | (116,214 | ) | — | ||||||||
Total Return Swap Contracts | — | (4,611,432 | ) | — | ||||||||
| Total | $ | (522,323 | ) | $ | (4,727,646 | ) | $ | — | ||||
| DYNAMIC ALLOCATION | ||||||||||||
| Investment Type | Level 1 | Level 2 | Level 3 | |||||||||
| Assets | ||||||||||||
Common Stock and/or Other Equity Investments(a) | ||||||||||||
Asia | $ | — | $ | 45,502,773 | $ | — | ||||||
Europe | — | 6,771,673 | — | |||||||||
North America | 10,330,365 | — | — | |||||||||
Fixed Income | ||||||||||||
U.S. Treasury Obligations and/or Other U.S. Government Agencies | 12,156,912 | — | — | |||||||||
Investment Company | 293,105,652 | — | — | |||||||||
Securities Lending Reinvestment Vehicle | 163,400 | — | — | |||||||||
| Total | $ | 315,756,329 | $ | 52,274,446 | $ | — | ||||||
63
GOLDMAN SACHS SELECT SATELLITE FUNDS
Notes to Financial Statements (continued)
June 30, 2017 (Unaudited)
| 3. INVESTMENTS AND FAIR VALUE MEASUREMENTS (continued) |
| DYNAMIC ALLOCATION (continued) | ||||||||||||
| Derivative Type | Level 1 | Level 2 | Level 3 | |||||||||
| Assets(b) | ||||||||||||
Forward Foreign Currency Exchange Contracts | $ | — | $ | 1,049,804 | $ | — | ||||||
Futures Contracts | 563,953 | — | — | |||||||||
Credit Default Swap Contracts | — | 96,200 | — | |||||||||
Total Return Swap Contracts | — | 120,957 | — | |||||||||
| Total | $ | 563,953 | $ | 1,266,961 | $ | — | ||||||
| Liabilities(b) | ||||||||||||
Forward Foreign Currency Exchange Contracts | $ | — | $ | (283,244 | ) | $ | — | |||||
Futures Contracts | (3,553,004 | ) | — | — | ||||||||
Interest Rate Swap Contract | — | (745,084 | ) | — | ||||||||
Total Return Swap Contracts | — | (299,041 | ) | — | ||||||||
| Total | $ | (3,553,004 | ) | $ | (1,327,369 | ) | $ | — | ||||
| MANAGED FUTURES STRATEGY | ||||||||||||
| Investment Type | Level 1 | Level 2 | Level 3 | |||||||||
| Assets | ||||||||||||
Investment Company | $ | 91,639,677 | $ | — | $ | — | ||||||
| Derivative Type | ||||||||||||
| Assets(b) | ||||||||||||
Forward Foreign Currency Exchange Contracts | $ | — | $ | 923,036 | $ | — | ||||||
Futures Contracts | 666,939 | — | — | |||||||||
Interest Rate Swap Contracts | — | 6,380,444 | — | |||||||||
| Total | $ | 666,939 | $ | 7,303,480 | $ | — | ||||||
| Liabilities(b) | ||||||||||||
Forward Foreign Currency Exchange Contracts | $ | — | $ | (1,213,862 | ) | $ | — | |||||
Futures Contracts | (1,095,549 | ) | — | — | ||||||||
Interest Rate Swap Contracts | — | (1,769,315 | ) | — | ||||||||
| Total | $ | (1,095,549 | ) | $ | (2,983,177 | ) | $ | — | ||||
| (a) | Amounts are disclosed by continent to highlight the impact of time zone differences between local market close and the calculation of NAV. Security valuations are based on the principal exchange or system on which they are traded, which may differ from country of domicile noted in the table. The Funds utilize fair value model prices provided by an independent fair value service for international equities securities, resulting in a Level 2 classification. |
| (b) | Amount shown represents unrealized gain (loss) at period end. |
For further information regarding security characteristics, see the Schedules of Investments.
64
GOLDMAN SACHS SELECT SATELLITE FUNDS
| 4. INVESTMENTS IN DERIVATIVES |
The following tables set forth, by certain risk types, the gross value of derivative contracts as of June 30, 2017. These instruments were used as part of the Funds’ investment strategies and to obtain and/or manage exposure related to the risks below. The values in the tables below exclude the effects of cash collateral received or posted pursuant to these derivative contracts, and therefore are not representative of the Funds’ net exposure.
| ABSOLUTE RETURN TRACKER | ||||||||||||
| Risk | Consolidated Statements of Assets and Liabilities | Assets | Consolidated Statements of Assets and Liabilities | Liabilities | ||||||||
Commodity | Receivable for unrealized gain on swap contracts and variation margin on certain derivative contracts | $ | 184,007 | (a) | Variation margin on certain derivative contracts | $ | (798,305) | (a) | ||||
Credit | Variation margin on certain derivative contracts | 1,746,004 | (a) | — | — | |||||||
Currency | Receivable for unrealized gain on forward foreign currency exchange contracts | 571,355 | Payable for unrealized loss on forward foreign currency exchange contracts | (99,186) | ||||||||
Equity | Receivable for unrealized gain on swap contracts and Variation margin on certain derivative contracts | 675,350 | (a) | Payable for unrealized loss on swap contracts, Written options, at value and Variation margin on certain derivative contracts | (6,806,182) | (a)(b) | ||||||
Interest Rate | Variation margin on certain derivative contracts | 115,637 | (a) | Variation margin on certain derivative contracts | (1,227,990) | (a) | ||||||
| Total | $ | 3,292,353 | $ | (8,931,663) | ||||||||
| COMMODITY STRATEGY | ||||||||||||
| Risk | Consolidated Statements of Assets and Liabilities | Assets | Consolidated Statements of Assets and Liabilities | Liabilities | ||||||||
Commodity | Receivable for unrealized gain on swap contracts | $ | 2,909,509 | Payable for unrealized loss on swap contracts | $ | (4,611,432) | (b) | |||||
Interest Rate | Variation margin on certain derivative contracts | 274,255 | (a) | Variation margin on certain derivative contracts | (638,537) | (a) | ||||||
| Total | $ | 3,183,764 | $ | (5,249,969) | ||||||||
65
GOLDMAN SACHS SELECT SATELLITE FUNDS
Notes to Financial Statements (continued)
June 30, 2017 (Unaudited)
| 4. INVESTMENTS IN DERIVATIVES (continued) |
| DYNAMIC ALLOCATION | ||||||||||||
| Risk | Consolidated Statements of Assets and Liabilities | Assets | Consolidated Statements of Assets and Liabilities | Liabilities | ||||||||
Commodity | Receivable for unrealized gain on swap contracts and variation margin on certain derivative contracts | $ | 253,593 | (a) | Payable for unrealized loss on swap contracts and variation margin on certain derivative contracts | $ | (362,411) | (a)(b) | ||||
Credit | Variation margin on certain derivative contracts | 96,200 | (a) | — | — | |||||||
Currency | Receivable for unrealized gain on forward foreign currency exchange contracts | 1,049,804 | Payable for unrealized loss on forward foreign currency exchange contracts | (283,244) | ||||||||
Equity | Variation margin on certain derivative contracts | 187,174 | (a) | Payable for unrealized loss on swap contracts and variation margin on certain derivative contracts | (2,571,184) | (a)(b) | ||||||
Interest Rate | Variation margin on certain derivative contracts | 244,143 | (a) | Variation margin on certain derivative contracts | (1,663,534) | (a) | ||||||
| Total | $ | 1,830,914 | $ | (4,880,373) | ||||||||
| MANAGED FUTURES STRATEGY | ||||||||||||
| Risk | Consolidated Statements of Assets and Liabilities | Assets | Consolidated Statements of Assets and Liabilities | Liabilities | ||||||||
Commodity | Variation margin on certain derivative contracts | $ | 506,593 | (a) | Variation margin on certain derivative contracts | $ | (520,682) | (a) | ||||
Currency | Receivable for unrealized gain on forward foreign currency exchange contracts | 923,036 | Payable for unrealized loss on forward foreign currency exchange contracts | (1,213,862) | ||||||||
Equity | Variation margin on certain derivative contracts | 160,346 | (a) | Variation margin on certain derivative contracts | (574,867) | (a) | ||||||
Interest Rate | Variation margin on certain derivative contracts | 6,380,444 | (a) | Variation margin on certain derivative contracts | (1,769,315) | (a) | ||||||
| Total | $ | 7,970,419 | $ | (4,078,726) | ||||||||
| (a) | Includes unrealized gain (loss) on futures contracts and centrally cleared swap contracts described in the Additional Investment Information sections of the Consolidated Schedules of Investments. Only the variation margin as of June 30, 2017 is reported within the Consolidated Statements of Assets and Liabilities. |
| (b) | Aggregate of amounts include $940,797, $4,611,432 and $299,041 for the Absolute Return Tracker, Commodity Strategy and Dynamic Allocation Funds, respectively, which represent the payments to be made pursuant to bilateral agreements should counterparties exercise their “right to terminate” provisions based on, among others, the Funds’ performance, their failure to pay on their obligations or failure to pledge collateral. Such amounts do not include incremental charges directly associated with the close-out of the agreements. They also do not reflect the fair value of any assets pledged as collateral which, through the daily margining process, substantially offsets the aforementioned amounts and for which the Funds are entitled to a full return. |
66
GOLDMAN SACHS SELECT SATELLITE FUNDS
| 4. INVESTMENTS IN DERIVATIVES (continued) |
The following tables set forth, by certain risk types, the Funds’ gains (losses) related to these derivatives and their indicative volumes for the six months ended June 30, 2017. These gains (losses) should be considered in the context that these derivative contracts may have been executed to create investment opportunities and/or economically hedge certain investments, and accordingly, certain gains (losses) on such derivative contracts may offset certain (losses) gains attributable to investments. These gains (losses) are included in “Net realized gain (loss)” or “Net change in unrealized gain (loss)” on the Consolidated Statements of Operations:
| ABSOLUTE RETURN TRACKER | ||||||||||||||
| Risk | Consolidated Statements of Operations | Net Realized Gain (Loss) | Net Change in Unrealized Gain (Loss) | Average Number of Contracts(a) | ||||||||||
| Commodity | Net realized gain (loss) from futures contracts and swap contracts/Net change in unrealized gain (loss) on futures contracts and swap contracts | $ | (1,366,292 | ) | $ | (674,789 | ) | 495 | ||||||
| Credit | Net realized gain (loss) from swap contracts/Net change in unrealized gain (loss) on swap contracts | 8,006,924 | (1,426,631 | ) | 4 | |||||||||
| Currency | Net realized gain (loss) from forward foreign currency exchange contracts/Net change in unrealized gain (loss) on forward foreign currency exchange contracts | (2,248,129 | ) | 611,098 | 32 | |||||||||
| Equity | Net realized gain (loss) from futures contracts, swap contracts and written options/Net change in unrealized gain (loss) on futures contracts, swap contracts and written options | 19,945,759 | (5,944,271 | ) | 4,336 | |||||||||
| Interest rate | Net realized gain (loss) from futures contracts/Net change in unrealized gain (loss) on futures contracts | (2,056,057 | ) | (1,819,745 | ) | 2,372 | ||||||||
| Total | $ | 22,282,205 | $ | (9,254,338 | ) | 7,239 | ||||||||
| COMMODITY STRATEGY | ||||||||||||||
| Risk | Consolidated Statements of Operations | Net Realized Gain (Loss) | Net Change in Unrealized Gain (Loss) | Average Number of | ||||||||||
| Commodity | Net realized gain (loss) from swap contracts/Net change in unrealized gain (loss) on swap contracts | $ | (22,242,034 | ) | $ | (19,749,751 | ) | 5 | ||||||
| Interest rate | Net realized gain (loss) from futures contracts and swap contracts/Net change in unrealized gain (loss) on futures contracts and swap contracts | (1,327,808 | ) | (560,383 | ) | 1,365 | ||||||||
| Total | $ | (23,569,842 | ) | $ | (20,310,134 | ) | 1,370 | |||||||
67
GOLDMAN SACHS SELECT SATELLITE FUNDS
Notes to Financial Statements (continued)
June 30, 2017 (Unaudited)
| 4. INVESTMENTS IN DERIVATIVES (continued) |
| DYNAMIC ALLOCATION | ||||||||||||||
| Risk | Consolidated Statements of Operations | Net Realized Gain (Loss) | Net Change in Unrealized Gain (Loss) | Average Number of Contracts(a) | ||||||||||
| Commodity | Net realized gain (loss) from futures contracts and swap contracts/Net change in unrealized gain (loss) on futures contracts and swap contracts | $ | (1,075,984 | ) | $ | (609,644 | ) | 209 | ||||||
| Credit | Net realized gain (loss) from swap contracts/Net change in unrealized gain (loss) on swap contracts | 3,622,710 | (1,780,296 | ) | 2 | |||||||||
| Currency | Net realized gain (loss) from forward foreign currency exchange contracts/Net change in unrealized gain (loss) on forward foreign currency exchange contracts | (4,130,291 | ) | (1,887,442 | ) | 27 | ||||||||
| Equity | Net realized gain (loss) from futures contracts and swap contracts/Net change in unrealized gain (loss) on futures contracts and swap contracts | 11,796,245 | (1,968,265 | ) | 2,596 | |||||||||
| Interest rate | Net realized gain (loss) from futures contracts and swap contracts/Net change in unrealized gain (loss) on futures contracts and swap contracts | (3,812,984 | ) | 5,009,194 | 538 | |||||||||
| Total | $ | 6,399,696 | $ | (1,236,453 | ) | 3,372 | ||||||||
| MANAGED FUTURES STRATEGY | ||||||||||||||
| Risk | Consolidated Statements of Operations | Net Realized Gain (Loss) | Net Change in Unrealized Gain (Loss) | Average Number of Contracts(a) | ||||||||||
| Commodity | Net realized gain (loss) from futures contracts/Net change in unrealized gain (loss) on futures contracts | $ | (1,418,283 | ) | $ | (66,714 | ) | 928 | ||||||
| Currency | Net realized gain (loss) from forward foreign currency exchange contracts/Net change in unrealized gain (loss) on forward foreign currency exchange contracts | (1,337,045 | ) | (1,772,578 | ) | 213 | ||||||||
| Equity | Net realized gain (loss) from futures contracts/Net change in unrealized gain (loss) on futures contracts | 6,865,473 | (1,131,449 | ) | 3,522 | |||||||||
| Interest rate | Net realized gain (loss) from futures contracts and swap contracts/Net change in unrealized gain (loss) on swap contracts | 2,760,766 | (3,334,774 | ) | 218 | |||||||||
| Total | $ | 6,870,911 | $ | (6,305,515 | ) | 4,881 | ||||||||
| (a) | Average number of contracts is based on the average of month end balances for the six months ended June 30, 2017. |
In order to better define its contractual rights and to secure rights that will help a Fund mitigate its counterparty risk, a Fund may enter into an International Swaps and Derivatives Association, Inc. Master Agreement (“ISDA Master Agreement”) or similar agreement with its derivatives counterparties. An ISDA Master Agreement is a bilateral agreement between a Fund and a counterparty that governs OTC derivatives (including forward foreign currency exchange contracts, and certain options and swaps), and typically contains, among other things, collateral posting terms and netting provisions in the event of a default and/or termination event. The provisions of the ISDA Master Agreement typically permit a single net payment in the event of a default (close-out netting) or similar event, including the bankruptcy or insolvency of the counterparty.
Collateral and margin requirements differ between exchange traded derivatives and OTC derivatives. Margin requirements are established by the broker or clearing house for exchange-traded and centrally cleared derivatives (financial futures contracts, options and centrally cleared swaps) pursuant to governing agreements for those instrument types. Brokers can ask for margin in excess of the minimum in certain circumstances. Collateral terms are contract-specific for OTC derivatives. For derivatives traded under an ISDA Master Agreement, the collateral requirements are typically calculated by netting the marked to market amount for
68
GOLDMAN SACHS SELECT SATELLITE FUNDS
| 4. INVESTMENTS IN DERIVATIVES (continued) |
each transaction under such agreement and comparing that amount to the value of any collateral currently pledged by a Fund and the counterparty. Additionally, a Fund may be required to post initial margin to the counterparty, the terms of which would be outlined in the confirmation of the OTC transaction.
For financial reporting purposes, cash collateral that has been pledged to cover obligations of a Fund and cash collateral received from the counterparty, if any, is reported separately on the Consolidated Statements of Assets and Liabilities as receivables/payables for collateral on certain derivative contracts. Non-cash collateral pledged by a Fund, if any, is noted in the Schedules of Investments. Generally, the amount of collateral due from or to a counterparty must exceed a minimum transfer amount threshold before a transfer is required to be made. To the extent amounts due to a Fund from its counterparties are not fully collateralized, contractually or otherwise, the Fund bears the risk of loss from counterparty nonperformance. A Fund attempts to mitigate counterparty risk by only entering into agreements with counterparties that the Investment Adviser believes to be of good standing and by monitoring the financial stability of those counterparties.
Additionally, the netting of assets and liabilities and the offsetting of collateral pledged or received are based on contractual netting/set-off provisions in the ISDA Master Agreement or similar agreements. However, in the event of a default or insolvency of a counterparty, a court could determine that such rights are not enforceable due to the restrictions or prohibitions against the right of setoff that may be imposed in accordance with a particular jurisdiction’s bankruptcy or insolvency laws.
The following tables set forth the Funds’ net exposure for derivative instruments that are subject to enforceable master netting arrangements or similar agreements as of June 30, 2017:
| COMMODITY STRATEGY | ||||||||||||||||||||||
| Derivative Assets(1) | Derivative Liabilities(1) | Net Derivative Assets (Liabilities) | Collateral (Received) Pledged(1) | Net Amount(2) | ||||||||||||||||||
| Counterparty | Swaps | Swaps | ||||||||||||||||||||
| Macquarie Bank Ltd. | $ | — | $ | (1,647,975 | ) | $ | (1,647,975 | ) | $ | 1,647,975 | $ | — | ||||||||||
| Merrill Lynch International | — | (2,308,348 | ) | (2,308,348 | ) | 2,308,348 | — | |||||||||||||||
| Societe Generale SA | 2,909,509 | — | 2,909,509 | — | 2,909,509 | |||||||||||||||||
| UBS AG | — | (655,109 | ) | (655,109 | ) | 655,109 | — | |||||||||||||||
| Total | $ | 2,909,509 | $ | (4,611,432 | ) | $ | (1,701,923 | ) | $ | 4,611,432 | $ | 2,909,509 | ||||||||||
| MANAGED FUTURES STRATEGY | ||||||||||||||||||||||
| Derivative Assets(1) | Derivative Liabilities(1) | Net Derivative Assets (Liabilities) | Collateral (Received) Pledged(1) | Net Amount(2) | ||||||||||||||||||
| Counterparty | Forwards | Forwards | ||||||||||||||||||||
| Morgan Stanley Co., Inc. | $ | 923,036 | $ | (1,213,862 | ) | $ | (290,826 | ) | $ | 1,213,862 | $ | 923,036 | ||||||||||
| (1) | Gross amounts available for offset but not netted in the Consolidated Statements of Assets and Liabilities. |
| (2) | Net amount represents the net amount due (to) from counterparty in the event of a default based on the contractual set-off rights under the agreement. |
| 5. AGREEMENTS AND AFFILIATED TRANSACTIONS |
A. Management Agreement — Under the Agreement, GSAM manages the Funds, subject to the general supervision of the Trustees.
As compensation for the services rendered pursuant to the Agreement, the assumption of the expenses related thereto and administration of the Funds’ business affairs, including providing facilities, GSAM is entitled to a management fee, accrued daily and paid monthly, equal to an annual percentage rate of each Fund’s average daily net assets.
69
GOLDMAN SACHS SELECT SATELLITE FUNDS
Notes to Financial Statements (continued)
June 30, 2017 (Unaudited)
| 5. AGREEMENTS AND AFFILIATED TRANSACTIONS (continued) |
For the six months ended June 30, 2017, contractual and effective net management fees with GSAM were at the following rates:
| Contractual Management Rate | Effective Net Management Rate^(1)(2) | |||||||||||||||||||||||||||||
| Fund | First $1 billion | Next $1 billion | Next $3 billion | Next $3 billion | Over $8 billion | Effective Rate | ||||||||||||||||||||||||
Absolute Return Tracker | 1.15 | % | 1.04 | % | 0.99 | % | 0.97 | % | 0.95 | % | 1.13 | % | 0.58 | %(3) | ||||||||||||||||
Commodity Strategy | 0.50 | 0.50 | 0.45 | 0.43 | 0.42 | 0.50 | 0.42 | |||||||||||||||||||||||
Dynamic Allocation | 0.90 | 0.81 | 0.77 | 0.75 | 0.74 | 0.90 | 0.71 | (3) | ||||||||||||||||||||||
Managed Futures Strategy | 1.00 | 0.90 | 0.86 | 0.84 | 0.82 | 1.00 | 0.87 | |||||||||||||||||||||||
| ^ | Effective Net Management Rate includes the impact of management fee waivers of affiliated underlying funds, if any. |
| (1) | GSAM agreed to waive a portion of its management fee payable by the Funds in an amount equal to any management fees it earns as an investment adviser to any of the affiliated funds in which they invest through at least April 28, 2018. Prior to such date GSAM may not terminate the arrangement without the approval of the Trustees. |
| (2) | Reflects combined management fees paid to GSAM under the Agreement and the Funds’ Subsidiary Agreements (as defined below) after the waivers. |
| (3) | GSAM agreed to waive a portion of its management fee in order to achieve net management rates, as defined in the Funds’ most recent prospectuses. These waivers will be effective through at least April 28, 2018, and prior to such date GSAM may not terminate the arrangements without the approval of the Trustees. |
GSAM also provides management services to the Subsidiaries pursuant to a Subsidiary Management Agreement (each a “Subsidiary Agreement”) and is entitled to a management fee accrued daily and paid monthly, equal to an annual percentage rate of 0.42% of each Subsidiary’s average daily net assets. In consideration of the Subsidiary’s management fee, and for as long as the Subsidiary Agreement remains in effect, GSAM has contractually agreed to waive irrevocably a portion of each Fund’s management fee in an amount equal to the management fee accrued and paid to GSAM by the Subsidiary under the Subsidiary Agreement. For the six months ended June 30, 2017, GSAM waived $31,723, $141,871, $25,666 and $60,680 of each Fund’s management fee for Absolute Return Tracker, Commodity Strategy, Dynamic Allocation and Managed Futures Strategy Funds, respectively. This waiver represents an inter-fund transaction and, accordingly, has been eliminated in consolidation.
The Funds invest in Institutional Shares of Goldman Sachs Financial Square Government Fund, which is an affiliated Underlying Fund. GSAM has agreed to waive a portion of its management fee payable by the Funds in an amount equal to the management fee it earns as an investment adviser to any of the affiliated Underlying Funds in which the Funds invest. For the six months ended June 30, 2017, GSAM waived $687,823, $153,627, $202,405 and $91,129 of the Absolute Return Tracker, Commodity Strategy, Dynamic Allocation and Managed Futures Strategy Funds’ management fees, respectively.
B. Distribution and/or Service (12b-1) Plans — The Trust, on behalf of Class A and Class R Shares of each applicable Fund, has adopted Distribution and Service Plans subject to Rule 12b-1 under the Act. Under the Distribution and Service Plans, Goldman Sachs, which serves as distributor (the “Distributor”), is entitled to a fee accrued daily and paid monthly for distribution services and personal and account maintenance services, which may then be paid by Goldman Sachs to authorized dealers. These fees are equal to an annual percentage of the average daily net assets attributable to Class A or Class R Shares of the Funds, as applicable, as set forth below.
The Trust, on behalf of Class C Shares of each applicable Fund, has adopted a Distribution Plan subject to Rule 12b-1 under the Act. Under the Distribution Plan, Goldman Sachs as Distributor is entitled to a fee accrued daily and paid monthly for
70
GOLDMAN SACHS SELECT SATELLITE FUNDS
| 5. AGREEMENTS AND AFFILIATED TRANSACTIONS (continued) |
distribution services, which may then be paid by Goldman Sachs to authorized dealers. These fees are equal to an annual percentage of the average daily net assets attributable to Class C Shares of the Funds, as set forth below.
| Distribution and Service Plan Rates | ||||||||||||
| Class A* | Class C | Class R* | ||||||||||
Distribution Plan | 0.25 | % | 0.75 | % | 0.50 | % | ||||||
| * | With respect to Class A and Class R Shares, the Distributor at its discretion may use compensation for distribution services paid under the Distribution Plan to compensate service organizations for personal and account maintenance services and expenses as long as such total compensation does not exceed the maximum cap on “service fees” imposed by the Financial Industry Regulatory Authority. |
C. Distribution Agreement — Goldman Sachs, as Distributor of the shares of the Funds pursuant to a Distribution Agreement, may retain a portion of the Class A Shares’ front end sales charge and Class C Shares’ CDSC. During the six months ended June 30, 2017, Goldman Sachs advised that it retained front end sales charges of $4,974, $7,787, $1,756 and $1,362 for the Absolute Return Tracker, Commodity Strategy, Dynamic Allocation and Managed Futures Strategy Funds, respectively. For the six months ended June 30, 2017, Goldman Sachs did not retain any CDSC charges on Class C Shares.
D. Service Plan — The Trust, on behalf of each applicable Fund, has adopted a Service Plan to allow Class C Shares to compensate service organizations (including Goldman Sachs) for providing varying levels of personal and account maintenance services to their customers who are beneficial owners of such shares. The Service Plan provides for compensation to the service organizations equal to an annual percentage rate of 0.25% of the average daily net assets attributable to Class C Shares of the Funds.
E. Transfer Agency Agreement — Goldman Sachs also serves as the transfer agent of the Funds for a fee pursuant to the Transfer Agency Agreement. The fees charged for such transfer agency services are accrued daily and paid monthly at annual rates as follows: 0.19% (except for the Commodity Strategy Fund, which charges at an annual rate of 0.13%) of the average daily net assets of Class A, Class C, Class IR and Class R Shares; 0.02% of the average daily net assets of Class R6 Shares; and 0.04% of the average daily net assets of Institutional Shares. Effective July 28, 2017, the annual rates were amended for Class A, Class C, Class IR and Class R Shares to 0.18% of average daily net assets, and for Class R6 Shares to 0.03% of average daily net assets.
F. Other Expense Agreements and Affiliated Transactions — GSAM has agreed to limit certain “Other Expenses” of the Funds (excluding acquired fund fees and expenses, transfer agency fees and expenses, service fees and shareholder administration fees (as applicable), taxes, interest, brokerage fees, shareholder meeting, litigation, indemnification and extraordinary expenses) to the extent such expenses exceed, on an annual basis, a percentage rate of the average daily net assets of each Fund. Such Other Expense reimbursements, if any, are accrued daily and paid monthly. In addition, the Funds are not obligated to reimburse GSAM for prior fiscal year expense reimbursements, if any. The Other Expense limitations as an annual percentage rate of average daily net assets for the Absolute Return Tracker, Commodity Strategy, Dynamic Allocation and Managed Futures Strategy Funds are 0.014%, 0.074%, 0.004% and 0.254%, respectively. Prior to April 28, 2017, the Other Expense limitation was 0.204% for the Managed Futures Strategy Fund. These Other Expense limitations will remain in place through at least April 28, 2018, and prior to such date GSAM may not terminate the arrangements without the approval of the Trustees. The Subsidiaries also pay certain other expenses, including service and custody fees. GSAM has agreed to reduce or limit each Subsidiary’s expenses (excluding management fees) to 0.004% of the Subsidiary’s average daily net assets for the Absolute Return Tracker, Commodity Strategy, Dynamic Allocation and Managed Futures Strategy Funds. In addition, the Funds have entered into certain offset arrangements with the custodian and the transfer agent, which may result in a reduction of the Funds’ expenses and are received irrespective of the application of the “Other Expense” limitations described above.
71
GOLDMAN SACHS SELECT SATELLITE FUNDS
Notes to Financial Statements (continued)
June 30, 2017 (Unaudited)
| 5. AGREEMENTS AND AFFILIATED TRANSACTIONS (continued) |
For the six months ended June 30, 2017, these expense reductions, including any fee waivers and Other Expense reimbursements, were as follows:
| Fund | Management Fee Waiver | Other Expense Reimbursement | Custody Fee Credits | Total Expense Reductions | ||||||||||||||
Absolute Return Tracker | $ | 3,231,750 | $ | 236,704 | $ | 7,432 | $ | 3,475,886 | ||||||||||
Commodity Strategy | 153,627 | 151,385 | 9,812 | 314,824 | ||||||||||||||
Dynamic Allocation | 467,777 | 261,075 | 4,414 | 733,266 | ||||||||||||||
Managed Futures Strategy | 91,129 | 47,901 | 3,590 | 142,620 | ||||||||||||||
G. Line of Credit Facility — As of June 30, 2017, the Funds participated in a $1,100,000,000 committed, unsecured revolving line of credit facility (the “facility”) together with other funds of the Trust and certain registered investment companies having management agreements with GSAM or its affiliates. This facility is to be used for temporary emergency purposes, or to allow for an orderly liquidation of securities to meet redemption requests. The interest rate on borrowings is based on the federal funds rate. The facility also requires a fee to be paid by the Funds based on the amount of the commitment that has not been utilized. For the six months ended June 30, 2017, the Funds did not have any borrowings under the facility.
H. Other Transactions with Affiliates — For the six months ended June 30, 2017, Goldman Sachs earned $182 and $934 in brokerage commissions from portfolio transactions, including futures transactions executed with Goldman Sachs as the Futures Commission Merchant, on behalf of the Absolute Return Tracker and Dynamic Allocation Funds, respectively.
The following table provides information about the Funds’ investment in the Goldman Sachs Financial Square Government Fund as of and for the six months ended June 30, 2017:
| Fund | Market Value 12/31/16 | Purchases at Cost | Proceeds from Sales | Market Value 06/30/17 | Dividend Interest Income | |||||||||||||||||
Absolute Return Tracker | $ | 759,181,647 | $ | 355,718,418 | $ | (111,542,614 | ) | $ | 1,003,357,451 | $ | 2,589,504 | |||||||||||
Commodity Strategy | 213,373,363 | 259,224,675 | (320,159,266 | ) | 152,438,772 | 562,007 | ||||||||||||||||
Dynamic Allocation | 287,578,990 | 230,703,322 | (225,176,660 | ) | 293,105,652 | 748,420 | ||||||||||||||||
Managed Futures Strategy | 128,140,368 | 75,287,498 | (111,788,189 | ) | 91,639,677 | 317,274 | ||||||||||||||||
As of June 30, 2017, the following Goldman Sachs Fund of Funds Portfolios were beneficial owners of 5% or more of total outstanding shares of the following Funds:
| Fund | Goldman Sachs Balanced Strategy Portfolio | Goldman Sachs Growth and Income Strategy Portfolio | Goldman Sachs Growth Strategy Portfolio | |||||||||||
Dynamic Allocation | 11 | % | 21 | % | 17 | % | ||||||||
Managed Futures Strategy | 12 | 20 | 18 | |||||||||||
As of June 30, 2017, The Goldman Sachs Group, Inc. was the beneficial owner of the following Funds:
| Fund | Class R | Class R6 | ||||||||
Dynamic Allocation | 100 | % | 100 | % | ||||||
72
GOLDMAN SACHS SELECT SATELLITE FUNDS
| 6. PORTFOLIO SECURITIES TRANSACTIONS |
The cost of purchases and proceeds from sales and maturities of long-term securities for the six months ended June 30, 2017, were as follows:
| Fund | Purchases of U.S. Government and Agency Obligations) | Purchases (Excluding U.S. Government and Agency Obligations) | Sales and Maturities of U.S. Government and Agency Obligations) | Sales and Maturities (Excluding U.S. Government and Agency Obligations) | ||||||||||||||
Absolute Return Tracker | $ | — | $ | 126,577,982 | $ | — | $ | 97,993,923 | ||||||||||
Commodity Strategy | 58,525,689 | — | 76,343,360 | 742,887 | ||||||||||||||
Dynamic Allocation | 25,309,281 | 234,885,150 | 34,607,562 | 355,072,838 | ||||||||||||||
| 7. SECURITIES LENDING |
Pursuant to exemptive relief granted by the Securities and Exchange Commission (“SEC”) and the terms and conditions contained therein, the Absolute Return Tracker and Dynamic Allocation Funds may lend their securities through a securities lending agent, Goldman Sachs Agency Lending (“GSAL”), a wholly-owned subsidiary of Goldman Sachs, to certain qualified borrowers including Goldman Sachs and affiliates. In accordance with the Funds’ securities lending procedures, the Funds receive cash collateral at least equal to the market value of the securities on loan. The market value of the loaned securities is determined at the close of business of the Funds, at their last sale price or official closing price on the principal exchange or system on which they are traded, and any additional required collateral is delivered to the Funds on the next business day. As with other extensions of credit, the Funds may experience delay in the recovery of their securities or incur a loss should the borrower of the securities breach its agreement with the Funds or become insolvent at a time when the collateral is insufficient to cover the cost of repurchasing securities on loan. Dividend income received from securities on loan may not be subject to withholding taxes and therefore withholding taxes paid may differ from the amounts listed in the Consolidated Statements of Operations. Loans of securities are terminable at any time and as such 1) the remaining contractual maturities of the outstanding securities lending transactions are considered to be overnight and continuous and 2) the borrower, after notice, is required to return borrowed securities within the standard time period for settlement of securities transactions.
The Absolute Return Tracker and Dynamic Allocation Funds invest the cash collateral received in connection with securities lending transactions in the Goldman Sachs Financial Square Government Fund (“Government Money Market Fund”), an affiliated series of the Trust. The Government Money Market Fund is registered under the Act as an open end investment company, is subject to Rule 2a-7 under the Act, and is managed by GSAM, for which GSAM may receive a management fee of up to 0.205% on an annualized basis of the average daily net assets of the Government Money Market Fund.
In the event of a default by a borrower with respect to any loan, GSAL will exercise any and all remedies provided under the applicable borrower agreement to make the Funds whole. These remedies include purchasing replacement securities by applying the collateral held from the defaulting broker against the purchase cost of the replacement securities. If GSAL is unable to purchase replacement securities, GSAL will indemnify the Funds by paying the Funds an amount equal to the market value of the securities loaned minus the value of cash collateral received from the borrower for the loan, subject to an exclusion for any shortfalls resulting from a loss of value in such cash collateral due to reinvestment risk. The amounts of the Funds’ overnight and continuous agreements represent the gross amounts of recognized liabilities for securities lending transactions outstanding as of June 30, 2017 are disclosed as “Payable upon return of securities loaned” on the Consolidated Statements of Assets and Liabilities.
Each of the Absolute Return Tracker and Dynamic Allocation Funds and GSAL received compensation relating to the lending of the Funds’ securities. The amounts earned, if any, by the Funds for the six months ended June 30, 2017, are reported under Investment Income on the Consolidated Statements of Operations.
73
GOLDMAN SACHS SELECT SATELLITE FUNDS
Notes to Financial Statements (continued)
June 30, 2017 (Unaudited)
| 7. SECURITIES LENDING (continued) |
The table below details securities lending activity with affiliates of Goldman Sachs:
| For the Six Months ended June 30, 2017 | Amounts Payable to Goldman Sachs Upon Return of Securities Loaned as of June 30, 2017 | |||||||||||||
| Fund | Earnings of GSAL Loaned | Amounts Received from Lending to | ||||||||||||
Absolute Return Tracker | $ | 4,440 | $ | 25,246 | $ | 4,697,575 | ||||||||
Dynamic Allocation | 1,095 | 5,744 | 163,400 | |||||||||||
The following table provides information about the Funds’ investment in the Government Money Market Fund for the six months ended June 30, 2017:
| Fund | Market Value 12/31/2016 | Purchases at Cost | Proceeds from Sales | Market Value 06/30/2017 | ||||||||||||||
Absolute Return Tracker | $ | 6,832,600 | $ | 56,077,400 | $ | (54,908,050 | ) | $ | 8,001,950 | |||||||||
Dynamic Allocation | — | 21,185,685 | (21,022,285 | ) | 163,400 | |||||||||||||
| 8. TAX INFORMATION |
As of the Funds’ most recent fiscal year end, December 31, 2016, the Funds’ capital loss carryforwards and certain timing differences, on a tax-basis were as follows:
| Absolute Return Tracker | Commodity Strategy | Dynamic Allocation | Managed Futures Strategy | |||||||||||||
Capital loss carryforwards: | ||||||||||||||||
Expiring 2017(1) | $ | — | $ | (67,560,179 | ) | $ | — | $ | — | |||||||
Perpetual Short-term | — | (6,277,565 | ) | (4,795,025 | ) | (2,268,892 | ) | |||||||||
Perpetual Long-term | — | (11,806,815 | ) | (1,379,604 | ) | (265,987 | ) | |||||||||
Total capital loss carryforwards | $ | — | $ | (85,644,559 | ) | $ | (6,174,629 | ) | $ | (2,534,879 | ) | |||||
Timing differences (Post October Loss Deferral and Straddle Loss Deferral) | $ | (57,974 | ) | $ | (294,712 | ) | $ | (155,399 | ) | $ | (1,462,748 | ) | ||||
| (1) | Expiration occurs on December 31 of the year indicated. |
As of June 30, 2017, the Funds’ aggregate security unrealized gains and losses based on cost for U.S. federal income tax purposes were as follows:
Absolute Return Tracker | Commodity Strategy | Dynamic Allocation | Managed Futures Strategy | |||||||||||||
Tax cost | $ | 1,260,429,846 | $ | 288,843,029 | $ | 365,548,910 | $ | 91,639,677 | ||||||||
Gross unrealized gain | 32,719,250 | 1,453,158 | 5,309,611 | — | ||||||||||||
Gross unrealized loss | (10,752,700 | ) | (735,242 | ) | (2,827,746 | ) | — | |||||||||
Net unrealized security gain | $ | 21,966,550 | $ | 717,916 | $ | 2,481,865 | $ | — | ||||||||
74
GOLDMAN SACHS SELECT SATELLITE FUNDS
| 8. TAX INFORMATION (continued) |
The difference between GAAP-basis and tax-basis unrealized gains (losses) is attributable primarily to wash sales, net mark to market gains (losses) on regulated futures, options and foreign currency contracts, and differences related to the tax treatment of swap transactions, underlying fund investments and passive foreign investment companies.
GSAM has reviewed the Funds’ tax positions for all open tax years (the current and prior three years, as applicable) and has concluded that no provision for income tax is required in the Funds’ financial statements. Such open tax years remain subject to examination and adjustment by tax authorities.
| 9. OTHER RISKS |
The Funds’ risks include, but are not limited to, the following:
Derivatives Risk — The Funds’ use of derivatives may result in loss. Derivative instruments, which may pose risks in addition to and greater than those associated with investing directly in securities, currencies or other instruments, may be illiquid or less liquid, volatile, difficult to price and leveraged so that small changes in the value of the underlying instruments may produce disproportionate losses to the Funds. Derivatives are also subject to counterparty risk, which is the risk that the other party in the transaction will not fulfill its contractual obligation. The use of derivatives is a highly specialized activity that involves investment techniques and risks different from those associated with investments in more traditional securities and instruments. Losses from derivatives can also result from a lack of correlation between changes in the value of derivative instruments and the portfolio assets (if any) being hedged.
Foreign and Emerging Countries Risk — Investing in foreign markets may involve special risks and considerations not typically associated with investing in the U.S. Foreign securities may be subject to risk of loss because of more or less foreign government regulation, less public information and less economic, political and social stability in the countries in which a Fund invests. The imposition of exchange controls, confiscations, trade restrictions (including tariffs) and other government restrictions by the U.S. or other governments, or from problems in share registration, settlement or custody, may also result in losses. Foreign risk also involves the risk of negative foreign currency rate fluctuations, which may cause the value of securities denominated in such foreign currency (or other instruments through which a Fund has exposure to foreign currencies) to decline in value. Currency exchange rates may fluctuate significantly over short periods of time. To the extent that a Fund also invests in securities of issuers
located in emerging markets, these risks may be more pronounced.
Foreign Custody Risk — If a Fund invests in foreign securities, the Fund may hold such securities and cash with foreign banks, agents, and securities depositories appointed by the Fund’s custodian (each a “Foreign Custodian”). Some foreign custodians may be recently organized or new to the foreign custody business. In some countries, Foreign Custodians may be subject to little or no regulatory oversight over, or independent evaluation of, their operations. Further, the laws of certain countries may place limitations on a Fund’s ability to recover its assets if a Foreign Custodian enters bankruptcy. Investments in emerging markets may be subject to even greater custody risks than investments in more developed markets. Custody services in emerging market countries are very often undeveloped and may be considerably less well regulated than in more developed countries, and thus may not afford the same level of investor protection as would apply in developed countries.
Interest Rate Risk — When interest rates increase, fixed income securities or instruments held by a Fund will generally decline in value. Long-term fixed income securities or instruments will normally have more price volatility because of this risk than short-term fixed income securities or instruments. The risks associated with increasing rates are heightened given that interest rates are near historic lows, but may be expected to increase in the future with unpredictable effects on the markets and a Fund’s investments. Fluctuations in interest rates may also affect the liquidity of fixed income securities and instruments held by the Funds.
Investments in Other Investment Companies — As a shareholder of another investment company, including an ETF a Fund will indirectly bear its proportionate share of any net management fees and other expenses paid by such other investment companies, in addition to the fees and expenses regularly borne by the Fund. ETFs are subject to risks that do not apply to
75
GOLDMAN SACHS SELECT SATELLITE FUNDS
Notes to Financial Statements (continued)
June 30, 2017 (Unaudited)
| 9. OTHER RISKS (continued) |
conventional mutual funds, including but not limited to the following: (i) the market price of the ETF’s shares may trade at a premium or a discount to their NAV; and (ii) an active trading market for an ETF’s shares may not develop or be maintained.
Large Shareholder Transactions Risk — A Fund may experience adverse effects when certain large shareholders, such as other funds, institutional investors (including those trading by use of non-discretionary mathematical formulas), financial intermediaries (who may make investment decisions on behalf of underlying clients and/or include a Fund in their investment model), individuals, accounts and Goldman Sachs affiliates, purchase or redeem large amounts of shares of a Fund. Such large shareholder redemptions may cause a Fund to sell portfolio securities at times when it would not otherwise do so, which may negatively impact a Fund’s NAV and liquidity. These transactions may also accelerate the realization of taxable income to shareholders if such sales of investments resulted in gains, and may also increase transaction costs. In addition, a large redemption could result in a Fund’s current expenses being allocated over a smaller asset base, leading to an increase in the Fund’s expense ratio. Similarly, large Fund share purchases may adversely affect a Fund’s performance to the extent that the Fund is delayed in investing new cash and is required to maintain a larger cash position than it ordinarily would.
Liquidity Risk — A Fund may make investments that are illiquid or that may become less liquid in response to market developments or adverse investor perceptions. Illiquid investments may be more difficult to value. Liquidity risk may also refer to the risk that a Fund will not be able to pay redemption proceeds within the allowable time period because of unusual market conditions, an unusually high volume of redemption requests, or other reasons. To meet redemption requests, a Fund may be forced to sell investments at an unfavorable time and/or under unfavorable conditions. Liquidity risk may be the result of, among other things, the reduced number and capacity of traditional market participants to make a market in fixed income securities or the lack of an active market. The potential for liquidity risk may be magnified by a rising interest rate environment or other circumstances where investor redemptions from fixed income mutual funds may be higher than normal, potentially causing increased supply in the market due to selling activity.
Market and Credit Risks — In the normal course of business, a Fund trades financial instruments and enters into financial transactions where risk of potential loss exists due to changes in the market (market risk). Additionally, a Fund may also be exposed to credit risk in the event that an issuer or guarantor fails to perform or that an institution or entity with which the Fund has unsettled or open transactions defaults.
Non-Diversification Risk — The Funds (except for the Absolute Return Tracker Fund) are non-diversified, meaning that they are permitted to invest a larger percentage of their assets in fewer issuers than diversified mutual funds. Thus, each Fund (except for the Absolute Return Tracker Fund) may be more susceptible to adverse developments affecting any single issuer held in its portfolio, and may be more susceptible to greater losses because of these developments.
Short Position Risk — A Fund may enter into a short position through a futures contract, an option or swap agreement or through short sales of any instrument that a Fund may purchase for investment. Taking short positions involves leverage of a Fund’s assets and presents various risks, including counterparty risk. If the value of the underlying instrument or market in which a Fund has taken a short position increases, then the Fund will incur a loss equal to the increase in value from the time that the short position was entered into plus any related interest payments or other fees. Taking short positions involves the risk that losses may be disproportionate, may exceed the amount invested, and may be unlimited.
Tax Risk — Historically, the Internal Revenue Service (“IRS”) issued private letter rulings (“PLRs”) in which the IRS specifically concluded that income and gains from investments in commodity index-linked structured notes or a wholly-owned foreign subsidiary that invests in commodity-linked instruments are “qualifying income” for purposes of compliance with Subchapter M of the Code. The IRS has issued such PLRs to the Absolute Return Tracker, Commodity Strategy, and Dynamic Allocation Funds. Based on such rulings, these Funds may seek to gain exposure to the commodity markets through investments in commodity-linked notes and/or subsidiaries. The Managed Futures Strategy Fund has not received a PLR, and is not able to rely on PLRs issued to other taxpayers. Additionally, the IRS has suspended the granting of such PLRs, pending review of its position on this matter. The IRS also recently issued proposed regulations that, if finalized, would generally treat the Fund’s income inclusion with respect to a subsidiary as qualifying income only if there is a distribution out of the earnings and profits of a subsidiary that are
76
GOLDMAN SACHS SELECT SATELLITE FUNDS
| 9. OTHER RISKS (continued) |
attributable to such income inclusion. The proposed regulations, if adopted would apply to taxable years beginning on or after 90 days after the regulations are published as final.
The IRS also recently issued a revenue procedure, which states that the IRS will not in the future issue PLRs that would require a determination of whether an asset (such as commodity index-linked note) is a “security” under the Investment Company Act of 1940. The Managed Futures Strategy Fund has obtained an opinion of counsel that the Fund’s income from such investments should constitute “qualifying income.” However, no assurances can be provided that the IRS would not be able to successfully assert that the Fund’s income from such investments was not “qualifying income”, in which case the Fund would fail to qualify as regulated investment company (“RIC”) under Subchapter M of the Code if over 10% of its gross income were derived from these investments. If a Fund failed to qualify as a RIC, it would be subject to federal and state income tax on all of its taxable income at regular corporate tax rates. This would significantly adversely affect the returns to, and could cause substantial losses for, Fund shareholders.
| 10. INDEMNIFICATIONS |
Under the Trust’s organizational documents, its Trustees, officers, employees and agents are indemnified, to the extent permitted by the Act and state law, against certain liabilities that may arise out of performance of their duties to the Funds. Additionally, in the course of business, the Funds enter into contracts that contain a variety of indemnification clauses. The Funds’ maximum exposure under these arrangements is unknown, as this would involve future claims that may be made against the Funds that have not yet occurred. However, GSAM believes the risk of loss under these arrangements to be remote.
| 11. SUBSEQUENT EVENTS |
Subsequent events after the Consolidated Statements of Assets and Liabilities date have been evaluated and GSAM has concluded that there is no impact requiring adjustment or disclosure in the financial statements.
77
GOLDMAN SACHS SELECT SATELLITE FUNDS
Notes to Financial Statements (continued)
June 30, 2017 (Unaudited)
| 12. SUMMARY OF SHARE TRANSACTIONS |
Share activity is as follows:
| Absolute Return Tracker Fund | ||||||||||||||||
|
| |||||||||||||||
| For the Six Months Ended June 30, 2017 (Unaudited) | For the Fiscal Year Ended December 31, 2016 | |||||||||||||||
|
| |||||||||||||||
| Shares | Dollars | Shares | Dollars | |||||||||||||
|
| |||||||||||||||
| Class A Shares | ||||||||||||||||
Shares sold | 798,584 | $ | 7,322,528 | 1,387,722 | $ | 12,232,250 | ||||||||||
Reinvestment of distributions | — | — | 15,656 | 141,378 | ||||||||||||
Shares redeemed | (2,324,522 | ) | (21,321,574 | ) | (2,305,534 | ) | (20,220,098 | ) | ||||||||
| (1,525,938 | ) | (13,999,046 | ) | (902,156 | ) | (7,846,470 | ) | |||||||||
| Class C Shares | ||||||||||||||||
Shares sold | 128,667 | 1,105,313 | 141,066 | 1,170,541 | ||||||||||||
Reinvestment of distributions | — | — | 5,015 | 42,327 | ||||||||||||
Shares redeemed | (305,364 | ) | (2,624,957 | ) | (789,864 | ) | (6,452,472 | ) | ||||||||
| (176,697 | ) | (1,519,644 | ) | (643,783 | ) | (5,239,604 | ) | |||||||||
| Institutional Shares | ||||||||||||||||
Shares sold | 48,859,627 | 460,998,758 | 41,759,946 | 378,858,665 | ||||||||||||
Reinvestment of distributions | — | — | 378,659 | 3,505,767 | ||||||||||||
Shares redeemed | (20,598,019 | ) | (193,868,849 | ) | (62,395,126 | ) | (557,400,892 | ) | ||||||||
| 28,261,608 | 267,129,909 | (20,256,521 | ) | (175,036,460 | ) | |||||||||||
| Class IR Shares | ||||||||||||||||
Shares sold | 3,723,846 | 34,867,507 | 1,086,318 | 9,723,420 | ||||||||||||
Reinvestment of distributions | — | — | 7,685 | 70,603 | ||||||||||||
Shares redeemed | (265,942 | ) | (2,493,247 | ) | (416,734 | ) | (3,741,490 | ) | ||||||||
| 3,457,904 | 32,374,260 | 677,269 | 6,052,533 | |||||||||||||
| Class R Shares | ||||||||||||||||
Shares sold | 49,637 | 450,665 | 69,592 | 599,953 | ||||||||||||
Reinvestment of distributions | — | — | 922 | 8,142 | ||||||||||||
Shares redeemed | (16,599 | ) | (149,087 | ) | (58,896 | ) | (508,726 | ) | ||||||||
| 33,038 | 301,578 | 11,618 | 99,369 | |||||||||||||
| Class R6 Shares | ||||||||||||||||
Shares sold | 223,633 | 2,100,015 | 1,810 | 16,457 | ||||||||||||
Reinvestment of distributions | — | — | 19 | 177 | ||||||||||||
Shares redeemed | (12,940 | ) | (122,770 | ) | — | — | ||||||||||
| 210,693 | 1,977,245 | 1,829 | 16,634 | |||||||||||||
NET INCREASE (DECREASE) | 30,260,608 | $ | 286,264,302 | (21,111,744 | ) | $ | (181,953,998 | ) | ||||||||
78
GOLDMAN SACHS SELECT SATELLITE FUNDS
| 12. SUMMARY OF SHARE TRANSACTIONS (continued) |
| Commodity Strategy Fund | ||||||||||||||||
|
| |||||||||||||||
| For the Six Months Ended June 30, 2017 (Unaudited) | For the Fiscal Year Ended December 31, 2016 | |||||||||||||||
|
| |||||||||||||||
| Shares | Dollars | Shares | Dollars | |||||||||||||
|
| |||||||||||||||
| Class A Shares | ||||||||||||||||
Shares sold | 1,272,836 | $ | 14,072,813 | 2,244,218 | $ | 24,147,890 | ||||||||||
Reinvestment of distributions | 7,842 | 80,068 | 23,593 | 276,258 | ||||||||||||
Shares redeemed | (2,012,275 | ) | (22,727,747 | ) | (2,665,683 | ) | (28,855,539 | ) | ||||||||
| (731,597 | ) | (8,574,866 | ) | (397,872 | ) | (4,431,391 | ) | |||||||||
| Class C Shares | ||||||||||||||||
Shares sold | 37,425 | 401,019 | 93,085 | 945,136 | ||||||||||||
Shares redeemed | (92,352 | ) | (977,013 | ) | (203,266 | ) | (2,114,815 | ) | ||||||||
| (54,927 | ) | (575,994 | ) | (110,181 | ) | (1,169,679 | ) | |||||||||
| Institutional Shares | ||||||||||||||||
Shares sold | 9,097,481 | 100,447,846 | 17,353,171 | 185,427,601 | ||||||||||||
Reinvestment of distributions | 77,644 | 800,505 | 148,735 | 1,759,147 | ||||||||||||
Shares redeemed | (10,125,223 | ) | (112,109,376 | ) | (41,268,501 | ) | (457,599,046 | ) | ||||||||
| (950,098 | ) | (10,861,025 | ) | (23,766,595 | ) | (270,412,298 | ) | |||||||||
| Class IR Shares | ||||||||||||||||
Shares sold | 892,051 | 10,471,818 | 393,995 | 4,334,577 | ||||||||||||
Reinvestment of distributions | 3,648 | 37,609 | 4,363 | 51,647 | ||||||||||||
Shares redeemed | (305,191 | ) | (3,320,468 | ) | (584,585 | ) | (6,435,342 | ) | ||||||||
| 590,508 | 7,188,959 | (186,227 | ) | (2,049,118 | ) | |||||||||||
| Class R Shares | ||||||||||||||||
Shares sold | 81,667 | 887,208 | 267,403 | 2,813,744 | ||||||||||||
Reinvestment of distributions | 137 | 1,380 | 885 | 10,206 | ||||||||||||
Shares redeemed | (155,853 | ) | (1,717,538 | ) | (73,990 | ) | (791,961 | ) | ||||||||
| (74,049 | ) | (828,950 | ) | 194,298 | 2,031,989 | |||||||||||
| Class R6 Shares | ||||||||||||||||
Shares sold | 53,246 | 596,443 | 57,018 | 628,258 | ||||||||||||
Reinvestment of distributions | 519 | 5,350 | 1,251 | 14,801 | ||||||||||||
Shares redeemed | (84,690 | ) | (945,678 | ) | (22,776 | ) | (248,314 | ) | ||||||||
| (30,925 | ) | (343,885 | ) | 35,493 | 394,745 | |||||||||||
NET DECREASE | (1,251,088 | ) | $ | (13,995,761 | ) | (24,231,084 | ) | $ | (275,635,752 | ) | ||||||
79
GOLDMAN SACHS SELECT SATELLITE FUNDS
Notes to Financial Statements (continued)
June 30, 2017 (Unaudited)
| 12. SUMMARY OF SHARE TRANSACTIONS (continued) |
| Dynamic Allocation Fund | ||||||||||||||||
|
| |||||||||||||||
| For the Six Months Ended June 30, 2017 (Unaudited) | For the Fiscal Year Ended December 31, 2016 | |||||||||||||||
|
| |||||||||||||||
| Shares | Dollars | Shares | Dollars | |||||||||||||
|
| |||||||||||||||
| Class A Shares | ||||||||||||||||
Shares sold | 47,370 | $ | 487,006 | 122,360 | $ | 1,161,012 | ||||||||||
Shares redeemed | (1,013,212 | ) | (10,317,598 | ) | (1,938,420 | ) | (18,497,868 | ) | ||||||||
| (965,842 | ) | (9,830,592 | ) | (1,816,060 | ) | (17,336,856 | ) | |||||||||
| Class C Shares | ||||||||||||||||
Shares sold | 8,950 | 87,962 | 136,130 | 1,222,282 | ||||||||||||
Shares redeemed | (398,858 | ) | (3,915,879 | ) | (1,103,634 | ) | (10,143,970 | ) | ||||||||
| (389,908 | ) | (3,827,917 | ) | (967,504 | ) | (8,921,688 | ) | |||||||||
| Institutional Shares | ||||||||||||||||
Shares sold | 2,733,048 | 28,221,594 | 7,252,557 | 69,826,845 | ||||||||||||
Shares redeemed | (15,389,814 | ) | (162,423,153 | ) | (14,602,323 | ) | (141,806,122 | ) | ||||||||
| (12,656,766 | ) | (134,201,559 | ) | (7,349,766 | ) | (71,979,277 | ) | |||||||||
| Class IR Shares | ||||||||||||||||
Shares sold | 601,647 | 6,198,147 | 141,597 | 1,389,965 | ||||||||||||
Shares redeemed | (201,555 | ) | (2,105,163 | ) | (618,335 | ) | (5,927,803 | ) | ||||||||
| 400,092 | 4,092,984 | (476,738 | ) | (4,537,838 | ) | |||||||||||
NET DECREASE | (13,612,424 | ) | $ | (143,767,084 | ) | (10,610,068 | ) | $ | (102,775,659 | ) | ||||||
80
GOLDMAN SACHS SELECT SATELLITE FUNDS
| 12. SUMMARY OF SHARE TRANSACTIONS (continued) |
| Managed Futures Strategy Fund | ||||||||||||||||
|
| |||||||||||||||
For the Six Months Ended June 30, 2017 (Unaudited) | For the Fiscal Year Ended December 31, 2016 | |||||||||||||||
|
| |||||||||||||||
| Shares | Dollars | Shares | Dollars | |||||||||||||
|
| |||||||||||||||
| Class A Shares | ||||||||||||||||
Shares sold | 149,274 | $ | 1,523,888 | 4,857,786 | $ | 50,677,276 | ||||||||||
Shares redeemed | (1,659,242 | ) | (16,926,173 | ) | (4,917,638 | ) | (50,203,291 | ) | ||||||||
| (1,509,968 | ) | (15,402,285 | ) | (59,852 | ) | 473,985 | ||||||||||
| Class C Shares | ||||||||||||||||
Shares sold | 20,729 | 203,347 | 274,113 | 2,794,349 | ||||||||||||
Shares redeemed | (111,028 | ) | (1,093,805 | ) | (166,933 | ) | (1,651,740 | ) | ||||||||
| (90,299 | ) | (890,458 | ) | 107,180 | 1,142,609 | |||||||||||
| Institutional Shares | ||||||||||||||||
Shares sold | 1,238,580 | 12,816,573 | 5,689,837 | 60,098,888 | ||||||||||||
Reinvestment of distributions | — | — | 11,216 | 116,199 | ||||||||||||
Shares redeemed | (3,843,098 | ) | (39,801,407 | ) | (3,416,894 | ) | (35,675,060 | ) | ||||||||
| (2,604,518 | ) | (26,984,834 | ) | 2,284,159 | 24,540,027 | |||||||||||
| Class IR Shares | ||||||||||||||||
Shares sold | 2,164,817 | 22,347,445 | 3,252,148 | 34,165,251 | ||||||||||||
Shares redeemed | (1,865,761 | ) | (19,302,618 | ) | (1,908,713 | ) | (19,725,292 | ) | ||||||||
| 299,056 | 3,044,827 | 1,343,435 | 14,439,959 | |||||||||||||
| Class R Shares | ||||||||||||||||
Shares sold | 17,717 | 177,951 | 17,175 | 175,248 | ||||||||||||
Shares redeemed | (4,255 | ) | (42,886 | ) | (5,729 | ) | (57,047 | ) | ||||||||
| 13,462 | 135,065 | 11,446 | 118,201 | |||||||||||||
NET INCREASE (DECREASE) | (3,892,267 | ) | $ | (40,097,685 | ) | 3,686,368 | $ | 40,714,781 | ||||||||
81
GOLDMAN SACHS SELECT SATELLITE FUNDS
Fund Expenses — Six Month Period Ended June 30, 2017 (Unaudited)
As a shareholder of Class A, Class C, Institutional, Class IR, Class R or Class R6 Shares of a Fund you incur two types of costs: (1) transaction costs, including sales charges on purchase payments (with respect to Class A Shares) and contingent deferred sales charges on redemptions (with respect to Class C Shares); and (2) ongoing costs, including management fees; distribution and/or service (12b-1) fees (with respect to Class A, Class C and Class R Shares); and other Fund expenses. This example is intended to help you understand your ongoing costs (in dollars) of investing in Class A, Class C, Institutional, Class IR, Class R and Class R6 Shares of the Funds and to compare these costs with the ongoing costs of investing in other mutual funds.
The example is based on an investment of $1,000 invested at the beginning of the period and held for the entire period from January 1, 2017 through June 30, 2017, which represents a period of 181 days of a 365 day year.
Actual Expenses — The first line under each share class in the table below provides information about actual account values and actual expenses. You may use the information in this line, together with the amount you invested, to estimate the expenses that you paid over the period. Simply divide your account value by $1,000 (for example, an $8,600 account value divided by $1,000=8.6), then multiply the result by the number in the first line under the heading entitled “Expenses Paid” to estimate the expenses you paid on your account during this period.
Hypothetical Example for Comparison Purposes — The second line under each share class in the table below provides information about hypothetical account values and hypothetical expenses based on the Funds’ actual net expense ratio and an assumed rate of return of 5% per year before expenses, which is not the Funds’ actual return. The hypothetical account values and expenses may not be used to estimate the actual ending account balance or expenses you paid for the period. You may use this information to compare the ongoing costs of investing in the Funds and other funds. To do so, compare this 5% hypothetical example with the 5% hypothetical examples that appear in the shareholder reports of the other funds.
Please note that the expenses shown in the table are meant to highlight your ongoing costs only and do not reflect any transactional costs, such as sales charges, redemption fees, or exchange fees. Therefore, the second line of the table is useful in comparing ongoing costs only, and will not help you determine the relative total costs of owning different funds. In addition, if these transactional costs were included, your costs would have been higher.
| Absolute Return Tracker Fund | Commodity Strategy Fund | Dynamic Allocation Fund | Managed Futures Strategy Fund | |||||||||||||||||||||||||||||||||||||||||||||
| Share Class | Beginning Account Value 01/01/17 | Ending Value | Expenses Paid for the 6 Months Ended 06/30/17* | Beginning Account Value 01/01/17 | Ending Value | Expenses Paid for the 6 Months Ended 06/30/17* | Beginning Account Value 01/01/17 | Ending Value | Expenses Paid for the 6 Months Ended 06/30/17* | Beginning Account Value 01/01/17 | Ending Value | Expenses Paid for the 6 Months Ended 06/30/17* | ||||||||||||||||||||||||||||||||||||
| Class A | ||||||||||||||||||||||||||||||||||||||||||||||||
Actual | $ | 1,000 | $ | 1,029.90 | $ | 5.23 | $ | 1,000 | $ | 892.30 | $ | 4.08 | $ | 1,000 | $ | 1,045.00 | $ | 5.83 | $ | 1,000 | $ | 995.10 | $ | 7.82 | ||||||||||||||||||||||||
Hypothetical 5% return | 1,000 | 1,019.64 | + | 5.21 | 1,000 | 1,020.48 | + | 4.36 | 1,000 | 1,019.09 | + | 5.76 | 1,000 | 1,016.96 | + | 7.90 | ||||||||||||||||||||||||||||||||
| Class C | ||||||||||||||||||||||||||||||||||||||||||||||||
Actual | 1,000 | 1,026.10 | 8.99 | 1,000 | 888.80 | 7.59 | 1,000 | 1,040.80 | 9.61 | 1,000 | 990.80 | 11.50 | ||||||||||||||||||||||||||||||||||||
Hypothetical 5% return | 1,000 | 1,015.92 | + | 8.95 | 1,000 | 1,016.76 | + | 8.10 | 1,000 | 1,015.37 | + | 9.49 | 1,000 | 1,013.24 | + | 11.63 | ||||||||||||||||||||||||||||||||
| Institutional | ||||||||||||||||||||||||||||||||||||||||||||||||
Actual | 1,000 | 1,033.60 | 3.23 | 1,000 | 893.30 | 2.49 | 1,000 | 1,046.30 | 3.81 | 1,000 | 997.10 | 5.84 | ||||||||||||||||||||||||||||||||||||
Hypothetical 5% return | 1,000 | 1,021.62 | + | 3.21 | 1,000 | 1,022.17 | + | 2.66 | 1,000 | 1,021.08 | + | 3.76 | 1,000 | 1,018.94 | + | 5.91 | ||||||||||||||||||||||||||||||||
| Class IR | ||||||||||||||||||||||||||||||||||||||||||||||||
Actual | 1,000 | 1,031.60 | 3.93 | 1,000 | 893.00 | 2.91 | 1,000 | 1,045.50 | 4.56 | 1,000 | 996.10 | 6.58 | ||||||||||||||||||||||||||||||||||||
Hypothetical 5% return | 1,000 | 1,020.93 | + | 3.91 | 1,000 | 1,021.72 | + | 3.11 | 1,000 | 1,020.33 | + | 4.51 | 1,000 | 1,018.20 | + | 6.66 | ||||||||||||||||||||||||||||||||
| Class R | ||||||||||||||||||||||||||||||||||||||||||||||||
Actual | 1,000 | 1,028.30 | 6.49 | 1,000 | 891.10 | 5.25 | 1,000 | 1,043.50 | 6.99 | 1,000 | 994.00 | 9.05 | ||||||||||||||||||||||||||||||||||||
Hypothetical 5% return | 1,000 | 1,018.40 | + | 6.46 | 1,000 | 1,019.24 | + | 5.61 | 1,000 | 1,017.95 | + | 6.90 | 1,000 | 1,015.72 | + | 9.15 | ||||||||||||||||||||||||||||||||
| Class R6 | ||||||||||||||||||||||||||||||||||||||||||||||||
Actual | 1,000 | 1,032.50 | 3.12 | 1,000 | 894.20 | 2.40 | 1,000 | 1,046.30 | 3.70 | N/A | N/A | N/A | ||||||||||||||||||||||||||||||||||||
Hypothetical 5% return | 1,000 | 1,021.72 | + | 3.11 | 1,000 | 1,022.27 | + | 2.56 | 1,000 | 1,021.17 | + | 3.66 | N/A | N/A | N/A | |||||||||||||||||||||||||||||||||
| * | Expenses are calculated using each Fund’s annualized net expense ratio for each class, which represents the ongoing expenses as a percentage of net assets for the six months ended June 30, 2017. Expenses are calculated by multiplying the annualized net expense ratio by the average account value for the period; then multiplying the result by the number of days in the most recent fiscal half year; and then dividing that result by the number of days in the fiscal year. The annualized net expense ratios for the period were as follows: |
| Fund | Class A | Class C | Institutional | Class IR | Class R | Class R6 | ||||||||||||||||||
Absolute Return Tracker | 1.04 | % | 1.79 | % | 0.64 | % | 0.78 | % | 1.29 | % | 0.62 | % | ||||||||||||
Commodity Strategy | 0.87 | 1.62 | 0.53 | 0.62 | 1.12 | 0.51 | ||||||||||||||||||
Dynamic Allocation | 1.15 | 1.90 | 0.75 | 0.90 | 1.38 | 0.73 | ||||||||||||||||||
Managed Futures Strategy | 1.58 | 2.33 | 1.18 | 1.33 | 1.83 | N/A | ||||||||||||||||||
| + | Hypothetical expenses are based on each Fund’s actual annualized net expense ratios and an assumed rate of return of 5% per year before expenses. |
82
GOLDMAN SACHS SELECT SATELLITE FUNDS
Statement Regarding Basis for Approval of Management Agreement (Unaudited)
Background
The Goldman Sachs Absolute Return Tracker Fund, Goldman Sachs Commodity Strategy Fund, Goldman Sachs Dynamic Allocation Fund, and Goldman Sachs Managed Futures Strategy Fund (the “Funds”) are investment portfolios of Goldman Sachs Trust (the “Trust”). The Board of Trustees oversees the management of the Trust and reviews the investment performance and expenses of the Funds at regularly scheduled meetings held throughout the year. In addition, the Board of Trustees determines annually whether to approve the continuance of the Trust’s investment management agreement (the “Management Agreement”) with Goldman Sachs Asset Management, L.P. (the “Investment Adviser”) on behalf of the Funds.
The Management Agreement was most recently approved for continuation until June 30, 2018 by the Board of Trustees, including those Trustees who are not parties to the Management Agreement or “interested persons” (as defined in the Investment Company Act of 1940, as amended) of any party thereto (the “Independent Trustees”), at a meeting held on June 14-15, 2017 (the “Annual Meeting”).
The review process undertaken by the Trustees spans the course of the year and culminates with the Annual Meeting. To assist the Trustees in their deliberations, the Trustees have established a Contract Review Committee (the “Committee”), comprised of the Independent Trustees. The Committee held four meetings over the course of the year since the Management Agreement was last approved. At those Committee meetings, regularly scheduled Board or other committee meetings, and/or the Annual Meeting, matters relevant to the renewal of the Management Agreement were considered by the Board, or the Independent Trustees, as applicable. With respect to each Fund, such matters included:
| (a) | the nature and quality of the advisory, administrative, and other services provided to the Fund by the Investment Adviser and its affiliates, including information about: |
| (i) | the structure, staff, and capabilities of the Investment Adviser and its portfolio management teams; |
| (ii) | the groups within the Investment Adviser and its affiliates that support the portfolio management teams or provide other types of necessary services, including fund services groups (e.g., accounting and financial reporting, tax, shareholder services, and operations); controls and risk management groups (e.g., legal, compliance, valuation oversight, credit risk management, internal audit, compliance testing, market risk analysis, finance, and central funding); sales and distribution support groups, and others (e.g., information technology and training); |
| (iii) | trends in employee headcount; |
| (iv) | the Investment Adviser’s financial resources and ability to hire and retain talented personnel and strengthen its operations; and |
| (v) | the parent company’s support of the Investment Adviser and its mutual fund business, as expressed by the firm’s senior management; |
| (b) | information on the investment performance of the Fund, including comparisons to the performance of similar mutual funds, as provided by a third-party mutual fund data provider engaged as part of the contract review process (the “Outside Data Provider”), a benchmark performance index, and (in the case of the Absolute Return Tracker Fund) a composite of accounts with comparable investment strategies managed by the Investment Adviser; and information on general investment outlooks in the markets in which the Fund invests; |
| (c) | information provided by the Investment Adviser indicating the Investment Adviser’s views on whether the Fund’s peer group and/or benchmark index had high, medium, or low relevance given the Fund’s particular investment strategy; |
| (d) | the terms of the Management Agreement and other agreements with affiliated service providers entered into by the Trust on behalf of the Fund; |
| (e) | fee and expense information for the Fund, including: |
| (i) | the relative management fee and expense levels of the Fund as compared to those of comparable funds managed by other advisers, as provided by the Outside Data Provider; |
| (ii) | the Fund’s expense trends over time; and |
| (iii) | to the extent the Investment Adviser manages other types of accounts (such as bank collective trusts, private wealth management accounts, institutional separate accounts, sub-advised mutual funds, and non-U.S. funds) having investment objectives and policies similar to those of the Fund, comparative information on the advisory fees charged and services provided to those accounts by the Investment Adviser; |
83
GOLDMAN SACHS SELECT SATELLITE FUNDS
Statement Regarding Basis for Approval of Management Agreement (Unaudited) (continued)
| (f) | with respect to the extensive investment performance and expense comparison data provided by the Outside Data Provider, its processes in producing that data for the Fund; |
| (g) | the undertakings of the Investment Adviser and its affiliates to implement fee waivers and/or expense limitations; |
| (h) | information relating to the profitability of the Management Agreement and the transfer agency and distribution and service arrangements of the Fund to the Investment Adviser and its affiliates; |
| (i) | whether the Fund’s existing management fee schedule adequately addressed any economies of scale; |
| (j) | a summary of the “fall-out” benefits derived by the Investment Adviser and its affiliates from their relationships with the Fund, including the fees received by the Investment Adviser’s affiliates from the Fund for transfer agency, securities lending, portfolio trading, distribution and other services; |
| (k) | a summary of potential benefits derived by the Fund as a result of its relationship with the Investment Adviser; |
| (l) | information regarding commissions paid by the Fund and broker oversight, an update on the Investment Adviser’s soft dollars practices, other information regarding portfolio trading, and how the Investment Adviser carries out its duty to seek best execution; |
| (m) | portfolio manager ownership of Fund shares; the manner in which portfolio manager compensation is determined; and the number and types of accounts managed by the portfolio managers; |
| (n) | the nature and quality of the services provided to the Fund by its unaffiliated service providers, and the Investment Adviser’s general oversight and evaluation (including reports on due diligence) of those service providers as part of the administrative services provided under the Management Agreement; and |
| (o) | the Investment Adviser’s processes and policies addressing various types of potential conflicts of interest; its approach to risk management; the annual review of the effectiveness of the Fund’s compliance program; and periodic compliance reports. |
The Trustees also received an overview of the Funds’ distribution arrangements. They received information regarding the Funds’ assets, share purchase and redemption activity, and payment of distribution and service fees. Information was also provided to the Trustees relating to revenue sharing payments made by and services provided by the Investment Adviser and its affiliates to intermediaries that promote the sale, distribution, and/or servicing of Fund shares. The Independent Trustees also discussed the broad range of other investment choices that are available to Fund investors, including the availability of comparable funds managed by other advisers.
The presentations made at the Board and Committee meetings and at the Annual Meeting encompassed the Funds and other mutual funds for which the Board of Trustees has responsibility. In evaluating the Management Agreement at the Annual Meeting, the Trustees relied upon their knowledge, resulting from their meetings and other interactions throughout the year, of the Investment Adviser and its affiliates, their services, and the Funds. In conjunction with these meetings, the Trustees received written materials and oral presentations on the topics covered, and the Investment Adviser addressed the questions and concerns of the Trustees, including concerns regarding the investment performance of certain of the funds they oversee. The Independent Trustees were advised by their independent legal counsel regarding their responsibilities and other regulatory requirements related to the approval and continuation of mutual fund investment management agreements under applicable law. In addition, the Investment Adviser and its affiliates provided the Independent Trustees with a written response to a formal request for information sent on behalf of the Independent Trustees by their independent legal counsel. During the course of their deliberations, the Independent Trustees met in executive sessions with their independent legal counsel, without representatives of the Investment Adviser or its affiliates present.
Nature, Extent, and Quality of the Services Provided Under the Management Agreement
As part of their review, the Trustees considered the nature, extent, and quality of the services provided to the Funds by the Investment Adviser. In this regard, the Trustees considered both the investment advisory services and non-advisory services that are provided by the Investment Adviser and its affiliates. The Trustees noted the transition in the leadership and changes in personnel of various of the Investment Adviser’s portfolio management teams that had occurred in recent periods, and the ongoing recruitment efforts aimed at bringing high quality investment talent to the Investment Adviser. They also noted the Investment Adviser’s commitment to maintaining high quality systems and expending substantial resources to respond to ongoing changes to
84
GOLDMAN SACHS SELECT SATELLITE FUNDS
Statement Regarding Basis for Approval of Management Agreement (Unaudited) (continued)
the regulatory and control environment in which the Funds and their service providers operate, as well as the efforts of the Investment Adviser and its affiliates to combat cyber security risks. The Trustees concluded that the Investment Adviser continued to commit substantial financial and operational resources to the Funds and expressed confidence that the Investment Adviser would continue to do so in the future. The Trustees also recognized that the Investment Adviser had made significant commitments to address regulatory compliance requirements applicable to the Funds and the Investment Adviser and its affiliates.
Investment Performance
The Trustees also considered the investment performance of the Funds. In this regard, they compared the investment performance of each Fund to its peers using rankings and ratings compiled by the Outside Data Provider as of December 31, 2016, and updated performance information prepared by the Investment Adviser using the peer group identified by the Outside Data Provider as of March 31, 2017. The information on each Fund’s investment performance was provided for the one-, three-, five-, and ten-year periods ending on the applicable dates, to the extent that each Fund had been in existence for those periods. The Trustees also reviewed each Fund’s investment performance relative to its performance benchmark. As part of this review, they considered the investment performance trends of the Funds over time, and reviewed the investment performance of each Fund in light of its investment objective and policies and market conditions. The Trustees also received information comparing the Absolute Return Tracker Fund’s performance to that of a composite of accounts with comparable investment strategies managed by the Investment Adviser.
In addition, the Trustees considered materials prepared and presentations made by the Investment Adviser’s senior management and portfolio management personnel in which Fund performance was assessed. The Trustees also considered the Investment Adviser’s periodic reports with respect to the Funds’ risk profiles, and how the Investment Adviser’s approach to risk monitoring and management influences portfolio management. They noted the efforts of the Absolute Return Tracker, Dynamic Allocation, and Managed Futures Strategy Funds’ portfolio management team to continue to enhance the investment models used in managing the Funds.
The Trustees observed that the Absolute Return Tracker Fund’s Institutional Shares had placed in the top half of the Fund’s peer group for the one-, three-, and five-year periods ended March 31, 2017; had outperformed the Fund’s benchmark index for the one-, three-, and five-year periods ended April 30, 2017; and had outperformed the average performance of a group of competitor funds, as determined by the Investment Adviser (“Competitor Fund Average”), for the one-, three-, and five-year periods ended March 31, 2017. They noted that the Commodity Strategy Fund’s Institutional Shares had placed in the third quartile of the Fund’s peer group for the one- and ten-year periods and the fourth quartile for the three- and five-year periods, and had outperformed the Fund’s benchmark index for the one-, three-, five-, and ten-year periods ended March 31, 2017. The Trustees observed that the Dynamic Allocation Fund’s Institutional Shares had placed in the third quartile of the Fund’s peer group for the one-, three-, and five-year periods; had outperformed the Fund’s LIBOR-based benchmark index by 7.51%, 1.34%, and 2.63%, respectively, for the one-, three-, and five-year periods; and had underperformed the Fund’s Competitor Fund Average for the one-, three-, and five-year periods ended March 31, 2017. They considered that the Dynamic Allocation Fund had certain significant differences from the Fund’s benchmark index that caused it to be an imperfect basis for comparison. The Trustees noted that the Managed Futures Strategy Fund’s Institutional Shares had placed in the top half of the Fund’s peer group for the one-, three-, and five-year periods; had outperformed the Fund’s LIBOR-based benchmark index by 3.61% and 1.63%, respectively, for the three- and five-year periods and underperformed by 1.17% for the one-year period; and had outperformed the Fund’s Competitor Fund Average for the one-year period and underperformed for the three- and five-year periods ended March 31, 2017. They also noted that the Dynamic Allocation and Managed Futures Strategy Funds had experienced certain portfolio management changes in the first half of 2017.
Costs of Services Provided and Competitive Information
The Trustees considered the contractual terms of the Management Agreement and the fee rates payable by each Fund thereunder. In this regard, the Trustees considered information on the services rendered by the Investment Adviser to the Funds, which included both advisory and administrative services that were directed to the needs and operations of the Funds as registered mutual funds.
85
GOLDMAN SACHS SELECT SATELLITE FUNDS
Statement Regarding Basis for Approval of Management Agreement (Unaudited) (continued)
In particular, the Trustees reviewed analyses prepared by the Outside Data Provider regarding the expense rankings of the Funds. The analyses provided a comparison of each Fund’s management fee and breakpoints to those of a relevant peer group and category universe; an expense analysis which compared each Fund’s overall net and gross expenses to a peer group and a category universe; and data comparing each Fund’s net expenses to the peer and category medians. The analyses also compared each Fund’s transfer agency, custody, and distribution fees, other expenses and fee waivers/reimbursements to those of the peer group and category medians. The Trustees concluded that the comparisons provided by the Outside Data Provider were useful in evaluating the reasonableness of the management fees and total expenses paid by the Funds.
With respect to the Absolute Return Tracker and Dynamic Allocation Funds, the Trustees noted that the management fee breakpoint schedules were being reduced at all asset levels. In addition, the Trustees considered the Investment Adviser’s undertakings to implement fee waivers and/or expense limitations. The Trustees noted that the Investment Adviser had agreed to waive a portion of its management fee in an amount equal to the entire management fee paid to the Investment Adviser as the investment adviser to each Fund’s wholly-owned subsidiary. They also considered, to the extent that the Investment Adviser manages other types of accounts having investment objectives and policies similar to those of the Funds, comparative fee information for services provided by the Investment Adviser to those accounts, and information that indicated that services provided to the Funds differed in various significant respects from the services provided to other types of accounts which, in many cases, operated under less stringent legal and regulatory structures, required fewer services from the Investment Adviser to a smaller number of client contact points, and were less time-intensive.
In addition, the Trustees noted that shareholders are able to redeem their Fund shares at any time if shareholders believe that the Fund fees and expenses are too high or if they are dissatisfied with the performance of the Fund.
Profitability
The Trustees reviewed each Fund’s contribution to the Investment Adviser’s revenues and pre-tax profit margins. In this regard the Trustees noted that they had received, among other things, profitability analyses and summaries, revenue and expense schedules by Fund and by function (i.e., investment management, transfer agency and distribution and service), and information on the Investment Adviser’s expense allocation methodology. They observed that the profitability and expense figures are substantially similar to those used by the Investment Adviser for many internal purposes, including compensation decisions among various business groups, and are thus subject to a vigorous internal debate about how certain revenue and expenses should be allocated. The Trustees also noted that the internal audit group within the Goldman Sachs organization had audited the expense allocation methodology and that the internal audit group was satisfied with the reasonableness, consistency, and accuracy of the Investment Adviser’s expense allocation methodology and profitability analysis calculations. Profitability data for each Fund were provided for 2016 and 2015, and the Trustees considered this information in relation to the Investment Adviser’s overall profitability.
Economies of Scale
The Trustees considered the information that had been provided regarding the Investment Adviser’s profitability. The Trustees also considered the breakpoints in the fee rate payable under the Management Agreement for each of the Funds at the following annual percentage rates of the average daily net assets of the Funds:
Absolute Fund | Commodity Fund | Dynamic Allocation Fund | Managed Futures Strategy Fund | |||||||||||||
| First $1 billion | 1.15 | % | 0.50 | % | 0.90 | % | 1.00 | % | ||||||||
| Next $1 billion | 1.04 | 0.50 | 0.81 | 0.90 | ||||||||||||
| Next $3 billion | 0.99 | 0.45 | 0.77 | 0.86 | ||||||||||||
| Next $3 billion | 0.97 | 0.43 | 0.75 | 0.84 | ||||||||||||
| Over $8 billion | 0.95 | 0.42 | 0.74 | 0.82 | ||||||||||||
86
GOLDMAN SACHS SELECT SATELLITE FUNDS
Statement Regarding Basis for Approval of Management Agreement (Unaudited) (continued)
The Trustees noted that the breakpoints were designed to share potential economies of scale, if any, with the Funds and their shareholders as assets under management reach those asset levels. The Trustees considered the amounts of assets in the Funds; the Funds’ recent share purchase and redemption activity; the information provided by the Investment Adviser relating to the costs of the services provided by the Investment Adviser and its affiliates and their realized profits; information comparing fee rates charged by the Investment Adviser with fee rates charged to other funds in the peer groups; and the Investment Adviser’s undertakings to waive a portion of its management fees (with respect to the Absolute Return Tracker and Dynamic Allocation Funds) and to limit certain expenses of the Funds that exceed specified levels. Upon reviewing these matters at the Annual Meeting, the Trustees concluded that the fee breakpoints represented a means of assuring that benefits of scalability, if any, would be passed along to shareholders at the specified asset levels. They also noted that the Investment Adviser had passed along savings to shareholders of the Absolute Return Tracker Fund, which had asset levels above at least the first breakpoint during the prior fiscal year.
Other Benefits to the Investment Adviser and Its Affiliates
The Trustees also considered the other benefits derived by the Investment Adviser and its affiliates from their relationships with the Funds as stated above, including: (a) transfer agency fees received by Goldman Sachs & Co. LLC (“Goldman Sachs”); (b) brokerage and futures commissions earned by Goldman Sachs for executing securities and futures transactions on behalf of the Funds; (c) trading efficiencies resulting from aggregation of orders of the Funds with those for other funds or accounts managed by the Investment Adviser; (d) with respect to the Absolute Return Tracker and Dynamic Allocation Funds, fees earned by Goldman Sachs Agency Lending (“GSAL”), an affiliate of the Investment Adviser, as securities lending agent (and fees earned by the Investment Adviser for managing the fund in which the Absolute Return Tracker and Dynamic Allocation Funds’ cash collateral is invested); (e) the Investment Adviser’s ability to leverage the infrastructure designed to service the Funds on behalf of its other clients; (f) the Investment Adviser’s ability to cross-market other products and services to Fund shareholders; (g) Goldman Sachs’ retention of certain fees as Fund Distributor; (h) the Investment Adviser’s ability to negotiate better pricing with custodians on behalf of its other clients, as a result of the relationship with the Funds; and (i) the possibility that the working relationship between the Investment Adviser and the Funds’ third-party service providers may cause those service providers to be more likely to do business with other areas of Goldman Sachs. In the course of considering the foregoing, the Independent Trustees requested and received further information quantifying certain of these fall-out benefits.
Other Benefits to the Funds and Their Shareholders
The Trustees also noted that the Funds receive certain potential benefits as a result of their relationship with the Investment Adviser, including: (a) trading efficiencies resulting from aggregation of orders of the Funds with those of other funds or accounts managed by the Investment Adviser; (b) enhanced servicing from vendors because of the volume of business generated by the Investment Adviser and its affiliates; (c) enhanced servicing from broker-dealers because of the volume of business generated by the Investment Adviser and its affiliates; (d) the Investment Adviser’s ability to negotiate favorable terms with derivatives counterparties on behalf of the Funds as a result of the size and reputation of the Goldman Sachs organization; (e) the Investment Adviser’s knowledge and experience gained from managing other accounts and products; (f) the Investment Adviser’s ability to hire and retain qualified personnel to provide services to the Funds because of the reputation of the Goldman Sachs organization; (g) the Funds’ access, through the Investment Adviser, to certain firmwide resources (e.g., proprietary risk management systems and databases), subject to certain restrictions; (h) the Absolute Return Tracker and Dynamic Allocation Funds’ ability to participate in the securities lending program administered by GSAL, as measured by the revenue received by the Funds in connection with the program; and (i) the Funds’ access to certain affiliated distribution channels. In addition, the Trustees noted the competitive nature of the mutual fund marketplace, and considered that many of the Funds’ shareholders invested in the Funds in part because of the Funds’ relationship with the Investment Adviser and that those shareholders have a general expectation that the relationship will continue.
87
GOLDMAN SACHS SELECT SATELLITE FUNDS
Statement Regarding Basis for Approval of Management Agreement (Unaudited) (continued)
Conclusion
In connection with their consideration of the Management Agreement, the Trustees gave weight to each of the factors described above, but did not identify any particular factor as controlling their decision. After deliberation and consideration of all of the information provided, including the factors described above, the Trustees concluded, in the exercise of their business judgment, that the management fees paid by each of the Funds were reasonable in light of the services provided to it by the Investment Adviser, the Investment Adviser’s costs and each Fund’s current and reasonably foreseeable asset levels. The Trustees unanimously concluded that the Investment Adviser’s continued management likely would benefit each Fund and its shareholders and that the Management Agreement should be approved and continued with respect to each Fund until June 30, 2018.
88
FUNDS PROFILE
Goldman Sachs Funds
Goldman Sachs is a premier financial services firm, known since 1869 for creating thoughtful and customized investment solutions in complex global markets.
Today, the Investment Management Division of Goldman Sachs serves a diverse set of clients worldwide, including private institutions, public entities and individuals. With approximately $1.21 trillion in assets under supervision as of June 30, 2017, Goldman Sachs Asset Management (“GSAM”) has portfolio management teams located around the world and our investment professionals bring firsthand knowledge of local markets to every investment decision. Assets under supervision includes assets under management and other client assets for which Goldman Sachs does not have full discretion. GSAM leverages the resources of Goldman Sachs & Co. LLC subject to legal, internal and regulatory restrictions.
Money Market
Financial Square FundsSM
| ∎ | Financial Square Treasury Solutions Fund1 |
| ∎ | Financial Square Government Fund1 |
| ∎ | Financial Square Money Market Fund2 |
| ∎ | Financial Square Prime Obligations Fund2 |
| ∎ | Financial Square Treasury Instruments Fund1 |
| ∎ | Financial Square Treasury Obligations Fund1 |
| ∎ | Financial Square Federal Instruments Fund1 |
| ∎ | Financial Square Tax-Exempt Money Market Fund2 |
Investor FundsSM
| ∎ | Investor Money Market Fund3 |
| ∎ | Investor Tax-Exempt Money Market Fund3 |
Fixed Income
Short Duration and Government
| ∎ | Enhanced Income Fund |
| ∎ | High Quality Floating Rate Fund |
| ∎ | Short-Term Conservative Income Fund |
| ∎ | Short Duration Government Fund |
| ∎ | Short Duration Income Fund |
| ∎ | Government Income Fund |
| ∎ | Inflation Protected Securities Fund |
Multi-Sector
| ∎ | Bond Fund |
| ∎ | Core Fixed Income Fund |
| ∎ | Global Income Fund |
| ∎ | Strategic Income Fund |
Municipal and Tax-Free
| ∎ | High Yield Municipal Fund |
| ∎ | Dynamic Municipal Income Fund |
| ∎ | Short Duration Tax-Free Fund |
Single Sector
| ∎ | Investment Grade Credit Fund |
| ∎ | U.S. Mortgages Fund |
| ∎ | High Yield Fund |
| ∎ | High Yield Floating Rate Fund |
| ∎ | Emerging Markets Debt Fund |
| ∎ | Local Emerging Markets Debt Fund |
| ∎ | Dynamic Emerging Markets Debt Fund |
Fixed Income Alternatives
| ∎ | Long Short Credit Strategies Fund |
| ∎ | Strategic Macro Fund4 |
Fundamental Equity
| ∎ | Equity Income Fund5 |
| ∎ | Small Cap Value Fund |
| ∎ | Small/Mid Cap Value Fund |
| ∎ | Mid Cap Value Fund |
| ∎ | Large Cap Value Fund |
| ∎ | Focused Value Fund |
| ∎ | Capital Growth Fund |
| ∎ | Strategic Growth Fund |
| ∎ | Small/Mid Cap Growth Fund |
| ∎ | Flexible Cap Fund6 |
| ∎ | Concentrated Growth Fund7 |
| ∎ | Technology Opportunities Fund |
| ∎ | Growth Opportunities Fund |
| ∎ | Rising Dividend Growth Fund |
| ∎ | Dynamic U.S. Equity Fund |
| ∎ | Income Builder Fund |
Tax-Advantaged Equity
| ∎ | U.S. Tax-Managed Equity Fund |
| ∎ | International Tax-Managed Equity Fund |
| ∎ | U.S. Equity Dividend and Premium Fund |
| ∎ | International Equity Dividend and Premium Fund |
Equity Insights
| ∎ | Small Cap Equity Insights Fund |
| ∎ | U.S. Equity Insights Fund |
| ∎ | Small Cap Growth Insights Fund |
| ∎ | Large Cap Growth Insights Fund |
| ∎ | Large Cap Value Insights Fund |
| ∎ | Small Cap Value Insights Fund |
| ∎ | International Small Cap Insights Fund |
| ∎ | International Equity Insights Fund |
| ∎ | Emerging Markets Equity Insights Fund |
Fundamental Equity International
| ∎ | Strategic International Equity Fund |
| ∎ | Focused International Equity Fund |
| ∎ | Asia Equity Fund |
| ∎ | Emerging Markets Equity Fund |
| ∎ | N-11 Equity Fund |
Select Satellite
| ∎ | Real Estate Securities Fund |
| ∎ | International Real Estate Securities Fund |
| ∎ | Commodity Strategy Fund |
| ∎ | Global Real Estate Securities Fund |
| ∎ | Dynamic Allocation Fund |
| ∎ | Absolute Return Tracker Fund |
| ∎ | Long Short Fund |
| ∎ | Managed Futures Strategy Fund |
| ∎ | MLP Energy Infrastructure Fund |
| ∎ | Multi-Manager Alternatives Fund |
| ∎ | Absolute Return Multi-Asset Fund |
| ∎ | Global Infrastructure Fund |
Total Portfolio Solutions
| ∎ | Global Managed Beta Fund |
| ∎ | Multi-Manager Non-Core Fixed Income Fund |
| ∎ | Multi-Manager U.S. Dynamic Equity Fund |
| ∎ | Multi-Manager Global Equity Fund |
| ∎ | Multi-Manager International Equity Fund |
| ∎ | Tactical Tilt Overlay Fund |
| ∎ | Balanced Strategy Portfolio |
| ∎ | Multi-Manager U.S. Small Cap Equity Fund |
| ∎ | Multi-Manager Real Assets Strategy Fund |
| ∎ | Growth and Income Strategy Portfolio |
| ∎ | Growth Strategy Portfolio |
| ∎ | Equity Growth Strategy Portfolio |
| ∎ | Satellite Strategies Portfolio |
| ∎ | Enhanced Dividend Global Equity Portfolio |
| ∎ | Tax-Advantaged Global Equity Portfolio |
| ∎ | Strategic Factor Allocation Fund |
| ∎ | Target Date 2020 Portfolio |
| ∎ | Target Date 2025 Portfolio |
| ∎ | Target Date 2030 Portfolio |
| ∎ | Target Date 2035 Portfolio |
| ∎ | Target Date 2040 Portfolio |
| ∎ | Target Date 2045 Portfolio |
| ∎ | Target Date 2050 Portfolio |
| ∎ | Target Date 2055 Portfolio |
| ∎ | GQG Partners International Opportunities Fund |
| 1 | You could lose money by investing in the Fund. Although the Fund seeks to preserve the value of your investment at $1.00 per share, it cannot guarantee it will do so. An investment in the Fund is not a deposit of a bank and is not insured or guaranteed by the Federal Deposit Insurance Corporation or any other government agency. The Fund’s sponsor has no legal obligation to provide financial support to the Fund, and you should not expect that the sponsor will provide financial support to the Fund at any time. |
| 2 | You could lose money by investing in the Fund. Because the share price of the Fund will fluctuate, when you sell your shares they may be worth more or less than what you originally paid for them. The Fund may impose a fee upon sale of your shares or may temporarily suspend your ability to sell shares if the Fund’s liquidity falls below required minimums because of market conditions or other factors. An investment in the Fund is not a deposit of a bank and is not insured or guaranteed by the Federal Deposit Insurance Corporation or any other government agency. The Fund’s sponsor has no legal obligation to provide financial support to the Fund, and you should not expect that the sponsor will provide financial support to the Fund at any time. |
| 3 | You could lose money by investing in the Fund. Although the Fund seeks to preserve the value of your investment at $1.00 per share, it cannot guarantee it will do so. The Fund may impose a fee upon sale of your shares or may temporarily suspend your ability to sell shares if the Fund’s liquidity falls below required minimums because of market conditions or other factors. An investment in the Fund is not a deposit of a bank and is not insured or guaranteed by the Federal Deposit Insurance Corporation or any other government agency. The Fund’s sponsor has no legal obligation to provide financial support to the Fund, and you should not expect that the sponsor will provide financial support to the Fund at any time. |
| 4 | Effective on June 20, 2017, the Goldman Sachs Fixed Income Macro Strategies Fund was renamed the Goldman Sachs Strategic Macro Fund. |
| 5 | Effective on June 20, 2017, the Goldman Sachs Growth and Income Fund was renamed the Goldman Sachs Equity Income Fund. |
| 6 | Effective on August 31, 2017, the Goldman Sachs Flexible Cap Growth Fund was renamed the Goldman Sachs Flexible Cap Fund. |
| 7 | Effective on July 28, 2017, the Goldman Sachs Focused Growth Fund was reorganized with and into the Goldman Sachs Concentrated Growth Fund. |
Financial Square FundsSM and Investor FundsSM are registered service marks of Goldman Sachs & Co. LLC.
| * | This list covers open-end funds only. Please visit our website at www.GSAMFUNDS.com to learn about our closed-end funds and exchange-traded funds. |
| TRUSTEES | OFFICERS | |
| Ashok N. Bakhru, Chairman | James A. McNamara, President | |
| Kathryn A. Cassidy | Scott M. McHugh, Principal Financial Officer, Senior Vice | |
| Diana M. Daniels | President, and Treasurer | |
| Herbert J. Markley | Joseph F. DiMaria, Assistant Treasurer | |
| James A. McNamara | and Principal Accounting Officer | |
| Jessica Palmer | Caroline L. Kraus, Secretary | |
| Roy W. Templin | ||
| Gregory G. Weaver | ||
GOLDMAN SACHS & CO. LLC Distributor and Transfer Agent | GOLDMAN SACHS ASSET MANAGEMENT, L.P. Investment Adviser | |
Visit our web site at www.GSAMFUNDS.com to obtain the most recent month-end returns.
Goldman Sachs Asset Management, L.P. 200 West Street, New York, New York 10282
Economic and market forecasts presented herein reflect our judgment as of the date of this presentation and are subject to change without notice. These forecasts do not take into account the specific investment objectives, restrictions, tax and financial situation or other needs of any specific client. Actual data will vary and may not be reflected here. These forecasts are subject to high levels of uncertainty that may affect actual performance. Accordingly, these forecasts should be viewed as merely representative of a broad range of possible outcomes. These forecasts are estimated, based on assumptions, and are subject to significant revision and may change materially as economic and market conditions change. Goldman Sachs has no obligation to provide updates or changes to these forecasts. Case studies and examples are for illustrative purposes only.
The portfolio risk management process includes an effort to monitor and manage risk, but does not imply low risk.
The reports concerning the Funds included in this shareholder report may contain certain forward-looking statements about the factors that may affect the performance of the Funds in the future. These statements are based on Fund management’s predictions and expectations concerning certain future events and their expected impact on the Funds, such as performance of the economy as a whole and of specific industry sectors, changes in the levels of interest rates, the impact of developing world events, and other factors that may influence the future performance of the Funds. Management believes these forward-looking statements to be reasonable, although they are inherently uncertain and difficult to predict. Actual events may cause adjustments in portfolio management strategies from those currently expected to be employed.
A description of the policies and procedures that the Funds use to determine how to vote proxies relating to portfolio securities and information regarding how a Fund voted proxies relating to portfolio securities during the most recent 12-month period ended June 30 is available (i) without charge, upon request by calling 1-800-526-7384 (for Retail Shareholders) or 1-800-621-2550 (for Institutional Shareholders); and (ii) on the Securities and Exchange Commission (“SEC”) web site at http://www. sec.gov.
The Global Industry Classification Standard (GICS) was developed by and is the exclusive property and a service mark of Morgan Stanley Capital International Inc. (MSCI) and Standard & Poor’s, a division of The McGraw-Hill Companies, Inc. (S&P) and is licensed for use by Goldman Sachs. Neither MSCI, S&P nor any other party involved in making or compiling the GICS or any GICS classifications makes any express or implied warranties or representations with respect to such standard or classification (or the results to be obtained by the use thereof), and all such parties hereby expressly disclaim all warranties of originality, accuracy, completeness, merchantability or fitness for a particular purpose with respect to any of such standard or classification. Without limiting any of the foregoing, in no event shall MSCI, S&P, any of their affiliates or any third party involved in making or compiling the GICS or any GICS classifications have any liability for any direct, indirect, special, punitive, consequential or any other damages (including lost profits) even if notified of the possibility of such damages.
The Funds file their complete schedule of portfolio holdings with the SEC for the first and third quarters of each fiscal year on Form N-Qs. The Funds’ Form N-Qs are available on the SEC’s web site at http://www.sec.gov within 60 days after the Funds’ first and third fiscal quarters. The Funds’ Form N-Qs may be reviewed and copied at the SEC’s Public Reference Room in Washington, D.C., and information on the operation of the Public Reference Room may also be obtained by calling 1-800-SEC-0330. Form N-Qs may be obtained upon request and without charge by calling 1-800-526-7384 (for Retail Shareholders) or 1-800-621-2550 (for Institutional Shareholders).
Holdings and allocations shown are as of June 30, 2017 and may not be representative of future investments. Fund holdings should not be relied on in making investment decisions and should not be construed as research or investment advice regarding particular securities. Current and future holdings are subject to risk.
This material is not authorized for distribution to prospective investors unless preceded or accompanied by a current prospectus or summary prospectus, if applicable. Investors should consider a Fund’s objective, risks, and charges and expenses, and read the summary prospectus, if available, and/or the prospectus carefully before investing or sending money. The summary prospectus, if available, and the prospectus contain this and other information about a Fund and may be obtained from your authorized dealer or from Goldman Sachs & Co. LLC by calling (retail – 1-800-526-7384) (institutional – 1-800-621-2550).
© 2017 Goldman Sachs. All rights reserved. 101631-TMPL-08/2017-591342 SELSATSAR-17 / 49K
Goldman Sachs Funds

| Semi-Annual Report | June 30, 2017 | |||
Tax-Advantaged Equity Funds | ||||
U.S. Equity Dividend and Premium | ||||
International Equity Dividend and Premium | ||||
U.S. Tax-Managed Equity | ||||
International Tax-Managed Equity | ||||

Goldman Sachs Tax-Advantaged
Equity Funds
| ∎ | U.S. EQUITY DIVIDEND AND PREMIUM |
| ∎ | INTERNATIONAL EQUITY DIVIDEND AND PREMIUM |
| ∎ | U.S. TAX-MANAGED EQUITY |
| ∎ | INTERNATIONAL TAX-MANAGED EQUITY |
TABLE OF CONTENTS | ||||
| 1 | ||||
| 4 | ||||
Portfolio Management Discussions and Performance Summaries — Equity Dividend and Premium Funds | 5 | |||
| 15 | ||||
Portfolio Management Discussions and Performance Summaries — Global Tax-Managed Funds | 21 | |||
| 26 | ||||
| 27 | ||||
| 52 | ||||
| 56 | ||||
| 64 | ||||
| 82 | ||||
| NOT FDIC-INSURED | May Lose Value | No Bank Guarantee | ||
MARKET REVIEW
Goldman Sachs U.S. Tax-Advantaged Equity Funds
During the six months ended June 30, 2017 (the “Reporting Period”), the U.S. and international equity markets produced positive returns, with international equities recording double-digit gains.
U.S. Equities
As the Reporting Period began in January 2017, U.S. equities rallied to new highs on the prospect of deregulation following executive orders on oil pipelines and on further optimism around infrastructure spending after a $1 trillion proposal from Senate Democrats. Despite political uncertainty and protectionism concerns, U.S. equities continued to rally in February 2017, driven by “risk on” sentiment, or reduced risk aversion, owing to potential U.S. tax reform and deregulation as well as by stronger economic data. In March 2017, the U.S. Federal Reserve (the “Fed”) raised interest rates for the third time since the 2008-2009 global financial crisis, while maintaining projections for three rate hikes this year. However, a seemingly cautious stance on the future path of monetary tightening from the Fed Chair and the presence of a dissenter on the policy committee led to a dovish market reaction. (Dovish tends to suggest lower interest rates; opposite of hawkish.) Political risks subsequently drove U.S. equities lower in the wake of House Republicans’ struggle to schedule a vote on health care. For the month of March 2017, U.S. equities were virtually flat.
U.S. equities fell in April 2017, as Fed committee minutes suggested stocks were overvalued. However, U.S. equities subsequently rebounded on strong first quarter 2017 earnings results and on receding European political risk following the centrist candidate’s win in the French election. Although the U.S. labor market remained strong, economic activity and inflation data appeared to be moderating during the second quarter of 2017. Core inflation softened to 1.7% year- over- year in May 2017, marking a third consecutive month of weakness, while core personal consumption expenditures remained below the Fed’s 2% target at just 1.4% year- over- year. In addition, market expectations for pro-growth U.S. fiscal policy were dampened by domestic political developments. Nonetheless, the Fed proceeded to raise the targeted federal funds rate by 25 basis points in June 2017, citing ongoing strength in the labor market and a pick-up in household spending and business fixed investment. (A basis point is 1/100th of a percentage point.) The results of the Fed’s 2017 Comprehensive Capital Analysis and Review stress test for banks were encouraging, with improving payout ratios. (Payout ratio is the proportion of earnings paid out as dividends to shareholders.)
U.S. equities, as represented by the Standard & Poor’s 500® Index (the “S&P 500® Index”) gained 9.34% during the Reporting Period. Information technology, health care and consumer discretionary were the best performing sectors in the S&P 500® Index by a wide margin. The weakest performing sectors in the S&P 500® Index were energy and telecommunication
1
MARKET REVIEW
services, the only two to post negative absolute returns, followed by real estate and financials, which were comparatively weak but generated positive returns during the Reporting Period.
Within the U.S. equity market, there was significant disparity in performance not only among sectors but also among the various capitalization and style segments. While all capitalization segments posted positive returns, large-cap stocks, as measured by the Russell 1000® Index, performed best, followed by mid-cap stocks, as measured by the Russell Midcap® Index, and then at some distance by small-cap stocks, as measured by the Russell 2000® Index. From a style perspective, growth-oriented stocks significantly outpaced value-oriented stocks across the capitalization spectrum. (All as measured by the Russell Investments indices.)
International Equities
When the Reporting Period started, international equities rallied on the prospect of deregulation in the U.S. following Presidential executive orders on oil pipelines and further optimism around infrastructure. However, international equity markets subsequently retreated on political uncertainty and protectionism concerns. In February 2017, international equities were buoyed by “risk on” sentiment, or reduced risk aversion, owing to potential U.S. tax reform and deregulation as well as by stronger economic data. In March 2017, the Fed raised interest rates. However, a seemingly cautious stance on the future path of monetary tightening from the Fed Chair and the presence of a dissenter on the policy committee led to a dovish market reaction and Japanese yen appreciation, despite the Bank of Japan maintaining its policy rate. Meanwhile the European Central Bank (“ECB”) kept its policy unchanged at its March 2017 meeting but revised its growth and inflation forecasts upwards. Markets interpreted the positive economic assessment as hawkish, sparking concerns around the sequencing of the ECB’s policy steps—namely, whether rates will rise before quantitative easing ends. Still, international equities gained ground in March 2017.
During the second quarter of 2017, international equities were buoyed by receding political risk, as the centrist candidate defeated the nationalist candidate in the French election and successfully secured a parliamentary majority. Political risk also declined in Italy, as the anti-establishment Five Star Movement saw a setback in local elections, and expectations for parliamentary elections this year declined. However, market optimism for pro-growth fiscal policy was dampened by political developments in the U.S. Strong first quarter 2017 corporate earnings results, with double-digit growth across virtually all major developed market regions, were supportive for international equity markets. The U.S. labor market remained strong during the second quarter of 2017, but economic activity and inflation data appeared to be moderating. Nonetheless, the Fed proceeded to raise the targeted federal funds rate by 25 basis points in June 2017. In the same month, European markets reacted hawkishly to the ECB President’s sanguine outlook for recovering inflation and cautious reference to tapering of asset purchases. Japanese equities saw a temporary pullback in June 2017, as market sentiment deteriorated and as the Japanese yen strengthened immediately after the Fed interest rate hike, but quickly rebounded.
For the Reporting Period as a whole, international equities, as measured by the MSCI EAFE Index, posted a return of 13.81%.1 Information technology, consumer staples, industrials and health care were the best performing sectors in the MSCI EAFE Index. The weakest performing
| 1 | All MSCI EAFE returns are net of fees and in U.S. dollar terms. |
2
MARKET REVIEW
sector in the MSCI EAFE Index during the Reporting Period was energy, the only one to post a negative absolute return during the Reporting Period. Telecommunication services, consumer discretionary and real estate were relatively weak compared to the MSCI EAFE Index, but each still generated a double-digit gain.
From a country perspective, China was the best performing equity market in the MSCI EAFE Index by a wide margin during the Reporting Period, followed by Spain, Denmark, Finland and Hong Kong. Ireland was the weakest individual country constituent in the MSCI EAFE Index during the Reporting Period, followed by Australia, Japan and the U.K.
Looking Ahead
In the months ahead, we expect less expensive stocks to outpace more expensive stocks. We also believe that stocks with good momentum are likely to outperform those with poor momentum. Our plan is to seek profitable companies with positive fundamentals, sustainable earnings and a track record of using capital to enhance shareholder value. To that end, we anticipate remaining fully invested, with long-term performance likely to be the result of stock selection rather than sector or capitalization allocations.
We stand behind our investment philosophy that sound economic investment principles, coupled with a disciplined quantitative approach, can provide potentially strong, uncorrelated returns over the long term. Our research agenda is robust, and we continue to enhance our existing models, add new proprietary forecasting signals and improve our trading execution as we seek to provide the most value to our shareholders.
3
What Differentiates the Goldman Sachs
U.S. Equity Dividend and Premium and
Goldman Sachs International Equity Dividend
and Premium Funds’ Investment Process?
The Goldman Sachs U.S. Equity Dividend and Premium Fund seeks to maximize income and total return. The Goldman Sachs International Equity Dividend and Premium Fund seeks to maximize total return with an emphasis on income. Their portfolios consist primarily of large-cap, dividend-paying stocks.1 By investing in these securities, and through the use of option call writing, the Funds seek to generate an attractive after-tax cash flow.

A diversified portfolio:
| ∎ | Create a diversified large-cap equity portfolio that participates in all industries and sectors. |
| ∎ | Emphasize higher dividend-paying stocks within each industry and sector. |
Written call options:
| ∎ | The Funds utilize index call writing to seek to enhance their cash flow. |

| ∎ | We use proprietary quantitative techniques, including optimization tools, a risk model and a transactions cost model, in identifying a portfolio of stocks that we believe may enhance expected dividend yield while limiting deviations when compared to the S&P 500® Index or MSCI EAFE Index, as applicable. |

| ∎ | A fully invested, style-consistent portfolio. |
| ∎ | The Funds seek attractive after-tax cash flow from qualified dividends, long-term capital gains and option call writing. |
| ∎ | The Funds seek to enhance after-tax returns by generating distributions primarily from qualified dividends and long-term capital gains. |
| 1 | Dividends are not guaranteed and a company’s future ability to pay dividends may be limited. There is no guarantee that these objectives will be met. |
4
PORTFOLIO RESULTS
U.S. Equity Dividend and Premium Fund
Investment Objective
The Fund seeks to maximize income and total return.
Portfolio Management Discussion and Analysis
Below, the Goldman Sachs Quantitative Investment Strategies Team discusses the Goldman Sachs U.S. Equity Dividend and Premium Fund’s (the “Fund”) performance and positioning for the six-month period ended June 30, 2017 (the “Reporting Period”).
| Q | How did the Fund perform during the Reporting Period? |
| A | During the Reporting Period, the Fund’s Class A, C, Institutional and IR Shares generated cumulative total returns, without sales charges, of 5.82%, 5.41%, 6.03% and 5.99%, respectively. These returns compare to the 9.34% cumulative total return of the Fund’s primary benchmark, the Standard & Poor’s 500® Index (with dividends reinvested) (the “S&P 500® Index”), during the same period. The Bloomberg Barclays U.S. Aggregate Bond Index, the secondary benchmark, returned 2.27%. Although the Fund does not invest in fixed income securities, maximizing income is part of the Fund’s investment objective, and therefore we believe that a comparison of the Fund’s performance to that of the Bloomberg Barclays U.S. Aggregate Bond Index is useful to investors. |
| Q | What key factors were most responsible for the Fund’s performance during the Reporting Period? |
| A | The sale of call options on the S&P 500® Index detracted from the Fund’s total return during the Reporting Period. (A call option is an option that gives the holder the right to buy a certain quantity of an underlying security at an agreed-upon price at any time up to an agreed-upon date.) |
| Security selection also hampered results, with the Fund’s bias toward stocks with higher dividend yields detracting from performance. Overall, the Fund was hurt by its investments in the information technology, financials and industrials sectors. It benefited from holdings in the consumer staples, real estate and energy sectors. |
| Q | How did the Fund’s call writing affect its performance? |
| A | Consistent with our investment approach, we wrote index call options on a portion of the stock portfolio’s market value. When the Fund sells an index call option, it retains the premium it receives from the sale. However, if the purchaser exercises the option, the Fund is obligated to pay the purchaser the difference between the price of the index and the exercise price of the option. Although the Fund retains the premium it receives from the sale of the option, the premium may not exceed the difference in the value of the index as call options are exercised. This is what happened during the Reporting Period, and our call writing overall detracted from performance. |
| Call option writing has the potential to reduce Fund volatility. Since its inception, the realized daily volatility of the Fund has been 17.88% compared to the realized volatility of the S&P 500® Index of 19.42%. During the Reporting Period, the realized daily volatility of the Fund was 5.68%.1 |
| Q | What was the Fund’s dividend yield during the Reporting Period? |
| A | While maintaining industry and sector weights consistent with the S&P 500® Index, we favor stocks with higher dividend yields. The dividend yield of the Fund’s Institutional Shares during the Reporting Period was 2.62% compared to 2.01% for the S&P 500® Index. (Dividend yield is a ratio that shows how much a company pays out in dividends in a year divided by its share price.) The Fund’s dividend yield served to enhance its quarterly net income distributions. As of June 30, 2017, the Standardized 30-Day Subsidized Yield was 1.93% and the Standardized 30-Day Unsubsidized Yield was 1.91%.2 |
| 1 | The realized daily volatility of the Fund quoted herein is for Institutional Shares, net of fees. Based on GSAM calculations. |
| 2 | The Standardized 30-Day Subsidized Yield and Standardized 30-Day Unsubsidized Yield of the Fund quoted herein is for Institutional Shares, net of fees. Based on GSAM calculations. |
5
PORTFOLIO RESULTS
| Q | Which individual stock holdings detracted significantly from relative performance during the Reporting Period? |
| A | Relative to the S&P 500® Index, the Fund was hurt by its overweight positions in telecommunications conglomerate AT&T; multi-bank holding company New York Community Bancorp; and savings and loan holding company People’s United Financial. The Fund was overweight all three stocks primarily due to their attractive dividend yields and/or risk metrics. |
| Q | Among individual holdings, which stocks contributed most to the Fund’s results? |
| A | The Fund benefited from overweight positions relative to the S&P 500® Index in health care company Abbott Laboratories and aerospace firm Boeing. In addition, an underweight in Anadarko Petroleum, an oil and natural gas exploration and production company, added to performance. The Fund was overweight Abbott Laboratories and Boeing primarily because of their attractive dividend yields and/or risk metrics. It was underweight Anadarko Petroleum largely because of its unattractive yield and/or risk metrics. |
| Q | How did the Fund use derivatives and similar instruments during the Reporting Period? |
| A | During the Reporting Period, we used equity index futures, on an opportunistic basis, to equitize the Fund’s excess cash holdings. In other words, we put the Fund’s excess cash holdings to work by using them as collateral for the purchase of equity index futures. Equity index futures did not have a significant impact on Fund performance during the Reporting Period. Consistent with our investment approach, we also wrote equity index options on a portion of the portfolio’s market value in an effort to generate premiums. Equity index options had a negative impact on performance during the Reporting Period. |
| Q | What changes or enhancements did you make to your quantitative model during the Reporting Period? |
| A | We made no changes to our quantitative model during the Reporting Period. |
6
FUND BASICS
U.S. Equity Dividend and Premium Fund
as of June 30, 2017
PERFORMANCE REVIEW |
| |||||||||||||
| January 1, 2017–June 30, 2017 | Fund Total Return (based on NAV)1 | S&P 500® Index2 (with dividends reinvested) | Bloomberg Barclays U.S. Aggregate Bond Index3 | |||||||||||
| Class A | 5.82% | 9.34 | % | 2.27 | % | |||||||||
| Class C | 5.41 | 9.34 | 2.27 | |||||||||||
| Institutional | 6.03 | 9.34 | 2.27 | |||||||||||
| Class IR | 5.99 | 9.34 | 2.27 | |||||||||||
| 1 | The net asset value (“NAV”) represents the net assets of the class of the Fund (ex-dividend) divided by the total number of shares of the class outstanding. The Fund’s performance reflects the reinvestment of dividends and other distributions. The Fund’s performance does not reflect the deduction of any applicable sales charges. |
| 2 | The S&P 500® Index is an unmanaged composite index of 500 common stock prices. The Index figures do not include any deduction for fees, expenses or taxes. It is not possible to invest directly in an index. |
| 3 | The Bloomberg Barclays U.S. Aggregate Bond Index represents an unmanaged diversified portfolio of fixed income securities, including U.S. Treasuries, investment-grade corporate bonds, and mortgage-backed and asset-backed securities. The Index figures do not reflect any deduction for fees, expenses or taxes. It is not possible to invest directly in an index. |
| STANDARDIZED TOTAL RETURNS4 | ||||||||||||||||||||
| For the period ended 6/30/17 | One Year | Five Years | Ten Years | Since Inception | Inception Date | |||||||||||||||
| Class A | 6.83 | % | 10.38 | % | 5.57 | % | 6.58 | % | 8/31/05 | |||||||||||
| Class C | 11.19 | 10.83 | 5.37 | 6.28 | 8/31/05 | |||||||||||||||
| Institutional | 13.49 | 12.09 | 6.59 | 7.51 | 8/31/05 | |||||||||||||||
| Class IR | 13.37 | 11.93 | N/A | 13.07 | 8/31/10 | |||||||||||||||
| 4 | The Standardized Total Returns are average annual total returns as of the most recent calendar quarter-end. They assume reinvestment of all distributions at NAV. These returns reflect a maximum initial sales charge of 5.5% for Class A Shares and the assumed contingent deferred sales charge for Class C Shares (1% if redeemed within 12 months of purchase). Because Institutional and Class IR Shares do not involve a sales charge, such a charge is not applied to their Standardized Total Returns. |
The returns set forth in the tables above represent past performance. Past performance does not guarantee future results. The Fund’s investment return and principal value will fluctuate so that an investor’s shares, when redeemed, may be worth more or less than their original cost. Current performance may be lower or higher than the performance quoted above. Please visit our web site at www.GSAMFUNDS.com to obtain the most recent month-end returns.
Performance reflects applicable fee waivers and/or expense limitations in effect during the periods shown. In their absence, performance would be reduced. Returns do not reflect the deduction of taxes that a shareholder would pay on Fund distributions or the redemption of Fund shares.
7
FUND BASICS
| EXPENSE RATIOS5 | ||||||||||
| Net Expense Ratio (Current) | Gross Expense Ratio (Before Waivers) | |||||||||
| Class A | 1.15 | % | 1.19 | % | ||||||
| Class C | 1.90 | 1.94 | ||||||||
| Institutional | 0.76 | 0.79 | ||||||||
| Class IR | 0.90 | 0.94 | ||||||||
| 5 | The expense ratios of the Fund, both current (net of applicable fee waivers and/or expense limitations) and before waivers (gross of applicable fee waivers and/or expense limitations) are as set forth above according to the most recent publicly available Prospectus for the Fund and may differ from the expense ratios disclosed in the Financial Highlights in this report. Pursuant to a contractual arrangement, the Fund’s fee waivers and/or expense limitations will remain in place through at least April 28, 2018, and prior to such date, the Investment Adviser may not terminate the arrangements without the approval of the Fund’s Board of Trustees. If these arrangements are discontinued in the future, the expense ratios may change without shareholder approval. |
STANDARDIZED AFTER-TAX PERFORMANCE AS OF 6/30/176 |
| |||||||||||||
| Class A Shares | One Year | Five Years | Ten Years | |||||||||||
| Returns before taxes* | 6.83 | % | 10.38 | % | 5.57 | % | ||||||||
| Returns after taxes on distributions** | 5.38 | 8.88 | 4.55 | |||||||||||
| Returns after taxes on distributions*** | 4.66 | 8.00 | 4.32 | |||||||||||
| and sale of Fund shares | ||||||||||||||
| 6 | The after-tax returns are calculated using the historically highest individual federal marginal income tax rates at the time of distributions (currently 23.8% for qualifying ordinary income dividends and long-term capital gain distributions and 43.4% for non-qualifying ordinary income dividends) and do not reflect state and local taxes. Actual after-tax returns will be calculated at calendar year-end and depend on an investor’s tax situation and may differ from those shown. In addition, the after-tax returns shown are not relevant to investors who hold Fund shares through tax-deferred arrangements such as 401(k) plans or individual retirement accounts. Under certain circumstances, the addition of the tax benefits from capital losses resulting from redemptions may cause the Returns After Taxes on Distributions and Sale of Fund Shares to be greater than the Returns After Taxes on Distributions or even Returns Before Taxes. Standardized after-tax returns assume reinvestment of all distributions at NAV and reflect a maximum initial sales charge of 5.5% for Class A Shares. |
| * | Returns Before Taxes do not reflect taxes on distributions on the Fund’s Class A Shares nor do they show how performance can be impacted by taxes when shares are redeemed. |
| ** | Returns After Taxes on Distributions assume that taxes are paid on distributions on the Fund’s Class A Shares (i.e., dividends and capital gains) but do not reflect taxes that may be incurred upon redemption of the Class A Shares at the end of the performance period. |
| *** | Returns After Taxes on Distributions and Sale of Fund Shares reflect taxes paid on distributions on the Fund’s Class A Shares and taxes applicable when the shares are redeemed. |
8
FUND BASICS
| TOP TEN HOLDINGS AS OF 6/30/177 | ||||||||
| Holding | % of Net Assets | Line of Business | ||||||
| Apple, Inc. | 3.6 | % | Technology Hardware & Equipment | |||||
| Microsoft Corp. | 2.7 | Software & Services | ||||||
| Amazon.com, Inc. | 1.9 | Retailing | ||||||
| Facebook, Inc. Class A | 1.8 | Software & Services | ||||||
| AT&T, Inc. | 1.8 | Telecommunication Services | ||||||
| Pfizer, Inc. | 1.7 | Pharmaceuticals, Biotechnology & Life Sciences | ||||||
| JPMorgan Chase & Co. | 1.7 | Banks | ||||||
| Wells Fargo & Co. | 1.7 | Banks | ||||||
| Johnson & Johnson | 1.6 | Pharmaceuticals, Biotechnology & Life Sciences | ||||||
| Exxon Mobil Corp. | 1.5 | Energy | ||||||
| 7 | The top 10 holdings may not be representative of the Fund’s future investments. |
| FUND VS. BENCHMARK SECTOR ALLOCATIONS8 |
| As of June 30, 2017 |
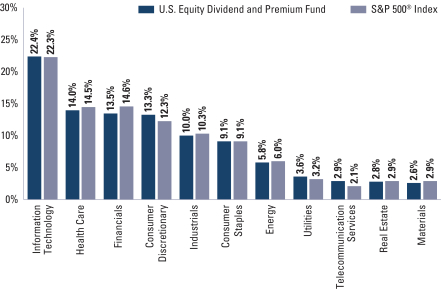
| 8 | The Fund is actively managed and, as such, its composition may differ over time. Consequently, the Fund’s overall sector allocations may differ from percentages contained in the graph above. The graph categorizes investments using Global Industry Classification Standard (“GICS”), however, the sector classifications used by the portfolio management team may differ from GICS. The percentage shown for each investment category reflects the value of investments in that category as a percentage of market value (excluding investments in the securities lending reinvestment vehicle, if any). Underlying sector allocations of exchange traded funds and investment companies held by the Fund are not reflected in the graph above. Investments in the securities lending reinvestment vehicle represented 0.1% of the Fund’s net assets at June 30, 2017. The graph depicts the Fund’s investments but may not represent the Fund’s market exposure due to the exclusion of certain derivatives, if any, as listed in the Additional Investment Information section of the Schedule of Investments. |
9
PORTFOLIO RESULTS
International Equity Dividend and Premium Fund
Investment Objective
The Fund seeks to maximize total return with an emphasis on income.
Portfolio Management Discussion and Analysis
Below, the Goldman Sachs Quantitative Investment Strategies Team discusses the Goldman Sachs International Equity Dividend and Premium Fund’s (the “Fund”) performance and positioning for the six-month period ended June 30, 2017 (the “Reporting Period”).
| Q | How did the Fund perform during the Reporting Period? |
| A | During the Reporting Period, the Fund’s Class A, C, Institutional and IR Shares generated cumulative total returns, without sales charges, of 14.39%, 14.14%, 14.75% and 14.56%, respectively. These returns compare to the 13.81% cumulative total return of the Fund’s primary benchmark, the MSCI EAFE Index (net, USD, unhedged). The Bloomberg Barclays Global Aggregate Bond Index, the secondary benchmark, returned 4.41%. Although the Fund does not invest in fixed income securities, maximizing income is part of the Fund’s investment objective, and therefore we believe that a comparison of the Fund’s performance to that of the Bloomberg Barclays Global Aggregate Bond Index is useful to investors. |
| Q | What key factors were most responsible for the Fund’s performance during the Reporting Period? |
| A | Security selection added to performance during the Reporting Period, with the Fund benefiting from its bias toward stocks with higher dividend yields. Overall, holdings in the information technology, real estate and telecommunication services sectors contributed positively. The Fund was hampered by stock selection in only two sectors, consumer discretionary and utilities. |
| The sale of index call options hurt the Fund’s total return during the Reporting Period. (A call option is an option that gives the holder the right to buy a certain quantity of an underlying security at an agreed-upon price at any time up to an agreed-upon date.) |
| Q | How did the Fund’s call writing affect its performance? |
| A | Consistent with our investment approach, we wrote index call options on a portion of the stock portfolio’s market value. When the Fund sells an index call option, it retains the premium it receives from the sale. However, if the purchaser exercises the option, the Fund is obligated to pay the purchaser the difference between the price of the index and the exercise price of the option. While the Fund retains the premium it receives from the sale of the option, the premium may not exceed the difference in the value of the index as call options are exercised. This is what happened during the Reporting Period, and our call writing overall detracted from performance. |
| Call option writing has the potential to reduce Fund volatility. However, since its inception, the realized daily volatility of the Fund has been 22.38% compared to the realized volatility of the MSCI EAFE Index of 20.80%. During the Reporting Period, the realized daily volatility of the Fund was 20.66% compared to the realized volatility of the MSCI EAFE Index of 20.97%.1 |
| Q | What was the Fund’s dividend yield during the Reporting Period? |
| A | While maintaining industry and sector weights consistent with the MSCI EAFE Index, we favor stocks with higher dividend yields. The dividend yield of the Fund’s Institutional Shares during the Reporting Period was 4.20% compared to 3.17% for the MSCI EAFE Index. (Dividend yield is a ratio that shows how much a company pays out in dividends in a year divided by its share price.) The Fund’s dividend yield served to enhance its quarterly net income distributions. As of June 30, 2017, the Standardized 30-Day Subsidized Yield was 2.78% and the Standardized 30-Day Unsubsidized Yield was 2.78%.2 |
| 1 | The realized daily volatility of the Fund quoted herein is for Institutional Shares, net of fees. Based on GSAM calculations. |
| 2 | The Standardized 30-Day Subsidized Yield and Standardized 30-Day Unsubsidized Yield of the Fund quoted herein is for Institutional Shares, net of fees. Based on GSAM calculations. |
10
PORTFOLIO RESULTS
| Q | Among individual holdings, which stocks contributed most to the Fund’s results? |
| A | During the Reporting Period, an overweight position relative to the MSCI EAFE Index in STMicroelectronics, a French electronics and semiconductor maker, added to performance. The Fund also benefited from overweight positions in both Unilever PLC (listed on the London Stock Exchange) and Unilever NV (listed on Euronext Amsterdam). Unilever is a Dutch-British consumer goods company. The Fund held all three stocks mainly because of their attractive dividend yields and/or risk metrics. |
| Q | Which individual stock holdings detracted significantly from relative performance during the Reporting Period? |
| A | Relative to the MSCI EAFE Index, the Fund was hindered by its overweight positions in German automaker Daimler, Australia-based retailer Harvey Norman Holdings and British energy company SSE. It was overweight all three stocks largely because of their attractive dividend yield and/or risk metrics. |
| Q | How did the Fund use derivatives and similar instruments during the Reporting Period? |
| A | During the Reporting Period, we used equity index futures, on an opportunistic basis, to equitize the Fund’s excess cash holdings. In other words, we put the Fund’s excess cash holdings to work by using them as collateral for the purchase of equity index futures. Equity index futures did not have a significant impact on Fund performance during the Reporting Period. Consistent with our investment approach, we also wrote equity index options on a portion of the portfolio’s market value in an effort to generate premiums. Equity index options had a negative impact on performance during the Reporting Period. |
| Q | What changes or enhancements did you make to your quantitative model during the Reporting Period? |
| A | We made no changes to our quantitative model during the Reporting Period. |
11
FUND BASICS
International Equity Dividend and Premium Fund
as of June 30, 2017
| PERFORMANCE REVIEW | ||||||||||||||
| January 1, 2017–June 30, 2017 | Fund Total Return (based on NAV)1 | MSCI EAFE Index (net, USD, unhedged)2 | Bloomberg Barclays Global Aggregate Bond Index3 | |||||||||||
| Class A | 14.39% | 13.81 | % | 4.41 | % | |||||||||
| Class C | 14.14 | 13.81 | 4.41 | |||||||||||
| Institutional | 14.75 | 13.81 | 4.41 | |||||||||||
| Class IR | 14.56 | 13.81 | 4.41 | |||||||||||
| 1 | The net asset value (“NAV”) represents the net assets of the class of the Fund (ex-dividend) divided by the total number of shares of the class outstanding. The Fund’s performance reflects the reinvestment of dividends and other distributions. The Fund’s performance does not reflect the deduction of any applicable sales charges. |
| 2 | The MSCI EAFE Index (net, USD, unhedged) is an unmanaged market capitalization-weighted composite of securities in 21 developed markets. The Index figures do not include any deduction for fees or expenses. It is not possible to invest directly in an index. |
| 3 | The Bloomberg Barclays Global Aggregate Bond Index represents an unmanaged diversified portfolio of fixed income securities, including U.S. Treasuries, investment-grade corporate bonds, and mortgage-backed and asset-backed securities. The Index figures do not reflect any deduction for fees, expenses or taxes. It is not possible to invest directly in an index. |
STANDARDIZED TOTAL RETURNS4 |
| |||||||||||||||||
| For the period ended 6/30/17 | One Year | Five Years | Since Inception | Inception Date | ||||||||||||||
| Class A | 11.46 | % | 5.14 | % | 0.10 | % | 1/31/08 | |||||||||||
| Class C | 16.26 | 5.56 | -0.18 | 1/31/08 | ||||||||||||||
| Institutional | 18.52 | 6.79 | 0.97 | 1/31/08 | ||||||||||||||
| Class IR | 18.44 | 6.59 | 5.26 | 8/31/10 | ||||||||||||||
| 4 | The Standardized Total Returns are average annual total returns as of the most recent calendar quarter-end. They assume reinvestment of all distributions at NAV. These returns reflect a maximum initial sales charge of 5.5% for Class A Shares and the assumed contingent deferred sales charge for Class C Shares (1% if redeemed within 12 months of purchase). Because Institutional and Class IR Shares do not involve a sales charge, such a charge is not applied to their Standardized Total Returns. |
The returns set forth in the tables above represent past performance. Past performance does not guarantee future results. The Fund’s investment return and principal value will fluctuate so that an investor’s shares, when redeemed, may be worth more or less than their original cost. Current performance may be lower or higher than the performance quoted above. Please visit our web site at www.GSAMFUNDS.com to obtain the most recent month-end returns. Performance reflects applicable fee waivers and/or expense limitations in effect during the periods shown. In their absence, performance would be reduced. Returns do not reflect the deduction of taxes that a shareholder would pay on Fund distributions or the redemption of Fund shares.
12
FUND BASICS
| EXPENSE RATIOS5 | ||||||||||
| Net Expense Ratio (Current) | Gross Expense Ratio (Before Waivers) | |||||||||
| Class A | 1.37 | % | 1.38 | % | ||||||
| Class C | 2.12 | 2.13 | ||||||||
| Institutional | 0.97 | 0.98 | ||||||||
| Class IR | 1.12 | 1.13 | ||||||||
| 5 | The expense ratios of the Fund, both current (net of applicable fee waivers and/or expense limitations) and before waivers (gross of applicable fee waivers and/or expense limitations) are as set forth above according to the most recent publicly available Prospectus for the Fund and may differ from the expense ratios disclosed in the Financial Highlights in this report. Pursuant to a contractual arrangement, the Fund’s fee waivers and/or expense limitations will remain in place through at least April 28, 2018, and prior to such date, the Investment Adviser may not terminate the arrangements without the approval of the Fund’s Board of Trustees. If these arrangements are discontinued in the future, the expense ratios may change without shareholder approval. |
STANDARDIZED AFTER-TAX PERFORMANCE AS OF 6/30/176 |
| |||||||||||||
| Class A Shares | One Year | Five Years | Since Inception (1/31/08) | |||||||||||
| Returns before taxes* | 11.46 | % | 5.14 | % | 0.10 | % | ||||||||
| Returns after taxes on distributions** | 10.76 | 4.31 | -0.50 | |||||||||||
Returns after taxes on distributions*** | 6.86 | 4.12 | 0.30 | |||||||||||
| 6 | The after-tax returns are calculated using the historically highest individual federal marginal income tax rates at the time of distributions (currently 23.8% for qualifying ordinary income dividends and long-term capital gain distributions and 43.4% for non-qualifying ordinary income dividends) and do not reflect state and local taxes. Actual after-tax returns will be calculated at calendar year-end and depend on an investor’s tax situation and may differ from those shown. In addition, the after-tax returns shown are not relevant to investors who hold Fund shares through tax-deferred arrangements such as 401(k) plans or individual retirement accounts. Under certain circumstances, the addition of the tax benefits from capital losses resulting from redemptions may cause the Returns After Taxes on Distributions and Sale of Fund Shares to be greater than the Returns After Taxes on Distributions or even Returns Before Taxes. Standardized after-tax returns assume reinvestment of all distributions at NAV and reflect a maximum initial sales charge of 5.5% for Class A Shares. |
| * | Returns Before Taxes do not reflect taxes on distributions on the Fund’s Class A Shares nor do they show how performance can be impacted by taxes when shares are redeemed. |
| ** | Returns After Taxes on Distributions assume that taxes are paid on distributions on the Fund’s Class A Shares (i.e., dividends and capital gains) but do not reflect taxes that may be incurred upon redemption of the Class A Shares at the end of the performance period. |
| *** | Returns After Taxes on Distributions and Sale of Fund Shares reflect taxes paid on distributions on the Fund’s Class A Shares and taxes applicable when the shares are redeemed. |
13
FUND BASICS
| TOP TEN HOLDINGS AS OF 6/30/177 | ||||||||
| Company | % of Net Assets | Line of Business | ||||||
| HSBC Holdings plc | 2.4 | % | Banks | |||||
| GlaxoSmithKline plc ADR | 1.8 | Pharmaceuticals, Biotechnology & Life Sciences | ||||||
Nestle SA (Registered) | 1.6 | Food, Beverage & Tobacco | ||||||
| Novartis AG (Registered) | 1.6 | Pharmaceuticals, Biotechnology & Life Sciences | ||||||
| Daimler AG (Registered) | 1.4 | Automobiles & Components | ||||||
| Roche Holding AG | 1.3 | Pharmaceuticals, Biotechnology & Life Sciences | ||||||
| Vodafone Group plc ADR | 1.3 | Telecommunication Services | ||||||
| National Australia Bank Ltd. | 1.3 | Banks | ||||||
| Unilever NV CVA | 1.2 | Household & Personal Products | ||||||
| Nordea Bank AB | 1.1 | Banks | ||||||
| 7 | The top 10 holdings may not be representative of the Fund’s future investments. |
| FUND VS. BENCHMARK SECTOR ALLOCATIONS8 |
| As of June 30, 2017 |
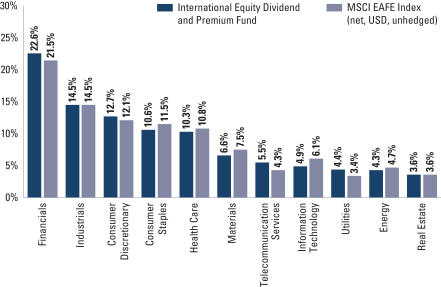
| 8 | The Fund is actively managed and, as such, its composition may differ over time. Consequently, the Fund’s overall sector allocations may differ from percentages contained in the graph above. The graph categorizes investments using Global Industry Classification Standard (“GICS”), however, the sector classifications used by the portfolio management team may differ from GICS. The percentage shown for each investment category reflects the value of investments in that category as a percentage of market value (excluding investments in the securities lending reinvestment vehicle, if any). Underlying sector allocations of exchange traded funds and investment companies held by the Fund are not reflected in the graph above. The graph depicts the Fund’s investments but may not represent the Fund’s market exposure due to the exclusion of certain derivatives, if any, as listed in the Additional Investment Information section of the Schedule of Investments. |
14
INVESTMENT PROCESS
What Differentiates the Goldman Sachs Global Tax-Management Investment Process?
In managing money for many of the world’s wealthiest taxable investors, Goldman Sachs often constructs a diversified investment portfolio around a tax-managed core. With the Goldman Sachs U.S. Tax-Managed Equity Fund and Goldman Sachs International Tax-Managed Equity Fund, investors can access Goldman Sachs’ tax-smart investment expertise while capitalizing on this same strategic approach to portfolio construction.
Goldman Sachs Global Tax-Management Investment Process
The Goldman Sachs Global Tax-Management investment process is a disciplined quantitative approach that has been consistently applied since 1989. With the Goldman Sachs U.S. Tax-Managed Equity Fund and the Goldman Sachs International Tax-Managed Equity Fund, the investment process is enhanced with an additional layer that seeks to maximize after-tax returns.
| ∎ | Comprehensive |
| ∎ | Rigorous |
| ∎ | Objective |
| ∎ | Extensive |
| ∎ | Fundamental |
| ∎ | Insightful |
Advantage: Daily analysis of approximately 3,000 U.S. and international equity securities using a proprietary model.
| ∎ | Benchmark driven |
| ∎ | Sector and size neutral |
| ∎ | Tax optimized |
Tax optimization is an additional layer that is built into the existing investment process — a distinct advantage. While other managers may simply seek to minimize taxable distributions through a low turnover strategy, this extension of the investment process seeks to maximize after-tax returns — the true objective of every taxable investor.
Advantage: Value added through stock selection — not market timing, industry rotation or style bias.
| ∎ | A fully invested, style-consistent portfolio |
| ∎ | Broad access to the total U.S. and international equity markets |
| ∎ | A consistent goal of seeking to maximize after-tax risk-adjusted returns |
15
PORTFOLIO RESULTS
Investment Objective
The Fund seeks to provide long-term after-tax growth of capital through tax-sensitive participation in a broadly diversified portfolio of U.S. equity securities.
Portfolio Management Discussion and Analysis
Below, the Goldman Sachs Quantitative Investment Strategies Team discusses the Goldman Sachs U.S. Tax- Managed Equity Fund’s (the “Fund”) performance and positioning for the six-month period ended June 30, 2017 (the “Reporting Period”).
| Q | How did the Fund perform during the Reporting Period? |
| A | During the Reporting Period, the Fund’s Class A, C, Institutional, Service and IR Shares generated cumulative total returns, without sales charges, of 8.05%, 7.61%, 8.25%, 7.94% and 8.15%, respectively. These returns compare to the 8.93% cumulative total return of the Fund’s benchmark, the Russell 3000® Index (the “Index”), over the same time period. |
| Q | What key factors were most responsible for the Fund’s performance during the Reporting Period? |
| A | During the Reporting Period, three of our quantitative model’s six investment themes added to relative performance. However, the Fund underperformed the Index largely because of certain individual stock positions. |
| Q | What impact did the Fund’s investment themes have on performance during the Reporting Period? |
| A | In keeping with our investment approach, we use our quantitative model and its six investment themes to take a long-term view of market patterns and look for inefficiencies, selecting stocks for the Fund and overweighting or underweighting the ones chosen by the model. Over time and by design, the performance of any one of the model’s investment themes tends to have a low correlation with the model’s other themes, demonstrating the diversification benefit of the Fund’s theme-driven quantitative model. The variance in performance supports our research indicating that the diversification provided by the Fund’s different investment themes is a significant investment advantage over the long term, even though the Fund may experience underperformance in the short term. Of course, diversification does not protect an investor from market risk nor does it ensure a profit. |
| During the Reporting Period, three of our investment themes—Momentum, Valuation and Sentiment—added to the Fund’s relative performance. The Momentum theme seeks to predict drifts in stock prices caused by delayed investor reaction to company-specific information and information about related companies. The Valuation theme attempts to capture potential mispricings of securities, typically by comparing a measure of the company’s intrinsic value to its market value. The Sentiment theme reflects selected investment views and decisions of individuals and financial intermediaries. |
| Our Profitability theme detracted from the Fund’s relative results. The Profitability theme assesses whether a company is earning more than its cost of capital. |
| The impact of our Management and Quality themes was rather neutral during the Reporting Period. The Management theme assesses the characteristics, policies and strategic decisions of company management. The Quality theme seeks to assess both firm and management quality. |
| Q | How did the Fund’s sector and industry allocations affect relative performance? |
| A | In constructing the Fund’s portfolio, we focus on picking stocks rather than on making sector or industry bets. Consequently, the Fund is similar to the Index in terms of its sector and industry allocations and its style. Changes in its sector or industry weights generally do not have a meaningful impact on relative performance. |
| Q | How successful was your stock selection during the Reporting Period? |
| A | The Fund seeks to provide investors with a tax-efficient means for maintaining broadly diversified exposure to the entire U.S. equity market, ranging from large- to small-cap stocks. During the Reporting Period, individual stock |
16
PORTFOLIO RESULTS
| positions in the financials, industrials and consumer staples sectors hurt relative returns. Holdings in the energy, real estate and telecommunications services sectors contributed positively. |
| Q | Which individual stock holdings detracted significantly from relative performance during the Reporting Period? |
| A | During the Reporting Period, overweight positions relative to the Index in automotive parts retailers O’Reilly Auto Parts and Autozone as well as in oilfield services company Baker Hughes detracted from performance. The Fund was overweight O’Reilly Auto Parts and Autozone due to our positive views on Sentiment and Momentum. We assumed the overweight in Baker Hughes because of our positive views on Quality and Sentiment. |
| Q | Among individual holdings, which stocks contributed most to the Fund’s results? |
| A | Relative to the Index, the Fund benefited from an overweight position in Applied Materials, a provider of engineering solutions for the semiconductor, flat panel display and solar photovoltaic industries. We chose to overweight Applied Materials due to our positive views on Sentiment, Valuation and Momentum. Underweight positions in telecommunications company Verizon Communications and oil and gas corporation Exxon Mobil also added to relative performance. The Fund was underweight Verizon Communications because of our negative views on Profitability, Quality and Management. We adopted the underweight in Exxon Mobil as a result of our negative views on Profitability and Quality. |
| Q | How did the Fund use derivatives and similar instruments during the Reporting Period? |
| A | During the Reporting Period, we did not use derivatives as part of an active management strategy to add value to the Fund’s results. However, we used equity index futures, on an opportunistic basis, to equitize the Fund’s excess cash holdings. In other words, we put the Fund’s excess cash holdings to work by using them as collateral for the purchase of equity index futures. Equity index futures did not have a significant impact on Fund performance during the Reporting Period. |
| Q | What changes or enhancements did you make to your quantitative model during the Reporting Period? |
| A | During the Reporting Period, we made some enhancements to our quantitative model within the U.S. region. More specifically, we made two enhancements to our Sentiment theme. First, we introduced a signal that looks at characteristics of the term structure of a company’s credit default swaps to infer investor expectations regarding the health of that company. Second, we introduced an enhancement that looks at companies’ 10-K and 10-Q filings as an indicator of stock price movements. We use natural language processing techniques to parse through quarterly filings in an effort to gauge various aspects of a company related to management’s sentiment, outlook and views of upcoming risks. |
| Q | How was the Fund positioned relative to the Index at the end of the Reporting Period? |
| A | In constructing the Fund’s portfolio, we focus on picking stocks rather than on making industry or sector bets. Consequently, the Fund is similar to the Index in terms of its sector allocation and style. That said, at the end of the Reporting Period, the Fund was overweight relative to the Index in the health care, industrials and consumer discretionary sectors. It was underweight compared to the Index in the financials, utilities, energy and telecommunication services sectors. The Fund was relatively neutral in the information technology, materials, real estate and consumer staples sectors at the end of the Reporting Period. |
17
FUND BASICS
U.S. Tax-Managed Equity Fund
as of June 30, 2017
| PERFORMANCE REVIEW | ||||||||||
| January 1, 2017–June 30, 2017 | Fund Total Return (based on NAV)1 | Russell 3000® Index2 | ||||||||
| Class A | 8.05 | % | 8.93 | % | ||||||
| Class C | 7.61 | 8.93 | ||||||||
| Institutional | 8.25 | 8.93 | ||||||||
| Service | 7.94 | 8.93 | ||||||||
| Class IR | 8.15 | 8.93 | ||||||||
| 1 | The net asset value (“NAV”) represents the net assets of the class of the Fund (ex-dividend) divided by the total number of shares of the class outstanding. The Fund’s performance assumes the reinvestment of dividends and other distributions. The Fund’s performance does not reflect the deduction of any applicable sales charges. |
| 2 | The Russell 3000® Index is an unmanaged index that measures the performance of the 3,000 largest U.S. companies based on total market capitalization, which represents approximately 98% of the investable U.S. equity market. Index figures do not reflect any deduction for fees, expenses or taxes. |
| It | is not possible to invest directly in an index. |
| STANDARDIZED TOTAL RETURNS3 | ||||||||||||||||||||
| For the period ended 6/30/17 | One Year | Five Years | Ten Years | Since Inception | Inception Date | |||||||||||||||
| Class A | 11.58 | % | 13.04 | % | 5.36 | % | 4.47 | % | 4/3/00 | |||||||||||
| Class C | 16.20 | 13.47 | 5.16 | 4.03 | 4/3/00 | |||||||||||||||
| Institutional | 18.55 | 14.78 | 6.40 | 5.24 | 4/3/00 | |||||||||||||||
| Service | 17.90 | 14.21 | 5.86 | 4.71 | 4/3/00 | |||||||||||||||
| Class IR | 18.34 | 14.60 | N/A | 15.80 | 8/31/10 | |||||||||||||||
| 3 | The Standardized Total Returns are average annual total returns as of the most recent calendar quarter-end. They assume reinvestment of all distributions at NAV. These returns reflect a maximum initial sales charge of 5.5% for Class A Shares and the assumed contingent deferred sales charge for Class C Shares (1% if redeemed within 12 months of purchase). Because Institutional, Service and Class IR Shares do not involve a sales charge, such a charge is not applied to their Standardized Total Returns. |
The returns set forth in the tables above represent past performance. Past performance does not guarantee future results. The Fund’s investment return and principal value will fluctuate so that an investor’s shares, when redeemed, may be worth more or less than their original cost. Current performance may be lower or higher than the performance quoted above. Please visit our web site at www.GSAMFUNDS.com to obtain the most recent month-end returns. Performance reflects applicable fee waivers and/or expense limitations in effect during the periods shown. In their absence, performance would be reduced. Returns do not reflect the deduction of taxes that a shareholder would pay on Fund distributions or the redemption of Fund shares.
18
FUND BASICS
| EXPENSE RATIOS4 | ||||||||||
| Net Expense Ratio (Current) | Gross Expense Ratio (Before Waivers) | |||||||||
| Class A | 1.17 | % | 1.17 | % | ||||||
| Class C | 1.92 | 1.92 | ||||||||
| Institutional | 0.77 | 0.77 | ||||||||
| Service | 1.27 | 1.27 | ||||||||
| Class IR | 0.92 | 0.92 | ||||||||
| 4 | The expense ratios of the Fund do not have a fee waiver and expense limitation. The Net and Gross expense ratios will be the same. |
STANDARDIZED AFTER-TAX PERFORMANCE AS OF 6/30/175 |
| |||||||||||||
| Class A Shares | One Year | Five Years | Ten Years | |||||||||||
| Returns before taxes* | 11.58 | % | 13.04 | % | 5.36 | % | ||||||||
| Returns after taxes on distributions** | 11.43 | 12.83 | 5.19 | |||||||||||
Returns after taxes on distributions*** | 6.66 | 10.43 | 4.27 | |||||||||||
| 5 | The after-tax returns are calculated using the historically highest individual federal marginal income tax rates at the time of distributions (currently 23.8% for qualifying ordinary income dividends and long-term capital gain distributions and 43.4% for non-qualifying ordinary income dividends) and do not reflect state and local taxes. Actual after-tax returns will be calculated at calendar year-end and depend on an investor’s tax situation and may differ from those shown. In addition, the after-tax returns shown are not relevant to investors who hold Fund shares through tax-deferred arrangements such as 401(k) plans or individual retirement accounts. Under certain circumstances, the addition of the tax benefits from capital losses resulting from redemptions may cause the Returns After Taxes on Distributions and Sale of Fund Shares to be greater than the Returns After Taxes on Distributions or even Returns Before Taxes. Standardized after-tax returns assume reinvestment of all distributions at NAV and reflect a maximum initial sales charge of 5.5% for Class A Shares. |
| * | Returns Before Taxes do not reflect taxes on distributions on the Fund’s Class A Shares nor do they show how performance can be impacted by taxes when shares are redeemed. |
| ** | Returns After Taxes on Distributions assume that taxes are paid on distributions on the Fund’s Class A Shares (i.e., dividends and capital gains) but do not reflect taxes that may be incurred upon redemption of the Class A Shares at the end of the performance period. |
| *** | Returns After Taxes on Distributions and Sale of Fund Shares reflect taxes paid on distributions on the Fund’s Class A Shares and taxes applicable when the shares are redeemed. |
19
FUND BASICS
| TOP TEN HOLDINGS AS OF 6/30/176 | ||||||||
| Holding | % of Net Assets | Line of Business | ||||||
| Microsoft Corp. | 2.3 | % | Software & Services | |||||
| Apple, Inc. | 2.1 | Technology Hardware & Equipment | ||||||
| Altria Group, Inc. | 1.6 | Food, Beverage & Tobacco | ||||||
| Amgen, Inc. | 1.5 | Pharmaceuticals, Biotechnology & Life Sciences | ||||||
| Amazon.com, Inc. | 1.4 | Retailing | ||||||
| Applied Materials, Inc. | 1.3 | Semiconductors & Semiconductor Equipment | ||||||
| Citizens Financial Group, Inc. | 1.3 | Banks | ||||||
| Facebook, Inc. Class A | 1.3 | Software & Services | ||||||
| Illinois Tool Works, Inc. | 1.3 | Capital Goods | ||||||
| JPMorgan Chase & Co. | 1.2 | Banks | ||||||
| 6 | The top 10 holdings may not be representative of the Fund’s future investments. |
| FUND VS. BENCHMARK SECTOR ALLOCATIONS7 |
| As of June 30, 2017 |
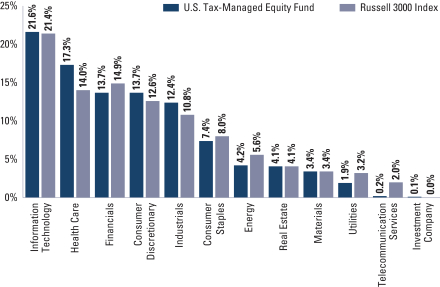
| 7 | The Fund is actively managed and, as such, its composition may differ over time. Consequently, the Fund’s overall sector allocations may differ from percentages contained in the graph above. The graph categorizes investments using Global Industry Classification Standard (“GICS”), however, the sector classifications used by the portfolio management team may differ from GICS. The percentage shown for each investment category reflects the value of investments in that category as a percentage of market value (excluding investments in the securities lending reinvestment vehicle, if any). Underlying sector allocations of exchange traded funds and investment companies held by the Fund are not reflected in the graph above. Investments in the securities lending reinvestment vehicle represented 0.1% of the Fund’s net assets at June 30, 2017. The graph depicts the Fund’s investments but may not represent the Fund’s market exposure due to the exclusion of certain derivatives, if any, as listed in the Additional Investment Information section of the Schedule of Investments. |
20
PORTFOLIO RESULTS
International Tax-Managed Equity Fund
Investment Objective
The Fund seeks to provide long-term after-tax growth of capital through tax-sensitive participation in a broadly diversified portfolio of international equity securities.
Portfolio Management Discussion and Analysis
Below, the Goldman Sachs Quantitative Investment Strategies Team discusses the Goldman Sachs International Tax-Managed Equity Fund’s (the “Fund”) performance and positioning for the six-month period ended June 30, 2017 (the “Reporting Period”).
| Q | How did the Fund perform during the Reporting Period? |
| A | During the Reporting Period, the Fund’s Class A, C, Institutional and IR Shares generated cumulative total returns, without sales charges, of 16.13%, 15.73%, 16.39% and 16.26%, respectively. These returns compare to the 13.81% cumulative total return of the Fund’s benchmark, the MSCI EAFE Index (net, USD, unhedged) (the “Index”), during the same time period. |
| Q | What key factors were most responsible for the Fund’s performance during the Reporting Period? |
| A | During the Reporting Period, the Fund outperformed the Index, with five of our quantitative model’s six investment themes contributing positively to relative returns. |
| Q | What impact did the Fund’s investment themes have on performance during the Reporting Period? |
| A | In keeping with our investment approach, we use our quantitative model and its six investment themes to take a long-term view of market patterns and look for inefficiencies, selecting stocks for the Fund and overweighting or underweighting the ones chosen by the model. Over time and by design, the performance of any one of the model’s investment themes tends to have a low correlation with the model’s other themes, demonstrating the diversification benefit of the Fund’s theme-driven quantitative model. The variance in performance supports our research indicating that the diversification provided by the Fund’s different investment themes is a significant investment advantage over the long term, even though the Fund may experience underperformance in the short term. Of course, diversification does not protect an investor from market risk nor does it ensure a profit. |
| During the Reporting Period, five of our quantitative model’s six investment themes added to the Fund’s results. Momentum, Quality, Sentiment, Valuation and Profitability contributed positively. The Momentum theme seeks to predict drifts in stock prices caused by delayed investor reaction to company-specific information and information about related companies. The Quality theme seeks to assess both firm and management quality. The Sentiment theme reflects selected investment views and decisions of individuals and financial intermediaries. The Valuation theme attempts to capture potential mispricings of securities, typically by comparing a measure of the company’s intrinsic value to its market value. The Profitability theme assesses whether a company is earning more than its cost of capital. |
| Management was the only theme that detracted from the Fund’s relative performance during the Reporting Period. The Management theme assesses the characteristics, policies and strategic decisions of company management. |
| Q | How did the Fund sector and industry allocations affect relative performance? |
| A | In constructing the Fund’s portfolio, we focus on picking stocks rather than on making sector or industry bets. Consequently, the Fund is similar to the Index in terms of its sector and industry allocations and its style. Changes in its sector or industry weights generally do not have a meaningful impact on relative performance. |
21
PORTFOLIO RESULTS
| Q | How successful was your stock selection during the Reporting Period? |
| A | The Fund seeks to provide investors with a tax-efficient means for maintaining broadly diversified exposure to the entire EAFE equity market. During the Reporting Period, stock selection in the industrials, consumer discretionary and information technology sectors bolstered relative returns. Holdings in the consumer staples, financials and utilities sectors dampened results. |
| Q | Among individual holdings, which stocks contributed most to the Fund’s results? |
| A | Relative to the Index, the Fund benefited from overweight positions in airlines Air France-KLM and Deutsche Lufthansa. The overweight in Air France-KLM was the result of our positive views on Momentum and Valuation. We chose to overweight Deutsche Lufthansa because of our positive views on Sentiment and Momentum. An underweight in Japan-based Toyota Motor, assumed due to our negative views on Sentiment and Momentum, also added to relative performance. |
| Q | Which individual stock holdings detracted significantly from relative performance during the Reporting Period? |
| A | The Fund was hurt during the Reporting Period by its underweight position relative to the Index in Italy-based Banca Intesa. We adopted the underweight due to our negative views on Management and Quality. Overweight positions in Vedanta Resources and Mitsubishi also detracted from relative performance. The Fund was overweight U.K.-headquartered metals and mining company Vedanta Resources because of our positive views on Momentum and Sentiment. The overweight in Mitsubishi, a Japanese industrial conglomerate, was based on our positive views on Profitability and Sentiment. |
| Q | How did the Fund use derivatives and similar instruments during the Reporting Period? |
| A | During the Reporting Period, we did not use derivatives as part of an active management strategy to add value to the Fund’s results. However, we used equity index futures, on an opportunistic basis, to equitize the Fund’s excess cash holdings. In other words, we put the Fund’s excess cash holdings to work by using them as collateral for the purchase of equity index futures. Equity index futures did not have a significant impact on Fund performance during the Reporting Period. |
| Q | What changes or enhancements did you make to your quantitative model during the Reporting Period? |
| A | During the Reporting Period, we made an enhancement to our quantitative model within the Japan region. In our Valuation theme, we introduced an enhancement evaluating the worth of companies’ patents. We utilize data on the exclusiveness of Japanese companies’ patent portfolios with the goal of determining which companies have the most valuable patent portfolios. We believe that companies with more exclusive patents tend to outperform in the long run. |
| Q | How was the Fund positioned relative to the Index at the end of the Reporting Period? |
| A | In constructing the Fund’s portfolio, we focus on picking stocks rather than on country weightings. Consequently, the Fund is similar to the Index in terms of its sector and country allocations. That said, at the end of the Reporting Period, the Fund was overweight the industrials and information technology sectors relative to the Index. It was underweight the telecommunication services, energy, financials and consumer staples sectors. The Fund was relatively neutrally weighted in the consumer discretionary, materials, health care, real estate and utilities sectors at the end of the Reporting Period. |
| At the end of the Reporting Period, the Fund was overweight compared to the Index in Norway, Australia, Hong Kong, the Netherlands and Japan. Relative to the Index, it was underweight the U.K., Switzerland, Belgium and Germany. The Fund was rather neutrally weighted relative to the Index in Sweden, Italy, Denmark, Spain, Singapore, Portugal, New Zealand, Austria, Ireland, Israel, France and Finland at the end of the Reporting Period. |
22
FUND BASICS
International Tax-Managed Equity Fund
as of June 30, 2017
| PERFORMANCE REVIEW | ||||||||||
| January 1, 2017– June 30, 2017 | Fund Total Return (based on NAV)1 | MSCI EAFE Index | ||||||||
| Class A | 16.13 | % | 13.81 | % | ||||||
| Class C | 15.73 | 13.81 | ||||||||
| Institutional | 16.39 | 13.81 | ||||||||
| Class IR | 16.26 | 13.81 | ||||||||
| 1 | The net asset value (“NAV”) represents the net assets of the class of the Fund (ex-dividend) divided by the total number of shares of the class outstanding. The Fund’s performance reflects the reinvestment of dividends and other distributions. The Fund’s performance does not reflect the deduction of any applicable sales charges. |
| 2 | The unmanaged MSCI EAFE Index (net, USD, unhedged) is a market capitalization-weighted composite of securities in 21 developed markets. The Index figures do not include any deduction for fees or expenses. It is not possible to invest directly in an index. |
| STANDARDIZED TOTAL RETURNS3 | ||||||||||||||||||
| For the period ended 6/30/17 | One Year | Five Years | Since Inception | Inception Date | ||||||||||||||
| Class A | 13.55 | % | 8.57 | % | 1.32 | % | 1/31/08 | |||||||||||
| Class C | 18.24 | 9.01 | 1.18 | 1/31/08 | ||||||||||||||
| Institutional | 20.53 | 10.25 | 2.34 | 1/31/08 | ||||||||||||||
| Class IR | 20.45 | 10.07 | 8.16 | 8/31/10 | ||||||||||||||
| 3 | The Standardized Total Returns are average annual total returns as of the most recent calendar quarter-end. They assume reinvestment of all distributions at NAV. These returns reflect a maximum initial sales charge of 5.5% for Class A Shares and the assumed contingent deferred sales charge for Class C Shares (1% if redeemed within 12 months of purchase). Because Institutional and Class IR Shares do not involve a sales charge, such a charge is not applied to their Standardized Total Returns. |
The returns set forth in the tables above represent past performance. Past performance does not guarantee future results. The Fund’s investment return and principal value will fluctuate so that an investor’s shares, when redeemed, may be worth more or less than their original cost. Current performance may be lower or higher than the performance quoted above. Please visit our web site at www.GSAMFUNDS.com to obtain the most recent month-end returns. Performance reflects applicable fee waivers and/or expense limitations in effect during the periods shown. In their absence, performance would be reduced. Returns do not reflect the deduction of taxes that a shareholder would pay on Fund distributions or the redemption of Fund shares.
23
FUND BASICS
| EXPENSE RATIOS4 | ||||||||||
| Net Expense Ratio (Current) | Gross Expense Ratio (Before Waivers) | |||||||||
| Class A | 1.30 | % | 1.39 | % | ||||||
| Class C | 2.05 | 2.14 | ||||||||
| Institutional | 0.90 | 0.99 | ||||||||
| Class IR | 1.05 | 1.14 | ||||||||
| 4 | The expense ratios of the Fund, both current (net of applicable fee waivers and/or expense limitations) and before waivers (gross of applicable fee waivers and/or expense limitations) are as set forth above according to the most recent publicly available Prospectus for the Fund and may differ from the expense ratios disclosed in the Financial Highlights in this report. Pursuant to a contractual arrangement, the Fund’s fee waivers and/or expense limitations will remain in place through at least April 28, 2018, and prior to such date, the Investment Adviser may not terminate the arrangements without the approval of the Fund’s Board of Trustees. If these arrangements are discontinued in the future, the expense ratios may change without shareholder approval. |
STANDARDIZED AFTER-TAX PERFORMANCE AS OF 6/30/175 |
| |||||||||||||
| Class A Shares | One Year | Five Years | Since Inception (1/31/08) | |||||||||||
| Returns before taxes* | 13.55 | % | 8.57 | % | 1.32 | % | ||||||||
| Returns after taxes on distributions** | 13.31 | 8.22 | 1.05 | |||||||||||
Returns after taxes on distributions*** | 8.08 | 6.79 | 1.08 | |||||||||||
| 5 | The after-tax returns are calculated using the historically highest individual federal marginal income tax rates at the time of distributions (currently 23.8% for qualifying ordinary income dividends and long-term capital gain distributions and 43.4% for non-qualifying ordinary income dividends) and do not reflect state and local taxes. Actual after-tax returns will be calculated at calendar year-end and depend on an investor’s tax situation and may differ from those shown. In addition, the after-tax returns shown are not relevant to investors who hold Fund shares through tax-deferred arrangements such as 401(k) plans or individual retirement accounts. Under certain circumstances, the addition of the tax benefits from capital losses resulting from redemptions may cause the Returns After Taxes on Distributions and Sale of Fund Shares to be greater than the Returns After Taxes on Distributions or even Returns Before Taxes. Standardized after-tax returns assume reinvestment of all distributions at NAV and reflect a maximum initial sales charge of 5.5% for Class A Shares. |
| * | Returns Before Taxes do not reflect taxes on distributions on the Fund’s Class A Shares nor do they show how performance can be impacted by taxes when shares are redeemed. |
| ** | Returns After Taxes on Distributions assume that taxes are paid on distributions on the Fund’s Class A Shares (i.e., dividends and capital gains) but do not reflect taxes that may be incurred upon redemption of the Class A Shares at the end of the performance period. |
| *** | Returns After Taxes on Distributions and Sale of Fund Shares reflect taxes paid on distributions on the Fund’s Class A Shares and taxes applicable when the shares are redeemed. |
24
FUND BASICS
| TOP TEN HOLDINGS AS OF 6/30/176 | ||||||||
| Holding | % of Total Net Assets | Line of Business | ||||||
HSBC Holdings plc | 1.5 | % | Banks | |||||
| Bayer AG (Registered) | 1.4 | Pharmaceuticals, Biotechnology & Life Sciences | ||||||
| British American Tobacco plc | 1.3 | Food, Beverage & Tobacco | ||||||
| Banco Santander SA | 1.3 | Banks | ||||||
| AIA Group Ltd. | 1.3 | Insurance | ||||||
| Novo Nordisk A/S Class B | 1.2 | Pharmaceuticals, Biotechnology & Life Sciences | ||||||
| BASF SE | 1.2 | Materials | ||||||
| ING Groep NV | 1.1 | Banks | ||||||
| BNP Paribas SA | 1.1 | Banks | ||||||
| AstraZeneca plc ADR | 1.1 | Pharmaceuticals, Biotechnology & Life Sciences | ||||||
| 6 | The top 10 holdings may not be representative of the Fund’s future investments. |
| FUND VS. BENCHMARK SECTOR ALLOCATIONS7 |
| As of June 30, 2017 |
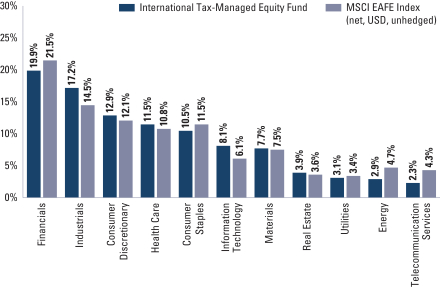
| 7 | The Fund is actively managed and, as such, its composition may differ over time. Consequently, the Fund’s overall sector allocations may differ from percentages contained in the graph above. The graph categorizes investments using Global Industry Classification Standard (“GICS”), however, the sector classifications used by the portfolio management team may differ from GICS. The percentage shown for each investment category reflects the value of investments in that category as a percentage of market value (excluding investments in the securities lending reinvestment vehicle, if any). Underlying sector allocations of exchange traded funds and investment companies held by the Fund are not reflected in the graph above. Investments in the securities lending reinvestment vehicle represented 0.5% of the Fund’s net assets at June 30, 2017. The graph depicts the Fund’s investments but may not represent the Fund’s market exposure due to the exclusion of certain derivatives, if any, as listed in the Additional Investment Information section of the Schedule of Investments. |
25
PORTFOLIO RESULTS
The MSCI EAFE Index is an equity index that captures large and mid-cap representation across developed markets countries around the world, excluding the U.S. and Canada. With 925 constituents as of December 31, 2016, the index covers approximately 85% of the free float-adjusted market capitalization in each country.
The Russell 3000® Index measures the performance of the largest 3,000 U.S. companies representing approximately 98% of the investable U.S. equity market. The Russell 3000 Index is constructed to provide a comprehensive, unbiased and stable barometer of the broad market and is completely reconstituted annually to ensure new and growing equities are reflected.
The S&P 500® Index includes 500 leading companies and captures approximately 80% of available market capitalization of the U.S. equity market.
Russell 1000® Index measures the performance of the large-cap segment of the U.S. equity universe. The Russell 1000® Index is a subset of the Russell 3000® Index and includes approximately 1000 of the largest securities based on a combination of their market cap and current index membership. The Russell 1000® Index represents approximately 92% of the U.S. market. The Russell 1000® Index is constructed to provide a comprehensive and unbiased barometer for the large-cap segment and is completely reconstituted annually to ensure new and growing equities are reflected.
Russell Midcap® Index measures the performance of the mid-cap segment of the U.S. equity universe. The Russell Midcap® Index is a subset of the Russell 1000® Index. The Russell Midcap® Index includes approximately 800 of the smallest securities based on a combination of their market cap and current index membership. The Russell Midcap® Index represents approximately 31% of the total market capitalization of the Russell 1000® Index companies. The Russell Midcap® Index is constructed to provide a comprehensive and unbiased barometer for the mid-cap segment. The Russell Midcap® Index is completely reconstituted annually to ensure larger stocks do not distort the performance and characteristics of the true mid-cap opportunity set.
Russell 2000® Index measures the performance of the small-cap segment of the U.S. equity universe. The Russell 2000® Index is a subset of the Russell 3000® Index representing approximately 10% of the total market capitalization of that index. The Russell 2000® Index includes approximately 2000 of the smallest securities based on a combination of their market cap and current index membership. The Russell 2000® Index is constructed to provide a comprehensive and unbiased small-cap barometer and is completely reconstituted annually to ensure larger stocks do not distort the performance and characteristics of the true small-cap opportunity set.
26
GOLDMAN SACHS U.S. EQUITY DIVIDEND AND PREMIUM FUND
June 30, 2017 (Unaudited)
| Shares | Description | Value | ||||||
| Common Stocks – 99.3% | ||||||||
| Automobiles & Components – 1.1% | ||||||||
| 1,560,800 | Ford Motor Co. | $ | 17,465,352 | |||||
| 525,000 | General Motors Co. | 18,338,250 | ||||||
|
| |||||||
| 35,803,602 | ||||||||
|
| |||||||
| Banks – 6.9% | ||||||||
| 1,287,266 | Bank of America Corp. | 31,229,073 | ||||||
| 245,600 | BB&T Corp. | 11,152,696 | ||||||
| 6,600 | Cullen/Frost Bankers, Inc. | 619,806 | ||||||
| 672,600 | Huntington Bancshares, Inc. | 9,093,552 | ||||||
| 598,729 | JPMorgan Chase & Co.(a) | 54,723,831 | ||||||
| 1,165,500 | New York Community Bancorp, Inc.(b) | 15,303,015 | ||||||
| 331,700 | PacWest Bancorp | 15,490,390 | ||||||
| 1,347,200 | People’s United Financial, Inc.(b) | 23,791,552 | ||||||
| 2,500 | TFS Financial Corp. | 38,675 | ||||||
| 133,700 | US Bancorp | 6,941,704 | ||||||
| 965,000 | Wells Fargo & Co.(a) | 53,470,650 | ||||||
|
| |||||||
| 221,854,944 | ||||||||
|
| |||||||
| Capital Goods – 6.9% | ||||||||
| 107,100 | 3M Co. | 22,297,149 | ||||||
| 156,200 | Boeing Co. (The) | 30,888,550 | ||||||
| 177,800 | Caterpillar, Inc. | 19,106,388 | ||||||
| 224,400 | Eaton Corp. plc | 17,465,052 | ||||||
| 211,100 | Emerson Electric Co. | 12,585,782 | ||||||
| 31,400 | General Dynamics Corp. | 6,220,340 | ||||||
| 1,549,163 | General Electric Co.(a)(b) | 41,842,893 | ||||||
| 124,800 | Honeywell International, Inc. | 16,634,592 | ||||||
| 214,600 | Johnson Controls International plc | 9,305,056 | ||||||
| 11,800 | KBR, Inc. | 179,596 | ||||||
| 67,736 | Lockheed Martin Corp. | 18,804,191 | ||||||
| 49,300 | Raytheon Co. | 7,960,964 | ||||||
| 12,500 | Timken Co. (The) | 578,125 | ||||||
| 107,200 | United Technologies Corp. | 13,090,192 | ||||||
| 24,900 | Watsco, Inc. | 3,839,580 | ||||||
|
| |||||||
| 220,798,450 | ||||||||
|
| |||||||
| Commercial & Professional Services – 0.7% | ||||||||
| 814,100 | Covanta Holding Corp. | 10,746,120 | ||||||
| 111,500 | KAR Auction Services, Inc. | 4,679,655 | ||||||
| 34,337 | LSC Communications, Inc. | 734,812 | ||||||
| 315,100 | Pitney Bowes, Inc. | 4,758,010 | ||||||
| 105,733 | RR Donnelley & Sons Co. | 1,325,892 | ||||||
|
| |||||||
| 22,244,489 | ||||||||
|
| |||||||
| Consumer Durables & Apparel – 1.5% | ||||||||
| 208,700 | Coach, Inc. | 9,879,858 | ||||||
| 133,500 | Garmin Ltd. | 6,812,505 | ||||||
| 531,900 | Mattel, Inc. | 11,451,807 | ||||||
| 243,400 | NIKE, Inc. Class B | 14,360,600 | ||||||
| 102,900 | Tupperware Brands Corp. | 7,226,667 | ||||||
|
| |||||||
| 49,731,437 | ||||||||
|
| |||||||
| Consumer Services – 2.8% | ||||||||
| 40,300 | Brinker International, Inc. | 1,535,430 | ||||||
| 132,200 | Carnival Corp. | 8,668,354 | ||||||
|
| |||||||
| Common Stocks – (continued) | ||||||||
| Consumer Services – (continued) | ||||||||
| 6,461 | Domino’s Pizza, Inc. | 1,366,695 | ||||||
| 16,600 | Dunkin’ Brands Group, Inc. | 914,992 | ||||||
| 339,900 | Extended Stay America, Inc. | 6,580,464 | ||||||
| 82,547 | International Game Technology plc | 1,510,610 | ||||||
| 221,500 | Las Vegas Sands Corp. | 14,151,635 | ||||||
| 203,100 | McDonald’s Corp. | 31,106,796 | ||||||
| 178,900 | Six Flags Entertainment Corp. | 10,664,229 | ||||||
| 205,197 | Starbucks Corp. | 11,965,037 | ||||||
| 9,300 | Vail Resorts, Inc. | 1,886,319 | ||||||
| 71,152 | Wendy’s Co. (The) | 1,103,568 | ||||||
|
| |||||||
| 91,454,129 | ||||||||
|
| |||||||
| Diversified Financials – 4.0% | ||||||||
| 162,100 | Artisan Partners Asset Management, Inc. Class A | 4,976,470 | ||||||
| 168,239 | Berkshire Hathaway, Inc. Class B* | 28,494,639 | ||||||
| 31,800 | BlackRock, Inc. | 13,432,638 | ||||||
| 57,600 | CME Group, Inc. | 7,213,824 | ||||||
| 39,800 | Eaton Vance Corp. | 1,883,336 | ||||||
| 200,500 | Federated Investors, Inc. Class B | 5,664,125 | ||||||
| 821,000 | Invesco Ltd. | 28,890,990 | ||||||
| 10,400 | Legg Mason, Inc. | 396,864 | ||||||
| 26,900 | LPL Financial Holdings, Inc. | 1,142,174 | ||||||
| 274,221 | Morgan Stanley | 12,219,288 | ||||||
| 489,400 | Navient Corp. | 8,148,510 | ||||||
| 127,300 | T Rowe Price Group, Inc. | 9,446,933 | ||||||
| 4,200 | TD Ameritrade Holding Corp. | 180,558 | ||||||
| 154,900 | Thomson Reuters Corp. | 7,170,321 | ||||||
|
| |||||||
| 129,260,670 | ||||||||
|
| |||||||
| Energy – 5.7% | ||||||||
| 79,000 | Baker Hughes, Inc. | 4,306,290 | ||||||
| 32,400 | Cheniere Energy, Inc.* | 1,578,204 | ||||||
| 321,800 | Chevron Corp. | 33,573,394 | ||||||
| 202,400 | ConocoPhillips | 8,897,504 | ||||||
| 31,700 | CONSOL Energy, Inc.* | 473,598 | ||||||
| 17,058 | Continental Resources, Inc.* | 551,485 | ||||||
| 37,300 | Diamondback Energy, Inc.* | 3,312,613 | ||||||
| 54,600 | Energen Corp.* | 2,695,602 | ||||||
| 146,200 | EOG Resources, Inc. | 13,234,024 | ||||||
| 590,400 | Exxon Mobil Corp. (a)(b) | 47,662,992 | ||||||
| 9,300 | Gulfport Energy Corp.* | 137,175 | ||||||
| 207,700 | Halliburton Co. | 8,870,867 | ||||||
| 21,800 | HollyFrontier Corp. | 598,846 | ||||||
| 282,700 | Kinder Morgan, Inc. | 5,416,532 | ||||||
| 35,800 | Kosmos Energy Ltd.* | 229,478 | ||||||
| 67,500 | Laredo Petroleum, Inc.* | 710,100 | ||||||
| 103,200 | Marathon Petroleum Corp. | 5,400,456 | ||||||
| 2,100 | Nabors Industries Ltd. | 17,094 | ||||||
| 140,100 | Occidental Petroleum Corp. | 8,387,787 | ||||||
| 55,500 | Parsley Energy, Inc. Class A* | 1,540,125 | ||||||
| 9,000 | Patterson-UTI Energy, Inc. | 181,710 | ||||||
| 44,100 | PBF Energy, Inc. Class A(c) | 981,666 | ||||||
| 45,100 | Pioneer Natural Resources Co. | 7,197,058 | ||||||
| 84,800 | QEP Resources, Inc.* | 856,480 | ||||||
| 64,400 | Rice Energy, Inc.* | 1,714,972 | ||||||
|
| |||||||
| The accompanying notes are an integral part of these financial statements. | 27 |
GOLDMAN SACHS U.S. EQUITY DIVIDEND AND PREMIUM FUND
Schedule of Investments (continued)
June 30, 2017 (Unaudited)
| Shares | Description | Value | ||||||
| Common Stocks – (continued) | ||||||||
| Energy – (continued) | ||||||||
| 183,400 | Schlumberger Ltd. | $ | 12,075,056 | |||||
| 34,048 | SM Energy Co. | 562,813 | ||||||
| 25,200 | Targa Resources Corp. | 1,139,040 | ||||||
| 80,100 | Valero Energy Corp. | 5,403,546 | ||||||
| 29,200 | Weatherford International plc*(c) | 113,004 | ||||||
| 89,035 | Whiting Petroleum Corp.* | 490,583 | ||||||
| 159,600 | Williams Cos., Inc. (The) | 4,832,688 | ||||||
| 85,900 | WPX Energy, Inc.* | 829,794 | ||||||
|
| |||||||
| 183,972,576 | ||||||||
|
| |||||||
| Food & Staples Retailing – 1.6% | ||||||||
| 133,278 | CVS Health Corp. | 10,723,548 | ||||||
| 149,022 | Sysco Corp. | 7,500,277 | ||||||
| 46,488 | US Foods Holding Corp.* | 1,265,403 | ||||||
| 139,996 | Walgreens Boots Alliance, Inc. | 10,963,087 | ||||||
| 289,840 | Wal-Mart Stores, Inc. | 21,935,091 | ||||||
|
| |||||||
| 52,387,406 | ||||||||
|
| |||||||
| Food, Beverage & Tobacco – 5.4% | ||||||||
| 182,359 | Altria Group, Inc. | 13,580,275 | ||||||
| 97,409 | Archer-Daniels-Midland Co. | 4,030,784 | ||||||
| 12,845 | Bunge Ltd. | 958,237 | ||||||
| 908,400 | Coca-Cola Co. (The) | 40,741,740 | ||||||
| 7,800 | Coca-Cola European Partners plc | 317,226 | ||||||
| 88,300 | Flowers Foods, Inc. | 1,528,473 | ||||||
| 192,600 | General Mills, Inc. | 10,670,040 | ||||||
| 91,300 | Kellogg Co. | 6,341,698 | ||||||
| 162,200 | Kraft Heinz Co. (The) | 13,890,808 | ||||||
| 263,800 | PepsiCo, Inc. | 30,466,262 | ||||||
| 272,500 | Philip Morris International, Inc. | 32,005,125 | ||||||
| 35,300 | Pinnacle Foods, Inc. | 2,096,820 | ||||||
| 251,593 | Reynolds American, Inc. | 16,363,609 | ||||||
|
| |||||||
| 172,991,097 | ||||||||
|
| |||||||
| Health Care Equipment & Services – 4.5% | ||||||||
| 646,241 | Abbott Laboratories | 31,413,775 | ||||||
| 5,600 | ABIOMED, Inc.* | 802,480 | ||||||
| 66,800 | Aetna, Inc. | 10,142,244 | ||||||
| 64,087 | Anthem, Inc. | 12,056,687 | ||||||
| 124,400 | Cardinal Health, Inc. | 9,693,248 | ||||||
| 15,523 | DexCom, Inc.* | 1,135,507 | ||||||
| 50,285 | Hill-Rom Holdings, Inc. | 4,003,189 | ||||||
| 376,354 | Medtronic plc | 33,401,418 | ||||||
| 1,600 | ResMed, Inc. | 124,592 | ||||||
| 6,100 | Tenet Healthcare Corp.*(c) | 117,974 | ||||||
| 208,472 | UnitedHealth Group, Inc. | 38,654,878 | ||||||
| 36,331 | VCA, Inc.* | 3,353,715 | ||||||
| 10,959 | Veeva Systems, Inc. Class A* | 671,896 | ||||||
|
| |||||||
| 145,571,603 | ||||||||
|
| |||||||
| Household & Personal Products – 2.0% | ||||||||
| 136,300 | Kimberly-Clark Corp. | 17,597,693 | ||||||
| 545,899 | Procter & Gamble Co. (The)(a) | 47,575,098 | ||||||
|
| |||||||
| 65,172,791 | ||||||||
|
| |||||||
| Common Stocks – (continued) | ||||||||
| Insurance – 2.5% | ||||||||
| 133,200 | American International Group, Inc. | 8,327,664 | ||||||
| 3,100 | American National Insurance Co. | 361,119 | ||||||
| 167,300 | Arthur J Gallagher & Co. | 9,577,925 | ||||||
| 2,600 | Erie Indemnity Co. Class A | 325,182 | ||||||
| 98,100 | First American Financial Corp. | 4,384,089 | ||||||
| 201,100 | Mercury General Corp. | 10,859,400 | ||||||
| 378,000 | MetLife, Inc. | 20,767,320 | ||||||
| 405,801 | Old Republic International Corp. | 7,925,294 | ||||||
| 105,600 | Principal Financial Group, Inc. | 6,765,792 | ||||||
| 105,200 | Prudential Financial, Inc. | 11,376,328 | ||||||
| 4,000 | Validus Holdings Ltd. | 207,880 | ||||||
|
| |||||||
| 80,877,993 | ||||||||
|
| |||||||
| Materials – 2.6% | ||||||||
| 44,500 | Air Products & Chemicals, Inc. | 6,366,170 | ||||||
| 194,000 | CF Industries Holdings, Inc. | 5,424,240 | ||||||
| 73,600 | Domtar Corp. | 2,827,712 | ||||||
| 306,702 | Dow Chemical Co. (The) | 19,343,695 | ||||||
| 125,700 | EI du Pont de Nemours & Co. | 10,145,247 | ||||||
| 67,100 | Huntsman Corp. | 1,733,864 | ||||||
| 215,400 | International Paper Co. | 12,193,794 | ||||||
| 166,800 | LyondellBasell Industries NV Class A | 14,076,252 | ||||||
| 159,700 | Mosaic Co. (The) | 3,645,951 | ||||||
| 79,800 | Newmont Mining Corp. | 2,584,722 | ||||||
| 47,900 | Nucor Corp. | 2,771,973 | ||||||
| 23,500 | Packaging Corp. of America | 2,617,665 | ||||||
|
| |||||||
| 83,731,285 | ||||||||
|
| |||||||
| Media – 2.8% | ||||||||
| 30,396 | Charter Communications, Inc. Class A* | 10,238,893 | ||||||
| 97,500 | Cinemark Holdings, Inc. | 3,787,875 | ||||||
| 640,916 | Comcast Corp. Class A | 24,944,451 | ||||||
| 320,800 | Interpublic Group of Cos., Inc. (The) | 7,891,680 | ||||||
| 3,600 | John Wiley & Sons, Inc. Class A | 189,900 | ||||||
| 62,200 | Omnicom Group, Inc. | 5,156,380 | ||||||
| 253,400 | Regal Entertainment Group Class A(c) | 5,184,564 | ||||||
| 125,000 | Time Warner, Inc. | 12,551,250 | ||||||
| 23,400 | Tribune Media Co. Class A | 954,018 | ||||||
| 1,900 | Viacom, Inc. Class A | 72,295 | ||||||
| 174,726 | Walt Disney Co. (The) | 18,564,637 | ||||||
|
| |||||||
| 89,535,943 | ||||||||
|
| |||||||
| Pharmaceuticals, Biotechnology & Life Sciences – 9.4% | ||||||||
| 449,085 | AbbVie, Inc.(b) | 32,563,153 | ||||||
| 11,200 | ACADIA Pharmaceuticals, Inc.*(c) | 312,368 | ||||||
| 4,600 | Agios Pharmaceuticals, Inc.* | 236,670 | ||||||
| 6,400 | Alkermes plc* | 371,008 | ||||||
| 41,439 | Allergan plc | 10,073,407 | ||||||
| 11,600 | Alnylam Pharmaceuticals, Inc.* | 925,216 | ||||||
| 192,100 | Amgen, Inc. | 33,085,383 | ||||||
| 69 | AquaBounty Technologies, Inc.* | 553 | ||||||
| 18,782 | BioMarin Pharmaceutical, Inc.* | 1,705,781 | ||||||
| 597 | Bio-Rad Laboratories, Inc. Class A* | 135,107 | ||||||
| 5,200 | Bio-Techne Corp. | 611,000 | ||||||
| 363,600 | Bristol-Myers Squibb Co. | 20,259,792 | ||||||
|
| |||||||
| 28 | The accompanying notes are an integral part of these financial statements. |
GOLDMAN SACHS U.S. EQUITY DIVIDEND AND PREMIUM FUND
| Shares | Description | Value | ||||||
| Common Stocks – (continued) | ||||||||
| Pharmaceuticals, Biotechnology & Life Sciences – (continued) | ||||||||
| 81,724 | Bruker Corp. | $ | 2,356,920 | |||||
| 89,283 | Celgene Corp.* | 11,595,183 | ||||||
| 22,632 | Charles River Laboratories International, Inc.* | 2,289,227 | ||||||
| 213,400 | Eli Lilly & Co. | 17,562,820 | ||||||
| 268,000 | Gilead Sciences, Inc. | 18,969,040 | ||||||
| 700 | Intrexon Corp.*(c) | 16,863 | ||||||
| 20,139 | Ionis Pharmaceuticals, Inc.* | 1,024,471 | ||||||
| 397,500 | Johnson & Johnson(a) | 52,585,275 | ||||||
| 522,050 | Merck & Co., Inc. | 33,458,185 | ||||||
| 7,800 | Neurocrine Biosciences, Inc.* | 358,800 | ||||||
| 1,651,000 | Pfizer, Inc.(a) | 55,457,090 | ||||||
| 103,614 | QIAGEN NV* | 3,474,177 | ||||||
| 34,100 | Quintiles IMS Holdings, Inc.* | 3,051,950 | ||||||
| 2,991 | Seattle Genetics, Inc.* | 154,754 | ||||||
| 4,924 | TESARO, Inc.* | 688,671 | ||||||
|
| |||||||
| 303,322,864 | ||||||||
|
| |||||||
| Real Estate Investment Trusts – 2.8% | ||||||||
| 54,800 | Alexandria Real Estate Equities, Inc. | 6,601,756 | ||||||
| 41,700 | American Campus Communities, Inc. | 1,972,410 | ||||||
| 117,100 | American Homes 4 Rent Class A | 2,642,947 | ||||||
| 127,800 | American Tower Corp. | 16,910,496 | ||||||
| 85,300 | Colony NorthStar, Inc. Class A | 1,201,877 | ||||||
| 63,200 | Crown Castle International Corp. | 6,331,376 | ||||||
| 51,000 | CubeSmart | 1,226,040 | ||||||
| 51,200 | CyrusOne, Inc. | 2,854,400 | ||||||
| 1,100 | DCT Industrial Trust, Inc. | 58,784 | ||||||
| 36,500 | Digital Realty Trust, Inc. | 4,122,675 | ||||||
| 43,400 | Duke Realty Corp. | 1,213,030 | ||||||
| 23,700 | Equinix, Inc. | 10,171,092 | ||||||
| 23,600 | Equity LifeStyle Properties, Inc. | 2,037,624 | ||||||
| 25,500 | Essex Property Trust, Inc. | 6,560,385 | ||||||
| 2,200 | Forest City Realty Trust, Inc. Class A | 53,174 | ||||||
| 16,100 | Healthcare Trust of America, Inc. Class A | 500,871 | ||||||
| 10,400 | Highwoods Properties, Inc. | 527,384 | ||||||
| 155,900 | Invitation Homes, Inc. | 3,372,117 | ||||||
| 21,300 | Kilroy Realty Corp. | 1,600,695 | ||||||
| 72,005 | Mid-America Apartment Communities, Inc. | 7,587,887 | ||||||
| 37,000 | Public Storage | 7,715,610 | ||||||
| 5,500 | SBA Communications Corp.* | 741,950 | ||||||
| 24,300 | Spirit Realty Capital, Inc. | 180,063 | ||||||
| 34,100 | Sun Communities, Inc. | 2,990,229 | ||||||
| 2,300 | Weyerhaeuser Co. | 77,050 | ||||||
|
| |||||||
| 89,251,922 | ||||||||
|
| |||||||
| Retailing – 5.0% | ||||||||
| 62,521 | Amazon.com, Inc.*(a) | 60,520,328 | ||||||
| 50,000 | Best Buy Co., Inc. | 2,866,500 | ||||||
| 134,800 | GameStop Corp. Class A | 2,913,028 | ||||||
| 162,300 | Gap, Inc. (The) | 3,568,977 | ||||||
| 217,175 | Home Depot, Inc. (The) | 33,314,645 | ||||||
|
| |||||||
| Common Stocks – (continued) | ||||||||
| Retailing – (continued) | ||||||||
| 264,300 | L Brands, Inc. | 14,243,127 | ||||||
| 375,900 | Macy’s, Inc. | 8,735,916 | ||||||
| 69,690 | Netflix, Inc.* | 10,412,383 | ||||||
| 39,400 | Penske Automotive Group, Inc. | 1,730,054 | ||||||
| 8,204 | Priceline Group, Inc. (The)* | 15,345,746 | ||||||
| 632,100 | Staples, Inc. | 6,365,247 | ||||||
|
| |||||||
| 160,015,951 | ||||||||
|
| |||||||
| Semiconductors & Semiconductor Equipment – 4.0% | ||||||||
| 152,300 | Analog Devices, Inc. | 11,848,940 | ||||||
| 79,891 | Broadcom Ltd. | 18,618,597 | ||||||
| 435,000 | Cypress Semiconductor Corp. | 5,937,750 | ||||||
| 760,000 | Intel Corp. | 25,642,400 | ||||||
| 24,000 | Marvell Technology Group Ltd. | 396,480 | ||||||
| 224,200 | Maxim Integrated Products, Inc. | 10,066,580 | ||||||
| 104,825 | NVIDIA Corp. | 15,153,502 | ||||||
| 311,200 | QUALCOMM, Inc. | 17,184,464 | ||||||
| 307,749 | Texas Instruments, Inc. | 23,675,131 | ||||||
|
| |||||||
| 128,523,844 | ||||||||
|
| |||||||
| Software & Services – 12.9% | ||||||||
| 117,100 | Accenture plc Class A | 14,482,928 | ||||||
| 165,885 | Activision Blizzard, Inc. | 9,550,000 | ||||||
| 47,903 | Alphabet, Inc. Class A* | 44,534,461 | ||||||
| 47,982 | Alphabet, Inc. Class C* | 43,602,683 | ||||||
| 123,400 | Automatic Data Processing, Inc. | 12,643,564 | ||||||
| 5,700 | Booz Allen Hamilton Holding Corp. | 185,478 | ||||||
| 38,300 | Broadridge Financial Solutions, Inc. | 2,893,948 | ||||||
| 329,500 | CA, Inc. | 11,357,865 | ||||||
| 100 | CDK Global, Inc. | 6,206 | ||||||
| 374,542 | Facebook, Inc. Class A*(a) | 56,548,351 | ||||||
| 180,400 | International Business Machines Corp. | 27,750,932 | ||||||
| 108,220 | Leidos Holdings, Inc. | 5,593,892 | ||||||
| 143,736 | Mastercard, Inc. Class A | 17,456,737 | ||||||
| 6,678 | MercadoLibre, Inc. | 1,675,377 | ||||||
| 1,275,551 | Microsoft Corp.(a) | 87,923,730 | ||||||
| 459,577 | Oracle Corp. | 23,043,191 | ||||||
| 277,100 | Paychex, Inc. | 15,778,074 | ||||||
| 22,718 | PTC, Inc.* | 1,252,216 | ||||||
| 38,500 | Sabre Corp. | 838,145 | ||||||
| 100,212 | salesforce.com, Inc.* | 8,678,359 | ||||||
| 24,962 | ServiceNow, Inc.* | 2,645,972 | ||||||
| 11,091 | Splunk, Inc.* | 630,967 | ||||||
| 1,476 | Square, Inc. Class A* | 34,627 | ||||||
| 234,867 | Visa, Inc. Class A | 22,025,827 | ||||||
| 279,100 | Western Union Co. (The) | 5,316,855 | ||||||
|
| |||||||
| 416,450,385 | ||||||||
|
| |||||||
| Technology Hardware & Equipment – 5.3% | ||||||||
| 796,687 | Apple, Inc.(a) | 114,738,862 | ||||||
| 1,031,748 | Cisco Systems, Inc. | 32,293,712 | ||||||
| 439,600 | HP, Inc. | 7,684,208 | ||||||
| 29,600 | National Instruments Corp. | 1,190,512 | ||||||
| 177,500 | Seagate Technology plc | 6,878,125 | ||||||
| 65,200 | Western Digital Corp. | 5,776,720 | ||||||
|
| |||||||
| The accompanying notes are an integral part of these financial statements. | 29 |
GOLDMAN SACHS U.S. EQUITY DIVIDEND AND PREMIUM FUND
Schedule of Investments (continued)
June 30, 2017 (Unaudited)
| Shares | Description | Value | ||||||
| Common Stocks – (continued) | ||||||||
| Technology Hardware & Equipment – (continued) | ||||||||
| 117,625 | Xerox Corp. | $ | 3,379,366 | |||||
|
| |||||||
| 171,941,505 | ||||||||
|
| |||||||
| Telecommunication Services – 2.9% | ||||||||
| 1,497,228 | AT&T, Inc.(a) | 56,490,412 | ||||||
| 836,300 | Verizon Communications, Inc.(b) | 37,349,158 | ||||||
|
| |||||||
| 93,839,570 | ||||||||
|
| |||||||
| Transportation – 2.4% | ||||||||
| 250,500 | Macquarie Infrastructure Corp. | 19,639,200 | ||||||
| 74,900 | Norfolk Southern Corp. | 9,115,330 | ||||||
| 198,300 | Union Pacific Corp. | 21,596,853 | ||||||
| 234,700 | United Parcel Service, Inc. Class A | 25,955,473 | ||||||
|
| |||||||
| 76,306,856 | ||||||||
|
| |||||||
| Utilities – 3.6% | ||||||||
| 406,400 | CenterPoint Energy, Inc. | 11,127,232 | ||||||
| 216,900 | Dominion Energy, Inc. | 16,621,047 | ||||||
| 263,700 | Duke Energy Corp. | 22,042,683 | ||||||
| 138,300 | FirstEnergy Corp. | 4,032,828 | ||||||
| 229,100 | Great Plains Energy, Inc. | 6,708,048 | ||||||
| 510,200 | PPL Corp. | 19,724,332 | ||||||
| 747,200 | Southern Co. (The) | 35,775,936 | ||||||
|
| |||||||
| 116,032,106 | ||||||||
|
| |||||||
| TOTAL COMMON STOCKS | ||||||||
| (Cost $2,820,536,698) | $ | 3,201,073,418 | ||||||
|
| |||||||
| Shares | Distribution Rate | Value | ||||||
| Investment Company(d)(e) – 0.0% | ||||||||
Goldman Sachs Financial Square Government Fund – Institutional Shares | ||||||||
| 52,404 | 0.845% | $ | 52,404 | |||||
| (Cost $52,404) | ||||||||
| ||||||||
| TOTAL INVESTMENTS BEFORE SECURITIES LENDING REINVESTMENT VEHICLE | ||||||||
| (Cost $2,820,589,102) | $ | 3,201,125,822 | ||||||
| ||||||||
| Securities Lending Reinvestment Vehicle(d)(e) – 0.1% | ||||||||
| | Goldman Sachs Financial Square Government Fund – | | ||||||
| 2,925,000 | 0.845% | $ | 2,925,000 | |||||
| (Cost $2,925,000) | ||||||||
|
| |||||||
| TOTAL INVESTMENTS – 99.4% | ||||||||
| (Cost $2,823,514,102) | $ | 3,204,050,822 | ||||||
|
| |||||||
| | OTHER ASSETS IN EXCESS OF LIABILITIES – 0.6% | 18,897,100 | ||||||
|
| |||||||
| NET ASSETS – 100.0% | $ | 3,222,947,922 | ||||||
|
| |||||||
| The percentage shown for each investment category reflects the value of investments in that category as a percentage of net assets. | ||
* | Non-income producing security. | |
(a) | All or a portion of security is segregated as collateral for call options written. | |
(b) | All or a portion of security is segregated as collateral for initial margin requirements on futures transactions. | |
(c) | All or a portion of security is on loan. | |
(d) | Represents an affiliated issuer. | |
(e) | Variable rate security. Interest rate or distribution rate disclosed is that which is in effect on June 30, 2017. | |
| ADDITIONAL INVESTMENT INFORMATION |
FUTURES CONTRACTS — At June 30, 2017, the Fund had the following futures contracts:
| Type | Number of Contracts Long (Short) | Expiration Date | Current Value | Unrealized Gain (Loss) | ||||||||
S&P 500 E-Mini Index | 125 | September 2017 | $ | 15,130,625 | $ | (107,127 | ) | |||||
| 30 | The accompanying notes are an integral part of these financial statements. |
GOLDMAN SACHS U.S. EQUITY DIVIDEND AND PREMIUM FUND
| ADDITIONAL INVESTMENT INFORMATION (continued) |
WRITTEN OPTIONS CONTRACTS — At June 30, 2017, the Fund had the following written options:
| Call Options | Number of Contracts | Exercise Price | Expiration Month | Value | ||||||||||
S&P 500 Index | 1,720 | $ | 2,400 | July 2017 | $ | (7,791,600 | ) | |||||||
| 1,751 | 2,425 | August 2017 | (6,233,560 | ) | ||||||||||
| 1,721 | 2,445 | September 2017 | (6,195,600 | ) | ||||||||||
| TOTAL (Premiums Received $19,533,257) | 5,192 | $ | (20,220,760 | ) | ||||||||||
For the six months ended June 30, 2017, the Fund had the following written options activity:
Number of Contracts | Premiums Received | |||||||
Contracts Outstanding December 31, 2016 | 4,511 | $ | 19,023,198 | |||||
Contracts written | 9,952 | 41,777,625 | ||||||
Contracts bought to close | (9,271 | ) | (41,267,566 | ) | ||||
Contracts Outstanding June 30, 2017 | 5,192 | $ | 19,533,257 | |||||
| The accompanying notes are an integral part of these financial statements. | 31 |
GOLDMAN SACHS INTERNATIONAL EQUITY DIVIDEND AND PREMIUM FUND
Schedule of Investments
June 30, 2017 (Unaudited)
| Shares | Description | Value | ||||||
| Common Stocks – 98.6% | ||||||||
| Australia – 7.9% | ||||||||
| 63,826 | Alumina Ltd. (Materials) | $ | 94,010 | |||||
| 84,591 | AMP Ltd. (Diversified Financials) | 337,538 | ||||||
| 80,307 | APA Group (Utilities) | 565,861 | ||||||
| 323,365 | Aurizon Holdings Ltd. (Transportation) | 1,331,914 | ||||||
| 75,567 | AusNet Services (Utilities) | 100,756 | ||||||
| 112,863 | Australia & New Zealand Banking Group Ltd. (Banks) | 2,491,077 | ||||||
| 252,016 | Bank of Queensland Ltd. (Banks) | 2,217,287 | ||||||
| 68,467 | Bendigo & Adelaide Bank Ltd. (Banks) | 582,831 | ||||||
| 66,874 | BHP Billiton Ltd. (Materials) | 1,191,957 | ||||||
| 55,970 | BHP Billiton plc (Materials) | 857,500 | ||||||
| 9,364 | Boral Ltd. (Materials) | 49,997 | ||||||
| 139,148 | Coca-Cola Amatil Ltd. (Food, Beverage & Tobacco) | 987,416 | ||||||
| 24,684 | Commonwealth Bank of Australia (Banks) | 1,570,305 | ||||||
| 38,354 | Crown Resorts Ltd. (Consumer Services) | 361,985 | ||||||
| 41,258 | Fortescue Metals Group Ltd. (Materials) | 165,160 | ||||||
| 468,101 | Harvey Norman Holdings Ltd. (Retailing) | 1,374,574 | ||||||
| 404,990 | Insurance Australia Group Ltd. (Insurance) | 2,110,665 | ||||||
| 217,542 | National Australia Bank Ltd. (Banks) | 4,948,744 | ||||||
| 3,196 | Orica Ltd. (Materials) | 50,788 | ||||||
| 4,672 | Sonic Healthcare Ltd. (Health Care Equipment & Services) | 86,987 | ||||||
| 138,474 | Suncorp Group Ltd. (Insurance) | 1,577,219 | ||||||
| 21,373 | Sydney Airport (Transportation) | 116,425 | ||||||
| 294,090 | Tabcorp Holdings Ltd. (Consumer Services) | 987,694 | ||||||
| 607,582 | Telstra Corp. Ltd. (Telecommunication Services) | 2,007,531 | ||||||
| 178,204 | Transurban Group (Transportation) | 1,622,976 | ||||||
| 97,284 | Wesfarmers Ltd. (Food & Staples Retailing) | 2,999,753 | ||||||
| 4,191 | Woodside Petroleum Ltd. (Energy) | 96,138 | ||||||
|
| |||||||
| 30,885,088 | ||||||||
|
| |||||||
| Austria – 0.0% | ||||||||
| 2,800 | voestalpine AG (Materials)(a) | 130,508 | ||||||
|
| |||||||
| Belgium – 2.1% | ||||||||
| 24,370 | Ageas (Insurance) | 981,408 | ||||||
| 37,097 | Anheuser-Busch InBev SA/NV (Food, Beverage & Tobacco)(a) | 4,097,309 | ||||||
| 28,005 | KBC Group NV (Banks) | 2,123,313 | ||||||
| 15,274 | Proximus SADP (Telecommunication Services) | 534,581 | ||||||
| 3,902 | Solvay SA (Materials)(a) | 523,692 | ||||||
|
| |||||||
| 8,260,303 | ||||||||
|
| |||||||
| Canada – 0.0% | ||||||||
| 4,094 | International Petroleum Corp. (Energy)* | 12,149 | ||||||
|
| |||||||
| China – 0.1% | ||||||||
| 86,000 | BOC Hong Kong Holdings Ltd. (Banks) | 411,571 | ||||||
|
| |||||||
| Common Stocks – (continued) | ||||||||
| Denmark – 1.4% | ||||||||
| 485 | Chr Hansen Holding A/S (Materials) | 35,273 | ||||||
| 17,829 | Coloplast A/S Class B (Health Care Equipment & Services) | 1,490,244 | ||||||
| 52,406 | Novo Nordisk A/S Class B (Pharmaceuticals, Biotechnology & Life Sciences) | 2,251,743 | ||||||
| 67,814 | Tryg A/S (Insurance) | 1,483,027 | ||||||
| 3,337 | Vestas Wind Systems A/S (Capital Goods) | 308,230 | ||||||
|
| |||||||
| 5,568,517 | ||||||||
|
| |||||||
| Finland – 2.0% | ||||||||
| 57,458 | Fortum OYJ (Utilities) | 901,725 | ||||||
| 23,393 | Kone OYJ Class B (Capital Goods)(a) | 1,190,121 | ||||||
| 12,595 | Metso OYJ (Capital Goods) | 437,020 | ||||||
| 165,528 | Nokia OYJ (Technology Hardware & Equipment) | 1,014,973 | ||||||
| 15,000 | Nokian Renkaat OYJ (Automobiles & Components) | 620,903 | ||||||
| 13,790 | Orion OYJ Class B (Pharmaceuticals, Biotechnology & Life Sciences) | 880,917 | ||||||
| 25,171 | Sampo OYJ Class A (Insurance)(a) | 1,291,414 | ||||||
| 57,844 | Stora Enso OYJ Class R (Materials) | 747,463 | ||||||
| 22,129 | UPM-Kymmene OYJ (Materials) | 631,002 | ||||||
|
| |||||||
| 7,715,538 | ||||||||
|
| |||||||
| France – 8.8% | ||||||||
| 15,140 | Accor SA (Consumer Services)(a) | 710,206 | ||||||
| 156 | Aeroports de Paris (Transportation) | 25,146 | ||||||
| 6,387 | Air Liquide SA (Materials) | 789,408 | ||||||
| 11,970 | Airbus SE (Capital Goods) | 987,830 | ||||||
| 31,802 | AXA SA (Insurance) | 870,845 | ||||||
| 24,706 | BNP Paribas SA (Banks)(a) | 1,778,653 | ||||||
| 36,142 | Bouygues SA (Capital Goods)(a) | 1,522,671 | ||||||
| 8,909 | Capgemini SE (Software & Services)(a) | 920,322 | ||||||
| 27,913 | Casino Guichard Perrachon SA (Food & Staples Retailing)(a)(b) | 1,653,127 | ||||||
| 36,180 | Credit Agricole SA (Banks) | 582,800 | ||||||
| 10,779 | Danone SA (Food, Beverage & Tobacco) | 809,046 | ||||||
| 33,851 | Edenred (Commercial & Professional Services) | 883,009 | ||||||
| 90,586 | Electricite de France SA (Utilities) | 981,496 | ||||||
| 237,980 | Engie SA (Utilities)(a) | 3,592,010 | ||||||
| 6,368 | Eutelsat Communications SA (Media) | 162,479 | ||||||
| 2,079 | Kering (Consumer Durables & Apparel)(a) | 707,924 | ||||||
| 2,358 | Klepierre (REIT)(a) | 96,644 | ||||||
| 24,354 | Lagardere SCA (Media) | 768,472 | ||||||
| 746 | L’Oreal SA (Household & Personal Products)(a) | 155,552 | ||||||
| 9,353 | LVMH Moet Hennessy Louis Vuitton SE (Consumer Durables & Apparel)(a) | 2,338,768 | ||||||
| 47,668 | Natixis SA (Banks) | 319,982 | ||||||
| 5,546 | Orange SA (Telecommunication Services) | 88,264 | ||||||
|
| |||||||
| 32 | The accompanying notes are an integral part of these financial statements. |
GOLDMAN SACHS INTERNATIONAL EQUITY DIVIDEND AND PREMIUM FUND
| Shares | Description | Value | ||||||
| Common Stocks – (continued) | ||||||||
| France – (continued) | ||||||||
| 8,050 | Renault SA (Automobiles & Components) | $ | 728,326 | |||||
| 71,573 | Rexel SA (Capital Goods) | 1,169,669 | ||||||
| 35,412 | Sanofi (Pharmaceuticals, Biotechnology & Life Sciences)(a) | 3,393,177 | ||||||
| 50,850 | Schneider Electric SE (Capital Goods)*,(a) | 3,907,797 | ||||||
| 22,267 | Societe Generale SA (Banks)(a) | 1,200,764 | ||||||
| 39,670 | TOTAL SA (Energy) | 1,969,497 | ||||||
| 1,317 | Unibail-Rodamco SE (REIT) | 331,854 | ||||||
| 50,727 | Vivendi SA (Telecommunication Services) | 1,129,562 | ||||||
|
| |||||||
| 34,575,300 | ||||||||
|
| |||||||
| Germany – 7.9% | ||||||||
| 19,392 | Allianz SE (Registered) (Insurance)(a) | 3,826,859 | ||||||
| 10,282 | Axel Springer SE (Media) | 618,473 | ||||||
| 27,946 | BASF SE (Materials)(a) | 2,593,643 | ||||||
| 20,057 | Bayer AG (Registered) (Pharmaceuticals, Biotechnology & Life Sciences)(a) | 2,599,592 | ||||||
| 13,810 | Bayerische Motoren Werke AG (Automobiles & Components)(a) | 1,284,431 | ||||||
| 15,417 | Bayerische Motoren Werke AG (Preference) (Automobiles & Components)(c) | 1,272,294 | ||||||
| 74,326 | Daimler AG (Registered) (Automobiles & Components)(a) | 5,390,766 | ||||||
| 8,595 | Deutsche Boerse AG (Diversified Financials) | 907,891 | ||||||
| 47,010 | Deutsche Post AG (Registered) (Transportation)(a) | 1,764,673 | ||||||
| 7,001 | Evonik Industries AG (Materials)(a) | 224,072 | ||||||
| 392 | Fresenius SE & Co. KGaA (Health Care Equipment & Services) | 33,654 | ||||||
| 12,634 | FUCHS PETROLUB SE (Preference) (Materials)(c) | 688,591 | ||||||
| 20,247 | HUGO BOSS AG (Consumer Durables & Apparel)(a) | 1,419,363 | ||||||
| 5,571 | MAN SE (Capital Goods)(a) | 597,459 | ||||||
| 1,994 | Muenchener Rueckversicherungs-Gesellschaft AG in Muenchen (Registered) (Insurance)(a) | 403,492 | ||||||
| 16,117 | ProSiebenSat.1 Media SE (Media)(a) | 676,251 | ||||||
| 13,120 | SAP SE (Software & Services)(a) | 1,373,288 | ||||||
| 18,669 | Siemens AG (Registered) (Capital Goods)(a) | 2,567,995 | ||||||
| 4,311 | Symrise AG (Materials)(a) | 305,867 | ||||||
| 189,119 | Telefonica Deutschland Holding AG (Telecommunication Services) | 945,783 | ||||||
| 5,335 | TUI AG (Consumer Services) | 77,773 | ||||||
| 10,360 | United Internet AG (Registered) (Software & Services)(a) | 570,153 | ||||||
| 21,374 | Vonovia SE (Real Estate)(a) | 850,390 | ||||||
|
| |||||||
| 30,992,753 | ||||||||
|
| |||||||
| Common Stocks – (continued) | ||||||||
| Hong Kong – 2.7% | ||||||||
| 137,000 | AIA Group Ltd. (Insurance) | 1,002,342 | ||||||
| 49,408 | Cheung Kong Property Holdings Ltd. (Real Estate) | 386,632 | ||||||
| 53,408 | CK Hutchison Holdings Ltd. (Capital Goods) | 670,246 | ||||||
| 23,000 | CK Infrastructure Holdings Ltd. (Utilities) | 193,206 | ||||||
| 59,000 | Galaxy Entertainment Group Ltd. (Consumer Services) | 358,089 | ||||||
| 111,000 | Hang Lung Properties Ltd. (Real Estate) | 277,405 | ||||||
| 34,900 | Hang Seng Bank Ltd. (Banks) | 730,115 | ||||||
| 744,448 | Hong Kong & China Gas Co. Ltd. (Utilities) | 1,400,068 | ||||||
| 27,600 | Hong Kong Exchanges & Clearing Ltd. (Diversified Financials) | 713,029 | ||||||
| 27,000 | Hysan Development Co. Ltd. (Real Estate) | 128,855 | ||||||
| 2,700 | Jardine Matheson Holdings Ltd. (Capital Goods) | 173,329 | ||||||
| 239,000 | Link REIT (REIT) | 1,818,083 | ||||||
| 87,189 | New World Development Co. Ltd. (Real Estate) | 110,520 | ||||||
| 17,500 | Power Assets Holdings Ltd. (Utilities) | 154,472 | ||||||
| 155,600 | Sands China Ltd. (Consumer Services) | 712,265 | ||||||
| 135,261 | Sino Land Co. Ltd. (Real Estate) | 221,609 | ||||||
| 29,000 | Sun Hung Kai Properties Ltd. (Real Estate) | 426,015 | ||||||
| 58,200 | Swire Properties Ltd. (Real Estate) | 191,852 | ||||||
| 24,000 | Techtronic Industries Co. Ltd. (Consumer Durables & Apparel) | 110,280 | ||||||
| 107,000 | Wharf Holdings Ltd. (The) (Real Estate) | 885,391 | ||||||
|
| |||||||
| 10,663,803 | ||||||||
|
| |||||||
| Ireland – 0.2% | ||||||||
| 24,569 | CRH plc (Materials)(a) | 870,807 | ||||||
|
| |||||||
| Israel – 0.5% | ||||||||
| 562,979 | Bezeq The Israeli Telecommunication Corp. Ltd. (Telecommunication Services) | 933,865 | ||||||
| 63,751 | Israel Chemicals Ltd. (Materials) | 300,728 | ||||||
| 21,887 | Teva Pharmaceutical Industries Ltd. ADR (Pharmaceuticals, Biotechnology & Life Sciences)(a) | 727,086 | ||||||
|
| |||||||
| 1,961,679 | ||||||||
|
| |||||||
| Italy – 1.7% | ||||||||
| 41,324 | Assicurazioni Generali SpA (Insurance) | 682,101 | ||||||
| 54,886 | Atlantia SpA (Transportation)(a) | 1,543,912 | ||||||
| 121,624 | Eni SpA (Energy)(a) | 1,827,750 | ||||||
| 368,564 | Intesa Sanpaolo SpA RNC (Banks) | 1,096,504 | ||||||
| 386,240 | Intesa Sanpaolo SpA (Banks) | 1,228,557 | ||||||
| 1,178 | Saipem SpA (Energy)* | 4,363 | ||||||
| 95,536 | UnipolSai Assicurazioni SpA (Insurance) | 209,592 | ||||||
|
| |||||||
| 6,592,779 | ||||||||
|
| |||||||
| The accompanying notes are an integral part of these financial statements. | 33 |
GOLDMAN SACHS INTERNATIONAL EQUITY DIVIDEND AND PREMIUM FUND
Schedule of Investments (continued)
June 30, 2017 (Unaudited)
| Shares | Description | Value | ||||||
| Common Stocks – (continued) | ||||||||
| Japan – 22.3% | ||||||||
| 2,400 | ABC-Mart, Inc. (Retailing) | $ | 141,437 | |||||
| 13,000 | AEON Financial Service Co. Ltd. (Diversified Financials) | 275,887 | ||||||
| 24,700 | Alfresa Holdings Corp. (Health Care Equipment & Services) | 477,528 | ||||||
| 3,500 | Alps Electric Co. Ltd. (Technology Hardware & Equipment) | 101,669 | ||||||
| 12,000 | ANA Holdings, Inc. (Transportation) | 41,784 | ||||||
| 209,000 | Aozora Bank Ltd. (Banks) | 797,938 | ||||||
| 26,200 | Asahi Glass Co. Ltd. (Capital Goods) | 1,106,500 | ||||||
| 41,000 | Asahi Kasei Corp. (Materials) | 442,321 | ||||||
| 28,900 | Astellas Pharma, Inc. (Pharmaceuticals, Biotechnology & Life Sciences) | 354,219 | ||||||
| 1,600 | Benesse Holdings, Inc. (Consumer Services) | 60,487 | ||||||
| 57,600 | Bridgestone Corp. (Automobiles & Components) | 2,490,139 | ||||||
| 99,200 | Canon, Inc. (Technology Hardware & Equipment) | 3,374,319 | ||||||
| 18,200 | Casio Computer Co. Ltd. (Consumer Durables & Apparel) | 280,502 | ||||||
| 12,100 | Chugai Pharmaceutical Co. Ltd. (Pharmaceuticals, Biotechnology & Life Sciences) | 453,338 | ||||||
| 31,100 | Chugoku Electric Power Co., Inc. (The) (Utilities) | 343,387 | ||||||
| 11,300 | CYBERDYNE, Inc. (Health Care Equipment & Services)* | 150,578 | ||||||
| 39,200 | Daicel Corp. (Materials) | 489,952 | ||||||
| 9,700 | Dai-ichi Life Holdings, Inc. (Insurance) | 176,069 | ||||||
| 2,800 | Daikin Industries Ltd. (Capital Goods) | 287,258 | ||||||
| 6,600 | Daito Trust Construction Co. Ltd. (Real Estate) | 1,028,252 | ||||||
| 22,200 | Daiwa House Industry Co. Ltd. (Real Estate) | 759,808 | ||||||
| 236,000 | Daiwa Securities Group, Inc. (Diversified Financials) | 1,405,311 | ||||||
| 2,100 | Dentsu, Inc. (Media) | 100,743 | ||||||
| 14,700 | Eisai Co. Ltd. (Pharmaceuticals, Biotechnology & Life Sciences) | 813,315 | ||||||
| 10,300 | FANUC Corp. (Capital Goods) | 1,993,521 | ||||||
| 1,000 | Fast Retailing Co. Ltd. (Retailing) | 334,425 | ||||||
| 5,200 | Hamamatsu Photonics KK (Technology Hardware & Equipment) | 160,249 | ||||||
| 1,300 | Hikari Tsushin, Inc. (Retailing) | 136,962 | ||||||
| 48,300 | Hino Motors Ltd. (Capital Goods) | 539,297 | ||||||
| 1,825 | Hirose Electric Co. Ltd. (Technology Hardware & Equipment) | 261,166 | ||||||
| 6,000 | Hitachi Chemical Co. Ltd. (Materials) | 179,884 | ||||||
| 93,000 | Hitachi Ltd. (Technology Hardware & Equipment) | 573,409 | ||||||
| 2,900 | Hitachi Metals Ltd. (Materials) | 40,462 | ||||||
| 16,800 | Hokuriku Electric Power Co. (Utilities) | 151,658 | ||||||
| 34,500 | Honda Motor Co. Ltd. (Automobiles & Components) | 945,234 | ||||||
| 12,900 | Hulic Co. Ltd. (Real Estate) | 132,106 | ||||||
|
| |||||||
| Common Stocks – (continued) | ||||||||
| Japan – (continued) | ||||||||
| 5,400 | Idemitsu Kosan Co. Ltd. (Energy) | 153,623 | ||||||
| 23,000 | IHI Corp. (Capital Goods)* | 78,600 | ||||||
| 47,000 | Inpex Corp. (Energy) | 453,807 | ||||||
| 11,800 | Isuzu Motors Ltd. (Automobiles & Components) | 146,525 | ||||||
| 126,000 | ITOCHU Corp. (Capital Goods) | 1,876,005 | ||||||
| 12,700 | Japan Airlines Co. Ltd. (Transportation) | 393,391 | ||||||
| 34,300 | Japan Exchange Group, Inc. (Diversified Financials) | 623,671 | ||||||
| 44,600 | Japan Post Holdings Co. Ltd. (Insurance) | 554,796 | ||||||
| 41,500 | Japan Tobacco, Inc. (Food, Beverage & Tobacco) | 1,458,646 | ||||||
| 11,800 | JFE Holdings, Inc. (Materials) | 205,457 | ||||||
| 6,400 | JSR Corp. (Materials) | 110,792 | ||||||
| 128,600 | JXTG Holdings, Inc. (Energy) | 562,691 | ||||||
| 50,000 | Kaneka Corp. (Materials) | 382,672 | ||||||
| 19,300 | Kao Corp. (Household & Personal Products) | 1,147,546 | ||||||
| 91,000 | Kawasaki Heavy Industries Ltd. (Capital Goods) | 270,873 | ||||||
| 29,600 | KDDI Corp. (Telecommunication Services) | 782,850 | ||||||
| 8,000 | Kikkoman Corp. (Food, Beverage & Tobacco) | 255,906 | ||||||
| 80,000 | Kintetsu Group Holdings Co. Ltd. (Transportation) | 308,646 | ||||||
| 45,500 | Kirin Holdings Co. Ltd. (Food, Beverage & Tobacco) | 928,136 | ||||||
| 43,600 | Komatsu Ltd. (Capital Goods) | 1,119,101 | ||||||
| 6,000 | Kose Corp. (Household & Personal Products) | 658,024 | ||||||
| 8,000 | Kubota Corp. (Capital Goods) | 135,222 | ||||||
| 7,300 | Kyushu Railway Co. (Transportation) | 236,769 | ||||||
| 5,100 | Lawson, Inc. (Food & Staples Retailing) | 356,914 | ||||||
| 36,600 | LIXIL Group Corp. (Capital Goods) | 917,383 | ||||||
| 3,900 | M3, Inc. (Health Care Equipment & Services) | 107,587 | ||||||
| 6,000 | Makita Corp. (Capital Goods) | 222,204 | ||||||
| 179,100 | Marubeni Corp. (Capital Goods) | 1,160,327 | ||||||
| 16,100 | Marui Group Co. Ltd. (Retailing) | 237,891 | ||||||
| 800 | Maruichi Steel Tube Ltd. (Materials) | 23,275 | ||||||
| 2,800 | MEIJI Holdings Co. Ltd. (Food, Beverage & Tobacco) | 227,049 | ||||||
| 20,900 | Mitsubishi Corp. (Capital Goods) | 439,339 | ||||||
| 11,500 | Mitsubishi Electric Corp. (Capital Goods) | 166,320 | ||||||
| 22,000 | Mitsubishi Estate Co. Ltd. (Real Estate) | 411,242 | ||||||
| 4,000 | Mitsubishi Heavy Industries Ltd. (Capital Goods) | 16,469 | ||||||
| 2,700 | Mitsubishi Materials Corp. (Materials) | 81,935 | ||||||
| 23,900 | Mitsubishi Motors Corp. (Automobiles & Components) | 158,054 | ||||||
| 243,200 | Mitsubishi UFJ Financial Group, Inc. (Banks) | 1,640,396 | ||||||
| 123,900 | Mitsui & Co. Ltd. (Capital Goods) | 1,773,732 | ||||||
|
| |||||||
| 34 | The accompanying notes are an integral part of these financial statements. |
GOLDMAN SACHS INTERNATIONAL EQUITY DIVIDEND AND PREMIUM FUND
| Shares | Description | Value | ||||||
| Common Stocks – (continued) | ||||||||
| Japan – (continued) | ||||||||
| 13,000 | Mitsui Fudosan Co. Ltd. (Real Estate) | $ | 311,461 | |||||
| 3,500 | Mixi, Inc. (Software & Services) | 194,772 | ||||||
| 794,100 | Mizuho Financial Group, Inc. (Banks) | 1,455,961 | ||||||
| 13,700 | MS&AD Insurance Group Holdings, Inc. (Insurance) | 462,083 | ||||||
| 9,000 | Murata Manufacturing Co. Ltd. (Technology Hardware & Equipment) | 1,373,994 | ||||||
| 39,000 | NEC Corp. (Technology Hardware & Equipment) | 103,678 | ||||||
| 10,200 | NGK Spark Plug Co. Ltd. (Automobiles & Components) | 218,489 | ||||||
| 6,900 | Nidec Corp. (Capital Goods) | 708,906 | ||||||
| 4,000 | Nintendo Co. Ltd. (Software & Services) | 1,339,167 | ||||||
| 83,000 | Nippon Express Co. Ltd. (Transportation) | 520,839 | ||||||
| 2,400 | Nippon Paint Holdings Co. Ltd. (Materials) | 91,307 | ||||||
| 114 | Nippon Prologis REIT, Inc. (REIT) | 240,547 | ||||||
| 141,000 | Nippon Yusen KK (Transportation)* | 263,598 | ||||||
| 55,900 | Nissan Motor Co. Ltd. (Automobiles & Components) | 558,158 | ||||||
| 11,600 | Nisshin Seifun Group, Inc. (Food, Beverage & Tobacco) | 190,699 | ||||||
| 7,100 | Nitto Denko Corp. (Materials) | 586,327 | ||||||
| 9,600 | Nomura Holdings, Inc. (Diversified Financials) | 57,892 | ||||||
| 3,500 | Nomura Real Estate Holdings, Inc. (Real Estate) | 68,879 | ||||||
| 9,900 | Nomura Research Institute Ltd. (Software & Services) | 391,114 | ||||||
| 32,300 | NSK Ltd. (Capital Goods) | 406,456 | ||||||
| 62,300 | NTT DOCOMO, Inc. (Telecommunication Services) | 1,473,438 | ||||||
| 4,200 | Obic Co. Ltd. (Software & Services) | 258,619 | ||||||
| 28,400 | Odakyu Electric Railway Co. Ltd. (Transportation) | 573,986 | ||||||
| 3,400 | Ono Pharmaceutical Co. Ltd. (Pharmaceuticals, Biotechnology & Life Sciences) | 74,159 | ||||||
| 19,700 | ORIX Corp. (Diversified Financials) | 306,529 | ||||||
| 2,700 | Otsuka Corp. (Software & Services) | 167,951 | ||||||
| 3,400 | Otsuka Holdings Co. Ltd. (Pharmaceuticals, Biotechnology & Life Sciences) | 145,164 | ||||||
| 55,400 | Panasonic Corp. (Consumer Durables & Apparel) | 754,839 | ||||||
| 10,500 | Park24 Co. Ltd. (Commercial & Professional Services) | 267,187 | ||||||
| 10,500 | Rakuten, Inc. (Retailing) | 123,910 | ||||||
| 15,900 | Recruit Holdings Co. Ltd. (Commercial & Professional Services) | 273,637 | ||||||
| 35,300 | Resona Holdings, Inc. (Banks) | 194,991 | ||||||
| 44,100 | Ricoh Co. Ltd. (Technology Hardware & Equipment) | 390,665 | ||||||
| 1,000 | Ryohin Keikaku Co. Ltd. (Retailing) | 250,281 | ||||||
|
| |||||||
| Common Stocks – (continued) | ||||||||
| Japan – (continued) | ||||||||
| 24,500 | Sankyo Co. Ltd. (Consumer Durables & Apparel) | 832,273 | ||||||
| 22,600 | SBI Holdings, Inc. (Diversified Financials) | 307,329 | ||||||
| 13,200 | Sega Sammy Holdings, Inc. (Consumer Durables & Apparel) | 177,965 | ||||||
| 33,700 | Seiko Epson Corp. (Technology Hardware & Equipment) | 751,928 | ||||||
| 87,700 | Sekisui House Ltd. (Consumer Durables & Apparel) | 1,549,975 | ||||||
| 101,100 | Seven Bank Ltd. (Banks) | 362,490 | ||||||
| 33,000 | Sharp Corp. (Consumer Durables & Apparel)* | 122,322 | ||||||
| 7,000 | Shimadzu Corp. (Technology Hardware & Equipment) | 133,386 | ||||||
| 9,400 | Shin-Etsu Chemical Co. Ltd. (Materials) | 855,521 | ||||||
| 8,400 | Shionogi & Co. Ltd. (Pharmaceuticals, Biotechnology & Life Sciences) | 468,366 | ||||||
| 39,000 | Showa Shell Sekiyu KK (Energy) | 362,246 | ||||||
| 13,300 | SoftBank Group Corp. (Telecommunication Services) | 1,081,159 | ||||||
| 3,800 | Sompo Holdings, Inc. (Insurance) | 147,496 | ||||||
| 19,500 | Sony Corp. (Consumer Durables & Apparel) | 743,803 | ||||||
| 3,900 | Start Today Co. Ltd. (Retailing) | 96,114 | ||||||
| 40,800 | Subaru Corp. (Automobiles & Components) | 1,383,449 | ||||||
| 39,000 | Sumitomo Chemical Co. Ltd. (Materials) | 225,412 | ||||||
| 129,600 | Sumitomo Corp. (Capital Goods) | 1,690,007 | ||||||
| 11,000 | Sumitomo Metal Mining Co. Ltd. (Materials) | 147,027 | ||||||
| 60,700 | Sumitomo Mitsui Financial Group, Inc. (Banks) | 2,369,999 | ||||||
| 28,100 | Sumitomo Mitsui Trust Holdings, Inc. (Banks) | 1,009,332 | ||||||
| 5,000 | Sumitomo Realty & Development Co. Ltd. (Real Estate) | 154,841 | ||||||
| 9,700 | Sysmex Corp. (Health Care Equipment & Services) | 580,581 | ||||||
| 66,300 | Takeda Pharmaceutical Co. Ltd. (Pharmaceuticals, Biotechnology & Life Sciences) | 3,365,983 | ||||||
| 8,200 | Terumo Corp. (Health Care Equipment & Services) | 323,564 | ||||||
| 55,300 | Tohoku Electric Power Co., Inc. (Utilities) | 766,409 | ||||||
| 20,200 | Tokio Marine Holdings, Inc. (Insurance) | 840,588 | ||||||
| 8,800 | Tokyo Electron Ltd. (Semiconductors & Semiconductor Equipment) | 1,189,698 | ||||||
| 73,000 | Tokyo Gas Co. Ltd. (Utilities) | 380,235 | ||||||
| 57,700 | Tokyu Fudosan Holdings Corp. (Real Estate) | 342,190 | ||||||
| 4,600 | TOTO Ltd. (Capital Goods) | 176,248 | ||||||
| 3,800 | Toyoda Gosei Co. Ltd. (Automobiles & Components) | 91,053 | ||||||
|
| |||||||
| The accompanying notes are an integral part of these financial statements. | 35 |
GOLDMAN SACHS INTERNATIONAL EQUITY DIVIDEND AND PREMIUM FUND
Schedule of Investments (continued)
June 30, 2017 (Unaudited)
| Shares | Description | Value | ||||||
| Common Stocks – (continued) | ||||||||
| Japan – (continued) | ||||||||
| 81,220 | Toyota Motor Corp. (Automobiles & Components) | $ | 4,269,208 | |||||
| 18,400 | Trend Micro, Inc. (Software & Services) | 950,968 | ||||||
| 61,200 | USS Co. Ltd. (Retailing) | 1,219,783 | ||||||
| 3,300 | Yamaha Corp. (Consumer Durables & Apparel) | 114,243 | ||||||
| 22,600 | Yamaha Motor Co. Ltd. (Automobiles & Components) | 586,456 | ||||||
| 13,300 | Yamato Holdings Co. Ltd. (Transportation) | 270,197 | ||||||
|
| |||||||
| 87,424,507 | ||||||||
|
| |||||||
| Luxembourg – 0.8% | ||||||||
| 8,497 | RTL Group SA (Media)(a) | 641,940 | ||||||
| 97,540 | SES SA FDR (Media) | 2,285,061 | ||||||
| 21,970 | Tenaris SA (Energy) | 343,034 | ||||||
|
| |||||||
| 3,270,035 | ||||||||
|
| |||||||
| Macau – 0.1% | ||||||||
| 88,000 | MGM China Holdings Ltd. (Consumer Services) | 195,696 | ||||||
| 141,200 | Wynn Macau Ltd. (Consumer Services) | 329,711 | ||||||
|
| |||||||
| 525,407 | ||||||||
|
| |||||||
| Mexico – 0.0% | ||||||||
| 5,858 | Fresnillo plc (Materials) | 113,556 | ||||||
|
| |||||||
| Netherlands – 3.6% | ||||||||
| 134,734 | Aegon NV (Insurance) | 689,557 | ||||||
| 1,970 | ASML Holding NV (Semiconductors & Semiconductor Equipment) | 256,795 | ||||||
| 12,678 | Boskalis Westminster (Capital Goods)(a) | 411,730 | ||||||
| 126,193 | ING Groep NV (Banks) | 2,178,441 | ||||||
| 13,008 | Koninklijke DSM NV (Materials) | 946,105 | ||||||
| 26,936 | Koninklijke Philips NV (Capital Goods) | 958,886 | ||||||
| 51,233 | NN Group NV (Insurance) | 1,817,903 | ||||||
| 1,920 | NXP Semiconductors NV (Semiconductors & Semiconductor Equipment)* | 210,144 | ||||||
| 3,902 | Randstad Holding NV (Commercial & Professional Services) | 227,491 | ||||||
| 140,271 | Royal Dutch Shell plc Class A (Energy)(a) | 3,728,951 | ||||||
| 91,973 | Royal Dutch Shell plc Class B (Energy)(a) | 2,469,145 | ||||||
|
| |||||||
| 13,895,148 | ||||||||
|
| |||||||
| New Zealand – 1.0% | ||||||||
| 76,420 | Contact Energy Ltd. (Utilities) | 291,758 | ||||||
| 259,655 | Fletcher Building Ltd. (Materials) | 1,520,515 | ||||||
| 249,625 | Mercury NZ Ltd. (Utilities) | 607,312 | ||||||
| 317,017 | Meridian Energy Ltd. (Utilities) | 675,962 | ||||||
| 231,659 | Spark New Zealand Ltd. (Telecommunication Services) | 641,891 | ||||||
|
| |||||||
| 3,737,438 | ||||||||
|
| |||||||
| Common Stocks – (continued) | ||||||||
| Norway – 0.8% | ||||||||
| 29,116 | Gjensidige Forsikring ASA (Insurance) | 497,007 | ||||||
| 105,945 | Marine Harvest ASA (Food, Beverage & Tobacco)* | 1,812,635 | ||||||
| 57,276 | Orkla ASA (Food, Beverage & Tobacco) | 582,154 | ||||||
| 11,689 | Statoil ASA (Energy) | 193,829 | ||||||
| 3,666 | Yara International ASA (Materials) | 137,850 | ||||||
|
| |||||||
| 3,223,475 | ||||||||
|
| |||||||
| Portugal – 0.6% | ||||||||
| 305,538 | EDP - Energias de Portugal SA (Utilities) | 999,483 | ||||||
| 43,737 | Galp Energia SGPS SA (Energy) | 662,780 | ||||||
| 27,474 | Jeronimo Martins SGPS SA (Food & Staples Retailing) | 536,396 | ||||||
|
| |||||||
| 2,198,659 | ||||||||
|
| |||||||
| Singapore – 1.3% | ||||||||
| 436,100 | Ascendas REIT (REIT) | 826,302 | ||||||
| 486,200 | CapitaLand Commercial Trust (REIT) | 585,974 | ||||||
| 568,100 | CapitaLand Mall Trust (REIT) | 814,730 | ||||||
| 48,200 | ComfortDelGro Corp. Ltd. (Transportation) | 80,508 | ||||||
| 743,600 | Global Logistic Properties Ltd. (Real Estate) | 1,544,802 | ||||||
| 202,000 | Singapore Technologies Engineering Ltd. (Capital Goods) | 539,654 | ||||||
| 456,500 | Suntec REIT (REIT) | 619,541 | ||||||
|
| |||||||
| 5,011,511 | ||||||||
|
| |||||||
| Spain – 3.6% | ||||||||
| 159,767 | Abertis Infraestructuras SA (Transportation)(a) | 2,961,518 | ||||||
| 3,306 | ACS Actividades de Construccion y Servicios SA (Capital Goods)(a) | 127,823 | ||||||
| 6,586 | Amadeus IT Group SA (Software & Services) | 393,683 | ||||||
| 209,830 | Banco Bilbao Vizcaya Argentaria SA (Banks) | 1,747,873 | ||||||
| 60,229 | Banco Santander SA (Banks) | 399,913 | ||||||
| 103,039 | CaixaBank SA (Banks) | 492,565 | ||||||
| 90,136 | Distribuidora Internacional de Alimentacion SA (Food & Staples Retailing) | 562,483 | ||||||
| 19,625 | Enagas SA (Energy) | 550,762 | ||||||
| 74,270 | Endesa SA (Utilities) | 1,713,304 | ||||||
| 61,426 | Ferrovial SA (Capital Goods) | 1,364,467 | ||||||
| 7,157 | Iberdrola SA (Utilities) | 56,715 | ||||||
| 30,372 | Mapfre SA (Insurance) | 106,309 | ||||||
| 345,875 | Telefonica SA (Telecommunication Services)(a) | 3,580,366 | ||||||
| 19,419 | Zardoya Otis SA (Capital Goods) | 201,126 | ||||||
|
| |||||||
| 14,258,907 | ||||||||
|
| |||||||
| Sweden – 3.9% | ||||||||
| 6,099 | Atlas Copco AB Class B (Capital Goods) | 210,810 | ||||||
|
| |||||||
| 36 | The accompanying notes are an integral part of these financial statements. |
GOLDMAN SACHS INTERNATIONAL EQUITY DIVIDEND AND PREMIUM FUND
| Shares | Description | Value | ||||||
| Common Stocks – (continued) | ||||||||
| Sweden – (continued) | ||||||||
| 44,003 | Hennes & Mauritz AB Class B (Retailing) | $ | 1,097,084 | |||||
| 12,347 | Lundin Petroleum AB (Energy)* | 237,976 | ||||||
| 350,406 | Nordea Bank AB (Banks) | 4,462,922 | ||||||
| 13,117 | Sandvik AB (Capital Goods) | 206,517 | ||||||
| 219,763 | Skandinaviska Enskilda Banken AB Class A (Banks) | 2,660,591 | ||||||
| 21,194 | Skanska AB Class B (Capital Goods) | 503,272 | ||||||
| 85,838 | Swedbank AB Class A (Banks) | 2,094,950 | ||||||
| 147,272 | Tele2 AB Class B (Telecommunication Services) | 1,543,363 | ||||||
| 69,362 | Telefonaktiebolaget LM Ericsson Class B (Technology Hardware & Equipment) | 498,722 | ||||||
| 334,966 | Telia Co. AB (Telecommunication Services) | 1,543,721 | ||||||
| 15,913 | Volvo AB Class B (Capital Goods) | 271,375 | ||||||
|
| |||||||
| 15,331,303 | ||||||||
|
| |||||||
| Switzerland – 9.0% | ||||||||
| 50,153 | ABB Ltd. (Registered) (Capital Goods) | 1,244,853 | ||||||
| 5,336 | Baloise Holding AG (Registered) (Insurance) | 826,545 | ||||||
| 4,167 | Cie Financiere Richemont SA (Registered) (Consumer Durables & Apparel) | 344,815 | ||||||
| 146,817 | Credit Suisse Group AG (Registered) (Diversified Financials)* | 2,136,333 | ||||||
| 2,590 | EMS-Chemie Holding AG (Registered) (Materials) | 1,912,482 | ||||||
| 1,736 | Geberit AG (Registered) (Capital Goods) | 810,643 | ||||||
| 926 | Givaudan SA (Registered) (Materials) | 1,855,518 | ||||||
| 259,708 | Glencore plc (Materials)* | 973,185 | ||||||
| 10,884 | Kuehne + Nagel International AG (Registered) (Transportation) | 1,819,625 | ||||||
| 25,102 | LafargeHolcim Ltd. (Registered) (Materials)* | 1,442,689 | ||||||
| 72,389 | Nestle SA (Registered) (Food, Beverage & Tobacco) | 6,313,601 | ||||||
| 72,916 | Novartis AG (Registered) (Pharmaceuticals, Biotechnology & Life Sciences) | 6,090,426 | ||||||
| 1,473 | Partners Group Holding AG (Diversified Financials) | 914,601 | ||||||
| 20,695 | Roche Holding AG (Pharmaceuticals, Biotechnology & Life Sciences) | 5,287,881 | ||||||
| 397 | SGS SA (Registered) (Commercial & Professional Services) | 962,601 | ||||||
| 145,496 | STMicroelectronics NV (Semiconductors & Semiconductor Equipment)(a) | 2,092,164 | ||||||
| 17,457 | UBS Group AG (Registered) (Diversified Financials)* | 296,872 | ||||||
|
| |||||||
| 35,324,834 | ||||||||
|
| |||||||
| Common Stocks – (continued) | ||||||||
| United Kingdom – 16.3% | ||||||||
| 204,174 | Aberdeen Asset Management plc (Diversified Financials) | 803,854 | ||||||
| 27,116 | Anglo American plc (Materials)* | 362,262 | ||||||
| 78,181 | AstraZeneca plc ADR (Pharmaceuticals, Biotechnology & Life Sciences)(a) | 2,665,109 | ||||||
| 250,161 | BAE Systems plc (Capital Goods) | 2,065,149 | ||||||
| 319,649 | Barclays plc (Banks) | 845,399 | ||||||
| 39,792 | Berkeley Group Holdings plc (Consumer Durables & Apparel)(a) | 1,673,236 | ||||||
| 88,908 | BP plc ADR (Energy) | 3,080,662 | ||||||
| 52,689 | British American Tobacco plc (Food, Beverage & Tobacco) (a) | 3,590,383 | ||||||
| 24,262 | British Land Co. plc (The) (REIT) | 191,538 | ||||||
| 43,199 | Capita plc (Commercial & Professional Services) | 389,069 | ||||||
| 108,358 | Centrica plc (Utilities) | 282,517 | ||||||
| 52,728 | Cobham plc (Capital Goods) | 89,004 | ||||||
| 15,616 | Compass Group plc (Consumer Services) | 329,623 | ||||||
| 13,945 | Diageo plc (Food, Beverage & Tobacco) | 412,099 | ||||||
| 50,835 | easyJet plc (Transportation) | 900,547 | ||||||
| 130,365 | G4S plc (Commercial & Professional Services) | 554,432 | ||||||
| 160,047 | GlaxoSmithKline plc ADR (Pharmaceuticals, Biotechnology & Life Sciences)(a)(b) | 6,901,227 | ||||||
| 1,024,775 | HSBC Holdings plc (Banks) | 9,511,928 | ||||||
| 21,808 | Imperial Brands plc (Food, Beverage & Tobacco) (a) | 979,990 | ||||||
| 118,879 | J Sainsbury plc (Food & Staples Retailing) | 389,931 | ||||||
| 24,945 | Land Securities Group plc (REIT) | 329,340 | ||||||
| 852,286 | Legal & General Group plc (Insurance) | 2,867,944 | ||||||
| 170,573 | Marks & Spencer Group plc (Retailing) | 740,315 | ||||||
| 1,017 | Next plc (Retailing)(a) | 51,078 | ||||||
| 132,053 | Pearson plc (Media) | 1,188,995 | ||||||
| 41,176 | Persimmon plc (Consumer Durables & Apparel) | 1,202,607 | ||||||
| 28,433 | Provident Financial plc (Diversified Financials)(a) | 901,799 | ||||||
| 1,916 | Reckitt Benckiser Group plc (Household & Personal Products)(a) | 194,231 | ||||||
| 11,241 | Rio Tinto Ltd. (Materials) | 546,297 | ||||||
| 12,184 | Rio Tinto plc (Materials) | 516,015 | ||||||
| 22,663 | Rio Tinto plc ADR (Materials)(a)(b)(d) | 958,871 | ||||||
| 27,421 | Royal Mail plc (Transportation) | 150,423 | ||||||
| 148,325 | SSE plc (Utilities)(a) | 2,806,487 | ||||||
| 101,081 | Standard Life plc (Insurance) | 525,626 | ||||||
| 125,880 | Tate & Lyle plc (Food, Beverage & Tobacco) | 1,084,881 | ||||||
| 84,914 | Unilever NV CVA (Household & Personal Products)(a) | 4,687,406 | ||||||
|
| |||||||
| The accompanying notes are an integral part of these financial statements. | 37 |
GOLDMAN SACHS INTERNATIONAL EQUITY DIVIDEND AND PREMIUM FUND
Schedule of Investments (continued)
June 30, 2017 (Unaudited)
| Shares | Description | Value | ||||||
| Common Stocks – (continued) | ||||||||
| United Kingdom – (continued) | ||||||||
| 66,459 | Unilever plc ADR (Household & Personal Products)(a) | $ | 3,596,761 | |||||
| 178,943 | Vodafone Group plc ADR (Telecommunication Services)(a)(b) | 5,141,032 | ||||||
| 55,944 | William Hill plc (Consumer Services) | 185,221 | ||||||
| 61,537 | Wm Morrison Supermarkets plc (Food & Staples Retailing) | 193,278 | ||||||
|
| |||||||
| 63,886,566 | ||||||||
|
| |||||||
| | TOTAL COMMON STOCKS (Cost $393,345,676) | $ | 386,842,141 | |||||
|
| |||||||
| Units | Description | Expiration Month | Value | |||||||
| Right* – 0.0% | ||||||||||
| Spain – 0.0% | ||||||||||
| 3,306 | ACS Actividades de Construccion y Servicios SA (Capital Goods) | 07/17 | $ | 2,643 | ||||||
| (Cost $2,746) | ||||||||||
| ||||||||||
| Shares | Distribution Rate | Value | ||||||
| Investment Company(e)(f) – 0.0% | ||||||||
Goldman Sachs Financial Square Government Fund – Institutional Shares | ||||||||
| 197 | 0.845% | $ | 197 | |||||
| (Cost $197) | ||||||||
| ||||||||
| TOTAL INVESTMENTS BEFORE SECURITIES LENDING REINVESTMENT VEHICLE | ||||||||
| (Cost $393,348,619) | $ | 386,844,981 | ||||||
| ||||||||
| Shares | Distribution Rate | Value | ||||||
| Securities Lending Reinvestment Vehicle(e)(f) – 0.0% | ||||||||
| | Goldman Sachs Financial Square Government Fund – | | ||||||
| 136,800 | 0.845% | $ | 136,800 | |||||
| (Cost $136,800) | ||||||||
|
| |||||||
| TOTAL INVESTMENTS – 98.6% | ||||||||
| (Cost $393,485,419) | $ | 386,981,781 | ||||||
|
| |||||||
| | OTHER ASSETS IN EXCESS OF LIABILITIES – 1.4% | 5,642,477 | ||||||
|
| |||||||
| NET ASSETS – 100.0% | $ | 392,624,258 | ||||||
|
| |||||||
| The percentage shown for each investment category reflects the value of investments in that category as a percentage of net assets. | ||
* | Non-income producing security. | |
(a) | All or a portion of security is segregated as collateral for call options written. | |
(b) | All or a portion of security is segregated as collateral for initial margin requirements on futures transactions. | |
(c) | Preference Shares are a special type of equity investment that shares in the earnings of the company, has limited voting rights, and receives a greater dividend than applicable Common Shares. | |
(d) | All or a portion of security is on loan. | |
(e) | Represents an affiliated issuer. | |
(f) | Variable rate security. Interest rate or distribution rate disclosed is that which is in effect on June 30, 2017. | |
| ||
Investment Abbreviations: | ||
ADR | —American Depositary Receipt | |
CVA | —Dutch Certification | |
FDR | —Fiduciary Depositary Receipt | |
REIT | —Real Estate Investment Trust
| |
Currency Abbreviations: | ||
EUR | —Euro | |
GBP | —British Pound | |
JPY | —Japanese Yen | |
| ||
| ADDITIONAL INVESTMENT INFORMATION |
FUTURES CONTRACTS — At June 30, 2017, the Fund had the following futures contracts:
| Type | Number of Contracts Long (Short) | Expiration Date | Current Value | Unrealized Gain (Loss) | ||||||||||
EURO STOXX 50 Index | 44 | September 2017 | $ | 1,724,235 | $ | (67,802 | ) | |||||||
FTSE 100 Index | 9 | September 2017 | 848,969 | (25,037 | ) | |||||||||
Hang Seng Index | 1 | July 2017 | 163,850 | (957 | ) | |||||||||
MSCI Singapore Index | 2 | July 2017 | 52,072 | (274 | ) | |||||||||
SPI 200 Index | 3 | September 2017 | 325,637 | (5,538 | ) | |||||||||
TSE TOPIX Index | 5 | September 2017 | 716,381 | 4,667 | ||||||||||
| TOTAL | $ | (94,941 | ) | |||||||||||
| 38 | The accompanying notes are an integral part of these financial statements. |
GOLDMAN SACHS INTERNATIONAL EQUITY DIVIDEND AND PREMIUM FUND
| ADDITIONAL INVESTMENT INFORMATION (continued) |
WRITTEN OPTIONS CONTRACTS — At June 30, 2017, the Fund had the following written options:
| Call Options | Number of Contracts | Exercise | Expiration Month | Value | ||||||||||||||
EURO STOXX 50 Index | 2,109 | EUR | 3,550 | September 2017 | $ | (997,241 | ) | |||||||||||
FTSE 100 Index | 337 | GBP | 7,425 | September 2017 | (307,248 | ) | ||||||||||||
Nikkei-225 Stock Average | 234 | JPY | 20,000 | September 2017 | (1,019,426 | ) | ||||||||||||
| TOTAL (Premiums Received $3,721,564) | 2,680 | $ | (2,323,915 | ) | ||||||||||||||
For the six months ended June 30, 2017, the Fund had the following written options activity:
Number of Contracts | Premiums Received | |||||||
Contracts Outstanding December 31, 2016 | 2,355 | $ | 3,117,253 | |||||
Contracts written | 5,107 | 7,631,571 | ||||||
Contracts bought to close | (4,782 | ) | (7,027,260 | ) | ||||
Contracts Outstanding June 30, 2017 | 2,680 | $ | 3,721,564 | |||||
| The accompanying notes are an integral part of these financial statements. | 39 |
GOLDMAN SACHS U.S. TAX-MANAGED EQUITY FUND
Schedule of Investments
June 30, 2017 (Unaudited)
| Shares | Description | Value | ||||||
| Common Stocks – 98.3% | ||||||||
| Automobiles & Components – 1.0% | ||||||||
| 101,391 | BorgWarner, Inc. | $ | 4,294,923 | |||||
| 49,403 | Dana, Inc. | 1,103,169 | ||||||
| 21,887 | Gentex Corp. | 415,196 | ||||||
| 47,383 | Lear Corp. | 6,732,177 | ||||||
|
| |||||||
| 12,545,465 | ||||||||
|
| |||||||
| Banks – 5.2% | ||||||||
| 14,958 | Berkshire Hills Bancorp, Inc. | 525,774 | ||||||
| 38,634 | CenterState Banks, Inc. | 960,441 | ||||||
| 19,853 | Central Pacific Financial Corp. | 624,774 | ||||||
| 468,112 | Citizens Financial Group, Inc. | 16,702,236 | ||||||
| 11,376 | FCB Financial Holdings, Inc. Class A* | 543,204 | ||||||
| 160,029 | Fifth Third Bancorp | 4,154,353 | ||||||
| 3,267 | First Citizens BancShares, Inc. Class A | 1,217,611 | ||||||
| 8,596 | Hilltop Holdings, Inc. | 225,301 | ||||||
| 172,510 | JPMorgan Chase & Co. | 15,767,414 | ||||||
| 208,520 | KeyCorp | 3,907,665 | ||||||
| 64,124 | PNC Financial Services Group, Inc. (The) | 8,007,164 | ||||||
| 123,441 | Radian Group, Inc. | 2,018,260 | ||||||
| 5,237 | SVB Financial Group* | 920,612 | ||||||
| 18,859 | Synovus Financial Corp. | 834,322 | ||||||
| 75,821 | TCF Financial Corp. | 1,208,587 | ||||||
| 34,664 | United Community Banks, Inc. | 963,659 | ||||||
| 5,562 | US Bancorp | 288,779 | ||||||
| 116,732 | Wells Fargo & Co. | 6,468,120 | ||||||
| 22,699 | Western Alliance Bancorp* | 1,116,791 | ||||||
|
| |||||||
| 66,455,067 | ||||||||
|
| |||||||
| Capital Goods – 6.5% | ||||||||
| 27,205 | AerCap Holdings NV* | 1,263,128 | ||||||
| 5,386 | Allegion plc | 436,912 | ||||||
| 24,698 | Allison Transmission Holdings, Inc. | 926,422 | ||||||
| 9,879 | Applied Industrial Technologies, Inc. | 583,355 | ||||||
| 55,021 | Boeing Co. (The) | 10,880,403 | ||||||
| 11,432 | Eaton Corp. plc | 889,753 | ||||||
| 4,919 | Esterline Technologies Corp.* | 466,321 | ||||||
| 15,347 | Fortive Corp. | 972,232 | ||||||
| 425,250 | General Electric Co. | 11,486,002 | ||||||
| 6,702 | Granite Construction, Inc. | 323,304 | ||||||
| 41,574 | HD Supply Holdings, Inc.* | 1,273,412 | ||||||
| 9,481 | Honeywell International, Inc. | 1,263,722 | ||||||
| 10,454 | Hubbell, Inc. | 1,183,079 | ||||||
| 114,094 | Illinois Tool Works, Inc. | 16,343,966 | ||||||
| 26,915 | Lockheed Martin Corp. | 7,471,873 | ||||||
| 48,420 | Masco Corp. | 1,850,128 | ||||||
| 31,608 | Orbital ATK, Inc. | 3,108,963 | ||||||
| 5,480 | Owens Corning | 366,722 | ||||||
| 64,168 | Raytheon Co. | 10,361,849 | ||||||
| 37,020 | Spirit AeroSystems Holdings, Inc. Class A | 2,144,939 | ||||||
| 11,074 | Trex Co., Inc.* | 749,267 | ||||||
| 8,619 | United Rentals, Inc.* | 971,447 | ||||||
| 8,601 | Valmont Industries, Inc. | 1,286,710 | ||||||
| 21,794 | WABCO Holdings, Inc.* | 2,778,953 | ||||||
|
| |||||||
| Common Stocks – (continued) | ||||||||
| Capital Goods – (continued) | ||||||||
| 23,184 | Watsco, Inc. | 3,574,973 | ||||||
|
| |||||||
| 82,957,835 | ||||||||
|
| |||||||
| Commercial & Professional Services – 1.1% | ||||||||
| 13,181 | ABM Industries, Inc.(a) | 547,275 | ||||||
| 54,765 | Brady Corp. Class A | 1,856,534 | ||||||
| 29,156 | Cintas Corp. | 3,674,822 | ||||||
| 66,486 | ManpowerGroup, Inc. | 7,423,162 | ||||||
| 8,453 | MSA Safety, Inc. | 686,130 | ||||||
| 35,790 | Steelcase, Inc. Class A | 501,060 | ||||||
|
| |||||||
| 14,688,983 | ||||||||
|
| |||||||
| Consumer Durables & Apparel – 2.7% | ||||||||
| 19,685 | Columbia Sportswear Co. | 1,142,911 | ||||||
| 51,425 | Fossil Group, Inc.* | 532,249 | ||||||
| 33,386 | Hasbro, Inc. | 3,722,873 | ||||||
| 4,530 | Mohawk Industries, Inc.* | 1,094,856 | ||||||
| 163,278 | NIKE, Inc. Class B | 9,633,402 | ||||||
| 1,156 | NVR, Inc.* | 2,786,665 | ||||||
| 24,693 | PVH Corp. | 2,827,348 | ||||||
| 448,586 | Taylor Morrison Home Corp. Class A* | 10,770,550 | ||||||
| 8,306 | Whirlpool Corp. | 1,591,596 | ||||||
|
| |||||||
| 34,102,450 | ||||||||
|
| |||||||
| Consumer Services – 3.3% | ||||||||
| 38,745 | Boyd Gaming Corp. | 961,263 | ||||||
| 51,446 | Carnival Corp. | 3,373,314 | ||||||
| 46,924 | Domino’s Pizza, Inc. | 9,925,834 | ||||||
| 89,426 | Las Vegas Sands Corp. | 5,713,427 | ||||||
| 6,048 | Marriott International, Inc. Class A | 606,675 | ||||||
| 62,281 | Papa John’s International, Inc. | 4,469,285 | ||||||
| 34,874 | Starbucks Corp. | 2,033,503 | ||||||
| 21,234 | Vail Resorts, Inc. | 4,306,892 | ||||||
| 5,310 | Wyndham Worldwide Corp. | 533,177 | ||||||
| 87,531 | Yum Brands, Inc. | 6,456,287 | ||||||
| 87,531 | Yum China Holdings, Inc.* | 3,451,347 | ||||||
|
| |||||||
| 41,831,004 | ||||||||
|
| |||||||
| Diversified Financials – 3.8% | ||||||||
| 203,559 | AGNC Investment Corp. (REIT) | 4,333,771 | ||||||
| 32,395 | Ameriprise Financial, Inc. | 4,123,560 | ||||||
| 96,718 | Bank of New York Mellon Corp. (The) | 4,934,553 | ||||||
| 38,603 | Berkshire Hathaway, Inc. Class B* | 6,538,190 | ||||||
| 4,505 | Capital One Financial Corp. | 372,203 | ||||||
| 137,041 | E*TRADE Financial Corp.* | 5,211,669 | ||||||
| 13,256 | Morgan Stanley | 590,687 | ||||||
| 38,270 | MSCI, Inc. | 3,941,427 | ||||||
| 88,445 | Nasdaq, Inc. | 6,322,933 | ||||||
| 171,359 | Synchrony Financial | 5,109,926 | ||||||
| 143,290 | TD Ameritrade Holding Corp. | 6,160,037 | ||||||
| 41,461 | Voya Financial, Inc. | 1,529,496 | ||||||
|
| |||||||
| 49,168,452 | ||||||||
|
| |||||||
| Energy – 4.2% | ||||||||
| 35,648 | Anadarko Petroleum Corp. | 1,616,280 | ||||||
|
| |||||||
| 40 | The accompanying notes are an integral part of these financial statements. |
GOLDMAN SACHS U.S. TAX-MANAGED EQUITY FUND
| Shares | Description | Value | ||||||
| Common Stocks – (continued) | ||||||||
| Energy – (continued) | ||||||||
| 149,794 | Baker Hughes, Inc. | $ | 8,165,271 | |||||
| 152,331 | Chesapeake Energy Corp.*(b) | 757,085 | ||||||
| 6,903 | Cimarex Energy Co. | 648,951 | ||||||
| 39,820 | Devon Energy Corp. | 1,273,045 | ||||||
| 61,715 | Energen Corp.* | 3,046,870 | ||||||
| 12,027 | EOG Resources, Inc. | 1,088,684 | ||||||
| 58,417 | Exxon Mobil Corp. | 4,716,004 | ||||||
| 78,991 | Kinder Morgan, Inc. | 1,513,468 | ||||||
| 32,063 | Marathon Oil Corp. | 379,947 | ||||||
| 198,855 | Marathon Petroleum Corp. | 10,406,082 | ||||||
| 186,820 | McDermott International, Inc.* | 1,339,499 | ||||||
| 39,371 | Newfield Exploration Co.* | 1,120,499 | ||||||
| 12,188 | Pioneer Natural Resources Co. | 1,944,961 | ||||||
| 103,194 | Valero Energy Corp. | 6,961,467 | ||||||
| 247,662 | Williams Cos., Inc. (The) | 7,499,205 | ||||||
| 24,190 | World Fuel Services Corp. | 930,106 | ||||||
|
| |||||||
| 53,407,424 | ||||||||
|
| |||||||
| Food & Staples Retailing – 1.8% | ||||||||
| 166,845 | CVS Health Corp. | 13,424,349 | ||||||
| 120,558 | Walgreens Boots Alliance, Inc. | 9,440,897 | ||||||
|
| |||||||
| 22,865,246 | ||||||||
|
| |||||||
| Food, Beverage & Tobacco – 4.4% | ||||||||
| 284,075 | Altria Group, Inc. | 21,155,065 | ||||||
| 67,825 | Archer-Daniels-Midland Co. | 2,806,598 | ||||||
| 237,923 | Conagra Brands, Inc. | 8,508,126 | ||||||
| 35,366 | Lamb Weston Holdings, Inc. | 1,557,519 | ||||||
| 13,685 | Lancaster Colony Corp. | 1,678,055 | ||||||
| 14,631 | Molson Coors Brewing Co. Class B | 1,263,241 | ||||||
| 16,207 | PepsiCo, Inc. | 1,871,746 | ||||||
| 95,122 | Pilgrim’s Pride Corp.* | 2,085,074 | ||||||
| 28,740 | Sanderson Farms, Inc. | 3,323,781 | ||||||
| 204,944 | Tyson Foods, Inc. Class A | 12,835,643 | ||||||
|
| |||||||
| 57,084,848 | ||||||||
|
| |||||||
| Health Care Equipment & Services – 8.8% | ||||||||
| 16,015 | Aetna, Inc. | 2,431,557 | ||||||
| 32,290 | Anthem, Inc. | 6,074,718 | ||||||
| 247,341 | Baxter International, Inc. | 14,974,024 | ||||||
| 12,250 | Becton Dickinson and Co. | 2,390,098 | ||||||
| 179,530 | Boston Scientific Corp.* | 4,976,572 | ||||||
| 6,376 | Cardinal Health, Inc. | 496,818 | ||||||
| 51,825 | Centene Corp.* | 4,139,781 | ||||||
| 66,201 | Cigna Corp. | 11,081,385 | ||||||
| 13,472 | Cooper Cos., Inc. (The) | 3,225,466 | ||||||
| 114,242 | Danaher Corp. | 9,640,882 | ||||||
| 40,526 | Hologic, Inc.* | 1,839,070 | ||||||
| 61,683 | Humana, Inc. | 14,842,164 | ||||||
| 55,146 | IDEXX Laboratories, Inc.* | 8,901,667 | ||||||
| 4,387 | McKesson Corp. | 721,837 | ||||||
| 81,279 | UnitedHealth Group, Inc. | 15,070,752 | ||||||
| 65,679 | WellCare Health Plans, Inc.* | 11,793,321 | ||||||
|
| |||||||
| 112,600,112 | ||||||||
|
| |||||||
| Common Stocks – (continued) | ||||||||
| Household & Personal Products – 1.1% | ||||||||
| 34,636 | Colgate-Palmolive Co. | 2,567,567 | ||||||
| 75,060 | Kimberly-Clark Corp. | 9,690,996 | ||||||
| 8,185 | Procter & Gamble Co. (The) | 713,323 | ||||||
| 9,724 | USANA Health Sciences, Inc.* | 623,308 | ||||||
|
| |||||||
| 13,595,194 | ||||||||
|
| |||||||
| Insurance – 4.5% | ||||||||
| 8,231 | Argo Group International Holdings Ltd. | 498,799 | ||||||
| 98,971 | Lincoln National Corp. | 6,688,460 | ||||||
| 196,811 | Marsh & McLennan Cos., Inc. | 15,343,386 | ||||||
| 47,125 | Principal Financial Group, Inc. | 3,019,299 | ||||||
| 64,085 | Prudential Financial, Inc. | 6,930,152 | ||||||
| 107,660 | Reinsurance Group of America, Inc. | 13,822,467 | ||||||
| 82,165 | Travelers Cos., Inc. (The) | 10,396,337 | ||||||
| 18,889 | Unum Group | 880,794 | ||||||
|
| |||||||
| 57,579,694 | ||||||||
|
| |||||||
| Materials – 3.4% | ||||||||
| 5,254 | Air Products & Chemicals, Inc. | 751,637 | ||||||
| 12,663 | Celanese Corp. Series A | 1,202,225 | ||||||
| 18,697 | Chemours Co. (The) | 708,990 | ||||||
| 8,075 | Crown Holdings, Inc.* | 481,755 | ||||||
| 22,311 | HB Fuller Co. | 1,140,315 | ||||||
| 22,879 | Huntsman Corp. | 591,193 | ||||||
| 14,786 | Innophos Holdings, Inc. | 648,218 | ||||||
| 185,595 | Louisiana-Pacific Corp.* | 4,474,695 | ||||||
| 66,105 | LyondellBasell Industries NV Class A | 5,578,601 | ||||||
| 17,318 | Minerals Technologies, Inc. | 1,267,678 | ||||||
| 97,498 | Nucor Corp. | 5,642,209 | ||||||
| 41,069 | Owens-Illinois, Inc.* | 982,371 | ||||||
| 16,462 | PPG Industries, Inc. | 1,810,162 | ||||||
| 8,350 | Reliance Steel & Aluminum Co. | 607,964 | ||||||
| 15,232 | Sealed Air Corp. | 681,784 | ||||||
| 15,506 | Sherwin-Williams Co. (The) | 5,441,986 | ||||||
| 315,262 | Steel Dynamics, Inc. | 11,289,532 | ||||||
|
| |||||||
| 43,301,315 | ||||||||
|
| |||||||
| Media – 1.6% | ||||||||
| 271,158 | Comcast Corp. Class A | 10,553,469 | ||||||
| 310,553 | Interpublic Group of Cos., Inc. (The) | 7,639,604 | ||||||
| 32,046 | Omnicom Group, Inc. | 2,656,614 | ||||||
| 14,896 | Regal Entertainment Group Class A(b) | 304,772 | ||||||
|
| |||||||
| 21,154,459 | ||||||||
|
| |||||||
| Pharmaceuticals, Biotechnology & Life Sciences – 8.2% | ||||||||
| 117,983 | AbbVie, Inc. | 8,554,947 | ||||||
| 28,864 | Alexion Pharmaceuticals, Inc.* | 3,511,883 | ||||||
| 15,723 | Allergan plc | 3,822,104 | ||||||
| 110,476 | Amgen, Inc. | 19,027,282 | ||||||
| 30,180 | Biogen, Inc.* | 8,189,645 | ||||||
| 9,877 | Bioverativ, Inc.* | 594,299 | ||||||
| 48,696 | Cambrex Corp.* | 2,909,586 | ||||||
| 115,837 | Celgene Corp.* | 15,043,751 | ||||||
| 29,265 | Exelixis, Inc.* | 720,797 | ||||||
|
| |||||||
| The accompanying notes are an integral part of these financial statements. | 41 |
GOLDMAN SACHS U.S. TAX-MANAGED EQUITY FUND
Schedule of Investments (continued)
June 30, 2017 (Unaudited)
| Shares | Description | Value | ||||||
| Common Stocks – (continued) | ||||||||
| Pharmaceuticals, Biotechnology & Life Sciences – (continued) | ||||||||
| 3,087 | Incyte Corp.* | $ | 388,684 | |||||
| 33,539 | Ironwood Pharmaceuticals, Inc.* | 633,216 | ||||||
| 101,303 | Johnson & Johnson | 13,401,374 | ||||||
| 116,725 | Merck & Co., Inc. | 7,480,905 | ||||||
| 1,326 | Mettler-Toledo International, Inc.* | 780,404 | ||||||
| 9,084 | MiMedx Group, Inc.*(b) | 135,988 | ||||||
| 279,257 | Pfizer, Inc. | 9,380,243 | ||||||
| 22,579 | Phibro Animal Health Corp. Class A | 836,552 | ||||||
| 20,694 | Repligen Corp.* | 857,559 | ||||||
| 3,494 | Thermo Fisher Scientific, Inc. | 609,598 | ||||||
| 33,107 | United Therapeutics Corp.* | 4,294,971 | ||||||
| 32,624 | Vertex Pharmaceuticals, Inc.* | 4,204,255 | ||||||
|
| |||||||
| 105,378,043 | ||||||||
|
| |||||||
| Real Estate – 4.0% | ||||||||
| 132,057 | American Homes 4 Rent Class A (REIT) | 2,980,526 | ||||||
| 118,678 | American Tower Corp. (REIT) | 15,703,473 | ||||||
| 15,622 | Apartment Investment & Management Co. Class A (REIT) | 671,277 | ||||||
| 47,783 | CBRE Group, Inc. Class A* | 1,739,301 | ||||||
| 18,849 | CoreSite Realty Corp. (REIT) | 1,951,437 | ||||||
| 19,282 | CyrusOne, Inc. (REIT) | 1,074,971 | ||||||
| 42,346 | DCT Industrial Trust, Inc. (REIT) | 2,262,970 | ||||||
| 7,822 | DuPont Fabros Technology, Inc. (REIT) | 478,393 | ||||||
| 39,468 | Equity LifeStyle Properties, Inc. (REIT) | 3,407,667 | ||||||
| 11,456 | First Industrial Realty Trust, Inc. (REIT) | 327,871 | ||||||
| 21,436 | First Potomac Realty Trust (REIT) | 238,154 | ||||||
| 81,728 | Forest City Realty Trust, Inc. Class A (REIT) | 1,975,366 | ||||||
| 18,168 | Hudson Pacific Properties, Inc. (REIT) | 621,164 | ||||||
| 12,458 | Lamar Advertising Co. Class A (REIT) | 916,535 | ||||||
| 66,161 | Mack-Cali Realty Corp. (REIT) | 1,795,610 | ||||||
| 33,012 | Mid-America Apartment Communities, Inc. (REIT) | 3,478,805 | ||||||
| 16,478 | Park Hotels & Resorts, Inc. (REIT) | 444,247 | ||||||
| 33,614 | Prologis, Inc. (REIT) | 1,971,125 | ||||||
| 10,025 | PS Business Parks, Inc. (REIT) | 1,327,210 | ||||||
| 21,404 | Public Storage (REIT) | 4,463,376 | ||||||
| 23,711 | Realogy Holdings Corp. | 769,422 | ||||||
| 19,064 | SBA Communications Corp. (REIT)* | 2,571,747 | ||||||
|
| |||||||
| 51,170,647 | ||||||||
|
| |||||||
| Retailing – 4.9% | ||||||||
| 13,975 | Aaron’s, Inc. | 543,628 | ||||||
| 18,949 | Amazon.com, Inc.* | 18,342,632 | ||||||
| 10,896 | AutoZone, Inc.* | 6,215,732 | ||||||
| 126,771 | Best Buy Co., Inc. | 7,267,781 | ||||||
| 9,461 | Burlington Stores, Inc.* | 870,317 | ||||||
| 7,896 | Expedia, Inc. | 1,176,109 | ||||||
| 141,850 | Lowe’s Cos., Inc. | 10,997,631 | ||||||
| 17,336 | Netflix, Inc.* | 2,590,172 | ||||||
|
| |||||||
| Common Stocks – (continued) | ||||||||
| Retailing – (continued) | ||||||||
| 37,334 | O’Reilly Automotive, Inc.* | 8,166,439 | ||||||
| 19,490 | Pool Corp. | 2,291,439 | ||||||
| 2,240 | Priceline Group, Inc. (The)* | 4,189,965 | ||||||
|
| |||||||
| 62,651,845 | ||||||||
|
| |||||||
| Semiconductors & Semiconductor Equipment – 4.3% | ||||||||
| 30,458 | Advanced Energy Industries, Inc.* | 1,970,328 | ||||||
| 418,887 | Applied Materials, Inc. | 17,304,222 | ||||||
| 6,898 | Diodes, Inc.* | 165,759 | ||||||
| 31,784 | Intel Corp. | 1,072,392 | ||||||
| 136,437 | KLA-Tencor Corp. | 12,485,350 | ||||||
| 42,708 | Lam Research Corp. | 6,040,192 | ||||||
| 86,810 | Maxim Integrated Products, Inc. | 3,897,769 | ||||||
| 6,989 | NXP Semiconductors NV* | 764,946 | ||||||
| 96,874 | ON Semiconductor Corp.* | 1,360,111 | ||||||
| 50,405 | QUALCOMM, Inc. | 2,783,364 | ||||||
| 100,492 | Teradyne, Inc. | 3,017,775 | ||||||
| 63,128 | Texas Instruments, Inc. | 4,856,437 | ||||||
|
| |||||||
| 55,718,645 | ||||||||
|
| |||||||
| Software & Services – 11.1% | ||||||||
| 55,994 | Adobe Systems, Inc.* | 7,919,791 | ||||||
| 15,113 | Alphabet, Inc. Class A* | 14,050,254 | ||||||
| 15,281 | Alphabet, Inc. Class C* | 13,886,303 | ||||||
| 31,238 | Amdocs Ltd. | 2,013,602 | ||||||
| 14,690 | Aspen Technology, Inc.* | 811,769 | ||||||
| 38,091 | Cadence Design Systems, Inc.* | 1,275,668 | ||||||
| 15,958 | CDK Global, Inc. | 990,354 | ||||||
| 96,260 | Citrix Systems, Inc.* | 7,660,371 | ||||||
| 10,304 | CoreLogic, Inc.* | 446,988 | ||||||
| 1,354 | CoStar Group, Inc.* | 356,914 | ||||||
| 49,384 | eBay, Inc.* | 1,724,489 | ||||||
| 50,031 | Electronic Arts, Inc.* | 5,289,277 | ||||||
| 66,896 | EVERTEC, Inc. | 1,157,301 | ||||||
| 110,483 | Facebook, Inc. Class A* | 16,680,723 | ||||||
| 6,626 | Intuit, Inc. | 879,999 | ||||||
| 19,359 | Leidos Holdings, Inc. | 1,000,667 | ||||||
| 16,541 | LogMeIn, Inc. | 1,728,535 | ||||||
| 421,098 | Microsoft Corp. | 29,026,285 | ||||||
| 9,824 | MicroStrategy, Inc. Class A* | 1,882,966 | ||||||
| 212,943 | Oracle Corp. | 10,676,962 | ||||||
| 22,899 | Synopsys, Inc.* | 1,670,024 | ||||||
| 89,564 | Take-Two Interactive Software, Inc.* | 6,572,206 | ||||||
| 36,907 | Teradata Corp.* | 1,088,388 | ||||||
| 501,461 | Travelport Worldwide Ltd. | 6,900,103 | ||||||
| 91,433 | Vantiv, Inc. Class A* | 5,791,366 | ||||||
| 12,293 | VeriSign, Inc.* | 1,142,757 | ||||||
|
| |||||||
| 142,624,062 | ||||||||
|
| |||||||
| Technology Hardware & Equipment – 5.8% | ||||||||
| 185,226 | Apple, Inc. | 26,676,249 | ||||||
| 13,009 | ARRIS International plc* | 364,512 | ||||||
| 9,482 | EchoStar Corp. Class A* | 575,557 | ||||||
| 94,685 | F5 Networks, Inc.* | 12,030,676 | ||||||
| 26,644 | Finisar Corp.* | 692,211 | ||||||
| 504,699 | Flex Ltd.* | 8,231,641 | ||||||
|
| |||||||
| 42 | The accompanying notes are an integral part of these financial statements. |
GOLDMAN SACHS U.S. TAX-MANAGED EQUITY FUND
| Shares | Description | Value | ||||||
| Common Stocks – (continued) | ||||||||
| Technology Hardware & Equipment – (continued) | ||||||||
| 249,464 | HP, Inc. | $ | 4,360,631 | |||||
| 302,323 | Jabil, Inc. | 8,824,808 | ||||||
| 18,593 | Methode Electronics, Inc. | 766,032 | ||||||
| 45,067 | NCR Corp.* | 1,840,536 | ||||||
| 72,064 | NetApp, Inc. | 2,886,163 | ||||||
| 40,289 | NETGEAR, Inc.* | 1,736,456 | ||||||
| 48,534 | Seagate Technology plc | 1,880,693 | ||||||
| 127,068 | TTM Technologies, Inc.* | 2,205,900 | ||||||
| 150,233 | Viavi Solutions, Inc.* | 1,581,954 | ||||||
|
| |||||||
| 74,654,019 | ||||||||
|
| |||||||
| Telecommunication Services – 0.2% | ||||||||
| 48,653 | AT&T, Inc. | 1,835,678 | ||||||
| 14,288 | Level 3 Communications, Inc.* | 847,278 | ||||||
|
| |||||||
| 2,682,956 | ||||||||
|
| |||||||
| Transportation – 4.6% | ||||||||
| 92,001 | Alaska Air Group, Inc. | 8,258,010 | ||||||
| 4,135 | Allegiant Travel Co. | 560,706 | ||||||
| 33,622 | American Airlines Group, Inc. | 1,691,859 | ||||||
| 10,206 | ArcBest Corp. | 210,243 | ||||||
| 31,353 | CSX Corp. | 1,710,620 | ||||||
| 241,135 | Delta Air Lines, Inc. | 12,958,595 | ||||||
| 28,727 | Hawaiian Holdings, Inc.* | 1,348,733 | ||||||
| 418,787 | JetBlue Airways Corp.* | 9,560,907 | ||||||
| 63,265 | Southwest Airlines Co. | 3,931,287 | ||||||
| 18,844 | Union Pacific Corp. | 2,052,300 | ||||||
| 197,719 | United Continental Holdings, Inc.* | 14,878,355 | ||||||
| 16,477 | United Parcel Service, Inc. Class B | 1,822,191 | ||||||
|
| |||||||
| 58,983,806 | ||||||||
|
| |||||||
| Utilities – 1.8% | ||||||||
| 492,047 | AES Corp.(a) | 5,466,642 | ||||||
| 9,873 | American Water Works Co., Inc. | 769,600 | ||||||
| 133,249 | CenterPoint Energy, Inc. | 3,648,358 | ||||||
| 113,422 | Edison International | 8,868,466 | ||||||
| 283,475 | NRG Energy, Inc. | 4,881,440 | ||||||
|
| |||||||
| 23,634,506 | ||||||||
|
| |||||||
| TOTAL COMMON STOCKS | ||||||||
| (Cost $852,538,053) | $ | 1,260,836,077 | ||||||
|
| |||||||
| Units | Description | Value | ||||||||||
| Right* – 0.0% | ||||||||||||
| Food & Staples Retailing – 0.0% | ||||||||||||
62,608 | Safeway, Inc., CVR | $ | 32,766 | |||||||||
| (Cost $0) | ||||||||||||
| ||||||||||||
| Shares | Distribution Rate | Value | ||||||
| Investment Company(c)(d) – 0.1% | ||||||||
Goldman Sachs Financial Square Government Fund – Institutional Shares |
| |||||||
1,409,490 | 0.845 | % | $ | 1,409,490 | ||||
| (Cost $1,409,490) | ||||||||
| ||||||||
| TOTAL INVESTMENTS BEFORE SECURITIES LENDING REINVESTMENT VEHICLE | ||||||||
| (Cost $853,947,543) | $ | 1,262,278,333 | ||||||
| ||||||||
| Securities Lending Reinvestment Vehicle(c)(d) – 0.1% | ||||||||
Goldman Sachs Financial Square Government Fund – Institutional Shares |
| |||||||
1,186,925 | 0.845 | % | $ | 1,186,925 | ||||
| (Cost $1,186,925) | ||||||||
| ||||||||
| TOTAL INVESTMENTS – 98.5% | ||||||||
| (Cost $855,134,468) | $ | 1,263,465,258 | ||||||
| ||||||||
| OTHER ASSETS IN EXCESS OF LIABILITIES – 1.5% | 19,085,257 | |||||||
| ||||||||
| NET ASSETS – 100.0% | $ | 1,282,550,515 | ||||||
| ||||||||
| The percentage shown for each investment category reflects the value of investments in that category as a percentage of net assets. | ||
* | Non-income producing security. | |
(a) | All or a portion of security is segregated as collateral for initial margin requirements on futures transactions. | |
(b) | All or a portion of security is on loan. | |
(c) | Represents an affiliated issuer. | |
(d) | Variable rate security. Interest rate or distribution rate disclosed is that which is in effect on June 30, 2017. | |
| ||
Investment Abbreviations: | ||
CVR—Contingent Value Rights | ||
REIT—Real Estate Investment Trust | ||
| ||
| The accompanying notes are an integral part of these financial statements. | 43 |
GOLDMAN SACHS U.S. TAX-MANAGED EQUITY FUND
Schedule of Investments (continued)
June 30, 2017 (Unaudited)
| ADDITIONAL INVESTMENT INFORMATION |
FUTURES CONTRACTS — At June 30, 2017, the Fund had the following futures contracts:
| Type | Number of Contracts Long (Short) | Expiration Date | Current Value | Unrealized Gain (Loss) | ||||||||||
Russell 2000 Mini Index | 9 | September 2017 | $ | 636,435 | $ | (1,298 | ) | |||||||
S&P 500 E-Mini Index | 51 | September 2017 | 6,173,295 | (43,706 | ) | |||||||||
| TOTAL | $ | (45,004 | ) | |||||||||||
| 44 | The accompanying notes are an integral part of these financial statements. |
GOLDMAN SACHS INTERNATIONAL TAX-MANAGED EQUITY FUND
Schedule of Investments
June 30, 2017 (Unaudited)
| Shares | Description | Value | ||||||
| Common Stocks – 96.6% | ||||||||
| Australia – 9.0% | ||||||||
| 102,786 | Adelaide Brighton Ltd. (Materials) | $ | 444,627 | |||||
| 199,165 | AGL Energy Ltd. (Utilities) | 3,902,935 | ||||||
| 266,243 | Aristocrat Leisure Ltd. (Consumer Services) | 4,615,842 | ||||||
| 73,373 | ASX Ltd. (Diversified Financials) | 3,023,043 | ||||||
| 905,376 | Aurizon Holdings Ltd. (Transportation) | 3,729,171 | ||||||
| 325,740 | BHP Billiton Ltd. (Materials) | 5,805,963 | ||||||
| 106,387 | BHP Billiton plc (Materials) | 1,629,924 | ||||||
| 366,478 | BlueScope Steel Ltd. (Materials) | 3,710,244 | ||||||
| 95,124 | Breville Group Ltd. (Consumer Durables & Apparel) | 763,960 | ||||||
| 518,713 | Coca-Cola Amatil Ltd. (Food, Beverage & Tobacco) | 3,680,870 | ||||||
| 11,563 | Cochlear Ltd. (Health Care Equipment & Services) | 1,381,054 | ||||||
| 124,538 | Computershare Ltd. (Software & Services) | 1,353,445 | ||||||
| 34,602 | CSR Ltd. (Materials) | 112,457 | ||||||
| 18,769 | Downer EDI Ltd. (Commercial & Professional Services) | 92,454 | ||||||
| 981,539 | Fortescue Metals Group Ltd. (Materials) | 3,929,194 | ||||||
| 76,354 | G8 Education Ltd. (Consumer Services) | 211,856 | ||||||
| 71,148 | GUD Holdings Ltd. (Consumer Durables & Apparel) | 705,852 | ||||||
| 9,188 | IOOF Holdings Ltd. (Diversified Financials) | 69,221 | ||||||
| 118,999 | MACA Ltd. (Capital Goods) | 150,914 | ||||||
| 33,938 | Macquarie Group Ltd. (Diversified Financials) | 2,307,915 | ||||||
| 79,312 | Nanosonics Ltd. (Health Care Equipment & Services)* | 154,873 | ||||||
| 35,563 | OZ Minerals Ltd. (Materials) | 202,439 | ||||||
| 857,901 | Qantas Airways Ltd. (Transportation) | 3,770,942 | ||||||
| 398,902 | Treasury Wine Estates Ltd. (Food, Beverage & Tobacco) | 4,033,675 | ||||||
| 19,401 | Webjet Ltd. (Retailing) | 184,152 | ||||||
| 13,517 | Wesfarmers Ltd. (Food & Staples Retailing) | 416,797 | ||||||
| 1,054,750 | Whitehaven Coal Ltd. (Energy)* | 2,326,150 | ||||||
| 30,649 | Woolworths Ltd. (Food & Staples Retailing) | 601,610 | ||||||
|
| |||||||
| 53,311,579 | ||||||||
|
| |||||||
| Belgium – 0.1% | ||||||||
| 17,311 | AGFA-Gevaert NV (Health Care Equipment & Services)* | 84,228 | ||||||
| 6,720 | Melexis NV (Semiconductors & Semiconductor Equipment) | 551,807 | ||||||
| 4,275 | Orange Belgium SA (Telecommunication Services) | 100,095 | ||||||
|
| |||||||
| 736,130 | ||||||||
|
| |||||||
| Shares | Description | Value | ||||||
| Common Stocks – (continued) | ||||||||
| China – 0.6% | ||||||||
| 1,663,000 | Fosun International Ltd. (Capital Goods) | 2,596,748 | ||||||
| 803,100 | Yangzijiang Shipbuilding Holdings Ltd. (Capital Goods) | 693,982 | ||||||
|
| |||||||
| 3,290,730 | ||||||||
|
| |||||||
| Denmark – 2.2% | ||||||||
| 123,684 | Danske Bank A/S (Banks) | 4,758,505 | ||||||
| 6,439 | Dfds A/S (Transportation) | 343,269 | ||||||
| 7,343 | FLSmidth & Co. A/S (Capital Goods) | 464,001 | ||||||
| 1,656 | ISS A/S (Commercial & Professional Services) | 65,050 | ||||||
| 164,257 | Novo Nordisk A/S Class B (Pharmaceuticals, Biotechnology & Life Sciences) | 7,057,677 | ||||||
|
| |||||||
| 12,688,502 | ||||||||
|
| |||||||
| Finland – 0.2% | ||||||||
| 9,523 | Cramo OYJ (Capital Goods) | 284,969 | ||||||
| 14,178 | Konecranes OYJ (Capital Goods) | 600,266 | ||||||
| 12,856 | Metso OYJ (Capital Goods) | 446,076 | ||||||
|
| |||||||
| 1,331,311 | ||||||||
|
| |||||||
| France – 9.2% | ||||||||
| 348,201 | Air France-KLM (Transportation)* | 4,970,434 | ||||||
| 35,545 | Arkema SA (Materials) | 3,795,913 | ||||||
| 92,918 | BNP Paribas SA (Banks) | 6,689,421 | ||||||
| 2,360 | Chargeurs SA (Consumer Durables & Apparel) | 64,853 | ||||||
| 87,223 | Cie de Saint-Gobain (Capital Goods) | 4,658,149 | ||||||
| 36,968 | Cie Generale des Etablissements Michelin (Automobiles & Components) | 4,920,222 | ||||||
| 82,747 | Eutelsat Communications SA (Media) | 2,111,282 | ||||||
| 4,408 | Fonciere Des Regions (REIT) | 408,881 | ||||||
| 22,325 | Gecina SA (REIT) | 3,504,095 | ||||||
| 1,488 | Kaufman & Broad SA (Consumer Durables & Apparel) | 66,317 | ||||||
| 10,145 | Orange SA (Telecommunication Services) | 161,457 | ||||||
| 65,460 | Sanofi (Pharmaceuticals, Biotechnology & Life Sciences) | 6,272,376 | ||||||
| 3,118 | SEB SA (Consumer Durables & Apparel) | 559,645 | ||||||
| 113,024 | Societe Generale SA (Banks) | 6,094,898 | ||||||
| 7,141 | Tarkett SA (Capital Goods) | 331,899 | ||||||
| 34,374 | Thales SA (Capital Goods) | 3,699,479 | ||||||
| 5,827 | Unibail-Rodamco SE (REIT) | 1,468,269 | ||||||
| 64,819 | Valeo SA (Automobiles & Components) | 4,360,953 | ||||||
|
| |||||||
| 54,138,543 | ||||||||
|
| |||||||
| Germany – 7.8% | ||||||||
| 40,851 | Aareal Bank AG (Banks) | 1,621,999 | ||||||
| 434 | Allianz SE (Registered) (Insurance) | 85,646 | ||||||
| 12,164 | alstria office REIT-AG (REIT) | 164,500 | ||||||
| 75,587 | BASF SE (Materials) | 7,015,161 | ||||||
|
| |||||||
| The accompanying notes are an integral part of these financial statements. | 45 |
GOLDMAN SACHS INTERNATIONAL TAX-MANAGED EQUITY FUND
Schedule of Investments (continued)
June 30, 2017 (Unaudited)
| Shares | Description | Value | ||||||
| Common Stocks – (continued) | ||||||||
| Germany – (continued) | ||||||||
| 65,331 | Bayer AG (Registered) (Pharmaceuticals, Biotechnology & Life Sciences) | $ | 8,467,564 | |||||
| 2,001 | bet-at-home.com AG (Consumer Services) | 290,470 | ||||||
| 50,652 | Covestro AG (Materials)(a) | 3,671,969 | ||||||
| 221,250 | Deutsche Lufthansa AG (Registered) (Transportation) | 5,042,188 | ||||||
| 2,286 | Duerr AG (Capital Goods) | 272,062 | ||||||
| 29,994 | Evotec AG (Pharmaceuticals, Biotechnology & Life Sciences)* | 479,460 | ||||||
| 2,021 | Fraport AG Frankfurt Airport Services Worldwide (Transportation) | 178,844 | ||||||
| 4,691 | Freenet AG (Telecommunication Services) | 149,655 | ||||||
| 32,255 | Henkel AG & Co. KGaA (Preference) (Household & Personal Products)(b) | 4,447,763 | ||||||
| 9,677 | HOCHTIEF AG (Capital Goods) | 1,776,493 | ||||||
| 117,739 | Infineon Technologies AG (Semiconductors & Semiconductor Equipment) | 2,500,844 | ||||||
| 51,492 | Innogy SE (Utilities)(a) | 2,026,544 | ||||||
| 34,611 | Merck KGaA (Pharmaceuticals, Biotechnology & Life Sciences) | 4,187,887 | ||||||
| 35,507 | Rheinmetall AG (Capital Goods) | 3,379,686 | ||||||
|
| |||||||
| 45,758,735 | ||||||||
|
| |||||||
| Hong Kong – 4.4% | ||||||||
| 1,024,400 | AIA Group Ltd. (Insurance) | 7,494,880 | ||||||
| 307,464 | Cheung Kong Property Holdings Ltd. (Real Estate) | 2,405,993 | ||||||
| 340,964 | CK Hutchison Holdings Ltd. (Capital Goods) | 4,278,943 | ||||||
| 380,000 | CLP Holdings Ltd. (Utilities) | 4,018,251 | ||||||
| 237,000 | Galaxy Entertainment Group Ltd. (Consumer Services) | 1,438,425 | ||||||
| 64,020 | Henderson Land Development Co. Ltd. (Real Estate) | 356,970 | ||||||
| 1,800 | Jardine Matheson Holdings Ltd. (Capital Goods) | 115,553 | ||||||
| 11,400 | Jardine Strategic Holdings Ltd. (Capital Goods) | 475,236 | ||||||
| 282,000 | Melco International Development Ltd. (Consumer Services) | 754,454 | ||||||
| 286,000 | SJM Holdings Ltd. (Consumer Services) | 301,350 | ||||||
| 1,032,000 | WH Group Ltd. (Food, Beverage & Tobacco)(a) | 1,042,085 | ||||||
| 76,000 | Wharf Holdings Ltd. (The) (Real Estate) | 628,876 | ||||||
| 255,000 | Wheelock & Co. Ltd. (Real Estate) | 1,923,364 | ||||||
| 190,500 | Yue Yuen Industrial Holdings Ltd. (Consumer Durables & Apparel) | 790,097 | ||||||
|
| |||||||
| 26,024,477 | ||||||||
|
| |||||||
| Common Stocks – (continued) | ||||||||
| Ireland – 0.0% | ||||||||
| 41,047 | Total Produce plc (Food & Staples Retailing) | 101,734 | ||||||
|
| |||||||
| Italy – 2.2% | ||||||||
| 54,706 | Amplifon SpA (Health Care Equipment & Services) | 721,908 | ||||||
| 5,731 | ASTM SpA (Transportation) | 99,036 | ||||||
| 7,714 | Banca Generali SpA (Diversified Financials) | 230,188 | ||||||
| 3,686 | DiaSorin SpA (Health Care Equipment & Services) | 283,120 | ||||||
| 1,061,230 | Enel SpA (Utilities) | 5,691,904 | ||||||
| 119,737 | Eni SpA (Energy) | 1,799,393 | ||||||
| 98,495 | Iren SpA (Utilities) | 228,142 | ||||||
| 176,472 | Leonardo SpA (Capital Goods) | 2,938,218 | ||||||
| 62,834 | Mediobanca SpA (Banks) | 621,619 | ||||||
| 646,771 | Telecom Italia SpA (Telecommunication Services)* | 598,375 | ||||||
|
| |||||||
| 13,211,903 | ||||||||
|
| |||||||
| Japan – 23.9% | ||||||||
| 19,700 | ADEKA Corp. (Materials) | 300,977 | ||||||
| 85,700 | Astellas Pharma, Inc. (Pharmaceuticals, Biotechnology & Life Sciences) | 1,050,399 | ||||||
| 4,900 | Avex Group Holdings, Inc. (Media) | 65,754 | ||||||
| 16,300 | Benesse Holdings, Inc. (Consumer Services) | 616,208 | ||||||
| 2,600 | Central Japan Railway Co. (Transportation) | 424,624 | ||||||
| 83,900 | Chubu Electric Power Co., Inc. (Utilities) | 1,115,757 | ||||||
| 11,800 | CKD Corp. (Capital Goods) | 180,668 | ||||||
| 66,400 | Daiichi Sankyo Co. Ltd. (Pharmaceuticals, Biotechnology & Life Sciences) | 1,567,233 | ||||||
| 25,900 | Daito Trust Construction Co. Ltd. (Real Estate) | 4,035,109 | ||||||
| 137,600 | Daiwa House Industry Co. Ltd. (Real Estate) | 4,709,440 | ||||||
| 68,200 | DeNA Co. Ltd. (Software & Services) | 1,532,825 | ||||||
| 5,600 | Dip Corp. (Software & Services) | 113,920 | ||||||
| 10,200 | Disco Corp. (Semiconductors & Semiconductor Equipment) | 1,635,992 | ||||||
| 50,200 | Dynam Japan Holdings Co. Ltd. (Consumer Services) | 88,455 | ||||||
| 5,200 | Fancl Corp. (Household & Personal Products) | 95,592 | ||||||
| 221,800 | Financial Products Group Co. Ltd. (Diversified Financials) | 2,118,902 | ||||||
| 15,200 | Foster Electric Co. Ltd. (Consumer Durables & Apparel) | 262,792 | ||||||
| 15,200 | Fujitsu General Ltd. (Consumer Durables & Apparel) | 352,489 | ||||||
| 239,000 | Fujitsu Ltd. (Software & Services) | 1,767,708 | ||||||
| 749,000 | Fukuoka Financial Group, Inc. (Banks) | 3,573,637 | ||||||
|
| |||||||
| 46 | The accompanying notes are an integral part of these financial statements. |
GOLDMAN SACHS INTERNATIONAL TAX-MANAGED EQUITY FUND
| Shares | Description | Value | ||||||
| Common Stocks – (continued) | ||||||||
| Japan – (continued) | ||||||||
| 4,500 | Gakkyusha Co. Ltd. (Consumer Services) | $ | 62,077 | |||||
| 1,800 | Glory Ltd. (Capital Goods) | 59,118 | ||||||
| 32,800 | Hachijuni Bank Ltd. (The) (Banks) | 208,987 | ||||||
| 7,500 | HIS Co. Ltd. (Consumer Services) | 226,048 | ||||||
| 41,400 | Hitachi High-Technologies Corp. (Technology Hardware & Equipment) | 1,612,238 | ||||||
| 788,000 | Hitachi Ltd. (Technology Hardware & Equipment) | 4,858,565 | ||||||
| 85,800 | Honda Motor Co. Ltd. (Automobiles & Components) | 2,350,755 | ||||||
| 20,000 | Hoya Corp. (Health Care Equipment & Services) | 1,041,227 | ||||||
| 119,300 | Japan Airlines Co. Ltd. (Transportation) | 3,695,399 | ||||||
| 81,000 | Japan Tobacco, Inc. (Food, Beverage & Tobacco) | 2,846,997 | ||||||
| 477,000 | Kajima Corp. (Capital Goods) | 4,031,423 | ||||||
| 5,800 | Kansai Electric Power Co., Inc. (The) (Utilities) | 79,979 | ||||||
| 29,200 | Kao Corp. (Household & Personal Products) | 1,736,184 | ||||||
| 130,300 | KDDI Corp. (Telecommunication Services) | 3,446,126 | ||||||
| 6,900 | Ki-Star Real Estate Co. Ltd. (Consumer Durables & Apparel) | 128,145 | ||||||
| 15,700 | Konami Holdings Corp. (Software & Services) | 873,952 | ||||||
| 5,700 | K’s Holdings Corp. (Retailing) | 111,447 | ||||||
| 30,000 | Kyokuto Boeki Kaisha Ltd. (Capital Goods) | 71,890 | ||||||
| 26,000 | M3, Inc. (Health Care Equipment & Services) | 717,246 | ||||||
| 7,000 | Mandom Corp. (Household & Personal Products) | 379,772 | ||||||
| 12,700 | Meiko Network Japan Co. Ltd. (Consumer Services) | 169,340 | ||||||
| 20,200 | Miraca Holdings, Inc. (Health Care Equipment & Services) | 909,789 | ||||||
| 95,500 | Mitsubishi Tanabe Pharma Corp. (Pharmaceuticals, Biotechnology & Life Sciences) | 2,209,116 | ||||||
| 453,000 | Mitsubishi UFJ Financial Group, Inc. (Banks) | 3,055,507 | ||||||
| 28,000 | Mitsui Chemicals, Inc. (Materials) | 149,110 | ||||||
| 9,800 | Mitsui Fudosan Co. Ltd. (Real Estate) | 234,793 | ||||||
| 5,900 | Modec, Inc. (Energy) | 131,490 | ||||||
| 108,700 | Nexon Co. Ltd. (Software & Services) | 2,156,159 | ||||||
| 6,300 | NGK Insulators Ltd. (Capital Goods) | 126,303 | ||||||
| 20,000 | Nichias Corp. (Capital Goods) | 231,355 | ||||||
| 21,600 | Nikkiso Co. Ltd. (Health Care Equipment & Services) | 208,058 | ||||||
| 126,000 | Nikon Corp. (Consumer Durables & Apparel) | 2,019,673 | ||||||
| 74,200 | Nippon Electric Glass Co. Ltd. (Technology Hardware & Equipment) | 2,706,638 | ||||||
|
| |||||||
| Common Stocks – (continued) | ||||||||
| Japan – (continued) | ||||||||
| 261,400 | Nippon Light Metal Holdings Co. Ltd. (Materials) | 622,213 | ||||||
| 60,800 | Nippon Telegraph & Telephone Corp. (Telecommunication Services) | 2,870,010 | ||||||
| 47,000 | Nishimatsu Construction Co. Ltd. (Capital Goods) | 249,599 | ||||||
| 458,700 | Nissan Motor Co. Ltd. (Automobiles & Components) | 4,580,089 | ||||||
| 4,800 | Noevir Holdings Co. Ltd. (Household & Personal Products) | 244,716 | ||||||
| 733,000 | Nomura Holdings, Inc. (Diversified Financials) | 4,420,316 | ||||||
| 103,900 | NTT DOCOMO, Inc. (Telecommunication Services) | 2,457,306 | ||||||
| 31,200 | Obayashi Corp. (Capital Goods) | 367,602 | ||||||
| 3,200 | Olympus Corp. (Health Care Equipment & Services) | 117,243 | ||||||
| 7,600 | Open House Co. Ltd. (Real Estate) | 234,519 | ||||||
| 143,100 | Persol Holdings Co. Ltd. (Commercial & Professional Services) | 2,688,591 | ||||||
| 30,600 | Relo Group, Inc. (Real Estate) | 595,752 | ||||||
| 47,800 | SCREEN Holdings Co. Ltd. (Semiconductors & Semiconductor Equipment) | 3,197,463 | ||||||
| 2,400 | Secom Co. Ltd. (Commercial & Professional Services) | 182,604 | ||||||
| 202,300 | Sega Sammy Holdings, Inc. (Consumer Durables & Apparel) | 2,727,452 | ||||||
| 223,000 | Sekisui House Ltd. (Consumer Durables & Apparel) | 3,941,213 | ||||||
| 60,800 | Seven & i Holdings Co. Ltd. (Food & Staples Retailing) | 2,508,878 | ||||||
| 13,500 | Shikoku Electric Power Co., Inc. (Utilities) | 159,357 | ||||||
| 43,000 | Shionogi & Co. Ltd. (Pharmaceuticals, Biotechnology & Life Sciences) | 2,397,589 | ||||||
| 16,700 | Ship Healthcare Holdings, Inc. (Health Care Equipment & Services) | 520,239 | ||||||
| 20,000 | Shizuoka Bank Ltd. (The) (Banks) | 181,387 | ||||||
| 22,300 | Skylark Co. Ltd. (Consumer Services) | 320,400 | ||||||
| 16,900 | SoftBank Group Corp. (Telecommunication Services) | 1,373,803 | ||||||
| 54,400 | Sony Corp. (Consumer Durables & Apparel) | 2,075,020 | ||||||
| 27,800 | Square Enix Holdings Co. Ltd. (Software & Services) | 911,060 | ||||||
| 3,800 | ST Corp. (Household & Personal Products) | 89,160 | ||||||
| 146,400 | Start Today Co. Ltd. (Retailing) | 3,607,983 | ||||||
| 149,500 | Sumitomo Mitsui Financial Group, Inc. (Banks) | 5,837,147 | ||||||
| 365,000 | Taisei Corp. (Capital Goods) | 3,338,489 | ||||||
| 68,300 | Terumo Corp. (Health Care Equipment & Services) | 2,695,048 | ||||||
| 64,700 | Tokio Marine Holdings, Inc. (Insurance) | 2,692,379 | ||||||
|
| |||||||
| The accompanying notes are an integral part of these financial statements. | 47 |
GOLDMAN SACHS INTERNATIONAL TAX-MANAGED EQUITY FUND
Schedule of Investments (continued)
June 30, 2017 (Unaudited)
| Shares | Description | Value | ||||||
| Common Stocks – (continued) | ||||||||
| Japan – (continued) | ||||||||
| 33,500 | Tokyo Electron Ltd. (Semiconductors & Semiconductor Equipment) | $ | 4,528,964 | |||||
| 318,000 | Toppan Printing Co. Ltd. (Commercial & Professional Services) | 3,496,733 | ||||||
| 7,600 | Towa Corp. (Semiconductors & Semiconductor Equipment) | 111,793 | ||||||
| 1,900 | Trend Micro, Inc. (Software & Services) | 98,198 | ||||||
| 55,000 | UACJ Corp. (Materials) | 151,066 | ||||||
| 33,200 | Ulvac, Inc. (Semiconductors & Semiconductor Equipment) | 1,601,978 | ||||||
| 38,500 | Unicharm Corp. (Household & Personal Products) | 969,275 | ||||||
| 2,500 | Yamaha Corp. (Consumer Durables & Apparel) | 86,547 | ||||||
| 5,100 | Yodogawa Steel Works Ltd. (Materials) | 135,021 | ||||||
| 5,200 | Yoshinoya Holdings Co. Ltd. (Consumer Services) | 86,697 | ||||||
| 78,500 | Zenkoku Hosho Co. Ltd. (Diversified Financials) | 3,214,096 | ||||||
|
| |||||||
| 141,138,382 | ||||||||
|
| |||||||
| Liechtenstein – 0.0% | ||||||||
| 595 | VP Bank AG (Registered) (Diversified Financials) | 73,654 | ||||||
|
| |||||||
| Luxembourg – 0.5% | ||||||||
| 7,435 | ArcelorMittal (Materials)* | 168,649 | ||||||
| 79,512 | B&M European Value Retail SA (Retailing) | 351,038 | ||||||
| 3,845 | Eurofins Scientific SE (Pharmaceuticals, Biotechnology & Life Sciences) | 2,169,369 | ||||||
|
| |||||||
| 2,689,056 | ||||||||
|
| |||||||
| Netherlands – 5.5% | ||||||||
| 142,488 | ABN AMRO Group NV CVA (Banks)(a) | 3,774,771 | ||||||
| 53,002 | BE Semiconductor Industries NV (Semiconductors & Semiconductor Equipment) | 2,834,309 | ||||||
| 390,783 | ING Groep NV (Banks) | 6,745,998 | ||||||
| 53,832 | Koninklijke DSM NV (Materials) | 3,915,339 | ||||||
| 122,184 | Koninklijke Philips NV (Capital Goods) | 4,349,590 | ||||||
| 113,331 | NN Group NV (Insurance) | 4,021,330 | ||||||
| 14,739 | NXP Semiconductors NV (Semiconductors & Semiconductor Equipment)* | 1,613,183 | ||||||
| 153,940 | Royal Dutch Shell plc Class B (Energy) | 4,132,737 | ||||||
| 22,482 | Wolters Kluwer NV (Commercial & Professional Services) | 950,831 | ||||||
|
| |||||||
| 32,338,088 | ||||||||
|
| |||||||
| New Zealand – 0.0% | ||||||||
| 64,405 | Air New Zealand Ltd. (Transportation) | 153,890 | ||||||
|
| |||||||
| Common Stocks – (continued) | ||||||||
| Norway – 2.1% | ||||||||
| 11,171 | Austevoll Seafood ASA (Food, Beverage & Tobacco) | 94,939 | ||||||
| 11,849 | Borregaard ASA (Materials) | 146,243 | ||||||
| 241,885 | DNB ASA (Banks) | 4,118,042 | ||||||
| 71,780 | Grieg Seafood ASA (Food, Beverage & Tobacco) | 499,931 | ||||||
| 35,060 | Leroy Seafood Group ASA (Food, Beverage & Tobacco) | 190,401 | ||||||
| 75,871 | Marine Harvest ASA (Food, Beverage & Tobacco)* | 1,298,093 | ||||||
| 692,668 | Norsk Hydro ASA (Materials) | 3,833,229 | ||||||
| 171,490 | Orkla ASA (Food, Beverage & Tobacco) | 1,743,026 | ||||||
| 9,479 | Salmar ASA (Food, Beverage & Tobacco) | 234,958 | ||||||
| 5,636 | Tomra Systems ASA (Commercial & Professional Services) | 68,877 | ||||||
| 7,218 | Veidekke ASA (Capital Goods) | 94,237 | ||||||
|
| |||||||
| 12,321,976 | ||||||||
|
| |||||||
| Portugal – 0.0% | ||||||||
| 20,096 | Altri SGPS SA (Materials) | 92,553 | ||||||
|
| |||||||
| Singapore – 1.2% | ||||||||
| 144,900 | China Aviation Oil Singapore Corp. Ltd. (Energy) | 175,708 | ||||||
| 118,500 | Genting Singapore plc (Consumer Services) | 93,362 | ||||||
| 266,900 | Golden Agri-Resources Ltd. (Food, Beverage & Tobacco) | 72,697 | ||||||
| 19,400 | Jardine Cycle & Carriage Ltd. (Retailing) | 624,615 | ||||||
| 593,600 | Oversea-Chinese Banking Corp. Ltd. (Banks) | 4,649,875 | ||||||
| 44,900 | Singapore Airlines Ltd. (Transportation) | 329,981 | ||||||
| 14,700 | Venture Corp. Ltd. (Technology Hardware & Equipment) | 128,672 | ||||||
| 367,600 | Wilmar International Ltd. (Food, Beverage & Tobacco) | 894,132 | ||||||
|
| |||||||
| 6,969,042 | ||||||||
|
| |||||||
| South Africa – 0.7% | ||||||||
| 149,473 | Mondi plc (Materials) | 3,919,448 | ||||||
|
| |||||||
| Spain – 2.9% | ||||||||
| 76,966 | ACS Actividades de Construccion y Servicios SA (Capital Goods) | 2,975,805 | ||||||
| 28,129 | Amadeus IT Group SA (Software & Services) | 1,681,432 | ||||||
| 1,166,050 | Banco Santander SA (Banks) | 7,742,434 | ||||||
| 99,936 | Bankinter SA (Banks) | 921,905 | ||||||
| 21,119 | Grifols SA (Pharmaceuticals, Biotechnology & Life Sciences) | 588,821 | ||||||
| 221,884 | Repsol SA (Energy) | 3,401,721 | ||||||
|
| |||||||
| 17,312,118 | ||||||||
|
| |||||||
| 48 | The accompanying notes are an integral part of these financial statements. |
GOLDMAN SACHS INTERNATIONAL TAX-MANAGED EQUITY FUND
| Shares | Description | Value | ||||||
| Common Stocks – (continued) | ||||||||
| Sweden – 3.7% | ||||||||
| 75,598 | Alfa Laval AB (Capital Goods) | $ | 1,547,303 | |||||
| 15,164 | Atlas Copco AB Class B (Capital Goods) | 524,140 | ||||||
| 9,863 | Bure Equity AB (Diversified Financials) | 114,731 | ||||||
| 141,453 | Electrolux ABSeries B (Consumer Durables & Apparel) | 4,638,422 | ||||||
| 59,071 | Essity AB Class B (Household & Personal Products)* | 1,616,184 | ||||||
| 1,992 | Holmen AB Class B (Materials) | 86,458 | ||||||
| 155,354 | Husqvarna AB Class B (Consumer Durables & Apparel) | 1,544,250 | ||||||
| 4,957 | Loomis AB Class B (Commercial & Professional Services) | 177,693 | ||||||
| 253,728 | Sandvik AB (Capital Goods) | 3,994,754 | ||||||
| 424,462 | Svenska Cellulosa AB SCA Class B (Household & Personal Products) | 3,211,058 | ||||||
| 110,654 | Swedish Match AB (Food, Beverage & Tobacco) | 3,898,431 | ||||||
| 2,844 | Vitrolife AB (Pharmaceuticals, Biotechnology & Life Sciences) | 178,746 | ||||||
| 7,518 | Volvo AB Class B (Capital Goods) | 128,209 | ||||||
|
| |||||||
| 21,660,379 | ||||||||
|
| |||||||
| Switzerland – 6.4% | ||||||||
| 231,015 | ABB Ltd. (Registered) (Capital Goods) | 5,734,049 | ||||||
| 13,067 | Adecco Group AG (Registered) (Commercial & Professional Services) | 995,473 | ||||||
| 992 | Bachem Holding AG (Registered) Class B (Pharmaceuticals, Biotechnology & Life Sciences) | 113,175 | ||||||
| 1,952 | Bobst Group SA (Registered) (Capital Goods) | 187,706 | ||||||
| 3,854 | Cembra Money Bank AG (Diversified Financials) | 365,254 | ||||||
| 246 | Conzzeta AG (Registered) (Capital Goods) | 243,588 | ||||||
| 1,357 | Flughafen Zurich AG (Registered) (Transportation) | 333,280 | ||||||
| 142 | Forbo Holding AG (Registered) (Consumer Durables & Apparel) | 233,532 | ||||||
| 1,884 | Georg Fischer AG (Registered) (Capital Goods) | 1,827,441 | ||||||
| 24,334 | Logitech International SA (Registered) (Technology Hardware & Equipment) | 895,417 | ||||||
| 20,071 | Lonza Group AG (Registered) (Pharmaceuticals, Biotechnology & Life Sciences)* | 4,347,703 | ||||||
| 96 | Metall Zug AG (Registered) Class B (Consumer Durables & Apparel) | 417,193 | ||||||
| 57,281 | Nestle SA (Registered) (Food, Beverage & Tobacco) | 4,995,916 | ||||||
| 14,028 | Novartis AG (Registered) (Pharmaceuticals, Biotechnology & Life Sciences) | 1,171,711 | ||||||
|
| |||||||
| Common Stocks – (continued) | ||||||||
| Switzerland – (continued) | ||||||||
| 3,566 | Oriflame Holding AG (Household & Personal Products) | 134,010 | ||||||
| 15,357 | Roche Holding AG (Pharmaceuticals, Biotechnology & Life Sciences) | 3,923,943 | ||||||
| 364,143 | STMicroelectronics NV (Semiconductors & Semiconductor Equipment) | 5,243,200 | ||||||
| 2,546 | Sulzer AG (Registered) (Capital Goods) | 288,612 | ||||||
| 364,627 | UBS Group AG (Registered) (Diversified Financials)* | 6,200,806 | ||||||
| 629 | Zurich Insurance Group AG (Insurance) | 183,573 | ||||||
|
| |||||||
| 37,835,582 | ||||||||
|
| |||||||
| United Kingdom – 13.2% | ||||||||
| 71,921 | 888 Holdings plc (Consumer Services) | 239,101 | ||||||
| 15,643 | AstraZeneca plc (Pharmaceuticals, Biotechnology & Life Sciences) | 1,047,824 | ||||||
| 192,048 | AstraZeneca plc ADR (Pharmaceuticals, Biotechnology & Life Sciences)(c) | 6,546,916 | ||||||
| 168,976 | Barratt Developments plc (Consumer Durables & Apparel) | 1,241,006 | ||||||
| 113,944 | British American Tobacco plc (Food, Beverage & Tobacco) | 7,764,478 | ||||||
| 114,633 | British Land Co. plc (The) (REIT) | 904,976 | ||||||
| 238,152 | Compass Group plc (Consumer Services) | 5,026,805 | ||||||
| 181,414 | Diageo plc (Food, Beverage & Tobacco) | 5,361,106 | ||||||
| 2,326 | Dialog Semiconductor plc (Semiconductors & Semiconductor Equipment)* | 99,379 | ||||||
| 839,234 | Direct Line Insurance Group plc (Insurance) | 3,886,092 | ||||||
| 44,690 | Electrocomponents plc (Technology Hardware & Equipment) | 336,151 | ||||||
| 70,347 | GlaxoSmithKline plc ADR (Pharmaceuticals, Biotechnology & Life Sciences) | 3,033,363 | ||||||
| 7,302 | HomeServe plc (Commercial & Professional Services) | 69,950 | ||||||
| 954,402 | HSBC Holdings plc (Banks) | 8,858,728 | ||||||
| 498,662 | International Consolidated Airlines Group SA (Transportation) | 3,962,013 | ||||||
| 79,545 | JD Sports Fashion plc (Retailing) | 362,333 | ||||||
| 3,366,170 | Lloyds Banking Group plc (Banks) | 2,900,886 | ||||||
| 48,320 | Micro Focus International plc (Software & Services) | 1,428,783 | ||||||
| 28,180 | National Grid plc (Utilities) | 349,164 | ||||||
| 104,859 | OneSavings Bank plc (Banks) | 512,151 | ||||||
| 147,305 | Persimmon plc (Consumer Durables & Apparel) | 4,302,265 | ||||||
| 100,909 | QinetiQ Group plc (Capital Goods) | 355,481 | ||||||
| 2,891 | Reckitt Benckiser Group plc (Household & Personal Products) | 293,070 | ||||||
|
| |||||||
| The accompanying notes are an integral part of these financial statements. | 49 |
GOLDMAN SACHS INTERNATIONAL TAX-MANAGED EQUITY FUND
Schedule of Investments (continued)
June 30, 2017 (Unaudited)
| Shares | Description | Value | ||||||
| Common Stocks – (continued) | ||||||||
| United Kingdom – (continued) | ||||||||
| 106,294 | Regional REIT Ltd. (REIT)(a) | $ | 145,711 | |||||
| 40,445 | Rentokil Initial plc (Commercial & Professional Services) | 143,926 | ||||||
| 37,414 | Safestore Holdings plc (REIT) | 204,916 | ||||||
| 183,978 | Smiths Group plc (Capital Goods) | 3,825,257 | ||||||
| 162,475 | SSP Group plc (Consumer Services) | 1,006,867 | ||||||
| 20,298 | St Modwen Properties plc (Real Estate) | 94,883 | ||||||
| 116,448 | Standard Life Investment Property Income Trust Ltd. (REIT) | 135,363 | ||||||
| 313,285 | Subsea 7 SA (Energy) | 4,224,160 | ||||||
| 30,131 | Tate & Lyle plc (Food, Beverage & Tobacco) | 259,680 | ||||||
| 36,085 | Unilever plc (Household & Personal Products) | 1,952,844 | ||||||
| 36,634 | Unilever plc ADR (Household & Personal Products) | 1,982,632 | ||||||
| 66,124 | Vodafone Group plc ADR (Telecommunication Services) | 1,899,742 | ||||||
| 160,388 | WPP plc (Media) | 3,377,240 | ||||||
|
| |||||||
| 78,135,242 | ||||||||
|
| |||||||
| United States – 0.8% | ||||||||
| 64,290 | Carnival plc ADR (Consumer Services)(d) | 4,250,855 | ||||||
| 2,995 | QIAGEN NV (Pharmaceuticals, Biotechnology & Life Sciences)* | 99,655 | ||||||
| 14,945 | Sims Metal Management Ltd. (Materials) | 174,007 | ||||||
|
| |||||||
| 4,524,517 | ||||||||
|
| |||||||
| TOTAL COMMON STOCKS | ||||||||
| (Cost $480,981,752) | $ | 569,757,571 | ||||||
|
| |||||||
| Units | Description | Expiration Month | Value | |||||||
| Right* – 0.0% | ||||||||||
| Spain – 0.0% | ||||||||||
| 76,966 | ACS Actividades de Construccion y Servicios SA (Capital Goods) | 07/17 | $ | 61,534 | ||||||
| (Cost $63,939) | ||||||||||
| ||||||||||
| Shares | Distribution Rate | Value | ||||||
| Investment Company(e)(f) – 0.0% | ||||||||
| | Goldman Sachs Financial Square Government Fund – | | ||||||
| 1,310 | 0.845% | $ | 1,310 | |||||
| (Cost $1,310) | ||||||||
|
| |||||||
| | TOTAL INVESTMENTS BEFORE SECURITIES LENDING REINVESTMENT VEHICLE | |||||||
| (Cost $481,047,001) | $ | 569,820,415 | ||||||
|
| |||||||
| Securities Lending Reinvestment Vehicle(e)(f) – 0.5% | ||||||||
| | Goldman Sachs Financial Square Government Fund – | | ||||||
| 3,216,000 | 0.845% | $ | 3,216,000 | |||||
| (Cost $3,216,000) | ||||||||
|
| |||||||
| TOTAL INVESTMENTS – 97.1% | ||||||||
| (Cost $484,263,001) | $ | 573,036,415 | ||||||
|
| |||||||
| | OTHER ASSETS IN EXCESS OF LIABILITIES – 2.9% | 16,885,285 | ||||||
|
| |||||||
| NET ASSETS – 100.0% | $ | 589,921,700 | ||||||
|
| |||||||
| The percentage shown for each investment category reflects the value of investments in that category as a percentage of net assets. | ||
* | Non-income producing security. | |
(a) | Exempt from registration under Rule 144A of the Securities Act of 1933. Under procedures approved by the Board of Trustees, such securities may be deemed liquid by the Investment Adviser and may be resold, normally to qualified institutional buyers in transactions exempt from registration. Total market value of Rule 144A securities amounts to $10,661,080, which represents approximately 1.8% of net assets as of June 30, 2017. | |
(b) | Preference Shares are a special type of equity investment that shares in the earnings of the company, has limited voting rights, and receives a greater dividend than applicable Common Shares. | |
(c) | All or a portion of security is segregated as collateral for initial margin requirements on futures transactions. | |
(d) | All or a portion of security is on loan. | |
(e) | Represents an affiliated issuer. | |
(f) | Variable rate security. Interest rate or distribution rate disclosed is that which is in effect on June 30, 2017. | |
| ||
Investment Abbreviations: | ||
ADR | —American Depositary Receipt | |
CVA | —Dutch Certification | |
REIT | —Real Estate Investment Trust | |
| ||
| 50 | The accompanying notes are an integral part of these financial statements. |
GOLDMAN SACHS INTERNATIONAL TAX-MANAGED EQUITY FUND
| ADDITIONAL INVESTMENT INFORMATION |
FUTURES CONTRACTS — At June 30, 2017, the Fund had the following futures contracts:
| Type | Number of Contracts Long (Short) | Expiration Date | Current Value | Unrealized Gain (Loss) | ||||||||||
EURO STOXX 50 Index | 116 | September 2017 | $ | 4,545,711 | $ | (178,765 | ) | |||||||
FTSE 100 Index | 22 | September 2017 | 2,075,259 | (61,208 | ) | |||||||||
Hang Seng Index | 1 | July 2017 | 163,850 | (754 | ) | |||||||||
MSCI Singapore Index | 5 | July 2017 | 130,180 | 314 | ||||||||||
SPI 200 Index | 7 | September 2017 | 759,819 | (16,010 | ) | |||||||||
TSE TOPIX Index | 13 | September 2017 | 1,862,592 | 12,636 | ||||||||||
| TOTAL | $ | (243,787 | ) | |||||||||||
| The accompanying notes are an integral part of these financial statements. | 51 |
GOLDMAN SACHS TAX-ADVANTAGED EQUITY FUNDS
Statements of Assets and Liabilities
June 30, 2017 (Unaudited)
U.S. Equity Dividend and Premium Fund | International Equity Dividend and Premium Fund | U.S. Tax-Managed Equity Fund | International Tax-Managed Equity Fund | |||||||||||||||
| Assets: | ||||||||||||||||||
Investments in unaffiliated issuers, at value (cost $2,820,536,698, $393,348,422, $852,538,053 and $481,045,691)(a) | $ | 3,201,073,418 | $ | 386,844,784 | $ | 1,260,868,843 | $ | 569,819,105 | ||||||||||
Investments in affiliated issuers, at value (cost $52,404, $197, $1,409,490 and $1,310) | 52,404 | 197 | 1,409,490 | 1,310 | ||||||||||||||
Investments in affiliated securities lending reinvestment vehicle, at value (cost $2,925,000, $136,800, $1,186,925 and $3,216,000) | 2,925,000 | 136,800 | 1,186,925 | 3,216,000 | ||||||||||||||
Cash | 40,203,131 | 867,404 | 19,464,131 | 6,546,034 | ||||||||||||||
Foreign currencies, at value (cost $0, $5,029,063, $0 and $11,680,210) | — | 5,200,047 | — | 11,844,080 | ||||||||||||||
Receivables: | ||||||||||||||||||
Investments sold | 6,192,158 | — | 20,610,473 | — | ||||||||||||||
Fund shares sold | 4,514,026 | 115,958 | 523,318 | 260,880 | ||||||||||||||
Dividends | 4,040,634 | 1,076,832 | 1,239,833 | 1,181,385 | ||||||||||||||
Reimbursement from investment adviser | 18,919 | — | — | 26,039 | ||||||||||||||
Securities lending income | 481 | 2,121 | 386 | 405 | ||||||||||||||
Foreign tax reclaims | — | 1,440,105 | — | 945,223 | ||||||||||||||
Due from custodian | — | 942,941 | — | — | ||||||||||||||
Variation margin on certain derivative contracts | 5,633 | — | 637 | — | ||||||||||||||
Other assets | 7,025 | 861 | 3,156 | 1,346 | ||||||||||||||
| Total assets | 3,259,032,829 | 396,628,050 | 1,305,307,192 | 593,841,807 | ||||||||||||||
| Liabilities: | ||||||||||||||||||
Written options, at value (premiums received $19,533,257, $3,721,564, $0 and $0) | 20,220,760 | 2,323,915 | — | — | ||||||||||||||
Variation margin on certain derivative contracts | — | 35,795 | — | 88,368 | ||||||||||||||
Payables: | ||||||||||||||||||
Investments purchased | 7,184,355 | 942,941 | 20,662,018 | 2 | ||||||||||||||
Fund shares redeemed | 3,457,746 | 180,277 | 20,712 | 45,175 | ||||||||||||||
Payable upon return of securities loaned | 2,925,000 | 136,800 | 1,186,925 | 3,216,000 | ||||||||||||||
Management fees | 1,817,690 | 260,593 | 720,191 | 410,728 | ||||||||||||||
Distribution and Service fees and Transfer Agency fees | 396,379 | 17,917 | 81,280 | 23,054 | ||||||||||||||
Accrued expenses | 82,977 | 105,554 | 85,551 | 136,780 | ||||||||||||||
| Total liabilities | 36,084,907 | 4,003,792 | 22,756,677 | 3,920,107 | ||||||||||||||
| Net Assets: | ||||||||||||||||||
Paid-in capital | 2,784,303,786 | 427,262,153 | 899,223,282 | 526,907,516 | ||||||||||||||
Undistributed (distributions in excess of) net investment income | 1,741,418 | (43,989 | ) | 4,972,139 | 7,541,706 | |||||||||||||
Accumulated net realized gain (loss) | 57,160,628 | (29,547,637 | ) | (29,930,692 | ) | (33,248,747 | ) | |||||||||||
Net unrealized gain (loss) | 379,742,090 | (5,046,269 | ) | 408,285,786 | 88,721,225 | |||||||||||||
| NET ASSETS | $ | 3,222,947,922 | $ | 392,624,258 | $ | 1,282,550,515 | $ | 589,921,700 | ||||||||||
Net Assets: | ||||||||||||||||||
Class A | $ | 279,894,227 | $ | 4,561,101 | $ | 48,168,592 | $ | 4,988,344 | ||||||||||
Class C | 164,871,750 | 3,401,190 | 22,050,631 | 1,297,486 | ||||||||||||||
Institutional | 2,375,805,552 | 380,365,544 | 1,195,634,808 | 576,114,591 | ||||||||||||||
Service | — | — | 663,813 | — | ||||||||||||||
Class IR | 402,376,393 | 4,296,423 | 16,032,671 | 7,521,279 | ||||||||||||||
Total Net Assets | $ | 3,222,947,922 | $ | 392,624,258 | $ | 1,282,550,515 | $ | 589,921,700 | ||||||||||
Shares outstanding $0.001 par value (unlimited shares authorized): |
| |||||||||||||||||
Class A | 21,989,631 | 629,830 | 2,377,275 | 498,225 | ||||||||||||||
Class C | 13,001,976 | 486,706 | 1,147,189 | 133,618 | ||||||||||||||
Institutional | 187,056,206 | 53,427,647 | 58,023,290 | 57,936,294 | ||||||||||||||
Service | — | — | 32,567 | — | ||||||||||||||
Class IR | 31,660,171 | 605,323 | 778,891 | 751,552 | ||||||||||||||
Net asset value, offering and redemption price per share:(b) | ||||||||||||||||||
Class A | $12.73 | $7.24 | $20.26 | $10.01 | ||||||||||||||
Class C | 12.68 | 6.99 | 19.22 | 9.71 | ||||||||||||||
Institutional | 12.70 | 7.12 | 20.61 | 9.94 | ||||||||||||||
Service | — | — | 20.38 | — | ||||||||||||||
Class IR | 12.71 | 7.10 | 20.58 | 10.01 | ||||||||||||||
| (a) | Includes loaned securities having a market value of $2,843,135, $135,392, $1,136,387 and $3,173,760 for the U.S. Equity Dividend and Premium, International Equity Dividend and Premium, U.S. Tax-Managed Equity and International Tax-Managed Equity Funds, respectively. |
| (b) | Maximum public offering price per share for Class A Shares of the U.S. Equity Dividend and Premium, International Equity Dividend and Premium, U.S. Tax-Managed Equity and International Tax-Managed Equity Funds is $13.47, $7.66, $21.44 and $10.59, respectively. At redemption, Class C Shares may be subject to a contingent deferred sales charge assessed on the amount equal to the lesser of the current NAV or the original purchase price of the shares. |
| 52 | The accompanying notes are an integral part of these financial statements. |
GOLDMAN SACHS TAX-ADVANTAGED EQUITY FUNDS
Statements of Operations
For the Six Months Ended June 30, 2017 (Unaudited)
| U.S. Equity Dividend and Premium Fund | International Equity Dividend and Premium Fund | U.S. Tax-Managed Equity Fund | International Tax-Managed Equity Fund | |||||||||||||||
| Investment income: | ||||||||||||||||||
Dividends — unaffiliated issuers (net of foreign taxes withheld of $25,927, $860,326, $0 and $958,176) | $ | 40,804,269 | $ | 8,557,466 | $ | 9,443,570 | $ | 10,335,486 | ||||||||||
Dividends — affiliated issuers | 187,885 | 4,912 | 39,794 | 7,809 | ||||||||||||||
Securities lending income — affiliated issuer | 7,396 | 22,231 | 2,950 | 13,277 | ||||||||||||||
| Total investment income | 40,999,550 | 8,584,609 | 9,486,314 | 10,356,572 | ||||||||||||||
| Expenses: | ||||||||||||||||||
Management fees | 10,369,995 | 1,442,966 | 4,179,344 | 2,330,084 | ||||||||||||||
Transfer Agency fees(a) | 1,156,270 | 79,587 | 307,398 | 117,338 | ||||||||||||||
Distribution and Service fees(a) | 1,121,772 | 19,867 | 172,832 | 11,155 | ||||||||||||||
Custody, accounting and administrative services | 162,941 | 65,978 | 69,535 | 96,136 | ||||||||||||||
Registration fees | 92,225 | 30,536 | 28,673 | 35,371 | ||||||||||||||
Professional fees | 42,832 | 53,802 | 43,904 | 56,704 | ||||||||||||||
Printing and mailing costs | 32,869 | 7,607 | 12,596 | 7,731 | ||||||||||||||
Trustee fees | 10,653 | 8,411 | 9,264 | 8,605 | ||||||||||||||
Service share fees — Service Plan | — | — | 802 | — | ||||||||||||||
Service share fees — Shareholder Administration Plan | — | — | 802 | — | ||||||||||||||
Other | 33,070 | 9,198 | 18,074 | 9,051 | ||||||||||||||
| Total expenses | 13,022,627 | 1,717,952 | 4,843,224 | 2,672,175 | ||||||||||||||
Less — expense reductions | (246,053 | ) | (2,882 | ) | (15,901 | ) | (59,348 | ) | ||||||||||
| Net expenses | 12,776,574 | 1,715,070 | 4,827,323 | 2,612,827 | ||||||||||||||
| NET INVESTMENT INCOME | 28,222,976 | 6,869,539 | 4,658,991 | 7,743,745 | ||||||||||||||
| Realized and unrealized gain (loss): | ||||||||||||||||||
Net realized gain (loss) from: | ||||||||||||||||||
Investments | 97,094,959 | (2,031,291 | ) | 9,646,217 | 47,159,695 | |||||||||||||
Futures contracts | 6,543,132 | 603,793 | 1,684,652 | 1,068,140 | ||||||||||||||
Foreign currency transactions | — | 181,091 | — | 74,524 | ||||||||||||||
Written options | (43,222,480 | ) | (2,125,333 | ) | — | — | ||||||||||||
Net change in unrealized gain (loss) on: | ||||||||||||||||||
Investments | 72,531,477 | 42,895,040 | 79,506,414 | 26,871,123 | ||||||||||||||
Futures contracts | 249,995 | (93,425 | ) | (68,764 | ) | (234,688 | ) | |||||||||||
Foreign currency translation | — | 343,398 | — | 241,568 | ||||||||||||||
Written options | 9,202,959 | 1,905,012 | — | — | ||||||||||||||
| Net realized and unrealized gain | 142,400,042 | 41,678,285 | 90,768,519 | 75,180,362 | ||||||||||||||
| NET INCREASE IN NET ASSETS RESULTING FROM OPERATIONS | $ | 170,623,018 | $ | 48,547,824 | $ | 95,427,510 | $ | 82,924,107 | ||||||||||
| (a) | Class specific Distribution and Service, and Transfer Agency fees were as follows: |
| Distribution and Service Fees | Transfer Agency Fees | |||||||||||||||||||||||||||
Fund | Class A | Class C | Class A | Class C | Institutional | Service | Class IR | |||||||||||||||||||||
U.S. Equity Dividend and Premium | $ | 337,382 | $ | 784,390 | $ | 256,412 | $ | 149,035 | $ | 449,746 | $ | — | $ | 301,077 | ||||||||||||||
International Equity Dividend and Premium | 6,112 | 13,755 | 4,645 | 2,614 | 69,037 | — | 3,291 | |||||||||||||||||||||
U.S. Tax-Managed Equity | 59,763 | 113,069 | 45,420 | 21,483 | 226,101 | 128 | 14,266 | |||||||||||||||||||||
International Tax-Managed Equity | 5,535 | 5,620 | 4,207 | 1,068 | 107,602 | — | 4,461 | |||||||||||||||||||||
| The accompanying notes are an integral part of these financial statements. | 53 |
GOLDMAN SACHS TAX-ADVANTAGED EQUITY FUNDS
Statements of Changes in Net Assets
��
| U.S. Equity Dividend and Premium Fund | ||||||||||
| For the Six Months Ended June 30, 2017 (Unaudited) | For the Fiscal Year Ended December 31, 2016 | |||||||||
| From operations: | ||||||||||
Net investment income | $ | 28,222,976 | $ | 39,154,893 | ||||||
Net realized gain (loss) | 60,415,611 | 76,166,366 | ||||||||
Net change in unrealized gain (loss) | 81,984,431 | 134,707,366 | ||||||||
| Net increase in net assets resulting from operations | 170,623,018 | 250,028,625 | ||||||||
| Distributions to shareholders: | ||||||||||
From net investment income | ||||||||||
Class A Shares | (2,016,290 | ) | (3,738,453 | ) | ||||||
Class C Shares | (682,848 | ) | (1,052,935 | ) | ||||||
Institutional Shares | (21,654,667 | ) | (32,416,858 | ) | ||||||
Service Shares | — | — | ||||||||
Class IR Shares | (3,365,585 | ) | (2,136,468 | ) | ||||||
From net realized gains | ||||||||||
Class A Shares | — | (9,720,310 | ) | |||||||
Class C Shares | — | (5,035,563 | ) | |||||||
Institutional Shares | — | (70,738,512 | ) | |||||||
Class IR Shares | — | (5,771,130 | ) | |||||||
| Total distributions to shareholders | (27,719,390 | ) | (130,610,229 | ) | ||||||
| From share transactions: | ||||||||||
Proceeds from sales of shares | 868,806,545 | 1,238,497,043 | ||||||||
Reinvestment of distributions | 24,603,926 | 116,491,582 | ||||||||
Cost of shares redeemed | (487,959,171 | ) | (401,224,181 | ) | ||||||
| Net increase (decrease) in net assets resulting from share transactions | 405,451,300 | 953,764,444 | ||||||||
| TOTAL INCREASE | 548,354,928 | 1,073,182,840 | ||||||||
| Net assets: | ||||||||||
Beginning of period | 2,674,592,994 | 1,601,410,154 | ||||||||
End of period | $ | 3,222,947,922 | $ | 2,674,592,994 | ||||||
| Undistributed (distributions in excess of) net investment income | $ | 1,741,418 | $ | 1,237,832 | ||||||
| 54 | The accompanying notes are an integral part of these financial statements. |
GOLDMAN SACHS TAX-ADVANTAGED EQUITY FUNDS
| International Equity Dividend and Premium Fund | U.S. Tax-Managed Equity Fund | International Tax-Managed Equity Fund | ||||||||||||||||||||||||||||||||||||||||||||
| For the Six Months Ended June 30, 2017 (Unaudited) | For the Fiscal Year Ended December 31, 2016 | For the Six Months Ended June 30, 2017 (Unaudited) | For the Fiscal Year Ended December 31, 2016 | For the Six Months Ended June 30, 2017 (Unaudited) | For the Fiscal Year Ended December 31, 2016 | |||||||||||||||||||||||||||||||||||||||||
| $ | 6,869,539 | $ | 9,400,852 | $ | 4,658,991 | $ | 10,257,148 | $ | 7,743,745 | $ | 8,815,381 | |||||||||||||||||||||||||||||||||||
| (3,371,740 | ) | (21,816,393 | ) | 11,330,869 | 10,789,522 | 48,302,359 | 7,181,824 | |||||||||||||||||||||||||||||||||||||||
| 45,050,025 | 16,448,049 | 79,437,650 | 82,407,174 | 26,878,003 | (7,179,959 | ) | ||||||||||||||||||||||||||||||||||||||||
| 48,547,824 | 4,032,508 | 95,427,510 | 103,453,844 | 82,924,107 | 8,817,246 | |||||||||||||||||||||||||||||||||||||||||
| (71,406 | ) | (217,063 | ) | — | (290,064 | ) | — | (76,758 | ) | |||||||||||||||||||||||||||||||||||||
| (45,067 | ) | (53,653 | ) | — | — | — | (8,324 | ) | ||||||||||||||||||||||||||||||||||||||
| (6,799,588 | ) | (9,117,288 | ) | — | (10,183,706 | ) | — | (8,908,634 | ) | |||||||||||||||||||||||||||||||||||||
| — | — | — | (842 | ) | — | — | ||||||||||||||||||||||||||||||||||||||||
| (74,267 | ) | (51,621 | ) | — | (128,024 | ) | — | (18,421 | ) | |||||||||||||||||||||||||||||||||||||
| — | — | — | — | — | — | |||||||||||||||||||||||||||||||||||||||||
| — | — | — | — | — | — | |||||||||||||||||||||||||||||||||||||||||
| — | — | — | — | — | — | |||||||||||||||||||||||||||||||||||||||||
| — | — | — | — | — | — | |||||||||||||||||||||||||||||||||||||||||
| (6,990,328 | ) | (9,439,625 | ) | — | (10,602,636 | ) | — | (9,012,137 | ) | |||||||||||||||||||||||||||||||||||||
| 53,888,876 | 86,617,253 | 86,409,451 | 164,924,713 | 47,316,110 | 181,954,674 | |||||||||||||||||||||||||||||||||||||||||
| 6,922,592 | 9,338,124 | — | 10,433,576 | — | 9,012,029 | |||||||||||||||||||||||||||||||||||||||||
| (27,682,947 | ) | (67,424,216 | ) | (45,730,477 | ) | (167,179,979 | ) | (66,798,761 | ) | (96,123,872 | ) | |||||||||||||||||||||||||||||||||||
| 33,128,521 | 28,531,161 | 40,678,974 | 8,178,310 | (19,482,651 | ) | 94,842,831 | ||||||||||||||||||||||||||||||||||||||||
| 74,686,017 | 23,124,044 | 136,106,484 | 101,029,518 | 63,441,456 | 94,647,940 | |||||||||||||||||||||||||||||||||||||||||
| 317,938,241 | 294,814,197 | 1,146,444,031 | 1,045,414,513 | 526,480,244 | 431,832,304 | |||||||||||||||||||||||||||||||||||||||||
| $ | 392,624,258 | $ | 317,938,241 | $ | 1,282,550,515 | $ | 1,146,444,031 | $ | 589,921,700 | $ | 526,480,244 | |||||||||||||||||||||||||||||||||||
| $ | (43,989 | ) | $ | 76,800 | $ | 4,972,139 | $ | 313,148 | $ | 7,541,706 | $ | (202,039 | ) | |||||||||||||||||||||||||||||||||
| The accompanying notes are an integral part of these financial statements. | 55 |
GOLDMAN SACHS U.S. EQUITY DIVIDEND AND PREMIUM FUND
Selected Data for a Share Outstanding Throughout Each Period
| Income (loss) from investment operations | Distributions to shareholders | |||||||||||||||||||||||||||||
| Year - Share Class | Net asset | Net investment income(a) | Net realized and unrealized gain | Total from investment operations | From net investment income | From net realized gains | Total distributions | |||||||||||||||||||||||
| FOR THE SIX MONTHS ENDED JUNE 30, (UNAUDITED) | ||||||||||||||||||||||||||||||
2017 - A | $ | 12.11 | $ | 0.10 | $ | 0.61 | $ | 0.71 | $ | (0.09 | ) | $ | — | $ | (0.09 | ) | ||||||||||||||
2017 - C | 12.07 | 0.05 | 0.61 | 0.66 | (0.05 | ) | — | (0.05 | ) | |||||||||||||||||||||
2017 - Institutional | 12.09 | 0.12 | 0.61 | 0.73 | (0.12 | ) | — | (0.12 | ) | |||||||||||||||||||||
2017 - IR | 12.10 | 0.12 | 0.60 | 0.72 | (0.11 | ) | — | (0.11 | ) | |||||||||||||||||||||
| FOR THE FISCAL YEARS ENDED DECEMBER 31, | ||||||||||||||||||||||||||||||
2016 - A | 11.34 | 0.20 | 1.21 | 1.41 | (0.19 | ) | (0.45 | ) | (0.64 | ) | ||||||||||||||||||||
2016 - C | 11.31 | 0.11 | 1.21 | 1.32 | (0.11 | ) | (0.45 | ) | (0.56 | ) | ||||||||||||||||||||
2016 - Institutional | 11.31 | 0.24 | 1.22 | 1.46 | (0.23 | ) | (0.45 | ) | (0.68 | ) | ||||||||||||||||||||
2016 - IR | 11.33 | 0.23 | 1.21 | 1.44 | (0.22 | ) | (0.45 | ) | (0.67 | ) | ||||||||||||||||||||
2015 - A | 11.76 | 0.21 | 0.04 | 0.25 | (0.20 | ) | (0.47 | ) | (0.67 | ) | ||||||||||||||||||||
2015 - C | 11.74 | 0.12 | 0.03 | 0.15 | (0.11 | ) | (0.47 | ) | (0.58 | ) | ||||||||||||||||||||
2015 - Institutional | 11.73 | 0.25 | 0.04 | 0.29 | (0.24 | ) | (0.47 | ) | (0.71 | ) | ||||||||||||||||||||
2015 - IR | 11.75 | 0.24 | 0.04 | 0.28 | (0.23 | ) | (0.47 | ) | (0.70 | ) | ||||||||||||||||||||
2014 - A | 11.26 | 0.23 | 0.95 | 1.18 | (0.22 | ) | (0.46 | ) | (0.68 | ) | ||||||||||||||||||||
2014 - C | 11.24 | 0.14 | 0.96 | 1.10 | (0.14 | ) | (0.46 | ) | (0.60 | ) | ||||||||||||||||||||
2014 - Institutional | 11.24 | 0.27 | 0.95 | 1.22 | (0.27 | ) | (0.46 | ) | (0.73 | ) | ||||||||||||||||||||
2014 - IR | 11.25 | 0.26 | 0.95 | 1.21 | (0.25 | ) | (0.46 | ) | (0.71 | ) | ||||||||||||||||||||
2013 - A | 9.60 | 0.20 | 2.12 | 2.32 | (0.20 | ) | (0.46 | ) | (0.66 | ) | ||||||||||||||||||||
2013 - C | 9.59 | 0.13 | 2.11 | 2.24 | (0.13 | ) | (0.46 | ) | (0.59 | ) | ||||||||||||||||||||
2013 - Institutional | 9.58 | 0.25 | 2.12 | 2.37 | (0.25 | ) | (0.46 | ) | (0.71 | ) | ||||||||||||||||||||
2013 - IR | 9.59 | 0.23 | 2.12 | 2.35 | (0.23 | ) | (0.46 | ) | (0.69 | ) | ||||||||||||||||||||
2012 - A | 9.39 | 0.25 | 0.71 | 0.96 | (0.24 | ) | (0.51 | ) | (0.75 | ) | ||||||||||||||||||||
2012 - C | 9.38 | 0.18 | 0.71 | 0.89 | (0.17 | ) | (0.51 | ) | (0.68 | ) | ||||||||||||||||||||
2012 - Institutional | 9.37 | 0.28 | 0.72 | 1.00 | (0.28 | ) | (0.51 | ) | (0.79 | ) | ||||||||||||||||||||
2012 - IR | 9.38 | 0.29 | 0.70 | 0.99 | (0.27 | ) | (0.51 | ) | (0.78 | ) | ||||||||||||||||||||
| (a) | Calculated based on the average shares outstanding methodology. |
| (b) | Assumes investment at the net asset value at the beginning of the period, reinvestment of all distributions, a complete redemption of the investment at the net asset value at the end of the period and no sales or redemption charges. Total returns would be reduced if a sales or redemption charge was taken into account. Returns do not reflect the impact of taxes to shareholders relating to Fund distributions or the redemption of Fund shares. Total returns for periods less than one full year are not annualized. |
| (c) | The Fund’s portfolio turnover rate is calculated in accordance with regulatory requirements, without regard to transactions involving short term investments and certain derivatives. If such transactions were included, the Fund’s portfolio turnover rate may be higher. |
| (d) | Annualized. |
| 56 | The accompanying notes are an integral part of these financial statements. |
GOLDMAN SACHS U.S. EQUITY DIVIDEND AND PREMIUM FUND
| Net asset value, end of period | Total return(b) | Net assets, end of period (in 000s) | Ratio of net expenses to average net assets | Ratio of total expenses to average net assets | Ratio of net investment income to average net assets | Portfolio turnover rate(c) | ||||||||||||||||||||||||||||||||||
| $ | 12.73 | 5.82 | % | $ | 279,894 | 1.14 | %(d) | 1.16 | %(d) | 1.55 | %(d) | 16 | % | |||||||||||||||||||||||||||
| 12.68 | 5.41 | 164,872 | 1.89 | (d) | 1.91 | (d) | 0.85 | (d) | 16 | |||||||||||||||||||||||||||||||
| 12.70 | 6.03 | 2,375,806 | 0.74 | (d) | 0.76 | (d) | 2.00 | (d) | 16 | |||||||||||||||||||||||||||||||
| 12.71 | 5.99 | 402,376 | 0.89 | (d) | 0.91 | (d) | 1.88 | (d) | 16 | |||||||||||||||||||||||||||||||
| 12.11 | 12.73 | 294,401 | 1.16 | 1.19 | 1.67 | 23 | ||||||||||||||||||||||||||||||||||
| 12.07 | 11.92 | 142,909 | 1.91 | 1.94 | 0.92 | 23 | ||||||||||||||||||||||||||||||||||
| 12.09 | 13.17 | 2,062,756 | 0.76 | 0.79 | 2.07 | 23 | ||||||||||||||||||||||||||||||||||
| 12.10 | 12.92 | 174,527 | 0.91 | 0.94 | 1.90 | 23 | ||||||||||||||||||||||||||||||||||
| 11.34 | 2.08 | 194,237 | 1.17 | 1.20 | 1.75 | 39 | ||||||||||||||||||||||||||||||||||
| 11.31 | 1.26 | 90,091 | 1.92 | 1.95 | 1.01 | 39 | ||||||||||||||||||||||||||||||||||
| 11.31 | 2.49 | 1,262,977 | 0.77 | 0.80 | 2.15 | 39 | ||||||||||||||||||||||||||||||||||
| 11.33 | 2.34 | 54,106 | 0.92 | 0.95 | 2.03 | 39 | ||||||||||||||||||||||||||||||||||
| 11.76 | 10.47 | 172,832 | 1.19 | 1.20 | 1.96 | 53 | ||||||||||||||||||||||||||||||||||
| 11.74 | 9.68 | 74,125 | 1.94 | 1.95 | 1.21 | 53 | ||||||||||||||||||||||||||||||||||
| 11.73 | 10.83 | 1,149,361 | 0.79 | 0.80 | 2.36 | 53 | ||||||||||||||||||||||||||||||||||
| 11.75 | 10.75 | 39,960 | 0.94 | 0.95 | 2.21 | 53 | ||||||||||||||||||||||||||||||||||
| 11.26 | 24.58 | 167,149 | 1.19 | 1.21 | 1.92 | 69 | ||||||||||||||||||||||||||||||||||
| 11.24 | 23.61 | 66,872 | 1.94 | 1.96 | 1.17 | 69 | ||||||||||||||||||||||||||||||||||
| 11.24 | 25.14 | 1,072,965 | 0.79 | 0.81 | 2.32 | 69 | ||||||||||||||||||||||||||||||||||
| 11.25 | 24.93 | 35,480 | 0.94 | 0.96 | 2.18 | 69 | ||||||||||||||||||||||||||||||||||
| 9.60 | 10.30 | 145,184 | 1.21 | 1.22 | 2.48 | 67 | ||||||||||||||||||||||||||||||||||
| 9.59 | 9.57 | 45,243 | 1.96 | 1.97 | 1.83 | 67 | ||||||||||||||||||||||||||||||||||
| 9.58 | 10.74 | 895,258 | 0.81 | 0.82 | 2.83 | 67 | ||||||||||||||||||||||||||||||||||
| 9.59 | 10.60 | 19,787 | 0.96 | 0.97 | 2.90 | 67 | ||||||||||||||||||||||||||||||||||
| The accompanying notes are an integral part of these financial statements. | 57 |
GOLDMAN SACHS INTERNATIONAL EQUITY DIVIDEND AND PREMIUM FUND
Financial Highlights
Selected Data for a Share Outstanding Throughout Each Period
| Income (loss) from investment operations | Distributions to shareholders | |||||||||||||||||||||||||||||
| Year - Share Class | Net asset | Net investment income | Net realized and unrealized gain (loss) | Total from investment operations | From net investment income | From net realized gains | Total distributions | |||||||||||||||||||||||
| FOR THE SIX MONTHS ENDED JUNE 30, (UNAUDITED) | ||||||||||||||||||||||||||||||
2017 - A | $ | 6.43 | $ | 0.11 | (c) | $ | 0.81 | $ | 0.92 | $ | (0.11 | ) | $ | — | $ | (0.11 | ) | |||||||||||||
2017 - C | 6.21 | 0.09 | (c) | 0.79 | 0.88 | (0.10 | ) | — | (0.10 | ) | ||||||||||||||||||||
2017 - Institutional | 6.32 | 0.13 | (c) | 0.80 | 0.93 | (0.13 | ) | — | (0.13 | ) | ||||||||||||||||||||
2017 - IR | 6.31 | 0.14 | (c) | 0.78 | 0.92 | (0.13 | ) | — | (0.13 | ) | ||||||||||||||||||||
| FOR THE FISCAL YEARS ENDED DECEMBER 31, | ||||||||||||||||||||||||||||||
2016 - A | 6.56 | 0.18 | (c) | (0.14 | ) | 0.04 | (0.17 | ) | — | (0.17 | ) | |||||||||||||||||||
2016 - C | 6.35 | 0.12 | (c) | (0.14 | ) | (0.02 | ) | (0.12 | ) | — | (0.12 | ) | ||||||||||||||||||
2016 - Institutional | 6.46 | 0.19 | (c) | (0.14 | ) | 0.05 | (0.19 | ) | — | (0.19 | ) | |||||||||||||||||||
2016 - IR | 6.44 | 0.17 | (c) | (0.11 | ) | 0.06 | (0.19 | ) | — | (0.19 | ) | |||||||||||||||||||
2015 - A | 7.14 | 0.16 | (c)(e) | (0.49 | ) | (0.33 | ) | (0.14 | ) | (0.11 | ) | (0.25 | ) | |||||||||||||||||
2015 - C | 6.94 | 0.09 | (c)(e) | (0.47 | ) | (0.38 | ) | (0.10 | ) | (0.11 | ) | (0.21 | ) | |||||||||||||||||
2015 - Institutional | 7.03 | 0.18 | (c)(e) | (0.48 | ) | (0.30 | ) | (0.16 | ) | (0.11 | ) | (0.27 | ) | |||||||||||||||||
2015 - IR | 7.02 | 0.16 | (c)(e) | (0.48 | ) | (0.32 | ) | (0.15 | ) | (0.11 | ) | (0.26 | ) | |||||||||||||||||
2014 - A | 8.00 | 0.25 | (c)(f) | (0.64 | ) | (0.39 | ) | (0.23 | ) | (0.24 | ) | (0.47 | ) | |||||||||||||||||
2014 - C | 7.80 | 0.18 | (c)(f) | (0.62 | ) | (0.44 | ) | (0.18 | ) | (0.24 | ) | (0.42 | ) | |||||||||||||||||
2014 - Institutional | 7.89 | 0.27 | (c)(f) | (0.63 | ) | (0.36 | ) | (0.26 | ) | (0.24 | ) | (0.50 | ) | |||||||||||||||||
2014 - IR | 7.88 | 0.28 | (c)(f) | (0.66 | ) | (0.38 | ) | (0.24 | ) | (0.24 | ) | (0.48 | ) | |||||||||||||||||
2013 - A | 7.31 | 0.19 | (c) | 0.92 | 1.11 | (0.18 | ) | (0.24 | ) | (0.42 | ) | |||||||||||||||||||
2013 - C | 7.15 | 0.12 | (c) | 0.90 | 1.02 | (0.13 | ) | (0.24 | ) | (0.37 | ) | |||||||||||||||||||
2013 - Institutional | 7.21 | 0.20 | (c) | 0.93 | 1.13 | (0.21 | ) | (0.24 | ) | (0.45 | ) | |||||||||||||||||||
2013 - IR | 7.20 | 0.21 | (c) | 0.91 | 1.12 | (0.20 | ) | (0.24 | ) | (0.44 | ) | |||||||||||||||||||
2012 - A | 6.60 | 0.16 | 0.78 | 0.94 | (0.17 | ) | (0.06 | ) | (0.23 | ) | ||||||||||||||||||||
2012 - C | 6.47 | 0.13 | 0.74 | 0.87 | (0.13 | ) | (0.06 | ) | (0.19 | ) | ||||||||||||||||||||
2012 - Institutional | 6.52 | 0.21 | 0.74 | 0.95 | (0.20 | ) | (0.06 | ) | (0.26 | ) | ||||||||||||||||||||
2012 - IR | 6.52 | 0.26 | 0.67 | 0.93 | (0.19 | ) | (0.06 | ) | (0.25 | ) | ||||||||||||||||||||
| (a) | Assumes investment at the net asset value at the beginning of the period, reinvestment of all distributions, a complete redemption of the investment at the net asset value at the end of the period and no sales or redemption charges. Total returns would be reduced if a sales or redemption charge was taken into account. Returns do not reflect the impact of taxes to shareholders relating to Fund distributions or the redemption of Fund shares. Total returns for periods less than one full year are not annualized. |
| (b) | The Fund’s portfolio turnover rate is calculated in accordance with regulatory requirements, without regard to transactions involving short term investments and certain derivatives. If such transactions were included, the Fund’s portfolio turnover rate may be higher. |
| (c) | Calculated based on the average shares outstanding methodology. |
| (d) | Annualized. |
| (e) | Reflects income recognized from a corporate action which amounted to $0.03 per share and 0.38% of average net assets. |
| (f) | Reflects income recognized from a corporate action which amounted to $0.05 per share and 0.69% of average net assets. |
| 58 | The accompanying notes are an integral part of these financial statements. |
GOLDMAN SACHS INTERNATIONAL EQUITY DIVIDEND AND PREMIUM FUND
| Net asset value, end of period | Total return(a) | Net assets, end of period (in 000s) | Ratio of net expenses to average net assets | Ratio of total expenses to average net assets | Ratio of net investment income to average net assets | Portfolio turnover rate(b) | ||||||||||||||||||||||||||||||||||
| $ | 7.24 | 14.39 | % | $ | 4,561 | 1.35 | %(d) | 1.35 | %(d) | 3.16 | %(d) | 10 | % | |||||||||||||||||||||||||||
| 6.99 | 14.14 | 3,401 | 2.10 | (d) | 2.10 | (d) | 2.66 | (d) | 10 | |||||||||||||||||||||||||||||||
| 7.12 | 14.75 | 380,366 | 0.95 | (d) | 0.95 | (d) | 3.87 | (d) | 10 | |||||||||||||||||||||||||||||||
| 7.10 | 14.56 | 4,296 | 1.09 | (d) | 1.10 | (d) | 4.00 | (d) | 10 | |||||||||||||||||||||||||||||||
| 6.43 | 0.66 | 5,968 | 1.37 | 1.38 | 2.87 | 18 | ||||||||||||||||||||||||||||||||||
| 6.21 | (0.21 | ) | 2,549 | 2.12 | 2.13 | 2.00 | 18 | |||||||||||||||||||||||||||||||||
| 6.32 | 0.92 | 307,311 | 0.97 | 0.98 | 3.08 | 18 | ||||||||||||||||||||||||||||||||||
| 6.31 | 0.96 | 2,111 | 1.12 | 1.13 | 2.64 | 18 | ||||||||||||||||||||||||||||||||||
| 6.56 | (4.80 | ) | 9,532 | 1.37 | 1.37 | 2.26 | (e) | 100 | ||||||||||||||||||||||||||||||||
| 6.35 | (5.59 | ) | 3,329 | 2.12 | 2.12 | 1.38 | (e) | 100 | ||||||||||||||||||||||||||||||||
| 6.46 | (4.42 | ) | 281,204 | 0.97 | 0.97 | 2.65 | (e) | 100 | ||||||||||||||||||||||||||||||||
| 6.44 | (4.69 | ) | 749 | 1.12 | 1.12 | 2.33 | (e) | 100 | ||||||||||||||||||||||||||||||||
| 7.14 | (5.30 | ) | 10,565 | 1.35 | 1.35 | 3.13 | (f) | 44 | ||||||||||||||||||||||||||||||||
| 6.94 | (6.04 | ) | 2,634 | 2.10 | 2.10 | 2.32 | (f) | 44 | ||||||||||||||||||||||||||||||||
| 7.03 | (4.99 | ) | 415,503 | 0.95 | 0.95 | 3.45 | (f) | 44 | ||||||||||||||||||||||||||||||||
| 7.02 | (5.16 | ) | 862 | 1.09 | 1.09 | 3.52 | (f) | 44 | ||||||||||||||||||||||||||||||||
| 8.00 | 15.57 | 10,323 | 1.34 | 1.36 | 2.56 | 97 | ||||||||||||||||||||||||||||||||||
| 7.80 | 14.68 | 2,582 | 2.10 | 2.11 | 1.54 | 97 | ||||||||||||||||||||||||||||||||||
| 7.89 | 16.14 | 403,776 | 0.94 | 0.96 | 2.71 | 97 | ||||||||||||||||||||||||||||||||||
| 7.88 | 15.98 | 1,547 | 1.09 | 1.11 | 2.74 | 97 | ||||||||||||||||||||||||||||||||||
| 7.31 | 14.48 | 14,952 | 1.30 | 1.37 | 3.51 | 60 | ||||||||||||||||||||||||||||||||||
| 7.15 | 13.71 | 1,640 | 2.05 | 2.11 | 1.99 | 60 | ||||||||||||||||||||||||||||||||||
| 7.21 | 14.93 | 366,136 | 0.90 | 0.95 | 2.68 | 60 | ||||||||||||||||||||||||||||||||||
| 7.20 | 14.56 | 2,133 | 1.05 | 1.10 | 4.06 | 60 | ||||||||||||||||||||||||||||||||||
| The accompanying notes are an integral part of these financial statements. | 59 |
GOLDMAN SACHS U.S. TAX-MANAGED EQUITY FUND
Financial Highlights
Selected Data for a Share Outstanding Throughout Each Period
| Income (loss) from investment operations | Distributions to shareholders | |||||||||||||||||||||||||||||
| Year - Share Class | Net asset | Net investment income (loss)(a) | Net realized and unrealized gain (loss) | Total from investment operations | From net investment income | From net realized gains | Total distributions | |||||||||||||||||||||||
| FOR THE SIX MONTHS ENDED JUNE 30, (UNAUDITED) | ||||||||||||||||||||||||||||||
2017 - A | $ | 18.75 | $ | 0.04 | $ | 1.47 | $ | 1.51 | $ | — | $ | — | $ | — | ||||||||||||||||
2017 - C | 17.86 | (0.03 | ) | 1.39 | 1.36 | — | — | — | ||||||||||||||||||||||
2017 - Institutional | 19.04 | 0.08 | 1.49 | 1.57 | — | — | — | |||||||||||||||||||||||
2017 - Service | 18.88 | 0.03 | 1.47 | 1.50 | — | — | — | |||||||||||||||||||||||
2017 - IR | 19.03 | 0.07 | 1.48 | 1.55 | — | — | — | |||||||||||||||||||||||
| FOR THE FISCAL YEARS ENDED DECEMBER 31, | ||||||||||||||||||||||||||||||
2016 - A | 17.28 | 0.11 | 1.47 | 1.58 | (0.11 | ) | — | (0.11 | ) | |||||||||||||||||||||
2016 - C | 16.48 | (0.02 | ) | 1.40 | 1.38 | — | — | — | ||||||||||||||||||||||
2016 - Institutional | 17.53 | 0.18 | 1.51 | 1.69 | (0.18 | ) | — | (0.18 | ) | |||||||||||||||||||||
2016 - Service | 17.33 | 0.09 | 1.49 | 1.58 | (0.03 | ) | — | (0.03 | ) | |||||||||||||||||||||
2016 - IR | 17.54 | 0.15 | 1.50 | 1.65 | (0.16 | ) | — | (0.16 | ) | |||||||||||||||||||||
2015 - A | 17.44 | 0.13 | (0.18 | ) | (0.05 | ) | (0.11 | ) | — | (0.11 | ) | |||||||||||||||||||
2015 - C | 16.67 | — | (e) | (0.18 | ) | (0.18 | ) | (0.01 | ) | — | (0.01 | ) | ||||||||||||||||||
2015 - Institutional | 17.69 | 0.20 | (0.18 | ) | 0.02 | (0.18 | ) | — | (0.18 | ) | ||||||||||||||||||||
2015 - Service | 17.53 | 0.12 | (0.19 | ) | (0.07 | ) | (0.13 | ) | — | (0.13 | ) | |||||||||||||||||||
2015 - IR | 17.70 | 0.18 | (0.18 | ) | — | (e) | (0.16 | ) | — | (0.16 | ) | |||||||||||||||||||
2014 - A | 15.45 | 0.09 | 1.97 | 2.06 | (0.07 | ) | — | (0.07 | ) | |||||||||||||||||||||
2014 - C | 14.82 | (0.04 | ) | 1.89 | 1.85 | — | — | — | ||||||||||||||||||||||
2014 - Institutional | 15.66 | 0.15 | 2.01 | 2.16 | (0.13 | ) | — | (0.13 | ) | |||||||||||||||||||||
2014 - Service | 15.49 | 0.04 | 2.00 | 2.04 | — | — | — | |||||||||||||||||||||||
2014 - IR | 15.68 | 0.13 | 2.00 | 2.13 | (0.11 | ) | — | (0.11 | ) | |||||||||||||||||||||
2013 - A | 11.38 | 0.11 | 4.22 | 4.33 | (0.08 | ) | (0.18 | ) | (0.26 | ) | ||||||||||||||||||||
2013 - C | 10.95 | — | (e) | 4.05 | 4.05 | — | (0.18 | ) | (0.18 | ) | ||||||||||||||||||||
2013 - Institutional | 11.54 | 0.16 | 4.28 | 4.44 | (0.14 | ) | (0.18 | ) | (0.32 | ) | ||||||||||||||||||||
2013 - Service | 11.46 | 0.12 | 4.22 | 4.34 | (0.13 | ) | (0.18 | ) | (0.31 | ) | ||||||||||||||||||||
2013 - IR | 11.55 | 0.14 | 4.29 | 4.43 | (0.12 | ) | (0.18 | ) | (0.30 | ) | ||||||||||||||||||||
2012 - A | 9.94 | 0.12 | 1.44 | (f) | 1.56 | (0.12 | ) | — | (0.12 | ) | ||||||||||||||||||||
2012 - C | 9.57 | 0.05 | 1.38 | (f) | 1.43 | (0.05 | ) | — | (0.05 | ) | ||||||||||||||||||||
2012 - Institutional | 10.08 | 0.18 | 1.46 | (f) | 1.64 | (0.18 | ) | — | (0.18 | ) | ||||||||||||||||||||
2012 - Service | 10.01 | 0.12 | 1.45 | (f) | 1.57 | (0.12 | ) | — | (0.12 | ) | ||||||||||||||||||||
2012 - IR | 10.09 | 0.16 | 1.46 | (f) | 1.62 | (0.16 | ) | — | (0.16 | ) | ||||||||||||||||||||
| (a) | Calculated based on the average shares outstanding methodology. |
| (b) | Assumes investment at the net asset value at the beginning of the period, reinvestment of all distributions, a complete redemption of the investment at the net asset value at the end of the period and no sales or redemption charges. Total returns would be reduced if a sales or redemption charge was taken into account. Returns do not reflect the impact of taxes to shareholders relating to Fund distributions or the redemption of Fund shares. Total returns for periods less than one full year are not annualized. |
| (c) | The Fund’s portfolio turnover rate is calculated in accordance with regulatory requirements, without regard to transactions involving short term investments and certain derivatives. If such transactions were included, the Fund’s portfolio turnover rate may be higher. |
| (d) | Annualized. |
| (e) | Amount is less than $0.005 per share. |
| (f) | Reflects payment from affiliate relating to certain investment transactions which amounted to $0.02 per share. Excluding such payment, the total return would have been 15.49%,14.68%,15.92%,15.36% and 15.80%, respectively. |
| 60 | The accompanying notes are an integral part of these financial statements. |
GOLDMAN SACHS U.S. TAX-MANAGED EQUITY FUND
| Net asset value, end of period | Total return(b) | Net assets, end of period (in 000s) | Ratio of net expenses to average net assets | Ratio of total expenses to average net assets | Ratio of net investment income (loss) to average net assets | Portfolio turnover rate(c) | ||||||||||||||||||||||||||||||||||
| $ | 20.26 | 8.05 | % | $ | 48,169 | 1.15 | %(d) | 1.16 | %(d) | 0.39 | %(d) | 45 | % | |||||||||||||||||||||||||||
| 19.22 | 7.61 | 22,051 | 1.90 | (d) | 1.91 | (d) | (0.35 | )(d) | 45 | |||||||||||||||||||||||||||||||
| 20.61 | 8.25 | 1,195,635 | 0.75 | (d) | 0.76 | (d) | 0.81 | (d) | 45 | |||||||||||||||||||||||||||||||
| 20.38 | 7.94 | 664 | 1.25 | (d) | 1.26 | (d) | 0.30 | (d) | 45 | |||||||||||||||||||||||||||||||
| 20.58 | 8.15 | 16,033 | 0.90 | (d) | 0.91 | (d) | 0.68 | (d) | 45 | |||||||||||||||||||||||||||||||
| 18.75 | 9.09 | 51,206 | 1.17 | 1.17 | 0.61 | 118 | ||||||||||||||||||||||||||||||||||
| 17.86 | 8.35 | 22,512 | 1.92 | 1.92 | (0.15 | ) | 118 | |||||||||||||||||||||||||||||||||
| 19.04 | 9.61 | 1,057,850 | 0.77 | 0.77 | 1.01 | 118 | ||||||||||||||||||||||||||||||||||
| 18.88 | 9.07 | 614 | 1.27 | 1.27 | 0.53 | 118 | ||||||||||||||||||||||||||||||||||
| 19.03 | 9.40 | 14,262 | 0.92 | 0.93 | 0.84 | 118 | ||||||||||||||||||||||||||||||||||
| 17.28 | (0.28 | ) | 57,913 | 1.17 | 1.17 | 0.73 | 96 | |||||||||||||||||||||||||||||||||
| 16.48 | (1.05 | ) | 22,194 | 1.92 | 1.92 | (0.02 | ) | 96 | ||||||||||||||||||||||||||||||||
| 17.53 | 0.10 | 957,273 | 0.77 | 0.77 | 1.12 | 96 | ||||||||||||||||||||||||||||||||||
| 17.33 | (0.41 | ) | 1,236 | 1.27 | 1.27 | 0.67 | 96 | |||||||||||||||||||||||||||||||||
| 17.54 | (0.03 | ) | 6,799 | 0.92 | 0.92 | 0.99 | 96 | |||||||||||||||||||||||||||||||||
| 17.44 | 13.32 | 51,253 | 1.18 | 1.19 | 0.52 | 57 | ||||||||||||||||||||||||||||||||||
| 16.67 | 12.48 | 15,750 | 1.93 | 1.94 | (0.22 | ) | 57 | |||||||||||||||||||||||||||||||||
| 17.69 | 13.78 | 735,421 | 0.78 | 0.79 | 0.93 | 57 | ||||||||||||||||||||||||||||||||||
| 17.53 | 13.17 | 58 | 1.28 | 1.29 | 0.25 | 57 | ||||||||||||||||||||||||||||||||||
| 17.70 | 13.57 | 4,175 | 0.93 | 0.94 | 0.78 | 57 | ||||||||||||||||||||||||||||||||||
| 15.45 | 38.17 | 34,792 | 1.15 | 1.21 | 0.80 | 95 | ||||||||||||||||||||||||||||||||||
| 14.82 | 37.07 | 10,648 | 1.90 | 1.96 | 0.04 | 95 | ||||||||||||||||||||||||||||||||||
| 15.66 | 38.73 | 493,729 | 0.75 | 0.81 | 1.17 | 95 | ||||||||||||||||||||||||||||||||||
| 15.49 | 38.08 | 411 | 1.27 | 1.29 | 0.81 | 95 | ||||||||||||||||||||||||||||||||||
| 15.68 | 38.48 | 843 | 0.91 | 0.96 | 1.02 | 95 | ||||||||||||||||||||||||||||||||||
| 11.38 | 15.69 | (f) | 35,890 | 1.09 | 1.23 | 1.13 | 184 | |||||||||||||||||||||||||||||||||
| 10.95 | 14.89 | (f) | 8,228 | 1.84 | 1.97 | 0.44 | 184 | |||||||||||||||||||||||||||||||||
| 11.54 | 16.12 | (f) | 304,435 | 0.69 | 0.82 | 1.65 | 184 | |||||||||||||||||||||||||||||||||
| 11.46 | 15.56 | (f) | 40 | 1.19 | 1.32 | 1.11 | 184 | |||||||||||||||||||||||||||||||||
| 11.55 | 16.01 | (f) | 476 | 0.84 | 0.97 | 1.42 | 184 | |||||||||||||||||||||||||||||||||
| The accompanying notes are an integral part of these financial statements. | 61 |
GOLDMAN SACHS INTERNATIONAL TAX-MANAGED EQUITY FUND
Financial Highlights
Selected Data for a Share Outstanding Throughout Each Period
| Income (loss) from investment operations | ||||||||||||||||||||||
| Year - Share Class | Net asset value, beginning of period | Net investment income(a) | Net realized and unrealized gain (loss) | Total from investment operations | Distributions to shareholders from net investment income | |||||||||||||||||
| FOR THE SIX MONTHS ENDED JUNE 30, (UNAUDITED) | ||||||||||||||||||||||
2017 - A | $ | 8.62 | $ | 0.10 | $ | 1.29 | $ | 1.39 | $ | — | ||||||||||||
2017 - C | 8.39 | 0.08 | 1.24 | 1.32 | — | |||||||||||||||||
2017 - Institutional | 8.54 | 0.13 | 1.27 | 1.40 | — | |||||||||||||||||
2017 - IR | 8.61 | 0.15 | 1.25 | 1.40 | — | |||||||||||||||||
| FOR THE FISCAL YEARS ENDED DECEMBER 31, | ||||||||||||||||||||||
2016 - A | 8.67 | 0.12 | (0.04 | ) | 0.08 | (0.13 | ) | |||||||||||||||
2016 - C | 8.45 | 0.06 | (0.05 | ) | 0.01 | (0.07 | ) | |||||||||||||||
2016 - Institutional | 8.59 | 0.16 | (0.05 | ) | 0.11 | (0.16 | ) | |||||||||||||||
2016 - IR | 8.65 | 0.15 | (0.05 | ) | 0.10 | (0.14 | ) | |||||||||||||||
2015 - A | 8.45 | 0.11 | 0.21 | 0.32 | (0.10 | ) | ||||||||||||||||
2015 - C | 8.27 | 0.02 | 0.23 | 0.25 | (0.07 | ) | ||||||||||||||||
2015 - Institutional | 8.36 | 0.15 | 0.21 | 0.36 | (0.13 | ) | ||||||||||||||||
2015 - IR | 8.43 | 0.07 | 0.27 | 0.34 | (0.12 | ) | ||||||||||||||||
2014 - A | 9.18 | 0.27 | (e) | (0.80 | ) | (0.53 | ) | (0.20 | ) | |||||||||||||
2014 - C | 9.03 | 0.15 | (e) | (0.74 | ) | (0.59 | ) | (0.17 | ) | |||||||||||||
2014 - Institutional | 9.10 | 0.28 | (e) | (0.77 | ) | (0.49 | ) | (0.25 | ) | |||||||||||||
2014 - IR | 9.17 | 0.29 | (e) | (0.80 | ) | (0.51 | ) | (0.23 | ) | |||||||||||||
2013 - A | 7.62 | 0.15 | 1.54 | 1.69 | (0.13 | )(f) | ||||||||||||||||
2013 - C | 7.55 | 0.10 | 1.51 | 1.61 | (0.13 | )(f) | ||||||||||||||||
2013 - Institutional | 7.59 | 0.19 | 1.53 | 1.72 | (0.21 | )(f) | ||||||||||||||||
2013 - IR | 7.66 | 0.20 | 1.51 | 1.71 | (0.20 | )(f) | ||||||||||||||||
2012 - A | 6.65 | 0.17 | 0.98 | 1.15 | (0.18 | ) | ||||||||||||||||
2012 - C | 6.64 | 0.11 | 0.96 | 1.07 | (0.16 | ) | ||||||||||||||||
2012 - Institutional | 6.64 | 0.19 | 0.98 | 1.17 | (0.22 | ) | ||||||||||||||||
2012 - IR | 6.64 | 0.35 | 0.82 | 1.17 | (0.15 | ) | ||||||||||||||||
| (a) | Calculated based on the average shares outstanding methodology. |
| (b) | Assumes investment at the net asset value at the beginning of the period, reinvestment of all distributions, a complete redemption of the investment at the net asset value at the end of the period and no sales or redemption charges. Total returns would be reduced if a sales or redemption charge was taken into account. Returns do not reflect the impact of taxes to shareholders relating to Fund distributions or the redemption of Fund shares. Total returns for periods less than one full year are not annualized. |
| (c) | The Fund’s portfolio turnover rate is calculated in accordance with regulatory requirements, without regard to transactions involving short term investments and certain derivatives. If such transactions were included, the Fund’s portfolio turnover rate may be higher. |
| (d) | Annualized. |
| (e) | Reflects income recognized from special dividends which amounted to $0.06 per share and 0.71% of average net assets. |
| (f) | Includes a distribution from capital of less than $0.01 per share. |
| 62 | The accompanying notes are an integral part of these financial statements. |
GOLDMAN SACHS INTERNATIONAL TAX-MANAGED EQUITY FUND
| Net asset value, end of period | Total return(b) | Net assets, end of period (in 000s) | Ratio of net expenses to average net assets | Ratio of total expenses to average net assets | Ratio of net investment income to average net assets | Portfolio turnover rate(c) | ||||||||||||||||||||||||||||||||||
| $ | 10.01 | 16.13 | % | $ | 4,988 | 1.35 | %(d) | 1.37 | %(d) | 2.20 | %(d) | 67 | % | |||||||||||||||||||||||||||
| 9.71 | 15.73 | 1,297 | 2.09 | (d) | 2.12 | (d) | 1.71 | (d) | 67 | |||||||||||||||||||||||||||||||
| 9.94 | 16.39 | 576,115 | 0.95 | (d) | 0.97 | (d) | 2.83 | (d) | 67 | |||||||||||||||||||||||||||||||
| 10.01 | 16.26 | 7,521 | 1.08 | (d) | 1.11 | (d) | 3.20 | (d) | 67 | |||||||||||||||||||||||||||||||
| 8.62 | 0.93 | 5,082 | 1.38 | 1.39 | 1.37 | 125 | ||||||||||||||||||||||||||||||||||
| 8.39 | 0.11 | 1,012 | 2.13 | 2.14 | 0.67 | 125 | ||||||||||||||||||||||||||||||||||
| 8.54 | 1.26 | 519,135 | 0.98 | 0.99 | 1.90 | 125 | ||||||||||||||||||||||||||||||||||
| 8.61 | 1.21 | 1,251 | 1.13 | 1.14 | 1.76 | 125 | ||||||||||||||||||||||||||||||||||
| 8.67 | 3.77 | 3,408 | 1.38 | 1.39 | 1.22 | 113 | ||||||||||||||||||||||||||||||||||
| 8.45 | 3.07 | 812 | 2.13 | 2.13 | 0.20 | 113 | ||||||||||||||||||||||||||||||||||
| 8.59 | 4.26 | 426,168 | 0.98 | 0.99 | 1.71 | 113 | ||||||||||||||||||||||||||||||||||
| 8.65 | 4.04 | 1,444 | 1.13 | 1.13 | 0.84 | 113 | ||||||||||||||||||||||||||||||||||
| 8.45 | (5.79 | ) | 2,151 | 1.38 | 1.42 | 2.98 | (e) | 106 | ||||||||||||||||||||||||||||||||
| 8.27 | (6.55 | ) | 181 | 2.13 | 2.17 | 1.71 | (e) | 106 | ||||||||||||||||||||||||||||||||
| 8.36 | (5.48 | ) | 316,062 | 0.98 | 1.02 | 3.12 | (e) | 106 | ||||||||||||||||||||||||||||||||
| 8.43 | (5.59 | ) | 205 | 1.13 | 1.17 | 3.12 | (e) | 106 | ||||||||||||||||||||||||||||||||
| 9.18 | 22.23 | 3,388 | 1.31 | 1.51 | 1.79 | 95 | ||||||||||||||||||||||||||||||||||
| 9.03 | 21.38 | 70 | 2.10 | 2.23 | 1.15 | 95 | ||||||||||||||||||||||||||||||||||
| 9.10 | 22.70 | 228,410 | 0.95 | 1.08 | 2.27 | 95 | ||||||||||||||||||||||||||||||||||
| 9.17 | 22.36 | 217 | 1.12 | 1.21 | 2.34 | 95 | ||||||||||||||||||||||||||||||||||
| 7.62 | 17.25 | 15,384 | 1.26 | 1.59 | 2.44 | 182 | ||||||||||||||||||||||||||||||||||
| 7.55 | 16.20 | 32 | 2.01 | 2.30 | 1.52 | 182 | ||||||||||||||||||||||||||||||||||
| 7.59 | 17.71 | 134,290 | 0.86 | 1.17 | 2.69 | 182 | ||||||||||||||||||||||||||||||||||
| 7.66 | 17.68 | 1 | 1.02 | 1.36 | 5.14 | 182 | ||||||||||||||||||||||||||||||||||
| The accompanying notes are an integral part of these financial statements. | 63 |
GOLDMAN SACHS TAX-ADVANTAGED EQUITY FUNDS
June 30, 2017 (Unaudited)
| 1. ORGANIZATION |
Goldman Sachs Trust (the “Trust”) is a Delaware statutory trust registered under the Investment Company Act of 1940, as amended (the “Act”), as an open-end management investment company. The following table lists those series of the Trust that are included in this report (collectively, the “Funds” or individually a “Fund”), along with their corresponding share classes and respective diversification status under the Act:
| Fund | Share Classes Offered | Diversified/ Non-diversified | ||
U.S. Equity Dividend and Premium, International Equity Dividend and Premium, International Tax-Managed Equity | A, C, Institutional and IR | Diversified | ||
U. S. Tax-Managed Equity | A, C, Institutional, Service and IR | Diversified |
Class A Shares are sold with a front-end sales charge of up to 5.50%. Class C Shares are sold with a contingent deferred sales charge (“CDSC”) of 1.00%, which is imposed on redemptions made within 12 months of purchase. Institutional, Service and Class IR Shares are not subject to a sales charge.
Goldman Sachs Asset Management, L.P. (“GSAM”), an affiliate of Goldman Sachs & Co. LLC (formerly Goldman, Sachs & Co.) (“Goldman Sachs”), serves as investment adviser to the Funds pursuant to a management agreement (the “Agreement”) with the Trust.
| 2. SIGNIFICANT ACCOUNTING POLICIES |
The financial statements have been prepared in accordance with accounting principles generally accepted in the United States of America (“GAAP”) and require management to make estimates and assumptions that may affect the reported amounts and disclosures. Actual results may differ from those estimates and assumptions.
A. Investment Valuation — The Funds’ valuation policy is to value investments at fair value.
B. Investment Income and Investments — Investment income includes interest income, dividend income and securities lending income. Interest income is accrued daily and adjusted for amortization of premiums and accretion of discounts. Dividend income is recognized on ex-dividend date or, for certain foreign securities, as soon as such information is obtained subsequent to the ex-dividend date. Investment transactions are reflected on trade date. Realized gains and losses are calculated using identified cost. Investment transactions are recorded on the following business day for daily net asset value (“NAV”) calculations. Investment income is recorded net of any foreign withholding taxes, less any amounts reclaimable. The Funds may file withholding tax reclaims in certain jurisdictions to recover a portion of amounts previously withheld. Any foreign capital gains tax is accrued daily based upon net unrealized gains, and is payable upon sale of such investments. Distributions received from the Funds’ investments in United States (“U.S.”) real estate investment trusts (“REITs”) may be characterized as ordinary income, net capital gain or a return of capital. A return of capital is recorded by the Funds as a reduction to the cost basis of the REIT.
For derivative contracts, realized gains and losses are recorded upon settlement of the contract.
C. Class Allocations and Expenses — Investment income, realized and unrealized gain (loss), and non-class specific expenses of each Fund are allocated daily based upon the proportion of net assets of each class. Non-class specific expenses directly incurred by a Fund are charged to that Fund, while such expenses incurred by the Trust are allocated across the applicable Funds on a straight-line and/or pro-rata basis depending upon the nature of the expenses. Class specific expenses, where applicable, are borne by the respective share classes and include Distribution and Service, Transfer Agency and Service and Shareholder Administration fees.
D. Federal Taxes and Distributions to Shareholders — It is each Fund’s policy to comply with the requirements of the Internal Revenue Code of 1986, as amended (the “Code”), applicable to regulated investment companies (mutual funds) and to distribute each year substantially all of its investment company taxable income and capital gains to its shareholders. Accordingly,
64
GOLDMAN SACHS TAX-ADVANTAGED EQUITY FUNDS
| 2. SIGNIFICANT ACCOUNTING POLICIES (continued) |
each Fund is not required to make any provisions for the payment of federal income tax. Distributions to shareholders are recorded on the ex-dividend date. Income and capital gains distributions, if any, are declared and paid according to the following schedule:
| Fund | Income Distributions Declared/Paid | Capital Gains Distributions Declared/Paid | ||||
U.S. Equity Dividend and Premium International Equity Dividend and Premium | Quarterly | Annually | ||||
U.S. Tax-Managed Equity International Tax-Managed Equity | Annually | Annually |
Net capital losses, if any, are carried forward to future fiscal years and may be used to the extent allowed by the Code to offset any future capital gains. Losses that are carried forward will retain their character as either short-term or long-term capital losses. Utilization of capital loss carryforwards will reduce the requirement of future capital gains distributions.
The characterization of distributions to shareholders for financial reporting purposes is determined in accordance with federal income tax rules, which may differ from GAAP. The source of each Fund’s distributions may be shown in the accompanying financial statements as either from net investment income, net realized gain or capital. Certain components of the Funds’ net assets on the Statements of Assets and Liabilities reflect permanent GAAP/tax differences based on the appropriate tax character.
E. Foreign Currency Translation — The accounting records and reporting currency of a Fund are maintained in U.S. dollars. Assets and liabilities denominated in foreign currencies are translated into U.S. dollars using the current exchange rates at the close of each business day. The effect of changes in foreign currency exchange rates on investments is included within net realized and unrealized gain (loss) on investments. Changes in the value of other assets and liabilities as a result of fluctuations in foreign exchange rates are included in the Statements of Operations within net change in unrealized gain (loss) on foreign currency translations. Transactions denominated in foreign currencies are translated into U.S. dollars on the date the transaction occurred, the effects of which are included within net realized gain (loss) on foreign currency transactions.
| 3. INVESTMENTS AND FAIR VALUE MEASUREMENTS |
U.S. GAAP defines the fair value of a financial instrument as the amount that would be received to sell an asset or paid to transfer a liability in an orderly transaction between market participants at the measurement date (i.e., the exit price); the Funds’ policy is to use the market approach. GAAP establishes a fair value hierarchy that prioritizes the inputs to valuation techniques used to measure fair value. The hierarchy gives the highest priority to unadjusted quoted prices in active markets for identical assets or liabilities (Level 1 measurements) and the lowest priority to unobservable inputs (Level 3 measurements). The levels used for classifying investments are not necessarily an indication of the risk associated with investing in these investments. The three levels of the fair value hierarchy are described below:
Level 1 — Unadjusted quoted prices in active markets that are accessible at the measurement date for identical, unrestricted assets or liabilities;
Level 2 — Quoted prices in markets that are not active or financial instruments for which significant inputs are observable (including, but not limited to, quoted prices for similar investments, interest rates, foreign exchange rates, volatility and credit spreads), either directly or indirectly;
Level 3 — Prices or valuations that require significant unobservable inputs (including GSAM’s assumptions in determining fair value measurement).
Changes in valuation techniques may result in transfers into or out of an assigned level within the hierarchy. In accordance with the Funds’ policy, transfers between different levels of the fair value hierarchy resulting from such changes are deemed to have occurred as of the beginning of the reporting period.
65
GOLDMAN SACHS TAX-ADVANTAGED EQUITY FUNDS
Notes to Financial Statements (continued)
June 30, 2017 (Unaudited)
| 3. INVESTMENTS AND FAIR VALUE MEASUREMENTS (continued) |
The Board of Trustees (“Trustees”) has approved Valuation Procedures that govern the valuation of the portfolio investments held by the Funds, including investments for which market quotations are not readily available. The Trustees have delegated to GSAM day-to-day responsibility for implementing and maintaining internal controls and procedures related to the valuation of the Funds’ portfolio investments. To assess the continuing appropriateness of pricing sources and methodologies, GSAM regularly performs price verification procedures and issues challenges as necessary to third party pricing vendors or brokers, and any differences are reviewed in accordance with the Valuation Procedures.
A. Level 1 and Level 2 Fair Value Investments — The valuation techniques and significant inputs used in determining the fair values for investments classified as Level 1 and Level 2 are as follows:
Equity Securities — Equity securities traded on a U.S. securities exchange or the NASDAQ system, or those located on certain foreign exchanges, including but not limited to the Americas, are valued daily at their last sale price or official closing price on the principal exchange or system on which they are traded. If there is no sale or official closing price or such price is believed by GSAM to not represent fair value, equity securities are valued at the last bid price for long positions and at the last ask price for short positions. To the extent these investments are actively traded, they are classified as Level 1 of the fair value hierarchy, otherwise they are generally classified as Level 2.
Unlisted equity securities for which market quotations are available are valued at the last sale price on the valuation date, or if no sale occurs, at the last bid price. Securities traded on certain foreign securities exchanges are valued daily at fair value determined by an independent fair value service (if available) under Valuation Procedures approved by the Trustees and consistent with applicable regulatory guidance. The independent fair value service takes into account multiple factors including, but not limited to, movements in the securities markets, certain depositary receipts, futures contracts and foreign currency exchange rates that have occurred subsequent to the close of the foreign securities exchange. These investments are generally classified as Level 2 of the fair value hierarchy.
Money Market Funds — Investments in the Goldman Sachs Financial Square Government Fund (“Underlying Fund”) are valued at the NAV of the Institutional Share class on the day of valuation. These investments are generally classified as Level 1 of the fair value hierarchy. For information regarding an Underlying Fund’s accounting policies and investment holdings, please see the Underlying Fund’s shareholder report.
Derivative Contracts — A derivative is an instrument whose value is derived from underlying assets, indices, reference rates or a combination of these factors. A Fund enters into derivative transactions to hedge against changes in interest rates, securities prices, and/or currency exchange rates, to increase total return, or to gain access to certain markets or attain exposure to other underliers.
Exchange-traded derivatives, including futures and options contracts, are valued at the last sale or settlement price and typically fall within Level 1 of the fair value hierarchy. Over-the-counter (“OTC”) and centrally cleared derivatives are valued using market transactions and other market evidence, including market-based inputs to models, calibration to market-clearing transactions, broker or dealer quotations, or other alternative pricing sources. Where models are used, the selection of a particular model to value OTC and centrally cleared derivatives depends upon the contractual terms of, and specific risks inherent in, the instrument, as well as the availability of pricing information in the market. Valuation models require a variety of inputs, including contractual terms, market prices, yield curves, credit curves, measures of volatility, voluntary and involuntary prepayment rates, loss severity rates and correlations of such inputs. For OTC and centrally cleared derivatives that trade in liquid markets, model inputs can generally be verified and model selection does not involve significant management judgment. OTC and centrally cleared derivatives are classified within Level 2 of the fair value hierarchy when significant inputs are corroborated by market evidence.
i. Futures Contracts — Futures contracts are contracts to buy or sell a standardized quantity of a specified commodity or security and are valued based on exchanged settlement prices or independent market quotes. Futures contracts are valued at the last settlement price, or in the absence of a sale, the last bid price for long positions and at the last ask price for short positions, at the end of each day on the board of trade or exchange upon which they are traded. Upon entering into a futures contract, a Fund deposits cash or securities in an account on behalf of the broker in an amount sufficient to meet the initial
66
GOLDMAN SACHS TAX-ADVANTAGED EQUITY FUNDS
| 3. INVESTMENTS AND FAIR VALUE MEASUREMENTS (continued) |
margin requirement. Subsequent payments are made or received by a Fund equal to the daily change in the contract value and are recorded as variation margin receivable or payable with a corresponding offset to unrealized gains or losses. For financial reporting purposes, cash collateral that has been pledged to cover obligations of the Funds and cash collateral received, if any, is reported separately on the Statements of Assets and Liabilities as receivables/payables for collateral on certain derivative contracts. Non-cash collateral pledged by the Funds, if any, is noted in the Schedules of Investments.
ii. Options — When a Fund writes call or put options, an amount equal to the premium received is recorded as a liability and is subsequently marked-to-market to reflect the current value of the option written. Swaptions are options on interest rate swap contracts.
Upon the purchase of a call option or a put option by a Fund, the premium paid is recorded as an investment and subsequently marked-to-market to reflect the current value of the option. Certain options may be purchased with premiums to be determined on a future date. The premiums for these options are based upon implied volatility parameters at specified terms.
B. Level 3 Fair Value Investments — To the extent that significant inputs to valuation models and other alternative pricing sources are unobservable, or if quotations are not readily available, or if GSAM believes that such quotations do not accurately reflect fair value, the fair value of a Fund’s investments may be determined under Valuation Procedures approved by the Trustees. GSAM, consistent with its procedures and applicable regulatory guidance, may make an adjustment to the most recent valuation prices of either domestic or foreign securities in light of significant events to reflect what it believes to be the fair value of the securities at the time of determining a Fund’s NAV. Significant events which could affect a large number of securities in a particular market may include, but are not limited to: significant fluctuations in U.S. or foreign markets; market dislocations; market disruptions; or unscheduled market closings. Significant events which could also affect a single issuer may include, but are not limited to: corporate actions such as reorganizations, mergers and buy-outs; ratings downgrades; and bankruptcies.
C. Fair Value Hierarchy — The following is a summary of the Funds’ investments and derivatives classified in the fair value hierarchy as of June 30, 2017:
| U.S. EQUITY DIVIDEND AND PREMIUM | ||||||||||||
| Investment Type | Level 1 | Level 2 | Level 3 | |||||||||
| Assets | ||||||||||||
Common Stock and/or Other Equity Investments(a) | ||||||||||||
Africa | $ | 229,478 | $ | — | $ | — | ||||||
Europe | 317,226 | — | — | |||||||||
North America | 3,198,851,337 | — | — | |||||||||
South America | 1,675,377 | — | — | |||||||||
Investment Company | 52,404 | — | — | |||||||||
Securities Lending Reinvestment Vehicle | 2,925,000 | — | — | |||||||||
| Total | $ | 3,204,050,822 | $ | — | $ | — | ||||||
| Derivative Type | ||||||||||||
| Liabilities | ||||||||||||
Futures Contracts(b) | $ | (107,127 | ) | $ | — | $ | — | |||||
Written Options | (20,220,760 | ) | — | — | ||||||||
| Total | $ | (20,327,887 | ) | $ | — | $ | — | |||||
67
GOLDMAN SACHS TAX-ADVANTAGED EQUITY FUNDS
Notes to Financial Statements (continued)
June 30, 2017 (Unaudited)
| 3. INVESTMENTS AND FAIR VALUE MEASUREMENTS (continued) |
INTERNATIONAL EQUITY DIVIDEND AND PREMIUM | ||||||||||||
| Investment Type | Level 1 | Level 2 | Level 3 | |||||||||
| Assets | ||||||||||||
Common Stock and/or Other Equity Investments(a) | ||||||||||||
Asia | $ | 727,086 | $ | 105,271,392 | $ | — | ||||||
Australia and Oceania | — | 34,622,526 | — | |||||||||
Europe | 22,343,641 | 223,754,434 | — | |||||||||
North America | — | 125,705 | — | |||||||||
Investment Company | 197 | — | — | |||||||||
Securities Lending Reinvestment Vehicle | 136,800 | — | — | |||||||||
| Total | $ | 23,207,724 | $ | 363,774,057 | $ | — | ||||||
| Derivative Type | ||||||||||||
| Assets(b) | ||||||||||||
Futures Contracts | $ | 4,667 | $ | — | $ | — | ||||||
| Liabilities | ||||||||||||
Futures Contracts(b) | $ | (99,608 | ) | $ | — | $ | — | |||||
Written Options | (2,323,915 | ) | — | — | ||||||||
| Total | $ | (2,423,523 | ) | $ | — | $ | — | |||||
| U.S. TAX-MANAGED EQUITY | ||||||||||||
| Investment Type | Level 1 | Level 2 | Level 3 | |||||||||
| Assets | ||||||||||||
Common Stock and/or Other Equity Investments(a) | ||||||||||||
Europe | $ | 2,028,074 | $ | — | $ | — | ||||||
North America | 1,258,808,003 | 32,766 | — | |||||||||
Investment Company | 1,409,490 | — | — | |||||||||
Securities Lending Reinvestment Vehicle | 1,186,925 | — | — | |||||||||
| Total | $ | 1,263,432,492 | $ | 32,766 | $ | — | ||||||
| Derivative Type | ||||||||||||
| Liability(b) | ||||||||||||
Futures Contracts | $ | (45,004 | ) | $ | — | $ | — | |||||
68
GOLDMAN SACHS TAX-ADVANTAGED EQUITY FUNDS
| 3. INVESTMENTS AND FAIR VALUE MEASUREMENTS (continued) |
INTERNATIONAL TAX-MANAGED EQUITY | ||||||||||||
| Investment Type | Level 1 | Level 2 | Level 3 | |||||||||
| Assets | ||||||||||||
Common Stock and/or Other Equity Investments(a) | ||||||||||||
Africa | $ | — | $ | 3,919,448 | $ | — | ||||||
Asia | — | 177,422,631 | — | |||||||||
Australia and Oceania | — | 53,465,469 | — | |||||||||
Europe | 15,075,836 | 315,411,204 | — | |||||||||
North America | 4,250,855 | 273,662 | — | |||||||||
Investment Company | 1,310 | — | — | |||||||||
Securities Lending Reinvestment Vehicle | 3,216,000 | — | — | |||||||||
| Total | $ | 22,544,001 | $ | 550,492,414 | $ | — | ||||||
| Derivative Type | ||||||||||||
| Asset(b) | ||||||||||||
Futures Contracts | $ | 12,950 | $ | — | $ | — | ||||||
| Liability(b) | ||||||||||||
Futures Contracts | $ | (256,737 | ) | $ | — | $ | — | |||||
| (a) | Amounts are disclosed by continent to highlight the impact of time zone differences between local market close and the calculation of NAV. Security valuations are based on the principal exchange or system on which they are traded, which may differ from country of domicile noted in the table. The Funds utilize fair value model prices provided by an independent fair value service for international equities securities, resulting in a Level 2 classification. |
| (b) | Amount shown represents unrealized gain (loss) at period end. |
For further information regarding security characteristics, see the Schedules of Investments.
| 4. INVESTMENTS IN DERIVATIVES |
The following table sets forth, by certain risk types, the gross value of derivative contracts as of June 30, 2017. These instruments were used as part of the Funds’ investment strategies and to obtain and/or manage exposure related to the risks below. The values in the tables below exclude the effects of cash collateral received or posted pursuant to these derivative contracts, and therefore are not representative of the Funds’ net exposure.
| Fund | Risk | Statements of Assets and Liabilities | Assets | Statements of Assets and Liabilities | Liabilities | |||||||||
U.S. Equity Dividend and Premium | Equity | — | $ | — | Variation margin on certain derivative contracts, Payable for written options at value | $ | (20,327,887) | (a) | ||||||
International Equity Dividend and Premium | Equity | Variation margin on certain derivative contracts | 4,667 | (a) | Variation margin on certain derivative contracts, Payable for written options at value | (2,423,523) | (a) | |||||||
U.S. Tax-Managed Equity | Equity | — | — | Variation margin on certain derivative contracts | (45,004) | (a) | ||||||||
International Tax-Managed Equity | Equity | Variation margin on certain derivative contracts | 12,950 | (a) | Variation margin on certain derivative contracts | (256,737) | (a) | |||||||
| (a) | Includes unrealized gain (loss) on futures contracts described in the Additional Investment Information sections of the Schedules of Investments. Only variation margin as of June 30, 2017 is reported within the Statements of Assets and Liabilities. |
69
GOLDMAN SACHS TAX-ADVANTAGED EQUITY FUNDS
Notes to Financial Statements (continued)
June 30, 2017 (Unaudited)
| 4. INVESTMENTS IN DERIVATIVES (continued) |
The following table sets forth, by certain risk types, the Funds’ gains (losses) related to these derivatives and their indicative volumes for the six months ended June 30, 2017. These gains (losses) should be considered in the context that these derivative contracts may have been executed to create investment opportunities and/or economically hedge certain investments, and accordingly, certain gains (losses) on such derivative contracts may offset certain (losses) gains attributable to investments. These gains (losses) are included in “Net realized gain (loss)” or “Net change in unrealized gain (loss)” on the Statements of Operations:
| Fund | Risk | Statements of Operations | Net Realized Gain (Loss) | Net Change in Unrealized Gain (Loss) | Average Number of Contracts(a) | |||||||||||
U.S. Equity Dividend and Premium | Equity | Net realized gain (loss) from futures contracts and written options/Net change in unrealized gain (loss) on futures contracts and written options | $ | (36,679,348 | ) | $ | 9,452,954 | 5,205 | ||||||||
International Equity Dividend and Premium | Equity | Net realized gain (loss) from futures contracts, investments and written options/Net change in unrealized gain (loss) on futures contracts and written options | (1,521,910 | ) | 1,811,587 | 2,603 | ||||||||||
U.S. Tax-Managed Equity | Equity | Net realized gain (loss) from futures contracts/Net change in unrealized gain (loss) on futures contracts | 1,684,652 | (68,764 | ) | 157 | ||||||||||
International Tax-Managed Equity | Equity | Net realized gain (loss) from futures contracts/Net change in unrealized gain (loss) on futures contracts | 1,068,140 | (234,688 | ) | 162 | ||||||||||
| (a) | Average number of contracts is based on the average of month end balances for the six months ended June 30, 2017. |
| 5. AGREEMENTS AND AFFILIATED TRANSACTIONS |
A. Management Agreement — Under the Agreement, GSAM manages the Funds, subject to the general supervision of the Trustees.
As compensation for the services rendered pursuant to the Agreement, the assumption of the expenses related thereto and administration of the Funds’ business affairs, including providing facilities, GSAM is entitled to a management fee, accrued daily and paid monthly, equal to an annual percentage rate of each Fund’s average daily net assets.
For the six months ended June 30, 2017, contractual and effective net management fees with GSAM were at the following rates:
| Contractual Management Rate | Effective Net Management Rate^ | |||||||||||||||||||||||||||||
| Fund | First $1 billion | Next $1 billion | Next $3 billion | Next $3 billion | Over $8 billion | Effective Rate | ||||||||||||||||||||||||
U.S. Equity Dividend and Premium | 0.75 | % | 0.68 | % | 0.65 | % | 0.64 | % | 0.63 | % | 0.69 | % | 0.69 | % | ||||||||||||||||
International Equity Dividend and Premium | 0.81 | 0.73 | 0.69 | 0.68 | 0.67 | 0.81 | 0.81 | |||||||||||||||||||||||
U.S. Tax-Managed Equity | 0.70 | 0.63 | 0.60 | 0.59 | 0.58 | 0.69 | 0.69 | |||||||||||||||||||||||
International Tax-Managed Equity | 0.85 | 0.77 | 0.73 | 0.72 | 0.71 | 0.85 | 0.85 | |||||||||||||||||||||||
| ^ | Effective Net Management Rate includes the impact of management fee waivers of affiliated Underlying Funds, if any. |
70
GOLDMAN SACHS TAX-ADVANTAGED EQUITY FUNDS
| 5. AGREEMENTS AND AFFILIATED TRANSACTIONS (continued) |
The Funds invest in Institutional Shares of the Goldman Sachs Financial Square Government Fund, which is an affiliated Underlying Fund. GSAM has agreed to waive a portion of its management fee payable by the Funds in an amount equal to the management fee it earns as an investment adviser to any of the affiliated Underlying Funds in which the Funds invest. For the six months ended June 30, 2017, GSAM waived $51,707, $1,633, $10,957 and $2,233 of the Funds’ management fees, respectively.
B. Distribution and/or Service (12b-1) Plans — The Trust, on behalf of Class A Shares of each Fund, has adopted a Distribution and Service Plan subject to Rule 12b-1 under the Act. Under the Distribution and Service Plan, Goldman Sachs, which serves as distributor (the “Distributor”), is entitled to a fee accrued daily and paid monthly, for distribution services and personal and account maintenance services, which may then be paid by Goldman Sachs to authorized dealers. These fees are equal to an annual percentage rate of the average daily net assets attributable to Class A Shares of the Funds, as set forth below.
The Trust, on behalf of Class C Shares of each applicable Fund, has adopted a Distribution Plan subject to Rule 12b-1 under the Act. Under the Distribution Plan, Goldman Sachs as Distributor is entitled to a fee accrued daily and paid monthly for distribution services, which may then be paid by Goldman Sachs to authorized dealers. These fees are equal to an annual percentage rate of the average daily net assets attributable to Class C Shares of the Funds, as set forth below.
The Trust, on behalf of Service Shares of each applicable Fund, has adopted a Service Plan subject to Rule 12b-1 under the Act to allow Service Shares to compensate service organizations (including Goldman Sachs) for providing personal and account maintenance services to their customers who are beneficial owners of such shares. The Service Plan provides for compensation to the service organizations equal to an annual percentage rate of the average daily net assets attributable to Service Shares of the Funds, as set forth below.
| Distribution and Service Plan Rates | ||||||||||||
| Class A* | Class C | Service | ||||||||||
Distribution Plan | 0.25 | % | 0.75 | % | — | % | ||||||
Service Plan | — | — | 0.25 | |||||||||
| * | With respect to Class A Shares, the Distributor at its discretion may use compensation for distribution services paid under the Distribution Plan to compensate service organizations for personal and account maintenance services and expenses as long as such total compensation does not exceed the maximum cap on “service fees” imposed by the Financial Industry Regulatory Authority. |
C. Distribution Agreement — Goldman Sachs, as Distributor of the shares of the Funds pursuant to a Distribution Agreement, may retain a portion of the Class A Shares’ front end sales charge and Class C Shares’ CDSC. During the six months ended June 30, 2017, Goldman Sachs advised that it retained front end sales charges of $73,961, $153, $1,046, and $1,484 for the U.S. Equity Dividend and Premium, International Equity Dividend and Premium, U.S. Tax-Managed Equity and International Tax-Managed Equity Funds, respectively.
D. Service and/or Shareholder Administration Plans — The Trust, on behalf of each applicable Fund, has adopted Service and/or Shareholder Administration Plans to allow Class C and Service Shares, respectively, to compensate service organizations (including Goldman Sachs) for providing varying levels of personal and account maintenance and/or shareholder administration services to their customers who are beneficial owners of such shares. The Service and/or Shareholder Administration Plans each provide for compensation to the service organizations equal to 0.25% of the average daily net assets attributable to Class C or Service Shares of the Funds, respectively.
E. Transfer Agency Agreement — Goldman Sachs also serves as the transfer agent of the Funds for a fee pursuant to the Transfer Agency Agreement. The fees charged for such transfer agency services are accrued daily and paid monthly at annual rates as follows: 0.19% of the average daily net assets of Class A, Class C and Class IR Shares; and 0.04% of the average daily net assets of Institutional and Service Shares. Effective July 28, 2017, the annual rates were amended for Class A, Class C, Class IR and Class R Shares to 0.18% of average daily net assets. Goldman Sachs has agreed to waive a portion of its transfer agency fee equal to 0.01% as an annual percentage rate of the average daily net assets attributable to Class A, Class C and Class IR Shares of
71
GOLDMAN SACHS TAX-ADVANTAGED EQUITY FUNDS
Notes to Financial Statements (continued)
June 30, 2017 (Unaudited)
| 5. AGREEMENTS AND AFFILIATED TRANSACTIONS (continued) |
the U.S. Equity Dividend and Premium Fund. This arrangement will remain in effect through at least April 28, 2018, and prior to such date, Goldman Sachs may not terminate the arrangement without the approval of the Trustees.
F. Other Expense Agreements and Affiliated Transactions — GSAM has agreed to limit certain “Other Expenses” of the Funds (excluding acquired fund fees and expenses, transfer agency fees and expenses, service fees and shareholder administration fees (as applicable), taxes, interest, brokerage fees, shareholder meeting, litigation, indemnification and extraordinary expenses) to the extent such expenses exceed, on an annual basis, a percentage rate of the average daily net assets of each Fund. Such Other Expense reimbursements, if any, are accrued daily and paid monthly. In addition, the Funds are not obligated to reimburse GSAM for prior fiscal year expense reimbursements, if any. The Other Expense limitations as an annual percentage rate of average daily net assets for the U.S. Equity Dividend and Premium, International Equity Dividend and Premium, U.S. Tax-Managed Equity and International Tax-Managed Equity Funds are 0.014%, 0.124%, 0.044% and 0.014%, respectively. Prior to April 28, 2017, the Other Expense limitation was 0.094% for the International Tax-Managed Equity Fund. These Other Expense limitations will remain in place through at least April 28, 2018, and prior to such date GSAM may not terminate the arrangements without the approval of the Trustees. In addition, the Funds have entered into certain offset arrangements with the custodian and the transfer agent, which may result in a reduction of the Funds’ expenses and are received irrespective of the application of the “Other Expense” limitations described above.
For the six months ended June 30, 2017, these expense reductions, including any fee waivers and Other Expense reimbursements, were as follows:
| Fund | Management Fee Waiver | Other Expense Reimbursement | Custody Fee Credits | Transfer Agency Fee Waiver | Total Expense Reductions | |||||||||||||||||
U.S. Equity Dividend and Premium | $ | 51,707 | $ | 165,068 | $ | 14,758 | $ | 14,520 | $ | 246,053 | ||||||||||||
International Equity Dividend and Premium | 1,633 | — | 1,249 | — | 2,882 | |||||||||||||||||
U.S. Tax-Managed Equity | 10,957 | — | 4,944 | — | 15,901 | |||||||||||||||||
International Tax-Managed Equity | 2,233 | 54,981 | 2,134 | — | 59,348 | |||||||||||||||||
G. Line of Credit Facility — As of June 30, 2017, the Funds participated in a $1,100,000,000 committed, unsecured revolving line of credit facility (the “facility”) together with other funds of the Trust and certain registered investment companies having management agreements with GSAM or its affiliates . This facility is to be used for temporary emergency purposes, or to allow for an orderly liquidation of securities to meet redemption requests. The interest rate on borrowings is based on the federal funds rate. The facility also requires a fee to be paid by the Funds based on the amount of the commitment that has not been utilized. For the six months ended June 30, 2017, the Funds did not have any borrowings under the facility.
H. Other Transactions with Affiliates — For the six months ended June 30, 2017, Goldman Sachs earned $914 and $1,969 in brokerage commissions from portfolio transactions, including futures transactions executed with Goldman Sachs as the Futures Commission Merchant, on behalf of the International Equity Dividend and Premium and International Tax-Managed Equity Funds, respectively.
72
GOLDMAN SACHS TAX-ADVANTAGED EQUITY FUNDS
| 5. AGREEMENTS AND AFFILIATED TRANSACTIONS (continued) |
The following table provides information about the Funds’ investment in the Goldman Sachs Financial Square Government Fund as of and for the six months ended June 30, 2017:
| Fund | Market Value | Purchases at Cost | Proceeds from Sales | Market Value 6/30/17 | Dividend Income | |||||||||||||||||
U.S. Equity Dividend and Premium | $ | 67,791,499 | $ | 452,500,464 | $ | (520,239,559 | ) | $ | 52,404 | $ | 187,885 | |||||||||||
International Equity Dividend and Premium | — | 20,191,911 | (20,191,714 | ) | 197 | 4,912 | ||||||||||||||||
U.S. Tax-Managed Equity | — | 99,138,510 | (97,729,020 | ) | 1,409,490 | 39,794 | ||||||||||||||||
International Tax-Managed Equity | 256 | 78,465,075 | (78,464,021 | ) | 1,310 | 7,809 | ||||||||||||||||
As of June 30, 2017, the following Goldman Sachs Fund of Funds Portfolios were beneficial owners of 5% or more of total outstanding shares of the following Funds:
| Fund | Goldman Sachs Enhanced Dividend Global Equity Portfolio | Goldman Sachs Tax-Advantaged Global Equity Portfolio | ||||||||
U.S. Equity Dividend and Premium | 8 | % | — | % | ||||||
International Equity Dividend and Premium | 39 | — | ||||||||
U.S. Tax-Managed Equity | — | 85 | ||||||||
International Tax-Managed Equity | — | 88 | ||||||||
| 6. PORTFOLIO SECURITIES TRANSACTIONS |
The cost of purchases and proceeds from sales and maturities of long-term securities for the six months ended June 30, 2017, were as follows:
| Fund | Purchases | Sales | ||||||||
U.S. Equity Dividend and Premium | $ | 920,007,018 | $ | 469,441,478 | ||||||
International Equity Dividend and Premium | 68,296,958 | 33,352,487 | ||||||||
U.S. Tax-Managed Equity | 591,658,161 | 538,033,192 | ||||||||
International Tax-Managed Equity | 361,703,738 | 355,465,817 | ||||||||
| 7. SECURITIES LENDING |
Pursuant to exemptive relief granted by the Securities and Exchange Commission (“SEC”) and the terms and conditions contained therein, the Funds may lend their securities through a securities lending agent, Goldman Sachs Agency Lending (“GSAL”), a wholly-owned subsidiary of Goldman Sachs, to certain qualified borrowers including Goldman Sachs and affiliates. In accordance with the Funds’ securities lending procedures, the Funds receive cash collateral at least equal to the market value of the securities on loan. The market value of the loaned securities is determined at the close of business of the Funds, at their last sale price or official closing price on the principal exchange or system on which they are traded, and any additional required collateral is
73
GOLDMAN SACHS TAX-ADVANTAGED EQUITY FUNDS
Notes to Financial Statements (continued)
June 30, 2017 (Unaudited)
| 7. SECURITIES LENDING (continued) |
delivered to the Funds on the next business day. As with other extensions of credit, the Funds may experience delay in the recovery of their securities or incur a loss should the borrower of the securities breach its agreement with the Funds or become insolvent at a time when the collateral is insufficient to cover the cost of repurchasing securities on loan. Dividend income received from securities on loan may not be subject to withholding taxes and therefore withholding taxes paid may differ from the amounts listed in the Statements of Operations. Loans of securities are terminable at any time and as such 1) the remaining contractual maturities of the outstanding securities lending transactions are considered to be overnight and continuous and 2) the borrower, after notice, is required to return borrowed securities within the standard time period for settlement of securities transactions.
The Funds invest the cash collateral received in connection with securities lending transactions in the Goldman Sachs Financial Square Government Fund (“Government Money Market Fund”), an affiliated series of the Trust. The Government Money Market Fund is registered under the Act as an open end investment company, is subject to Rule 2a-7 under the Act, and is managed by GSAM, for which GSAM may receive a management fee of up to 0.205% on an annualized basis of the average daily net assets of the Government Money Market Fund.
In the event of a default by a borrower with respect to any loan, GSAL will exercise any and all remedies provided under the applicable borrower agreement to make the Funds whole. These remedies include purchasing replacement securities by applying the collateral held from the defaulting broker against the purchase cost of the replacement securities. If GSAL is unable to purchase replacement securities, GSAL will indemnify the Funds by paying the Funds an amount equal to the market value of the securities loaned minus the value of cash collateral received from the borrower for the loan, subject to an exclusion for any shortfalls resulting from a loss of value in such cash collateral due to reinvestment risk. The amounts of the Funds’ overnight and continuous agreements represent the gross amounts of recognized liabilities for securities lending transactions outstanding as of June 30, 2017 are disclosed as “Payable upon return of securities loaned” on the Statements of Assets and Liabilities.
Each of the Funds and GSAL received compensation relating to the lending of the Funds’ securities. The amounts earned, if any, by the Funds for the six months ended June 30, 2017, are reported under Investment Income on the Statements of Operations.
The table below details securities lending activity with affiliates of Goldman Sachs:
| For the Six Months ended June 30, 2017 | Amounts Payable to Goldman Sachs Upon Return of Securities Loaned as of June 30, 2017 | |||||||||||||
| Fund | Earnings of GSAL Relating to Securities Loaned | Amounts Received from Lending to | ||||||||||||
U.S. Equity Dividend and Premium | $ | 807 | $ | 1,446 | $ | — | ||||||||
International Equity Dividend and Premium | 2,598 | 103 | 136,800 | |||||||||||
U.S. Tax-Managed Equity | 324 | 782 | 131,150 | |||||||||||
International Tax-Managed Equity | 1,338 | 133 | — | |||||||||||
74
GOLDMAN SACHS TAX-ADVANTAGED EQUITY FUNDS
| 7. SECURITIES LENDING (continued) |
The following table provides information about the Funds’ investment in the Government Money Market Fund for the six months ended June 30, 2017:
| Fund | Market Value 12/31/2016 | Purchases at Cost | Proceeds from Sales | Market Value 6/30/2017 | ||||||||||||||
U.S. Equity Dividend and Premium | $ | 7,057,525 | $ | 67,616,991 | $ | (71,749,516 | ) | $ | 2,925,000 | |||||||||
International Equity Dividend and Premium | 976,900 | 12,276,910 | (13,117,010 | ) | 136,800 | |||||||||||||
U.S. Tax-Managed Equity | 4,817,100 | 13,503,350 | (17,133,525 | ) | 1,186,925 | |||||||||||||
International Tax-Managed Equity | 708,486 | 34,675,635 | (32,168,121 | ) | 3,216,000 | |||||||||||||
| 8. TAX INFORMATION |
As of the Funds’ most recent fiscal year end, December 31, 2016, the Funds’ capital loss carryforwards and certain timing differences, on a tax-basis were as follows:
| U.S. Equity Dividend and Premium | International Equity Dividend and Premium | U.S. Tax-Managed Equity | International Tax-Managed Equity | |||||||||||||
Capital loss carryforwards | ||||||||||||||||
Expiring 2017(1) | $ | — | $ | — | $ | — | $ | (31,387,420 | ) | |||||||
Perpetual Long-term | — | (17,065,848 | ) | — | — | |||||||||||
Perpetual Short-term | — | �� | — | (39,976,616 | ) | (49,931,158 | ) | |||||||||
Total capital loss carryforwards | $ | — | $ | (17,065,848 | ) | $ | (39,976,616 | ) | $ | (81,318,578 | ) | |||||
Timing differences (Qualified Late Year Loss Deferral/Post October Loss Deferral and Deferred Dividends from REIT Distributions) | $ | (12,541,657 | ) | $ | (9,602,979 | ) | $ | (1,145,352 | ) | $ | (374,068 | ) | ||||
| (1) | Expiration occurs on December 31 of the year indicated. |
As of June 30, 2017, the Funds’ aggregate security unrealized gains and losses based on cost for U.S. federal income tax purposes were as follows:
| U.S. Equity Dividend and Premium | International Equity Dividend and Premium | U.S. Tax-Managed Equity | International Tax-Managed Equity | |||||||||||||
Tax cost | $ | 2,823,543,638 | $ | 393,601,048 | $ | 855,068,122 | $ | 484,491,074 | ||||||||
Gross unrealized gain | 446,542,776 | 28,769,212 | 409,117,050 | 91,076,144 | ||||||||||||
Gross unrealized loss | (66,035,592 | ) | (35,388,479 | ) | (719,914 | ) | (2,530,803 | ) | ||||||||
Net unrealized security gain (loss) | $ | 380,507,184 | $ | (6,619,267 | ) | $ | 408,397,136 | $ | 88,545,341 | |||||||
The difference between GAAP-basis and tax-basis unrealized gains (losses) is attributable primarily to wash sales, net mark to market gains (losses) on regulated futures and options contracts and differences related to the tax treatment of underlying fund investments, real estate investment trust investments and passive foreign investment company investments.
75
GOLDMAN SACHS TAX-ADVANTAGED EQUITY FUNDS
Notes to Financial Statements (continued)
June 30, 2017 (Unaudited)
| 8. TAX INFORMATION (continued) |
GSAM has reviewed the Funds’ tax positions for all open tax years (the current and prior three years, as applicable) and has concluded that no provision for income tax is required in the Funds’ financial statements. Such open tax years remain subject to examination and adjustment by tax authorities.
| 9. OTHER RISKS |
The Funds’ risks include, but are not limited to, the following:
Derivatives Risk — The Funds’ use of derivatives may result in loss. Derivative instruments, which may pose risks in addition to and greater than those associated with investing directly in securities, currencies or other instruments, may be illiquid or less liquid, volatile, difficult to price and leveraged so that small changes in the value of the underlying instruments may produce disproportionate losses to the Funds. Derivatives are also subject to counterparty risk, which is the risk that the other party in the transaction will not fulfill its contractual obligation. The use of derivatives is a highly specialized activity that involves investment techniques and risks different from those associated with investments in more traditional securities and instruments. Losses from derivatives can also result from a lack of correlation between changes in the value of derivative instruments and the portfolio assets (if any) being hedged.
Foreign and Emerging Countries Risk — Investing in foreign markets may involve special risks and considerations not typically associated with investing in the U.S. Foreign securities may be subject to risk of loss because of more or less foreign government regulation, less public information and less economic, political and social stability in the countries in which a Fund invests. The imposition of exchange controls, confiscations, trade restrictions (including tariffs) and other government restrictions by the U.S. or other governments, or from problems in share registration, settlement or custody, may also result in losses. Foreign risk also involves the risk of negative foreign currency rate fluctuations, which may cause the value of securities denominated in such foreign currency (or other instruments through which a Fund has exposure to foreign currencies) to decline in value. Currency exchange rates may fluctuate significantly over short periods of time. To the extent that a Fund also invests in securities of issuers located in emerging markets, these risks may be more pronounced.
Foreign Custody Risk — If a Fund invests in foreign securities, the Fund may hold such securities and cash with foreign banks, agents, and securities depositories appointed by the Fund’s custodian (each a “Foreign Custodian”). Some foreign custodians may be recently organized or new to the foreign custody business. In some countries, Foreign Custodians may be subject to little or no regulatory oversight over, or independent evaluation of, their operations. Further, the laws of certain countries may place limitations on a Fund’s ability to recover its assets if a Foreign Custodian enters bankruptcy. Investments in emerging markets may be subject to even greater custody risks than investments in more developed markets. Custody services in emerging market countries are very often undeveloped and may be considerably less well regulated than in more developed countries, and thus may not afford the same level of investor protection as would apply in developed countries.
Investments in Other Investment Companies — As a shareholder of another investment company, including an exchange-traded fund (“ETF”), a Fund will indirectly bear its proportionate share of any net management fees and other expenses paid by such other investment companies, in addition to the fees and expenses regularly borne by the Fund. ETFs are subject to risks that do not apply to conventional mutual funds, including but not limited to the following: (i) the market price of the ETF’s shares may trade at a premium or a discount to their NAV; and (ii) an active trading market for an ETF’s shares may not develop or be maintained.
Large Shareholder Transactions Risk — A Fund may experience adverse effects when certain large shareholders, such as other funds, institutional investors (including those trading by use of non-discretionary mathematical formulas), financial intermediaries (who may make investment decisions on behalf of underlying clients and/or include a Fund in their investment model), individuals, accounts and Goldman Sachs affiliates, purchase or redeem large amounts of shares of a Fund. Such large shareholder redemptions may cause a Fund to sell portfolio securities at times when it would not otherwise do so, which may negatively impact a Fund’s NAV and liquidity. These transactions may also accelerate the realization of taxable income to
76
GOLDMAN SACHS TAX-ADVANTAGED EQUITY FUNDS
| 9. OTHER RISKS (continued) |
shareholders if such sales of investments resulted in gains, and may also increase transaction costs. In addition, a large redemption could result in a Fund’s current expenses being allocated over a smaller asset base, leading to an increase in the Fund’s expense ratio. Similarly, large Fund share purchases may adversely affect a Fund’s performance to the extent that the Fund is delayed in investing new cash and is required to maintain a larger cash position than it ordinarily would.
Liquidity Risk — A Fund may make investments that are illiquid or that may become less liquid in response to market developments or adverse investor perceptions. Illiquid investments may be more difficult to value. Liquidity risk may also refer to the risk that a Fund will not be able to pay redemption proceeds within the allowable time period because of unusual market conditions, an unusually high volume of redemption requests, or other reasons. To meet redemption requests, a Fund may be forced to sell investments at an unfavorable time and/or under unfavorable conditions.
Market and Credit Risks — In the normal course of business, a Fund trades financial instruments and enters into financial transactions where risk of potential loss exists due to changes in the market (market risk). Additionally, a Fund may also be exposed to credit risk in the event that an issuer or guarantor fails to perform or that an institution or entity with which the Fund has unsettled or open transactions defaults.
| 10. INDEMNIFICATIONS |
Under the Trust’s organizational documents, its Trustees, officers, employees and agents are indemnified, to the extent permitted by the Act and state law, against certain liabilities that may arise out of performance of their duties to the Funds. Additionally, in the course of business, the Funds enter into contracts that contain a variety of indemnification clauses. The Funds’ maximum exposure under these arrangements is unknown, as this would involve future claims that may be made against the Funds that have not yet occurred. However, GSAM believes the risk of loss under these arrangements to be remote.
| 11. SUBSEQUENT EVENTS |
Subsequent events after the Statements of Assets and Liabilities date have been evaluated and GSAM has concluded that there is no impact requiring adjustment or disclosure in the financial statements.
77
GOLDMAN SACHS TAX-ADVANTAGED EQUITY FUNDS
Notes to Financial Statements (continued)
June 30, 2017 (Unaudited)
| 12. SUMMARY OF SHARE TRANSACTIONS |
Share activity is as follows:
| U.S. Equity Dividend and Premium | ||||||||||||||||
|
| |||||||||||||||
| For the Six Months Ended June 30, 2017 (Unaudited) | For the Fiscal Year Ended December 31, 2016 | |||||||||||||||
|
| |||||||||||||||
| Shares | Dollars | Shares | Dollars | |||||||||||||
|
| |||||||||||||||
| Class A Shares | ||||||||||||||||
Shares sold | 9,907,492 | $ | 124,293,842 | 12,647,333 | $ | 150,820,215 | ||||||||||
Reinvestment of distributions | 153,634 | 1,942,966 | 1,074,353 | 13,040,607 | ||||||||||||
Shares redeemed | (12,376,767 | ) | (153,871,778 | ) | (6,546,730 | ) | (77,158,201 | ) | ||||||||
| (2,315,641 | ) | (27,634,970 | ) | 7,174,956 | 86,702,621 | |||||||||||
| Class C Shares | ||||||||||||||||
Shares sold | 2,789,047 | 34,764,459 | 5,729,698 | 67,996,153 | ||||||||||||
Reinvestment of distributions | 45,922 | 578,305 | 412,246 | 4,996,220 | ||||||||||||
Shares redeemed | (1,669,335 | ) | (20,910,633 | ) | (2,269,562 | ) | (26,623,485 | ) | ||||||||
| 1,165,634 | 14,432,131 | 3,872,382 | 46,368,888 | |||||||||||||
| Institutional Shares | ||||||||||||||||
Shares sold | 37,050,196 | 462,452,311 | 74,063,806 | 879,231,543 | ||||||||||||
Reinvestment of distributions | 1,483,005 | 18,717,111 | 7,474,410 | 90,547,157 | ||||||||||||
Shares redeemed | (22,143,445 | ) | (277,322,965 | ) | (22,528,418 | ) | (264,717,264 | ) | ||||||||
| 16,389,756 | 203,846,457 | 59,009,798 | 705,061,436 | |||||||||||||
| Class IR Shares | ||||||||||||||||
Shares sold | 19,821,049 | 247,295,933 | 11,784,064 | 140,449,132 | ||||||||||||
Reinvestment of distributions | 266,430 | 3,365,544 | 650,809 | 7,907,598 | ||||||||||||
Shares redeemed | (2,852,015 | ) | (35,853,795 | ) | (2,787,456 | ) | (32,725,231 | ) | ||||||||
| 17,235,464 | 214,807,682 | 9,647,417 | 115,631,499 | |||||||||||||
NET INCREASE | 32,475,213 | $ | 405,451,300 | 79,704,553 | $ | 953,764,444 | ||||||||||
78
GOLDMAN SACHS TAX-ADVANTAGED EQUITY FUNDS
| 12. SUMMARY OF SHARE TRANSACTIONS (continued) |
| International Equity Dividend and Premium | ||||||||||||||||
|
| |||||||||||||||
| For the Six Months Ended June 30, 2017 (Unaudited) | For the Fiscal Year Ended December 31, 2016 | |||||||||||||||
|
| |||||||||||||||
| Shares | Dollars | Shares | Dollars | |||||||||||||
|
| |||||||||||||||
| Class A Shares | ||||||||||||||||
Shares sold | 56,895 | $ | 386,425 | 188,370 | $ | 1,210,233 | ||||||||||
Reinvestment of distributions | 9,989 | 71,406 | 33,882 | 213,594 | ||||||||||||
Shares redeemed | (365,821 | ) | (2,468,054 | ) | (747,009 | ) | (4,841,914 | ) | ||||||||
| (298,937 | ) | (2,010,223 | ) | (524,757 | ) | (3,418,087 | ) | |||||||||
| Class C Shares | ||||||||||||||||
Shares sold | 138,540 | 965,390 | 37,418 | 228,946 | ||||||||||||
Reinvestment of distributions | 6,512 | 45,067 | 8,776 | 53,450 | ||||||||||||
Shares redeemed | (68,490 | ) | (465,556 | ) | (160,258 | ) | (984,153 | ) | ||||||||
| 76,562 | 544,901 | (114,064 | ) | (701,757 | ) | |||||||||||
| Institutional Shares | ||||||||||||||||
Shares sold | 7,325,841 | 49,703,425 | 13,277,243 | 82,712,513 | ||||||||||||
Reinvestment of distributions | 958,926 | 6,731,853 | 1,447,262 | 9,019,459 | ||||||||||||
Shares redeemed | (3,469,359 | ) | (23,643,827 | ) | (9,671,643 | ) | (60,426,490 | ) | ||||||||
| 4,815,408 | 32,791,451 | 5,052,862 | 31,305,482 | |||||||||||||
| Class IR Shares | ||||||||||||||||
Shares sold | 425,727 | 2,833,636 | 396,064 | 2,465,561 | ||||||||||||
Reinvestment of distributions | 10,607 | 74,266 | 8,308 | 51,621 | ||||||||||||
Shares redeemed | (165,748 | ) | (1,105,510 | ) | (185,926 | ) | (1,171,659 | ) | ||||||||
| 270,586 | 1,802,392 | 218,446 | 1,345,523 | |||||||||||||
NET INCREASE | 4,863,619 | $ | 33,128,521 | 4,632,487 | $ | 28,531,161 | ||||||||||
79
GOLDMAN SACHS TAX-ADVANTAGED EQUITY FUNDS
Notes to Financial Statements (continued)
June 30, 2017 (Unaudited)
| 12. SUMMARY OF SHARE TRANSACTIONS (continued) |
| U.S. Tax-Managed Equity | ||||||||||||||||
|
| |||||||||||||||
| For the Six Months Ended June 30, 2017 (Unaudited) | For the Fiscal Year Ended December 31, 2016 | |||||||||||||||
|
| |||||||||||||||
| Shares | Dollars | Shares | Dollars | |||||||||||||
|
| |||||||||||||||
| Class A Shares | ||||||||||||||||
Shares sold | 147,176 | $ | 2,921,885 | 265,460 | $ | 4,535,080 | ||||||||||
Reinvestment of distributions | — | — | 13,898 | 263,090 | ||||||||||||
Shares redeemed | (500,248 | ) | (9,774,650 | ) | (901,330 | ) | (15,231,729 | ) | ||||||||
| (353,072 | ) | (6,852,765 | ) | (621,972 | ) | (10,433,559 | ) | |||||||||
| Class C Shares | ||||||||||||||||
Shares sold | 58,650 | 1,102,394 | 161,781 | 2,666,369 | ||||||||||||
Shares redeemed | (172,121 | ) | (3,228,949 | ) | (247,773 | ) | (3,967,917 | ) | ||||||||
| (113,471 | ) | (2,126,555 | ) | (85,992 | ) | (1,301,548 | ) | |||||||||
| Institutional Shares | ||||||||||||||||
Shares sold | 3,735,188 | 74,534,237 | 8,549,709 | 147,447,369 | ||||||||||||
Reinvestment of distributions | — | — | 522,729 | 10,041,620 | ||||||||||||
Shares redeemed | (1,285,362 | ) | (25,511,753 | ) | (8,102,550 | ) | (143,234,603 | ) | ||||||||
| 2,449,826 | 49,022,484 | 969,888 | 14,254,386 | |||||||||||||
| Service Shares | ||||||||||||||||
Shares sold | 23 | 450 | 350 | 6,136 | ||||||||||||
Reinvestment of distributions | — | — | 44 | 842 | ||||||||||||
Shares redeemed | — | — | (39,132 | ) | (700,278 | ) | ||||||||||
| 23 | 450 | (38,738 | ) | (693,300 | ) | |||||||||||
| Class IR Shares | ||||||||||||||||
Shares sold | 396,197 | 7,850,485 | 584,232 | 10,269,759 | ||||||||||||
Reinvestment of distributions | — | — | 6,668 | 128,024 | ||||||||||||
Shares redeemed | (366,788 | ) | (7,215,125 | ) | (229,127 | ) | (4,045,452 | ) | ||||||||
| 29,409 | 635,360 | 361,773 | 6,352,331 | |||||||||||||
NET INCREASE | 2,012,715 | $ | 40,678,974 | 584,959 | $ | 8,178,310 | ||||||||||
80
GOLDMAN SACHS TAX-ADVANTAGED EQUITY FUNDS
| 12. SUMMARY OF SHARE TRANSACTIONS (continued) |
| International Tax-Managed Equity | ||||||||||||||||
|
| |||||||||||||||
| For the Six Months Ended June 30, 2017 (Unaudited) | For the Fiscal Year Ended December 31, 2016 | |||||||||||||||
|
| |||||||||||||||
| Shares | Dollars | Shares | Dollars | |||||||||||||
|
| |||||||||||||||
| Class A Shares | ||||||||||||||||
Shares sold | 157,008 | $ | 1,507,632 | 318,464 | $ | 2,722,587 | ||||||||||
Reinvestment of distributions | — | — | 8,903 | 76,650 | ||||||||||||
Shares redeemed | (248,244 | ) | (2,274,643 | ) | (130,886 | ) | (1,125,758 | ) | ||||||||
| (91,236 | ) | (767,011 | ) | 196,481 | 1,673,479 | |||||||||||
| Class C Shares | ||||||||||||||||
Shares sold | 16,675 | 158,899 | 35,048 | 290,471 | ||||||||||||
Reinvestment of distributions | — | — | 993 | 8,324 | ||||||||||||
Shares redeemed | (3,670 | ) | (35,602 | ) | (11,511 | ) | (96,172 | ) | ||||||||
| 13,005 | 123,297 | 24,530 | 202,623 | |||||||||||||
| Institutional Shares | ||||||||||||||||
Shares sold | 4,263,270 | 39,410,893 | 21,272,363 | 178,167,952 | ||||||||||||
Reinvestment of distributions | — | — | 1,044,389 | 8,908,634 | ||||||||||||
Shares redeemed | (7,083,797 | ) | (63,869,375 | ) | (11,174,262 | ) | (93,931,752 | ) | ||||||||
| (2,820,527 | ) | (24,458,482 | ) | 11,142,490 | 93,144,834 | |||||||||||
| Class IR Shares | ||||||||||||||||
Shares sold | 671,409 | 6,238,686 | 91,532 | 773,664 | ||||||||||||
Reinvestment of distributions | — | — | 2,144 | 18,421 | ||||||||||||
Shares redeemed | (65,158 | ) | (619,141 | ) | (115,262 | ) | (970,190 | ) | ||||||||
| 606,251 | 5,619,545 | (21,586 | ) | (178,105 | ) | |||||||||||
NET INCREASE (DECREASE) | (2,292,507 | ) | $ | (19,482,651 | ) | 11,341,915 | $ | 94,842,831 | ||||||||
81
GOLDMAN SACHS TAX-ADVANTAGED EQUITY FUNDS
Fund Expenses — Six Month Period Ended June 30, 2017 (Unaudited)
As a shareholder of Class A, Class C, Institutional, Service or Class IR Shares of a Fund you incur types of costs: (1) transaction costs, including sales charges on purchase payments (with respect to Class A Shares), contingent deferred sales charges on redemptions (with respect to Class C Shares), (if any); and (2) ongoing costs, including management fees; distribution and/or service (12b-1) fees (with respect to Class A, Class C and Service Shares); and other Fund expenses. This example is intended to help you understand your ongoing costs (in dollars) of investing in Class A, Class C, Institutional, Service or Class IR Shares of the Funds and to compare these costs with the ongoing costs of investing in other mutual funds.
The example is based on an investment of $1,000 invested at the beginning of the period and held for the entire period from January 1, 2017 through June 30, 2017, which represents a period of 181 days of a 365 day year.
Actual Expenses — The first line under each share class in the table below provides information about actual account values and actual expenses. You may use the information in this line, together with the amount you invested, to estimate the expenses that you paid over the period. Simply divide your account value by $1,000 (for example, an $8,600 account value divided by $1,000=8.6), then multiply the result by the number in the first line under the heading entitled “Expenses Paid” to estimate the expenses you paid on your account during this period.
Hypothetical Example for Comparison Purposes — The second line under each share class in the table below provides information about hypothetical account values and hypothetical expenses based on the Funds’ actual net expense ratio and an assumed rate of return of 5% per year before expenses, which is not the Funds’ actual return. The hypothetical account values and expenses may not be used to estimate the actual ending account balance or expenses you paid for the period. You may use this information to compare the ongoing costs of investing in the Funds and other funds. To do so, compare this 5% hypothetical example with the 5% hypothetical examples that appear in the shareholder reports of the other funds.
Please note that the expenses shown in the table are meant to highlight your ongoing costs only and do not reflect any transactional costs, such as sales charges, redemption fees, or exchange fees. Therefore, the second line of the table is useful in comparing ongoing costs only and will not help you determine the relative total costs of owning different funds. In addition, if these transactional costs were included, your costs would have been higher.
| U.S. Equity Dividend and Premium Fund | International Equity Dividend and Premium Fund | U.S. Tax-Managed Equity Fund | International Tax-Managed Equity Fund | |||||||||||||||||||||||||||||||||||||||||||||
| Share Class | Beginning Account Value 01/01/17 | Ending Account Value 06/30/17 | Expenses Paid for the 6 Months Ended 06/30/17* | Beginning Account Value 01/01/17 | Ending Account Value 06/30/17 | Expenses Paid for the 6 Months Ended 06/30/17* | Beginning Account Value 01/01/17 | Ending Account Value 06/30/17 | Expenses Paid for the 6 Months Ended 06/30/17* | Beginning Account Value 01/01/17 | Ending Account Value 06/30/17 | Expenses Paid for the 6 Months Ended 06/30/17* | ||||||||||||||||||||||||||||||||||||
| Class A | ||||||||||||||||||||||||||||||||||||||||||||||||
Actual | $ | 1,000 | $ | 1,058.20 | $ | 5.82 | $ | 1,000 | $ | 1,143.90 | $ | 7.18 | $ | 1,000 | $ | 1,080.50 | $ | 5.93 | $ | 1,000 | $ | 1,161.30 | $ | 7.23 | ||||||||||||||||||||||||
Hypothetical 5% return | 1,000 | 1,019.14 | + | 5.71 | 1,000 | 1,018.10 | + | 6.76 | 1,000 | 1,019.09 | + | 5.76 | 1,000 | 1,018.10 | + | 6.76 | ||||||||||||||||||||||||||||||||
| Class C | ||||||||||||||||||||||||||||||||||||||||||||||||
Actual | 1,000 | 1,054.10 | 9.63 | 1,000 | 1,141.40 | 11.15 | 1,000 | 1,076.10 | 9.78 | 1,000 | 1,157.30 | 11.18 | ||||||||||||||||||||||||||||||||||||
Hypothetical 5% return | 1,000 | 1,015.42 | + | 9.44 | 1,000 | 1,014.38 | + | 10.49 | 1,000 | 1,015.37 | + | 9.49 | 1,000 | 1,014.43 | + | 10.44 | ||||||||||||||||||||||||||||||||
| Institutional | ||||||||||||||||||||||||||||||||||||||||||||||||
Actual | 1,000 | 1,060.30 | 3.78 | 1,000 | 1,147.50 | 5.06 | 1,000 | 1,082.50 | 3.87 | 1,000 | 1,163.90 | 5.10 | ||||||||||||||||||||||||||||||||||||
Hypothetical 5% return | 1,000 | 1,021.12 | + | 3.71 | 1,000 | 1,020.08 | + | 4.76 | 1,000 | 1,021.08 | + | 3.76 | 1,000 | 1,020.08 | + | 4.76 | ||||||||||||||||||||||||||||||||
| Service | ||||||||||||||||||||||||||||||||||||||||||||||||
Actual | N/A | N/A | N/A | N/A | N/A | N/A | 1,000 | 1,079.40 | 6.44 | N/A | N/A | N/A | ||||||||||||||||||||||||||||||||||||
Hypothetical 5% return | N/A | N/A | N/A | N/A | N/A | N/A | 1,000 | 1,018.60 | + | 6.26 | N/A | N/A | N/A | |||||||||||||||||||||||||||||||||||
| Class IR | ||||||||||||||||||||||||||||||||||||||||||||||||
Actual | 1,000 | 1,059.90 | 4.55 | 1,000 | 1,145.60 | 5.80 | 1,000 | 1,081.50 | 4.64 | 1,000 | 1,162.60 | 5.79 | ||||||||||||||||||||||||||||||||||||
Hypothetical 5% return | 1,000 | 1,020.38 | + | 4.46 | 1,000 | 1,019.39 | + | 5.46 | 1,000 | 1,020.33 | + | 4.51 | 1,000 | 1,019.44 | + | 5.41 | ||||||||||||||||||||||||||||||||
| * | Expenses are calculated using each Fund’s annualized net expense ratio for each class, which represents the ongoing expenses as a percentage of net assets for the six months ended June 30, 2017. Expenses are calculated by multiplying the annualized net expense ratio by the average account value for the period; then multiplying the result by the number of days in the most recent fiscal half year; and then dividing that result by the number of days in the fiscal year. The annualized net expense ratios for the period were as follows: |
| Fund | Class A | Class C | Institutional | Service | Class IR | |||||||||||||||
U.S. Equity Dividend and Premium | 1.14 | % | 1.89 | % | 0.74 | % | N/A | 0.89 | % | |||||||||||
International Equity Dividend and Premium | 1.35 | 2.10 | 0.95 | N/A | 1.09 | |||||||||||||||
U.S. Tax-Managed Equity | 1.15 | 1.90 | 0.75 | 1.25 | % | 0.90 | ||||||||||||||
International Tax-Managed Equity | 1.35 | 2.09 | 0.95 | N/A | 1.08 | |||||||||||||||
| + | Hypothetical expenses are based on each Fund’s actual annualized net expense ratios and an assumed rate of return of 5% per year before expenses. |
82
GOLDMAN SACHS TAX-ADVANTAGED EQUITY FUNDS
Statement Regarding Basis for Approval of Management Agreement (Unaudited)
Background
The Goldman Sachs International Equity Dividend and Premium Fund, Goldman Sachs International Tax-Managed Equity Fund, Goldman Sachs U.S. Tax-Managed Equity Fund, and Goldman Sachs U.S. Equity Dividend and Premium Fund (the “Funds”) are investment portfolios of Goldman Sachs Trust (the “Trust”). The Board of Trustees oversees the management of the Trust and reviews the investment performance and expenses of the Funds at regularly scheduled meetings held throughout the year. In addition, the Board of Trustees determines annually whether to approve the continuance of the Trust’s investment management agreement (the “Management Agreement”) with Goldman Sachs Asset Management, L.P. (the “Investment Adviser”) on behalf of the Funds.
The Management Agreement was most recently approved for continuation until June 30, 2018 by the Board of Trustees, including those Trustees who are not parties to the Management Agreement or “interested persons” (as defined in the Investment Company Act of 1940, as amended) of any party thereto (the “Independent Trustees”), at a meeting held on June 14-15, 2017 (the “Annual Meeting”).
The review process undertaken by the Trustees spans the course of the year and culminates with the Annual Meeting. To assist the Trustees in their deliberations, the Trustees have established a Contract Review Committee (the “Committee”), comprised of the Independent Trustees. The Committee held four meetings over the course of the year since the Management Agreement was last approved. At those Committee meetings, regularly scheduled Board or other committee meetings, and/or the Annual Meeting, matters relevant to the renewal of the Management Agreement were considered by the Board, or the Independent Trustees, as applicable. With respect to each Fund, such matters included:
| (a) | the nature and quality of the advisory, administrative, and other services provided to the Fund by the Investment Adviser and its affiliates, including information about: |
| (i) | the structure, staff, and capabilities of the Investment Adviser and its portfolio management teams; |
| (ii) | the groups within the Investment Adviser and its affiliates that support the portfolio management teams or provide other types of necessary services, including fund services groups (e.g., accounting and financial reporting, tax, shareholder services, and operations); controls and risk management groups (e.g., legal, compliance, valuation oversight, credit risk management, internal audit, compliance testing, market risk analysis, finance, and central funding); sales and distribution support groups, and others (e.g., information technology and training); |
| (iii) | trends in employee headcount; |
| (iv) | the Investment Adviser’s financial resources and ability to hire and retain talented personnel and strengthen its operations; and |
| (v) | the parent company’s support of the Investment Adviser and its mutual fund business, as expressed by the firm’s senior management; |
| (b) | information on the investment performance of the Fund, including comparisons to the performance of similar mutual funds, as provided by a third-party mutual fund data provider engaged as part of the contract review process (the “Outside Data Provider”), and a benchmark performance index; and information on general investment outlooks in the markets in which the Fund invests; |
| (c) | information provided by the Investment Adviser indicating the Investment Adviser’s views on whether the Fund’s peer group and/or benchmark index had high, medium, or low relevance given the Fund’s particular investment strategy; |
| (d) | the terms of the Management Agreement and other agreements with affiliated service providers entered into by the Trust on behalf of the Fund; |
| (e) | fee and expense information for the Fund, including: |
| (i) | the relative management fee and expense levels of the Fund as compared to those of comparable funds managed by other advisers, as provided by the Outside Data Provider; |
| (ii) | the Fund’s expense trends over time; and |
83
GOLDMAN SACHS TAX-ADVANTAGED EQUITY FUNDS
Statement Regarding Basis for Approval of Management Agreement (Unaudited) (continued)
| (iii) | to the extent the Investment Adviser manages other types of accounts (such as bank collective trusts, private wealth management accounts, institutional separate accounts, sub-advised mutual funds, and non-U.S. funds) having investment objectives and policies similar to those of the Fund, comparative information on the advisory fees charged and services provided to those accounts by the Investment Adviser; |
| (f) | with respect to the extensive investment performance and expense comparison data provided by the Outside Data Provider, its processes in producing that data for the Fund; |
| (g) | the undertakings of the Investment Adviser and its affiliates to implement fee waivers and/or expense limitations; |
| (h) | information relating to the profitability of the Management Agreement and the transfer agency and distribution and service arrangements of the Fund to the Investment Adviser and its affiliates; |
| (i) | whether the Fund’s existing management fee schedule adequately addressed any economies of scale; |
| (j) | a summary of the “fall-out” benefits derived by the Investment Adviser and its affiliates from their relationships with the Fund, including the fees received by the Investment Adviser’s affiliates from the Fund for transfer agency, securities lending, portfolio trading, distribution and other services; |
| (k) | a summary of potential benefits derived by the Fund as a result of its relationship with the Investment Adviser; |
| (l) | information regarding commissions paid by the Fund and broker oversight, other information regarding portfolio trading, and how the Investment Adviser carries out its duty to seek best execution; |
| (m) | portfolio manager ownership of Fund shares; the manner in which portfolio manager compensation is determined; and the number and types of accounts managed by the portfolio managers; |
| (n) | the nature and quality of the services provided to the Fund by its unaffiliated service providers, and the Investment Adviser’s general oversight and evaluation (including reports on due diligence) of those service providers as part of the administrative services provided under the Management Agreement; and |
| (o) | the Investment Adviser’s processes and policies addressing various types of potential conflicts of interest; its approach to risk management; the annual review of the effectiveness of the Fund’s compliance program; and periodic compliance reports. |
The Trustees also received an overview of the Funds’ distribution arrangements. They received information regarding the Funds’ assets, share purchase and redemption activity, and payment of distribution, service, and shareholder administration fees, as applicable. Information was also provided to the Trustees relating to revenue sharing payments made by and services provided by the Investment Adviser and its affiliates to intermediaries that promote the sale, distribution, and/or servicing of Fund shares. The Independent Trustees also discussed the broad range of other investment choices that are available to Fund investors, including the availability of comparable funds managed by other advisers.
The presentations made at the Board and Committee meetings and at the Annual Meeting encompassed the Funds and other mutual funds for which the Board of Trustees has responsibility. In evaluating the Management Agreement at the Annual Meeting, the Trustees relied upon their knowledge, resulting from their meetings and other interactions throughout the year, of the Investment Adviser and its affiliates, their services, and the Funds. In conjunction with these meetings, the Trustees received written materials and oral presentations on the topics covered, and the Investment Adviser addressed the questions and concerns of the Trustees, including concerns regarding the investment performance of certain of the funds they oversee. The Independent Trustees were advised by their independent legal counsel regarding their responsibilities and other regulatory requirements related to the approval and continuation of mutual fund investment management agreements under applicable law. In addition, the Investment Adviser and its affiliates provided the Independent Trustees with a written response to a formal request for information sent on behalf of the Independent Trustees by their independent legal counsel. During the course of their deliberations, the Independent Trustees met in executive sessions with their independent legal counsel, without representatives of the Investment Adviser or its affiliates present.
84
GOLDMAN SACHS TAX-ADVANTAGED EQUITY FUNDS
Statement Regarding Basis for Approval of Management Agreement (Unaudited) (continued)
Nature, Extent, and Quality of the Services Provided Under the Management Agreement
As part of their review, the Trustees considered the nature, extent, and quality of the services provided to the Funds by the Investment Adviser. In this regard, the Trustees considered both the investment advisory services and non-advisory services that are provided by the Investment Adviser and its affiliates. The Trustees noted the transition in the leadership and changes in personnel of various of the Investment Adviser’s portfolio management teams that had occurred in recent periods, and the ongoing recruitment efforts aimed at bringing high quality investment talent to the Investment Adviser. They also noted the Investment Adviser’s commitment to maintaining high quality systems and expending substantial resources to respond to ongoing changes to the regulatory and control environment in which the Funds and their service providers operate, as well as the efforts of the Investment Adviser and its affiliates to combat cyber security risks. The Trustees concluded that the Investment Adviser continued to commit substantial financial and operational resources to the Funds and expressed confidence that the Investment Adviser would continue to do so in the future. The Trustees also recognized that the Investment Adviser had made significant commitments to address regulatory compliance requirements applicable to the Funds and the Investment Adviser and its affiliates.
Investment Performance
The Trustees also considered the investment performance of the Funds. In this regard, they compared the investment performance of each Fund to its peers using rankings and ratings compiled by the Outside Data Provider as of December 31, 2016, and updated performance information prepared by the Investment Adviser using the peer group identified by the Outside Data Provider as of March 31, 2017. The information on each Fund’s investment performance was provided for the one-, three-, five-, and ten-year periods ending on the applicable dates, to the extent that each Fund had been in existence for those periods. The Trustees also reviewed each Fund’s investment performance relative to its performance benchmark. As part of this review, they considered the investment performance trends of the Funds over time, and reviewed the investment performance of each Fund in light of its investment objective and policies and market conditions.
In addition, the Trustees considered materials prepared and presentations made by the Investment Adviser’s senior management and portfolio management personnel in which Fund performance was assessed. The Trustees also considered the Investment Adviser’s periodic reports with respect to the Funds’ risk profiles, and how the Investment Adviser’s approach to risk monitoring and management influences portfolio management. They noted the efforts of the Funds’ portfolio management team to continue to enhance the investment models used in managing the Funds.
The Trustees noted that the International Equity Dividend and Premium Fund’s Institutional Shares had placed in the third quartile of the Fund’s peer group for the one- and three-year periods and in the fourth quartile for the five-year period, and had underperformed the Fund’s benchmark index for the one-, three-, and five-year periods ended March 31, 2017. They observed that the International Tax-Managed Equity Fund’s Institutional Shares had placed in the top half of the Fund’s peer group and had outperformed the Fund’s benchmark index for the one-, three-, and five-year periods ended March 31, 2017. The Trustees noted that the U.S. Tax-Managed Equity Fund’s Institutional Shares had placed in the top half of the Fund’s peer group for the one-, three-, five-, and ten-year periods, and had outperformed the Fund’s benchmark index for the five-year period and underperformed for the one-, three-, and ten-year periods ended March 31, 2017. They noted that the U.S. Equity Dividend and Premium Fund’s Institutional Shares had placed in the top half of the Fund’s peer group for the three- and ten-year periods and in the third quartile for the one- and five-year periods, and had underperformed the Fund’s benchmark index for the one-, three-, five-, and ten-year periods ended March 31, 2017.
Costs of Services Provided and Competitive Information
The Trustees considered the contractual terms of the Management Agreement and the fee rates payable by each Fund thereunder. In this regard, the Trustees considered information on the services rendered by the Investment Adviser to the Funds, which included both advisory and administrative services that were directed to the needs and operations of the Funds as registered mutual funds.
85
GOLDMAN SACHS TAX-ADVANTAGED EQUITY FUNDS
Statement Regarding Basis for Approval of Management Agreement (Unaudited) (continued)
In particular, the Trustees reviewed analyses prepared by the Outside Data Provider regarding the expense rankings of the Funds. The analyses provided a comparison of each Fund’s management fee and breakpoints to those of a relevant peer group and category universe; an expense analysis which compared each Fund’s overall net and gross expenses to a peer group and a category universe; and data comparing each Fund’s net expenses to the peer and category medians. The analyses also compared each Fund’s transfer agency, custody, and distribution fees, other expenses and fee waivers/reimbursements to those of the peer group and category medians. The Trustees concluded that the comparisons provided by the Outside Data Provider were useful in evaluating the reasonableness of the management fees and total expenses paid by the Funds.
In addition, the Trustees considered the Investment Adviser’s undertakings to implement fee waivers and/or expense limitations. The Trustees also noted that certain changes were being made to existing fee waiver or expense limitation arrangements of the International Equity Dividend and Premium Fund that would have the effect of decreasing total Fund expenses, with such changes taking effect in connection with the Fund’s next annual registration statement update. They also considered, to the extent that the Investment Adviser manages other types of accounts having investment objectives and policies similar to those of the Funds, comparative fee information for services provided by the Investment Adviser to those accounts, and information that indicated that services provided to the Funds differed in various significant respects from the services provided to other types of accounts which, in many cases, operated under less stringent legal and regulatory structures, required fewer services from the Investment Adviser to a smaller number of client contact points, and were less time-intensive.
In addition, the Trustees noted that shareholders are able to redeem their Fund shares at any time if shareholders believe that the Fund fees and expenses are too high or if they are dissatisfied with the performance of the Fund.
Profitability
The Trustees reviewed each Fund’s contribution to the Investment Adviser’s revenues and pre-tax profit margins. In this regard the Trustees noted that they had received, among other things, profitability analyses and summaries, revenue and expense schedules by Fund and by function (i.e., investment management, transfer agency and distribution and service), and information on the Investment Adviser’s expense allocation methodology. They observed that the profitability and expense figures are substantially similar to those used by the Investment Adviser for many internal purposes, including compensation decisions among various business groups, and are thus subject to a vigorous internal debate about how certain revenue and expenses should be allocated. The Trustees also noted that the internal audit group within the Goldman Sachs organization had audited the expense allocation methodology and that the internal audit group was satisfied with the reasonableness, consistency, and accuracy of the Investment Adviser’s expense allocation methodology and profitability analysis calculations. Profitability data for each Fund were provided for 2016 and 2015, and the Trustees considered this information in relation to the Investment Adviser’s overall profitability.
Economies of Scale
The Trustees considered the information that had been provided regarding the Investment Adviser’s profitability. The Trustees also considered the breakpoints in the fee rate payable under the Management Agreement for each of the Funds at the following annual percentage rates of the average daily net assets of the Funds:
| International Equity Dividend and Premium Fund | International Tax-Managed Equity Fund | U.S. Tax- Managed Equity Fund | U.S. Equity Dividend and Premium Fund | |||||||||||||
| First $1 billion | 0.81 | % | 0.85 | % | 0.70 | % | 0.75 | % | ||||||||
| Next $1 billion | 0.73 | 0.77 | 0.63 | 0.68 | ||||||||||||
| Next $3 billion | 0.69 | 0.73 | 0.60 | 0.65 | ||||||||||||
| Next $3 billion | 0.68 | 0.72 | 0.59 | 0.64 | ||||||||||||
| Over $8 billion | 0.67 | 0.71 | 0.58 | 0.63 | ||||||||||||
86
GOLDMAN SACHS TAX-ADVANTAGED EQUITY FUNDS
Statement Regarding Basis for Approval of Management Agreement (Unaudited) (continued)
The Trustees noted that the breakpoints were designed to share potential economies of scale, if any, with the Funds and their shareholders as assets under management reach those asset levels. The Trustees considered the amounts of assets in the Funds; the Funds’ recent share purchase and redemption activity; the information provided by the Investment Adviser relating to the costs of the services provided by the Investment Adviser and its affiliates and their realized profits; information comparing fee rates charged by the Investment Adviser with fee rates charged to other funds in the peer groups; and the Investment Adviser’s undertaking to limit certain expenses of the Funds that exceed specified levels. Upon reviewing these matters at the Annual Meeting, the Trustees concluded that the fee breakpoints represented a means of assuring that benefits of scalability, if any, would be passed along to shareholders at the specified asset levels. They also noted that the Investment Adviser had passed along savings to shareholders of the U.S. Tax-Managed Equity and U.S. Equity Dividend and Premium Funds, which had asset levels above at least the first breakpoint during the prior fiscal year.
Other Benefits to the Investment Adviser and Its Affiliates
The Trustees also considered the other benefits derived by the Investment Adviser and its affiliates from their relationships with the Funds as stated above, including: (a) transfer agency fees received by Goldman Sachs & Co. LLC (“Goldman Sachs”); (b) brokerage and futures commissions earned by Goldman Sachs for executing securities and futures transactions on behalf of the Funds; (c) trading efficiencies resulting from aggregation of orders of the Funds with those for other funds or accounts managed by the Investment Adviser; (d) fees earned by Goldman Sachs Agency Lending (“GSAL”), an affiliate of the Investment Adviser, as securities lending agent (and fees earned by the Investment Adviser for managing the fund in which the Funds’ cash collateral is invested); (e) the Investment Adviser’s ability to leverage the infrastructure designed to service the Funds on behalf of its other clients; (f) the Investment Adviser’s ability to cross-market other products and services to Fund shareholders; (g) Goldman Sachs’ retention of certain fees as Fund Distributor; (h) the Investment Adviser’s ability to negotiate better pricing with custodians on behalf of its other clients, as a result of the relationship with the Funds; and (i) the possibility that the working relationship between the Investment Adviser and the Funds’ third-party service providers may cause those service providers to be more likely to do business with other areas of Goldman Sachs. In the course of considering the foregoing, the Independent Trustees requested and received further information quantifying certain of these fall-out benefits.
Other Benefits to the Funds and Their Shareholders
The Trustees also noted that the Funds receive certain potential benefits as a result of their relationship with the Investment Adviser, including: (a) trading efficiencies resulting from aggregation of orders of the Funds with those of other funds or accounts managed by the Investment Adviser; (b) enhanced servicing from vendors because of the volume of business generated by the Investment Adviser and its affiliates; (c) enhanced servicing from broker-dealers because of the volume of business generated by the Investment Adviser and its affiliates; (d) the Investment Adviser’s ability to negotiate favorable terms with derivatives counterparties on behalf of the Funds as a result of the size and reputation of the Goldman Sachs organization; (e) the Investment Adviser’s knowledge and experience gained from managing other accounts and products; (f) the Investment Adviser’s ability to hire and retain qualified personnel to provide services to the Funds because of the reputation of the Goldman Sachs organization; (g) the Funds’ access, through the Investment Adviser, to certain firmwide resources (e.g., proprietary risk management systems and databases), subject to certain restrictions; (h) the Funds’ ability to participate in the securities lending program administered by GSAL, as measured by the revenue received by the Funds in connection with the program; and (i) the Funds’ access to certain affiliated distribution channels. In addition, the Trustees noted the competitive nature of the mutual fund marketplace, and considered that many of the Funds’ shareholders invested in the Funds in part because of the Funds’ relationship with the Investment Adviser and that those shareholders have a general expectation that the relationship will continue.
87
GOLDMAN SACHS TAX-ADVANTAGED EQUITY FUNDS
Statement Regarding Basis for Approval of Management Agreement (Unaudited) (continued)
Conclusion
In connection with their consideration of the Management Agreement, the Trustees gave weight to each of the factors described above, but did not identify any particular factor as controlling their decision. After deliberation and consideration of all of the information provided, including the factors described above, the Trustees concluded, in the exercise of their business judgment, that the management fees paid by each of the Funds were reasonable in light of the services provided to it by the Investment Adviser, the Investment Adviser’s costs and each Fund’s current and reasonably foreseeable asset levels. The Trustees unanimously concluded that the Investment Adviser’s continued management likely would benefit each Fund and its shareholders and that the Management Agreement should be approved and continued with respect to each Fund until June 30, 2018.
88
FUNDS PROFILE
Goldman Sachs Funds
Goldman Sachs is a premier financial services firm, known since 1869 for creating thoughtful and customized investment solutions in complex global markets.
Today, the Investment Management Division of Goldman Sachs serves a diverse set of clients worldwide, including private institutions, public entities and individuals. With approximately $1.21 trillion in assets under supervision as of June 30, 2017, Goldman Sachs Asset Management (“GSAM”) has portfolio management teams located around the world and our investment professionals bring firsthand knowledge of local markets to every investment decision. Assets under supervision includes assets under management and other client assets for which Goldman Sachs does not have full discretion. GSAM leverages the resources of Goldman Sachs & Co. LLC subject to legal, internal and regulatory restrictions.
Money Market
Financial Square FundsSM
| ∎ | Financial Square Treasury Solutions Fund1 |
| ∎ | Financial Square Government Fund1 |
| ∎ | Financial Square Money Market Fund2 |
| ∎ | Financial Square Prime Obligations Fund2 |
| ∎ | Financial Square Treasury Instruments Fund1 |
| ∎ | Financial Square Treasury Obligations Fund1 |
| ∎ | Financial Square Federal Instruments Fund1 |
| ∎ | Financial Square Tax-Exempt Money Market Fund2 |
Investor FundsSM
| ∎ | Investor Money Market Fund3 |
| ∎ | Investor Tax-Exempt Money Market Fund3 |
Fixed Income
Short Duration and Government
| ∎ | Enhanced Income Fund |
| ∎ | High Quality Floating Rate Fund |
| ∎ | Short-Term Conservative Income Fund |
| ∎ | Short Duration Government Fund |
| ∎ | Short Duration Income Fund |
| ∎ | Government Income Fund |
| ∎ | Inflation Protected Securities Fund |
Multi-Sector
| ∎ | Bond Fund |
| ∎ | Core Fixed Income Fund |
| ∎ | Global Income Fund |
| ∎ | Strategic Income Fund |
Municipal and Tax-Free
| ∎ | High Yield Municipal Fund |
| ∎ | Dynamic Municipal Income Fund |
| ∎ | Short Duration Tax-Free Fund |
Single Sector
| ∎ | Investment Grade Credit Fund |
| ∎ | U.S. Mortgages Fund |
| ∎ | High Yield Fund |
| ∎ | High Yield Floating Rate Fund |
| ∎ | Emerging Markets Debt Fund |
| ∎ | Local Emerging Markets Debt Fund |
| ∎ | Dynamic Emerging Markets Debt Fund |
Fixed Income Alternatives
| ∎ | Long Short Credit Strategies Fund |
| ∎ | Strategic Macro Fund4 |
Fundamental Equity
| ∎ | Equity Income Fund5 |
| ∎ | Small Cap Value Fund |
| ∎ | Small/Mid Cap Value Fund |
| ∎ | Mid Cap Value Fund |
| ∎ | Large Cap Value Fund |
| ∎ | Focused Value Fund |
| ∎ | Capital Growth Fund |
| ∎ | Strategic Growth Fund |
| ∎ | Small/Mid Cap Growth Fund |
| ∎ | Flexible Cap Fund6 |
| ∎ | Concentrated Growth Fund7 |
| ∎ | Technology Opportunities Fund |
| ∎ | Growth Opportunities Fund |
| ∎ | Rising Dividend Growth Fund |
| ∎ | Dynamic U.S. Equity Fund |
| ∎ | Income Builder Fund |
Tax-Advantaged Equity
| ∎ | U.S. Tax-Managed Equity Fund |
| ∎ | International Tax-Managed Equity Fund |
| ∎ | U.S. Equity Dividend and Premium Fund |
| ∎ | International Equity Dividend and Premium Fund |
Equity Insights
| ∎ | Small Cap Equity Insights Fund |
| ∎ | U.S. Equity Insights Fund |
| ∎ | Small Cap Growth Insights Fund |
| ∎ | Large Cap Growth Insights Fund |
| ∎ | Large Cap Value Insights Fund |
| ∎ | Small Cap Value Insights Fund |
| ∎ | International Small Cap Insights Fund |
| ∎ | International Equity Insights Fund |
| ∎ | Emerging Markets Equity Insights Fund |
Fundamental Equity International
| ∎ | Strategic International Equity Fund |
| ∎ | Focused International Equity Fund |
| ∎ | Asia Equity Fund |
| ∎ | Emerging Markets Equity Fund |
| ∎ | N-11 Equity Fund |
Select Satellite
| ∎ | Real Estate Securities Fund |
| ∎ | International Real Estate Securities Fund |
| ∎ | Commodity Strategy Fund |
| ∎ | Global Real Estate Securities Fund |
| ∎ | Dynamic Allocation Fund |
| ∎ | Absolute Return Tracker Fund |
| ∎ | Long Short Fund |
| ∎ | Managed Futures Strategy Fund |
| ∎ | MLP Energy Infrastructure Fund |
| ∎ | Multi-Manager Alternatives Fund |
| ∎ | Absolute Return Multi-Asset Fund |
| ∎ | Global Infrastructure Fund |
Total Portfolio Solutions
| ∎ | Global Managed Beta Fund |
| ∎ | Multi-Manager Non-Core Fixed Income Fund |
| ∎ | Multi-Manager U.S. Dynamic Equity Fund |
| ∎ | Multi-Manager Global Equity Fund |
| ∎ | Multi-Manager International Equity Fund |
| ∎ | Tactical Tilt Overlay Fund |
| ∎ | Balanced Strategy Portfolio |
| ∎ | Multi-Manager U.S. Small Cap Equity Fund |
| ∎ | Multi-Manager Real Assets Strategy Fund |
| ∎ | Growth and Income Strategy Portfolio |
| ∎ | Growth Strategy Portfolio |
| ∎ | Equity Growth Strategy Portfolio |
| ∎ | Satellite Strategies Portfolio |
| ∎ | Enhanced Dividend Global Equity Portfolio |
| ∎ | Tax-Advantaged Global Equity Portfolio |
| ∎ | Strategic Factor Allocation Fund |
| ∎ | Target Date 2020 Portfolio |
| ∎ | Target Date 2025 Portfolio |
| ∎ | Target Date 2030 Portfolio |
| ∎ | Target Date 2035 Portfolio |
| ∎ | Target Date 2040 Portfolio |
| ∎ | Target Date 2045 Portfolio |
| ∎ | Target Date 2050 Portfolio |
| ∎ | Target Date 2055 Portfolio |
| ∎ | GQG Partners International Opportunities Fund |
| 1 | You could lose money by investing in the Fund. Although the Fund seeks to preserve the value of your investment at $1.00 per share, it cannot guarantee it will do so. An investment in the Fund is not a deposit of a bank and is not insured or guaranteed by the Federal Deposit Insurance Corporation or any other government agency. The Fund’s sponsor has no legal obligation to provide financial support to the Fund, and you should not expect that the sponsor will provide financial support to the Fund at any time. |
| 2 | You could lose money by investing in the Fund. Because the share price of the Fund will fluctuate, when you sell your shares they may be worth more or less than what you originally paid for them. The Fund may impose a fee upon sale of your shares or may temporarily suspend your ability to sell shares if the Fund’s liquidity falls below required minimums because of market conditions or other factors. An investment in the Fund is not a deposit of a bank and is not insured or guaranteed by the Federal Deposit Insurance Corporation or any other government agency. The Fund’s sponsor has no legal obligation to provide financial support to the Fund, and you should not expect that the sponsor will provide financial support to the Fund at any time. |
| 3 | You could lose money by investing in the Fund. Although the Fund seeks to preserve the value of your investment at $1.00 per share, it cannot guarantee it will do so. The Fund may impose a fee upon sale of your shares or may temporarily suspend your ability to sell shares if the Fund’s liquidity falls below required minimums because of market conditions or other factors. An investment in the Fund is not a deposit of a bank and is not insured or guaranteed by the Federal Deposit Insurance Corporation or any other government agency. The Fund’s sponsor has no legal obligation to provide financial support to the Fund, and you should not expect that the sponsor will provide financial support to the Fund at any time. |
| 4 | Effective on June 20, 2017, the Goldman Sachs Fixed Income Macro Strategies Fund was renamed the Goldman Sachs Strategic Macro Fund. |
| 5 | Effective on June 20, 2017, the Goldman Sachs Growth and Income Fund was renamed the Goldman Sachs Equity Income Fund. |
| 6 | Effective on August 31, 2017, the Goldman Sachs Flexible Cap Growth Fund was renamed the Goldman Sachs Flexible Cap Fund. |
| 7 | Effective on July 28, 2017, the Goldman Sachs Focused Growth Fund was reorganized with and into the Goldman Sachs Concentrated Growth Fund. |
Financial Square FundsSM and Investor FundsSM are registered service marks of Goldman Sachs & Co. LLC.
| * | This list covers open-end funds only. Please visit our website at www.GSAMFUNDS.com to learn about our closed-end funds and exchange-traded funds. |
TRUSTEES Ashok N. Bakhru, Chairman Kathryn A. Cassidy Diana M. Daniels Herbert J. Markley James A. McNamara Jessica Palmer Roy W. Templin Gregory G. Weaver | OFFICERS James A. McNamara, President Scott M. McHugh, Treasurer, Senior Vice President and Principal Financial Officer Joseph F. DiMaria, Assistant Treasurer and Principal Accounting Officer Caroline L. Kraus, Secretary | |
GOLDMAN SACHS & CO. LLC Distributor and Transfer Agent | GOLDMAN SACHS ASSET MANAGEMENT, L.P. Investment Adviser | |
Visit our web site at www.GSAMFUNDS.com to obtain the most recent month-end returns.
Goldman Sachs Asset Management, L.P. 200 West Street, New York, New York 10282
The reports concerning the Funds included in this shareholder report may contain certain forward-looking statements about the factors that may affect the performance of the Funds in the future. These statements are based on Fund management’s predictions and expectations concerning certain future events and their expected impact on the Funds, such as performance of the economy as a whole and of specific industry sectors, changes in the levels of interest rates, the impact of developing world events, and other factors that may influence the future performance of the Funds. Management believes these forward-looking statements to be reasonable, although they are inherently uncertain and difficult to predict. Actual events may cause adjustments in portfolio management strategies from those currently expected to be employed.
A description of the policies and procedures that the Funds use to determine how to vote proxies relating to portfolio securities and information regarding how a Fund voted proxies relating to portfolio securities during the most recent 12-month period ended June 30 is available (i) without charge, upon request by calling 1-800-526-7384 (for Retail Shareholders) or 1-800-621-2550 (for Institutional Shareholders); and (ii) on the Securities and Exchange Commission (“SEC”) web site at http://www.sec.gov.
The Funds file their complete schedule of portfolio holdings with the SEC for the first and third quarters of each fiscal year on Form N-Q. The Funds’ Forms N-Q are available on the SEC’s web site at http://www.sec.gov within 60 days after the Funds’ first and third fiscal quarters. The Funds’ Forms N-Q may be reviewed and copied at the SEC’s Public Reference Room in Washington, D.C. and information on the operation of the Public Reference Room may also be obtained by calling 1-800-SEC-0330. Forms N-Q may be obtained upon request and without charge by calling 1-800-526-7384 (for Retail Shareholders) or 1-800-621-2550 (for Institutional Shareholders).
Goldman Sachs & Co. LLC (‘‘Goldman Sachs’’) does not provide legal, tax or accounting advice. Any statement contained in this communication (including any attachments) concerning U.S. tax matters was not intended or written to be used, and cannot be used, for the purpose of avoiding penalties under the Internal Revenue Code, and was written to support the promotion or marketing of the transaction(s) or matter(s) addressed. Clients of Goldman Sachs should obtain their own independent tax advice based on their particular circumstances.
Holdings and allocations shown are as of June 30, 2017 and may not be representative of future investments. Fund holdings should not be relied on in making investment decisions and should not be construed as research or investment advice regarding particular securities. Current and future holdings are subject to risk.
The Global Industry Classification Standard (GICS) was developed by and is the exclusive property and a service mark of Morgan Stanley Capital International Inc. (MSCI) and Standard & Poor’s, a division of The McGraw-Hill Companies, Inc. (S&P) and is licensed for use by Goldman Sachs. Neither MSCI, S&P nor any other party involved in making or compiling the GICS or any GICS classifications makes any express or implied warranties or representations with respect to such standard or classification (or the results to be obtained by the use thereof), and all such parties hereby expressly disclaim all warranties of originality, accuracy, completeness, merchantability or fitness for a particular purpose with respect to any of such standard or classification. Without limiting any of the foregoing, in no event shall MSCI, S&P, any of their affiliates or any third party involved in making or compiling the GICS or any GICS classifications have any liability for any direct, indirect, special, punitive, consequential or any other damages (including lost profits) even if notified of the possibility of such damages.
The portfolio risk management process includes an effort to monitor and manage risk, but does not imply low risk.
This material is not authorized for distribution to prospective investors unless preceded or accompanied by a current prospectus or summary prospectus, if applicable. Investors should consider a Fund’s objective, risks, and charges and expenses, and read the summary prospectus, if available, and/or the prospectus carefully before investing or sending money. The summary prospectus, if available, and the prospectus contain this and other information about a Fund and may be obtained from your authorized dealer or from Goldman Sachs & Co. LLC by calling (retail – 1-800-526-7384) (institutional – 1-800-621-2550).
© 2017 Goldman Sachs. All rights reserved. 101879-TMPL-08/2017-589872 / TAXADVSAR-17 / 33K
| ITEM 2. | CODE OF ETHICS. |
(a) As of the end of the period covered by this report, the registrant has adopted a code of ethics that applies to the registrant’s principal executive officer, principal financial officer, principal accounting officer or controller, or persons performing similar functions, regardless of whether these individuals are employed by the registrant or a third party (the “Code of Ethics”).
(b) During the period covered by this report, no amendments were made to the provisions of the Code of Ethics.
(c) During the period covered by this report, the registrant did not grant any waivers, including an implicit waiver, from any provision of the Code of Ethics.
(d) A copy of the Code of Ethics is available as provided in Item 12(a)(1) of this report.
| ITEM 3. | AUDIT COMMITTEE FINANCIAL EXPERT. |
The registrant’s board of trustees has determined that the registrant has at least one “audit committee financial expert” (as defined in Item 3 of Form N-CSR) serving on its audit committee. Gregory G. Weaver is the “audit committee financial expert” and is “independent” (as each term is defined in Item 3 of Form N-CSR).
| ITEM 4. | PRINCIPAL ACCOUNTANT FEES AND SERVICES. |
The information required by this Item is only required in an annual report on this Form N-CSR.
| ITEM 5. | AUDIT COMMITTEE OF LISTED REGISTRANTS. |
| Not applicable. |
| ITEM 6. | SCHEDULE OF INVESTMENTS. |
| Schedule of Investments is included as part of the Report to Shareholders filed under Item 1. |
| ITEM 7. | DISCLOSURE OF PROXY VOTING POLICIES AND PROCEDURES FOR CLOSED-END MANAGEMENT INVESTMENT COMPANIES. |
| Not applicable. |
| ITEM 8. | PORTFOLIO MANAGERS OF CLOSED-END MANAGEMENT INVESTMENT COMPANIES. |
| Not applicable. |
| ITEM 9. | PURCHASES OF EQUITY SECURITIES BY CLOSED-END MANAGEMENT INVESTMENT COMPANY AND AFFILIATED PURCHASERS. |
| Not applicable. |
| ITEM 10. | SUBMISSION OF MATTERS TO A VOTE OF SECURITY HOLDERS. |
| There have been no material changes to the procedures by which shareholders may recommend nominees to the registrant’s board of trustees. |
| ITEM 11. | CONTROLS AND PROCEDURES. |
| (a) | The registrant’s principal executive and principal financial officers, or persons performing similar functions have concluded that the registrant’s disclosure controls and procedures (as defined in Rule 30a-3(c) under the Investment Company Act of 1940, as amended (the “1940 Act”)) are effective as of a date within 90 days of the filing of this report that includes the disclosure required by this paragraph, based on the evaluation of these controls and procedures required by Rule 30a-3(b) under the 1940 Act and 15d-15(b) under the Securities Exchange Act of 1934, as amended. |
| (b) | There were no changes in the registrant’s internal control over financial reporting (as defined in Rule 30a-3(d) under the 1940 Act) that occurred during the registrant’s second fiscal quarter of the period covered by this report that have materially affected, or are reasonably likely to materially affect, the registrant’s internal control over financial reporting. |
| ITEM 12. | EXHIBITS. |
| (a)(1) | Goldman Sachs Trust’s Code of Ethics for Principal Executive and Senior Financial Officers is incorporated by reference to Exhibit 12(a)(1) of the registrant’s Form N-CSR filed on July 8, 2015 for its International Equity Insights Funds. | |||
| (a)(2) | Exhibit 99.CERT | Certifications pursuant to Section 302 of the Sarbanes-Oxley Act of 2002 filed herewith. | ||
| (b) | Exhibit 99.906CERT | Certifications pursuant to Section 906 of the Sarbanes-Oxley Act of 2002 filed herewith. | ||
SIGNATURES
Pursuant to the requirements of the Securities Exchange Act of 1934 and the Investment Company Act of 1940, the registrant has duly caused this report to be signed on its behalf by the undersigned, thereunto duly authorized.
| Goldman Sachs Trust | ||
| By: | /s/ James A. McNamara | |
| ||
James A. McNamara | ||
| President/Chief Executive Officer | ||
| Goldman Sachs Trust | ||
| Date: | August 30, 2017 | |
Pursuant to the requirements of the Securities Exchange Act of 1934 and the Investment Company Act of 1940, this report has been signed below by the following persons on behalf of the registrant and in the capacities and on the dates indicated.
| By: | /s/ James A. McNamara | |
| ||
James A. McNamara | ||
| President/Chief Executive Officer | ||
| Goldman Sachs Trust | ||
| Date: | August 30, 2017 | |
| By: | /s/ Scott McHugh | |
| ||
Scott McHugh | ||
| Principal Financial Officer | ||
| Goldman Sachs Trust | ||
| Date: | August 30, 2017 | |