UNITED STATES
SECURITIES AND EXCHANGE COMMISSION
Washington, D.C. 20549
FORM N-CSR
CERTIFIED SHAREHOLDER REPORT OF REGISTERED
MANAGEMENT INVESTMENT COMPANIES
Investment Company Act file number 811-05349
Goldman Sachs Trust
(Exact name of registrant as specified in charter)
71 South Wacker Drive, Chicago, Illinois 60606
(Address of principal executive offices) (Zip code)
| | |
| Caroline Kraus, Esq. | | Copies to: |
| Goldman Sachs & Co. LLC | | Geoffrey R.T. Kenyon, Esq. |
| 200 West Street | | Dechert LLP |
| New York, New York 10282 | | 100 Oliver Street |
| | 40th Floor |
| | Boston, MA 02110-2605 |
(Name and address of agents for service)
Registrant’s telephone number, including area code: (312) 655-4400
Date of fiscal year end: March 31
Date of reporting period: September 30, 2017
| ITEM 1. | REPORTS TO STOCKHOLDERS. |
| | The Semi-Annual Report to Shareholders is filed herewith. |
Goldman Sachs Funds

| | | | |
| | |
| Semi-Annual Report | | | | September 30, 2017 |
| | |
| | | | Fixed Income Alternatives Funds |
| | | | Long Short Credit Strategies |
| | | | Strategic Macro* |
*Effective June 20, 2017, the Goldman Sachs Fixed Income Macro Strategies Fund was renamed the Goldman Sachs Strategic Macro Fund.

Goldman Sachs Fixed Income Alternatives Funds
| ∎ | | LONG SHORT CREDIT STRATEGIES FUND |
| | | | |
| | | |
| NOT FDIC-INSURED | | May Lose Value | | No Bank Guarantee |
GOLDMAN SACHS LONG SHORT CREDIT STRATEGIES FUND
What Differentiates Goldman Sachs Long Short Credit Strategies Fund’s Investment Process?
The Goldman Sachs Long Short Credit Strategies Fund (the “Fund”) seeks an absolute return comprised of income and capital appreciation.
The Fund uses a bottom-up, fundamental approach with a focus on high conviction ideas across the corporate credit spectrum. Inefficiencies in the credit markets may provide attractive opportunities for investors. The Fund seeks to capitalize on these through an unconstrained approach, security selection and providing active downside management.

| ∎ | | The Fund is not limited by the traditional constraints of a benchmark strategy. |
| ∎ | | The Fund uses a flexible and dynamic strategy that allows it to invest across the spectrum of corporate credit while seeking what we believe are the most attractive risk- adjusted return opportunities. |
| ∎ | | The Fund invests across the spectrum of corporate credit including high yield, investment grade, bank loans, convertibles and preferred equity. |

| ∎ | | The Fund seeks to identify issuers that offer compelling value through bottom-up security selection, with a focus on capital preservation. |
| ∎ | | The Fund’s investment approach allows for flexibility in security selection, irrespective of industry, ratings and maturity constraints. |

| ∎ | | The Fund manages long and short exposures to potentially generate absolute returns. A hedged approach allows the Fund to deploy tactical portfolio tilts via high yield index shorts. |
| ∎ | | Dynamic portfolio management may enhance downside mitigation while providing investors access to security selection expertise. |
1
PORTFOLIO RESULTS
Goldman Sachs Long Short Credit Strategies Fund
Investment Objective
The Fund seeks an absolute return comprised of income and capital appreciation.
Portfolio Management Discussion and Analysis
Below, the Goldman Sachs Asset Management Credit Alternatives Portfolio Management Team discusses the Goldman Sachs Long Short Credit Strategies Fund’s (the “Fund”) performance and positioning for the six-month period ended September 30, 2017 (the “Reporting Period”).
| Q | | How did the Fund perform during the Reporting Period? |
| A | | During the Reporting Period, the Fund’s Class A, C, Institutional, Investor and R Shares generated cumulative total returns, without sales charges, of 1.65%, 1.27%, 1.82%, 1.78% and 1.52%, respectively. These returns compare to the 0.59% cumulative total return of the Fund’s benchmark, the Bank of America Merrill Lynch U.S. Dollar Three-Month LIBOR Constant Maturity Index (the “Index”), during the same time period. |
| | Because the composition of the Index (e.g. short-term securities) is not comparable to the range of instruments in which the Fund may transact (e.g., various credit-related instruments), references to the Index are for informational purposes only and not an indication of how the Fund is managed. |
| Q | | What economic and market factors most influenced the corporate credit markets as a whole during the Reporting Period? |
| A | | During the Reporting Period, moderate economic growth, low inflation and accommodative central bank policy at home and abroad provided a generally favorable backdrop for U.S. corporate credit and also led to notably muted volatility in both the equity and credit markets. |
| | U.S. credit markets, especially U.S. high yield bonds, rallied, as credit spreads, or yield differentials to U.S. Treasuries, tightened during the Reporting Period to near historic low levels. Supporting the markets was steady global economic growth, led by the developed markets. Despite the moderate rate of economic growth and unemployment levels not seen since early 2001, U.S. inflation remained historically low. The U.S. Federal Reserve (the “Fed”) maintained its accommodative approach to raising the targeted federal funds rate. Still, improved economic data led the Fed to raise interest rates by 25 basis points in June 2017 — only the second increase in 2017 to date and only the fourth increase since December 2015. (A basis point is 1/100th of a percentage point.) The Fed indicated it intends to maintain its accommodative monetary stance for the time being, as it expects its rate increases to be gradual. The Fed also unveiled a plan to gradually shrink its balance sheet beginning in October 2017. The Fed’s balance sheet had expanded dramatically in its quantitative easing strategy designed to help the economy recover from the 2007-2008 financial crisis. The European Central Bank similarly flagged a possible tapering of its asset purchases beginning in early 2018. |
| | Further supporting the U.S. credit markets during the Reporting Period were generally healthy credit fundamentals, including strong first quarter 2017 corporate earnings, reported in April 2017. Still, as of September 30, 2017, high yield mutual funds and exchange-traded funds (“ETFs”) experienced year-to-date outflows of more than $11 billion, with $5 billion of outflows seen during the Reporting Period. Despite healthy high yield credit fundamentals, investor uncertainty surrounding compressed high yield spreads — as well as broader macro concerns, including heightened geopolitical tensions, interest rate hikes and global economic growth — contributed to a widespread cautious view toward the high yield market and drove outflows. |
| | The one major interruption to the U.S. corporate credit rally during the Reporting Period was seen in August 2017. While volatility was quite low for the Reporting Period as a whole, we saw some volatility in August 2017 on the back of global political headlines concerning strained tensions with North Korea. The market experienced a quick sell-off early in the |
2
PORTFOLIO RESULTS
| | month, but the market rebounded almost completely by the end of the month. |
| Q | | What key factors were responsible for the Fund’s performance during the Reporting Period? |
| A | | As a part of our investment philosophy, we apply a value-oriented approach to credit market investing, with a focus on capital preservation via high conviction ideas. Consistent with the cornerstone of our fundamentally-based investment process focused on bottom-up security selection, the Fund’s performance during the Reporting Period was attributable to individual security selection. |
| | We maintained our focus on corporate fundamentals and earnings during the Reporting Period. The Fund’s positive performance during the Reporting Period was broad-based, attributable to long positioning in consumer cyclicals, energy and capital goods credits. The largest individual contributors during the Reporting Period included long positions in Jack Cooper Holdings, Transocean and Adient Global Holdings. |
| | Within the Fund’s long positioning, there were no sectors that materially detracted from performance. That said, the three largest individual detractors during the Reporting Period were the Fund’s positions in PetSmart, Uniti Group and Prairie Provident Resources. The Fund’s tactical short position in a high yield credit default swap index, a position taken in an effort to mitigate risk and serve as a portfolio market hedge, detracted from its results during the Reporting Period as spreads tightened. The Fund’s interest rate swaps, which are used to hedge duration, also detracted modestly from performance as spreads tightened. |
| | Importantly, since the Fund’s portfolio is constructed through bottom-up, fundamental research and not relative to a benchmark, there is no requirement to hold issues from any single company or sector. |
| Q | | Which segments of the corporate credit sector most significantly affected Fund performance? |
| A | | The corporate credit markets, as mentioned earlier, broadly rallied during the Reporting Period, driven largely, in our view, by technicals and generally healthy fundamentals. U.S. high yield corporate bonds were one of the strongest performers during the Reporting Period, as spreads narrowed to near historic low levels. Gains were broad-based across virtually all segments of the corporate credit sector. As such, our ability to identify select issuers within the corporate credit sector contributed positively to the Fund’s performance during the Reporting Period. |
| Q | | Did the Fund’s duration and yield curve positioning strategy help or hurt its results during the Reporting Period? |
| A | | The Fund does not use duration and yield curve positioning as active management strategies within its investment process. However, the Fund does implement interest rate swaps to hedge the interest rate risk of certain bonds, thereby limiting the Fund’s exposure to changes in interest rates. The Fund’s interest rate swap positions modestly detracted from its performance, as rates tightened during the Reporting Period. |
| Q | | How did the Fund use derivatives and similar instruments during the Reporting Period? |
| A | | The Fund used credit default swaps via a short position in a credit default swap high yield index to tactically hedge market risk, which detracted from performance. The Fund used interest rate swaps to hedge the interest rate risk of certain bonds, thereby limiting the Fund’s exposure to changes in interest rates. Interest rate swaps modestly detracted from Fund performance during the Reporting Period. The Fund used foreign currency exchange forward contracts to hedge the currency risk in non-U.S. dollar-denominated issues to U.S. dollars. This had a rather neutral impact on the Fund’s performance during the Reporting Period. |
| Q | | Were there any notable changes in the Fund’s weightings during the Reporting Period? |
| A | | During the Reporting Period, we continued to pursue investment opportunities based on fundamental, bottom-up research, which, in our view, offered compelling risk-adjusted return potential. |
| | We increased the Fund’s allocation to secured indebtedness, including high yield and bank loans, during the Reporting Period. We continued to identify opportunities in bank loans given the anticipated rising interest rate environment for the remainder of 2017 and into 2018. |
| | We also found what we considered to be compelling opportunities amongst short duration bonds, especially toward the very short-term end of the yield curve, or spectrum of maturities. We maintained our favor toward short-dated high yield credit securities, which, in our view, offer attractive risk-adjusted yields and some insulation from a potential increase in interest rates. We believe these securities are attractive for maintaining yield while limiting overall interest rate exposure, particularly given Fed interest |
3
PORTFOLIO RESULTS
| | rate hikes thus far and potential additional interest rate increases in the fourth quarter of 2017 and into 2018. |
| | We took a cautious view in the Fund given the rally in the corporate credit markets seen in the Fund’s prior fiscal year and during much of the Reporting Period. Our view was driven by the potential for volatility related to both geopolitical events and macroeconomic uncertainty, including further interest rate hikes, the reduction of the Fed’s balance sheet and the pace of global economic growth. We expressed this view by increasing the Fund’s exposure to a high yield credit default swap index. One of the key tenets of our investment philosophy is capital preservation, which leads us to take a more defensive, cautious position given certain market conditions. We also believe our hedged approach may provide for active downside management for investors seeking to mitigate market risk and volatility. |
| Q | | How was the Fund positioned at the end of the Reporting Period? |
| A | | At the end of the Reporting Period, the Fund was defensively positioned based on our cautious view of the market at the end of September 2017. The Fund remained focused on higher quality issuers in the capital structure and companies with what we considered to be strong cash flow. |
| | Reflecting our modestly defensive Fund positioning, as of September 30, 2017, approximately 46% of the Fund’s total net assets was invested in unsecured debt obligations, 15% in secured debt obligations, 24% in bank loans, 10% in investment grade corporate bonds, less than 1% in preferred and other equity securities and 14% in cash and cash equivalents. The Fund’s notional derivative exposure, calculated as a percentage of total net assets, was -53% in a credit default swap high yield index. (The Fund had a total of 143 holdings from 117 issuers at September 30, 2017, with the Fund’s top long corporate issuers, as measured by a percentage of total net assets invested, being Weatherford International, Frontier Communications and Rite Aid.) |
| Q | | What is the Fund’s tactical view and strategy for the months ahead? |
| A | | At the end of the Reporting Period, we believed the economic backdrop of moderate growth, low inflation and accommodative central bank policy was positive. However, while we believed we may see muted volatility for the remainder of 2017, we also felt we may still see bouts of volatility ahead given broad macro uncertainties, including geopolitics, interest rate increases, reductions in the Fed’s balance sheet and global economic growth. We further believed we may also see a slight uptick in defaults if interest rates rise with increased velocity, especially in 2018, though some of the default risk may be mitigated by economic growth and modestly improved, relatively stable oil prices. |
| | Given this view, we believe a sound approach, grounded in fundamentals with a focus on capital preservation, may offer a compelling means to navigate the current and anticipated market environment in the months ahead. We believe heightened volatility may lead to periods of technical dislocations in the market, which may provide for attractive single-name investing opportunities. While we continued to see value in the credit markets at the end of the Reporting Period, we believe that security selection and a focus on fundamentals will be increasingly important if interest rates continue to rise and should the Fed indeed begin to take a more hawkish, less accommodative approach. (Hawkish tends to suggest higher interest rates; opposite of dovish.) |
| | We intend to remain disciplined in our approach focused on credit selection. Our investment team has been identifying what we view as several investment opportunities in the new issue debt market, as we have seen what we consider to be attractive price entry points. Overall, we believe the Fund’s ability to be flexible across the corporate credit spectrum —high yield, loans, bank loans and investment grade credit —enables the Fund to step in and seek to take advantage of market opportunities when inefficiencies arise as well as to capitalize on changing market conditions. |
4
FUND BASICS
Long Short Credit Strategies Fund
as of September 30, 2017
| | | | | | | | | | | | | | | | | | |
| | PERFORMANCE REVIEW | |
| | | April 1, 2017–September 30, 2017 | | Fund Total
Return
(based on NAV)1 | | | Bank of America Merrill
Lynch U.S. Dollar Three-
Month LIBOR Constant
Maturity Index2 | | | 30-Day
Standardized
Subsidized
Yield3 | | | 30-Day
Standardized
Unsubsidized
Yield3 | |
| | Class A | | | 1.65 | % | | | 0.59 | % | | | 3.09 | % | | | 2.98 | % |
| | Class C | | | 1.27 | | | | 0.59 | | | | 2.46 | | | | 2.35 | |
| | Institutional | | | 1.82 | | | | 0.59 | | | | 3.56 | | | | 3.44 | |
| | Investor | | | 1.78 | | | | 0.59 | | | | 3.46 | | | | 3.35 | |
| | | Class R | | | 1.52 | | | | 0.59 | | | | 2.98 | | | | 2.83 | |
| | 1 | | The net asset value (“NAV”) represents the net assets of the Fund (ex-dividend) divided by the total number of shares outstanding. The Fund’s performance assumes the reinvestment of dividends and other distributions. The Fund’s performance does not reflect the deduction of any applicable sales charges. |
| | 2 | | The Bank of America Merrill Lynch U.S. Dollar Three-Month LIBOR Constant Maturity Index (the “Index”) tracks the performance of a synthetic asset paying LIBOR to a stated maturity. The Index is based on the assumed purchase at par of a synthetic instrument having exactly its stated maturity and with a coupon equal to that day’s fixing rate. That issue is assumed to be sold the following business day (priced at a yield equal to the current day fixing rate) and rolled into a new instrument. |
| | 3 | | The method of calculation of the 30-Day Standardized Subsidized Yield is mandated by the Securities and Exchange Commission and is determined by dividing the net investment income per share earned during the last 30 days of the period by the maximum public offering price (“POP”) per share on the last day of the period. This number is then annualized. The 30-Day Standardized Subsidized Yield reflects fee waivers and/or expense reimbursements recorded by the Fund during the period. Without waivers and/or reimbursements, yields would be reduced. This yield does not necessarily reflect income actually earned and distributed by the Fund and, therefore, may not be correlated with the dividends or other distributions paid to shareholders. The 30-Day Standardized Unsubsidized Yield does not adjust for any fee waivers and/ or expense reimbursements in effect. If the Fund does not incur any fee waivers and/or expense reimbursements during the period, the 30-Day Standardized Subsidized Yield and 30-Day Standardized Unsubsidized Yield will be identical. |
The returns set forth in the table above represent past performance. Past performance does not guarantee future results. The Fund’s investment return and principal value will fluctuate so that an investor’s shares, when redeemed, may be worth more or less than their original cost. Current performance may be lower or higher than the performance quoted above. Please visit our web site at www.GSAMFUNDS.com to obtain the most recent month-end returns. Performance reflects applicable fee waivers and/or expense limitations in effect during the periods shown, except with respect to the 30-day Standardized Unsubsidized Yield. In their absence, performance would be reduced. Returns do not reflect the deduction of taxes that a shareholder would pay on Fund distributions or the redemption of Fund shares.
5
FUND BASICS
| | | | | | | | | | | | | | | | | | |
| | STANDARDIZED TOTAL RETURNS4 | |
| | | For the period ended 9/30/17 | | One Year | | | Five Years | | | Since Inception | | | Inception Date | |
| | Class A | | | -1.94 | % | | | N/A | | | | -0.64 | % | | | 4/30/14 | |
| | Class C | | | 0.16 | | | | N/A | | | | -0.27 | | | | 4/30/14 | |
| | Institutional5 | | | 2.27 | | | | 2.35 | % | | | 5.26 | | | | 6/15/09 | |
| | Investor | | | 2.18 | | | | N/A | | | | 0.73 | | | | 4/30/14 | |
| | | Class R | | | 1.67 | | | | N/A | | | | 0.24 | | | | 4/30/14 | |
| | 4 | | The Standardized Total Returns are average annual total returns or cumulative total returns (only if the performance period is one year or less) as of the most recent calendar quarter-end. They assume reinvestment of all distributions at NAV. These returns reflect the maximum initial sales charge of 3.75% for Class A Shares and the assumed contingent deferred sales charge for Class C Shares (1.00% if redeemed within 12 months of purchase). Because Institutional, Investor and Class R Shares do not involve a sales charge, such a charge is not applied to their Standardized Total Returns. |
| | 5 | | The average annual total return figures for the Fund’s Institutional Shares, which do not impose an initial sales charge, do not reflect an initial sales charge for the periods shown. Prior to March 24, 2014 (the effective date of the reorganization of the Goldman Sachs Credit Strategies Fund (the “Predecessor Fund”) into the Fund), the maximum initial sales charge applicable to sales of Common Shares of the Predecessor Fund was 2.50%, which is not reflected in the average annual total return figures shown. The Predecessor Fund commenced operations on June 15, 2009. |
The returns set forth in the tables above represent past performance. Past performance does not guarantee future results. The Fund’s investment return and principal value will fluctuate so that an investor’s shares, when redeemed, may be worth more or less than their original cost. Current performance may be lower or higher than the performance quoted above. Please visit our web site at www.GSAMFUNDS.com to obtain the most recent month-end returns. Performance reflects applicable fee waivers and/or expense limitations in effect during the period shown. In their absence, performance would be reduced. Returns do not reflect the deduction of taxes that a shareholder would pay on Fund distributions or the redemption of Fund shares.
Effective at the close of business on March 21, 2014, the Goldman Sachs Credit Strategies Fund (the “Predecessor Fund”), a closed-end management investment company that was operated as an “interval fund,” was reorganized with and into the Fund, with shareholders of the Predecessor Fund receiving Institutional Shares of the Fund upon consummation of the reorganization. Because the Predecessor Fund was the accounting survivor, the Fund has assumed the Predecessor Fund’s historical performance. The performance information for the Fund’s Institutional Shares shown in this report is for the Predecessor Fund for the period prior to March 24, 2014, and reflects the Predecessor Fund’s investment strategies and policies. However, the Fund’s current investment strategies and policies, including the ability to implement short positions, are different from those of the Predecessor Fund. As a result, the Fund’s performance may differ substantially from what is shown for periods prior to March 24, 2014.
6
FUND BASICS
| | | | | | | | | | |
| | EXPENSE RATIOS6 | |
| | | | | Net Expense Ratio (Current) | | | Gross Expense Ratio (Before Waivers) | |
| | Class A | | | 1.47 | % | | | 1.61 | % |
| | Class C | | | 2.22 | | | | 2.36 | |
| | Institutional Shares | | | 1.13 | | | | 1.27 | |
| | Investor | | | 1.22 | | | | 1.36 | |
| | | Class R | | | 1.72 | | | | 1.86 | |
| | 6 | | The expense ratios of the Fund, both current (net of applicable fee waivers and/or expense limitations) and before waivers (gross of applicable fee waivers and/or expense limitations) are as set forth above according to the most recent publicly available Prospectus for the Fund and may differ from the expense ratios disclosed in the Financial Highlights in this report. Pursuant to a contractual arrangement, the Fund’s waivers and/or expense limitations will remain in place through at least July 28, 2018, and prior to such date the Investment Adviser may not terminate the arrangements without the approval of the Fund’s Board of Trustees. If these arrangements are discontinued in the future, the expense ratios may change without shareholder approval. |
| | |
| | SECTOR ALLOCATIONS7 |
| | | Percentage of Net Assets |

| | 7 | | The percentage shown for each investment category reflects the value of investments in that category as a percentage of net assets. Figures in the graph may not sum to 100% due to the exclusion of other assets and liabilities. The graph depicts the Fund’s investments but may not represent the Fund’s market exposure due to the exclusion of certain derivatives, if any, as listed in the Additional Investment Information section of the Schedule of Investments. |
7
FUND BASICS
| | | | | | |
| | TOP TEN INDUSTRY ALLOCATIONS8 | | | | |
| | | As of September 30, 2017 | | Percentage of Net Assets | |
| | Automotive | | | 8.8 | |
| | Health Care – Services | | | 5.1 | |
| | Pipelines | | | 4.7 | |
| | Oil & Gas Services | | | 4.6 | |
| | Oil & Gas | | | 4.4 | |
| | Media – Cable | | | 3.9 | |
| | Telecommunications – Wirelines | | | 3.6 | |
| | Media | | | 3.6 | |
| | Telecommunication Services | | | 3.5 | |
| | | Diversified Financial Services | | | 3.4 | |
| | 8 | | The percentage shown for each investment category reflects the value of investments in that category as a percentage of net assets. The above table depicts the Fund’s investments but may not represent the Fund’s market exposure due to the exclusion of certain derivatives, if any, as listed in the Additional Investment Information section of the Schedule of Investments. |
8
GOLDMAN SACHS FIXED INCOME ALTERNATIVES FUNDS
What Differentiates Goldman Sachs Strategic Macro Fund’s Investment Process?
The Goldman Sachs Strategic Macro Fund (the “Fund”) seeks to generate long-term absolute return. Changes in global fixed income and currency markets have created opportunities for generating attractive returns through fixed income alternative and unconstrained investment strategies.
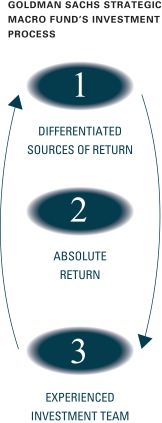
Our investment process seeks to create excess returns by:
| ∎ | | Adopting a global perspective to compare and contrast investment opportunities around the world |
| ∎ | | Employing eight specialist strategy teams that each conduct very detailed fundamental and quantitative research in their search for attractive investments |
| ∎ | | Capturing the value in the inherent diversification benefits among the different investment strategies |
| ∎ | | Using a disciplined risk-management approach to implement the strategy |
We believe the following characteristics drive the implementation and execution of the Fund’s investment process:

| ∎ | | The Fund invests in a portfolio of fixed income, currency, and commodities in an attempt to generate returns different from traditional asset classes. |
| ∎ | | Alternative investments do not necessarily move in tandem with traditional asset classes, such as stocks, bonds and credit. By adding them to the portfolio the Fund seeks to enhance its overall risk/return profile. |

| ∎ | | The Fund seeks to generate returns in up and down markets when asset classes are in or out of favor. |
| ∎ | | The Fund employs alternative investment techniques — such as hedging, leverage and shorting that may provide an opportunity for the Fund to achieve its goal of absolute returns. |

| ∎ | | We have over 300 investment professionals covering multiple sectors of the global fixed income market who are focused on finding investment ideas for our portfolio. |
| ∎ | | The senior professionals on the team have an average of over 20 years of investment experience through multiple market cycles. |
9
PORTFOLIO RESULTS
Goldman Sachs Strategic Macro Fund
Investment Objective
The Fund seeks to generate long-term absolute return.
Portfolio Management Discussion and Analysis
Effective June 20, 2017, the Goldman Sachs Fixed Income Macro Strategies Fund was renamed the Goldman Sachs Strategic Macro Fund (the “Fund”). There was no change to the Fund’s investment philosophy or strategy in connection with this name change. Below, the Goldman Sachs Fixed Income Investment Management Team discusses the Fund’s performance and positioning for the six-month period ended September 30, 2017 (the “Reporting Period”).
| Q | | How did the Fund perform during the Reporting Period? |
| A | | During the Reporting Period, the Fund’s Class A, C, Institutional, Investor and R Shares generated cumulative total returns, without sales charges, of -1.58%, -1.91%, -1.35%, -1.35% and -1.58%, respectively. These returns compare to the 0.59% cumulative total return of the Fund’s benchmark, the Bank of America Merrill Lynch U.S. Dollar Three-Month LIBOR Constant Maturity Index (“the Index”) during the same time period. |
| | Because the composition of the Index (e.g., short-term securities) is not comparable to the range of instruments in which the Fund may transact (e.g., various fixed income, currency and commodities instruments), references to the Index are for informational purposes only and are not an indication of how the Fund is managed. |
| Q | | What economic and market factors most influenced the fixed income market as a whole during the Reporting Period? |
| A | | The performance of the fixed income markets as a whole was primarily driven by geopolitical events, improving economic growth around the world and changing market expectations about central monetary policy. |
| | When the Reporting Period began with the second quarter of 2017, spread, or non-government bond sectors, generally recorded positive returns, though with mixed results relative to U.S. Treasury securities. Political developments led to temporary bouts of volatility early in the quarter, driving weakness in Brazilian, U.S. and U.K. fixed income assets as well as a credit rating downgrade of South Africa’s sovereign debt. Political risks receded in May 2017 on the centrist candidate’s victory in the French presidential election, which was supportive of French and European peripheral bonds broadly. On the economic front, U.S. core inflation weakened for the third consecutive month in May 2017, casting uncertainty over the pace of Federal Reserve (“Fed”) monetary tightening. Nonetheless, comments included in minutes from the Fed’s May and June 2017 policy meetings suggested an announcement about how and when the Fed would begin reducing the size of its balance sheet would be made sooner than the markets had previously anticipated. In Europe, economic data continued to surprise to the upside. At its June 2017 policy meeting, the European Central Bank (“ECB”) provided an optimistic assessment of the risks to growth, but revised downward its medium-term inflation forecasts. The ECB, Bank of Japan (“BoJ”) and Bank of England (“BoE”) left their respective monetary policies unchanged during the second calendar quarter, while the Fed raised interest rates for the second time in 2017 and the fourth time in a decade at its June 2017 policy meeting. As the quarter came to an end, a string of comments from global central bankers triggered a hawkish market reaction. (Hawkish suggests higher interest rates; opposite of dovish.) Global interest rates rose as the market anticipated a faster than expected pace of monetary policy tightening by the BoE, ECB and Bank of Canada (“BoC”). During the second quarter of 2017, the U.S. dollar weakened versus many global currencies. |
| | During the third quarter of 2017, spread sectors broadly advanced, outperforming U.S. Treasury securities. The Fed kept its monetary policy unchanged but unveiled its plans for balance sheet normalization. (Balance sheet normalization refers to the steps the Fed will take to reverse quantitative easing and remove the substantial monetary accommodation it has provided to the economy since the financial crisis began |
10
PORTFOLIO RESULTS
| | in 2007.) This prompted a hawkish market reaction, with the U.S. dollar appreciating and yields on U.S. government bonds rising. However, the U.S. Treasury yield curve, or spectrum of maturities, only steepened modestly due to geopolitical uncertainty and mixed U.S. economic data, including weak inflation readings. (A steepening yield curve is one wherein the differential in yields between longer-term and shorter-term maturities widens.) The central banks of other developed countries also set the stage for less accommodative monetary policy. The BoE noted “a majority” of its policymakers were in favor of tightening policy “over the coming months,” while the BoC surprised the markets with two consecutive rate hikes. The market’s expectations for a BoE rate hike in November 2017, along with a constructive tone for Brexit negotiations, also drove the British pound higher versus the U.S. dollar. (Brexit refers to the U.K.’s efforts to exit the European Union.) Overall, the U.S. dollar continued to weaken relative to many global currencies during the third calendar quarter. |
| | For the Reporting Period as a whole, spread sectors outperformed U.S. Treasury securities, led by high yield corporate bonds, sovereign emerging markets debt and investment grade corporate bonds. Commercial mortgage-backed securities, agency securities, asset-backed securities and mortgage-backed securities also outperformed U.S. Treasuries, albeit to a lesser extent. The U.S. Treasury yield curve flattened slightly during the Reporting Period, as yields on shorter-term maturities generally rose and yields on intermediate- and longer-term maturities fell. The yield on the bellwether 10-year U.S. Treasury declined approximately seven basis points to end the Reporting Period at 2.33%. (A flattening yield curve is one wherein the differential in yields between longer-term and shorter-term maturities narrows.) |
| Q | | What key factors were responsible for the Fund’s performance during the Reporting Period? |
| A | | The Fund seeks long-term absolute return through the implementation of relative value, long/short, macro and other strategies that aim to exploit disparities or inefficiencies in the global fixed income, currency and commodities markets. Absolute return is the return of an investment and is not relative to a benchmark. We believe absolute return performance may be uncorrelated to fixed income and equity markets over the long-term. Relative value strategy means to simultaneously take long and short positions within an investment portfolio. A long/short strategy seeks to produce returns with risk and volatility that are uncorrelated with general global market risk and volatility by simultaneously taking long and short exposures in approximately equal amounts. A macro hedge may be employed as we seek to mitigate the risk of market movements (either up or down), potentially enabling the Fund to pursue returns in a variety of market cycles. In addition, the Fund may use derivatives instead of buying and selling bonds to manage duration, to gain exposure to or to short individual securities, or to gain exposure to an index. Duration is a measure of the Fund’s sensitivity to changes in interest rates. |
| | Investment ideas for the Fund are generated through our specialized top-down and bottom-up strategy teams, in the following areas: Tactical Duration; Country Relative Value; Fundamental Currency; Commodities; Government and Swaps; Liquid Mortgages; Emerging Markets Debt; and Cross Macro. Near the end of 2016, Cross Macro was added as a specific strategy within the Fund. The Cross Macro strategy focuses on relative value investment opportunities across interest rate, currency, commodity and credit markets in combination. It seeks to take advantage of increased market linkages, where one factor can potentially influence many different markets (e.g., crude oil prices). Derivatives are used in combination with cash securities to implement our views in the Fund. |
| | During the Reporting Period, the Fund underperformed the Index due primarily to its Tactical Duration, Country Relative Value and Commodities strategies. Within the Tactical Duration strategy, the Fund was positioned for tightening Fed monetary policy. More specifically, it held a short duration position on the U.S. Treasury yield curve throughout the Reporting Period, which detracted from performance. Short-term U.S. Treasury yields rose in response to Fed rate hikes, but intermediate- and longer-term yields fell on political uncertainty, increased geopolitical risks and a decline in positive economic data surprise. In addition, soft inflation data during the first nine months of 2017 weighed on market expectations for further Fed rate hikes. We maintained the Fund’s short duration position because we believed global economic growth would remain strong and that tightness in the labor market and easy financial conditions in the U.S. would warrant further monetary tightening by the Fed. We also expected U.S. inflation to rebound should wage growth begin to emerge. The Tactical Duration strategy is implemented via interest rate futures. Within the Country Relative Value strategy, performance was hampered by the Fund’s positioning for easier Canadian and European financial conditions relative to those in the U.S., expressed through a long position in Canadian interest rates versus a short position in U.S. interest rates. In response to stronger economic indicators, the BoC |
11
PORTFOLIO RESULTS
| | was surprisingly hawkish, raising rates twice during the summer of 2017. Europe also showed signs of stronger economic growth, and European interest rates rose as markets anticipated the ECB might start tapering its quantitative easing and otherwise reduce its accommodative monetary policy. The Country Relative Value strategy is actively implemented via interest rate swaps and/or futures. Within the Commodities strategy, the Fund’s long positions in crude oil and natural gas detracted from performance. The crude oil markets were pressured by growing inventories, which were particularly elevated in the U.S. Natural gas prices fell on cooler than expected summer weather, which depressed demand, along with higher production. The Commodities strategy uses a blend of commodity futures and options. |
| | The Government/Swaps, Fundamental Currency and Emerging Markets Debt strategies contributed positively to the Fund’s results. Within the Government/Swaps strategy, the Fund benefited from its steepening positions on the U.S. Treasury and European government bond yield curves. Curve steepening positions were implemented through interest rate swaps. In addition, the Fund’s short position in U.K. inflation-linked bonds added to returns. The Government and Swaps strategy is actively implemented via interest rate swaps and/ or futures. Within the Fundamental Currency strategy, the Fund was helped by its long positions in emerging markets currencies, including the Polish zloty, Czech koruna and Mexican peso. The Fund also gained from its long positions in the Swedish krona and Norwegian krone. These results were offset somewhat by the Fund’s short position in the euro, which detracted. The Fundamental Currency strategy employs a mix of non-deliverable currency forwards, forward foreign currency exchange contracts and/or currency options. Within the Emerging Markets Debt strategy, the Fund benefited from its long positions in Mexican, Hungarian and Russian local debt as well as from a short position in Czech local debt. These gains were slightly offset by the Fund’s short position in Hong Kong local debt, which detracted. The Emerging Markets Debt strategy is implemented using cross currency swaps. |
| | The Fund’s Liquid Mortgages and Cross Macro strategies did not have a meaningful impact on performance during the Reporting Period. |
| Q | | How did the Fund use derivatives and similar instruments during the Reporting Period? |
| A | | During the Reporting Period, the Fund invested in interest rate futures, interest rate swaps, total return swaps, swaptions, options on futures, credit default swaps, equity index futures and options, non-deliverable forwards, forward foreign currency exchange contracts, currency options and cross currency swaps. The Fund used interest rate futures to hedge interest rate exposure, i.e., to manage exposure to fluctuations in interest rates, and to facilitate specific duration and yield curve strategies. Interest rate swaps were used to express our views on the direction of interest rates. Total return swaps were employed to manage the Fund’s yield curve exposures across various strategies. Swaptions (or options on interest rate swap contracts) were used to hedge interest rate exposure and manage the Fund’s exposure to potential market volatility. Options on futures were used within the Government and Swaps strategy to allow the Fund the right to enter into futures contracts. Credit default swaps were employed to implement specific credit-related investment strategies. Equity index futures and options were used as a means of reducing Fund volatility. Within the Fundamental Currency strategy, the Fund used non-deliverable currency forwards to gain exposure to a particular country and also to take advantage of relative value opportunities. The Fund also utilized forward foreign currency exchange contracts and currency options within the Fundamental Currency strategy to take long or short positions. Within the Emerging Markets Debt strategy, the Fund employed cross currency swaps to express relative views on given currencies as well as our views on the direction of a country’s interest rates. Derivatives and similar instruments allow us to manage interest rate, credit and currency risks more effectively by allowing us both to apply active investment views with greater versatility and to afford greater risk management precision than we would otherwise be able to implement. Within the Liquid Mortgages strategy, the Fund used mortgage-backed securities forward agreements (known as “TBAs”) in addition to interest only and principal only strips. (Strips are a type of security for which the holder is only entitled to receive regular cash flows derived from incoming interest payments or principal repayments on an underlying loan pool.) During the Reporting Period, the use of derivatives and similar instruments had a negative impact on the Fund’s performance. |
| Q | | Were there any notable changes in the Fund’s weightings during the Reporting Period? |
| A | | Within the Tactical Duration strategy, we moved the Fund to a modestly short duration position on the Japanese government yield curve. Throughout the Reporting Period, the Fund held a short duration on the U.S. Treasury yield |
12
PORTFOLIO RESULTS
| | curve and a neutral duration position on the European government bond yield curve. Within the Country Relative Value strategy, we reduced the Fund’s long position in European interest rates and its short position in U.S. interest rates, as European government bonds outperformed U.S. government bonds during September 2017. Within the Fundamental Currency strategy, we continued to add exposure to a number of emerging markets currencies, such as the Swedish krona, South African rand and Brazilian real, versus the U.S. dollar during the Reporting Period. Within the Commodities strategy, we added a modestly short position in crude oil. The Fund continued to hold a short position in natural gas versus crude oil. Within the Cross Macro strategy, we sought to benefit from tighter financial conditions in the U.S. relative to Asia, Canada and Europe by implementing long positions in Asian interest rates versus short positions in U.S. interest rates. |
| Q | | How was the Fund positioned at the end of the Reporting Period? |
| A | | At the end of the Reporting Period, within the Tactical Duration strategy, the Fund held a short duration position on the U.S. Treasury yield curve, a modestly short duration on the Japanese government bond curve and a neutral duration position on the European government bond yield curve. Within the Country Relative Value strategy, the Fund had long positions in European and Canadian interest rates versus short positions in U.S. and U.K. interest rates. The Fund maintained a short position in U.K. inflation-linked securities. In addition, at the end of Reporting Period, the Fund had a long position in Mexican interest rates and a short position in Czech Republic interest rates. Within the Fundamental Currency strategy, the Fund had short positions in select developed markets currencies, such as the euro and Australian dollar. Within the Commodities strategy, the Fund held a modestly short position in crude oil as well as a short position in natural gas versus crude oil. Within the Emerging Markets Debt strategy, the Fund held long positions in a number of Latin American countries that import oil and rely on American tourism. It also had a short position in Chinese local emerging markets debt. Within the macro hedge, the Fund was positioned for tighter financial conditions in the U.S. relative to Asia, Canada and Europe at the end of the Reporting Period. |
| Q | | What is the Fund’s tactical view and strategy for the months ahead? |
| A | | At the end of the Reporting Period, we expected one more Fed rate hike during 2017, and we believed the market was underpricing the pace of future interest rate hikes. As for Europe, we thought that by the end of 2017, the ECB may communicate its plans to reduce asset purchases through its quantitative easing program with tapered purchases likely to continue, we believe, through 2018. In the U.K., we saw scope for a BoE rate hike in November 2017 given policymakers’ communications. Meanwhile, the BoC has commenced a rate hiking cycle, though we expect the trajectory for its future rate hikes to be shallower than in the U.S. In Japan, the BoJ’s monetary policy is likely to remain unchanged in the near term, in our view. However, we note that based on market prices at the end of the Reporting Period, investors appear to believe BoJ monetary policy might fluctuate around the country’s general election and the end of BoJ Governor Haruhiko Kuroda’s term, which is scheduled to occur in April 2018. |
| | In terms of the Fund’s positioning at the end of the Reporting Period, we were continuing to add exposure to emerging markets currencies versus the U.S. dollar because of what we considered a supportive global economic growth environment and improvements in commodity prices. In our opinion, emerging markets assets overall are more resilient now than they were during the 2013 taper tantrum, as evidenced by improved fundamentals, such as healthier account balances in many countries. (Taper tantrum refers to the way markets reacted negatively in 2013 when the Fed suggested it might begin tapering its quantitative easing program.) That said, at the end of the Reporting Period, we were cautious about valuations in emerging markets asset classes, though we acknowledged support from ongoing strength in global and Chinese economic growth, the gradual pace of monetary tightening in developed markets, and higher commodity prices that have buttressed the terms of trade for emerging markets countries. (Terms of trade is a ratio representing the prices of a country’s exports relative to the prices of its imports.) In addition, while China’s economic growth has decelerated in recent years, the pace of the slowing appeared to have moderated during the Reporting Period. We plan to be watchful for any sharp downturn in China’s business cycle, which could be a headwind for the emerging markets. |
13
FUND BASICS
Strategic Macro Fund
as of September 30, 2017

| | | | | | | | | | |
| | PERFORMANCE REVIEW | |
| | | April 1, 2017–September 30, 2017 | | Fund Total Return
(based on NAV)1 | | | Bank of America Merrill Lynch
U.S. Dollar Three-Month LIBOR
Constant Maturity Index2 | |
| | Class A | | | -1.58 | % | | | 0.59 | % |
| | Class C | | | -1.91 | | | | 0.59 | |
| | Institutional | | | -1.35 | | | | 0.59 | |
| | Investor | | | -1.35 | | | | 0.59 | |
| | | Class R | | | -1.58 | | | | 0.59 | |
| | 1 | | The net asset value (“NAV”) represents the net assets of the class of the Fund (ex-dividend) divided by the total number of shares of the class outstanding. The Fund’s performance reflects the reinvestment of dividends and other distributions. The Fund’s performance does not reflect the deduction of any applicable sales charges. |
| | 2 | | The Bank of America Merrill Lynch U.S. Dollar Three-Month LIBOR Constant Maturity Index (the “Index”) tracks the performance of a synthetic asset paying LIBOR to a stated maturity. The Index is based on the assumed purchase at par of a synthetic instrument having exactly its stated maturity and with a coupon equal to that day’s fixing rate. That issue is assumed to be sold the following business day (priced at yield equal to the current day Fixing rate) and rolled into a new instrument. |
| | | | | | | | | | | | |
| | STANDARDIZED TOTAL RETURNS3 |
| | | For the period ended 9/30/17 | | One Year | | | Since Inception | | | Inception Date |
| | Class A | | | -3.41 | % | | | -2.63 | % | | 12/16/13 |
| | Class C | | | -1.45 | | | | -2.13 | | | 12/16/13 |
| | Institutional | | | 0.70 | | | | -1.34 | | | 12/16/13 |
| | Investor | | | 0.70 | | | | -1.46 | | | 12/16/13 |
| | | Class R | | | 0.11 | | | | -1.80 | | | 12/16/13 |
| | 3 | | The Standardized Total Returns are average annual total returns or cumulative total returns (only if the performance period is one year or less) as of the most recent calendar quarter-end. They assume reinvestment of all distributions at NAV or cumulative total returns (only if the performance period is one year or less). These returns reflect a maximum initial sales charge of 3.75% for Class A Shares and the assumed contingent deferred sales charge for Class C Shares (1.00% if redeemed within 12 months of purchase). Because Institutional, Investor and Class R Shares do not involve a sales charge, such a charge is not applied to their Standardized Total Returns. |
The returns set forth in the tables above represent past performance. Past performance does not guarantee future results. The Fund’s investment return and principal value will fluctuate so that an investor’s shares, when redeemed, may be worth more or less than their original cost. Current performance may be lower or higher than the performance quoted above. Please visit our web site at www.GSAMFUNDS.com to obtain the most recent month-end returns. Performance reflects applicable fee waivers and/or expense limitations in effect during the periods shown. In their absence, performance would be reduced. Returns do not reflect the deduction of taxes that a shareholder would pay on Fund distributions or the redemption of Fund shares.
14
FUND BASICS
| | | | | | | | | | |
| | EXPENSE RATIOS4 | |
| | | | | Net Expense Ratio (Current) | | | Gross Expense Ratio (Before Waivers) | |
| | Class A | | | 1.34 | % | | | 2.69 | % |
| | Class C | | | 2.09 | | | | 3.44 | |
| | Institutional | | | 1.06 | | | | 2.35 | |
| | Investor | | | 1.09 | | | | 2.44 | |
| | | Class R | | | 1.59 | | | | 2.94 | |
| | 4 | | The expense ratios of the Fund, both current (net of applicable fee waivers and/or expense limitations) and before waivers (gross of applicable fee waivers and/or expense limitations) are as set forth above according to the most recent publicly available Prospectus for the Fund and may differ from the expense ratios disclosed in the Financial Highlights in this report. Pursuant to a contractual arrangement, the Fund’s waivers and/or expense limitations will remain in place through at least July 28, 2018, and prior to such date the Investment Adviser may not terminate the arrangements without the approval of the Fund’s Board of Trustees. However, the management fee waiver arrangement with respect to the fee paid by Cayman Commodity-FIMS, Ltd., a wholly-owned subsidiary through which the Fund gains exposure to the commodities markets (the “Subsidiary”), may not be discontinued by the Investment Adviser as long as the contract with the Subsidiary remains in place. If these arrangements are discontinued in the future, the expense ratios may change without shareholder approval. |
15
FUND BASICS
Strategic Macro Fund
as of September 30, 2017
|
| FUND COMPOSITION5 (%) |
| Percentage of Net Assets |
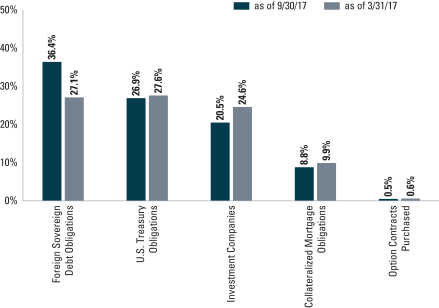
| | 5 | | The percentage shown for each investment category reflects the value of investments in that category as a percentage of net assets. Figures in the graph may not sum to 100% due to the exclusion of other assets and liabilities. The graph depicts the Fund’s investments but may not represent the Fund’s market exposure due to the exclusion of certain derivatives, if any, as listed in the Additional Investment Information section of the Schedule of Investments. |
16
GOLDMAN SACHS LONG SHORT CREDIT STRATEGIES FUND
Schedule of Investments
September 30, 2017 (Unaudited)
| | | | | | | | | | | | | | |
Principal
Amount | | | Interest
Rate | | | Maturity
Date | | | Value | |
| Secured Debt Obligations – 38.9% | |
| Bank Loans(a) – 23.5% | |
| Automotive – 1.1% | |
| American Axle & Manufacturing, Inc. (BB/Ba2) (1M LIBOR +
2.250%)(b) |
|
| $ | 2,357,804 | | | | 3.490 | % | | | 04/06/24 | | | $ | 2,350,448 | |
| | |
| Building Materials – 0.7% | |
| | Builders FirstSource, Inc. (B+/B3) (3M LIBOR + 3.000%)(b) | |
| | 1,360,825 | | | | 4.333 | | | | 02/29/24 | | | | 1,364,009 | |
| | |
| Chemicals – 0.9% | |
| | Kraton Polymers LLC (BB-/Ba3) (1M LIBOR + 3.000%)(b) | |
| | 206,573 | | | | 4.235 | | | | 01/06/22 | | | | 209,039 | |
| New Arclin U.S. Holding Corp. (B+/B2) (3M LIBOR +
4.250%)(b) |
|
| | 691,268 | | | | 5.583 | | | | 02/14/24 | | | | 696,024 | |
| | OXEA Finance & Cy S.C.A. (NR/NR) | |
| | 489,000 | | | | 3.500 | | | | 09/27/24 | | | | 487,778 | |
| | Tronox Blocked Borrower LLC (NR/NR) | |
| | 153,581 | | | | 3.000 | | | | 09/22/24 | | | | 154,125 | |
| | Tronox Finance LLC (BB-/Ba3) | |
| | 354,419 | | | | 3.000 | | | | 09/22/24 | | | | 355,673 | |
| | | | | | | | | | | | | | |
| | | | | | | | | | | | | 1,902,639 | |
| | |
| Commercial Services – 0.6% | |
| | Garda World Security Corp. (B/B1) (PRIME + 3.000%)(b) | |
| | 316,061 | | | | 5.316 | | | | 05/24/24 | | | | 318,826 | |
| | Monitronics International, Inc. (B-/B2) (3M LIBOR + 5.500%)(b) | |
| | 907,152 | | | | 6.833 | | | | 09/30/22 | | | | 899,215 | |
| | | | | | | | | | | | | | |
| | | | | | | | | | | | | 1,218,041 | |
| | |
| Communications – Cable & Satellite – 0.2% | |
| Radiate Holdco LLC/Radiate Finance, Inc. (B/B1) (1M LIBOR +
3.000%)(b) |
|
| | 456,852 | | | | 4.235 | | | | 02/01/24 | | | | 450,333 | |
| | |
| Communications – Entertainment – 0.5% | |
| Univision Communications, Inc. (BB-/B2) (1M LIBOR +
2.750%)(b) |
|
| | 1,054,150 | | | | 3.985 | | | | 03/15/24 | | | | 1,044,273 | |
| | |
| Consumer Cyclical Services – 0.9% | |
| | TKC Holdings, Inc. (B/B2) (2M LIBOR + 4.250%)(b) | |
| | 1,936,915 | | | | 5.522 | | | | 02/01/23 | | | | 1,953,050 | |
| | |
| Consumer Durables – 0.3% | |
| | Comfort Holding LLC (CCC+/B2) (1M LIBOR + 4.750%)(b) | |
| | 635,738 | | | | 5.981 | | | | 02/05/24 | | | | 568,191 | |
| | |
| Diversified Financial Services – 0.5% | |
| | Tecomet, Inc. (NR/NR) (3M LIBOR + 3.750%)(b) | |
| | 510,720 | | | | 5.061 | | | | 05/02/24 | | | | 513,595 | |
| | VFH Parent LLC (NR/NR) (3M LIBOR + 3.750%)(b) | |
| | 460,132 | | | | 5.061 | | | | 12/30/21 | | | | 464,734 | |
| | | | | | | | | | | | | | |
| | | | | | | | | | | | | 978,329 | |
| | |
| Diversified Telecommunication – 0.9% | |
| | Telesat Canada (BB-/Ba3) (1M LIBOR + 3.000%)(b) | |
| | 1,865,602 | | | | 4.240 | | | | 11/17/23 | | | | 1,878,437 | |
| | |
| Electric – 1.4% | |
| | Talen Energy Supply LLC (NR/NR) (1M LIBOR + 4.000%)(b) | |
| | 2,982,000 | | | | 5.235 | | | | 04/15/24 | | | | 2,903,723 | |
| | |
| Secured Debt Obligations – (continued) | |
| Food & Beverage – 0.8% | |
| | Dole Food Co., Inc. (NR/NR) (PRIME + 1.750%)(b) | |
| 1,723,458 | | | | 4.018 | | | | 04/06/24 | | | | 1,727,491 | |
| | |
| Food & Drug Retailers – 0.7% | |
| | BJ’s Wholesale Club, Inc. (B-/B3) (1M LIBOR + 3.750%)(b) | |
| | 1,424,043 | | | | 4.982 | | | | 02/03/24 | | | | 1,363,008 | |
| | |
| Health Care – Services – 2.2% | |
| | ATI Holdings Acquisition, Inc. (B/B1) (1M LIBOR + 3.500%)(c) | |
| | 318,963 | | | | 4.801 | | | | 05/10/23 | | | | 322,152 | |
| Change Healthcare Holdings, Inc. (B+/Ba3) (1M LIBOR +
2.750%)(b) |
|
| | 924,355 | | | | 3.985 | | | | 03/01/24 | | | | 926,435 | |
| | Envision Healthcare Corp. (BB-/Ba3) (3M LIBOR + 3.000%)(b) | |
| | 1,236,305 | | | | 4.240 | | | | 12/01/23 | | | | 1,238,629 | |
| | Greenway Health LLC (B-/B3) (3M LIBOR + 4.250%)(b) | |
| | 1,028,297 | | | | 5.580 | | | | 02/14/24 | | | | 1,030,868 | |
| | Kindred Healthcare, Inc. (BB-/Ba3) (3M LIBOR + 3.500%)(b) | |
| | 688,886 | | | | 4.813 | | | | 04/09/21 | | | | 689,175 | |
| | Team Health Holdings, Inc. (NR/NR) (1M LIBOR + 2.750%)(b) | |
| | 414,627 | | | | 3.985 | | | | 02/06/24 | | | | 406,596 | |
| | | | | | | | | | | | | | |
| | | | | | | | | | | | | 4,613,855 | |
| | |
| Household Products(b) – 0.2% | |
| | AI Aqua Merger Sub, Inc. (NR/NR) (1M LIBOR + 3.500%) | |
| | 409,000 | | | | 4.735 | | | | 12/13/23 | | | | 410,023 | |
| | |
| Life Insurance – 0.2% | |
| | Acrisure LLC (NR/NR) (2M LIBOR + 5.000%)(b) | |
| | 385,065 | | | | 6.272 | | | | 11/22/23 | | | | 389,235 | |
| | |
| Media – Cable – 0.7% | |
| | Atlantic Broadband Finance LLC (NR/NR) | |
| | 1,005,000 | | | | 2.750 | | | | 08/11/24 | | | | 998,246 | |
| | Cable One, Inc. (NR/NR) (3M LIBOR + 2.250%)(b)(c) | |
| | 368,078 | | | | 3.570 | | | | 05/01/24 | | | | 369,918 | |
| | | | | | | | | | | | | | |
| | | | | | | | | | | | | 1,368,164 | |
| | |
| Media – Non Cable – 0.6% | |
| | CBS Radio, Inc. (BB-/Ba3) (1M LIBOR + 3.500%)(b) | |
| | 1,338,259 | | | | 4.737 | | | | 10/17/23 | | | | 1,347,466 | |
| | |
| Media-Entertainment – 0.4% | |
| Lions Gate Entertainment Corp. (NR/NR) (1M LIBOR +
3.000%)(b) |
|
| | 838,513 | | | | 4.235 | | | | 12/08/23 | | | | 844,801 | |
| | |
| Packaging – 1.3% | |
| | BWAY Holding Co. (B-/B2) (1M LIBOR + 3.250%)(b) | |
| | 2,644,348 | | | | 4.481 | | | | 04/03/24 | | | | 2,650,482 | |
| | |
| Restaurant – 1.7% | |
| 1011778 B.C. Unlimited Liability Co. (B+/Ba3) (3M LIBOR +
2.250%)(b) |
|
| | 3,475,005 | | | | 3.583 | | | | 02/16/24 | | | | 3,468,923 | |
| | |
| Retailers – 0.6% | |
| | JC Penney Corp., Inc. (BB-/Ba2) (3M LIBOR + 4.250%)(b) | |
| | 1,186,046 | | | | 5.568 | | | | 06/23/23 | | | | 1,151,947 | |
| | |
| Technology – Software – 1.1% | |
| | Kronos, Inc. (B/B2) (3M LIBOR + 3.500%)(b) | |
| | 697,736 | | | | 4.811 | | | | 11/01/23 | | | | 701,413 | |
| | |
| | |
| The accompanying notes are an integral part of these financial statements. | | 17 |
GOLDMAN SACHS LONG SHORT CREDIT STRATEGIES FUND
Schedule of Investments (continued)
September 30, 2017 (Unaudited)
| | | | | | | | | | | | | | |
Principal
Amount | | | Interest
Rate | | | Maturity
Date | | | Value | |
| Secured Debt Obligations – (continued) | |
| Technology – Software – (continued) | |
| | Optiv Security, Inc. (B-/B2) (3M LIBOR + 3.250%)(b) | |
| $ | 500,348 | | | | 4.563 | % | | | 02/01/24 | | | $ | 469,076 | |
| | Peak 10, Inc. (NR/NR) (3M LIBOR + 3.500%)(b) | |
| | 1,036,000 | | | | 4.811 | | | | 08/01/24 | | | | 1,036,000 | |
| | | | | | | | | | | | | | |
| | | | | | | | | | | | | 2,206,489 | |
| | |
| Telecommunications – Wireless – 1.0% | |
| | Sprint Communications, Inc. (BB-/Ba2) (1M LIBOR + 2.500%)(b) | |
| | 2,150,133 | | | | 3.750 | | | | 02/02/24 | | | | 2,151,488 | |
| | |
| Telecommunications – Wirelines – 3.4% | |
| | CenturyLink, Inc. (BBB-/Ba3) | |
| | 2,000,000 | | | | 2.750 | | | | 01/31/25 | | | | 1,937,000 | |
| Frontier Communications Corp. (NR/NR) (1M LIBOR +
3.750%)(b) |
|
| | 4,527,653 | | | | 4.990 | | | | 06/15/24 | | | | 4,292,803 | |
| | Windstream Corp. (BB-/B1) (1M LIBOR + 4.000%)(b) | |
| | 857,570 | | | | 5.240 | | | | 03/29/21 | | | | 763,237 | |
| | | | | | | | | | | | | | |
| | | | | | | | | | | | | 6,993,040 | |
| | |
| Trading Companies & Distributors(b) – 0.6% | |
| | HD Supply Waterworks Ltd. (NR/NR) (6M LIBOR + 3.000%) | |
| | 1,250,000 | | | | 4.455 | | | | 08/01/24 | | | | 1,251,562 | |
| | |
| | TOTAL BANK LOANS | | | $ | 48,549,447 | |
| | |
| Other Secured Debt Obligations – 15.4% | |
| Auto Components(d)(e) – 0.4% | |
| | Mclaren Finance PLC (B/(P)B2) | |
| | 809,000 | | | | 5.750 | | | | 08/01/22 | | | | 830,899 | |
| | |
| Chemicals(d)(e) – 0.3% | |
| | Cornerstone Chemical Co. (B/B2) | |
| | 605,000 | | | | 6.750 | | | | 08/15/24 | | | | 600,463 | |
| | |
| Commercial Services(d)(e) – 0.8% | |
| | The Hertz Corp. (BB-/B1) | |
| | 1,567,000 | | | | 7.625 | | | | 06/01/22 | | | | 1,614,010 | |
| | |
| Consumer Cyclical Services(d) – 0.9% | |
| | APX Group, Inc. (B-/B1) | |
| | 1,782,000 | | | | 7.875 | | | | 12/01/22 | | | | 1,931,242 | |
| | |
| Containers & Packaging(d)(e) – 0.2% | |
| Ardagh Packaging Finance PLC/Ardagh Holdings USA, Inc.
(BB/Ba3) |
|
| | 391,000 | | | | 4.625 | | | | 05/15/23 | | | | 401,753 | |
| | |
| Health Care – Services(d) – 2.9% | |
| | CHS/Community Health Systems, Inc. (B+/Ba3) | |
| | 2,725,000 | | | | 6.250 | | | | 03/31/23 | | | | 2,690,937 | |
| | HCA, Inc. (BBB-/Ba1) | |
| | 1,411,000 | | | | 5.250 | | | | 06/15/26 | | | | 1,520,353 | |
| | Tenet Healthcare Corp. (BB-/Ba3)(e) | |
| | 1,815,000 | | | | 4.625 | | | | 07/15/24 | | | | 1,796,850 | |
| | | | | | | | | | | | | | |
| | | | | | | | | | | | | 6,008,140 | |
| | |
| Media – Cable(d)(e) – 3.2% | |
| | Altice Financing SA (BB-/B1) | |
| | 1,382,000 | | | | 6.625 | | | | 02/15/23 | | | | 1,464,920 | |
| | |
| Secured Debt Obligations – (continued) | |
| Media – Cable(d)(e) – (continued) | |
| | Altice US Finance I Corp. (BB/Ba3) | |
| 1,635,000 | | | | 5.500 | | | | 05/15/26 | | | | 1,720,837 | |
| | Ziggo Secured Finance BV (BB-/Ba3) | |
| | 3,472,000 | | | | 5.500 | | | | 01/15/27 | | | | 3,541,440 | |
| | | | | | | | | | | | | | |
| | | | | | | | | | | | | 6,727,197 | |
| | |
| Media – Non Cable(d)(e) – 0.9% | |
| | Univision Communications, Inc. (BB-/B2) | |
| | 602,000 | | | | 5.125 | | | | 05/15/23 | | | | 613,287 | |
| | 1,273,000 | | | | 5.125 | | | | 02/15/25 | | | | 1,284,139 | |
| | | | | | | | | | | | | | |
| | | | | | | | | | | | | 1,897,426 | |
| | |
| Oil Field Service(d)(e) – 0.7% | |
| | Transocean Proteus Ltd. (BB-/NR) | |
| | 1,335,700 | | | | 6.250 | | | | 12/01/24 | | | | 1,402,485 | |
| | |
| Pipelines(d)(e) – 3.2% | |
| | Cheniere Corpus Christi Holdings LLC (BB-/Ba3) | |
| | 2,459,000 | | | | 5.125 | | | | 06/30/27 | | | | 2,532,770 | |
| | Cheniere Energy Partners LP (BB/Ba2) | |
| | 3,914,000 | | | | 5.250 | | | | 10/01/25 | | | | 4,002,065 | |
| | | | | | | | | | | | | | |
| | | | | | | | | | | | | 6,534,835 | |
| | |
| Real Estate Investment Trust(d)(e) – 0.2% | |
| Uniti Group LP/Uniti Group Finance, Inc./CSL Capital LLC
(B+/B1) |
|
| | 364,000 | | | | 6.000 | | | | 04/15/23 | | | | 347,620 | |
| | |
| Retailing(d)(e) – 1.0% | |
| | PetSmart, Inc. (B/Ba3)(e) | |
| | 2,284,000 | | | | 5.875 | | | | 06/01/25 | | | | 1,992,790 | |
| | |
| Telecommunications – Wireless – 0.7% | |
| | Hughes Satellite Systems Corp. (BBB-/Ba2) | |
| | 1,353,000 | | | | 5.250 | | | | 08/01/26 | | | | 1,407,120 | |
| | |
| TOTAL OTHER SECURED DEBT
OBLIGATIONS |
| | $ | 31,695,980 | |
| | |
| | TOTAL SECURED DEBT OBLIGATIONS | |
| | (Cost $80,613,374) | | | $ | 80,245,427 | |
| | |
| | | | | | | | | | | | | | |
| Unsecured Debt Obligations – 46.2% | |
| Aerospace & Defense – 3.5% | |
| | Bombardier, Inc. (B-/B3)(e) | |
| $ | 614,000 | | | | 6.000 | %(d) | | | 10/15/22 | | | $ | 595,580 | |
| | 1,935,000 | | | | 6.125 | | | | 01/15/23 | | | | 1,862,437 | |
| | 578,000 | | | | 7.500 | (d) | | | 03/15/25 | | | | 577,278 | |
| | TransDigm, Inc. (B-/B3)(d) | |
| | 359,000 | | | | 6.500 | | | | 05/15/25 | | | | 369,321 | |
| | 806,000 | | | | 6.375 | | | | 06/15/26 | | | | 826,150 | |
| | Triumph Group, Inc. (B-/B3)(d) | |
| | 844,000 | | | | 4.875 | | | | 04/01/21 | | | | 823,955 | |
| | 226,000 | | | | 5.250 | | | | 06/01/22 | | | | 220,350 | |
| | 1,758,000 | | | | 7.750 | (e) | | | 08/15/25 | | | | 1,845,900 | |
| | | | | | | | | | | | | | |
| | | | | | | | | | | | | 7,120,971 | |
| | |
| | |
| 18 | | The accompanying notes are an integral part of these financial statements. |
GOLDMAN SACHS LONG SHORT CREDIT STRATEGIES FUND
| | | | | | | | | | | | | | |
Principal
Amount | | | Interest
Rate | | | Maturity
Date | | | Value | |
| Unsecured Debt Obligations – (continued) | |
| Automotive – 7.7% | |
| | Adient Global Holdings Ltd. (BB/Ba3)(d)(e) | |
| $ | 2,866,000 | | | | 4.875 | % | | | 08/15/26 | | | $ | 2,930,485 | |
| | Allison Transmission, Inc. (NR/NR)(d)(e) | |
| | 561,000 | | | | 4.750 | | | | 10/01/27 | | | | 565,208 | |
| | Cooper-Standard Automotive, Inc. (B+/B2)(d)(e) | |
| | 2,655,000 | | | | 5.625 | | | | 11/15/26 | | | | 2,711,419 | |
| | Dana, Inc. (BB/B1) | |
| | 434,000 | | | | 6.000 | | | | 09/15/23 | | | | 455,700 | |
| | Delphi Jersey Technologies PLC (BB/B1)(e) | |
| | 451,000 | | | | 5.000 | | | | 10/01/25 | | | | 457,711 | |
| | General Motors Financial Co., Inc. (BBB/Baa3)(d) | |
| | 471,000 | | | | 5.250 | | | | 03/01/26 | | | | 511,297 | |
| | Navistar International Corp. (CCC+/Caa1)(d) | |
| | 3,985,000 | | | | 8.250 | | | | 11/01/21 | | | | 3,999,944 | |
| | Tenneco, Inc. (BB/Ba2)(d) | |
| | 765,000 | | | | 5.000 | | | | 07/15/26 | | | | 781,256 | |
| | Tesla, Inc. (B-/B3)(d)(e) | |
| | 3,482,000 | | | | 5.300 | | | | 08/15/25 | | | | 3,403,655 | |
| | | | | | | | | | | | | | |
| | | | | | | | | | | | | 15,816,675 | |
| | |
| Casino & Gaming(e) – 1.0% | |
| | CRC Escrow Issuer LLC Co. (B-/NR) | |
| | 2,122,000 | | | | 5.250 | | | | 10/15/25 | | | | 2,124,639 | |
| | |
| Chemicals(d)(e) – 0.6% | |
| | NOVA Chemicals Corp. (BB+/Ba2) | |
| | 1,185,000 | | | | 5.250 | | | | 08/01/23 | | | | 1,222,031 | |
| | |
| Commercial Services(d) – 1.4% | |
| | Booz Allen Hamilton, Inc. (B+/B1)(e) | |
| | 665,000 | | | | 5.125 | | | | 05/01/25 | | | | 670,819 | |
| | The Hertz Corp. (B-/B3) | |
| | 741,000 | | | | 5.875 | | | | 10/15/20 | | | | 731,737 | |
| | 1,478,000 | | | | 7.375 | | | | 01/15/21 | | | | 1,481,695 | |
| | | | | | | | | | | | | | |
| | | | | | | | | | | | | 2,884,251 | |
| | |
| Computer Hardware(d) – 0.9% | |
| | Seagate HDD Cayman (BB+/Baa3) | |
| | 2,023,000 | | | | 4.875 | | | | 06/01/27 | | | | 1,907,524 | |
| | |
| Diversified Financial Services – 2.6% | |
| | DAE Funding LLC (BB/Ba3)(d)(e) | |
| | 2,598,000 | | | | 5.000 | | | | 08/01/24 | | | | 2,662,950 | |
| | Jefferies Finance LLC/JFIN Co-Issuer Corp. (B/B1)(d)(e) | |
| | 227,000 | | | | 6.875 | | | | 04/15/22 | | | | 227,567 | |
| | 1,078,000 | | | | 7.250 | | | | 08/15/24 | | | | 1,079,347 | |
| | Navient Corp. (B+/Ba3) | |
| | 485,000 | | | | 8.000 | | | | 03/25/20 | | | | 535,791 | |
| | 182,000 | | | | 5.000 | | | | 10/26/20 | | | | 187,188 | |
| | 662,000 | | | | 6.625 | | | | 07/26/21 | | | | 709,630 | |
| | | | | | | | | | | | | | |
| | | | | | | | | | | | | 5,402,473 | |
| | |
| Electrical(d)(e) – 0.4% | |
| | Talen Energy Supply LLC (B+/B1) | |
| | 944,000 | | | | 9.500 | | | | 07/15/22 | | | | 873,200 | |
| | |
| Entertainment(d) – 0.4% | |
| | Cinemark USA, Inc. (BB/B2) | |
| | 406,000 | | | | 4.875 | | | | 06/01/23 | | | | 410,060 | |
| | |
| Unsecured Debt Obligations – (continued) | |
| Entertainment(d) – (continued) | |
| | Lions Gate Entertainment Corp. (B-/B2)(e) | |
| 493,000 | | | | 5.875 | | | | 11/01/24 | | | | 516,418 | |
| | | | | | | | | | | | | | |
| | | | | | | | | | | | | 926,478 | |
| | |
| Food & Drug Retailing(d)(e) – 4.8% | |
| | Dean Foods Co. (BB/B2) | |
| | 2,254,000 | | | | 6.500 | | | | 03/15/23 | | | | 2,287,810 | |
| FAGE International SA/FAGE USA Dairy Industry, Inc.
(BB-/B1) |
|
| | 2,357,000 | | | | 5.625 | | | | 08/15/26 | | | | 2,445,387 | |
| | Pilgrim’s Pride Corp. (NR/B1) | |
| | 441,000 | | | | 5.875 | | | | 09/30/27 | | | | 450,923 | |
| | Pilgrim’s Pride Corp. (BB-/B1) | |
| | 264,000 | | | | 5.750 | | | | 03/15/25 | | | | 272,250 | |
| | Rite Aid Corp. (B-/B3) | |
| | 4,515,000 | | | | 6.125 | | | | 04/01/23 | | | | 4,390,837 | |
| | | | | | | | | | | | | | |
| | | | | | | | | | | | | 9,847,207 | |
| | |
| Home Builders(d) – 1.2% | |
| Ashton Woods USA LLC/Ashton Woods Finance Co.
(B-/Caa1)(e) |
|
| | 626,000 | | | | 6.750 | | | | 08/01/25 | | | | 616,610 | |
| | AV Homes, Inc. (B-/B3) | |
| | 927,000 | | | | 6.625 | | | | 05/15/22 | | | | 950,175 | |
| | M/I Homes, Inc. (BB-/B1)(e) | |
| | 348,000 | | | | 5.625 | | | | 08/01/25 | | | | 354,960 | |
| | The New Home Co., Inc. (B-/B3) | |
| | 494,000 | | | | 7.250 | | | | 04/01/22 | | | | 510,055 | |
| | | | | | | | | | | | | | |
| | | | | | | | | | | | | 2,431,800 | |
| | |
| Machinery – Construction & Mining(d)(e) – 0.6% | |
| | Terex Corp. (BB/B2) | |
| | 1,172,000 | | | | 5.625 | | | | 02/01/25 | | | | 1,229,135 | |
| | |
| Media(d) – 3.6% | |
| | AMC Networks, Inc. (BB/Ba3) | |
| | 1,594,000 | | | | 4.750 | | | | 08/01/25 | | | | 1,603,963 | |
| | CBS Radio, Inc. (B-/B3)(e) | |
| | 460,000 | | | | 7.250 | | | | 11/01/24 | | | | 489,900 | |
| | CCO Holdings LLC/CCO Holdings Capital Corp. (BB/B1)(e) | |
| | 3,414,000 | | | | 5.750 | | | | 02/15/26 | | | | 3,580,432 | |
| | Cengage Learning, Inc. (CCC+/Caa2)(e) | |
| | 370,000 | | | | 9.500 | | | | 06/15/24 | | | | 319,125 | |
| | Sirius XM Radio, Inc. (BB/Ba3)(e) | |
| | 900,000 | | | | 5.375 | | | | 04/15/25 | | | | 951,750 | |
| | Videotron Ltd. (BB/Ba2)(e) | |
| | 377,000 | | | | 5.125 | | | | 04/15/27 | | | | 392,080 | |
| | | | | | | | | | | | | | |
| | | | | | | | | | | | | 7,337,250 | |
| | |
| Oil & Gas(d) – 3.8% | |
| | Covey Park Energy LLC/Covey Park Finance Corp. (B/B3)(e) | |
| | 471,000 | | | | 7.500 | | | | 05/15/25 | | | | 492,784 | |
| | CrownRock LP/CrownRock Finance, Inc. (B+/B3)(e) | |
| | 1,826,000 | | | | 7.125 | | | | 04/15/21 | | | | 1,885,345 | |
| | Extraction Oil & Gas, Inc. (B/B3)(e) | |
| | 763,000 | | | | 7.375 | | | | 05/15/24 | | | | 795,427 | |
| | |
| | |
| The accompanying notes are an integral part of these financial statements. | | 19 |
GOLDMAN SACHS LONG SHORT CREDIT STRATEGIES FUND
Schedule of Investments (continued)
September 30, 2017 (Unaudited)
| | | | | | | | | | | | | | |
Principal
Amount | | | Interest
Rate | | | Maturity
Date | | | Value | |
| Unsecured Debt Obligations – (continued) | |
| Oil & Gas(d) – (continued) | |
| | Gulfport Energy Corp. (B+/B2) | |
| $ | 2,158,000 | | | | 6.625 | % | | | 05/01/23 | | | $ | 2,201,160 | |
| | 862,000 | | | | 6.375 | | | | 05/15/25 | | | | 872,775 | |
| | QEP Resources, Inc. (BB+/Ba3) | |
| | 467,000 | | | | 5.250 | | | | 05/01/23 | | | | 454,158 | |
| | Seven Generations Energy Ltd. (B+/Ba3)(e) | |
| | 1,270,000 | | | | 5.375 | | | | 09/30/25 | | | | 1,279,525 | |
| | | | | | | | | | | | | | |
| | | | | | | | | | | | | 7,981,174 | |
| | |
| Oil & Gas Services(d) – 5.2% | |
| | Rowan Cos., Inc. (B+/B2) | |
| | 435,000 | | | | 4.875 | | | | 06/01/22 | | | | 406,725 | |
| | SESI LLC (BB-/B3) | |
| | 1,406,000 | | | | 7.125 | | | | 12/15/21 | | | | 1,437,635 | |
| | 1,313,000 | | | | 7.750 | (e) | | | 09/15/24 | | | | 1,368,803 | |
| | Transocean, Inc. (B/Caa1) | |
| | 819,000 | | | | 5.800 | | | | 10/15/22 | | | | 804,667 | |
| | Trinidad Drilling Ltd. (BB-/Caa1)(e) | |
| | 415,000 | | | | 6.625 | | | | 02/15/25 | | | | 388,544 | |
| | Weatherford International Ltd. (B/Caa1) | |
| | 3,861,000 | | | | 7.750 | | | | 06/15/21 | | | | 4,015,440 | |
| | 1,899,000 | | | | 4.500 | | | | 04/15/22 | | | | 1,761,322 | |
| | 545,000 | | | | 8.250 | | | | 06/15/23 | | | | 561,350 | |
| | | | | | | | | | | | | | |
| | | | | | | | | | | | | 10,744,486 | |
| | |
| Pharmaceuticals(d)(e) – 0.8% | |
| | Concordia International Corp. (C/Ca) | |
| | 955,000 | | | | 7.000 | | | | 04/15/23 | | | | 162,350 | |
| | Valeant Pharmaceuticals International, Inc. (B-/Caa1) | |
| | 1,388,000 | | | | 6.375 | | | | 10/15/20 | | | | 1,391,470 | |
| | | | | | | | | | | | | | |
| | | | | | | | | | | | | 1,553,820 | |
| | |
| Pipelines(d)(e) – 1.5% | |
| Tallgrass Energy Partners LP/Tallgrass Energy Finance Corp.
(BB+/Ba3) |
|
| | 1,843,000 | | | | 5.500 | | | | 09/15/24 | | | | 1,893,683 | |
| Tallgrass Energy Partners LP/Tallgrass Energy Finance Corp.
(BB+/Ba3) |
|
| | 1,290,000 | | | | 5.500 | | | | 01/15/28 | | | | 1,309,350 | |
| | | | | | | | | | | | | | |
| | | | | | | | | | | | | 3,203,033 | |
| | |
| Real Estate Investment Trust – 1.6% | |
| | iStar, Inc. (BB-/B1)(d) | |
| | 834,000 | | | | 5.250 | | | | 09/15/22 | | | | 845,467 | |
| | SBA Communications Corp. (B+/NR)(e) | |
| | 435,000 | | | | 4.000 | | | | 10/01/22 | | | | 437,175 | |
| Uniti Group LP/Uniti Fiber Holdings, Inc./CSL Capital LLC
(CCC+/Caa1)(d)(e) |
|
| | 2,326,000 | | | | 7.125 | | | | 12/15/24 | | | | 1,977,100 | |
| | | | | | | | | | | | | | |
| | | | | | | | | | | | | 3,259,742 | |
| | |
| Retailing(d) – 0.4% | |
| | PetSmart, Inc. (CCC+/B3)(e) | |
| | 1,032,000 | | | | 8.875 | | | | 06/01/25 | | | | 820,440 | |
| | |
| Unsecured Debt Obligations – (continued) | |
| Software(d) – 0.5% | |
| | Donnelley Financial Solutions, Inc. (B/B3) | |
| 896,000 | | | | 8.250 | | | | 10/15/24 | | | | 959,840 | |
| | |
| Telecommunication Services – 3.5% | |
| | Frontier Communications Corp. (B/B2) | |
| | 830,000 | | | | 8.500 | | | | 04/15/20 | | | | 805,100 | |
| | Inmarsat Finance PLC (BB+/Ba2)(d)(e) | |
| | 1,404,000 | | | | 4.875 | | | | 05/15/22 | | | | 1,434,011 | |
| | 604,000 | | | | 6.500 | | | | 10/01/24 | | | | 651,741 | |
| | Intelsat Jackson Holdings SA (CCC+/Caa2)(d)(e) | |
| | 611,000 | | | | 9.750 | | | | 07/15/25 | | | | 620,165 | |
| | ViaSat, Inc. (BB-/NR)(d)(e) | |
| | 3,669,000 | | | | 5.625 | | | | 09/15/25 | | | | 3,691,931 | |
| | | | | | | | | | | | | | |
| | | | | | | | | | | | | 7,202,948 | |
| | |
| Utilities(d) – 0.2% | |
| Suburban Propane Partners LP/Suburban Energy Finance Corp.
(BB-/B1) |
|
| | 488,000 | | | | 5.500 | | | | 06/01/24 | | | | 486,780 | |
| | |
| | TOTAL UNSECURED DEBT OBLIGATIONS | |
| | (Cost $95,937,526) | | | $ | 95,335,897 | |
| | |
| | | | | | | | | | | | | | |
| | U.S. Treasury Obligation(f) – 2.4% | | | | | |
| | United States Treasury Bill | |
| $ | 5,000,000 | | | | 0.000 | % | | | 11/02/17 | | | $ | 4,995,800 | |
| | (Cost $4,996,530) | | | | | | | | | |
| | |
| | | | | | | | |
| Shares | | | Description | | Value | |
| | Common Stock* – 0.2% | | | | |
| Oil, Gas & Consumable Fuels – 0.2% | | | |
| | 1,141,924 | | | Prairie Provident Resources, Inc. | | $ | 360,860 | |
| | (Cost $2,946,424) | | | | |
| | |
| | |
| Units | | | Expiration
Date | | Value | |
| Warrant(c) – 0.0% | |
| | Jack Cooper Enterprises, Inc. (NR/NR) | |
| | 1,734 | | | 10/29/17 | | $ | 8,670 | |
| | |
| | |
| 20 | | The accompanying notes are an integral part of these financial statements. |
GOLDMAN SACHS LONG SHORT CREDIT STRATEGIES FUND
| | | | | | | | |
| Shares | | | Distribution
Rate | | Value | |
| Investment Company(g) – 9.9% | |
| Goldman Sachs Financial Square Government Fund –
Institutional Shares |
|
| | 20,359,346 | | | 0.914% | | $ | 20,359,346 | |
| | (Cost $20,359,346) | |
| | |
| | TOTAL INVESTMENTS – 97.6% | |
| | (Cost $204,853,200) | | $ | 201,306,000 | |
| | |
| OTHER ASSETS IN EXCESS OF
LIABILITIES – 2.4% | | | 4,863,067 | |
| | |
| | NET ASSETS – 100.0% | | $ | 206,169,067 | |
| | |
| | |
| The percentage shown for each investment category reflects the value of investments in that category as a percentage of net assets. |
* | | Non-income producing security. |
(a) | | Bank Loans often require prepayments from excess cash flows or permit the borrower to repay at its election. The degree to which borrowers repay, whether as a contractual requirement or at their election, cannot be predicted with accuracy. As a result, the actual remaining maturity may be substantially less than the stated maturities shown. The stated interest rate represents the weighted average interest rate of all contracts within the bank loan facility on September 30, 2017. Bank Loans typically have rates of interest which are predetermined either daily, monthly, quarterly or semi-annually by reference to a base lending rate, plus a premium. These base lending rates are primarily the London-Interbank Offered Rate (“LIBOR”), and secondarily the prime rate offered by one or more major United States banks (the “Prime Rate”) and the certificate of deposit (“CD”) rate or other base lending rates used by commercial lenders. |
| | |
(b) | | Variable rate security. Interest rate disclosed is that which is in effect on September 30, 2017. |
(c) | | Significant unobservable inputs were used in the valuation of this portfolio security; i.e. Level 3. |
(d) | | Security with “Call” features with resetting interest rates. Maturity dates disclosed are the final maturity dates. |
(e) | | Exempt from registration under Rule 144A of the Securities Act of 1933. Such securities may be deemed liquid by the investment adviser and may be resold, normally to qualified institutional buyers in transactions exempt from registration. Total market value of Rule 144A securities amounts to $86,854,014, which represents approximately 42.1% of net assets as of September 30, 2017 and are unaudited. |
(f) | | Issued with a zero coupon. Income is recognized through the accretion of discount. |
(g) | | Represents an Affiliated Issuer. |
Security ratings disclosed, if any, are obtained from Standard & Poor’s/Moody’s Investors Service and are unaudited. A description of the ratings is available in the Fund’s Statement of Additional Information.
| | |
|
Currency Abbreviations: |
USD | | —U.S. Dollar |
| | |
Investment Abbreviations: |
LIBOR | | —London Interbank Offered Rate |
LLC | | —Limited Liability Company |
LP | | —Limited Partnership |
PLC | | —Public Limited Company |
|
|
| ADDITIONAL INVESTMENT INFORMATION |
SWAP CONTRACTS — At September 30, 2017, the Fund had the following swap contracts:
CENTRALLY CLEARED INTEREST RATE SWAP CONTRACTS
| | | | | | | | | | | | | | | | | | | | | | | | |
| Payments Made by the Fund | | Payments
Received
by Fund | | | Termination
Date | | | Notional
Amount
(000s)(a) | | | Market
Value | | | Upfront
Premium
(Received) Paid | | | Unrealized
Appreciation/
(Depreciation) | |
2.250% | | | 3M LIBOR | | | | 12/20/20 | | | $ | 1,910 | | | $ | (19,001 | ) | | $ | (28,055 | ) | | $ | 9,054 | |
2.000(b) | | | 3M LIBOR(c) | | | | 03/21/25 | | | | 17,586 | | | | 267,749 | | | | 150,395 | | | | 117,354 | |
| TOTAL | | | | | | | | | | | | | | | | | | $ | 122,340 | | | $ | 126,408 | |
| | (a) | | Represents forward starting interest rate swaps whose effective dates of commencement of accruals and cash flows occur subsequent to September 30, 2017. |
| | (b) | | Payments made semi-annually. |
| | (c) | | Payments made quarterly. |
| | |
| The accompanying notes are an integral part of these financial statements. | | 21 |
GOLDMAN SACHS LONG SHORT CREDIT STRATEGIES FUND
Schedule of Investments (continued)
September 30, 2017 (Unaudited)
|
| ADDITIONAL INVESTMENT INFORMATION (continued) |
CENTRALLY CLEARED CREDIT DEFAULT SWAP CONTRACT
| | | | | | | | | | | | | | | | | | | | | | | | | | |
| Referenced Obligation/Index | | Financing Rate
Received/(Paid)
by the Fund(a) | | Credit
Spread at
September 30,
2017(b) | | | Termination
Date | | | Notional
Amount
(000s) | | | Market Value | | | Upfront
Premiums
(Received) Paid | | | Unrealized
Appreciation/
(Depreciation) | |
Protection Purchased: | |
| | | | | | | |
CDX.NA.HY Index 28 | | (1.000)% | | | 3.135 | % | | | 06/20/22 | | | $ | 110,000 | | | $ | (8,640,571 | ) | | $ | (7,892,458 | ) | | $ | (748,113 | ) |
| | (a) | | Payments made quarterly. |
| | (b) | | Credit spread on the referenced obligation, together with the term of the swap contract, are indicators of payment/performance risk. The likelihood of a credit event occurring which would require a fund or its counterparty to make a payment or otherwise be required to perform under the swap contract is generally greater as the credit spread and the term of the swap contract increase. |
| | |
|
Abbreviation: |
CDX.NA.HY Index 28 | | —CDX North America High Yield Index 28 |
|
| | |
| 22 | | The accompanying notes are an integral part of these financial statements. |
GOLDMAN SACHS STRATEGIC MACRO FUND
Consolidated Schedule of Investments
September 30, 2017 (Unaudited)
| | | | | | | | | | | | | | |
Principal
Amount | | | Interest
Rate | | | Maturity
Date | | | Value | |
| Foreign Sovereign Debt Obligations – 36.4% | |
| Argentinian Peso – 3.4% | |
| Republic of Argentina | |
| | (Argentina Deposit Rates + 3.000%)(a) | |
| ARS | 835,000 | | | | 23.662 | % | | | 10/09/17 | | | $ | 48,037 | |
| | (Argentina Deposit Rates + 2.750%) | |
| | 4,010,000 | | | | 22.838 | (a) | | | 03/01/18 | | | | 230,816 | |
| | 600,000 | | | | 22.750 | | | | 03/05/18 | | | | 34,392 | |
| | (Argentina Deposit Rates + 2.500%)(a) | |
| | 230,000 | | | | 22.710 | | | | 03/11/19 | | | | 13,380 | |
| | (Argentina Deposit Rates + 3.250%) | |
| | 875,000 | | | | 23.338 | (a) | | | 03/01/20 | | | | 51,857 | |
| | 7,635,000 | | | | 26.250 | (a) | | | 06/21/20 | | | | 463,485 | |
| | 50,000 | | | | 18.200 | | | | 10/03/21 | | | | 2,974 | |
| | 180,000 | | | | 16.000 | | | | 10/17/23 | | | | 10,800 | |
| | 70,000 | | | | 15.500 | | | | 10/17/26 | | | | 4,300 | |
| | | | | | | | | | | | | | |
| | | | | | | | | | | | | 860,041 | |
| | |
| Brazilian Real – 0.2% | |
| | Brazil Notas do Tesouro Nacional | |
| BRL | 126,296 | | | | 6.000 | | | | 08/15/50 | | | | 44,882 | |
| | |
| Dominican Peso – 0.6% | |
| | Dominican Republic | |
| DOP | 6,700,000 | | | | 11.375 | | | | 07/06/29 | | | | 146,036 | |
| | |
| Hungarian Forint – 2.0% | |
| | Hungary Government Bond | |
| HUF | 26,580,000 | | | | 3.000 | | | | 06/26/24 | | | | 107,623 | |
| | 102,510,000 | | | | 2.750 | | | | 12/22/26 | | | | 396,287 | |
| | | | | | | | | | | | | | |
| | | | | | | | | | | | | 503,910 | |
| | |
| Japanese Yen – 18.8% | |
| | Japan Treasury Discount Bill(b) | |
| JPY | 257,000,000 | | | | 0.000 | | | | 12/18/17 | | | | 2,284,565 | |
| | Japanese Government CPI Linked Bond | |
| | 265,111,300 | | | | 0.100 | | | | 03/10/26 | | | | 2,451,440 | |
| | | | | | | | | | | | | | |
| | | | | | | | | | | | | 4,736,005 | |
| | |
| Mexican Peso – 0.7% | |
| | United Mexican States | |
| MXN | 3,006,300 | | | | 8.000 | | | | 11/07/47 | | | | 179,895 | |
| | |
| Russian Ruble – 5.6% | |
| | Russian Federation Bond | |
| RUB | 21,010,000 | | | | 7.750 | | | | 09/16/26 | | | | 371,237 | |
| | 60,640,000 | | | | 7.700 | | | | 03/23/33 | | | | 1,051,667 | |
| | | | | | | | | | | | | | |
| | | | | | | | | | | | | 1,422,904 | |
| | |
| South African Rand – 5.1% | |
| | Republic of South Africa | |
| ZAR | 1,610,000 | | | | 8.000 | | | | 01/31/30 | | | | 109,191 | |
| | 1,540,000 | | | | 6.250 | | | | 03/31/36 | | | | 81,952 | |
| | 12,940,000 | | | | 8.500 | | | | 01/31/37 | | | | 860,432 | |
| | 1,630,000 | | | | 9.000 | | | | 01/31/40 | | | | 112,000 | |
| | 740,000 | | | | 8.750 | | | | 01/31/44 | | | | 49,376 | |
| | 1,320,000 | | | | 8.750 | | | | 02/28/48 | | | | 88,181 | |
| | | | | | | | | | | | | | |
| | | | | | | | | | | | | 1,301,132 | |
| | |
| | TOTAL FOREIGN SOVEREIGN DEBT OBLIGATIONS | |
| | (Cost $9,065,273) | | | $ | 9,194,805 | |
| | |
| Mortgage-Backed Obligations – 8.8% | |
| Collateralized Mortgage Obligations – 8.8% | |
| Interest Only – 8.8% | |
| FHLMC REMIC Series 4416, Class DS (-1x1M LIBOR +
6.100%)(a) |
|
| $ | 1,353,754 | | | | 4.873 | % | | | 12/15/44 | | | $ | 246,174 | |
| FHLMC REMIC Series 4431, Class ST (-1x1M LIBOR +
6.100%)(a) |
|
| | 755,238 | | | | 4.873 | | | | 01/15/45 | | | | 150,499 | |
| | FHLMC STRIPS Series 304, Class C45 | |
| | 385,986 | | | | 3.000 | | | | 12/15/27 | | | | 35,533 | |
| FNMA REMIC Series 2013-96, Class SW (-1x1M LIBOR +
6.100%)(a) |
|
| | 369,548 | | | | 4.866 | | | | 09/25/43 | | | | 59,606 | |
| FNMA REMIC Series 2014-19, Class MS (-1x1M LIBOR +
6.600%)(a) |
|
| | 342,934 | | | | 5.366 | | | | 11/25/39 | | | | 37,326 | |
| FNMA REMIC Series 2015-20, Class ES (-1x1M LIBOR +
6.150%)(a) |
|
| | 741,190 | | | | 4.916 | | | | 04/25/45 | | | | 150,969 | |
| FNMA REMIC Series 2015-22, Class DS (-1x1M LIBOR +
6.200%)(a) |
|
| | 718,666 | | | | 4.963 | | | | 04/25/45 | | | | 148,736 | |
| FNMA REMIC Series 2015-79, Class SA (-1x1M LIBOR
+ 6.250%)(a) |
|
| | 572,401 | | | | 5.016 | | | | 11/25/45 | | | | 95,993 | |
| FNMA REMIC Series 2015-86, Class BS (-1x1M LIBOR +
5.700%)(a) |
|
| | 327,023 | | | | 4.463 | | | | 11/25/45 | | | | 46,682 | |
| GNMA REMIC Series 2010-1, Class SD (-1x1M LIBOR +
5.790%)(a) |
|
| | 85,716 | | | | 4.554 | | | | 01/20/40 | | | | 13,585 | |
| GNMA REMIC Series 2010-31, Class SA (-1x1M LIBOR +
5.750%)(a) |
|
| | 551,661 | | | | 4.514 | | | | 03/20/40 | | | | 81,402 | |
| GNMA REMIC Series 2010-37, Class SG (-1x1M LIBOR +
5.700%)(a) |
|
| | 385,851 | | | | 4.464 | | | | 03/20/40 | | | | 56,551 | |
| GNMA REMIC Series 2010-85, Class SN (-1x1M LIBOR +
5.940%)(a) |
|
| | 321,107 | | | | 4.704 | | | | 07/20/40 | | | | 58,804 | |
| GNMA REMIC Series 2010-90, Class ES (-1x1M LIBOR +
5.950%)(a) |
|
| | 204,271 | | | | 4.714 | | | | 07/20/40 | | | | 32,077 | |
| GNMA REMIC Series 2013-113, Class SA (-1x1M LIBOR +
6.700%)(a) |
|
| | 345,840 | | | | 5.464 | | | | 08/20/43 | | | | 64,128 | |
| GNMA REMIC Series 2013-134, Class DS (-1x1M LIBOR +
6.100%)(a) |
|
| | 188,448 | | | | 4.864 | | | | 09/20/43 | | | | 30,423 | |
| | GNMA REMIC Series 2013-183, Class NI | |
| | 657,515 | | | | 4.500 | | | | 10/20/42 | | | | 79,550 | |
| GNMA REMIC Series 2014-41, Class SA (-1x1M LIBOR +
6.100%)(a) |
|
| | 223,169 | | | | 4.864 | | | | 03/20/44 | | | | 36,897 | |
| GNMA REMIC Series 2015-111, Class SM (-1x1M LIBOR +
6.200%)(a) |
|
| | 565,606 | | | | 4.964 | | | | 08/20/45 | | | | 93,282 | |
| GNMA REMIC Series 2015-112, Class SB (-1x1M LIBOR +
5.740%)(a) |
|
| | 543,059 | | | | 4.504 | | | | 08/20/45 | | | | 79,247 | |
| | |
| | |
| The accompanying notes are an integral part of these financial statements. | | 23 |
GOLDMAN SACHS STRATEGIC MACRO FUND
Consolidated Schedule of Investments (continued)
September 30, 2017 (Unaudited)
| | | | | | | | | | | | | | |
Principal
Amount | | | Interest
Rate | | | Maturity
Date | | | Value | |
| Mortgage-Backed Obligations – (continued) | |
| Collateralized Mortgage Obligations – (continued) | |
| Interest Only – (continued) | | | | | | | |
| GNMA REMIC Series 2015-123, Class SE (-1x1M LIBOR +
5.720%)(a) |
|
| $ | 547,933 | | | | 4.484 | % | | | 09/20/45 | | | $ | 79,616 | |
| GNMA REMIC Series 2015-141, Class HS (-1x1M LIBOR +
6.200%)(a) |
|
| | 248,245 | | | | 4.964 | % | | | 10/20/45 | | | | 41,173 | |
| GNMA REMIC Series 2015-142, Class SA (-1x1M LIBOR +
5.720%)(a) |
|
| | 683,422 | | | | 4.484 | | | | 10/20/45 | | | | 99,303 | |
| GNMA REMIC Series 2015-168, Class SD (-1x1M LIBOR +
6.200%)(a) |
|
| | 290,485 | | | | 4.964 | | | | 11/20/45 | | | | 47,199 | |
| | GNMA REMIC Series 2015-63, Class IY | |
| | 792,105 | | | | 4.000 | | | | 05/20/45 | | | | 130,735 | |
| | GNMA REMIC Series 2015-95, Class GI | |
| | 592,499 | | | | 4.500 | | | | 07/16/45 | | | | 125,511 | |
| GNMA REMIC Series 2016-6, Class S (-1x1M LIBOR +
5.650%)(a) |
|
| | 613,947 | | | | 4.414 | | | | 01/20/46 | | | | 89,225 | |
| | |
| | TOTAL MORTGAGE-BACKED OBLIGATIONS | |
| | (Cost $2,203,382) | | | $ | 2,210,226 | |
| | |
| | | | | | | | | | | | | | |
| U.S. Treasury Obligations – 26.9% | |
| | United States Treasury Bond | |
| $ | 100,000 | | | | 3.000 | % | | | 05/15/47 | | | $ | 102,917 | |
| | United States Treasury Inflation Indexed Bonds | |
| | 723,457 | | | | 0.250 | | | | 01/15/25 | | | | 716,715 | |
| | 516,125 | | | | 0.375 | | | | 07/15/25 | | | | 516,553 | |
| | 2,946,429 | | | | 0.625 | | | | 01/15/26 | | | | 2,987,679 | |
| | 50,704 | | | | 0.875 | | | | 02/15/47 | | | | 50,017 | |
| | United States Treasury Strip Coupon(b) | |
| | 1,000,000 | | | | 0.000 | | | | 05/15/35 | | | | 615,940 | |
| | 2,600,000 | | | | 0.000 | | | | 11/15/35 | | | | 1,576,042 | |
| | 400,000 | | | | 0.000 | | | | 08/15/36 | | | | 236,624 | |
| | |
| | TOTAL U.S. TREASURY OBLIGATIONS | | | | | |
| | (Cost $7,095,119) | | | $ | 6,802,487 | |
| | |
| | | | | | | | |
| Shares | | | Distribution
Rate | | Value | |
| Investment Company(c) – 20.5% | |
| Goldman Sachs Financial Square Government Fund –
Institutional Shares |
|
| | 5,183,338 | | | 0.927% | | $ | 5,183,338 | |
| (Cost $5,183,338) | | | |
| | |
| | TOTAL INVESTMENTS – 92.6% | | | | |
| | (Cost $23,547,112) | | $ | 23,390,856 | |
| | |
| OTHER ASSETS IN EXCESS OF
LIABILITIES – 7.4% | | | 1,864,206 | |
| | |
| | NET ASSETS – 100.0% | | $ | 25,255,062 | |
| | |
| | |
| The percentage shown for each investment category reflects the value of investments in that category as a percentage of net assets. |
(a) | | Variable rate security. Interest rate disclosed is that which is in effect on September 30, 2017. |
(b) | | Issued with a zero coupon. Income is recognized through the accretion of discount. |
(c) | | Represents an Affiliated Issuer. |
| | |
| 24 | | The accompanying notes are an integral part of these financial statements. |
GOLDMAN SACHS STRATEGIC MACRO FUND
| | |
|
Currency Abbreviations: |
ARS | | —Argentine Peso |
AUD | | —Australian Dollar |
BRL | | —Brazilian Real |
CAD | | —Canadian Dollar |
CHF | | —Swiss Franc |
CLP | | —Chilean Peso |
CNH | | —Chinese Yuan Renminbi Offshore |
CNY | | —Chinese Yuan Renminbi |
COP | | —Colombian Peso |
CZK | | —Czech Koruna |
DOP | | —Dominican Peso |
EGP | | —Egyptian Pound |
EUR | | —Euro |
GBP | | —British Pound |
HKD | | —Hong Kong Dollar |
HUF | | —Hungarian Forint |
IDR | | —Indonesian Rupiah |
INR | | —Indian Rupee |
JPY | | —Japanese Yen |
KRW | | —South Korean Won |
MXN | | —Mexican Peso |
NOK | | —Norwegian Krone |
NZD | | —New Zealand Dollar |
PEN | | —Peruvian Nuevo Sol |
PHP | | —Philippine Peso |
PLN | | —Polish Zloty |
RUB | | —Russian Ruble |
SEK | | —Swedish Krona |
SGD | | —Singapore Dollar |
THB | | —Thai Baht |
TRY | | —Turkish Lira |
TWD | | —Taiwan Dollar |
USD | | —U.S. Dollar |
ZAR | | —South African Rand |
|
|
Investment Abbreviations: |
AUDOR | | —Australian Dollar Offered Rate |
BP | | —British Pound Offered Rate |
BUBOR | | —Budapest Interbank Offered Rate |
CDOR | | —Canadian Dollar Offered Rate |
CHFOR | | —Swiss Franc Offered Rate |
CPI | | —Consumer Price Index |
EURO | | —Euro Offered Rate |
FHLMC | | —Federal Home Loan Mortgage Corp. |
FNMA | | —Federal National Mortgage Association |
GNMA | | —Government National Mortgage Association |
HIBOR | | —Hong Kong Interbank Offered Rate |
JYOR | | —Japanese Yen Offered Rate |
LIBOR | | —London Interbank Offered Rate |
LLC | | —Limited Liability Company |
MIBOR | | —MIBOR – Mumbai Interbank Offered Rate |
NIBOR | | —Norwegian Interbank Offered Rate |
OTC | | —Over the Counter |
PLC | | —Public Limited Company |
PRIBOR | | —Prague Interbank Offered Rate |
REMIC | | —Real Estate Mortgage Investment Conduit |
SHIBOR | | —Shanghai Interbank Offered Rate |
STIBOR | | —Stockholm Interbank Offered Rate |
STRIPS | | —Separate Trading of Registered Interest and Principal of Securities |
TIIE | | —La Tasa de Interbank Equilibrium Interest Rate |
WIBOR | | —Warsaw Interbank Offered Rate |
|
|
| ADDITIONAL INVESTMENT INFORMATION |
FORWARD FOREIGN CURRENCY EXCHANGE CONTRACTS — At September 30, 2017, the Fund had the following forward foreign currency exchange contracts:
FORWARD FOREIGN CURRENCY EXCHANGE CONTRACTS WITH UNREALIZED GAIN
| | | | | | | | | | | | | | | | | | | | | | | | |
| Counterparty | | Currency
Purchased | | | Currency
Sold | | | Current
Value | | | Settlement
Date | | | Unrealized
Gain | |
Citibank NA | | ARS | | | 1,355,995 | | | USD | | | 77,477 | | | $ | 78,061 | | | | 10/06/17 | | | $ | 584 | |
| | ARS | | | 3,780,218 | | | USD | | | 214,207 | | | | 217,117 | | | | 10/10/17 | | | | 2,910 | |
| | ARS | | | 475,294 | | | USD | | | 27,206 | | | | 27,283 | | | | 10/11/17 | | | | 77 | |
| | ARS | | | 240,968 | | | USD | | | 13,781 | | | | 13,824 | | | | 10/12/17 | | | | 43 | |
| | ARS | | | 1,196,175 | | | USD | | | 68,108 | | | | 68,115 | | | | 10/25/17 | | | | 8 | |
| | ARS | | | 942,818 | | | USD | | | 52,669 | | | | 53,536 | | | | 10/30/17 | | | | 866 | |
| | ARS | | | 996,302 | | | USD | | | 55,890 | | | | 56,511 | | | | 11/02/17 | | | | 621 | |
| | ARS | | | 1,195,348 | | | USD | | | 67,181 | | | | 67,615 | | | | 11/07/17 | | | | 434 | |
| | ARS | | | 1,209,480 | | | USD | | | 68,140 | | | | 68,377 | | | | 11/08/17 | | | | 238 | |
| | ARS | | | 362,805 | | | USD | | | 20,405 | | | | 20,455 | | | | 11/13/17 | | | | 50 | |
| | ARS | | | 850,217 | | | USD | | | 47,711 | | | | 47,831 | | | | 11/17/17 | | | | 120 | |
| | AUD | | | 248,543 | | | USD | | | 194,366 | | | | 194,772 | | | | 12/20/17 | | | | 407 | |
| | BRL | | | 8,007,525 | | | USD | | | 2,523,048 | | | | 2,527,178 | | | | 10/03/17 | | | | 4,129 | |
| | BRL | | | 3,660,342 | | | USD | | | 1,141,800 | | | | 1,150,242 | | | | 11/03/17 | | | | 8,442 | |
| | CAD | | | 36,559 | | | AUD | | | 37,000 | | | | 29,316 | | | | 12/20/17 | | | | 320 | |
| | CAD | | | 41,661 | | | USD | | | 33,402 | | | | 33,406 | | | | 12/20/17 | | | | 5 | |
| | CHF | | | 439,094 | | | EUR | | | 381,542 | | | | 455,996 | | | | 12/20/17 | | | | 2,967 | |
| | CNH | | | 1,959,553 | | | USD | | | 292,626 | | | | 293,379 | | | | 12/20/17 | | | | 752 | |
| | |
| The accompanying notes are an integral part of these financial statements. | | 25 |
GOLDMAN SACHS STRATEGIC MACRO FUND
Consolidated Schedule of Investments (continued)
September 30, 2017 (Unaudited)
|
| ADDITIONAL INVESTMENT INFORMATION (continued) |
FORWARD FOREIGN CURRENCY EXCHANGE CONTRACTS WITH UNREALIZED GAIN (continued)
| | | | | | | | | | | | | | | | | | | | | | | | |
| Counterparty | | Currency
Purchased | | | Currency
Sold | | | Current
Value | | | Settlement
Date | | | Unrealized
Gain | |
Citibank NA (continued) | | CZK | | | 25,016,451 | | | EUR | | | 948,254 | | | $ | 1,138,172 | | | | 10/03/17 | | | $ | 17,247 | |
| | CZK | | | 8,410,689 | | | EUR | | | 315,000 | | | | 383,401 | | | | 11/09/17 | | | | 10,306 | |
| | CZK | | | 12,541,592 | | | EUR | | | 468,872 | | | | 572,084 | | | | 11/21/17 | | | | 16,376 | |
| | CZK | | | 8,634,017 | | | EUR | | | 327,835 | | | | 393,862 | | | | 11/22/17 | | | | 5,291 | |
| | CZK | | | 7,706,721 | | | EUR | | | 296,014 | | | | 352,523 | | | | 12/20/17 | | | | 1,048 | |
| | CZK | | | 14,729,432 | | | EUR | | | 552,274 | | | | 674,652 | | | | 01/03/18 | | | | 18,351 | |
| | CZK | | | 872,683 | | | USD | | | 39,674 | | | | 39,736 | | | | 10/18/17 | | | | 62 | |
| | EGP | | | 170,088 | | | USD | | | 9,269 | | | | 9,556 | | | | 11/03/17 | | | | 286 | |
| | EGP | | | 530,700 | | | USD | | | 29,000 | | | | 29,761 | | | | 11/09/17 | | | | 761 | |
| | EGP | | | 627,802 | | | USD | | | 30,850 | | | | 34,809 | | | | 12/19/17 | | | | 3,959 | |
| | EGP | | | 189,454 | | | USD | | | 9,221 | | | | 10,496 | | | | 12/22/17 | | | | 1,275 | |
| | EGP | | | 465,980 | | | USD | | | 23,299 | | | | 25,697 | | | | 01/09/18 | | | | 2,398 | |
| | EGP | | | 503,208 | | | USD | | | 24,547 | | | | 27,635 | | | | 01/24/18 | | | | 3,089 | |
| | EGP | | | 633,149 | | | USD | | | 30,885 | | | | 34,714 | | | | 01/30/18 | | | | 3,829 | |
| | EGP | | | 599,175 | | | USD | | | 31,669 | | | | 32,842 | | | | 01/31/18 | | | | 1,174 | |
| | EGP | | | 598,982 | | | USD | | | 29,726 | | | | 32,769 | | | | 02/07/18 | | | | 3,043 | |
| | EUR | | | 65,000 | | | CHF | | | 74,194 | | | | 77,178 | | | | 12/20/17 | | | | 128 | |
| | EUR | | | 32,714 | | | GBP | | | 28,868 | | | | 38,843 | | | | 12/20/17 | | | | 61 | |
| | EUR | | | 63,000 | | | HUF | | | 19,533,579 | | | | 74,804 | | | | 12/20/17 | | | | 431 | |
| | EUR | | | 256,000 | | | NOK | | | 2,386,086 | | | | 303,964 | | | | 12/20/17 | | | | 3,808 | |
| | EUR | | | 91,487 | | | PLN | | | 392,916 | | | | 108,627 | | | | 12/20/17 | | | | 925 | |
| | EUR | | | 83,000 | | | SEK | | | 789,279 | | | | 98,551 | | | | 12/20/17 | | | | 1,171 | |
| | EUR | | | 3,655,753 | | | USD | | | 4,313,094 | | | | 4,323,572 | | | | 10/12/17 | | | | 10,478 | |
| | EUR | | | 495,365 | | | USD | | | 585,875 | | | | 588,175 | | | | 12/20/17 | | | | 2,301 | |
| | GBP | | | 226,182 | | | EUR | | | 252,523 | | | | 303,854 | | | | 12/20/17 | | | | 4,018 | |
| | GBP | | | 57,000 | | | JPY | | | 8,565,675 | | | | 76,574 | | | | 12/20/17 | | | | 139 | |
| | GBP | | | 3,413,054 | | | USD | | | 4,579,124 | | | | 4,580,064 | | | | 11/16/17 | | | | 940 | |
| | GBP | | | 186,141 | | | USD | | | 247,939 | | | | 250,063 | | | | 12/20/17 | | | | 2,124 | |
| | HKD | | | 1,586,100 | | | USD | | | 203,009 | | | | 203,059 | | | | 10/03/17 | | | | 50 | |
| | HKD | | | 13,054,103 | | | USD | | | 1,674,264 | | | | 1,674,551 | | | | 12/20/17 | | | | 287 | |
| | HKD | | | 4,539,678 | | | USD | | | 583,000 | | | | 583,489 | | | | 03/27/18 | | | | 489 | |
| | IDR | | | 2,109,659,415 | | | USD | | | 155,174 | | | | 156,185 | | | | 11/02/17 | | | | 1,012 | |
| | IDR | | | 3,088,119,119 | | | USD | | | 226,236 | | | | 227,405 | | | | 12/20/17 | | | | 1,169 | |
| | IDR | | | 1,957,386,304 | | | USD | | | 143,032 | | | | 144,122 | | | | 12/21/17 | | | | 1,091 | |
| | INR | | | 3,022,117 | | | USD | | | 46,000 | | | | 46,040 | | | | 11/03/17 | | | | 40 | |
| | INR | | | 9,404,138 | | | USD | | | 141,902 | | | | 142,171 | | | | 01/12/18 | | | | 269 | |
| | JPY | | | 8,450,851 | | | EUR | | | 63,000 | | | | 75,411 | | | | 12/20/17 | | | | 607 | |
| | JPY | | | 67,634,369 | | | USD | | | 603,300 | | | | 603,533 | | | | 12/20/17 | | | | 233 | |
| | KRW | | | 63,992,552 | | | USD | | | 55,889 | | | | 55,893 | | | | 10/12/17 | | | | 4 | |
| | KRW | | | 16,109,178 | | | USD | | | 14,069 | | | | 14,071 | | | | 10/25/17 | | | | 3 | |
| | NZD | | | 203,158 | | | USD | | | 146,340 | | | | 146,509 | | | | 12/20/17 | | | | 169 | |
| | PHP | | | 7,508,100 | | | USD | | | 146,365 | | | | 147,591 | | | | 10/05/17 | | | | 1,226 | |
| | PHP | | | 3,544,894 | | | USD | | | 69,212 | | | | 69,630 | | | | 10/10/17 | | | | 418 | |
| | PHP | | | 3,949,798 | | | USD | | | 77,341 | | | | 77,536 | | | | 10/19/17 | | | | 195 | |
| | PHP | | | 15,722,168 | | | USD | | | 306,535 | | | | 308,060 | | | | 11/14/17 | | | | 1,526 | |
| | PLN | | | 281,568 | | | EUR | | | 65,000 | | | | 77,181 | | | | 12/20/17 | | | | 3 | |
| | PLN | | | 205,939 | | | HUF | | | 14,769,245 | | | | 56,450 | | | | 12/20/17 | | | | 218 | |
| | RUB | | | 69,145,473 | | | USD | | | 1,137,261 | | | | 1,196,565 | | | | 10/13/17 | | | | 59,304 | |
| | RUB | | | 24,800,225 | | | USD | | | 422,000 | | | | 424,473 | | | | 12/14/17 | | | | 2,473 | |
| | SEK | | | 1,611,685 | | | EUR | | | 167,030 | | | | 198,845 | | | | 12/20/17 | | | | 521 | |
| | SGD | | | 42,062 | | | USD | | | 31,000 | | | | 31,037 | | | | 12/20/17 | | | | 37 | |
| | TRY | | | 556,898 | | | USD | | | 152,023 | | | | 152,649 | | | | 12/20/17 | | | | 626 | |
| | |
| 26 | | The accompanying notes are an integral part of these financial statements. |
GOLDMAN SACHS STRATEGIC MACRO FUND
|
| ADDITIONAL INVESTMENT INFORMATION (continued) |
FORWARD FOREIGN CURRENCY EXCHANGE CONTRACTS WITH UNREALIZED GAIN (continued)
| | | | | | | | | | | | | | | | | | | | | | | | |
| Counterparty | | Currency
Purchased | | | Currency
Sold | | | Current
Value | | | Settlement
Date | | | Unrealized
Gain | |
Citibank NA (continued) | | TWD | | | 9,634,154 | | | USD | | | 315,553 | | | $ | 317,325 | | | | 10/20/17 | | | $ | 1,772 | |
| | TWD | | | 2,945,679 | | | USD | | | 96,915 | | | | 97,052 | | | | 10/26/17 | | | | 137 | |
| | USD | | | 678,238 | | | AUD | | | 847,693 | | | | 664,606 | | | | 11/08/17 | | | | 13,632 | |
| | USD | | | 1,790,710 | | | AUD | | | 2,238,499 | | | | 1,754,208 | | | | 12/20/17 | | | | 36,504 | |
| | USD | | | 304,000 | | | BRL | | | 955,869 | | | | 301,672 | | | | 10/03/17 | | | | 2,328 | |
| | USD | | | 36,435 | | | BRL | | | 115,880 | | | | 36,415 | | | | 11/03/17 | | | | 20 | |
| | USD | | | 1,855,689 | | | BRL | | | 5,928,000 | | | | 1,855,147 | | | | 12/04/17 | | | | 542 | |
| | USD | | | 145,339 | | | CAD | | | 180,000 | | | | 144,296 | | | | 11/06/17 | | | | 1,043 | |
| | USD | | | 857,982 | | | CAD | | | 1,058,721 | | | | 848,950 | | | | 12/20/17 | | | | 9,033 | |
| | USD | | | 103,219 | | | CHF | | | 99,162 | | | | 102,527 | | | | 10/18/17 | | | | 691 | |
| | USD | | | 75,000 | | | CHF | | | 71,792 | | | | 74,556 | | | | 12/20/17 | | | | 444 | |
| | USD | | | 75,000 | | | CLP | | | 46,340,475 | | | | 72,387 | | | | 10/12/17 | | | | 2,613 | |
| | USD | | | 74,171 | | | CLP | | | 46,414,881 | | | | 72,496 | | | | 10/16/17 | | | | 1,675 | |
| | USD | | | 566,551 | | | CNH | | | 3,745,771 | | | | 560,809 | | | | 12/20/17 | | | | 5,743 | |
| | USD | | | 75,000 | | | COP | | | 219,270,750 | | | | 74,415 | | | | 10/25/17 | | | | 585 | |
| | USD | | | 925,632 | | | CZK | | | 20,066,587 | | | | 912,968 | | | | 10/03/17 | | | | 12,664 | |
| | USD | | | 889,045 | | | EUR | | | 751,350 | | | | 888,898 | | | | 10/18/17 | | | | 147 | |
| | USD | | | 2,003,895 | | | EUR | | | 1,670,242 | | | | 1,983,177 | | | | 12/20/17 | | | | 20,718 | |
| | USD | | | 371,476 | | | GBP | | | 275,119 | | | | 369,598 | | | | 12/20/17 | | | | 1,878 | |
| | USD | | | 774,206 | | | HKD | | | 5,998,242 | | | | 767,919 | | | | 10/03/17 | | | | 6,287 | |
| | USD | | | 1,472,825 | | | HKD | | | 11,424,697 | | | | 1,462,911 | | | | 10/10/17 | | | | 9,914 | |
| | USD | | | 80,345 | | | HKD | | | 626,284 | | | | 80,258 | | | | 11/08/17 | | | | 87 | |
| | USD | | | 1,432,683 | | | HKD | | | 11,084,498 | | | | 1,424,700 | | | | 03/27/18 | | | | 7,983 | |
| | USD | | | 695,000 | | | HKD | | | 5,383,585 | | | | 692,479 | | | | 05/11/18 | | | | 2,521 | |
| | USD | | | 154,000 | | | HKD | | | 1,194,613 | | | | 153,927 | | | | 09/19/18 | | | | 73 | |
| | USD | | | 487,259 | | | HUF | | | 128,197,760 | | | | 487,029 | | | | 11/14/17 | | | | 230 | |
| | USD | | | 170,590 | | | IDR | | | 2,256,076,926 | | | | 167,352 | | | | 10/10/17 | | | | 3,239 | |
| | USD | | | 508,387 | | | IDR | | | 6,814,290,400 | | | | 505,208 | | | | 10/16/17 | | | | 3,178 | |
| | USD | | | 226,000 | | | IDR | | | 3,003,137,720 | | | | 222,613 | | | | 10/18/17 | | | | 3,387 | |
| | USD | | | 73,513 | | | INR | | | 4,804,050 | | | | 73,466 | | | | 10/05/17 | | | | 47 | |
| | USD | | | 170,483 | | | INR | | | 10,918,227 | | | | 166,828 | | | | 10/10/17 | | | | 3,655 | |
| | USD | | | 1,597,633 | | | INR | | | 102,557,112 | | | | 1,565,383 | | | | 10/18/17 | | | | 32,250 | |
| | USD | | | 150,681 | | | INR | | | 9,787,455 | | | | 149,253 | | | | 10/25/17 | | | | 1,429 | |
| | USD | | | 3,468,225 | | | JPY | | | 379,949,299 | | | | 3,380,829 | | | | 10/25/17 | | | | 87,397 | |
| | USD | | | 352,718 | | | JPY | | | 38,876,319 | | | | 346,911 | | | | 12/20/17 | | | | 5,807 | |
| | USD | | | 244,582 | | | KRW | | | 278,945,631 | | | | 243,571 | | | | 10/02/17 | | | | 1,011 | |
| | USD | | | 451,371 | | | KRW | | | 512,396,649 | | | | 447,535 | | | | 10/10/17 | | | | 3,836 | |
| | USD | | | 305,883 | | | KRW | | | 345,919,968 | | | | 302,135 | | | | 10/12/17 | | | | 3,748 | |
| | USD | | | 106,279 | | | KRW | | | 120,436,066 | | | | 105,200 | | | | 10/25/17 | | | | 1,079 | |
| | USD | | | 516,854 | | | KRW | | | 589,687,280 | | | | 515,161 | | | | 11/10/17 | | | | 1,694 | |
| | USD | | | 263,375 | | | MXN | | | 4,720,000 | | | | 258,929 | | | | 10/06/17 | | | | 4,446 | |
| | USD | | | 601,599 | | | MXN | | | 10,862,214 | | | | 588,802 | | | | 12/20/17 | | | | 12,798 | |
| | USD | | | 207,821 | | | NOK | | | 1,621,002 | | | | 203,617 | | | | 10/19/17 | | | | 4,204 | |
| | USD | | | 510,884 | | | NZD | | | 700,000 | | | | 505,213 | | | | 11/08/17 | | | | 5,671 | |
| | USD | | | 420,644 | | | NZD | | | 579,000 | | | | 417,549 | | | | 12/20/17 | | | | 3,095 | |
| | USD | | | 66,531 | | | PHP | | | 3,383,664 | | | | 66,463 | | | | 10/10/17 | | | | 68 | |
| | USD | | | 152,000 | | | PHP | | | 7,714,747 | | | | 151,370 | | | | 10/26/17 | | | | 630 | |
| | USD | | | 31,000 | | | PHP | | | 1,577,726 | | | | 30,943 | | | | 11/02/17 | | | | 57 | |
| | USD | | | 462,427 | | | PLN | | | 1,654,932 | | | | 453,513 | | | | 10/18/17 | | | | 8,914 | |
| | USD | | | 284,742 | | | RUB | | | 16,566,440 | | | | 283,546 | | | | 12/14/17 | | | | 1,196 | |
| | USD | | | 1,180,097 | | | SEK | | | 9,371,619 | | | | 1,151,854 | | | | 10/19/17 | | | | 28,243 | |
| | USD | | | 428,696 | | | SGD | | | 575,946 | | | | 424,983 | | | | 12/20/17 | | | | 3,713 | |
| | USD | | | 76,000 | | | THB | | | 2,532,515 | | | | 75,943 | | | | 10/11/17 | | | | 57 | |
| | |
| The accompanying notes are an integral part of these financial statements. | | 27 |
GOLDMAN SACHS STRATEGIC MACRO FUND
Consolidated Schedule of Investments (continued)
September 30, 2017 (Unaudited)
|
| ADDITIONAL INVESTMENT INFORMATION (continued) |
FORWARD FOREIGN CURRENCY EXCHANGE CONTRACTS WITH UNREALIZED GAIN (continued)
| | | | | | | | | | | | | | | | | | | | | | | | |
| Counterparty | | Currency
Purchased | | | Currency
Sold | | | Current
Value | | | Settlement
Date | | | Unrealized
Gain | |
Citibank NA (continued) | | USD | | | 588,309 | | | TRY | | | 2,114,530 | | | $ | 579,607 | | | | 12/20/17 | | | $ | 8,702 | |
| | USD | | | 198,871 | | | TWD | | | 5,940,277 | | | | 195,790 | | | | 10/02/17 | | | | 3,080 | |
| | USD | | | 30,000 | | | TWD | | | 899,550 | | | | 29,627 | | | | 10/19/17 | | | | 373 | |
| | USD | | | 1,763,190 | | | TWD | | | 53,218,154 | | | | 1,752,875 | | | | 10/20/17 | | | | 10,316 | |
| | USD | | | 400,091 | | | TWD | | | 12,054,364 | | | | 397,100 | | | | 10/23/17 | | | | 2,992 | |
| | USD | | | 441,830 | | | TWD | | | 13,345,469 | | | | 439,697 | | | | 10/26/17 | | | | 2,133 | |
| | USD | | | 36,980 | | | TWD | | | 1,120,887 | | | | 36,938 | | | | 10/31/17 | | | | 42 | |
| | USD | | | 671,055 | | | TWD | | | 20,059,091 | | | | 661,390 | | | | 11/10/17 | | | | 9,664 | |
| | USD | | | 899,756 | | | ZAR | | | 12,103,152 | | | | 887,452 | | | | 11/14/17 | | | | 12,304 | |
| | USD | | | 36,104 | | | ZAR | | | 494,775 | | | | 36,071 | | | | 12/20/17 | | | | 32 | |
| | | ZAR | | | 3,152,405 | | | USD | | | 229,000 | | | | 229,824 | | | | 12/20/17 | | | | 816 | |
| TOTAL | | | | | | | | | | | | | | | | | | | | | | $ | 624,529 | |
FORWARD FOREIGN CURRENCY EXCHANGE CONTRACTS WITH UNREALIZED LOSS
| | | | | | | | | | | | | | | | | | | | | | | | |
| Counterparty | | Currency
Purchased | | | Currency
Sold | | | Current
Value | | | Settlement
Date | | | Unrealized
Loss | |
Citibank NA | | AUD | | | 94,000 | | | NZD | | | 103,416 | | | $ | 73,663 | | | | 12/20/17 | | | $ | (916 | ) |
| | AUD | | | 876,892 | | | USD | | | 701,612 | | | | 687,499 | | | | 11/08/17 | | | | (14,114 | ) |
| | AUD | | | 1,534,768 | | | USD | | | 1,217,495 | | | | 1,202,724 | | | | 12/20/17 | | | | (14,765 | ) |
| | BRL | | | 3,126,237 | | | USD | | | 995,475 | | | | 986,641 | | | | 10/03/17 | | | | (8,836 | ) |
| | BRL | | | 4,830,000 | | | USD | | | 1,522,588 | | | | 1,517,802 | | | | 11/03/17 | | | | (4,787 | ) |
| | BRL | | | 1,081,315 | | | USD | | | 338,471 | | | | 338,394 | | | | 12/04/17 | | | | (77 | ) |
| | CAD | | | 501,038 | | | USD | | | 404,557 | | | | 401,654 | | | | 11/06/17 | | | | (2,903 | ) |
| | CAD | | | 1,362,310 | | | USD | | | 1,114,035 | | | | 1,092,386 | | | | 12/20/17 | | | | (21,650 | ) |
| | CHF | | | 109,000 | | | USD | | | 113,459 | | | | 112,699 | | | | 10/18/17 | | | | (760 | ) |
| | CNH | | | 3,872,470 | | | USD | | | 586,156 | | | | 579,777 | | | | 12/20/17 | | | | (6,379 | ) |
| | CNY | | | 1,026,104 | | | USD | | | 155,559 | | | | 154,123 | | | | 10/26/17 | | | | (1,436 | ) |
| | CNY | | | 953,788 | | | USD | | | 143,914 | | | | 142,749 | | | | 12/14/17 | | | | (1,165 | ) |
| | COP | | | 404,549,174 | | | USD | | | 139,082 | | | | 137,294 | | | | 10/25/17 | | | | (1,789 | ) |
| | EGP | | | 420,264 | | | USD | | | 24,721 | | | | 23,610 | | | | 11/03/17 | | | | (1,111 | ) |
| | EUR | | | 372,306 | | | CHF | | | 428,082 | | | | 442,062 | | | | 12/20/17 | | | | (2,497 | ) |
| | EUR | | | 190,233 | | | CZK | | | 4,949,864 | | | | 224,873 | | | | 10/03/17 | | | | (330 | ) |
| | EUR | | | 439,446 | | | GBP | | | 391,498 | | | | 521,782 | | | | 12/20/17 | | | | (4,160 | ) |
| | EUR | | | 63,799 | | | USD | | | 76,555 | | | | 75,454 | | | | 10/12/17 | | | | (1,101 | ) |
| | EUR | | | 503,384 | | | USD | | | 603,765 | | | | 597,697 | | | | 12/20/17 | | | | (6,067 | ) |
| | GBP | | | 558,198 | | | EUR | | | 632,000 | | | | 749,888 | | | | 12/20/17 | | | | (523 | ) |
| | GBP | | | 715,058 | | | USD | | | 972,458 | | | | 960,615 | | | | 12/20/17 | | | | (11,843 | ) |
| | HKD | | | 4,412,142 | | | USD | | | 566,238 | | | | 564,861 | | | | 10/03/17 | | | | (1,377 | ) |
| | HUF | | | 20,245,680 | | | EUR | | | 65,000 | | | | 77,084 | | | | 12/20/17 | | | | (95 | ) |
| | HUF | | | 97,326,899 | | | USD | | | 383,252 | | | | 370,563 | | | | 12/20/17 | | | | (12,689 | ) |
| | IDR | | | 5,045,505,423 | | | USD | | | 377,241 | | | | 374,432 | | | | 10/05/17 | | | | (2,808 | ) |
| | IDR | | | 3,135,312,936 | | | USD | | | 234,973 | | | | 232,573 | | | | 10/10/17 | | | | (2,400 | ) |
| | IDR | | | 5,898,993,201 | | | USD | | | 439,523 | | | | 437,349 | | | | 10/16/17 | | | | (2,174 | ) |
| | IDR | | | 1,691,323,886 | | | USD | | | 126,798 | | | | 125,285 | | | | 10/26/17 | | | | (1,513 | ) |
| | IDR | | | 2,063,637,990 | | | USD | | | 153,000 | | | | 152,811 | | | | 10/31/17 | | | | (189 | ) |
| | IDR | | | 6,525,766,533 | | | USD | | | 484,467 | | | | 482,410 | | | | 11/16/17 | | | | (2,057 | ) |
| | INR | | | 14,208,188 | | | USD | | | 221,645 | | | | 217,279 | | | | 10/05/17 | | | | (4,366 | ) |
| | INR | | | 52,261,084 | | | USD | | | 811,972 | | | | 798,537 | | | | 10/10/17 | | | | (13,435 | ) |
| | INR | | | 86,318,549 | | | USD | | | 1,337,101 | | | | 1,317,525 | | | | 10/18/17 | | | | (19,575 | ) |
| | INR | | | 31,213,085 | | | USD | | | 479,243 | | | | 475,980 | | | | 10/25/17 | | | | (3,263 | ) |
| | |
| 28 | | The accompanying notes are an integral part of these financial statements. |
GOLDMAN SACHS STRATEGIC MACRO FUND
|
| ADDITIONAL INVESTMENT INFORMATION (continued) |
FORWARD FOREIGN CURRENCY EXCHANGE CONTRACTS WITH UNREALIZED LOSS (continued)
| | | | | | | | | | | | | | | | | | | | | | | | |
| Counterparty | | Currency
Purchased | | | Currency
Sold | | | Current
Value | | | Settlement
Date | | | Unrealized
Loss | |
Citibank NA (continued) | | INR | | | 31,238,332 | | | USD | | | 479,429 | | | $ | 476,301 | | | | 10/26/17 | | | $ | (3,128 | ) |
| | INR | | | 4,804,050 | | | USD | | | 73,238 | | | | 73,187 | | | | 11/03/17 | | | | (51 | ) |
| | JPY | | | 8,536,612 | | | EUR | | | 64,662 | | | | 76,176 | | | | 12/20/17 | | | | (601 | ) |
| | JPY | | | 4,318,162 | | | GBP | | | 29,584 | | | | 38,533 | | | | 12/20/17 | | | | (1,210 | ) |
| | JPY | | | 109,534,000 | | | USD | | | 1,000,036 | | | | 974,645 | | | | 10/25/17 | | | | (25,391 | ) |
| | JPY | | | 79,397,867 | | | USD | | | 721,242 | | | | 708,504 | | | | 12/20/17 | | | | (12,739 | ) |
| | KRW | | | 278,945,631 | | | USD | | | 248,163 | | | | 243,570 | | | | 10/02/17 | | | | (4,593 | ) |
| | KRW | | | 512,396,649 | | | USD | | | 454,643 | | | | 447,536 | | | | 10/10/17 | | | | (7,107 | ) |
| | KRW | | | 281,927,416 | | | USD | | | 249,498 | | | | 246,243 | | | | 10/12/17 | | | | (3,255 | ) |
| | KRW | | | 440,928,339 | | | USD | | | 388,360 | | | | 385,147 | | | | 10/25/17 | | | | (3,213 | ) |
| | KRW | | | 257,019,046 | | | USD | | | 227,186 | | | | 224,536 | | | | 11/10/17 | | | | (2,650 | ) |
| | KRW | | | 707,703,455 | | | USD | | | 623,664 | | | | 618,348 | | | | 11/22/17 | | | | (5,315 | ) |
| | MXN | | | 1,583,438 | | | USD | | | 88,356 | | | | 86,864 | | | | 10/06/17 | | | | (1,491 | ) |
| | MXN | | | 21,085,596 | | | USD | | | 1,168,012 | | | | 1,142,976 | | | | 12/20/17 | | | | (25,038 | ) |
| | NOK | | | 7,975,721 | | | EUR | | | 851,071 | | | | 1,003,304 | | | | 12/20/17 | | | | (7,222 | ) |
| | NOK | | | 376,533 | | | GBP | | | 35,490 | | | | 47,366 | | | | 12/20/17 | | | | (312 | ) |
| | NOK | | | 1,721,000 | | | USD | | | 220,641 | | | | 216,178 | | | | 10/19/17 | | | | (4,463 | ) |
| | NOK | | | 541,558 | | | USD | | | 69,347 | | | | 68,126 | | | | 12/20/17 | | | | (1,221 | ) |
| | NZD | | | 103,333 | | | EUR | | | 63,000 | | | | 74,519 | | | | 12/20/17 | | | | (285 | ) |
| | NZD | | | 673,093 | | | USD | | | 491,247 | | | | 485,794 | | | | 11/08/17 | | | | (5,453 | ) |
| | NZD | | | 1,241,579 | | | USD | | | 902,431 | | | | 895,374 | | | | 12/20/17 | | | | (7,059 | ) |
| | PEN | | | 246,791 | | | USD | | | 76,000 | | | | 75,585 | | | | 10/05/17 | | | | (415 | ) |
| | PEN | | | 489,202 | | | USD | | | 151,000 | | | | 149,804 | | | | 10/10/17 | | | | (1,196 | ) |
| | PEN | | | 492,879 | | | USD | | | 151,097 | | | | 150,473 | | | | 12/14/17 | | | | (624 | ) |
| | PLN | | | 5,318,528 | | | EUR | | | 1,244,923 | | | | 1,457,873 | | | | 12/20/17 | | | | (20,298 | ) |
| | PLN | | | 1,578,824 | | | USD | | | 441,160 | | | | 432,656 | | | | 10/18/17 | | | | (8,504 | ) |
| | PLN | | | 2,550,946 | | | USD | | | 718,327 | | | | 699,245 | | | | 12/20/17 | | | | (19,081 | ) |
| | RUB | | | 66,243,408 | | | USD | | | 1,137,252 | | | | 1,133,801 | | | | 12/14/17 | | | | (3,450 | ) |
| | SEK | | | 22,343,428 | | | EUR | | | 2,340,686 | | | | 2,756,673 | | | | 12/20/17 | | | | (22,564 | ) |
| | SEK | | | 9,300,098 | | | USD | | | 1,171,151 | | | | 1,143,063 | | | | 10/19/17 | | | | (28,089 | ) |
| | SEK | | | 486,287 | | | USD | | | 60,957 | | | | 59,997 | | | | 12/20/17 | | | | (960 | ) |
| | SGD | | | 540,108 | | | USD | | | 401,429 | | | | 398,538 | | | | 12/20/17 | | | | (2,891 | ) |
| | THB | | | 2,480,100 | | | USD | | | 75,000 | | | | 74,371 | | | | 10/11/17 | | | | (629 | ) |
| | TRY | | | 2,432,633 | | | USD | | | 687,547 | | | | 666,799 | | | | 12/20/17 | | | | (20,749 | ) |
| | TWD | | | 8,021,865 | | | USD | | | 266,897 | | | | 264,399 | | | | 10/02/17 | | | | (2,498 | ) |
| | TWD | | | 2,281,140 | | | USD | | | 76,000 | | | | 75,126 | | | | 10/05/17 | | | | (874 | ) |
| | TWD | | | 35,082,191 | | | USD | | | 1,161,229 | | | | 1,155,520 | | | | 10/20/17 | | | | (5,708 | ) |
| | TWD | | | 3,762,060 | | | USD | | | 124,995 | | | | 123,931 | | | | 10/23/17 | | | | (1,064 | ) |
| | TWD | | | 6,861,454 | | | USD | | | 226,701 | | | | 226,067 | | | | 10/26/17 | | | | (634 | ) |
| | USD | | | 104,652 | | | ARS | | | 1,867,000 | | | | 107,231 | | | | 10/10/17 | | | | (2,579 | ) |
| | USD | | | 141,253 | | | AUD | | | 180,764 | | | | 141,656 | | | | 12/20/17 | | | | (403 | ) |
| | USD | | | 3,100,672 | | | BRL | | | 10,177,894 | | | | 3,212,148 | | | | 10/03/17 | | | | (111,476 | ) |
| | USD | | | 76,000 | | | BRL | | | 243,429 | | | | 76,496 | | | | 11/03/17 | | | | (496 | ) |
| | USD | | | 75,000 | | | CHF | | | 72,494 | | | | 75,284 | | | | 12/20/17 | | | | (284 | ) |
| | USD | | | 33,632 | | | CNH | | | 225,251 | | | | 33,724 | | | | 12/20/17 | | | | (92 | ) |
| | USD | | | 196,542 | | | CNY | | | 1,313,337 | | | | 197,036 | | | | 11/10/17 | | | | (494 | ) |
| | USD | | | 61,000 | | | COP | | | 180,126,717 | | | | 61,089 | | | | 10/31/17 | | | | (89 | ) |
| | USD | | | 4,408,652 | | | EUR | | | 3,736,993 | | | | 4,419,653 | | | | 10/12/17 | | | | (11,001 | ) |
| | USD | | | 296,472 | | | EUR | | | 250,258 | | | | 297,144 | | | | 12/20/17 | | | | (672 | ) |
| | USD | | | 4,671,498 | | | GBP | | | 3,481,905 | | | | 4,672,456 | | | | 11/16/17 | | | | (958 | ) |
| | USD | | | 437,412 | | | GBP | | | 328,762 | | | | 441,662 | | | | 12/20/17 | | | | (4,251 | ) |
| | USD | | | 372,784 | | | IDR | | | 5,045,505,423 | | | | 374,433 | | | | 10/05/17 | | | | (1,649 | ) |
| | USD | | | 143,597 | | | INR | | | 9,404,138 | | | | 143,813 | | | | 10/05/17 | | | | (216 | ) |
| | |
| The accompanying notes are an integral part of these financial statements. | | 29 |
GOLDMAN SACHS STRATEGIC MACRO FUND
Consolidated Schedule of Investments (continued)
September 30, 2017 (Unaudited)
|
| ADDITIONAL INVESTMENT INFORMATION (continued) |
FORWARD FOREIGN CURRENCY EXCHANGE CONTRACTS WITH UNREALIZED LOSS (continued)
| | | | | | | | | | | | | | | | | | | | | | | | |
| Counterparty | | Currency
Purchased | | | Currency
Sold | | | Current
Value | | | Settlement
Date | | | Unrealized
Loss | |
Citibank NA (continued) | | USD | | | 77,000 | | | INR | | | 5,055,474 | | | $ | 77,083 | | | | 10/26/17 | | | $ | (83 | ) |
| | USD | | | 198,003 | | | INR | | | 13,071,015 | | | | 199,129 | | | | 11/03/17 | | | | (1,126 | ) |
| | USD | | | 2,281,590 | | | JPY | | | 257,086,095 | | | | 2,293,791 | | | | 12/18/17 | | | | (12,201 | ) |
| | USD | | | 370,685 | | | JPY | | | 41,683,781 | | | | 371,964 | | | | 12/20/17 | | | | (1,279 | ) |
| | USD | | | 374,901 | | | KRW | | | 430,579,493 | | | | 376,161 | | | | 11/10/17 | | | | (1,260 | ) |
| | USD | | | 55,911 | | | KRW | | | 63,992,552 | | | | 55,913 | | | | 11/22/17 | | | | (2 | ) |
| | USD | | | 149,352 | | | NZD | | | 208,052 | | | | 150,039 | | | | 12/20/17 | | | | (687 | ) |
| | USD | | | 75,000 | | | PHP | | | 3,840,874 | | | | 75,397 | | | | 10/19/17 | | | | (397 | ) |
| | USD | | | 75,000 | | | PHP | | | 3,832,913 | | | | 75,236 | | | | 10/20/17 | | | | (236 | ) |
| | USD | | | 76,000 | | | PHP | | | 3,884,629 | | | | 76,220 | | | | 10/26/17 | | | | (220 | ) |
| | USD | | | 2,506,802 | | | RUB | | | 151,153,965 | | | | 2,615,725 | | | | 10/13/17 | | | | (108,923 | ) |
| | USD | | | 455,674 | | | RUB | | | 26,839,695 | | | | 459,380 | | | | 12/14/17 | | | | (3,706 | ) |
| | USD | | | 381,687 | | | SGD | | | 519,821 | | | | 383,570 | | | | 12/20/17 | | | | (1,883 | ) |
| | USD | | | 46,000 | | | TRY | | | 167,840 | | | | 46,006 | | | | 12/20/17 | | | | (6 | ) |
| | USD | | | 68,609 | | | TWD | | | 2,081,589 | | | | 68,609 | | | | 10/02/17 | | | | — | |
| | USD | | | 74,964 | | | TWD | | | 2,281,140 | | | | 75,126 | | | | 10/05/17 | | | | (163 | ) |
| | USD | | | 315,053 | | | TWD | | | 9,620,767 | | | | 316,884 | | | | 10/20/17 | | | | (1,831 | ) |
| | USD | | | 160,901 | | | TWD | | | 4,895,150 | | | | 161,314 | | | | 10/31/17 | | | | (413 | ) |
| | | ZAR | | | 10,649,528 | | | USD | | | 803,505 | | | | 776,396 | | | | 12/20/17 | | | | (27,110 | ) |
| TOTAL | | | | | | $ | (731,361 | ) |
FUTURES CONTRACTS — At September 30, 2017, the Fund had the following futures contracts:
| | | | | | | | | | | | | | |
| Description | | Number of
Contracts | | | Expiration
Date | | Notional
Amount | | | Unrealized
Appreciation/
(Depreciation) | |
Long position contracts: | |
Primary Aluminum | | | 7 | | | 12/18/17 | | $ | 367,413 | | | $ | 8,653 | |
Zinc | | | 4 | | | 12/18/17 | | | 316,600 | | | | 21,595 | |
10 Year German Euro-Bund | | | 4 | | | 12/07/17 | | | 761,191 | | | | (4,722 | ) |
10 Year U.S. Treasury Notes | | | 190 | | | 12/19/17 | | | 23,809,375 | | | | (257,096 | ) |
| TOTAL | | | $ | (231,570 | ) |
Short position contracts: | | | | | |
Eurodollars | | | (30 | ) | | 12/17/18 | | | (7,360,125 | ) | | | (3,419 | ) |
Italian 10 Year Government Bonds | | | (6 | ) | | 12/07/17 | | | (957,056 | ) | | | 1,763 | |
Japan 10 Year Government Bonds | | | (1 | ) | | 12/13/17 | | | (1,336,148 | ) | | | 6,484 | |
Primary Aluminum | | | (7 | ) | | 12/18/17 | | | (367,412 | ) | | | (10,028 | ) |
S&P 500 E-Mini Index | | | (14 | ) | | 12/15/17 | | | (1,761,270 | ) | | | (38,560 | ) |
Ultra Long U.S. Treasury Bonds | | | (3 | ) | | 12/19/17 | | | (495,375 | ) | | | 4,721 | |
Ultra 10 Year U.S. Treasury Notes | | | (13 | ) | | 12/19/17 | | | (1,746,266 | ) | | | 20,454 | |
Zinc | | | (4 | ) | | 12/18/17 | | | (316,600 | ) | | | (25,505 | ) |
2 Year U.S. Treasury Notes | | | (27 | ) | | 12/29/17 | | | (5,823,984 | ) | | | 12,954 | |
5 Year U.S. Treasury Notes | | | (242 | ) | | 12/29/17 | | | (28,435,000 | ) | | | 187,387 | |
20 Year U.S. Treasury Bonds | | | (44 | ) | | 12/19/17 | | | (6,723,750 | ) | | | 99,543 | |
| TOTAL | | | $ | 255,794 | |
| TOTAL FUTURES CONTRACTS | | | $ | 24,224 | |
| | |
| 30 | | The accompanying notes are an integral part of these financial statements. |
GOLDMAN SACHS STRATEGIC MACRO FUND
|
| ADDITIONAL INVESTMENT INFORMATION (continued) |
SWAP CONTRACTS — At September 30, 2017, the Fund had the following swap contracts:
OVER THE COUNTER INTEREST RATE SWAP CONTRACTS
| | | | | | | | | | | | | | | | | | | | | | | | | | |
| Payments Made by the Fund | | Payments
Received
by the Fund | | | Counterparty | | Termination
Date | | | Notional
Amount (000s) | | | Market Value | | | Upfront
Payments
(Received) Paid | | | Unrealized
Appreciation/
(Depreciation) | |
1M BID Avg(a) | | | 11.830% | | | BoA Securities LLC | | | 01/02/18 | | | BRL | 6,660 | | | $ | 32,370 | | | $ | — | | | $ | 32,370 | |
3M SHIBOR(b) | | | 4.000 | | | BoA Securities LLC | | | 06/21/22 | | | CNY | 3,180 | | | | 4,856 | | | | (1,650 | ) | | | 6,506 | |
1M BID Avg(c) | | | 11.340 | | | Citibank NA | | | 01/02/19 | | | BRL | 1,880 | | | | 23,681 | | | | — | | | | 23,681 | |
Colombia IBR Overnight IB(b) | | | 6.665 | | | Citibank NA | | | 08/04/19 | | | COP | 1,113,460 | | | | 13,636 | | | | — | | | | 13,636 | |
1M BID Avg(a) | | | 11.120 | | | CS International (London) | | | 01/02/18 | | | BRL | 1,370 | | | | (15,507 | ) | | | — | | | | (15,507 | ) |
| | | 11.150 | | | Deutsche Bank AG | | | 01/02/18 | | | | 1,220 | | | | (13,445 | ) | | | — | | | | (13,445 | ) |
| | | 11.450 | | | Deutsche Bank AG | | | 01/02/18 | | | | 1,520 | | | | (12,200 | ) | | | — | | | | (12,200 | ) |
1M BID Avg(c) | | | 11.345 | | | Deutsche Bank AG | | | 01/02/19 | | | | 1,680 | | | | 21,665 | | | | — | | | | 21,665 | |
5.340%(b) | |
| Colombia IBR
Overnight IB |
| | Deutsche Bank AG | | | 09/24/19 | | | COP | 709,695 | | | | (2,427 | ) | | | — | | | | (2,427 | ) |
6.960(b) | |
| Colombia IBR
Overnight IB |
| | Deutsche Bank AG | | | 11/17/26 | | | | 422,480 | | | | (9,970 | ) | | | — | | | | (9,970 | ) |
1M BID Avg | | | 12.480 | | | JPMorgan Securities, Inc. | | | 01/02/20 | | | BRL | 3,485 | | | | 83,016 | | | | — | | | | 83,016 | |
15.568(c) | | | 1M BID Avg | | | JPMorgan Securities, Inc. | | | 01/04/21 | | | | 8,930 | | | | (483,541 | ) | | | — | | | | (483,541 | ) |
6.250(e) | | | 6M MIBOR | | | JPMorgan Securities, Inc. | | | 12/20/22 | | | INR | 28,850 | (d) | | | 488 | | | | (1,033 | ) | | | 1,521 | |
1M BID Avg(a) | | | 13.760 | | | JPMorgan Securities, Inc. | | | 01/02/23 | | | BRL | 1,690 | | | | 72,588 | | | | — | | | | 72,588 | |
1M BID Avg(c) | | | 15.470 | | | JPMorgan Securities, Inc. | | | 01/02/23 | | | | 2,215 | | | | 132,847 | | | | — | | | | 132,847 | |
| TOTAL | | | | | | | | | | | | | | | | | | | | $ | (2,683) | | | $ | (149,260) | |
| | (a) | | Payments made monthly. |
| | (b) | | Payments made quarterly. |
| | (c) | | Payments made at maturity. |
| | (d) | | Represents forward starting interest rate swaps whose effective dates of commencement of accruals and cash flows occur subsequent to September 30, 2017. |
| | (e) | | Payments made semi-annually. |
CENTRALLY CLEARED INTEREST RATE SWAP CONTRACTS
| | | | | | | | | | | | | | | | | | | | | | | | |
Payments Made by the
Fund | | Payments
Received
by Fund | | Termination
Date | | | Notional
Amount (000s) | | | Market
Value | | | Upfront
Premium
(Received) Paid | | | Unrealized
Appreciation/
(Depreciation) | |
6M CDOR(a) | | 0.833% | | | 10/25/17 | | | CAD | | | 15,220 | | | $ | (2,922 | ) | | $ | 34 | | | $ | (2,956 | ) |
6M BP(b) | | 0.297 | | | 12/14/17 | | | GBP | | | 48,910 | (c) | | | (5,624 | ) | | | 327 | | | | (5,951 | ) |
1.655% | | 3M LIBOR | | | 04/14/18 | | | USD | | | 700 | | | | 5,199 | | | | 1 | | | | 5,197 | |
1.860(b) | | 6M BUBOR(d) | | | 06/09/18 | | | HUF | | | 130,750 | | | | (5,933 | ) | | | 1 | | | | (8,469 | ) |
3M STIBOR(e) | | 0.050 | | | 06/15/18 | | | SEK | | | 43,780 | | | | 9,695 | | | | (37,144 | ) | | | 47,738 | |
3M STIBOR(b) | | 0.330(e) | | | 09/15/18 | | | | | | 17,680 | | | | 1,773 | | | | (83,917 | ) | | | 85,690 | |
0.330(e) | | 3M STIBOR(b) | | | 09/15/18 | | | | | | 17,680 | | | | — | | | | (20 | ) | | | 111 | |
6M CHFOR | | 0.554 | | | 03/29/19 | | | CHF | | | 5,830 | (c) | | | 42 | | | | (128,351 | ) | | | 128,392 | |
1.826 | | 3M LIBOR | | | 05/11/19 | | | USD | | | 4,210 | (c) | | | (896 | ) | | | (866 | ) | | | (29 | ) |
3M STIBOR(e) | | 0.100(b) | | | 06/29/19 | | | SEK | | | 30,360 | (c) | | | 201 | | | | (17,701 | ) | | | 17,902 | |
Mexico IB TIIE 28D(f) | | 5.800 | | | 08/19/19 | | | MXN | | | 107,350 | (c) | | | (52,788 | ) | | | 35 | | | | (52,823 | ) |
3M NIBOR(d) | | 1.000(b) | | | 09/20/19 | | | NOK | | | 10,110 | | | | (1,934 | ) | | | (2,769 | ) | | | 885 | |
6M CDOR(d) | | 1.250 | | | 12/20/19 | | | CAD | | | 4,630 | (c) | | | (53,010 | ) | | | (54,389 | ) | | | 1,378 | |
2.000(d) | | 3M LIBOR(e) | | | 12/20/19 | | | USD | | | 3,890 | (c) | | | (15,043 | ) | | | (24,103 | ) | | | 9,059 | |
6M BUBOR(b) | | 2.415(d) | | | 12/16/20 | | | HUF | | | 106,500 | | | | (24,636 | ) | | | (4,687 | ) | | | (27,407 | ) |
6.010(f) | | Mexico IB TIIE 28D | | | 08/16/21 | | | MXN | | | 57,660 | (c) | | | 29,691 | | | | 449 | | | | 29,242 | |
1.515 | | 3M LIBOR | | | 09/06/21 | | | USD | | | 1,800 | | | | 39,424 | | | | 13 | | | | 39,412 | |
1.579 | | 3M LIBOR | | | 09/13/21 | | | | | | 900 | | | | 17,389 | | | | 6 | | | | 17,383 | |
1.870(b) | | 3M LIBOR | | | 10/28/21 | | | | | | 900 | | | | 6,045 | | | | 7 | | | | 6,038 | |
| | |
| The accompanying notes are an integral part of these financial statements. | | 31 |
GOLDMAN SACHS STRATEGIC MACRO FUND
Consolidated Schedule of Investments (continued)
September 30, 2017 (Unaudited)
|
| ADDITIONAL INVESTMENT INFORMATION (continued) |
CENTRALLY CLEARED INTEREST RATE SWAP CONTRACTS (continued)
| | | | | | | | | | | | | | | | | | | | | | | | |
Payments Made by the
Fund | | Payments
Received
by Fund | | Termination
Date | | | Notional
Amount (000s) | | | Market
Value | | | Upfront
Premium
(Received) Paid | | | Unrealized
Appreciation/
(Depreciation) | |
1.890%(b) | | 3M LIBOR | | | 10/31/21 | | | USD | | | 700 | | | $ | 4,030 | | | $ | 5 | | | $ | 4,025 | |
1.873(b) | | 3M LIBOR | | | 11/09/21 | | | | | | 600 | | | | 3,856 | | | | 4 | | | | 3,851 | |
2.015 | | 3M LIBOR | | | 11/14/21 | | | | | | 600 | | | | (535 | ) | | | 4 | | | | (539 | ) |
6M PRIBOR(d) | | 0.368%(b) | | | 12/21/21 | | | CZK | | | 630 | | | | (1,140 | ) | | | (135 | ) | | | (952 | ) |
2.250(e) | | 3M HIBOR | | | 06/21/22 | | | HKD | | | 3,436 | | | | (10,198 | ) | | | (10,203 | ) | | | (236 | ) |
6M BP(a) | | 3.370 | | | 07/15/22 | | | GBP | | | 540 | | | | (2,876 | ) | | | 28 | | | | (2,905 | ) |
Mexico IB TIIE 28D(a) | | 7.370 | | | 08/11/22 | | | MXN | | | 16,560 | (c) | | | 9,876 | | | | 7 | | | | 9,869 | |
Mexico IB TIIE 28D(a) | | 7.500 | | | 09/15/22 | | | | | | 99,680 | (c) | | | 68,687 | | | | (22,321 | ) | | | 91,008 | |
1.038(b) | | 6M PRIBOR(c) | | | 09/20/22 | | | CZK | | | 36,040 | | | | 26,689 | | | | (76,583 | ) | | | 103,013 | |
Mexico IB TIIE 28D(f) | | 6.750 | | | 12/14/22 | | | MXN | | | 37,375 | (c) | | | (3,004 | ) | | | 310 | | | | (3,314 | ) |
6M EURO(d) | | 0.250(b) | | | 12/20/22 | | | EUR | | | 2,230 | (c) | | | (7,386 | ) | | | 411 | | | | (7,797 | ) |
3M STIBOR(e) | | 0.500(b) | | | 12/20/22 | | | SEK | | | 15,970 | (c) | | | (4,025 | ) | | | 2,795 | | | | (6,820 | ) |
6M CDOR(d) | | 1.750 | | | 12/20/22 | | | CAD | | | 1,870 | (c) | | | (30,212 | ) | | | (31,039 | ) | | | 827 | |
3M LIBOR | | 2.250 | | | 12/20/22 | | | USD | | | 1,050 | (c) | | | 10,033 | | | | 15,488 | | | | (5,455 | ) |
6M AUDOR(d) | | 2.500 | | | 12/20/22 | | | AUD | | | 50 | (c) | | | (292 | ) | | | 72 | | | | (364 | ) |
2.250(d) | | 3M LIBOR(e) | | | 12/20/22 | | | USD | | | 3,700 | (c) | | | (35,356 | ) | | | (60,676 | ) | | | 25,320 | |
2.500 | | 6M AUDOR | | | 12/20/22 | | | AUD | | | 1,420 | (c) | | | 8,285 | | | | (1,887 | ) | | | 10,172 | |
0.250(b) | | 6M EURO(d) | | | 12/20/22 | | | EUR | | | 400 | (c) | | | 1,325 | | | | 519 | | | | 806 | |
1.218(b) | | 6M PRIBOR(d) | | | 12/20/22 | | | CZK | �� | | 41,350 | (c) | | | 19,121 | | | | (1,295 | ) | | | 20,416 | |
2.450(b) | | 6M WIBOR(d) | | | 12/20/22 | | | PLN | | | 2,850 | (c) | | | 2,550 | | | | (1,237 | ) | | | 3,787 | |
2.143(d) | | 3M LIBOR(e) | | | 07/03/23 | | | USD | | | 2,700 | (c) | | | (117 | ) | | | (1,544 | ) | | | 1,427 | |
3M LIBOR(e) | | 2.065(d) | | | 08/06/23 | | | | | | 6,540 | (c) | | | (28,076 | ) | | | 2,304 | | | | (30,379 | ) |
7.430(f) | | Mexico IB TIIE 28D | | | 08/07/25 | | | MXN | | | 7,150 | (c) | | | (5,404 | ) | | | 4 | | | | (5,408 | ) |
7.600(f) | | Mexico IB TIIE 28D | | | 09/11/25 | | | | | | 43,410 | (c) | | | (45,521 | ) | | | (10,771 | ) | | | (34,750 | ) |
3M LIBOR | | 1.740 | | | 09/06/26 | | | | | | 1,800 | | | | (59,565 | ) | | | 20 | | | | (59,584 | ) |
3M LIBOR | | 1.780 | | | 09/13/26 | | | | | | 900 | | | | (26,842 | ) | | | 10 | | | | (26,852 | ) |
3M LIBOR(b) | | 2.023 | | | 10/28/26 | | | | | | 900 | | | | (7,253 | ) | | | 10 | | | | (7,263 | ) |
3M LIBOR(b) | | 2.034 | | | 10/31/26 | | | | | | 700 | | | | (4,916 | ) | | | 8 | | | | (4,924 | ) |
3M LIBOR(b) | | 2.045 | | | 11/09/26 | | | | | | 600 | | | | (3,462 | ) | | | 7 | | | | (3,469 | ) |
3M LIBOR(b) | | 2.239 | | | 11/14/26 | | | | | | 600 | | | | 8,341 | | | | 7 | | | | 8,335 | |
6M EURO(d) | | 1.330(b) | | | 01/12/27 | | | EUR | | | 1,510 | (c) | | | (8,655 | ) | | | (25,128 | ) | | | 16,474 | |
6M BP(d) | | 1.600 | | | 03/16/27 | | | GBP | | | 9,100 | (c) | | | (62,245 | ) | | | (293,774 | ) | | | 231,529 | |
6M BP(b) | | 3.336 | | | 06/15/27 | | | | | | 190 | | | | (1,759 | ) | | | 2 | | | | (1,761 | ) |
3M LIBOR(e) | | 2.400(d) | | | 08/31/27 | | | USD | | | 610 | (c) | | | (4,753 | ) | | | (705 | ) | | | (4,048 | ) |
1.500(b) | | 6M EURO(d) | | | 08/31/27 | | | EUR | | | 540 | (c) | | | 2,285 | | | | (906 | ) | | | 3,191 | |
6M CDOR(d) | | 2.500 | | | 09/21/27 | | | CAD | | | 1,530 | (c) | | | (10,202 | ) | | | (4,420 | ) | | | (5,782 | ) |
2.500(d) | | 3M LIBOR(e) | | | 09/21/27 | | | USD | | | 1,230 | (c) | | | 4,627 | | | | (432 | ) | | | 5,059 | |
6M EURO(d) | | 1.000(b) | | | 12/20/27 | | | EUR | | | 1,820 | (c) | | | 8,768 | | | | 32,993 | | | | (24,225 | ) |
6M CDOR(d) | | 2.000 | | | 12/20/27 | | | CAD | | | 2,180 | (c) | | | (68,439 | ) | | | (56,804 | ) | | | (11,634 | ) |
3M LIBOR | | 2.500 | | | 12/20/27 | | | USD | | | 670 | (c) | | | 11,366 | | | | 25,084 | | | | (13,718 | ) |
2.500(d) | | 3M LIBOR(e) | | | 12/20/27 | | | | | | 1,680 | (c) | | | (28,499 | ) | | | (62,879 | ) | | | 34,380 | |
1.250(d) | | 6M BP | | | 12/20/27 | | | GBP | | | 860 | (c) | | | 22,756 | | | | (17,185 | ) | | | 39,941 | |
0.250(d) | | 6M JYOR | | | 12/20/27 | | | JPY | | | 114,460 | (c) | | | 5,391 | | | | 2,944 | | | | 2,447 | |
1.450(e) | | 6M PRIBOR(d) | | | 12/20/27 | | | CZK | | | 6,630 | (c) | | | 5,649 | | | | 4 | | | | 5,645 | |
3M LIBOR(e) | | 2.378(d) | | | 07/03/28 | | | USD | | | 9,880 | (c) | | | (1,221 | ) | | | (26,626 | ) | | | 25,405 | |
2.346(d) | | 3M LIBOR(e) | | | 08/06/28 | | | | | | 3,680 | (c) | | | 14,191 | | | | (3,594 | ) | | | 17,784 | |
1.940(d) | | 6M BP | | | 01/11/32 | | | GBP | | | 1,200 | (c) | | | 3,919 | | | | (23,697 | ) | | | 27,616 | |
1.500(d) | | 6M BP | | | 12/20/32 | | | | | | 690 | (c) | | | 15,841 | | | | (19,603 | ) | | | 35,444 | |
1.231(b) | | 3M LIBOR | | | 09/09/36 | | | USD | | | 2,350 | | | | 337,008 | | | | 17,840 | | | | 319,168 | |
| | |
| 32 | | The accompanying notes are an integral part of these financial statements. |
GOLDMAN SACHS STRATEGIC MACRO FUND
|
| ADDITIONAL INVESTMENT INFORMATION (continued) |
CENTRALLY CLEARED INTEREST RATE SWAP CONTRACTS (continued)
| | | | | | | | | | | | | | | | | | | | | | | | |
Payments Made by the
Fund | | Payments
Received
by Fund | | Termination
Date | | | Notional
Amount (000s) | | | Market
Value | | | Upfront
Premium
(Received) Paid | | | Unrealized
Appreciation/
(Depreciation) | |
1.750%(d) | | 6M BP | | | 03/17/37 | | | GBP | | | 6,570 | (c) | | $ | 144,796 | | | $ | (151,979 | ) | | $ | 296,775 | |
1.500(d) | | 6M BP | | | 12/20/47 | | | | | | 170 | (c) | | | 9,208 | | | | (3,491 | ) | | | 12,699 | |
| 2.560(d) | | 3M LIBOR(e) | | | 07/03/48 | | | USD | | | 4,080 | (c) | | | 6,120 | | | | 94 | | | | 6,026 | |
| TOTAL | | | | | | | | | | | | | | | | | | $ | (1,161,014) | | | $ | 1,391,052 | |
| | (a) | | Payments made at maturity. |
| | (b) | | Payments made annually. |
| | (c) | | Represents forward starting interest rate swaps whose effective dates of commencement of accruals and cash flows occur subsequent to September 30, 2017. |
| | (d) | | Payments made semi-annually. |
| | (e) | | Payments made quarterly. |
| | (f) | | Payments made monthly. |
CENTRALLY CLEARED CREDIT DEFAULT SWAP CONTRACTS
| | | | | | | | | | | | | | | | | | | | | | | | | | |
| Referenced Obligation/Index | | Financing Rate
Received/(Paid)
by the Fund(a) | | Credit
Spread at
September 30,
2017(b) | | | Termination
Date | | | Notional
Amount
(000s) | | | Market Value | | | Upfront
Premiums
(Received) Paid | | | Unrealized
Appreciation/
(Depreciation) | |
Protection Purchased: | |
CDX.EM Index 27 | | (1.000)% | | | 0.480 | % | | | 06/20/22 | | | EUR | 2,590 | | | $ | (74,840 | ) | | $ | (65,383 | ) | | $ | (10,383 | ) |
CDX.NA.IG Index 28 | | (1.000) | | | 0.529 | | | | 06/20/22 | | | USD | 3,210 | | | | (67,869 | ) | | | (60,495 | ) | | | (8,347 | ) |
| TOTAL | | | $ | (125,878 | ) | | $ | (18,730 | ) |
| | (a) | | Payments made quarterly. |
| | (b) | | Credit spread on the referenced obligation, together with the term of the swap contract, are indicators of payment/performance risk. The likelihood of a credit event occurring which would require a fund or its counterparty to make a payment or otherwise be required to perform under the swap contract is generally greater as the credit spread and the term of the swap contract increase. |
OVER THE COUNTER CROSS CURRENCY SWAP CONTRACTS
| | | | | | | | | | | | | | | | | | | | | | | | | | | | |
| Counterparty | | Notional Amount
of Currency
Received | | | Notional Amount
of Currency
Delivered | | | Termination
Date | | | Receive | | Pay | | Upfront
Payments
made (received) | | | Unrealized
Gain (Loss) | |
Citibank NA | | | TRY | | | | 3,340,000 | | | | 942,172 | | | | 12/20/22 | | | 10.440%(a) | | 3M LIBOR(b) | | $ | — | | | $ | (7,141 | ) |
| | | USD | | | | 580,000 | | | | 580,000 | | | | 12/20/27 | | | 3M LIBOR(b) | | 10.010%(a) | | | — | | | | 5,782 | |
MS & Co. Int. PLC | | | TRY | | | | 6,110,000 | | | | 1,723,554 | | | | 12/20/19 | | | 10.655(a) | | 3M LIBOR(b) | | | — | | | | (25,011 | ) |
| | | USD | | | | 860,000 | | | | | | | | 12/20/22 | | | 3M LIBOR(b) | | 10.385(a) | | | (2,525 | ) | | | 13,170 | |
| | | | | | | | 470,000 | | | | 470,000 | | | | 12/20/27 | | | 3M LIBOR(b) | | 9.953(a) | | | — | | | | 6,286 | |
| TOTAL | | | | | | | | | | | | | | | | | | | | | | $ | (2,525) | | | $ | (6,914 | ) |
| | (a) | | Payments made annually. |
| | (b) | | Payments made quarterly. |
| | |
| The accompanying notes are an integral part of these financial statements. | | 33 |
GOLDMAN SACHS STRATEGIC MACRO FUND
Consolidated Schedule of Investments (continued)
September 30, 2017 (Unaudited)
|
| ADDITIONAL INVESTMENT INFORMATION (continued) |
OVER THE COUNTER TOTAL RETURN SWAPS CONTRACTS
| | | | | | | | | | | | | | | | | | | | | | | | | | |
| Referenced Obligation/Index | | Financing Rate
Received
by the Fund | | Counterparty | | | Termination
Date | | | Notional
Amount | | | Market Value | | | Unrealized
Appreciation/
(Depreciation) | |
Egypt Treasury Bill | | 2.671%(a) | | | Citibank NA | | | | 02/08/18 | | | | EGP | | | | 6,250,000 | | | $ | 27,681 | | | $ | 27,681 | |
Egypt Treasury Bill | | 1.000 | | | Citibank NA | | | | 05/10/18 | | | | USD | | | | 11,800,000 | | | | 8,422 | | | | 8,422 | |
| TOTAL | | | | | | | | | | | | | | | | | | | | | | | | $ | 36,103 | |
| | (a) | | The Fund pays semi-annually and receives annually coupon payments in accordance with the swap contracts. On the termination date of the swap contracts, the Fund will either receive from or pay to the counterparty an amount equal to the net of the accrued financing fees and the value of the reference security subtracted from the original notional cost (notional multiplied by the price change of the reference security, converted to U.S. Dollars). |
| | (b) | | The Fund pays annually and receives semi-annual coupon payments in accordance with the swap contracts. On the termination date of the swap contracts, the Fund will either receive from or pay to the counterparty an amount equal to the net of the accrued financing fees and the value of the reference security subtracted from the original notional cost (notional multiplied by the price change of the reference security, converted to U.S. Dollars). |
NON-DELIVERABLE BOND FORWARD CONTRACT#
| | | | | | | | | | | | | | | | | | |
| Counterparty | | Notional
Amount
(000s) | | Referenced
Obligation | | Settlement
Date | | Market
Value | | | Financing
Fee(a) | | | Unrealized
Gain (Loss)* | |
Deutsche Bank AG | | COP 1,390 | | Titulos de Tesoreria | | 10/18/17 | | $ | (465 | ) | | | 3.500 | % | | $ | (465 | ) |
| | # | | Represents a short term forward contract to purchase the referenced obligation denominated in the non-deliverable foreign currency. |
| | * | | There are no upfront payments on the forward contract, therefore the unrealized gain (loss) on the forward contract is equal to its market value. |
| | (a) | | Payments made annually. |
PURCHASED AND WRITTEN OPTIONS CONTRACTS — At September 30, 2017, the Fund had the following purchased and written options:
OVER-THE-COUNTER INTEREST RATE SWAPTIONS
| | | | | | | | | | | | | | | | | | | | | | | | | | |
| Description | | Counterparty | | Exercise
Rate | | | Expiration
Date | | Number of
Contracts | | Notional
Amount | | | Market
Value | | | Premiums Paid
(Received) by
Portfolio | | | Unrealized
Appreciation/
(Depreciation) | |
Purchased option contracts: | |
Calls | |
1Y IRS | | Citibank NA | | | 2.273 | % | | 01/22/18 | | USD 3,181,500 | | $ | 1,400,000 | | | $ | 20,599 | | | $ | 22,785 | | | $ | (2,186 | ) |
1Y IRS | | JPMorgan Securities, Inc. | | | 2.048 | % | | 01/24/18 | | USD 1,842,750 | | | 900,000 | | | | 25,901 | | | | 16,965 | | | | 8,936 | |
1Y IRS | | Citibank NA | | | 2.539 | % | | 01/24/18 | | USD 2,285,100 | | | 900,000 | | | | 4,710 | | | | 17,280 | | | | (12,570 | ) |
| | | | | | | | | | | 7,309,350 | | | | | | $ | 51,210 | | | $ | 57,030 | | | $ | (5,820 | ) |
Puts | |
1Y IRS | | JPMorgan Securities, Inc. | | | 0.700 | % | | 10/23/17 | | EUR 602,000 | | $ | 860,000 | | | | 68 | | | | 5,367 | | | | (5,299 | ) |
1Y IRS | | Citibank NA | | | 2.273 | % | | 01/22/18 | | USD 3,181,500 | | | 1,400,000 | | | | 13,976 | | | | 22,785 | | | | (8,809 | ) |
1Y IRS | | JPMorgan Securities, Inc. | | | 2.048 | % | | 01/24/18 | | USD 1,842,750 | | | 900,000 | | | | 3,544 | | | | 16,965 | | | | (13,421 | ) |
1Y IRS | | Citibank NA | | | 2.539 | % | | 01/24/18 | | USD 2,285,100 | | | 900,000 | | | | 21,766 | | | | 17,280 | | | | 4,486 | |
| | | | | | | | | | | 7,911,350 | | | | | | $ | 39,354 | | | $ | 62,397 | | | $ | (23,043) | |
| TOTAL | | | | | | | | | | 15,220,700 | | | | | | $ | 90,564 | | | $ | 119,427 | | | $ | (28,863) | |
| | |
| 34 | | The accompanying notes are an integral part of these financial statements. |
GOLDMAN SACHS STRATEGIC MACRO FUND
|
| ADDITIONAL INVESTMENT INFORMATION (continued) |
OPTIONS ON FUTURES
| | | | | | | | | | | | | | | | | | | | | | | | | | |
| Description | | Counterparty | | Exercise
Price | | | Expiration
Date | | Number of
Contracts | | Notional
Amount | | | Market
Value | | | Premiums Paid
(Received)
by Portfolio | | | Unrealized
Appreciation/
(Depreciation) | |
Purchased option contracts | |
Puts | |
Eurodollar | | MS & Co. LLC | | | 97.875 USD | | | 12/15/17 | | USD 14,155,625 | | $ | 58 | | | $ | 363 | | | $ | 4,481 | | | $ | (4,118 | ) |
Eurodollar | | MS & Co. LLC | | | 97.875 USD | | | 12/15/17 | | USD 14,228,125 | | | 58 | | | | 11,600 | | | | 21,880 | | | | (10,280 | ) |
Eurodollar | | MS & Co. LLC | | | 97.875 USD | | | 06/15/18 | | USD 6,370,000 | | | 26 | | | | 10,074 | | | | 7,208 | | | | 2,866 | |
| Total Purchased option contracts | | | | | 34,753,750 | | | | | | $ | 22,037 | | | $ | 33,569 | | | $ | (11,532) | |
| | | | | | | | | | | | | | | | | | | | | | | | | | |
Written option contracts | |
Puts | |
| | | | | | | | |
Eurodollar | | MS & Co. LLC | | | 97.875 USD | | | 12/15/17 | | USD 116 | | $ | (290,000 | ) | | | (3,625 | ) | | | (20,039 | ) | | | 16,414 | |
| | |
|
| Abbreviation: |
1M BID Avg | | —1 month Brazilian Interbank Deposit Average |
BoA Securities LLC | | —Bank of America Securities LLC |
CDX.EM Index 27 | | —CDX Emerging Markets Index 27 |
CDX.NA.IG Index 28 | | —CDX North America Investment Grade Index 28 |
Colombia IBR Overnight IB | | —Colombia IBR Overnight Interbank |
Colombia IBR Overnight IB | | —Colombia IBR Overnight Interbank |
CS International (London) | | —Credit Suisse International (London) |
Mexico IB TIIE 28D | | —Mexico Interbank TIIE 28 Days |
MS & Co. Int. PLC | | —Morgan Stanley & Co. International PLC |
MS & Co. LLC | | —Morgan Stanley & Co. LLC |
|
| | |
| The accompanying notes are an integral part of these financial statements. | | 35 |
GOLDMAN SACHS FIXED INCOME ALTERNATIVES FUNDS
Statements of Assets and Liabilities
September 30, 2017 (Unaudited)
| | | | | | | | | | |
| | | | | Long Short
Credit Strategies
Fund | | | Strategic
Macro Fund(a) | |
| | Assets: | | | | | | | | |
| | Investments of unaffiliated issuers, at value (cost $184,493,854 and $18,363,774) | | $ | 180,946,654 | | | $ | 18,207,518 | |
| | Investments of affiliated issuers, at value (cost $20,359,346 and $5,183,338) | | | 20,359,346 | | | | 5,183,338 | |
| | Purchased options (cost $0 and $152,996) | | | — | | | | 112,601 | |
| | Cash | | | 2,373,427 | | | | 553,174 | |
| | Foreign currencies, at value (cost $227,861 and $227,764, respectively) | | | 246,234 | | | | 227,605 | |
| | Unrealized gain on swap contracts | | | — | | | | 449,171 | |
| | Unrealized gain on forward foreign currency exchange contracts | | | — | | | | 624,529 | |
| | Variation margin on future contracts | | | — | | | | 15,813 | |
| | Variation margin on swap contracts | | | — | | | | 105,134 | |
| | Receivables: | | | | | | | | |
| | Collateral on certain derivative contracts(b) | | | 4,499,088 | | | | 1,786,884 | |
| | Investments sold | | | 4,294,923 | | | | 2,814,373 | |
| | Investments sold on an extended-settlement basis | | | 3,949,208 | | | | — | |
| | Dividends and interest | | | 2,302,847 | | | | 113,585 | |
| | Fund shares sold | | | 576,147 | | | | — | |
| | Reimbursement from investment adviser | | | 17,129 | | | | 11,300 | |
| | Due from broker — upfront payment | | | 16,258 | | | | 12,137,874 | |
| | Other assets | | | 277 | | | | 243 | |
| | Total assets | | | 219,581,538 | | | | 42,343,142 | |
| | | | | | | | | | |
| | Liabilities: | | | | | | | | |
| | Unrealized loss on swap contracts | | | — | | | | 569,242 | |
| | Unrealized loss on forward foreign currency exchange contracts | | | — | | | | 731,361 | |
| | Variation margin on swap contracts | | | 256,433 | | | | — | |
| | Written option contracts, at value (premium received $0 and $20,039, respectively) | | | — | | | | 3,625 | |
| | Payables: | | | | | | | | |
| | Investments purchased on an extended — settlement basis | | | 9,269,086 | | | | — | |
| | Investments purchased | | | 2,890,496 | | | | 3,239,770 | |
| | Fund shares redeemed | | | 655,983 | | | | 209,472 | |
| | Management fees | | | 167,317 | | | | 18,857 | |
| | Income distribution | | | 57,222 | | | | — | |
| | Distribution and Service fees and Transfer Agency fees | | | 11,671 | | | | 920 | |
| | Due to broker — upfront payment | | | — | | | | 12,162,505 | |
| | Non deliverable bond forward contracts, at value | | | — | | | | 465 | |
| | Due to Broker | | | — | | | | 739 | |
| | Upfront payments received on swap contracts | | | — | | | | 5,208 | |
| | Accrued expenses | | | 104,263 | | | | 145,916 | |
| | Total liabilities | | | 13,412,471 | | | | 17,088,080 | |
| | | | | | | | | | |
| | Net Assets: | | | | | | | | |
| | Paid-in capital | | | 225,806,678 | | | | 33,227,610 | |
| | Undistributed net investment income | | | 3,806,952 | | | | 230,602 | |
| | Accumulated net realized loss | | | (19,294,031 | ) | | | (9,191,379 | ) |
| | Net unrealized gain (loss) | | | (4,150,532 | ) | | | 988,229 | |
| | | NET ASSETS | | $ | 206,169,067 | | | $ | 25,255,062 | |
| | | Net Assets: | | | | | | | | |
| | | Class A | | $ | 8,432,145 | | | $ | 178,809 | |
| | | Class C | | | 2,147,146 | | | | 39,398 | |
| | | Institutional | | | 188,626,703 | | | | 24,763,708 | |
| | | Investor | | | 6,927,699 | | | | 249,793 | |
| | | Class R | | | 35,374 | | | | 23,354 | |
| | | Total Net Assets | | $ | 206,169,067 | | | $ | 25,255,062 | |
| | | Shares Outstanding $0.001 par value (unlimited number of shares authorized): | | | | | | | | |
| | | Class A | | | 886,374 | | | | 20,456 | |
| | | Class C | | | 225,792 | | | | 4,518 | |
| | | Institutional | | | 19,845,207 | | | | 2,825,857 | |
| | | Investor | | | 728,395 | | | | 28,463 | |
| | | Class R | | | 3,720 | | | | 2,679 | |
| | | Net asset value, offering and redemption price per share:(c) | | | | | | | | |
| | | Class A | | $ | 9.51 | | | $ | 8.74 | |
| | | Class C | | | 9.51 | | | | 8.72 | |
| | | Institutional | | | 9.50 | | | | 8.76 | |
| | | Investor | | | 9.51 | | | | 8.78 | |
| | | Class R | | | 9.51 | | | | 8.72 | |
| | (a) | | Statement of Assets and Liabilities for the Fund is consolidated and includes the balances of a wholly-owned subsidiary, Cayman Commodity – FIMS Ltd. Accordingly, all interfund balances and transactions have been eliminated. |
| | (b) | | Includes amounts segregated for initial margin and/or collateral on futures transactions and swaps transactions of $0 and $4,499,088, respectively for Long Short Credit Strategies Fund and $251,812 and $1,535,072, respectively for Strategic Macro Fund. |
| | (c) | | Maximum public offering price for Class A shares of the Long Short Credit Strategies and the Strategic Macro Funds is $9.88 and $9.08, respectively. At redemption, Class C shares may be subject to a contingent deferred sales charge, assessed on the amount equal to the lesser of the current net asset value or the original purchase price of the shares. |
| | |
| 36 | | The accompanying notes are an integral part of these financial statements. |
GOLDMAN SACHS FIXED INCOME ALTERNATIVES FUNDS
Statements of Operations
For the Six Months Ended September 30, 2017 (Unaudited)
| | | | | | | | | | |
| | | | | Long Short
Credit Strategies
Fund | | | Strategic
Macro Fund(a) | |
| | Investment income: | | | | | | | | |
| | Interest | | $ | 4,930,497 | | | $ | 273,594 | |
| | Dividends — affiliated issuers | | | 111,786 | | | | 47,936 | |
| | Total investment income | | | 5,042,283 | | | | 321,530 | |
| | | | | | | | | | |
| | Expenses: | | | | | | | | |
| | Management fees | | | 1,039,300 | | | | 286,468 | |
| | Professional fees | | | 67,959 | | | | 54,448 | |
| | Custody, accounting and administrative services | | | 58,156 | | | | 174,532 | |
| | Transfer Agency fees(b) | | | 50,033 | | | | 9,463 | |
| | Registration fees | | | 37,201 | | | | 29,297 | |
| | Printing and mailing costs | | | 26,985 | | | | 16,299 | |
| | Distribution and Service fees(b) | | | 23,071 | | | | 504 | |
| | Trustee fees | | | 9,080 | | | | 8,913 | |
| | Prime Broker Fees | | | — | | | | 5,395 | |
| | Other | | | 7,256 | | | | 7,720 | |
| | Total expenses | | | 1,319,041 | | | | 593,039 | |
| | Less — expense reductions | | | (133,000 | ) | | | (322,648 | ) |
| | Net expenses | | | 1,186,041 | | | | 270,391 | |
| | NET INVESTMENT INCOME | | | 3,856,242 | | | | 51,139 | |
| | | | | | | | | | |
| | Realized and unrealized gain (loss): | | | | | | | | |
| | Net realized gain (loss) from: | | | | | | | | |
| | Investments — unaffiliated issuers | | | 2,298,720 | | | | 798,793 | |
| | Purchased options | | | — | | | | (522,724 | ) |
| | Futures contracts | | | — | | | | (698,754 | ) |
| | Written options | | | — | | | | 363,300 | |
| | Swap contracts | | | (2,349,978 | ) | | | (492,199 | ) |
| | Non-deliverable bond forward contracts | | | — | | | | 4,410 | |
| | Forward foreign currency exchange contracts | | | — | | | | (802,224 | ) |
| | Foreign currency transactions | | | 24 | | | | 193,703 | |
| | Net change in unrealized gain on: | | | | | | | | |
| | Investments | | | 169,675 | | | | (365,933 | ) |
| | Purchased options | | | — | | | | 229,758 | |
| | Futures contracts | | | — | | | | (369,561 | ) |
| | Non-deliverable bond forward contracts | | | — | | | | (1,992 | ) |
| | Written options | | | — | | | | (231,526 | ) |
| | Swap contracts | | | (228,644 | ) | | | 442,161 | |
| | Forward foreign currency exchange contracts | | | — | | | | 970,955 | |
| | Foreign currency translation | | | 23,674 | | | | (76,386 | ) |
| | Net realized and unrealized loss | | | (86,529 | ) | | | (558,219 | ) |
| | NET INCREASE (DECREASE) IN NET ASSETS RESULTING FROM OPERATIONS | | $ | 3,769,713 | | | $ | (507,080 | ) |
| | (a) | | Statement of Operations for the Fund is consolidated and includes the balances of a wholly-owned subsidiary, Cayman Commodity – FIMS Ltd. Accordingly, all interfund balances and transactions have been eliminated. |
| | (b) | | Class specific Distribution and Service and Transfer Agent fees were as follows: |
| | | | | | | | | | | | | | | | | | | | | | | | | | | | | | | | |
| | | Distribution and Service Fees | | | Transfer Agency Fees | |
Fund | | Class A | | | Class C | | | Class R | | | Class A | | | Class C | | | Institutional | | | Investor | | | Class R | |
Long Short Credit Strategies | | | 11,402 | | | | 11,581 | | | | 88 | | | | 5,929 | | | | 1,506 | | | | 37,812 | | | | 4,763 | | | | 23 | |
| | | | | | | | |
Strategic Macro | | | 225 | | | | 220 | | | | 59 | | | | 117 | | | | 29 | | | | 9,110 | | | | 192 | | | | 15 | |
| | |
| The accompanying notes are an integral part of these financial statements. | | 37 |
GOLDMAN SACHS FIXED INCOME ALTERNATIVES FUNDS
Statements of Changes in Net Assets
| | | | | | | | | | |
| | | | | Long Short Credit Strategies Fund | |
| | | | | For the
Six Months Ended
September 30, 2017
(Unaudited) | | | For the Fiscal
Year Ended
March 31, 2017 | |
| | From operations: | | | | | | | | |
| | Net investment income | | $ | 3,856,242 | | | $ | 7,798,659 | |
| | Net realized gain (loss) | | | (51,234 | ) | | | (533,503 | ) |
| | Net change in unrealized gain (loss) | | | (35,295 | ) | | | (258,494 | ) |
| | Net increase in net assets resulting from operations | | | 3,769,713 | | | | 7,006,662 | |
| | | | | | | | | | |
| | Distributions to shareholders: | | | | | | | | |
| | From net investment income | | | | | | | | |
| | Class A Shares | | | (92,691 | ) | | | (420,839 | ) |
| | Class C Shares | | | (14,816 | ) | | | (67,169 | ) |
| | Institutional Shares | | | (2,220,264 | ) | | | (6,964,302 | ) |
| | Investor Shares | | | (83,227 | ) | | | (285,677 | ) |
| | Class R Shares | | | (308 | ) | | | (1,069 | ) |
| | Total distributions to shareholders | | | (2,411,306 | ) | | | (7,739,056 | ) |
| | | | | | | | | | |
| | From share transactions: | | | | | | | | |
| | Proceeds from sales of shares | | | 23,221,374 | | | | 88,176,783 | |
| | Reinvestment of distributions | | | 2,003,438 | | | | 6,291,062 | |
| | Cost of shares redeemed | | | (34,590,189 | ) | | | (68,548,576 | ) |
| | Net increase (decrease) in net assets resulting from share transactions | | | (9,365,377 | ) | | | 25,919,269 | |
| | TOTAL INCREASE (DECREASE) | | | (8,006,970 | ) | | | 25,186,875 | |
| | | | | | | | | | |
| | Net assets: | | | | | | | | |
| | Beginning of period | | | 214,176,037 | | | | 188,989,162 | |
| | End of period | | $ | 206,169,067 | | | $ | 214,176,037 | |
| | Undistributed net investment income | | $ | 3,806,952 | | | $ | 2,362,016 | |
| | |
| 38 | | The accompanying notes are an integral part of these financial statements. |
GOLDMAN SACHS FIXED INCOME ALTERNATIVES FUNDS
Statements of Changes in Net Assets
| | | | | | | | | | |
| | | | | Strategic Macro Fund(a) | |
| | | | | For the
Six Months Ended
September 30, 2017
(Unaudited) | | | For the Fiscal
Year Ended
March 31, 2017 | |
| | From operations: | | | | | | | | |
| | Net investment income | | $ | 51,139 | | | $ | 924,164 | |
| | Net realized gain (loss) | | | (1,155,695 | ) | | | 165,640 | |
| | Net change in unrealized gain (loss) | | | 597,476 | | | | (232,161 | ) |
| | Net increase (decrease) in net assets resulting from operations | | | (507,080 | ) | | | 857,643 | |
| | | | | | | | | | |
| | Distributions to shareholders: | | | | | | | | |
| | From net investment income | | | | | | | | |
| | Class A Shares | | | — | | | | (1,827 | ) |
| | Institutional Shares | | | — | | | | (844,564 | ) |
| | Investor Shares | | | — | | | | (3,763 | ) |
| | Class R Shares | | | — | | | | (212 | ) |
| | Total distributions to shareholders | | | — | | | | (850,366 | ) |
| | | | | | | | | | |
| | From share transactions: | | | | | | | | |
| | Proceeds from sales of shares | | | 1,830,509 | | | | 1,604,824 | |
| | Reinvestment of distributions | | | — | | | | 850,366 | |
| | Cost of shares redeemed | | | (32,872,020 | ) | | | (13,839,002 | ) |
| | Net decrease in net assets resulting from share transactions | | | (31,041,511 | ) | | | (11,383,812 | ) |
| | TOTAL DECREASE | | | (31,548,591 | ) | | | (11,376,535 | ) |
| | | | | | | | | | |
| | Net assets: | | | | | | | | |
| | Beginning of period | | | 56,803,653 | | | | 68,180,188 | |
| | End of period | | $ | 25,255,062 | | | $ | 56,803,653 | |
| | Undistributed net investment income | | $ | 230,602 | | | $ | 179,463 | |
| | (a) | | Statement of Changes in Net Assets for the Strategic Macro Fund is consolidated and includes the balances of wholly owned subsidiary, Cayman Commodity — FIMS Ltd. Accordingly, all interfund balances and transactions have been eliminated. |
| | |
| The accompanying notes are an integral part of these financial statements. | | 39 |
GOLDMAN SACHS LONG SHORT CREDIT STRATEGIES FUND
Financial Highlights
Selected Data for a Share Outstanding Throughout Each Period
| | | | | | | | | | | | | | | | | | | | | | | | | | | | | | |
| | | | | | | | Income (loss) From
Investment Operations | | | Distributions
to shareholders | |
| | | Year - Share Class | |
Net asset
value,
beginning
of period | | | Net
investment
income(a) | | | Net realized
and unrealized
gain (loss) | | | Total from
investment
operations | | | From net
investment
income | | | From net
realized gains | | | Total
distributions | |
| | FOR THE SIX MONTHS ENDED SEPTEMBER 30, (UNAUDITED) | | | | | | | | | |
| | 2017 - A | | $ | 9.45 | | | $ | 0.16 | | | $ | — | (d) | | $ | 0.16 | | | $ | (0.10 | ) | | $ | — | | | $ | (0.10 | ) |
| | 2017 - C | | | 9.45 | | | | 0.13 | | | | (0.01 | ) | | | 0.12 | | | | (0.06 | ) | | | — | | | | (0.06 | ) |
| | 2017 - Institutional | | | 9.44 | | | | 0.18 | | | | (0.01 | ) | | | 0.17 | | | | (0.11 | ) | | | — | | | | (0.11 | ) |
| | 2017 - Investor(f) | | | 9.45 | | | | 0.17 | | | | — | (d) | | | 0.17 | | | | (0.11 | ) | | | — | | | | (0.11 | ) |
| | 2017 - R | | | 9.45 | | | | 0.15 | | | | (0.01 | ) | | | 0.14 | | | | (0.08 | ) | | | — | | | | (0.08 | ) |
| | | | | | | | | | | | | | | | | | | | | | | | | | | | | | |
| | FOR THE FISCAL YEARS ENDED MARCH 31, | | | | | | | | | |
| | 2017 - A | | | 9.47 | | | | 0.33 | | | | (0.03 | ) | | | 0.30 | | | | (0.32 | ) | | | — | | | | (0.32 | ) |
| | 2017 - C | | | 9.47 | | | | 0.26 | | | | (0.03 | ) | | | 0.23 | | | | (0.25 | ) | | | — | | | | (0.25 | ) |
| | 2017 - Institutional | | | 9.46 | | | | 0.36 | | | | (0.03 | ) | | | 0.33 | | | | (0.35 | ) | | | — | | | | (0.35 | ) |
| | 2017 - Investor(f) | | | 9.47 | | | | 0.35 | | | | (0.03 | ) | | | 0.32 | | | | (0.34 | ) | | | — | | | | (0.34 | ) |
| | 2017 - R | | | 9.47 | | | | 0.30 | | | | (0.02 | ) | | | 0.28 | | | | (0.30 | ) | | | — | | | | (0.30 | ) |
| | 2016 - A | | | 9.79 | | | | 0.32 | | | | (0.30 | ) | | | 0.02 | | | | (0.34 | ) | | | — | | | | (0.34 | ) |
| | 2016 - C | | | 9.79 | | | | 0.25 | | | | (0.31 | ) | | | (0.06 | ) | | | (0.26 | ) | | | — | | | | (0.26 | ) |
| | 2016 - Institutional | | | 9.78 | | | | 0.35 | | | | (0.30 | ) | | | 0.05 | | | | (0.37 | ) | | | — | | | | (0.37 | ) |
| | 2016 - Investor(f) | | | 9.79 | | | | 0.35 | | | | (0.31 | ) | | | 0.04 | | | | (0.36 | ) | | | — | | | | (0.36 | ) |
| | 2016 - R | | | 9.78 | | | | 0.30 | | | | (0.30 | ) | | | — | | | | (0.31 | ) | | | — | | | | (0.31 | ) |
| | 2015 - A (Commenced April 30, 2014) | | | 10.52 | | | | 0.31 | | | | (0.65 | ) | | | (0.34 | ) | | | (0.30 | ) | | | (0.09 | ) | | | (0.39 | ) |
| | 2015 - C (Commenced April 30, 2014) | | | 10.52 | | | | 0.24 | | | | (0.66 | ) | | | (0.42 | ) | | | (0.22 | ) | | | (0.09 | ) | | | (0.31 | ) |
| | 2015 - Institutional | | | 10.51 | | | | 0.37 | | | | (0.66 | ) | | | (0.29 | ) | | | (0.35 | ) | | | (0.09 | ) | | | (0.44 | ) |
| | 2015 - Investor(f) (Commenced April 30, 2014) | | | 10.52 | | | | 0.33 | | | | (0.65 | ) | | | (0.32 | ) | | | (0.32 | ) | | | (0.09 | ) | | | (0.41 | ) |
| | 2015 - R (Commenced April 30, 2014) | | | 10.52 | | | | 0.28 | | | | (0.65 | ) | | | (0.37 | ) | | | (0.28 | ) | | | (0.09 | ) | | | (0.37 | ) |
| | 2014 - Institutional | | | 10.80 | | | | 0.39 | | | | 0.09 | | | | 0.48 | | | | (0.39 | ) | | | (0.38 | ) | | | (0.77 | ) |
| | 2013 - Institutional | | | 10.58 | | | | 0.45 | | | | 0.45 | | | | 0.90 | | | | (0.47 | ) | | | (0.21 | ) | | | (0.68 | ) |
| | (a) | | Calculated based on the average shares outstanding methodology. |
| | (b) | | Assumes investment at the NAV at the beginning of the period, reinvestment of all dividends and distributions, a complete redemption of the investment at the NAV at the end of the period and no sales or redemption charges. Total returns would be reduced if a sales or redemption charge was taken into account. Returns do not reflect the impact of taxes to shareholder relating to Fund distributions or the redemption of Fund shares. Total returns for periods less than one full year are not annualized. |
| | (c) | | The Fund’s portfolio turnover rate is calculated in accordance with regulatory requirements, without regard to transactions involving short term investments and certain derivatives. If such transactions were included, the Fund’s portfolio turnover rate may be higher. |
| | (d) | | Amount is less than $0.005 per share. |
| | (f) | | Effective August 15, 2017, Class IR Shares changed its name to Investor Shares. |
| | |
| 40 | | The accompanying notes are an integral part of these financial statements. |
GOLDMAN SACHS LONG SHORT CREDIT STRATEGIES FUND
| | | | | | | | | | | | | | | | | | | | | | | | | | | | | | | | | | | | | | | | |
| | | | | | | | | | | | | | | | | | | | | | | | | | | | | | | | | | |
| | | Net asset
value, end
of period | | | | | Total
return(b) | | | | | Net assets,
end of
period
(in 000s) | | | | | Ratio of
net expenses
to average
net assets | | | | | Ratio of
total expenses
to average
net assets | | | | | Ratio of
net investment
income
to average
net assets | | | | | Portfolio
turnover
rate(c) | |
| | | | | | | | | | | | | | | | | | | | | | | | | | | | | | | | | | | | | | | | |
| | $ | 9.51 | | | | | | 1.65 | % | | | | $ | 8,432 | | | | | | 1.45 | %(e) | | | | | 1.58 | %(e) | | | | | 3.41 | %(e) | | | | | 140 | % |
| | | 9.51 | | | | | | 1.27 | | | | | | 2,147 | | | | | | 2.20 | (e) | | | | | 2.33 | (e) | | | | | 2.66 | (e) | | | | | 140 | |
| | | 9.50 | | | | | | 1.82 | | | | | | 188,627 | | | | | | 1.11 | (e) | | | | | 1.24 | (e) | | | | | 3.74 | (e) | | | | | 140 | |
| | | 9.51 | | | | | | 1.78 | | | | | | 6,928 | | | | | | 1.20 | (e) | | | | | 1.33 | (e) | | | | | 3.66 | (e) | | | | | 140 | |
| | | 9.51 | | | | | | 1.52 | | | | | | 35 | | | | | | 1.70 | (e) | | | | | 1.83 | (e) | | | | | 3.14 | (e) | | | | | 140 | |
| | | | | | | | | | | | | | | | | | | | | | | | | | | | | | | | | | | | | | | | |
| | | | | | | | | | | | | | | | | | | | | | | | | | | | | | | | | | | | | | | | |
| | | 9.45 | | | | | | 3.20 | | | | | | 12,673 | | | | | | 1.45 | | | | | | 1.62 | | | | | | 3.43 | | | | | | 266 | |
| | | 9.45 | | | | | | 2.43 | | | | | | 2,692 | | | | | | 2.20 | | | | | | 2.37 | | | | | | 2.68 | | | | | | 266 | |
| | | 9.44 | | | | | | 3.55 | | | | | | 189,429 | | | | | | 1.11 | | | | | | 1.28 | | | | | | 3.77 | | | | | | 266 | |
| | | 9.45 | | | | | | 3.45 | | | | | | 9,347 | | | | | | 1.20 | | | | | | 1.38 | | | | | | 3.69 | | | | | | 266 | |
| | | 9.45 | | | | | | 2.94 | | | | | | 35 | | | | | | 1.70 | | | | | | 1.87 | | | | | | 3.18 | | | | | | 266 | |
| | | 9.47 | | | | | | 0.19 | | | | | | 8,358 | | | | | | 1.49 | | | | | | 1.57 | | | | | | 3.34 | | | | | | 173 | |
| | | 9.47 | | | | | | (0.55 | ) | | | | | 1,773 | | | | | | 2.23 | | | | | | 2.32 | | | | | | 2.61 | | | | | | 173 | |
| | | 9.46 | | | | | | 0.53 | | | | | | 173,758 | | | | | | 1.15 | | | | | | 1.23 | | | | | | 3.68 | | | | | | 173 | |
| | | 9.47 | | | | | | 0.44 | | | | | | 5,067 | | | | | | 1.23 | | | | | | 1.32 | | | | | | 3.61 | | | | | | 173 | |
| | | 9.47 | | | | | | 0.04 | | | | | | 33 | | | | | | 1.74 | | | | | | 1.83 | | | | | | 3.08 | | | | | | 173 | |
| | | 9.79 | | | | | | (3.28 | ) | | | | | 6,943 | | | | | | 1.57 | (e) | | | | | 1.62 | (e) | | | | | 3.35 | (e) | | | | | 164 | |
| | | 9.79 | | | | | | (3.95 | ) | | | | | 1,016 | | | | | | 2.30 | (e) | | | | | 2.38 | (e) | | | | | 2.61 | (e) | | | | | 164 | |
| | | 9.78 | | | | | | (2.77 | ) | | | | | 190,148 | | | | | | 1.27 | | | | | | 1.35 | | | | | | 3.57 | | | | | | 164 | |
| | | 9.79 | | | | | | (3.05 | ) | | | | | 2,475 | | | | | | 1.30 | (e) | | | | | 1.40 | (e) | | | | | 3.60 | (e) | | | | | 164 | |
| | | 9.78 | | | | | | (3.57 | ) | | | | | 32 | | | | | | 1.84 | (e) | | | | | 1.93 | (e) | | | | | 2.98 | (e) | | | | | 164 | |
| | | 10.51 | | | | | | 4.61 | | | | | | 335,421 | | | | | | 1.49 | | | | | | 1.51 | | | | | | 3.67 | | | | | | 207 | |
| | | 10.80 | | | | | | 8.74 | | | | | | 506,996 | | | | | | 1.47 | | | | | | 1.47 | | | | | | 4.23 | | | | | | 204 | |
| | |
| The accompanying notes are an integral part of these financial statements. | | 41 |
GOLDMAN SACHS STRATEGIC MACRO FUND
Financial Highlights
Selected Data for a Share Outstanding Throughout Each Period
| | | | | | | | | | | | | | | | | | | | | | | | | | | | | | |
| | | | | | | | From
Investment Operations | | | Distributions to shareholders | |
| | | Year - Share Class | | Net asset
value,
beginning
of period | | | Net
investment
income
(loss)(a) | | | Net realized
and unrealized
gain (loss) | | | Total from
investment
operations | | | From net
investment
income | | | From
capital | | | Total
distributions | |
| | FOR THE SIX MONTHS ENDED SEPTEMBER 30, (UNAUDITED) | |
| | 2017 - A | | $ | 8.87 | | | $ | (0.02 | ) | | $ | (0.11 | ) | | $ | (0.13 | ) | | $ | — | | | $ | — | | | $ | — | |
| | 2017 - C | | | 8.88 | | | | (0.05 | ) | | | (0.11 | ) | | | (0.16 | ) | | | — | | | | — | | | | — | |
| | 2017 - Institutional | | | 8.88 | | | | 0.01 | | | | (0.13 | ) | | | (0.12 | ) | | | — | | | | — | | | | — | |
| | 2017 - Investor(f) | | | 8.89 | | | | — | (e) | | | (0.11 | ) | | | (0.11 | ) | | | — | | | | — | | | | — | |
| | 2017 - R | | | 8.85 | | | | (0.02 | ) | | | (0.11 | ) | | | (0.13 | ) | | | — | | | | — | | | | — | |
| | | | | | | | | | | | | | | | | | | | | | | | | | | | | | |
| | FOR THE FISCAL YEARS ENDED MARCH 31, | |
| | 2017 - A | | | 8.84 | | | | 0.10 | | | | 0.02 | | | | 0.12 | | | | (0.09 | ) | | | — | | | | (0.09 | ) |
| | 2017 - C | | | 8.83 | | | | 0.03 | | | | 0.02 | | | | 0.05 | | | | — | | | | — | | | | — | |
| | 2017 - Institutional | | | 8.86 | | | | 0.14 | | | | 0.01 | | | | 0.15 | | | | (0.13 | ) | | | — | | | | (0.13 | ) |
| | 2017 - Investor(f) | | | 8.84 | | | | 0.10 | | | | 0.04 | | | | 0.14 | | | | (0.09 | ) | | | — | | | | (0.09 | ) |
| | 2017 - R | | | 8.84 | | | | 0.09 | | | | — | (e) | | | 0.09 | | | | (0.08 | ) | | | — | | | | (0.08 | ) |
| | 2016 - A | | | 9.03 | | | | 0.03 | | | | 0.33 | | | | 0.36 | | | | (0.25 | ) | | | (0.30 | ) | | | (0.55 | ) |
| | 2016 - C | | | 9.04 | | | | (0.06 | ) | | | 0.35 | | | | 0.29 | | | | (0.33 | ) | | | (0.17 | ) | | | (0.50 | ) |
| | 2016 - Institutional | | | 9.05 | | | | 0.04 | | | | 0.33 | | | | 0.37 | | | | (0.30 | ) | | | (0.26 | ) | | | (0.56 | ) |
| | 2016 - Investor(f) | | | 9.03 | | | | — | (e) | | | 0.36 | | | | 0.36 | | | | (0.40 | ) | | | (0.15 | ) | | | (0.55 | ) |
| | 2016 - R | | | 9.04 | | | | (0.01 | ) | | | 0.34 | | | | 0.33 | | | | (0.29 | ) | | | (0.24 | ) | | | (0.53 | ) |
| | 2015 - A | | | 9.82 | | | | 0.03 | | | | (0.81 | ) | | | (0.78 | ) | | | — | | | | (0.01 | ) | | | (0.01 | ) |
| | 2015 - C | | | 9.82 | | | | 0.05 | | | | (0.82 | ) | | | (0.77 | ) | | | — | | | | (0.01 | ) | | | (0.01 | ) |
| | 2015 - Institutional | | | 9.84 | | | | 0.02 | | | | (0.79 | ) | | | (0.77 | ) | | | — | | | | (0.02 | ) | | | (0.02 | ) |
| | 2015 - Investor(f) | | | 9.81 | | | | 0.02 | | | | (0.78 | ) | | | (0.76 | ) | | | — | | | | (0.02 | ) | | | (0.02 | ) |
| | 2015 - R | | | 9.82 | | | | 0.01 | | | | (0.78 | ) | | | (0.77 | ) | | | — | | | | (0.01 | ) | | | (0.01 | ) |
| | | | | | | | | | | | | | | | | | | | | | | | | | | | | | |
| | FOR THE PERIOD ENDED MARCH 31, | |
| | 2014 - A (Commenced December 16, 2013) | | | 10.00 | | | | (0.01 | ) | | | (0.16 | ) | | | (0.17 | ) | | | — | | | | (0.01 | ) | | | (0.01 | ) |
| | 2014 - C (Commenced December 16, 2013) | | | 10.00 | | | | (0.02 | ) | | | (0.16 | ) | | | (0.18 | ) | | | — | | | | — | (e) | | | — | (e) |
| | 2014 - Institutional (Commenced December 16, 2013) | | | 10.00 | | | | — | (e) | | | (0.14 | ) | | | (0.14 | ) | | | — | | | | (0.02 | ) | | | (0.02 | ) |
| | 2014 - Investor(f) (Commenced December 16, 2013) | | | 10.00 | | | | — | (e) | | | (0.17 | ) | | | (0.17 | ) | | | — | | | | (0.02 | ) | | | (0.02 | ) |
| | 2014 - R (Commenced December 16, 2013) | | | 10.00 | | | | (0.01 | ) | | | (0.16 | ) | | | (0.17 | ) | | | — | | | | (0.01 | ) | | | (0.01 | ) |
| | (a) | | Calculated based on the average shares outstanding methodology. |
| | (b) | | Assumes investment at the NAV at the beginning of the period, reinvestment of all dividends and distributions, a complete redemption of the investment at the NAV at the end of the period and no sales or redemption charges. Total returns would be reduced if a sales or redemption charge was taken into account. Returns do not reflect the impact of taxes to shareholder relating to Fund distributions or the redemption of Fund shares. Total returns for periods less than one full year are not annualized. |
| | (c) | | The Fund’s portfolio turnover rate is calculated in accordance with regulatory requirements, without regard to transactions involving short term investments and certain derivatives. If such transactions were included, the Fund’s portfolio turnover rate may be higher. |
| | (e) | | Amount is less than $0.005 per share. |
| | (f) | | Effective August 15, 2017, Class IR Shares changed its name to Investor Shares. |
| | |
| 42 | | The accompanying notes are an integral part of these financial statements. |
GOLDMAN SACHS STRATEGIC MACRO FUND
| | | | | | | | | | | | | | | | | | | | | | | | | | | | | | | | | | | | | | | | |
| | | | | | | | | | | | | | | | | | | | | | | | | | | | | | | | | | |
| | | Net asset
value, end
of period | | | | | Total
return(b) | | | | | Net assets,
end of
period
(in 000s) | | | | | Ratio of
net expenses
to average
net assets | | | | | Ratio of
total expenses
to average
net assets | | | | | Ratio of
net investment
income (loss)
to average
net assets | | | | | Portfolio
turnover
rate(c) | |
| | | | | | | | | | | | | | | | | | | | | | | | | | | | | | | | | | | | | | | | |
| | $ | 8.74 | | | | | | (1.58 | )% | | | | $ | 179 | | | | | | 1.43 | %(d) | | | | | 3.02 | %(d) | | | | | (0.38 | )%(d) | | | | | 138 | % |
| | | 8.72 | | | | | | (1.91 | ) | | | | | 39 | | | | | | 2.19 | (d) | | | | | 3.75 | (d) | | | | | (1.06 | )(d) | | | | | 138 | |
| | | 8.76 | | | | | | (1.35 | ) | | | | | 24,764 | | | | | | 1.17 | (d) | | | | | 2.57 | (d) | | | | | 0.23 | (d) | | | | | 138 | |
| | | 8.78 | | | | | | (1.35 | ) | | | | | 250 | | | | | | 1.19 | (d) | | | | | 2.75 | (d) | | | | | (0.05 | )(d) | | | | | 138 | |
| | | 8.72 | | | | | | (1.58 | ) | | | | | 23 | | | | | | 1.59 | (d) | | | | | 3.18 | (d) | | | | | (0.56 | )(d) | | | | | 138 | |
| | | | | | | | | | | | | | | | | | | | | | | | | | | | | | | | | | | | | | | | |
| | | | | | | | | | | | | | | | | | | | | | | | | | | | | | | | | | | | | | | | |
| | | 8.87 | | | | | | 1.35 | | | | | | 183 | | | | | | 1.74 | | | | | | 3.12 | | | | | | 1.19 | | | | | | 376 | |
| | | 8.88 | | | | | | 0.57 | | | | | | 53 | | | | | | 2.49 | | | | | | 3.89 | | | | | | 0.38 | | | | | | 376 | |
| | | 8.88 | | | | | | 1.73 | | | | | | 56,204 | | | | | | 1.44 | | | | | | 2.78 | | | | | | 1.54 | | | | | | 376 | |
| | | 8.89 | | | | | | 1.62 | | | | | | 340 | | | | | | 1.50 | | | | | | 2.89 | | | | | | 1.18 | | | | | | 376 | |
| | | 8.85 | | | | | | 1.03 | | | | | | 24 | | | | | | 1.96 | | | | | | 3.35 | | | | | | 1.05 | | | | | | 376 | |
| | | 8.84 | | | | | | 3.98 | | | | | | 312 | | | | | | 1.85 | | | | | | 3.39 | | | | | | 0.33 | | | | | | 472 | |
| | | 8.83 | | | | | | 3.25 | | | | | | 136 | | | | | | 2.21 | | | | | | 3.88 | | | | | | (0.68 | ) | | | | | 472 | |
| | | 8.86 | | | | | | 4.15 | | | | | | 66,006 | | | | | | 1.44 | | | | | | 2.79 | | | | | | 0.42 | | | | | | 472 | |
| | | 8.84 | | | | | | 4.06 | | | | | | 1,703 | | | | | | 1.52 | | | | | | 2.89 | | | | | | 0.03 | | | | | | 472 | |
| | | 8.84 | | | | | | 3.66 | | | | | | 23 | | | | | | 1.93 | | | | | | 3.35 | | | | | | (0.05 | ) | | | | | 472 | |
| | | 9.03 | | | | | | (8.00 | ) | | | | | 2,562 | | | | | | 0.19 | | | | | | 3.06 | | | | | | 0.36 | | | | | | 487 | |
| | | 9.04 | | | | | | (7.97 | ) | | | | | 347 | | | | | | 0.88 | | | | | | 4.10 | | | | | | 0.60 | | | | | | 487 | |
| | | 9.05 | | | | | | (7.89 | ) | | | | | 72,251 | | | | | | 0.97 | | | | | | 2.65 | | | | | | 0.25 | | | | | | 487 | |
| | | 9.03 | | | | | | (7.85 | ) | | | | | 3,923 | | | | | | 0.72 | | | | | | 2.80 | | | | | | 0.20 | | | | | | 487 | |
| | | 9.04 | | | | | | (7.93 | ) | | | | | 23 | | | | | | 1.01 | | | | | | 3.25 | | | | | | 0.11 | | | | | | 487 | |
| | | | | | | | | | | | | | | | | | | | | | | | | | | | | | | | | | | | | | | | |
| | | | | | | | | | | | | | | | | | | | | | | | | | | | | | | | | | | | | | | | |
| | | 9.82 | | | | | | (1.60 | ) | | | | | 19 | | | | | | 1.79 | (d) | | | | | 3.34 | (d) | | | | | (0.29 | )(d) | | | | | 90 | |
| | | 9.82 | | | | | | (1.69 | ) | | | | | 10 | | | | | | 2.19 | (d) | | | | | 4.16 | (d) | | | | | (0.67 | )(d) | | | | | 90 | |
| | | 9.84 | | | | | | (1.32 | ) | | | | | 99,736 | | | | | | 1.45 | (d) | | | | | 2.72 | (d) | | | | | 0.11 | (d) | | | | | 90 | |
| | | 9.81 | | | | | | (1.64 | ) | | | | | 56 | | | | | | 1.55 | (d) | | | | | 2.90 | (d) | | | | | (0.01 | )(d) | | | | | 90 | |
| | | 9.82 | | | | | | (1.65 | ) | | | | | 25 | | | | | | 2.01 | (d) | | | | | 3.66 | (d) | | | | | (0.47 | )(d) | | | | | 90 | |
| | |
| The accompanying notes are an integral part of these financial statements. | | 43 |
GOLDMAN SACHS FIXED INCOME ALTERNATIVES FUNDS
Notes to Financial Statements
September 30, 2017 (Unaudited)
Goldman Sachs Trust (the “Trust”) is a Delaware statutory trust registered under the Investment Company Act of 1940, as amended (the “Act”), as an open-end management investment company. The Trust includes the Goldman Sachs Long Short Credit Strategies Fund and the Goldman Sachs Strategic Macro Fund (formerly, the Goldman Sachs Fixed Income Macro Strategies Fund) (the “Funds”). Effective June 20, 2017, the Goldman Sachs Fixed Income Macro Strategies Fund was renamed the Goldman Sachs Strategic Macro Fund. The Funds are non-diversified portfolios and currently offer five classes of shares: Class A, Class C, Institutional, Investor and Class R Shares. Class A Shares are sold with a front-end sales charge of up to 3.75%. Class C Shares are sold with a contingent deferred sales charge (“CDSC”) of 1.00% which is imposed on redemptions made within 12 months of purchase.
Goldman Sachs Asset Management, L.P. (“GSAM”), an affiliate of Goldman Sachs & Co. LLC (formerly, Goldman, Sachs & Co.) (“Goldman Sachs”), serves as investment adviser to the Funds pursuant to a management agreement (the “Agreement”) with the Trust.
|
| 2. SIGNIFICANT ACCOUNTING POLICIES |
The financial statements have been prepared in accordance with accounting principles generally accepted in the United States of America (“GAAP”) and require management to make estimates and assumptions that may affect the reported amounts and disclosures. Actual results may differ from those estimates and assumptions.
A. Basis of Consolidation for Strategic Macro Fund — The Cayman Commodity — FIMS, Ltd. (the “Subsidiary”), a Cayman Islands exempted company, was incorporated on December 16, 2013 and is currently a wholly-owned subsidiary of the Strategic Macro Fund (the “Fund”). The Subsidiary acts as an investment vehicle for the Fund to enable the Fund to gain exposure to certain types of commodity-linked derivative instruments. The Fund is the sole shareholder of the Subsidiary pursuant to a subscription agreement dated as of December 16, 2013, and it is intended that the Fund will remain the sole shareholder and will continue to control the Subsidiary. Under the Memorandum and Articles of Association of the Subsidiary, shares issued by the Subsidiary confer upon a shareholder the right to vote at general meetings of the Subsidiary and certain rights in connection with any winding-up or repayment of capital, as well as the right to participate in the profits or assets of the Subsidiary. All inter-fund balances and transactions have been eliminated in consolidation. As of September 30, 2017, the Fund’s net assets were $25,255,062, of which, $952,083, or 3.7%, represented the Subsidiary’s net assets.
B. Investment Valuation — The Funds’ valuation policy is to value investments at fair value.
C. Investment Income and Investments — Investment income includes interest income, dividend income less any amounts reclaimable, and securities lending income. Interest income is accrued daily and adjusted for amortization of premiums and accretion of discounts. Dividend income is recognized on ex-dividend date or, for certain foreign securities, as soon as such information is obtained subsequent to the ex-dividend date. Investment transactions are reflected on trade date. Realized gains and losses are calculated using identified cost. Investment transactions are recorded on the following business day for daily net asset value (“NAV”) calculations. Investment income is recorded net of any foreign withholding taxes, less any amounts reclaimable. The Funds may file withholding tax reclaims in certain jurisdictions to recover a portion of amounts previously withheld. Any foreign capital gains tax is accrued daily based upon the net unrealized gains, and is payable upon sale of such investments.
For derivative contracts, realized gains and losses are recorded upon settlement of the contract. Upfront payments, if any, are made or received upon entering into a swap agreement and are reflected in the Statements of Assets and Liabilities. Upfront payments are recognized over the contract’s term/event as realized gains or losses, with the exception of forward starting interest rate swaps whose realized gains or losses are recognized from the effective start date.
For securities with paydown provisions, principal payments received are treated as a proportionate reduction to the cost basis of the securities, and excess or shortfall amounts are recorded as income. For treasury inflation protected securities (“TIPS”), adjustments to principal due to inflation/deflation are reflected as increases/decreases to interest income with a corresponding adjustment to cost.
44
GOLDMAN SACHS FIXED INCOME ALTERNATIVES FUNDS
|
| 2. SIGNIFICANT ACCOUNTING POLICIES (continued) |
D. Class Allocations and Expenses — Investment income, realized and unrealized gain (loss), and non-class specific expenses of each Fund are allocated daily based upon the proportion of net assets of each class. Non-class specific expenses directly incurred by a Fund are charged to that Fund, while such expenses incurred by the Trust are allocated across the applicable Funds on a straight-line and/or pro-rata basis depending upon the nature of the expenses. Class specific expenses, where applicable, are borne by the respective share classes and include Distribution and Service, Transfer Agency and Service and Shareholder Administration fees.
E. Federal Taxes and Distributions to Shareholders — It is each Fund’s policy to comply with the requirements of the Internal Revenue Code of 1986, as amended (the “Code”), applicable to regulated investment companies (mutual funds) and to distribute each year substantially all of its investment company taxable income and capital gains to its shareholders. Accordingly, the Funds are not required to make any provisions for the payment of federal income tax. Distributions to shareholders are recorded on the ex-dividend date. Income and capital gains distributions, if any, are declared and paid according to the following schedule:
| | | | | | |
| Fund | | | | Income Distributions
Declared/Paid | | Capital Gains Distributions
Declared/Paid |
Long Short Credit Strategies | | | | Daily/Monthly | | Annually |
Strategic Macro | | | | Annually | | Annually |
The Subsidiary is classified as a controlled foreign corporation under the Code. Therefore, the Strategic Macro Fund is required to increase its taxable income by its share of the Subsidiary’s income. Net losses of the Subsidiary cannot be deducted by the Fund in the current period nor carried forward to offset taxable income in future periods.
Net capital losses, if any, are carried forward to future fiscal years and may be used to the extent allowed by the Code to offset any future capital gains. Losses that are carried forward will retain their character as either short-term or long-term capital losses. Utilization of capital loss carryforwards will reduce the requirement of future capital gains distributions.
The characterization of distributions to shareholders for financial reporting purposes is determined in accordance with federal income tax rules, which may differ from GAAP. The source of each Fund’s distributions may be shown in the accompanying financial statements as either from net investment income, net realized gain or capital. Certain components of the Funds’ net assets on the Statements of Assets and Liabilities reflect permanent GAAP/tax differences based on the appropriate tax character.
F. Foreign Currency Translation — The accounting records and reporting currency of the Funds are maintained in U.S. dollars. Assets and liabilities denominated in foreign currencies are translated into U.S. dollars using the current exchange rates at the close of each business day. The effect of changes in foreign currency exchange rates on investments is included within net realized and unrealized gain (loss) on investments. Changes in the value of other assets and liabilities as a result of fluctuations in foreign exchange rates are included in the Statements of Operations within net change in unrealized gain (loss) on foreign currency translations. Transactions denominated in foreign currencies are translated into U.S. dollars on the date the transaction occurred, the effects of which are included within net realized gain (loss) on foreign currency transactions.
|
| 3. INVESTMENTS AND FAIR VALUE MEASUREMENTS |
U.S. GAAP defines the fair value of a financial instrument as the amount that would be received to sell an asset or paid to transfer a liability in an orderly transaction between market participants at the measurement date (i.e., the exit price); the Funds’ policy is to use the market approach. GAAP establishes a fair value hierarchy that prioritizes the inputs to valuation techniques used to measure fair value. The hierarchy gives the highest priority to unadjusted quoted prices in active markets for identical assets or liabilities (Level 1 measurements) and the lowest priority to unobservable inputs (Level 3 measurements). The levels used for
45
GOLDMAN SACHS FIXED INCOME ALTERNATIVES FUNDS
Notes to Financial Statements (continued)
September 30, 2017 (Unaudited)
|
| 3. INVESTMENTS AND FAIR VALUE MEASUREMENTS (continued) |
classifying investments are not necessarily an indication of the risk associated with investing in these investments. The three levels of the fair value hierarchy are described below:
Level 1 — Unadjusted quoted prices in active markets that are accessible at the measurement date for identical, unrestricted assets or liabilities;
Level 2 — Quoted prices in markets that are not active or financial instruments for which significant inputs are observable (including, but not limited to, quoted prices for similar investments, interest rates, foreign exchange rates, volatility and credit spreads), either directly or indirectly;
Level 3 — Prices or valuations that require significant unobservable inputs (including GSAM’s assumptions in determining fair value measurement).
Changes in valuation techniques may result in transfers into or out of an assigned level within the hierarchy. In accordance with the Funds’ policy, transfers between different levels of the fair value hierarchy resulting from such changes are deemed to have occurred as of the beginning of the reporting period.
The Board of Trustees (“Trustees”) has approved Valuation Procedures that govern the valuation of the portfolio investments held by the Funds, including investments for which market quotations are not readily available. The Trustees have delegated to GSAM day-to-day responsibility for implementing and maintaining internal controls and procedures related to the valuation of the Funds’ investments. To assess the continuing appropriateness of pricing sources and methodologies, GSAM regularly performs price verification procedures and issues challenges as necessary to third party pricing vendors or brokers, and any differences are reviewed in accordance with the Valuation Procedures.
A. Level 1 and Level 2 Fair Value Investments — The valuation techniques and significant inputs used in determining the fair values for investments classified as Level 1 and Level 2 are as follows:
Debt Securities — Debt securities for which market quotations are readily available are valued daily on the basis of quotations supplied by dealers or an independent pricing service approved by the Trustees. The pricing services may use valuation models or matrix pricing, which consider: (i) yield or price with respect to bonds that are considered comparable in characteristics such as rating, interest rate and maturity date or (ii) quotations from securities dealers to determine current value. With the exception of treasury securities of G8 countries, which are generally classified as Level 1, these investments are generally classified as Level 2 of the fair value hierarchy.
i. Bank Loans — Bank loans (“Loans”) are interests in amounts owed by corporate, governmental, or other borrowers to lenders or lending syndicates. Loans are arranged through private negotiations between the borrower and one or more financial institutions (“Lenders”). A Fund’s investments in Loans are in the form of either participations in Loans (“Participations”) or assignments of all or a portion of Loans from third parties (“Assignments”). With respect to Participations, a Fund has the right to receive payments of principal, interest and any fees to which it is entitled from the Lender selling the Participations and only upon receipt by the Lender of the payments from the borrower. A Fund generally has no right to enforce compliance by the borrower with the terms of the loan agreement with respect to Participations. Conversely, assignments result in a Fund having a direct contractual relationship with the borrower, and the Fund may be permitted to enforce compliance by the borrower with the terms of the loan agreement.
ii. Inverse Floaters — The interest rate on inverse floating rate securities (“inverse floaters”) resets in the opposite direction from the market rate of interest to which the inverse floaters are indexed. An inverse floater may be considered to be leveraged to the extent that its interest rate varies by a magnitude that exceeds the magnitude of the change in the index rate of interest. The higher the degree of leverage of an inverse floater, the greater the volatility of its market value
iii. Mortgage-Backed and Asset-Backed Securities — Mortgage-backed securities represent direct or indirect participations in, or are collateralized by and payable from, mortgage loans secured by residential and/or commercial real estate property. Asset-backed securities include securities whose principal and interest payments are collateralized by pools of other assets or receivables. The value of certain mortgage-backed and asset-backed securities (including adjustable rate
46
GOLDMAN SACHS FIXED INCOME ALTERNATIVES FUNDS
|
| 3. INVESTMENTS AND FAIR VALUE MEASUREMENTS (continued) |
mortgage loans) may be particularly sensitive to changes in prevailing interest rates. The value of these securities may also fluctuate in response to the market’s perception of the creditworthiness of the issuers.
Asset-backed securities may present credit risks that are not presented by mortgage-backed securities because they generally do not have the benefit of a security interest in collateral that is comparable to mortgage assets. Some asset-backed securities may only have a subordinated claim on collateral.
Stripped mortgage-backed securities are usually structured with two different classes: one that receives substantially all interest payments (interest-only, or “IO” and/or high coupon rate with relatively low principal amount, or “IOette”), and the other that receives substantially all principal payments (principal-only, or “PO”) from a pool of mortgage loans. Little to no principal will be received at the maturity of an IO; as a result, periodic adjustments are recorded to reduce the cost of the security until maturity. These adjustments are included in interest income.
iv. Treasury Inflation Protected Securities — TIPS are treasury securities in which the principal amount is adjusted daily to keep pace with inflation, as measured by the U.S. Consumer Pricing Index for Urban Consumers. The repayment of the original bond principal upon maturity is guaranteed by the full faith and credit of the U.S. Government.
v. When-Issued Securities and Forward Commitments — When-issued securities, including TBA (“To Be Announced”) securities, are securities that are authorized but not yet issued in the market and purchased in order to secure what is considered to be an advantageous price or yield to a Fund. A forward commitment involves entering into a contract to purchase or sell securities, typically on an extended settlement basis, for a fixed price at a future date. The purchase of securities on a when-issued or forward commitment basis involves a risk of loss if the value of the security to be purchased declines before the settlement date. Conversely, the sale of securities on a forward commitment basis involves the risk that the value of the securities sold may increase before the settlement date. Although a Fund will generally purchase securities on a when-issued or forward commitment basis with the intention of acquiring the securities for its portfolio, the Fund may dispose of when-issued securities or forward commitments prior to settlement, which may result in a realized gain or loss.
Equity Securities — Equity securities traded on a United States (“U.S.”) securities exchange or the NASDAQ system, or those located on certain foreign exchanges, including but not limited to the Americas, are valued daily at their last sale price or official closing price on the principal exchange or system on which they are traded. If there is no sale or official closing price or such price is believed by GSAM to not represent fair value, equity securities are valued at the last bid price for long positions and at the last ask price for short positions. To the extent these investments are actively traded, they are classified as Level 1 of the fair value hierarchy, otherwise they are generally classified as Level 2.
Unlisted equity securities for which market quotations are available are valued at the last sale price on the valuation date, or if no sale occurs, at the last bid price. Securities traded on certain foreign securities exchanges are valued daily at fair value determined by an independent fair value service (if available) under Valuation Procedures approved by the Trustees and consistent with applicable regulatory guidance. The independent fair value service takes into account multiple factors including, but not limited to, movements in the securities markets, certain depositary receipts, futures contracts and foreign currency exchange rates that have occurred subsequent to the close of the foreign securities exchange. These investments are generally classified as Level 2 of the fair value hierarchy.
Private Investments — Private investments may include, but are not limited to, investments in private equity or debt instruments. The investment manager estimates the fair value of private investments based upon various factors, including, but not limited to, transactions in similar instruments, completed or pending third-party transactions in underlying investments or comparable entities, subsequent rounds of financing, recapitalizations, and other transactions across the capital structure, offerings in equity or debt capital markets, and changes in current and projected financial ratios or cash flows.
Money Market Funds — Investments in the Goldman Sachs Financial Square Government Fund (“Underlying Fund”) are valued at the NAV of the Institutional Share class on the day of valuation. These investments are generally classified as Level 1 of the fair value hierarchy. For information regarding an Underlying Fund’s accounting policies and investment holdings, please see the Underlying Fund’s shareholder report.
47
GOLDMAN SACHS FIXED INCOME ALTERNATIVES FUNDS
Notes to Financial Statements (continued)
September 30, 2017 (Unaudited)
|
| 3. INVESTMENTS AND FAIR VALUE MEASUREMENTS (continued) |
Derivative Contracts — A derivative is an instrument whose value is derived from underlying assets, indices, reference rates or a combination of these factors. A Fund enters into derivative transactions to hedge against changes in interest rates, securities prices, and/or currency exchange rates, to increase total return, or to gain access to certain markets or attain exposure to other underliers.
Exchange-traded derivatives, including futures and options contracts, are valued at the last sale or settlement price and typically fall within Level 1 of the fair value hierarchy. Over-the-counter (“OTC”) and centrally cleared derivatives are valued using market transactions and other market evidence, including market-based inputs to models, calibration to market-clearing transactions, broker or dealer quotations, or other alternative pricing sources. Where models are used, the selection of a particular model to value OTC and centrally cleared derivatives depends upon the contractual terms of, and specific risks inherent in, the instrument, as well as the availability of pricing information in the market. Valuation models require a variety of inputs, including contractual terms, market prices, yield curves, credit curves, measures of volatility, voluntary and involuntary prepayment rates, loss severity rates and correlations of such inputs. For OTC and centrally cleared derivatives that trade in liquid markets, model inputs can generally be verified and model selection does not involve significant management judgment. OTC and centrally cleared derivatives are classified within Level 2 of the fair value hierarchy when significant inputs are corroborated by market evidence.
i. Forward Contracts — A forward contract is a contract between two parties to buy or sell an asset at a specified price on a future date. A forward contract settlement can occur on a cash or delivery basis. Forward contracts are marked-to-market daily using independent vendor prices, and the change in value, if any, is recorded as an unrealized gain or loss. Cash and certain investments may be used to collateralize forward contracts.
A forward foreign currency contract is a forward contract in which a Fund agrees to receive or deliver a fixed quantity of one currency for another, at a pre-determined price at a future date. All forward foreign currency exchange contracts are marked-to-market daily at the applicable forward rate. Non-deliverable forward foreign currency exchange contracts are settled with the counterparty in cash without the delivery of foreign currency.
A non-deliverable bond forward is a short term forward contract between two parties to buy or sell a bond denominated in a non-deliverable foreign currency at a specified future time and price. Non-deliverable bond forwards are marked-to-market daily using market quotations. Unrealized gains or losses on non-deliverable bond forwards are recorded by a Fund on a daily basis, and realized gains or losses are recorded on the termination date or sale of a contract.
ii. Futures Contracts — Futures contracts are contracts to buy or sell a standardized quantity of a specified commodity or security and are valued based on exchanged settlement prices or independent market quotes. Futures contracts are valued at the last settlement price, or in the absence of a sale, the last bid price for long positions and at the last ask price for short positions, at the end of each day on the board of trade or exchange upon which they are traded. Upon entering into a futures contract, a Fund deposits cash or securities in an account on behalf of the broker in an amount sufficient to meet the initial margin requirement. Subsequent payments are made or received by a Fund equal to the daily change in the contract value and are recorded as variation margin receivable or payable with a corresponding offset to unrealized gains or losses. For financial reporting purposes, cash collateral that has been pledged to cover obligations of a Fund and cash collateral received, if any, is reported separately on the Statement of Assets and Liabilities as receivables/payables for collateral on certain derivative contracts. Non-cash collateral pledged by a Fund, if any, is noted in the Schedules of Investments.
iii. Options — When a Fund writes call or put options, an amount equal to the premium received is recorded as a liability and is subsequently marked-to-market to reflect the current value of the option written. Swaptions are options on interest rate swap contracts.
Upon the purchase of a call option or a put option by a Fund, the premium paid is recorded as an investment and subsequently marked-to-market to reflect the current value of the option. Certain options may be purchased with premiums to be determined on a future date. The premiums for these options are based upon implied volatility parameters at specified terms.
iv. Swap Contracts — Bilateral swap contracts are agreements in which a Fund and a counterparty agree to exchange periodic payments on a specified notional amount or make a net payment upon termination. Bilateral swap transactions are privately negotiated in the OTC market and payments are settled through direct payments between a Fund and the counterparty. By contrast, certain swap transactions are subject to mandatory central clearing. These swaps are executed through a derivatives clearing
48
GOLDMAN SACHS FIXED INCOME ALTERNATIVES FUNDS
|
| 3. INVESTMENTS AND FAIR VALUE MEASUREMENTS (continued) |
member (“DCM”), acting in an agency capacity, and submitted to a central counterparty (“CCP”) (“centrally cleared swaps”), in which case all payments are settled with the CCP through the DCM. Swaps are marked-to-market daily using pricing vendor quotations, counterparty or clearinghouse prices or model prices, and the change in value, if any, is recorded as an unrealized gain or loss. Upon entering into a swap contract, a Fund is required to satisfy an initial margin requirement by delivering cash or securities to the counterparty (or in some cases, segregated in a triparty account on behalf of the counterparty), which can be adjusted by any mark-to-market gains or losses pursuant to bilateral or centrally cleared arrangements. For centrally cleared swaps the daily change in valuation, if any, is recorded as a receivable or payable for variation margin.
An interest rate swap is an agreement that obligates two parties to exchange a series of cash flows at specified intervals, based upon or calculated by reference to changes in interest rates on a specified notional principal amount. The payment flows are usually netted against each other, with the difference being paid by one party to the other.
A credit default swap is an agreement that involves one party (the buyer of protection) making a stream of payments to another party (the seller of protection) in exchange for the right to receive protection on a reference security or obligation, including a group of assets or exposure to the performance of an index. A Fund’s investment in credit default swaps may involve greater risks than if the Fund had invested in the referenced obligation directly. Credit events are contract specific but may include bankruptcy, failure to pay, restructuring and obligation acceleration. If a Fund buys protection through a credit default swap and no credit event occurs, its payments are limited to the periodic payments previously made to the counterparty. Upon the occurrence of a specified credit event, a Fund, as a buyer of credit protection, is entitled to receive an amount equal to the notional amount of the swap and deliver to the seller the defaulted reference obligation in a physically settled trade. A Fund may also receive a net settlement amount in the form of cash or securities equal to the notional amount of the swap reduced by the recovery value of the reference obligation in a cash settled trade.
As a seller of protection, a Fund generally receives a payment stream throughout the term of the swap, provided that there is no credit event. In addition, if a Fund sells protection through a credit default swap, a Fund could suffer a loss because the value of the referenced obligation and the premium payments received may be less than the notional amount of the swap paid to the buyer of protection. Upon the occurrence of a specified credit event, a Fund, as a seller of credit protection, may be required to take possession of the defaulted reference obligation and pay the buyer an amount equal to the notional amount of the swap in a physically settled trade. A Fund may also pay a net settlement amount in the form of cash or securities equal to the notional amount of the swap reduced by the recovery value of the reference obligation in a cash settled trade. Recovery values are at times established through the credit event auction process in which market participants are ensured that a transparent price has been set for the defaulted security or obligation. In addition, a Fund is entitled to a return of any assets, which have been pledged as collateral to the counterparty upon settlement.
The maximum potential amount of future payments (undiscounted) that a Fund as seller of protection could be required to make under a credit default swap would be an amount equal to the notional amount of the agreement. These potential amounts would be partially offset by any recovery values of the respective referenced obligations or net amounts received from a settlement of a credit default swap for the same reference security or obligation where a Fund bought credit protection.
A total return swap is an agreement that gives a Fund the right to receive the appreciation in the value of a specified security, index or other instrument in return for a fee paid to the counterparty, which will typically be an agreed upon interest rate. If the underlying asset declines in value over the term of the swap, a Fund may also be required to pay the dollar value of that decline to the counterparty.
A cross currency swap is an agreement which a Fund may enter into to gain or mitigate exposure to currency risk. A cross currency swap is an agreement to exchange cash flows on a notional amount of two or more currencies based on the relative value differential among them. Such swaps may involve initial and final exchanges that correspond to the agreed upon notional amount. Cross currency swaps usually involve the delivery of the entire principal value of one designated currency in exchange for another designated currency. Therefore, the entire principal value of a cross currency swap is subject to risk that the other party to the swap will default on its contractual delivery obligations. If there is a default by the counterparty, the Fund may have contractual remedies pursuant to the agreements related to the transactions.
Reverse Repurchase Agreements — Reverse repurchase agreements involve the sale of securities held by a Fund subject to the Fund’s agreement to repurchase the securities at a mutually agreed upon date and price (including interest), under the terms of an
49
GOLDMAN SACHS FIXED INCOME ALTERNATIVES FUNDS
Notes to Financial Statements (continued)
September 30, 2017 (Unaudited)
|
| 3. INVESTMENTS AND FAIR VALUE MEASUREMENTS (continued) |
MRA. The gross value of reverse repurchase agreements is included in the Statement of Assets and Liabilities for financial reporting purposes.
When a Fund enters into a reverse repurchase agreement, it is required to deliver securities as collateral to the counterparty that exceed the value of the reverse repurchase agreement. During the term of a reverse repurchase agreement, the value of the underlying securities pledged as collateral on behalf of a Fund, including accrued interest, is required to exceed the value of the reverse repurchase agreement, including accrued interest. If the value of those securities pledged as collateral, including accrued interest, becomes less than the value of the reverse repurchase agreement, including accrued interest, a Fund will be obligated to deliver additional collateral to the buyer. If the buyer defaults on its commitment to sell back the securities, a Fund could suffer a loss to the extent that the amount borrowed is less than the replacement cost of similar securities and the Fund’s costs associated with delay and enforcement of the reverse repurchase agreement. In addition, in the event of default or insolvency of the buyer, a court could determine that the Fund’s interest in the amount borrowed is not enforceable, resulting in additional losses to a Fund.
B. Level 3 Fair Value Investments — To the extent that significant inputs to valuation models and other alternative pricing sources are unobservable, or if quotations are not readily available, or if GSAM believes that such quotations do not accurately reflect fair value, the fair value of the Funds’ investments may be determined under Valuation Procedures approved by the Trustees. GSAM, consistent with its procedures and applicable regulatory guidance, may make an adjustment to the most recent valuation prices of either domestic or foreign securities in light of significant events to reflect what it believes to be the fair value of the securities at the time of determining a Fund’s NAV. Significant events which could affect a large number of securities in a particular market may include, but are not limited to: significant fluctuations in U.S. or foreign markets; market dislocations; market disruptions; or unscheduled market closings. Significant events which could also affect a single issuer may include, but are not limited to: corporate actions such as reorganizations, mergers and buy-outs; ratings downgrades; and bankruptcies. To the extent investments are valued using single source broker quotations obtained directly from the broker or passed through from third party pricing vendors, such investments are classified as Level 3 investments.
GSAM did not develop the unobservable inputs (examples include but are not limited to single source broker quotations, third party pricing, etc.) for the valuation of Level 3 Assets and Liabilities.
C. Fair Value Hierarchy — The following is a summary of the Funds’ investments and derivatives classified in the fair value hierarchy as of September 30, 2017:
| | | | | | | | | | | | |
| | | |
| LONG SHORT CREDIT STRATEGIES | | | | | | | | | | | | |
| | | |
| Investment Type | | Level 1 | | | Level 2 | | | Level 3 | |
| Assets | | | | | | | | | | | | |
Fixed Income | | | | | | | | | | | | |
Bank Loans | | $ | — | | | $ | 48,549,447 | | | $ | 692,070 | |
Other Secured Debt Obligations | | | — | | | | 31,003,910 | | | | — | |
Unsecured Debt Obligations | | | | | | | 95,335,897 | | | | | |
U.S. Treasury Obligations | | | 4,995,800 | | | | — | | | | — | |
Common Stock and/or Other Equity Investments(a) | | | | | | | | | | | | |
North America | | | — | | | | 360,860 | | | | — | |
Warrants | | | — | | | | — | | | | 8,670 | |
Investment Company | | | 20,359,346 | | | | — | | | | — | |
| Total | | $ | 25,355,146 | | | $ | 175,250,114 | | | $ | 700,740 | |
| | | |
| Derivative Type | | | | | | | | | |
| Assets | | | | | | | | | | | | |
Interest Rate Swap Contracts(b) | | $ | — | | | $ | 126,408 | | | $ | — | |
| Liabilities | | | | | | | | | | | | |
Credit Default Swap Contracts(b) | | $ | — | | | $ | (748,113 | ) | | $ | — | |
50
GOLDMAN SACHS FIXED INCOME ALTERNATIVES FUNDS
|
| 3. INVESTMENTS AND FAIR VALUE MEASUREMENTS (continued) |
| | | | | | | | | | | | |
| | | |
| STRATEGIC MACRO | | | | | | | | | |
| | | |
| Investment Type | | Level 1 | | | Level 2 | | | Level 3 | |
| Assets | | | | | | | | | | | | |
Fixed Income | | | | | | | | | | | | |
Foreign Sovereign Debt Obligations | | $ | 4,736,005 | | | $ | 4,458,799 | | | $ | — | |
Mortgage-Backed Obligations | | | — | | | | 2,210,226 | | | | — | |
U.S. Treasury Obligations | | | 6,802,487 | | | | — | | | | — | |
Investment Company | | | 5,183,338 | | | | — | | | | — | |
| Total | | $ | 16,721,830 | | | $ | 6,669,025 | | | $ | — | |
| Liabilities | | | | | | | | | | | | |
Reverse Repurchase Agreements | | $ | — | | | $ | (13,830,000 | ) | | $ | — | |
| | | |
| Derivative Type | | | | | | | | | |
| Assets | | | | | | | | | | | | |
Forward Foreign Currency Exchange Contracts(b) | | $ | — | | | $ | 624,529 | | | $ | — | |
Futures Contracts(b) | | | 363,554 | | | | — | | | | — | |
Interest Rate Swap Contracts(b) | | | — | | | | 2,138,696 | | | | — | |
Cross Currency Swap Contracts(b) | | | — | | | | 25,238 | | | | — | |
Total Return Swap Contracts(b) | | | — | | | | 36,103 | | | | — | |
Options Purchased | | | 22,037 | | | | 90,564 | | | | — | |
| Total | | $ | 385,591 | | | $ | 2,915,130 | | | $ | — | |
| Liabilities | | | | | | | | | | | | |
Forward Foreign Currency Exchange Contracts(b) | | $ | — | | | $ | (731,361 | ) | | $ | — | |
Futures Contracts(b) | | | (339,330 | ) | | | — | | | | — | |
Interest Rate Swap Contracts(b) | | | — | | | | (896,904 | ) | | | — | |
Credit Default Swap Contracts(b) | | | — | | | | (18,730 | ) | | | — | |
Cross Currency Swap Contracts(b) | | | — | | | | (32,152 | ) | | | — | |
Non-Deliverable Bond Forward Contract(b) | | | — | | | | (465 | ) | | | — | |
Written Options | | | (3,625 | ) | | | — | | | | — | |
| Total | | $ | (342,955 | ) | | $ | (1,679,612 | ) | | $ | — | |
| (a) | | Amounts are disclosed by continent to highlight the impact of time zone differences between local market close and the calculation of net asset value. Security valuations are based on the principle exchange or system on which they are traded, which may differ from country of domicile. The Funds utilize fair value model prices provided by an independent fair value service for international equities, resulting in a Level 2 classification. |
| (b) | | Amount shown represents unrealized gain (loss) at period end. |
For further information regarding security characteristics, see the Schedules of Investments.
|
| 4. INVESTMENTS IN DERIVATIVES |
The following tables set forth, by certain risk types, the gross value of derivative contracts as of September 30, 2017. These instruments were used as part of the Funds’ investment strategies and to obtain and/or manage exposure related to the risks below.
51
GOLDMAN SACHS FIXED INCOME ALTERNATIVES FUNDS
Notes to Financial Statements (continued)
September 30, 2017 (Unaudited)
|
| 4. INVESTMENTS IN DERIVATIVES (continued) |
The values in the tables below exclude the effects of cash collateral received or posted pursuant to these derivative contracts, and therefore are not representative of the Funds’ net exposure.
| | | | | | | | | | | | |
|
| Long Short Credit Strategies | |
| Risk | | Statements of Assets
and Liabilities | | Assets | | | Statements of Assets
and Liabilities | | Liabilities | |
Interest rate | | Variation Margin on swap contracts | | $ | 126,408 | (a) | | — | | $ | — | |
Credit | | — | | | — | | | Variation Margin on swap contracts | | | (748,113) | (a) |
| Total | | | | $ | 126,408 | | | | | $ | (748,113) | |
| | | | | | | | | | | | |
|
| Strategic Macro | |
| Risk | | Consolidated Statements of Assets
and Liabilities | | Assets | | | Consolidated Statements of Assets
and Liabilities | | Liabilities | |
Interest rate | | Receivable for unrealized gain on swap contracts; Variation margin on certain derivative contracts; Purchased options, at value | | $ | 2,620,706 | (a) | | Payable for unrealized loss on swap contracts; Payable for unrealized gain on non-deliverable bond forward contracts; Variation margin on certain derivative contracts; Written options, at value | | $ | (1,166,231) | (a)(b) |
Credit | | — | | | — | | | Payable for unrealized loss on swap contracts | | | (18,730) | (a) |
Currency | | Receivable for unrealized gain on swap contracts; Receivable for unrealized gain on forward foreign currency exchange contracts | | | 649,767 | | | Payable for unrealized loss on swap contracts; Payable for unrealized loss on forward foreign currency exchange contracts | | | (763,513) | (b) |
Commodity | | Receivable for unrealized gain on swap contracts | | | 30,248 | (a) | | Payable for unrealized loss on swap contracts | | | (35,533) | (a) |
Equity | | — | | | — | | | Variation margin on certain derivative contracts | | | (38,560) | (a) |
| Total | | | | $ | 3,300,721 | | | | | $ | (2,022,567) | |
| (a) | | Includes unrealized gain (loss) on futures contracts and centrally cleared swaps described in the Additional Investment Information sections of the Schedules of Investments. Only current day’s variation margin is reported within the Statements of Assets and Liabilities. |
| (b) | | Aggregate of amounts include $572,867 for Strategic Macro Fund, which represent the payments to be made pursuant to bilateral agreements should counterparties exercise their “right to terminate” provisions based on, among others, the Fund’s performance, its failure to pay on its obligations or failure to pledge collateral. Such amounts do not include incremental charges directly associated with the close-out of the agreements. They also do not reflect the fair value of any assets pledged as collateral which, through the daily margining process, substantially offsets the aforementioned amounts and for which the Fund is entitled to a full return. |
52
GOLDMAN SACHS FIXED INCOME ALTERNATIVES FUNDS
|
| 4. INVESTMENTS IN DERIVATIVES (continued) |
The following tables set forth, by certain risk types, the Funds’ gains (losses) related to these derivatives and their indicative volumes for the six months ended September 30, 2017. These gains (losses) should be considered in the context that these derivative contracts may have been executed to create investment opportunities and/or economically hedge certain investments, and accordingly, certain gains (losses) on such derivative contracts may offset certain (losses) gains attributable to investments. These gains (losses) are included in “Net realized gain (loss)” or “Net change in unrealized gain (loss)” on the Statements of Operations:
| | | | | | | | | | | | | | |
|
| Long Short Credit Strategies | |
| Risk | | Statements of Operations | | Net Realized
Gain (Loss) | | | Net Change in
Unrealized
Gain (Loss) | | | Average
Number of
Contracts(a) | |
| Interest rate | | Net realized gain (loss) from swap contracts /Net change in unrealized gain (loss) on swap contracts | | $ | (575,723 | ) | | $ | 190,708 | | | | 1 | |
| Credit | | Net realized gain (loss) from swap contracts/Net change in unrealized gain (loss) on swap contracts | | | (1,774,255 | ) | | | (419,352 | ) | | | 1 | |
| Total | | | | $ | (2,349,978 | ) | | $ | (228,644 | ) | | | 2 | |
| | | | | | | | | | | | | | |
|
| Strategic Macro | |
| Risk | | Statements of Operations | | Net Realized
Gain (Loss) | | | Net Change in
Unrealized
Gain (Loss) | | | Average
Number of
Contracts(a) | |
| Interest rate | | Net realized gain (loss) from purchased options, futures contracts, swap contracts, non-deliverable bond forward contracts and written options/Net change in unrealized gain (loss) on investments, futures contracts, swap contracts, non-deliverable bond forward contracts and written options | | $ | (438,108 | ) | | $ | 174,665 | | | | 1,611 | |
| Credit | | Net realized gain (loss) from swap contracts/Net change in unrealized gain (loss) on swap contracts | | | (809 | ) | | | (18,730 | ) | | | 1 | |
| Commodity | | Net realized gain (loss) from futures contracts/Net change in unrealized gain (loss) on futures contracts | | | (410,177 | ) | | | (142,245 | ) | | | 141 | |
| Currency | | Net realized gain (loss) from purchased options, futures contracts, swap contracts, forward foreign currency exchange contracts and written options/Net change in unrealized gain (loss) on investments, swap contracts, forward foreign currency exchange contracts and written options | | | (963,312 | ) | | | 1,120,980 | | | | 940 | |
| Equity | | Net realized gain (loss) from futures contracts/Net change in unrealized gain (loss) on investment and futures contracts | | | (337,597 | ) | | | (54,480 | ) | | | 45 | |
| Total | | | | $ | (2,150,003 | ) | | $ | 1,080,190 | | | | 2,738 | |
| (a) | | Average number of contracts is based on the average of month end balances for the six months ended September 30, 2017. |
In order to better define its contractual rights and to secure rights that will help a Fund mitigate its counterparty risk, a Fund may enter into an International Swaps and Derivatives Association, Inc. Master Agreement (“ISDA Master Agreement”) or similar agreement with its derivatives counterparties. An ISDA Master Agreement is a bilateral agreement between a Fund and a counterparty that governs OTC derivatives (including forward foreign currency exchange contracts, and certain options and swaps), and typically contains, among other things, collateral posting terms and netting provisions in the event of a default and/or
53
GOLDMAN SACHS FIXED INCOME ALTERNATIVES FUNDS
Notes to Financial Statements (continued)
September 30, 2017 (Unaudited)
|
| 4. INVESTMENTS IN DERIVATIVES (continued) |
termination event. The provisions of the ISDA Master Agreement typically permit a single net payment in the event of a default (close-out netting) or similar event, including the bankruptcy or insolvency of the counterparty.
Collateral and margin requirements differ between exchange traded derivatives and OTC derivatives. Margin requirements are established by the broker or clearing house for exchange-traded and centrally cleared derivatives (financial futures contracts, options and centrally cleared swaps) pursuant to governing agreements for those instrument types. Brokers can ask for margin in excess of the minimum in certain circumstances. Collateral terms are contract-specific for OTC derivatives. For derivatives traded under an ISDA Master Agreement, the collateral requirements are typically calculated by netting the marked to market amount for each transaction under such agreement and comparing that amount to the value of any collateral currently pledged by a Fund and the counterparty. Additionally, a Fund may be required to post initial margin to the counterparty, the terms of which would be outlined in the confirmation of the OTC transaction.
For financial reporting purposes, cash collateral that has been pledged to cover obligations of a Fund and cash collateral received from the counterparty, if any, is reported separately on the Statements of Assets and Liabilities as receivables/payables for collateral on certain derivative contracts. Non-cash collateral pledged by a Fund, if any, is noted in the Schedules of Investments. Generally, the amount of collateral due from or to a counterparty must exceed a minimum transfer amount threshold before a transfer is required to be made. To the extent amounts due to a Fund from its counterparties are not fully collateralized, contractually or otherwise, the Fund bears the risk of loss from counterparty nonperformance. A Fund attempts to mitigate counterparty risk by only entering into agreements with counterparties that the Investment Adviser believes to be of good standing and by monitoring the financial stability of those counterparties.
Additionally, the netting of assets and liabilities and the offsetting of collateral pledged or received are based on contractual netting/set-off provisions in the ISDA Master Agreement or similar agreements. However, in the event of a default or insolvency of a counterparty, a court could determine that such rights are not enforceable due to the restrictions or prohibitions against the right of setoff that may be imposed in accordance with a particular jurisdiction’s bankruptcy or insolvency laws.
The following tables set forth the Funds’ net exposure for derivative instruments that are subject to enforceable master netting arrangements or similar agreements as of September 30, 2017:
| | | | | | | | | | | | | | | | | | | | | | | | | | | | | | | | | | | | | | | | |
| | | | | | | |
| Strategic Macro Fund | | | | | | | | | | | | | | | | | | | | | | | | | | | | | |
| | | Derivative Assets(1) | | | Derivative Liabilities(1) | | | Net
Derivative
Asset
(Liabilities) | | | Collateral
(Received)
Pledged(1) | | | Net
Amount(2) | |
| Counterparty | | Options
Purchased | | | Swaps | | | Forward
Currency
Contracts | | | Total | | | Swaps | | | Forward
Currency
Contracts | | | Total | | | | |
Bank of America Securities LLC | | $ | — | | | $ | 38,876 | | | $ | — | | | $ | 38,876 | | | $ | — | | | $ | — | | | $ | — | | | $ | 38,876 | | | $ | — | | | $ | 38,876 | |
Citibank NA | | | 61,051 | | | | 79,202 | | | | 624,529 | | | | 764,782 | | | | (7,141 | ) | | | (731,361 | ) | | | (738,502 | ) | | | 26,280 | | | | — | | | | 26,280 | |
Credit Suisse International (London) | | | — | | | | — | | | | — | | | | — | | | | (15,507 | ) | | | — | | | | (15,507 | ) | | | (15,507 | ) | | | — | | | | (15,507 | ) |
Deutsche Bank AG | | | — | | | | 21,665 | | | | — | | | | 21,665 | | | | (38,042 | ) | | | (465 | )* | | | (38,507 | ) | | | (16,842 | ) | | | — | | | | (16,842 | ) |
JPMorgan Securities, Inc. | | | 29,513 | | | | 289,972 | | | | — | | | | 319,485 | | | | (483,541 | ) | | | — | | | | (483,541 | ) | | | (164,056 | ) | | | — | | | | (164,056 | ) |
Morgan Stanley & Co. International PLC | | | — | | | | 19,456 | | | | — | | | | 19,456 | | | | (25,011 | ) | | | — | | | | (25,011 | ) | | | (5,555 | ) | | | 5,555 | | | | — | |
Total | | $ | 90,564 | | | $ | 449,171 | | | $ | 624,529 | | | $ | 1,164,264 | | | $ | (569,242 | ) | | $ | (731,826 | ) | | $ | (1,301,068 | ) | | $ | (136,804 | ) | | $ | 5,555 | | | $ | (131,249 | ) |
| * | | Includes Non-Deliverable Bond Forward Contracts assets of $0 and liabilities of $465. |
| (1) | | Gross amounts available for offset but not netted in the Statement of Assets and Liabilities. |
| (2) | | Net amount represents the net amount due (to) from counterparty in the event of a default based on the contractual set-off rights under the agreement. Net amount excludes any over-collateralized amounts. |
54
GOLDMAN SACHS FIXED INCOME ALTERNATIVES FUNDS
|
| 5. AGREEMENTS AND AFFILIATED TRANSACTIONS |
A. Management Agreement — Under the Agreement, GSAM manages the Funds, subject to the general supervision of the Trustees.
As compensation for the services rendered pursuant to the Agreement, the assumption of the expenses related thereto and administration of the Funds’ business affairs, including providing facilities, GSAM is entitled to a management fee, accrued daily and paid monthly, equal to an annual percentage rate of each Fund’s average daily net assets.
For the six months ended September 30, 2017, contractual and effective net management fees paid to GSAM were at the following rates:
| | | | | | | | | | | | | | | | | | | | | | | | | | | | | | |
| | | | | Contractual Management Rate | | | Effective Net
Management
Rate^ | |
| Fund | | | | First
$1 billion | | | Next
$1 billion | | | Next
$3 billion | | | Next
$3 billion | | | Over
$8 billion | | | Effective
Rate | | |
Long Short Credit Strategies | | | | | 1.00 | % | | | 0.90 | % | | | 0.86 | % | | | 0.84 | % | | | 0.82 | % | | | 1.00 | % | | | 0.98 | % |
Strategic Macro* | | | | | 0.95 | | | | 0.95 | | | | 0.86 | | | | 0.81 | | | | 0.80 | | | | 1.24 | | | | 1.14 | (a) |
| ^ | | Effective Net Management Rate includes the impact of management fee waivers of the Fund or affiliated underlying funds, if any, and any additional voluntary management fee waivers, if applicable. |
| * | | Prior to June 20, 2017, the management fee rate for the Strategic Macro Fund was 1.50% on the first $2 billion of average daily net assets, 1.35% on the next $3 billion of average daily net assets, 1.29% on the next $3 billion of average daily net assets, and 1.26% on amounts over $8 billion of average daily net assets. In addition, prior to June 20, 2017, the Investment Adviser had agreed to waive a portion of its management fees in order to achieve an effective net management fee rate of 1.35% of average daily net assets. |
| (a) | | Reflects combined management fees paid to GSAM under the Agreement and the Subsidiary Agreement as defined below after waivers. |
The Long Short Credit Strategies and Strategic Macro Funds invest in Institutional Shares of the Goldman Sachs Financial Square Government Fund, which is an affiliated Underlying Fund. GSAM has agreed to waive a portion of its management fee payable by the Funds in an amount equal to the management fee it earns as an investment adviser to any of the affiliated Underlying Funds in which the Funds invest. For the six months ended September 30, 2017, GSAM waived $23,098 and $9,928 of the Funds’ management fee for Long Short Credit Strategies and Strategic Macro Funds, respectively.
GSAM also provides management services to the Subsidiary pursuant to a Subsidiary Management Agreement (the “Subsidiary Agreement”) and is entitled to a management fee accrued daily and paid monthly, equal to an annual percentage rate of 0.42% of the Subsidiary’s average daily net assets. In consideration of the Subsidiary’s management fee, and for as long as the Subsidiary Agreement remains in effect, GSAM has contractually agreed to waive irrevocably a portion of the Fund’s management fee in an amount equal to the management fee accrued and paid to GSAM by the Subsidiary under the Subsidiary Agreement. For the six months ended September 30, 2017, GSAM waived $33,795 of the Fund’s management fee. This waiver represents an inter-fund transaction and, accordingly, has been eliminated in consolidation.
B. Distribution and/or Service (12b-1) Plans — The Trust, on behalf of Class A and Class R Shares of each applicable Fund, has adopted Distribution and Service Plans subject to Rule 12b-1 under the Act. Under the Distribution and Service Plans, Goldman Sachs, which serves as distributor (the “Distributor”), is entitled to a fee accrued daily and paid monthly, for distribution services and personal and account maintenance services, which may then be paid by Goldman Sachs to authorized dealers. These fees are equal to an annual percentage rate of the average daily net assets attributable to Class A or Class R Shares of the Funds, as applicable, as set forth below.
The Trust, on behalf of Class C Shares of each applicable Fund, has adopted a Distribution Plan subject to Rule 12b-1 under the Act. Under the Distribution Plan, Goldman Sachs as Distributor is entitled to a fee accrued daily and paid monthly for
55
GOLDMAN SACHS FIXED INCOME ALTERNATIVES FUNDS
Notes to Financial Statements (continued)
September 30, 2017 (Unaudited)
|
| 5. AGREEMENTS AND AFFILIATED TRANSACTIONS (continued) |
distribution services, which may then be paid by Goldman Sachs to authorized dealers. These fees are equal to an annual percentage rate of the average daily net assets attributable to Class C Shares of the Funds, as set forth below.
| | | | | | | | | | | | |
| | | Distribution and Service Plan Rates | |
| | | Class A* | | | Class C | | | Class R* | |
Distribution Plan | | | 0.25 | % | | | 0.75 | % | | | 0.50 | % |
Service Plan | | | — | | | | 0.25 | | | | — | |
| * | | With respect to Class A and Class R Shares, the Distributor at its discretion may use compensation for distribution services paid under the Distribution Plan to compensate service organizations for personal and account maintenance services and expenses as long as such total compensation does not exceed the maximum cap on “service fees” imposed by the Financial Industry Regulatory Authority. |
C. Distribution Agreement — Goldman Sachs, as Distributor of the shares of the Funds pursuant to a Distribution Agreement, may retain a portion of the Class A Shares’ front end sales charge and Class C Shares’ CDSC. For the six months ended September 30, 2017, Goldman Sachs advised that it retained $107 in front end sales charges for the Long Short Credit Strategies, and it did not retain any contingent deferred sales charges for either fund.
D. Transfer Agency Agreement — Goldman Sachs also serves as the transfer agent of the Funds for a fee pursuant to the Transfer Agency Agreement. The fees charged for such transfer agency services are accrued daily and paid monthly at annual rates as follows: 0.13% of the average daily net assets of Class A, Class C, Investor and Class R Shares and 0.04% of the average daily net assets of Institutional Shares.
Goldman Sachs has agreed to waive a portion of its transfer agency fee equal to 0.06% as an annual percentage rate of the average daily net assets attributable to Class A, Class C, Investor and Class R Shares of the Strategic Macro Fund. As a result of this waiver, a net transfer agency fee equal to 0.07% as an annual percentage rate of the average daily net assets attributable to Class A, Class C, Investor and Class R Shares of the Strategic Macro Fund is being charged to those share classes. This arrangement will remain in effect through at least July 28, 2018, and prior to such date, the Investment Advisor may not terminate the arrangement without the approval of the Board of Trustees.
E. Other Expense Agreements and Affiliated Transactions — GSAM has agreed to limit certain “Other Expenses” of the Funds (excluding acquired fund fees and expenses, transfer agency fees and expenses, service fees and shareholder administration fees (as applicable), taxes, interest, brokerage fees, expenses of shareholder meetings, litigation and indemnification, and extraordinary expenses) to the extent such expenses exceed, on an annual basis, a percentage rate of the average daily net assets of each Fund. Such Other Expense reimbursements, if any, are accrued daily and paid monthly. In addition, the Funds are not obligated to reimburse GSAM for prior fiscal year expense reimbursements, if any. The Other Expense limitations as an annual percentage rate of average daily net assets for Long Short Credit Strategies Fund and Strategic Macro Fund are 0.094% and 0.064%, respectively. These Other Expense limitations will remain in place through at least July 28, 2018, and prior to such date GSAM may not terminate the arrangements without the approval of the Trustees. In addition, the Funds have entered into certain offset arrangements with the transfer agent, which may result in a reduction of the Funds’ expenses and are received irrespective of the application of the “Other Expense” limitations described above.
For the six months ended September 30, 2017, these expense reductions, including any fee waivers and Other Expense reimbursements, were as follows:
| | | | | | | | | | | | | | | | | | |
| Fund | | | | Management
Fee Waiver | | | Transfer Agency
Fee Waiver | | | Other Expense
Reimbursements | | | Total Expense
Reductions | |
Long Short Credit Strategies | | | | $ | 23,098 | | | $ | — | | | $ | 109,902 | | | $ | 133,000 | |
Strategic Macro | | | | | 28,342 | | | | 163 | | | | 294,143 | | | | 322,648 | |
F. Line of Credit Facility — As of September 30, 2017, the Funds participated in a $1,100,000,000 committed, unsecured revolving line of credit facility (the “facility”) together with other funds of the Trust and certain registered investment companies
56
GOLDMAN SACHS FIXED INCOME ALTERNATIVES FUNDS
|
| 5. AGREEMENTS AND AFFILIATED TRANSACTIONS (continued) |
having management agreements with GSAM or its affiliates. This facility is to be used for temporary emergency purposes, or to allow for an orderly liquidation of securities to meet redemption requests. The interest rate on borrowings is based on the federal funds rate. The facility also requires a fee to be paid by the Funds based on the amount of the commitment that has not been utilized. For the six months ended September 30, 2017, the Funds did not have any borrowings under the facility.
G. Other Transactions with Affiliates — For the six months ended September 30, 2017 , Goldman Sachs did not earn any brokerage commissions from portfolio transactions, including futures transactions executed with Goldman Sachs as the Futures Commission Merchant, on behalf of the Funds.
As of September 30, 2017 The Goldman Sachs Group, Inc. was the beneficial owner of 5% or more of outstanding Class A, Class C, Institutional, Investor and Class R Shares of the following Funds:
| | | | | | | | | | | | | | | | | | | | | | |
| Fund | | | | Class A | | | Class C | | | Institutional | | | Investor | | | Class R | |
Long Short Credit Strategies | | | | | — | % | | | — | % | | | — | % | | | — | % | | | 71 | % |
Strategic Macro | | | | | 5 | | | | 23 | | | | 20 | | | | 9 | | | | 100 | |
The table below shows the transactions in and earnings from investments in the Underlying Funds for the six months ended September 30, 2017:
| | | | | | | | | | | | | | | | | | | | | | | | | | |
| Fund | | Underlying
Funds | | Beginning
Value as of
March 31,
2017 | | | Purchases
at Cost | | | Proceeds
from Sales | | | Ending Value as
of September 30,
2017 | | | Shares as of
September 30,
2017 | | | Dividend
Income | |
Long Short Credit Strategies | | Goldman Sachs Financial Square Government Fund | | $ | 22,868,909 | | | $ | 143,143,945 | | | $ | (145,653,508 | ) | | $ | 20,359,346 | | | | 20,359,346 | | | $ | 111,786 | |
Strategic Macro | | Goldman Sachs Financial Square Government Fund | | | 13,951,169 | | | | 54,386,869 | | | | (63,154,700 | ) | | | 5,183,338 | | | | 5,183,338 | | | | 47,936 | |
|
| 6. PORTFOLIO SECURITIES TRANSACTIONS |
The cost of purchases and proceeds from sales and maturities of long-term securities for the six months ended September 30, 2017, were:
| | | | | | | | | | | | | | | | | | |
| Fund | | | | Purchases of U.S. Government and Agency Obligations | | | Purchases (Excluding U.S. Government and Agency Obligations) | | | Sales and Maturities of U.S. Government and Agency Obligations | | | Sales and Maturities (Excluding U.S. Government and Agency Obligations) | |
Long Short Credit Strategies | | | | $ | 34,645,842 | | | $ | 213,106,290 | | | $ | 29,671,270 | | | $ | 238,171,438 | |
Strategic Macro | | | | | 32,284,205 | | | | 6,206,935 | | | | 44,148,615 | | | | 10,264,885 | |
The table below summarizes the reverse repurchase agreement activity for the six months ended September 30, 2017:
| | | | | | | | | | | | | | |
| | | | | Average amount of
borrowings | | | Weighted average
interest rate
(Paid) Received | | | Number of days
outstanding during
the period | |
Strategic Macro Fund | | | | | $3,920,294 | | | | 14.550% | | | | 14 | |
57
GOLDMAN SACHS FIXED INCOME ALTERNATIVES FUNDS
Notes to Financial Statements (continued)
September 30, 2017 (Unaudited)
As of the Funds’ most recent fiscal year end, March 31, 2017, the Funds’ capital loss carryforwards and certain timing differences on a tax basis were as follows:
| | | | | | | | |
| | | Long Short
Credit Strategies | | | Strategic
Macro | |
Capital loss carryforwards: | | | | | | | | |
Perpetual Short-term | | $ | (16,383,198 | ) | | $ | (2,840,479 | ) |
Perpetual Long-term | | $ | (2,219,572 | ) | | $ | (4,852,446 | ) |
Total capital loss carryforwards | | $ | (18,602,770 | ) | | $ | (7,692,925 | ) |
Timing differences (Qualified Late Year Loss Deferral, Post October Loss Deferral, Straddle Deferral and Dividend Payable) | | $ | (1,553,762 | ) | | $ | (1,330,785 | ) |
As of September 30, 2017, the Funds’ aggregate security unrealized gains and losses based on cost for U.S. federal income tax purposes were as follows:
| | | | | | | | |
| | | Long Short
Credit Strategies | | | Strategic
Macro | |
Tax Cost | | $ | 204,014,712 | | | $ | 23,578,263 | |
Gross unrealized gain | | | 2,624,854 | | | | 368,992 | |
Gross unrealized loss | | | (5,333,566 | ) | | | (443,798 | ) |
Net unrealized losses on securities | | $ | (2,708,712 | ) | | $ | (74,806 | ) |
The difference between GAAP-basis and tax-basis unrealized gains (losses) is attributable primarily to wash sales, net mark to market gains/(losses) on regulated futures, foreign currency contracts and options contracts, and differences in the tax treatment of swap transactions, inflation protected securities, material modification of debt securities and underlying Fund investments.
In order to present certain components of the Funds’ capital accounts on a tax-basis, certain reclassifications have been recorded to the Funds’ accounts. These reclassifications have no impact on the NAV of the Funds and result primarily from differences in the tax treatment of swap transactions, foreign currency transactions, the recognition of income and gains/losses of certain bonds, inflation protected securities, and underlying fund investments.
GSAM has reviewed the Funds’ tax positions for all open tax years (the current and prior three years, as applicable) and has concluded that no provision for income tax is required in the Funds’ financial statements. Such open tax years remain subject to examination and adjustment by tax authorities.
Derivatives Risk — The Funds’ use of derivatives may result in loss. Derivative instruments, which may pose risks in addition to and greater than those associated with investing directly in securities, currencies or other instruments, may be illiquid or less liquid, volatile, difficult to price and leveraged so that small changes in the value of the underlying instruments may produce disproportionate losses to the Funds. Derivatives are also subject to counterparty risk, which is the risk that the other party in the transaction will not fulfill its contractual obligation. The use of derivatives is a highly specialized activity that involves investment techniques and risks different from those associated with investments in more traditional securities and instruments. Losses from derivatives can also result from a lack of correlation between changes in the value of derivative instruments and the portfolio assets (if any) being hedged.
Foreign and Emerging Countries Risk — Investing in foreign markets may involve special risks and considerations not typically associated with investing in the United States. Foreign securities may be subject to risk of loss because of more or less
58
GOLDMAN SACHS FIXED INCOME ALTERNATIVES FUNDS
|
| 8. OTHER RISKS (continued) |
foreign government regulation, less public information and less economic, political and social stability in the countries in which the Funds invest. The imposition of exchange controls, confiscations, trade restrictions (including tariffs) and other government restrictions by the United States or other governments, or from problems in share registration, settlement or custody, may also result in losses. Foreign risk also involves the risk of negative foreign currency rate fluctuations, which may cause the value of securities denominated in such foreign currency (or other instruments through which the Funds have exposure to foreign currencies) to decline in value. Currency exchange rates may fluctuate significantly over short periods of time. To the extent that the Funds also invest in securities of issuers located in emerging markets, these risks may be more pronounced.
Foreign Custody Risk — If a Fund invests in foreign securities, such Fund may hold such securities and cash with foreign banks, agents, and securities depositories appointed by the Fund’s custodian (each a “Foreign Custodian”). Some foreign custodians may be recently organized or new to the foreign custody business. In some countries, Foreign Custodians may be subject to little or no regulatory oversight over, or independent evaluation of, their operations. Further, the laws of certain countries may place limitations on a Fund’s ability to recover its assets if a Foreign Custodian enters bankruptcy.
Investments in emerging markets may be subject to even greater custody risks than investments in more developed markets. Custody services in emerging market countries are very often undeveloped and may be considerably less well regulated than in more developed countries, and thus may not afford the same level of investor protection as would apply in developed countries.
Interest Rate Risk — When interest rates increase, fixed income securities or instruments held by the Funds will generally decline in value. Long-term fixed income securities or instruments will normally have more price volatility because of this risk than short-term fixed income securities or instruments. The risks associated with increasing rates are heightened given that interest rates are near historic lows, but may be expected to increase in the future with unpredictable effects on the markets and the Funds’ investments. Fluctuations in interest rates may also affect the liquidity of fixed income securities and instruments held by the Funds.
Investments in Other Investment Companies — As a shareholder of another investment company, including an exchange-traded fund (“ETF”), a Fund will indirectly bear its proportionate share of any net management fees and other expenses paid by such other investment companies, in addition to the fees and expenses regularly borne by the Fund. ETFs are subject to risks that do not apply to conventional mutual funds, including but not limited to the following: (i) the market price of the ETF’s shares may trade at a premium or a discount to their NAV; and (ii) an active trading market for an ETF’s shares may not develop or be maintained.
Large Shareholder Transactions Risk — A Fund may experience adverse effects when certain large shareholders, such as other funds, institutional investors (including those trading by use of non-discretionary mathematical formulas), financial intermediaries (who may make investment decisions on behalf of underlying clients and/or include a Fund in their investment model), individuals, accounts and Goldman Sachs affiliates, purchase or redeem large amounts of shares of a Fund. Such large shareholder redemptions may cause a Fund to sell portfolio securities at times when it would not otherwise do so, which may negatively impact a Fund’s NAV and liquidity. These transactions may also accelerate the realization of taxable income to shareholders if such sales of investments resulted in gains, and may also increase transaction costs. In addition, a large redemption could result in a Fund’s current expenses being allocated over a smaller asset base, leading to an increase in the Fund’s expense ratio. Similarly, large Fund share purchases may adversely affect a Fund’s performance to the extent that the Fund is delayed in investing new cash and is required to maintain a larger cash position than it ordinarily would.
Leverage Risk — Leverage creates exposure to potential gains and losses in excess of the initial amount invested. Borrowing and the use of derivatives may result in leverage and may make a Fund more volatile. When a Fund uses leverage, the sum of that Fund’s investment exposure may significantly exceed the amount of assets invested in the Fund, although these exposures may vary over time. Relatively small market movements may result in large changes in the value of a leveraged investment. A Fund will identify liquid assets on its books or otherwise cover transactions that may give rise to such risk, to the extent required by applicable law. The use of leverage may cause a Fund to liquidate portfolio positions to satisfy its obligations or to meet segregation requirements when it may not be advantageous to do so. The use of leverage by a Fund can substantially increase the adverse impact to which the Fund’s investment portfolio may be subject.
59
GOLDMAN SACHS FIXED INCOME ALTERNATIVES FUNDS
Notes to Financial Statements (continued)
September 30, 2017 (Unaudited)
|
| 8. OTHER RISKS (continued) |
Liquidity Risk — A Fund may make investments that are illiquid or that may become less liquid in response to market developments or adverse investor perceptions. Illiquid investments may be more difficult to value. Liquidity risk may also refer to the risk that a Fund will not be able to pay redemption proceeds within the allowable time period because of unusual market conditions, an unusually high volume of redemption requests, or other reasons. To meet redemption requests, a Fund may be forced to sell investments at an unfavorable time and/or under unfavorable conditions. Liquidity risk may be the result of, among other things, the reduced number and capacity of traditional market participants to make a market in fixed income securities or the lack of an active market. The potential for liquidity risk may be magnified by a rising interest rate environment or other circumstances where investor redemptions from fixed income mutual funds may be higher than normal, potentially causing increased supply in the market due to selling activity.
Loan-Related Investments Risk — In addition to risks generally associated with debt investments, loan-related investments such as loan participations and assignments are subject to other risks. Although a loan obligation may be fully collateralized at the time of acquisition, the collateral may decline in value, be relatively illiquid, or lose all or substantially all of its value subsequent to investment. Many loan investments are subject to legal or contractual restrictions on resale and may be relatively illiquid and difficult to value. There is less readily available, reliable information about most loan investments than is the case for many other types of securities. Substantial increases in interest rates may cause an increase in loan obligation defaults. With respect to loan participations, the Fund may not always have direct recourse against a borrower if the borrower fails to pay scheduled principal and/or interest; may be subject to greater delays, expenses and risks than if the Fund had purchased a direct obligation of the borrower; and may be regarded as the creditor of the agent lender (rather than the borrower), subjecting the Fund to the creditworthiness of that lender as well. Investors in loans, such as the Fund, may not be entitled to rely on the anti-fraud protections of the federal securities laws, although they may be entitled to certain contractual remedies. The market for loan obligations may be subject to irregular trading activity, wide bid/ask spreads and extended trade settlement periods. Because transactions in many loans are subject to extended trade settlement periods, the Fund may not receive the proceeds from the sale of a loan for a period after the sale. As a result, sale proceeds related to the sale of loans may not be available to make additional investments or to meet the Fund’s redemption obligations for a period after the sale of the loans, and, as a result, the Fund may have to sell other investments or engage in borrowing transactions, such as borrowing from its credit facility, if necessary to raise cash to meet its obligations.
Senior Loans hold the most senior position in the capital structure of a business entity, and are typically secured with specific collateral, but are nevertheless usually rated below investment grade. Because Second Lien Loans are subordinated or unsecured and thus lower in priority of payment to Senior Loans, they are subject to the additional risk that the cash flow of the borrower and property securing the loan or debt, if any, may be insufficient to meet scheduled payments after giving effect to the senior secured obligations of the borrower. Second Lien Loans generally have greater price volatility than Senior Loans and may be less liquid.
Market and Credit Risks — In the normal course of business, the Funds trade financial instruments and enter into financial transactions where risk of potential loss exists due to changes in the market (market risk). Additionally, the Funds may also be exposed to credit risk in the event that an issuer or guarantor fails to perform or that an institution or entity with which the Funds have unsettled or open transactions defaults.
Non-Diversification Risk — The Funds are non-diversified, meaning that they are permitted to invest a larger percentage of their assets in fewer issuers than diversified mutual funds. Thus, the Funds may be more susceptible to adverse developments affecting any single issuer held in their portfolios, and may be more susceptible to greater losses because of these developments.
Short Position Risk — A Fund may enter into a short position through a futures contract, an option or swap agreement or through short sales of any instrument that a Fund may purchase for investment. Taking short positions involves leverage of a Fund’s assets and presents various risks, including counterparty risk. If the value of the underlying instrument or market in which a Fund has taken a short position increases, then the Fund will incur a loss equal to the increase in value from the time that the short position was entered into plus any related interest payments or other fees. Taking short positions involves the risk that losses may be disproportionate, may exceed the amount invested, and may be unlimited.
60
GOLDMAN SACHS FIXED INCOME ALTERNATIVES FUNDS
|
| 8. OTHER RISKS (continued) |
Tax Risk — The Strategic Macro Fund will seek to gain exposure to the commodity markets primarily through investments in the Subsidiary and/or commodity index-linked structured notes, as applicable. Historically, the Internal Revenue Service (“IRS”) issued private letter rulings (“PLRs”) in which the IRS specifically concluded that income and gains from investments in commodity index-linked structured notes or a wholly-owned foreign subsidiary that invests in commodity-linked instruments are “qualifying income” for purposes of compliance with Subchapter M of the Code. The Fund has not received a PLR, and is not able to rely on PLRs issued to other taxpayers. Additionally, the IRS has suspended the granting of such PLRs, pending review of its position on this matter. The IRS also recently issued proposed regulations that, if finalized, would generally treat the Fund’s income inclusion with respect to a subsidiary as qualifying income only if there is a distribution out of the earnings and profits of a subsidiary that are attributable to such income inclusion. The proposed regulations, if adopted, would apply to taxable years beginning on or after 90 days after the regulations are published as final.
The IRS also recently issued a revenue procedure, which states that the IRS will not in the future issue PLRs that would require a determination of whether an asset (such as a commodity index-linked note) is a “security” under the Investment Company Act of 1940. The Fund has obtained an opinion of counsel that the Fund’s income from such investments should constitute “qualifying income.” However, no assurances can be provided that the IRS would not be able to successfully assert that the Fund’s income from such investments was not “qualifying income,” in which case the Fund would fail to qualify as a regulated investment company (“RIC”) under Subchapter M of the Code if over 10% of its gross income were derived from these investments. If the Fund failed to qualify as a RIC, it would be subject to federal and state income tax on all of its taxable income at regular corporate tax rates. This would significantly adversely affect the returns to, and could cause substantial losses for, Fund shareholders.
Under the Trust’s organizational documents, its Trustees, officers, employees and agents are indemnified, to the extent permitted by the Act and state law, against certain liabilities that may arise out of performance of their duties to the Funds. Additionally, in the course of business, the Funds enter into contracts that contain a variety of indemnification clauses. The Funds’s maximum exposure under these arrangements is unknown, as this would involve future claims that may be made against the Funds that have not yet occurred. However, GSAM believes the risk of loss under these arrangements to be remote.
Subsequent events after the Statements of Assets and Liabilities date have been evaluated and GSAM has concluded that there is no impact requiring adjustment or disclosure in the financial statements.
61
GOLDMAN SACHS FIXED INCOME ALTERNATIVES FUNDS
Notes to Financial Statements (continued)
September 30, 2017 (Unaudited)
|
| 11. SUMMARY OF SHARE TRANSACTIONS |
Share activity is as follows:
| | | | | | | | | | | | | | | | |
| | | Long Short Credit Strategies Fund | |
| | | | |
| | | For the Six Months Ended
September 30, 2017
(Unaudited) | | | For the Fiscal Year Ended
March 31, 2017
| |
| | | | |
| | | Shares | | | Dollars | | | Shares | | | Dollars | |
| | | | |
| Class A Shares | | | | | | | | | | | | | | | | |
Shares sold | | | 39,941 | | | $ | 379,373 | | | | 709,896 | | | $ | 6,769,325 | |
Reinvestment of distributions | | | 9,731 | | | | 92,567 | | | | 44,163 | | | | 419,468 | |
Shares redeemed | | | (504,113 | ) | | | (4,774,993 | ) | | | (295,569 | ) | | | (2,819,928 | ) |
| | | | (454,441 | ) | | | (4,303,053 | ) | | | 458,490 | | | | 4,368,865 | |
| Class C Shares | | | | | | | | | | | | | | | | |
Shares sold | | | 716 | | | | 6,800 | | | | 176,485 | | | | 1,688,399 | |
Reinvestment of distributions | | | 1,556 | | | | 14,797 | | | | 7,086 | | | | 67,135 | |
Shares redeemed | | | (61,452 | ) | | | (583,221 | ) | | | (85,797 | ) | | | (818,193 | ) |
| | | | (59,180 | ) | | | (561,624 | ) | | | 97,774 | | | | 937,341 | |
| Institutional Shares | | | | | | | | | | | | | | | | |
Shares sold | | | 2,155,666 | | | | 20,472,428 | | | | 7,305,879 | | | | 69,775,802 | |
Reinvestment of distributions | | | 190,748 | | | | 1,812,821 | | | | 583,045 | | | | 5,534,050 | |
Shares redeemed | | | (2,559,864 | ) | | | (24,316,301 | ) | | | (6,189,282 | ) | | | (59,029,553 | ) |
| | | | (213,450 | ) | | | (2,031,052 | ) | | | 1,699,642 | | | | 16,280,299 | |
| Investor Shares | | | | | | | | | | | | | | | | |
Shares sold | | | 248,552 | | | | 2,362,773 | | | | 1,042,262 | | | | 9,942,346 | |
Reinvestment of distributions | | | 8,720 | | | | 82,945 | | | | 28,396 | | | | 269,340 | |
Shares redeemed | | | (518,079 | ) | | | (4,915,674 | ) | | | (616,556 | ) | | | (5,880,902 | ) |
| | | | (260,807 | ) | | | (2,469,956 | ) | | | 454,102 | | | | 4,330,784 | |
| Class R Shares | | | | | | | | | | | | | | | | |
Shares sold | | | — | | | | — | | | | 94 | | | | 911 | |
Reinvestment of distributions | | | 32 | | | | 308 | | | | 114 | | | | 1,069 | |
| | | | 32 | | | | 308 | | | | 208 | | | | 1,980 | |
NET INCREASE (DECREASE) | | | (987,846 | ) | | $ | (9,365,377 | ) | | | 2,710,216 | | | $ | 25,919,269 | |
62
GOLDMAN SACHS FIXED INCOME ALTERNATIVES FUNDS
|
| 11. SUMMARY OF SHARE TRANSACTIONS (continued) |
| | | | | | | | | | | | | | | | |
| | | Strategic Macro Fund | |
| | | | |
| | | For the Six Months Ended
September 30, 2017
(Unaudited) | | | For the Fiscal Year Ended
March 31, 2017
| |
| | | | |
| | | Shares | | | Dollars | | | Shares | | | Dollars | |
| | | | |
| Class A Shares | | | | | | | | | | | | | | | | |
Shares sold | | | 432 | | | $ | 3,800 | | | | 766 | | | $ | 6,754 | |
Reinvestment of distributions | | | — | | | | — | | | | 209 | | | | 1,827 | |
Shares redeemed | | | (666 | ) | | | (5,839 | ) | | | (15,579 | ) | | | (136,998 | ) |
| | | | (234 | ) | | | (2,039 | ) | | | (14,604 | ) | | | (128,417 | ) |
| Class C Shares | | | | | | | | | | | | | | | | |
Shares sold | | | — | | | | — | | | | 965 | | | | 8,438 | |
Shares redeemed | | | (1,426 | ) | | | (12,577 | ) | | | (10,452 | ) | | | (91,479 | ) |
| | | | (1,426 | ) | | | (12,577 | ) | | | (9,487 | ) | | | (83,041 | ) |
| Institutional Shares | | | | | | | | | | | | | | | | |
Shares sold | | | 207,361 | | | | 1,822,010 | | | | 150,507 | | | | 1,325,328 | |
Reinvestment of distributions | | | — | | | | — | | | | 96,411 | | | | 844,564 | |
Shares redeemed | | | (3,712,144 | ) | | | (32,762,743 | ) | | | (1,362,614 | ) | | | (11,982,857 | ) |
| | | | (3,504,783 | ) | | | (30,940,733 | ) | | | (1,115,696 | ) | | | (9,812,965 | ) |
| Investor Shares | | | | | | | | | | | | | | | | |
Shares sold | | | 533 | | | | 4,699 | | | | 30,197 | | | | 264,304 | |
Reinvestment of distributions | | | — | | | | — | | | | 429 | | | | 3,763 | |
Shares redeemed | | | (10,310 | ) | | | (90,861 | ) | | | (184,924 | ) | | | (1,627,668 | ) |
| | | | (9,777 | ) | | | (86,162 | ) | | | (154,298 | ) | | | (1,359,601 | ) |
| Class R Shares | | | | | | | | | | | | | | | | |
Reinvestment of distributions | | | — | | | | — | | | | 24 | | | | 212 | |
| | | | — | | | | — | | | | 24 | | | | 212 | |
NET DECREASE | | | (3,516,220 | ) | | $ | (31,041,511 | ) | | | (1,294,061 | ) | | $ | (11,383,812 | ) |
63
GOLDMAN SACHS FIXED INCOME ALTERNATIVES FUNDS
| | |
Fund Expenses — Six Month Period Ended September 30, 2017 (Unaudited) | | |
As a shareholder of Class A, Class C, Institutional, Investor or Class R Shares of a Fund, you incur two types of costs: (1) transaction costs, including sales charges on purchase payments (with respect to Class A Shares), contingent deferred sales charges on redemptions (with respect to Class C Shares), and (2) ongoing costs, including management fees; distribution and/or service (12b-1) fees (with respect to Class A, Class C and Class R Shares); and other Fund expenses. This Example is intended to help you understand your ongoing costs (in dollars) of investing in Class A, Class C, Institutional, Investor or Class R Shares of the Funds and to compare these costs with the ongoing costs of investing in other mutual funds.
The Example is based on an investment of $1,000 invested at the beginning of the period and held for the entire period from April 1, 2017 through September 30, 2017, which represents a period of 183 days in a 365-day year.
Actual Expenses — The first line under each share class in the table below provides information about actual account values and actual expenses. You may use the information in this line, together with the amount you invested, to estimate the expenses that you paid over the period. Simply divide your account value by $1,000 (for example, an $8,600 account value divided by $1,000=8.6), then multiply the result by the number in the first line under the heading entitled “Expenses Paid” to estimate the expenses you paid on your account during this period.
Hypothetical Example for Comparison Purposes — The second line under each share class in the table below provides information about hypothetical account values and hypothetical expenses based on the Funds’ actual net expense ratios and an assumed rate of return of 5% per year before expenses, which is not the Funds’ actual return. The hypothetical account values and expenses may not be used to estimate the actual ending account balance or expenses you paid for the period. You may use this information to compare the ongoing costs of investing in the Funds and other funds. To do so, compare this 5% hypothetical example with the 5% hypothetical examples that appear in the shareholder reports of the other funds.
Please note that the expenses shown in the table are meant to highlight your ongoing costs only and do not reflect any transactional costs, such as sales charges, redemption fees, or exchange fees. Therefore, the second line of the table is useful in comparing ongoing costs only, and will not help you determine the relative total costs of owning different funds. In addition, if these transactional costs were included, your costs would have been higher.
| | | | | | | | | | | | | | | | | | | | | | | | |
| | | Long Short Credit Strategies Fund | | | Strategic Macro Fund | |
| Share Class | | Beginning
Account Value
4/1/17 | | | Ending
Account Value
9/30/17 | | | Expenses
Paid for the
6 months
ended
9/30/17* | | | Beginning
Account Value
4/1/17 | | | Ending
Account Value
9/30/17 | | | Expenses
Paid for the
6 months
ended
9/30/17* | |
| Class A | | | | | | | | | | | | | | | | | | | | | | | | |
Actual | | $ | 1,000.00 | | | $ | 1,016.50 | | | $ | 7.33 | | | $ | 1,000.00 | | | $ | 984.20 | | | $ | 7.11 | |
Hypothetical 5% return | | | 1,000.00 | | | | 1,017.80 | + | | | 7.33 | | | | 1,000.00 | | | | 1,017.90 | + | | | 7.23 | |
| Class C | | | | | | | | | | | | | | | | | | | | | | | | |
Actual | | | 1,000.00 | | | | 1,012.70 | | | | 11.10 | | | | 1,000.00 | | | | 980.90 | | | | 10.88 | |
Hypothetical 5% return | | | 1,000.00 | | | | 1,014.04 | + | | | 11.11 | | | | 1,000.00 | | | | 1,014.09 | + | | | 11.06 | |
| Institutional | | | | | | | | | | | | | | | | | | | | | | | | |
Actual | | | 1,000.00 | | | | 1,018.20 | | | | 5.62 | | | | 1,000.00 | | | | 986.50 | | | | 5.83 | |
Hypothetical 5% return | | | 1,000.00 | | | | 1,019.50 | + | | | 5.62 | | | | 1,000.00 | | | | 1,019.40 | + | | | 5.92 | |
| Investor | | | | | | | | | | | | | | | | | | | | | | | | |
Actual | | | 1,000.00 | | | | 1,020.80 | | | | 6.07 | | | | 1,000.00 | | | | 986.50 | | | | 5.93 | |
Hypothetical 5% return | | | 1,000.00 | | | | 1,017.65 | + | | | 6.07 | | | | 1,000.00 | | | | 1,019.10 | + | | | 6.02 | |
| Class R | | | | | | | | | | | | | | | | | | | | | | | | |
Actual | | | 1,000.00 | | | | 1,015.20 | | | | 8.59 | | | | 1,000.00 | | | | 984.20 | | | | 7.91 | |
Hypothetical 5% return | | | 1,000.00 | | | | 1,016.55 | + | | | 8.59 | | | | 1,000.00 | | | | 1,017.10 | + | | | 8.04 | |
| | * | | Expenses for each share class are calculated using each Fund’s annualized net expense ratio for each class, which represents the ongoing expenses as a percentage of net assets for the six months ended September 30, 2017. Expenses are calculated by multiplying the annualized net expense ratio by the average account value for the period; then multiplying the result by the number of days in the most recent fiscal half year; and then dividing that result by the number of days in the fiscal year. The annualized net expense ratios for the period were as follows: | |
| | | | | | | | | | | | | | | | | | | | |
| Fund | | Class A | | | Class C | | | Institutional | | | Investor | | | Class R | |
Long Short Credit Strategies | | | 1.65 | % | | | 1.27 | % | | | 1.82 | % | | | 1.78 | % | | | 1.52 | % |
Strategic Macro | | | 1.58 | | | | 1.91 | | | | 1.35 | | | | 1.35 | | | | 1.58 | |
| | + | | Hypothetical expenses are based on each Fund’s actual annualized net expense ratios and an assumed rate of return of 5% per year before expenses. | |
64
GOLDMAN SACHS FIXED INCOME ALTERNATIVES FUNDS
Statement Regarding Basis for Approval of Management Agreement (Unaudited)
Background
The Goldman Sachs Long Short Credit Strategies Fund and Goldman Sachs Strategic Macro Fund (formerly, the Goldman Sachs Fixed Income Macro Strategies Fund) (the “Funds”) are investment portfolios of Goldman Sachs Trust (the “Trust”). The Board of Trustees oversees the management of the Trust and reviews the investment performance and expenses of the Funds at regularly scheduled meetings held throughout the year. In addition, the Board of Trustees determines annually whether to approve the continuance of the Trust’s investment management agreement (the “Management Agreement”) with Goldman Sachs Asset Management, L.P. (the “Investment Adviser”) on behalf of the Funds.
The Management Agreement was most recently approved for continuation until June 30, 2018 by the Board of Trustees, including those Trustees who are not parties to the Management Agreement or “interested persons” (as defined in the Investment Company Act of 1940, as amended) of any party thereto (the “Independent Trustees”), at a meeting held on June 14-15, 2017 (the “Annual Meeting”).
The review process undertaken by the Trustees spans the course of the year and culminates with the Annual Meeting. To assist the Trustees in their deliberations, the Trustees have established a Contract Review Committee (the “Committee”), comprised of the Independent Trustees. The Committee held four meetings over the course of the year since the Management Agreement was last approved. At those Committee meetings, regularly scheduled Board or other committee meetings, and/or the Annual Meeting, matters relevant to the renewal of the Management Agreement were considered by the Board, or the Independent Trustees, as applicable. With respect to each Fund, such matters included:
| | (a) | | the nature and quality of the advisory, administrative, and other services provided to the Fund by the Investment Adviser and its affiliates, including information about: |
| | (i) | | the structure, staff, and capabilities of the Investment Adviser and its portfolio management teams; |
| | (ii) | | the groups within the Investment Adviser and its affiliates that support the portfolio management teams or provide other types of necessary services, including fund services groups (e.g., accounting and financial reporting, tax, shareholder services, and operations); controls and risk management groups (e.g., legal, compliance, valuation oversight, credit risk management, internal audit, compliance testing, market risk analysis, finance, and central funding); sales and distribution support groups, and others (e.g., information technology and training); |
| | (iii) | | trends in employee headcount; |
| | (iv) | | the Investment Adviser’s financial resources and ability to hire and retain talented personnel and strengthen its operations; and |
| | (v) | | the parent company’s support of the Investment Adviser and its mutual fund business, as expressed by the firm’s senior management; |
65
GOLDMAN SACHS FIXED INCOME ALTERNATIVES FUNDS
Statement Regarding Basis for Approval of Management Agreement (Unaudited) (continued)
| | (b) | | information on the investment performance of the Fund, including comparisons to the performance of similar mutual funds, as provided by a third-party mutual fund data provider engaged as part of the contract review process (the “Outside Data Provider”), and a benchmark performance index; and information on general investment outlooks in the markets in which the Fund invests; |
| | (c) | | information provided by the Investment Adviser indicating the Investment Adviser’s views on whether the Fund’s peer group and/or benchmark index had high, medium, or low relevance given the Fund’s particular investment strategy; |
| | (d) | | the terms of the Management Agreement and other agreements with affiliated service providers entered into by the Trust on behalf of the Fund; |
| | (e) | | fee and expense information for the Fund, including: |
| | (i) | | the relative management fee and expense levels of the Fund as compared to those of comparable funds managed by other advisers, as provided by the Outside Data Provider; |
| | (ii) | | the Fund’s expense trends over time; and |
| | (iii) | | to the extent the Investment Adviser manages other types of accounts (such as bank collective trusts, private wealth management accounts, institutional separate accounts, sub-advised mutual funds, and non-U.S. funds) having investment objectives and policies similar to those of the Fund, comparative information on the advisory fees charged and services provided to those accounts by the Investment Adviser; |
| | (f) | | with respect to the extensive investment performance and expense comparison data provided by the Outside Data Provider, its processes in producing that data for the Fund; |
| | (g) | | the undertakings of the Investment Adviser and its affiliates to implement fee waivers and/or expense limitations; |
| | (h) | | information relating to the profitability of the Management Agreement and the transfer agency and distribution and service arrangements of the Fund to the Investment Adviser and its affiliates; |
| | (i) | | whether the Fund’s existing management fee schedule adequately addressed any economies of scale; |
| | (j) | | a summary of the “fall-out” benefits derived by the Investment Adviser and its affiliates from their relationships with the Fund, including the fees received by the Investment Adviser’s affiliates from the Fund for transfer agency, portfolio trading, distribution and other services; |
| | (k) | | a summary of potential benefits derived by the Fund as a result of its relationship with the Investment Adviser; |
| | (l) | | information regarding portfolio trading and how the Investment Adviser carries out its duty to seek best execution; |
| | (m) | | portfolio manager ownership of Fund shares; the manner in which portfolio manager compensation is determined; and the number and types of accounts managed by the portfolio managers; |
| | (n) | | the nature and quality of the services provided to the Fund by its unaffiliated service providers, and the Investment Adviser’s general oversight and evaluation (including reports on due diligence) of those service providers as part of the administrative services provided under the Management Agreement; and |
| | (o) | | the Investment Adviser’s processes and policies addressing various types of potential conflicts of interest; its approach to risk management; the annual review of the effectiveness of the Fund’s compliance program; and periodic compliance reports. |
66
GOLDMAN SACHS FIXED INCOME ALTERNATIVES FUNDS
Statement Regarding Basis for Approval of Management Agreement (Unaudited) (continued)
The Trustees also received an overview of the Funds’ distribution arrangements. They received information regarding the Funds’ assets, share purchase and redemption activity, and payment of distribution and service fees. Information was also provided to the Trustees relating to revenue sharing payments made by and services provided by the Investment Adviser and its affiliates to intermediaries that promote the sale, distribution, and/or servicing of Fund shares. The Independent Trustees also discussed the broad range of other investment choices that are available to Fund investors, including the availability of comparable funds managed by other advisers.
The presentations made at the Board and Committee meetings and at the Annual Meeting encompassed the Funds and other mutual funds for which the Board of Trustees has responsibility. In evaluating the Management Agreement at the Annual Meeting, the Trustees relied upon their knowledge, resulting from their meetings and other interactions throughout the year, of the Investment Adviser and its affiliates, their services, and the Funds. In conjunction with these meetings, the Trustees received written materials and oral presentations on the topics covered, and the Investment Adviser addressed the questions and concerns of the Trustees, including concerns regarding the investment performance of certain of the funds they oversee. The Independent Trustees were advised by their independent legal counsel regarding their responsibilities and other regulatory requirements related to the approval and continuation of mutual fund investment management agreements under applicable law. In addition, the Investment Adviser and its affiliates provided the Independent Trustees with a written response to a formal request for information sent on behalf of the Independent Trustees by their independent legal counsel. During the course of their deliberations, the Independent Trustees met in executive sessions with their independent legal counsel, without representatives of the Investment Adviser or its affiliates present.
Nature, Extent, and Quality of the Services Provided Under the Management Agreement
As part of their review, the Trustees considered the nature, extent, and quality of the services provided to the Funds by the Investment Adviser. In this regard, the Trustees considered both the investment advisory services and non-advisory services that are provided by the Investment Adviser and its affiliates. The Trustees noted the transition in the leadership and changes in personnel of various of the Investment Adviser’s portfolio management teams that had occurred in recent periods, and the ongoing recruitment efforts aimed at bringing high quality investment talent to the Investment Adviser. They also noted the Investment Adviser’s commitment to maintaining high quality systems and expending substantial resources to respond to ongoing changes to the regulatory and control environment in which the Funds and their service providers operate, as well as the efforts of the Investment Adviser and its affiliates to combat cyber security risks. The Trustees concluded that the Investment Adviser continued to commit substantial financial and operational resources to the Funds and expressed confidence that the Investment Adviser would continue to do so in the future. The Trustees also recognized that the Investment Adviser had made significant commitments to address regulatory compliance requirements applicable to the Funds and the Investment Adviser and its affiliates.
67
GOLDMAN SACHS FIXED INCOME ALTERNATIVES FUNDS
Statement Regarding Basis for Approval of Management Agreement (Unaudited) (continued)
Investment Performance
The Trustees also considered the investment performance of the Funds. In this regard, they compared the investment performance of each Fund to its peers using rankings and ratings compiled by the Outside Data Provider as of December 31, 2016, and updated performance information prepared by the Investment Adviser using the peer group identified by the Outside Data Provider as of March 31, 2017. The information on each Fund’s investment performance was provided for the one-, three-, and five-year periods ending on the applicable dates, to the extent that each Fund had been in existence for those periods. The Trustees also reviewed each Fund’s investment performance relative to its performance benchmark. As part of this review, they considered the investment performance trends of the Funds over time, and reviewed the investment performance of each Fund in light of its investment objective and policies and market conditions.
In addition, the Trustees considered materials prepared and presentations made by the Investment Adviser’s senior management and portfolio management personnel in which Fund performance was assessed. The Trustees also considered the Investment Adviser’s periodic reports with respect to the Funds’ risk profiles, and how the Investment Adviser’s approach to risk monitoring and management influences portfolio management.
The Trustees recalled that the Long Short Credit Strategies Fund was launched in April 2014 in connection with the reorganization of the Goldman Sachs Credit Strategies Fund, a closed-end interval fund, with and into the Long Short Credit Strategies Fund. The Trustees also noted that the Long Short Credit Strategies Fund’s Institutional Shares (when viewed together with its predecessor) had placed in the first quartile of the Fund’s peer group for the five-year period and the third quartile for the one- and three-year periods; had outperformed the Fund’s LIBOR-based benchmark index by 2.81% and 2.50%, respectively, for the one- and five-year periods and underperformed by 0.03% for the three-year period; and had outperformed the average performance of a group of competitor funds, as determined by the Investment Adviser (the “Competitor Fund Average”) for the three- and five-year periods and underperformed for the one-year period ended March 31, 2017. However, they noted that the Long Short Credit Strategies Fund currently implements a long/short credit strategy, while the Goldman Sachs Credit Strategies Fund implemented a long-only credit strategy. The Trustees observed that the Strategic Macro Fund’s Institutional Shares had placed in the fourth quartile of the Fund’s peer group for the one- and three-year periods, had outperformed the Fund’s LIBOR-based benchmark index by 0.99% for the one-year period and underperformed by 1.25% for the three-year period, and had underperformed the Fund’s Competitor Fund Average for the one- and three-year periods ended March 31, 2017. They noted that the Strategic Macro Fund had certain significant differences from its benchmark index that caused it to be an imperfect basis for comparison. They also noted that the Investment Adviser was proposing to change the Strategic Macro Fund’s name in June 2017.
68
GOLDMAN SACHS FIXED INCOME ALTERNATIVES FUNDS
Statement Regarding Basis for Approval of Management Agreement (Unaudited) (continued)
Costs of Services Provided and Competitive Information
The Trustees considered the contractual terms of the Management Agreement and the fee rates payable by each Fund thereunder. In this regard, the Trustees considered information on the services rendered by the Investment Adviser to the Funds, which included both advisory and administrative services that were directed to the needs and operations of the Funds as registered mutual funds.
In particular, the Trustees reviewed analyses prepared by the Outside Data Provider regarding the expense rankings of the Funds. The analyses provided a comparison of each Fund’s management fee and breakpoints to those of a relevant peer group and category universe; an expense analysis which compared each Fund’s overall net and gross expenses to a peer group and a category universe; and data comparing each Fund’s net expenses to the peer and category medians. The analyses also compared each Fund’s transfer agency, custody, and distribution fees, other expenses and fee waivers/reimbursements to those of the peer group and category medians. The Trustees concluded that the comparisons provided by the Outside Data Provider were useful in evaluating the reasonableness of the management fees and total expenses paid by the Funds.
With respect to the Strategic Macro Fund, the Trustees noted that the management fee breakpoint schedule was being reduced at all asset levels. In addition, the Trustees considered the Investment Adviser’s undertakings to implement fee waivers and/or expense limitations. With respect to the Strategic Macro Fund, the Trustees noted that the Investment Adviser had agreed to waive a portion of its management fee in an amount equal to the entire management fee paid to the Investment Adviser as the investment adviser to the Fund’s wholly-owned subsidiary. They also considered, to the extent that the Investment Adviser manages other types of accounts having investment objectives and policies similar to those of the Funds, comparative fee information for services provided by the Investment Adviser to those accounts, and information that indicated that services provided to the Funds differed in various significant respects from the services provided to other types of accounts which, in many cases, operated under less stringent legal and regulatory structures, required fewer services from the Investment Adviser to a smaller number of client contact points, and were less time-intensive.
In addition, the Trustees noted that shareholders are able to redeem their Fund shares at any time if shareholders believe that the Fund fees and expenses are too high or if they are dissatisfied with the performance of the Fund.
69
GOLDMAN SACHS FIXED INCOME ALTERNATIVES FUNDS
Statement Regarding Basis for Approval of Management Agreement (Unaudited) (continued)
Profitability
The Trustees reviewed each Fund’s contribution to the Investment Adviser’s revenues and pre-tax profit margins. In this regard the Trustees noted that they had received, among other things, profitability analyses and summaries, revenue and expense schedules by Fund and by function (i.e., investment management, transfer agency and distribution and service), and information on the Investment Adviser’s expense allocation methodology. They observed that the profitability and expense figures are substantially similar to those used by the Investment Adviser for many internal purposes, including compensation decisions among various business groups, and are thus subject to a vigorous internal debate about how certain revenue and expenses should be allocated. The Trustees also noted that the internal audit group within the Goldman Sachs organization had audited the expense allocation methodology and that the internal audit group was satisfied with the reasonableness, consistency, and accuracy of the Investment Adviser’s expense allocation methodology and profitability analysis calculations. Profitability data for each Fund was provided for 2016 and 2015, and the Trustees considered this information in relation to the Investment Adviser’s overall profitability.
Economies of Scale
The Trustees considered the information that had been provided regarding the Investment Adviser’s profitability. The Trustees also considered the breakpoints in the fee rate payable under the Management Agreement for each of the Funds at the following annual percentage rates of the average daily net assets of the Funds:
| | | | | | | | |
| | | Long Short
Credit
Strategies
Fund | | | Strategic
Macro
Fund | |
| First $1 billion | | | 1.00 | % | | | 1.50 | % |
| Next $1 billion | | | 0.90 | | | | 1.50 | |
| Next $3 billion | | | 0.86 | | | | 1.35 | |
| Next $3 billion | | | 0.84 | | | | 1.29 | |
| Over $8 billion | | | 0.82 | | | | 1.26 | |
70
GOLDMAN SACHS FIXED INCOME ALTERNATIVES FUNDS
Statement Regarding Basis for Approval of Management Agreement (Unaudited) (continued)
The Trustees noted that the breakpoints were designed to share potential economies of scale, if any, with the Funds and their shareholders as assets under management reach those asset levels. The Trustees considered the amounts of assets in the Funds; the Funds’ recent share purchase and redemption activity; the information provided by the Investment Adviser relating to the costs of the services provided by the Investment Adviser and its affiliates and their realized profits; information comparing fee rates charged by the Investment Adviser with fee rates charged to other funds in the peer groups; and the Investment Adviser’s undertakings to waive a portion of its management fee (with respect to the Strategic Macro Fund) and to limit certain expenses of the Funds that exceed specified levels, as well as Goldman Sachs & Co LLC’s (“Goldman Sachs”) undertaking to waive a portion of the transfer agency fees paid by the Strategic Macro Fund’s Class A, Class C, Investor and Class R Shares. Upon reviewing these matters at the Annual Meeting, the Trustees concluded that the fee breakpoints represented a means of assuring that benefits of scalability, if any, would be passed along to shareholders at the specified asset levels.
Other Benefits to the Investment Adviser and Its Affiliates
The Trustees also considered the other benefits derived by the Investment Adviser and its affiliates from their relationships with the Funds as stated above, including: (a) transfer agency fees received by Goldman Sachs; (b) futures commissions earned by Goldman Sachs for executing futures transactions on behalf of the Funds; (c) trading efficiencies resulting from aggregation of orders of the Funds with those for other funds or accounts managed by the Investment Adviser; (d) the Investment Adviser’s ability to leverage the infrastructure designed to service the Funds on behalf of its other clients; (e) the Investment Adviser’s ability to cross-market other products and services to Fund shareholders; (f) Goldman Sachs’ retention of certain fees as Fund Distributor; (g) the Investment Adviser’s ability to negotiate better pricing with custodians on behalf of its other clients, as a result of the relationship with the Funds; and (h) the possibility that the working relationship between the Investment Adviser and the Funds’ third-party service providers may cause those service providers to be more likely to do business with other areas of Goldman Sachs. In the course of considering the foregoing, the Independent Trustees requested and received further information quantifying certain of these fall-out benefits.
71
GOLDMAN SACHS FIXED INCOME ALTERNATIVES FUNDS
Statement Regarding Basis for Approval of Management Agreement (Unaudited) (continued)
Other Benefits to the Funds and Their Shareholders
The Trustees also noted that the Funds receive certain potential benefits as a result of their relationship with the Investment Adviser, including: (a) trading efficiencies resulting from aggregation of orders of the Funds with those of other funds or accounts managed by the Investment Adviser; (b) enhanced servicing from vendors because of the volume of business generated by the Investment Adviser and its affiliates; (c) enhanced servicing from broker-dealers because of the volume of business generated by the Investment Adviser and its affiliates; (d) the Investment Adviser’s ability to negotiate favorable terms with derivatives counterparties on behalf of the Funds as a result of the size and reputation of the Goldman Sachs organization; (e) the Investment Adviser’s knowledge and experience gained from managing other accounts and products; (f) the Investment Adviser’s ability to hire and retain qualified personnel to provide services to the Funds because of the reputation of the Goldman Sachs organization; (g) the Funds’ access, through the Investment Adviser, to certain firmwide resources (e.g., proprietary risk management systems and databases), subject to certain restrictions; and (h) the Funds’ access to certain affiliated distribution channels. In addition, the Trustees noted the competitive nature of the mutual fund marketplace, and considered that many of the Funds’ shareholders invested in the Funds in part because of the Funds’ relationship with the Investment Adviser and that those shareholders have a general expectation that the relationship will continue.
Conclusion
In connection with their consideration of the Management Agreement, the Trustees gave weight to each of the factors described above, but did not identify any particular factor as controlling their decision. After deliberation and consideration of all of the information provided, including the factors described above, the Trustees concluded, in the exercise of their business judgment, that the management fees paid by each of the Funds were reasonable in light of the services provided to it by the Investment Adviser, the Investment Adviser’s costs and each Fund’s current and reasonably foreseeable asset levels. The Trustees unanimously concluded that the Investment Adviser’s continued management likely would benefit each Fund and its shareholders and that the Management Agreement should be approved and continued with respect to each Fund until June 30, 2018.
72
FUNDS PROFILE
Goldman Sachs Funds
Goldman Sachs is a premier financial services firm, known since 1869 for creating thoughtful and customized investment solutions in complex global markets.
Today, the Investment Management Division of Goldman Sachs serves a diverse set of clients worldwide, including private institutions, public entities and individuals. With approximately $1.25 trillion in assets under supervision as of September 30, 2017, Goldman Sachs Asset Management (“GSAM”) has portfolio management teams located around the world and our investment professionals bring firsthand knowledge of local markets to every investment decision. Assets under supervision includes assets under management and other client assets for which Goldman Sachs does not have full discretion. GSAM leverages the resources of Goldman Sachs & Co. LLC subject to legal, internal and regulatory restrictions.
Money Market
Financial Square FundsSM
| ∎ | | Financial Square Treasury Solutions Fund1 |
| ∎ | | Financial Square Government Fund1 |
| ∎ | | Financial Square Money Market Fund2 |
| ∎ | | Financial Square Prime Obligations Fund2 |
| ∎ | | Financial Square Treasury Instruments Fund1 |
| ∎ | | Financial Square Treasury Obligations Fund1 |
| ∎ | | Financial Square Federal Instruments Fund1 |
| ∎ | | Financial Square Tax-Exempt Money Market Fund2 |
Investor FundsSM
| ∎ | | Investor Money Market Fund3 |
| ∎ | | Investor Tax-Exempt Money Market Fund3 |
Fixed Income
Short Duration and Government
| ∎ | | High Quality Floating Rate Fund |
| ∎ | | Short-Term Conservative Income Fund |
| ∎ | | Short Duration Government Fund |
| ∎ | | Short Duration Income Fund |
| ∎ | | Inflation Protected Securities Fund |
Multi-Sector
Municipal and Tax-Free
| ∎ | | High Yield Municipal Fund |
| ∎ | | Dynamic Municipal Income Fund |
| ∎ | | Short Duration Tax-Free Fund |
Single Sector
| ∎ | | Investment Grade Credit Fund |
| ∎ | | High Yield Floating Rate Fund |
| ∎ | | Emerging Markets Debt Fund |
| ∎ | | Local Emerging Markets Debt Fund |
| ∎ | | Dynamic Emerging Markets Debt Fund |
Fixed Income Alternatives
| ∎ | | Long Short Credit Strategies Fund |
Fundamental Equity
| ∎ | | Small/Mid Cap Value Fund |
| ∎ | | Small/Mid Cap Growth Fund |
| ∎ | | Concentrated Growth Fund7 |
| ∎ | | Technology Opportunities Fund |
| ∎ | | Growth Opportunities Fund |
| ∎ | | Rising Dividend Growth Fund |
Tax-Advantaged Equity
| ∎ | | U.S. Tax-Managed Equity Fund |
| ∎ | | International Tax-Managed Equity Fund |
| ∎ | | U.S. Equity Dividend and Premium Fund |
| ∎ | | International Equity Dividend and Premium Fund |
Equity Insights
| ∎ | | Small Cap Equity Insights Fund |
| ∎ | | U.S. Equity Insights Fund |
| ∎ | | Small Cap Growth Insights Fund |
| ∎ | | Large Cap Growth Insights Fund |
| ∎ | | Large Cap Value Insights Fund |
| ∎ | | Small Cap Value Insights Fund |
| ∎ | | International Small Cap Insights Fund |
| ∎ | | International Equity Insights Fund |
| ∎ | | Emerging Markets Equity Insights Fund |
Fundamental Equity International
| ∎ | | Strategic International Equity Fund |
| ∎ | | Focused International Equity Fund |
| ∎ | | Emerging Markets Equity Fund |
Select Satellite
| ∎ | | Real Estate Securities Fund |
| ∎ | | International Real Estate Securities Fund |
| ∎ | | Commodity Strategy Fund |
| ∎ | | Global Real Estate Securities Fund |
| ∎ | | Alternative Premia Fund9 |
| ∎ | | Absolute Return Tracker Fund |
| ∎ | | Managed Futures Strategy Fund |
| ∎ | | MLP Energy Infrastructure Fund |
| ∎ | | Multi-Manager Alternatives Fund |
| ∎ | | Absolute Return Multi-Asset Fund |
| ∎ | | Global Infrastructure Fund |
Total Portfolio Solutions
| ∎ | | Global Managed Beta Fund |
| ∎ | | Multi-Manager Non-Core Fixed Income Fund |
| ∎ | | Multi-Manager U.S. Dynamic Equity Fund |
| ∎ | | Multi-Manager Global Equity Fund |
| ∎ | | Multi-Manager International Equity Fund |
| ∎ | | Tactical Tilt Overlay Fund |
| ∎ | | Balanced Strategy Portfolio |
| ∎ | | Multi-Manager U.S. Small Cap Equity Fund |
| ∎ | | Multi-Manager Real Assets Strategy Fund |
| ∎ | | Growth and Income Strategy Portfolio |
| ∎ | | Growth Strategy Portfolio |
| ∎ | | Equity Growth Strategy Portfolio |
| ∎ | | Satellite Strategies Portfolio |
| ∎ | | Enhanced Dividend Global Equity Portfolio |
| ∎ | | Tax-Advantaged Global Equity Portfolio |
| ∎ | | Strategic Factor Allocation Fund |
| ∎ | | Target Date 2020 Portfolio |
| ∎ | | Target Date 2025 Portfolio |
| ∎ | | Target Date 2030 Portfolio |
| ∎ | | Target Date 2035 Portfolio |
| ∎ | | Target Date 2040 Portfolio |
| ∎ | | Target Date 2045 Portfolio |
| ∎ | | Target Date 2050 Portfolio |
| ∎ | | Target Date 2055 Portfolio |
| ∎ | | GQG Partners International Opportunities Fund |
| 1 | | You could lose money by investing in the Fund. Although the Fund seeks to preserve the value of your investment at $1.00 per share, it cannot guarantee it will do so. An investment in the Fund is not a deposit of a bank and is not insured or guaranteed by the Federal Deposit Insurance Corporation or any other government agency. The Fund’s sponsor has no legal obligation to provide financial support to the Fund, and you should not expect that the sponsor will provide financial support to the Fund at any time. |
| 2 | | You could lose money by investing in the Fund. Because the share price of the Fund will fluctuate, when you sell your shares they may be worth more or less than what you originally paid for them. The Fund may impose a fee upon sale of your shares or may temporarily suspend your ability to sell shares if the Fund’s liquidity falls below required minimums because of market conditions or other factors. An investment in the Fund is not a deposit of a bank and is not insured or guaranteed by the Federal Deposit Insurance Corporation or any other government agency. The Fund’s sponsor has no legal obligation to provide financial support to the Fund, and you should not expect that the sponsor will provide financial support to the Fund at any time. |
| 3 | | You could lose money by investing in the Fund. Although the Fund seeks to preserve the value of your investment at $1.00 per share, it cannot guarantee it will do so. The Fund may impose a fee upon sale of your shares or may temporarily suspend your ability to sell shares if the Fund’s liquidity falls below required minimums because of market conditions or other factors. An investment in the Fund is not a deposit of a bank and is not insured or guaranteed by the Federal Deposit Insurance Corporation or any other government agency. The Fund’s sponsor has no legal obligation to provide financial support to the Fund, and you should not expect that the sponsor will provide financial support to the Fund at any time. |
| 4 | | Effective on June 20, 2017, the Goldman Sachs Fixed Income Macro Strategies Fund was renamed the Goldman Sachs Strategic Macro Fund. |
| 5 | | Effective on June 20, 2017, the Goldman Sachs Growth and Income Fund was renamed the Goldman Sachs Equity Income Fund. |
| 6 | | Effective after the close of business on August 31, 2017, the Goldman Sachs Flexible Cap Growth Fund was renamed the Goldman Sachs Flexible Cap Fund. |
| 7 | | Effective on July 28, 2017, the Goldman Sachs Focused Growth Fund was reorganized with and into the Goldman Sachs Concentrated Growth Fund. |
| 8 | | Effective after the close of business on October 31, 2017, the Goldman Sachs Dynamic U.S. Equity Fund was renamed the Goldman Sachs Blue Chip Fund. |
| 9 | | Effective after the close of business on October 30, 2017, the Goldman Sachs Dynamic Allocation Fund was renamed the Goldman Sachs Alternative Premia Fund. |
Financial Square FundsSM and Investor FundsSM are registered service marks of Goldman Sachs & Co. LLC.
| * | | This list covers open-end funds only. Please visit our website at www.GSAMFUNDS.com to learn about our closed-end funds and exchange-traded funds. |
| | |
TRUSTEES Ashok N. Bakhru, Chairman Kathryn A. Cassidy Diana M. Daniels Herbert J. Markley James A. McNamara Jessica Palmer Roy W. Templin Gregory G. Weaver | | OFFICERS James A. McNamara, President Scott M. McHugh, Treasurer, Senior Vice President and Principal Financial Officer Joseph F. DiMaria, Assistant Treasurer and Principal Accounting Officer Caroline L. Kraus, Secretary |
| |
GOLDMAN SACHS & CO. LLC Distributor and Transfer Agent | | GOLDMAN SACHS ASSET MANAGEMENT, L.P. Investment Adviser |
Visit our web site at www.GSAMFUNDS.com to obtain the most recent month-end returns.
Goldman Sachs Asset Management, L.P., 200 West Street, New York, New York 10282
The reports concerning the Funds included in this shareholder report may contain certain forward-looking statements about the factors that may affect the performance of the Funds in the future. These statements are based on Fund management’s predictions and expectations concerning certain future events and their expected impact on the Funds, such as performance of the economy as a whole and of specific industry sectors, changes in the levels of interest rates, the impact of developing world events, and other factors that may influence the future performance of the Funds. Management believes these forward-looking statements to be reasonable, although they are inherently uncertain and difficult to predict. Actual events may cause adjustments in portfolio management strategies from those currently expected to be employed.
A description of the policies and procedures that the Funds use to determine how to vote proxies relating to portfolio securities and information regarding how the Funds voted proxies relating to portfolio securities for the most recent 12-month period ended June 30 are available (I) without charge, upon request by calling 1-800-526-7384 (for Retail Shareholders) or 1-800-621-2550 (for Institutional Shareholders); and (II) on the Securities and Exchange Commission (‘‘SEC’’) web site at http://www.sec.gov.
The Funds file their complete schedule of portfolio holdings with the SEC for the first and third quarters of each fiscal year on Form N-Qs. The Funds’ Forms N-Qs are available on the SEC’s web site at http://www.sec.gov within 60 days after the Funds’ first and third fiscal quarters. The Funds’ Form N-Qs may be reviewed and copied at the SEC’s Public Reference Room in Washington, D.C., and information on the operation of the Public Reference Room may also be obtained by calling 1-800-SEC-0330. Forms N-Q may be obtained upon request and without charge by calling 1-800-526-7384 (for Retail Shareholders) or 1-800-621-2550 (for Institutional Shareholders).
Goldman Sachs & Co. LLC (“Goldman Sachs”) does not provide legal, tax or accounting advice. Any statement contained in this communication (including any attachments) concerning U.S. tax matters was not intended or written to be used, and cannot be used, for the purpose of avoiding penalties under the Internal Revenue Code, and was written to support the promotion or marketing of the transaction(s) or matter(s) addressed. Clients of Goldman Sachs should obtain their own independent tax advice based on their particular circumstances.
Economic and market forecasts presented herein reflect our judgment as of the date of this presentation and are subject to change without notice. These forecasts do not take into account the specific investment objectives, restrictions, tax and financial situation or other needs of any specific client. Actual data will vary and may not be reflected here. These forecasts are subject to high levels of uncertainty that may affect actual performance. Accordingly, these forecasts should be viewed as merely representative of a broad range of possible outcomes. These forecasts are estimated, based on assumptions, and are subject to significant revision and may change materially as economic and market conditions change. Goldman Sachs has no obligation to provide updates or changes to these forecasts. Case studies and examples are for illustrative purposes only.
Fund holdings and allocations shown are as of September 30, 2017 and may not be representative of future investments. Fund holdings should not be relied on in making investment decisions and should not be construed as research or investment advice regarding particular securities.
The portfolio risk management process includes an effort to monitor and manage risk, but does not imply low risk.
THIS MATERIAL IS FOR INFORMATIONAL PURPOSES ONLY AND IS PROVIDED SOLELY ON THE BASIS THAT IT WILL NOT CONSTITUTE INVESTMENT OR OTHER ADVICE OR A RECOMMENDATION RELATING TO ANY PERSON’S OR PLAN’S INVESTMENT OR OTHER DECISIONS, AND GOLDMAN SACHS IS NOT A FIDUCIARY OR ADVISOR WITH RESPECT TO ANY PERSON OR PLAN BY REASON OF PROVIDING THE MATERIAL OR CONTENT HEREIN INCLUDING UNDER THE EMPLOYEE RETIREMENT INCOME SECURITY ACT OF 1974 OR DEPARTMENT OF LABOR REGULATIONS. PLAN SPONSORS AND OTHER FIDUCIARIES SHOULD CONSIDER THEIR OWN CIRCUMSTANCES IN ASSESSING ANY POTENTIAL COURSE OF ACTION.
This material is not authorized for distribution to prospective investors unless preceded or accompanied by a current prospectus or summary prospectus, if applicable. Investors should consider a Fund’s objective, risks, and charges and expenses, and read the summary prospectus, if available, and/or the prospectus carefully before investing or sending money. The summary prospectus, if available, and the prospectus contain this and other information about a Fund and may be obtained from your authorized dealer or from Goldman Sachs & Co. LLC by calling (retail – 1-800-526-7384) (institutional – 1-800-621-2550).
© 2017 Goldman Sachs. All rights reserved. 110559-OTU-651501 FIALTSAR-17/1.6K
Goldman Sachs Funds

| | | | |
| | |
| Semi-Annual Report | | | | September 30, 2017 |
| | |
| | | | Multi Sector Fixed Income Funds |
| | | | Bond Fund |
| | | | Core Fixed Income |
| | | | Global Income |
| | | | Strategic Income |

Goldman Sachs Multi Sector Fixed Income Funds
| | | | |
| | | |
| NOT FDIC-INSURED | | May Lose Value | | No Bank Guarantee |
GOLDMAN SACHS MULTI SECTOR FIXED INCOME FUNDS
What Differentiates the Goldman Sachs Asset Management Fixed Income Investment Process?
At Goldman Sachs Asset Management, L.P. (“GSAM”), the goal of our fixed income investment process is to provide consistent, strong performance by actively managing our portfolios within a research-intensive, risk-managed framework.
A key element of our fixed income investment philosophy is to evaluate the broadest global opportunity set to capture relative value across sectors and instruments. Our globally integrated investment process involves managing dynamically along the risk/return spectrum, as we continue to develop value-added strategies through:

| ∎ | | Assess relative value among sectors (such as mortgage-backed and corporate debt securities) and sub-sectors |
| ∎ | | Leverage the vast resources of GSAM in selecting securities for each portfolio |

| ∎ | | Team approach to decision making |
| ∎ | | Manage risk by avoiding significant sector and interest rate bets |
| ∎ | | Careful management of yield curve strategies — while closely managing portfolio duration |

Fixed Income portfolios that:
| | ∎ | | Include domestic and global investment options, income opportunities, and access to areas of specialization | |
| | ∎ | | Capitalize on GSAM’s industry-renowned credit research capabilities | |
| | ∎ | | Use a risk-managed framework to seek total return, recognizing the importance of investors’ capital accumulation goals as well as their need for income | |
The portfolio risk management process includes an effort to monitor and manage risk, but does not imply low risk.
1
MARKET REVIEW
Goldman Sachs Multi Sector Fixed Income Funds
Market Review
During the six months ended September 30, 2017 (the “Reporting Period”), the performance of the global fixed income markets was primarily driven by geopolitical events, improving economic growth around the world and changing market expectations about central monetary policy.
When the Reporting Period began with the second quarter of 2017, spread, or non-government bond, sectors generally recorded positive returns, though with mixed results relative to U.S. Treasury securities. Political developments led to temporary bouts of volatility early in the quarter, driving weakness in Brazilian, U.S. and U.K. fixed income assets as well as a credit rating downgrade of South Africa’s sovereign debt. Political risks receded in May 2017 on the centrist candidate’s victory in the French presidential election, which was supportive of French and European peripheral bonds broadly. On the economic front, U.S. core inflation weakened for the third consecutive month in May 2017, casting uncertainty over the pace of Federal Reserve (“Fed”) monetary tightening. Nonetheless, comments included in minutes from the Fed’s May and June 2017 policy meetings suggested an announcement about how and when the Fed would begin reducing the size of its balance sheet would be made sooner than the markets had previously anticipated. In Europe, economic data continued to surprise the consensus to the upside. At its June 2017 policy meeting, the European Central Bank (“ECB”) provided an optimistic assessment of the risks to growth, but revised downward its medium-term inflation forecasts. The ECB, Bank of Japan (“BoJ”) and Bank of England (“BoE”) left their respective monetary policies unchanged during the second calendar quarter, while the Fed raised interest rates for the second time in 2017 and the fourth time in a decade at its June 2017 policy meeting. As the quarter came to an end, a string of comments from global central bankers triggered a hawkish market reaction. (Hawkish suggests higher interest rates; opposite of dovish.) Global interest rates rose as the market anticipated a faster than expected pace of monetary policy tightening by the BoE, ECB and Bank of Canada (“BoC”). During the second quarter of 2017, the U.S. dollar weakened versus many global currencies.
During the third quarter of 2017, spread sectors broadly advanced, outperforming U.S. Treasury securities. The Fed kept its monetary policy unchanged but unveiled its plans for balance sheet normalization. (Balance sheet normalization refers to the steps the Fed will take to reverse quantitative easing and remove the substantial monetary accommodation it has provided to the economy since the financial crisis began in 2007.) This prompted a hawkish market reaction, with the U.S. dollar appreciating and yields on U.S. government bonds rising. However, the U.S. Treasury yield curve, or spectrum of maturities, only steepened modestly due to geopolitical uncertainty and mixed U.S. economic data, including weak inflation readings. (A steepening yield curve is one wherein the differential in yields between longer-term and shorter-term maturities widens.) The central banks of other developed countries also set the stage for less accommodative monetary policy. The BoE noted “a majority” of its policymakers were in favor of tightening policy “over the coming months,” while the BoC surprised the markets with two consecutive rate hikes. The market’s expectations for a BoE rate hike in November 2017, along with a constructive tone for Brexit negotiations, also drove the British pound higher versus the U.S. dollar. (Brexit refers to the U.K.’s efforts to exit the European Union.) Overall, the U.S. dollar continued to weaken relative to many global currencies during the third calendar quarter.
For the Reporting Period as a whole, spread sectors outperformed U.S. Treasury securities, led by high yield corporate bonds, sovereign emerging markets debt and investment grade
2
MARKET REVIEW
corporate bonds. Commercial mortgage-backed securities, agency securities, asset-backed securities and mortgage-backed securities also outperformed U.S. Treasuries, albeit to a lesser extent. The U.S. Treasury yield curve flattened slightly during the Reporting Period, as yields on shorter-term maturities generally rose and yields on intermediate- and longer-term maturities fell. The yield on the bellwether 10-year U.S. Treasury declined approximately seven basis points (a basis point in 1/100th of one percent) to end the Reporting Period at 2.33%. (A flattening yield curve is one wherein the differential in yields between longer-term and shorter-term maturities narrows.)
Looking Ahead
At the end of the Reporting Period, we believed global economic growth remained strong, with broad-based expansion in all corners of the world. Business investment appeared to be improving, in our view, with the drag from commodity-oriented countries fading and global trade buoyant despite protectionist rhetoric following the 2016 U.S. elections. We also note that forward-looking activity indicators, including purchasing managers’ surveys, pointed to further momentum, particularly within developed markets.
Regarding the U.S., we believe economic growth is supported by a healthy labor market and robust consumption as well as by revived proposals for fiscal stimulus toward the end of the Reporting Period. In the Eurozone, economic growth surprised the consensus to the upside, driven by consumption and trade, though we expect some moderation in the near term due to the strength of the euro. In the longer term, we expect spillover effects from Brexit. However, during the Reporting Period, the supportive global economic growth environment boosted trade and appeared to be cushioning the impact of Brexit negotiations on both the U.K. and the European Union. In Japan, economic growth surprised the consensus to the upside and consumer sentiment remained healthy despite stagnant wage growth. As for China, we expect an ongoing focus on deleveraging but think there will be little tolerance if the country’s Gross Domestic Product drops below 6.4% given policymakers’ commitment to doubling incomes and growth from their 2010 levels by the year 2020.
The expansion in global economic growth during the Reporting Period had not yet been reflected in inflation data, which remained below central bank targets in key markets. In our opinion, low inflation has been due in part to structural trends, such as increased migration, lower productivity and lower inflation expectations. We expect inflation to gradually trend higher should labor markets tighten further and output gaps diminish. (The output gap is an economic measure of the difference between the actual output of an economy and its potential output.)
As for central bank policy, the job-rich recovery has resulted in a shift in tone. In our view, the Fed’s plans to normalize its balance sheet marks the beginning of an era of less monetary accommodation. Also, by the end of 2017, we expect the ECB to communicate its plans to reduce asset purchases through its quantitative easing program with tapered purchases likely to continue, we believe, through 2018. In the U.K., we see scope for a BoE rate hike in November 2017 given policymakers’ recent communications. Meanwhile, the BoC has commenced a rate hiking cycle, though we expect the trajectory for its future rate hikes to be shallower than in the U.S.
Overall, at the end of the Reporting Period, we believed the macro backdrop of solid economic growth, subdued inflation and contained volatility was supportive for riskier asset classes. We saw opportunities in high-yielding emerging market currencies versus the U.S. dollar. That
3
MARKET REVIEW
said, proposed U.S. tax reform could be inflationary and require more monetary tightening than currently expected. This would likely be supportive for the U.S. dollar, particularly if we see more hawkish leadership at the Fed.
Among spread sectors, we remained cautious about corporate bonds at the end of the Reporting Period, given that the U.S. is in the late stage of the credit cycle and because of extended valuations, in our view. When the Reporting Period concluded, corporate credit spreads (yield differentials versus duration-equivalent U.S. Treasury securities) were near historically tight levels. We think this makes corporate credit vulnerable to a sharp pickup in volatility, which could arise from several catalysts, including an unwinding of global central bank quantitative easing programs, an inflation surprise that leads to a more hawkish monetary policy outlook than the market had previously priced in, increasing geopolitical tensions and/or missteps by central bank policymakers, particularly in China. Overall, at the end of the Reporting Period, we continued to see value in Federal Family Education Loan Program (“FFELP”) student loan asset backed securities, which we believe offer attractive yields along with strong credit protection. We also had a positive view of collateralized loan obligations and residential mortgage-backed securities. Within residential mortgage-backed securities, we favored legacy non-agency mortgage backed securities (in general, those issued before the 2008-2009 financial crisis), which should continue to benefit, in our opinion, from low supply and improving collateral performance.
4
PORTFOLIO RESULTS
Goldman Sachs Bond Fund
Investment Objective
The Fund seeks a total return consisting of capital appreciation and income that exceeds the total return of the Bloomberg Barclays U.S. Aggregate Bond Index.
Portfolio Management Discussion and Analysis
Below, the Goldman Sachs U.S. Fixed Income Investment Management Team discusses the Goldman Sachs Bond Fund’s (the “Fund”) performance and positioning for the six-month period ended September 30, 2017 (the “Reporting Period”).
| Q | | How did the Fund perform during the Reporting Period? |
| A | | During the Reporting Period, the Fund’s Class A, C, Institutional, Service, Investor (formerly Class IR Shares), R and R6 Shares generated cumulative total returns, without sales charges, of 1.74%, 1.36%, 1.91%, 1.66%, 1.87%, 1.61% and 1.92%, respectively. These returns compare to the 2.31% cumulative total return of the Fund’s benchmark, the Bloomberg Barclays U.S. Aggregate Bond Index (the “Bloomberg Barclays Index”), during the same time period. |
| Q | | What key factors were responsible for the Fund’s performance during the Reporting Period? |
| A | | Tactical management of the Fund’s duration and yield curve positioning strategy detracted from relative performance during the Reporting Period. The duration strategy is primarily implemented via interest rate swaps and/or futures. Duration is a measure of the Fund’s sensitivity to changes in interest rates. Yield curve indicates the spectrum of maturities within a particular sector. |
| | Our country strategy also detracted from the Fund’s relative results. Long positions in Canadian and European rates versus short positions in U.S. rates drove underperformance most within the country strategy. The Bank of Canada surprised markets during the summer of 2017 with two interest rate hikes, lifting their benchmark rate to 1%, citing stronger than consensus expected economic data. European rates generally moved higher given positive economic growth data and widespread anticipation that the European Central Bank may reduce accommodation and taper its quantitative easing or raise rates sooner than originally expected by the markets. The Fund’s country strategy is primarily implemented via interest rate swaps and/or futures. |
| | Our top-down currency strategy contributed positively to the Fund’s relative results during the Reporting Period, with long positions in the Czech koruna, Polish zloty and Swedish krona boosting returns most. These gains were partially offset by a short position in the euro, which detracted. The currency strategy is primarily implemented via currency forwards. |
| | Overall, our cross-sector strategy also contributed positively to the Fund’s relative results during the Reporting Period. Our cross-sector strategy is one in which we invest Fund assets across a variety of fixed income sectors, including some that may not be included in the Fund’s benchmark. Bottom-up individual issue selection overall added value as well. |
| Q | | Which fixed income market sectors most significantly affected Fund performance? |
| A | | Implemented via our cross-sector strategy, the Fund’s allocations to non-agency residential mortgage-backed securities, collateralized loan obligations (“CLOs”) and asset-backed securities (“ABS”) contributed positively to relative results. Exposure to the government/swaps sector further added to relative returns during the Reporting Period. Only partially offsetting these positive contributors were underweights to the corporate credit and emerging markets debt sectors, which detracted, as these sectors outpaced the Bloomberg Barclays Index during the Reporting Period. An underweight to agency mortgage-backed securities further detracted from performance, as the sector benefited from demand from foreign investors and domestic commercial banks looking for yield. |
| | Within the government/swaps sector, tactical trades and individual issue selection of U.S. government debt contributed positively. The Fund’s government/swaps |
5
PORTFOLIO RESULTS
| | strategy is primarily implemented via interest rate swaps and/or futures. Corporate curve positioning and selection of high yield industrial names and investment grade financial names helped most within the corporate credit sector. Selection of ABS proved most beneficial within the securitized sector. Within emerging markets debt, short exposure to China through the ownership of credit protection detracted from performance, while selection of U.S. dollar-denominated bonds from Argentina and other Latin American issuers contributed positively. Selection of tax-exempt Puerto Rico municipal bonds detracted from relative returns within the municipal bond sector following Governor Ricardo’s initiation of the Commonwealth to enter a Title III restructuring. Market expectations of the negative economic impact from Hurricane Maria added to these bonds’ headwinds. (Title III is an in-court debt restructuring process akin to U.S. bankruptcy protection, since Puerto Rico is barred from using Chapter 9 of the U.S. federal bankruptcy code reserved for insolvent public entities. It should be noted that this action was taken on May 3, 2017, well before the devastation caused by Hurricane Maria.) |
| Q | | Did the Fund’s duration and yield curve positioning strategy help or hurt its results during the Reporting Period? |
| A | | Tactical management of the Fund’s duration and yield curve positioning detracted from its results during the Reporting Period, primarily driven by a short U.S. duration position relative to the Bloomberg Barclays Index. During the Reporting Period, U.S. Treasury yields pushed higher at the front, or short-term, end of the yield curve in response to interest rate hikes by the Federal Reserve (the “Fed”). However, the intermediate and long-term ends of the U.S. Treasury yield curve rallied, or moved lower, on political uncertainty, increased geopolitical risks and fewer positive economic surprises. In particular, soft inflation data throughout 2017 year-to-date weighed on market expectations for further interest rate hikes by the Fed. While we recognized recent weakness in inflation, we maintained the Fund’s underweight U.S. duration position given our expectations that global economic growth is likely to remain strong and that tightness in the labor market and easy financial conditions may warrant further monetary tightening in the U.S. We also expected inflation to rebound from recent weakness should wage growth begin to emerge. |
| Q | | How did the Fund use derivatives and similar instruments during the Reporting Period? |
| A | | As market conditions warranted during the Reporting Period, currency transactions were carried out using primarily over-the-counter (“OTC”) spot and forward foreign exchange contracts as well as by purchasing OTC options. Currency transactions were used as we sought both to enhance returns and to hedge the Fund’s portfolio against currency exchange rate fluctuations. Also, Treasury futures were used as warranted to facilitate specific duration, yield curve and country strategies; swaptions (or options on interest rate swap contracts) to express an outright term structure view and manage volatility (term structure, most often depicted as a yield curve, refers to the term structure of interest rates, which is the relationship between the yield to maturity and the time to maturity for pure discount bonds); credit default swaps to manage exposure to fluctuations in credit spreads (or the differential in yields between Treasury securities and non-Treasury securities with the same maturity but of different quality rating); and interest rate swaps to manage exposure to fluctuations in interest rates. The Fund also used forward sales contracts to help manage duration. |
| | | Overall, we employ derivatives and similar instruments for the efficient management of the Fund’s portfolio. Derivatives and similar instruments allow us to manage interest rate, credit and currency risks more effectively by allowing us both to hedge and to apply active investment views with greater versatility and to afford greater risk management precision than we would otherwise be able to implement. Derivatives are used in combination with cash securities1 to implement our views in the Fund. During the Reporting Period, positions in currency forwards and futures contributed positively to relative results, while positions in swaptions, credit default swaps and interest rate swaps detracted from performance. |
| | 1 | | Cash may include local currency, foreign currency, short-term investment funds, bank acceptances, commercial paper, margin, repurchase agreements, time deposits, variable-rate demand notes, and/or money market mutual funds. The Cash category may show a negative market value percentage as a result of a) the timing of trade date versus settlement date transactions and/or b) the portfolio’s derivative investments, which are collateralized by the portfolio’s available cash and securities. Such securities are AAA rated by an independent rating agency, have durations between -2 and 1 years, and are limited to the following sectors: governments, agencies, supranationals, corporates, and agency-backed adjustable-rate mortgages. |
6
PORTFOLIO RESULTS
| Q | | Were there any notable changes in the Fund’s weightings during the Reporting Period? |
| A | | There were no notable changes in the Fund’s weightings during the Reporting Period. We maintained the Fund’s modest exposure to corporate credit because we believe the U.S. is in the late stage of the credit cycle. Given that corporations overall are carrying significant leverage, we believe their bonds are more vulnerable to market shocks than other fixed income sectors. We further believe valuations seen during much of the Reporting Period within the sector did not compensate investors for these risks. We maintained the Fund’s underweight exposure to agency mortgage-backed securities on our view that valuations within the sector remained unattractive relative to other fixed income sectors. Additionally, the Fed announced it intends to begin to unwind its mortgage holdings, which could put pressure on the agency mortgage market, increasing volatility and pushing spreads, or yield differentials to U.S. Treasuries, higher. |
| | | We maintained the Fund’s overweight to emerging markets debt on a market value basis, but we maintained a small underweight to the sector in terms of risk, as measured by contribution to duration, through the purchase of protection on emerging market credit derivative indices. At the sector level, we were cautious on emerging market valuations but acknowledged the support for the sector from ongoing strength in global economic growth and in China, from a gradual pace of monetary tightening in developed markets and from a rise in commodity prices that has supported the terms of trade for emerging market countries. |
| Q | | How was the Fund positioned relative to its benchmark index at the end of September 2017? |
| A | | At the end of September 2017, the Fund had overweighted allocations relative to the Bloomberg Barclays Index on a market-value weighted basis in asset-backed securities and, to a lesser extent, in emerging markets debt. The Fund also had modest exposure to municipal bonds, which is a sector not represented in the Bloomberg Barclays Index. The Fund had underweighted exposure relative to the Bloomberg Barclays Index in U.S. government securities and, to a lesser extent, in residential mortgage-backed securities and commercial mortgage-backed securities. The Fund held rather neutral positions compared to the Bloomberg Barclays Index in quasi-government securities, investment grade corporate bonds, high yield corporate bonds and covered bonds. (Covered bonds are debt securities backed by cash flows from mortgage loans or public sector loans.) The Fund also maintained a position in cash at the end of the Reporting Period. The Fund had a shorter overall duration compared to that of the Bloomberg Barclays Index at the end of the Reporting Period. |
7
FUND BASICS
Bond Fund
as of September 30, 2017
| | | | | | | | | | | | | | | | | | |
| | PERFORMANCE REVIEW | |
| | | April 1, 2017– September 30, 2017 | | Fund Total Return
(based on NAV)1 | | | Bloomberg
Barclays
U.S. Aggregate
Bond Index2 | | | 30-Day
Standardized
Subsidized Yield3 | | | 30-Day
Standardized
Unsubsidized Yield3 | |
| | Class A | | | 1.74 | % | | | 2.31 | % | | | 1.60 | % | | | 1.49 | % |
| | Class C | | | 1.36 | | | | 2.31 | | | | 0.92 | | | | 0.81 | |
| | Institutional | | | 1.91 | | | | 2.31 | | | | 2.01 | | | | 1.89 | |
| | Service | | | 1.66 | | | | 2.31 | | | | 1.51 | | | | 1.39 | |
| | Investor | | | 1.87 | | | | 2.31 | | | | 1.92 | | | | 1.80 | |
| | Class R | | | 1.61 | | | | 2.31 | | | | 1.42 | | | | 1.30 | |
| | | Class R6 | | | 1.92 | | | | 2.31 | | | | 2.01 | | | | 1.90 | |
| | 1 | | The net asset value (“NAV”) represents the net assets of the class of the Fund (ex-dividend) divided by the total number of shares of the class outstanding. The Fund’s performance assumes the reinvestment of dividends and other distributions. The Fund’s performance does not reflect the deduction of any applicable sales charges. |
| | 2 | | The Bloomberg Barclays U.S. Aggregate Bond Index represents an unmanaged diversified portfolio of fixed income securities, including U.S. Treasuries, investment-grade corporate bonds, and mortgage-backed and asset-backed securities. The Index figure does not reflect any deduction for fees, expenses or taxes. It is not possible to invest directly in an index. |
| | 3 | | The method of calculation of the 30-Day Standardized Subsidized Yield is mandated by the Securities and Exchange Commission and is determined by dividing the net investment income per share earned during the last 30 days of the period by the maximum public offering price (“POP”) per share on the last day of the period. This number is then annualized. The 30-Day Standardized Subsidized Yield reflects fee waivers and/or expense reimbursements recorded by the Fund during the period. Without waivers and/or reimbursements, yields would be reduced. This yield does not necessarily reflect income actually earned and distributed by the Fund and, therefore, may not be correlated with the dividends or other distributions paid to shareholders. The 30-Day Standardized Unsubsidized Yield does not adjust for any fee waivers and/or expense reimbursements in effect. If the Fund does not incur any fee waivers and/or expense reimbursements during the period, the 30-Day Standardized Subsidized Yield and 30-Day Standardized Unsubsidized Yield will be identical. |
The returns set forth in the table above represent past performance. Past performance does not guarantee future results. The Fund’s investment return and principal value will fluctuate so that an investor’s shares, when redeemed, may be worth more or less than their original cost. Current performance may be lower or higher than the performance quoted above. Please visit our web site at www.GSAMFUNDS.com to obtain the most recent month-end returns. Performance reflects applicable fee waivers and/or expense limitations in effect during the periods shown. In their absence, performance would be reduced. Returns do not reflect the deduction of taxes that a shareholder would pay on Fund distributions or the redemption of Fund shares.
8
FUND BASICS
| | | | | | | | | | | | | | | | | | | | |
| | STANDARDIZED TOTAL RETURNS4 |
| | | For the period ended 9/30/17 | | One Year | | | Five Years | | | Ten Years | | | Since Inception | | | Inception Date |
| | Class A | | | -3.81 | % | | | 1.63 | % | | | 3.93 | % | | | 3.97 | % | | 11/30/06 |
| | Class C | | | -1.78 | | | | 1.67 | | | | 3.56 | | | | 3.57 | | | 11/30/06 |
| | Institutional | | | 0.30 | | | | 2.78 | | | | 4.69 | | | | 4.70 | | | 11/30/06 |
| | Service | | | -0.20 | | | | 2.27 | | | | 4.18 | | | | 4.43 | | | 6/20/07 |
| | Investor | | | 0.20 | | | | 2.67 | | | | N/A | | | | 4.44 | | | 11/30/07 |
| | Class R | | | -0.29 | | | | 2.16 | | | | N/A | | | | 3.94 | | | 11/30/07 |
| | | Class R6 | | | 0.32 | | | | N/A | | | | N/A | | | | 2.71 | | | 7/31/15 |
| | 4 | | The Standardized Total Returns are average annual or cumulative total returns (only if the performance period is one year or less) as of the most recent calendar quarter-end. They assume reinvestment of all distributions at NAV. These returns reflect a maximum initial sales charge of 3.75% for Class A Shares and the assumed contingent deferred sales charge for Class C Shares (1% if redeemed within 12 months of purchase). Prior to July 29, 2009, the maximum initial sales charge applicable to Class A Shares was 4.5%, which is not reflected in the average annual total return figures shown. Because Institutional, Service, Investor, Class R and Class R6 Shares do not involve a sales charge, such a charge is not applied to their Standardized Total Returns. |
The returns set forth in the table above represent past performance. Past performance does not guarantee future results. The Fund’s investment return and principal value will fluctuate so that an investor’s shares, when redeemed, may be worth more or less than their original cost. Current performance may be lower or higher than the performance quoted above. Please visit our web site at www.GSAMFUNDS.com to obtain the most recent month-end returns. Performance reflects applicable fee waivers and/or expense limitations in effect during the periods shown. In their absence, performance would be reduced. Returns do not reflect the deduction of taxes that a shareholder would pay on Fund distributions or the redemption of Fund shares.
| | | | | | | | | | |
| | EXPENSE RATIOS5 | |
| | | | | Net Expense Ratio (Current) | | | Gross Expense Ratio (Before Waivers) | |
| | Class A | | | 0.79 | % | | | 0.94 | % |
| | Class C | | | 1.54 | | | | 1.69 | |
| | Institutional | | | 0.45 | | | | 0.60 | |
| | Service | | | 0.95 | | | | 1.10 | |
| | Investor | | | 0.54 | | | | 0.69 | |
| | Class R | | | 1.04 | | | | 1.19 | |
| | | Class R6 | | | 0.44 | | | | 0.58 | |
| | 5 | | The expense ratios of the Fund, both current (net of applicable fee waivers and/or expense limitations) and before waivers (gross of applicable fee waivers and/or expense limitations) are as set forth above according to the most recent publicly available Prospectus for the Fund and may differ from the expense ratios disclosed in the Financial Highlights in this report. Pursuant to a contractual arrangement, the Fund’s waivers and/or expense limitations will remain in place through at least July 28, 2018, and prior to such date the Investment Adviser may not terminate the arrangements without the approval of the Fund’s Board of Trustees. If these arrangements are discontinued in the future, the expense ratios may change without shareholder approval. |
9
FUND BASICS
|
| SECTOR ALLOCATIONS6 |
| Percentage of Net Assets |
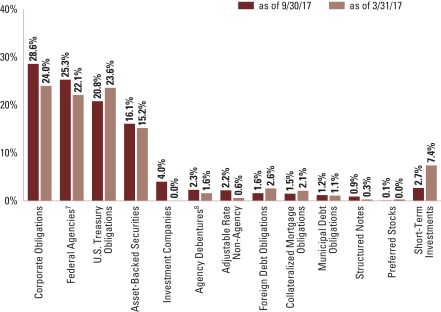
| | 6 | | The percentage shown for each investment category reflects the value of investments in that category as a percentage of net assets. Short-term investments represent certificates of deposits and commercial papers. Figures in the graph may not sum to 100% due to the exclusion of other assets and liabilities. The graph depicts the Fund’s investments but may not represent the Fund’s market exposure due to the exclusion of certain derivatives, if any, as listed in the Additional Investment Information section of the Schedule of Investments. |
| | 7 | | “Federal Agencies” are mortgage-backed securities guaranteed by the Government National Mortgage Association (“GNMA”), Federal National Mortgage Association (“FNMA”) and Federal Home Loan Mortgage Corp. (“FHLMC”). GNMA instruments are backed by the full faith and credit of the U.S. Government. |
| | 8 | | “Agency Debentures” include agency securities offered by companies such as FNMA and FHLMC, which operate under a government charter. While they are required to report to a government regulator, their assets are not explicitly guaranteed by the government and they otherwise operate like any other publicly traded company. |
10
PORTFOLIO RESULTS
Goldman Sachs Core Fixed Income Fund
Investment Objective
The Fund seeks a total return consisting of capital appreciation and income that exceeds the total return of the Bloomberg Barclays U.S. Aggregate Bond Index.
Portfolio Management Discussion and Analysis
Below, the Goldman Sachs U.S. Fixed Income Investment Management Team discusses the Goldman Sachs Core Fixed Income Fund’s (the “Fund”) performance and positioning for the six-month period ended September 30, 2017 (the “Reporting Period”).
| Q | | How did the Fund perform during the Reporting Period? |
| A | | During the Reporting Period, the Fund’s Class A, C, Institutional, Service, Investor (formerly Class IR Shares), R and R6 Shares generated cumulative total returns, without sales charges, of 2.08%, 1.59%, 2.15%, 1.89%, 2.20%, 1.85% and 2.25%, respectively. These returns compare to the 2.31% cumulative total return of the Fund’s benchmark, the Bloomberg Barclays U.S. Aggregate Bond Index (the “Bloomberg Barclays Index”), during the same period. |
| Q | | What key factors were responsible for the Fund’s performance during the Reporting Period? |
| A | | Our country strategy detracted from the Fund’s relative results. Long positions in Canadian and European rates versus short positions in U.S. rates drove underperformance most within the country strategy. The Bank of Canada surprised markets during the summer of 2017 with two interest rate hikes, lifting their benchmark rate to 1%, citing stronger than consensus expected economic data. European rates generally moved higher given positive economic growth data and widespread anticipation that the European Central Bank may reduce accommodation and taper its quantitative easing or raise rates sooner than originally expected by the markets. The Fund’s country strategy is primarily implemented via interest rate swaps and/or futures. |
| | | Our top-down currency strategy further detracted from the Fund’s relative results during the Reporting Period. Short positions in the euro and the British pound detracted most. These losses were partially offset by long positions in the Swedish krona and the Norwegian krone, which contributed positively. The currency strategy is primarily implemented via currency forwards. |
| | | Overall, our cross-sector strategy contributed positively to the Fund’s relative results during the Reporting Period. Our cross-sector strategy is one in which we invest Fund assets across a variety of fixed income sectors, including some that may not be included in the Fund’s benchmark. Bottom-up individual issue selection overall added value as well. |
| | | Tactical management of the Fund’s duration and yield curve positioning strategy had a rather neutral effect on relative performance during the Reporting Period. The duration strategy is primarily implemented via interest rate swaps and/or futures. Duration is a measure of the Fund’s sensitivity to changes in interest rates. Yield curve indicates the spectrum of maturities within a particular sector. |
| Q | | Which fixed income market sectors most significantly affected Fund performance? |
| A | | Implemented via our cross-sector strategy, the Fund’s allocations to collateralized loan obligations (“CLOs”) and asset-backed securities (“ABS”) contributed positively to relative results. Exposure to the government/swaps sector further added to relative returns during the Reporting Period. Only partially offsetting these positive contributors were underweights to the corporate credit and emerging markets debt sectors, which detracted, as these sectors outpaced the Bloomberg Barclays Index during the Reporting Period. An underweight to agency mortgage-backed securities further detracted from performance, as the sector benefited from demand from foreign investors and domestic commercial banks looking for yield. |
| | | Corporate curve positioning and selection of investment grade industrial and financial names helped most within the corporate credit sector. Within the government/swaps sector, tactical trades and individual issue selection of U.S. government and agency debt contributed positively. The Fund’s government/swaps strategy is primarily implemented via interest rate swaps and/or futures. |
| | | Selection of ABS proved most beneficial within the securitized sector. |
| Q | | Did the Fund’s duration and yield curve positioning strategy help or hurt its results during the Reporting Period? |
| A | | Tactical management of the Fund’s duration and yield curve positioning did not have a meaningful effect on relative results during the Reporting Period. The Fund maintained a |
11
PORTFOLIO RESULTS
| | short U.S. duration position relative to the Bloomberg Barclays Index throughout the Reporting Period. During the Reporting Period, U.S. Treasury yields pushed higher at the front, or short-term, end of the yield curve in response to interest rate hikes by the Federal Reserve (the “Fed”). However, the intermediate and long-term ends of the U.S. Treasury yield curve rallied, or moved lower, on political uncertainty, increased geopolitical risks and fewer positive economic surprises. In particular, soft inflation data throughout 2017 year-to-date weighed on market expectations for further interest rate hikes by the Fed. While we recognized recent weakness in inflation, we maintained the Fund’s underweight U.S. duration position given our expectations that global economic growth is likely to remain strong and that tightness in the labor market and easy financial conditions may warrant further monetary tightening in the U.S. We also expected inflation to rebound from recent weakness should wage growth begin to emerge. |
| Q | | How did the Fund use derivatives and similar instruments during the Reporting Period? |
| A | | As market conditions warranted during the Reporting Period, currency transactions were carried out using primarily over-the-counter (“OTC”) spot and forward foreign exchange contracts as well as by purchasing OTC options. Currency transactions were used as we sought both to enhance returns and to hedge the Fund’s portfolio against currency exchange rate fluctuations. Also, Treasury and international government bond futures, Eurodollar futures and other futures contracts were used as warranted to facilitate specific duration, yield curve and country strategies; swaptions (or options on interest rate swap contracts) to express an outright term structure view and manage volatility (term structure, most often depicted as a yield curve, refers to the term structure of interest rates, which is the relationship between the yield to maturity and the time to maturity for pure discount bonds); credit default swaps to manage exposure to fluctuations in credit spreads (or the differential in yields between Treasury securities and non-Treasury securities that are identical in all respects except for quality rating); and interest rate swaps to manage exposure to fluctuations in interest rates. The Fund also used forward sales contracts to help manage duration. |
| | | Overall, we employ derivatives and similar instruments for the efficient management of the Fund’s portfolio. Derivatives and similar instruments allow us to manage interest rate, credit and currency risks more effectively by allowing us both to hedge and to apply active investment views with greater versatility and to afford greater risk management precision than we would otherwise be able to implement. During the Reporting Period, positions in currency forwards and futures contributed positively to relative results, while positions in interest rate swaps detracted from performance. Positions in swaptions and credit default swaps had a rather neutral effect on performance during the Reporting Period. |
| Q | | Were there any notable changes in the Fund’s weightings during the Reporting Period? |
| A | | We moved the Fund to an underweight position relative to the Bloomberg Barclays Index in emerging markets debt. At the sector level, we were cautious on emerging market valuations but acknowledged the support for the sector from ongoing strength in global economic growth and in China, from a gradual pace of monetary tightening in developed markets and from a rise in commodity prices that has supported the terms of trade for emerging market countries. |
| | | There were no other notable changes to the Fund’s weightings during the Reporting Period. While increasing the Fund’s exposure to corporate credit somewhat, we maintained its modest exposure to corporate credit relative to the Bloomberg Barclays Index because we believe the U.S. is in the late stage of the credit cycle. Given that corporations overall are carrying significant leverage, we believe their bonds are more vulnerable to market shocks than other fixed income sectors. We further believe valuations seen during much of the Reporting Period within the sector did not compensate investors for these risks. We maintained the Fund’s underweight exposure to agency mortgage-backed securities on our view that valuations within the sector remained unattractive relative to other fixed income sectors. Additionally, the Fed announced it will begin to unwind its mortgage holdings, which could put pressure on the agency mortgage market, increasing volatility and pushing spreads, or yield differentials to U.S. Treasuries, higher. |
| Q | | How was the Fund positioned relative to its benchmark index at the end of September 2017? |
| A | | At the end of September 2017, the Fund had its most overweighted allocations relative to the Bloomberg Barclays Index on a market-value weighted basis in ABS and investment grade corporate bonds (with an emphasis on the industrials and financials industries). (While the Fund had an overweight allocation to investment grade corporate bonds on a market-value weighted basis, the Fund was underweight investment grade corporate credit in terms of risk, as measured by contribution to duration.) The Fund also had a modestly overweighted exposure at the end of the Reporting Period to quasi-government securities. The Fund had its most underweighted exposures relative to the Bloomberg Barclays Index in U.S. government securities and residential mortgage-backed securities. The Fund maintained rather neutral exposures relative to the Bloomberg Barclays Index to commercial mortgage-backed securities and emerging markets debt. The Fund had no exposure to high yield corporate bonds or covered bonds at the end of the Reporting Period. (Covered bonds are debt securities backed by cash flows from mortgage loans or public sector loans.) The Fund also maintained a modest position in cash at the end of the Reporting Period. The Fund had a modestly short duration overall compared to that of the Bloomberg Barclays Index at the end of the Reporting Period. |
12
FUND BASICS
Core Fixed Income Fund
as of September 30, 2017
| | | | | | | | | | | | | | | | | | |
| | PERFORMANCE REVIEW | |
| | | April 1, 2017– September 30, 2017 | | Fund Total Return
(based on NAV)1 | | | Bloomberg
Barclays
U.S. Aggregate
Bond Index2 | | | 30-Day
Standardized
Subsidized Yield3 | | | 30-Day
Standardized
Unsubsidized Yield3 | |
| | Class A | | | 2.08 | % | | | 2.31 | % | | | 1.35 | % | | | 1.30 | % |
| | Class C | | | 1.59 | | | | 2.31 | | | | 0.66 | | | | 0.61 | |
| | Institutional | | | 2.15 | | | | 2.31 | | | | 1.74 | | | | 1.69 | |
| | Service | | | 1.89 | | | | 2.31 | | | | 1.24 | | | | 1.19 | |
| | Investor | | | 2.20 | | | | 2.31 | | | | 1.65 | | | | 1.60 | |
| | Class R | | | 1.85 | | | | 2.31 | | | | 1.15 | | | | 1.10 | |
| | | Class R6 | | | 2.25 | | | | 2.31 | | | | 1.75 | | | | 1.70 | |
| | 1 | | The net asset value (“NAV”) represents the net assets of the class of the Fund (ex-dividend) divided by the total number of shares of the class outstanding. The Fund’s performance assumes the reinvestment of dividends and other distributions. The Fund’s performance does not reflect the deduction of any applicable sales charges. |
| | 2 | | The Bloomberg Barclays U.S. Aggregate Bond Index represents an unmanaged diversified portfolio of fixed income securities, including U.S. Treasuries, investment-grade corporate bonds and mortgage-backed and asset-backed securities. The Index figure does not reflect any deduction for fees, expenses or taxes. It is not possible to invest directly in an index. |
| | 3 | | The method of calculation of the 30-Day Standardized Subsidized Yield is mandated by the Securities and Exchange Commission and is determined by dividing the net investment income per share earned during the last 30 days of the period by the maximum public offering price (“POP”) per share on the last day of the period. This number is then annualized. The 30-Day Standardized Subsidized Yield reflects fee waivers and/or expense reimbursements recorded by the Fund during the period. Without waivers and/or reimbursements, yields would be reduced. This yield does not necessarily reflect income actually earned and distributed by the Fund and, therefore, may not be correlated with the dividends or other distributions paid to shareholders. The 30-Day Standardized Unsubsidized Yield does not adjust for any fee waivers and/or expense reimbursements in effect. If the Fund does not incur any fee waivers and/or expense reimbursements during the period, the 30-Day Standardized Subsidized Yield and 30-Day Standardized Unsubsidized Yield will be identical. |
The returns set forth in the table above represent past performance. Past performance does not guarantee future results. The Fund’s investment return and principal value will fluctuate so that an investor’s shares, when redeemed, may be worth more or less than their original cost. Current performance may be lower or higher than the performance quoted above. Please visit our web site at www.GSAMFUNDS.com to obtain the most recent month-end returns. Performance reflects applicable fee waivers and/or expense limitations in effect during the periods shown. In their absence, performance would be reduced. Returns do not reflect the deduction of taxes that a shareholder would pay on Fund distributions or the redemption of Fund shares.
13
FUND BASICS
| | | | | | | | | | | | | | | | | | | | |
| | STANDARDIZED TOTAL RETURNS4 |
| | | For the period ended 9/30/17 | | One Year | | | Five Years | | | Ten Years | | | Since Inception | | | Inception Date |
| | Class A | | | -3.63 | % | | | 1.17 | % | | | 3.12 | % | | | 4.52 | % | | 5/1/97 |
| | Class C | | | -1.59 | | | | 1.17 | | | | 2.74 | | | | 3.81 | | | 8/15/97 |
| | Institutional | | | 0.49 | | | | 2.30 | | | | 3.86 | | | | 5.22 | | | 1/5/94 |
| | Service | | | -0.10 | | | | 1.77 | | | | 3.34 | | | | 4.64 | | | 3/13/96 |
| | Investor | | | 0.40 | | | | 2.20 | | | | N/A | | | | 3.57 | | | 11/30/07 |
| | Class R | | | -0.11 | | | | 1.68 | | | | N/A | | | | 3.05 | | | 11/30/07 |
| | | Class R6 | | | 0.61 | | | | N/A | | | | N/A | | | | 2.77 | | | 7/31/15 |
| | 4 | | The Standardized Total Returns are average annual or cumulative total returns (only if the performance period is one year or less) as of the most recent calendar quarter-end . They assume reinvestment of all distributions at NAV. These returns reflect a maximum initial sales charge of 3.75% for Class A Shares and the assumed contingent deferred sales charge for Class C Shares (1% if redeemed within 12 months of purchase). Prior to July 29, 2009, the maximum initial sales charge applicable to Class A Shares was 4.5%, which is not reflected in the average annual total return figures shown. Because Institutional, Service, Investor, Class R and Class R6 Shares do not involve a sales charge, such a charge is not applied to their Standardized Total Returns. |
The returns set forth in the table above represent past performance. Past performance does not guarantee future results. The Fund’s investment return and principal value will fluctuate so that an investor’s shares, when redeemed, may be worth more or less than their original cost. Current performance may be lower or higher than the performance quoted above. Please visit our web site at www.GSAMFUNDS.com to obtain the most recent month-end returns. Performance reflects applicable fee waivers and/or expense limitations in effect during the periods shown. In their absence, performance would be reduced. Returns do not reflect the deduction of taxes that a shareholder would pay on Fund distributions or the redemption of Fund shares.
| | | | | | | | | | |
| | EXPENSE RATIOS5 | |
| | | | | Net Expense Ratio (Current) | | | Gross Expense Ratio (Before Waivers) | |
| | Class A | | | 0.80 | % | | | 0.85 | % |
| | Class C | | | 1.55 | | | | 1.60 | |
| | Institutional | | | 0.45 | | | | 0.51 | |
| | Service | | | 0.95 | | | | 1.01 | |
| | Investor | | | 0.54 | | | | 0.60 | |
| | Class R | | | 1.04 | | | | 1.11 | |
| | | Class R6 | | | 0.44 | | | | 0.50 | |
| | 5 | | The expense ratios of the Fund, both current (net of applicable fee waivers and/or expense limitations) and before waivers (gross of applicable fee waivers and/or expense limitations) are as set forth above according to the most recent publicly available Prospectus for the Fund and may differ from the expense ratios disclosed in the Financial Highlights in this report. Pursuant to a contractual arrangement, the Fund’s waivers and/or expense limitations will remain in place through at least July 28, 2018, and prior to such date the Investment Adviser may not terminate the arrangements without the approval of the Fund’s Board of Trustees. If these arrangements are discontinued in the future, the expense ratios may change without shareholder approval. |
14
FUND BASICS
|
| SECTOR ALLOCATIONS6 |
| Percentage of Net Assets |
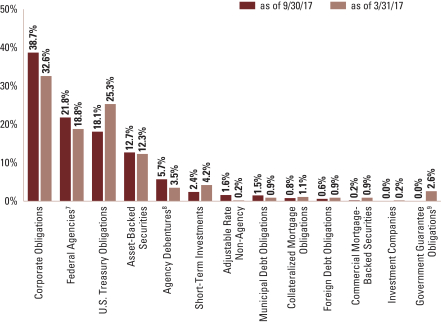
| | 6 | | The percentage shown for each investment category reflects the value of investments in that category as a percentage of net assets. Short-term investments represent certificates of deposits and commercial papers. Figures in the graph may not sum to 100% due to the exclusion of other assets and liabilities. The graph depicts the Fund’s investments but may not represent the Fund’s market exposure due to the exclusion of certain derivatives, if any, as listed in the Additional Investment Information section of the Schedule of Investments. |
| | 7 | | “Federal Agencies” are mortgage-backed securities guaranteed by the Government National Mortgage Association (“GNMA”), Federal National Mortgage Association (“FNMA”) and Federal Home Loan Mortgage Corp. (“FHLMC”). GNMA instruments are backed by the full faith and credit of the U.S. Government. |
| | 8 | | “Agency Debentures” include agency securities offered by companies such as FNMA and FHLMC, which operate under a government charter. While they are required to report to a government regulator, their assets are not explicitly guaranteed by the government and they otherwise operate like any other publicly traded company. |
| | 9 | | “Government Guarantee Obligations” are guaranteed by a foreign government guarantee program and are backed by the full faith and credit of the United States or the government of a foreign country. |
15
PORTFOLIO RESULTS
Goldman Sachs Global Income Fund
Investment Objective
The Fund seeks a high total return, emphasizing current income, and, to a lesser extent, providing opportunities for capital appreciation.
Portfolio Management Discussion and Analysis
Below, the Goldman Sachs Global Fixed Income Investment Management Team discusses the Goldman Sachs Global Income Fund’s (the “Fund”) performance and positioning for the six-month period ended September 30, 2017 (the “Reporting Period”).
| Q | | How did the Fund perform during the Reporting Period? |
| A | | During the Reporting Period, the Fund’s Class A, C, Institutional, Service, Investor (formerly Class IR Shares) and R6 Shares generated cumulative total returns, without sales charges, of 1.17%, 0.81%, 1.34%, 1.09%, 1.29% and 1.34%, respectively. These returns compare to the 1.77% cumulative total return of the Fund’s benchmark, the Bloomberg Barclays Global Aggregate Bond (Gross, USD, Hedged) Index (the “Bloomberg Barclays Index”), during the same time period. |
| Q | | What key factors were responsible for the Fund’s performance during the Reporting Period? |
| A | | The Fund’s cross-sector strategy detracted from relative results during the Reporting Period. The cross-sector strategy is primarily implemented via cash bonds and index/ single-name credit default swaps. Our cross-sector strategy is one in which we invest Fund assets across a variety of fixed income sectors, including some that may not be included in the Bloomberg Barclays Index. |
| | | Another detractor from the Fund’s performance was our country strategy, attributable primarily to the Fund’s long position in Canadian rates versus short position in U.S. rates. We thought the Bank of Canada would raise its interest rates at a slower pace than the Federal Reserve (the “Fed”). However, early in September 2017, the Bank of Canada hiked its interest rates, causing the Fund’s relative value trade to prove a detractor. The Fund’s long position in Australian rates versus short position in U.S. rates also disappointed during the Reporting Period, particularly in June and August 2017. These detractors were partially offset by the Fund’s European and U.K. curve positions, which contributed positively. The country strategy is primarily implemented via interest rate swaps and/or futures. |
| | | Our duration strategy dampened relative results as well. The duration strategy is primarily implemented via interest rate swaps and/or futures. Duration is a measure of the Fund’s sensitivity to changes in interest rates. |
| | | Bottom-up individual issue selection generated mixed results. Our emerging markets debt selection strategy detracted, while our government/swaps selection strategy and corporate selection strategy contributed positively. The emerging markets debt selection strategy implements directional, relative value and idiosyncratic trade ideas in local and external emerging market rates and corporate bonds. The government/swaps selection strategy identifies local relative value anomalies and opportunities within government bond markets. The corporate selection strategy is primarily implemented via cash rate bonds and credit default swaps (mainly index swaps). Individual issue selection strategies reflect any active views we take on a particular sector. |
| | | Contributing positively to the Fund’s performance was our currency strategy. Overweights relative to the Bloomberg Barclays Index in the Czech koruna and Polish zloty versus the euro added the most value. This trade expressed the confidence we had in the improved health of the Eurozone. Due to ongoing quantitative easing by the European Central Bank, we wished to express this view through currencies such as the Czech koruna and Polish zloty both because of their trade linkages to the Eurozone’s economic growth and because of what we viewed as their supportive balance of payments. The Fund’s currency strategy primarily implements relative value positions in developed and emerging market currencies, using valuation relative to short- and medium-term fundamentals. |
16
PORTFOLIO RESULTS
| Q | | Which fixed income market sectors most significantly affected Fund performance? |
| A | | Our cross-sector strategy detracted due primarily to the Fund’s underweight positions in investment grade corporate bonds and emerging markets debt, as each of these sectors outperformed the Bloomberg Barclays Index during the Reporting Period as a whole and particularly in September 2017. Within our emerging markets debt selection strategy, which detracted, the Fund’s overweight exposure to external debt in China hurt most. |
| | | Our government/swaps selection strategy contributed positively to relative performance, with several trades boosting results. These included the Fund’s U.K. curve steepener trade, which was held throughout the Reporting Period. The Fund’s exposure to U.K. inflation-linked medium-dated swaps also contributed positively to performance, a position we closed at the beginning of August 2017. (A steepening yield curve is one in which the differential between yields on shorter-term maturities and longer-term maturities widens.) |
| | | Within our corporate selection strategy, selection amongst investment grade financials issuers, such as UniCredit, Santander and BNP Paribas, proved particularly beneficial. Our selection amongst investment grade utilities issuers, such as Exelon and EDP Energy, also added notable value. |
| Q | | Did the Fund’s duration and yield curve positioning strategy help or hurt its results during the Reporting Period? |
| A | | The Fund’s duration positioning detracted from its results during the Reporting Period. The Fund’s duration strategy is actively managed and constantly monitored in an effort to generate greater performance and reduced risk through volatile markets. We tactically adjusted the Fund’s duration position throughout the Reporting Period as market conditions shifted. That said, we maintained a short U.S. duration position relative to the Bloomberg Barclays Index throughout the Reporting Period. Despite three interest rate increases by the Fed in 2017 year-to-date, good economic growth but low inflation in the U.S. led to rallying intermediate- and long-term U.S. Treasury rates, thus causing the Fund’s duration positioning to detract. |
| | | We remained neutral to European rates during the Reporting Period and toward the end of the Reporting Period introduced a modest short Japanese rate position. |
| Q | | How did the Fund use derivatives and similar instruments during the Reporting Period? |
| A | | We used derivatives and similar instruments for the efficient management of the Fund. These derivatives and similar instruments allowed us to manage interest rate, credit and currency risks more effectively by allowing us both to hedge and to apply active investment views with greater versatility and to afford greater risk management precision than we would otherwise be able to implement. Derivatives are used in combination with cash securities1 to implement our views in the Fund. |
| | | During the Reporting Period, we used interest rate and bond exchange traded futures contracts to implement duration and country strategies within the Fund, especially in the U.S., Eurozone, U.K. and Japanese markets. Currency transactions were carried out using primarily over-the-counter (“OTC”) spot and forward foreign exchange contracts as well as by purchasing OTC options. Currency transactions were used as we sought both to enhance returns and to hedge the Fund’s portfolio against currency exchange rate fluctuations. Interest rate and credit default swaps were also used as cost-efficient instruments to help grant us greater precision and versatility in the management of active strategies. Forward sales contracts were used to implement currency transactions based on our active views and for hedging purposes. Written option contracts were used to implement active views within our top-down and bottom-up selection strategies and for hedging purposes. While the use of derivatives generated mixed results during the Reporting Period, as described earlier, overall, they had a negative impact on the Fund’s results. |
| Q | | Were there any notable changes in the Fund’s weightings during the Reporting Period? |
| A | | As mentioned earlier, we tactically adjusted the Fund’s U.S. duration position during the Reporting Period as market conditions and central bank policy shifted. We also introduced a small short Japanese interest rate position in late September 2017. |
| | 1 | | Cash may include local currency, foreign currency, short-term investment funds, bank acceptances, commercial paper, margin, repurchase agreements, time deposits, variable-rate demand notes, and/or money market mutual funds. The Cash category may show a negative market value percentage as a result of a) the timing of trade date versus settlement date transactions and/or b) the portfolio’s derivative investments, which are collateralized by the portfolio’s available cash and securities. Such securities are AAA rated by an independent rating agency, have durations between -2 and 1 years, and are limited to the following sectors: governments, agencies, supranationals, corporates, and agency-backed adjustable-rate mortgages. |
17
PORTFOLIO RESULTS
| | | From a sector perspective, on a market-value weighted basis, we reduced the Fund’s underweight to investment grade corporate bonds during the second calendar quarter and then increased the underweight during the third calendar quarter. Also, during the Reporting Period, we reduced the Fund’s underweight to emerging markets debt. In our view, emerging markets have been supported by a reduced likelihood of protectionist U.S. policies and by continued strength of countries such as Indonesia, Mexico and China. |
| | | From a country perspective, on a market-value weighted basis, we increased the Fund’s exposure relative to the Bloomberg Barclays Index to the U.S. and decreased its relative weightings in Japan, Sweden and the Eurozone overall. Within the Eurozone, we increased relative exposure to Germany and decreased relative exposures to France, Spain and Italy. |
| Q | | Were there any changes to the Fund’s portfolio management team during the Reporting Period? |
| A | | During the Reporting Period, we implemented the following change in an effort to improve the coordination amongst our interest rate management strategies, including cross-macro. Gilberto Marcheggiano, Vice President, assumed responsibility of the cross-macro team from Jonathan Bayliss. Gilberto has 11 years of industry experience. Gilberto reports to Jonathan Bayliss, head of macro rates. Macro rates includes the duration, country and cross-macro strategies. |
| Q | | How was the Fund positioned relative to its benchmark index at the end of September 2017? |
| A | | At the end of September 2017, on a market-value weighted basis, the Fund had overweighted allocations relative to the Bloomberg Barclays Index in asset-backed securities and, to a much lesser degree, in quasi-government securities and residential mortgage-backed securities. The Fund had underweighted exposures relative to the Bloomberg Barclays Index in government securities, and, to lesser degrees, in investment grade corporate bonds, emerging markets debt and covered bonds. (Covered bonds are debt securities backed by cash flows from mortgage loans or public sector loans.) The Fund had a rather neutrally weighted position relative to the Bloomberg Barclays Index in commercial mortgage-backed securities and had no position in high yield corporate bonds at the end of the Reporting Period. The Fund also maintained a position in cash at the end of the Reporting Period. |
| | | From a country perspective, on a market-value weighted basis, the Fund was overweight relative to the Bloomberg Barclays Index in the U.S. and Japan. The Fund was underweight compared to the Bloomberg Barclays Index in the U.K., Australia and the emerging markets and the Eurozone overall. Within the Eurozone, the Fund was overweight Germany, underweight France and Italy and rather neutral to the remaining markets at the end of the Reporting Period. Within the emerging markets, the Fund was most underweight the Asian emerging markets. The Fund was relatively neutrally weighted at the end of the Reporting Period to Canada, Denmark, Norway and Sweden. The Fund had a shorter duration than the Bloomberg Barclays Index at the end of the Reporting Period. |
18
FUND BASICS
Global Income Fund
as of September 30, 2017
| | | | | | | | | | | | | | | | | | |
| | PERFORMANCE REVIEW | |
| | | April 1, 2017– September 30, 2017 | | Fund Total Return
(based on NAV)1 | | | Bloomberg Barclays
Global Aggregate
Bond (Gross, USD,
Hedged) Index2 | | | 30-Day
Standardized
Subsidized Yield3 | | | 30-Day
Standardized
Unsubsidized Yield3 | |
| | Class A | | | 1.17 | % | | | 1.77 | % | | | 0.34 | % | | | 0.19 | % |
| | Class C | | | 0.81 | | | | 1.77 | | | | -0.22 | | | | -0.54 | |
| | Institutional | | | 1.34 | | | | 1.77 | | | | 0.65 | | | | 0.54 | |
| | Service | | | 1.09 | | | | 1.77 | | | | 0.23 | | | | 0.04 | |
| | Investor | | | 1.29 | | | | 1.77 | | | | 0.57 | | | | 0.45 | |
| | | Class R6 | | | 1.34 | | | | 1.77 | | | | 0.66 | | | | 0.55 | |
| | 1 | | The net asset value (“NAV”) represents the net assets of the class of the Fund (ex-dividend) divided by the total number of shares of the class outstanding. The Fund’s performance reflects the reinvestment of dividends and other distributions. The Fund’s performance does not reflect the deduction of any applicable sales charges. |
| | 2 | | The Bloomberg Barclays Global Aggregate Bond (Gross, USD, Hedged) Index, an unmanaged index, provides a broad based measure of the global investment-grade fixed-rate debt markets and covers the most liquid portion of the global investment grade fixed-rate bond market, including government, credit and collateralized securities. The Index figures do not include any deduction for fees, expenses or taxes. It is not possible to invest directly in an index. |
| | 3 | | The method of calculation of the 30-Day Standardized Subsidized Yield is mandated by the Securities and Exchange Commission and is determined by dividing the net investment income per share earned during the last 30 days of the period by the maximum public offering price (“POP”) per share on the last day of the period. This number is then annualized. The 30-Day Standardized Subsidized Yield reflects fee waivers and/or expense reimbursements recorded by the Fund during the period. Without waivers and/or reimbursements, yields would be reduced. This yield does not necessarily reflect income actually earned and distributed by the Fund and, therefore, may not be correlated with the dividends or other distributions paid to shareholders. The 30-Day Standardized Unsubsidized Yield does not adjust for any fee waivers and/or expense reimbursements in effect. If the Fund does not incur any fee waivers and/or expense reimbursements during the period, the 30-Day Standardized Subsidized Yield and 30-Day Standardized Unsubsidized Yield will be identical. |
The returns set forth in the table above represent past performance. Past performance does not guarantee future results. The Fund’s investment return and principal value will fluctuate so that an investor’s shares, when redeemed, may be worth more or less than their original cost. Current performance may be lower or higher than the performance quoted above. Please visit our web site at www.GSAMFUNDS.com to obtain the most recent month-end returns. Performance reflects applicable fee waivers and/or expense limitations in effect during the periods shown. In their absence, performance would be reduced. Returns do not reflect the deduction of taxes that a shareholder would pay on Fund distributions or the redemption of Fund shares.
19
FUND BASICS
| | | | | | | | | | | | | | | | | | | | |
| | STANDARDIZED TOTAL RETURNS4 |
| | | For the period ended 9/30/17 | | One Year | | | Five Years | | | Ten Years | | | Since Inception | | | Inception Date |
| | Class A | | | -4.24 | % | | | 1.89 | % | | | 3.59 | % | | | 5.10 | % | | 8/2/91 |
| | Class C | | | -2.20 | | | | 1.91 | | | | 3.21 | | | | 3.74 | | | 8/15/97 |
| | Institutional | | | -0.16 | | | | 3.02 | | | | 4.34 | | | | 5.48 | | | 8/1/95 |
| | Service | | | -0.74 | | | | 2.43 | | | | 3.77 | | | | 4.42 | | | 3/12/97 |
| | Investor | | | -0.25 | | | | 2.91 | | | | N/A | | | | 3.41 | | | 7/30/10 |
| | | Class R6 | | | -0.14 | | | | N/A | | | | N/A | | | | 2.66 | | | 7/31/15 |
| | 4 | | The Standardized Total Returns are average annual or cumulative total returns (only if the performance period is one year or less) as of the most recent calendar quarter-end. They assume reinvestment of all distributions at NAV. These returns reflect a maximum initial sales charge of 3.75% for Class A Shares and the assumed contingent deferred sales charge for Class C Shares (1% if redeemed within 12 months of purchase). Prior to July 29, 2009, the maximum initial sales charge applicable to Class A Shares was 4.5%, which is not reflected in the average annual total return figures shown. Because Institutional, Service, Investor and Class R6 Shares do not involve a sales charge, such a charge is not applied to their Standardized Total Returns. |
The returns set forth in the table above represent past performance. Past performance does not guarantee future results. The Fund’s investment return and principal value will fluctuate so that an investor’s shares, when redeemed, may be worth more or less than their original cost. Current performance may be lower or higher than the performance quoted above. Please visit our web site at www.GSAMFUNDS.com to obtain the most recent month-end returns. Performance reflects applicable fee waivers and/or expense limitations in effect during the periods shown. In their absence, performance would be reduced. Returns do not reflect the deduction of taxes that a shareholder would pay on Fund distributions or the redemption of Fund shares.
| | | | | | | | | | |
| | EXPENSE RATIOS5 | |
| | | | | Net Expense Ratio (Current) | | | Gross Expense Ratio (Before Waivers) | |
| | Class A | | | 1.03 | % | | | 1.13 | % |
| | Class C | | | 1.79 | | | | 1.88 | |
| | Institutional | | | 0.69 | | | | 0.79 | |
| | Service | | | 1.19 | | | | 1.29 | |
| | Investor | | | 0.78 | | | | 0.88 | |
| | | Class R6 | | | 0.68 | | | | 0.77 | |
| | 5 | | The expense ratios of the Fund, both current (net of applicable fee waivers and/or expense limitations) and before waivers (gross of applicable fee waivers and/or expense limitations) are as set forth above according to the most recent publicly available Prospectus for the Fund and may differ from the expense ratios disclosed in the Financial Highlights in this report. Pursuant to a contractual arrangement, the Fund’s waivers and/or expense limitations will remain in place through at least July 28, 2018, and prior to such date the Investment Adviser may not terminate the arrangements without the approval of the Fund’s Board of Trustees. If these arrangements are discontinued in the future, the expense ratios may change without shareholder approval. |
20
FUND BASICS
| | | | | | | | | | |
| | CURRENCY ALLOCATION6 | |
| | | | | Percentage of Net Assets | |
| | | | | as of 9/30/17 | | | as of 3/31/17 | |
| | U.S. Dollar | | | 54.2 | % | | | 51.4 | % |
| | Japanese Yen | | | 19.2 | | | | 22.6 | |
| | Euro | | | 14.4 | | | | 19.8 | |
| | British Pound | | | 3.1 | | | | 3.5 | |
| | Canadian Dollar | | | 2.1 | | | | 1.9 | |
| | South African Rand | | | 0.7 | | | | 0.6 | |
| | Thai Baht | | | 0.5 | | | | 0.0 | |
| | South Korean Won | | | 0.4 | | | | 0.4 | |
| | Swedish Krona | | | 0.4 | | | | 0.3 | |
| | Mexican Peso | | | 0.4 | | | | 0.2 | |
| | Australian Dollar | | | 0.3 | | | | 0.3 | |
| | Danish Krone | | | 0.1 | | | | 0.1 | |
| | Czech Koruna | | | 0.1 | | | | 0.1 | |
| | | Russian Ruble | | | 0.1 | | | | 0.0 | |
| | 6 | | The percentage shown for each currency reflects the value of investments in that category as a percentage of net assets. Figures in the table may not sum to 100% due to the exclusion of other assets and liabilities. The table depicts the Fund’s investments but may not represent the Fund’s market exposure due to the exclusion of certain derivatives, if any, as listed in the Additional Investment Information section of the Schedule of Investments. |
21
PORTFOLIO RESULTS
Goldman Sachs Strategic Income Fund
Investment Objective
The Fund seeks total return comprised of income and capital appreciation.
Portfolio Management Discussion and Analysis
Below, the Goldman Sachs U.S. Fixed Income Investment Management Team discusses the Goldman Sachs Strategic Income Fund’s (the “Fund”) performance and positioning for the six-month period ended September 30, 2017 (the “Reporting Period”).
| Q | | How did the Fund perform during the Reporting Period? |
| A | | During the Reporting Period, the Fund’s Class A, C, Institutional, Investor (formerly Class IR Shares), R and R6 Shares generated cumulative total returns, without sales charges, of -0.42%, -0.88%, -0.25%, -0.29%, -0.64% and -0.24%, respectively. These returns compare to the 0.59% cumulative total return of the Fund’s benchmark, the Bank of America Merrill Lynch U.S. Dollar Three-Month LIBOR Constant Maturity Index (the “LIBOR Index”), during the same period. |
| | | We note that the Fund’s benchmark being the LIBOR Index is a means of emphasizing that the Fund has an unconstrained strategy. That said, this Fund employs a benchmark agnostic strategy and thus comparisons to a benchmark index are not particularly relevant. |
| Q | | What key factors were responsible for the Fund’s performance during the Reporting Period? |
| A | | Within our top-down strategies, our country strategy, wherein we trade based on our analysis of relative value rates across global interest rate markets, detracted most from the Fund’s performance during the Reporting Period. One of the primary trades undertaken in this strategy during the Reporting Period was its long Canadian rates versus short U.S. rates position. This trade detracted from results, as there was an abrupt shift to more hawkish rhetoric from the Bank of Canada and a subsequent interest rate hike, which, in turn, led to a sell-off in Canadian rates. (Hawkish rhetoric tends to suggest higher interest rates; opposite of dovish.) |
| | | The Fund’s duration strategy detracted from its performance, however, yield curve positioning added value. Duration is a measure of the Fund’s sensitivity to changes in interest rates. Yield curve indicates the spectrum of maturities within a particular sector. |
| | | Conversely, our currency strategy was the best performing top-down strategy during the Reporting Period. Long positions in the Polish zloty, Swedish krona and Czech koruna versus the euro proved especially beneficial. We viewed these currencies as proxies for improving European economic growth, which came to fruition on the back of improving economic data coming from the region. |
| | | Individual issue selection produced mixed results. These strategies reflect any active views we take on particular sectors. |
| Q | | Which fixed income market sectors most significantly affected Fund performance? |
| A | | Individual issue selection within the municipal bond sector detracted from the Fund’s results during the Reporting Period. The Fund held various positions within tax-exempt Puerto Rico municipal bonds. These bonds performed poorly following Governor Ricardo’s initiation of the Commonwealth to enter a Title III restructuring. Market expectations of the negative economic impact from Hurricane Maria added to these bonds’ headwinds. (Title III is an in-court debt restructuring process akin to U.S. bankruptcy protection, since Puerto Rico is barred from using Chapter 9 of the U.S. federal bankruptcy code reserved for insolvent public entities. It should be noted that this action was taken on May 3, 2017, well before the devastation caused by Hurricane Maria.) |
| | | Issue selection within the emerging markets debt sector also dampened the Fund’s results during the Reporting Period. The Fund held a short position in emerging markets debt through the use of credit default swap indices. As emerging markets debt performed well during the Reporting Period, outpacing the broad fixed income market, as measured by the Bloomberg Barclays Aggregate Bond Index, this positioning hurt the Fund’s performance. (A credit default swap index is |
22
PORTFOLIO RESULTS
| | a credit derivative used to hedge credit risk or to take a position on a basket of credit entities. Unlike a credit default swap, which is an over the counter credit derivative, a credit default swap index is a completely standardized credit security and may therefore be more liquid.) |
| | | Conversely, issue selection within the securitized sector added value during the Reporting Period. Most of the performance derived from the Fund’s positions in non-agency mortgage-backed securities and senior Federal Family Education Loan Program (“FFELP”) asset-backed securities. We believe FFELP asset-backed securities are among the most compelling investments in the securitized sector, as they are secured by loans that are at least 97% guaranteed by the U.S. Department of Education and benefit from additional credit enhancement. During the Reporting Period, the securitized sector broadly and these securities in particular experienced spread tightening, or a narrowing of the yield differential to U.S. Treasuries, which helped drive their strong performance. |
| Q | | Did the Fund’s duration and yield curve positioning strategy help or hurt its results during the Reporting Period? |
| A | | The Fund’s tactical duration positioning detracted modestly from results during the Reporting Period. While we tactically adjusted the Fund’s duration position as market conditions shifted throughout, we kept a short U.S. interest rate position in the Fund during the Reporting Period. During the Reporting Period, U.S. Treasury yields pushed higher at the front, or short-term, end of the yield curve in response to interest rate hikes by the Federal Reserve (the “Fed”). However, the intermediate and long-term ends of the U.S. Treasury yield curve rallied, or moved lower, on political uncertainty, increased geopolitical risks and fewer positive economic surprises. In particular, soft inflation data throughout 2017 year-to-date weighed on market expectations for further interest rate hikes by the Fed. While we recognized recent weakness in inflation, we maintained the Fund’s underweight U.S. duration position given our expectations that global economic growth is likely to remain strong and that tightness in the labor market and easy financial conditions may warrant further monetary tightening in the U.S. We also expected inflation to rebound from recent weakness should wage growth begin to emerge. Further, as mentioned earlier, we positioned the Fund to take advantage of relative value positions across global interest rates, which detracted from results during the Reporting Period. |
| | | The Fund’s yield curve positioning boosted the Fund’s performance during the Reporting Period. The Fund was positioned for yield curve steepening in the U.S., U.K. and Canada. Particularly positive performance came from yield curve steepening in the U.K. yield curve. (A steepening yield curve is one in which the differential between yields on shorter-term maturities and longer-term maturities widens.) |
| Q | | How did the Fund use derivatives and similar instruments during the Reporting Period? |
| A | | We used derivatives and similar instruments for the efficient management of the Fund. These derivatives and similar instruments allowed us to manage interest rate, credit and currency risks more effectively by allowing us both to hedge and to apply active investment views with greater versatility and to afford greater risk management precision than we would otherwise be able to implement. |
| | | During the Reporting Period, we used interest rate and bond exchange traded futures contracts to implement duration and country strategies within the Fund, especially in the U.S., Eurozone and Japanese markets. Currency transactions were carried out using primarily over-the-counter (“OTC”) spot and forward foreign exchange contracts as well as by purchasing OTC options. Currency transactions were used as we sought both to enhance returns and to hedge the Fund’s portfolio against currency exchange rate fluctuations. Also, we used written options contracts and swaptions (or options on interest rate swap contracts) to express an outright term structure view and manage volatility (term structure, most often depicted as a yield curve, refers to the term structure of interest rates, which is the relationship between the yield to maturity and the time to maturity for pure discount bonds); credit default swaps to manage exposure to fluctuations in credit spreads (or the differential in yields between Treasury securities and non-Treasury securities with the same maturity but of different quality rating); and interest rate swaps to manage exposure to fluctuations in interest rates. We used total return swaps to manage curve exposure across various strategies within the Fund. Our currency strategy used forward sales contracts to implement long and short views within the strategy. |
| | | In the country strategy, the team primarily uses swaps/ futures to express relative value trades in the interest rates of two separate countries. The country strategy overall detracted from the Fund’s performance during the Reporting Period. The duration strategy, implemented through derivatives as described above, also detracted from Fund performance during the Reporting Period. The use of a credit default swap |
23
PORTFOLIO RESULTS
| | index to gain exposure to emerging markets debt, as already mentioned, detracted as well. The currency strategy, implemented primarily through the use of currency forwards, contributed positively to the Fund’s performance during the Reporting Period. Overall, derivatives had a negative impact on the fund. |
| Q | | Were there any notable changes in the Fund’s weightings during the Reporting Period? |
| A | | The Fund is a broadly diversified, multi-sector portfolio designed to provide total return opportunities from across the fixed income spectrum, including government, securitized, corporate credit and emerging market fixed income sectors. |
| | | Positioning throughout the Reporting Period remained consistent with themes we have been focusing on for some time now. Most risk was allocated across the Fund’s top-down, or macro, currency and country strategies with the balance allocated across our sector strategies. |
| | | In our macro strategies, we positioned the Fund to be short U.S. interest rates, as the Fed’s comments led to hawkish sentiment by the consensus. (Hawkish tends to suggest higher interest rates; opposite of dovish.) We also believed the European Central Bank was likely to remain accommodative and expressed this view by being long European rates versus short U.S. rates within the Fund. From a currency perspective, we ended the Reporting Period short the U.S. dollar. We instead increased the Fund’s long positions in various emerging market currencies given a backdrop of solid global economic growth, low inflation and contained volatility, which we view as supportive of risk assets. |
| | | From a sector perspective, we maintained the Fund’s modest exposure to corporate credit during the Reporting Period, as we believe the U.S. is in the late stages of the credit cycle. We instead focused credit exposure in the securitized credit space. While we think an improving earnings cycle may bolster the ability of companies to protect credit metrics, we were cautious in the Fund’s exposure at this late stage of the cycle and given what we believe are high levels of leverage, which have been hovering around historical highs. We also saw scope for a pickup in political and policy uncertainty, which could serve as a catalyst for broader market volatility and weigh on corporate credit markets going forward. |
| Q | | How was the Fund positioned relative to its benchmark index at the end of September 2017? |
| A | | At the end of September 2017, the Fund had the majority of its total net assets invested in collateralized loan obligations, asset-backed securities, emerging markets debt and non-agency residential mortgage-backed securities. The Fund also had modest exposure at the end of the Reporting Period to quasi-government securities, commercial mortgage-backed securities, investment grade corporate bonds, high yield corporate bonds, corporate bank loans, municipal bonds and equities. The Fund had a significant position in cash at the end of the Reporting Period. |
| | | At the end of the Reporting Period, the Fund’s largest duration position was its short duration position in the U.S. The Fund also had a short duration position in the U.K., a rather neutral duration position in Japan, and long duration positions in Europe and Canada. |
24
FUND BASICS
Strategic Income Fund
as of September 30, 2017
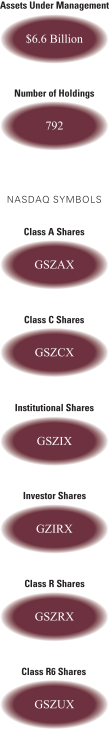
| | | | | | | | | | | | | | | | | | |
| | PERFORMANCE REVIEW | |
| | | April 1, 2017– September 30, 2017 | | Fund Total Return
(based on NAV)1 | | | BofA Merrill Lynch
U.S. Dollar 3-Month
LIBOR Constant
Maturity Index2 | | | 30-Day
Standardized
Subsidized Yield3 | | | 30-Day
Standardized
Unsubsidized Yield3 | |
| | Class A | | | -0.42 | % | | | 0.59 | % | | | 1.44 | % | | | 1.43 | % |
| | Class C | | | -0.88 | | | | 0.59 | | | | 0.62 | | | | 0.62 | |
| | Institutional | | | -0.25 | | | | 0.59 | | | | 1.63 | | | | 1.63 | |
| | Investor | | | -0.29 | | | | 0.59 | | | | 1.61 | | | | 1.60 | |
| | Class R | | | -0.64 | | | | 0.59 | | | | 1.10 | | | | 1.10 | |
| | | Class R6 | | | -0.24 | | | | 0.59 | | | | 1.64 | | | | 1.63 | |
| | 1 | | The net asset value (NAV) represents the net assets of the class of the Fund (ex-dividend) divided by the total number of shares of the class outstanding. The Fund’s performance reflects the reinvestment of dividends and other distributions. The Fund’s performance does not reflect the deduction of any applicable sales charges. |
| | 2 | | The Bank of America Merrill Lynch U.S. Dollar Three-Month LIBOR Constant Maturity Index tracks the performance of a synthetic asset paying LIBOR to a stated maturity. The index is based on the assumed purchase at par of a synthetic instrument having exactly its stated maturity and with a coupon equal to that day’s fixing rate. That issue is assumed to be sold the following business day (priced at a yield equal to the current day fixing rate) and rolled into a new instrument. |
| | 3 | | The method of calculation of the 30-Day Standardized Subsidized Yield is mandated by the Securities and Exchange Commission and is determined by dividing the net investment income per share earned during the last 30 days of the period by the maximum public offering price (“POP”) per share on the last day of the period. This number is then annualized. The 30-Day Standardized Subsidized Yield reflects fee waivers and/or expense reimbursements recorded by the Fund during the period. Without waivers and/or reimbursements, yields would be reduced. This yield does not necessarily reflect income actually earned and distributed by the Fund and, therefore, may not be correlated with the dividends or other distributions paid to shareholders. The 30-Day Standardized Unsubsidized Yield does not adjust for any fee waivers and/or expense reimbursements in effect. If the Fund does not incur any fee waivers and/or expense reimbursements during the period, the 30-Day Standardized Subsidized Yield and 30-Day Standardized Unsubsidized Yield will be identical. |
The returns set forth in the table above represent past performance. Past performance does not guarantee future results. The Fund’s investment return and principal value will fluctuate so that an investor’s shares, when redeemed, may be worth more or less than their original cost. Current performance may be lower or higher than the performance quoted above. Please visit our web site at www.GSAMFUNDS.com to obtain the most recent month-end returns. Performance reflects applicable fee waivers and/or expense limitations in effect during the periods shown. In their absence, performance would be reduced. Returns do not reflect the deduction of taxes that a shareholder would pay on Fund distributions or the redemption of Fund shares.
25
FUND BASICS
| | | | | | | | | | | | | | | | |
| | STANDARDIZED TOTAL RETURNS4 |
| | | For the period ended 9/30/17 | | One Year | | | Five Years | | | Since Inception | | | Inception Date |
| | Class A | | | -2.16 | % | | | 0.91 | % | | | 1.86 | % | | 6/30/10 |
| | Class C | | | -0.03 | | | | 0.95 | | | | 1.65 | | | 6/30/10 |
| | Institutional | | | 1.97 | | | | 2.04 | | | | 2.75 | | | 6/30/10 |
| | Investor | | | 1.88 | | | | 1.95 | | | | 2.65 | | | 6/30/10 |
| | Class R | | | 1.41 | | | | 1.45 | | | | 2.14 | | | 6/30/10 |
| | | Class R6 | | | 1.99 | | | | N/A | | | | 0.80 | | | 7/31/15 |
| | 4 | | The Standardized Total Returns are average annual or cumulative total returns (only if the performance period is one year or less) as of the most recent calendar quarter-end. They assume reinvestment of all distributions at NAV. These returns reflect a maximum initial sales charge of 3.75% for Class A Shares and the assumed contingent deferred sales charge for Class C Shares (1% if redeemed within 12 months of purchase). Because Institutional, Investor, Class R and Class R6 Shares do not involve a sales charge, such a charge is not applied to their Standardized Total Returns. |
The returns set forth in the table above represent past performance. Past performance does not guarantee future results. The Fund’s investment return and principal value will fluctuate so that an investor’s shares, when redeemed, may be worth more or less than their original cost. Current performance may be lower or higher than the performance quoted above. Please visit our web site at www.GSAMFUNDS.com to obtain the most recent month-end returns. Performance reflects applicable fee waivers and/or expense limitations in effect during the periods shown. In their absence, performance would be reduced. Returns do not reflect the deduction of taxes that a shareholder would pay on Fund distributions or the redemption of Fund shares.
| | | | | | | | | | |
| | EXPENSE RATIOS5 | |
| | | | | Net Expense Ratio (Current) | | | Gross Expense Ratio (Before Waivers) | |
| | Class A | | | 0.93 | % | | | 0.93 | % |
| | Class C | | | 1.68 | | | | 1.68 | |
| | Institutional | | | 0.59 | | | | 0.59 | |
| | Investor | | | 0.68 | | | | 0.68 | |
| | Class R | | | 1.18 | | | | 1.18 | |
| | | Class R6 | | | 0.58 | | | | 0.58 | |
| | 5 | | The expense ratios of the Fund, both current (net of applicable fee waivers and/or expense limitations) and before waivers (gross of applicable fee waivers and/or expense limitations), are as set forth above according to the most recent publicly available Prospectus. |
26
FUND BASICS
|
| SECTOR ALLOCATIONS6 |
| Percentage of Net Assets |
| | 6 | | The percentage shown for each investment category reflects the value of investments in that category as a percentage of net assets. Short-term investments represent certificates of deposits and commercial papers. Figures in the graph may not sum to 100% due to the exclusion of other assets and liabilities. The graph depicts the Fund’s investments but may not represent the Fund’s market exposure due to the exclusion of certain derivatives, if any, as listed in the Additional Investment Information section of the Schedule of Investments. |
| | 7 | | “Federal Agencies” are mortgage-backed securities guaranteed by the Government National Mortgage Association (“GNMA”), Federal National Mortgage Association (“FNMA”) and Federal Home Loan Mortgage Corp. (“FHLMC”). GNMA instruments are backed by the full faith and credit of the U.S. Government. |
| | 8 | | “Agency Debentures” include agency securities offered by companies such as FNMA and FHLMC, which operate under a government charter. While they are required to report to a government regulator, their assets are not explicitly guaranteed by the government and they otherwise operate like any other publicly traded company. |
27
GOLDMAN SACHS BOND FUND
Schedule of Investments
September 30, 2017 (Unaudited)
| | | | | | | | | | | | | | |
Principal
Amount | | | Interest
Rate | | | Maturity
Date | | | Value | |
| Corporate Obligations – 28.6% | |
| Agriculture – 1.6% | | | | | | | | | | |
| | BAT Capital Corp.(a)(b) | |
| $ | 4,100,000 | | | | 3.222 | % | | | 08/15/24 | | | $ | 4,110,102 | |
| | 3,900,000 | | | | 3.557 | | | | 08/15/27 | | | | 3,939,204 | |
| | Reynolds American, Inc. | |
| | 700,000 | | | | 4.850 | | | | 09/15/23 | | | | 768,291 | |
| | 1,375,000 | | | | 4.450 | (a) | | | 06/12/25 | | | | 1,473,779 | |
| | | | | | | | | | | | | | |
| | | | | | | | | | | | | 10,291,376 | |
| | |
| Automotive – 0.6% | | | | | | | | | | |
| | Ford Motor Credit Co. LLC | |
| | 2,175,000 | | | | 5.875 | | | | 08/02/21 | | | | 2,419,266 | |
| | General Motors Financial Co., Inc. | |
| | 1,050,000 | | | | 3.500 | | | | 07/10/19 | | | | 1,075,412 | |
| | | | | | | | | | | | | | |
| | | | | | | | | | | | | 3,494,678 | |
| | |
| Banks – 7.4% | | | | | | | | | | |
| | Bank of America Corp. | |
| | 625,000 | | | | 4.125 | | | | 01/22/24 | | | | 664,915 | |
| | 575,000 | | | | 4.000 | | | | 04/01/24 | | | | 607,461 | |
| | 1,300,000 | | | | 3.248 | (a) | | | 10/21/27 | | | | 1,273,953 | |
| | 1,225,000 | | | | 4.183 | (a) | | | 11/25/27 | | | | 1,269,683 | |
| | 100,000 | | | | 6.110 | | | | 01/29/37 | | | | 125,034 | |
| | (3M USD LIBOR + 0.660%) | |
| | 1,850,000 | | | | 2.369 | (a)(c) | | | 07/21/21 | | | | 1,850,137 | |
| | (3M USD LIBOR + 1.575%) | |
| | 1,250,000 | | | | 3.824 | (a)(c) | | | 01/20/28 | | | | 1,285,256 | |
| | Barclays PLC | |
| | 575,000 | | | | 5.200 | | | | 05/12/26 | | | | 615,053 | |
| | 225,000 | | | | 4.950 | | | | 01/10/47 | | | | 245,894 | |
| | Capital One Financial Corp.(a) | |
| | 700,000 | | | | 4.200 | | | | 10/29/25 | | | | 719,322 | |
| | Citigroup, Inc. | |
| | 925,000 | | | | 4.125 | | | | 07/25/28 | | | | 951,769 | |
| | Compass Bank | |
| | 475,000 | | | | 5.500 | | | | 04/01/20 | | | | 501,524 | |
| | Credit Suisse Group AG(a)(b) | |
| | 475,000 | | | | 4.282 | | | | 01/09/28 | | | | 494,768 | |
| | Credit Suisse Group Funding Guernsey Ltd. | |
| | 250,000 | | | | 3.750 | | | | 03/26/25 | | | | 254,656 | |
| | Deutsche Bank AG | |
| | 225,000 | | | | 2.500 | | | | 02/13/19 | | | | 226,323 | |
| | HSBC Holdings PLC(a)(c) (3M USD LIBOR + 1.055%) | |
| | 1,150,000 | | | | 3.262 | | | | 03/13/23 | | | | 1,173,777 | |
| | ING Bank NV(a)(c) (5 year USD ICE Swap + 2.700%) | |
| | 700,000 | | | | 4.125 | | | | 11/21/23 | | | | 712,600 | |
| | ING Groep NV | |
| | 425,000 | | | | 3.150 | | | | 03/29/22 | | | | 433,087 | |
| | Intesa Sanpaolo SpA | |
| | 950,000 | | | | 3.875 | | | | 01/16/18 | | | | 955,245 | |
| | JPMorgan Chase & Co.(a) | |
| | 1,075,000 | | | | 2.972 | | | | 01/15/23 | | | | 1,091,695 | |
| | 1,200,000 | | | | 3.625 | | | | 12/01/27 | | | | 1,203,461 | |
| | (3M USD LIBOR + 1.360%) | |
| | 425,000 | | | | 3.882 | (c) | | | 07/24/38 | | | | 428,455 | |
| | (3M USD LIBOR + 3.800%) | |
| | 1,075,000 | | | | 5.300 | (c) | | | 05/01/49 | | | | 1,120,688 | |
| | Kreditanstalt fuer Wiederaufbau | |
| | 12,490,000 | | | | 1.500 | | | | 09/09/19 | | | | 12,454,528 | |
| | |
| Corporate Obligations – (continued) | |
| Banks – (continued) | | | | | | | | | | |
| | Macquarie Bank Ltd.(b) | |
| 88,000 | | | | 6.625 | | | | 04/07/21 | | | | 98,828 | |
| | Mitsubishi UFJ Financial Group, Inc. | |
| | 525,000 | | | | 2.950 | | | | 03/01/21 | | | | 533,403 | |
| | 250,000 | | | | 3.850 | | | | 03/01/26 | | | | 260,085 | |
| | Mizuho Financial Group, Inc.(b) | |
| | 850,000 | | | | 2.632 | | | | 04/12/21 | | | | 849,301 | |
| | Morgan Stanley, Inc. | |
| | 325,000 | | | | 3.875 | | | | 04/29/24 | | | | 340,116 | |
| | 1,050,000 | | | | 3.700 | | | | 10/23/24 | | | | 1,087,772 | |
| | 50,000 | | | | 4.000 | | | | 07/23/25 | | | | 52,713 | |
| | (3M USD LIBOR + 1.400%) | |
| | 1,550,000 | | | | 2.713 | (a)(c) | | | 10/24/23 | | | | 1,585,233 | |
| | Santander Bank NA | |
| | 400,000 | | | | 8.750 | | | | 05/30/18 | | | | 417,697 | |
| | Sumitomo Mitsui Financial Group, Inc. | |
| | 1,525,000 | | | | 2.784 | | | | 07/12/22 | | | | 1,530,906 | |
| | 975,000 | | | | 4.436 | (b) | | | 04/02/24 | | | | 1,032,296 | |
| | UBS Group Funding Switzerland AG(b) | |
| | 1,275,000 | | | | 4.125 | | | | 09/24/25 | | | | 1,341,183 | |
| | UniCredit SpA(b) | |
| | 2,050,000 | | | | 3.750 | | | | 04/12/22 | | | | 2,101,383 | |
| | Wells Fargo & Co. | |
| | 3,375,000 | | | | 3.000 | | | | 10/23/26 | | | | 3,300,248 | |
| | Westpac Banking Corp.(a)(c) | |
| | (5 year USD ICE Swap + 2.888%) | |
| | 575,000 | | | | 5.000 | | | | 12/31/99 | | | | 574,379 | |
| | (5 year USD ICE Swap + 2.236%) | |
| | 775,000 | | | | 4.322 | | | | 11/23/31 | | | | 796,242 | |
| | | | | | | | | | | | | | |
| | | | | | | | | | | | | 46,561,069 | |
| | |
| Beverages – 0.8% | | | | | | | | | | |
| | Anheuser-Busch InBev Finance, Inc.(a) | |
| | 2,425,000 | | | | 2.650 | | | | 02/01/21 | | | | 2,464,384 | |
| | 1,400,000 | | | | 3.650 | | | | 02/01/26 | | | | 1,448,317 | |
| | 225,000 | | | | 4.900 | | | | 02/01/46 | | | | 254,153 | |
| | Molson Coors Brewing Co.(a) | |
| | 300,000 | | | | 2.100 | | | | 07/15/21 | | | | 295,805 | |
| | Suntory Holdings Ltd.(b) | |
| | 550,000 | | | | 2.550 | | | | 09/29/19 | | | | 554,736 | |
| | | | | | | | | | | | | | |
| | | | | | | | | | | | | 5,017,395 | |
| | |
| Chemicals – 0.5% | | | | | | | | | | |
| | LyondellBasell Industries NV(a) | |
| | 300,000 | | | | 5.000 | | | | 04/15/19 | | | | 311,278 | |
| | The Sherwin-Williams Co. | |
| | 725,000 | | | | 2.250 | | | | 05/15/20 | | | | 727,869 | |
| | 225,000 | | | | 2.750 | (a) | | | 06/01/22 | | | | 226,515 | |
| | 200,000 | | | | 3.125 | (a) | | | 06/01/24 | | | | 201,005 | |
| | 1,125,000 | | | | 3.450 | (a) | | | 06/01/27 | | | | 1,132,823 | |
| | Westlake Chemical Corp.(a) | |
| | 325,000 | | | | 3.600 | | | | 08/15/26 | | | | 324,583 | |
| | | | | | | | | | | | | | |
| | | | | | | | | | | | | 2,924,073 | |
| | |
| Commercial Services – 0.1% | |
| | Rensselaer Polytechnic Institute | |
| | 350,000 | | | | 5.600 | | | | 09/01/20 | | | | 376,764 | |
| | |
| | |
| 28 | | The accompanying notes are an integral part of these financial statements. |
GOLDMAN SACHS BOND FUND
| | | | | | | | | | | | | | |
Principal
Amount | | | Interest
Rate | | | Maturity
Date | | | Value | |
| Corporate Obligations – (continued) | |
| Computers(a) – 0.2% | | | | | | | | | | |
| | Dell International LLC/EMC Corp.(b) | |
| $ | 375,000 | | | | 5.450 | % | | | 06/15/23 | | | $ | 410,400 | |
| | Hewlett Packard Enterprise Co. | |
| | 525,000 | | | | 4.900 | | | | 10/15/25 | | | | 555,380 | |
| | | | | | | | | | | | | | |
| | | | | | | | | | | | | 965,780 | |
| | |
| Diversified Financial Services – 0.8% | |
| | AerCap Ireland Capital DAC/AerCap Global Aviation Trust | |
| | 1,150,000 | | | | 4.625 | | | | 07/01/22 | | | | 1,232,610 | |
| | Discover Financial Services(a) | |
| | 900,000 | | | | 3.750 | | | | 03/04/25 | | | | 903,534 | |
| | GE Capital International Funding Co. | |
| | 551,000 | | | | 4.418 | | | | 11/15/35 | | | | 599,156 | |
| | International Lease Finance Corp.(b) | |
| | 575,000 | | | | 7.125 | | | | 09/01/18 | | | | 602,051 | |
| | Synchrony Financial(a) | |
| | 1,675,000 | | | | 3.000 | | | | 08/15/19 | | | | 1,702,380 | |
| | | | | | | | | | | | | | |
| | | | | | | | | | | | | 5,039,731 | |
| | |
| Electrical – 0.7% | | | | | | | | | | |
| Consumers Energy Co.(a) | |
| | 850,000 | | | | 3.950 | | | | 05/15/43 | | | | 881,100 | |
| | Duke Energy Corp.(a) | |
| | 1,175,000 | | | | 3.150 | | | | 08/15/27 | | | | 1,164,842 | |
| | Enel Finance International NV(b) | |
| | 825,000 | | | | 2.875 | | | | 05/25/22 | | | | 830,345 | |
| | Puget Sound Energy, Inc.(a)(c) (3M USD LIBOR + 2.530%) | |
| | 600,000 | | | | 6.974 | | | | 06/01/67 | | | | 585,000 | |
| | The Southern Co.(a) | |
| | 1,025,000 | | | | 2.350 | | | | 07/01/21 | | | | 1,019,299 | |
| | | | | | | | | | | | | | |
| | | | | | | | | | | | | 4,480,586 | |
| | |
| Food & Drug Retailing(a) – 0.3% | |
| | Kraft Heinz Foods Co. | |
| | 525,000 | | | | 2.800 | | | | 07/02/20 | | | | 534,485 | |
| | 325,000 | | | | 3.950 | | | | 07/15/25 | | | | 334,738 | |
| | 700,000 | | | | 4.375 | | | | 06/01/46 | | | | 691,203 | |
| | | | | | | | | | | | | | |
| | | | | | | | | | | | | 1,560,426 | |
| | |
| Gaming – 0.1% | | | | | | | | | | |
| | MGM Resorts International | |
| | 475,000 | | | | 6.750 | | | | 10/01/20 | | | | 523,094 | |
| | |
| Healthcare Providers & Services – 1.0% | |
| | Aetna, Inc.(a) | | | | | | | | | | | | | |
| | 400,000 | | | | 2.800 | | | | 06/15/23 | | | | 402,460 | |
| | Becton Dickinson & Co. | |
| | 414,000 | | | | 2.675 | | | | 12/15/19 | | | | 418,971 | |
| | 1,525,000 | | | | 2.894 | (a) | | | 06/06/22 | | | | 1,529,962 | |
| | 1,475,000 | | | | 3.363 | (a) | | | 06/06/24 | | | | 1,488,761 | |
| | 475,000 | | | | 4.685 | (a) | | | 12/15/44 | | | | 502,112 | |
| | CHS/Community Health Systems, Inc.(a) | |
| | 100,000 | | | | 8.000 | | | | 11/15/19 | | | | 97,500 | |
| | Thermo Fisher Scientific, Inc.(a) | |
| | 800,000 | | | | 3.000 | | | | 04/15/23 | | | | 813,220 | |
| | UnitedHealth Group, Inc. | |
| | 450,000 | | | | 4.625 | | | | 07/15/35 | | | | 515,736 | |
| | 500,000 | | | | 6.875 | | | | 02/15/38 | | | | 709,618 | |
| | | | | | | | | | | | | | |
| | | | | | | | | | | | | 6,478,340 | |
| | |
| Corporate Obligations – (continued) | |
| Insurance – 1.1% | | | | | | | | | | |
| | American International Group, Inc.(a) | |
| 450,000 | | | | 3.750 | | | | 07/10/25 | | | | 464,718 | |
| | 600,000 | | | | 4.800 | | | | 07/10/45 | | | | 654,711 | |
| | Brighthouse Financial, Inc.(a)(b) | |
| | 600,000 | | | | 3.700 | | | | 06/22/27 | | | | 589,125 | |
| | MetLife, Inc. | |
| | 150,000 | | | | 4.050 | | | | 03/01/45 | | | | 152,480 | |
| | Reliance Standard Life Global Funding II(b) | |
| | 675,000 | | | | 2.500 | | | | 01/15/20 | | | | 678,105 | |
| | Teachers Insurance & Annuity Association of America(b) | |
| | 295,000 | | | | 4.900 | | | | 09/15/44 | | | | 333,168 | |
| | The Chubb Corp.(a)(c) (3M USD LIBOR + 2.250%) | |
| | 500,000 | | | | 3.554 | | | | 03/29/67 | | | | 497,250 | |
| The Dai-ichi Life Insurance Co. Ltd.(a)(b)(c) (3M USD LIBOR +
3.660%) |
|
| | 800,000 | | | | 4.000 | | | | 07/23/49 | | | | 792,000 | |
| | The Hartford Financial Services Group, Inc. | |
| | 150,000 | | | | 5.125 | | | | 04/15/22 | | | | 166,216 | |
| | The Northwestern Mutual Life Insurance Co.(b) | |
| | 800,000 | | | | 6.063 | | | | 03/30/40 | | | | 1,052,393 | |
| | 500,000 | | | | 3.850 | (a) | | | 09/30/47 | | | | 494,336 | |
| | XLIT Ltd. | |
| | 775,000 | | | | 4.450 | | | | 03/31/25 | | | | 793,600 | |
| | | | | | | | | | | | | | |
| | | | | 6,668,102 | |
| | |
| Internet(a) – 0.7% | | | | | | | | | | |
| | Amazon.com, Inc. | | | | | | | | | | | | | |
| | 1,650,000 | | | | 3.300 | | | | 12/05/21 | | | | 1,719,624 | |
| | Expedia, Inc.(b) | |
| | 975,000 | | | | 3.800 | | | | 02/15/28 | | | | 966,239 | |
| | Symantec Corp.(b) | |
| | 900,000 | | | | 5.000 | | | | 04/15/25 | | | | 940,359 | |
| | The Priceline Group, Inc. | |
| | 1,000,000 | | | | 3.600 | | | | 06/01/26 | | | | 1,016,733 | |
| | | | | | | | | | | | | | |
| | | | | 4,642,955 | |
| | |
| Machinery-Diversified(a) – 0.2% | |
| | Roper Technologies, Inc. | |
| | 475,000 | | | | 3.000 | | | | 12/15/20 | | | | 484,623 | |
| | 800,000 | | | | 3.800 | | | | 12/15/26 | | | | 823,489 | |
| | | | | | | | | | | | | | |
| | | | | 1,308,112 | |
| | |
| Media – 0.7% | | | | | | | | | | |
| | 21st Century Fox America, Inc. | |
| | 1,125,000 | | | | 4.000 | | | | 10/01/23 | | | | 1,192,646 | |
| Charter Communications Operating LLC/Charter Communications
Operating Capital(a) |
|
| | 275,000 | | | | 4.464 | | | | 07/23/22 | | | | 290,957 | |
| | 925,000 | | | | 4.908 | | | | 07/23/25 | | | | 988,840 | |
| | NBCUniversal Media LLC | |
| | 458,000 | | | | 4.450 | | | | 01/15/43 | | | | 487,226 | |
| | SFR Group SA(a)(b) | |
| | 1,000,000 | | | | 6.000 | | | | 05/15/22 | | | | 1,043,750 | |
| | Time Warner Cable LLC | |
| | 225,000 | | | | 5.000 | | | | 02/01/20 | | | | 237,879 | |
| | | | | | | | | | | | | | |
| | | | | 4,241,298 | |
| | |
| | |
| The accompanying notes are an integral part of these financial statements. | | 29 |
GOLDMAN SACHS BOND FUND
Schedule of Investments (continued)
September 30, 2017 (Unaudited)
| | | | | | | | | | | | | | |
Principal
Amount | | | Interest
Rate | | | Maturity
Date | | | Value | |
| Corporate Obligations – (continued) | |
| Mining(b) – 0.5% | |
| | Glencore Finance Canada Ltd. | |
| $ | 880,000 | | | | 2.700 | % | | | 10/25/17 | | | $ | 880,308 | |
| | 650,000 | | | | 4.250 | | | | 10/25/22 | | | | 684,042 | |
| | Glencore Funding LLC | |
| | 475,000 | | | | 4.125 | | | | 05/30/23 | | | | 494,499 | |
| | 945,000 | | | | 4.625 | | | | 04/29/24 | | | | 1,000,991 | |
| | | | | | | | | | | | | | |
| | | | | 3,059,840 | |
| | |
| Miscellaneous Manufacturing – 0.1% | |
| | General Electric Co. | |
| | MXN2,000,000 | | | | 8.500 | | | | 04/06/18 | | | | 110,052 | |
| $ | 200,000 | | | | 6.150 | | | | 08/07/37 | | | | 265,204 | |
| | 172,000 | | | | 5.875 | | | | 01/14/38 | | | | 225,078 | |
| | | | | | | | | | | | | | |
| | | | | | | | | | | | | 600,334 | |
| | |
| Oil Field Services – 1.7% | |
| | Anadarko Petroleum Corp. | |
| | 475,000 | | | | 8.700 | | | | 03/15/19 | | | | 518,410 | |
| | 330,000 | | | | 3.450 | (a) | | | 07/15/24 | | | | 327,496 | |
| | 300,000 | | | | 5.550 | (a) | | | 03/15/26 | | | | 335,052 | |
| | 250,000 | | | | 6.450 | | | | 09/15/36 | | | | 295,749 | |
| | Apache Corp.(a) | |
| | 100,000 | | | | 3.250 | | | | 04/15/22 | | | | 101,430 | |
| | 275,000 | | | | 2.625 | | | | 01/15/23 | | | | 269,544 | |
| | 625,000 | | | | 4.250 | | | | 01/15/44 | | | | 586,926 | |
| | ConocoPhillips Co.(a) | |
| | 150,000 | | | | 4.200 | | | | 03/15/21 | | | | 159,523 | |
| | 155,000 | | | | 3.350 | | | | 11/15/24 | | | | 159,403 | |
| | Devon Energy Corp.(a) | |
| | 250,000 | | | | 3.250 | | | | 05/15/22 | | | | 252,958 | |
| | 380,000 | | | | 5.600 | | | | 07/15/41 | | | | 415,871 | |
| | EQT Corp.(a) | |
| | 625,000 | | | | 3.000 | | | | 10/01/22 | | | | 626,457 | |
| | Halliburton Co.(a) | |
| | 350,000 | | | | 3.800 | | | | 11/15/25 | | | | 359,383 | |
| | 250,000 | | | | 4.850 | | | | 11/15/35 | | | | 271,025 | |
| | Petrobras Global Finance BV | |
| | 20,000 | | | | 8.750 | | | | 05/23/26 | | | | 24,071 | |
| | 440,000 | | | | 7.375 | | | | 01/17/27 | | | | 484,550 | |
| | 303,000 | | | | 5.999 | (b) | | | 01/27/28 | | | | 303,000 | |
| | 230,000 | | | | 6.850 | (d) | | | 06/05/15 | | | | 218,414 | |
| | Petroleos de Venezuela SA | |
| | 5,140,000 | | | | 6.000 | | | | 10/28/22 | | | | 1,470,040 | |
| | 640,000 | | | | 5.375 | | | | 04/12/27 | | | | 192,000 | |
| | Petroleos Mexicanos | |
| | 19,000 | | | | 6.375 | | | | 02/04/21 | | | | 20,762 | |
| | EUR410,000 | | | | 5.125 | | | | 03/15/23 | | | | 554,843 | |
| $ | 980,000 | | | | 6.500 | (b) | | | 03/13/27 | | | | 1,086,066 | |
| | 16,000 | | | | 5.500 | | | | 06/27/44 | | | | 14,880 | |
| | 10,000 | | | | 6.375 | | | | 01/23/45 | | | | 10,190 | |
| | 610,000 | | | | 6.750 | (b) | | | 09/21/47 | | | | 649,284 | |
| | Pioneer Natural Resources Co.(a) | |
| | 525,000 | | | | 3.450 | | | | 01/15/21 | | | | 536,799 | |
| | 410,000 | | | | 3.950 | | | | 07/15/22 | | | | 430,842 | |
| | | | | | | | | | | | | | |
| | | | | | | | | | | | | 10,674,968 | |
| | |
| Corporate Obligations – (continued) | |
| Pharmaceuticals – 1.5% | | | | |
| | AbbVie, Inc.(a) | | | | | | | | | | | | | |
| $ | 550,000 | | | | 2.500 | | | | 05/14/20 | | | | 556,590 | |
| | Allergan Funding SCS | |
| | 1,125,000 | | | | 2.350 | | | | 03/12/18 | | | | 1,128,277 | |
| | 150,000 | | | | 4.850 | (a) | | | 06/15/44 | | | | 163,336 | |
| | Bayer US Finance LLC(b) | |
| | 1,025,000 | | | | 3.000 | | | | 10/08/21 | | | | 1,044,466 | |
| | EMD Finance LLC(a)(b) | |
| | 1,500,000 | | | | 2.950 | | | | 03/19/22 | | | | 1,524,587 | |
| | Forest Laboratories LLC(a)(b) | |
| | 278,000 | | | | 4.375 | | | | 02/01/19 | | | | 285,089 | |
| | 425,000 | | | | 5.000 | | | | 12/15/21 | | | | 464,483 | |
| | Mylan NV(a) | |
| | 1,675,000 | | | | 3.950 | | | | 06/15/26 | | | | 1,705,325 | |
| | Teva Pharmaceutical Finance Netherlands III BV | |
| | 525,000 | | | | 2.200 | | | | 07/21/21 | | | | 505,472 | |
| | 440,000 | | | | 2.800 | | | | 07/21/23 | | | | 419,668 | |
| | 225,000 | | | | 3.150 | | | | 10/01/26 | | | | 207,382 | |
| | Valeant Pharmaceuticals International, Inc.(a)(b) | |
| | 450,000 | | | | 7.000 | | | | 03/15/24 | | | | 480,375 | |
| | Zoetis, Inc.(a) | |
| | 775,000 | | | | 3.000 | | | | 09/12/27 | | | | 765,776 | |
| | | | | | | | | | | | | | |
| | | | | | | | | | | | | 9,250,826 | |
| | |
| Pipelines – 1.7% | | | | | | | | | | |
| | Enbridge, Inc.(a) | |
| | 325,000 | | | | 3.500 | | | | 06/10/24 | | | | 330,031 | |
| | Energy Transfer LP(a) | |
| | 350,000 | | | | 4.650 | | | | 06/01/21 | | | | 371,988 | |
| | 70,000 | | | | 3.600 | | | | 02/01/23 | | | | 71,187 | |
| | 100,000 | | | | 4.750 | | | | 01/15/26 | | | | 105,267 | |
| Enterprise Products Operating LLC(a)(c) (3M USD LIBOR +
3.708%) |
|
| | 1,075,000 | | | | 5.018 | | | | 08/01/66 | | | | 1,075,537 | |
| | Kinder Morgan Energy Partners LP(a) | |
| | 1,025,000 | | | | 3.500 | | | | 09/01/23 | | | | 1,036,224 | |
| | 300,000 | | | | 4.250 | | | | 09/01/24 | | | | 311,329 | |
| | Kinder Morgan, Inc. | |
| | 1,175,000 | | | | 3.050 | (a) | | | 12/01/19 | | | | 1,196,248 | |
| | 500 | | | | 7.750 | | | | 01/15/32 | | | | 642 | |
| | Plains All American Pipeline LP/PAA Finance Corp.(a) | |
| | 600,000 | | | | 3.650 | | | | 06/01/22 | | | | 603,171 | |
| | 600,000 | | | | 3.850 | | | | 10/15/23 | | | | 602,299 | |
| | 825,000 | | | | 4.500 | | | | 12/15/26 | | | | 837,301 | |
| | Sabine Pass Liquefaction LLC(a) | |
| | 800,000 | | | | 6.250 | | | | 03/15/22 | | | | 899,796 | |
| | 1,025,000 | | | | 5.625 | | | | 03/01/25 | | | | 1,131,344 | |
| | Sunoco Logistics Partners Operations LP(a) | |
| | 200,000 | | | | 4.250 | | | | 04/01/24 | | | | 206,370 | |
| | Western Gas Partners LP(a) | |
| | 525,000 | | | | 3.950 | | | | 06/01/25 | | | | 527,434 | |
| | Williams Partners LP(a) | |
| | 915,000 | | | | 3.600 | | | | 03/15/22 | | | | 945,373 | |
| | 600,000 | | | | 3.900 | | | | 01/15/25 | | | | 612,340 | |
| | | | | | | | | | | | | | |
| | | | | | | | | | | | | 10,863,881 | |
| | |
| | |
| 30 | | The accompanying notes are an integral part of these financial statements. |
GOLDMAN SACHS BOND FUND
| | | | | | | | | | | | | | |
Principal
Amount | | | Interest
Rate | | | Maturity
Date | | | Value | |
| Corporate Obligations – (continued) | |
| Real Estate Investment Trust – 1.5% | |
| | American Campus Communities Operating Partnership LP(a) | |
| $ | 800,000 | | | | 3.750 | % | | | 04/15/23 | | | $ | 823,390 | |
| | American Tower Corp. | |
| | 300,000 | | | | 3.400 | | | | 02/15/19 | | | | 305,473 | |
| | 275,000 | | | | 3.300 | (a) | | | 02/15/21 | | | | 281,785 | |
| | China Evergrande Group(a) | |
| | 480,000 | | | | 8.750 | | | | 06/28/25 | | | | 486,654 | |
| | Crown Castle International Corp. | |
| | 300,000 | | | | 2.250 | (a) | | | 09/01/21 | | | | 295,861 | |
| | 575,000 | | | | 5.250 | | | | 01/15/23 | | | | 635,450 | |
| | 450,000 | | | | 3.200 | (a) | | | 09/01/24 | | | | 447,864 | |
| | 925,000 | | | | 3.650 | (a) | | | 09/01/27 | | | | 924,492 | |
| | DDR Corp.(a) | |
| | 540,000 | | | | 3.625 | | | | 02/01/25 | | | | 524,973 | |
| | Education Realty Operating Partnership LP(a) | |
| | 750,000 | | | | 4.600 | | | | 12/01/24 | | | | 773,398 | |
| | MPT Operating Partnership LP/MPT Finance Corp.(a) | |
| | 585,000 | | | | 5.000 | | | | 10/15/27 | | | | 599,625 | |
| | National Retail Properties, Inc.(a) | |
| | 400,000 | | | | 4.000 | | | | 11/15/25 | | | | 410,123 | |
| | Select Income REIT(a) | |
| | 125,000 | | | | 2.850 | | | | 02/01/18 | | | | 125,285 | |
| | Trust F/1401(a)(b) | |
| | 300,000 | | | | 5.250 | | | | 12/15/24 | | | | 319,140 | |
| | VEREIT Operating Partnership LP(a) | |
| | 575,000 | | | | 3.000 | | | | 02/06/19 | | | | 579,312 | |
| | 750,000 | | | | 4.125 | | | | 06/01/21 | | | | 784,123 | |
| | 250,000 | | | | 4.875 | | | | 06/01/26 | | | | 268,437 | |
| | WEA Finance LLC/Westfield UK & Europe Finance PLC(a)(b) | |
| | 900,000 | | | | 3.750 | | | | 09/17/24 | | | | 917,488 | |
| | | | | | | | | | | | | | |
| | | | | | | | | | | | | 9,502,873 | |
| | |
| Retailing(a) – 0.6% | | | | |
| | Alimentation Couche-Tard, Inc.(b) | |
| | 575,000 | | | | 2.700 | | | | 07/26/22 | | | | 576,863 | |
| | 250,000 | | | | 3.550 | | | | 07/26/27 | | | | 252,107 | |
| | CVS Health Corp. | |
| | 425,000 | | | | 3.500 | | | | 07/20/22 | | | | 442,118 | |
| | 1,525,000 | | | | 3.375 | | | | 08/12/24 | | | | 1,558,210 | |
| | Dollar Tree, Inc. | |
| | 50,000 | | | | 5.250 | | | | 03/01/20 | | | | 51,375 | |
| | 150,000 | | | | 5.750 | | | | 03/01/23 | | | | 158,062 | |
| | Sally Holdings LLC/Sally Capital, Inc. | |
| | 450,000 | | | | 5.625 | | | | 12/01/25 | | | | 459,000 | |
| | Walgreens Boots Alliance, Inc. | |
| | 200,000 | | | | 2.700 | | | | 11/18/19 | | | | 202,732 | |
| | | | | | | | | | | | | | |
| | | | | | | | | | | | | 3,700,467 | |
| | |
| Semiconductors(a)(b) – 0.4% | |
| | Broadcom Corp./Broadcom Cayman Finance Ltd. | |
| | 1,175,000 | | | | 3.000 | | | | 01/15/22 | | | | 1,194,601 | |
| | 1,375,000 | | | | 3.625 | | | | 01/15/24 | | | | 1,412,643 | |
| | 50,000 | | | | 3.875 | | | | 01/15/27 | | | | 51,499 | |
| | | | | | | | | | | | | | |
| | | | | | | | | | | | | 2,658,743 | |
| | |
| Software(a) – 0.5% | |
| | Fidelity National Information Services, Inc. | |
| | 558,000 | | | | 3.625 | | | | 10/15/20 | | | | 581,055 | |
| | |
| Corporate Obligations – (continued) | |
| Software(a) – (continued) | |
| | Fiserv, Inc. | |
| 675,000 | | | | 2.700 | | | | 06/01/20 | | | | 682,805 | |
| | Microsoft Corp. | |
| | 800,000 | | | | 3.125 | | | | 11/03/25 | | | | 821,948 | |
| | Oracle Corp. | |
| | 775,000 | | | | 2.500 | | | | 05/15/22 | | | | 786,389 | |
| | | | | | | | | | | | | | |
| | | | | | | | | | | | | 2,872,197 | |
| | |
| Sovereign – 0.1% | |
| | NCUA Guaranteed Notes Series A4 | |
| | 600,000 | | | | 3.000 | | | | 06/12/19 | | | | 612,960 | |
| | |
| Supranational – 0.1% | |
| | Inter-American Development Bank | |
| | 700,000 | | | | 1.000 | | | | 02/27/18 | | | | 697,607 | |
| | |
| Telecommunication Services – 2.9% | |
| | AT&T, Inc.(a) | |
| | 250,000 | | | | 2.800 | | | | 02/17/21 | | | | 252,977 | |
| | 1,250,000 | | | | 3.200 | | | | 03/01/22 | | | | 1,274,801 | |
| | 1,375,000 | | | | 3.000 | | | | 06/30/22 | | | | 1,388,387 | |
| | 775,000 | | | | 3.600 | | | | 02/17/23 | | | | 797,387 | |
| | 400,000 | | | | 4.450 | | | | 04/01/24 | | | | 424,415 | |
| | 175,000 | | | | 3.950 | | | | 01/15/25 | | | | 179,746 | |
| | 2,150,000 | | | | 3.400 | | | | 05/15/25 | | | | 2,120,762 | |
| | 600,000 | | | | 4.125 | | | | 02/17/26 | | | | 615,652 | |
| | 1,200,000 | | | | 3.900 | | | | 08/14/27 | | | | 1,202,336 | |
| | Cisco Systems, Inc. | |
| | 650,000 | | | | 2.200 | | | | 02/28/21 | | | | 653,768 | |
| | Digicel Ltd.(a)(b) | |
| | 800,000 | | | | 6.750 | | | | 03/01/23 | | | | 785,000 | |
| | Nokia OYJ | |
| | 579,000 | | | | 4.375 | | | | 06/12/27 | | | | 595,971 | |
| | Sprint Communications, Inc.(b) | |
| | 250,000 | | | | 7.000 | | | | 03/01/20 | | | | 273,438 | |
| | Telecom Italia Capital SA | |
| | 50,000 | | | | 7.200 | | | | 07/18/36 | | | | 61,750 | |
| | Telefonica Emisiones SAU | |
| | 600,000 | | | | 5.134 | | | | 04/27/20 | | | | 643,615 | |
| | 150,000 | | | | 5.462 | | | | 02/16/21 | | | | 164,412 | |
| | Verizon Communications, Inc. | |
| | 981,000 | | | | 2.946 | | | | 03/15/22 | | | | 997,622 | |
| | 2,875,000 | | | | 5.150 | | | | 09/15/23 | | | | 3,222,782 | |
| | 1,775,000 | | | | 4.150 | (a) | | | 03/15/24 | | | | 1,879,256 | |
| | 700,000 | | | | 2.625 | | | | 08/15/26 | | | | 657,353 | |
| | 100,000 | | | | 4.125 | | | | 03/16/27 | | | | 104,341 | |
| | 50,000 | | | | 4.125 | | | | 08/15/46 | | | | 45,453 | |
| | 50,000 | | | | 4.862 | | | | 08/21/46 | | | | 50,683 | |
| | | | | | | | | | | | | | |
| | | | | | | | | | | | | 18,391,907 | |
| | |
| Trucking & Leasing(b) – 0.2% | |
| | Penske Truck Leasing Co. LP/PTL Finance Corp. | |
| | 500,000 | | | | 2.875 | | | | 07/17/18 | | | | 504,663 | |
| | 750,000 | | | | 3.050 | (a) | | | 01/09/20 | | | | 764,262 | |
| | | | | | | | | | | | | | |
| | | | | | | | | | | | | 1,268,925 | |
| | |
| | TOTAL CORPORATE OBLIGATIONS | | | | | |
| | (Cost $176,180,561) | | | $ | 178,729,307 | |
| | |
| | |
| The accompanying notes are an integral part of these financial statements. | | 31 |
GOLDMAN SACHS BOND FUND
Schedule of Investments (continued)
September 30, 2017 (Unaudited)
| | | | | | | | | | | | | | |
Principal
Amount | | | Interest
Rate | | | Maturity
Date | | | Value | |
| Mortgage-Backed Obligations – 29.0% | |
| Adjustable Rate Non-Agency(c) – 2.2% | |
| Countrywide Alternative Loan Trust Series 2006-0C8, Class 2A3
(1M USD LIBOR + 0.250%) |
|
| $ | 1,905,531 | | | | 1.484 | % | | | 11/25/36 | | | $ | 1,348,094 | |
| Credit Suisse European Mortgage Capital Ltd. Series 2015-1HWA,
Class A(b)(e) (3 M EURIBOR + 2.750%) |
|
| | EUR 943,821 | | | | 2.750 | | | | 04/20/20 | | | | 1,107,136 | |
| Deutsche Alt-A Securities Mortgage Loan Trust Series 2007-OA3,
Class A1 (1M LIBOR + 0.140%) |
|
| $ | 431,378 | | | | 1.377 | | | | 07/25/47 | | | | 402,343 | |
| DSLA Mortgage Loan Trust Series 2006-AR2, Class 2A1A
(1M USD LIBOR + 0.200%) |
|
| | 1,751,691 | | | | 1.431 | | | | 10/19/36 | | | | 1,565,171 | |
| FHLMC Structured Agency Credit Risk Debt Notes
Series 2015-DNA1, Class M3 (1M USD LIBOR + 3.300%) |
|
| | 260,000 | | | | 4.534 | | | | 10/25/27 | | | | 288,326 | |
| FHLMC Structured Agency Credit Risk Debt Notes
Series 2015-HQ2, Class M3 (1M USD LIBOR + 3.250%) |
|
| | 1,000,000 | | | | 4.484 | | | | 05/25/25 | | | | 1,094,025 | |
| FNMA Connecticut Avenue Securities Series 2014-C03,
Class 1M1 (1M USD LIBOR + 1.200%) |
|
| | 6,764 | | | | 2.434 | | | | 07/25/24 | | | | 6,770 | |
| Master Adjustable Rate Mortgages Trust Series 2006-OA2,
Class 4A1B (12M MTA + 1.200%) |
|
| | 238,246 | | | | 2.030 | | | | 12/25/46 | | | | 240,525 | |
| Mortgage Repurchase Agreement Financing Trust Series 2016-1,
Class A2(b) (1M USD LIBOR + 0.950%) |
|
| | 550,000 | | | | 2.181 | | | | 04/10/19 | | | | 550,012 | |
| Mortgage Repurchase Agreement Financing Trust Series 2017-1,
Class A1(b) (1M USD LIBOR + 0.850%) |
|
| | 4,150,000 | | | | 2.081 | | | | 07/10/19 | | | | 4,151,066 | |
| Mortgage Repurchase Agreement Financing Trust Series 2017-2,
Class A1(b) (1M USD LIBOR + 0.550%) |
|
| | 2,250,000 | | | | 1.781 | | | | 08/12/19 | | | | 2,250,182 | |
| Station Place Securitization Trust Series 2015-2, Class A(b)
(1M USD LIBOR + 1.050%) |
|
| | 589,528 | | | | 2.279 | | | | 05/15/18 | | | | 589,528 | |
| | |
| TOTAL ADJUSTABLE RATE
NON-AGENCY |
| | $ | 13,593,178 | |
| | |
| Collateralized Mortgage Obligations – 1.5% | |
| Interest Only(f) – 1.3% | |
| | FHLMC REMIC Series 4314, Class SE(c) (-1x1M LIBOR + 6.050%) | |
| | 1,076,792 | | | | 4.816 | | | | 03/15/44 | | | | 187,266 | |
| | FHLMC REMIC Series 4320, Class SD(c) (-1x1M LIBOR + 6.100%) | |
| | 324,312 | | | | 4.866 | | | | 07/15/39 | | | | 50,740 | |
| | FHLMC REMIC Series 4326, Class GS(c) (-1x1M LIBOR + 6.050%) | |
| | 588,475 | | | | 4.816 | | | | 04/15/44 | | | | 101,622 | |
| | FHLMC REMIC Series 4431, Class ST(c) (-1x1M LIBOR + 6.100%) | |
| | 755,238 | | | | 4.873 | | | | 01/15/45 | | | | 150,499 | |
| | FHLMC REMIC Series 4583, Class ST(c) (-1x1M LIBOR + 6.000%) | |
| | 2,123,231 | | | | 4.766 | | | | 05/15/46 | | | | 405,068 | |
| | FHLMC STRIPS Series 304, Class C45 | |
| | 385,986 | | | | 3.000 | | | | 12/15/27 | | | | 35,533 | |
| FNMA REMIC Series 2010-126, Class LS(c) (-1x1M LIBOR +
5.000%) |
|
| | 1,110,972 | | | | 3.768 | | | | 11/25/40 | | | | 166,976 | |
| | |
| Mortgage-Backed Obligations – (continued) | |
| Interest Only(f) – (continued) | |
| FNMA REMIC Series 2011-124, Class SC(c) (1M LIBOR +
6.550%) |
|
| $ | 604,959 | | | | 5.316 | % | | | 12/25/41 | | | $ | 111,590 | |
| FNMA REMIC Series 2012-5, Class SA(c) (-1x1M LIBOR +
5.950%) |
|
| | 807,072 | | | | 4.716 | | | | 02/25/42 | | | | 137,669 | |
| FNMA REMIC Series 2012-88, Class SB(c) (-1x1M LIBOR +
6.670%) |
|
| | 544,310 | | | | 5.436 | | | | 07/25/42 | | | | 101,269 | |
| FNMA REMIC Series 2013-121, Class SA(c) (-1x1M LIBOR +
6.100%) |
|
| | 687,272 | | | | 4.866 | | | | 12/25/43 | | | | 109,035 | |
| FNMA REMIC Series 2013-130, Class SN(c) (-1x1M LIBOR +
6.650%) |
|
| | 1,132,924 | | | | 5.413 | | | | 10/25/42 | | | | 218,908 | |
| FNMA REMIC Series 2013-96, Class SW(c) (-1x1M LIBOR +
6.100%) |
|
| | 310,156 | | | | 4.866 | | | | 09/25/43 | | | | 50,027 | |
| FNMA REMIC Series 2014-6, Class SA(c) (-1x1M LIBOR +
6.600%) |
|
| | 615,278 | | | | 5.366 | | | | 02/25/44 | | | | 113,925 | |
| FNMA REMIC Series 2014-87, Class MS(c) (-1x1M LIBOR +
6.250%) |
|
| | 1,068,421 | | | | 5.016 | | | | 01/25/45 | | | | 175,160 | |
| FNMA REMIC Series 2015-28, Class PS(c) (-1x1M LIBOR +
5.600%) |
|
| | 1,798,701 | | | | 4.366 | | | | 08/25/44 | | | | 267,003 | |
| FNMA REMIC Series 2015-79, Class SA(c) (-1x1M LIBOR +
6.250%) |
|
| | 572,401 | | | | 5.016 | | | | 11/25/45 | | | | 95,993 | |
| FNMA REMIC Series 2015-81, Class SA(c) (-1x1M LIBOR +
5.700%) |
|
| | 2,109,967 | | | | 4.466 | | | | 11/25/45 | | | | 300,967 | |
| FNMA REMIC Series 2015-82, Class MS(c) (-1x1M LIBOR +
5.700%) |
|
| | 699,510 | | | | 4.466 | | | | 11/25/45 | | | | 101,329 | |
| FNMA REMIC Series 2015-86, Class BS(c) (-1x1M LIBOR +
5.700%) |
|
| | 327,023 | | | | 4.463 | | | | 11/25/45 | | | | 46,682 | |
| | FNMA REMIC Series 2016-1, Class SJ(c) (-1x1M LIBOR + 6.150%) | |
| | 1,552,151 | | | | 4.913 | | | | 02/25/46 | | | | 301,946 | |
| | FNMA REMIC Series 2016-3, Class IP | |
| | 1,468,306 | | | | 4.000 | | | | 02/25/46 | | | | 296,681 | |
| FNMA REMIC Series 2016-69, Class BS(c) (-1x1M LIBOR +
6.100%) |
|
| | 3,474,940 | | | | 4.866 | | | | 10/25/46 | | | | 531,440 | |
| GNMA REMIC Series 2010-101, Class S(c) (-1x1M LIBOR +
6.000%) |
|
| | 594,263 | | | | 4.764 | | | | 08/20/40 | | | | 96,072 | |
| GNMA REMIC Series 2010-20, Class SE(c) (-1x1M LIBOR +
6.250%) |
|
| | 1,245,314 | | | | 5.014 | | | | 02/20/40 | | | | 209,123 | |
| GNMA REMIC Series 2010-31, Class SA(c) (-1x1M LIBOR +
5.750%) |
|
| | 467,509 | | | | 4.514 | | | | 03/20/40 | | | | 68,984 | |
| | |
| | |
| 32 | | The accompanying notes are an integral part of these financial statements. |
GOLDMAN SACHS BOND FUND
| | | | | | | | | | | | | | |
Principal
Amount | | | Interest
Rate | | | Maturity
Date | | | Value | |
| Mortgage-Backed Obligations – (continued) | |
| Interest Only(f) – (continued) | |
| GNMA REMIC Series 2012-149, Class MS(c) (-1x1M LIBOR +
6.250%) |
|
| $ | 133,063 | | | | 5.014 | % | | | 12/20/42 | | | $ | 22,227 | |
| GNMA REMIC Series 2013-113, Class SD(c) (-1x1M LIBOR +
6.700%) |
|
| | 459,385 | | | | 5.466 | | | | 08/16/43 | | | | 81,559 | |
| GNMA REMIC Series 2013-134, Class DS(c) (-1x1M LIBOR +
6.100%) |
|
| | 170,501 | | | | 4.864 | | | | 09/20/43 | | | | 27,526 | |
| GNMA REMIC Series 2013-152, Class SG(c) (-1x1M LIBOR +
6.150%) |
|
| | 534,206 | | | | 4.914 | | | | 06/20/43 | | | | 87,630 | |
| GNMA REMIC Series 2013-167, Class SG(c) (-1x1M LIBOR +
6.150%) |
|
| | 248,310 | | | | 4.914 | | | | 11/20/43 | | | | 40,484 | |
| GNMA REMIC Series 2013-181, Class SA(c) (-1x1M LIBOR +
6.100%) |
|
| | 707,587 | | | | 4.864 | | | | 11/20/43 | | | | 117,409 | |
| GNMA REMIC Series 2014-132, Class SL(c) (-1x1M LIBOR +
6.100%) |
|
| | 879,911 | | | | 4.864 | | | | 10/20/43 | | | | 128,178 | |
| GNMA REMIC Series 2014-133, Class BS(c) (-1x1M LIBOR +
5.600%) |
|
| | 430,906 | | | | 4.364 | | | | 09/20/44 | | | | 60,607 | |
| GNMA REMIC Series 2014-162, Class SA(c) (-1x1M LIBOR +
5.600%) |
|
| | 407,474 | | | | 4.364 | | | | 11/20/44 | | | | 57,087 | |
| | GNMA REMIC Series 2014-188, Class IB | |
| | 1,032,151 | | | | 4.000 | | | | 12/20/44 | | | | 151,868 | |
| GNMA REMIC Series 2014-41, Class SA(c) (-1x1M LIBOR +
6.100%) |
|
| | 192,737 | | | | 4.864 | | | | 03/20/44 | | | | 31,865 | |
| GNMA REMIC Series 2015-110, Class MS(c) (-1x1M LIBOR +
5.710%) |
|
| | 2,918,943 | | | | 4.474 | | | | 08/20/45 | | | | 424,195 | |
| | GNMA REMIC Series 2015-111, Class IM | |
| | 1,259,649 | | | | 4.000 | | | | 08/20/45 | | | | 198,649 | |
| | GNMA REMIC Series 2015-117, Class KI | |
| | 1,937,853 | | | | 5.000 | | | | 08/20/45 | | | | 407,318 | |
| GNMA REMIC Series 2015-119, Class SN(c) (-1x1M LIBOR +
6.250%) |
|
| | 593,823 | | | | 5.014 | | | | 08/20/45 | | | | 100,678 | |
| GNMA REMIC Series 2015-123, Class SP(c) (-1x1M LIBOR +
6.250%) |
|
| | 624,654 | | | | 5.014 | | | | 09/20/45 | | | | 104,258 | |
| GNMA REMIC Series 2015-126, Class HS(c) (-1x1M LIBOR +
6.200%) |
|
| | 273,002 | | | | 4.964 | | | | 09/20/45 | | | | 44,462 | |
| | GNMA REMIC Series 2015-14, Class IO | |
| | 929,318 | | | | 5.000 | | | | 10/20/44 | | | | 196,220 | |
| GNMA REMIC Series 2015-167, Class AS(c) (-1x1M LIBOR +
6.250%) |
|
| | 461,580 | | | | 5.014 | | | | 11/20/45 | | | | 73,640 | |
| GNMA REMIC Series 2015-168, Class SD(c) (-1x1M LIBOR +
6.200%) |
|
| | 290,485 | | | | 4.964 | | | | 11/20/45 | | | | 47,199 | |
| | |
| Mortgage-Backed Obligations – (continued) | |
| Interest Only(f) – (continued) | |
| GNMA REMIC Series 2015-57, Class AS(c) (-1x1M LIBOR +
5.600%) |
|
| 2,395,682 | | | | 4.364 | | | | 04/20/45 | | | | 336,886 | |
| GNMA REMIC Series 2015-64, Class SG(c) (-1x1M LIBOR +
5.600%) |
|
| | 1,483,102 | | | | 4.364 | | | | 05/20/45 | | | | 249,291 | |
| | GNMA REMIC Series 2016-109, Class IH | |
| | 1,788,318 | | | | 4.000 | | | | 10/20/45 | | | | 284,289 | |
| | GNMA REMIC Series 2016-27, Class IA | |
| | 945,614 | | | | 4.000 | | | | 06/20/45 | | | | 131,220 | |
| GNMA REMIC Series 2016-4, Class SM(c) (-1x1M LIBOR +
5.650%) |
|
| | 990,424 | | | | 4.414 | | | | 01/20/46 | | | | 137,403 | |
| GNMA REMIC Series 2016-6, Class SB(c) (-1x1M LIBOR +
5.650%) |
|
| | 806,029 | | | | 4.414 | | | | 01/20/46 | | | | 113,986 | |
| | | | | | | | | | | | | | |
| | | | | | | | | | | | | 8,087,641 | |
| | |
| Planned Amortization Class – 0.0% | |
| | FNMA REMIC Series 2005-70, Class PA | |
| | 77,497 | | | | 5.500 | | | | 08/25/35 | | | | 86,497 | |
| | |
| Regular Floater – 0.0% | |
| FNMA REMIC Series 2011-63, Class FG(c) (1M LIBOR +
0.450%) |
|
| | 151,660 | | | | 1.684 | | | | 07/25/41 | | | | 152,446 | |
| | |
| Sequential Fixed Rate – 0.2% | |
| | FNMA REMIC Series 2011-52, Class GB | |
| | 599,184 | | | | 5.000 | | | | 06/25/41 | | | | 657,477 | |
| | FNMA REMIC Series 2012-111, Class B | |
| | 52,524 | | | | 7.000 | | | | 10/25/42 | | | | 60,418 | |
| | FNMA REMIC Series 2012-153, Class B | |
| | 145,888 | | | | 7.000 | | | | 07/25/42 | | | | 169,266 | |
| | | | | | | | | | | | | | |
| | | | | | | | | | | | | 887,161 | |
| | |
| TOTAL COLLATERALIZED MORTGAGE
OBLIGATIONS |
| | $ | 9,213,745 | |
| | |
| Federal Agencies – 25.3% | |
| Adjustable Rate FHLMC (12M USD LIBOR + 1.771%) – 0.0% | |
| $ | 44,837 | | | | 3.041 | % | | | 09/01/35 | | | $ | 47,351 | |
| | |
| FHLMC – 1.2% | | | | | | | | | | |
| | 1,470 | | | | 5.000 | | | | 05/01/18 | | | | 1,507 | |
| | 182,358 | | | | 6.000 | | | | 08/01/27 | | | | 205,142 | |
| | 18,504 | | | | 5.000 | | | | 08/01/33 | | | | 20,249 | |
| | 3,441 | | | | 5.000 | | | | 09/01/33 | | | | 3,765 | |
| | 4,748 | | | | 5.000 | | | | 10/01/33 | | | | 5,196 | |
| | 2,649 | | | | 6.000 | | | | 12/01/33 | | | | 3,028 | |
| | 4,638 | | | | 5.000 | | | | 11/01/34 | | | | 5,077 | |
| | 260,163 | | | | 5.000 | | | | 12/01/34 | | | | 284,728 | |
| | 6,956 | | | | 5.000 | | | | 07/01/35 | | | | 7,613 | |
| | 3,380 | | | | 5.000 | | | | 11/01/35 | | | | 3,698 | |
| | 33,004 | | | | 6.500 | | | | 08/01/37 | | | | 38,465 | |
| | 109,105 | | | | 6.500 | | | | 10/01/37 | | | | 128,099 | |
| | 21,465 | | | | 6.500 | | | | 09/01/38 | | | | 24,588 | |
| | 189,121 | | | | 6.000 | | | | 01/01/39 | | | | 214,198 | |
| | 180,126 | | | | 7.000 | | | | 02/01/39 | | | | 209,674 | |
| | |
| | |
| The accompanying notes are an integral part of these financial statements. | | 33 |
GOLDMAN SACHS BOND FUND
Schedule of Investments (continued)
September 30, 2017 (Unaudited)
| | | | | | | | | | | | | | |
Principal
Amount | | | Interest
Rate | | | Maturity
Date | | | Value | |
| Mortgage-Backed Obligations – (continued) | |
| FHLMC – (continued) | | | | | | | | | | |
| $ | 49,650 | | | | 5.000 | % | | | 03/01/39 | | | $ | 54,060 | |
| | 11,090 | | | | 5.000 | | | | 05/01/39 | | | | 12,075 | |
| | 30,693 | | | | 5.000 | | | | 04/01/40 | | | | 33,777 | |
| | 6,099 | | | | 5.000 | | | | 08/01/40 | | | | 6,682 | |
| | 701,019 | | | | 5.500 | | | | 08/01/40 | | | | 776,584 | |
| | 73,798 | | | | 4.000 | | | | 02/01/41 | | | | 78,135 | |
| | 1,786 | | | | 5.000 | | | | 04/01/41 | | | | 1,964 | |
| | 4,943 | | | | 5.000 | | | | 06/01/41 | | | | 5,416 | |
| | 466,884 | | | | 3.500 | | | | 06/01/45 | | | | 484,902 | |
| | 369,733 | | | | 3.500 | | | | 10/01/45 | | | | 383,887 | |
| | 3,434,054 | | | | 3.500 | | | | 03/01/46 | | | | 3,563,905 | |
| | 881,226 | | | | 3.500 | | | | 06/01/46 | | | | 918,815 | |
| | | | | | | | | | | | | | |
| | | | | | | | | | | | | 7,475,229 | |
| | |
| FNMA – 12.5% | | | | |
| | 1,000,000 | | | | 5.000 | | | | TBA-30yr | (g) | | | 1,091,094 | |
| | 15,429 | | | | 6.000 | | | | 06/01/21 | | | | 16,312 | |
| | 33,031 | | | | 5.000 | | | | 08/01/23 | | | | 34,929 | |
| | 14,066 | | | | 5.500 | | | | 09/01/23 | | | | 14,900 | |
| | 8,455 | | | | 5.500 | | | | 10/01/23 | | | | 8,992 | |
| | 60,022 | | | | 5.000 | | | | 02/01/24 | | | | 63,049 | |
| | 91,680 | | | | 5.500 | | | | 05/01/25 | | | | 93,781 | |
| | 48,543 | | | | 6.000 | | | | 12/01/32 | | | | 54,921 | |
| | 943 | | | | 5.500 | | | | 03/01/33 | | | | 1,049 | |
| | 89,421 | | | | 5.500 | | | | 04/01/33 | | | | 101,114 | |
| | 220 | | | | 6.000 | | | | 05/01/33 | | | | 249 | |
| | 2,466 | | | | 5.000 | | | | 08/01/33 | | | | 2,713 | |
| | 635 | | | | 5.500 | | | | 09/01/33 | | | | 709 | |
| | 21,941 | | | | 5.500 | | | | 12/01/33 | | | | 24,516 | |
| | 107 | | | | 6.000 | | | | 12/01/33 | | | | 122 | |
| | 795 | | | | 5.500 | | | | 02/01/34 | | | | 888 | |
| | 9,965 | | | | 6.000 | | | | 02/01/34 | | | | 11,288 | |
| | 1,927 | | | | 5.500 | | | | 03/01/34 | | | | 2,157 | |
| | 157 | | | | 5.500 | | | | 04/01/34 | | | | 177 | |
| | 4,277 | | | | 5.500 | | | | 09/01/34 | | | | 4,780 | |
| | 1,731 | | | | 5.500 | | | | 10/01/34 | | | | 1,929 | |
| | 5,086 | | | | 5.500 | | | | 12/01/34 | | | | 5,683 | |
| | 32,153 | | | | 5.000 | | | | 04/01/35 | | | | 35,617 | |
| | 156 | | | | 6.000 | | | | 04/01/35 | | | | 178 | |
| | 3,980 | | | | 5.500 | | | | 05/01/35 | | | | 4,442 | |
| | 1,547 | | | | 5.500 | | | | 07/01/35 | | | | 1,736 | |
| | 102,466 | | | | 6.000 | | | | 07/01/35 | | | | 116,917 | |
| | 1,006 | | | | 5.500 | | | | 09/01/35 | | | | 1,128 | |
| | 123,944 | | | | 6.000 | | | | 09/01/35 | | | | 140,461 | |
| | 4,454 | | | | 6.000 | | | | 03/01/36 | | | | 5,079 | |
| | 5,980 | | | | 6.000 | | | | 04/01/36 | | | | 6,816 | |
| | 68 | | | | 5.500 | | | | 02/01/37 | | | | 76 | |
| | 138 | | | | 5.500 | | | | 04/01/37 | | | | 155 | |
| | 3,496 | | | | 5.000 | | | | 02/01/38 | | | | 3,811 | |
| | 10,103 | | | | 5.500 | | | | 02/01/38 | | | | 11,233 | |
| | 189 | | | | 5.500 | | | | 03/01/38 | | | | 212 | |
| | 162 | | | | 5.500 | | | | 06/01/38 | | | | 182 | |
| | 134 | | | | 5.500 | | | | 07/01/38 | | | | 150 | |
| | 150 | | | | 5.500 | | | | 08/01/38 | | | | 168 | |
| | 116 | | | | 5.500 | | | | 09/01/38 | | | | 130 | |
| | 134,482 | | | | 6.000 | | | | 11/01/38 | | | | 150,658 | |
| | |
| Mortgage-Backed Obligations – (continued) | |
| FNMA – (continued) | | | | |
| 50 | | | | 5.500 | | | | 12/01/38 | | | | 56 | |
| | 49,816 | | | | 6.000 | | | | 12/01/38 | | | | 56,710 | |
| | 11,642 | | | | 4.500 | | | | 02/01/39 | | | | 12,510 | |
| | 112,981 | | | | 7.000 | | | | 03/01/39 | | | | 130,916 | |
| | 11,986 | | | | 4.500 | | | | 04/01/39 | | | | 13,087 | |
| | 2,905 | | | | 5.500 | | | | 06/01/39 | | | | 3,257 | |
| | 35,535 | | | | 5.000 | | | | 07/01/39 | | | | 38,843 | |
| | 13,494 | | | | 4.500 | | | | 08/01/39 | | | | 14,734 | |
| | 477,058 | | | | 5.000 | | | | 10/01/39 | | | | 521,474 | |
| | 2,479 | | | | 5.500 | | | | 11/01/39 | | | | 2,779 | |
| | 176,548 | | | | 4.500 | | | | 12/01/39 | | | | 192,768 | |
| | 170,357 | | | | 4.500 | | | | 06/01/40 | | | | 183,530 | |
| | 80,743 | | | | 4.500 | | | | 08/01/41 | | | | 87,253 | |
| | 31,243 | | | | 3.500 | | | | 11/01/41 | | | | 32,412 | |
| | 597,531 | | | | 3.500 | | | | 12/01/41 | | | | 619,146 | |
| | 142,246 | | | | 5.000 | | | | 12/01/41 | | | | 155,569 | |
| | 1,026,456 | | | | 3.500 | | | | 02/01/42 | | | | 1,063,403 | |
| | 1,340,532 | | | | 3.500 | | | | 03/01/42 | | | | 1,388,786 | |
| | 38,051 | | | | 3.500 | | | | 06/01/42 | | | | 39,523 | |
| | 431,579 | | | | 3.500 | | | | 07/01/42 | | | | 447,114 | |
| | 423,878 | | | | 3.500 | | | | 09/01/42 | | | | 439,136 | |
| | 22,088 | | | | 3.500 | | | | 10/01/42 | | | | 22,942 | |
| | 86,232 | | | | 3.000 | | | | 12/01/42 | | | | 87,254 | |
| | 207,275 | | | | 3.000 | | | | 01/01/43 | | | | 209,737 | |
| | 58,897 | | | | 3.000 | | | | 02/01/43 | | | | 59,596 | |
| | 20,605 | | | | 3.000 | | | | 03/01/43 | | | | 20,856 | |
| | 288,698 | | | | 3.000 | | | | 04/01/43 | | | | 292,216 | |
| | 44,466 | | | | 3.000 | | | | 05/01/43 | | | | 45,008 | |
| | 66,798 | | | | 3.500 | | | | 05/01/43 | | | | 69,402 | |
| | 64,520 | | | | 3.000 | | | | 06/01/43 | | | | 65,306 | |
| | 18,169 | | | | 3.000 | | | | 07/01/43 | | | | 18,390 | |
| | 1,028,480 | | | | 3.500 | | | | 07/01/43 | | | | 1,065,104 | |
| | 483,596 | | | | 3.500 | | | | 08/01/43 | | | | 500,939 | |
| | 38,445 | | | | 3.500 | | | | 09/01/43 | | | | 39,955 | |
| | 640,056 | | | | 3.500 | | | | 11/01/43 | | | | 663,095 | |
| | 96,790 | | | | 3.500 | | | | 01/01/44 | | | | 100,594 | |
| | 62,211 | | | | 5.000 | | | | 06/01/44 | | | | 68,206 | |
| | 32,220 | | | | 3.500 | | | | 03/01/45 | | | | 33,243 | |
| | 636,519 | | | | 3.000 | | | | 04/01/45 | | | | 640,696 | |
| | 241,743 | | | | 3.500 | | | | 04/01/45 | | | | 251,016 | |
| | 3,052,500 | | | | 4.500 | | | | 04/01/45 | | | | 3,341,057 | |
| | 357,939 | | | | 4.500 | | | | 05/01/45 | | | | 391,832 | |
| | 65,665 | | | | 3.500 | | | | 06/01/45 | | | | 68,183 | |
| | 25,014 | | | | 3.500 | | | | 09/01/45 | | | | 25,978 | |
| | 48,845 | | | | 3.500 | | | | 10/01/45 | | | | 50,703 | |
| | 45,691 | | | | 3.500 | | | | 11/01/45 | | | | 47,429 | |
| | 987,807 | | | | 4.000 | | | | 11/01/45 | | | | 1,041,191 | |
| | 69,214 | | | | 3.500 | | | | 01/01/46 | | | | 71,848 | |
| | 911,062 | | | | 3.500 | | | | 06/01/46 | | | | 949,711 | |
| | 12,000,000 | | | | 3.500 | | | | TBA-30yr | (g) | | | 12,370,313 | |
| | 46,000,000 | | | | 4.000 | | | | TBA-30yr | (g) | | | 48,425,782 | |
| | | | | | | | | | | | | | |
| | 78,495,089 | |
| | |
| GNMA – 11.6% | |
| | 47,150 | | | | 5.500 | | | | 11/15/32 | | | | 52,806 | |
| | 29,057 | | | | 5.500 | | | | 01/15/33 | | | | 32,504 | |
| | |
| | |
| 34 | | The accompanying notes are an integral part of these financial statements. |
GOLDMAN SACHS BOND FUND
| | | | | | | | | | | | | | |
Principal
Amount | | | Interest
Rate | | | Maturity
Date | | | Value | |
| Mortgage-Backed Obligations – (continued) | |
| GNMA – (continued) | |
| $ | 59,491 | | | | 5.500 | % | | | 02/15/33 | | | $ | 66,181 | |
| | 56,868 | | | | 5.500 | | | | 03/15/33 | | | | 63,263 | |
| | 56,492 | | | | 5.500 | | | | 07/15/33 | | | | 63,049 | |
| | 29,526 | | | | 5.500 | | | | 08/15/33 | | | | 32,847 | |
| | 19,444 | | | | 5.500 | | | | 09/15/33 | | | | 21,631 | |
| | 36,333 | | | | 5.500 | | | | 04/15/34 | | | | 40,407 | |
| | 16,898 | | | | 5.500 | | | | 05/15/34 | | | | 18,793 | |
| | 268,919 | | | | 5.500 | | | | 09/15/34 | | | | 299,073 | |
| | 244,911 | | | | 5.500 | | | | 12/15/34 | | | | 272,373 | |
| | 208,990 | | | | 5.500 | | | | 01/15/35 | | | | 232,425 | |
| | 1,395 | | | | 5.500 | | | | 05/15/36 | | | | 1,568 | |
| | 35,743 | | | | 5.000 | | | | 11/15/40 | | | | 39,283 | |
| | 10,678 | | | | 4.000 | | | | 02/20/41 | | | | 11,367 | |
| | 16,413 | | | | 4.000 | | | | 11/20/41 | | | | 17,438 | |
| | 2,705 | | | | 4.000 | | | | 01/20/42 | | | | 2,874 | |
| | 8,791 | | | | 4.000 | | | | 04/20/42 | | | | 9,341 | |
| | 4,762 | | | | 4.000 | | | | 10/20/42 | | | | 5,060 | |
| | 1,539,280 | | | | 4.000 | | | | 08/20/43 | | | | 1,633,561 | |
| | 1,911,617 | | | | 4.000 | | | | 10/20/43 | | | | 2,028,704 | |
| | 9,488 | | | | 4.000 | | | | 03/20/44 | | | | 10,069 | |
| | 11,540 | | | | 4.000 | | | | 05/20/44 | | | | 12,247 | |
| | 802,233 | | | | 4.000 | | | | 11/20/44 | | | | 850,868 | |
| | 182,311 | | | | 4.000 | | | | 12/20/44 | | | | 193,364 | |
| | 53,577 | | | | 4.000 | | | | 05/20/45 | | | | 56,808 | |
| | 209,762 | | | | 4.000 | | | | 07/20/45 | | | | 222,413 | |
| | 1,801,709 | | | | 4.000 | | | | 08/20/45 | | | | 1,908,686 | |
| | 4,545,616 | | | | 4.000 | | | | 09/20/45 | | | | 4,815,512 | |
| | 5,737,138 | | | | 4.000 | | | | 10/20/45 | | | | 6,077,781 | |
| | 1,858,245 | | | | 4.000 | | | | 11/20/45 | | | | 1,968,578 | |
| | 5,673,370 | | | | 4.000 | | | | 01/20/46 | | | | 6,003,134 | |
| | 1,417,964 | | | | 4.000 | | | | 02/20/46 | | | | 1,500,384 | |
| | 738,358 | | | | 4.000 | | | | 03/20/46 | | | | 781,275 | |
| | 12,746,322 | | | | 4.000 | | | | 04/20/46 | | | | 13,487,202 | |
| | 785,282 | | | | 4.000 | | | | 05/20/46 | | | | 830,927 | |
| | 5,504,534 | | | | 4.000 | | | | 05/20/47 | | | | 5,808,144 | |
| | 7,907,541 | | | | 4.000 | | | | 06/20/47 | | | | 8,348,633 | |
| | 4,973,849 | | | | 4.000 | | | | 07/20/47 | | | | 5,246,354 | |
| | 1,995,570 | | | | 4.000 | | | | 08/20/47 | | | | 2,110,003 | |
| | 6,000,000 | | | | 4.000 | | | | 09/20/47 | | | | 6,328,726 | |
| | 1,000,000 | | | | 4.000 | | | | TBA-30yr | (g) | | | 1,052,148 | |
| | | | | | | | | | | | | | |
| | 72,557,804 | |
| | |
| | TOTAL FEDERAL AGENCIES | | | $ | 158,575,473 | |
| | |
| | TOTAL MORTGAGE-BACKED OBLIGATIONS | |
| | (Cost $179,943,874) | | | | | | | $ | 181,382,396 | |
| | |
| | | | | | | | | | | | | | |
| Agency Debentures – 2.3% | |
| | FHLB | | | | | | | | | | | | | |
| $ | 2,400,000 | | | | 4.625 | % | | | 09/11/20 | | | $ | 2,599,709 | |
| | 400,000 | | | | 5.375 | | | | 08/15/24 | | | | 474,468 | |
| | FNMA | | | | | | | | | | | | | |
| | 4,000,000 | | | | 1.875 | | | | 09/24/26 | | | | 3,803,600 | |
| | 800,000 | | | | 6.250 | | | | 05/15/29 | | | | 1,077,304 | |
| | |
| Agency Debentures – (continued) | |
| | Hashemite Kingdom of Jordan Government AID Bond(h) | |
| 1,600,000 | | | | 2.503 | | | | 10/30/20 | | | | 1,635,776 | |
| | Israel Government AID Bond(h) | |
| | 2,000,000 | | | | 5.500 | | | | 09/18/23 | | | | 2,365,720 | |
| | 300,000 | | | | 5.500 | | | | 12/04/23 | | | | 355,122 | |
| | 877,000 | | | | 5.500 | | | | 04/26/24 | | | | 1,051,154 | |
| | 40,000 | | | | 5.500 | | | | 09/18/33 | | | | 53,053 | |
| | Tennessee Valley Authority | |
| | 1,200,000 | | | | 3.875 | | | | 02/15/21 | | | | 1,280,664 | |
| | |
| | TOTAL AGENCY DEBENTURES | |
| | (Cost $14,482,819) | | | $ | 14,696,570 | |
| | |
| | Asset-Backed Securities(c) – 16.1% | |
| Asset-Backed Securities(c) – 16.1% | |
| Collateralized Loan Obligations(b) – 7.9% | |
| ACIS CLO Ltd. Series 2013-1A, Class A1 (3M USD
LIBOR + 0.870%) |
|
| $ | 2,670,868 | | | | 2.028 | % | | | 04/18/24 | | | $ | 2,672,378 | |
| ACIS CLO Ltd. Series 2013-1A, Class B (3M USD
LIBOR + 1.950%) |
|
| | 597,200 | | | | 3.108 | | | | 04/18/24 | | | | 597,350 | |
| ACIS CLO Ltd. Series 2013-1A, Class C (3M USD
LIBOR + 2.950%) |
|
| | 377,200 | | | | 4.108 | | | | 04/18/24 | | | | 378,000 | |
| ACIS CLO Ltd. Series 2013-2A, Class C1R (3M USD
LIBOR + 1.300%) |
|
| | 519,773 | | | | 2.459 | | | | 10/14/22 | | | | 519,829 | |
| Apidos CLO X Series 2012-10A, Class A (3M USD LIBOR +
1.420%) |
|
| | 1,817,564 | | | | 2.590 | | | | 10/30/22 | | | | 1,819,462 | |
| BlueMountain CLO Ltd. Series 2014-2A, Class AR (3M USD
LIBOR + 0.930%) |
|
| | 3,050,000 | | | | 2.237 | | | | 07/20/26 | | | | 3,062,075 | |
| CBAM Ltd. Series 2017-3A, Class A (3M USD LIBOR +
1.230%) |
|
| | 3,450,000 | | | | 2.599 | | | | 10/17/29 | | | | 3,450,000 | |
| Crown Point CLO III Ltd. Series 2015-3A, Class A1A (3M USD
LIBOR + 1.410%) |
|
| | 3,225,545 | | | | 2.568 | | | | 12/31/27 | | | | 3,228,554 | |
| Crown Point CLO Ltd. Series 2012-1A, Class A1LA (3M USD
LIBOR + 0.750%) |
|
| | 103,922 | | | | 1.922 | | | | 11/21/22 | | | | 103,934 | |
| Crown Point CLO Ltd. Series 2012-1A, Class A2L (3M USD
LIBOR + 2.710%) |
|
| | 130,049 | | | | 3.882 | | | | 11/21/22 | | | | 130,226 | |
| Crown Point CLO Ltd. Series 2012-1A, Class A3L (3M USD
LIBOR + 3.960%) |
|
| | 104,039 | | | | 5.132 | | | | 11/21/22 | | | | 104,261 | |
| Crown Point CLO Ltd. Series 2015-3A, Class A1AR(a) (3M USD
LIBOR + 1.410%) |
|
| | 3,200,000 | | | | 0.000 | | | | 12/31/27 | | | | 3,200,000 | |
| Cutwater Ltd. Series 2014-1A, Class A1AR (3M USD LIBOR +
1.250%) |
|
| | 3,000,000 | | | | 2.469 | | | | 07/15/26 | | | | 3,005,946 | |
| Greywolf CLO V Ltd. Series 2015-1A, Class A1 (3M USD
LIBOR + 1.600%) |
|
| | 1,450,000 | | | | 2.756 | | | | 04/25/27 | | | | 1,452,346 | |
| | |
| | |
| The accompanying notes are an integral part of these financial statements. | | 35 |
GOLDMAN SACHS BOND FUND
Schedule of Investments (continued)
September 30, 2017 (Unaudited)
| | | | | | | | | | | | | | |
Principal
Amount | | | Interest
Rate | | | Maturity
Date | | | Value | |
| Asset-Backed Securities(c) – (continued) | |
| Collateralized Loan Obligations(b) – (continued) | |
| Halcyon Loan Advisors Funding Ltd. Series 2015-1A, Class A
(3M USD LIBOR + 1.450%) |
|
| $ | 1,700,000 | | | | 2.606 | % | | | 04/20/27 | | | $ | 1,701,981 | |
| Halcyon Loan Advisors Funding Ltd. Series 2015-2A, Class A
(3M USD LIBOR + 1.390%) |
|
| | 2,300,000 | | | | 2.546 | | | | 07/25/27 | | | | 2,297,047 | |
| Neuberger Berman CLO XIX Ltd. Series 2015-19A, Class A1R
(3M USD LIBOR + 1.050%) |
|
| | 3,050,000 | | | | 2.354 | | | | 07/15/27 | | | | 3,055,383 | |
| NewMark Capital Funding CLO Ltd. Series 2013-1A, Class A2
(3M USD LIBOR + 1.120%) |
|
| | 2,249,496 | | | | 2.330 | | | | 06/02/25 | | | | 2,251,924 | |
| OCP CLO Ltd. Series 2012-2A, Class A1R (3M USD LIBOR +
1.400%) |
|
| | 1,500,000 | | | | 2.572 | | | | 11/22/25 | | | | 1,508,325 | |
| OFSI Fund V Ltd. Series 2013-5A, Class A1LA (3M USD
LIBOR + 0.930%) |
|
| | 993,128 | | | | 2.088 | | | | 04/17/25 | | | | 993,521 | |
| Recette CLO Ltd. Series 2015-1A, Class AR (3M USD LIBOR +
0.920%) |
|
| | 4,350,000 | | | | 0.000 | | | | 10/20/27 | | | | 4,350,000 | |
| Regatta IV Funding Ltd. Series 2014-1A, Class A1R(3M USD
LIBOR + 1.020%) |
|
| | 1,550,000 | | | | 2.176 | | | | 07/25/26 | | | | 1,551,514 | |
| Voya CLO Ltd. Series 2014-4A, Class A1R (3M USD LIBOR +
0.950%) |
|
| | 4,450,000 | | | | 0.000 | | | | 10/14/26 | | | | 4,454,615 | |
| Whitehorse Ltd. Series 2014-9A, Class AR (3M USD LIBOR +
1.160%) |
|
| | 3,450,000 | | | | 2.464 | | | | 07/17/26 | | | | 3,454,385 | |
| | | | | | | | | | | | | | |
| | | | | 49,343,056 | |
| | |
| Home Equity – 0.6% | |
| Bear Stearns Asset Backed Securities Trust Series 2001-3,
Class A2 (1M LIBOR + 0.400%) |
|
| | 6,614 | | | | 2.037 | | | | 10/27/32 | | | | 6,379 | |
| Bear Stearns Asset Backed Securities Trust Series 2002-2,
Class A1 (1M USD LIBOR + 0.660%) |
|
| | 2,609 | | | | 1.894 | | | | 10/25/32 | | | | 2,605 | |
| CS First Boston Mortgage Securities Corp. Series 2001-HE17,
Class A1 (1M USD LIBOR + 0.620%) |
|
| | 1,316 | | | | 1.854 | | | | 01/25/32 | | | | 1,209 | |
| GMAC Mortgage Home Equity Loan Trust Series 2007-HE3,
Class 1A1 |
|
| | 38,182 | | | | 7.000 | | | | 09/25/37 | | | | 38,682 | |
| GMAC Mortgage Home Equity Loan Trust Series 2007-HE3,
Class 2A1 |
|
| | 31,701 | | | | 7.000 | | | | 09/25/37 | | | | 32,664 | |
| Home Equity Asset Trust Series 2002-1, Class A4 (1M USD
LIBOR + 0.600%) |
|
| | 257 | | | | 1.834 | | | | 11/25/32 | | | | 233 | |
| Home Equity Loan Trust Series 2007-FRE1, Class 2AV3
(1M USD LIBOR + 0.230%) |
|
| | 1,400,000 | | | | 1.464 | | | | 04/25/37 | | | | 1,232,177 | |
| Morgan Stanley Mortgage Loan Trust Series 2007-7AX, Class 1A
(1M USD LIBOR + 0.220%) |
|
| | 3,410,800 | | | | 1.454 | | | | 04/25/37 | | | | 1,557,781 | |
| | |
| Asset-Backed Securities(c) – (continued) | |
| Home Equity – (continued) | |
| Renaissance Home Equity Loan Trust Series 2003-2, Class A
(1M USD LIBOR + 0.880%) |
|
| 1,069 | | | | 2.114 | | | | 08/25/33 | | | | 1,045 | |
| Renaissance Home Equity Loan Trust Series 2003-3, Class A
(1M USD LIBOR + 0.500%) |
|
| | 3,268 | | | | 2.234 | | | | 12/25/33 | | | | 3,223 | |
| Structured Asset Securities Corp. Mortgage Loan Trust Series
2006-BC6, Class A4 (1M USD LIBOR + 0.170%) |
|
| | 1,167,062 | | | | 1.404 | | | | 01/25/37 | | | | 1,125,161 | |
| | | | | | | | | | | | | | |
| | | | | 4,001,159 | |
| | |
| Student Loan – 7.6% | |
| Academic Loan Funding Trust Series 2012-1A, Class A2(b)
(1M USD LIBOR + 1.100%) |
|
| | 2,750,000 | | | | 2.334 | | | | 12/27/44 | | | | 2,744,876 | |
| Access Group, Inc. Series 2004-1, Class A2 (3M USD
LIBOR + 0.210%) |
|
| | 2,600,982 | | | | 1.506 | | | | 09/26/33 | | | | 2,572,286 | |
| ECMC Group Student Loan Trust Series 2016-1A, Class A(b)
(1M USD LIBOR + 1.350%) |
|
| | 2,157,556 | | | | 2.584 | | | | 07/26/66 | | | | 2,158,912 | |
| Edsouth Indenture No. 9 LLC Series 2015-1, Class A(b) (1M USD
LIBOR + 0.800%) |
|
| | 1,310,654 | | | | 2.034 | | | | 10/25/56 | | | | 1,311,459 | |
| EFS Volunteer No. 2 LLC Series 2012-1, Class A2(b) (1M USD
LIBOR + 1.350%) |
|
| | 2,600,000 | | | | 2.584 | | | | 03/25/36 | | | | 2,636,595 | |
| EFS Volunteer No. 3 LLC Series 2012-1, Class A3(b) (1M USD
LIBOR + 1.000%) |
|
| | 1,650,000 | | | | 2.234 | | | | 04/25/33 | | | | 1,649,999 | |
| Montana Higher Education Student Assistance Corp.
Series 2012-1, Class A3 (1M USD LIBOR + 1.050%) |
|
| | 1,500,000 | | | | 2.281 | | | | 07/20/43 | | | | 1,498,539 | |
| Navient Student Loan Trust Series 2016-5A, Class A(b) (1M USD
LIBOR + 1.250%) |
|
| | 4,881,571 | | | | 2.484 | | | | 06/25/65 | | | | 4,979,478 | |
| Navient Student Loan Trust Series 2016-7A, Class A(b) (1M USD
LIBOR + 1.150%) |
|
| | 2,441,719 | | | | 2.384 | | | | 03/25/66 | | | | 2,471,302 | |
| Navient Student Loan Trust Series 2017-2A, Class A(b) (1M USD
LIBOR + 1.050%) |
|
| | 5,346,610 | | | | 2.284 | | | | 12/27/66 | | | | 5,419,656 | |
| Nelnet Student Loan Trust Series 2006-1, Class A6(b) (3M USD
LIBOR + 0.450%) |
|
| | 2,600,000 | | | | 1.636 | | | | 08/23/36 | | | | 2,531,134 | |
| PHEAA Student Loan Trust Series 2016-1A, Class A(b) (1M USD
LIBOR + 1.150%) |
|
| | 2,270,169 | | | | 2.384 | | | | 09/25/65 | | | | 2,310,498 | |
| Scholar Funding Trust Series 2010-A, Class A(b) (3M USD
LIBOR + 0.750%) |
|
| | 556,165 | | | | 1.922 | | | | 10/28/41 | | | | 552,535 | |
| SLM Student Loan Trust Series 2003-7A, Class A5A(b) (3M USD
LIBOR + 1.200%) |
|
| | 2,040,990 | | | | 2.446 | | | | 12/15/33 | | | | 2,066,093 | |
| | |
| | |
| 36 | | The accompanying notes are an integral part of these financial statements. |
GOLDMAN SACHS BOND FUND
| | | | | | | | | | | | | | |
Principal
Amount | | | Interest
Rate | | | Maturity
Date | | | Value | |
| Asset-Backed Securities(c) – (continued) | |
| Student Loan – (continued) | |
| SLM Student Loan Trust Series 2004-8A, Class A6(b) (3M USD
LIBOR + 0.630%) |
|
| $ | 1,300,000 | | | | 1.786 | % | | | 01/25/40 | | | $ | 1,300,382 | |
| SLM Student Loan Trust Series 2005-4, Class A3 (3M USD
LIBOR + 0.120%) |
|
| | 363,631 | | | | 1.276 | | | | 01/25/27 | | | | 362,314 | |
| SLM Student Loan Trust Series 2005-5, Class A4 (3M USD
LIBOR + 0.140%) |
|
| | 1,650,000 | | | | 1.296 | | | | 10/25/28 | | | | 1,641,840 | |
| SLM Student Loan Trust Series 2005-5, Class A5(3M USD
LIBOR + 0.750%) |
|
| | 550,000 | | | | 1.906 | | | | 10/25/40 | | | | 542,259 | |
| SLM Student Loan Trust Series 2006-10, Class A5A (3M USD
LIBOR + 0.100%) |
|
| | 911,109 | | | | 1.256 | | | | 04/25/27 | | | | 908,528 | |
| SLM Student Loan Trust Series 2006-2, Class A5 (3M USD
LIBOR + 0.110%) |
|
| | 1,245,969 | | | | 1.266 | | | | 07/25/25 | | | | 1,245,906 | |
| SLM Student Loan Trust Series 2007-7, Class A4 (3M USD
LIBOR + 0.330%) |
|
| | 1,054,857 | | | | 1.486 | | | | 01/25/22 | | | | 1,038,985 | |
| SLM Student Loan Trust Series 2008-2, Class A3 (3M USD
LIBOR + 0.750%) |
|
| | 290,180 | | | | 1.906 | | | | 04/25/23 | | | | 289,665 | |
| SLM Student Loan Trust Series 2008-4, Class A4 (3M USD
LIBOR + 1.650%) |
|
| | 698,010 | | | | 2.806 | | | | 07/25/22 | | | | 714,676 | |
| SLM Student Loan Trust Series 2008-5, Class A4 (3M USD
LIBOR + 1.700%) |
|
| | 2,134,754 | | | | 2.856 | | | | 07/25/23 | | | | 2,196,115 | |
| SLM Student Loan Trust Series 2008-6, Class A4 (3M USD
LIBOR + 1.100%) |
|
| | 1,400,000 | | | | 2.256 | | | | 07/25/23 | | | | 1,412,502 | |
| SLM Student Loan Trust Series 2008-8, Class A4 (3M USD
LIBOR + 1.500%) |
|
| | 850,000 | | | | 2.656 | | | | 04/25/23 | | | | 869,973 | |
| | | | | | | | | | | | | | |
| | | | | 47,426,507 | |
| | |
| | TOTAL ASSET-BACKED SECURITIES | |
| | (Cost $99,194,336) | | | | | | | $ | 100,770,722 | |
| | |
| | | | | | | | | | | | | | |
| Foreign Debt Obligations – 1.6% | |
| Sovereign – 1.6% | |
| | Brazil Letras do Tesouro Nacional(i) | |
| BRL | 3,072,000 | | | | 0.000 | % | | | 10/01/19 | | | $ | 833,178 | |
| | Dominican Republic | |
| DOP | 100,000 | | | | 10.375 | | | | 03/04/22 | | | | 2,133 | |
| | 300,000 | | | | 14.500 | | | | 02/10/23 | | | | 7,374 | |
| $ | 280,000 | | | | 6.600 | (b) | | | 01/28/24 | | | | 313,600 | |
| | 210,000 | | | | 6.600 | | | | 01/28/24 | | | | 235,200 | |
| | 360,000 | | | | 6.875 | (b) | | | 01/29/26 | | | | 410,400 | |
| | 191,000 | | | | 8.625 | | | | 04/20/27 | | | | 230,394 | |
| DOP | 100,000 | | | | 11.375 | | | | 07/06/29 | | | | 2,180 | |
| $ | 120,000 | | | | 6.850 | | | | 01/27/45 | | | | 133,800 | |
| | |
| Foreign Debt Obligations – (continued) | |
| Sovereign – (continued) | |
| | Perusahaan Penerbit SBSN(b) | |
| 260,000 | | | | 4.325 | | | | 05/28/25 | | | | 272,893 | |
| | 220,000 | | | | 4.150 | | | | 03/29/27 | | | | 226,833 | |
| | Republic of Argentina | |
| EUR | 40,000 | | | | 2.260 | (j) | | | 12/31/38 | | | | 32,266 | |
| $ | 100,000 | | | | 2.500 | (j) | | | 12/31/38 | | | | 70,750 | |
| | 1,330,000 | | | | 7.125 | (b)(d) | | | 06/28/17 | | | | 1,327,340 | |
| | Republic of Ecuador | |
| | 460,000 | | | | 9.650 | | | | 12/13/26 | | | | 483,000 | |
| | 360,000 | | | | 9.625 | | | | 06/02/27 | | | | 376,200 | |
| | 200,000 | | | | 9.625 | (b) | | | 06/02/27 | | | | 209,000 | |
| | Republic of Indonesia(b) | |
| EUR | 250,000 | | | | 2.150 | | | | 07/18/24 | | | | 303,970 | |
| $ | 320,000 | | | | 4.125 | | | | 01/15/25 | | | | 335,786 | |
| | 1,060,000 | | | | 4.750 | | | | 01/08/26 | | | | 1,155,729 | |
| | 810,000 | | | | 3.850 | | | | 07/18/27 | | | | 833,206 | |
| | Republic of South Africa | |
| ZAR | 4,340,000 | | | | 7.000 | | | | 02/28/31 | | | | 266,968 | |
| | 8,375,000 | | | | 8.250 | | | | 03/31/32 | | | | 565,444 | |
| | 1,520,000 | | | | 8.875 | | | | 02/28/35 | | | | 106,079 | |
| | 1,770,000 | | | | 8.500 | | | | 01/31/37 | | | | 117,694 | |
| | 870,000 | | | | 6.500 | | | | 02/28/41 | | | | 45,550 | |
| | 850,000 | | | | 8.750 | | | | 01/31/44 | | | | 56,716 | |
| | 2,717,000 | | | | 8.750 | | | | 02/28/48 | | | | 181,506 | |
| | Republic of Venezuela | |
| $ | 140,000 | | | | 6.000 | | | | 12/09/20 | | | | 53,900 | |
| | 490,000 | | | | 9.250 | | | | 05/07/28 | | | | 167,825 | |
| | United Mexican States | |
| MXN | 3,046,400 | | | | 6.500 | | | | 06/10/21 | | | | 166,034 | |
| | 9,246,500 | | | | 6.500 | | | | 06/09/22 | | | | 502,901 | |
| | 1,887,000 | | | | 8.000 | | | | 12/07/23 | | | | 110,105 | |
| | 1,125,400 | | | | 7.750 | | | | 11/23/34 | | | | 65,486 | |
| | 48,700 | | | | 8.000 | | | | 11/07/47 | | | | 2,914 | |
| | |
| | TOTAL FOREIGN DEBT OBLIGATIONS | |
| | (Cost $9,822,979) | | | | | | | $ | 10,204,354 | |
| | |
| | |
| Structured Notes(i) – 0.9% | |
| | Arab Republic of Egypt (Issuer Citibank NA) | |
| $ | 11,730,000 | | | | 0.000 | %(b) | | | 11/02/17 | | | $ | 654,042 | |
| | 12,000,000 | | | | 0.000 | | | | 11/09/17 | | | | 666,683 | |
| | 5,375,000 | | | | 0.000 | | | | 02/08/18 | | | | 286,136 | |
| | 30,620,000 | | | | 0.000 | (b) | | | 05/03/18 | | | | 1,567,033 | |
| | 24,050,000 | | | | 0.000 | (b) | | | 05/10/18 | | | | 1,223,171 | |
| | Arab Republic of Egypt (Issuer HSBC Bank PLD)(b) | |
| | 8,500,000 | | | | 0.000 | | | | 06/07/18 | | | | 429,098 | |
| | Arab Republic of Egypt (Issuer JPMorgan Chase Bank NA)(b) | |
| EGP | 10,100,000 | | | | 0.000 | | | | 02/15/18 | | | | 535,718 | |
| | 6,675,000 | | | | 0.000 | | | | 05/17/18 | | | | 339,317 | |
| | |
| | TOTAL STRUCTURED NOTES | |
| | (Cost $5,615,990) | | | | | | | $ | 5,701,198 | |
| | |
| | |
| The accompanying notes are an integral part of these financial statements. | | 37 |
GOLDMAN SACHS BOND FUND
Schedule of Investments (continued)
September 30, 2017 (Unaudited)
| | | | | | | | | | | | | | |
Principal
Amount | | | Interest
Rate | | | Maturity
Date | | | Value | |
| Municipal Debt Obligations – 1.2% | |
| California(a) – 0.3% | |
| | California State GO Bonds Build America Taxable Series 2009 | |
| $ | 210,000 | | | | 7.550 | % | | | 04/01/39 | | | $ | 322,056 | |
| | California State GO Bonds Build America Taxable Series 2010 | |
| | 625,000 | | | | 7.950 | | | | 03/01/36 | | | | 704,512 | |
| East Bay Municipal Utility District Water System RB Build
America SubSeries 2010 |
|
| | 900,000 | | | | 5.874 | | | | 06/01/40 | | | | 1,193,580 | |
| | | | | | | | | | | | | | |
| | 2,220,148 | |
| | |
| Illinois – 0.3% | |
| | Illinois State GO Bonds Build America Series 2010(a) | |
| | 115,000 | | | | 6.630 | | | | 02/01/35 | | | | 128,913 | |
| | 730,000 | | | | 7.350 | | | | 07/01/35 | | | | 837,193 | |
| | Illinois State GO Bonds Taxable-Pension Series 2003 | |
| | 965,000 | | | | 5.100 | | | | 06/01/33 | | | | 975,904 | |
| | | | | | | | | | | | | | |
| | 1,942,010 | |
| | |
| Minnesota(a)(c) – 0.1% | |
| Northstar Education Finance, Inc. (Student Loan Asset Backed)
Series 2007-1, Class A1 (3M USD LIBOR + 0.100%) |
|
| | 510,104 | | | | 1.414 | | | | 04/28/30 | | | | 506,921 | |
| | |
| New York(a) – 0.1% | |
| Port Authority of New York & New Jersey Consolidated Bonds-
192 Series 2015 |
|
| | 375,000 | | | | 4.810 | | | | 10/15/65 | | | | 436,706 | |
| | |
| Ohio(a) – 0.1% | |
| American Municipal Power-Ohio, Inc. RB Build America
Taxable Series 2010 |
|
| | 250,000 | | | | 6.270 | | | | 02/15/50 | | | | 328,925 | |
| | |
| Puerto Rico(a) – 0.3% | |
| Puerto Rico Commonwealth Aqueduct & Sewer Authority RB
(Senior Lien) Series 2008 A |
|
| | 85,000 | | | | 6.000 | | | | 07/01/38 | | | | 64,387 | |
| | 5,000 | | | | 6.000 | | | | 07/01/44 | | | | 3,763 | |
| Puerto Rico Commonwealth Aqueduct & Sewer Authority RB
(Senior Lien) Series 2012 A |
|
| | 120,000 | | | | 5.500 | | | | 07/01/28 | | | | 90,000 | |
| | 20,000 | | | | 5.750 | | | | 07/01/37 | | | | 14,500 | |
| | 35,000 | | | | 6.000 | | | | 07/01/47 | | | | 25,813 | |
| Puerto Rico Commonwealth Aqueduct & Sewer Authority RB
(Senior Lien) Series 2012 D |
|
| | 50,000 | | | | 5.000 | | | | 07/01/33 | | | | 35,750 | |
| Puerto Rico Commonwealth GO Bonds for Public Improvement
Series 2011 A(k) |
|
| | 10,000 | | | | 5.750 | | | | 07/01/41 | | | | 4,625 | |
| Puerto Rico Commonwealth GO Bonds Refunding for Public
Improvement Series 2008 A(k) |
|
| | 15,000 | | | | 5.500 | | | | 07/01/32 | | | | 6,919 | |
| Puerto Rico Commonwealth GO Bonds Refunding for Public
Improvement Series 2009 B(k) |
|
| | 10,000 | | | | 5.750 | | | | 07/01/38 | | | | 4,575 | |
| Puerto Rico Commonwealth GO Bonds Refunding for Public
Improvement Series 2012 A(k) |
|
| | 860,000 | | | | 5.750 | | | | 07/01/28 | | | | 402,050 | |
| | 170,000 | | | | 5.000 | | | | 07/01/41 | | | | 77,137 | |
| | |
| Municipal Debt Obligations – (continued) | |
| Puerto Rico(a) – (continued) | |
| | Puerto Rico Commonwealth GO Bonds Series 2014 A(k) | |
| 400,000 | | | | 8.000 | | | | 07/01/35 | | | | 194,000 | |
| Puerto Rico Commonwealth GO Bonds Unrefunded Balance for
Public Improvement Series 2006 A(k) |
|
| | 10,000 | | | | 5.250 | | | | 07/01/27 | | | | 4,650 | |
| Puerto Rico Sales Tax Financing Corp. Sales Tax RB Capital
Appreciation SubSeries 2010 C(i) |
|
| | 15,000 | | | | 0.000 | | | | 08/01/37 | | | | 855 | |
| | 15,000 | | | | 0.000 | | | | 08/01/38 | | | | 801 | |
| Puerto Rico Sales Tax Financing Corp. Sales Tax RB
SubSeries 2009 A(k) |
|
| | 105,000 | | | | 5.250 | | | | 08/01/27 | | | | 21,788 | |
| | 495,000 | | | | 6.750 | | | | 08/01/32 | | | | 103,950 | |
| | 95,000 | | | | 5.750 | | | | 08/01/37 | | | | 19,713 | |
| | 15,000 | | | | 6.375 | | | | 08/01/39 | | | | 3,150 | |
| | 510,000 | | | | 6.000 | | | | 08/01/42 | | | | 105,825 | |
| Puerto Rico Sales Tax Financing Corp. Sales Tax RB
SubSeries 2010 A(k) |
|
| | 25,000 | | | | 4.500 | | | | 08/01/21 | | | | 5,188 | |
| | 50,000 | | | | 6.250 | | | | 08/01/33 | | | | 8,875 | |
| | 80,000 | | | | 5.500 | | | | 08/01/37 | | | | 16,600 | |
| | 135,000 | | | | 5.375 | | | | 08/01/39 | | | | 28,012 | |
| | 605,000 | | | | 5.500 | | | | 08/01/42 | | | | 125,537 | |
| Puerto Rico Sales Tax Financing Corp. Sales Tax RB
SubSeries 2010 C(k) |
|
| | 15,000 | | | | 5.375 | | | | 08/01/38 | | | | 3,113 | |
| | 290,000 | | | | 6.000 | | | | 08/01/39 | | | | 60,175 | |
| | 1,005,000 | | | | 5.250 | | | | 08/01/41 | | | | 208,537 | |
| Puerto Rico Sales Tax Financing Corp. Sales Tax RB
SubSeries 2011 A-1(k) |
|
| | 370,000 | | | | 5.000 | | | | 08/01/43 | | | | 76,775 | |
| | 125,000 | | | | 5.250 | | | | 08/01/43 | | | | 25,938 | |
| Puerto Rico Sales Tax Financing Corp. Sales Tax RB Unrefunded
SubSeries 2009 A(k) |
|
| | 130,000 | | | | 5.500 | | | | 08/01/28 | | | | 26,975 | |
| | | | | | | | | | | | | | |
| | | | | 1,769,976 | |
| | |
| Texas(a)(c) – 0.0% | |
| Brazos Higher Education Authority, Inc. Series 2005-2,
Class I-A-11 (3M USD LIBOR + 0.140%) |
|
| | 211,123 | | | | 1.456 | | | | 09/27/21 | | | | 210,870 | |
| | |
| | TOTAL MUNICIPAL DEBT OBLIGATIONS | |
| | (Cost $9,042,582) | | | | | | | $ | 7,415,556 | |
| | |
| | |
| U.S. Treasury Obligations – 20.8% | |
| | United States Treasury Bonds | |
| $ | 3,960,000 | | | | 2.750 | % | | | 11/15/42 | | | $ | 3,911,054 | |
| | 5,990,000 | | | | 3.625 | (l) | | | 02/15/44 | | | | 6,886,524 | |
| | 4,120,000 | | | | 3.125 | | | | 08/15/44 | | | | 4,347,919 | |
| | 2,080,000 | | | | 3.000 | | | | 11/15/44 | | | | 2,144,085 | |
| | 100,000 | | | | 2.875 | | | | 08/15/45 | | | | 100,510 | |
| | 6,560,000 | | | | 3.000 | (l) | | | 11/15/45 | | | | 6,752,864 | |
| | 14,800,000 | | | | 2.875 | | | | 11/15/46 | | | | 14,854,760 | |
| | |
| | |
| 38 | | The accompanying notes are an integral part of these financial statements. |
GOLDMAN SACHS BOND FUND
| | | | | | | | | | | | | | |
Principal
Amount | | | Interest
Rate | | | Maturity
Date | | | Value | |
| U.S. Treasury Obligations – (continued) | |
| | United States Treasury Inflation Indexed Bonds | |
| $ | 8,683,554 | | | | 0.125 | % | | | 04/15/18 | | | $ | 8,690,761 | |
| | 1,358,097 | | | | 0.125 | | | | 04/15/19 | | | | 1,363,570 | |
| | 365,859 | | | | 0.125 | | | | 04/15/20 | | | | 367,772 | |
| | 1,919,890 | | | | 0.625 | | | | 01/15/24 | | | | 1,961,551 | |
| | 2,015,345 | | | | 0.250 | | | | 01/15/25 | | | | 1,996,562 | |
| | 537,462 | | | | 0.875 | | | | 02/15/47 | | | | 530,174 | |
| | United States Treasury Notes | |
| | 68,060,000 | | | | 2.125 | | | | 07/31/24 | | | | 67,959,269 | |
| | 1,210,000 | | | | 2.375 | | | | 08/15/24 | | | | 1,227,061 | |
| | 4,360,000 | | | | 2.250 | | | | 11/15/25 | | | | 4,360,218 | |
| | United States Treasury Strip Coupon(i) | |
| | 2,800,000 | | | | 0.000 | | | | 02/15/35 | | | | 1,738,744 | |
| | 1,800,000 | | | | 0.000 | | | | 02/15/36 | | | | 1,082,952 | |
| | |
| | TOTAL U.S. TREASURY OBLIGATIONS | |
| | (Cost $129,814,154) | | | | | | | $ | 130,276,350 | |
| | |
| | |
| Shares | | | Rate | | | Value | |
| Preferred Stock(a)(c) – 0.1% | |
| Property Insurance – 0.1% | |
| | Delphi Financial Group, Inc. (3M USD LIBOR + 3.190%) | |
| $ | 26,843 | | | | 4.505% | | | $ | 543,571 | |
| | (Cost $597,116) | |
| | |
| | | | | | | | | | | | | | |
| Shares | | | Distribution
Rate | | | Value | |
| Investment Company(m) – 4.0% | |
| Goldman Sachs Financial Square Government Fund—
Institutional Shares |
|
| | 24,781,528 | | | | 0.927 | | | $ | 24,781,528 | |
| | (Cost $24,781,528) | |
| | |
| TOTAL INVESTMENTS BEFORE SHORT-
TERM INVESTMENTS |
| | | | |
| | (Cost $649,475,939) | | | | | | | $ | 654,501,552 | |
| | |
| | |
Principal
Amount | | | Interest
Rate | | | Maturity
Date | | | Value | |
| Short-term Investments – 2.7% | |
| Certificates of Deposit – 1.9% | |
| | Credit Suisse New York | |
| $ | 2,500,000 | | | | 2.051 | % | | | 11/03/17 | | | $ | 2,502,053 | |
| | UBS AG Stamford | |
| | 2,500,000 | | | | 1.420 | | | | 11/02/17 | | | | 2,500,353 | |
| | The Bank of Tokyo-Mitsubishi UFJ Ltd. | |
| | 2,500,000 | | | | 1.690 | | | | 01/25/18 | | | | 2,502,424 | |
| | Societe Generale SA | |
| | 2,000,000 | | | | 1.590 | | | | 01/18/18 | | | | 2,001,710 | |
| | UBS AG Stamford | |
| | 2,000,000 | | | | 1.530 | | | | 12/19/17 | | | | 2,000,956 | |
| | | | | | | | | | | | | | |
| | | | | 11,507,496 | |
| | |
| Short-term Investments – (continued) | |
| Commercial Paper – 0.8% | |
| | National Australia Bank Ltd. | |
| 2,500,000 | | | | 1.288 | | | | 12/06/17 | | | | 2,501,900 | |
| | Electricite de France SA(i) | |
| | 2,700,000 | | | | 0.000 | | | | 01/05/18 | | | | 2,688,725 | |
| | | | | | | | | | | | | | |
| | | | | | | | | | | | | 5,190,625 | |
| | |
| | TOTAL SHORT-TERM INVESTMENTS | |
| | (Cost $16,686,576) | | | $ | 16,698,121 | |
| | |
| | TOTAL INVESTMENTS — 107.3% | | | | | |
| | (Cost $666,162,515) | | | | | | | | | | | $ | 671,199,673 | |
| | |
| LIABILITIES IN EXCESS OF OTHER
ASSETS — (7.3)% |
| | | (45,464,914 | ) |
| | |
| | NET ASSETS — 100.0% | | | $ | 625,734,759 | |
| | |
| | |
| The percentage shown for each investment category reflects the value of investments in that category as a percentage of net assets. |
(a) | | Security with “Call” features with resetting interest rates. Maturity dates disclosed are the final maturity dates. |
(b) | | Exempt from registration under Rule 144A of the Securities Act of 1933. Such securities may be deemed liquid by the investment adviser and may be resold, normally to qualified institutional buyers in transactions exempt from registration. Total market value of Rule 144A securities amounts to $139,464,001, which represents approximately 22.3% of net assets as of September 30, 2017 and are unaudited. |
(c) | | Variable rate security. Interest rate disclosed is that which is in effect on September 30, 2017. |
(d) | | Actual maturity date is October 12, 2110. |
(e) | | Significant unobservable inputs were used in the valuation of this portfolio security; i.e. Level 3. |
(f) | | Security with a notional or nominal principal amount. The actual effective yield of this security is different than the stated interest rate. |
(g) | | TBA (To Be Announced) Securities are purchased on a forward commitment basis with an approximate principal amount and no defined maturity date. The actual principal and maturity date will be determined upon settlement when the specific mortgage pools are assigned. Total market value of TBA securities (excluding forward sales contracts, if any) amounts to $62,939,337 which represents approximately 10.1% of net assets as of September 30, 2017. |
(h) | | Guaranteed by the United States Government until maturity. Total market value for these securities amounts to $5,460,825, which represents approximately 0.9% of net assets as of September 30, 2017. |
(i) | | Issued with a zero coupon. Income is recognized through the accretion of discount. |
(j) | | Coupon changes periodically based upon a predetermined schedule. Interest rate disclosed is that which is in effect on September 30, 2017. |
(k) | | Security is currently in default and/or non-income producing. |
(l) | | All or a portion of security is segregated as collateral for initial margin requirements on futures transactions. |
(m) | | Represents an Affiliated Issuer. |
| | |
| The accompanying notes are an integral part of these financial statements. | | 39 |
GOLDMAN SACHS BOND FUND
Schedule of Investments (continued)
September 30, 2017 (Unaudited)
| | |
|
Currency Abbreviations: |
ARS | | —Argentine Peso |
AUD | | —Australian Dollar |
BRL | | —Brazilian Real |
CAD | | —Canadian Dollar |
CHF | | —Swiss Franc |
CLP | | —Chilean Peso |
CNH | | —Chinese Yuan Renminbi Offshore |
CNY | | —Chinese Yuan Renminbi |
COP | | —Colombian Peso |
CZK | | —Czech Koruna |
DOP | | —Dominican Peso |
EGP | | —Egyptian Pound |
EUR | | —Euro |
GBP | | —British Pound |
HKD | | —Hong Kong Dollar |
HUF | | —Hungarian Forint |
IDR | | —Indonesian Rupiah |
INR | | —Indian Rupee |
JPY | | —Japanese Yen |
KRW | | —South Korean Won |
MXN | | —Mexican Peso |
NOK | | —Norwegian Krone |
NZD | | —New Zealand Dollar |
PEN | | —Peruvian Nuevo Sol |
PHP | | —Philippine Peso |
PLN | | —Polish Zloty |
RUB | | —Russian Ruble |
SEK | | —Swedish Krona |
SGD | | —Singapore Dollar |
THB | | —Thai Baht |
TRY | | —Turkish Lira |
TWD | | —Taiwan Dollar |
USD | | —U.S. Dollar |
ZAR | | —South African Rand |
| | |
Investment Abbreviations: |
AUDOR | | —Australian Dollar Offered Rate |
CDOR | | —Canadian Dollar Offered Rate |
CHFOR | | —Swiss Franc Offered Rate |
CLO | | —Collateralized Loan Obligation |
EURO | | —Euro Offered Rate |
FHLB | | —Federal Home Loan Bank |
FHLMC | | —Federal Home Loan Mortgage Corp. |
FNMA | | —Federal National Mortgage Association |
GBP | | —British Pound Offered Rate |
GMAC | | —General Motors Acceptance Corporation |
GNMA | | —Government National Mortgage Association |
GO | | —General Obligation |
JYOR | | —Japanese Yen Offered Rate |
KWCDC | | —South Korean Won Certificate of Deposit |
LIBOR | | —London Interbank Offered Rate |
LLC | | —Limited Liability Company |
LP | | —Limited Partnership |
MTA | | —Monthly Treasury Average Index |
NCUA | | —National Credit Union Administration |
NIBOR | | —Norwegian Interbank Offered Rate |
NZDOR | | —New Zealand Dollar Offered Rate |
OTC | | —Over the Counter |
PLC | | —Public Limited Company |
RB | | —Revenue Bond |
REIT | | —Real Estate Investment Trust |
REMIC | | —Real Estate Mortgage Investment Conduit |
STIBOR | | —Stockholm Interbank Offered Rate |
STRIPS | | —Separate Trading of Registered Interest and Principal of Securities |
TIIE | | —La Tasa de Interbank Equilibrium Interest Rate |
|
| | |
| 40 | | The accompanying notes are an integral part of these financial statements. |
GOLDMAN SACHS BOND FUND
|
| ADDITIONAL INVESTMENT INFORMATION |
FORWARD FOREIGN CURRENCY EXCHANGE CONTRACTS — At September 30, 2017, the Fund had the following forward foreign currency exchange contracts:
FORWARD FOREIGN CURRENCY EXCHANGE CONTRACTS WITH UNREALIZED GAIN
| | | | | | | | | | | | | | | | | | | | | | | | |
| Counterparty | | Currency
Purchased | | | Currency
Sold | | | Current
Value | | | Settlement
Date | | | Unrealized
Gain | |
Morgan Stanley & Co. International PLC | | ARS | | | 9,725,445 | | | USD | | | 553,000 | | | $ | 560,189 | | | | 10/05/17 | | | $ | 7,185 | |
| | ARS | | | 14,423,256 | | | USD | | | 824,326 | | | | 830,306 | | | | 10/06/17 | | | | 5,978 | |
| | ARS | | | 19,814,733 | | | USD | | | 1,103,545 | | | | 1,138,059 | | | | 10/10/17 | | | | 34,514 | |
| | ARS | | | 3,552,199 | | | USD | | | 203,331 | | | | 203,903 | | | | 10/11/17 | | | | 572 | |
| | ARS | | | 1,760,919 | | | USD | | | 100,710 | | | | 101,022 | | | | 10/12/17 | | | | 312 | |
| | ARS | | | 15,597,826 | | | USD | | | 874,507 | | | | 889,221 | | | | 10/23/17 | | | | 14,714 | |
| | ARS | | | 8,788,561 | | | USD | | | 500,402 | | | | 500,459 | | | | 10/25/17 | | | | 57 | |
| | ARS | | | 6,826,548 | | | USD | | | 381,353 | | | | 387,630 | | | | 10/30/17 | | | | 6,277 | |
| | ARS | | | 12,695,100 | | | USD | | | 706,461 | | | | 720,466 | | | | 11/01/17 | | | | 14,006 | |
| | ARS | | | 7,219,106 | | | USD | | | 404,971 | | | | 409,471 | | | | 11/02/17 | | | | 4,500 | |
| | ARS | | | 8,782,795 | | | USD | | | 493,610 | | | | 496,802 | | | | 11/07/17 | | | | 3,192 | |
| | ARS | | | 8,950,149 | | | USD | | | 504,234 | | | | 505,992 | | | | 11/08/17 | | | | 1,758 | |
| | ARS | | | 15,731,646 | | | USD | | | 884,177 | | | | 886,956 | | | | 11/13/17 | | | | 2,779 | |
| | ARS | | | 6,253,815 | | | USD | | | 350,944 | | | | 351,825 | | | | 11/17/17 | | | | 882 | |
| | ARS | | | 5,338,872 | | | USD | | | 296,028 | | | | 299,214 | | | | 11/24/17 | | | | 3,185 | |
| | AUD | | | 1,796,369 | | | USD | | | 1,404,794 | | | | 1,407,731 | | | | 12/20/17 | | | | 2,936 | |
| | BRL | | | 17,718,863 | | | USD | | | 5,564,368 | | | | 5,592,080 | | | | 10/03/17 | | | | 27,712 | |
| | BRL | | | 23,525,850 | | | USD | | | 7,338,341 | | | | 7,392,870 | | | | 11/03/17 | | | | 54,530 | |
| | CAD | | | 271,725 | | | AUD | | | 275,000 | | | | 217,886 | | | | 12/20/17 | | | | 2,381 | |
| | CAD | | | 297,002 | | | USD | | | 238,121 | | | | 238,155 | | | | 12/20/17 | | | | 34 | |
| | CHF | | | 3,204,141 | | | EUR | | | 2,784,289 | | | | 3,327,468 | | | | 12/20/17 | | | | 21,515 | |
| | CNH | | | 14,158,975 | | | USD | | | 2,114,405 | | | | 2,119,851 | | | | 12/20/17 | | | | 5,446 | |
| | CZK | | | 55,572,658 | | | EUR | | | 2,098,435 | | | | 2,528,384 | | | | 10/03/17 | | | | 47,839 | |
| | CZK | | | 25,499,073 | | | EUR | | | 955,000 | | | | 1,162,375 | | | | 11/09/17 | | | | 31,246 | |
| | CZK | | | 40,570,484 | | | EUR | | | 1,516,609 | | | | 1,850,619 | | | | 11/21/17 | | | | 53,134 | |
| | CZK | | | 67,770,681 | | | EUR | | | 2,591,512 | | | | 3,091,523 | | | | 11/22/17 | | | | 19,894 | |
| | CZK | | | 195,446,562 | | | EUR | | | 7,511,668 | | | | 8,940,163 | | | | 12/20/17 | | | | 21,115 | |
| | CZK | | | 47,731,165 | | | EUR | | | 1,789,697 | | | | 2,186,229 | | | | 01/03/18 | | | | 59,425 | |
| | EUR | | | 470,000 | | | CHF | | | 536,482 | | | | 558,059 | | | | 12/20/17 | | | | 928 | |
| | EUR | | | 240,350 | | | GBP | | | 212,094 | | | | 285,382 | | | | 12/20/17 | | | | 453 | |
| | EUR | | | 462,000 | | | HUF | | | 143,246,246 | | | | 548,560 | | | | 12/20/17 | | | | 3,163 | |
| | EUR | | | 1,864,000 | | | NOK | | | 17,373,989 | | | | 2,213,237 | | | | 12/20/17 | | | | 27,679 | |
| | EUR | | | 659,001 | | | PLN | | | 2,830,313 | | | | 782,470 | | | | 12/20/17 | | | | 6,648 | |
| | EUR | | | 609,000 | | | SEK | | | 5,791,210 | | | | 723,102 | | | | 12/20/17 | | | | 8,598 | |
| | EUR | | | 6,609,521 | | | USD | | | 7,794,459 | | | | 7,816,923 | | | | 10/12/17 | | | | 22,464 | |
| | EUR | | | 3,593,248 | | | USD | | | 4,249,762 | | | | 4,266,477 | | | | 12/20/17 | | | | 16,714 | |
| | GBP | | | 1,648,200 | | | EUR | | | 1,840,114 | | | | 2,214,206 | | | | 12/20/17 | | | | 29,329 | |
| | GBP | | | 410,000 | | | JPY | | | 61,612,750 | | | | 550,798 | | | | 12/20/17 | | | | 998 | |
| | GBP | | | 2,179,369 | | | USD | | | 2,921,978 | | | | 2,924,550 | | | | 11/16/17 | | | | 2,572 | |
| | GBP | | | 1,595,218 | | | USD | | | 2,124,520 | | | | 2,143,030 | | | | 12/20/17 | | | | 18,510 | |
| | HKD | | | 11,654,158 | | | USD | | | 1,491,644 | | | | 1,492,013 | | | | 10/03/17 | | | | 369 | |
| | HKD | | | 17,278,809 | | | USD | | | 2,219,000 | | | | 2,220,861 | | | | 03/27/18 | | | | 1,861 | |
| | IDR | | | 15,309,804,385 | | | USD | | | 1,126,095 | | | | 1,133,440 | | | | 11/02/17 | | | | 7,346 | |
| | IDR | | | 22,408,094,760 | | | USD | | | 1,641,619 | | | | 1,650,101 | | | | 12/20/17 | | | | 8,482 | |
| | IDR | | | 14,389,393,898 | | | USD | | | 1,051,472 | | | | 1,059,489 | | | | 12/21/17 | | | | 8,017 | |
| | INR | | | 21,746,104 | | | USD | | | 331,000 | | | | 331,288 | | | | 11/03/17 | | | | 288 | |
| | INR | | | 69,132,872 | | | USD | | | 1,043,169 | | | | 1,045,145 | | | | 01/12/18 | | | | 1,977 | |
| | JPY | | | 61,838,770 | | | EUR | | | 461,000 | | | | 551,817 | | | | 12/20/17 | | | | 4,444 | |
| | |
| The accompanying notes are an integral part of these financial statements. | | 41 |
GOLDMAN SACHS BOND FUND
Schedule of Investments (continued)
September 30, 2017 (Unaudited)
|
| ADDITIONAL INVESTMENT INFORMATION (continued) |
FORWARD FOREIGN CURRENCY EXCHANGE CONTRACTS WITH UNREALIZED GAIN (continued)
| | | | | | | | | | | | | | | | | | | | | | | | |
| Counterparty | | Currency
Purchased | | | Currency
Sold | | | Current
Value | | | Settlement
Date | | | Unrealized
Gain | |
Morgan Stanley & Co. International PLC (continued) | | JPY | | | 494,842,181 | | | USD | | | 4,414,004 | | | $ | 4,415,711 | | | | 12/20/17 | | | $ | 1,706 | |
| | KRW | | | 627,664,242 | | | USD | | | 548,178 | | | | 548,218 | | | | 10/12/17 | | | | 40 | |
| | KRW | | | 119,207,882 | | | USD | | | 104,108 | | | | 104,127 | | | | 10/25/17 | | | | 19 | |
| | NZD | | | 1,482,672 | | | USD | | | 1,068,014 | | | | 1,069,239 | | | | 12/20/17 | | | | 1,225 | |
| | PHP | | | 55,194,434 | | | USD | | | 1,075,972 | | | | 1,084,982 | | | | 10/05/17 | | | | 9,011 | |
| | PHP | | | 46,460,735 | | | USD | | | 906,760 | | | | 912,598 | | | | 10/10/17 | | | | 5,838 | |
| | PHP | | | 28,584,064 | | | USD | | | 559,704 | | | | 561,113 | | | | 10/19/17 | | | | 1,409 | |
| | PHP | | | 90,241,946 | | | USD | | | 1,759,445 | | | | 1,768,202 | | | | 11/14/17 | | | | 8,757 | |
| | PLN | | | 2,035,954 | | | EUR | | | 470,000 | | | | 558,080 | | | | 12/20/17 | | | | 20 | |
| | PLN | | | 1,497,311 | | | HUF | | | 107,382,048 | | | | 410,431 | | | | 12/20/17 | | | | 1,583 | |
| | RUB | | | 181,768,838 | | | USD | | | 3,093,000 | | | | 3,111,099 | | | | 12/14/17 | | | | 18,099 | |
| | SEK | | | 11,665,048 | | | EUR | | | 1,208,928 | | | | 1,439,202 | | | | 12/20/17 | | | | 3,771 | |
| | SGD | | | 299,862 | | | USD | | | 221,000 | | | | 221,264 | | | | 12/20/17 | | | | 264 | |
| | TRY | | | 4,044,360 | | | USD | | | 1,104,036 | | | | 1,108,585 | | | | 12/20/17 | | | | 4,548 | |
| | TWD | | | 32,274,415 | | | USD | | | 1,057,103 | | | | 1,063,040 | | | | 10/20/17 | | | | 5,937 | |
| | TWD | | | 21,335,815 | | | USD | | | 701,962 | | | | 702,958 | | | | 10/26/17 | | | | 995 | |
| | USD | | | 560,544 | | | ARS | | | 9,725,445 | | | | 560,189 | | | | 10/05/17 | | | | 355 | |
| | USD | | | 1,210,926 | | | AUD | | | 1,513,658 | | | | 1,186,735 | | | | 11/08/17 | | | | 24,192 | |
| | USD | | | 12,376,632 | | | AUD | | | 15,482,360 | | | | 12,132,801 | | | | 12/20/17 | | | | 243,830 | |
| | USD | | | 2,212,000 | | | BRL | | | 6,954,931 | | | | 2,194,979 | | | | 10/03/17 | | | | 17,021 | |
| | USD | | | 811,622 | | | BRL | | | 2,577,392 | | | | 809,932 | | | | 11/03/17 | | | | 1,692 | |
| | USD | | | 226,861 | | | BRL | | | 724,708 | | | | 226,795 | | | | 12/04/17 | | | | 66 | |
| | USD | | | 1,664,049 | | | CAD | | | 2,025,314 | | | | 1,623,579 | | | | 11/06/17 | | | | 40,470 | |
| | USD | | | 6,163,889 | | | CAD | | | 7,604,873 | | | | 6,098,065 | | �� | | 12/20/17 | | | | 65,827 | |
| | USD | | | 551,000 | | | CHF | | | 527,434 | | | | 547,735 | | | | 12/20/17 | | | | 3,265 | |
| | USD | | | 555,000 | | | CLP | | | 342,919,515 | | | | 535,660 | | | | 10/12/17 | | | | 19,340 | |
| | USD | | | 545,897 | | | CLP | | | 341,613,527 | | | | 533,569 | | | | 10/16/17 | | | | 12,327 | |
| | USD | | | 3,570,564 | | | CNH | | | 23,733,770 | | | | 3,553,367 | | | | 12/20/17 | | | | 17,197 | |
| | USD | | | 258,493 | | | CNY | | | 1,722,960 | | | | 258,491 | | | | 11/10/17 | | | | 3 | |
| | USD | | | 551,000 | | | COP | | | 1,610,909,110 | | | | 546,702 | | | | 10/25/17 | | | | 4,298 | |
| | USD | | | 442,678 | | | EUR | | | 371,292 | | | | 439,118 | | | | 10/12/17 | | | | 3,560 | |
| | USD | | | 21,477,722 | | | EUR | | | 17,894,772 | | | | 21,247,523 | | | | 12/20/17 | | | | 230,198 | |
| | USD | | | 2,699,000 | | | GBP | | | 1,998,845 | | | | 2,685,268 | | | | 12/20/17 | | | | 13,733 | |
| | USD | | | 2,345,014 | | | HKD | | | 18,168,227 | | | | 2,325,971 | | | | 10/03/17 | | | | 19,043 | |
| | USD | | | 2,707,159 | | | HKD | | | 21,024,387 | | | | 2,692,135 | | | | 10/10/17 | | | | 15,024 | |
| | USD | | | 6,792,997 | | | HKD | | | 52,570,157 | | | | 6,756,890 | | | | 03/27/18 | | | | 36,107 | |
| | USD | | | 2,086,000 | | | HKD | | | 16,158,500 | | | | 2,078,434 | | | | 05/11/18 | | | | 7,566 | |
| | USD | | | 2,757,000 | | | HKD | | | 21,389,181 | | | | 2,756,018 | | | | 09/19/18 | | | | 982 | |
| | USD | | | 1,255,016 | | | IDR | | | 16,597,688,617 | | | | 1,231,189 | | | | 10/10/17 | | | | 23,827 | |
| | USD | | | 536,916 | | | IDR | | | 7,215,615,300 | | | | 534,963 | | | | 10/16/17 | | | | 1,953 | |
| | USD | | | 1,653,000 | | | IDR | | | 21,965,427,660 | | | | 1,628,225 | | | | 10/18/17 | | | | 24,775 | |
| | USD | | | 543,013 | | | INR | | | 35,485,916 | | | | 542,669 | | | | 10/05/17 | | | | 344 | |
| | USD | | | 1,263,672 | | | INR | | | 80,929,373 | | | | 1,236,581 | | | | 10/10/17 | | | | 27,092 | |
| | USD | | | 4,334,171 | | | INR | | | 278,479,939 | | | | 4,250,587 | | | | 10/18/17 | | | | 83,584 | |
| | USD | | | 1,092,313 | | | INR | | | 70,949,949 | | | | 1,081,942 | | | | 10/25/17 | | | | 10,371 | |
| | USD | | | 830,696 | | | JPY | | | 90,480,630 | | | | 805,106 | | | | 10/25/17 | | | | 25,590 | |
| | USD | | | 2,594,669 | | | JPY | | | 285,981,445 | | | | 2,551,948 | | | | 12/20/17 | | | | 42,722 | |
| | USD | | | 1,789,548 | | | KRW | | | 2,040,978,941 | | | | 1,782,147 | | | | 10/02/17 | | | | 7,400 | |
| | USD | | | 3,300,125 | | | KRW | | | 3,766,198,844 | | | | 3,289,457 | | | | 10/10/17 | | | | 10,669 | |
| | USD | | | 2,263,637 | | | KRW | | | 2,559,922,529 | | | | 2,235,901 | | | | 10/12/17 | | | | 27,736 | |
| | USD | | | 765,713 | | | KRW | | | 867,713,524 | | | | 757,939 | | | | 10/25/17 | | | | 7,774 | |
| | |
| 42 | | The accompanying notes are an integral part of these financial statements. |
GOLDMAN SACHS BOND FUND
|
| ADDITIONAL INVESTMENT INFORMATION (continued) |
FORWARD FOREIGN CURRENCY EXCHANGE CONTRACTS WITH UNREALIZED GAIN (continued)
| | | | | | | | | | | | | | | | | | | | | | | | |
| Counterparty | | Currency
Purchased | | | Currency
Sold | | | Current
Value | | | Settlement
Date | | | Unrealized
Gain | |
Morgan Stanley & Co. International PLC (continued) | | USD | | | 3,723,733 | | | KRW | | | 4,248,474,292 | | | $ | 3,711,538 | | | | 11/10/17 | | | $ | 12,195 | |
| | USD | | | 798,992 | | | MXN | | | 14,329,763 | | | | 786,101 | | | | 10/06/17 | | | | 12,891 | |
| | USD | | | 4,394,396 | | | MXN | | | 79,339,101 | | | | 4,300,692 | | | | 12/20/17 | | | | 93,705 | |
| | USD | | | 3,086,184 | | | NZD | | | 4,248,000 | | | | 3,063,474 | | | | 12/20/17 | | | | 22,710 | |
| | USD | | | 492,328 | | | PHP | | | 25,039,112 | | | | 491,827 | | | | 10/10/17 | | | | 501 | |
| | USD | | | 1,104,000 | | | PHP | | | 56,032,840 | | | | 1,099,415 | | | | 10/26/17 | | | | 4,585 | |
| | USD | | | 221,000 | | | PHP | | | 11,247,662 | | | | 220,594 | | | | 11/02/17 | | | | 406 | |
| | USD | | | 2,053,356 | | | RUB | | | 119,464,877 | | | | 2,044,723 | | | | 12/14/17 | | | | 8,633 | |
| | USD | | | 863,868 | | | SEK | | | 6,868,358 | | | | 844,181 | | | | 10/19/17 | | | | 19,687 | |
| | USD | | | 3,072,165 | | | SGD | | | 4,127,570 | | | | 3,045,682 | | | | 12/20/17 | | | | 26,482 | |
| | USD | | | 554,000 | | | THB | | | 18,460,704 | | | | 553,583 | | | | 10/11/17 | | | | 417 | |
| | USD | | | 4,506,294 | | | TRY | | | 16,194,742 | | | | 4,439,080 | | | | 12/20/17 | | | | 67,216 | |
| | USD | | | 1,473,746 | | | TWD | | | 44,020,901 | | | | 1,450,920 | | | | 10/02/17 | | | | 22,826 | |
| | USD | | | 221,000 | | | TWD | | | 6,626,685 | | | | 218,256 | | | | 10/19/17 | | | | 2,744 | |
| | USD | | | 8,282,977 | | | TWD | | | 249,666,593 | | | | 8,223,400 | | | | 10/20/17 | | | | 59,577 | |
| | USD | | | 2,938,939 | | | TWD | | | 88,547,353 | | | | 2,916,964 | | | | 10/23/17 | | | | 21,975 | |
| | USD | | | 1,670,164 | | | TWD | | | 50,447,318 | | | | 1,662,103 | | | | 10/26/17 | | | | 8,062 | |
| | USD | | | 268,200 | | | TWD | | | 8,129,421 | | | | 267,895 | | | | 10/31/17 | | | | 305 | |
| | USD | | | 4,685,837 | | | TWD | | | 140,044,161 | | | | 4,617,551 | | | | 11/10/17 | | | | 68,286 | |
| | USD | | | 884,995 | | | ZAR | | | 11,901,148 | | | | 872,640 | | | | 11/14/17 | | | | 12,355 | |
| | USD | | | 257,384 | | | ZAR | | | 3,527,267 | | | | 257,153 | | | | 12/20/17 | | | | 230 | |
| | | ZAR | | | 22,865,108 | | | USD | | | 1,661,000 | | | | 1,666,962 | | | | 12/20/17 | | | | 5,963 | |
| TOTAL | | | | | | | | $ | 2,222,864 | |
FORWARD FOREIGN CURRENCY EXCHANGE CONTRACTS WITH UNREALIZED LOSS
| | | | | | | | | | | | | | | | | | | | | | | | |
| Counterparty | | Currency
Purchased | | | Currency
Sold | | | Current
Value | | | Settlement
Date | | | Unrealized
Loss | |
Morgan Stanley & Co. International PLC | | ARS | | | 9,725,445 | | | USD | | | 552,112 | | | | 551,329 | | | | 11/03/17 | | | | (782 | ) |
| | ARS | | | 23,751,128 | | | USD | | | 1,348,688 | | | | 1,333,285 | | | | 11/21/17 | | | | (15,403 | ) |
| | ARS | | | 7,196,276 | | | USD | | | 405,082 | | | | 403,311 | | | | 11/24/17 | | | | (1,771 | ) |
| | AUD | | | 688,000 | | | NZD | | | 756,917 | | | | 539,153 | | | | 12/20/17 | | | | (6,702 | ) |
| | AUD | | | 1,403,634 | | | USD | | | 1,122,907 | | | | 1,100,474 | | | | 11/08/17 | | | | (22,433 | ) |
| | AUD | | | 10,079,484 | | | USD | | | 7,993,729 | | | | 7,898,819 | | | | 12/20/17 | | | | (94,908 | ) |
| | BRL | | | 18,623,596 | | | USD | | | 5,935,300 | | | | 5,877,613 | | | | 10/03/17 | | | | (57,687 | ) |
| | BRL | | | 3,383,930 | | | USD | | | 1,059,133 | | | | 1,058,989 | | | | 12/04/17 | | | | (144 | ) |
| | CAD | | | 3,594,797 | | | USD | | | 2,953,576 | | | | 2,881,744 | | | | 11/06/17 | | | | (71,832 | ) |
| | CAD | | | 10,141,136 | | | USD | | | 8,295,097 | | | | 8,131,798 | | | | 12/20/17 | | | | (163,300 | ) |
| | CNH | | | 28,271,392 | | | USD | | | 4,279,444 | | | | 4,232,730 | | | | 12/20/17 | | | | (46,714 | ) |
| | CNY | | | 7,403,744 | | | USD | | | 1,122,416 | | | | 1,112,061 | | | | 10/26/17 | | | | (10,355 | ) |
| | CNY | | | 7,198,163 | | | USD | | | 1,086,105 | | | | 1,077,317 | | | | 12/14/17 | | | | (8,789 | ) |
| | COP | | | 3,240,551,878 | | | USD | | | 1,114,089 | | | | 1,099,761 | | | | 10/25/17 | | | | (14,328 | ) |
| | EUR | | | 2,725,967 | | | CHF | | | 3,134,381 | | | | 3,236,702 | | | | 12/20/17 | | | | (18,319 | ) |
| | EUR | | | 2,135,767 | | | CZK | | | 55,572,658 | | | | 2,524,676 | | | | 10/03/17 | | | | (3,709 | ) |
| | EUR | | | 3,224,645 | | | GBP | | | 2,872,812 | | | | 3,828,812 | | | | 12/20/17 | | | | (30,549 | ) |
| | EUR | | | 3,682,800 | | | USD | | | 4,417,197 | | | | 4,372,805 | | | | 12/20/17 | | | | (44,392 | ) |
| | GBP | | | 4,081,378 | | | EUR | | | 4,621,000 | | | | 5,482,960 | | | | 12/20/17 | | | | (3,828 | ) |
| | |
| The accompanying notes are an integral part of these financial statements. | | 43 |
GOLDMAN SACHS BOND FUND
Schedule of Investments (continued)
September 30, 2017 (Unaudited)
|
| ADDITIONAL INVESTMENT INFORMATION (continued) |
FORWARD FOREIGN CURRENCY EXCHANGE CONTRACTS WITH UNREALIZED LOSS (continued)
| | | | | | | | | | | | | | | | | | | | | | | | |
| Counterparty | | Currency
Purchased | | | Currency
Sold | | | Current
Value | | | Settlement
Date | | | Unrealized
Loss | |
Morgan Stanley & Co. International PLC (continued) | | GBP | | | 5,233,536 | | | USD | | | 7,117,472 | | | $ | 7,030,780 | | | | 12/20/17 | | | $ | (86,692 | ) |
| | HKD | | | 6,514,069 | | | USD | | | 834,014 | | | | 833,958 | | | | 10/03/17 | | | | (57 | ) |
| | HUF | | | 146,703,312 | | | EUR | | | 471,000 | | | | 558,559 | | | | 12/20/17 | | | | (686 | ) |
| | HUF | | | 643,424,240 | | | USD | | | 2,533,665 | | | | 2,449,779 | | | | 12/20/17 | | | | (83,886 | ) |
| | IDR | | | 36,797,488,658 | | | USD | | | 2,751,266 | | | | 2,730,783 | | | | 10/05/17 | | | | (20,484 | ) |
| | IDR | | | 22,971,824,100 | | | USD | | | 1,721,608 | | | | 1,704,012 | | | | 10/10/17 | | | | (17,596 | ) |
| | IDR | | | 27,642,336,996 | | | USD | | | 2,060,706 | | | | 2,049,392 | | | | 10/16/17 | | | | (11,313 | ) |
| | IDR | | | 12,425,593,091 | | | USD | | | 931,542 | | | | 920,428 | | | | 10/26/17 | | | | (11,115 | ) |
| | IDR | | | 14,931,027,810 | | | USD | | | 1,107,000 | | | | 1,105,634 | | | | 10/31/17 | | | | (1,366 | ) |
| | IDR | | | 20,596,826,501 | | | USD | | | 1,529,089 | | | | 1,522,597 | | | | 11/16/17 | | | | (6,492 | ) |
| | INR | | | 104,618,787 | | | USD | | | 1,632,028 | | | | 1,599,885 | | | | 10/05/17 | | | | (32,144 | ) |
| | INR | | | 169,546,806 | | | USD | | | 2,636,121 | | | | 2,590,633 | | | | 10/10/17 | | | | (45,488 | ) |
| | INR | | | 339,156,726 | | | USD | | | 5,261,133 | | | | 5,176,729 | | | | 10/18/17 | | | | (84,404 | ) |
| | INR | | | 227,311,267 | | | USD | | | 3,490,116 | | | | 3,466,351 | | | | 10/25/17 | | | | (23,765 | ) |
| | INR | | | 225,806,254 | | | USD | | | 3,465,578 | | | | 3,442,944 | | | | 10/26/17 | | | | (22,633 | ) |
| | INR | | | 35,485,916 | | | USD | | | 540,985 | | | | 540,606 | | | | 11/03/17 | | | | (379 | ) |
| | JPY | | | 61,726,275 | | | EUR | | | 467,556 | | | | 550,813 | | | | 12/20/17 | | | | (4,344 | ) |
| | JPY | | | 31,806,542 | | | GBP | | | 217,907 | | | | 283,825 | | | | 12/20/17 | | | | (8,913 | ) |
| | JPY | | | 101,727,000 | | | USD | | | 933,948 | | | | 905,177 | | | | 10/25/17 | | | | (28,770 | ) |
| | JPY | | | 627,840,256 | | | USD | | | 5,704,969 | | | | 5,602,516 | | | | 12/20/17 | | | | (102,454 | ) |
| | KRW | | | 2,040,978,941 | | | USD | | | 1,815,747 | | | | 1,782,147 | | | | 10/02/17 | | | | (33,600 | ) |
| | KRW | | | 3,766,198,844 | | | USD | | | 3,341,727 | | | | 3,289,456 | | | | 10/10/17 | | | | (52,272 | ) |
| | KRW | | | 1,932,258,287 | | | USD | | | 1,710,028 | | | | 1,687,684 | | | | 10/12/17 | | | | (22,345 | ) |
| | KRW | | | 3,201,941,106 | | | USD | | | 2,820,171 | | | | 2,796,865 | | | | 10/25/17 | | | | (23,307 | ) |
| | KRW | | | 1,888,443,033 | | | USD | | | 1,669,248 | | | | 1,649,776 | | | | 11/10/17 | | | | (19,473 | ) |
| | KRW | | | 5,483,816,370 | | | USD | | | 4,810,744 | | | | 4,791,424 | | | | 11/22/17 | | | | (19,320 | ) |
| | MXN | | | 153,132,485 | | | USD | | | 8,482,555 | | | | 8,300,770 | | | | 12/20/17 | | | | (181,786 | ) |
| | NOK | | | 57,199,877 | | | EUR | | | 6,103,570 | | | | 7,195,451 | | | | 12/20/17 | | | | (51,679 | ) |
| | NOK | | | 2,766,395 | | | GBP | | | 260,747 | | | | 347,998 | | | | 12/20/17 | | | | (2,291 | ) |
| | NOK | | | 3,999,005 | | | USD | | | 512,073 | | | | 503,055 | | | | 12/20/17 | | | | (9,018 | ) |
| | NZD | | | 757,775 | | | EUR | | | 462,000 | | | | 546,474 | | | | 12/20/17 | | | | (2,086 | ) |
| | NZD | | | 8,793,388 | | | USD | | | 6,391,808 | | | | 6,341,411 | | | | 12/20/17 | | | | (50,396 | ) |
| | PEN | | | 1,795,726 | | | USD | | | 553,000 | | | | 549,979 | | | | 10/05/17 | | | | (3,021 | ) |
| | PEN | | | 3,589,644 | | | USD | | | 1,108,000 | | | | 1,099,223 | | | | 10/10/17 | | | | (8,777 | ) |
| | PEN | | | 3,566,888 | | | USD | | | 1,093,466 | | | | 1,088,951 | | | | 12/14/17 | | | | (4,516 | ) |
| | PLN | | | 39,407,165 | | | EUR | | | 9,224,266 | | | | 10,801,978 | | | | 12/20/17 | | | | (150,541 | ) |
| | PLN | | | 18,926,858 | | | USD | | | 5,329,588 | | | | 5,188,079 | | | | 12/20/17 | | | | (141,509 | ) |
| | RUB | | | 492,307,153 | | | USD | | | 8,451,902 | | | | 8,426,176 | | | | 12/14/17 | | | | (25,725 | ) |
| | SEK | | | 161,501,673 | | | EUR | | | 16,918,654 | | | | 19,925,646 | | | | 12/20/17 | | | | (162,874 | ) |
| | SEK | | | 5,103,000 | | | USD | | | 641,830 | | | | 627,203 | | | | 10/19/17 | | | | (14,627 | ) |
| | SEK | | | 3,560,897 | | | USD | | | 446,391 | | | | 439,334 | | | | 12/20/17 | | | | (7,057 | ) |
| | SGD | | | 3,922,739 | | | USD | | | 2,915,578 | | | | 2,894,540 | | | | 12/20/17 | | | | (21,038 | ) |
| | THB | | | 18,352,740 | | | USD | | | 555,000 | | | | 550,345 | | | | 10/11/17 | | | | (4,655 | ) |
| | TRY | | | 18,884,422 | | | USD | | | 5,338,842 | | | | 5,176,339 | | | | 12/20/17 | | | | (162,502 | ) |
| | TWD | | | 58,694,082 | | | USD | | | 1,952,824 | | | | 1,934,545 | | | | 10/02/17 | | | | (18,280 | ) |
| | TWD | | | 16,598,295 | | | USD | | | 553,000 | | | | 546,644 | | | | 10/05/17 | | | | (6,356 | ) |
| | TWD | | | 105,088,291 | | | USD | | | 3,477,389 | | | | 3,461,350 | | | | 10/20/17 | | | | (16,038 | ) |
| | TWD | | | 27,182,461 | | | USD | | | 903,147 | | | | 895,456 | | | | 10/23/17 | | | | (7,691 | ) |
| | TWD | | | 49,309,337 | | | USD | | | 1,629,188 | | | | 1,624,610 | | | | 10/26/17 | | | | (4,578 | ) |
| | USD | | | 774,463 | | | AUD | | | 992,000 | | | | 777,384 | | | | 12/20/17 | | | | (2,921 | ) |
| | USD | | | 9,150,231 | | | BRL | | | 29,387,526 | | | | 9,274,714 | | | | 10/03/17 | | | | (124,482 | ) |
| | USD | | | 554,000 | | | BRL | | | 1,774,468 | | | | 557,617 | | | | 11/03/17 | | | | (3,617 | ) |
| | |
| 44 | | The accompanying notes are an integral part of these financial statements. |
GOLDMAN SACHS BOND FUND
|
| ADDITIONAL INVESTMENT INFORMATION (continued) |
FORWARD FOREIGN CURRENCY EXCHANGE CONTRACTS WITH UNREALIZED LOSS (continued)
| | | | | | | | | | | | | | | | | | | | | | | | |
| Counterparty | | Currency
Purchased | | | Currency
Sold | | | Current
Value | | | Settlement
Date | | | Unrealized
Loss | |
Morgan Stanley & Co. International PLC (continued) | | USD | | | 551,000 | | | CHF | | | 532,586 | | | $ | 553,085 | | | | 12/20/17 | | | $ | (2,085 | ) |
| | USD | | | 242,736 | | | CNH | | | 1,625,726 | | | | 243,400 | | | | 12/20/17 | | | | (664 | ) |
| | USD | | | 1,166,395 | | | CNY | | | 7,798,460 | | | | 1,169,980 | | | | 11/10/17 | | | | (3,584 | ) |
| | USD | | | 443,000 | | | COP | | | 1,308,133,371 | | | | 443,643 | | | | 10/31/17 | | | | (643 | ) |
| | USD | | | 9,029,777 | | | EUR | | | 7,660,000 | | | | 9,059,299 | | | | 10/12/17 | | | | (29,523 | ) |
| | USD | | | 2,135,377 | | | EUR | | | 1,802,505 | | | | 2,140,220 | | | | 12/20/17 | | | | (4,844 | ) |
| | USD | | | 2,635,008 | | | GBP | | | 1,965,331 | | | | 2,637,328 | | | | 11/16/17 | | | | (2,319 | ) |
| | USD | | | 2,491,217 | | | GBP | | | 1,872,596 | | | | 2,515,662 | | | | 12/20/17 | | | | (24,445 | ) |
| | USD | | | 2,718,739 | | | IDR | | | 36,797,488,658 | | | | 2,730,783 | | | | 10/05/17 | | | | (12,044 | ) |
| | USD | | | 1,055,625 | | | INR | | | 69,132,872 | | | | 1,057,216 | | | | 10/05/17 | | | | (1,591 | ) |
| | USD | | | 1,435,482 | | | INR | | | 94,762,380 | | | | 1,443,646 | | | | 11/03/17 | | | | (8,163 | ) |
| | USD | | | 2,682,033 | | | JPY | | | 301,601,838 | | | | 2,691,334 | | | | 12/20/17 | | | | (9,302 | ) |
| | USD | | | 2,716,395 | | | KRW | | | 3,119,822,886 | | | | 2,725,530 | | | | 11/10/17 | | | | (9,134 | ) |
| | USD | | | 548,399 | | | KRW | | | 627,664,242 | | | | 548,415 | | | | 11/22/17 | | | | (16 | ) |
| | USD | | | 1,084,913 | | | NZD | | | 1,511,323 | | | | 1,089,901 | | | | 12/20/17 | | | | (4,988 | ) |
| | USD | | | 551,000 | | | PHP | | | 28,217,619 | | | | 553,919 | | | | 10/19/17 | | | | (2,919 | ) |
| | USD | | | 551,000 | | | PHP | | | 28,159,131 | | | | 552,734 | | | | 10/20/17 | | | | (1,734 | ) |
| | USD | | | 554,000 | | | PHP | | | 28,316,901 | | | | 555,603 | | | | 10/26/17 | | | | (1,603 | ) |
| | USD | | | 3,307,181 | | | RUB | | | 194,796,313 | | | | 3,334,073 | | | | 12/14/17 | | | | (26,892 | ) |
| | USD | | | 2,758,188 | | | SGD | | | 3,756,400 | | | | 2,771,800 | | | | 12/20/17 | | | | (13,612 | ) |
| | USD | | | 332,000 | | | TRY | | | 1,211,365 | | | | 332,043 | | | | 12/20/17 | | | | (43 | ) |
| | USD | | | 483,625 | | | TWD | | | 14,673,181 | | | | 483,625 | | | | 10/02/17 | | | | — | |
| | USD | | | 545,458 | | | TWD | | | 16,598,295 | | | | 546,644 | | | | 10/05/17 | | | | (1,186 | ) |
| | USD | | | 1,588,376 | | | TWD | | | 48,504,251 | | | | 1,597,610 | | | | 10/20/17 | | | | (9,234 | ) |
| | USD | | | 1,166,395 | | | TWD | | | 35,485,706 | | | | 1,169,389 | | | | 10/31/17 | | | | (2,994 | ) |
| | | ZAR | | | 79,941,049 | | | USD | | | 6,033,187 | | | | 5,828,036 | | | | 12/20/17 | | | | (205,150 | ) |
| TOTAL | | | | | | | | | | | | | | | | | | | | | | $ | (2,946,016 | ) |
FORWARD SALES CONTRACTS — At September 30, 2017, the Fund had the following forward sales contracts:
| | | | | | | | | | | | | | | | | | |
| Description | | Interest
Rate | | | Maturity
Date(a) | | Settlement
Date | | | Principal
Amount | | | Value | |
FNMA | | | 3.000 | % | | TBA-30yr | | | 10/12/17 | | | $ | (1,000,000 | ) | | $ | (1,003,125 | ) |
GNMA | | | 4.000 | | | TBA-30yr | | | 10/23/17 | | | | (5,000,000 | ) | | | (5,264,844 | ) |
| TOTAL (Proceeds Receivable: $6,284,766) | | | $ | (6,267,969 | ) |
| | (a) | | TBA (To Be Announced) Securities are purchased or sold on a forward commitment basis with an approximate principal amount and no defined maturity date. The actual principal and maturity date will be determined upon settlement when the specific mortgage pools are assigned. |
FUTURES CONTRACTS — At September 30, 2017, the Fund had the following futures contracts:
| | | | | | | | | | | | | | |
| Description | | Number of
Contracts | | | Expiration
Date | | Notional
Amount | | | Unrealized
Appreciation/
(Depreciation) | |
Long position contracts: | | | | | | | | | | | | | | |
Ultra Long U.S. Treasury Bonds | | | 24 | | | 12/19/17 | | $ | 3,963,000 | | | $ | (86,271 | ) |
10 Year German Euro-Bund | | | 32 | | | 12/07/17 | | | 6,089,529 | | | | (37,742 | ) |
2 Year U.S. Treasury Notes | | | 136 | | | 12/29/17 | | | 29,335,625 | | | | (82,329 | ) |
10 Year U.S. Treasury Notes | | | 228 | | | 12/19/17 | | | 28,571,250 | | | | (278,725 | ) |
20 Year U.S. Treasury Bonds | | | 88 | | | 12/19/17 | | | 13,447,500 | | | | (198,635 | ) |
| Total | | | | | | | | | | | | $ | (683,702 | ) |
| | |
| The accompanying notes are an integral part of these financial statements. | | 45 |
GOLDMAN SACHS BOND FUND
Schedule of Investments (continued)
September 30, 2017 (Unaudited)
|
| ADDITIONAL INVESTMENT INFORMATION (continued) |
| | | | | | | | | | | | | | |
| Description | | Number of
Contracts | | | Expiration
Date | | Notional
Amount | | | Unrealized
Appreciation/
(Depreciation) | |
Short position contracts: | | | | | | | | | | | | | | |
Eurodollars | | | (204 | ) | | 12/17/18 | | $ | (50,048,850 | ) | | $ | (18,150 | ) |
Italian 10 Year Government Bonds | | | (37 | ) | | 12/07/17 | | | (5,901,843 | ) | | | 10,401 | |
Ultra 10 Year U.S. Treasury Notes | | | (5 | ) | | 12/19/17 | | | (671,641 | ) | | | 7,867 | |
5 Year U.S. Treasury Notes | | | (244 | ) | | 12/29/17 | | | (28,670,000 | ) | | | 234,172 | |
10 Year U.S. Treasury Notes | | | (90 | ) | | 12/19/17 | | | (11,278,125 | ) | | | 7,621 | |
| Total | | | | | | | | | | | | $ | 241,911 | |
| TOTAL FUTURES CONTRACTS | | | | | | | | | | | | $ | (441,791 | ) |
SWAP CONTRACTS — At September 30, 2017, the Fund had the following swap contracts:
OVER THE COUNTER INTEREST RATE SWAP CONTRACTS
| | | | | | | | | | | | | | | | | | |
| Payments Made by the Fund | | Payments
Received
by the Fund(a) | | | Counterparty | | Termination
Date | | | Notional
Amount | | | Unrealized
Appreciation/
(Depreciation)* | |
3M KWCDC | | | 2.239 | % | | Citibank NA | | | 10/06/17 | | | | KRW 1,102,660 | | | $ | 2,177 | |
| | | 2.245 | | | Deutsche Bank AG | | | 10/06/17 | | | | 765,310 | | | | 1,522 | |
| | | 2.253 | | | Deutsche Bank AG | | | 10/15/17 | | | | 3,978,210 | | | | 7,857 | |
| | | | 2.175 | | | MS & Co. Int. PLC | | | 10/29/17 | | | | 1,213,740 | | | | 2,153 | |
| TOTAL | | | | | | | | | | | | | | | | $ | 13,709 | |
| | (a) | | Represents forward starting interest rate swaps whose effective dates of commencement of accruals and cash flows occur subsequent to September 30, 2017. |
| | * | | There are no upfront payments on the swap contracts, therefore the unrealized gain (loss) on the swap contracts is equal to their value. |
CENTRALLY CLEARED INTEREST RATE SWAP CONTRACTS
| | | | | | | | | | | | | | | | | | | | | | | | | | |
| Payments Made by the Fund | | Payments
Received
by Fund | | Termination
Date | | | Notional
Amount | | | Value | | | Upfront
Premium
(Received) Paid | | | Unrealized
Appreciation/
(Depreciation) | |
| 6M CDOR(a) | | 0.832% | | | 10/25/17 | | | | CAD | | | | 153,940 | | | $ | (29,552 | ) | | $ | 231 | | | $ | (29,783 | ) |
| 6M GBP(b) | | 0.297 | | | 12/14/17 | | | | GBP | | | | 359,210 | (c) | | | (41,303 | ) | | | 2,145 | | | | (43,448 | ) |
| 3M STIBOR(d) | | 0.050(b) | | | 06/15/18 | | | | SEK | | | | 273,340 | | | | 66,148 | | | | 53,815 | | | | 12,333 | |
| 3M STIBOR(d) | | 0.330(b) | | | 09/15/18 | | | | | | | | 101,290 | | | | 10,669 | | | | 2,250 | | | | 8,419 | |
| 6M CHFOR | | 0.554 | | | 03/29/19 | | | | CHF | | | | 38,050 | (c) | | | 271 | | | | (345,138 | ) | | | 345,409 | |
| 1.826% | | 3M LIBOR | | | 05/11/19 | | | $ | | | | | 26,300 | (c) | | | (5,594 | ) | | | (4,170 | ) | | | (1,424 | ) |
| 3M STIBOR(d) | | 0.100(b) | | | 06/29/19 | | | | SEK | | | | 263,500 | (c) | | | 1,744 | | | | (4,232 | ) | | | 5,976 | |
| 3M NIBOR(e) | | 1.000(b) | | | 09/20/19 | | | | NOK | | | | 53,520 | | | | (9,971 | ) | | | (14,670 | ) | | | 4,699 | |
| 6M CDOR(e) | | 1.250 | | | 12/20/19 | | | | CAD | | | | 29,010 | (c) | | | (332,145 | ) | | | (344,074 | ) | | | 11,929 | |
| 2.000(e) | | 3M LIBOR(d) | | | 12/20/19 | | | $ | | | | | 29,140 | (c) | | | (112,690 | ) | | | (179,147 | ) | | | 66,457 | |
| 6M CDOR(e) | | 2.028 | | | 07/18/22 | | | | CAD | | | | 6,720 | (c) | | | (37,294 | ) | | | (2,058 | ) | | | (35,236 | ) |
Mexico IB TIIE 28D(f) | | 6.750 | | | 12/14/22 | | | | MXN | | | | 34,350 | (c) | | | (2,760 | ) | | | (322 | ) | | | (2,438 | ) |
| 6M EURO(e) | | 0.250(b) | | | 12/20/22 | | | | EUR | | | | 14,060 | (c) | | | (46,570 | ) | | | 555 | | | | (47,125 | ) |
| 3M STIBOR(d) | | 0.500(b) | | | 12/20/22 | | | | SEK | | | | 110,990 | (c) | | | (27,974 | ) | | | 20,490 | | | | (48,464 | ) |
| 6M CDOR(e) | | 1.750(d) | | | 12/20/22 | | | | CAD | | | | 12,590 | (c) | | | (203,404 | ) | | | (208,972 | ) | | | 5,568 | |
| 2.250(e) | | 3M LIBOR | | | 12/20/22 | | | $ | | | | | 19,190 | (c) | | | (183,372 | ) | | | (314,695 | ) | | | 131,323 | |
| 2.500(e) | | 6M AUDOR | | | 12/20/22 | | | | AUD | | | | 11,390 | (c) | | | 66,458 | | | | (15,134 | ) | | | 81,592 | |
| 2.142(e) | | 3M LIBOR(d) | | | 07/03/23 | | | $ | | | | | 6,600 | (c) | | | (287 | ) | | | 24,856 | | | | (25,143 | ) |
| 3M LIBOR(d) | | 2.065(e) | | | 08/06/23 | | | | | | | | 15,970 | (c) | | | (68,558 | ) | | | 7,027 | | | | (75,585 | ) |
| 6M EURO(e) | | 1.330(b) | | | 01/12/27 | | | | EUR | | | | 10,830 | (c) | | | (62,073 | ) | | | (125,677 | ) | | | 63,604 | |
| 6M GBP(e) | | 1.600 | | | 03/16/27 | | | | GBP | | | | 21,690 | (c) | | | (148,363 | ) | | | (146,515 | ) | | | (1,848 | ) |
| | |
| 46 | | The accompanying notes are an integral part of these financial statements. |
GOLDMAN SACHS BOND FUND
Schedule of Investments (continued)
September 30, 2017 (Unaudited)
|
| ADDITIONAL INVESTMENT INFORMATION (continued) |
CENTRALLY CLEARED INTEREST RATE SWAP CONTRACTS (continued)
| | | | | | | | | | | | | | | | | | | | | | | | | | | | |
| Payments Made by the Fund | | Payments
Received
by Fund | | | Termination
Date | | | Notional
Amount | | | Value | | | Upfront
Premium
(Received) Paid | | | Unrealized
Appreciation/
(Depreciation) | |
| 6M EURO(e) | | | 1.750%(b) | | | | 06/15/27 | | | | EUR | | | | 7,720 | (c) | | $ | 97,626 | | | $ | (324,894 | ) | | $ | 422,520 | |
| 3M LIBOR(d) | | | 2.400(e) | | | | 08/31/27 | | | $ | | | | | 4,530 | (c) | | | (35,295 | ) | | | (5,212 | ) | | | (30,083 | ) |
| 1.500%(b) | | | 6M EURO(e) | | | | 08/31/27 | | | | EUR | | | | 3,960 | (c) | | | 16,754 | | | | (6,631 | ) | | | 23,385 | |
| 6M CDOR(e) | | | 2.500 | | | | 09/21/27 | | | | CAD | | | | 11,250 | (c) | | | (75,013 | ) | | | (32,434 | ) | | | (42,579 | ) |
| 2.500(e) | | | 3M LIBOR(d) | | | | 09/21/27 | | | $ | | | | | 9,070 | (c) | | | 34,118 | | | | (3,144 | ) | | | 37,262 | |
| 6M EURO(e) | | | 1.000(b) | | | | 12/20/27 | | | | EUR | | | | 13,000 | (c) | | | 62,629 | | | | 234,723 | | | | (172,094 | ) |
| 6M CDOR(e) | | | 2.000 | | | | 12/20/27 | | | | CAD | | | | 16,000 | (c) | | | (502,302 | ) | | | (416,873 | ) | | | (85,429 | ) |
| 3M LIBOR(d) | | | 2.500(e) | | | | 12/20/27 | | | $ | | | | | 200 | (c) | | | 3,392 | | | | 5,387 | | | | (1,995 | ) |
| 2.500(e) | | | 3M LIBOR(d) | | | | 12/20/27 | | | | | | | | 5,630 | | | | (95,505 | ) | | | (210,704 | ) | | | 115,199 | |
| 1.250(e) | | | 6M GBP | | | | 12/20/27 | | | | GBP | | | | 6,250 | (c) | | | 165,376 | | | | (112,508 | ) | | | 277,884 | |
| 0.250(e) | | | 6M JYOR(b) | | | | 12/20/27 | | | | JPY | | | | 882,690 | (c) | | | 41,573 | | | | 22,857 | | | | 18,716 | |
| 6M CHFOR(e) | | | 1.000 | | | | 12/21/27 | | | | CHF | | | | 2,340 | (c) | | | 20,951 | | | | 38,851 | | | | (17,900 | ) |
| 6M GBP(e) | | | 2.000 | | | | 12/21/27 | | | | GBP | | | | 1,570 | (c) | | | 20,800 | | | | 21,789 | | | | (989 | ) |
| 6M CDOR(e) | | | 2.500 | | | | 12/21/27 | | | | CAD | | | | 13,650 | (c) | | | (103,756 | ) | | | (67,179 | ) | | | (36,577 | ) |
| 2.750(e) | | | 3M LIBOR(d) | | | | 12/21/27 | | | $ | | | | | 14,310 | (c) | | | (89,094 | ) | | | (123,714 | ) | | | 34,620 | |
| 4.000(e) | | | 3M NZDOR(d) | | | | 12/21/27 | | | | NZD | | | | 3,330 | (c) | | | (10,144 | ) | | | (23,729 | ) | | | 13,585 | |
| 3M LIBOR(d) | | | 2.378(e) | | | | 07/03/28 | | | $ | | | | | 23,540 | (c) | | | (2,910 | ) | | | (52,912 | ) | | | 50,002 | |
| 2.346(e) | | | 3M LIBOR(d) | | | | 08/06/28 | | | | | | | | 9,000 | (c) | | | 34,706 | | | | (9,093 | ) | | | 43,799 | |
| 1.940(e) | | | 6M GBP | | | | 01/11/32 | | | | GBP | | | | 8,500 | (c) | | | 27,757 | | | | 23,471 | | | | 4,286 | |
| 1.500(e) | | | 6M GBP | | | | 12/20/32 | | | | | | | | 4,700 | (c) | | | 107,900 | | | | (122,914 | ) | | | 230,814 | |
| 1.750(e) | | | 6M GBP | | | | 03/17/37 | | | | | | | | 15,660 | (c) | | | 345,130 | | | | (69,516 | ) | | | 414,646 | |
| 6M EURO(e) | | | 2.000(b) | | | | 06/16/37 | | | | EUR | | | | 1,910 | (c) | | | (35,811 | ) | | | (780 | ) | | | (35,031 | ) |
| 2.750(e) | | | 3M LIBOR(d) | | | | 06/16/37 | | | $ | | | | | 3,910 | (c) | | | 4,291 | | | | (7,662 | ) | | | 11,953 | |
| 2.500(e) | | | 3M LIBOR(d) | | | | 06/17/47 | | | | | | | | 3,680 | (c) | | | 29,193 | | | | 5,977 | | | | 23,216 | |
| 1.500(e) | | | 6M GBP | | | | 12/20/47 | | | | GBP | | | | 1,020 | (c) | | | 55,249 | | | | (20,925 | ) | | | 76,174 | |
| 2.560(e) | | | 3M LIBOR(d) | | | | 07/03/48 | | | $ | | | | | 9,770 | (c) | | | 14,654 | | | | 33,947 | | | | (19,293 | ) |
| 2.540(e) | | | 6M CDOR | | | | 07/18/48 | | | | CAD | | | | 1,000 | (c) | | | 25,349 | | | | (5,509 | ) | | | 30,858 | |
| TOTAL | | | | | | | | | | | | | | | | | | | | | | $ | (2,822,766 | ) | | $ | 1,813,764 | |
| | (a) | | Payments made at maturity. |
| | (b) | | Payments made annually. |
| | (c) | | Represents forward starting interest rate swaps whose effective dates of commencement of accruals and cash flows occur subsequent to September 30, 2017. |
| | (d) | | Payments made quarterly. |
| | (e) | | Payments made semi-annually. |
| | (f) | | Payments made monthly. |
OVER THE COUNTER CREDIT DEFAULT SWAP CONTRACTS
| | | | | | | | | | | | | | | | | | | | | | | | | | | | | | |
| Reference Obligation/ Index(a) | | Financing
Rate
Paid
by the Fund | | Credit Spread at
September 30,
2017(b) | | | Counterparty | | | Termination
Date | | | Notional
Amount (000s) | | | Value | | | Upfront
Premiums
(Received) Paid | | | Unrealized
Appreciation/
(Depreciation) | |
Protection Purchased: | | | | | | | | | | | | | | | | | | | | | | | | | | | | | | |
| People’s Republic of China, 4.250% 10/28/17 | | 1.000% | | | 0.207 | % | |
| BoA Securities
LLC |
| | | 06/20/19 | | | $ | 40 | | | $ | (556 | ) | | $ | (91 | ) | | $ | (465 | ) |
| People’s Republic of China, 7.500%, 10/28/27 | | 1.000 | | | 0.207 | | |
| BoA Securities
LLC |
| | | 06/20/19 | | | | 60 | | | | (834 | ) | | | (123 | ) | | | (711 | ) |
| People’s Republic of China, 7.500%, 10/28/27 | | 1.000 | | | 0.379 | | |
| BoA Securities
LLC |
| | | 12/20/20 | | | | 830 | | | | (16,505 | ) | | | 3,173 | | | | (19,678 | ) |
| People’s Republic of China, 7.500%, 10/28/27 | | 1.000 | | | 0.442 | | |
| BoA Securities
LLC |
| | | 06/20/21 | | | | 900 | | | | (18,417 | ) | | | 7,438 | | | | (25,855 | ) |
| | |
| The accompanying notes are an integral part of these financial statements. | | 47 |
GOLDMAN SACHS BOND FUND
Schedule of Investments (continued)
September 30, 2017 (Unaudited)
|
| ADDITIONAL INVESTMENT INFORMATION (continued) |
OVER THE COUNTER CREDIT DEFAULT SWAP CONTRACTS (continued)
| | | | | | | | | | | | | | | | | | | | | | | | | | | | | | |
| Reference Obligation/ Index(a) | | Financing
Rate
Paid
by the Fund | | Credit Spread at
September 30,
2017(b) | | | Counterparty | | | Termination
Date | | | Notional
Amount (000s) | | | Value | | | Upfront
Premiums
(Received) Paid | | | Unrealized
Appreciation/
(Depreciation) | |
Protection Purchased: (continued) | | | | | | | | | | | | | | | | | | | | | | | | | | | | |
| People’s Republic of China, 4.250% 10/28/17 | | 1.000% | | | 0.191 | % | |
| Barclays Bank
PLC |
| | | 03/20/19 | | | | 270 | | | $ | (3,290 | ) | | $ | (309 | ) | | $ | (2,981 | ) |
| People’s Republic of China, 7.500%, 10/28/27 | | 1.000 | | | 0.442 | | |
| Barclays Bank
PLC |
| | | 06/20/21 | | | | 80 | | | | (1,637 | ) | | | 545 | | | | (2,182 | ) |
| People’s Republic of China, 7.500%, 10/28/27 | | 1.000 | | | 0.490 | | |
| Barclays Bank
PLC |
| | | 12/20/21 | | | | 1,130 | | | | (23,771 | ) | | | (3,351 | ) | | | (20,420 | ) |
| People’s Republic of China, 7.500%, 10/28/27 | | 1.000 | | | 0.379 | | | | Citibank NA | | | | 12/20/20 | | | | 720 | | | | (14,317 | ) | | | 3,916 | | | | (18,233 | ) |
| People’s Republic of China, 4.250% 10/28/17 | | 1.000 | | | 0.191 | | | | Citibank NA | | | | 03/20/19 | | | | 3,080 | | | | (37,522 | ) | | | (4,220 | ) | | | (33,302 | ) |
| People’s Republic of China, 4.250% 10/28/17 | | 1.000 | | | 0.207 | | | | Citibank NA | | | | 06/20/19 | | | | 4,390 | | | | (61,043 | ) | | | (6,847 | ) | | | (54,196 | ) |
| People’s Republic of China, 7.500%, 10/28/27 | | 1.000 | | | 0.442 | | | | Citibank NA | | | | 06/20/21 | | | | 560 | | | | (11,460 | ) | | | 3,908 | | | | (15,368 | ) |
| People’s Republic of China, 7.500%, 10/28/27 | | 1.000 | | | 0.570 | | | | Citibank NA | | | | 06/20/22 | | | | 280 | | | | (5,519 | ) | | | (3,992 | ) | | | (1,527 | ) |
| People’s Republic of China, 7.500%, 10/28/27 | | 1.000 | | | 0.442 | | |
| Deutsche
Bank AG |
| | | 06/20/21 | | | | 460 | | | | (9,413 | ) | | | 3,998 | | | | (13,411 | ) |
| People’s Republic of China, 4.250% 10/28/17 | | 1.000 | | | 0.191 | | |
| JPMorgan
Securities, Inc. |
| | | 03/20/19 | | | | 270 | | | | (3,289 | ) | | | (278 | ) | | | (3,011 | ) |
| People’s Republic of China, 4.250% 10/28/17 | | 1.000 | | | 0.207 | | |
| JPMorgan
Securities, Inc. |
| | | 06/20/19 | | | | 120 | | | | (1,669 | ) | | | (279 | ) | | | (1,390 | ) |
| People’s Republic of China, 7.500%, 10/28/27 | | 1.000 | | | 0.379 | | |
| JPMorgan
Securities, Inc. |
| | | 12/20/20 | | | | 6,410 | | | | (127,467 | ) | | | 32,394 | | | | (159,861 | ) |
| People’s Republic of China, 7.500%, 10/28/27 | | 1.000 | | | 0.442 | | |
| JPMorgan
Securities, Inc. |
| | | 06/20/21 | | | | 10 | | | | (205 | ) | | | 71 | | | | (276 | ) |
| People’s Republic of China, 7.500%, 10/28/27 | | 1.000 | | | 0.570 | | |
| JPMorgan
Securities, Inc. |
| | | 06/20/22 | | | | 580 | | | | (11,432 | ) | | | (8,323 | ) | | | (3,109 | ) |
| TOTAL | | | $ | (348,346 | ) | | $ | 27,630 | | | $ | (375,976 | ) |
| | (a) | | Payments made quarterly. |
| | (b) | | Credit spread on the referenced obligation, together with the term of the swap contract, are indicators of payment/performance risk. The likelihood of a credit event occurring which would require a Fund or its counterparty to make a payment or otherwise be required to perform under the swap contract is generally greater as the credit spread and the term of the swap contract increase. |
| | |
| 48 | | The accompanying notes are an integral part of these financial statements. |
GOLDMAN SACHS BOND FUND
|
| ADDITIONAL INVESTMENT INFORMATION (continued) |
CENTRALLY CLEARED CREDIT DEFAULT SWAP CONTRACTS
| | | | | | | | | | | | | | | | | | | | | | | | | | | | |
| Referenced Obligation/Index(a) | | Financing Rate
Received/(Paid)
by the Fund | | | Credit Spread at
September 30,
2017(b) | | | Termination
Date | | | Notional
Amount | | | Value | | | Upfront
Premiums
(Received)
Paid | | | Unrealized
Appreciation/
(Depreciation) | |
Protection Purchased: | | | | | | | | | | | | | | | | | | | | | | | | | | | | |
CDX.EM Index 28 | | | 1.000% | | | | 1.853% | | | | 12/20/22 | | | | 10,480 | | | $ | 419,699 | | | $ | 437,630 | | | $ | (17,931 | ) |
Markit iTraxx Europe Index 27 | | | 1.000 | | | | 0.480 | | | | 06/20/22 | | | | 18,990 | | | | (555,524 | ) | | | (479,275 | ) | | | (76,249 | ) |
CDX.IG Index 28 | | | 1.000 | | | | 0.529 | | | | 06/20/22 | | | | 23,600 | | | | (506,127 | ) | | | (444,779 | ) | | | (61,348 | ) |
CDX.EM Index 27 | | | 1.000 | | | | 1.723 | | | | 06/20/22 | | | | 7,770 | | | | 241,378 | | | | 284,512 | | | | (43,134 | ) |
| TOTAL | | | | | | | | | | | | | | | | | | | | | | $ | (201,912 | ) | | $ | (198,662 | ) |
| | (a) | | Payments made quarterly. |
| | (b) | | Credit spread on the referenced obligation, together with the term of the swap contract, are indicators of payment/performance risk. The likelihood of a credit event occurring which would require a Fund or its counterparty to make a payment or otherwise be required to perform under the swap contract is generally greater as the credit spread and the term of the swap contract increase. |
PURCHASED OPTIONS CONTRACTS — At September 30, 2017 the Fund had following options contracts:
PURCHASED OPTIONS ON INTEREST RATE SWAPTIONS
| | | | | | | | | | | | | | | | | | | | | | | | | | | | | | |
| Description | | Counterparty | | Exercise
Rate | | | Expiration
Date | | | Number of
Contracts | | | Notional
Amount | | | Value | | | Premiums
Paid (Received)
by Fund | | | Unrealized
Appreciation/
(Depreciation) | |
Purchased Options Contracts: | | | | | | | | | | | | | | | | | | | | | | | | | | | | |
Calls: | | | | | | | | | | | | | | | | | | | | | | | | | | | | | | |
5Y IRS | | BoA Securities LLC | | | 2.018 | % | | | 01/29/18 | | | | 12,600,000 | | | $ | 12,600,000 | | | $ | 95,130 | | | $ | 103,320 | | | $ | (8,190 | ) |
10Y IRS | | Citibank NA | | | 2.273 | | | | 01/22/18 | | | | 7,200,000 | | | | 7,200,000 | | | | 105,940 | | | | 117,180 | | | | (11,240 | ) |
10Y IRS | | Citibank NA | | | 2.539 | | | | 01/24/18 | | | | 4,700,000 | | | | 4,700,000 | | | | 24,595 | | | | 90,240 | | | | (65,645 | ) |
10Y IRS | | JPMorgan Securities, Inc. | | | 2.048 | | | | 01/24/18 | | | | 4,700,000 | | | | 4,700,000 | | | | 135,263 | | | | 88,595 | | | | 46,668 | |
| | | | | | | | |
Puts: | | | | | | | | | | | | | | | | | | | | | | | | | | | | | | |
5Y IRS | | BoA Securities LLC | | | 2.018 | | | | 01/29/18 | | | | 12,600,000 | | | | 12,600,000 | | | | 64,334 | | | | 103,320 | | | | (38,986 | ) |
10Y IRS | | Citibank NA | | | 2.273 | | | | 10/22/18 | | | | 7,200,000 | | | | 7,200,000 | | | | 71,877 | | | | 117,180 | | | | (45,303 | ) |
10Y IRS | | Citibank NA | | | 2.539 | | | | 01/24/18 | | | | 4,700,000 | | | | 4,700,000 | | | | 113,666 | | | | 90,240 | | | | 23,426 | |
10Y IRS | | JPMorgan Securities, Inc. | | | 0.700 | | | | 10/23/17 | | | | 5,730,000 | | | | 5,730,000 | | | | 450 | | | | 35,761 | | | | (35,311 | ) |
10Y IRS | | JPMorgan Securities, Inc. | | | 2.048 | | | | 01/24/18 | | | | 4,700,000 | | | | 4,700,000 | | | | 18,508 | | | | 88,595 | | | | (70,087 | ) |
| TOTAL PURCHASED OPTIONS CONTRACTS | | | | | | | | | | | | | | | | 709,588 | | | $ | 891,545 | | | $ | (181,957 | ) |
PURCHASED OPTIONS ON FUTURES
| | | | | | | | | | | | | | | | | | | | | | | | | | | | | | |
| Description | | Counterparty | | Exercise
Price | | | Expiration
Date | | | Number of
Contracts | | | Notional
Amount | | | Value | | | Premiums
Paid (Received)
| | | Unrealized
Appreciation/
(Depreciation) | |
Eurodollar | | MS & Co. LLC | | $ | 98.00 | | | | 06/15/18 | | | | 206 | | | $ | 515,000 | | | $ | 79,825 | | | $ | 57,114 | | | $ | 22,711 | |
| | |
|
Abbreviation |
BoA Securities LLC | | —Bank of America Securities LLC |
CDX.EM Index 27 | | —CDX Emerging Markets Index 27 |
CDX.EM Index 28 | | —CDX Emerging Markets Index 28 |
CDX.IG Index 28 | | —CDX Investment Grade Index 28 |
Mexico IB TIIE 28D | | —Mexico Interbank TIIE 28 Days |
MS & Co. Int. PLC | | —Morgan Stanley & Co. International PLC |
MS & Co. LLC | | —Morgan Stanley & Co. LLC |
|
| | |
| The accompanying notes are an integral part of these financial statements. | | 49 |
GOLDMAN SACHS CORE FIXED INCOME FUND
Schedule of Investments
September 30, 2017 (Unaudited)
| | | | | | | | | | | | | | |
Principal Amount | | | Interest
Rate | | | Maturity Date | | | Value | |
| Corporate Obligations – 38.7% | |
| Agriculture – 2.4% | |
| | BAT Capital Corp.(a)(b) | |
| $ | 6,750,000 | | | | 3.222 | % | | | 08/15/24 | | | $ | 6,766,631 | |
| | 6,475,000 | | | | 3.557 | | | | 08/15/27 | | | | 6,540,089 | |
| | BAT International Finance PLC(b) | |
| | 7,250,000 | | | | 2.750 | | | | 06/15/20 | | | | 7,362,783 | |
| | Reynolds American, Inc.(a) | |
| | 3,125,000 | | | | 4.450 | | | | 06/12/25 | | | | 3,349,497 | |
| | | | | | | | | | | | | | |
| | | | | | | | | | | | | 24,019,000 | |
| | |
| Automotive – 0.7% | |
| | Ford Motor Credit Co. LLC | |
| | 3,250,000 | | | | 5.875 | | | | 08/02/21 | | | | 3,614,995 | |
| | General Motors Financial Co., Inc. | |
| | 1,125,000 | | | | 3.250 | | | | 05/15/18 | | | | 1,135,073 | |
| | 1,755,000 | | | | 3.500 | | | | 07/10/19 | | | | 1,797,474 | |
| | | | | | | | | | | | | | |
| | | | | | | | | | | | | 6,547,542 | |
| | |
| Banks – 8.1% | |
| | Bank of America Corp. | |
| | 3,050,000 | | | | 4.125 | | | | 01/22/24 | | | | 3,244,787 | |
| | 2,300,000 | | | | 4.000 | | | | 04/01/24 | | | | 2,429,842 | |
| | 2,550,000 | | | | 3.248 | (a) | | | 10/21/27 | | | | 2,498,907 | |
| | 350,000 | | | | 6.110 | | | | 01/29/37 | | | | 437,619 | |
| | (3M USD LIBOR + 0.660%) | |
| | 3,100,000 | | | | 2.369 | (a)(c) | | | 07/21/21 | | | | 3,100,230 | |
| | (3M USD LIBOR + 1.575%) | |
| | 100,000 | | | | 3.824 | (a)(c) | | | 01/20/28 | | | | 102,820 | |
| | Barclays PLC | |
| | 400,000 | | | | 4.950 | | | | 01/10/47 | | | | 437,145 | |
| | Capital One NA/Mclean VA(a) | |
| | 1,700,000 | | | | 2.650 | | | | 08/08/22 | | | | 1,691,532 | |
| | Citigroup, Inc. | |
| | 1,300,000 | | | | 4.600 | | | | 03/09/26 | | | | 1,384,032 | |
| | 1,150,000 | | | | 4.125 | | | | 07/25/28 | | | | 1,183,281 | |
| | Compass Bank(a) | |
| | 1,000,000 | | | | 2.750 | | | | 09/29/19 | | | | 1,006,404 | |
| | Credit Agricole SA(b) | |
| | 1,050,000 | | | | 3.250 | | | | 10/04/24 | | | | 1,050,597 | |
| | Credit Suisse AG | |
| | 1,475,000 | | | | 2.300 | | | | 05/28/19 | | | | 1,484,621 | |
| | Credit Suisse Group AG(a)(b) | |
| | 1,000,000 | | | | 4.282 | | | | 01/09/28 | | | | 1,041,616 | |
| | Credit Suisse Group Funding Guernsey Ltd. | |
| | 475,000 | | | | 3.750 | | | | 03/26/25 | | | | 483,846 | |
| | Deutsche Bank AG | |
| | 425,000 | | | | 2.500 | | | | 02/13/19 | | | | 427,499 | |
| | 2,500,000 | | | | 2.700 | | | | 07/13/20 | | | | 2,508,990 | |
| | HSBC Holdings PLC(a)(c) (3M USD LIBOR + 1.055%) | |
| | 2,200,000 | | | | 3.262 | | | | 03/13/23 | | | | 2,245,487 | |
| | ING Bank NV(a)(c) (5 year USD ICE Swap + 2.700%) | |
| | 2,025,000 | | | | 4.125 | | | | 11/21/23 | | | | 2,061,450 | |
| | ING Groep NV | |
| | 750,000 | | | | 3.150 | | | | 03/29/22 | | | | 764,271 | |
| | Intesa Sanpaolo SpA | |
| | 2,800,000 | | | | 3.875 | | | | 01/16/18 | | | | 2,815,458 | |
| | JPMorgan Chase & Co.(a) | |
| | 2,100,000 | | | | 2.972 | | | | 01/15/23 | | | | 2,132,613 | |
| | |
| Corporate Obligations – (continued) | |
| Banks – (continued) | |
| | (3M USD LIBOR + 1.360%) | |
| 800,000 | | | | 3.882 | %(c) | | | 07/24/38 | | | | 806,503 | |
| | (3M USD LIBOR + 3.800%) | |
| | 2,250,000 | | | | 5.300 | (c) | | | 12/29/49 | | | | 2,345,625 | |
| | KBC Bank NV(a)(c) (5 year USD Swap + 7.097%) | |
| | 1,400,000 | | | | 8.000 | | | | 01/25/23 | | | | 1,423,682 | |
| | KeyCorp | | | | | | | | | | | | | |
| | 4,350,000 | | | | 2.900 | | | | 09/15/20 | | | | 4,442,088 | |
| | Macquarie Bank Ltd.(b) | |
| | 265,000 | | | | 6.625 | | | | 04/07/21 | | | | 297,608 | |
| | Mitsubishi UFJ Financial Group, Inc. | |
| | 300,000 | | | | 3.850 | | | | 03/01/26 | | | | 312,102 | |
| | Mizuho Financial Group, Inc. | |
| | 2,175,000 | | | | 2.632 | (b) | | | 04/12/21 | | | | 2,173,211 | |
| | 4,150,000 | | | | 2.601 | | | | 09/11/22 | | | | 4,115,916 | |
| | Morgan Stanley, Inc. | |
| | 4,700,000 | | | | 3.700 | | | | 10/23/24 | | | | 4,869,077 | |
| | 700,000 | | | | 4.000 | | | | 07/23/25 | | | | 737,985 | |
| | 175,000 | | | | 3.625 | | | | 01/20/27 | | | | 177,377 | |
| | (3M USD LIBOR + 1.400%) | |
| | 2,575,000 | | | | 2.713 | (a)(c) | | | 10/24/23 | | | | 2,633,532 | |
| | Santander Bank NA | |
| | 975,000 | | | | 8.750 | | | | 05/30/18 | | | | 1,018,137 | |
| | Santander Holdings USA, Inc.(a) | |
| | 650,000 | | | | 2.650 | | | | 04/17/20 | | | | 652,976 | |
| | Sumitomo Mitsui Financial Group, Inc. | |
| | 2,550,000 | | | | 2.784 | | | | 07/12/22 | | | | 2,559,876 | |
| | The Bank of New York Mellon Corp.(a) | |
| | 825,000 | | | | 3.300 | | | | 08/23/29 | | | | 818,204 | |
| | The Bank of Tokyo-Mitsubishi UFJ Ltd.(b) | |
| | 2,700,000 | | | | 2.150 | | | | 09/14/18 | | | | 2,707,007 | |
| | The Toronto-Dominion Bank(a)(c) (5 year USD Swap + 2.205%) | |
| | 925,000 | | | | 3.625 | | | | 09/15/31 | | | | 921,058 | |
| | UBS Group Funding Switzerland AG(b) | |
| | 2,550,000 | | | | 4.125 | | | | 09/24/25 | | | | 2,682,367 | |
| | UniCredit SpA(b) | |
| | 5,925,000 | | | | 3.750 | | | | 04/12/22 | | | | 6,073,509 | |
| | Wells Fargo & Co. | |
| | 2,700,000 | | | | 3.000 | | | | 10/23/26 | | | | 2,640,198 | |
| | Westpac Banking Corp.(a)(c) (5 year USD ICE Swap + 2.236%) | |
| | 1,450,000 | | | | 4.322 | | | | 11/23/31 | | | | 1,489,743 | |
| | | | | | | | | | | | | | |
| | | | | | | | | | | | | 80,430,828 | |
| | |
| Beverages – 1.6% | |
| | Anheuser-Busch InBev Finance, Inc.(a) | |
| | 6,000,000 | | | | 2.650 | | | | 02/01/21 | | | | 6,097,444 | |
| | 2,325,000 | | | | 3.650 | | | | 02/01/26 | | | | 2,405,241 | |
| | 600,000 | | | | 4.900 | | | | 02/01/46 | | | | 677,740 | |
| | Molson Coors Brewing Co.(a) | |
| | 525,000 | | | | 2.100 | | | | 07/15/21 | | | | 517,659 | |
| | 725,000 | | | | 3.000 | | | | 07/15/26 | | | | 705,095 | |
| | Pernod Ricard SA(b) | |
| | 2,300,000 | | | | 4.450 | | | | 01/15/22 | | | | 2,460,675 | |
| | Suntory Holdings Ltd.(b) | |
| | 2,550,000 | | | | 2.550 | | | | 09/29/19 | | | | 2,571,958 | |
| | | | | | | | | | | | | | |
| | | | | | | | | | | | | 15,435,812 | |
| | |
| | |
| 50 | | The accompanying notes are an integral part of these financial statements. |
GOLDMAN SACHS CORE FIXED INCOME FUND
| | | | | | | | | | | | | | |
Principal Amount | | | Interest
Rate | | | Maturity Date | | | Value | |
| Corporate Obligations – (continued) | |
| Chemicals – 0.7% | |
| | LYB International Finance II BV(a) | |
| $ | 1,825,000 | | | | 3.500 | % | | | 03/02/27 | | | $ | 1,815,207 | |
| | The Sherwin-Williams Co. | |
| | 1,250,000 | | | | 2.250 | | | | 05/15/20 | | | | 1,254,947 | |
| | 400,000 | | | | 2.750 | (a) | | | 06/01/22 | | | | 402,693 | |
| | 325,000 | | | | 3.125 | (a) | | | 06/01/24 | | | | 326,633 | |
| | 1,900,000 | | | | 3.450 | (a) | | | 06/01/27 | | | | 1,913,211 | |
| | Westlake Chemical Corp.(a) | |
| | 925,000 | | | | 3.600 | | | | 08/15/26 | | | | 923,814 | |
| | | | | | | | | | | | | | |
| | | | | | | | | | | | | 6,636,505 | |
| | |
| Commercial Services – 0.8% | |
| | Ecolab, Inc. | |
| | 975,000 | | | | 5.500 | | | | 12/08/41 | | | | 1,199,567 | |
| | ERAC USA Finance LLC(b) | |
| | 3,525,000 | | | | 2.350 | | | | 10/15/19 | | | | 3,539,289 | |
| | Rensselaer Polytechnic Institute | |
| | 2,600,000 | | | | 5.600 | | | | 09/01/20 | | | | 2,798,818 | |
| | | | | | | | | | | | | | |
| | | | | | | | | | | | | 7,537,674 | |
| | |
| Computers(a) – 0.2% | |
| | Dell International LLC/EMC Corp.(b) | |
| | 1,100,000 | | | | 5.450 | | | | 06/15/23 | | | | 1,203,839 | |
| | Hewlett Packard Enterprise Co. | |
| | 1,025,000 | | | | 4.900 | | | | 10/15/25 | | | | 1,084,315 | |
| | | | | | | | | | | | | | |
| | | | | | | | | | | | | 2,288,154 | |
| | |
| Diversified Financial Services – 1.3% | |
| | AerCap Ireland Capital DAC/AerCap Global Aviation Trust | |
| | 2,075,000 | | | | 4.625 | | | | 07/01/22 | | | | 2,224,057 | |
| | American Express Co.(a) | |
| | 700,000 | | | | 3.625 | | | | 12/05/24 | | | | 722,593 | |
| | Discover Financial Services(a) | |
| | 1,625,000 | | | | 3.750 | | | | 03/04/25 | | | | 1,631,380 | |
| | GE Capital International Funding Co. | |
| | 1,110,000 | | | | 4.418 | | | | 11/15/35 | | | | 1,207,012 | |
| | International Lease Finance Corp.(b) | |
| | 1,400,000 | | | | 7.125 | | | | 09/01/18 | | | | 1,465,864 | |
| | Synchrony Financial(a) | |
| | 1,625,000 | | | | 2.600 | | | | 01/15/19 | | | | 1,635,408 | |
| | 1,900,000 | | | | 3.000 | | | | 08/15/19 | | | | 1,931,057 | |
| | TD Ameritrade Holding Corp.(a) | |
| | 1,950,000 | | | | 2.950 | | | | 04/01/22 | | | | 1,990,108 | |
| | | | | | | | | | | | | | |
| | | | | | | | | | | | | 12,807,479 | |
| | |
| Electrical – 1.9% | |
| | Arizona Public Service Co.(a) | |
| | 1,175,000 | | | | 2.950 | | | | 09/15/27 | | | | 1,163,649 | |
| | Dominion Energy, Inc. | |
| | 2,175,000 | | | | 2.579 | | | | 07/01/20 | | | | 2,193,150 | |
| | Duke Energy Corp.(a) | |
| | 2,100,000 | | | | 3.150 | | | | 08/15/27 | | | | 2,081,846 | |
| | Emera US Finance LP(a) | |
| | 950,000 | | | | 2.700 | | | | 06/15/21 | | | | 955,117 | |
| | Enel Finance International NV(b) | |
| | 1,375,000 | | | | 2.875 | | | | 05/25/22 | | | | 1,383,908 | |
| | Entergy Corp.(a) | |
| | 1,025,000 | | | | 2.950 | | | | 09/01/26 | | | | 991,244 | |
| | |
| Corporate Obligations – (continued) | |
| Electrical – (continued) | |
| | Exelon Corp.(a) | |
| 1,125,000 | | | | 3.497 | % | | | 06/01/22 | | | | 1,158,854 | |
| | Florida Power & Light Co.(a) | |
| | 1,532,000 | | | | 4.125 | | | | 02/01/42 | | | | 1,647,858 | |
| | Pacific Gas & Electric Co.(a) | |
| | 975,000 | | | | 3.500 | | | | 06/15/25 | | | | 1,006,282 | |
| | Puget Sound Energy, Inc.(a)(c) (3M USD LIBOR + 2.530%) | |
| | 1,230,000 | | | | 6.974 | | | | 06/01/67 | | | | 1,199,250 | |
| | Ruwais Power Co. PJSC(b) | |
| | 740,000 | | | | 6.000 | | | | 08/31/36 | | | | 869,500 | |
| | Southern California Edison Co.(a) | |
| | 1,950,000 | | | | 4.050 | | | | 03/15/42 | | | | 2,044,601 | |
| | The Southern Co.(a) | |
| | 1,975,000 | | | | 2.350 | | | | 07/01/21 | | | | 1,964,015 | |
| | | | | | | | | | | | | | |
| | | | | | | | | | | | | 18,659,274 | |
| | |
| Food & Drug Retailing – 0.5% | |
| | Kraft Heinz Foods Co.(a) | |
| | 1,050,000 | | | | 2.800 | | | | 07/02/20 | | | | 1,068,969 | |
| | 675,000 | | | | 5.200 | | | | 07/15/45 | | | | 739,402 | |
| | 125,000 | | | | 4.375 | | | | 06/01/46 | | | | 123,429 | |
| | Smithfield Foods, Inc.(b) | |
| | 1,200,000 | | | | 2.700 | | | | 01/31/20 | | | | 1,203,695 | |
| | 2,350,000 | | | | 2.650 | (a) | | | 10/03/21 | | | | 2,347,640 | |
| | | | | | | | | | | | | | |
| | | | | | | | | | | | | 5,483,135 | |
| | |
| Gas(a) – 0.3% | |
| | NiSource Finance Corp. | |
| | 2,525,000 | | | | 3.490 | | | | 05/15/27 | | | | 2,555,798 | |
| | |
| Healthcare Providers & Services – 1.9% | |
| | Aetna, Inc.(a) | |
| | 750,000 | | | | 2.800 | | | | 06/15/23 | | | | 754,613 | |
| | Becton Dickinson & Co. | |
| | 1,743,000 | | | | 2.675 | | | | 12/15/19 | | | | 1,763,927 | |
| | 2,575,000 | | | | 2.894 | (a) | | | 06/06/22 | | | | 2,583,378 | |
| | 2,450,000 | | | | 3.363 | (a) | | | 06/06/24 | | | | 2,472,858 | |
| | 825,000 | | | | 4.685 | (a) | | | 12/15/44 | | | | 872,090 | |
| | C.R. Bard, Inc.(a) | |
| | 2,200,000 | | | | 3.000 | | | | 05/15/26 | | | | 2,206,916 | |
| | Cigna Corp.(a) | |
| | 1,675,000 | | | | 3.250 | | | | 04/15/25 | | | | 1,696,327 | |
| | Medtronic, Inc. | |
| | 1,275,000 | | | | 3.150 | | | | 03/15/22 | | | | 1,320,202 | |
| | Stryker Corp.(a) | |
| | 575,000 | | | | 2.625 | | | | 03/15/21 | | | | 581,868 | |
| | 1,175,000 | | | | 3.375 | | | | 11/01/25 | | | | 1,203,291 | |
| | Thermo Fisher Scientific, Inc.(a) | |
| | 1,325,000 | | | | 3.000 | | | | 04/15/23 | | | | 1,346,896 | |
| | 1,025,000 | | | | 3.650 | | | | 12/15/25 | | | | 1,060,983 | |
| | UnitedHealth Group, Inc. | |
| | 950,000 | | | | 4.625 | | | | 07/15/35 | | | | 1,088,775 | |
| | | | | | | | | | | | | | |
| | | | | | | | | | | | | 18,952,124 | |
| | |
| Household Products – 0.1% | |
| | Kimberly-Clark Corp. | |
| | 825,000 | | | | 3.700 | | | | 06/01/43 | | | | 798,337 | |
| | |
| | |
| The accompanying notes are an integral part of these financial statements. | | 51 |
GOLDMAN SACHS CORE FIXED INCOME FUND
Schedule of Investments (continued)
September 30, 2017 (Unaudited)
| | | | | | | | | | | | | | |
Principal
Amount | | | Interest
Rate | | | Maturity
Date | | | Value | |
| Corporate Obligations – (continued) | |
| Insurance – 1.4% | |
| | AIA Group Ltd.(a)(b) | |
| $ | 925,000 | | | | 3.200 | % | | | 03/11/25 | | | $ | 925,273 | |
| | American International Group, Inc.(a) | |
| | 1,000,000 | | | | 3.750 | | | | 07/10/25 | | | | 1,032,707 | |
| | 1,100,000 | | | | 4.800 | | | | 07/10/45 | | | | 1,200,304 | |
| | Arch Capital Group Ltd. | |
| | 1,125,000 | | | | 7.350 | | | | 05/01/34 | | | | 1,497,629 | |
| | Brighthouse Financial, Inc.(a)(b) | |
| | 950,000 | | | | 3.700 | | | | 06/22/27 | | | | 932,782 | |
| | MetLife, Inc. | |
| | 250,000 | | | | 4.050 | | | | 03/01/45 | | | | 254,133 | |
| | Reliance Standard Life Global Funding II(b) | |
| | 2,050,000 | | | | 2.500 | | | | 01/15/20 | | | | 2,059,430 | |
| | Teachers Insurance & Annuity Association of America(b) | |
| | 560,000 | | | | 4.900 | | | | 09/15/44 | | | | 632,455 | |
| | The Chubb Corp.(a)(c) (3M USD LIBOR + 2.250%) | |
| | 1,125,000 | | | | 3.554 | | | | 03/29/67 | | | | 1,118,812 | |
| | The Hartford Financial Services Group, Inc. | |
| | 250,000 | | | | 5.125 | | | | 04/15/22 | | | | 277,026 | |
| | The Northwestern Mutual Life Insurance Co.(b) | |
| | 1,200,000 | | | | 6.063 | | | | 03/30/40 | | | | 1,578,589 | |
| | 750,000 | | | | 3.850 | (a) | | | 09/30/47 | | | | 741,504 | |
| | XLIT Ltd. | | | | | | | | | | | | | |
| | 1,225,000 | | | | 4.450 | | | | 03/31/25 | | | | 1,254,400 | |
| | | | | | | | | | | | | | |
| | | | | | | | | | | | | 13,505,044 | |
| | |
| Internet(a) – 0.3% | |
| | Amazon.com, Inc. | |
| | 1,650,000 | | | | 3.300 | | | | 12/05/21 | | | | 1,719,624 | |
| | Expedia, Inc.(b) | |
| | 1,575,000 | | | | 3.800 | | | | 02/15/28 | | | | 1,560,849 | |
| | | | | | | | | | | | | | |
| | | | | | | | | | | | | 3,280,473 | |
| | |
| Lodging(a) – 0.3% | |
| | Marriott International, Inc. | |
| | 766,000 | | | | 2.875 | | | | 03/01/21 | | | | 776,799 | |
| | 2,375,000 | | | | 2.300 | | | | 01/15/22 | | | | 2,344,689 | |
| | | | | | | | | | | | | | |
| | | | | | | | | | | | | 3,121,488 | |
| | |
| Machinery-Diversified(a) – 0.2% | |
| | Roper Technologies, Inc. | |
| | 1,300,000 | | | | 3.000 | | | | 12/15/20 | | | | 1,326,336 | |
| | 1,000,000 | | | | 2.800 | | | | 12/15/21 | | | | 1,009,155 | |
| | | | | | | | | | | | | | |
| | | | | 2,335,491 | |
| | |
| Media – 1.0% | |
| | 21st Century Fox America, Inc.(a) | |
| | 2,000,000 | | | | 3.700 | | | | 09/15/24 | | | | 2,075,432 | |
| Charter Communications Operating LLC/Charter Communications
Operating Capital(a) |
|
| | 475,000 | | | | 4.464 | | | | 07/23/22 | | | | 502,563 | |
| | 1,975,000 | | | | 4.908 | | | | 07/23/25 | | | | 2,111,306 | |
| | 200,000 | | | | 6.484 | | | | 10/23/45 | | | | 234,736 | |
| | NBCUniversal Media LLC | |
| | 3,850,000 | | | | 4.375 | | | | 04/01/21 | | | | 4,143,231 | |
| | Time Warner Cable LLC | |
| | 425,000 | | | | 5.000 | | | | 02/01/20 | | | | 449,327 | |
| | 275,000 | | | | 5.875 | (a) | | | 11/15/40 | | | | 301,775 | |
| | | | | | | | | | | | | | |
| | | | | | | | | | | | | 9,818,370 | |
| | |
| Corporate Obligations – (continued) | |
| Mining(b) – 0.5% | |
| | Glencore Funding LLC | |
| 3,075,000 | | | | 2.700 | | | | 10/25/17 | | | | 3,076,076 | |
| | 900,000 | | | | 4.125 | | | | 05/30/23 | | | | 936,945 | |
| | 1,183,000 | | | | 4.625 | | | | 04/29/24 | | | | 1,253,093 | |
| | | | | | | | | | | | | | |
| | | | | | | | | | | | | 5,266,114 | |
| | |
| Miscellaneous Manufacturing – 0.0% | |
| | General Electric Co. | |
| | 337,000 | | | | 6.150 | | | | 08/07/37 | | | | 446,870 | |
| | |
| Oil Field Services – 1.6% | |
| | Anadarko Petroleum Corp. | |
| | 950,000 | | | | 8.700 | | | | 03/15/19 | | | | 1,036,820 | |
| | 190,000 | | | | 3.450 | (a) | | | 07/15/24 | | | | 188,558 | |
| | 475,000 | | | | 5.550 | (a) | | | 03/15/26 | | | | 530,500 | |
| | 925,000 | | | | 6.450 | | | | 09/15/36 | | | | 1,094,271 | |
| | Apache Corp.(a) | |
| | 275,000 | | | | 3.250 | | | | 04/15/22 | | | | 278,934 | |
| | 400,000 | | | | 2.625 | | | | 01/15/23 | | | | 392,064 | |
| | 1,300,000 | | | | 4.250 | | | | 01/15/44 | | | | 1,220,806 | |
| | ConocoPhillips Co.(a) | |
| | 310,000 | | | | 3.350 | | | | 11/15/24 | | | | 318,805 | |
| | Devon Energy Corp.(a) | |
| | 250,000 | | | | 4.000 | | | | 07/15/21 | | | | 259,887 | |
| | 400,000 | | | | 5.600 | | | | 07/15/41 | | | | 437,759 | |
| | Dolphin Energy Ltd.(b) | |
| | 261,087 | | | | 5.888 | | | | 06/15/19 | | | | 270,225 | |
| | EQT Corp.(a) | |
| | 1,000,000 | | | | 3.000 | | | | 10/01/22 | | | | 1,002,332 | |
| | Halliburton Co.(a) | |
| | 1,600,000 | | | | 3.250 | | | | 11/15/21 | | | | 1,646,345 | |
| | Petroleos Mexicanos | |
| | 250,000 | | | | 5.500 | | | | 02/04/19 | | | | 260,312 | |
| | 628,000 | | | | 6.375 | | | | 02/04/21 | | | | 686,247 | |
| EUR | 1,250,000 | | | | 5.125 | | | | 03/15/23 | | | | 1,691,595 | |
| $ | 1,020,000 | | | | 6.500 | (b) | | | 03/13/27 | | | | 1,130,395 | |
| | 10,000 | | | | 6.625 | | | | 06/15/35 | | | | 10,775 | |
| | 27,000 | | | | 5.500 | | | | 06/27/44 | | | | 25,110 | |
| | 20,000 | | | | 6.375 | | | | 01/23/45 | | | | 20,380 | |
| | 190,000 | | | | 5.625 | | | | 01/23/46 | | | | 177,365 | |
| | 630,000 | | | | 6.750 | (b) | | | 09/21/47 | | | | 670,572 | |
| | Pioneer Natural Resources Co.(a) | |
| | 1,450,000 | | | | 3.450 | | | | 01/15/21 | | | | 1,482,587 | |
| | 295,000 | | | | 3.950 | | | | 07/15/22 | | | | 309,996 | |
| | Valero Energy Corp. | |
| | 950,000 | | | | 3.650 | | | | 03/15/25 | | | | 974,655 | |
| | | | | | | | | | | | | | |
| | | | | | | | | | | | | 16,117,295 | |
| | |
| Pharmaceuticals – 2.1% | |
| | Allergan Funding SCS | |
| | 2,200,000 | | | | 2.350 | | | | 03/12/18 | | | | 2,206,409 | |
| | 150,000 | | | | 4.850 | (a) | | | 06/15/44 | | | | 163,337 | |
| | Bayer US Finance LLC(b) | |
| | 2,775,000 | | | | 3.000 | | | | 10/08/21 | | | | 2,827,699 | |
| | EMD Finance LLC(a)(b) | |
| | 3,325,000 | | | | 2.950 | | | | 03/19/22 | | | | 3,379,501 | |
| | |
| | |
| 52 | | The accompanying notes are an integral part of these financial statements. |
GOLDMAN SACHS CORE FIXED INCOME FUND
| | | | | | | | | | | | | | |
Principal
Amount | | | Interest
Rate | | | Maturity
Date | | | Value | |
| Corporate Obligations – (continued) | |
| Pharmaceuticals – (continued) | |
| | Forest Laboratories LLC(a)(b) | |
| $ | 841,000 | | | | 4.375 | % | | | 02/01/19 | | | $ | 862,447 | |
| | 900,000 | | | | 5.000 | | | | 12/15/21 | | | | 983,610 | |
| | Mylan NV(a) | |
| | 2,775,000 | | | | 3.950 | | | | 06/15/26 | | | | 2,825,240 | |
| | Shire Acquisitions Investments Ireland DAC | |
| | 2,550,000 | | | | 1.900 | | | | 09/23/19 | | | | 2,544,958 | |
| | 2,125,000 | | | | 3.200 | (a) | | | 09/23/26 | | | | 2,094,862 | |
| | Teva Pharmaceutical Finance Netherlands III BV | |
| | 825,000 | | | | 2.200 | | | | 07/21/21 | | | | 794,313 | |
| | 645,000 | | | | 2.800 | | | | 07/21/23 | | | | 615,196 | |
| | 425,000 | | | | 3.150 | | | | 10/01/26 | | | | 391,721 | |
| | Zoetis, Inc.(a) | |
| | 1,250,000 | | | | 3.000 | | | | 09/12/27 | | | | 1,235,122 | |
| | | | | | | | | | | | | | |
| | | | | | | | | | | | | 20,924,415 | |
| | |
| Pipelines(a) – 2.3% | |
| | Columbia Pipeline Group, Inc. | |
| | 925,000 | | | | 3.300 | | | | 06/01/20 | | | | 946,785 | |
| | Enbridge, Inc. | |
| | 1,100,000 | | | | 2.900 | | | | 07/15/22 | | | | 1,106,439 | |
| | Energy Transfer LP | |
| | 1,375,000 | | | | 4.650 | | | | 06/01/21 | | | | 1,461,382 | |
| | 775,000 | | | | 5.200 | | | | 02/01/22 | | | | 839,987 | |
| | 210,000 | | | | 3.600 | | | | 02/01/23 | | | | 213,561 | |
| | EnLink Midstream Partners LP | |
| | 700,000 | | | | 4.850 | | | | 07/15/26 | | | | 732,473 | |
| | Enterprise Products Operating LLC | |
| | 215,000 | | | | 3.350 | | | | 03/15/23 | | | | 220,527 | |
| | 85,000 | | | | 3.750 | | | | 02/15/25 | | | | 88,095 | |
| | (3M USD LIBOR + 2.778%) | |
| | 1,350,000 | | | | 4.093 | (c) | | | 06/01/67 | | | | 1,310,297 | |
| | (3M USD LIBOR + 3.708%) | |
| | 2,125,000 | | | | 5.018 | (c) | | | 08/01/66 | | | | 2,126,063 | |
| | Kinder Morgan Energy Partners LP | |
| | 425,000 | | | | 5.400 | | | | 09/01/44 | | | | 441,838 | |
| | Kinder Morgan, Inc. | |
| | 4,375,000 | | | | 3.050 | | | | 12/01/19 | | | | 4,454,113 | |
| | Plains All American Pipeline LP/PAA Finance Corp. | |
| | 525,000 | | | | 3.650 | | | | 06/01/22 | | | | 527,775 | |
| | 650,000 | | | | 4.500 | | | | 12/15/26 | | | | 659,692 | |
| | Sabine Pass Liquefaction LLC | |
| | 1,475,000 | | | | 6.250 | | | | 03/15/22 | | | | 1,658,998 | |
| | 1,875,000 | | | | 5.625 | | | | 03/01/25 | | | | 2,069,531 | |
| | Western Gas Partners LP | |
| | 1,050,000 | | | | 3.950 | | | | 06/01/25 | | | | 1,054,868 | |
| | Williams Partners LP | |
| | 785,000 | | | | 3.600 | | | | 03/15/22 | | | | 811,058 | |
| | 1,400,000 | | | | 3.900 | | | | 01/15/25 | | | | 1,428,792 | |
| | 800,000 | | | | 4.000 | | | | 09/15/25 | | | | 818,267 | |
| | | | | | | | | | | | | | |
| | | | | | | | | | | | | 22,970,541 | |
| | |
| Real Estate Investment Trust – 2.5% | |
| | American Campus Communities Operating Partnership LP(a) | |
| | 2,575,000 | | | | 3.750 | | | | 04/15/23 | | | | 2,650,285 | |
| | American Tower Corp.(a) | |
| | 1,025,000 | | | | 3.300 | | | | 02/15/21 | | | | 1,050,290 | |
| | |
| Corporate Obligations – (continued) | |
| Real Estate Investment Trust – (continued) | |
| | Crown Castle International Corp.(a) | |
| 725,000 | | | | 3.200 | | | | 09/01/24 | | | | 721,559 | |
| | 1,475,000 | | | | 3.650 | | | | 09/01/27 | | | | 1,474,190 | |
| | CubeSmart LP(a) | |
| | 1,500,000 | | | | 4.000 | | | | 11/15/25 | | | | 1,546,257 | |
| | DDR Corp.(a) | |
| | 3,125,000 | | | | 3.500 | | | | 01/15/21 | | | | 3,171,337 | |
| | 850,000 | | | | 3.900 | | | | 08/15/24 | | | | 856,272 | |
| | Digital Realty Trust LP(a) | |
| | 1,525,000 | | | | 2.750 | | | | 02/01/23 | | | | 1,518,263 | |
| | Healthcare Trust of America Holdings LP(a) | |
| | 2,275,000 | | | | 3.700 | | | | 04/15/23 | | | | 2,331,103 | |
| | Kilroy Realty LP | |
| | 2,375,000 | | | | 6.625 | | | | 06/01/20 | | | | 2,622,519 | |
| | 1,500,000 | | | | 3.800 | (a) | | | 01/15/23 | | | | 1,545,079 | |
| | MPT Operating Partnership LP/MPT Finance Corp.(a) | |
| | 950,000 | | | | 5.000 | | | | 10/15/27 | | | | 973,750 | |
| | National Retail Properties, Inc.(a) | |
| | 1,150,000 | | | | 4.000 | | | | 11/15/25 | | | | 1,179,105 | |
| | Ventas Realty LP(a) | |
| | 975,000 | | | | 3.500 | | | | 02/01/25 | | | | 978,805 | |
| | VEREIT Operating Partnership LP(a) | |
| | 500,000 | | | | 4.875 | | | | 06/01/26 | | | | 536,875 | |
| | Welltower, Inc.(a) | |
| | 1,557,000 | | | | 4.125 | | | | 04/01/19 | | | | 1,599,926 | |
| | | | | | | | | | | | | | |
| | | | | | | | | | | | | 24,755,615 | |
| | |
| Retailing(a) – 0.5% | |
| | Alimentation Couche-Tard, Inc.(b) | |
| | 1,000,000 | | | | 2.700 | | | | 07/26/22 | | | | 1,003,240 | |
| | 400,000 | | | | 3.550 | | | | 07/26/27 | | | | 403,371 | |
| | CVS Health Corp. | |
| | 1,100,000 | | | | 4.125 | | | | 05/15/21 | | | | 1,161,902 | |
| | 2,100,000 | | | | 3.500 | | | | 07/20/22 | | | | 2,184,581 | |
| | | | | | | | | | | | | | |
| | | | | | | | | | | | | 4,753,094 | |
| | |
| Semiconductors(b) – 0.5% | |
| | Broadcom Corp./Broadcom Cayman Finance Ltd.(a) | |
| | 1,200,000 | | | | 3.000 | | | | 01/15/22 | | | | 1,220,018 | |
| | 950,000 | | | | 3.875 | | | | 01/15/27 | | | | 978,472 | |
| | NXP BV/NXP Funding LLC | |
| | 725,000 | | | | 4.125 | | | | 06/15/20 | | | | 756,719 | |
| | 1,975,000 | | | | 4.125 | | | | 06/01/21 | | | | 2,066,344 | |
| | 225,000 | | | | 4.625 | | | | 06/01/23 | | | | 241,594 | |
| | | | | | | | | | | | | | |
| | | | | | | | | | | | | 5,263,147 | |
| | |
| Software(a) – 0.1% | |
| | Fidelity National Information Services, Inc. | |
| | 1,436,000 | | | | 3.625 | | | | 10/15/20 | | | | 1,495,333 | |
| | |
| Sovereign – 0.4% | |
| | NCUA Guaranteed Notes Series A4 | |
| | 3,500,000 | | | | 3.000 | | | | 06/12/19 | | | | 3,575,598 | |
| | |
| Supranational – 0.3% | |
| | Inter-American Development Bank | |
| | 2,700,000 | | | | 1.000 | | | | 02/27/18 | | | | 2,690,769 | |
| | |
| | |
| The accompanying notes are an integral part of these financial statements. | | 53 |
GOLDMAN SACHS CORE FIXED INCOME FUND
Schedule of Investments (continued)
September 30, 2017 (Unaudited)
| | | | | | | | | | | | | | |
Principal
Amount | | | Interest
Rate | | | Maturity
Date | | | Value | |
| Corporate Obligations – (continued) | | | | |
| Telecommunication Services – 3.9% | | | | |
| | AT&T, Inc. | | | | | |
| $ | 500,000 | | | | 2.800 | %(a) | | | 02/17/21 | | | $ | 505,954 | |
| | 2,200,000 | | | | 3.200 | (a) | | | 03/01/22 | | | | 2,243,650 | |
| | 2,875,000 | | | | 3.800 | | | | 03/15/22 | | | | 2,994,797 | |
| | 2,400,000 | | | | 3.000 | (a) | | | 06/30/22 | | | | 2,423,367 | |
| | 1,354,000 | | | | 3.600 | (a) | | | 02/17/23 | | | | 1,393,112 | |
| | 3,525,000 | | | | 3.400 | (a) | | | 05/15/25 | | | | 3,477,063 | |
| | 100,000 | | | | 4.125 | (a) | | | 02/17/26 | | | | 102,609 | |
| | 2,175,000 | | | | 3.900 | (a) | | | 08/14/27 | | | | 2,179,234 | |
| | Cisco Systems, Inc. | | | | | |
| | 3,875,000 | | | | 1.400 | | | | 09/20/19 | | | | 3,855,564 | |
| | Telefonica Emisiones SAU | | | | | |
| | 3,875,000 | | | | 5.462 | | | | 02/16/21 | | | | 4,247,304 | |
| | Verizon Communications, Inc. | | | | | |
| | 7,848,000 | | | | 2.946 | | | | 03/15/22 | | | | 7,980,978 | |
| | 6,825,000 | | | | 5.150 | | | | 09/15/23 | | | | 7,650,603 | |
| | 25,000 | | | | 4.125 | | | | 08/15/46 | | | | 22,727 | |
| | 50,000 | | | | 4.862 | | | | 08/21/46 | | | | 50,683 | |
| | | | | | | | | | | | | | |
| | | | | | | | | | | | | 39,127,645 | |
| | |
| Trucking & Leasing(b) – 0.3% | | | | |
| | Penske Truck Leasing Co. LP/PTL Finance Corp. | |
| | 1,225,000 | | | | 3.375 | (a) | | | 02/01/22 | | | | 1,257,793 | |
| | 1,425,000 | | | | 4.250 | | | | 01/17/23 | | | | 1,518,573 | |
| | | | | | | | | | | | | | |
| | | | | | | | | | | | | 2,776,366 | |
| | |
| | TOTAL CORPORATE OBLIGATIONS | |
| | (Cost $376,659,076) | | | $ | 384,375,330 | |
| | |
| | | | | | | | | | | | | | |
| Mortgage-Backed Obligations – 24.4% | | | | |
| Adjustable Rate Non-Agency(c) – 1.6% | | | | |
| Harborview Mortgage Loan Trust Series 2005-16, Class 2A1A
(1M USD LIBOR + 0.240%) |
|
| $ | 474,672 | | | | 1.711 | % | | | 01/19/36 | | | $ | 324,155 | |
| Impac CMB Trust Series 2004-08, Class 1A (1M USD
LIBOR + 0.720%) |
|
| | 253,685 | | | | 1.954 | | | | 10/25/34 | | | | 229,270 | |
| Master Adjustable Rate Mortgages Trust Series 2006-OA2,
Class 4A1A (12M MTA + 0.850%) |
|
| | 952,984 | | | | 1.680 | | | | 12/25/46 | | | | 942,983 | |
| Mortgage Repurchase Agreement Financing Trust Series 2016-1,
Class A2(b) (1M USD LIBOR + 0.950%) |
|
| | 2,800,000 | | | | 2.181 | | | | 04/10/19 | | | | 2,800,059 | |
| Mortgage Repurchase Agreement Financing Trust Series 2017-1,
Class A1(b) (1M USD LIBOR + 0.850%) |
|
| | 2,550,000 | | | | 2.081 | | | | 07/10/19 | | | | 2,550,655 | |
| Mortgage Repurchase Agreement Financing Trust Series 2017-2,
Class A1(b) |
|
| | 7,950,000 | | | | 1.781 | | | | 08/12/19 | | | | 7,950,644 | |
| Sequoia Mortgage Trust Series 2003-4, Class 1A2 (6M USD
LIBOR + 0.660%) |
|
| | 636,606 | | | | 2.116 | | | | 07/20/33 | | | | 622,132 | |
| Washington Mutual Mortgage Pass-Through Certificates Series
2002-AR19, Class A7 |
|
| | 41,125 | | | | 2.822 | | | | 02/25/33 | | | | 42,343 | |
| | |
| TOTAL ADJUSTABLE RATE
NON-AGENCY |
| | $ | 15,462,241 | |
| | |
| | | | | | | | | | | | | | |
Principal
Amount | | | Interest
Rate | | | Maturity
Date | | | Value | |
| Mortgage-Backed Obligations – (continued) | |
| Collateralized Mortgage Obligations – 0.8% | | | | |
| Interest Only(c)(d) – 0.0% | | | | |
| CS First Boston Mortgage Securities Corp. Series 2003-AR20,
Class 2X |
|
| $ | 158,285 | | | | 0.000 | % | | | 08/25/33 | | | $ | — | |
| CS First Boston Mortgage-Backed Pass-Through Certificates
Series 2003-AR18, Class 2X |
|
| | 162,044 | | | | 0.000 | | | | 07/25/33 | | | | — | |
| | | | | | | | | | | | | | |
| | | | | | | | | | | | | — | |
| | |
| Inverse Floaters(c) – 0.0% | | | | |
| GNMA REMIC Series 2002-13, Class SB (-1x1M LIBOR +
37.567%) |
|
| | 59,460 | | | | 31.806 | | | | 02/16/32 | | | | 91,311 | |
| | |
| Sequential Fixed Rate – 0.1% | | | | |
| | FHLMC REMIC Series 2755, Class ZA | |
| | 624,865 | | | | 5.000 | | | | 02/15/34 | | | | 684,744 | |
| | |
| Sequential Fixed Rate – 0.6% | | | | |
| | FHLMC REMIC Series 4273, Class PD | |
| | 1,450,976 | | | | 6.500 | | | | 11/15/43 | | | | 1,674,446 | |
| | FNMA REMIC Series 2003-134, Class ME | |
| | 9,869 | | | | 4.500 | | | | 06/25/33 | | | | 9,957 | |
| | FNMA REMIC Series 2004-64, Class BA | |
| | 2,044 | | | | 5.000 | | | | 03/25/34 | | | | 2,048 | |
| | FNMA REMIC Series 2011-52, Class GB | |
| | 1,384,780 | | | | 5.000 | | | | 06/25/41 | | | | 1,519,502 | |
| | FNMA REMIC Series 2011-99, Class DB | |
| | 1,382,174 | | | | 5.000 | | | | 10/25/41 | | | | 1,515,126 | |
| | FNMA REMIC Series 2012-111, Class B | |
| | 227,605 | | | | 7.000 | | | | 10/25/42 | | | | 261,812 | |
| | FNMA REMIC Series 2012-153, Class B | |
| | 826,700 | | | | 7.000 | | | | 07/25/42 | | | | 959,172 | |
| | | | | | | | | | | | | | |
| | | | | 5,942,063 | |
| | |
| Sequential Floating Rate(b)(c) – 0.1% | | | | |
| Station Place Securitization Trust Series 2015-2, Class A
(1M USD LIBOR + 1.050%) |
|
| | 1,117,000 | | | | 2.279 | | | | 05/15/18 | | | | 1,117,000 | |
| | |
| TOTAL COLLATERALIZED MORTGAGE
OBLIGATIONS |
| | $ | 7,835,118 | |
| | |
| Commercial Mortgage-Backed Securities(c) – 0.2% | | | | |
| Sequential Floating Rate – 0.2% | | | | |
| Citigroup Commercial Mortgage Trust Series 2008-C7,
Class A1A |
|
| | 1,811,693 | | | | 6.141 | | | | 12/10/49 | | | | 1,810,996 | |
| | |
| Federal Agencies – 21.8% | | | | |
| Adjustable Rate FNMA(c) – 0.5% | | | | |
| | (1 year CMT + 2.216%) | | | | | | | | | |
| | 6,510 | | | | 3.148 | | | | 06/01/33 | | | | 6,853 | |
| | (12M USD LIBOR + 1.710%) | | | | | | | | | |
| | 879,430 | | | | 3.537 | | | | 07/01/34 | | | | 926,694 | |
| | (12M USD LIBOR + 1.567%) | | | | | | | | | |
| | 1,834,175 | | | | 3.246 | | | | 09/01/34 | | | | 1,917,134 | |
| | (12M USD LIBOR + 1.742%) | | | | | | | | | |
| | 1,464,954 | | | | 3.488 | | | | 05/01/35 | | | | 1,547,479 | |
| | (12M USD LIBOR + 1.233%) | | | | | | | | | |
| | 173,691 | | | | 2.985 | | | | 06/01/35 | | | | 179,288 | |
| | | | | | | | | | | | | | |
| | | | | 4,577,448 | |
| | |
| | |
| 54 | | The accompanying notes are an integral part of these financial statements. |
GOLDMAN SACHS CORE FIXED INCOME FUND
| | | | | | | | | | | | | | |
Principal
Amount | | | Interest
Rate | | | Maturity
Date | | | Value | |
| Mortgage-Backed Obligations – (continued) | |
| FHLMC – 0.8% | |
| $ | 494 | | | | 5.000 | % | | | 10/01/17 | | | $ | 496 | |
| | 2 | | | | 7.000 | | | | 10/01/17 | | | | 2 | |
| | 1,010 | | | | 5.000 | | | | 11/01/17 | | | | 1,033 | |
| | 708 | | | | 5.000 | | | | 12/01/17 | | | | 723 | |
| | 1,324 | | | | 5.000 | | | | 01/01/18 | | | | 1,346 | |
| | 3,518 | | | | 5.000 | | | | 02/01/18 | | | | 3,532 | |
| | 3,102 | | | | 5.000 | | | | 03/01/18 | | | | 3,121 | |
| | 2,392 | | | | 5.000 | | | | 04/01/18 | | | | 2,409 | |
| | 1,600 | | | | 5.000 | | | | 05/01/18 | | | | 1,615 | |
| | 1,602 | | | | 5.000 | | | | 06/01/18 | | | | 1,616 | |
| | 3,973 | | | | 5.000 | | | | 07/01/18 | | | | 4,013 | |
| | 593 | | | | 5.000 | | | | 08/01/18 | | | | 600 | |
| | 6,032 | | | | 4.500 | | | | 09/01/18 | | | | 6,093 | |
| | 817 | | | | 5.000 | | | | 10/01/18 | | | | 827 | |
| | 1,513 | | | | 5.000 | | | | 11/01/18 | | | | 1,533 | |
| | 21,155 | | | | 5.000 | | | | 06/01/19 | | | | 21,591 | |
| | 58,721 | | | | 5.000 | | | | 05/01/23 | | | | 63,770 | |
| | 179,845 | | | | 4.500 | | | | 10/01/23 | | | | 192,724 | |
| | 47,534 | | | | 5.500 | | | | 10/01/25 | | | | 52,584 | |
| | 4,032 | | | | 7.000 | | | | 06/01/26 | | | | 4,300 | |
| | 11,072 | | | | 7.500 | | | | 12/01/30 | | | | 11,578 | |
| | 12,624 | | | | 7.500 | | | | 01/01/31 | | | | 13,604 | |
| | 328,153 | | | | 5.500 | | | | 03/01/33 | | | | 364,413 | |
| | 16,178 | | | | 5.000 | | | | 10/01/33 | | | | 17,706 | |
| | 57,277 | | | | 6.500 | | | | 10/01/33 | | | | 66,459 | |
| | 720 | | | | 5.500 | | | | 12/01/33 | | | | 814 | |
| | 21,740 | | | | 5.500 | | | | 09/01/34 | | | | 24,250 | |
| | 1,439 | | | | 5.500 | | | | 12/01/34 | | | | 1,597 | |
| | 1,347 | | | | 5.500 | | | | 03/01/35 | | | | 1,495 | |
| | 2,895 | | | | 5.000 | | | | 04/01/35 | | | | 3,168 | |
| | 23,863 | | | | 5.000 | | | | 07/01/35 | | | | 26,117 | |
| | 35,627 | | | | 5.500 | | | | 11/01/35 | | | | 39,573 | |
| | 130,676 | | | | 5.000 | | | | 12/01/35 | | | | 144,807 | |
| | 258 | | | | 5.500 | | | | 02/01/36 | | | | 290 | |
| | 54,820 | | | | 5.500 | | | | 06/01/36 | | | | 60,800 | |
| | 39,823 | | | | 5.500 | | | | 08/01/37 | | | | 44,161 | |
| | 256,310 | | | | 5.000 | | | | 01/01/38 | | | | 281,178 | |
| | 103,409 | | | | 5.500 | | | | 03/01/38 | | | | 115,600 | |
| | 50,495 | | | | 5.500 | | | | 04/01/38 | | | | 56,448 | |
| | 76,875 | | | | 5.500 | | | | 08/01/38 | | | | 86,514 | |
| | 1,870 | | | | 5.500 | | | | 09/01/38 | | | | 2,090 | |
| | 6,266 | | | | 6.500 | | | | 09/01/38 | | | | 7,178 | |
| | 7,659 | | | | 5.500 | | | | 11/01/38 | | | | 8,723 | |
| | 14,110 | | | | 5.500 | | | | 12/01/38 | | | | 15,649 | |
| | 614,760 | | | | 5.000 | | | | 01/01/39 | | | | 672,272 | |
| | 750,524 | | | | 7.000 | | | | 02/01/39 | | | | 873,641 | |
| | 3,873 | | | | 5.500 | | | | 03/01/39 | | | | 4,286 | |
| | 184,561 | | | | 5.000 | | | | 06/01/39 | | | | 200,955 | |
| | 5,225 | | | | 5.500 | | | | 10/01/39 | | | | 5,840 | |
| | 12,214 | | | | 5.500 | | | | 03/01/40 | | | | 13,646 | |
| | 24,059 | | | | 4.000 | | | | 06/01/40 | | | | 25,503 | |
| | 26,852 | | | | 5.500 | | | | 06/01/40 | | | | 30,009 | |
| | 18,121 | | | | 5.000 | | | | 08/01/40 | | | | 19,854 | |
| | 5,004 | | | | 4.500 | | | | 11/01/40 | | | | 5,384 | |
| | 255,971 | | | | 4.000 | | | | 02/01/41 | | | | 271,017 | |
| | 5,306 | | | | 5.000 | | | | 04/01/41 | | | | 5,837 | |
| | |
| Mortgage-Backed Obligations – (continued) | |
| FHLMC – (continued) | |
| 14,688 | | | | 5.000 | | | | 06/01/41 | | | | 16,093 | |
| | 18,814 | | | | 4.000 | | | | 11/01/41 | | | | 19,946 | |
| | 1,400,652 | | | | 3.500 | | | | 06/01/45 | | | | 1,454,709 | |
| | 1,109,199 | | | | 3.500 | | | | 10/01/45 | | | | 1,151,661 | |
| | 1,762,451 | | | | 3.500 | | | | 06/01/46 | | | | 1,837,631 | |
| | | | | | | | | | | | | | |
| | | | | | | | | | | | | 8,366,424 | |
| | |
| FNMA – 8.7% | |
| | 6,344 | | | | 5.000 | | | | 06/01/18 | | | | 6,401 | |
| | 48,558 | | | | 4.500 | | | | 07/01/18 | | | | 48,973 | |
| | 3,199 | | | | 4.500 | | | | 08/01/18 | | | | 3,230 | |
| | 71 | | | | 6.500 | | | | 10/01/18 | | | | 79 | |
| | 81,100 | | | | 5.500 | | | | 09/01/23 | | | | 85,934 | |
| | 25,364 | | | | 5.500 | | | | 10/01/23 | | | | 26,975 | |
| | 240,086 | | | | 5.000 | | | | 02/01/24 | | | | 252,196 | |
| | 35,679 | | | | 7.000 | | | | 08/01/27 | | | | 40,309 | |
| | 1,615 | | | | 6.500 | | | | 09/01/27 | | | | 1,814 | |
| | 153,786 | | | | 7.000 | | | | 03/01/28 | | | | 174,403 | |
| | 2,123 | | | | 6.500 | | | | 05/01/28 | | | | 2,384 | |
| | 17,650 | | | | 8.000 | | | | 02/01/31 | | | | 20,046 | |
| | 58,854 | | | | 7.000 | | | | 03/01/31 | | | | 64,366 | |
| | 646 | | | | 5.500 | | | | 05/01/33 | | | | 726 | |
| | 22,799 | | | | 5.000 | | | | 07/01/33 | | | | 25,204 | |
| | 38,809 | | | | 5.000 | | | | 08/01/33 | | | | 42,685 | |
| | 1,311 | | | | 5.000 | | | | 09/01/33 | | | | 1,442 | |
| | 7,603 | | | | 5.500 | | | | 09/01/33 | | | | 8,492 | |
| | 1,598 | | | | 6.500 | | | | 09/01/33 | | | | 1,829 | |
| | 15,579 | | | | 5.000 | | | | 12/01/33 | | | | 17,200 | |
| | 472 | | | | 5.500 | | | | 12/01/33 | | | | 525 | |
| | 868 | | | | 5.500 | | | | 01/01/34 | | | | 969 | |
| | 10,662 | | | | 5.500 | | | | 02/01/34 | | | | 11,908 | |
| | 1,883 | | | | 5.500 | | | | 04/01/34 | | | | 2,113 | |
| | 7,528 | | | | 5.500 | | | | 05/01/34 | | | | 8,417 | |
| | 1,946 | | | | 6.000 | | | | 07/01/34 | | | | 2,207 | |
| | 2,572 | | | | 5.500 | | | | 08/01/34 | | | | 2,889 | |
| | 6,813 | | | | 5.500 | | | | 10/01/34 | | | | 7,592 | |
| | 5,242 | | | | 5.500 | | | | 11/01/34 | | | | 5,862 | |
| | 60,911 | | | | 5.500 | | | | 12/01/34 | | | | 68,057 | |
| | 172,394 | | | | 5.000 | | | | 04/01/35 | | | | 190,966 | |
| | 6,599 | | | | 5.500 | | | | 04/01/35 | | | | 7,372 | |
| | 5,760 | | | | 5.500 | | | | 07/01/35 | | | | 6,435 | |
| | 262 | | | | 5.500 | | | | 08/01/35 | | | | 294 | |
| | 965,556 | | | | 5.000 | | | | 09/01/35 | | | | 1,062,330 | |
| | 15,623 | | | | 5.500 | | | | 09/01/35 | | | | 17,509 | |
| | 1,114 | | | | 5.500 | | | | 12/01/35 | | | | 1,252 | |
| | 222 | | | | 5.500 | | | | 02/01/36 | | | | 248 | |
| | 114,788 | | | | 5.500 | | | | 03/01/36 | | | | 128,234 | |
| | 22,272 | | | | 6.000 | | | | 03/01/36 | | | | 25,398 | |
| | 762 | | | | 5.500 | | | | 04/01/36 | | | | 852 | |
| | 4,266 | | | | 6.000 | | | | 04/01/36 | | | | 4,853 | |
| | 127,612 | | | | 6.000 | | | | 07/01/36 | | | | 144,795 | |
| | 223,105 | | | | 6.000 | | | | 09/01/36 | | | | 253,737 | |
| | 1,832 | | | | 5.500 | | | | 01/01/37 | | | | 2,054 | |
| | 3,030 | | | | 6.000 | | | | 01/01/37 | | | | 3,458 | |
| | 764 | | | | 5.500 | | | | 02/01/37 | | | | 856 | |
| | 11,742 | | | | 6.000 | | | | 02/01/37 | | | | 13,472 | |
| | |
| | |
| The accompanying notes are an integral part of these financial statements. | | 55 |
GOLDMAN SACHS CORE FIXED INCOME FUND
Schedule of Investments (continued)
September 30, 2017 (Unaudited)
| | | | | | | | | | | | | | |
Principal
Amount | | | Interest
Rate | | | Maturity
Date | | | Value | |
| Mortgage-Backed Obligations – (continued) | |
| FNMA – (continued) | |
| $ | 30,291 | | | | 6.000 | % | | | 03/01/37 | | | $ | 34,384 | |
| | 1,698 | | | | 5.500 | | | | 04/01/37 | | | | 1,903 | |
| | 725 | | | | 5.500 | | | | 05/01/37 | | | | 817 | |
| | 530 | | | | 5.500 | | | | 06/01/37 | | | | 594 | |
| | 361 | | | | 5.500 | | | | 07/01/37 | | | | 405 | |
| | 327,221 | | | | 6.000 | | | | 07/01/37 | | | | 371,170 | |
| | 5,299 | | | | 6.000 | | | | 08/01/37 | | | | 6,018 | |
| | 93,879 | | | | 6.000 | | | | 09/01/37 | | | | 106,546 | |
| | 298,988 | | | | 6.000 | | | | 10/01/37 | | | | 339,494 | |
| | 400,630 | | | | 6.000 | | | | 11/01/37 | | | | 456,274 | |
| | 425 | | | | 5.500 | | | | 12/01/37 | | | | 476 | |
| | 848 | | | | 5.500 | | | | 02/01/38 | | | | 957 | |
| | 4,624 | | | | 5.500 | | | | 03/01/38 | | | | 5,185 | |
| | 25,064 | | | | 6.000 | | | | 03/01/38 | | | | 28,514 | |
| | 51,087 | | | | 5.000 | | | | 04/01/38 | | | | 56,096 | |
| | 190,903 | | | | 6.000 | | | | 04/01/38 | | | | 216,955 | |
| | 1,028 | | | | 5.500 | | | | 05/01/38 | | | | 1,154 | |
| | 403,664 | | | | 6.000 | | | | 05/01/38 | | | | 458,252 | |
| | 4,792 | | | | 5.500 | | | | 06/01/38 | | | | 5,382 | |
| | 39,830 | | | | 6.000 | | | | 06/01/38 | | | | 45,228 | |
| | 3,295 | | | | 5.500 | | | | 07/01/38 | | | | 3,694 | |
| | 1,981 | | | | 5.500 | | | | 08/01/38 | | | | 2,221 | |
| | 1,703 | | | | 5.500 | | | | 09/01/38 | | | | 1,910 | |
| | 211,117 | | | | 6.000 | | | | 10/01/38 | | | | 239,783 | |
| | 234,319 | | | | 6.000 | | | | 11/01/38 | | | | 265,936 | |
| | 2,956 | | | | 5.500 | | | | 12/01/38 | | | | 3,289 | |
| | 46,132 | | | | 5.000 | | | | 02/01/39 | | | | 50,562 | |
| | 66,614 | | | | 6.000 | | | | 02/01/39 | | | | 75,670 | |
| | 451,925 | | | | 7.000 | | | | 03/01/39 | | | | 523,664 | |
| | 31,787 | | | | 4.500 | | | | 04/01/39 | | | | 34,707 | |
| | 290,486 | | | | 6.000 | | | | 04/01/39 | | | | 329,662 | |
| | 11,288 | | | | 4.500 | | | | 05/01/39 | | | | 12,325 | |
| | 11,147 | | | | 5.500 | | | | 06/01/39 | | | | 12,495 | |
| | 7,405 | | | | 4.500 | | | | 07/01/39 | | | | 8,085 | |
| | 504,813 | | | | 5.000 | | | | 07/01/39 | | | | 551,813 | |
| | 55,601 | | | | 4.500 | | | | 08/01/39 | | | | 60,710 | |
| | 318,461 | | | | 6.000 | | | | 09/01/39 | | | | 361,545 | |
| | 9,522 | | | | 5.500 | | | | 11/01/39 | | | | 10,677 | |
| | 309,201 | | | | 6.000 | | | | 11/01/39 | | | | 351,140 | |
| | 468,201 | | | | 4.500 | | | | 12/01/39 | | | | 511,217 | |
| | 42,371 | | | | 6.000 | | | | 04/01/40 | | | | 48,121 | |
| | 395,324 | | | | 5.000 | | | | 06/01/40 | | | | 432,171 | |
| | 89,645 | | | | 5.000 | | | | 07/01/40 | | | | 98,001 | |
| | 460,218 | | | | 6.000 | | | | 10/01/40 | | | | 522,505 | |
| | 261,753 | | | | 5.000 | | | | 11/01/40 | | | | 286,123 | |
| | 283,505 | | | | 6.000 | | | | 04/01/41 | | | | 321,741 | |
| | 1,015,542 | | | | 4.500 | | | | 05/01/41 | | | | 1,095,547 | |
| | 207,651 | | | | 6.000 | | | | 05/01/41 | | | | 235,211 | |
| | 170,457 | | | | 4.500 | | | | 08/01/41 | | | | 184,200 | |
| | 56,959 | | | | 3.500 | | | | 11/01/41 | | | | 59,091 | |
| | 69,370 | | | | 3.500 | | | | 06/01/42 | | | | 72,053 | |
| | 366,504 | | | | 5.000 | | | | 07/01/42 | | | | 400,665 | |
| | 810,773 | | | | 3.500 | | | | 10/01/42 | | | | 840,064 | |
| | 31,165 | | | | 3.000 | | | | 11/01/42 | | | | 31,536 | |
| | 738,387 | | | | 3.000 | | | | 12/01/42 | | | | 746,279 | |
| | 1,082,184 | | | | 3.000 | | | | 01/01/43 | | | | 1,095,035 | |
| | |
| Mortgage-Backed Obligations – (continued) | |
| FNMA – (continued) | |
| 163,974 | | | | 3.000 | | | | 02/01/43 | | | | 165,921 | |
| | 1,101,243 | | | | 3.000 | | | | 03/01/43 | | | | 1,114,665 | |
| | 1,866,199 | | | | 3.000 | | | | 04/01/43 | | | | 1,888,943 | |
| | 296,513 | | | | 3.500 | | | | 04/01/43 | | | | 307,072 | |
| | 1,329,110 | | | | 3.000 | | | | 05/01/43 | | | | 1,345,309 | |
| | 121,777 | | | | 3.500 | | | | 05/01/43 | | | | 126,524 | |
| | 125,928 | | | | 3.000 | | | | 06/01/43 | | | | 127,463 | |
| | 1,142,039 | | | | 3.000 | | | | 07/01/43 | | | | 1,155,959 | |
| | 7,026,185 | | | | 3.500 | | | | 07/01/43 | | | | 7,276,391 | |
| | 2,227,787 | | | | 3.500 | | | | 08/01/43 | | | | 2,307,342 | |
| | 70,088 | | | | 3.500 | | | | 09/01/43 | | | | 72,842 | |
| | 176,456 | | | | 3.500 | | | | 01/01/44 | | | | 183,390 | |
| | 1,352,759 | | | | 5.000 | | | | 05/01/44 | | | | 1,483,201 | |
| | 465,334 | | | | 3.500 | | | | 04/01/45 | | | | 483,184 | |
| | 4,578,751 | | | | 4.500 | | | | 04/01/45 | | | | 5,011,586 | |
| | 536,909 | | | | 4.500 | | | | 05/01/45 | | | | 587,747 | |
| | 119,712 | | | | 3.500 | | | | 06/01/45 | | | | 124,304 | |
| | 68,766 | | | | 3.500 | | | | 07/01/45 | | | | 71,403 | |
| | 45,603 | | | | 3.500 | | | | 09/01/45 | | | | 47,360 | |
| | 117,969 | | | | 3.500 | | | | 10/01/45 | | | | 122,457 | |
| | 83,299 | | | | 3.500 | | | | 11/01/45 | | | | 86,468 | |
| | 43,475 | | | | 3.500 | | | | 12/01/45 | | | | 45,130 | |
| | 126,183 | | | | 3.500 | | | | 01/01/46 | | | | 130,984 | |
| | 1,841,838 | | | | 3.500 | | | | 06/01/46 | | | | 1,915,318 | |
| | 2,000,000 | | | | 3.500 | | | | TBA-30yr | (e) | | | 2,061,719 | |
| | 39,000,000 | | | | 4.000 | | | | TBA-30yr | (e) | | | 41,056,642 | |
| | 2,000,000 | | | | 5.000 | | | | TBA-30yr | (e) | | | 2,182,188 | |
| | | | | | | | | | | | | | |
| | | | | | | | | | | | | 86,296,106 | |
| | |
| GNMA – 11.8% | |
| | 10,000 | | | | 6.000 | | | | 11/15/38 | | | | 11,507 | |
| | 146,245 | | | | 5.000 | | | | 07/15/40 | | | | 160,728 | |
| | 162,614 | | | | 5.000 | | | | 01/15/41 | | | | 178,718 | |
| | 10,678 | | | | 4.000 | | | | 02/20/41 | | | | 11,367 | |
| | 16,413 | | | | 4.000 | | | | 11/20/41 | | | | 17,438 | |
| | 2,705 | | | | 4.000 | | | | 01/20/42 | | | | 2,874 | |
| | 8,791 | | | | 4.000 | | | | 04/20/42 | | | | 9,341 | |
| | 4,762 | | | | 4.000 | | | | 10/20/42 | | | | 5,060 | |
| | 91,742 | | | | 4.000 | | | | 08/20/43 | | | | 97,362 | |
| | 15,624,355 | | | | 4.000 | | | | 10/20/43 | | | | 16,581,346 | |
| | 9,488 | | | | 4.000 | | | | 03/20/44 | | | | 10,069 | |
| | 11,540 | | | | 4.000 | | | | 05/20/44 | | | | 12,247 | |
| | 802,233 | | | | 4.000 | | | | 11/20/44 | | | | 850,868 | |
| | 53,577 | | | | 4.000 | | | | 05/20/45 | | | | 56,808 | |
| | 7,823,655 | | | | 4.000 | | | | 07/20/45 | | | | 8,295,519 | |
| | 1,801,709 | | | | 4.000 | | | | 08/20/45 | | | | 1,908,686 | |
| | 4,953,089 | | | | 4.000 | | | | 09/20/45 | | | | 5,247,178 | |
| | 5,936,661 | | | | 4.000 | | | | 10/20/45 | | | | 6,289,150 | |
| | 1,038,820 | | | | 4.000 | | | | 11/20/45 | | | | 1,100,500 | |
| | 4,695,455 | | | | 4.000 | | | | 01/20/46 | | | | 4,968,379 | |
| | 1,390,102 | | | | 4.000 | | | | 02/20/46 | | | | 1,470,902 | |
| | 19,197,300 | | | | 4.000 | | | | 03/20/46 | | | | 20,313,143 | |
| | 5,354,784 | | | | 4.000 | | | | 04/20/46 | | | | 5,666,031 | |
| | 2,593,459 | | | | 4.000 | | | | 05/20/46 | | | | 2,744,204 | |
| | 4,522,357 | | | | 4.000 | | | | 05/20/47 | | | | 4,771,794 | |
| | 17,791,967 | | | | 4.000 | | | | 06/20/47 | | | | 18,784,425 | |
| | |
| | |
| 56 | | The accompanying notes are an integral part of these financial statements. |
GOLDMAN SACHS CORE FIXED INCOME FUND
| | | | | | | | | | | | | | |
Principal
Amount | | | Interest
Rate | | | Maturity
Date | | | Value | |
| Mortgage-Backed Obligations – (continued) | |
| GNMA – (continued) | |
| $ | 7,958,158 | | | | 4.000 | % | | | 07/20/47 | | | $ | 8,394,167 | |
| | 4,988,924 | | | | 4.000 | | | | 08/20/47 | | | | 5,275,008 | |
| | 4,000,000 | | | | 4.000 | | | | 09/20/47 | | | | 4,219,150 | |
| | | | | | | | | | | | | | |
| | | | | | | | | | | | | 117,453,969 | |
| | |
| | TOTAL FEDERAL AGENCIES | | | $ | 216,693,947 | |
| | |
| TOTAL MORTGAGE-BACKED
OBLIGATIONS
(Cost $241,751,304) |
| | $ | 241,802,302 | |
| | |
| | | | | | | | | | | | | | |
| Agency Debentures – 5.7% | |
| | FHLB | |
| $ | 6,800,000 | | | | 2.125 | % | | | 06/09/23 | | | $ | 6,818,884 | |
| | 3,500,000 | | | | 3.375 | | | | 09/08/23 | | | | 3,732,592 | |
| | 750,000 | | | | 3.375 | | | | 12/08/23 | | | | 800,944 | |
| | 2,400,000 | | | | 5.000 | | | | 09/28/29 | | | | 2,906,938 | |
| | FNMA | |
| | 3,700,000 | | | | 1.875 | | | | 09/24/26 | | | | 3,518,330 | |
| | 4,200,000 | | | | 6.250 | | | | 05/15/29 | | | | 5,655,846 | |
| | Hashemite Kingdom of Jordan Government AID Bond(f) | |
| | 7,400,000 | | | | 2.503 | | | | 10/30/20 | | | | 7,565,464 | |
| | Israel Government AID Bond(f) | |
| | 7,827,000 | | | | 5.500 | | | | 09/18/23 | | | | 9,258,245 | |
| | 1,200,000 | | | | 5.500 | | | | 12/04/23 | | | | 1,420,488 | |
| | 2,400,000 | | | | 5.500 | | | | 04/26/24 | | | | 2,876,592 | |
| | 4,700,000 | | | | 5.500 | | | | 09/18/33 | | | | 6,233,704 | |
| | Tennessee Valley Authority | |
| | 5,400,000 | | | | 3.875 | | | | 02/15/21 | | | | 5,762,988 | |
| | |
| TOTAL AGENCY DEBENTURES
(Cost $54,412,097) |
| | $ | 56,551,015 | |
| | |
| | | | | | | | | | | | | | |
| Asset-Backed Securities – 12.7% | |
| Collateralized Loan Obligations(b)(c) – 5.4% | |
| B&M CLO Ltd. Series 2014-1A, Class A1 (3M USD
LIBOR + 1.400%) |
|
| $ | 3,700,000 | | | | 2.558 | % | | | 04/16/26 | | | $ | 3,699,145 | |
| B&M CLO Ltd. Series 2014-1A, Class A2 (3M USD
LIBOR + 1.950%) |
|
| | 650,000 | | | | 3.108 | | | | 04/16/26 | | | | 649,993 | |
| BlueMountain CLO Ltd. Series 2014-2A, Class AR (3M USD
LIBOR + 0.930%) |
|
| | 5,150,000 | | | | 2.237 | | | | 07/20/26 | | | | 5,170,389 | |
| Cutwater Ltd. Series 2014-1A, Class A1AR (3M USD
LIBOR + 1.250%) |
|
| | 5,000,000 | | | | 2.469 | | | | 07/15/26 | | | | 5,009,910 | |
| Halcyon Loan Advisors Funding Ltd. Series 2014-1A, Class A1R
(3M USD LIBOR + 1.130%) |
|
| | 3,400,000 | | | | 2.434 | | | | 04/18/26 | | | | 3,405,307 | |
| Neuberger Berman CLO XIX Ltd. Series 2015-19A, Class A1R
(3M USD LIBOR + 1.050%) |
|
| | 5,150,000 | | | | 2.354 | | | | 07/15/27 | | | | 5,159,090 | |
| | |
| Asset-Backed Securities – (continued) | |
| Collateralized Loan Obligations(b)(c) – (continued) | |
| | Recette CLO Ltd. Series 2015-1A, Class AR | |
| 7,000,000 | | | | 0.000 | | | | 10/20/27 | | | | 7,000,000 | |
| Shackleton CLO Ltd. Series 2014-5A, Class AR (3M USD
LIBOR + 1.140%) |
|
| | 7,800,000 | | | | 2.319 | | | | 05/07/26 | | | | 7,811,255 | |
| Voya CLO Ltd. Series 2014-4A, Class A1R (3M USD LIBOR +
0.950%) |
|
| | 7,500,000 | | | | 0.000 | | | | 10/14/26 | | | | 7,507,778 | |
| WhiteHorse VIII Ltd. Series 2014-1A, Class A (3M USD LIBOR
+ 1.500%) |
|
| | 7,500,000 | | | | 2.670 | | | | 05/01/26 | | | | 7,509,375 | |
| | | | | | | | | | | | | | |
| | | | | | | | | | | | | 52,922,242 | |
| | |
| Other – 0.0% | |
| | Small Business Administration | |
| | 11,676 | | | | 6.300 | | | | 06/01/18 | | | | 11,801 | |
| | |
| Student Loan(c) – 7.3% | |
| Access Group, Inc. Series 2004-1, Class A2 (3M USD
LIBOR + 0.210%) |
|
| | 4,379,205 | | | | 1.506 | | | | 09/26/33 | | | | 4,330,891 | |
| Access Group, Inc. Series 2015-1, Class A(b) (1M USD
LIBOR + 0.700%) |
|
| | 1,900,591 | | | | 1.934 | | | | 07/25/56 | | | | 1,902,921 | |
| Chase Education Loan Trust Series 2007-A, Class A3 (3M USD
LIBOR + 0.070%) |
|
| | 386,147 | | | | 1.365 | | | | 12/28/23 | | | | 385,163 | |
| ECMC Group Student Loan Trust Series 2016-1A, Class A(b)
(1M USD LIBOR + 1.350%) |
|
| | 4,045,417 | | | | 2.584 | | | | 07/26/66 | | | | 4,047,961 | |
| Edsouth Indenture No. 9 LLC Series 2015-1, Class A(b) (1M USD
LIBOR + 0.800%) |
|
| | 2,704,966 | | | | 2.034 | | | | 10/25/56 | | | | 2,706,628 | |
| Education Loan Asset-Backed Trust I Series 2013-1, Class A2(b)
(1M USD LIBOR + 0.800%) |
|
| | 8,200,000 | | | | 2.034 | | | | 04/26/32 | | | | 8,070,012 | |
| Educational Funding of the South, Inc. Series 2011-1, Class A2
(3M USD LIBOR + 0.650%) |
|
| | 2,856,665 | | | | 1.806 | | | | 04/25/35 | | | | 2,850,016 | |
| EFS Volunteer No. 3 LLC Series 2012-1, Class A2(b) (1M USD
LIBOR + 1.000%) |
|
| | 1,736,852 | | | | 2.234 | | | | 02/25/25 | | | | 1,740,347 | |
| Higher Education Funding I Series 2014-1, Class A(b) (3M USD
LIBOR + 1.050%) |
|
| | 4,091,055 | | | | 2.239 | | | | 05/25/34 | | | | 4,074,677 | |
| Navient Student Loan Trust Series 2016-5A, Class A(b) (1M USD
LIBOR + 1.250%) |
|
| | 9,147,449 | | | | 2.484 | | | | 06/25/65 | | | | 9,330,913 | |
| Navient Student Loan Trust Series 2016-7A, Class A(b) (1M USD
LIBOR + 1.150%) |
|
| | 4,521,702 | | | | 2.384 | | | | 03/25/66 | | | | 4,576,486 | |
| Nelnet Student Loan Trust Series 2006-1, Class A5 (3M USD
LIBOR + 0.110%) |
|
| | 2,678,869 | | | | 1.296 | | | | 08/23/27 | | | | 2,671,349 | |
| Nelnet Student Loan Trust Series 2006-1, Class A6(b) (3M USD
LIBOR + 0.450%) |
|
| | 5,200,000 | | | | 1.636 | | | | 08/23/36 | | | | 5,062,268 | |
| | |
| | |
| The accompanying notes are an integral part of these financial statements. | | 57 |
GOLDMAN SACHS CORE FIXED INCOME FUND
Schedule of Investments (continued)
September 30, 2017 (Unaudited)
| | | | | | | | | | | | | | |
Principal
Amount | | | Interest
Rate | | | Maturity
Date | | | Value | |
| Asset-Backed Securities – (continued) | |
| Student Loan(c) – (continued) | |
| Nelnet Student Loan Trust Series 2013-5A, Class A(b) (1M USD
LIBOR + 0.630%) |
|
| $ | 615,588 | | | | 1.864 | % | | | 01/25/37 | | | $ | 611,085 | |
| North Carolina State Education Assistance Authority Series
2010-1, Class A1 (3M USD LIBOR + 0.900%) |
|
| | 2,078,974 | | | | 2.056 | | | | 07/25/41 | | | | 2,071,657 | |
| | Palmer Square Loan Funding Ltd. Series 2017-1A, Class A1(b) | |
| | 5,090,000 | | | | 2.060 | | | | 10/15/25 | | | | 5,089,969 | |
| PHEAA Student Loan Trust Series 2016-1A, Class A(b) (1M USD
LIBOR + 1.150%) |
|
| | 4,459,260 | | | | 2.384 | | | | 09/25/65 | | | | 4,538,478 | |
| Scholar Funding Trust Series 2010-A, Class A(b) (3M USD
LIBOR + 0.750%) |
|
| | 1,483,107 | | | | 1.922 | | | | 10/28/41 | | | | 1,473,427 | |
| SLC Student Loan Trust Series 2006-2, Class A5 (3M USD
LIBOR + 0.100%) |
|
| | 3,094,730 | | | | 1.346 | | | | 09/15/26 | | | | 3,078,322 | |
| SLM Student Loan Trust Series 2004-8A, Class A6(b) (3M USD
LIBOR + 0.630%) |
|
| | 2,550,000 | | | | 1.786 | | | | 01/25/40 | | | | 2,550,750 | |
| SLM Student Loan Trust Series 2005-3, Class A5 (3M USD
LIBOR + 0.090%) |
|
| | 1,466,412 | | | | 1.246 | | | | 10/25/24 | | | | 1,464,616 | |
| | | | | | | | | | | | | | |
| | | | | | | | | | | | | 72,627,936 | |
| | |
| TOTAL ASSET-BACKED SECURITIES
(Cost $124,504,661) |
| | $ | 125,561,979 | |
| | |
| | | | | | | | | | | | | | |
| Foreign Debt Obligations – 0.6% | |
| Sovereign – 0.6% | |
| | Republic of Chile | |
| $ | 239,000 | | | | 3.125 | % | | | 01/21/26 | | | $ | 245,812 | |
| | Republic of Colombia(a) | |
| | 1,380,000 | | | | 5.000 | | | | 06/15/45 | | | | 1,420,020 | |
| | Republic of Indonesia | |
| | 790,000 | | | | 3.700 | (b) | | | 01/08/22 | | | | 819,941 | |
| | 200,000 | | | | 5.875 | | | | 01/15/24 | | | | 229,270 | |
| EUR | 280,000 | | | | 2.150 | (b) | | | 07/18/24 | | | | 340,446 | |
| $ | 380,000 | | | | 4.125 | | | | 01/15/25 | | | | 398,745 | |
| | 420,000 | | | | 4.125 | (b) | | | 01/15/25 | | | | 440,719 | |
| | 1,380,000 | | | | 4.350 | (b) | | | 01/08/27 | | | | 1,464,332 | |
| | 510,000 | | | | 6.750 | | | | 01/15/44 | | | | 681,992 | |
| | 380,000 | | | | 5.250 | (b) | | | 01/08/47 | | | | 427,701 | |
| | |
| | TOTAL FOREIGN DEBT OBLIGATIONS | |
| | (Cost $6,037,387) | | | $ | 6,468,978 | |
| | |
| | | | | | | | | | | | | | |
| Municipal Debt Obligations – 1.5% | |
| California(a) – 0.6% | |
| | California State GO Bonds Build America Taxable Series 2009 | |
| $ | 950,000 | | | | 7.500 | % | | | 04/01/34 | | | $ | 1,380,283 | |
| | 1,650,000 | | | | 7.550 | | | | 04/01/39 | | | | 2,530,440 | |
| | California State GO Bonds Build America Taxable Series 2010 | |
| | 1,645,000 | | | | 7.950 | | | | 03/01/36 | | | | 1,854,277 | |
| | | | | | | | | | | | | | |
| | | | | | | | | | | | | 5,765,000 | |
| | |
| Illinois – 0.3% | |
| | Illinois State GO Bonds Build America Series 2010(a) | |
| 160,000 | | | | 6.630 | | | | 02/01/35 | | | | 179,357 | |
| | 1,595,000 | | | | 7.350 | | | | 07/01/35 | | | | 1,829,210 | |
| | Illinois State GO Bonds Taxable-Pension Series 2003 | |
| | 1,170,000 | | | | 5.100 | | | | 06/01/33 | | | | 1,183,221 | |
| | | | | | | | | | | | | | |
| | | | | | | | | | | | | 3,191,788 | |
| | |
| New Hampshire(a)(c) – 0.4% | |
| New Hampshire Higher Education Loan Corp. Series 2011-1,
Class A3 (3M USD LIBOR + 0.850%) |
|
| | 3,500,000 | | | | 2.010 | | | | 10/25/37 | | | | 3,423,491 | |
| | |
| Ohio(a) – 0.2% | |
| American Municipal Power-Ohio, Inc. RB Build America
Taxable Series 2010 |
|
| | 1,700,000 | | | | 6.270 | | | | 02/15/50 | | | | 2,236,690 | |
| | |
| | TOTAL MUNICIPAL DEBT OBLIGATIONS | |
| | (Cost $12,561,503) | | | $ | 14,616,969 | |
| | |
| | |
| U.S. Treasury Obligations – 18.1% | |
| | United States Treasury Bonds | |
| $ | 3,670,000 | | | | 2.750 | % | | | 11/15/42 | | | $ | 3,624,639 | |
| | 8,320,000 | | | | 3.625 | | | | 02/15/44 | | | | 9,565,255 | |
| | 3,830,000 | | | | 3.125 | | | | 08/15/44 | | | | 4,041,876 | |
| | 31,750,000 | | | | 3.000 | (g) | | | 11/15/44 | | | | 32,728,218 | |
| | 5,290,000 | | | | 3.000 | | | | 05/15/45 | | | | 5,448,964 | |
| | 11,400,000 | | | | 2.875 | | | | 11/15/46 | | | | 11,442,180 | |
| | 190,000 | | | | 3.000 | | | | 05/15/47 | | | | 195,542 | |
| | United States Treasury Inflation Indexed Bonds | |
| | 13,978,404 | | | | 0.125 | | | | 04/15/18 | | | | 13,990,006 | |
| | 1,531,715 | | | | 0.625 | | | | 01/15/24 | | | | 1,564,953 | |
| | 3,410,583 | | | | 0.250 | | | | 01/15/25 | | | | 3,378,796 | |
| | 3,348,215 | | | | 0.625 | | | | 01/15/26 | | | | 3,395,090 | |
| | 571,894 | | | | 0.125 | | | | 07/15/26 | | | | 556,470 | |
| | 993,798 | | | | 0.875 | | | | 02/15/47 | | | | 980,323 | |
| | United States Treasury Notes | |
| | 36,080,000 | | | | 2.125 | | | | 07/31/24 | | | | 36,026,601 | |
| | 1,010,000 | | | | 2.375 | | | | 08/15/24 | | | | 1,024,241 | |
| | 5,470,000 | | | | 2.000 | | | | 09/30/24 | | | | 5,456,708 | |
| | 44,220,000 | | | | 2.250 | | | | 11/15/25 | | | | 44,222,210 | |
| | United States Treasury Strip Coupon(h) | |
| | 3,200,000 | | | | 0.000 | | | | 02/15/36 | | | | 1,925,248 | |
| | |
| | TOTAL U.S. TREASURY OBLIGATIONS | |
| | (Cost $177,193,222) | | | $ | 179,567,320 | |
| | |
| | |
| 58 | | The accompanying notes are an integral part of these financial statements. |
GOLDMAN SACHS CORE FIXED INCOME FUND
| | | | | | | | | | | | | | |
| Shares | | | | | | Distribution
Rate | | | Value | |
| | Investment Company(i) – 0.0% | |
| Goldman Sachs Financial Square Government Fund –
Institutional Shares |
|
| $ | 3,949 | | | | | | | | 0.927 | % | | $ | 3,949 | |
| | (Cost $3,949) | |
| | |
| TOTAL INVESTMENTS BEFORE
SHORT-TERM INVESTMENTS |
|
| | (Cost $993,123,199) | | | $ | 1,008,947,842 | |
| | |
| | | | | | | | | | | | | | |
Principal
Amount | | | Interest
Rate | | | Maturity
Date | | | Value | |
| | Short-term Investments – 2.4% | |
| Certificates of Deposit – 1.3% | |
| | Credit Suisse New York | |
| $ | 4,000,000 | | | | 2.051 | % | | | 11/03/17 | | | $ | 4,003,285 | |
| | |
| | Mizuho Bank Ltd. | |
| | 5,000,000 | | | | 2.017 | | | | 12/08/17 | | | | 5,007,383 | |
| | UBS AG Stamford | |
| | 4,000,000 | | | | 1.420 | | | | 11/02/17 | | | | 4,000,565 | |
| | | | | | | | | | | | | | |
| | | | | | | | | | | | | 13,011,233 | |
| | |
| Commercial Paper – 1.1% | |
| | Electricite de France SA(h) | |
| | 5,500,000 | | | | 0.000 | | | | 01/05/18 | | | | 5,477,033 | |
| | National Australia Bank Ltd. | |
| | 5,000,000 | | | | 1.288 | | | | 12/06/17 | | | | 5,003,799 | |
| | | | | | | | | | | | | | |
| | | | | | | | | | | | | 10,480,832 | |
| | |
| | TOTAL SHORT-TERM INVESTMENTS | |
| | (Cost $23,472,573) | | | $ | 23,492,065 | |
| | |
| | TOTAL INVESTMENTS – 104.1% | | | | | |
| | (Cost $1,016,595,772) | | | | | | | $ | 1,032,439,907 | |
| | |
| LIABILITIES IN EXCESS OF
OTHER ASSETS – (4.1)% |
| | | (40,476,760 | ) |
| | |
| | NET ASSETS – 100.0% | | | $ | 991,963,147 | |
| | |
| | |
| The percentage shown for each investment category reflects the value of investments in that category as a percentage of net assets. |
(a) | | Security with “Call” features with resetting interest rates. Maturity dates disclosed are the final maturity dates. |
(b) | | Exempt from registration under Rule 144A of the Securities Act of 1933. Such securities may be deemed liquid by the investment adviser and may be resold, normally to qualified institutional buyers in transactions exempt from registration. Total market value of Rule 144A securities amounts to $213,619,016, which represents approximately 21.5% of net assets as of September 30, 2017 and are unaudited. |
(c) | | Variable rate security. Interest rate disclosed is that which is in effect on September 30, 2017. |
(d) | | Security with a notional or nominal principal amount. The actual effective yield of this security is different than the stated interest rate. |
(e) | | TBA (To Be Announced) Securities are purchased on a forward commitment basis with an approximate principal amount and no defined maturity date. The actual principal and maturity date will be determined upon settlement when the specific mortgage pools are assigned. Total market value of TBA securities (excluding forward sales contracts, if any) amounts to $45,300,549 which represents approximately 4.6% of net assets as of September 30, 2017. |
(f) | | Guaranteed by the United States Government until maturity. Total market value for these securities amounts to $27,354,493, which represents approximately 2.8% of net assets as of September 30, 2017. |
(g) | | All or a portion of security is segregated as collateral for initial margin requirements on futures transactions. |
(h) | | Issued with a zero coupon. Income is recognized through the accretion of discount. |
(i) | | Represents an Affiliated Issuer. |
| | |
|
Currency Abbreviations: |
AUD | | —Australian Dollar |
CAD | | —Canadian Dollar |
CHF | | —Swiss Franc |
EUR | | —Euro |
GBP | | —British Pound |
JPY | | —Japanese Yen |
NOK | | —Norwegian Krone |
NZD | | —New Zealand Dollar |
SEK | | —Swedish Krona |
USD | | —U.S. Dollar |
| | |
Investment Abbreviations: |
AUDOR | | —Australian Dollar Offered Rate |
CDOR | | —Canadian Dollar Offered Rate |
CHFOR | | —Swiss Franc Offered Rate |
CLO | | —Collateralized Loan Obligation |
EURO | | —Euro Offered Rate |
FHLB | | —Federal Home Loan Bank |
FHLMC | | —Federal Home Loan Mortgage Corp. |
FNMA | | —Federal National Mortgage Association |
GBP | | —British Pound Offered Rate |
GNMA | | —Government National Mortgage Association |
GO | | —General Obligation |
JYOR | | —Japanese Yen Offered Rate |
LIBOR | | —London Interbank Offered Rate |
LLC | | —Limited Liability Company |
LP | | —Limited Partnership |
NCUA | | —National Credit Union Administration |
NIBOR | | —Norwegian Interbank Offered Rate |
NZDOR | | —New Zealand Dollar Offered Rate |
PLC | | —Public Limited Company |
RB | | —Revenue Bond |
REMIC | | —Real Estate Mortgage Investment Conduit |
STIBOR | | —Stockholm Interbank Offered Rate |
|
| | |
| The accompanying notes are an integral part of these financial statements. | | 59 |
GOLDMAN SACHS CORE FIXED INCOME FUND
Schedule of Investments (continued)
September 30, 2017 (Unaudited)
|
| ADDITIONAL INVESTMENT INFORMATION |
FORWARD FOREIGN CURRENCY EXCHANGE CONTRACTS — At September 30, 2017, the Fund had the following forward foreign currency exchange contracts:
FORWARD FOREIGN CURRENCY EXCHANGE CONTRACTS WITH UNREALIZED GAIN
| | | | | | | | | | | | | | | | | | | | | | | | |
| Counterparty | | Currency
Purchased | | | Currency
Sold | | | Current
Value | | | Settlement
Date | | | Unrealized
Gain | |
Australia & New Zealand Banking Group | | USD | | | 1,259,562 | | | AUD | | | 1,583,057 | | | $ | 1,240,568 | | | | 12/20/17 | | | $ | 18,995 | |
Bank of America Securities LLC | | CAD | | | 377,450 | | | AUD | | | 382,000 | | | | 302,663 | | | | 12/20/17 | | | | 3,308 | |
| | CHF | | | 743,541 | | | EUR | | | 641,000 | | | | 772,160 | | | | 12/20/17 | | | | 11,062 | |
| | EUR | | | 2,013,420 | | | USD | | | 2,379,244 | | | | 2,390,652 | | | | 12/20/17 | | | | 11,408 | |
| | GBP | | | 1,739,820 | | | EUR | | | 1,938,000 | | | | 2,337,290 | | | | 12/20/17 | | | | 36,187 | |
| | SEK | | | 3,025,155 | | | EUR | | | 313,527 | | | | 373,236 | | | | 12/20/17 | | | | 966 | |
| | USD | | | 1,305,020 | | | CAD | | | 1,612,540 | | | | 1,293,035 | | | | 12/20/17 | | | | 11,985 | |
| | USD | | | 307,640 | | | EUR | | | 259,000 | | | | 307,526 | | | | 12/20/17 | | | | 114 | |
| | USD | | | 307,232 | | | GBP | | | 227,365 | | | | 305,444 | | | | 12/20/17 | | | | 1,788 | |
| | USD | | | 767,000 | | | JPY | | | 84,725,888 | | | | 756,049 | | | | 12/20/17 | | | | 10,951 | |
Barclays Bank PLC | | CAD | | | 952,997 | | | USD | | | 764,000 | | | | 764,172 | | | | 12/20/17 | | | | 172 | |
| | GBP | | | 3,398,712 | | | USD | | | 4,558,948 | | | | 4,560,818 | | | | 11/16/17 | | | | 1,870 | |
| | GBP | | | 233,000 | | | USD | | | 308,293 | | | | 313,014 | | | | 12/20/17 | | | | 4,722 | |
| | NZD | | | 1,063,000 | | | USD | | | 764,940 | | | | 766,590 | | | | 12/20/17 | | | | 1,650 | |
| | USD | | | 1,955,341 | | | AUD | | | 2,435,151 | | | | 1,908,314 | | | | 12/20/17 | | | | 47,027 | |
| | USD | | | 1,410,223 | | | CAD | | | 1,740,763 | | | | 1,395,853 | | | | 12/20/17 | | | | 14,371 | |
| | USD | | | 771,649 | | | EUR | | | 641,000 | | | | 761,097 | | | | 12/20/17 | | | | 10,551 | |
| | USD | | | 306,577 | | | GBP | | | 226,492 | | | | 304,271 | | | | 12/20/17 | | | | 2,306 | |
BNP Paribas SA | | CHF | | | 1,493,685 | | | EUR | | | 1,299,721 | | | | 1,551,176 | | | | 12/20/17 | | | | 7,941 | |
| | EUR | | | 650,000 | | | CHF | | | 742,151 | | | | 771,784 | | | | 12/20/17 | | | | 1,068 | |
| | EUR | | | 333,958 | | | GBP | | | 294,829 | | | | 396,529 | | | | 12/20/17 | | | | 454 | |
| | EUR | | | 1,935,000 | | | NOK | | | 18,046,344 | | | | 2,297,540 | | | | 12/20/17 | | | | 27,403 | |
| | EUR | | | 1,556,000 | | | USD | | | 1,843,253 | | | | 1,847,531 | | | | 12/20/17 | | | | 4,278 | |
| | GBP | | | 452,217 | | | USD | | | 606,003 | | | | 607,513 | | | | 12/20/17 | | | | 1,510 | |
| | SEK | | | 9,960,522 | | | EUR | | | 1,034,000 | | | | 1,228,903 | | | | 12/20/17 | | | | 1,173 | |
| | USD | | | 762,892 | | | AUD | | | 965,000 | | | | 756,225 | | | | 12/20/17 | | | | 6,667 | |
| | USD | | | 2,367,300 | | | CAD | | | 2,916,441 | | | | 2,338,585 | | | | 12/20/17 | | | | 28,714 | |
| | USD | | | 339,801 | | | EUR | | | 283,000 | | | | 336,023 | | | | 12/20/17 | | | | 3,778 | |
| | USD | | | 2,325,540 | | | GBP | | | 1,722,147 | | | | 2,313,548 | | | | 12/20/17 | | | | 11,992 | |
| | USD | | | 768,000 | | | JPY | | | 84,650,496 | | | | 755,376 | | | | 12/20/17 | | | | 12,624 | |
Citibank NA | | CAD | | | 412,578 | | | USD | | | 330,783 | | | | 330,831 | | | | 12/20/17 | | | | 47 | |
| | CHF | | | 2,223,564 | | | EUR | | | 1,936,000 | | | | 2,309,149 | | | | 12/20/17 | | | | 10,421 | |
| | EUR | | | 649,000 | | | NOK | | | 6,042,450 | | | | 770,596 | | | | 12/20/17 | | | | 10,487 | |
| | JPY | | | 336,425,901 | | | USD | | | 3,000,927 | | | | 3,002,087 | | | | 12/20/17 | | | | 1,160 | |
| | USD | | | 8,076,477 | | | EUR | | | 6,725,578 | | | | 7,985,678 | | | | 12/20/17 | | | | 90,799 | |
| | USD | | | 460,991 | | | GBP | | | 340,769 | | | | 457,792 | | | | 12/20/17 | | | | 3,199 | |
Deutsche Bank AG | | USD | | | 962,933 | | | SEK | | | 7,655,988 | | | | 940,988 | | | | 10/19/17 | | | | 21,945 | |
HSBC Bank PLC | | AUD | | | 978,936 | | | USD | | | 765,503 | | | | 767,146 | | | | 12/20/17 | | | | 1,644 | |
| | EUR | | | 206,000 | | | SEK | | | 1,958,082 | | | | 244,596 | | | | 12/20/17 | | | | 3,013 | |
| | GBP | | | 275,155 | | | EUR | | | 309,358 | | | | 369,646 | | | | 12/20/17 | | | | 2,327 | |
| | JPY | | | 85,984,060 | | | EUR | | | 641,000 | | | | 767,276 | | | | 12/20/17 | | | | 6,179 | |
| | USD | | | 1,135,676 | | | AUD | | | 1,418,871 | | | | 1,112,420 | | | | 11/08/17 | | | | 23,256 | |
| | USD | | | 388,723 | | | CAD | | | 479,392 | | | | 384,407 | | | | 12/20/17 | | | | 4,316 | |
| | USD | | | 4,478,563 | | | EUR | | | 3,756,081 | | | | 4,459,818 | | | | 12/20/17 | | | | 18,746 | |
| | USD | | | 329,011 | | | JPY | | | 36,204,186 | | | | 323,067 | | | | 12/20/17 | | | | 5,944 | |
Standard Chartered Bank | | AUD | | | 524,476 | | | USD | | | 409,936 | | | | 411,007 | | | | 12/20/17 | | | | 1,071 | |
| | EUR | | | 641,000 | | | SEK | | | 6,099,903 | | | | 761,097 | | | | 12/20/17 | | | | 8,507 | |
| | |
| 60 | | The accompanying notes are an integral part of these financial statements. |
GOLDMAN SACHS CORE FIXED INCOME FUND
|
| ADDITIONAL INVESTMENT INFORMATION (continued) |
FORWARD FOREIGN CURRENCY EXCHANGE CONTRACTS WITH UNREALIZED GAIN (continued)
| | | | | | | | | | | | | | | | | | | | | | | | |
| Counterparty | | Currency
Purchased | | | Currency
Sold | | | Current
Value | | | Settlement
Date | | | Unrealized
Gain | |
Standard Chartered Bank (continued) | | | | | | | | | | | | | | | | | | | | | | | | |
| | USD | | | 8,072,394 | | | AUD | | | 10,070,989 | | | $ | 7,892,163 | | | | 12/20/17 | | | $ | 180,231 | |
| | USD | | | 1,539,000 | | | JPY | | | 169,201,507 | | | | 1,509,865 | | | | 12/20/17 | | | | 29,135 | |
| | USD | | | 1,842,127 | | | NZD | | | 2,532,000 | | | | 1,825,968 | | | | 12/20/17 | | | | 16,158 | |
State Street Bank (London) | | GBP | | | 567,000 | | | JPY | | | 85,205,925 | | | | 761,713 | | | | 12/20/17 | | | | 1,380 | |
| | GBP | | | 907,512 | | | USD | | | 1,207,477 | | | | 1,219,160 | | | | 12/20/17 | | | | 11,683 | |
| | USD | | | 1,560,519 | | | AUD | | | 1,957,442 | | | | 1,533,955 | | | | 12/20/17 | | | | 26,564 | |
| | USD | | | 1,529,000 | | | CAD | | | 1,893,751 | | | | 1,518,528 | | | | 12/20/17 | | | | 10,472 | |
| | USD | | | 767,000 | | | CHF | | | 734,195 | | | | 762,455 | | | | 12/20/17 | | | | 4,545 | |
| | USD | | | 4,148,185 | | | EUR | | | 3,448,034 | | | | 4,094,055 | | | | 12/20/17 | | | | 54,130 | |
| | USD | | | 335,776 | | | GBP | | | 249,653 | | | | 335,386 | | | | 12/20/17 | | | | 390 | |
| | USD | | | 1,692,035 | | | NZD | | | 2,326,000 | | | | 1,677,411 | | | | 12/20/17 | | | | 14,625 | |
Westpac Banking Corp. | | AUD | | | 984,035 | | | USD | | | 768,807 | | | | 771,142 | | | | 12/20/17 | | | | 2,335 | |
| | EUR | | | 6,602,078 | | | USD | | | 7,782,675 | | | | 7,808,121 | | | | 10/12/17 | | | | 25,445 | |
| | USD | | | 1,527,329 | | | AUD | | | 1,924,000 | | | | 1,507,749 | | | | 12/20/17 | | | | 19,580 | |
| | USD | | | 1,748,707 | | | JPY | | | 189,968,150 | | | | 1,690,356 | | | | 10/25/17 | | | | 58,352 | |
| | | USD | | | 766,433 | | | NZD | | | 1,060,000 | | | | 764,426 | | | | 12/20/17 | | | | 2,010 | |
| TOTAL | | | | | | | | | | | | | | | | | | | | | | $ | 967,131 | |
FORWARD FOREIGN CURRENCY EXCHANGE CONTRACTS WITH UNREALIZED LOSS
| | | | | | | | | | | | | | | | | | | | | | | | |
| Counterparty | | Currency
Purchased | | | Currency
Sold | | | Current
Value | | | Settlement
Date | | | Unrealized
Loss | |
Australia & New Zealand Banking Group | | AUD | | | 1,628,463 | | | USD | | | 1,301,521 | | | $ | 1,276,151 | | | | 12/20/17 | | | $ | (25,370 | ) |
| | NZD | | | 626,000 | | | USD | | | 459,534 | | | | 451,444 | | | | 12/20/17 | | | | (8,090 | ) |
Bank of America Securities LLC | | AUD | | | 1,950,000 | | | USD | | | 1,529,659 | | | | 1,528,124 | | | | 12/20/17 | | | | (1,535 | ) |
| | CAD | | | 2,397,144 | | | USD | | | 1,967,893 | | | | 1,922,180 | | | | 12/20/17 | | | | (45,713 | ) |
| | EUR | | | 1,157,938 | | | USD | | | 1,391,192 | | | | 1,374,889 | | | | 12/20/17 | | | | (16,303 | ) |
| | JPY | | | 205,813,000 | | | USD | | | 1,889,553 | | | | 1,831,345 | | | | 10/25/17 | | | | (58,208 | ) |
| | SEK | | | 80,485,668 | | | EUR | | | 8,428,573 | | | | 9,930,106 | | | | 12/20/17 | | | | (77,638 | ) |
| | USD | | | 306,630 | | | EUR | | | 259,000 | | | | 307,526 | | | | 12/20/17 | | | | (896 | ) |
Barclays Bank PLC | | AUD | | | 360,895 | | | USD | | | 284,600 | | | | 282,816 | | | | 12/20/17 | | | | (1,784 | ) |
| | EUR | | | 1,287,000 | | | CHF | | | 1,490,269 | | | | 1,528,131 | | | | 12/20/17 | | | | (19,498 | ) |
| | EUR | | | 1,924,000 | | | GBP | | | 1,706,333 | | | | 2,284,479 | | | | 12/20/17 | | | | (7,824 | ) |
| | EUR | | | 1,227,568 | | | USD | | | 1,472,013 | | | | 1,457,565 | | | | 12/20/17 | | | | (14,448 | ) |
| | GBP | | | 792,479 | | | USD | | | 1,079,751 | | | | 1,064,624 | | | | 12/20/17 | | | | (15,128 | ) |
| | JPY | | | 44,213,080 | | | GBP | | | 302,904 | | | | 394,534 | | | | 12/20/17 | | | | (12,390 | ) |
| | NZD | | | 418,000 | | | USD | | | 306,501 | | | | 301,444 | | | | 12/20/17 | | | | (5,057 | ) |
| | SEK | | | 2,449,699 | | | USD | | | 309,296 | | | | 302,237 | | | | 12/20/17 | | | | (7,058 | ) |
| | USD | | | 806,415 | | | EUR | | | 680,476 | | | | 807,969 | | | | 12/20/17 | | | | (1,554 | ) |
| | USD | | | 769,865 | | | GBP | | | 579,696 | | | | 778,768 | | | | 12/20/17 | | | | (8,904 | ) |
| | USD | | | 764,000 | | | JPY | | | 85,701,623 | | | | 764,756 | | | | 12/20/17 | | | | (756 | ) |
BNP Paribas SA | | AUD | | | 5,832,447 | | | USD | | | 4,626,904 | | | | 4,570,617 | | | | 12/20/17 | | | | (56,288 | ) |
| | CAD | | | 2,130,076 | | | USD | | | 1,732,645 | | | | 1,708,028 | | | | 12/20/17 | | | | (24,617 | ) |
| | EUR | | | 1,217,684 | | | CHF | | | 1,395,758 | | | | 1,445,828 | | | | 12/20/17 | | | | (3,652 | ) |
| | EUR | | | 935,420 | | | USD | | | 1,121,654 | | | | 1,110,680 | | | | 12/20/17 | | | | (10,974 | ) |
| | GBP | | | 5,682,663 | | | EUR | | | 6,434,000 | | | | 7,634,141 | | | | 12/20/17 | | | | (5,329 | ) |
| | JPY | | | 37,451,887 | | | USD | | | 335,113 | | | | 334,201 | | | | 12/20/17 | | | | (912 | ) |
| | NOK | | | 3,662,895 | | | EUR | | | 388,500 | | | | 460,773 | | | | 12/20/17 | | | | (515 | ) |
| | |
| The accompanying notes are an integral part of these financial statements. | | 61 |
GOLDMAN SACHS CORE FIXED INCOME FUND
Schedule of Investments (continued)
September 30, 2017 (Unaudited)
|
| ADDITIONAL INVESTMENT INFORMATION (continued) |
FORWARD FOREIGN CURRENCY EXCHANGE CONTRACTS WITH UNREALIZED LOSS (continued)
| | | | | | | | | | | | | | | | | | | | | | | | |
| Counterparty | | Currency
Purchased | | | Currency
Sold | | | Current
Value | | | Settlement
Date | | | Unrealized
Loss | |
BNP Paribas SA (continued) | | | | | | | | | | | | | | | | | | | | | | | | |
| | NZD | | | 969,668 | | | USD | | | 703,436 | | | $ | 699,283 | | | | 12/20/17 | | | $ | (4,153 | ) |
| | SEK | | | 82,835,570 | | | EUR | | | 8,685,742 | | | | 10,220,031 | | | | 12/20/17 | | | | (93,065 | ) |
| | SEK | | | 2,479,703 | | | USD | | | 308,639 | | | | 305,939 | | | | 12/20/17 | | | | (2,700 | ) |
| | USD | | | 305,312 | | | AUD | | | 390,000 | | | | 305,625 | | | | 12/20/17 | | | | (313 | ) |
| | USD | | | 1,839,899 | | | EUR | | | 1,553,000 | | | | 1,843,969 | | | | 12/20/17 | | | | (4,071 | ) |
| | USD | | | 401,129 | | | GBP | | | 301,209 | | | | 404,647 | | | | 12/20/17 | | | | (3,518 | ) |
| | USD | | | 785,802 | | | JPY | | | 88,589,220 | | | | 790,523 | | | | 12/20/17 | | | | (4,721 | ) |
| | USD | | | 764,839 | | | NZD | | | 1,066,000 | | | | 768,753 | | | | 12/20/17 | | | | (3,914 | ) |
Citibank NA | | AUD | | | 959,000 | | | NZD | | | 1,055,063 | | | | 751,523 | | | | 12/20/17 | | | | (9,343 | ) |
| | AUD | | | 967,000 | | | USD | | | 766,144 | | | | 757,793 | | | | 12/20/17 | | | | (8,352 | ) |
| | CAD | | | 1,746,404 | | | USD | | | 1,419,546 | | | | 1,400,376 | | | | 12/20/17 | | | | (19,171 | ) |
| | EUR | | | 1,293,000 | | | CHF | | | 1,481,067 | | | | 1,535,256 | | | | 12/20/17 | | | | (2,818 | ) |
| | EUR | | | 1,291,000 | | | GBP | | | 1,156,636 | | | | 1,532,880 | | | | 12/20/17 | | | | (20,955 | ) |
| | EUR | | | 644,000 | | | USD | | | 771,528 | | | | 764,659 | | | | 12/20/17 | | | | (6,869 | ) |
| | JPY | | | 54,805,307 | | | USD | | | 494,655 | | | | 489,054 | | | | 12/20/17 | | | | (5,601 | ) |
| | NOK | | | 12,208,453 | | | EUR | | | 1,300,000 | | | | 1,535,761 | | | | 12/20/17 | | | | (7,806 | ) |
| | NOK | | | 3,843,817 | | | GBP | | | 362,300 | | | | 483,532 | | | | 12/20/17 | | | | (3,185 | ) |
| | NZD | | | 2,913,428 | | | USD | | | 2,119,537 | | | | 2,101,039 | | | | 12/20/17 | | | | (18,498 | ) |
| | SEK | | | 4,688,572 | | | EUR | | | 489,801 | | | | 578,463 | | | | 12/20/17 | | | | (3,107 | ) |
| | USD | | | 750,686 | | | JPY | | | 84,637,595 | | | | 755,261 | | | | 12/20/17 | | | | (4,575 | ) |
HSBC Bank PLC | | AUD | | | 1,929,387 | | | USD | | | 1,544,297 | | | | 1,512,674 | | | | 11/08/17 | | | | (31,623 | ) |
| | JPY | | | 121,140,065 | | | USD | | | 1,097,011 | | | | 1,080,990 | | | | 12/20/17 | | | | (16,021 | ) |
| | SEK | | | 6,137,938 | | | EUR | | | 642,288 | | | | 757,282 | | | | 12/20/17 | | | | (5,344 | ) |
| | USD | | | 664,718 | | | JPY | | | 74,594,651 | | | | 665,644 | | | | 12/20/17 | | | | (926 | ) |
JPMorgan Securities, Inc. | | USD | | | 5,349,104 | | | GBP | | | 3,987,361 | | | | 5,350,740 | | | | 11/16/17 | | | | (1,635 | ) |
Standard Chartered Bank | | AUD | | | 1,344,000 | | | USD | | | 1,074,965 | | | | 1,053,230 | | | | 12/20/17 | | | | (21,735 | ) |
| | CAD | | | 5,078,167 | | | USD | | | 4,174,885 | | | | 4,071,991 | | | | 12/20/17 | | | | (102,893 | ) |
| | EUR | | | 644,000 | | | USD | | | 770,195 | | | | 764,659 | | | | 12/20/17 | | | | (5,536 | ) |
| | JPY | | | 85,309,879 | | | EUR | | | 645,625 | | | | 761,260 | | | | 12/20/17 | | | | (5,328 | ) |
| | NOK | | | 64,829,388 | | | EUR | | | 6,922,175 | | | | 8,155,204 | | | | 12/20/17 | | | | (63,905 | ) |
| | NOK | | | 2,411,318 | | | USD | | | 309,198 | | | | 303,331 | | | | 12/20/17 | | | | (5,867 | ) |
| | NZD | | | 1,053,837 | | | EUR | | | 643,000 | | | | 759,982 | | | | 12/20/17 | | | | (3,491 | ) |
| | NZD | | | 6,883,936 | | | USD | | | 5,006,623 | | | | 4,964,397 | | | | 12/20/17 | | | | (42,226 | ) |
| | USD | | | 342,771 | | | AUD | | | 437,642 | | | | 342,959 | | | | 12/20/17 | | | | (188 | ) |
| | USD | | | 1,583,257 | | | GBP | | | 1,189,864 | | | | 1,598,474 | | | | 12/20/17 | | | | (15,217 | ) |
State Street Bank (London) | | AUD | | | 1,544,324 | | | USD | | | 1,226,664 | | | | 1,210,214 | | | | 12/20/17 | | | | (16,450 | ) |
| | EUR | | | 1,278,167 | | | GBP | | | 1,139,927 | | | | 1,517,644 | | | | 12/20/17 | | | | (13,744 | ) |
| | EUR | | | 511,089 | | | USD | | | 613,762 | | | | 606,847 | | | | 12/20/17 | | | | (6,916 | ) |
| | GBP | | | 5,680,000 | | | USD | | | 7,720,597 | | | | 7,630,563 | | | | 12/20/17 | | | | (90,034 | ) |
| | JPY | | | 620,989,353 | | | USD | | | 5,654,202 | | | | 5,541,382 | | | | 12/20/17 | | | | (112,820 | ) |
| | NOK | | | 3,149,741 | | | USD | | | 402,693 | | | | 396,221 | | | | 12/20/17 | | | | (6,471 | ) |
| | NZD | | | 1,699,000 | | | USD | | | 1,231,021 | | | | 1,225,245 | | | | 12/20/17 | | | | (5,775 | ) |
| | SEK | | | 31,919,780 | | | EUR | | | 3,342,964 | | | | 3,938,178 | | | | 12/20/17 | | | | (31,122 | ) |
| | USD | | | 765,852 | | | AUD | | | 982,000 | | | | 769,547 | | | | 12/20/17 | | | | (3,695 | ) |
| | USD | | | 767,000 | | | CHF | | | 741,367 | | | | 769,902 | | | | 12/20/17 | | | | (2,902 | ) |
| | USD | | | 747,026 | | | JPY | | | 83,865,943 | | | | 748,375 | | | | 12/20/17 | | | | (1,350 | ) |
| | USD | | | 735,966 | | | NZD | | | 1,025,337 | | | | 739,428 | | | | 12/20/17 | | | | (3,462 | ) |
Westpac Banking Corp. | | CAD | | | 1,710,609 | | | USD | | | 1,405,479 | | | | 1,371,298 | | | | 11/06/17 | | | | (34,182 | ) |
| | | USD | | | 9,310,363 | | | EUR | | | 7,898,023 | | | | 9,340,803 | | | | 10/12/17 | | | | (30,440 | ) |
| TOTAL | | | | | | | | | | | | | | | | | | | | | | $ | (1,338,474 | ) |
| | |
| 62 | | The accompanying notes are an integral part of these financial statements. |
GOLDMAN SACHS CORE FIXED INCOME FUND
|
| ADDITIONAL INVESTMENT INFORMATION (continued) |
FORWARD SALES CONTRACTS — At September 30, 2017, the Fund had the following forward sales contracts:
| | | | | | | | | | | | | | | | | | |
| Description | | Interest
Rate | | | Maturity
Date(a) | | Settlement
Date | | | Principal
Amount | | | Value | |
FHLMC | | | 3.500 | % | | TBA-30yr | | | 10/12/17 | | | $ | (4,000,000 | ) | | $ | (4,124,375 | ) |
FNMA | | | 3.000 | | | TBA-30yr | | | 10/12/17 | | | | (7,000,000 | ) | | | (7,021,875 | ) |
GNMA | | | 4.000 | | | TBA-30yr | | | 10/23/17 | | | | (5,000,000 | ) | | | (5,264,844 | ) |
| TOTAL (Proceeds Receivable: $16,500,313) | | | $ | (16,411,094 | ) |
| | (a) | | TBA (To Be Announced) Securities are purchased or sold on a forward commitment basis with an approximate principal amount and no defined maturity date. The actual principal and maturity date will be determined upon settlement when the specific mortgage pools are assigned. |
FUTURES CONTRACTS — At September 30, 2017, the Fund had the following futures contracts:
| | | | | | | | | | | | | | | | |
| Description | | Number of
Contracts | | | Expiration
Date | | | Notional
Amount | | | Unrealized
Appreciation/
(Depreciation) | |
Long position contracts: | | | | | | | | | | | | | | | | |
10 Year German Euro-Bund | | | 19 | | | | 12/07/17 | | | $ | 3,615,658 | | | $ | (22,723 | ) |
20 Year U.S. Treasury Bonds | | | 282 | | | | 12/19/17 | | | | 43,093,125 | | | | (682,256 | ) |
2 Year U.S. Treasury Notes | | | 371 | | | | 12/29/17 | | | | 80,025,860 | | | | (224,581 | ) |
5 Year U.S. Treasury Notes | | | 316 | | | | 12/29/17 | | | | 37,130,000 | | | | (284,804 | ) |
| TOTAL | | | | (1,124,364 | ) |
Short position contracts: | | | | | | | | | | | | | | | | |
Italian 10 Year Government Bonds | | | (22) | | | | 12/07/17 | | | | (3,509,204 | ) | | | 6,489 | |
Eurodollars | | | (129) | | | | 12/17/18 | | | | (31,648,538 | ) | | | (11,825 | ) |
Ultra Long U.S. Treasury Bonds | | | (44) | | | | 12/19/17 | | | | (7,265,500 | ) | | | 125,502 | |
Ultra 10 Year U.S. Treasury Notes | | | (8) | | | | 12/19/17 | | | | (1,074,625 | ) | | | 12,587 | |
10 Year U.S. Treasury Notes | | | (208) | | | | 12/19/17 | | | | (26,065,000 | ) | | | 268,608 | |
| TOTAL | | | | 401,361 | |
| TOTAL FUTURES CONTRACTS | | | $ | (813,003 | ) |
SWAP CONTRACTS — At September 30, 2017, the Fund had the following swap contracts:
CENTRALLY CLEARED INTEREST RATE SWAP CONTRACTS
| | | | | | | | | | | | | | | | | | | | | | | | | | |
| Payments Made by the Fund | | Payments
Received (Paid)
by Fund | | Termination
Date | | | Notional
Amount (000) | | | Value | | | Upfront
Premium
(Received)
Paid | | | Unrealized
Appreciation/
(Depreciation) | |
| 6M CDOR(a) | | 0.832% | | | 10/25/17 | | | | CAD | | | | 94,210 | | | $ | (18,086 | ) | | $ | 141 | | | $ | (18,227 | ) |
| 6M GBP(b) | | 0.297 | | | 12/14/17 | | | | GBP | | | | 241,520 | (c) | | | (27,771 | ) | | | 1,145 | | | | (28,916 | ) |
| 3M STIBOR(d) | | 0.050(b) | | | 06/15/18 | | | | SEK | | | | 77,980 | | | | 37,751 | | | | 27,454 | | | | 10,297 | |
| 3M STIBOR(d) | | 0.330(b) | | | 09/15/18 | | | | | | | | 104,320 | | | | 10,997 | | | | 403 | | | | 10,594 | |
| 6M CHFOR | | 0.554 | | | 03/29/19 | | | | CHF | | | | 30,530 | (c) | | | 217 | | | | (241,371 | ) | | | 241,588 | |
| 1.826 | | 3M LIBOR | | | 05/11/19 | | | $ | | | | | 21,110 | (c) | | | (4,490 | ) | | | (3,074 | ) | | | (1,416 | ) |
| 3M STIBOR(d) | | 1.000%(b) | | | 06/29/19 | | | | SEK | | | | 170,500 | (c) | | | 1,129 | | | | (3,050 | ) | | | 4,179 | |
| 3M NIBOR(e) | | 1.000(b) | | | 09/20/19 | | | | NOK | | | | 41,060 | | | | (7,650 | ) | | | (11,255 | ) | | | 3,605 | |
| 6M CDOR(e) | | 1.250 | | | 12/20/19 | | | | CAD | | | | 15,370 | (c) | | | (175,976 | ) | | | (182,296 | ) | | | 6,320 | |
| 2.000(e) | | 3M LIBOR(d) | | | 12/20/19 | | | $ | | | | | 13,320 | (c) | | | (51,511 | ) | | | (81,889 | ) | | | 30,378 | |
| 6M GBP(a) | | 3.370% | | | 07/15/22 | | | | GBP | | | | 2,570 | | | | (13,689 | ) | | | 135 | | | | (13,824 | ) |
| 6M EURO(e) | | 0.250(b) | | | 12/20/22 | | | | EUR | | | | 8,510 | (c) | | | (28,187 | ) | | | 336 | | | | (28,523 | ) |
| 3M STIBOR(d) | | 0.500(b) | | | 12/20/22 | | | | SEK | | | | 74,250 | (c) | | | (18,715 | ) | | | 12,504 | | | | (31,219 | ) |
| | |
| The accompanying notes are an integral part of these financial statements. | | 63 |
GOLDMAN SACHS CORE FIXED INCOME FUND
Schedule of Investments (continued)
September 30, 2017 (Unaudited)
|
| ADDITIONAL INVESTMENT INFORMATION (continued) |
CENTRALLY CLEARED INTEREST RATE SWAP CONTRACTS (continued)
| | | | | | | | | | | | | | | | | | | | | | | | | | | | |
| Payments Made by the Fund | | Payments
Received (Paid)
by Fund | | | Termination
Date | | | Notional
Amount (000) | | | Value | | | Upfront
Premium
(Received)
Paid | | | Unrealized
Appreciation/
(Depreciation) | |
| 6M CDOR(e) | | | 1.750% | | | | 12/20/22 | | | | CAD | | | | 7,880 | (c) | | $ | (127,309 | ) | | $ | (130,794 | ) | | $ | 3,485 | |
| 2.250%(e) | | | 3M LIBOR(d) | | | | 12/20/22 | | | $ | | | | | 13,110 | (c) | | | (125,274 | ) | | | (214,990 | ) | | | 89,716 | |
| 2.500(e) | | | 6M AUDOR | | | | 12/20/22 | | | | AUD | | | | 6,680 | (c) | | | 38,976 | | | | (8,876 | ) | | | 47,852 | |
| 2.143(e) | | | 3M LIBOR(d) | | | | 07/03/23 | | | $ | | | | | 3,920 | (c) | | | (171 | ) | | | 21,196 | | | | (21,367 | ) |
| 3M LIBOR(d) | | | 2.065%(e) | | | | 08/06/23 | | | | | | | | 11,030 | (c) | | | (47,351 | ) | | | 5,523 | | | | (52,874 | ) |
| 6M EURO(e) | | | 1.330(b) | | | | 01/12/27 | | | | EUR | | | | 6,420 | (c) | | | (36,796 | ) | | | (81,580 | ) | | | 44,784 | |
| 6M GBP(e) | | | 1.600 | | | | 03/16/27 | | | | GBP | | | | 14,780 | (c) | | | (101,097 | ) | | | 35,956 | | | | (137,053 | ) |
| 6M EURO(e) | | | 1.750(b) | | | | 06/15/27 | | | | EUR | | | | 4,040 | (c) | | | 51,089 | | | | (261,695 | ) | | | 312,784 | |
| 6M GBP(b) | | | 3.334 | | | | 06/15/27 | | | | GBP | | | | 1,240 | | | | (11,482 | ) | | | (955 | ) | | | (10,527 | ) |
| 6M EURO(b) | | | 1.427 | | | | 08/15/27 | | | | EUR | | | | 1,780 | | | | (4,667 | ) | | | 1,925 | | | | (6,592 | ) |
| 3M LIBOR(d) | | | 2.400(e) | | | | 08/31/27 | | | $ | | | | | 3,310 | (c) | | | (25,789 | ) | | | (3,790 | ) | | | (21,999 | ) |
| 1.500%(b) | | | 6M EURO(e) | | | | 08/31/27 | | | | EUR | | | | 2,900 | (c) | | | 12,270 | | | | (4,853 | ) | | | 17,123 | |
| 3.340(a) | | | 6M GBP | | | | 09/15/27 | | | | GBP | | | | 2,640 | | | | 15,582 | | | | (1,622 | ) | | | 17,204 | |
| 6M CDOR(e) | | | 2.500% | | | | 09/21/27 | | | | CAD | | | | 6,690 | (c) | | | (44,608 | ) | | | (19,285 | ) | | | (25,323 | ) |
| 2.500%(e) | | | 3M LIBOR(d) | | | | 09/21/27 | | | $ | | | | | 5,390 | (c) | | | 20,276 | | | | (1,872 | ) | | | 22,148 | |
| 6M EURO(e) | | | 1.000%(b) | | | | 12/20/27 | | | | EUR | | | | 8,330 | (c) | | | 40,132 | | | | 150,404 | | | | (110,272 | ) |
| 6M CDOR(e) | | | 2.000(d) | | | | 12/20/27 | | | | CAD | | | | 9,860 | (c) | | | (309,544 | ) | | | (256,898 | ) | | | (52,646 | ) |
| 2.500%(e) | | | 3M LIBOR | | | | 12/20/27 | | | $ | | | | | 4,280 | (c) | | | (72,605 | ) | | | (160,180 | ) | | | 87,575 | |
| 1.250(e) | | | 6M GBP | | | | 12/20/27 | | | | GBP | | | | 5,130 | (c) | | | 135,741 | | | | (92,346 | ) | | | 228,087 | |
| 0.250(e) | | | 6M JYOR | | | | 12/20/27 | | | | JPY | | | | 522,050 | (c) | | | 24,587 | | | | 13,510 | | | | 11,077 | |
| 6M CHFOR(e) | | | 1.000%(b) | | | | 12/21/27 | | | | CHF | | | | 1,500 | (c) | | | 13,430 | | | | 26,245 | | | | (12,815 | ) |
| 6M CDOR(e) | | | 2.500 | | | | 12/21/27 | | | | CAD | | | | 17,790 | (c) | | | (135,225 | ) | | | (84,955 | ) | | | (50,270 | ) |
| 2.750%(e) | | | 3M LIBOR(d) | | | | 12/21/27 | | | $ | | | | | 13,760 | (c) | | | (85,670 | ) | | | (127,818 | ) | | | 42,148 | |
| 4.000(e) | | | 3M NZDOR(d) | | | | 12/21/27 | | | | NZD | | | | 5,430 | (c) | | | (16,542 | ) | | | (38,548 | ) | | | 22,006 | |
| 3M LIBOR(d) | | | 2.378%(e) | | | | 07/03/28 | | | $ | | | | | 13,050 | (c) | | | (1,613 | ) | | | (20,371 | ) | | | 18,758 | |
| 2.346%(e) | | | 3M LIBOR(d) | | | | 08/06/28 | | | | | | | | 6,210 | (c) | | | 23,947 | | | | (6,599 | ) | | | 30,546 | |
| 1.940(e) | | | 6M GBP | | | | 01/11/32 | | | | GBP | | | | 4,450 | (c) | | | 14,532 | | | | 10,008 | | | | 4,524 | |
| 6M EURO(b) | | | 1.600% | | | | 08/15/32 | | | | EUR | | | | 980 | | | | (5,722 | ) | | | 24 | | | | (5,746 | ) |
| 6M GBP(a) | | | 3.460 | | | | 09/15/32 | | | | GBP | | | | 2,400 | | | | (9,215 | ) | | | 6,344 | | | | (15,559 | ) |
| 1.500%(e) | | | 6M GBP | | | | 12/20/32 | | | | | | | | 3,520 | (c) | | | 80,810 | | | | (92,055 | ) | | | 172,865 | |
| 1.750(e) | | | 6M GBP | | | | 03/17/37 | | | | | | | | 10,670 | (c) | | | 235,156 | | | | 49,107 | | | | 186,049 | |
| 6M EURO(e) | | | 2.000%(b) | | | | 06/16/37 | | | | EUR | | | | 1,210 | (c) | | | (22,687 | ) | | | (489 | ) | | | (22,198 | ) |
| 2.750%(e) | | | 3M LIBOR(d) | | | | 06/16/37 | | | $ | | | | | 2,340 | (c) | | | 2,568 | | | | (2,205 | ) | | | 4,773 | |
| 6M GBP(a) | | | 3.510% | | | | 09/15/42 | | | | GBP | | | | 1,940 | | | | (18,825 | ) | | | 722 | | | | (19,547 | ) |
| 2.500%(e) | | | 3M LIBOR(d) | | | | 06/17/47 | | | $ | | | | | 2,270 | (c) | | | 18,008 | | | | 3,486 | | | | 14,522 | |
| 3.450(a) | | | 6M GBP | | | | 09/15/47 | | | | GBP | | | | 1,770 | | | | 23,470 | | | | 4,682 | | | | 18,788 | |
| 1.500(e) | | | 6M GBP | | | | 12/20/47 | | | | | | | | 1,130 | (c) | | | 61,207 | | | | (23,182 | ) | | | 84,389 | |
| 2.560(e) | | | 3M LIBOR(d) | | | | 07/03/48 | | | $ | | | | | 5,410 | (c) | | | 8,115 | | | | 3,774 | | | | 4,341 | |
| TOTAL | | | | | | | | | | | | | | | | | | | | | | $ | (1,783,869 | ) | | $ | 1,105,592 | |
| | (a) | | Payments made at maturity. |
| | (b) | | Payments made annually. |
| | (c) | | Represents forward starting interest rate swaps whose effective dates of commencement of accruals and cash flows occur subsequent to September 30, 2017. |
| | (d) | | Payments made quarterly. |
| | (e) | | Payments made semi-annually. |
PURCHASED OPTIONS CONTRACTS — At September 30, 2017, the Fund had the following purchased options:
PURCHASED OPTIONS ON FUTURES
| | | | | | | | | | | | | | | | | | | | | | | | | | | | | | |
| Description | | Counterparty | | Exercise
Price | | | Expiration
Date | | | Number of
Contracts | | | Notional Amount | | | Market Value | | | Premiums Paid (Received) | | | Unrealized
Appreciation/ (Depreciation) | |
Purchased option contracts: | |
Puts | |
Eurodollar | | MS & Co. LLC | | $ | 98.00 | | | | 06/15/18 | | | | 121 | | | $ | 302,500 | | | $ | 46,888 | | | $ | 33,548 | | | $ | 13,340 | |
| | |
|
Investment Abbreviations: |
MS & Co. LLC—Morgan Stanley & Co. LLC |
|
| | |
| 64 | | The accompanying notes are an integral part of these financial statements. |
GOLDMAN SACHS GLOBAL INCOME FUND
Schedule of Investments
September 30, 2017 (Unaudited)
| | | | | | | | | | | | | | |
Principal
Amount | | | Interest
Rate | | | Maturity
Date | | | Value | |
| Foreign Sovereign Debt Obligations – 31.9% | |
| British Pound – 1.7% | |
| | United Kingdom Treasury | |
| GBP | 2,000,000 | | | | 4.500 | % | | | 09/07/34 | | | $ | 3,745,781 | |
| | 90,000 | | | | 4.250 | | | | 03/07/36 | | | | 166,180 | |
| | 3,970,000 | | | | 3.500 | | | | 01/22/45 | | | | 7,065,329 | |
| | 1,270,000 | | | | 3.500 | | | | 07/22/68 | | | | 2,715,629 | |
| | | | | | | | | | | | | | |
| | | | | | | | | | | | | 13,692,919 | |
| | |
| Canadian Dollar – 1.6% | |
| | British Columbia Province of Canada | |
| CAD | 800,000 | | | | 3.250 | | | | 12/18/21 | | | | 670,884 | |
| | 2,600,000 | | | | 2.850 | | | | 06/18/25 | | | | 2,118,174 | |
| | 2,000,000 | | | | 4.950 | | | | 06/18/40 | | | | 2,041,803 | |
| | Government of Canada | |
| | 1,760,000 | | | | 2.750 | | | | 12/01/48 | | | | 1,488,119 | |
| | Ontario Province of Canada | |
| | 1,800,000 | | | | 4.400 | | | | 06/02/19 | | | | 1,506,735 | |
| | 1,700,000 | | | | 2.600 | | | | 06/02/25 | | | | 1,357,098 | |
| | 2,300,000 | | | | 4.650 | | | | 06/02/41 | | | | 2,250,802 | |
| | Quebec Province of Canada | |
| | 1,800,000 | | | | 4.250 | | | | 12/01/21 | | | | 1,564,294 | |
| | | | | | | | | | | | | | |
| | | | | | | | | | | | | 12,997,909 | |
| | |
| Czech Koruna – 0.1% | |
| | Czech Republic Government Bond | |
| CZK | 11,190,000 | | | | 1.500 | | | | 10/29/19 | | | | 525,394 | |
| | |
| Danish Krone – 0.1% | |
| | Kingdom of Denmark | |
| DKK | 3,000,000 | | | | 4.500 | | | | 11/15/39 | | | | 801,115 | |
| | |
| Euro – 6.2% | |
| | France Government Bond OAT | |
| EUR | 1,700,000 | | | | 3.500 | | | | 04/25/26 | | | | 2,512,322 | |
| | 2,660,000 | | | | 4.750 | | | | 04/25/35 | | | | 4,838,393 | |
| | Government of France | |
| | 1,330,000 | | | | 4.500 | | | | 04/25/41 | | | | 2,476,415 | |
| | Italy Buoni Poliennali Del Tesoro | |
| | 3,440,000 | | | | 1.200 | | | | 04/01/22 | | | | 4,155,875 | |
| | 8,230,000 | | | | 1.850 | | | | 05/15/24 | | | | 9,987,044 | |
| | 1,400,000 | | | | 5.000 | | | | 09/01/40 | | | | 2,145,003 | |
| | 1,370,000 | | | | 2.800 | (a) | | | 03/01/67 | | | | 1,367,900 | |
| | Kingdom of Belgium(a) | |
| | 1,800,000 | | | | 0.800 | | | | 06/22/27 | | | | 2,140,823 | |
| | 910,000 | | | | 2.150 | | | | 06/22/66 | | | | 1,117,271 | |
| | Republic of Austria(a) | |
| | 450,000 | | | | 1.500 | | | | 11/02/86 | | | | 452,369 | |
| | Republic of Indonesia(a) | |
| | 650,000 | | | | 2.625 | | | | 06/14/23 | | | | 817,210 | |
| | 240,000 | | | | 2.150 | | | | 07/18/24 | | | | 291,811 | |
| | 420,000 | | | | 3.750 | | | | 06/14/28 | | | | 554,104 | |
| | Republic of Ireland | |
| | 860,000 | | | | 4.500 | | | | 04/18/20 | | | | 1,145,023 | |
| | 510,000 | | | | 3.400 | | | | 03/18/24 | | | | 724,498 | |
| | Spain Government Bond(a) | |
| | 2,230,000 | | | | 3.800 | | | | 04/30/24 | | | | 3,143,736 | |
| | 1,250,000 | | | | 2.750 | | | | 10/31/24 | | | | 1,662,432 | |
| | 5,545,000 | | | | 5.900 | | | | 07/30/26 | | | | 9,045,331 | |
| | 1,110,000 | | | | 3.450 | | | | 07/30/66 | | | | 1,388,577 | |
| | | | | | | | | | | | | | |
| | | | | | | | | | | | | 49,966,137 | |
| | |
| Foreign Sovereign Debt Obligations – (continued) | |
| Japanese Yen – 19.1% | |
| | Government of Japan | |
| JPY | 4,239,500,000 | | | | 1.300 | % | | | 06/20/20 | | | $ | 39,131,122 | |
| | 50,000 | | | | 0.400 | | | | 06/20/25 | | | | 459 | |
| | 436,000,000 | | | | 2.200 | | | | 03/20/31 | | | | 4,886,881 | |
| | 225,000,000 | | | | 1.700 | | | | 09/20/32 | | | | 2,406,065 | |
| | 214,000,000 | | | | 1.400 | | | | 09/20/34 | | | | 2,206,145 | |
| | 2,029,200,000 | | | | 2.500 | | | | 09/20/34 | | | | 24,146,443 | |
| | 315,000,000 | | | | 2.200 | | | | 09/20/39 | | | | 3,673,120 | |
| | 454,000,000 | | | | 1.400 | | | | 09/20/45 | | | | 4,607,702 | |
| | 233,600,000 | | | | 2.000 | | | | 03/20/52 | | | | 2,708,784 | |
| | 312,700,000 | | | | 1.400 | | | | 03/20/55 | | | | 3,121,442 | |
| | Japan Government Five Year Bond | |
| | 419,000,000 | | | | 0.100 | | | | 09/20/21 | | | | 3,752,028 | |
| | Japan Government Ten Year Bond | |
| | 1,124,050,000 | | | | 0.100 | | | | 06/20/26 | | | | 10,058,162 | |
| | 529,250,000 | | | | 0.100 | | | | 09/20/26 | | | | 4,731,102 | |
| | Japan Government Two Year Bond | |
| | 2,501,200,000 | | | | 0.100 | | | | 12/15/18 | | | | 22,291,523 | |
| | Japanese Government CPI Linked Bond | |
| | 23,476,500 | | | | 0.100 | | | | 09/10/24 | | | | 216,562 | |
| | 1,571,469,900 | | | | 0.100 | | | | 03/10/25 | | | | 14,503,190 | |
| | 1,321,354,736 | | | | 0.100 | | | | 03/10/26 | | | | 12,218,348 | |
| | | | | | | | | | | | | | |
| | | | | | | | | | | | | 154,659,078 | |
| | |
| Mexican Peso – 0.3% | |
| | United Mexican States | |
| MXN | 3,957,000 | | | | 6.500 | | | | 06/10/21 | | | | 215,663 | |
| | 19,401,200 | | | | 6.500 | | | | 06/09/22 | | | | 1,055,198 | |
| | 2,034,800 | | | | 8.000 | | | | 12/07/23 | | | | 118,729 | |
| | 2,098,900 | | | | 7.750 | | | | 11/23/34 | | | | 122,133 | |
| | 13,763,300 | | | | 10.000 | | | | 11/20/36 | | | | 975,565 | |
| | 2,436,600 | | | | 8.500 | | | | 11/18/38 | | | | 152,330 | |
| | 94,300 | | | | 8.000 | | | | 11/07/47 | | | | 5,643 | |
| | | | | | | | | | | | | | |
| | | | | | | | | | | | | 2,645,261 | |
| | |
| Russian Ruble – 0.1% | |
| | Russian Federation Bond | |
| RUB | 26,160,000 | | | | 7.050 | | | | 01/19/28 | | | | 441,071 | |
| | |
| South African Rand – 0.7% | |
| | Republic of South Africa | |
| ZAR | 47,650,000 | | | | 7.750 | | | | 02/28/23 | | | | 3,495,860 | |
| | 6,569,608 | | | | 10.500 | | | | 12/21/26 | | | | 544,308 | |
| | 9,630,000 | | | | 8.500 | | | | 01/31/37 | | | | 640,337 | |
| | 13,680,000 | | | | 8.750 | | | | 01/31/44 | | | | 912,790 | |
| | | | | | | | | | | | | | |
| | | | | | | | | | | | | 5,593,295 | |
| | |
| South Korean Won – 0.5% | |
| | Republic of Korea | |
| $ | 660,000 | | | | 7.125 | | | | 04/16/19 | | | | 709,005 | |
| | KRW 3,819,000,000 | | | | 5.000 | | | | 06/10/20 | | | | 3,597,873 | |
| | | | | | | | | | | | | | |
| | | | | | | | | | | | | 4,306,878 | |
| | |
| Swedish Krona – 0.4% | |
| | Sweden Government Bond | |
| SEK | 21,290,000 | | | | 3.500 | | | | 06/01/22 | | | | 3,041,724 | |
| | |
| | |
| The accompanying notes are an integral part of these financial statements. | | 65 |
GOLDMAN SACHS GLOBAL INCOME FUND
Schedule of Investments (continued)
September 30, 2017 (Unaudited)
| | | | | | | | | | | | | | |
Principal
Amount | | | Interest
Rate | | | Maturity
Date | | | Value | |
| Foreign Sovereign Debt Obligations – (continued) | |
| Thai Baht – 0.5% | |
| | Thailand Government Bond | |
| THB | 126,490,000 | | | | 1.875 | % | | | 06/17/22 | | | $ | 3,813,160 | |
| | |
| United States Dollar – 0.6% | |
| | Republic of Colombia(b) | |
| $ | 1,230,000 | | | | 3.875 | | | | 04/25/27 | | | | 1,249,065 | |
| | Republic of Indonesia | |
| | 970,000 | | | | 5.875 | | | | 01/15/24 | | | | 1,111,959 | |
| | 1,110,000 | | | | 4.125 | | | | 01/15/25 | | | | 1,164,756 | |
| | 200,000 | | | | 4.125 | (a) | | | 01/15/25 | | | | 209,866 | |
| | 790,000 | | | | 3.850 | (a) | | | 07/18/27 | | | | 812,634 | |
| | 300,000 | | | | 4.750 | (a) | | | 07/18/47 | | | | 316,698 | |
| | | | | | | | | | | | | | |
| | | | | | | | | | | | | 4,864,978 | |
| | |
| TOTAL FOREIGN SOVEREIGN DEBT
OBLIGATIONS |
| | | | |
| | (Cost $251,232,801) | | | $ | 257,348,919 | |
| | |
| | | | | | | | | | | | | | |
| Corporate Obligations – 18.6% | |
| Agriculture – 0.6% | |
| | BAT Capital Corp.(a)(b) | |
| $ | 700,000 | | | | 3.222 | % | | | 08/15/24 | | | $ | 701,725 | |
| | 1,100,000 | | | | 3.557 | | | | 08/15/27 | | | | 1,111,057 | |
| | BAT International Finance PLC(a) | |
| | 800,000 | | | | 2.750 | | | | 06/15/20 | | | | 812,445 | |
| | 200,000 | | | | 3.500 | | | | 06/15/22 | | | | 206,507 | |
| | Reynolds American, Inc. | |
| | 108,000 | | | | 3.250 | | | | 06/12/20 | | | | 110,984 | |
| | 150,000 | | | | 4.000 | | | | 06/12/22 | | | | 158,462 | |
| | 250,000 | | | | 5.700 | (b) | | | 08/15/35 | | | | 293,177 | |
| | 1,100,000 | | | | 5.850 | (b) | | | 08/15/45 | | | | 1,345,961 | |
| | | | | | | | | | | | | | |
| | | | | | | | | | | | | 4,740,318 | |
| | |
| Automotive – 0.1% | |
| | GKN Holdings PLC | |
| GBP | 700,000 | | | | 5.375 | | | | 09/19/22 | | | | 1,085,064 | |
| | |
| Banks – 7.3% | |
| | Bank of America Corp. | |
| $ | 1,550,000 | | | | 5.750 | | | | 12/01/17 | | | | 1,560,660 | |
| | 1,000,000 | | | | 5.650 | | | | 05/01/18 | | | | 1,022,833 | |
| | 1,400,000 | | | | 2.600 | | | | 01/15/19 | | | | 1,411,315 | |
| | 600,000 | | | | 2.650 | | | | 04/01/19 | | | | 605,400 | |
| | 1,450,000 | | | | 4.125 | | | | 01/22/24 | | | | 1,542,604 | |
| | 150,000 | | | | 3.875 | | | | 08/01/25 | | | | 157,128 | |
| | 3,500,000 | | | | 3.248 | (b) | | | 10/21/27 | | | | 3,429,872 | |
| | 650,000 | | | | 4.183 | (b) | | | 11/25/27 | | | | 673,710 | |
| | 2,100,000 | | | | 3.824 | (b)(c) | | | 01/20/28 | | | | 2,159,230 | |
| | 100,000 | | | | 6.110 | | | | 01/29/37 | | | | 125,034 | |
| | Barclays Bank PLC | |
| | 850,000 | | | | 10.179 | | | | 06/12/21 | | | | 1,052,655 | |
| | Barclays PLC(b) | |
| | 1,850,000 | | | | 3.684 | | | | 01/10/23 | | | | 1,897,311 | |
| | BNP Paribas SA(a) | |
| | 200,000 | | | | 4.375 | | | | 09/28/25 | | | | 207,540 | |
| | 900,000 | | | | 4.375 | | | | 05/12/26 | | | | 939,771 | |
| | |
| Corporate Obligations – (continued) | |
| Banks – (continued) | |
| | Capital One Financial Corp.(b) | |
| 1,600,000 | | | | 2.500 | | | | 05/12/20 | | | | 1,607,449 | |
| | 1,000,000 | | | | 4.200 | | | | 10/29/25 | | | | 1,027,603 | |
| | Citigroup, Inc.(b) | |
| | 1,300,000 | | | | 3.200 | | | | 10/21/26 | | | | 1,279,466 | |
| | Credit Agricole SA(a) | |
| | 1,500,000 | | | | 2.125 | | | | 04/17/18 | | | | 1,504,394 | |
| | 1,200,000 | | | | 3.375 | | | | 01/10/22 | | | | 1,226,985 | |
| | 1,000,000 | | | | 4.125 | | | | 01/10/27 | | | | 1,045,199 | |
| | Credit Suisse AG | |
| | 750,000 | | | | 6.500 | | | | 08/08/23 | | | | 847,500 | |
| | Deutsche Bank AG | |
| | 150,000 | | | | 2.850 | | | | 05/10/19 | | | | 151,498 | |
| | 3,400,000 | | | | 2.700 | | | | 07/13/20 | | | | 3,412,226 | |
| | 100,000 | | | | 3.125 | | | | 01/13/21 | | | | 101,055 | |
| | Dexia Credit Local SA | |
| | 3,500,000 | | | | 1.875 | (a) | | | 03/28/19 | | | | 3,495,897 | |
| GBP | 5,900,000 | | | | 1.125 | | | | 06/15/22 | | | | 7,855,161 | |
| | HSBC Holdings PLC | |
| $ | 200,000 | | | | 4.250 | | | | 08/18/25 | | | | 207,267 | |
| | 450,000 | | | | 6.800 | | | | 06/01/38 | | | | 613,240 | |
| | Intesa Sanpaolo SpA | |
| | 1,700,000 | | | | 3.875 | | | | 01/16/18 | | | | 1,709,385 | |
| | 900,000 | | | | 3.875 | | | | 01/15/19 | | | | 918,753 | |
| | Kreditanstalt fuer Wiederaufbau(d) | |
| AUD | 3,000,000 | | | | 6.000 | | | | 08/20/20 | | | | 2,589,649 | |
| | Morgan Stanley, Inc. | |
| $ | 500,000 | | | | 5.625 | | | | 09/23/19 | | | | 534,052 | |
| EUR | 900,000 | | | | 2.375 | | | | 03/31/21 | | | | 1,142,904 | |
| $ | 50,000 | | | | 3.875 | | | | 04/29/24 | | | | 52,326 | |
| | 1,700,000 | | | | 3.700 | | | | 10/23/24 | | | | 1,761,155 | |
| | 300,000 | | | | 4.000 | | | | 07/23/25 | | | | 316,279 | |
| | 1,400,000 | | | | 3.625 | | | | 01/20/27 | | | | 1,419,018 | |
| | 350,000 | | | | 4.300 | | | | 01/27/45 | | | | 366,894 | |
| | The Bank of Tokyo-Mitsubishi UFJ Ltd.(a) | |
| | 1,050,000 | | | | 1.700 | | | | 03/05/18 | | | | 1,050,225 | |
| | UBS Group Funding Switzerland AG(a) | |
| | 2,400,000 | | | | 3.000 | | | | 04/15/21 | | | | 2,433,041 | |
| | 1,750,000 | | | | 4.125 | | | | 09/24/25 | | | | 1,840,840 | |
| | UniCredit SpA(a) | |
| | 1,400,000 | | | | 3.750 | | | | 04/12/22 | | | | 1,435,091 | |
| | | | | | | | | | | | | | |
| | | | | | | | | | | | | 58,729,615 | |
| | |
| Beverages(b) – 0.4% | |
| | Anheuser-Busch InBev Finance, Inc. | |
| | 2,050,000 | | | | 2.650 | | | | 02/01/21 | | | | 2,083,293 | |
| | 1,100,000 | | | | 4.900 | | | | 02/01/46 | | | | 1,242,525 | |
| | | | | | | | | | | | | | |
| | | | | | | | | | | | | 3,325,818 | |
| | |
| Chemicals(b) – 0.0% | |
| | LyondellBasell Industries NV | |
| | 252,000 | | | | 5.000 | | | | 04/15/19 | | | | 261,473 | |
| | |
| Diversified Financial Services – 1.3% | |
| | AerCap Ireland Capital DAC/AerCap Global Aviation Trust | |
| | 2,550,000 | | | | 3.750 | | | | 05/15/19 | | | | 2,609,339 | |
| | 2,300,000 | | | | 3.500 | (b) | | | 05/26/22 | | | | 2,355,131 | |
| | 2,149,000 | | | | 4.625 | | | | 07/01/22 | | | | 2,303,373 | |
| | |
| | |
| 66 | | The accompanying notes are an integral part of these financial statements. |
GOLDMAN SACHS GLOBAL INCOME FUND
| | | | | | | | | | | | | | |
Principal
Amount | | | Interest
Rate | | | Maturity
Date | | | Value | |
| Corporate Obligations – (continued) | |
| Diversified Financial Services – (continued) | |
| | GE Capital European Funding Unlimited Co. | |
| EUR | 1,200,000 | | | | 2.875 | % | | | 06/18/19 | | | $ | 1,491,875 | |
| | GE Capital International Funding Co. | |
| $ | 1,500,000 | | | | 3.373 | | | | 11/15/25 | | | | 1,551,362 | |
| Standard Life Aberdeen PLC(b)(c) (5 year UK Government
Bond + 2.700%) |
|
| GBP | 50,000 | | | | 6.546 | | | | 11/29/49 | | | | 73,384 | |
| | Synchrony Financial(b) | |
| $ | 250,000 | | | | 3.000 | | | | 08/15/19 | | | | 254,087 | |
| | | | | | | | | | | | | | |
| | | | | | | | | | | | | 10,638,551 | |
| | |
| Electrical – 0.5% | |
| | Electricite de France SA(b)(c) (7 year EUR Swap + 3.021%) | |
| EUR | 2,000,000 | | | | 4.250 | | | | 12/29/49 | | | | 2,509,387 | |
| | Exelon Corp.(b) | |
| $ | 1,100,000 | | | | 3.497 | | | | 06/01/22 | | | | 1,133,102 | |
| | Ruwais Power Co. PJSC(a) | |
| | 520,000 | | | | 6.000 | | | | 08/31/36 | | | | 611,000 | |
| | | | | | | | | | | | | | |
| | | | | | | | | | | | | 4,253,489 | |
| | |
| Food & Drug Retailing(b) – 0.4% | |
| | Kraft Heinz Foods Co. | |
| | 600,000 | | | | 2.800 | | | | 07/02/20 | | | | 610,839 | |
| | 350,000 | | | | 3.950 | | | | 07/15/25 | | | | 360,487 | |
| | 150,000 | | | | 5.000 | | | | 07/15/35 | | | | 163,417 | |
| | The Kroger Co. | |
| | 1,650,000 | | | | 2.800 | | | | 08/01/22 | | | | 1,654,487 | |
| | | | | | | | | | | | | | |
| | | | | | | | | | | | | 2,789,230 | |
| | |
| Healthcare Providers & Services – 0.5% | |
| | Becton Dickinson & Co.(b) | |
| | 1,600,000 | | | | 2.894 | | | | 06/06/22 | | | | 1,605,206 | |
| | 1,700,000 | | | | 3.363 | | | | 06/06/24 | | | | 1,715,860 | |
| | UnitedHealth Group, Inc. | |
| | 700,000 | | | | 2.875 | | | | 12/15/21 | | | | 718,058 | |
| | | | | | | | | | | | | | |
| | | | | | | | | | | | | 4,039,124 | |
| | |
| Insurance – 0.8% | |
| | American International Group, Inc.(b) | |
| | 350,000 | | | | 3.875 | | | | 01/15/35 | | | | 342,735 | |
| | 500,000 | | | | 4.800 | | | | 07/10/45 | | | | 545,593 | |
| | Aviva PLC(b)(c) | |
| | (5 year UK Government Bond + 2.850%) | |
| GBP | 50,000 | | | | 6.125 | | | | 11/14/36 | | | | 78,490 | |
| | (6M GBP LIBOR + 1.880%) | |
| | 1,550,000 | | | | 5.902 | | | | 11/29/49 | | | | 2,253,918 | |
| Cloverie PLC for Zurich Insurance Co. Ltd.(b)(c) (3M USD
LIBOR + 4.918%) |
|
| $ | 1,250,000 | | | | 5.625 | | | | 06/24/46 | | | | 1,370,397 | |
| | MetLife, Inc. | |
| | 500,000 | | | | 4.368 | | | | 09/15/23 | | | | 544,859 | |
| | 110,000 | | | | 3.600 | | | | 04/10/24 | | | | 114,997 | |
| | NN Group NV(b)(c) (3 mo. Euribor + 3.950%) | |
| EUR | 800,000 | | | | 4.625 | | | | 04/08/44 | | | | 1,065,337 | |
| | QBE Insurance Group Ltd.(a) | |
| $ | 400,000 | | | | 2.400 | | | | 05/01/18 | | | | 400,433 | |
| | | | | | | | | | | | | | |
| | | | | | | | | | | | | 6,716,759 | |
| | |
| Corporate Obligations – (continued) | |
| Lodging(b) – 0.2% | |
| | Marriott International, Inc. | |
| 1,200,000 | | | | 2.300 | | | | 01/15/22 | | | | 1,184,685 | |
| | |
| Media – 0.3% | |
| Charter Communications Operating LLC/Charter Communications
Operating Capital(b) |
|
| | 150,000 | | | | 3.579 | | | | 07/23/20 | | | | 153,987 | |
| | 1,150,000 | | | | 4.908 | | | | 07/23/25 | | | | 1,229,368 | |
| | Time Warner Cable LLC | |
| | 300,000 | | | | 6.750 | | | | 07/01/18 | | | | 310,860 | |
| | 450,000 | | | | 5.000 | | | | 02/01/20 | | | | 475,758 | |
| | 100,000 | | | | 4.125 | (b) | | | 02/15/21 | | | | 103,835 | |
| | 28,000 | | | | 7.300 | | | | 07/01/38 | | | | 35,146 | |
| | 100,000 | | | | 5.500 | (b) | | | 09/01/41 | | | | 103,832 | |
| | | | | | | | | | | | | | |
| | | | | | | | | | | | | 2,412,786 | |
| | |
| Mining(a) – 0.3% | |
| | Glencore Funding LLC | |
| | 2,100,000 | | | | 4.125 | | | | 05/30/23 | | | | 2,186,205 | |
| | |
| Miscellaneous Manufacturing – 0.1% | |
| | General Electric Co. | |
| MXN | 2,000,000 | | | | 8.500 | | | | 04/06/18 | | | | 110,052 | |
| $ | 350,000 | | | | 5.550 | | | | 05/04/20 | | | | 382,453 | |
| | 150,000 | | | | 4.650 | | | | 10/17/21 | | | | 164,260 | |
| | | | | | | | | | | | | | |
| | | | | | | | | | | | | 656,765 | |
| | |
| Oil Field Services – 0.9% | |
| | Anadarko Petroleum Corp. | |
| | 50,000 | | | | 3.450 | (b) | | | 07/15/24 | | | | 49,621 | |
| | 850,000 | | | | 6.450 | | | | 09/15/36 | | | | 1,005,547 | |
| | BP Capital Markets PLC | |
| | 250,000 | | | | 3.814 | | | | 02/10/24 | | | | 263,308 | |
| EUR | 950,000 | | | | 0.830 | (b) | | | 09/19/24 | | | | 1,121,492 | |
| $ | 200,000 | | | | 3.017 | (b) | | | 01/16/27 | | | | 196,847 | |
| | Devon Energy Corp.(b) | |
| | 500,000 | | | | 3.250 | | | | 05/15/22 | | | | 505,915 | |
| | 200,000 | | | | 5.600 | | | | 07/15/41 | | | | 218,879 | |
| | 500,000 | | | | 4.750 | | | | 05/15/42 | | | | 506,198 | |
| | 300,000 | | | | 5.000 | | | | 06/15/45 | | | | 316,135 | |
| | Dolphin Energy Ltd. | |
| | 141,047 | | | | 5.888 | | | | 06/15/19 | | | | 145,984 | |
| | 210,070 | | | | 5.888 | (a) | | | 06/15/19 | | | | 217,422 | |
| | Petroleos Mexicanos | |
| | 32,000 | | | | 6.375 | | | | 02/04/21 | | | | 34,968 | |
| EUR | 820,000 | | | | 5.125 | | | | 03/15/23 | | | | 1,109,686 | |
| $ | 840,000 | | | | 6.500 | (a) | | | 03/13/27 | | | | 930,913 | |
| | 23,000 | | | | 5.500 | | | | 06/27/44 | | | | 21,390 | |
| | 30,000 | | | | 6.375 | | | | 01/23/45 | | | | 30,570 | |
| | 410,000 | | | | 6.750 | (a) | | | 09/21/47 | | | | 436,404 | |
| | | | | | | | | | | | | | |
| | | | | | | | | | | | | 7,111,279 | |
| | |
| Pharmaceuticals – 0.9% | |
| | Allergan Funding SCS | |
| | 50,000 | | | | 2.450 | | | | 06/15/19 | | | | 50,346 | |
| | 250,000 | | | | 3.000 | (b) | | | 03/12/20 | | | | 255,232 | |
| | Forest Laboratories LLC(a)(b) | |
| | 80,000 | | | | 4.375 | | | | 02/01/19 | | | | 82,040 | |
| | 4,100,000 | | | | 5.000 | | | | 12/15/21 | | | | 4,480,892 | |
| | |
| | |
| The accompanying notes are an integral part of these financial statements. | | 67 |
GOLDMAN SACHS GLOBAL INCOME FUND
Schedule of Investments (continued)
September 30, 2017 (Unaudited)
| | | | | | | | | | | | | | |
Principal
Amount | | | Interest
Rate | | | Maturity
Date | | | Value | |
| Corporate Obligations – (continued) | |
| Pharmaceuticals – (continued) | |
| | Mylan NV(b) | |
| $ | 2,300,000 | | | | 3.950 | % | | | 06/15/26 | | | $ | 2,341,641 | |
| | | | | | | | | | | | | | |
| | | | | | | | | | | | | 7,210,151 | |
| | |
| Pipelines – 1.5% | |
| | Buckeye Partners LP(b) | |
| | 550,000 | | | | 4.150 | | | | 07/01/23 | | | | 569,685 | |
| | Columbia Pipeline Group, Inc. | |
| | 100,000 | | | | 2.450 | | | | 06/01/18 | | | | 100,344 | |
| | 150,000 | | | | 3.300 | (b) | | | 06/01/20 | | | | 153,533 | |
| | Enterprise Products Operating LLC(b) | |
| | 700,000 | | | | 2.850 | | | | 04/15/21 | | | | 710,967 | |
| | 500,000 | | | | 3.750 | | | | 02/15/25 | | | | 518,204 | |
| | Kinder Morgan Energy Partners LP(b) | |
| | 470,000 | | | | 3.950 | | | | 09/01/22 | | | | 487,953 | |
| | Kinder Morgan, Inc.(b) | |
| | 350,000 | | | | 3.050 | | | | 12/01/19 | | | | 356,329 | |
| | 3,000,000 | | | | 5.000 | (a) | | | 02/15/21 | | | | 3,218,614 | |
| | 300,000 | | | | 4.300 | | | | 06/01/25 | | | | 314,257 | |
| | Plains All American Pipeline LP/PAA Finance Corp.(b) | |
| | 1,800,000 | | | | 4.500 | | | | 12/15/26 | | | | 1,826,838 | |
| | 700,000 | | | | 4.700 | | | | 06/15/44 | | | | 633,438 | |
| | Sabine Pass Liquefaction LLC(b) | |
| | 2,000,000 | | | | 5.625 | | | | 03/01/25 | | | | 2,207,500 | |
| | Williams Partners LP(b) | |
| | 550,000 | | | | 3.600 | | | | 03/15/22 | | | | 568,257 | |
| | 450,000 | | | | 3.900 | | | | 01/15/25 | | | | 459,255 | |
| | | | | | | | | | | | | | |
| | | | | | | | | | | | | 12,125,174 | |
| | |
| Real Estate Investment Trust(b) – 0.2% | |
| | American Tower Corp. | |
| | 450,000 | | | | 3.300 | | | | 02/15/21 | | | | 461,103 | |
| | HCP, Inc. | |
| | 100,000 | | | | 2.625 | | | | 02/01/20 | | | | 100,802 | |
| | 273,000 | | | | 5.375 | | | | 02/01/21 | | | | 296,538 | |
| | Ventas Realty LP/Ventas Capital Corp. | |
| | 200,000 | | | | 3.250 | | | | 08/15/22 | | | | 203,442 | |
| | WEA Finance LLC/Westfield UK & Europe Finance PLC(a) | |
| | 350,000 | | | | 2.700 | | | | 09/17/19 | | | | 353,088 | |
| | 400,000 | | | | 3.750 | | | | 09/17/24 | | | | 407,773 | |
| | | | | | | | | | | | | | |
| | | | | | | | | | | | | 1,822,746 | |
| | |
| Retailing(b) – 0.1% | |
| | CVS Health Corp. | |
| | 550,000 | | | | 2.800 | | | | 07/20/20 | | | | 559,481 | |
| | 222,000 | | | | 3.875 | | | | 07/20/25 | | | | 231,549 | |
| | McDonald’s Corp. | |
| | 100,000 | | | | 2.750 | | | | 12/09/20 | | | | 101,890 | |
| | | | | | | | | | | | | | |
| | | | | | | | | | | | | 892,920 | |
| | |
| Semiconductors(b) – 0.4% | |
| | Broadcom Corp./Broadcom Cayman Finance Ltd.(a) | |
| | 600,000 | | | | 3.000 | | | | 01/15/22 | | | | 610,009 | |
| | 750,000 | | | | 3.625 | | | | 01/15/24 | | | | 770,533 | |
| | 750,000 | | | | 3.875 | | | | 01/15/27 | | | | 772,478 | |
| | QUALCOMM, Inc. | |
| | 1,050,000 | | | | 3.250 | | | | 05/20/27 | | | | 1,058,794 | |
| | | | | | | | | | | | | | |
| | | | | | | | | | | | | 3,211,814 | |
| | |
| Corporate Obligations – (continued) | |
| Software(b) – 0.1% | |
| | Fidelity National Information Services, Inc. | |
| EUR | 800,000 | | | | 1.100 | | | | 07/15/24 | | | | 941,767 | |
| | |
| Supranational(d) – 0.2% | |
| | European Financial Stability Facility | |
| | 1,100,000 | | | | 2.350 | | | | 07/29/44 | | | | 1,513,344 | |
| | |
| Telecommunication Services – 1.5% | |
| | America Movil SAB de CV | |
| MXN | 5,260,000 | | | | 6.000 | | | | 06/09/19 | | | | 280,928 | |
| | AT&T, Inc.(b) | |
| $ | 2,000,000 | | | | 2.800 | | | | 02/17/21 | | | | 2,023,817 | |
| | 1,450,000 | | | | 3.200 | | | | 03/01/22 | | | | 1,478,770 | |
| | 250,000 | | | | 3.000 | | | | 06/30/22 | | | | 252,434 | |
| | 800,000 | | | | 2.850 | | | | 02/14/23 | | | | 794,976 | |
| | 800,000 | | | | 3.900 | | | | 08/14/27 | | | | 801,557 | |
| | Verizon Communications, Inc. | |
| | 350,000 | | | | 4.500 | | | | 09/15/20 | | | | 375,491 | |
| | 250,000 | | | | 3.450 | | | | 03/15/21 | | | | 259,903 | |
| | 400,000 | | | | 3.000 | (b) | | | 11/01/21 | | | | 408,208 | |
| | 3,299,000 | | | | 2.946 | | | | 03/15/22 | | | | 3,354,899 | |
| | 1,100,000 | | | | 3.125 | | | | 03/16/22 | | | | 1,127,178 | |
| | 1,200,000 | | | | 2.450 | (b) | | | 11/01/22 | | | | 1,190,849 | |
| | | | | | | | | | | | | | |
| | | | | | | | | | | | | 12,349,010 | |
| | |
| | TOTAL CORPORATE OBLIGATIONS | | | | | |
| | (Cost $147,268,244) | | | | | | | | | | | $ | 150,198,087 | |
| | |
| | | | | | | | | | | | | | |
| Foreign Debt Obligations(d) – 3.4% | |
| Supranational – 3.4% | |
| | European Financial Stability Facility | |
| EUR | 2,700,000 | | | | 0.400 | % | | | 05/31/26 | | | $ | 3,138,860 | |
| | FMS Wertmanagement | |
| | 19,900,000 | | | | 1.875 | | | | 05/09/19 | | | | 24,400,635 | |
| | |
| | TOTAL FOREIGN DEBT OBLIGATIONS | | | | | |
| | (Cost $27,090,615) | | | | | | | | | | | $ | 27,539,495 | |
| | |
| | | | | | | | | | | | | | |
| Asset-Backed Securities – 18.5% | |
| Collateralized Loan Obligations(a)(c) – 10.5% | |
| AIMCO CLO Series 2014-AA, Class AR (3M USD
LIBOR + 1.100%) |
|
| $ | 4,250,000 | | | | 2.181 | % | | | 07/20/26 | | | $ | 4,249,970 | |
| | Apex Credit CLO II LLC Series 2017-2A, Class A | |
| | 8,400,000 | | | | 2.600 | | | | 09/20/29 | | | | 8,438,472 | |
| Atrium X CLO Series 2017-10A, Class AR (3M USD
LIBOR + 0.950%) |
|
| | 4,150,000 | | | | 2.036 | | | | 07/16/25 | | | | 4,159,317 | |
| B&M CLO Ltd. Series 2014-1A, Class A1 (3M USD
LIBOR + 1.400%) |
|
| | 1,750,000 | | | | 2.558 | | | | 04/16/26 | | | | 1,749,596 | |
| GoldentTree Loan Management US CLO 1 Ltd. Series 2017-1A,
Class A (3M USD LIBOR + 1.220%) |
|
| | 4,650,000 | | | | 2.404 | | | | 04/20/29 | | | | 4,673,004 | |
| | |
| | |
| 68 | | The accompanying notes are an integral part of these financial statements. |
GOLDMAN SACHS GLOBAL INCOME FUND
| | | | | | | | | | | | | | |
Principal
Amount | | | Interest
Rate | | | Maturity
Date | | | Value | |
| Asset-Backed Securities – (continued) | |
| Collateralized Loan Obligations(a)(c) – (continued) | |
| Greywolf CLO V Ltd. Series 2015-1A, Class A1 (3M USD
LIBOR + 1.600%) |
|
| $ | 1,800,000 | | | | 2.756 | % | | | 04/25/27 | | | $ | 1,802,912 | |
| Halcyon Loan Advisors Funding Ltd. Series 2013-1A, Class A1
(3M USD LIBOR + 1.150%) |
|
| | 2,424,492 | | | | 2.308 | | | | 04/15/25 | | | | 2,424,754 | |
| Halcyon Loan Advisors Funding Ltd. Series 2014-1A, Class A1R
(3M USD LIBOR + 1.130%) |
|
| | 5,600,000 | | | | 2.434 | | | | 04/18/26 | | | | 5,608,742 | |
| Madison Park Funding XII Ltd. Series 2014-12A, Class AR
(3M USD LIBOR + 1.260%) |
|
| | 3,900,000 | | | | 2.416 | | | | 07/20/26 | | | | 3,924,215 | |
| Oak Hill Credit Partners X Ltd. Series 2014-10A, Class AR
(3M USD LIBOR + 1.130%) |
|
| | 4,650,000 | | | | 2.286 | | | | 07/20/26 | | | | 4,670,200 | |
| OCP CLO Ltd. Series 2016-12A, Class A1 (3M USD
LIBOR + 1.570%) |
|
| | 4,650,000 | | | | 2.728 | | | | 10/18/28 | | | | 4,683,898 | |
| | Octagon Investment Partners 24 Ltd. Series 2015-1A, Class A1R | |
| | 8,450,000 | | | | 2.250 | | | | 05/21/27 | | | | 8,458,450 | |
| OFSI Fund VII Ltd. Series 2014-7A, Class A (3M USD
LIBOR + 1.340%) |
|
| | 2,285,359 | | | | 2.498 | | | | 10/18/26 | | | | 2,286,499 | |
| | OFSI Fund VII Ltd. Series 2014-7A, Class AR | |
| | 2,250,000 | | | | 2.114 | | | | 10/18/26 | | | | 2,260,305 | |
| OFSI Fund VII Ltd. Series 2014-7A, Class B (3M USD LIBOR +
2.130%) |
|
| | 564,641 | | | | 3.288 | | | | 10/18/26 | | | | 564,858 | |
| OHA Credit Partners VIII Ltd. Series 2013-8A, Class A
(3M USD LIBOR + 1.120%) |
|
| | 5,660,645 | | | | 2.276 | | | | 04/20/25 | | | | 5,672,470 | |
| Shackleton CLO Ltd. Series 2014-5A, Class AR (3M USD
LIBOR + 1.140%) |
|
| | 3,650,000 | | | | 2.319 | | | | 05/07/26 | | | | 3,655,267 | |
| Sound Point CLO Vlll Ltd. Series 2015-1A, Class A (3M USD
LIBOR + 1.530%) |
|
| | 900,000 | | | | 2.688 | | | | 04/15/27 | | | | 901,326 | |
| Sound Point CLO XI Ltd. Series 2016-1A, Class A (3M USD
LIBOR + 1.650%) |
|
| | 8,350,000 | | | | 2.806 | | | | 07/20/28 | | | | 8,404,183 | |
| Sound Point CLO XI Ltd. Series 2016-1A, Class B1 (3M USD
LIBOR + 2.400%) |
|
| | 1,700,000 | | | | 3.556 | | | | 07/20/28 | | | | 1,711,636 | |
| Trinitas CLO II Ltd. Series 2014-2A, Class A1R (3M USD
LIBOR + 1.180%) |
|
| | 1,000,000 | | | | 2.339 | | | | 07/15/26 | | | | 1,001,426 | |
| WhiteHorse VIII Ltd. Series 2014-1A, Class A (3M USD
LIBOR + 1.500%) |
|
| | 3,500,000 | | | | 2.670 | | | | 05/01/26 | | | | 3,504,375 | |
| | | | | | | | | | | | | | |
| | | | | | | | | | | | | 84,805,875 | |
| | |
| Home Equity(c) – 0.2% | |
| CIT Mortgage Loan Trust Series 2007-1, Class 2A3(a)
(1M LIBOR + 1.450%) |
|
| | 1,516,653 | | | | 2.687 | | | | 10/25/37 | | | | 1,528,353 | |
| | |
| Asset-Backed Securities – (continued) | |
| Home Equity – (continued) | |
| GMAC Mortgage Home Equity Loan Trust Series 2007-HE3,
Class 1A1 |
|
| 22,562 | | | | 7.000 | | | | 09/25/37 | | | | 22,857 | |
| GMAC Mortgage Home Equity Loan Trust Series 2007-HE3,
Class 2A1 |
|
| | 68,685 | | | | 7.000 | | | | 09/25/37 | | | | 70,773 | |
| | | | | | | | | | | | | | |
| | | | | | | | | | | | | 1,621,983 | |
| | |
| Student Loans(c) – 7.8% | |
| Access Group, Inc. Series 2015-1, Class A(a) (1M USD
LIBOR + 0.700%) |
|
| | 1,267,061 | | | | 1.934 | | | | 07/25/56 | | | | 1,268,614 | |
| Chase Education Loan Trust Series 2007-A, Class A3 (3M USD
LIBOR + 0.070%) |
|
| | 231,688 | | | | 1.365 | | | | 12/28/23 | | | | 231,098 | |
| ECMC Group Student Loan Trust Series 2017-1A, Class A(a)
(1M USD LIBOR + 1.200%) |
|
| | 7,512,293 | | | | 2.434 | | | | 12/27/66 | | | | 7,518,912 | |
| Education Loan Asset-Backed Trust I Series 2013-1, Class A2(a)
(1M USD LIBOR + 0.800%) |
|
| | 6,750,000 | | | | 2.034 | | | | 04/26/32 | | | | 6,642,998 | |
| Educational Services of America, Inc. Series 2010-1, Class A1(a)
(3M USD LIBOR + 0.850%) |
|
| | 439,312 | | | | 2.006 | | | | 07/25/23 | | | | 439,595 | |
| Educational Services of America, Inc. Series 2015-2, Class A(a)
(1M USD LIBOR + 1.000%) |
|
| | 1,981,899 | | | | 2.234 | | | | 12/25/56 | | | | 1,992,091 | |
| Higher Education Funding I Series 2014-1, Class A(a) (3M USD
LIBOR + 1.050%) |
|
| | 3,363,757 | | | | 2.239 | | | | 05/25/34 | | | | 3,350,290 | |
| Knowledgeworks Foundation Student Loan Series 2010-1,
Class A (3M USD LIBOR + 0.950%) |
|
| | 519,027 | | | | 2.139 | | | | 02/25/42 | | | | 521,672 | |
| Montana Higher Education Student Assistance Corp.
Series 2012-1, Class A3 (1M USD LIBOR + 1.050%) |
|
| | 2,450,000 | | | | 2.281 | | | | 07/20/43 | | | | 2,447,614 | |
| Navient Student Loan Trust Series 2017-2A, Class A(a) (1M USD
LIBOR + 1.050%) |
|
| | 7,679,676 | | | | 2.284 | | | | 12/27/66 | | | | 7,784,597 | |
| | Navient Student Loan Trust Series 2017-5A, Class A(a) | |
| | 8,200,000 | | | | 2.048 | | | | 07/26/66 | | | | 8,199,953 | |
| Nelnet Student Loan Trust Series 2006-1, Class A6(a) (3M USD
LIBOR + 0.450%) |
|
| | 4,300,000 | | | | 1.636 | | | | 08/23/36 | | | | 4,186,106 | |
| Nelnet Student Loan Trust Series 2006-2, Class A5 (3M USD
LIBOR + 0.100%) |
|
| | 1,264,747 | | | | 1.256 | | | | 01/25/30 | | | | 1,263,084 | |
| Nelnet Student Loan Trust Series 2010-3A, Class A(a) (3M USD
LIBOR + 0.780%) |
|
| | 493,341 | | | | 1.936 | | | | 07/27/48 | | | | 498,460 | |
| Nelnet Student Loan Trust Series 2011-1A, Class A(a) (1M USD
LIBOR + 0.850%) |
|
| | 267,040 | | | | 2.084 | | | | 02/25/48 | | | | 268,074 | |
| North Carolina State Education Assistance Authority
Series 2010-1, Class A1 (3M USD LIBOR + 0.900%) |
|
| | 1,720,530 | | | | 2.056 | | | | 07/25/41 | | | | 1,714,475 | |
| | |
| | |
| The accompanying notes are an integral part of these financial statements. | | 69 |
GOLDMAN SACHS GLOBAL INCOME FUND
Schedule of Investments (continued)
September 30, 2017 (Unaudited)
| | | | | | | | | | | | | | |
Principal
Amount | | | Interest
Rate | | | Maturity
Date | | | Value | |
| Asset-Backed Securities – (continued) | |
| Student Loans(c) – (continued) | |
| PHEAA Student Loan Trust Series 2016-1A, Class A(a) (1M USD
LIBOR + 1.150%) |
|
| $ | 3,648,485 | | | | 2.384 | % | | | 09/25/65 | | | $ | 3,713,300 | |
| Scholar Funding Trust Series 2010-A, Class A(a) (3M USD
LIBOR + 0.750%) |
|
| | 880,595 | | | | 1.922 | | | | 10/28/41 | | | | 874,848 | |
| SLC Student Loan Center Series 2011-1, Class A(a) (1M USD
LIBOR + 1.220%) |
|
| | 594,882 | | | | 2.454 | | | | 10/25/27 | | | | 602,921 | |
| SLC Student Loan Trust Series 2006-1, Class A5 (3M USD
LIBOR + 0.110%) |
|
| | 2,205,081 | | | | 1.356 | | | | 03/15/27 | | | | 2,198,352 | |
| SLM Student Loan Trust Series 2004-8A, Class A6(a) (3M USD
LIBOR + 0.630%) |
|
| | 2,100,000 | | | | 1.786 | | | | 01/25/40 | | | | 2,100,617 | |
| SLM Student Loan Trust Series 2005-3, Class A5 (3M USD
LIBOR + 0.090%) |
|
| | 869,906 | | | | 1.246 | | | | 10/25/24 | | | | 868,840 | |
| SLM Student Loan Trust Series 2005-5, Class A5 (3M USD
LIBOR + 0.750%) |
|
| | 900,000 | | | | 1.906 | | | | 10/25/40 | | | | 887,332 | |
| SLM Student Loan Trust Series 2006-5, Class A5 (3M USD
LIBOR + 0.110%) |
|
| | 2,132,110 | | | | 1.266 | | | | 01/25/27 | | | | 2,130,471 | |
| Wachovia Student Loan Trust Series 2006-1, Class A5(a)
(3M USD LIBOR + 0.120%) |
|
| | 1,062,592 | | | | 1.276 | | | | 07/26/27 | | | | 1,061,848 | |
| | | | | | | | | | | | | | |
| | | | | | | | | | | | | 62,766,162 | |
| | |
| | TOTAL ASSET-BACKED SECURITIES | | | | | |
| | (Cost $147,705,152) | | | $ | 149,194,020 | |
| | |
| | | | | | | | | | | | | | |
| Mortgage-Backed Obligations – 14.7% | |
| Collateralized Mortgage Obligations – 1.9% | |
| Interest Only – 1.1% | |
| FHLMC REMIC Series 3852, Class SW(c) (-1x1M LIBOR +
6.000%) |
|
| $ | 656,040 | | | | 4.773 | % | | | 05/15/41 | | | $ | 104,367 | |
| FHLMC REMIC Series 4314, Class SE(c) (-1x1M LIBOR +
6.050%) |
|
| | 494,445 | | | | 4.816 | | | | 03/15/44 | | | | 85,989 | |
| FHLMC REMIC Series 4320, Class SD(c) (-1x1M LIBOR +
6.100%) |
|
| | 391,083 | | | | 4.866 | | | | 07/15/39 | | | | 61,186 | |
| FHLMC REMIC Series 4583, Class ST(c) (-1x1M LIBOR +
6.000%) |
|
| | 1,731,567 | | | | 4.766 | | | | 05/15/46 | | | | 330,347 | |
| | FHLMC STRIPS Series 304, Class C45 | |
| | 463,183 | | | | 3.000 | | | | 12/15/27 | | | | 42,640 | |
| FNMA REMIC Series 2010-126, Class LS(c) (-1x1M LIBOR +
5.000%) |
|
| | 2,138,621 | | | | 3.768 | | | | 11/25/40 | | | | 321,428 | |
| FNMA REMIC Series 2011-124, Class SC(c) (-1x1M LIBOR +
6.550%) |
|
| | 622,752 | | | | 5.316 | | | | 12/25/41 | | | | 114,872 | |
| | |
| Mortgage-Backed Obligations – (continued) | |
| Interest Only – (continued) | |
| FNMA REMIC Series 2012-5, Class SA(c) (-1x1M LIBOR +
5.950%) |
|
| 807,072 | | | | 4.716 | | | | 02/25/42 | | | | 137,669 | |
| FNMA REMIC Series 2013-121, Class SA(c) (-1x1M LIBOR +
6.100%) |
|
| | 828,251 | | | | 4.866 | | | | 12/25/43 | | | | 131,401 | |
| FNMA REMIC Series 2013-130, Class SN(c) (-1x1M LIBOR +
6.650%) |
|
| | 1,707,238 | | | | 5.413 | | | | 10/25/42 | | | | 329,880 | |
| FNMA REMIC Series 2013-96, Class SW (c)(-1x1M LIBOR +
6.100%) |
|
| | 356,350 | | | | 4.866 | | | | 09/25/43 | | | | 57,478 | |
| FNMA REMIC Series 2014-6, Class SA(c) (-1x1M LIBOR +
6.600%) |
|
| | 637,652 | | | | 5.366 | | | | 02/25/44 | | | | 118,068 | |
| FNMA REMIC Series 2014-87, Class MS(c) (-1x1M LIBOR +
6.250%) |
|
| | 1,535,087 | | | | 5.016 | | | | 01/25/45 | | | | 251,667 | |
| FNMA REMIC Series 2015-79, Class SA(c) (-1x1M LIBOR +
6.250%) |
|
| | 572,401 | | | | 5.016 | | | | 11/25/45 | | | | 95,993 | |
| FNMA REMIC Series 2015-81, Class SA(c) (-1x1M LIBOR +
5.700%) |
|
| | 2,718,883 | | | | 4.466 | | | | 11/25/45 | | | | 387,823 | |
| FNMA REMIC Series 2015-82, Class MS(c) (-1x1M LIBOR +
5.700%) |
|
| | 808,322 | | | | 4.466 | | | | 11/25/45 | | | | 117,091 | |
| FNMA REMIC Series 2015-86, Class BS(c) (-1x1M LIBOR +
5.700%) |
|
| | 343,374 | | | | 4.463 | | | | 11/25/45 | | | | 49,016 | |
| FNMA REMIC Series 2016-1, Class SJ(c) (-1x1M LIBOR +
6.150%) |
|
| | 1,552,151 | | | | 4.913 | | | | 02/25/46 | | | | 301,946 | |
| | FNMA REMIC Series 2016-3, Class IP | |
| | 1,372,961 | | | | 4.000 | | | | 02/25/46 | | | | 277,416 | |
| GNMA REMIC Series 2010-101, Class S(c) (-1x1M LIBOR +
6.000%) |
|
| | 1,265,780 | | | | 4.764 | | | | 08/20/40 | | | | 204,634 | |
| GNMA REMIC Series 2010-20, Class SE(c) (-1x1M LIBOR +
6.250%) |
|
| | 939,157 | | | | 5.014 | | | | 02/20/40 | | | | 157,711 | |
| GNMA REMIC Series 2010-31, Class SA(c) (-1x1M LIBOR +
5.750%) |
|
| | 542,311 | | | | 4.514 | | | | 03/20/40 | | | | 80,022 | |
| GNMA REMIC Series 2012-149, Class MS(c) (-1x1M LIBOR +
6.250%) |
|
| | 711,886 | | | | 5.014 | | | | 12/20/42 | | | | 118,915 | |
| GNMA REMIC Series 2013-124, Class CS(c) (-1x1M LIBOR +
6.050%) |
|
| | 986,782 | | | | 4.814 | | | | 08/20/43 | | | | 169,167 | |
| GNMA REMIC Series 2013-134, Class DS(c) (-1x1M LIBOR +
6.100%) |
|
| | 206,396 | | | | 4.864 | | | | 09/20/43 | | | | 33,320 | |
| GNMA REMIC Series 2013-152, Class SG(c) (-1x1M LIBOR +
6.150%) |
|
| | 373,096 | | | | 4.914 | | | | 06/20/43 | | | | 61,202 | |
| | |
| | |
| 70 | | The accompanying notes are an integral part of these financial statements. |
GOLDMAN SACHS GLOBAL INCOME FUND
| | | | | | | | | | | | | | |
Principal
Amount | | | Interest
Rate | | | Maturity
Date | | | Value | |
| Mortgage-Backed Obligations – (continued) | |
| Interest Only – (continued) | |
| GNMA REMIC Series 2013-152, Class TS(c) (-1x1M LIBOR +
6.100%) |
|
| $ | 380,072 | | | | 4.864 | % | | | 06/20/43 | | | $ | 60,220 | |
| GNMA REMIC Series 2013-167, Class SG(c) (-1x1M LIBOR +
6.150%) |
|
| | 188,373 | | | | 4.914 | | | | 11/20/43 | | | | 30,712 | |
| GNMA REMIC Series 2013-181, Class SA(c) (-1x1M LIBOR +
6.100%) |
|
| | 1,191,254 | | | | 4.864 | | | | 11/20/43 | | | | 197,663 | |
| GNMA REMIC Series 2014-117, Class SJ(c) (-1x1M LIBOR +
5.600%) |
|
| | 2,851,575 | | | | 4.364 | | | | 08/20/44 | | | | 428,732 | |
| GNMA REMIC Series 2014-132, Class SL(c) (-1x1M LIBOR +
6.100%) |
|
| | 879,911 | | | | 4.864 | | | | 10/20/43 | | | | 128,178 | |
| GNMA REMIC Series 2014-133, Class BS(c) (-1x1M LIBOR +
5.600%) |
|
| | 430,906 | | | | 4.364 | | | | 09/20/44 | | | | 60,607 | |
| GNMA REMIC Series 2014-158, Class SA(c) (-1x1M LIBOR +
5.600%) |
|
| | 1,322,398 | | | | 4.366 | | | | 10/16/44 | | | | 196,189 | |
| | GNMA REMIC Series 2014-188, Class IB | |
| | 1,032,151 | | | | 4.000 | | | | 12/20/44 | | | | 151,868 | |
| GNMA REMIC Series 2014-41, Class SA(c) (-1x1M LIBOR +
6.100%) |
|
| | 243,457 | | | | 4.864 | | | | 03/20/44 | | | | 40,251 | |
| GNMA REMIC Series 2015-110, Class MS(c) (-1x1M LIBOR +
5.710%) |
|
| | 2,579,531 | | | | 4.474 | | | | 08/20/45 | | | | 374,870 | |
| | GNMA REMIC Series 2015-111, Class IM | |
| | 1,242,154 | | | | 4.000 | | | | 08/20/45 | | | | 195,890 | |
| | GNMA REMIC Series 2015-117, Class KI | |
| | 3,585,687 | | | | 5.000 | | | | 08/20/45 | | | | 753,677 | |
| GNMA REMIC Series 2015-123, Class SP(c) (-1x1M LIBOR +
6.250%) |
|
| | 624,654 | | | | 5.014 | | | | 09/20/45 | | | | 104,258 | |
| GNMA REMIC Series 2015-126, Class HS(c) (-1x1M LIBOR +
6.200%) |
|
| | 955,508 | | | | 4.964 | | | | 09/20/45 | | | | 155,615 | |
| | GNMA REMIC Series 2015-129, Class IC | |
| | 513,182 | | | | 4.500 | | | | 09/16/45 | | | | 91,763 | |
| | GNMA REMIC Series 2015-14, Class IO | |
| | 1,858,637 | | | | 5.000 | | | | 10/20/44 | | | | 392,441 | |
| GNMA REMIC Series 2015-167, Class AS(c) (-1x1M LIBOR +
6.250%) |
|
| | 461,580 | | | | 5.014 | | | | 11/20/45 | | | | 73,640 | |
| GNMA REMIC Series 2015-168, Class SD(c) (-1x1M LIBOR +
6.200%) |
|
| | 290,485 | | | | 4.964 | | | | 11/20/45 | | | | 47,199 | |
| GNMA REMIC Series 2015-57, Class AS(c) (-1x1M LIBOR +
5.600%) |
|
| | 2,039,116 | | | | 4.364 | | | | 04/20/45 | | | | 286,745 | |
| GNMA REMIC Series 2015-64, Class SG(c) (-1x1M LIBOR +
5.600%) |
|
| | 1,483,102 | | | | 4.364 | | | | 05/20/45 | | | | 249,291 | |
| GNMA REMIC Series 2016-1, Class ST(c) (-1x1M LIBOR +
6.200%) |
|
| | 572,557 | | | | 4.964 | | | | 01/20/46 | | | | 93,705 | |
| | |
| Mortgage-Backed Obligations – (continued) | |
| Interest Only – (continued) | |
| | GNMA REMIC Series 2016-138, Class GI | |
| 1,346,739 | | | | 4.000 | | | | 10/20/46 | | | | 216,507 | |
| | GNMA REMIC Series 2016-27, Class IA | |
| | 806,097 | | | | 4.000 | | | | 06/20/45 | | | | 111,859 | |
| GNMA REMIC Series 2016-4, Class SM(c) (-1x1M LIBOR +
5.650%) |
|
| | 862,627 | | | | 4.414 | | | | 01/20/46 | | | | 119,673 | |
| GNMA REMIC Series 2016-6, Class SB(c) (-1x1M LIBOR +
5.650%) |
|
| | 822,478 | | | | 4.414 | | | | 01/20/46 | | | | 116,312 | |
| | | | | | | | | | | | | | |
| | | | | | | | | | | | | 8,819,113 | |
| | |
| Regular Floater(c) – 0.5% | |
| Countrywide Alternative Loan Trust Series 2005-38,
Class A1(12M MTA + 1.500%) |
|
| | 107,595 | | | | 2.330 | | | | 09/25/35 | | | | 105,489 | |
| Countrywide Alternative Loan Trust Series 2006-OA1,
Class 2A1(1M USD LIBOR + 0.210%) |
|
| | 619,149 | | | | 1.441 | | | | 03/20/46 | | | | 534,843 | |
| Mortgage Repurchase Agreement Financing Trust Series 2016-1,
Class A2 (1M USD LIBOR + 0.950%) |
|
| | 850,000 | | | | 2.181 | | | | 04/10/19 | | | | 850,018 | |
| Mortgage Repurchase Agreement Financing Trust Series 2017-1,
Class A1 (1M USD LIBOR + 0.850%) |
|
| | 1,200,000 | | | | 2.081 | | | | 07/10/19 | | | | 1,200,308 | |
| Residential Accredit Loans, Inc. Series 2005-QO5, Class A1
(12M MTA + 1.000%) |
|
| | 801,785 | | | | 1.830 | | | | 01/25/46 | | | | 678,903 | |
| Sequoia Mortgage Trust Series 2004-10, Class A3A (6M USD
LIBOR + 0.660%) |
|
| | 129,717 | | | | 2.058 | | | | 11/20/34 | | | | 129,595 | |
| Station Place Securitization Trust Series 2015-2, Class A
(1M USD LIBOR + 1.050%) |
|
| | 868,778 | | | | 2.279 | | | | 05/15/18 | | | | 868,778 | |
| | | | | | | | | | | | | | |
| | | | | | | | | | | | | 4,367,934 | |
| | |
| Sequential Fixed Rate – 0.2% | |
| | FNMA REMIC Series 2011-52, Class GB | |
| | 599,184 | | | | 5.000 | | | | 06/25/41 | | | | 657,477 | |
| | FNMA REMIC Series 2011-99, Class DB | |
| | 569,130 | | | | 5.000 | | | | 10/25/41 | | | | 623,875 | |
| | FNMA REMIC Series 2012-111, Class B | |
| | 70,032 | | | | 7.000 | | | | 10/25/42 | | | | 80,558 | |
| | FNMA REMIC Series 2012-153, Class B | |
| | 291,777 | | | | 7.000 | | | | 07/25/42 | | | | 338,531 | |
| | | | | | | | | | | | | | |
| | | | | | | | | | | | | 1,700,441 | |
| | |
| Sequential Floating Rate(c) – 0.1% | |
| Countrywide Home Loan Mortgage Pass-Through Trust
Series 2004-HYB5, Class 2A1 |
|
| | 69,541 | | | | 3.483 | | | | 04/20/35 | | | | 72,340 | |
| | Harborview Mortgage Loan Trust Series 2006-6, Class 3A1A | |
| | 620,191 | | | | 3.658 | | | | 08/19/36 | | | | 584,460 | |
| | | | | | | | | | | | | | |
| | | | | | | | | | | | | 656,800 | |
| | |
| TOTAL COLLATERALIZED MORTGAGE
OBLIGATIONS |
| | | 15,544,288 | |
| | |
| | |
| The accompanying notes are an integral part of these financial statements. | | 71 |
GOLDMAN SACHS GLOBAL INCOME FUND
Schedule of Investments (continued)
September 30, 2017 (Unaudited)
| | | | | | | | | | | | | | |
Principal
Amount | | | Interest
Rate | | | Maturity
Date | | | Value | |
| Mortgage-Backed Obligations – (continued) | |
| Federal Agencies – 12.8% | |
| FHLMC – 0.1% | |
| $ | 849 | | | | 5.000 | % | | | 10/01/17 | | | $ | 851 | |
| | 1,652 | | | | 5.000 | | | | 11/01/17 | | | | 1,689 | |
| | 2,311 | | | | 5.000 | | | | 12/01/17 | | | | 2,372 | |
| | 4,756 | | | | 5.000 | | | | 01/01/18 | | | | 4,850 | |
| | 10,801 | | | | 5.000 | | | | 02/01/18 | | | | 10,968 | |
| | 12,307 | | | | 5.000 | | | | 03/01/18 | | | | 12,527 | |
| | 14,438 | | | | 5.000 | | | | 04/01/18 | | | | 14,663 | |
| | 12,323 | | | | 5.000 | | | | 05/01/18 | | | | 12,599 | |
| | 3,875 | | | | 5.000 | | | | 06/01/18 | | | | 3,938 | |
| | 4,266 | | | | 5.000 | | | | 07/01/18 | | | | 4,310 | |
| | 1,296 | | | | 5.000 | | | | 08/01/18 | | | | 1,319 | |
| | 1,306 | | | | 5.000 | | | | 09/01/18 | | | | 1,330 | |
| | 8,050 | | | | 5.000 | | | | 10/01/18 | | | | 8,214 | |
| | 8,629 | | | | 5.000 | | | | 11/01/18 | | | | 8,789 | |
| | 7,202 | | | | 5.000 | | | | 12/01/18 | | | | 7,385 | |
| | 4,008 | | | | 5.000 | | | | 01/01/19 | | | | 4,111 | |
| | 559 | | | | 5.000 | | | | 02/01/19 | | | | 571 | |
| | 1,453 | | | | 5.000 | | | | 03/01/19 | | | | 1,492 | |
| | 3,482 | | | | 5.000 | | | | 01/01/33 | | | | 3,798 | |
| | 590 | | | | 5.000 | | | | 06/01/33 | | | | 645 | |
| | 6,500 | | | | 5.000 | | | | 07/01/33 | | | | 7,113 | |
| | 7,935 | | | | 5.000 | | | | 08/01/33 | | | | 8,684 | |
| | 1,376 | | | | 5.000 | | | | 10/01/33 | | | | 1,506 | |
| | 4,920 | | | | 5.000 | | | | 11/01/33 | | | | 5,384 | |
| | 1,948 | | | | 5.000 | | | | 12/01/33 | | | | 2,131 | |
| | 5,788 | | | | 5.000 | | | | 02/01/34 | | | | 6,334 | |
| | 2,392 | | | | 5.000 | | | | 03/01/34 | | | | 2,618 | |
| | 3,348 | | | | 5.000 | | | | 04/01/34 | | | | 3,664 | |
| | 7,065 | | | | 5.000 | | | | 05/01/34 | | | | 7,732 | |
| | 97,965 | | | | 5.000 | | | | 06/01/34 | | | | 107,203 | |
| | 1,163 | | | | 5.000 | | | | 11/01/34 | | | | 1,272 | |
| | 26,491 | | | | 5.000 | | | | 04/01/35 | | | | 28,988 | |
| | 2,717 | | | | 5.000 | | | | 11/01/35 | | | | 2,973 | |
| | 8,044 | | | | 5.000 | | | | 02/01/37 | | | | 8,914 | |
| | 684 | | | | 5.000 | | | | 11/01/37 | | | | 746 | |
| | 240,168 | | | | 7.000 | | | | 02/01/39 | | | | 279,565 | |
| | 38,466 | | | | 5.000 | | | | 01/01/40 | | | | 42,578 | |
| | 18,044 | | | | 4.000 | | | | 06/01/40 | | | | 19,127 | |
| | 191,979 | | | | 4.000 | | | | 02/01/41 | | | | 203,263 | |
| | 14,111 | | | | 4.000 | | | | 11/01/41 | | | | 14,960 | |
| | | | | | | | | | | | | | |
| | | | | | | | | | | | | 861,176 | |
| | |
| FNMA – 1.3% | |
| | 295 | | | | 5.000 | | | | 04/01/18 | | | | 297 | |
| | 1,469 | | | | 5.000 | | | | 05/01/18 | | | | 1,481 | |
| | 229 | | | | 5.000 | | | | 06/01/18 | | | | 232 | |
| | 277 | | | | 5.000 | | | | 11/01/18 | | | | 280 | |
| | 654 | | | | 5.000 | | | | 03/01/19 | | | | 666 | |
| | 638 | | | | 5.000 | | | | 04/01/19 | | | | 651 | |
| | 2,466 | | | | 5.000 | | | | 08/01/33 | | | | 2,713 | |
| | 1,687 | | | | 5.500 | | | | 02/01/34 | | | | 1,883 | |
| | 3,858 | | | | 5.500 | | | | 05/01/34 | | | | 4,314 | |
| | 1,739 | | | | 5.500 | | | | 10/01/34 | | | | 1,942 | |
| | 12,843 | | | | 5.500 | | | | 12/01/34 | | | | 14,358 | |
| | 3,407 | | | | 5.500 | | | | 04/01/35 | | | | 3,806 | |
| | 2,896 | | | | 5.500 | | | | 07/01/35 | | | | 3,235 | |
| | |
| Mortgage-Backed Obligations – (continued) | |
| FNMA – (continued) | |
| 401,322 | | | | 4.500 | | | | 07/01/36 | | | | 433,115 | |
| | 41,052 | | | | 4.500 | | | | 12/01/36 | | | | 44,292 | |
| | 41,003 | | | | 4.500 | | | | 05/01/38 | | | | 44,141 | |
| | 141,227 | | | | 7.000 | | | | 03/01/39 | | | | 163,645 | |
| | 30,176 | | | | 4.500 | | | | 05/01/39 | | | | 32,947 | |
| | 16,634 | | | | 4.500 | | | | 06/01/39 | | | | 18,162 | |
| | 13,494 | | | | 4.500 | | | | 08/01/39 | | | | 14,734 | |
| | 22,236 | | | | 4.500 | | | | 09/01/39 | | | | 23,999 | |
| | 29,489 | | | | 4.500 | | | | 10/01/39 | | | | 31,828 | |
| | 11,518 | | | | 4.500 | | | | 03/01/40 | | | | 12,431 | |
| | 162,347 | | | | 4.500 | | | | 04/01/40 | | | | 174,902 | |
| | 165,537 | | | | 5.000 | | | | 06/01/40 | | | | 180,966 | |
| | 10,261 | | | | 4.500 | | | | 12/01/40 | | | | 11,054 | |
| | 179,275 | | | | 4.500 | | | | 01/01/41 | | | | 193,701 | |
| | 48,527 | | | | 4.500 | | | | 04/01/41 | | | | 52,401 | |
| | 81,182 | | | | 4.500 | | | | 06/01/41 | | | | 87,577 | |
| | 66,237 | | | | 4.500 | | | | 07/01/41 | | | | 71,484 | |
| | 59,993 | | | | 5.000 | | | | 07/01/41 | | | | 65,818 | |
| | 107,941 | | | | 4.500 | | | | 08/01/41 | | | | 116,593 | |
| | 304,626 | | | | 4.500 | | | | 09/01/41 | | | | 329,129 | |
| | 243,761 | | | | 4.500 | | | | 10/01/41 | | | | 263,072 | |
| | 207,340 | | | | 4.500 | | | | 11/01/41 | | | | 223,766 | |
| | 108,472 | | | | 4.500 | | | | 12/01/41 | | | | 117,018 | |
| | 136,041 | | | | 4.500 | | | | 01/01/42 | | | | 146,764 | |
| | 27,727 | | | | 4.500 | | | | 03/01/42 | | | | 29,915 | |
| | 57,534 | | | | 4.500 | | | | 04/01/42 | | | | 61,917 | |
| | 122,286 | | | | 3.000 | | | | 12/01/42 | | | | 123,738 | |
| | 309,325 | | | | 3.000 | | | | 01/01/43 | | | | 312,997 | |
| | 368,936 | | | | 3.000 | | | | 04/01/43 | | | | 373,434 | |
| | 291,738 | | | | 3.500 | | | | 07/01/43 | | | | 302,127 | |
| | 450,418 | | | | 3.500 | | | | 08/01/43 | | | | 466,457 | |
| | 3,411,908 | | | | 3.500 | | | | 08/01/45 | | | | 3,544,386 | |
| | 2,000,000 | | | | 3.500 | | | | TBA-30yr | (e) | | | 2,061,719 | |
| | | | | | | | | | | | | | |
| | | | | | | | | | | | | 10,166,087 | |
| | |
| GNMA – 11.4% | |
| | 8,102,811 | | | | 4.000 | | | | 10/20/43 | | | | 8,599,109 | |
| | 802,233 | | | | 4.000 | | | | 11/20/44 | | | | 850,868 | |
| | 76,658 | | | | 4.000 | | | | 05/20/45 | | | | 81,282 | |
| | 3,672,176 | | | | 4.000 | | | | 07/20/45 | | | | 3,893,654 | |
| | 2,882,735 | | | | 4.000 | | | | 08/20/45 | | | | 3,053,897 | |
| | 2,802,933 | | | | 4.000 | | | | 09/20/45 | | | | 2,969,357 | |
| | 4,608,324 | | | | 4.000 | | | | 10/20/45 | | | | 4,881,943 | |
| | 1,182,905 | | | | 4.000 | | | | 11/20/45 | | | | 1,253,140 | |
| | 6,975,960 | | | | 4.000 | | | | 01/20/46 | | | | 7,381,438 | |
| | 3,726,006 | | | | 4.000 | | | | 02/20/46 | | | | 3,942,580 | |
| | 62,301 | | | | 4.000 | | | | 03/20/46 | | | | 65,922 | |
| | 4,783,876 | | | | 4.000 | | | | 04/20/46 | | | | 5,061,939 | |
| | 812,303 | | | | 4.000 | | | | 05/20/46 | | | | 859,518 | |
| | 7,672,713 | | | | 4.000 | | | | 05/20/47 | | | | 8,095,910 | |
| | 18,780,410 | | | | 4.000 | | | | 06/20/47 | | | | 19,828,004 | |
| | 8,952,928 | | | | 4.000 | | | | 07/20/47 | | | | 9,443,437 | |
| | 3,991,139 | | | | 4.000 | | | | 08/20/47 | | | | 4,220,006 | |
| | 6,000,000 | | | | 4.000 | | | | 09/20/47 | | | | 6,328,726 | |
| | |
| | |
| 72 | | The accompanying notes are an integral part of these financial statements. |
GOLDMAN SACHS GLOBAL INCOME FUND
| | | | | | | | | | | | | | |
Principal
Amount | | | Interest
Rate | | | Maturity
Date | | | Value | |
| Mortgage-Backed Obligations – (continued) | |
| GNMA – (continued) | |
| $ | 1,000,000 | | | | 4.000 | % | | | TBA-30yr | (e) | | $ | 1,052,148 | |
| | | | | | | | | | | | | | |
| | | | | | | | | | | | | 91,862,878 | |
| | |
| | TOTAL FEDERAL AGENCIES | | | $ | 102,890,141 | |
| | |
| | TOTAL MORTGAGE-BACKED OBLIGATIONS | |
| | (Cost $118,634,869) | | | $ | 118,434,429 | |
| | |
| | | | | | | | | | | | | | |
| Agency Debentures – 0.8% | |
| | Canada Housing Trust No. 1(a)(d) | |
| CAD | 5,200,000 | | | | 2.350 | % | | | 12/15/18 | | | $ | 4,208,260 | |
| | FHLMC | |
| $ | 1,800,000 | | | | 6.750 | | | | 03/15/31 | | | | 2,588,994 | |
| | |
| | TOTAL AGENCY DEBENTURES | |
| | (Cost $6,736,740) | | | $ | 6,797,254 | |
| | |
| | | | | | | | | | | | | | |
| Municipal Debt Obligation(b)(c) – 0.3% | |
| Ohio – 0.3% | |
| New Hampshire Higher Education Loan Corp. Series 2011-1,
Class A3 (3M USD LIBOR + 0.850%) |
|
| $ | 2,900,000 | | | | 2.164 | % | | | 10/25/37 | | | $ | 2,836,607 | |
| | |
| | | | | | | | | | | | | | |
| Government Guarantee Obligations(d) – 3.5% | |
| | Kreditanstalt fuer Wiederaufbau | |
| EUR | 11,300,000 | | | | 1.625 | % | | | 01/15/21 | | | $ | 14,226,385 | |
| | 3,100,000 | | | | 3.500 | | | | 07/04/21 | | | | 4,184,786 | |
| EUR | 7,300,000 | | | | 2.500 | | | | 01/17/22 | | | | 9,628,965 | |
| | |
| | TOTAL GOVERNMENT GUARANTEE OBLIGATIONS | |
| | (Cost $27,938,826) | | | $ | 28,040,136 | |
| | |
| | | | | | | | | | | | | | |
| U.S. Treasury Obligations – 2.3% | |
| | United States Treasury Inflation Indexed Bonds | |
| $ | 1,139,388 | | | | 0.125 | % | | | 04/15/20 | | | $ | 1,145,347 | |
| | 5,009,323 | | | | 0.125 | (f) | | | 04/15/21 | | | | 5,025,603 | |
| | 7,564,155 | | | | 0.625 | (f) | | | 01/15/24 | | | | 7,728,297 | |
| | 1,288,675 | | | | 0.125 | (f) | | | 07/15/24 | | | | 1,276,484 | |
| | 2,678,572 | | | | 0.625 | | | | 01/15/26 | | | | 2,716,072 | |
| | 888,479 | | | | 0.125 | | | | 07/15/26 | | | | 864,517 | |
| | |
| | TOTAL U.S. TREASURY OBLIGATIONS | | | | | |
| | (Cost $18,781,999) | | | $ | 18,756,320 | |
| | |
| Shares | | | Distribution Rate | | | Value | |
| | Investment Company(g) – 1.9% | |
| Goldman Sachs Financial Square Government Fund –
Institutional Shares |
|
| | 15,556,003 | | | | 0.927 | % | | $ | 15,556,003 | |
| | (Cost $15,556,003) | | | | | |
| | |
| | TOTAL INVESTMENTS — 95.9% | |
| | (Cost $763,819,560) | | | $ | 774,701,270 | |
| | |
| OTHER ASSETS IN EXCESS OF
LIABILITIES — 4.1% |
| | | 32,732,816 | |
| | |
| | NET ASSETS — 100.0% | | | $ | 807,434,086 | |
| | |
| | |
| The percentage shown for each investment category reflects the value of investments in that category as a percentage of net assets. |
(a) | | Exempt from registration under Rule 144A of the Securities Act of 1933. Such securities may be deemed liquid by the investment adviser and may be resold, normally to qualified institutional buyers in transactions exempt from registration. Total market value of Rule 144A securities amounts to $200,774,099, which represents approximately 24.9% of net assets as of September 30, 2017 and are unaudited. |
(b) | | Security with “Call” features with resetting interest rates. Maturity dates disclosed are the final maturity dates. |
(c) | | Variable rate security. Interest rate disclosed is that which is in effect on September 30, 2017. |
(d) | | Guaranteed by a foreign government until maturity to $63,890,884, which represents approximately 7.9% of net assets as of September 30, 2017. |
(e) | | TBA (To Be Announced) Securities are purchased on a forward commitment basis with an approximate principal amount and no defined maturity date. The actual principal and maturity date will be determined upon settlement when the specific mortgage pools are assigned. Total market value of TBA securities (excluding forward sales contracts, if any) amounts to $3,113,867 which represents approximately 0.4% of net assets as of September 30, 2017. |
(f) | | All or a portion of security is segregated as collateral for initial margin requirement on futures transactions. |
(g) | | Represents an Affiliated Issuer. |
| | |
| The accompanying notes are an integral part of these financial statements. | | 73 |
GOLDMAN SACHS GLOBAL INCOME FUND
Schedule of Investments (continued)
September 30, 2017 (Unaudited)
| | |
|
Currency Abbreviations: |
ARS | | —Argentine Peso |
AUD | | —Australian Dollar |
BRL | | —Brazilian Real |
CAD | | —Canadian Dollar |
CHF | | —Swiss Franc |
CLP | | —Chilean Peso |
CNH | | —Chinese Yuan Renminbi Offshore |
CNY | | —Chinese Yuan Renminbi |
COP | | —Colombian Peso |
CZK | | —Czech Koruna |
DKK | | —Danish Krone |
EUR | | —Euro |
GBP | | —British Pound |
HKD | | —Hong Kong Dollar |
HUF | | —Hungarian Forint |
IDR | | —Indonesian Rupiah |
INR | | —Indian Rupee |
JPY | | —Japanese Yen |
KRW | | —South Korean Won |
MXN | | —Mexican Peso |
NOK | | —Norwegian Krone |
NZD | | —New Zealand Dollar |
PEN | | —Peruvian Nuevo Sol |
PHP | | —Philippine Peso |
PLN | | —Polish Zloty |
RUB | | —Russian Ruble |
SEK | | —Swedish Krona |
SGD | | —Singapore Dollar |
THB | | —Thai Baht |
TRY | | —Turkish Lira |
TWD | | —Taiwan Dollar |
USD | | —U.S. Dollar |
ZAR | | —South African Rand |
|
| | |
|
Investment Abbreviations: |
AUDOR | | —Australian Dollar Offered Rate |
BP | | —British Pound Offered Rate |
CDOR | | —Canadian Dollar Offered Rate |
CHFOR | | —Swiss Franc Offered Rate |
CLO | | —Collateralized Loan Obligation |
CPI | | —Consumer Price Index |
EURO | | —Euro Offered Rate |
FHLMC | | —Federal Home Loan Mortgage Corp. |
FNMA | | —Federal National Mortgage Association |
GMAC | | —General Motors Acceptance Corporation |
GNMA | | —Government National Mortgage Association |
JYOR | | —Japanese Yen Offered Rate |
KWCDC | | —South Korean Won Certificate of Deposit |
LIBOR | | —London Interbank Offered Rate |
LLC | | —Limited Liability Company |
LP | | —Limited Partnership |
NIBOR | | —Norwegian Interbank Offered Rate |
NZDOR | | —New Zealand Dollar Offered Rate |
OTC | | —Over the Counter |
PLC | | —Public Limited Company |
REMIC | | —Real Estate Mortgage Investment Conduit |
STIBOR | | —Stockholm Interbank Offered Rate |
STRIPS | | —Separate Trading of Registered Interest and Principal of Securities |
TIIE | | —La Tasa de Interbank Equilibrium Interest Rate |
|
|
| ADDITIONAL INVESTMENT INFORMATION |
FORWARD FOREIGN CURRENCY EXCHANGE CONTRACTS — At September 30, 2017, the Fund had the following forward foreign currency exchange contracts:
FORWARD FOREIGN CURRENCY EXCHANGE CONTRACTS WITH UNREALIZED GAIN
| | | | | | | | | | | | | | | | | | | | | | | | |
| Counterparty | | Currency
Purchased | | | Currency
Sold | | | Current
Value | | | Settlement
Date | | | Unrealized
Gain | |
Morgan Stanley & Co. International PLC | | ARS | | | 10,006,832 | | | USD | | | 569,000 | | | $ | 576,397 | | | | 10/05/17 | | | $ | 7,397 | |
| | ARS | | | 15,609,699 | | | USD | | | 892,136 | | | | 898,606 | | | | 10/06/17 | | | | 6,470 | |
| | ARS | | | 20,484,637 | | | USD | | | 1,141,515 | | | | 1,176,535 | | | | 10/10/17 | | | | 35,020 | |
| | ARS | | | 3,652,261 | | | USD | | | 209,059 | | | | 209,647 | | | | 10/11/17 | | | | 588 | |
| | ARS | | | 1,742,383 | | | USD | | | 99,650 | | | | 99,959 | | | | 10/12/17 | | | | 309 | |
| | ARS | | | 16,026,596 | | | USD | | | 898,525 | | | | 913,665 | | | | 10/23/17 | | | | 15,140 | |
| | ARS | | | 8,738,720 | | | USD | | | 497,564 | | | | 497,621 | | | | 10/25/17 | | | | 57 | |
| | ARS | | | 6,764,887 | | | USD | | | 377,908 | | | | 384,129 | | | | 10/30/17 | | | | 6,220 | |
| | ARS | | | 13,098,424 | | | USD | | | 728,905 | | | | 743,356 | | | | 11/01/17 | | | | 14,451 | |
| | ARS | | | 7,137,441 | | | USD | | | 400,389 | | | | 404,839 | | | | 11/02/17 | | | | 4,449 | |
| | ARS | | | 9,661,739 | | | USD | | | 543,008 | | | | 546,520 | | | | 11/07/17 | | | | 3,512 | |
| | ARS | | | 9,192,045 | | | USD | | | 517,862 | | | | 519,667 | | | | 11/08/17 | | | | 1,805 | |
| | ARS | | | 16,234,141 | | | USD | | | 912,419 | | | | 915,287 | | | | 11/13/17 | | | | 2,868 | |
| | ARS | | | 6,216,028 | | | USD | | | 348,823 | | | | 349,700 | | | | 11/17/17 | | | | 877 | |
| | ARS | | | 5,532,135 | | | USD | | | 306,744 | | | | 310,045 | | | | 11/24/17 | | | | 3,301 | |
| | AUD | | | 1,777,174 | | | USD | | | 1,389,783 | | | | 1,392,688 | | | | 12/20/17 | | | | 2,904 | |
| | BRL | | | 16,871,642 | | | USD | | | 5,293,996 | | | | 5,324,696 | | | | 10/03/17 | | | | 30,701 | |
| | |
| 74 | | The accompanying notes are an integral part of these financial statements. |
GOLDMAN SACHS GLOBAL INCOME FUND
|
| ADDITIONAL INVESTMENT INFORMATION (continued) |
FORWARD FOREIGN CURRENCY EXCHANGE CONTRACTS WITH UNREALIZED GAIN (continued)
| | | | | | | | | | | | | | | | | | | | | | | | |
| Counterparty | | Currency
Purchased | | | Currency
Sold | | | Current
Value | | | Settlement
Date | | | Unrealized
Gain | |
Morgan Stanley & Co. International PLC (continued) | | BRL | | | 25,700,505 | | | USD | | | 8,016,646 | | | $ | 8,076,244 | | | | 11/03/17 | | | $ | 59,598 | |
| | CAD | | | 269,749 | | | AUD | | | 273,000 | | | | 216,301 | | | | 12/20/17 | | | | 2,364 | |
| | CAD | | | 294,314 | | | USD | | | 235,966 | | | | 236,000 | | | | 12/20/17 | | | | 34 | |
| | CHF | | | 3,186,806 | | | EUR | | | 2,769,239 | | | | 3,309,466 | | | | 12/20/17 | | | | 21,383 | |
| | CNH | | | 14,004,197 | | | USD | | | 2,091,292 | | | | 2,096,678 | | | | 12/20/17 | | | | 5,387 | |
| | CZK | | | 49,745,156 | | | EUR | | | 1,865,131 | | | | 2,263,252 | | | | 10/03/17 | | | | 58,493 | |
| | CZK | | | 27,635,121 | | | EUR | | | 1,035,000 | | | | 1,259,746 | | | | 11/09/17 | | | | 33,863 | |
| | CZK | | | 46,761,216 | | | EUR | | | 1,748,029 | | | | 2,133,009 | | | | 11/21/17 | | | | 61,245 | |
| | CZK | | | 63,432,017 | | | EUR | | | 2,423,177 | | | | 2,893,605 | | | | 11/22/17 | | | | 21,499 | |
| | CZK | | | 192,090,094 | | | EUR | | | 7,382,504 | | | | 8,786,632 | | | | 12/20/17 | | | | 20,947 | |
| | CZK | | | 81,258,435 | | | EUR | | | 3,046,034 | | | | 3,721,877 | | | | 01/03/18 | | | | 102,093 | |
| | EUR | | | 465,000 | | | CHF | | | 530,774 | | | | 552,122 | | | | 12/20/17 | | | | 919 | |
| | EUR | | | 237,282 | | | GBP | | | 209,387 | | | | 281,739 | | | | 12/20/17 | | | | 447 | |
| | EUR | | | 460,000 | | | HUF | | | 142,626,133 | | | | 546,185 | | | | 12/20/17 | | | | 3,149 | |
| | EUR | | | 1,849,000 | | | NOK | | | 17,234,263 | | | | 2,195,427 | | | | 12/20/17 | | | | 27,446 | |
| | EUR | | | 653,941 | | | PLN | | | 2,808,587 | | | | 776,463 | | | | 12/20/17 | | | | 6,595 | |
| | EUR | | | 1,164,000 | | | SEK | | | 11,069,654 | | | | 1,382,086 | | | | 12/20/17 | | | | 16,342 | |
| | EUR | | | 12,842,784 | | | USD | | | 15,146,336 | | | | 15,188,854 | | | | 10/12/17 | | | | 42,519 | |
| | EUR | | | 3,691,972 | | | USD | | | 4,366,406 | | | | 4,383,698 | | | | 12/20/17 | | | | 17,293 | |
| | GBP | | | 1,667,359 | | | EUR | | | 1,861,720 | | | | 2,239,945 | | | | 12/20/17 | | | | 29,415 | |
| | GBP | | | 406,000 | | | JPY | | | 61,011,650 | | | | 545,424 | | | | 12/20/17 | | | | 988 | |
| | GBP | | | 1,705,525 | | | USD | | | 2,271,281 | | | | 2,291,218 | | | | 12/20/17 | | | | 19,937 | |
| | HKD | | | 11,974,529 | | | USD | | | 1,532,649 | | | | 1,533,028 | | | | 10/03/17 | | | | 379 | |
| | HKD | | | 17,753,801 | | | USD | | | 2,280,000 | | | | 2,281,912 | | | | 03/27/18 | | | | 1,912 | |
| | IDR | | | 15,147,201,993 | | | USD | | | 1,114,135 | | | | 1,121,402 | | | | 11/02/17 | | | | 7,267 | |
| | IDR | | | 23,145,830,236 | | | USD | | | 1,695,665 | | | | 1,704,427 | | | | 12/20/17 | | | | 8,761 | |
| | IDR | | | 15,825,653,129 | | | USD | | | 1,156,423 | | | | 1,165,240 | | | | 12/21/17 | | | | 8,817 | |
| | INR | | | 21,549,010 | | | USD | | | 328,000 | | | | 328,286 | | | | 11/03/17 | | | | 286 | |
| | INR | | | 76,033,314 | | | USD | | | 1,147,292 | | | | 1,149,466 | | | | 01/12/18 | | | | 2,174 | |
| | JPY | | | 61,436,349 | | | EUR | | | 458,000 | | | | 548,226 | | | | 12/20/17 | | | | 4,415 | |
| | JPY | | | 522,011,238 | | | USD | | | 4,656,353 | | | | 4,658,153 | | | | 12/20/17 | | | | 1,800 | |
| | KRW | | | 595,891,659 | | | USD | | | 520,429 | | | | 520,467 | | | | 10/12/17 | | | | 38 | |
| | KRW | | | 118,133,937 | | | USD | | | 103,170 | | | | 103,189 | | | | 10/25/17 | | | | 19 | |
| | NZD | | | 1,470,935 | | | USD | | | 1,059,562 | | | | 1,060,775 | | | | 12/20/17 | | | | 1,214 | |
| | PHP | | | 60,703,641 | | | USD | | | 1,183,369 | | | | 1,193,279 | | | | 10/05/17 | | | | 9,909 | |
| | PHP | | | 48,086,850 | | | USD | | | 938,492 | | | | 944,538 | | | | 10/10/17 | | | | 6,046 | |
| | PHP | | | 29,571,514 | | | USD | | | 579,039 | | | | 580,497 | | | | 10/19/17 | | | | 1,458 | |
| | PHP | | | 96,974,239 | | | USD | | | 1,890,705 | | | | 1,900,114 | | | | 11/14/17 | | | | 9,410 | |
| | PLN | | | 2,014,295 | | | EUR | | | 465,000 | | | | 552,143 | | | | 12/20/17 | | | | 21 | |
| | PLN | | | 1,488,497 | | | HUF | | | 106,749,937 | | | | 408,015 | | | | 12/20/17 | | | | 1,575 | |
| | RUB | | | 180,534,291 | | | USD | | | 3,072,000 | | | | 3,089,968 | | | | 12/14/17 | | | | 17,968 | |
| | SEK | | | 11,824,663 | | | EUR | | | 1,225,471 | | | | 1,458,896 | | | | 12/20/17 | | | | 3,822 | |
| | SGD | | | 295,791 | | | USD | | | 218,000 | | | | 218,261 | | | | 12/20/17 | | | | 261 | |
| | TRY | | | 3,998,713 | | | USD | | | 1,091,575 | | | | 1,096,072 | | | | 12/20/17 | | | | 4,497 | |
| | TWD | | | 34,231,352 | | | USD | | | 1,121,200 | | | | 1,127,496 | | | | 10/20/17 | | | | 6,296 | |
| | TWD | | | 21,773,182 | | | USD | | | 716,345 | | | | 717,368 | | | | 10/26/17 | | | | 1,023 | |
| | USD | | | 576,763 | | | ARS | | | 10,006,832 | | | | 576,397 | | | | 10/05/17 | | | | 365 | |
| | USD | | | 2,853,215 | | | AUD | | | 3,566,519 | | | | 2,796,215 | | | | 11/08/17 | | | | 57,001 | |
| | USD | | | 12,856,065 | | | AUD | | | 16,078,916 | | | | 12,600,295 | | | | 12/20/17 | | | | 255,770 | |
| | USD | | | 2,234,000 | | | BRL | | | 7,024,006 | | | | 2,216,779 | | | | 10/03/17 | | | | 17,221 | |
| | USD | | | 256,217 | | | BRL | | | 814,899 | | | | 256,078 | | | | 11/03/17 | | | | 140 | |
| | |
| The accompanying notes are an integral part of these financial statements. | | 75 |
GOLDMAN SACHS GLOBAL INCOME FUND
Schedule of Investments (continued)
September 30, 2017 (Unaudited)
|
| ADDITIONAL INVESTMENT INFORMATION (continued) |
FORWARD FOREIGN CURRENCY EXCHANGE CONTRACTS WITH UNREALIZED GAIN (continued)
| | | | | | | | | | | | | | | | | | | | | | | | |
| Counterparty | | Currency
Purchased | | | Currency
Sold | | | Current
Value | | | Settlement
Date | | | Unrealized
Gain | |
Morgan Stanley & Co. International PLC (continued) | | USD | | | 16,360,706 | | | CAD | | | 19,912,697 | | | $ | 15,962,875 | | | | 11/06/17 | | | $ | 397,831 | |
| | USD | | | 6,283,084 | | | CAD | | | 7,751,865 | | | | 6,215,930 | | | | 12/20/17 | | | | 67,156 | |
| | USD | | | 548,000 | | | CHF | | | 524,562 | | | | 544,752 | | | | 12/20/17 | | | | 3,248 | |
| | USD | | | 570,000 | | | CLP | | | 352,187,610 | | | | 550,137 | | | | 10/12/17 | | | | 19,863 | |
| | USD | | | 543,919 | | | CLP | | | 340,375,801 | | | | 531,636 | | | | 10/16/17 | | | | 12,283 | |
| | USD | | | 3,387,556 | | | CNH | | | 22,528,777 | | | | 3,372,958 | | | | 12/20/17 | | | | 14,598 | |
| | USD | | | 253,664 | | | CNY | | | 1,690,773 | | | | 253,662 | | | | 11/10/17 | | | | 3 | |
| | USD | | | 548,000 | | | COP | | | 1,602,138,280 | | | | 543,725 | | | | 10/25/17 | | | | 4,275 | |
| | USD | | | 702,550 | | | DKK | | | 4,414,000 | | | | 701,795 | | | | 10/18/17 | | | | 754 | |
| | USD | | | 17,911,865 | | | EUR | | | 14,892,475 | | | | 17,612,975 | | | | 10/12/17 | | | | 298,890 | |
| | USD | | | 21,601,866 | | | EUR | | | 17,996,893 | | | | 21,368,777 | | | | 12/20/17 | | | | 233,088 | |
| | USD | | | 2,666,484 | | | GBP | | | 1,974,775 | | | | 2,652,932 | | | | 12/20/17 | | | | 13,553 | |
| | USD | | | 2,821,694 | | | HKD | | | 21,861,360 | | | | 2,798,781 | | | | 10/03/17 | | | | 22,914 | |
| | USD | | | 2,169,000 | | | HKD | | | 16,803,460 | | | | 2,151,652 | | | | 10/10/17 | | | | 17,348 | |
| | USD | | | 7,491,626 | | | HKD | | | 57,955,207 | | | | 7,449,038 | | | | 03/27/18 | | | | 42,588 | |
| | USD | | | 2,253,000 | | | HKD | | | 17,452,110 | | | | 2,244,829 | | | | 05/11/18 | | | | 8,171 | |
| | USD | | | 2,740,000 | | | HKD | | | 21,257,294 | | | | 2,739,024 | | | | 09/19/18 | | | | 976 | |
| | USD | | | 1,288,935 | | | IDR | | | 17,046,274,803 | | | | 1,264,464 | | | | 10/10/17 | | | | 24,471 | |
| | USD | | | 1,223,443 | | | IDR | | | 16,441,850,000 | | | | 1,218,992 | | | | 10/16/17 | | | | 4,450 | |
| | USD | | | 1,644,000 | | | IDR | | | 21,845,833,680 | | | | 1,619,360 | | | | 10/18/17 | | | | 24,640 | |
| | USD | | | 557,716 | | | INR | | | 36,446,726 | | | | 557,362 | | | | 10/05/17 | | | | 353 | |
| | USD | | | 1,254,162 | | | INR | | | 80,320,318 | | | | 1,227,275 | | | | 10/10/17 | | | | 26,888 | |
| | USD | | | 4,427,042 | | | INR | | | 284,446,549 | | | | 4,341,658 | | | | 10/18/17 | | | | 85,384 | |
| | USD | | | 1,086,366 | | | INR | | | 70,563,652 | | | | 1,076,051 | | | | 10/25/17 | | | | 10,315 | |
| | USD | | | 193,166,535 | | | JPY | | | 20,984,356,812 | | | | 186,720,991 | | | | 10/25/17 | | | | 6,445,545 | |
| | USD | | | 2,579,669 | | | JPY | | | 284,328,233 | | | | 2,537,196 | | | | 12/20/17 | | | | 42,473 | |
| | USD | | | 1,834,189 | | | KRW | | | 2,091,893,023 | | | | 1,826,605 | | | | 10/02/17 | | | | 7,585 | |
| | USD | | | 3,388,086 | | | KRW | | | 3,866,660,319 | | | | 3,377,201 | | | | 10/10/17 | | | | 10,886 | |
| | USD | | | 2,265,104 | | | KRW | | | 2,561,573,666 | | | | 2,237,344 | | | | 10/12/17 | | | | 27,760 | |
| | USD | | | 761,737 | | | KRW | | | 863,208,018 | | | | 754,004 | | | | 10/25/17 | | | | 7,733 | |
| | USD | | | 3,858,857 | | | KRW | | | 4,347,210,143 | | | | 3,797,796 | | | | 11/10/17 | | | | 61,062 | |
| | USD | | | 4,595,556 | | | KRW | | | 5,182,592,289 | | | | 4,528,233 | | | | 11/22/17 | | | | 67,323 | |
| | USD | | | 3,107,263 | | | MXN | | | 55,728,134 | | | | 3,057,131 | | | | 10/06/17 | | | | 50,132 | |
| | USD | | | 4,365,517 | | | MXN | | | 78,816,981 | | | | 4,272,389 | | | | 12/20/17 | | | | 93,127 | |
| | USD | | | 3,070,200 | | | NZD | | | 4,226,000 | | | | 3,047,609 | | | | 12/20/17 | | | | 22,591 | |
| | USD | | | 505,634 | | | PHP | | | 25,715,844 | | | | 505,119 | | | | 10/10/17 | | | | 515 | |
| | USD | | | 1,096,000 | | | PHP | | | 55,626,712 | | | | 1,091,446 | | | | 10/26/17 | | | | 4,554 | |
| | USD | | | 218,000 | | | PHP | | | 11,094,979 | | | | 217,600 | | | | 11/02/17 | | | | 400 | |
| | USD | | | 2,620,002 | | | RUB | | | 152,573,681 | | | | 2,611,403 | | | | 12/14/17 | | | | 8,599 | |
| | USD | | | 3,124,785 | | | SEK | | | 24,844,224 | | | | 3,053,571 | | | | 10/19/17 | | | | 71,213 | |
| | USD | | | 2,880,229 | | | SGD | | | 3,870,103 | | | | 2,855,701 | | | | 12/20/17 | | | | 24,528 | |
| | USD | | | 548,000 | | | THB | | | 18,260,768 | | | | 547,587 | | | | 10/11/17 | | | | 413 | |
| | USD | | | 3,783,952 | | | THB | | | 125,736,957 | | | | 3,770,900 | | | | 10/19/17 | | | | 13,053 | |
| | USD | | | 4,477,435 | | | TRY | | | 16,090,808 | | | | 4,410,591 | | | | 12/20/17 | | | | 66,845 | |
| | USD | | | 1,469,810 | | | TWD | | | 43,903,759 | | | | 1,447,059 | | | | 10/02/17 | | | | 22,752 | |
| | USD | | | 219,000 | | | TWD | | | 6,566,715 | | | | 216,281 | | | | 10/19/17 | | | | 2,719 | |
| | USD | | | 8,217,481 | | | TWD | | | 247,725,828 | | | | 8,159,478 | | | | 10/20/17 | | | | 58,003 | |
| | USD | | | 2,924,135 | | | TWD | | | 88,101,377 | | | | 2,902,273 | | | | 10/23/17 | | | | 21,862 | |
| | USD | | | 1,782,862 | | | TWD | | | 53,851,361 | | | | 1,774,257 | | | | 10/26/17 | | | | 8,605 | |
| | USD | | | 263,190 | | | TWD | | | 7,977,556 | | | | 262,891 | | | | 10/31/17 | | | | 299 | |
| | USD | | | 5,327,426 | | | TWD | | | 159,219,137 | | | | 5,249,790 | | | | 11/10/17 | | | | 77,636 | |
| | |
| 76 | | The accompanying notes are an integral part of these financial statements. |
GOLDMAN SACHS GLOBAL INCOME FUND
|
| ADDITIONAL INVESTMENT INFORMATION (continued) |
FORWARD FOREIGN CURRENCY EXCHANGE CONTRACTS WITH UNREALIZED GAIN (continued)
| | | | | | | | | | | | | | | | | | | | | | | | |
| Counterparty | | Currency
Purchased | | | Currency
Sold | | | Current
Value | | | Settlement
Date | | | Unrealized
Gain | |
Morgan Stanley & Co. International PLC (continued) | | USD | | | 5,614,236 | | | ZAR | | | 75,498,558 | | | $ | 5,535,856 | | | | 11/14/17 | | | $ | 78,380 | |
| | USD | | | 253,890 | | | ZAR | | | 3,479,385 | | | | 253,662 | | | | 12/20/17 | | | | 226 | |
| | | ZAR | | | 22,617,322 | | | USD | | | 1,643,000 | | | | 1,648,897 | | | | 12/20/17 | | | | 5,894 | |
| TOTAL | | | | | | | | | | | | | | | | | | | | | | $ | 9,754,643 | |
FORWARD FOREIGN CURRENCY EXCHANGE CONTRACTS WITH UNREALIZED LOSS
| | | | | | | | | | | | | | | | | | | | | | | | |
| Counterparty | | Currency
Purchased | | | Currency
Sold | | | Current
Value | | | Settlement
Date | | | Unrealized
Loss | |
Morgan Stanley & Co. International PLC | | ARS | | | 10,006,832 | | | USD | | | 568,086 | | | $ | 567,281 | | | | 11/03/17 | | | $ | (805 | ) |
| | ARS | | | 24,704,882 | | | USD | | | 1,402,846 | | | | 1,386,824 | | | | 11/21/17 | | | | (16,022 | ) |
| | AUD | | | 685,000 | | | NZD | | | 753,616 | | | | 536,802 | | | | 12/20/17 | | | | (6,673 | ) |
| | AUD | | | 10,040,873 | | | USD | | | 7,963,078 | | | | 7,868,562 | | | | 12/20/17 | | | | (94,518 | ) |
| | BRL | | | 17,818,534 | | | USD | | | 5,678,720 | | | | 5,623,536 | | | | 10/03/17 | | | | (55,184 | ) |
| | BRL | | | 3,721,693 | | | USD | | | 1,164,849 | | | | 1,164,691 | | | | 12/04/17 | | | | (158 | ) |
| | CAD | | | 10,291,863 | | | USD | | | 8,419,347 | | | | 8,252,659 | | | | 12/20/17 | | | | (166,688 | ) |
| | CNH | | | 28,993,616 | | | USD | | | 4,389,687 | | | | 4,340,860 | | | | 12/20/17 | | | | (48,827 | ) |
| | CNY | | | 7,289,675 | | | USD | | | 1,105,125 | | | | 1,094,928 | | | | 10/26/17 | | | | (10,197 | ) |
| | CNY | | | 9,385,302 | | | USD | | | 1,416,115 | | | | 1,404,656 | | | | 12/14/17 | | | | (11,459 | ) |
| | COP | | | 2,742,245,744 | | | USD | | | 942,774 | | | | 930,649 | | | | 10/25/17 | | | | (12,125 | ) |
| | EUR | | | 2,712,233 | | | CHF | | | 3,118,597 | | | | 3,220,395 | | | | 12/20/17 | | | | (18,236 | ) |
| | EUR | | | 1,911,805 | | | CZK | | | 49,745,156 | | | | 2,259,931 | | | | 10/03/17 | | | | (3,320 | ) |
| | EUR | | | 772,080 | | | CZK | | | 20,705,777 | | | | 917,509 | | | | 01/03/18 | | | | (30,878 | ) |
| | EUR | | | 3,208,707 | | | GBP | | | 2,858,616 | | | | 3,809,887 | | | | 12/20/17 | | | | (30,404 | ) |
| | EUR | | | 40,089,343 | | | USD | | | 48,197,285 | | | | 47,412,709 | | | | 10/12/17 | | | | (784,576 | ) |
| | EUR | | | 3,660,724 | | | USD | | | 4,390,722 | | | | 4,346,594 | | | | 12/20/17 | | | | (44,126 | ) |
| | GBP | | | 4,056,648 | | | EUR | | | 4,593,000 | | | | 5,449,737 | | | | 12/20/17 | | | | (3,804 | ) |
| | GBP | | | 5,281,355 | | | USD | | | 7,182,705 | | | | 7,095,020 | | | | 12/20/17 | | | | (87,686 | ) |
| | HKD | | | 9,726,748 | | | USD | | | 1,250,393 | | | | 1,245,258 | | | | 10/03/17 | | | | (5,135 | ) |
| | HUF | | | 145,145,952 | | | EUR | | | 466,000 | | | | 552,630 | | | | 12/20/17 | | | | (680 | ) |
| | HUF | | | 808,574,674 | | | USD | | | 3,183,992 | | | | 3,078,574 | | | | 12/20/17 | | | | (105,417 | ) |
| | IDR | | | 38,971,483,365 | | | USD | | | 2,913,859 | | | | 2,892,117 | | | | 10/05/17 | | | | (21,742 | ) |
| | IDR | | | 23,606,769,324 | | | USD | | | 1,769,192 | | | | 1,751,111 | | | | 10/10/17 | | | | (18,081 | ) |
| | IDR | | | 28,447,861,831 | | | USD | | | 2,120,750 | | | | 2,109,114 | | | | 10/16/17 | | | | (11,638 | ) |
| | IDR | | | 12,369,215,614 | | | USD | | | 927,316 | | | | 916,251 | | | | 10/26/17 | | | | (11,064 | ) |
| | IDR | | | 14,769,173,850 | | | USD | | | 1,095,000 | | | | 1,093,648 | | | | 10/31/17 | | | | (1,352 | ) |
| | IDR | | | 34,911,020,000 | | | USD | | | 2,591,761 | | | | 2,580,757 | | | | 11/16/17 | | | | (11,004 | ) |
| | INR | | | 112,480,039 | | | USD | | | 1,754,630 | | | | 1,720,104 | | | | 10/05/17 | | | | (34,529 | ) |
| | INR | | | 167,914,467 | | | USD | | | 2,610,870 | | | | 2,565,691 | | | | 10/10/17 | | | | (45,178 | ) |
| | INR | | | 365,012,137 | | | USD | | | 5,661,578 | | | | 5,571,373 | | | | 10/18/17 | | | | (90,204 | ) |
| | INR | | | 233,836,498 | | | USD | | | 3,590,304 | | | | 3,565,857 | | | | 10/25/17 | | | | (24,447 | ) |
| | INR | | | 223,926,626 | | | USD | | | 3,436,727 | | | | 3,414,284 | | | | 10/26/17 | | | | (22,443 | ) |
| | INR | | | 36,446,726 | | | USD | | | 555,633 | | | | 555,243 | | | | 11/03/17 | | | | (389 | ) |
| | JPY | | | 61,069,613 | | | EUR | | | 462,582 | | | | 544,953 | | | | 12/20/17 | | | | (4,298 | ) |
| | JPY | | | 31,373,148 | | | GBP | | | 214,938 | | | | 279,957 | | | | 12/20/17 | | | | (8,792 | ) |
| | JPY | | | 3,522,041,823 | | | USD | | | 32,206,327 | | | | 31,339,494 | | | | 10/25/17 | | | | (866,832 | ) |
| | JPY | | | 629,110,409 | | | USD | | | 5,716,720 | | | | 5,613,851 | | | | 12/20/17 | | | | (102,869 | ) |
| | KRW | | | 2,091,893,023 | | | USD | | | 1,861,043 | | | | 1,826,605 | | | | 10/02/17 | | | | (34,438 | ) |
| | KRW | | | 3,866,660,319 | | | USD | | | 3,430,888 | | | | 3,377,200 | | | | 10/10/17 | | | | (53,688 | ) |
| | |
| The accompanying notes are an integral part of these financial statements. | | 77 |
GOLDMAN SACHS GLOBAL INCOME FUND
Schedule of Investments (continued)
September 30, 2017 (Unaudited)
|
| ADDITIONAL INVESTMENT INFORMATION (continued) |
FORWARD FOREIGN CURRENCY EXCHANGE CONTRACTS WITH UNREALIZED LOSS (continued)
| | | | | | | | | | | | | | | | | | | | | | | | |
| Counterparty | | Currency
Purchased | | | Currency
Sold | | | Current
Value | | | Settlement
Date | | | Unrealized
Loss | |
Morgan Stanley & Co. International PLC (continued) | | KRW | | | 1,965,682,007 | | | USD | | | 1,739,684 | | | $ | 1,716,876 | | | | 10/12/17 | | | $ | (22,808 | ) |
| | KRW | | | 3,171,345,404 | | | USD | | | 2,793,205 | | | | 2,770,138 | | | | 10/25/17 | | | | (23,067 | ) |
| | KRW | | | 2,077,430,412 | | | USD | | | 1,836,300 | | | | 1,814,878 | | | | 11/10/17 | | | | (21,422 | ) |
| | KRW | | | 4,926,785,274 | | | USD | | | 4,315,186 | | | | 4,304,724 | | | | 11/22/17 | | | | (10,463 | ) |
| | MXN | | | 153,670,491 | | | USD | | | 8,513,227 | | | | 8,329,935 | | | | 12/20/17 | | | | (183,293 | ) |
| | NOK | | | 56,265,687 | | | EUR | | | 6,003,815 | | | | 7,077,934 | | | | 12/20/17 | | | | (50,751 | ) |
| | NOK | | | 2,731,083 | | | GBP | | | 257,419 | | | | 343,556 | | | | 12/20/17 | | | | (2,262 | ) |
| | NOK | | | 3,948,811 | | | USD | | | 505,646 | | | | 496,740 | | | | 12/20/17 | | | | (8,905 | ) |
| | NZD | | | 754,494 | | | EUR | | | 460,000 | | | | 544,109 | | | | 12/20/17 | | | | (2,077 | ) |
| | NZD | | | 8,741,018 | | | USD | | | 6,353,725 | | | | 6,303,645 | | | | 12/20/17 | | | | (50,081 | ) |
| | PEN | | | 1,847,682 | | | USD | | | 569,000 | | | | 565,892 | | | | 10/05/17 | | | | (3,108 | ) |
| | PEN | | | 3,690,076 | | | USD | | | 1,139,000 | | | | 1,129,978 | | | | 10/10/17 | | | | (9,022 | ) |
| | PEN | | | 3,686,865 | | | USD | | | 1,130,247 | | | | 1,125,579 | | | | 12/14/17 | | | | (4,667 | ) |
| | PLN | | | 39,639,596 | | | EUR | | | 9,278,723 | | | | 10,865,690 | | | | 12/20/17 | | | | (151,489 | ) |
| | PLN | | | 19,422,366 | | | USD | | | 5,469,649 | | | | 5,323,904 | | | | 12/20/17 | | | | (145,746 | ) |
| | RUB | | | 507,115,350 | | | USD | | | 8,706,204 | | | | 8,679,628 | | | | 12/14/17 | | | | (26,576 | ) |
| | SEK | | | 172,741,218 | | | EUR | | | 18,096,693 | | | | 21,312,351 | | | | 12/20/17 | | | | (174,927 | ) |
| | SEK | | | 3,504,995 | | | USD | | | 439,390 | | | | 432,437 | | | | 12/20/17 | | | | (6,953 | ) |
| | SGD | | | 3,886,597 | | | USD | | | 2,888,727 | | | | 2,867,873 | | | | 12/20/17 | | | | (20,854 | ) |
| | THB | | | 18,848,760 | | | USD | | | 570,000 | | | | 565,220 | | | | 10/11/17 | | | | (4,780 | ) |
| | TRY | | | 18,903,157 | | | USD | | | 5,352,323 | | | | 5,181,473 | | | | 12/20/17 | | | | (170,849 | ) |
| | TWD | | | 60,158,259 | | | USD | | | 2,001,539 | | | | 1,982,804 | | | | 10/02/17 | | | | (18,736 | ) |
| | TWD | | | 17,078,535 | | | USD | | | 569,000 | | | | 562,460 | | | | 10/05/17 | | | | (6,540 | ) |
| | TWD | | | 116,242,349 | | | USD | | | 3,845,382 | | | | 3,828,736 | | | | 10/20/17 | | | | (16,645 | ) |
| | TWD | | | 26,861,379 | | | USD | | | 892,481 | | | | 884,879 | | | | 10/23/17 | | | | (7,602 | ) |
| | TWD | | | 50,455,393 | | | USD | | | 1,666,948 | | | | 1,662,369 | | | | 10/26/17 | | | | (4,579 | ) |
| | USD | | | 765,876 | | | AUD | | | 981,000 | | | | 768,764 | | | | 12/20/17 | | | | (2,888 | ) |
| | USD | | | 8,673,274 | | | BRL | | | 27,666,170 | | | | 8,731,453 | | | | 10/03/17 | | | | (58,179 | ) |
| | USD | | | 548,000 | | | BRL | | | 1,755,249 | | | | 551,578 | | | | 11/03/17 | | | | (3,578 | ) |
| | USD | | | 548,000 | | | CHF | | | 529,686 | | | | 550,073 | | | | 12/20/17 | | | | (2,073 | ) |
| | USD | | | 240,543 | | | CNH | | | 1,611,035 | | | | 241,201 | | | | 12/20/17 | | | | (658 | ) |
| | USD | | | 1,145,855 | | | CNY | | | 7,661,132 | | | | 1,149,377 | | | | 11/10/17 | | | | (3,521 | ) |
| | USD | | | 438,000 | | | COP | | | 1,293,368,886 | | | | 438,636 | | | | 10/31/17 | | | | (636 | ) |
| | USD | | | 161,276,199 | | | EUR | | | 136,810,513 | | | | 161,802,530 | | | | 10/12/17 | | | | (526,331 | ) |
| | USD | | | 2,113,816 | | | EUR | | | 1,784,304 | | | | 2,118,609 | | | | 12/20/17 | | | | (4,795 | ) |
| | USD | | | 25,712,149 | | | GBP | | | 19,166,501 | | | | 25,720,010 | | | | 11/16/17 | | | | (7,862 | ) |
| | USD | | | 2,925,060 | | | GBP | | | 2,198,564 | | | | 2,953,572 | | | | 12/20/17 | | | | (28,511 | ) |
| | USD | | | 2,879,282 | | | IDR | | | 38,971,483,365 | | | | 2,892,117 | | | | 10/05/17 | | | | (12,835 | ) |
| | USD | | | 1,160,991 | | | INR | | | 76,033,314 | | | | 1,162,741 | | | | 10/05/17 | | | | (1,750 | ) |
| | USD | | | 548,000 | | | INR | | | 35,979,214 | | | | 548,587 | | | | 10/26/17 | | | | (587 | ) |
| | USD | | | 1,409,916 | | | INR | | | 93,074,732 | | | | 1,417,936 | | | | 11/03/17 | | | | (8,020 | ) |
| | USD | | | 2,653,817 | | | JPY | | | 298,428,572 | | | | 2,663,019 | | | | 12/20/17 | | | | (9,203 | ) |
| | USD | | | 2,679,855 | | | KRW | | | 3,077,854,641 | | | | 2,688,865 | | | | 11/10/17 | | | | (9,010 | ) |
| | USD | | | 520,639 | | | KRW | | | 595,891,659 | | | | 520,654 | | | | 11/22/17 | | | | (15 | ) |
| | USD | | | 1,073,642 | | | NZD | | | 1,495,621 | | | | 1,078,577 | | | | 12/20/17 | | | | (4,936 | ) |
| | USD | | | 548,000 | | | PHP | | | 28,063,984 | | | | 550,904 | | | | 10/19/17 | | | | (2,904 | ) |
| | USD | | | 548,000 | | | PHP | | | 28,005,814 | | | | 549,724 | | | | 10/20/17 | | | | (1,724 | ) |
| | USD | | | 548,000 | | | PHP | | | 28,010,220 | | | | 549,585 | | | | 10/26/17 | | | | (1,585 | ) |
| | USD | | | 3,262,893 | | | RUB | | | 192,185,102 | | | | 3,289,380 | | | | 12/14/17 | | | | (26,486 | ) |
| | USD | | | 2,717,665 | | | SGD | | | 3,701,218 | | | | 2,731,083 | | | | 12/20/17 | | | | (13,418 | ) |
| | USD | | | 329,000 | | | TRY | | | 1,200,419 | | | | 329,042 | | | | 12/20/17 | | | | (42 | ) |
| | |
| 78 | | The accompanying notes are an integral part of these financial statements. |
GOLDMAN SACHS GLOBAL INCOME FUND
|
| ADDITIONAL INVESTMENT INFORMATION (continued) |
FORWARD FOREIGN CURRENCY EXCHANGE CONTRACTS WITH UNREALIZED LOSS (continued)
| | | | | | | | | | | | | | | | | | | | | | | | |
| Counterparty | | Currency
Purchased | | | Currency
Sold | | | Current
Value | | | Settlement
Date | | | Unrealized
Loss | |
Morgan Stanley & Co. International PLC (continued) | | USD | | | 535,745 | | | TWD | | | 16,254,500 | | | $ | 535,745 | | | | 10/02/17 | | | $ | — | |
| | USD | | | 561,240 | | | TWD | | | 17,078,535 | | | | 562,460 | | | | 10/05/17 | | | | (1,220 | ) |
| | USD | | | 2,315,696 | | | TWD | | | 70,714,417 | | | | 2,329,159 | | | | 10/20/17 | | | | (13,462 | ) |
| | USD | | | 1,145,855 | | | TWD | | | 34,860,819 | | | | 1,148,797 | | | | 10/31/17 | | | | (2,942 | ) |
| | | ZAR | | | 78,083,530 | | | USD | | | 5,891,625 | | | | 5,692,617 | | | | 12/20/17 | | | | (199,014 | ) |
| TOTAL | | | | | | | | | | | | | | | | | | | | | | $ | (4,996,293 | ) |
FORWARD SALES CONTRACTS — At September 30, 2017, the Fund had the following forward sales contracts:
| | | | | | | | | | | | | | |
| Description | | Interest
Rate | | Maturity
Date(a) | | Settlement
Date | | Principal
Amount | | | Value | |
GNMA(Proceeds Receivable: $(8,428,516)) | | 4.000% | | TBA-30yr | | 10/23/17 | | $ | (8,000,000 | ) | | $ | (8,423,750 | ) |
| | (a) | | TBA (To Be Announced) Securities are purchased or sold on a forward commitment basis with an approximate principal amount and no defined maturity date. The actual principal and maturity date will be determined upon settlement when the specific mortgage pools are assigned. |
|
FUTURES CONTRACTS — At September 30, 2017, the Fund had the following futures contracts: |
| | | | | | | | | | | | | | |
| Description | | Number of
Contracts | | | Expiration
Date | | Notional
Amount | | | Unrealized
Appreciation/
(Depreciation) | |
Long position contracts: | | | | | | | | | | | | | | |
Australian 10 Year Government Bonds | | | 43 | | | 12/15/17 | | $ | 4,285,020 | | | $ | (80,924 | ) |
Australian 3 Year Government Bonds | | | 92 | | | 12/15/17 | | | 8,012,832 | | | | (38,034 | ) |
Euro Buxl 30 Year Bonds | | | 38 | | | 12/07/17 | | | 7,332,368 | | | | (158,577 | ) |
French 10 Year Government Bonds | | | 45 | | | 12/07/17 | | | 8,251,201 | | | | 15,352 | |
Ultra 10 Year U.S. Treasury Notes | | | 42 | | | 12/19/17 | | | 5,641,781 | | | | (63,135 | ) |
Ultra Long U.S. Treasury Bonds | | | 221 | | | 12/19/17 | | | 36,492,625 | | | | (520,112 | ) |
5 Year German Euro-Bobl | | | 118 | | | 12/07/17 | | | 18,294,920 | | | | (36,650 | ) |
10 Year German Euro-Bund | | | 71 | | | 12/07/17 | | | 13,511,142 | | | | (96,627 | ) |
10 Year U.K. Long Gilt | | | 41 | | | 12/27/17 | | | 6,805,964 | | | | (152,520 | ) |
2 Year U.S. Treasury Notes | | | 80 | | | 12/29/17 | | | 17,256,250 | | | | (43,897 | ) |
10 Year U.S. Treasury Notes | | | 543 | | | 12/19/17 | | | 68,044,688 | | | | (562,011 | ) |
| Total | | | $ | (1,737,135 | ) |
Short position contracts: | | | | | | | | | | | | | | |
Eurodollars | | | (235 | ) | | 12/17/18 | | | (57,654,313 | ) | | | (20,964 | ) |
Italian 10 Year Government Bonds | | | (5 | ) | | 12/07/17 | | | (797,546 | ) | | | (1,261 | ) |
U.S. Long Bonds | | | (66 | ) | | 12/19/17 | | | (10,085,625 | ) | | | 268,938 | |
5 Year U.S. Treasury Notes | | | (601 | ) | | 12/29/17 | | | (70,617,500 | ) | | | 441,148 | |
| Total | | | | | | | | | | | | $ | 687,861 | |
| TOTAL | | | $ | (1,049,274 | ) |
| | |
| The accompanying notes are an integral part of these financial statements. | | 79 |
GOLDMAN SACHS GLOBAL INCOME FUND
Schedule of Investments (continued)
September 30, 2017 (Unaudited)
|
| ADDITIONAL INVESTMENT INFORMATION (continued) |
SWAP CONTRACTS — At September 30, 2017, the Fund had the following swap contracts:
OVER THE COUNTER INTEREST RATE SWAP CONTRACTS
| | | | | | | | | | | | | | | | | | | | | | | | | | |
Payments Made
by the Fund(a) | | Payments
Received by
the Fund | | | Counterparty | | Termination
Date | | | Notional
Amount | | | Value | | | Upfront
Payments
(Received)
Paid | | | Unrealized
Appreciation/
(Depreciation) | |
3M KWCDC | | | 1.293 | % | | BoA Securities LLC | | | 06/15/19 | | | | KRW 19,308,640 | | | $ | (123,011 | ) | | $ | — | | | $ | (123,011 | ) |
3M KWCDC | | | 1.750 | | | MS & Co. Int. PLC | | | 06/21/27 | | | | 3,278,840 | | | | (78,687 | ) | | | (33,483 | ) | | | (45,204 | ) |
| TOTAL | | | | | | | | | | | | | | | | | | | | $ | (33,483 | ) | | $ | (168,215 | ) |
| | (a) | | Payments made quarterly. |
CENTRALLY CLEARED INTEREST RATE SWAP CONTRACTS
| | | | | | | | | | | | | | | | | | | | | | | | | | |
| Payments Made by the Fund | | Payments
Received
by Fund | | Termination
Date | | | Notional
Amount | | | Value | | | Upfront
Premium
(Received) Paid | | | Unrealized
Appreciation/
(Depreciation) | |
| 6M CDOR(a) | | 0.832% | | | 10/25/17 | | | | CAD | | | | 157,210 | | | $ | (30,179 | ) | | $ | 236 | | | $ | (30,415 | ) |
| 6M GBP(b) | | 0.297 | | | 12/14/17 | | | | GBP | | | | 367,650 | (c) | | | (42,274 | ) | | | 1,484 | | | | (43,758 | ) |
| 3M STIBOR(d) | | 0.050(b) | | | 06/15/18 | | | | SEK | | | | 129,980 | | | | 62,923 | | | | 45,754 | | | | 17,169 | |
| 3M STIBOR(d) | | 0.330(b) | | | 09/15/18 | | | | | | | | 191,800 | (c) | | | 20,207 | | | | 3,292 | | | | 16,915 | |
| 6M CHFOR | | 0.554 | | | 03/29/19 | | | | CHF | | | | 49,100 | (c) | | | 350 | | | | (373,917 | ) | | | 374,267 | |
| 1.826% | | 3M LIBOR | | | 05/11/19 | | | | | | | $ | 33,960 | (c) | | | (7,223 | ) | | | (4,824 | ) | | | (2,399 | ) |
| 3M STIBOR(d) | | 0.100(b) | | | 06/29/19 | | | | SEK | | | | 238,300 | (c) | | | 1,577 | | | | (4,761 | ) | | | 6,338 | |
| 6M NIBOR(e) | | 1.000(b) | | | 09/20/19 | | | | NOK | | | | 67,960 | | | | (12,662 | ) | | | (18,629 | ) | | | 5,967 | |
| 6M CDOR(e) | | 1.250 | | | 12/20/19 | | | | CAD | | | | 42,960 | (c) | | | (491,863 | ) | | | (509,528 | ) | | | 17,665 | |
| 2.000(e) | | 3M LIBOR(d) | | | 12/20/19 | | | | | | | $ | 22,260 | (c) | | | (86,084 | ) | | | (136,850 | ) | | | 50,766 | |
| 6M GBP(a) | | 3.370 | | | 07/15/22 | | | | GBP | | | | 3,970 | | | | (21,147 | ) | | | 208 | | | | (21,355 | ) |
| 6M CDOR(e) | | 2.028 | | | 07/18/22 | | | | CAD | | | | 7,400 | (c) | | | (41,068 | ) | | | (41,035 | ) | | | (33 | ) |
Mexico IB TIIE 28D(f) | | 6.750 | | | 12/14/22 | | | | MXN | | | | 38,225 | (c) | | | (3,072 | ) | | | (358 | ) | | | (2,714 | ) |
| 6M EURO(e) | | 0.250(b) | | | 12/20/22 | | | | EUR | | | | 29,540 | (c) | | | (97,845 | ) | | | 1,165 | | | | (99,010 | ) |
| 3M STIBOR(d) | | 0.500(b) | | | 12/20/22 | | | | SEK | | | | 124,440 | (c) | | | (31,365 | ) | | | 20,753 | | | | (52,118 | ) |
| 6M GBP(e) | | 1.000 | | | 12/20/22 | | | | GBP | | | | 2,590 | (c) | | | (26,200 | ) | | | 30,707 | | | | (56,907 | ) |
| 6M CDOR(e) | | 1.750 | | | 12/20/22 | | | | CAD | | | | 13,270 | (c) | | | (214,391 | ) | | | (220,259 | ) | | | 5,868 | |
| 2.250(e) | | 3M LIBOR(b) | | | 12/20/22 | | | | | | | $ | 21,460 | (c) | | | (205,063 | ) | | | (351,921 | ) | | | 146,858 | |
| 2.500(e) | | 6M AUDOR | | | 12/20/22 | | | | AUD | | | | 10,220 | (c) | | | 59,631 | | | | (13,580 | ) | | | 73,211 | |
| 2.143(e) | | 3M LIBOR(d) | | | 07/03/23 | | | | | | | $ | 5,740 | (c) | | | (250 | ) | | | 2,072 | | | | (2,322 | ) |
| 3M LIBOR(d) | | 2.065(e) | | | 08/06/23 | | | | | | | | 15,110 | (c) | | | (64,866 | ) | | | 7,310 | | | | (72,176 | ) |
| 6M EURO(e) | | 0.500(b) | | | 12/20/24 | | | | EUR | | | | 4,660 | (c) | | | (33,615 | ) | | | 10,279 | | | | (43,894 | ) |
| 6M EURO(e) | | 1.330(b) | | | 01/12/27 | | | | | | | | 17,020 | (c) | | | (97,551 | ) | | | (182,063 | ) | | | 84,512 | |
| 6M GBP(e) | | 1.600 | | | 03/16/27 | | | | GBP | | | | 22,320 | (c) | | | (152,672 | ) | | | (148,263 | ) | | | (4,409 | ) |
| 6M EURO(e) | | 1.750(b) | | | 06/15/27 | | | | EUR | | | | 6,780 | (c) | | | 85,739 | | | | (439,071 | ) | | | 524,810 | |
| 6M GBP(b) | | 3.336 | | | 06/15/27 | | | | GBP | | | | 1,930 | | | | (17,871 | ) | | | (1,476 | ) | | | (16,395 | ) |
| 6M EURO(b) | | 1.428 | | | 08/15/27 | | | | EUR | | | | 3,800 | | | | (9,962 | ) | | | 3,245 | | | | (13,207 | ) |
| 3M LIBOR(d) | | 2.400(d) | | | 08/31/27 | | | | | | | $ | 5,170 | (c) | | | (40,281 | ) | | | (5,918 | ) | | | (34,363 | ) |
| 1.500(b) | | 6M EURO(e) | | | 08/31/27 | | | | EUR | | | | 4,530 | (c) | | | 19,166 | | | | (7,580 | ) | | | 26,746 | |
| 3.340(a) | | 6M GBP | | | 09/15/27 | | | | GBP | | | | 2,690 | | | | 15,878 | | | | 2,592 | | | | 13,286 | |
| 6M CDOR(e) | | 2.500 | | | 09/21/27 | | | | CAD | | | | 11,110 | (c) | | | (74,079 | ) | | | (32,033 | ) | | | (42,046 | ) |
| 2.500(e) | | 3M LIBOR(d) | | | 09/21/27 | | | | | | | $ | 8,950 | (c) | | | 33,667 | | | | (3,103 | ) | | | 36,770 | |
| 6M CHFOR(e) | | 0.250(b) | | | 12/20/27 | | | | CHF | | | | 1,520 | (c) | | | (13,176 | ) | | | 506 | | | | (13,682 | ) |
| 6M EURO(e) | | 1.000(b) | | | 12/20/27 | | | | EUR | | | | 14,920 | (c) | | | 71,879 | | | | 269,390 | | | | (197,511 | ) |
| 6M CDOR(e) | | 2.000 | | | 12/20/27 | | | | CAD | | | | 16,360 | (c) | | | (513,603 | ) | | | (426,252 | ) | | | (87,351 | ) |
| 2.500(e) | | 3M LIBOR | | | 12/20/27 | | | | | | | $ | 10,820 | (c) | | | (183,546 | ) | | | (404,940 | ) | | | 221,394 | |
| 1.250(e) | | 6M GBP | | | 12/20/27 | | | | GBP | | | | 2,080 | (c) | | | 55,037 | | | | (37,443 | ) | | | 92,480 | |
| 0.250(e) | | 6M JYOR | | | 12/20/27 | | | | JPY | | | | 867,910 | (c) | | | 40,877 | | | | 22,440 | | | | 18,437 | |
| | |
| 80 | | The accompanying notes are an integral part of these financial statements. |
GOLDMAN SACHS GLOBAL INCOME FUND
|
| ADDITIONAL INVESTMENT INFORMATION (continued) |
CENTRALLY CLEARED INTEREST RATE SWAP CONTRACTS (continued)
| | | | | | | | | | | | | | | | | | | | | | | | | | |
| Payments Made by the Fund | | Payments
Received
by Fund | | Termination
Date | | | Notional
Amount | | | Value | | | Upfront
Premium
(Received) Paid | | | Unrealized
Appreciation/
(Depreciation) | |
| 6M CHFOR(e) | | 1.000%(b) | | | 12/21/27 | | | | CHF | | | | 2,440 | (c) | | $ | 21,848 | | | $ | 42,693 | | | $ | (20,845 | ) |
| 6M CDOR(e) | | 2.500 | | | 12/21/27 | | | | CAD | | | | 29,430 | (c) | | | (223,704 | ) | | | (141,204 | ) | | | (82,500 | ) |
| 2.750%(e) | | 3M LIBOR(d) | | | 12/21/27 | | | | | | | $ | 22,730 | (c) | | | (141,517 | ) | | | (209,231 | ) | | | 67,714 | |
| 4.000(e) | | 3M NZDOR(d) | | | 12/21/27 | | | | NZD | | | | 9,040 | (c) | | | (27,539 | ) | | | (64,790 | ) | | | 37,251 | |
| 3M LIBOR(d) | | 2.378(e) | | | 07/03/28 | | | | | | | $ | 21,690 | (c) | | | (2,681 | ) | | | (32,024 | ) | | | 29,343 | |
| 2.346(e) | | 3M LIBOR(d) | | | 08/06/28 | | | | | | | | 8,530 | (c) | | | 32,893 | | | | (9,693 | ) | | | 42,586 | |
| 1.940(e) | | 6M GBP | | | 01/11/32 | | | | GBP | | | | 12,290 | (c) | | | 40,134 | | | | 47,766 | | | | (7,632 | ) |
| 6M EURO(b) | | 1.600 | | | 08/15/32 | | | | EUR | | | | 1,010 | | | | (5,896 | ) | | | 25 | | | | (5,921 | ) |
| 6M GBP(a) | | 3.460 | | | 09/15/32 | | | | GBP | | | | 2,440 | | | | (9,369 | ) | | | 1,821 | | | | (11,190 | ) |
| 1.500(e) | | 6M GBP | | | 12/20/32 | | | | | | | | 5,800 | (c) | | | 133,153 | | | | (151,681 | ) | | | 284,834 | |
| 1.750(e) | | 6M GBP | | | 03/17/37 | | | | | | | | 16,120 | (c) | | | 355,268 | | | | (70,254 | ) | | | 425,522 | |
| 6M EURO(e) | | 2.000(b) | | | 06/16/37 | | | | EUR | | | | 2,030 | (c) | | | (38,061 | ) | | | (825 | ) | | | (37,236 | ) |
| 2.750(e) | | 3M LIBOR(d) | | | 06/16/37 | | | | | | | $ | 3,830 | (c) | | | 4,203 | | | | (6,801 | ) | | | 11,004 | |
| 6M GBP(a) | | 3.510 | | | 09/15/42 | | | | GBP | | | | 1,980 | | | | (19,213 | ) | | | (3,390 | ) | | | (15,823 | ) |
| 2.500(e) | | 3M LIBOR(d) | | | 06/17/47 | | | | | | | $ | 3,780 | (c) | | | 29,986 | | | | 6,089 | | | | 23,897 | |
| 3.450(a) | | 6M GBP | | | 09/15/47 | | | | GBP | | | | 1,810 | | | | 24,000 | | | | 11,068 | | | | 12,932 | |
| 3M LIBOR(d) | | 2.750(e) | | | 12/20/47 | | | | | | | $ | 270 | (c) | | | 12,290 | | | | 23,392 | | | | (11,102 | ) |
| 1.500(e) | | 6M GBP | | | 12/20/47 | | | | GBP | | | | 30 | (c) | | | 1,625 | | | | (615 | ) | | | 2,240 | |
| 2.560(e) | | 3M LIBOR(d) | | | 07/03/48 | | | | | | | $ | 8,980 | (c) | | | 13,469 | | | | 28,500 | | | | (15,031 | ) |
| 2.540(e) | | 6M CDOR | | | 07/18/48 | | | | CAD | | | | 1,110 | (c) | | | 28,137 | | | | 22,106 | | | | 6,031 | |
| TOTAL | | | | | | | | | | | | | | | | | | | | $ | (3,449,419 | ) | | $ | 1,633,468 | |
| | (a) | | Payments made at maturity. |
| | (b) | | Payments made annually. |
| | (c) | | Represents forward starting interest rate swaps whose effective dates of commencement of accruals and cash flows occur subsequent to September 30, 2017. |
| | (d) | | Payments made quarterly. |
| | (e) | | Payments made semi-annually. |
| | (f) | | Payments made monthly. |
OVER THE COUNTER CREDIT DEFAULT SWAP CONTRACTS
| | | | | | | | | | | | | | | | | | | | | | | | | | | | | | | | |
| Reference Obligation/Index(a) | | Financing Rate
Paid by the
Fund | | | Credit
Spread at
September 30,
2017(b) | | | Counterparty | | | Termination
Date | | | Notional
Amount | | | Value | | | Upfront Premiums
(Received) Paid | | | Unrealized
Appreciation/
(Depreciation) | |
Protection Purchased: | | | | | | | | | | | | | | | | | | | | | | | | | | | | | | | | |
| People’s Republic of China, 7.500%, 10/28/27 | | | 1.000 | % | | | 0.490 | % | | | Barclays Bank PLC | | | | 12/20/21 | | | | 460 | | | $ | (9,677 | ) | | $ | (1,546 | ) | | $ | (8,131 | ) |
| People’s Republic of China, 7.500%, 10/28/27 | | | 1.000 | | | | 0.379 | | | | Citibank NA | | | | 12/20/20 | | | | 13,280 | | | | (264,081 | ) | | | 64,842 | | | | (328,923 | ) |
| People’s Republic of China, 7.500%, 10/28/27 | | | 1.000 | | | | 0.442 | | | | Deutsche Bank AG | | | | 06/20/21 | | | | 100 | | | | (2,047 | ) | | | (18 | ) | | | (2,029 | ) |
| TOTAL | | | | | | | $ | 63,278 | | | $ | (339,083 | ) |
| | (a) | | Payments made quarterly. |
| | (b) | | Credit spread on the referenced obligation, together with the term of the swap contract, are indicators of payment/performance risk. The likelihood of a credit event occurring which would require a Fund or its counterparty to make a payment or otherwise be required to perform under the swap contract is generally greater as the credit spread and the term of the swap contract increase. |
| | |
| The accompanying notes are an integral part of these financial statements. | | 81 |
GOLDMAN SACHS GLOBAL INCOME FUND
Schedule of Investments (continued)
September 30, 2017 (Unaudited)
|
| ADDITIONAL INVESTMENT INFORMATION (continued) |
CENTRALLY CLEARED CREDIT DEFAULT SWAP CONTRACTS
| | | | | | | | | | | | | | | | | | | | | | | | | | | | | | |
| Referenced Obligation/Index(a) | | Financing Rate
Paid by the
Fund | | | Credit Spread at
September 30,
2017(b) | | | Termination
Date | | | Notional
Amount | | | Value | | | Upfront Premiums
(Received) Paid | | | Unrealized
Appreciation/
(Depreciation) | |
Protection Purchased: | | | | | | | | | | | | | | | | | | | | | | | | | | | | | | |
iTraxx Europe Series 26 | | | 1.000 | % | | | 0.415 | % | | | 12/20/21 | | | EUR | | | 22,410 | | | $ | (662,820 | ) | | $ | (258,190 | ) | | $ | (404,630 | ) |
iTraxx Europe Series 27 | | | 1.000 | | | | 0.480 | | | | 06/20/22 | | | | | | 20,890 | | | | (611,106 | ) | | | (527,239 | ) | | | (83,867 | ) |
CDX.NA.IG Index 28 | | | 1.000 | | | | 0.529 | | | | 06/20/22 | | | $ | | | 25,970 | | | | (556,953 | ) | | | (489,443 | ) | | | (67,510 | ) |
| TOTAL | | | | | | | $ | (1,274,872 | ) | | $ | (556,007 | ) |
| | (a) | | Payments made quarterly. |
| | (b) | | Credit spread on the referenced obligation, together with the term of the swap contract, are indicators of payment/performance risk. The likelihood of a credit event occurring which would require a Fund or its counterparty to make a payment or otherwise be required to perform under the swap contract is generally greater as the credit spread and the term of the swap contract increase. |
PURCHASED OPTIONS CONTRACTS — At September 30, 2017 the Fund had following options contracts:
PURCHASED OPTIONS ON INTEREST RATE SWAPTIONS
| | | | | | | | | | | | | | | | | | | | | | | | | | | | | | |
| Description | | Counterparty | | Exercise
Rate | | | Expiration
Date | | | Number of
Contracts | | | Notional Amount | | | Market Value | | | Premiums
Paid (Received) | | | Unrealized
Appreciation/ (Depreciation) | |
Purchased Options Contracts: | | | | | | | | | | | | | | | | | | | | | | | | | | | | | | |
Calls: | | | | | | | | | | | | | | | | | | | | | | | | | | | | | | |
5Y IRS | | BoA Securities LLC | | | 2.018 | % | | | 01/29/18 | | | | 9,600,000 | | | $ | 9,600,000 | | | $ | 72,480 | | | $ | 78,720 | | | $ | (6,240 | ) |
10Y IRS | | Citibank NA | | | 2.273 | | | | 01/22/18 | | | | 5,500,000 | | | | 5,500,000 | | | | 80,926 | | | | 89,512 | | | | (8,586 | ) |
10Y IRS | | Citibank NA | | | 2.539 | | | | 01/24/18 | | | | 3,600,000 | | | | 3,600,000 | | | | 18,838 | | | | 69,120 | | | | (50,282 | ) |
10Y IRS | | JPMorgan Securities, Inc. | | | 2.048 | | | | 01/24/18 | | | | 3,600,000 | | | | 3,600,000 | | | | 103,606 | | | | 67,860 | | | | 35,746 | |
| TOTAL | | | | | | | | | | | | | | | | | | | | $ | 275,850 | | | $ | 305,212 | | | $ | (29,362 | ) |
| | | | | | | | |
Puts: | | | | | | | | | | | | | | | | | | | | | | | | | | | | | | |
5Y IRS | | BoA Securities LLC | | | 2.018 | | | | 01/29/18 | | | | 9,600,000 | | | | 9,600,000 | | | | 49,017 | | | | 78,720 | | | | (29,703 | ) |
10Y IRS | | Citibank NA | | | 2.273 | | | | 01/22/18 | | | | 5,500,000 | | | | 5,500,000 | | | | 54,906 | | | | 89,513 | | | | (34,607 | ) |
10Y IRS | | Citibank NA | | | 2.539 | | | | 01/24/18 | | | | 3,600,000 | | | | 3,600,000 | | | | 87,064 | | | | 69,120 | | | | 17,944 | |
10Y IRS | | JPMorgan Securities, Inc. | | | 0.700 | | | | 10/23/17 | | | | 6,010,000 | | | | 6,010,000 | | | | 472 | | | | 37,508 | | | | (37,036 | ) |
10Y IRS | | JPMorgan Securities, Inc. | | | 2.048 | | | | 01/24/18 | | | | 3,600,000 | | | | 3,600,000 | | | | 14,176 | | | | 67,860 | | | | (53,684 | ) |
| TOTAL | | | | | | | | | | | | | | | | | | | | $ | 284,297 | | | $ | 399,003 | | | $ | (114,706 | ) |
| TOTAL PURCHASED OPTIONS CONTRACTS | | | | | | | | | | | | | | | $ | 560,147 | | | $ | 704,215 | | | $ | (144,068 | ) |
PURCHASED OPTIONS ON FUTURES
| | | | | | | | | | | | | | | | | | | | | | | | | | | | | | |
| Description | | Counterparty | | Exercise
Price | | | Expiration
Date | | | Number of
Contracts | | | Notional
Amount | | | Market
Value | | | Premiums
Paid (Received)
| | | Unrealized
Appreciation/
(Depreciation) | |
Eurodollar | | MS & Co. LLC | | $ | 98.00 | | | | 06/15/18 | | | | 203 | | | $ | 507,500 | | | $ | 78,662 | | | $ | 56,282 | | | $ | 22,380 | |
| | |
|
Abbreviation: |
BoA Securities LLC | | —Bank of America Securities LLC |
CDX.NA.IG Index 28 | | —CDX North America Investment Grade Index 28 |
Mexico IB TIIE 28D | | —Mexico Interbank TIIE 28 Days |
MS & Co. Int. PLC | | —Morgan Stanley & Co. International PLC |
MS & Co. LLC | | —Morgan Stanley & Co. LLC |
|
| | |
| 82 | | The accompanying notes are an integral part of these financial statements. |
GOLDMAN SACHS STRATEGIC INCOME FUND
Schedule of Investments
September 30, 2017 (Unaudited)
| | | | | | | | | | | | | | |
Principal
Amount | | | Interest
Rate | | | Maturity
Date | | | Value | |
| Bank Loans(a) – 2.2% | |
| Electric – 0.0% | |
| | Calpine Corp. (PRIME + 0.750%) | |
| $ | 1,943,182 | | | | 2.990 | % | | | 11/30/17 | | | $ | 1,944,795 | |
| | |
| Energy(b) – 0.5% | |
| | American Energy – Marcellus LLC | |
| | (1M LIBOR + 4.250%) | |
| | 23,426,000 | | | | 5.485 | | | | 08/04/20 | | | | 17,320,716 | |
| | (1M LIBOR + 7.500%) | |
| | 10,300,000 | | | | 8.735 | | | | 08/04/21 | | | | 648,076 | |
| | Blue Ridge Mountain Resources, Inc.(c) (PIK + 7.000%) | |
| | 12,150,131 | | | | 8.312 | | | | 05/06/19 | | | | 12,150,131 | |
| | | | | | | | | | | | | | |
| | | | | 30,118,923 | |
| | |
| Energy – Coal – 0.1% | |
| | Murray Energy Corp. (3M LIBOR + 7.250%) | |
| | 9,474,524 | | | | 8.583 | | | | 04/16/20 | | | | 8,665,305 | |
| | |
| Environmental – 0.2% | |
| | EnergySolutions LLC (3M LIBOR + 4.750%) | |
| | 13,397,500 | | | | 6.090 | | | | 05/29/20 | | | | 13,598,463 | |
| | |
| Food & Beverages(b) – 0.2% | |
| | Shearer’s Foods, Inc. (3M LIBOR + 6.750%) | |
| | 14,295,736 | | | | 8.083 | | | | 06/30/22 | | | | 13,509,471 | |
| | |
| Media – Broadcasting & Radio – 0.5% | |
| | Getty Images, Inc. (3M LIBOR + 3.500%) | |
| | 27,939,383 | | | | 4.833 | | | | 10/18/19 | | | | 24,109,452 | |
| | Lions Gate Entertainment Corp. (1M LIBOR + 3.000%) | |
| | 4,636,563 | | | | 4.235 | | | | 12/08/23 | | | | 4,671,337 | |
| | | | | | | | | | | | | | |
| | | | | 28,780,789 | |
| | |
| Media – Cable – 0.1% | |
| | Charter Communications Operating LLC (1M LIBOR + 2.000%) | |
| | 7,908,423 | | | | 3.240 | | | | 01/03/21 | | | | 7,927,087 | |
| | |
| Media – Non Cable – 0.1% | |
| | Checkout Holding Corp. (1M LIBOR + 6.750%) | |
| | 12,875,000 | | | | 7.985 | | | | 04/11/22 | | | | 7,419,219 | |
| | |
| Noncaptive – Financial – 0.2% | |
| | Avolon TLB Borrower 1 (Luxembourg) S.a.r.l. | |
| | (1M LIBOR + 2.250%) | |
| | 3,366,563 | | | | 3.486 | | | | 09/20/20 | | | | 3,377,504 | |
| | (1M LIBOR + 2.750%) | |
| | 7,581,000 | | | | 3.986 | | | | 04/03/22 | | | | 7,595,176 | |
| | | | | | | | | | | | | | |
| | | | | 10,972,680 | |
| | |
| Retailers(b) – 0.2% | |
| | True Religion Apparel, Inc. | |
| | 8,400,000 | | | | 11.000 | (i) | | | 01/30/20 | | | | 487,200 | |
| | (3M LIBOR + 4.875%) | |
| | 57,140,833 | | | | 5.875 | | | | 07/30/19 | | | | 14,570,912 | |
| | | | | | | | | | | | | | |
| | | | | 15,058,112 | |
| | |
| Technology – Software/Services – 0.1% | |
| | MA FinanceCo. LLC (1M LIBOR + 2.750%) | |
| | 986,683 | | | | 3.987 | | | | 06/21/24 | | | | 987,917 | |
| | |
| Bank Loans(a) – (continued) | |
| Technology – Software/Services – (continued) | |
| | Seattle Spinco, Inc. (1M LIBOR + 2.750%) | |
| 6,663,317 | | | | 3.987 | | | | 06/21/24 | | | | 6,671,645 | |
| | | | | | | | | | | | | | |
| | | | | 7,659,562 | |
| | |
| | TOTAL BANK LOANS | | | | | |
| | (Cost $215,875,379) | | | $ | 145,654,406 | |
| | |
| | | | | | | | | | | | | | |
| Corporate Obligations – 9.3% | |
| Airlines – 0.2% | |
| | Continental Airlines 2012-3 Class C Pass Through Trust | |
| $ | 12,550,000 | | | | 6.125 | % | | | 04/29/18 | | | $ | 12,767,015 | |
| | |
| Diversified Financial Services – 0.3% | |
| | Ally Financial, Inc. | |
| | 8,900,000 | | | | 6.250 | | | | 12/01/17 | | | | 8,944,500 | |
| | Nationstar Mortgage LLC/Nationstar Capital Corp.(e) | |
| | 6,450,000 | | | | 6.500 | | | | 08/01/18 | | | | 6,450,000 | |
| | Navient Corp. | |
| | 2,500,000 | | | | 8.450 | | | | 06/15/18 | | | | 2,612,400 | |
| | | | | | | | | | | | | | |
| | | | | 18,006,900 | |
| | |
| Electrical(e) – 0.2% | |
| | Dynegy, Inc. | |
| | 7,108,000 | | | | 6.750 | | | | 11/01/19 | | | | 7,356,780 | |
| | Electricite de France SA(f) (7 year EUR Swap + 3.021%) | |
| EUR | 3,100,000 | | | | 4.250 | | | | 01/29/49 | | | | 3,889,550 | |
| | | | | | | | | | | | | | |
| | | | | 11,246,330 | |
| | |
| Gaming – 0.1% | |
| | MGM Resorts International | |
| $ | 5,000,000 | | | | 8.625 | | | | 02/01/19 | | | | 5,400,000 | |
| | |
| Healthcare Providers & Services – 0.1% | |
| | HCA, Inc. | |
| | 7,050,000 | | | | 3.750 | | | | 03/15/19 | | | | 7,199,812 | |
| | |
| Home Builders(e) – 0.0% | |
| | Beazer Homes USA, Inc. | |
| | 1,500,000 | | | | 5.750 | | | | 06/15/19 | | | | 1,563,750 | |
| | |
| Insurance(e)(f) – 0.2% | |
| | The Chubb Corp. (3M USD LIBOR + 2.250%) | |
| | 11,894,000 | | | | 3.554 | | | | 03/29/67 | | | | 11,828,583 | |
| | |
| Media – 0.2% | |
| | Altice Financing SA(e)(g) | |
| | 3,200,000 | | | | 6.500 | | | | 01/15/22 | | | | 3,328,000 | |
| | Cablevision Systems Corp. | |
| | 1,450,000 | | | | 7.750 | | | | 04/15/18 | | | | 1,486,250 | |
| | SFR Group SA(e)(g) | |
| | 7,000,000 | | | | 6.000 | | | | 05/15/22 | | | | 7,306,250 | |
| | | | | | | | | | | | | | |
| | | | | 12,120,500 | |
| | |
| Mining – 0.4% | |
| | First Quantum Minerals Ltd.(e)(g) | |
| | 8,650,000 | | | | 7.250 | | | | 04/01/23 | | | | 8,931,125 | |
| | 3,700,000 | | | | 7.500 | | | | 04/01/25 | | | | 3,792,500 | |
| | |
| | |
| The accompanying notes are an integral part of these financial statements. | | 83 |
GOLDMAN SACHS STRATEGIC INCOME FUND
Schedule of Investments (continued)
September 30, 2017 (Unaudited)
| | | | | | | | | | | | | | |
Principal
Amount | | | Interest
Rate | | | Maturity
Date | | | Value | |
| Corporate Obligations – (continued) | |
| Mining – (continued) | |
| | Freeport-McMoRan, Inc. | |
| $ | 12,650,000 | | | | 2.375 | % | | | 03/15/18 | | | $ | 12,618,375 | |
| | | | | | | | | | | | | | |
| | | | | 25,342,000 | |
| | |
| Miscellaneous Manufacturing – 0.1% | |
| | General Electric Co. | |
| MXN | 110,000,000 | | | | 8.500 | | | | 04/06/18 | | | | 6,052,839 | |
| | |
| Oil Field Services – 3.4% | |
| | Carrizo Oil & Gas, Inc.(e) | |
| $ | 19,300,000 | | | | 7.500 | | | | 09/15/20 | | | | 19,686,000 | |
| | Halcon Resources Corp.(e)(g) | |
| | 1,600,000 | | | | 12.000 | | | | 02/15/22 | | | | 1,928,000 | |
| | 7,450,000 | | | | 6.750 | | | | 02/15/25 | | | | 7,710,750 | |
| | Laredo Petroleum, Inc.(e) | |
| | 12,000,000 | | | | 5.625 | | | | 01/15/22 | | | | 12,105,000 | |
| | 1,350,000 | | | | 7.375 | | | | 05/01/22 | | | | 1,397,250 | |
| | Nabors Industries, Inc.(g) | |
| | 3,550,000 | | | | 0.750 | | | | 01/15/24 | | | | 2,886,594 | |
| | Petrobras Global Finance BV | |
| | 1,130,000 | | | | 8.750 | | | | 05/23/26 | | | | 1,360,012 | |
| | 12,920,000 | | | | 7.375 | | | | 01/17/27 | | | | 14,228,150 | |
| | 17,722,000 | | | | 5.999 | (g) | | | 01/27/28 | | | | 17,722,000 | |
| | 10,150,000 | | | | 6.850 | | | | 06/05/15 | | | | 9,638,694 | |
| | Petroleos de Venezuela SA | |
| | 277,570,000 | | | | 6.000 | | | | 10/28/22 | | | | 79,385,020 | |
| | 21,570,000 | | | | 5.375 | | | | 04/12/27 | | | | 6,471,000 | |
| | Petroleos Mexicanos | |
| | 1,140,000 | | | | 6.375 | | | | 02/04/21 | | | | 1,245,735 | |
| EUR | 7,630,000 | | | | 5.125 | | | | 03/15/23 | | | | 10,325,495 | |
| $ | 16,770,000 | | | | 6.500 | (g) | | | 03/13/27 | | | | 18,585,017 | |
| | 90,000 | | | | 6.625 | | | | 06/15/35 | | | | 96,975 | |
| | 492,000 | | | | 5.500 | | | | 06/27/44 | | | | 457,560 | |
| | 990,000 | | | | 6.375 | | | | 01/23/45 | | | | 1,008,810 | |
| | 380,000 | | | | 5.625 | | | | 01/23/46 | | | | 354,730 | |
| | 6,520,000 | | | | 6.750 | (g) | | | 09/21/47 | | | | 6,939,888 | |
| | Whiting Petroleum Corp. | |
| | 6,800,000 | | | | 5.000 | (e) | | | 03/15/19 | | | | 6,817,000 | |
| | 2,950,000 | | | | 1.250 | | | | 04/01/20 | | | | 2,629,187 | |
| | | | | | | | | | | | | | |
| | | | | 222,978,867 | |
| | |
| Packaging(e) – 0.2% | |
| | Ardagh Packaging Finance PLC/Ardagh Holdings USA, Inc.(g) | |
| | 6,150,000 | | | | 6.000 | | | | 02/15/25 | | | | 6,519,000 | |
| Reynolds Group Issuer, Inc./Reynolds Group Issuer LLC/
Reynolds Group Issuer Lu |
|
| | 5,250,000 | | | | 5.750 | | | | 10/15/20 | | | | 5,328,750 | |
| | | | | | | | | | | | | | |
| | | | | 11,847,750 | |
| | |
| Pharmaceuticals(e)(g) – 0.3% | |
| | Valeant Pharmaceuticals International, Inc. | |
| | 8,900,000 | | | | 6.375 | | | | 10/15/20 | | | | 8,922,250 | |
| | 5,900,000 | | | | 6.500 | | | | 03/15/22 | | | | 6,239,250 | |
| | 7,350,000 | | | | 7.000 | | | | 03/15/24 | | | | 7,846,125 | |
| | | | | | | | | | | | | | |
| | | | | 23,007,625 | |
| | |
| Corporate Obligations – (continued) | |
| Pipelines(e) – 0.8% | |
| | DCP Midstream Operating LP | |
| 9,550,000 | | | | 2.500 | | | | 12/01/17 | | | | 9,550,000 | |
| | 6,200,000 | | | | 2.700 | | | | 04/01/19 | | | | 6,153,500 | |
| Enterprise Products Operating LLC(f) (3M USD LIBOR +
3.708%) |
|
| | 29,675,000 | | | | 5.018 | | | | 08/01/66 | | | | 29,689,837 | |
| | Plains All American Pipeline LP/PAA Finance Corp. | |
| | 7,725,000 | | | | 3.600 | | | | 11/01/24 | | | | 7,546,535 | |
| | | | | | | | | | | | | | |
| | | | | 52,939,872 | |
| | |
| Real Estate Investment Trusts – 0.3% | |
| | China Evergrande Group(e) | |
| | 17,900,000 | | | | 8.750 | | | | 06/28/25 | | | | 18,148,137 | |
| | Corporacion Geo SA(i) | |
| | 492,130 | | | | 8.000 | | | | 04/13/21 | | | | — | |
| | Trust F/1401(e)(g) | |
| | 4,470,000 | | | | 5.250 | | | | 12/15/24 | | | | 4,755,181 | |
| | | | | | | | | | | | | | |
| | | | | 22,903,318 | |
| | |
| Semiconductors(g) – 0.1% | |
| | NXP BV/NXP Funding LLC | |
| | 3,750,000 | | | | 4.125 | | | | 06/01/21 | | | | 3,923,438 | |
| | |
| Software(e)(g) – 0.2% | |
| Change Healthcare Holdings LLC/Change Healthcare Finance,
Inc. |
|
| | 7,000,000 | | | | 5.750 | | | | 03/01/25 | | | | 7,140,000 | |
| | CURO Financial Technologies Corp. | |
| | 8,000,000 | | | | 12.000 | | | | 03/01/22 | | | | 8,600,000 | |
| | | | | | | | | | | | | | |
| | | | | 15,740,000 | |
| | |
| Telecommunication Services – 2.1% | |
| | America Movil SAB de CV | |
| MXN | 256,740,000 | | | | 6.000 | | | | 06/09/19 | | | | 13,712,045 | |
| | Frontier Communications Corp. | |
| $ | 16,107,000 | | | | 8.125 | | | | 10/01/18 | | | | 16,268,070 | |
| | Intelsat Jackson Holdings SA(e) | |
| | 1,600,000 | | | | 7.250 | | | | 10/15/20 | | | | 1,544,000 | |
| | 15,000,000 | | | | 7.500 | | | | 04/01/21 | | | | 14,212,500 | |
| | 2,450,000 | | | | 9.750 | (g) | | | 07/15/25 | | | | 2,486,750 | |
| | Nokia OYJ | |
| | 3,500,000 | | | | 3.375 | | | | 06/12/22 | | | | 3,526,250 | |
| | Sprint Communications, Inc. | |
| | 7,700,000 | | | | 9.000 | (g) | | | 11/15/18 | | | | 8,267,875 | |
| | 8,000,000 | | | | 7.000 | | | | 08/15/20 | | | | 8,740,000 | |
| | Sprint Corp. | |
| | 13,500,000 | | | | 7.125 | | | | 06/15/24 | | | | 15,153,750 | |
| | Telecom Italia Capital SA | |
| | 5,550,000 | | | | 6.375 | | | | 11/15/33 | | | | 6,361,687 | |
| | 5,600,000 | | | | 7.200 | | | | 07/18/36 | | | | 6,916,000 | |
| | 7,450,000 | | | | 7.721 | | | | 06/04/38 | | | | 9,517,375 | |
| | Wind Acquisition Finance SA(e)(g) | |
| | 7,450,000 | | | | 4.750 | | | | 07/15/20 | | | | 7,543,125 | |
| | 13,500,000 | | | | 7.375 | | | | 04/23/21 | | | | 13,972,500 | |
| | Windstream Services LLC(e) | |
| | 13,300,000 | | | | 7.750 | | | | 10/15/20 | | | | 10,640,000 | |
| | | | | | | | | | | | | | |
| | | | | 138,861,927 | |
| | |
| | |
| 84 | | The accompanying notes are an integral part of these financial statements. |
GOLDMAN SACHS STRATEGIC INCOME FUND
| | | | | | | | | | | | | | |
Principal
Amount | | | Interest
Rate | | | Maturity
Date | | | Value | |
| Corporate Obligations – (continued) | |
| Trucking & Leasing(g) – 0.1% | |
| | Park Aerospace Holdings Ltd. | |
| $ | 7,300,000 | | | | 5.250 | % | | | 08/15/22 | | | $ | 7,585,722 | |
| | |
| | TOTAL CORPORATE OBLIGATIONS | |
| | (Cost $618,032,482) | | | $ | 611,316,248 | |
| | |
| | | | | | | | | | | | | | |
| Mortgage-Backed Obligations – 15.3% | |
| Collateralized Mortgage Obligations – 13.7% | |
| Interest Only(h) – 4.3% | |
| | FHLMC REMIC Series 3753, Class SK(f) (-1x1M LIBOR + 6.050%) | |
| $ | 14,109,182 | | | | 4.823 | % | | | 11/15/38 | | | $ | 1,211,412 | |
| | FHLMC REMIC Series 3852, Class SW(f) (-1x1M LIBOR + 6.000%) | |
| | 5,199,118 | | | | 4.773 | | | | 05/15/41 | | | | 827,105 | |
| | FHLMC REMIC Series 4273, Class PS(f) (-1x1M LIBOR + 6.100%) | |
| | 40,113,951 | | | | 4.866 | | | | 11/15/43 | | | | 6,586,526 | |
| | FHLMC REMIC Series 4320, Class SD(f) (-1x1M LIBOR + 6.100%) | |
| | 39,482,163 | | | | 4.866 | | | | 07/15/39 | | | | 6,177,127 | |
| | FHLMC REMIC Series 4326, Class GS(f) (-1x1M LIBOR + 6.050%) | |
| | 16,377,358 | | | | 4.816 | | | | 04/15/44 | | | | 2,828,165 | |
| | FHLMC REMIC Series 4431, Class ST(f) (-1x1M LIBOR + 6.100%) | |
| | 18,125,717 | | | | 4.873 | | | | 01/15/45 | | | | 3,611,986 | |
| | FHLMC REMIC Series 4468, Class SY(f) (-1x1M LIBOR + 6.100%) | |
| | 14,801,090 | | | | 4.866 | | | | 05/15/45 | | | | 2,937,711 | |
| | FHLMC STRIPS Series 304, Class C45 | |
| | 31,271,933 | | | | 3.000 | | | | 12/15/27 | | | | 2,878,863 | |
| FNMA REMIC Series 2010-126, Class LS(f) (-1x1M LIBOR +
5.000%) |
|
| | 6,584,926 | | | | 3.768 | | | | 11/25/40 | | | | 989,694 | |
| FNMA REMIC Series 2011-100, Class S(f) (-1x1M LIBOR +
6.450%) |
|
| | 13,559,499 | | | | 5.213 | | | | 10/25/41 | | | | 2,244,226 | |
| | FNMA REMIC Series 2012-146, Class IO | |
| | 3,168,694 | | | | 3.500 | | | | 01/25/43 | | | | 601,174 | |
| FNMA REMIC Series 2012-88, Class SB(f) (-1x1M LIBOR +
6.670%) |
|
| | 10,886,196 | | | | 5.436 | | | | 07/25/42 | | | | 2,025,371 | |
| FNMA REMIC Series 2013-121, Class SA(f) (-1x1M LIBOR +
6.100%) |
|
| | 21,534,515 | | | | 4.866 | | | | 12/25/43 | | | | 3,416,431 | |
| FNMA REMIC Series 2013-130, Class SN(f) (-1x1M LIBOR +
6.650%) |
|
| | 25,655,504 | | | | 5.413 | | | | 10/25/42 | | | | 4,957,267 | |
| FNMA REMIC Series 2013-96, Class SW(f) (-1x1M LIBOR +
6.100%) |
|
| | 41,514,732 | | | | 4.866 | | | | 09/25/43 | | | | 6,696,127 | |
| FNMA REMIC Series 2014-19, Class MS(f) (-1x1M LIBOR +
6.600%) |
|
| | 23,100,036 | | | | 5.366 | | | | 11/25/39 | | | | 2,514,254 | |
| FNMA REMIC Series 2014-87, Class MS(f) (-1x1M LIBOR +
6.250%) |
|
| | 16,185,958 | | | | 5.016 | | | | 01/25/45 | | | | 2,653,579 | |
| FNMA REMIC Series 2015-20, Class ES(f) (-1x1M LIBOR +
6.150%) |
|
| | 48,177,366 | | | | 4.916 | | | | 04/25/45 | | | | 9,812,959 | |
| | |
| Mortgage-Backed Obligations – (continued) | |
| Interest Only(h) – (continued) | |
| FNMA REMIC Series 2015-22, Class DS(f) (-1x1M LIBOR +
6.200%) |
|
| 11,498,655 | | | | 4.963 | | | | 04/25/45 | | | | 2,379,779 | |
| FNMA REMIC Series 2015-24, Class SG(f) (-1x1M LIBOR +
5.600%) |
|
| | 19,668,077 | | | | 4.366 | | | | 04/25/45 | | | | 3,562,640 | |
| FNMA REMIC Series 2015-34, Class LS(f) (-1x1M LIBOR +
6.100%) |
|
| | 31,741,901 | | | | 4.863 | | | | 06/25/45 | | | | 6,002,901 | |
| FNMA REMIC Series 2015-79, Class SA(f) (-1x1M LIBOR +
6.250%) |
|
| | 32,054,453 | | | | 5.016 | | | | 11/25/45 | | | | 5,375,622 | |
| FNMA REMIC Series 2015-79, Class SE(f) (-1x1M LIBOR +
6.250%) |
|
| | 12,776,951 | | | | 5.016 | | | | 11/25/45 | | | | 2,090,676 | |
| FNMA REMIC Series 2015-81, Class SA(f) (-1x1M LIBOR +
5.700%) |
|
| | 124,134,015 | | | | 4.466 | | | | 11/25/45 | | | | 17,706,550 | |
| FNMA REMIC Series 2015-82, Class MS(f) (-1x1M LIBOR +
5.700%) |
|
| | 93,641,012 | | | | 4.466 | | | | 11/25/45 | | | | 13,564,537 | |
| FNMA REMIC Series 2015-86, Class BS(f) (-1x1M LIBOR +
5.700%) |
|
| | 23,889,009 | | | | 4.463 | | | | 11/25/45 | | | | 3,410,099 | |
| GNMA REMIC Series 2010-1, Class SD(f) (-1x1M LIBOR +
5.790%) |
|
| | 7,553,688 | | | | 4.554 | | | | 01/20/40 | | | | 1,197,221 | |
| GNMA REMIC Series 2010-162, Class SE(f) (-1x1M LIBOR +
6.550%) |
|
| | 15,165,390 | | | | 5.314 | | | | 12/20/40 | | | | 1,425,089 | |
| GNMA REMIC Series 2010-20, Class SC(f) (-1x1M LIBOR +
6.150%) |
|
| | 10,806,390 | | | | 4.914 | | | | 02/20/40 | | | | 1,776,063 | |
| GNMA REMIC Series 2010-20, Class SD(f) (-1x1M LIBOR +
5.680%) |
|
| | 9,817,330 | | | | 4.444 | | | | 02/20/40 | | | | 1,428,974 | |
| GNMA REMIC Series 2010-20, Class SE(f) (-1x1M LIBOR +
6.250%) |
|
| | 14,968,587 | | | | 5.014 | | | | 02/20/40 | | | | 2,513,648 | |
| GNMA REMIC Series 2010-31, Class SA(f) (-1x1M LIBOR +
5.750%) |
|
| | 355,307 | | | | 4.514 | | | | 03/20/40 | | | | 52,428 | |
| GNMA REMIC Series 2010-35, Class DS(f) (-1x1M LIBOR +
5.680%) |
|
| | 11,727,994 | | | | 4.444 | | | | 03/20/40 | | | | 1,686,072 | |
| GNMA REMIC Series 2010-37, Class SG(f) (-1x1M LIBOR +
5.700%) |
|
| | 24,332,706 | | | | 4.464 | | | | 03/20/40 | | | | 3,566,221 | |
| GNMA REMIC Series 2010-58, Class AI(f) (-1x1M LIBOR +
5.770%) |
|
| | 3,863,663 | | | | 4.534 | | | | 05/20/40 | | | | 575,434 | |
| GNMA REMIC Series 2010-59, Class SA(f) (-1x1M LIBOR +
6.500%) |
|
| | 6,820,982 | | | | 5.264 | | | | 05/20/40 | | | | 1,219,740 | |
| | |
| | |
| The accompanying notes are an integral part of these financial statements. | | 85 |
GOLDMAN SACHS STRATEGIC INCOME FUND
Schedule of Investments (continued)
September 30, 2017 (Unaudited)
| | | | | | | | | | | | | | |
Principal
Amount | | | Interest
Rate | | | Maturity
Date | | | Value | |
| Mortgage-Backed Obligations – (continued) | |
| Interest Only(h) – (continued) | |
| GNMA REMIC Series 2010-85, Class SN(f) (-1x1M LIBOR +
5.940%) |
|
| $ | 14,449,822 | | | | 4.704 | % | | | 07/20/40 | | | $ | 2,646,193 | |
| GNMA REMIC Series 2010-9, Class XD(f) (-1x1M LIBOR +
6.600%) |
|
| | 24,718,907 | | | | 5.366 | | | | 01/16/40 | | | | 4,333,084 | |
| GNMA REMIC Series 2010-9, Class YD(f) (-1x1M LIBOR +
6.800%) |
|
| | 33,108,544 | | | | 5.566 | | | | 01/16/40 | | | | 6,028,914 | |
| GNMA REMIC Series 2010-90, Class ES(f) (-1x1M LIBOR +
5.950%) |
|
| | 22,933,640 | | | | 4.714 | | | | 07/20/40 | | | | 3,601,290 | |
| GNMA REMIC Series 2011-50, Class PS(f) (-1x1M LIBOR +
6.100%) |
|
| | 26,812,857 | | | | 4.864 | | | | 02/20/41 | | | | 4,201,671 | |
| GNMA REMIC Series 2012-149, Class MS(f) (-1x1M LIBOR +
6.250%) |
|
| | 5,961,217 | | | | 5.014 | | | | 12/20/42 | | | | 995,774 | |
| GNMA REMIC Series 2013-103, Class DS(f) (-1x1M LIBOR +
6.150%) |
|
| | 14,547,147 | | | | 4.914 | | | | 07/20/43 | | | | 2,400,905 | |
| GNMA REMIC Series 2013-111, Class SA(f) (-1x1M LIBOR +
6.700%) |
|
| | 15,485,044 | | | | 5.464 | | | | 07/20/43 | | | | 2,880,650 | |
| GNMA REMIC Series 2013-113, Class SA(f) (-1x1M LIBOR +
6.700%) |
|
| | 18,013,063 | | | | 5.464 | | | | 08/20/43 | | | | 3,340,085 | |
| GNMA REMIC Series 2013-113, Class SD(f) (-1x1M LIBOR +
6.700%) |
|
| | 62,936,135 | | | | 5.466 | | | | 08/16/43 | | | | 11,173,688 | |
| GNMA REMIC Series 2013-117, Class PS(f) (-1x1M LIBOR +
6.150%) |
|
| | 20,627,610 | | | | 4.914 | | | | 04/20/43 | | | | 3,045,716 | |
| GNMA REMIC Series 2013-134, Class DS(f) (-1x1M LIBOR +
6.100%) |
|
| | 125,632 | | | | 4.864 | | | | 09/20/43 | | | | 20,282 | |
| GNMA REMIC Series 2013-147, Class SD(f) (-1x1M LIBOR +
6.650%) |
|
| | 19,899,979 | | | | 5.414 | | | | 12/20/39 | | | | 3,646,289 | |
| GNMA REMIC Series 2013-152, Class SJ(f) (-1x1M LIBOR +
6.150%) |
|
| | 22,564,608 | | | | 4.914 | | | | 05/20/41 | | | | 3,721,644 | |
| GNMA REMIC Series 2013-152, Class TS(f) (-1x1M LIBOR +
6.100%) |
|
| | 380,072 | | | | 4.864 | | | | 06/20/43 | | | | 60,220 | |
| GNMA REMIC Series 2013-167, Class SG(f) (-1x1M LIBOR +
6.150%) |
|
| | 18,537,631 | | | | 4.914 | | | | 11/20/43 | | | | 3,022,310 | |
| | GNMA REMIC Series 2013-182, Class PI | |
| | 13,834,530 | | | | 4.500 | | | | 12/20/43 | | | | 2,659,688 | |
| | GNMA REMIC Series 2014-11, Class NI | |
| | 11,354,875 | | | | 4.500 | | | | 12/16/42 | | | | 1,425,656 | |
| GNMA REMIC Series 2014-132, Class SL(f) (-1x1M LIBOR +
6.100%) |
|
| | 25,800,219 | | | | 4.864 | | | | 10/20/43 | | | | 3,758,351 | |
| | |
| Mortgage-Backed Obligations – (continued) | |
| Interest Only(h) – (continued) | |
| GNMA REMIC Series 2014-133, Class BS(f) (-1x1M LIBOR +
5.600%) |
|
| 11,634,458 | | | | 4.364 | | | | 09/20/44 | | | | 1,636,391 | |
| | GNMA REMIC Series 2014-180, Class PI | |
| | 13,390,330 | | | | 4.000 | | | | 08/20/44 | | | | 2,128,759 | |
| GNMA REMIC Series 2014-3, Class TS(f) (-1x1M LIBOR +
5.550%) |
|
| | 8,960,725 | | | | 4.314 | | | | 01/20/44 | | | | 1,256,760 | |
| GNMA REMIC Series 2014-41, Class SA(f) (-1x1M LIBOR +
6.100%) |
|
| | 26,617,966 | | | | 4.864 | | | | 03/20/44 | | | | 4,400,764 | |
| GNMA REMIC Series 2014-5, Class SA(f) (-1x1M LIBOR +
5.550%) |
|
| | 13,904,750 | | | | 4.314 | | | | 01/20/44 | | | | 1,962,843 | |
| GNMA REMIC Series 2014-56, Class ST(f) (-1x1M LIBOR +
6.100%) |
|
| | 19,975,110 | | | | 4.866 | | | | 12/16/39 | | | | 2,979,052 | |
| GNMA REMIC Series 2014-76, Class SA(f) (-1x1M LIBOR +
5.600%) |
|
| | 30,032,080 | | | | 4.364 | | | | 01/20/40 | | | | 4,215,771 | |
| GNMA REMIC Series 2014-96, Class SE(f) (-1x1M LIBOR +
5.600%) |
|
| | 17,885,591 | | | | 4.364 | | | | 07/20/44 | | | | 2,555,170 | |
| GNMA REMIC Series 2015-110, Class MS(f) (-1x1M LIBOR +
5.710%) |
|
| | 18,273,943 | | | | 4.474 | | | | 08/20/45 | | | | 2,655,659 | |
| | GNMA REMIC Series 2015-111, Class IW | |
| | 15,567,088 | | | | 4.000 | | | | 06/20/45 | | | | 2,297,637 | |
| GNMA REMIC Series 2015-111, Class SM(f) (-1x1M LIBOR
+ 6.200%) |
|
| | 15,766,277 | | | | 4.964 | | | | 08/20/45 | | | | 2,600,241 | |
| GNMA REMIC Series 2015-112, Class SB(f) (-1x1M LIBOR +
5.740%) |
|
| | 30,411,317 | | | | 4.504 | | | | 08/20/45 | | | | 4,437,814 | |
| GNMA REMIC Series 2015-123, Class SE(f) (-1x1M LIBOR +
5.720%) |
|
| | 18,684,510 | | | | 4.484 | | | | 09/20/45 | | | | 2,714,915 | |
| GNMA REMIC Series 2015-126, Class HS(f) (-1x1M LIBOR +
6.200%) |
|
| | 32,869,695 | | | | 4.964 | | | | 09/20/45 | | | | 5,353,201 | |
| GNMA REMIC Series 2015-126, Class LS(f) (-1x1M LIBOR +
6.200%) |
|
| | 10,266,150 | | | | 4.964 | | | | 09/20/45 | | | | 1,693,137 | |
| | GNMA REMIC Series 2015-129, Class IC | |
| | 5,131,825 | | | | 4.500 | | | | 09/16/45 | | | | 917,632 | |
| GNMA REMIC Series 2015-133, Class SA(f) (-1x1M LIBOR +
5.700%) |
|
| | 5,808,088 | | | | 4.464 | | | | 09/20/45 | | | | 832,913 | |
| GNMA REMIC Series 2015-133, Class SB(f) (-1x1M LIBOR +
5.700%) |
|
| | 8,234,525 | | | | 4.464 | | | | 09/20/45 | | | | 1,187,129 | |
| GNMA REMIC Series 2015-144, Class QS(f) (-1x1M LIBOR +
5.700%) |
|
| | 16,750,079 | | | | 4.464 | | | | 10/20/45 | | | | 2,116,188 | |
| GNMA REMIC Series 2015-167, Class SA(f) (-1x1M LIBOR +
6.250%) |
|
| | 18,410,321 | | | | 5.014 | | | | 11/20/45 | | | | 3,066,646 | |
| | |
| | |
| 86 | | The accompanying notes are an integral part of these financial statements. |
GOLDMAN SACHS STRATEGIC INCOME FUND
| | | | | | | | | | | | | | |
Principal
Amount | | | Interest
Rate | | | Maturity
Date | | | Value | |
| Mortgage-Backed Obligations – (continued) | |
| Interest Only(h) – (continued) | |
| GNMA REMIC Series 2015-168, Class SD(f) (-1x1M LIBOR +
6.200%) |
|
| $ | 28,569,215 | | | | 4.964 | % | | | 11/20/45 | | | $ | 4,642,026 | |
| | GNMA REMIC Series 2015-95, Class GI | |
| | 45,178,050 | | | | 4.500 | | | | 07/16/45 | | | | 9,570,197 | |
| GNMA REMIC Series 2016-4, Class SM(f) (-1x1M LIBOR +
5.650%) |
|
| | 81,584,158 | | | | 4.414 | | | | 01/20/46 | | | | 11,318,260 | |
| GNMA REMIC Series 2016-6, Class S(f) (-1x1M LIBOR +
5.650%) |
|
| | 20,650,066 | | | | 4.414 | | | | 01/20/46 | | | | 3,001,076 | |
| GNMA REMIC Series 2016-6, Class SB(f) (-1x1M LIBOR +
5.650%) |
|
| | 41,781,899 | | | | 4.414 | | | | 01/20/46 | | | | 5,908,654 | |
| | | | | | | | | | | | | | |
| | | | | | | | | | | | | 280,914,916 | |
| | |
| Planned Amortization Class(f) – 0.0% | |
| | FNMA REMIC Series 2006-76, Class QF (1M LIBOR + 0.400%) | |
| | 1,031,393 | | | | 1.634 | | | | 08/25/36 | | | | 1,035,858 | |
| | FNMA REMIC Series 2006-79, Class PF (1M LIBOR + 0.400%) | |
| | 1,084,829 | | | | 1.634 | | | | 08/25/36 | | | | 1,089,664 | |
| | | | | | | | | | | | | | |
| | | | | | | | | | | | | 2,125,522 | |
| | |
| Regular Floater(f) – 0.1% | |
| | FHLMC REMIC Series 3231, Class FB (1M LIBOR + 0.350%) | |
| | 550,220 | | | | 1.577 | | | | 10/15/36 | | | | 551,580 | |
| | FHLMC REMIC Series 3314, Class FC (1M LIBOR + 0.400%) | |
| | 320,655 | | | | 1.634 | | | | 12/15/36 | | | | 321,907 | |
| | FHLMC REMIC Series 3371, Class FA (1M LIBOR + 0.600%) | |
| | 441,878 | | | | 1.827 | | | | 09/15/37 | | | | 446,116 | |
| | FHLMC REMIC Series 3545, Class FA (1M LIBOR + 0.850%) | |
| | 477,645 | | | | 2.077 | | | | 06/15/39 | | | | 482,588 | |
| | FHLMC REMIC Series 3827, Class KF (1M LIBOR + 0.370%) | |
| | 815,034 | | | | 1.604 | | | | 03/15/41 | | | | 817,244 | |
| | FNMA REMIC Series 2006-45, Class TF (1M LIBOR + 0.400%) | |
| | 976,386 | | | | 1.634 | | | | 06/25/36 | | | | 980,643 | |
| | FNMA REMIC Series 2007-33, Class HF (1M LIBOR + 0.350%) | |
| | 1,338,214 | | | | 1.584 | | | | 04/25/37 | | | | 1,341,330 | |
| | FNMA REMIC Series 2007-75, Class VF (1M LIBOR + 0.450%) | |
| | 382,551 | | | | 1.684 | | | | 08/25/37 | | | | 384,805 | |
| FNMA REMIC Series 2009-84, Class WF (1M LIBOR +
1.100%) |
|
| | 177,321 | | | | 2.337 | | | | 10/25/39 | | | | 180,169 | |
| | | | | | | | | | | | | | |
| | | | | | | | | | | | | 5,506,382 | |
| | |
| Sequential Fixed Rate – 0.4% | |
| | Banc of America Funding Trust Series 2007-8, Class 2A1 | |
| | 1,636,639 | | | | 7.000 | | | | 10/25/37 | | | | 1,063,365 | |
| | BCAP LLC Trust Series 2007-AA2, Class 2A7 | |
| | 1,561,005 | | | | 6.000 | | | | 04/25/37 | | | | 1,331,191 | |
| | Citicorp Mortgage Securities, Inc. Series 2007-4, Class 2A1 | |
| | 78,214 | | | | 5.500 | | | | 05/25/22 | | | | 78,498 | |
| | Citigroup Mortgage Loan Trust Series 2007-9, Class 1A1(g) | |
| | 15,855 | | | | 5.750 | | | | 04/25/47 | | | | 13,512 | |
| | CitiMortgage Alternative Loan Trust Series 2007-A3, Class 1A7 | |
| | 5,436,256 | | | | 5.750 | | | | 03/25/37 | | | | 4,998,258 | |
| | |
| Mortgage-Backed Obligations – (continued) | |
| Sequential Fixed Rate – (continued) | |
| Countrywide Alternative Loan Trust Series 2005-77T1,
Class 1A2 |
|
| 2,026,583 | | | | 6.000 | | | | 02/25/36 | | | | 1,649,723 | |
| | Countrywide Alternative Loan Trust Series 2007-15CB, Class A5 | |
| | 1,021,335 | | | | 5.750 | | | | 07/25/37 | | | | 917,435 | |
| Countrywide Alternative Loan Trust Series 2007-18CB,
Class 2A25 |
|
| | 374,708 | | | | 6.000 | | | | 08/25/37 | | | | 349,853 | |
| Countrywide Home Loans Mortgage Pass-Through Trust
Series 2007-1, Class A4 |
|
| | 1,083,264 | | | | 6.000 | | | | 03/25/37 | | | | 952,666 | |
| Countrywide Home Loans Mortgage Pass-Through Trust
Series 2007-7, Class A3 |
|
| | 1,985,329 | | | | 5.750 | | | | 06/25/37 | | | | 1,792,515 | |
| Countrywide Home Mortgage Loan Pass-Through Trust
Series 2007-10, Class A5 |
|
| | 1,580,542 | | | | 6.000 | | | | 07/25/37 | | | | 1,371,568 | |
| Countrywide Home Mortgage Pass-Through Trust Series 2007-10,
Class A22 |
|
| | 2,970,633 | | | | 6.000 | | | | 07/25/37 | | | | 2,577,866 | |
| | Morgan Stanley Mortgage Loan Trust Series 2005-4, Class 1A | |
| | 384,894 | | | | 5.000 | | | | 08/25/35 | | | | 383,784 | |
| | Residential Accredit Loans, Inc. Series 2006-QS2, Class 1A9 | |
| | 597,850 | | | | 5.500 | | | | 02/25/36 | | | | 547,589 | |
| | Residential Accredit Loans, Inc. Series 2006-QS6, Class 1A13 | |
| | 940,419 | | | | 6.000 | | | | 06/25/36 | | | | 844,376 | |
| | Residential Accredit Loans, Inc. Series 2006-QS9, Class 1A11 | |
| | 1,721,614 | | | | 6.500 | | | | 07/25/36 | | | | 1,526,757 | |
| | Residential Asset Securitization Trust Series 2006-A8, Class 1A1 | |
| | 1,311,264 | | | | 6.000 | | | | 08/25/36 | | | | 1,217,832 | |
| Residential Funding Mortgage Securities I Series 2007-S9,
Class 1A1 |
|
| | 4,247,827 | | | | 6.000 | | | | 10/25/37 | | | | 3,596,232 | |
| | | | | | | | | | | | | | |
| | | | | 25,213,020 | |
| | |
| Sequential Floating Rate(f) – 8.9% | |
| American Home Mortgage Assets Trust Series 2006-2, Class 2A1
(1M USD LIBOR + 0.190%) |
|
| | 8,406,332 | | | | 1.424 | | | | 09/25/46 | | | | 7,367,381 | |
| American Home Mortgage Investment Trust Series 2006-3,
Class 11A1 (1M USD LIBOR + 0.180%) |
|
| | 145,257 | | | | 1.594 | | | | 12/25/46 | | | | 131,382 | |
| American Home Mortgage Investment Trust Series 2007-2,
Class 11A1 (1M USD LIBOR + 0.230%) |
|
| | 4,187,710 | | | | 1.464 | | | | 03/25/47 | | | | 2,632,302 | |
| Banc of America Funding Trust Series 2006-H, Class 6A1
(1M USD LIBOR + 0.190%) |
|
| | 19,735,297 | | | | 1.421 | | | | 10/20/36 | | | | 17,404,341 | |
| | Banc of America Funding Trust Series 2007-2, Class 2A1 | |
| | 73,435 | | | | 4.858 | | | | 03/25/37 | | | | 73,897 | |
| Bear Stearns Mortgage Funding Trust Series 2007-AR4,
Class 1A1 (1M USD LIBOR + 0.200%) |
|
| | 3,673,722 | | | | 1.434 | | | | 09/25/47 | | | | 3,389,303 | |
| Chevy Chase Funding LLC Mortgage-Backed Certificates
Series 2005-4A, Class A1(g) (1M LIBOR + 0.200%) |
|
| | 5,169,137 | | | | 1.437 | | | | 10/25/36 | | | | 4,890,329 | |
| | |
| | |
| The accompanying notes are an integral part of these financial statements. | | 87 |
GOLDMAN SACHS STRATEGIC INCOME FUND
Schedule of Investments (continued)
September 30, 2017 (Unaudited)
| | | | | | | | | | | | | | |
Principal
Amount | | | Interest
Rate | | | Maturity
Date | | | Value | |
| Mortgage-Backed Obligations – (continued) | |
| Sequential Floating Rate(f) – (continued) | |
| Chevy Chase Funding LLC Mortgage-Backed Certificates
Series 2006-1A, Class A1(g) (1M USD LIBOR + 0.150%) |
|
| $ | 24,189,621 | | | | 1.384 | % | | | 12/25/46 | | | $ | 21,760,117 | |
| Chevy Chase Funding LLC Mortgage-Backed Certificates
Series 2006-3A, Class A1(g) (1M USD LIBOR + 0.130%) |
|
| | 13,389,631 | | | | 1.364 | | | | 08/25/47 | | | | 12,643,395 | |
| Citigroup Mortgage Loan Trust Series 2006-AR6, Class 2A2
(1M USD LIBOR + 0.160%) |
|
| | 6,967,456 | | | | 1.394 | | | | 09/25/36 | | | | 6,665,603 | |
| | Citigroup Mortgage Loan Trust Series 2006-AR7, Class 2A2A | |
| | 3,675,819 | | | | 3.582 | | | | 11/25/36 | | | | 3,386,584 | |
| Countrywide Alternative Loan Trust Series 2005-26CB, Class A1
(1M USD LIBOR + 0.500%) |
|
| | 718,248 | | | | 1.734 | | | | 07/25/35 | | | | 594,393 | |
| Countrywide Alternative Loan Trust Series 2005-36, Class 2A1A
(1M USD LIBOR + 0.310%) |
|
| | 5,989,104 | | | | 1.544 | | | | 08/25/35 | | | | 5,033,568 | |
| Countrywide Alternative Loan Trust Series 2005-64CB,
Class 1A12 (1M USD LIBOR + 0.800%) |
|
| | 947,703 | | | | 2.034 | | | | 12/25/35 | | | | 864,265 | |
| Countrywide Alternative Loan Trust Series 2005-9CB, Class 1A5
(1M USD LIBOR + 0.500%) |
|
| | 742,316 | | | | 1.734 | | | | 05/25/35 | | | | 649,704 | |
| Countrywide Alternative Loan Trust Series 2006-0C8,
Class 2A2B (1M USD LIBOR + 0.170%) |
|
| | 2,044,254 | | | | 1.404 | | | | 11/25/36 | | | | 1,919,091 | |
| Countrywide Alternative Loan Trust Series 2006-HY11, Class A1
(1M USD LIBOR + 0.120%) |
|
| | 321,922 | | | | 1.354 | | | | 06/25/36 | | | | 282,998 | |
| Countrywide Alternative Loan Trust Series 2006-OA1, Class 2A1
(1M USD LIBOR + 0.210%) |
|
| | 281,015 | | | | 1.441 | | | | 03/20/46 | | | | 242,751 | |
| Countrywide Alternative Loan Trust Series 2007-16CB,
Class 4A3 (1M USD LIBOR + 0.500%) |
|
| | 4,674,343 | | | | 1.734 | | | | 08/25/37 | | | | 3,936,930 | |
| Countrywide Alternative Loan Trust Series 2007-19, Class 1A11
(1M USD LIBOR + 0.500%) |
|
| | 9,864,944 | | | | 1.734 | | | | 08/25/37 | | | | 6,218,065 | |
| Countrywide Alternative Loan Trust Series 2007-HY6, Class A1
(1M USD LIBOR + 0.210%) |
|
| | 4,871,830 | | | | 1.444 | | | | 08/25/47 | | | | 4,282,522 | |
| Credit Suisse European Mortgage Capital Ltd.
Series 2015-1HWA, Class A(b)(g) (3 mo. Euribor + 2.750%) |
|
| EUR | 30,681,925 | | | | 2.750 | | | | 04/20/20 | | | | 35,991,006 | |
| Deutsche Alt-A Securities Mortgage Loan Trust
Series 2007-OA5, Class A1A (1M LIBOR + 0.200%) |
|
| $ | 2,955,464 | | | | 1.437 | | | | 08/25/47 | | | | 2,776,529 | |
| Deutsche Alt-A Securities Mortgage Loan Trust
Series 2007-OA5, Class A1B (1M LIBOR + 0.220%) |
|
| | 3,688,419 | | | | 1.457 | | | | 08/25/47 | | | | 3,472,156 | |
| Downey Savings & Loan Association Mortgage Trust
Series 2005-AR5, Class 2A1A (1M USD LIBOR + 0.330%) |
|
| | 8,651,365 | | | | 1.561 | | | | 09/19/45 | | | | 7,027,907 | |
| | |
| Mortgage-Backed Obligations – (continued) | |
| Sequential Floating Rate(f) – (continued) | |
| FHLMC Structured Agency Credit Risk Debt Notes
Series 2015-DNA1, Class M3 (1M USD LIBOR + 3.300%) |
|
| 8,210,000 | | | | 4.534 | | | | 10/25/27 | | | | 9,104,463 | |
| FHLMC Structured Agency Credit Risk Debt Notes
Series 2016-DNA2, Class M3 (1M USD LIBOR + 4.650%) |
|
| | 4,852,000 | | | | 5.884 | | | | 10/25/28 | | | | 5,419,659 | |
| FHLMC Structured Agency Credit Risk Debt Notes
Series 2016-DNA3, Class M3 (1M USD LIBOR + 5.000%) |
|
| | 2,000,000 | | | | 6.234 | | | | 12/25/28 | | | | 2,278,681 | |
| GreenPoint Mortgage Funding Trust Series 2006-OH1, Class A1
(1M USD LIBOR + 0.180%) |
|
| | 1,417,385 | | | | 1.414 | | | | 01/25/37 | | | | 1,290,779 | |
| GSR Mortgage Loan Trust Series 2006-OA1, Class 2A2
(1M USD LIBOR + 0.260%) |
|
| | 27,372,232 | | | | 1.494 | | | | 08/25/46 | | | | 15,670,231 | |
| HarborView Mortgage Loan Trust Series 2006-11, Class A1A
(1M USD LIBOR + 0.170%) |
|
| | 4,828,429 | | | | 1.401 | | | | 12/19/36 | | | | 4,162,820 | |
| | HomeBanc Mortgage Trust Series 2006-1, Class 3A2 | |
| | 2,900,572 | | | | 3.251 | | | | 04/25/37 | | | | 2,494,961 | |
| Indymac Index Mortgage Loan Trust Series 2005-AR10, Class A1
(1M USD LIBOR + 0.260%) |
|
| | 4,482,592 | | | | 1.754 | | | | 06/25/35 | | | | 4,096,978 | |
| Indymac Index Mortgage Loan Trust Series 2005-AR23,
Class 6A1 |
|
| | 2,878,375 | | | | 3.235 | | | | 11/25/35 | | | | 2,560,374 | |
| | Indymac Index Mortgage Loan Trust Series 2007-AR1, Class 1A1 | |
| | 4,840,921 | | | | 3.586 | | | | 03/25/37 | | | | 4,758,727 | |
| | JPMorgan Alternative Loan Trust Series 2006-A2, Class 2A2 | |
| | 5,917,002 | | | | 3.479 | | | | 05/25/36 | | | | 5,208,819 | |
| Lehman XS Trust Series 2005-7N, Class 1A1A
(1M USD LIBOR + 0.270%) |
|
| | 8,572,366 | | | | 1.504 | | | | 12/25/35 | | | | 8,230,093 | |
| Lehman XS Trust Series 2006-16N, Class A321
(1M USD LIBOR + 0.200%) |
|
| | 5,945,019 | | | | 1.434 | | | | 11/25/46 | | | | 5,441,889 | |
| Lehman XS Trust Series 2006-GP1, Class A2A
(1M USD LIBOR + 0.170%) |
|
| | 11 | | | | 1.404 | | | | 05/25/46 | | | | 61 | |
| Lehman XS Trust Series 2007-16N, Class 2A2
(1M LIBOR + 0.850%) |
|
| | 10,791,103 | | | | 2.087 | | | | 09/25/47 | | | | 10,429,967 | |
| Lehman XS Trust Series 2007-4N, Class 3A2A
(12M MTA + 0.750%) |
|
| | 4,833,156 | | | | 1.639 | | | | 03/25/47 | | | | 4,732,881 | |
| | Lehman XS Trust Series 2007-5H, Class 3A4 | |
| | 5,467,067 | | | | 3.236 | | | | 05/25/37 | | | | 4,782,890 | |
| Lehman XS Trust Series Series 2006-14N, Class 1A1A
(1M USD LIBOR + 0.190%) |
|
| | 12,476,013 | | | | 1.424 | | | | 09/25/46 | | | | 11,188,019 | |
| Luminent Mortgage Trust Series 2007-2, Class 2A1
(1M USD LIBOR + 0.230%) |
|
| | 1,326,446 | | | | 1.464 | | | | 05/25/37 | | | | 1,221,998 | |
| Master Adjustable Rate Mortgages Trust Series 2006-OA2,
Class 1A1 (12M MTA + 0.800%) |
|
| | 7,470,018 | | | | 1.630 | | | | 12/25/46 | | | | 7,260,407 | |
| | |
| | |
| 88 | | The accompanying notes are an integral part of these financial statements. |
GOLDMAN SACHS STRATEGIC INCOME FUND
| | | | | | | | | | | | | | |
Principal
Amount | | | Interest
Rate | | | Maturity
Date | | | Value | |
| Mortgage-Backed Obligations – (continued) | |
| Sequential Floating Rate(f) – (continued) | |
| Master Adjustable Rate Mortgages Trust Series 2006-OA2,
Class 4A1A (12M MTA + 0.850%) |
|
| $ | 2,978,076 | | | | 1.680 | % | | | 12/25/46 | | | $ | 2,946,822 | |
| Master Adjustable Rate Mortgages Trust Series 2007-2, Class A1
(1M USD LIBOR + 0.150%) |
|
| | 3,158,033 | | | | 1.384 | | | | 03/25/47 | | | | 3,001,870 | |
| Master Adjustable Rate Mortgages Trust Series 2007-3,
Class 12A1 (1M LIBOR + 0.200%) |
|
| | 1,483,008 | | | | 1.434 | | | | 05/25/47 | | | | 1,234,454 | |
| Master Adjustable Rate Mortgages Trust Series 2007-HF2,
Class A1 (1M USD LIBOR + 0.310%) |
|
| | 4,436,702 | | | | 1.544 | | | | 09/25/37 | | | | 4,306,162 | |
| Mortgage Repurchase Agreement Financing Trust Series 2016-1,
Class A2(g) (1M USD LIBOR + 0.950%) |
|
| | 35,950,000 | | | | 2.181 | | | | 04/10/19 | | | | 35,950,759 | |
| Mortgage Repurchase Agreement Financing Trust Series 2017-1,
Class A1(g) (1M USD LIBOR + 0.850%) |
|
| | 16,900,000 | | | | 2.081 | | | | 07/10/19 | | | | 16,904,343 | |
| Mortgage Repurchase Agreement Financing Trust Series 2017-2,
Class A1(g) |
|
| | 169,500,000 | | | | 1.781 | | | | 08/12/19 | | | | 169,513,730 | |
| Nomura Asset Acceptance Corp. Alternative Loan Trust
Series 2006-AR4, Class A4A (1M USD LIBOR + 0.240%) |
|
| | 2,040,736 | | | | 1.474 | | | | 12/25/36 | | | | 1,707,302 | |
| | Residential Accredit Loans, Inc. Series 2005-QA12, Class CB3 | |
| | 4,868,659 | | | | 4.251 | | | | 12/25/35 | | | | 4,475,255 | |
| Residential Accredit Loans, Inc. Series 2005-QO5, Class A1
(12M MTA + 1.000%) |
|
| | 4,479,971 | | | | 1.830 | | | | 01/25/46 | | | | 3,793,371 | |
| | Residential Accredit Loans, Inc. Series 2006-QA2, Class 2A1 | |
| | 3,706,446 | | | | 4.866 | | | | 02/25/36 | | | | 3,409,609 | |
| Residential Accredit Loans, Inc. Series 2006-QO1, Class 3A1
(1M USD LIBOR + 0.270%) |
|
| | 2,377,773 | | | | 1.504 | | | | 02/25/46 | | | | 1,744,240 | |
| Residential Accredit Loans, Inc. Series 2006-QO7, Class 1A1
(12M MTA + 0.800%) |
|
| | 4,936,499 | | | | 1.630 | | | | 09/25/46 | | | | 4,235,590 | |
| Residential Accredit Loans, Inc. Series 2006-QO7, Class 3A2
(1M USD LIBOR + 0.205%) |
|
| | 257,455 | | | | 1.439 | | | | 09/25/46 | | | | 224,479 | |
| Residential Accredit Loans, Inc. Series 2007-QO4, Class A1A
(1M USD LIBOR + 0.190%) |
|
| | 1,691,883 | | | | 1.424 | | | | 05/25/47 | | | | 1,593,988 | |
| Residential Funding Mortgage Securities I Series 2005-SA4,
Class 2A1 |
|
| | 3,949,449 | | | | 3.814 | | | | 09/25/35 | | | | 3,701,421 | |
| Residential Funding Mortgage Securities I Series 2005-SA5,
Class 2A |
|
| | 2,272,338 | | | | 3.845 | | | | 11/25/35 | | | | 2,207,337 | |
| Station Place Securitization Trust Series 2015-2, Class A(g)
(1M USD LIBOR + 1.050%) |
|
| | 9,525,528 | | | | 2.279 | | | | 05/15/18 | | | | 9,525,528 | |
| Structured Adjustable Rate Mortgage Loan Trust Series 2006-11,
Class 1A1 (1M USD LIBOR + 0.160%) |
|
| | 4,195,696 | | | | 1.394 | | | | 12/25/36 | | | | 3,977,656 | |
| | |
| Mortgage-Backed Obligations – (continued) | |
| Sequential Floating Rate(f) – (continued) | |
| Structured Adjustable Rate Mortgage Loan Trust Series 2006-9,
Class 3A1 |
|
| 2,801,633 | | | | 2.900 | | | | 10/25/36 | | | | 2,102,014 | |
| Structured Asset Mortgage Investments II Trust Series 2006-AR3,
Class 21A1 (1M USD LIBOR + 0.200%) |
|
| | 2,711,451 | | | | 1.634 | | | | 02/25/36 | | | | 2,298,612 | |
| Structured Asset Mortgage Investments II Trust Series 2007-AR4,
Class A4A (1M USD LIBOR + 0.180%) |
|
| | 5,739,533 | | | | 1.414 | | | | 09/25/47 | | | | 5,422,721 | |
| Structured Asset Mortgage Investments II Trust Series 2007-AR7,
Class 3A1 |
|
| | 13,874,234 | | | | 6.500 | | | | 05/25/47 | | | | 10,787,451 | |
| Washington Mutual Mortgage Pass-Through Certificates
Series 2005-AR1, Class A2A1 (1M USD LIBOR + 0.680%) |
|
| | 6,843,617 | | | | 1.914 | | | | 01/25/45 | | | | 6,638,650 | |
| Washington Mutual Mortgage Pass-Through Certificates
Series 2005-AR19, Class A1A1 (1M USD LIBOR + 0.270%) |
|
| | 404,530 | | | | 1.504 | | | | 12/25/45 | | | | 399,423 | |
| Washington Mutual Mortgage Pass-Through Certificates
Series 2005-AR8, Class 1A1A (1M USD LIBOR + 0.270%) |
|
| | 260,306 | | | | 1.774 | | | | 07/25/45 | | | | 259,781 | |
| Washington Mutual Mortgage Pass-Through Certificates
Series 2005-AR8, Class 2A1A (1M USD LIBOR + 0.290%) |
|
| | 931,737 | | | | 1.814 | | | | 07/25/45 | | | | 900,041 | |
| Washington Mutual Mortgage Pass-Through Certificates
Series 2005-AR9, Class A1A (1M USD LIBOR + 0.640%) |
|
| | 3,271,060 | | | | 1.874 | | | | 07/25/45 | | | | 3,254,325 | |
| Washington Mutual Mortgage Pass-Through Certificates
Series 2006-AR19, Class 1A (12M MTA + 0.740%) |
|
| | 7,425,121 | | | | 1.570 | | | | 01/25/47 | | | | 6,925,448 | |
| Washington Mutual Mortgage Pass-Through Certificates
Series 2007-OA4, Class A1A (12M MTA + 0.760%) |
|
| | 5,628,594 | | | | 1.590 | | | | 04/25/47 | | | | 4,943,310 | |
| Washington Mutual Mortgage Pass-Through Certificates
Series 2007-OA6, Class 2A (COF + 1.250%) |
|
| | 4,316,508 | | | | 1.822 | | | | 07/25/47 | | | | 3,538,754 | |
| | | | | | | | | | | | | | |
| | | | | | | | | | | | | 585,895,662 | |
| | |
| TOTAL COLLATERALIZED
MORTGAGE OBLIGATIONS |
| | $ | 899,655,502 | |
| | |
| Commercial Mortgage-Backed Securities – 1.1% | |
| Sequential Fixed Rate – 0.4% | |
| | CSMC Trust Series 2014-USA, Class E(g) | |
| $ | 9,050,000 | | | | 4.373 | % | | | 09/15/37 | | | $ | 8,065,514 | |
| FHLMC Multifamily Structured Pass-Through Certificates
Series K030, Class A1 |
|
| | 16,734,143 | | | | 2.779 | | | | 09/25/22 | | | | 17,009,756 | |
| | WF-RBS Commercial Mortgage Trust Series 2012-C6, Class B | |
| | 2,500,000 | | | | 4.697 | | | | 04/15/45 | | | | 2,664,676 | |
| | | | | | | | | | | | | | |
| | | | | 27,739,946 | |
| | |
| Sequential Floating Rate(f)(g) – 0.7% | |
| Hilton Mortgage Trust Series 2014-ORL, Class E (-1x1M LIBOR
+ 3.250%) |
|
| | 10,050,000 | | | | 3.231 | | | | 07/15/29 | | | | 10,114,403 | |
| | |
| | |
| The accompanying notes are an integral part of these financial statements. | | 89 |
GOLDMAN SACHS STRATEGIC INCOME FUND
Schedule of Investments (continued)
September 30, 2017 (Unaudited)
| | | | | | | | | | | | | | |
Principal
Amount | | | Interest
Rate | | | Maturity
Date | | | Value | |
| Mortgage-Backed Obligations – (continued) | |
| Sequential Floating Rate(f)(g) – (continued) | |
| JPMorgan Chase Commercial Mortgage Securities Trust
Series 2014-CBM, Class E (1M LIBOR + 3.850%) |
|
| $ | 9,600,000 | | | | 5.084 | % | | | 10/15/29 | | | $ | 9,599,959 | |
| Citigroup Commercial Mortgage Trust Series 2015-SSHP,
Class D (1M LIBOR + 3.050%) |
|
| | 10,013,500 | | | | 4.284 | | | | 09/15/27 | | | | 10,053,133 | |
| CGBAM Commercial Mortgage Trust Series 2015-SMRT,
Class E |
|
| | 12,450,000 | | | | 3.786 | | | | 04/10/28 | | | | 12,516,753 | |
| | | | | | | | | | | | | | |
| | | | | 42,284,248 | |
| | |
| TOTAL COMMERCIAL
MORTGAGE-BACKED SECURITIES |
| | $ | 70,024,194 | |
| | |
| Federal Agencies – 0.5% | |
| FHLMC – 0.0% | |
| $ | 21,167 | | | | 5.000 | % | | | 01/01/33 | | | $ | 23,086 | |
| | 1,748 | | | | 5.000 | | | | 03/01/33 | | | | 1,913 | |
| | 9,885 | | | | 5.000 | | | | 04/01/33 | | | | 10,817 | |
| | 2,112 | | | | 5.000 | | | | 05/01/33 | | | | 2,312 | |
| | 6,166 | | | | 5.000 | | | | 06/01/33 | | | | 6,748 | |
| | 39,511 | | | | 5.000 | | | | 07/01/33 | | | | 43,237 | |
| | 55,787 | | | | 5.000 | | | | 08/01/33 | | | | 61,075 | |
| | 6,833 | | | | 5.000 | | | | 09/01/33 | | | | 7,495 | |
| | 11,748 | | | | 5.000 | | | | 10/01/33 | | | | 12,856 | |
| | 29,909 | | | | 5.000 | | | | 11/01/33 | | | | 32,729 | |
| | 13,917 | | | | 5.000 | | | | 12/01/33 | | | | 15,229 | |
| | 13,437 | | | | 5.000 | | | | 01/01/34 | | | | 14,704 | |
| | 39,065 | | | | 5.000 | | | | 02/01/34 | | | | 42,748 | |
| | 17,287 | | | | 5.000 | | | | 03/01/34 | | | | 18,920 | |
| | 25,825 | | | | 5.000 | | | | 04/01/34 | | | | 28,263 | |
| | 46,175 | | | | 5.000 | | | | 05/01/34 | | | | 50,529 | |
| | 595,487 | | | | 5.000 | | | | 06/01/34 | | | | 651,644 | |
| | 8,996 | | | | 5.000 | | | | 11/01/34 | | | | 9,845 | |
| | 161,026 | | | | 5.000 | | | | 04/01/35 | | | | 176,208 | |
| | 16,513 | | | | 5.000 | | | | 11/01/35 | | | | 18,070 | |
| | | | | | | | | | | | | | |
| | | | | | | | | | | | | 1,228,428 | |
| | |
| FNMA – 0.5% | |
| | 1,980,437 | | | | 3.094 | | | | 01/01/18 | | | | 1,977,692 | |
| | 2,093,658 | | | | 3.434 | | | | 01/01/18 | | | | 2,093,942 | |
| | 12,938 | | | | 5.000 | | | | 01/01/18 | | | | 13,172 | |
| | 72,724 | | | | 5.000 | | | | 02/01/18 | | | | 74,403 | |
| | 68,755 | | | | 5.000 | | | | 03/01/18 | | | | 70,344 | |
| | 116,941 | | | | 5.000 | | | | 04/01/18 | | | | 119,642 | |
| | 13,581 | | | | 5.000 | | | | 05/01/18 | | | | 13,895 | |
| | 11,337 | | | | 5.000 | | | | 06/01/18 | | | | 11,599 | |
| | 215 | | | | 5.500 | | | | 01/01/19 | | | | 218 | |
| | 10,496 | | | | 5.500 | | | | 02/01/19 | | | | 10,656 | |
| | 14,483 | | | | 5.500 | | | | 03/01/19 | | | | 14,740 | |
| | 7,806 | | | | 5.500 | | | | 04/01/19 | | | | 7,938 | |
| | 6,874 | | | | 5.500 | | | | 05/01/19 | | | | 7,025 | |
| | 30,158 | | | | 5.500 | | | | 06/01/19 | | | | 30,681 | |
| | 88,826 | | | | 5.500 | | | | 07/01/19 | | | | 90,445 | |
| | 86,866 | | | | 5.500 | | | | 08/01/19 | | | | 88,515 | |
| | 81,602 | | | | 5.500 | | | | 09/01/19 | | | | 83,646 | |
| | |
| Mortgage-Backed Obligations – (continued) | |
| FNMA – (continued) | |
| 24,315 | | | | 5.500 | | | | 10/01/19 | | | | 24,886 | |
| | 26,603 | | | | 5.500 | | | | 11/01/19 | | | | 27,271 | |
| | 41,224 | | | | 5.500 | | | | 12/01/19 | | | | 42,283 | |
| | 4,477 | | | | 5.500 | | | | 01/01/20 | | | | 4,614 | |
| | 1,196 | | | | 5.500 | | | | 06/01/20 | | | | 1,219 | |
| | 471,707 | | | | 5.500 | | | | 07/01/20 | | | | 484,293 | |
| | 1,731,348 | | | | 3.416 | | | | 10/01/20 | | | | 1,793,764 | |
| | 1,185,006 | | | | 3.619 | | | | 12/01/20 | | | | 1,236,758 | |
| | 5,266,692 | | | | 4.381 | | | | 06/01/21 | | | | 5,637,690 | |
| | 3,033 | | | | 6.000 | | | | 01/01/24 | | | | 3,412 | |
| | 61,849 | | | | 6.000 | | | | 04/01/24 | | | | 69,568 | |
| | 527,161 | | | | 5.500 | | | | 05/01/25 | | | | 539,238 | |
| | 3,750 | | | | 4.500 | | | | 09/01/29 | | | | 4,031 | |
| | 6,210 | | | | 6.000 | | | | 12/01/32 | | | | 7,034 | |
| | 730 | | | | 6.000 | | | | 01/01/33 | | | | 820 | |
| | 3,285 | | | | 6.000 | | | | 04/01/33 | | | | 3,723 | |
| | 145,756 | | | | 6.000 | | | | 10/01/33 | | | | 166,132 | |
| | 4,948 | | | | 6.000 | | | | 02/01/34 | | | | 5,606 | |
| | 37,527 | | | | 6.000 | | | | 03/01/34 | | | | 42,490 | |
| | 122,931 | | | | 6.000 | | | | 08/01/34 | | | | 140,160 | |
| | 27,215 | | | | 6.000 | | | | 11/01/34 | | | | 30,865 | |
| | 270,985 | | | | 6.000 | | | | 05/01/35 | | | | 309,256 | |
| | 54,139 | | | | 6.000 | | | | 06/01/35 | | | | 61,844 | |
| | 168,638 | | | | 6.000 | | | | 10/01/35 | | | | 192,261 | |
| | 17,761 | | | | 6.000 | | | | 11/01/35 | | | | 20,266 | |
| | 29,555 | | | | 6.000 | | | | 12/01/35 | | | | 33,724 | |
| | 106,211 | | | | 6.000 | | | | 02/01/36 | | | | 120,843 | |
| | 7,274 | | | | 6.000 | | | | 05/01/36 | | | | 8,299 | |
| | 574,709 | | | | 6.000 | | | | 08/01/36 | | | | 654,703 | |
| | 25,525 | | | | 6.000 | | | | 09/01/36 | | | | 29,130 | |
| | 16,651 | | | | 6.000 | | | | 10/01/36 | | | | 19,017 | |
| | 234,444 | | | | 6.000 | | | | 11/01/36 | | | | 267,170 | |
| | 344,548 | | | | 6.000 | | | | 12/01/36 | | | | 390,617 | |
| | 1,093,543 | | | | 6.000 | | | | 01/01/37 | | | | 1,244,331 | |
| | 1,632,894 | | | | 6.000 | | | | 02/01/37 | | | | 1,863,352 | |
| | 69,563 | | | | 6.000 | | | | 04/01/37 | | | | 78,982 | |
| | 493,612 | | | | 6.000 | | | | 05/01/37 | | | | 561,527 | |
| | 923,428 | | | | 6.000 | | | | 07/01/37 | | | | 1,050,421 | |
| | 57,497 | | | | 4.500 | | | | 08/01/37 | | | | 61,951 | |
| | 1,039,553 | | | | 6.000 | | | | 08/01/37 | | | | 1,179,230 | |
| | 26,725 | | | | 6.000 | | | | 09/01/37 | | | | 30,375 | |
| | 426,766 | | | | 6.000 | | | | 10/01/37 | | | | 485,727 | |
| | 4,046 | | | | 6.000 | | | | 11/01/37 | | | | 4,612 | |
| | 269,479 | | | | 6.000 | | | | 12/01/37 | | | | 306,131 | |
| | 810,034 | | | | 6.000 | | | | 01/01/38 | | | | 918,940 | |
| | 66,806 | | | | 5.000 | | | | 03/01/38 | | | | 74,348 | |
| | 67,634 | | | | 6.000 | | | | 03/01/38 | | | | 77,181 | |
| | 163,907 | | | | 6.000 | | | | 05/01/38 | | | | 186,330 | |
| | 16,159 | | | | 6.000 | | | | 07/01/38 | | | | 18,481 | |
| | 16,911 | | | | 6.000 | | | | 08/01/38 | | | | 19,274 | |
| | 446,185 | | | | 6.000 | | | | 09/01/38 | | | | 507,259 | |
| | 281,621 | | | | 6.000 | | | | 10/01/38 | | | | 320,675 | |
| | 1,557,863 | | | | 6.000 | | | | 11/01/38 | | | | 1,756,601 | |
| | 4,240,296 | | | | 6.000 | | | | 12/01/38 | | | | 4,743,489 | |
| | 2,280 | | | | 6.000 | | | | 01/01/39 | | | | 2,565 | |
| | |
| | |
| 90 | | The accompanying notes are an integral part of these financial statements. |
GOLDMAN SACHS STRATEGIC INCOME FUND
| | | | | | | | | | | | | | |
Principal
Amount | | | Interest
Rate | | | Maturity
Date | | | Value | |
| Mortgage-Backed Obligations – (continued) | |
| FNMA – (continued) | |
| $ | 12,983 | | | | 4.500 | % | | | 04/01/39 | | | $ | 14,032 | |
| | 6,163 | | | | 6.000 | | | | 04/01/39 | | | | 7,011 | |
| | 98,310 | | | | 6.000 | | | | 07/01/39 | | | | 112,104 | |
| | 19,760 | | | | 4.000 | | | | 08/01/39 | | | | 20,941 | |
| | 10,379 | | | | 4.000 | | | | 09/01/39 | | | | 10,999 | |
| | 69,355 | | | | 6.000 | | | | 09/01/39 | | | | 78,801 | |
| | 59,602 | | | | 4.500 | | | | 10/01/39 | | | | 64,770 | |
| | 655,294 | | | | 6.000 | | | | 10/01/39 | | | | 745,861 | |
| | 202,773 | | | | 6.000 | | | | 10/01/40 | | | | 230,174 | |
| | 8,419 | | | | 4.500 | | | | 05/01/41 | | | | 9,172 | |
| | 1,079,239 | | | | 6.000 | | | | 05/01/41 | | | | 1,226,672 | |
| | 32,413 | | | | 4.500 | | | | 06/01/41 | | | | 35,072 | |
| | 109,686 | | | | 6.000 | | | | 07/01/41 | | | | 125,047 | |
| | 49,640 | | | | 4.500 | | | | 08/01/41 | | | | 54,371 | |
| | 10,736 | | | | 4.500 | | | | 10/01/41 | | | | 11,699 | |
| | 349,011 | | | | 5.000 | | | | 11/01/41 | | | | 381,702 | |
| | 11,035 | | | | 6.000 | | | | 01/01/42 | | | | 12,732 | |
| | 4,185 | | | | 4.500 | | | | 11/01/42 | | | | 4,504 | |
| | 53,045 | | | | 4.500 | | | | 12/01/43 | | | | 57,844 | |
| | | | | | | | | | | | | | |
| | | | | | | | | | | | | 35,776,830 | |
| | |
| | TOTAL FEDERAL AGENCIES | | | $ | 37,005,258 | |
| | |
| | TOTAL MORTGAGE-BACKED OBLIGATIONS | |
| | (Cost $947,346,415) | | | | | | | $ | 1,006,684,954 | |
| | |
| | | | | | | | | | | | | | |
| Agency Debentures – 0.2% | |
| | FFCB | |
| $ | 11,000,000 | | | | 2.850 | % | | | 02/10/31 | | | $ | 10,719,973 | |
| | 3,000,000 | | | | 3.020 | | | | 04/09/31 | | | | 2,971,842 | |
| | |
| | TOTAL AGENCY DEBENTURES | |
| | (Cost $13,230,006) | | | | | | | $ | 13,691,815 | |
| | |
| | | | | | | | | | | | | | |
| Asset-Backed Securities – 31.9% | |
| Automotive(g) – 0.0% | |
| | Skopos Auto Receivables Trust Series 2015-1A, Class A | |
| $ | 365,299 | | | | 3.100 | % | | | 12/15/23 | | | $ | 365,414 | |
| | Skopos Auto Receivables Trust Series 2015-2A, Class A | |
| | 704,596 | | | | 3.550 | | | | 02/15/20 | | | | 704,733 | |
| | | | | | | | | | | | | | |
| | | | | | | | | | | | | 1,070,147 | |
| | |
| Collateralized Loan Obligations(g) – 19.3% | |
| ACIS CLO Ltd. Series 2013-1A, Class A1(f) (3M USD LIBOR +
0.870%) |
|
| | 15,724,738 | | | | 2.028 | | | | 04/18/24 | | | | 15,733,623 | |
| ACIS CLO Ltd. Series 2013-1A, Class B(f) (3M USD LIBOR +
1.950%) |
|
| | 3,516,015 | | | | 3.108 | | | | 04/18/24 | | | | 3,516,898 | |
| ACIS CLO Ltd. Series 2013-1A, Class C(f) (3M USD LIBOR +
2.950%) |
|
| | 2,220,765 | | | | 4.108 | | | | 04/18/24 | | | | 2,225,475 | |
| | |
| Asset-Backed Securities – (continued) | |
| Collateralized Loan Obligations(g) – (continued) | |
| ACIS CLO Ltd. Series 2013-2A, Class C2R(f) (3M USD LIBOR +
1.300%) |
|
| 13,167,588 | | | | 2.459 | | | | 10/14/22 | | | | 13,168,997 | |
| ACIS CLO Ltd. Series 2014-4A, Class A(f)
(3M USD LIBOR + 1.420%) |
|
| | 109,000,000 | | | | 2.590 | | | | 05/01/26 | | | | 109,129,928 | |
| BlueMountain CLO Ltd. Series 2014-2A, Class AR(f)
(3M USD LIBOR + 0.930%) |
|
| | 28,750,000 | | | | 2.237 | | | | 07/20/26 | | | | 28,863,821 | |
| CBAM CLO Management LLC Series 2017-2A, Class A(f)
(3M USD LIBOR + 1.240%) |
|
| | 18,350,000 | | | | 2.631 | | | | 10/17/29 | | | | 18,443,512 | |
| Cedar Funding V CLO Ltd. Series 2016-5A, Class A1(f)
(3M USD LIBOR + 1.610%) |
|
| | 850,000 | | | | 2.768 | | | | 07/17/28 | | | | 857,223 | |
| Crown Point CLO III Ltd. Series 2015-3A, Class A1A(f)
(3M USD LIBOR + 1.410%) |
|
| | 26,962,244 | | | | 2.568 | | | | 12/31/27 | | | | 26,987,400 | |
| Crown Point CLO Ltd. Series 2012-1A, Class A1LA(f)
(3M USD LIBOR + 0.750%) |
|
| | 636,001 | | | | 1.922 | | | | 11/21/22 | | | | 636,078 | |
| Crown Point CLO Ltd. Series 2012-1A, Class A2L(f)
(3M USD LIBOR + 2.710%) |
|
| | 795,898 | | | | 3.882 | | | | 11/21/22 | | | | 796,981 | |
| Crown Point CLO Ltd. Series 2012-1A, Class A3L(f)
(3M USD LIBOR + 3.960%) |
|
| | 636,717 | | | | 5.132 | | | | 11/21/22 | | | | 638,078 | |
| Crown Point CLO Ltd. Series 2013-2A, Class A1L(f)
(3M USD LIBOR + 0.970%) |
|
| | 58,880,980 | | | | 2.128 | | | | 12/31/23 | | | | 58,727,360 | |
| | Crown Point CLO Ltd. Series 2015-3A, Class A1AR(e)(f) | |
| | 31,350,000 | | | | 2.230 | | | | 12/31/27 | | | | 31,350,000 | |
| Cutwater Ltd. Series 2014-1A, Class A1AR(f) (3M USD LIBOR +
1.250%) |
|
| | 38,250,000 | | | | 2.469 | | | | 07/15/26 | | | | 38,325,812 | |
| Halcyon Loan Advisors Funding Ltd. Series 2015-2A, Class A(f)
(3M USD LIBOR + 1.390%) |
|
| | 79,000,000 | | | | 2.546 | | | | 07/25/27 | | | | 78,898,564 | |
| MidOcean Credit CLO III Series 2014-3A, Class A(f)
(3M USD LIBOR + 1.460%) |
|
| | 1,300,000 | | | | 2.616 | | | | 07/21/26 | | | | 1,300,192 | |
| OCP CLO Ltd. Series 2012-2A, Class A1R(f) (3M USD LIBOR +
1.400%) |
|
| | 10,850,000 | | | | 2.572 | | | | 11/22/25 | | | | 10,910,218 | |
| OCP CLO Ltd. Series 2014-5A, Class A1(f) (3M USD LIBOR +
1.000%) |
|
| | 112,160,000 | | | | 2.167 | | | | 04/26/26 | | | | 112,389,816 | |
| Octagon Investment Partners 24 Ltd. Series 2015-1A,
Class A1R(f) |
|
| | 74,550,000 | | | | 2.250 | | | | 05/21/27 | | | | 74,624,550 | |
| OFSI Fund V Ltd. Series 2013-5A, Class A1LA(f)
(3M USD LIBOR + 0.930%) |
|
| | 7,192,648 | | | | 2.088 | | | | 04/17/25 | | | | 7,195,497 | |
| OFSI Fund VI Ltd. Series 2014-6A, Class A1(f)
(3M USD LIBOR + 1.030%) |
|
| | 98,374,560 | | | | 2.188 | | | | 03/20/25 | | | | 97,677,871 | |
| | |
| | |
| The accompanying notes are an integral part of these financial statements. | | 91 |
GOLDMAN SACHS STRATEGIC INCOME FUND
Schedule of Investments (continued)
September 30, 2017 (Unaudited)
| | | | | | | | | | | | | | |
Principal
Amount | | | Interest
Rate | | | Maturity
Date | | | Value | |
| Asset-Backed Securities – (continued) | |
| Collateralized Loan Obligations(g) – (continued) | |
| OFSI Fund VII Ltd. Series 2014-7A, Class A(f) (3M USD LIBOR
+ 1.340%) |
|
| $ | 117,675,963 | | | | 2.498 | % | | | 10/18/26 | | | $ | 117,734,683 | |
| | OFSI Fund VII Ltd. Series 2014-7A, Class AR(f) | |
| | 104,050,000 | | | | 2.114 | | | | 10/18/26 | | | | 104,526,549 | |
| OFSI Fund VII Ltd. Series 2014-7A, Class B(f)
(3M USD LIBOR + 2.130%) |
|
| | 148,590 | | | | 3.288 | | | | 10/18/26 | | | | 148,647 | |
| | Palmer Square Loan Funding Ltd. Series 2017-1A, Class A1(f) | |
| | 25,600,000 | | | | 2.060 | | | | 10/15/25 | | | | 25,599,846 | |
| | Recette CLO Ltd. Series 2015-1A, Class AR(f) | |
| | 45,100,000 | | | | 0.000 | | | | 10/20/27 | | | | 45,100,000 | |
| TCW CLO Ltd. Series 2017-1A, Class A(f) (3M USD LIBOR +
1.280%) |
|
| | 19,000,000 | | | | 2.714 | | | | 07/29/29 | | | | 19,087,305 | |
| | The Bank of New York Mellon SA(b)(e)(i) | |
| | 1,630,000 | | | | 9.625 | | | | 05/02/21 | | | | — | |
| Trinitas CLO II Ltd. Series 2014-2A, Class A1R(f)
(3M USD LIBOR + 1.180%) |
|
| | 46,550,000 | | | | 2.339 | | | | 07/15/26 | | | | 46,616,380 | |
| Wasatch Ltd. Series 2006-1A, Class A1B(f) (3M USD LIBOR +
0.240%) |
|
| | 328,961 | | | | 1.422 | | | | 11/14/22 | | | | 327,545 | |
| Z Capital Credit Partners CLO Ltd. Series 2015-1A, Class A1(f)
(3M USD LIBOR + 1.330%) |
|
| | 100,576,158 | | | | 2.488 | | | | 07/16/27 | | | | 100,843,892 | |
| Zais CLO 1 Ltd. Series 2014-1A, Class A1(f) (3M USD LIBOR +
1.400%) |
|
| | 77,111,170 | | | | 2.558 | | | | 04/15/26 | | | | 77,435,268 | |
| | | | | | | | | | | | | | |
| | | | | | | | | | | | | 1,269,818,009 | |
| | |
| Commercial Mortgage-Backed Securities(f)(g) – 0.1% | |
| Invitation Homes Trust Series 2015-SFR2, Class E (1M LIBOR +
3.150%) |
|
| | 100,000 | | | | 4.384 | | | | 06/17/32 | | | | 100,774 | |
| Tricon American Homes Trust Series 2015-SFR1, Class D
(1M LIBOR + 2.200%) |
|
| | 1,920,000 | | | | 3.434 | | | | 05/17/32 | | | | 1,926,583 | |
| Tricon American Homes Trust Series 2015-SFR1, Class E
(1M LIBOR + 3.000%) |
|
| | 3,790,000 | | | | 4.234 | | | | 05/17/32 | | | | 3,796,389 | |
| | | | | | | | | | | | | | |
| | | | | | | | | | | | | 5,823,746 | |
| | |
| Home Equity – 0.7% | |
| Ameriquest Mortgage Securities, Inc. Asset-Backed Pass-Through
Certificates Series 2005-R8, Class M2(f) (1M USD LIBOR +
0.490%) |
|
| | 5,440,000 | | | | 1.724 | | | | 10/25/35 | | | | 5,367,520 | |
| Citigroup Mortgage Loan Trust Series 2007-WFH2, Class A4(f)
(1M USD LIBOR + 0.350%) |
|
| | 250,766 | | | | 1.584 | | | | 03/25/37 | | | | 248,527 | |
| Credit-Based Asset Servicing and Securitization LLC
Series 2005-CB8, Class AF2(j) |
|
| | 31,395 | | | | 3.872 | | | | 12/25/35 | | | | 31,681 | |
| | |
| Asset-Backed Securities – (continued) | |
| Home Equity – (continued) | |
| Credit-Based Asset Servicing and Securitization LLC
Series 2005-CB8, Class AF3(j) |
|
| 9,006,000 | | | | 3.872 | | | | 12/25/35 | | | | 9,148,111 | |
| First Franklin Mortgage Loan Trust Series 2006-FF12, Class A4(f)
(1M USD LIBOR + 0.140%) |
|
| | 1,532,438 | | | | 1.374 | | | | 09/25/36 | | | | 1,521,131 | |
| HSI Asset Securitization Corp. Trust Series 2006-OPT1,
Class 2A4(f) (1M USD LIBOR + 0.300%) |
|
| | 8,600,000 | | | | 1.534 | | | | 12/25/35 | | | | 8,562,404 | |
| JPMorgan Mortgage Acquisition Trust Series 2006-CH1,
Class A5(f) (1M USD LIBOR + 0.230%) |
|
| | 2,698,208 | | | | 1.464 | | | | 07/25/36 | | | | 2,693,370 | |
| Lehman XS Trust Series 2007-3, Class 1BA2(f)
(6M USD LIBOR + 0.500%) |
|
| | 260,342 | | | | 1.957 | | | | 03/25/37 | | | | 218,718 | |
| Saxon Asset Securities Trust Series 2007-2, Class A2C(f)
(1M USD LIBOR + 0.240%) |
|
| | 5,932,698 | | | | 1.474 | | | | 05/25/47 | | | | 4,741,193 | |
| Structured Asset Securities Corp. Mortgage Loan Trust
Series 2007-EQ1, Class A1(f) (1M USD LIBOR + 0.215%) |
|
| | 4,783,937 | | | | 1.449 | | | | 03/25/37 | | | | 3,861,858 | |
| Vericrest Opportunity Loan Trust XXV LLC Series 2015-NPL8,
Class A1(g)(j) |
|
| | 4,446,563 | | | | 3.500 | | | | 06/26/45 | | | | 4,448,046 | |
| Wachovia Mortgage Loan Trust Series 2005-WMC1, Class M1(f)
(1M USD LIBOR + 0.660%) |
|
| | 2,600,593 | | | | 1.894 | | | | 10/25/35 | | | | 2,590,568 | |
| | | | | | | | | | | | | | |
| | | | | | | | | | | | | 43,433,127 | |
| | |
| Home Equity – 0.6% | |
| ACE Securities Corp. Home Equity Loan Trust Series 2007-
ASAP1, Class A2C(f) (1M USD LIBOR + 0.260%) |
|
| | 9,699,763 | | | | 1.494 | | | | 03/25/37 | | | | 5,894,071 | |
| ACE Securities Corp. Home Equity Loan Trust Series 2007-HE2,
Class A2D(f) (1M USD LIBOR + 0.270%) |
|
| | 16,641,000 | | | | 1.504 | | | | 05/25/36 | | | | 15,191,660 | |
| Bayview Financial Mortgage Pass-Through Trust Series 2006-A,
Class M3(f) (1M USD LIBOR + 0.650%) |
|
| | 10,095,000 | | | | 1.884 | | | | 02/28/41 | | | | 9,678,644 | |
| | GSAA Home Equity Trust Series 2007-10, Class A2A | |
| | 3,694,360 | | | | 6.500 | | | | 11/25/37 | | | | 2,804,440 | |
| Morgan Stanley Mortgage Loan Trust Series 2006-16AX,
Class 1A(f) (1M USD LIBOR + 0.170%) |
|
| | 913,431 | | | | 1.404 | | | | 11/25/36 | | | | 363,108 | |
| Morgan Stanley Mortgage Loan Trust Series 2007-1XS,
Class 2A1(f) (1M USD LIBOR + 0.080%) |
|
| | 7,131,273 | | | | 1.314 | | | | 09/25/46 | | | | 3,093,872 | |
| Securitized Asset Backed Receivables LLC Trust
Series 2004-DO1, Class M1(f) (1M USD LIBOR + 0.975%) |
|
| | 3,788,685 | | | | 2.209 | | | | 07/25/34 | | | | 3,790,981 | |
| | | | | | | | | | | | | | |
| | | | | | | | | | | | | 40,816,776 | |
| | |
| Student Loan(f) – 11.2% | |
| Academic Loan Funding Trust Series 2012-1A, Class A2(g)
(1M USD LIBOR + 1.100%) |
|
| | 46,600,000 | | | | 2.334 | | | | 12/27/44 | | | | 46,513,166 | |
| | |
| | |
| 92 | | The accompanying notes are an integral part of these financial statements. |
GOLDMAN SACHS STRATEGIC INCOME FUND
| | | | | | | | | | | | | | |
Principal
Amount | | | Interest
Rate | | | Maturity
Date | | | Value | |
| Asset-Backed Securities – (continued) | |
| Student Loan(f) – (continued) | |
| Access Group, Inc. Series 2015-1, Class A(g) (1M USD LIBOR +
0.700%) |
|
| $ | 29,744,251 | | | | 1.934 | % | | | 07/25/56 | | | $ | 29,780,717 | |
| Bank of America Student Loan Trust Series 2010-1A, Class A(g)
(3M USD LIBOR + 0.800%) |
|
| | 121,695 | | | | 1.956 | | | | 02/25/43 | | | | 122,289 | |
| EFS Volunteer No. 2 LLC Series 2012-1, Class A2(g)
(1M USD LIBOR + 1.350%) |
|
| | 40,450,000 | | | | 2.584 | | | | 03/25/36 | | | | 41,019,330 | |
| EFS Volunteer No. 3 LLC Series 2012-1, Class A3(g)
(1M USD LIBOR + 1.000%) |
|
| | 25,300,000 | | | | 2.234 | | | | 04/25/33 | | | | 25,299,982 | |
| GCO Education Loan Funding Trust Series 2006-1, Class A8L
(3M USD LIBOR + 0.130%) |
|
| | 2,424,081 | | | | 1.319 | | | | 05/25/25 | | | | 2,419,253 | |
| Higher Education Funding I Series 2005-1, Class A4
(3M USD LIBOR + 0.140%) |
|
| | 4,286,658 | | | | 1.329 | | | | 02/25/30 | | | | 4,285,524 | |
| Montana Higher Education Student Assistance Corp.
Series 2012-1, Class A3 (1M USD LIBOR + 1.050%) |
|
| | 22,700,000 | | | | 2.281 | | | | 07/20/43 | | | | 22,677,895 | |
| Nelnet Student Loan Trust Series 2005-4, Class A3
(3M USD LIBOR + 0.130%) |
|
| | 10,841,280 | | | | 1.417 | | | | 06/22/26 | | | | 10,837,518 | |
| Nelnet Student Loan Trust Series 2006-1, Class A6(g)
(3M USD LIBOR + 0.450%) |
|
| | 40,900,000 | | | | 1.636 | | | | 08/23/36 | | | | 39,816,682 | |
| Panhandle-Plains Higher Education Authority, Inc. Series 2011-1,
Class A2 (3M USD LIBOR + 0.950%) |
|
| | 3,105,941 | | | | 2.098 | | | | 07/01/24 | | | | 3,119,510 | |
| Scholar Funding Trust Series 2010-A, Class A(g)
(3M USD LIBOR + 0.750%) |
|
| | 27,777,355 | | | | 1.922 | | | | 10/28/41 | | | | 27,596,066 | |
| SLC Student Loan Trust Series 2005-3, Class A3
(3M USD LIBOR + 0.120%) |
|
| | 8,800,000 | | | | 1.366 | | | | 06/15/29 | | | | 8,751,672 | |
| SLM Student Loan Trust Series 2003-14, Class A5
(3M USD LIBOR + 0.230%) |
|
| | 7,946,251 | | | | 1.386 | | | | 01/25/23 | | | | 7,950,186 | |
| SLM Student Loan Trust Series 2003-7A, Class A5A(g)
(3M USD LIBOR + 1.200%) |
|
| | 32,543,009 | | | | 2.446 | | | | 12/15/33 | | | | 32,943,272 | |
| SLM Student Loan Trust Series 2004-8A, Class A6(g)
(3M USD LIBOR + 0.630%) |
|
| | 20,350,000 | | | | 1.786 | | | | 01/25/40 | | | | 20,355,983 | |
| SLM Student Loan Trust Series 2005-4, Class A3
(3M USD LIBOR + 0.120%) |
|
| | 53,513,233 | | | | 1.276 | | | | 01/25/27 | | | | 53,319,445 | |
| SLM Student Loan Trust Series 2005-5, Class A4
(3M USD LIBOR + 0.140%) |
|
| | 12,900,000 | | | | 1.296 | | | | 10/25/28 | | | | 12,836,202 | |
| SLM Student Loan Trust Series 2005-5, Class A5
(3M USD LIBOR + 0.750%) |
|
| | 8,203,000 | | | | 1.906 | | | | 10/25/40 | | | | 8,087,540 | |
| | |
| Asset-Backed Securities – (continued) | |
| Student Loan(f) – (continued) | |
| SLM Student Loan Trust Series 2006-10, Class A5A
(3M USD LIBOR + 0.100%) |
|
| 284,722 | | | | 0.256 | | | | 04/25/27 | | | | 283,915 | |
| SLM Student Loan Trust Series 2007-1, Class A5
(3M USD LIBOR + 0.090%) |
|
| | 38,010,773 | | | | 1.246 | | | | 01/26/26 | | | | 37,932,877 | |
| SLM Student Loan Trust Series 2007-2, Class A4
(3M USD LIBOR + 0.060%) |
|
| | 81,200,000 | | | | 1.216 | | | | 07/25/22 | | | | 78,829,041 | |
| SLM Student Loan Trust Series 2008-2, Class A3
(3M USD LIBOR + 0.750%) |
|
| | 15,830,914 | | | | 1.906 | | | | 04/25/23 | | | | 15,802,837 | |
| SLM Student Loan Trust Series 2008-3, Class A3
(3M USD LIBOR + 1.000%) |
|
| | 17,021,417 | | | | 2.156 | | | | 10/25/21 | | | | 17,017,496 | |
| SLM Student Loan Trust Series 2008-4, Class A4
(3M USD LIBOR + 1.650%) |
|
| | 45,219,521 | | | | 2.806 | | | | 07/25/22 | | | | 46,299,254 | |
| SLM Student Loan Trust Series 2008-5, Class A4
(3M USD LIBOR + 1.700%) |
|
| | 69,828,567 | | | | 2.856 | | | | 07/25/23 | | | | 71,835,719 | |
| SLM Student Loan Trust Series 2008-6, Class A4
(3M USD LIBOR + 1.100%) |
|
| | 22,590,000 | | | | 2.256 | | | | 07/25/23 | | | | 22,791,722 | |
| SLM Student Loan Trust Series 2008-8, Class A4
(3M USD LIBOR + 1.500%) |
|
| | 13,600,000 | | | | 2.656 | | | | 04/25/23 | | | | 13,919,574 | |
| SunTrust Student Loan Trust Series 2006-1A, Class A4(g)
(3M USD LIBOR + 0.190%) |
|
| | 28,361,602 | | | | 1.362 | | | | 10/28/37 | | | | 26,728,277 | |
| Wachovia Student Loan Trust Series 2005-1, Class A5
(3M USD LIBOR + 0.130%) |
|
| | 6,456,671 | | | | 1.286 | | | | 01/26/26 | | | | 6,454,639 | |
| | | | | | | | | | | | | | |
| | | | | | | | | | | | | 735,627,583 | |
| | |
| | TOTAL ASSET-BACKED SECURITIES | |
| | (Cost $2,050,718,996) | | | $ | 2,096,589,388 | |
| | |
| | | | | | | | | | | | | | |
| Foreign Debt Obligations – 24.2% | |
| Sovereign – 24.2% | |
| | Brazil Notas do Tesouro Nacional | |
| BRL | 73,699,000 | | | | 10.000 | % | | | 01/01/27 | | | $ | 23,705,812 | |
| | 13,895,608 | | | | 6.000 | | | | 08/15/40 | | | | 4,908,761 | |
| | 5,066,890 | | | | 6.000 | | | | 08/15/50 | | | | 1,800,649 | |
| | Dominican Republic | |
| DOP | 61,100,000 | | | | 10.375 | | | | 03/04/22 | | | | 1,303,482 | |
| | 98,700,000 | | | | 14.500 | | | | 02/10/23 | | | | 2,426,203 | |
| $ | 15,330,000 | | | | 6.600 | | | | 01/28/24 | | | | 17,169,600 | |
| | 16,140,000 | | | | 6.600 | (g) | | | 01/28/24 | | | | 18,076,800 | |
| | 9,312,000 | | | | 5.875 | | | | 04/18/24 | | | | 10,080,240 | |
| | 55,610,000 | | | | 5.500 | (g) | | | 01/27/25 | | | | 58,668,550 | |
| | 2,784,000 | | | | 8.625 | | | | 04/20/27 | | | | 3,358,200 | |
| DOP | 30,000,000 | | | | 18.500 | | | | 02/04/28 | | | | 890,518 | |
| | 58,700,000 | | | | 11.375 | | | | 07/06/29 | | | | 1,279,448 | |
| | |
| | |
| The accompanying notes are an integral part of these financial statements. | | 93 |
GOLDMAN SACHS STRATEGIC INCOME FUND
Schedule of Investments (continued)
September 30, 2017 (Unaudited)
| | | | | | | | | | | | | | |
Principal
Amount | | | Interest
Rate | | | Maturity
Date | | | Value | |
| Foreign Debt Obligations – (continued) | |
| Sovereign – (continued) | |
| | Japan Treasury Discount Bill(k) | |
| JPY | 89,718,100,000 | | | | 0.000 | % | | | 02/13/18 | | | $ | 797,712,510 | |
| | Japanese Government CPI Linked Bond | |
| | 4,678,716,600 | | | | 0.100 | | | | 09/10/24 | | | | 43,159,367 | |
| | 27,532,158,652 | | | | 0.100 | | | | 03/10/26 | | | | 254,585,302 | |
| | Perusahaan Penerbit SBSN(g) | |
| $ | 1,860,000 | | | | 3.400 | | | | 03/29/22 | | | | 1,893,871 | |
| | 30,900,000 | | | | 4.150 | | | | 03/29/27 | | | | 31,859,754 | |
| | Republic of Argentina | |
| EUR | 460,000 | | | | 2.260 | (j) | | | 12/31/38 | | | | 371,058 | |
| $ | 65,550,000 | | | | 7.125 | (g) | | | 06/28/17 | | | | 65,418,900 | |
| | Republic of Ecuador | |
| | 23,990,000 | | | | 9.650 | | | | 12/13/26 | | | | 25,189,500 | |
| | 10,400,000 | | | | 9.625 | (g) | | | 06/02/27 | | | | 10,868,000 | |
| | 10,810,000 | | | | 9.625 | | | | 06/02/27 | | | | 11,296,450 | |
| | Republic of Indonesia | |
| EUR | 2,510,000 | | | | 2.625 | (g) | | | 06/14/23 | | | | 3,155,689 | |
| $ | 23,015,000 | | | | 5.875 | | | | 01/15/24 | | | | 26,383,245 | |
| EUR | 11,900,000 | | | | 2.150 | (g) | | | 07/18/24 | | | | 14,468,972 | |
| $ | 39,150,000 | | | | 3.850 | (g) | | | 07/18/27 | | | | 40,271,647 | |
| | Republic of South Africa | |
| ZAR | 190,720,000 | | | | 7.000 | | | | 02/28/31 | | | | 11,731,811 | |
| | 389,245,000 | | | | 8.250 | | | | 03/31/32 | | | | 26,280,172 | |
| | 70,190,000 | | | | 8.875 | | | | 02/28/35 | | | | 4,898,496 | |
| | 79,330,000 | | | | 8.500 | | | | 01/31/37 | | | | 5,274,967 | |
| | 39,710,000 | | | | 6.500 | | | | 02/28/41 | | | | 2,079,056 | |
| | 38,960,000 | | | | 8.750 | | | | 01/31/44 | | | | 2,599,583 | |
| | 126,555,000 | | | | 8.750 | | | | 02/28/48 | | | | 8,454,348 | |
| | Republic of Venezuela | |
| $ | 120,000 | | | | 6.000 | | | | 12/09/20 | | | | 46,200 | |
| | 5,030,000 | | | | 9.250 | | | | 05/07/28 | | | | 1,722,775 | |
| | United Mexican States | |
| MXN | 269,823,600 | | | | 4.750 | | | | 06/14/18 | | | | 14,585,056 | |
| | 352,713,800 | | | | 6.500 | | | | 06/10/21 | | | | 19,223,472 | |
| | 356,579,600 | | | | 6.500 | | | | 06/09/22 | | | | 19,393,753 | |
| | 88,039,300 | | | | 8.000 | | | | 12/07/23 | | | | 5,137,022 | |
| | 1,546,000 | | | | 7.750 | | | | 11/23/34 | | | | 89,961 | |
| | 15,377,700 | | | | 8.500 | | | | 11/18/38 | | | | 961,374 | |
| | 2,663,200 | | | | 8.000 | | | | 11/07/47 | | | | 159,364 | |
| | |
| | TOTAL FOREIGN DEBT OBLIGATIONS | |
| | (Cost $1,619,776,975) | | | $ | 1,592,939,938 | |
| | |
| | | | | | | | | | | | | | |
| Structured Notes(k) – 2.1% | |
| | Arab Republic of Egypt (Issuer Citibank NA) | |
| $ | 345,115,000 | | | | 0.000 | %(g) | | | 11/02/17 | | | $ | 19,242,948 | |
| | 300,250,000 | | | | 0.000 | | | | 11/09/17 | | | | 16,680,972 | |
| | 314,550,000 | | | | 0.000 | | | | 02/08/18 | | | | 16,744,931 | |
| | 32,375,000 | | | | 0.000 | | | | 03/08/18 | | | | 1,703,347 | |
| | 418,040,000 | | | | 0.000 | (g) | | | 05/03/18 | | | | 21,393,937 | |
| | 595,900,000 | | | | 0.000 | (g) | | | 05/10/18 | | | | 30,307,170 | |
| | Arab Republic of Egypt (Issuer HSBC Bank PLC)(g) | |
| | 56,000,000 | | | | 0.000 | | | | 06/07/18 | | | | 2,827,001 | |
| | |
| Structured Notes(k) – (continued) | |
| | Arab Republic of Egypt (Issuer JPMorgan Chase Bank NA)(g) | |
| 270,750,000 | | | | 0.000 | | | | 02/15/18 | | | | 14,360,948 | |
| | 212,425,000 | | | | 0.000 | | | | 05/17/18 | | | | 10,798,411 | |
| | 127,600,000 | | | | 0.000 | | | | 07/26/18 | | | | 6,289,270 | |
| | |
| | TOTAL STRUCTURED NOTES | |
| | (Cost $137,158,228) | | | $ | 140,348,935 | |
| | |
| | | | | | | | | | | | | | |
| Municipal Debt Obligations – 1.4% | |
| Illinois – 0.3% | |
| | Illinois State GO Bonds Build America Series 2010(e) | |
| $ | 4,470,000 | | | | 7.350 | % | | | 07/01/35 | | | $ | 5,126,375 | |
| | Illinois State GO Bonds Taxable-Pension Series 2003 | |
| | 13,800,000 | | | | 5.100 | | | | 06/01/33 | | | | 13,955,940 | |
| | | | | | | | | | | | | | |
| | | | | | | | | | | | | 19,082,315 | |
| | |
| Minnesota(e)(f) – 0.1% | |
| Northstar Education Finance, Inc. (Student Loan Asset Backed)
Series 2007-1, Class A1 |
|
| | 8,347,150 | | | | 1.272 | | | | 04/28/30 | | | | 8,295,064 | |
| | |
| Puerto Rico(e) – 0.9% | |
| Puerto Rico Commonwealth Aqueduct & Sewer Authority RB
(Senior Lien) Series 2008 A |
|
| | 1,655,000 | | | | 6.000 | | | | 07/01/38 | | | | 1,253,663 | |
| Puerto Rico Commonwealth Aqueduct & Sewer Authority RB
(Senior Lien) Series 2012 A |
|
| | 45,000 | | | | 5.250 | | | | 07/01/42 | | | | 32,175 | |
| Puerto Rico Commonwealth Aqueduct & Sewer Authority RB
(Senior Lien) Series 2012 D |
|
| | 2,695,000 | | | | 5.000 | | | | 07/01/33 | | | | 1,926,925 | |
| Puerto Rico Commonwealth GO Bonds for Public Improvement
Series 2011 A(i) |
|
| | 3,035,000 | | | | 5.750 | | | | 07/01/41 | | | | 1,403,688 | |
| Puerto Rico Commonwealth GO Bonds Refunding for Public
Improvement Series 2008 A(i) |
|
| | 1,495,000 | | | | 5.500 | | | | 07/01/32 | | | | 689,569 | |
| Puerto Rico Commonwealth GO Bonds Refunding for Public
Improvement Series 2009 B(i) |
|
| | 1,160,000 | | | | 5.875 | | | | 07/01/36 | | | | 542,300 | |
| | 3,340,000 | | | | 5.750 | | | | 07/01/38 | | | | 1,528,050 | |
| | 2,170,000 | | | | 6.000 | | | | 07/01/39 | | | | 1,014,475 | |
| Puerto Rico Commonwealth GO Bonds Refunding for Public
Improvement Series 2011 A(i) |
|
| | 1,120,000 | | | | 6.000 | | | | 07/01/34 | | | | 501,200 | |
| Puerto Rico Commonwealth GO Bonds Refunding for Public
Improvement Series 2011 E(i) |
|
| | 1,010,000 | | | | 5.625 | | | | 07/01/32 | | | | 467,125 | |
| Puerto Rico Commonwealth GO Bonds Refunding for Public
Improvement Series 2012 A(i) |
|
| | 515,000 | | | | 5.500 | | | | 07/01/26 | | | | 240,763 | |
| | 1,975,000 | | | | 5.500 | | | | 07/01/39 | | | | 923,313 | |
| | 2,115,000 | | | | 5.000 | | | | 07/01/41 | | | | 959,681 | |
| | Puerto Rico Commonwealth GO Bonds Series 2014 A(i) | |
| | 4,300,000 | | | | 8.000 | | | | 07/01/35 | | | | 2,085,500 | |
| | |
| | |
| 94 | | The accompanying notes are an integral part of these financial statements. |
GOLDMAN SACHS STRATEGIC INCOME FUND
| | | | | | | | | | | | | | |
Principal
Amount | | | Interest
Rate | | | Maturity
Date | | | Value | |
| Municipal Debt Obligations – (continued) | |
| Puerto Rico(e) – (continued) | |
| Puerto Rico Commonwealth GO Bonds Unrefunded Balance for
Public Improvement Series 2001 A(i) |
|
| $ | 1,960,000 | | | | 5.125 | % | | | 07/01/31 | | | $ | 916,300 | |
| Puerto Rico Commonwealth GO Bonds Unrefunded Balance for
Public Improvement Series 2004 A(i) |
|
| | 455,000 | | | | 5.000 | | | | 07/01/34 | | | | 209,869 | |
| Puerto Rico Commonwealth GO Bonds Unrefunded Balance for
Public Improvement Series 2006 A(i) |
|
| | 605,000 | | | | 5.250 | | | | 07/01/27 | | | | 281,325 | |
| Puerto Rico Commonwealth GO Unrefunded Balance Refunding
for Public Improvement 2006 B(i) |
|
| | 670,000 | | | | 5.000 | | | | 07/01/35 | | | | 309,038 | |
| Puerto Rico Sales Tax Financing Corp. Sales Tax RB Capital
Appreciation Series 2010 A(k) |
|
| | 2,005,000 | | | | 0.000 | | | | 08/01/35 | | | | 127,137 | |
| Puerto Rico Sales Tax Financing Corp. Sales Tax RB Capital
Appreciation SubSeries 2010 C(k) |
|
| | 5,315,000 | | | | 0.000 | | | | 08/01/37 | | | | 302,955 | |
| | 4,330,000 | | | | 0.000 | | | | 08/01/38 | | | | 231,222 | |
| Puerto Rico Sales Tax Financing Corp. Sales Tax RB
SubSeries 2009 A(i) |
|
| | 1,650,000 | | | | 5.250 | | | | 08/01/27 | | | | 342,375 | |
| | 18,380,000 | | | | 6.750 | | | | 08/01/32 | | | | 3,859,800 | |
| | 16,765,000 | | | | 5.750 | | | | 08/01/37 | | | | 3,478,737 | |
| | 155,000 | | | | 6.375 | | | | 08/01/39 | | | | 32,550 | |
| Puerto Rico Sales Tax Financing Corp. Sales Tax RB
SubSeries 2010 A |
|
| | 9,275,000 | | | | 0.000 | (k) | | | 08/01/33 | | | | 1,646,312 | |
| | 6,845,000 | | | | 5.500 | (i) | | | 08/01/37 | | | | 1,420,337 | |
| | 18,845,000 | | | | 5.375 | (i) | | | 08/01/39 | | | | 3,910,337 | |
| | 48,210,000 | | | | 5.500 | (i) | | | 08/01/42 | | | | 10,003,575 | |
| Puerto Rico Sales Tax Financing Corp. Sales Tax RB
SubSeries 2010 C(i) |
|
| | 5,990,000 | | | | 5.375 | | | | 08/01/38 | | | | 1,242,925 | |
| | 60,650,000 | | | | 5.250 | | | | 08/01/41 | | | | 12,584,875 | |
| Puerto Rico Sales Tax Financing Corp. Sales Tax RB
SubSeries 2011 A-1(i) |
|
| | 12,240,000 | | | | 5.000 | | | | 08/01/43 | | | | 2,539,800 | |
| | 9,605,000 | | | | 5.250 | | | | 08/01/43 | | | | 1,993,037 | |
| Puerto Rico Sales Tax Financing Corp. Sales Tax RB Unrefunded
SubSeries 2009 A(i) |
|
| | 16,650,000 | | | | 5.500 | | | | 08/01/28 | | | | 3,454,875 | |
| | | | | | | | | | | | | | |
| | | | | | | | | | | | | 62,455,808 | |
| | |
| Texas(e)(f) – 0.1% | |
| Brazos Higher Education Authority, Inc. Series 2005-2,
Class I-A-11 |
|
| | 3,564,714 | | | | 1.456 | | | | 09/27/21 | | | | 3,560,444 | |
| | |
| | TOTAL MUNICIPAL DEBT OBLIGATIONS | |
| | (Cost $217,667,353) | | | $ | 93,393,631 | |
| | |
| U.S. Treasury Obligations – 4.4% | |
| | United States Treasury Bonds | |
| $ | 83,800,000 | | | | 2.875 | %(l) | | | 11/15/46 | | | $ | 84,110,063 | |
| | 3,140,000 | | | | 3.000 | | | | 05/15/47 | | | | 3,231,594 | |
| | United States Treasury Inflation Indexed Bonds | |
| | 42,623,352 | | | | 0.125 | (l) | | | 04/15/19 | | | | 42,795,124 | |
| | 32,121,635 | | | | 0.125 | | | | 04/15/21 | | | | 32,226,030 | |
| | 5,309,341 | | | | 0.125 | (l) | | | 07/15/24 | | | | 5,259,115 | |
| | 4,754,146 | | | | 0.250 | | | | 01/15/25 | | | | 4,709,837 | |
| | 81,490,402 | | | | 0.625 | | | | 01/15/26 | | | | 82,631,268 | |
| | 27,420,294 | | | | 0.125 | | | | 07/15/26 | | | | 26,680,769 | |
| | 7,859,120 | | | | 0.875 | | | | 02/15/47 | | | | 7,752,550 | |
| | |
| | TOTAL U.S. TREASURY OBLIGATIONS | |
| | (Cost $287,998,049) | | | $ | 289,396,350 | |
| | |
| | | | | | |
| Shares | | Description | | Value | |
| Common Stock(c)(d)(i) – 1.1% | |
| Oil, Gas & Consumable Fuels – 1.1% | |
| 7,667,598 | | Blue Ridge Mountain Resources, Inc. | | | | |
| (Cost $76,509,670) | | $ | 75,142,460 | |
| |
| | | | | | | | |
| Shares | | Distribution
Rate | | | Value | |
| Investment Company(c) – 3.9% | |
Goldman Sachs Financial Square Government Fund – Institutional Shares | |
| 253,516,820 | | | 0.927 | % | | $ | 253,516,820 | |
| (Cost $253,516,820) | |
| |
| TOTAL INVESTMENTS BEFORE SHORT-TERM INVESTMENTS | |
| (Cost $6,437,830,373) | | | $ | 6,318,674,945 | |
| |
| | | | | | | | | | | | | | |
Principal
Amount | | | Interest
Rate | | | Maturity
Date | | | Value | |
| Short-term Investments(k) – 0.0% | |
| Commercial Paper – 0.0% | |
| | Electricite de France SA | |
| $ | 100,000 | | | | 0.000 | % | | | 01/05/18 | | | $ | 99,583 | |
| | (Cost $102,491) | | | | | |
| | |
| | TOTAL INVESTMENTS – 96.0% | | | | | |
| | (Cost $6,437,932,864) | | | | | | | $ | 6,318,774,528 | |
| | |
| OTHER ASSETS IN EXCESS OF
LIABILITIES – 4.0% |
| | | 261,250,134 | |
| | |
| | NET ASSETS – 100.0% | | | $ | 6,580,024,662 | |
| | |
| | |
| The accompanying notes are an integral part of these financial statements. | | 95 |
GOLDMAN SACHS STRATEGIC INCOME FUND
Schedule of Investments (continued)
September 30, 2017 (Unaudited)
| | |
| The percentage shown for each investment category reflects the value of investments in that category as a percentage of net assets. |
(a) | | Bank Loans often require prepayments from excess cash flows or permit the borrower to repay at its election. The degree to which borrowers repay, whether as a contractual requirement or at their election, cannot be predicted with accuracy. As a result, the actual remaining maturity may be substantially less than the stated maturities shown. The stated interest rate represents the weighted average interest rate of all contracts within the bank loan facility on September 30, 2017. Bank Loans typically have rates of interest which are predetermined either daily, monthly, quarterly or semi-annually by reference to a base lending rate, plus a premium. These base lending rates are primarily the London-Interbank Offered Rate (“LIBOR”), and secondarily the prime rate offered by one or more major United States banks (the “Prime Rate”) and the certificate of deposit (“CD”) rate or other base lending rates used by commercial lenders. |
(b) | | Significant unobservable inputs were used in the valuation of this portfolio security; i.e. Level 3. |
(c) | | Represents an Affiliated Issuer. |
(d) | | Restricted securities are not registered under the Securities Act of 1933 and are subject to legal restrictions on resale. These securities generally may be resold in transactions exempt from registration or to the public if the securities are subsequently registered and the registration statement is effective. Disposal of these securities may involve time consuming negotiations and prompt sale at an acceptable price may be difficult. Total market value of restricted securities amounts to $75,142,460, which represents approximately 1.1% of net assets as of September 30, 2017. |
| | | | | | | | | | |
| | | Restricted Security | | Acquisition Date | | | Cost | |
| | Blue Ridge Mountain Resources, Inc. (Common Stocks) | | | 05/06/16 – 08/18/16 | | | $ | 76,509,670 | |
| | |
(e) | | Security with “Call” features with resetting interest rates. Maturity dates disclosed are the final maturity dates. |
(f) | | Variable rate security. Interest rate disclosed is that which is in effect on September 30, 2017. |
(g) | | Exempt from registration under Rule 144A of the Securities Act of 1933. Such securities may be deemed liquid by the investment adviser and may be resold, normally to qualified institutional buyers in transactions exempt from registration. Total market value of Rule 144A securities amounts to $2,451,711,401, which represents approximately 37.3% of net assets as of September 30, 2017 and are unaudited. |
(h) | | Security with a notional or nominal principal amount. The actual effective yield of this security is different than the stated interest rate. |
(i) | | Security is currently in default and/or non-income producing. |
(j) | | Coupon changes periodically based upon a predetermined schedule. Interest rate disclosed is that which is in effect on September 30, 2017. |
(k) | | Issued with a zero coupon. Income is recognized through the accretion of discount. |
(l) | | All or a portion of security is segregated as collateral for initial margin requirements on futures transactions. |
|
Currency Abbreviations: |
ARS | | —Argentine Peso |
AUD | | —Australian Dollar |
BRL | | —Brazilian Real |
CAD | | —Canadian Dollar |
CHF | | —Swiss Franc |
CLP | | —Chilean Peso |
CNH | | —Chinese Yuan Renminbi Offshore |
CNY | | —Chinese Yuan Renminbi |
COP | | —Colombian Peso |
CZK | | —Czech Koruna |
DOP | | —Dominican Peso |
EGP | | —Egyptian Pound |
EUR | | —Euro |
GBP | | —British Pound |
HKD | | —Hong Kong Dollar |
HUF | | —Hungarian Forint |
IDR | | —Indonesian Rupiah |
INR | | —Indian Rupee |
JPY | | —Japanese Yen |
KRW | | —South Korean Won |
MXN | | —Mexican Peso |
NOK | | —Norwegian Krone |
NZD | | —New Zealand Dollar |
PEN | | —Peruvian Nuevo Sol |
PHP | | —Philippine Peso |
PLN | | —Polish Zloty |
RUB | | —Russian Ruble |
SEK | | —Swedish Krona |
SGD | | —Singapore Dollar |
THB | | —Thai Baht |
TRY | | —Turkish Lira |
TWD | | —Taiwan Dollar |
USD | | —U.S. Dollar |
ZAR | | —South African Rand |
| | |
Investment Abbreviations: |
AUDOR | | —Australian Dollar Offered Rate |
CDOR | | —Canadian Dollar Offered Rate |
CHFOR | | —Swiss Franc Offered Rate |
CLO | | —Collateralized Loan Obligation |
CPI | | —Consumer Price Index |
EURO | | —Euro Offered Rate |
FFCB | | —Federal Farm Credit Bank |
FHLMC | | —Federal Home Loan Mortgage Corp. |
FNMA | | —Federal National Mortgage Association |
GBP | | —British Pound Offered Rate |
GNMA | | —Government National Mortgage Association |
GO | | —General Obligation |
JYOR | | —Japanese Yen Offered Rate |
LIBOR | | —London Interbank Offered Rate |
LLC | | —Limited Liability Company |
LP | | —Limited Partnership |
NIBOR | | —Norwegian Interbank Offered Rate |
NZDOR | | —New Zealand Dollar Offered Rate |
OTC | | —Over the Counter |
PI | | —Private Investment |
PIK | | —Payment in Kind |
PLC | | —Public Limited Company |
RB | | —Revenue Bond |
REMIC | | —Real Estate Mortgage Investment Conduit |
STIBOR | | —Stockholm Interbank Offered Rate |
STRIPS | | —Separate Trading of Registered Interest and Principal of Securities |
TIIE | | —La Tasa de Interbank Equilibrium Interest Rate |
WIBOR | | —Warsaw Interbank Offered Rate |
|
| | |
| 96 | | The accompanying notes are an integral part of these financial statements. |
GOLDMAN SACHS STRATEGIC INCOME FUND
|
| ADDITIONAL INVESTMENT INFORMATION |
FORWARD FOREIGN CURRENCY EXCHANGE CONTRACTS — At September 30, 2017, the Fund had the following forward foreign currency exchange contracts:
FORWARD FOREIGN CURRENCY EXCHANGE CONTRACTS WITH UNREALIZED GAIN
| | | | | | | | | | | | | | | | | | | | | | | | |
| Counterparty | | Currency
Purchased | | | Currency
Sold | | | Current
Value | | | Settlement
Date | | | Unrealized
Gain | |
Morgan Stanley & Co. International PLC | | ARS | | | 245,950,000 | | | USD | | | 13,985,000 | | | $ | 14,166,811 | | | | 10/05/17 | | | $ | 181,811 | |
| | ARS | | | 416,450,708 | | | USD | | | 23,801,451 | | | | 23,973,905 | | | | 10/06/17 | | | | 172,454 | |
| | ARS | | | 549,048,402 | | | USD | | | 30,566,079 | | | | 31,534,570 | | | | 10/10/17 | | | | 968,490 | |
| | ARS | | | 88,429,736 | | | USD | | | 5,061,805 | | | | 5,076,042 | | | | 10/11/17 | | | | 14,237 | |
| | ARS | | | 43,429,826 | | | USD | | | 2,483,833 | | | | 2,491,528 | | | | 10/12/17 | | | | 7,695 | |
| | ARS | | | 426,656,324 | | | USD | | | 23,920,458 | | | | 24,323,376 | | | | 10/23/17 | | | | 402,917 | |
| | ARS | | | 214,680,117 | | | USD | | | 12,223,431 | | | | 12,224,823 | | | | 10/25/17 | | | | 1,392 | |
| | ARS | | | 165,209,429 | | | USD | | | 9,229,137 | | | | 9,381,036 | | | | 10/30/17 | | | | 151,899 | |
| | ARS | | | 322,678,320 | | | USD | | | 17,956,501 | | | | 18,312,492 | | | | 11/01/17 | | | | 355,991 | |
| | ARS | | | 174,091,507 | | | USD | | | 9,766,020 | | | | 9,874,544 | | | | 11/02/17 | | | | 108,525 | |
| | ARS | | | 268,920,427 | | | USD | | | 15,113,833 | | | | 15,211,579 | | | | 11/07/17 | | | | 97,746 | |
| | ARS | | | 222,205,591 | | | USD | | | 12,518,625 | | | | 12,562,268 | | | | 11/08/17 | | | | 43,644 | |
| | ARS | | | 403,846,982 | | | USD | | | 22,697,608 | | | | 22,769,046 | | | | 11/13/17 | | | | 71,438 | |
| | ARS | | | 154,966,145 | | | USD | | | 8,696,192 | | | | 8,718,044 | | | | 11/17/17 | | | | 21,852 | |
| | ARS | | | 138,689,887 | | | USD | | | 7,690,041 | | | | 7,772,790 | | | | 11/24/17 | | | | 82,749 | |
| | AUD | | | 43,334,150 | | | USD | | | 33,888,124 | | | | 33,958,944 | | | | 12/20/17 | | | | 70,821 | |
| | BRL | | | 909,755,255 | | | USD | | | 286,376,201 | | | | 287,119,077 | | | | 10/03/17 | | | | 742,877 | |
| | BRL | | | 614,927,028 | | | USD | | | 191,811,599 | | | | 193,237,466 | | | | 11/03/17 | | | | 1,425,867 | |
| | CAD | | | 6,624,155 | | | AUD | | | 6,704,000 | | | | 5,311,662 | | | | 12/20/17 | | | | 58,050 | |
| | CAD | | | 7,176,434 | | | USD | | | 5,753,690 | | | | 5,754,513 | | | | 12/20/17 | | | | 823 | |
| | CHF | | | 79,320,871 | | | EUR | | | 68,929,326 | | | | 82,373,922 | | | | 12/20/17 | | | | 530,045 | |
| | CNH | | | 341,556,348 | | | USD | | | 51,005,728 | | | | 51,137,059 | | | | 12/20/17 | | | | 131,331 | |
| | CZK | | | 403,850,754 | | | EUR | | | 15,003,000 | | | | 18,373,968 | | | | 10/03/17 | | | | 639,024 | |
| | CZK | | | 758,003,333 | | | EUR | | | 28,389,000 | | | | 34,553,567 | | | | 11/09/17 | | | | 928,820 | |
| | CZK | | | 1,694,828,967 | | | EUR | | | 63,355,855 | | | | 77,309,494 | | | | 11/21/17 | | | | 2,220,088 | |
| | CZK | | | 849,614,051 | | | EUR | | | 32,175,491 | | | | 38,757,202 | | | | 11/22/17 | | | | 620,715 | |
| | CZK | | | 4,929,211,038 | | | EUR | | | 189,438,856 | | | | 225,473,172 | | | | 12/20/17 | | | | 541,179 | |
| | CZK | | | 1,313,013,660 | | | EUR | | | 49,247,624 | | | | 60,139,920 | | | | 01/03/18 | | | | 1,616,031 | |
| | EUR | | | 11,382,000 | | | CHF | | | 12,991,984 | | | | 13,514,524 | | | | 12/20/17 | | | | 22,480 | |
| | EUR | | | 5,861,201 | | | GBP | | | 5,172,158 | | | | 6,959,352 | | | | 12/20/17 | | | | 11,028 | |
| | EUR | | | 11,295,000 | | | HUF | | | 3,502,091,669 | | | | 13,411,224 | | | | 12/20/17 | | | | 77,329 | |
| | EUR | | | 45,311,000 | | | NOK | | | 422,338,926 | | | | 53,800,438 | | | | 12/20/17 | | | | 672,369 | |
| | EUR | | | 16,117,943 | | | PLN | | | 69,225,003 | | | | 19,137,790 | | | | 12/20/17 | | | | 162,384 | |
| | EUR | | | 29,161,000 | | | SEK | | | 277,244,927 | | | | 34,624,586 | | | | 12/20/17 | | | | 418,846 | |
| | EUR | | | 427,244,298 | | | USD | | | 503,658,686 | | | | 505,291,638 | | | | 10/12/17 | | | | 1,632,951 | |
| | EUR | | | 97,566,191 | | | USD | | | 115,383,052 | | | | 115,846,126 | | | | 12/20/17 | | | | 463,075 | |
| | GBP | | | 43,012,760 | | | EUR | | | 48,037,055 | | | | 57,783,730 | | | | 12/20/17 | | | | 746,486 | |
| | GBP | | | 9,932,000 | | | JPY | | | 1,492,531,300 | | | | 13,342,738 | | | | 12/20/17 | | | | 24,177 | |
| | GBP | | | 479,063,610 | | | USD | | | 642,302,140 | | | | 642,867,516 | | | | 11/16/17 | | | | 565,376 | |
| | GBP | | | 34,444,030 | | | USD | | | 45,879,283 | | | | 46,272,421 | | | | 12/20/17 | | | | 393,138 | |
| | HKD | | | 289,473,734 | | | USD | | | 37,050,456 | | | | 37,059,611 | | | | 10/03/17 | | | | 9,155 | |
| | HKD | | | 429,182,575 | | | USD | | | 55,117,000 | | | | 55,163,233 | | | | 03/27/18 | | | | 46,233 | |
| | IDR | | | 369,330,310,627 | | | USD | | | 27,165,682 | | | | 27,342,881 | | | | 11/02/17 | | | | 177,199 | |
| | IDR | | | 570,081,593,104 | | | USD | | | 41,764,219 | | | | 41,980,014 | | | | 12/20/17 | | | | 215,795 | |
| | IDR | | | 440,459,575,585 | | | USD | | | 32,185,574 | | | | 32,430,968 | | | | 12/21/17 | | | | 245,395 | |
| | INR | | | 525,191,411 | | | USD | | | 7,994,000 | | | | 8,000,966 | | | | 11/03/17 | | | | 6,966 | |
| | INR | | | 2,116,159,197 | | | USD | | | 31,931,422 | | | | 31,991,925 | | | | 01/12/18 | | | | 60,503 | |
| | JPY | | | 1,509,348,906 | | | EUR | | | 11,252,000 | | | | 13,468,633 | | | | 12/20/17 | | | | 108,466 | |
| | |
| The accompanying notes are an integral part of these financial statements. | | 97 |
GOLDMAN SACHS STRATEGIC INCOME FUND
Schedule of Investments (continued)
September 30, 2017 (Unaudited)
|
| ADDITIONAL INVESTMENT INFORMATION (continued) |
FORWARD FOREIGN CURRENCY EXCHANGE CONTRACTS WITH UNREALIZED GAIN (continued)
| | | | | | | | | | | | | | | | | | | | | | | | |
| Counterparty | | Currency
Purchased | | | Currency
Sold | | | Current
Value | | | Settlement
Date | | | Unrealized
Gain | |
Morgan Stanley & Co. International PLC (continued) | | JPY | | | 14,638,929,809 | | | USD | | | 130,579,615 | | | $ | 130,630,085 | | | | 12/20/17 | | | $ | 50,469 | |
| | KRW | | | 13,365,250,348 | | | USD | | | 11,672,708 | | | | 11,673,550 | | | | 10/12/17 | | | | 842 | |
| | KRW | | | 2,867,432,756 | | | USD | | | 2,504,221 | | | | 2,504,674 | | | | 10/25/17 | | | | 454 | |
| | NZD | | | 36,269,159 | | | USD | | | 26,126,071 | | | | 26,155,750 | | | | 12/20/17 | | | | 29,679 | |
| | PHP | | | 1,689,503,810 | | | USD | | | 32,935,534 | | | | 33,211,345 | | | | 10/05/17 | | | | 275,811 | |
| | PHP | | | 813,931,348 | | | USD | | | 15,884,594 | | | | 15,987,515 | | | | 10/10/17 | | | | 102,921 | |
| | PHP | | | 741,938,360 | | | USD | | | 14,527,871 | | | | 14,564,449 | | | | 10/19/17 | | | | 36,578 | |
| | PHP | | | 2,653,436,491 | | | USD | | | 51,733,993 | | | | 51,991,467 | | | | 11/14/17 | | | | 257,474 | |
| | PLN | | | 49,083,830 | | | EUR | | | 11,331,000 | | | | 13,454,469 | | | | 12/20/17 | | | | 500 | |
| | PLN | | | 36,573,363 | | | HUF | | | 2,622,916,702 | | | | 10,025,199 | | | | 12/20/17 | | | | 38,683 | |
| | RUB | | | 4,448,732,770 | | | USD | | | 75,702,000 | | | | 76,143,119 | | | | 12/14/17 | | | | 441,119 | |
| | SEK | | | 305,691,649 | | | EUR | | | 31,680,963 | | | | 37,715,419 | | | | 12/20/17 | | | | 98,733 | |
| | SGD | | | 7,230,600 | | | USD | | | 5,329,000 | | | | 5,335,370 | | | | 12/20/17 | | | | 6,370 | |
| | TRY | | | 97,502,860 | | | USD | | | 26,616,491 | | | | 26,726,146 | | | | 12/20/17 | | | | 109,655 | |
| | TWD | | | 908,651,218 | | | USD | | | 29,761,594 | | | | 29,928,730 | | | | 10/20/17 | | | | 167,137 | |
| | TWD | | | 529,609,669 | | | USD | | | 17,424,335 | | | | 17,449,209 | | | | 10/26/17 | | | | 24,875 | |
| | USD | | | 14,175,792 | | | ARS | | | 245,950,000 | | | | 14,166,811 | | | | 10/05/17 | | | | 8,982 | |
| | USD | | | 113,834,026 | | | AUD | | | 142,220,000 | | | | 111,503,017 | | | | 11/08/17 | | | | 2,331,009 | |
| | USD | | | 312,954,122 | | | AUD | | | 391,425,088 | | | | 306,741,515 | | | | 12/20/17 | | | | 6,212,609 | |
| | USD | | | 54,383,000 | | | BRL | | | 170,993,761 | | | | 53,965,691 | | | | 10/03/17 | | | | 417,309 | |
| | USD | | | 6,263,222 | | | BRL | | | 19,920,178 | | | | 6,259,807 | | | | 11/03/17 | | | | 3,415 | |
| | USD | | | 160,020,974 | | | BRL | | | 511,187,000 | | | | 159,974,234 | | | | 12/04/17 | | | | 46,739 | |
| | USD | | | 108,153,973 | | | CAD | | | 131,634,201 | | | | 105,523,642 | | | | 11/06/17 | | | | 2,630,331 | |
| | USD | | | 162,818,957 | | | CAD | | | 200,869,266 | | | | 161,069,519 | | | | 12/20/17 | | | | 1,749,436 | |
| | USD | | | 14,818,120 | | | CHF | | | 14,249,000 | | | | 14,732,554 | | | | 10/18/17 | | | | 85,565 | |
| | USD | | | 13,461,000 | | | CHF | | | 12,885,273 | | | | 13,381,226 | | | | 12/20/17 | | | | 79,774 | |
| | USD | | | 13,779,000 | | | CLP | | | 8,513,672,067 | | | | 13,298,850 | | | | 10/12/17 | | | | 480,150 | |
| | USD | | | 13,571,273 | | | CLP | | | 8,492,685,609 | | | | 13,264,806 | | | | 10/16/17 | | | | 306,467 | |
| | USD | | | 85,412,403 | | | CNH | | | 567,805,181 | | | | 85,010,531 | | | | 12/20/17 | | | | 401,872 | |
| | USD | | | 6,205,473 | | | CNY | | | 41,361,963 | | | | 6,205,411 | | | | 11/10/17 | | | | 62 | |
| | USD | | | 13,461,000 | | | COP | | | 39,354,714,210 | | | | 13,355,995 | | | | 10/25/17 | | | | 105,005 | |
| | USD | | | 539,987,339 | | | EUR | | | 449,876,110 | | | | 534,164,593 | | | | 12/20/17 | | | | 5,822,743 | |
| | USD | | | 65,065,874 | | | GBP | | | 48,187,738 | | | | 64,735,844 | | | | 12/20/17 | | | | 330,030 | |
| | USD | | | 72,871,378 | | | HKD | | | 564,578,285 | | | | 72,279,621 | | | | 10/03/17 | | | | 591,757 | |
| | USD | | | 92,822,489 | | | HKD | | | 721,291,028 | | | | 92,359,988 | | | | 10/10/17 | | | | 462,500 | |
| | USD | | | 193,739,810 | | | HKD | | | 1,498,773,935 | | | | 192,638,797 | | | | 03/27/18 | | | | 1,101,014 | |
| | USD | | | 61,843,000 | | | HKD | | | 479,046,082 | | | | 61,618,707 | | | | 05/11/18 | | | | 224,293 | |
| | USD | | | 37,562,000 | | | HKD | | | 291,393,334 | | | | 37,546,333 | | | | 09/19/18 | | | | 15,667 | |
| | USD | | | 24,312,649 | | | IDR | | | 321,512,174,042 | | | | 23,849,244 | | | | 10/10/17 | | | | 463,406 | |
| | USD | | | 31,196,779 | | | IDR | | | 419,253,519,000 | | | | 31,083,296 | | | | 10/16/17 | | | | 113,484 | |
| | USD | | | 41,085,000 | | | IDR | | | 545,946,518,700 | | | | 40,469,222 | | | | 10/18/17 | | | | 615,778 | |
| | USD | | | 13,545,926 | | | INR | | | 885,226,280 | | | | 13,537,344 | | | | 10/05/17 | | | | 8,582 | |
| | USD | | | 37,116,930 | | | INR | | | 2,377,079,531 | | | | 36,321,187 | | | | 10/10/17 | | | | 795,743 | |
| | USD | | | 114,542,720 | | | INR | | | 7,359,644,206 | | | | 112,334,136 | | | | 10/18/17 | | | | 2,208,584 | |
| | USD | | | 26,631,347 | | | INR | | | 1,729,805,688 | | | | 26,378,430 | | | | 10/25/17 | | | | 252,917 | |
| | USD | | | 302,780,760 | | | JPY | | | 32,892,133,692 | | | | 292,677,628 | | | | 10/25/17 | | | | 10,103,132 | |
| | USD | | | 1,073,857,269 | | | JPY | | | 118,172,368,278 | | | | 1,052,214,649 | | | | 11/10/17 | | | | 21,642,621 | |
| | USD | | | 64,365,523 | | | JPY | | | 7,094,228,918 | | | | 63,305,155 | | | | 12/20/17 | | | | 1,060,368 | |
| | USD | | | 45,131,808 | | | KRW | | | 51,472,827,209 | | | | 44,945,182 | | | | 10/02/17 | | | | 186,627 | |
| | USD | | | 84,777,277 | | | KRW | | | 96,742,980,230 | | | | 84,496,819 | | | | 10/10/17 | | | | 280,457 | |
| | USD | | | 55,965,992 | | | KRW | | | 63,291,386,802 | | | | 55,280,309 | | | | 10/12/17 | | | | 685,683 | |
| | USD | | | 18,712,605 | | | KRW | | | 21,205,322,804 | | | | 18,522,641 | | | | 10/25/17 | | | | 189,964 | |
| | |
| 98 | | The accompanying notes are an integral part of these financial statements. |
GOLDMAN SACHS STRATEGIC INCOME FUND
|
| ADDITIONAL INVESTMENT INFORMATION (continued) |
FORWARD FOREIGN CURRENCY EXCHANGE CONTRACTS WITH UNREALIZED GAIN (continued)
| | | | | | | | | | | | | | | | | | | | | | | | |
| Counterparty | | Currency
Purchased | | | Currency
Sold | | | Current
Value | | | Settlement
Date | | | Unrealized
Gain | |
Morgan Stanley & Co. International PLC (continued) | | USD | | | 110,691,285 | | | KRW | | | 126,283,542,093 | | | $ | 110,323,420 | | | | 11/10/17 | | | $ | 367,864 | |
| | USD | | | 77,568,914 | | | MXN | | | 1,388,592,423 | | | | 76,175,327 | | | | 10/06/17 | | | | 1,393,586 | |
| | USD | | | 107,403,546 | | | MXN | | | 1,939,091,654 | | | | 105,111,308 | | | | 12/20/17 | | | | 2,292,237 | |
| | USD | | | 32,715,624 | | | NOK | | | 255,105,643 | | | | 32,044,263 | | | | 10/19/17 | | | | 671,362 | |
| | USD | | | 79,321,799 | | | NZD | | | 108,536,000 | | | | 78,333,987 | | | | 11/08/17 | | | | 987,812 | |
| | USD | | | 76,408,119 | | | NZD | | | 105,174,000 | | | | 75,846,942 | | | | 12/20/17 | | | | 561,178 | |
| | USD | | | 12,223,033 | | | PHP | | | 621,646,695 | | | | 12,210,595 | | | | 10/10/17 | | | | 12,438 | |
| | USD | | | 26,858,000 | | | PHP | | | 1,363,156,014 | | | | 26,746,334 | | | | 10/26/17 | | | | 111,666 | |
| | USD | | | 5,329,000 | | | PHP | | | 271,216,258 | | | | 5,319,217 | | | | 11/02/17 | | | | 9,783 | |
| | USD | | | 12,237,666 | | | PLN | | | 44,069,302 | | | | 12,076,625 | | | | 10/18/17 | | | | 161,040 | |
| | USD | | | 49,676,975 | | | RUB | | | 2,890,212,994 | | | | 49,467,982 | | | | 12/14/17 | | | | 208,993 | |
| | USD | | | 189,933,605 | | | SEK | | | 1,510,105,115 | | | | 185,605,059 | | | | 10/19/17 | | | | 4,328,546 | |
| | USD | | | 84,404,894 | | | SGD | | | 113,379,804 | | | | 83,661,549 | | | | 12/20/17 | | | | 743,345 | |
| | USD | | | 13,350,000 | | | THB | | | 444,856,310 | | | | 13,339,950 | | | | 10/11/17 | | | | 10,050 | |
| | USD | | | 109,487,735 | | | TRY | | | 393,472,828 | | | | 107,853,373 | | | | 12/20/17 | | | | 1,634,362 | |
| | USD | | | 36,377,263 | | | TWD | | | 1,086,593,673 | | | | 35,813,898 | | | | 10/02/17 | | | | 563,365 | |
| | USD | | | 5,476,000 | | | TWD | | | 164,197,860 | | | | 5,408,005 | | | | 10/19/17 | | | | 67,995 | |
| | USD | | | 253,399,322 | | | TWD | | | 7,634,578,737 | | | | 251,464,196 | | | | 10/20/17 | | | | 1,935,125 | |
| | USD | | | 71,805,217 | | | TWD | | | 2,163,420,785 | | | | 71,268,309 | | | | 10/23/17 | | | | 536,908 | |
| | USD | | | 49,321,328 | | | TWD | | | 1,489,750,698 | | | | 49,083,264 | | | | 10/26/17 | | | | 238,063 | |
| | USD | | | 6,438,510 | | | TWD | | | 195,157,668 | | | | 6,431,190 | | | | 10/31/17 | | | | 7,320 | |
| | USD | | | 159,972,171 | | | TWD | | | 4,781,039,077 | | | | 157,640,926 | | | | 11/10/17 | | | | 2,331,245 | |
| | USD | | | 34,155,392 | | | ZAR | | | 459,311,465 | | | | 33,678,552 | | | | 11/14/17 | | | | 476,840 | |
| | USD | | | 6,206,326 | | | ZAR | | | 85,053,419 | | | | 6,200,750 | | | | 12/20/17 | | | | 5,576 | |
| | | ZAR | | | 551,323,494 | | | USD | | | 40,050,000 | | | | 40,193,791 | | | | 12/20/17 | | | | 143,784 | |
| TOTAL | | | | | | | | | | | | | | | | | | | | | | $ | 101,723,720 | |
FORWARD FOREIGN CURRENCY EXCHANGE CONTRACTS WITH UNREALIZED LOSS
| | | | | | | | | | | | | | | | | | | | | | | | |
| Counterparty | | Currency
Purchased | | | Currency
Sold | | | Current
Value | | | Settlement
Date | | | Unrealized
Loss | |
Morgan Stanley & Co. International PLC | | ARS | | | 245,950,000 | | | USD | | | 13,962,532 | | | $ | 13,942,744 | | | | 11/03/17 | | | $ | (19,788 | ) |
| | ARS | | | 623,914,473 | | | USD | | | 35,428,461 | | | | 35,023,828 | | | | 11/21/17 | | | | (404,633 | ) |
| | AUD | | | 17,099,000 | | | NZD | | | 18,811,807 | | | | 13,399,686 | | | | 12/20/17 | | | | (166,577 | ) |
| | AUD | | | 143,476,141 | | | USD | | | 114,839,451 | | | | 112,487,854 | | | | 11/08/17 | | | | (2,351,597 | ) |
| | AUD | | | 249,118,820 | | | USD | | | 197,572,655 | | | | 195,222,753 | | | | 12/20/17 | | | | (2,349,899 | ) |
| | BRL | | | 448,155,611 | | | USD | | | 142,820,875 | | | | 141,438,068 | | | | 10/03/17 | | | | (1,382,808 | ) |
| | BRL | | | 391,385,135 | | | USD | | | 123,422,710 | | | | 122,990,645 | | | | 11/03/17 | | | | (432,066 | ) |
| | BRL | | | 103,582,216 | | | USD | | | 32,420,099 | | | | 32,415,702 | | | | 12/04/17 | | | | (4,396 | ) |
| | CAD | | | 179,645,194 | | | USD | | | 147,601,014 | | | | 144,011,321 | | | | 11/06/17 | | | | (3,589,693 | ) |
| | CAD | | | 260,202,699 | | | USD | | | 212,869,812 | | | | 208,646,777 | | | | 12/20/17 | | | | (4,223,034 | ) |
| | CHF | | | 14,965,575 | | | USD | | | 15,563,316 | | | | 15,473,448 | | | | 10/18/17 | | | | (89,868 | ) |
| | CNH | | | 734,883,856 | | | USD | | | 111,289,706 | | | | 110,025,181 | | | | 12/20/17 | | | | (1,264,525 | ) |
| | CNY | | | 178,867,246 | | | USD | | | 27,116,550 | | | | 26,866,318 | | | | 10/26/17 | | | | (250,231 | ) |
| | CNY | | | 248,223,994 | | | USD | | | 37,453,639 | | | | 37,150,568 | | | | 12/14/17 | | | | (303,072 | ) |
| | COP | | | 70,362,618,475 | | | USD | | | 24,190,401 | | | | 23,879,294 | | | | 10/25/17 | | | | (311,107 | ) |
| | EUR | | | 67,356,048 | | | CHF | | | 77,444,398 | | | | 79,975,831 | | | | 12/20/17 | | | | (449,394 | ) |
| | EUR | | | 15,520,782 | | | CZK | | | 403,850,754 | | | | 18,347,011 | | | | 10/03/17 | | | | (26,956 | ) |
| | EUR | | | 79,747,861 | | | GBP | | | 71,048,898 | | | | 94,689,366 | | | | 12/20/17 | | | | (758,365 | ) |
| | |
| The accompanying notes are an integral part of these financial statements. | | 99 |
GOLDMAN SACHS STRATEGIC INCOME FUND
Schedule of Investments (continued)
September 30, 2017 (Unaudited)
|
| ADDITIONAL INVESTMENT INFORMATION (continued) |
FORWARD FOREIGN CURRENCY EXCHANGE CONTRACTS WITH UNREALIZED LOSS (continued)
| | | | | | | | | | | | | | | | | | | | | | | | |
| Counterparty | | Currency
Purchased | | | Currency
Sold | | | Current
Value | | | Settlement
Date | | | Unrealized
Loss | |
Morgan Stanley & Co. International PLC (continued) | | EUR | | | 14,807,777 | | | USD | | | 17,857,882 | | | $ | 17,512,804 | | | | 10/12/17 | | | $ | (345,078 | ) |
| | EUR | | | 90,451,314 | | | USD | | | 108,488,484 | | | | 107,398,211 | | | | 12/20/17 | | | | (1,090,271 | ) |
| | GBP | | | 101,327,873 | | | EUR | | | 114,725,000 | | | | 136,124,780 | | | | 12/20/17 | | | | (95,018 | ) |
| | GBP | | | 135,921,551 | | | USD | | | 184,864,854 | | | | 182,598,239 | | | | 12/20/17 | | | | (2,266,617 | ) |
| | HKD | | | 275,104,551 | | | USD | | | 35,222,399 | | | | 35,220,010 | | | | 10/03/17 | | | | (2,390 | ) |
| | HKD | | | 197,964,173 | | | USD | | | 25,476,703 | | | | 25,444,518 | | | | 03/27/18 | | | | (32,185 | ) |
| | HUF | | | 3,540,813,696 | | | EUR | | | 11,368,000 | | | | 13,481,325 | | | | 12/20/17 | | | | (16,576 | ) |
| | HUF | | | 17,956,077,868 | | | USD | | | 70,707,139 | | | | 68,366,129 | | | | 12/20/17 | | | | (2,341,009 | ) |
| | IDR | | | 1,010,541,168,689 | | | USD | | | 75,559,557 | | | | 74,993,380 | | | | 10/05/17 | | | | (566,177 | ) |
| | IDR | | | 571,439,950,180 | | | USD | | | 42,826,062 | | | | 42,388,475 | | | | 10/10/17 | | | | (437,588 | ) |
| | IDR | | | 752,925,087,174 | | | USD | | | 56,128,187 | | | | 55,821,578 | | | | 10/16/17 | | | | (306,608 | ) |
| | IDR | | | 303,558,818,389 | | | USD | | | 22,757,700 | | | | 22,486,164 | | | | 10/26/17 | | | | (271,536 | ) |
| | IDR | | | 360,125,061,000 | | | USD | | | 26,700,000 | | | | 26,667,041 | | | | 10/31/17 | | | | (32,959 | ) |
| | IDR | | | 648,982,051,273 | | | USD | | | 48,179,811 | | | | 47,975,254 | | | | 11/16/17 | | | | (204,557 | ) |
| | INR | | | 3,001,385,477 | | | USD | | | 46,818,474 | | | | 45,898,759 | | | | 10/05/17 | | | | (919,714 | ) |
| | INR | | | 4,396,152,351 | | | USD | | | 68,348,064 | | | | 67,172,119 | | | | 10/10/17 | | | | (1,175,945 | ) |
| | INR | | | 9,488,367,862 | | | USD | | | 147,100,108 | | | | 144,825,970 | | | | 10/18/17 | | | | (2,274,138 | ) |
| | INR | | | 5,762,064,812 | | | USD | | | 88,470,211 | | | | 87,867,802 | | | | 10/25/17 | | | | (602,409 | ) |
| | INR | | | 5,489,553,700 | | | USD | | | 84,251,356 | | | | 83,701,082 | | | | 10/26/17 | | | | (550,274 | ) |
| | INR | | | 885,226,280 | | | USD | | | 13,495,332 | | | | 13,485,874 | | | | 11/03/17 | | | | (9,457 | ) |
| | JPY | | | 1,494,563,863 | | | EUR | | | 11,320,824 | | | | 13,336,699 | | | | 12/20/17 | | | | (105,187 | ) |
| | JPY | | | 785,786,823 | | | GBP | | | 5,383,429 | | | | 7,011,947 | | | | 12/20/17 | | | | (220,200 | ) |
| | JPY | | | 28,401,006,636 | | | USD | | | 258,784,999 | | | | 252,884,457 | | | | 11/10/17 | | | | (5,900,541 | ) |
| | JPY | | | 14,619,439,053 | | | USD | | | 132,820,034 | | | | 130,456,158 | | | | 12/20/17 | | | | (2,363,876 | ) |
| | KRW | | | 51,472,827,209 | | | USD | | | 45,792,555 | | | | 44,945,181 | | | | 10/02/17 | | | | (847,373 | ) |
| | KRW | | | 96,742,980,230 | | | USD | | | 85,829,983 | | | | 84,496,819 | | | | 10/10/17 | | | | (1,333,164 | ) |
| | KRW | | | 49,926,136,454 | | | USD | | | 44,185,728 | | | | 43,606,758 | | | | 10/12/17 | | | | (578,970 | ) |
| | KRW | | | 77,844,234,586 | | | USD | | | 68,562,401 | | | | 67,996,171 | | | | 10/25/17 | | | | (566,230 | ) |
| | KRW | | | 57,822,243,091 | | | USD | | | 51,110,728 | | | | 50,514,481 | | | | 11/10/17 | | | | (596,247 | ) |
| | KRW | | | 135,729,935,927 | | | USD | | | 119,041,793 | | | | 118,592,526 | | | | 11/22/17 | | | | (449,268 | ) |
| | MXN | | | 3,847,230,411 | | | USD | | | 213,173,527 | | | | 208,544,769 | | | | 12/20/17 | | | | (4,628,758 | ) |
| | NOK | | | 1,396,698,497 | | | EUR | | | 149,036,464 | | | | 175,697,502 | | | | 12/20/17 | | | | (1,262,334 | ) |
| | NOK | | | 67,461,592 | | | GBP | | | 6,358,602 | | | | 8,486,322 | | | | 12/20/17 | | | | (55,882 | ) |
| | NOK | | | 281,595,000 | | | USD | | | 36,112,711 | | | | 35,371,637 | | | | 10/19/17 | | | | (741,074 | ) |
| | NOK | | | 98,778,551 | | | USD | | | 12,648,564 | | | | 12,425,834 | | | | 12/20/17 | | | | (222,729 | ) |
| | NZD | | | 18,522,835 | | | EUR | | | 11,293,000 | | | | 13,357,868 | | | | 12/20/17 | | | | (50,981 | ) |
| | NZD | | | 114,489,497 | | | USD | | | 83,672,817 | | | | 82,630,821 | | | | 11/08/17 | | | | (1,041,996 | ) |
| | NZD | | | 222,730,872 | | | USD | | | 161,886,628 | | | | 160,623,877 | | | | 12/20/17 | | | | (1,262,751 | ) |
| | PEN | | | 45,412,707 | | | USD | | | 13,985,000 | | | | 13,908,611 | | | | 10/05/17 | | | | (76,389 | ) |
| | PEN | | | 89,391,174 | | | USD | | | 27,592,000 | | | | 27,373,438 | | | | 10/10/17 | | | | (218,562 | ) |
| | PEN | | | 92,142,432 | | | USD | | | 28,247,220 | | | | 28,130,570 | | | | 12/14/17 | | | | (116,650 | ) |
| | PLN | | | 966,205,688 | | | EUR | | | 226,166,273 | | | | 264,848,609 | | | | 12/20/17 | | | | (3,692,024 | ) |
| | PLN | | | 487,860,532 | | | USD | | | 137,410,912 | | | | 133,728,444 | | | | 12/20/17 | | | | (3,682,467 | ) |
| | RUB | | | 12,182,993,626 | | | USD | | | 209,158,735 | | | | 208,520,309 | | | | 12/14/17 | | | | (638,427 | ) |
| | SEK | | | 4,355,120,344 | | | EUR | | | 456,242,007 | | | | 537,323,123 | | | | 12/20/17 | | | | (4,400,077 | ) |
| | SEK | | | 1,478,272,000 | | | USD | | | 185,929,792 | | | | 181,692,492 | | | | 10/19/17 | | | | (4,237,300 | ) |
| | SEK | | | 85,239,604 | | | USD | | | 10,685,255 | | | | 10,516,635 | | | | 12/20/17 | | | | (168,620 | ) |
| | SGD | | | 95,363,571 | | | USD | | | 70,879,356 | | | | 70,367,595 | | | | 12/20/17 | | | | (511,761 | ) |
| | THB | | | 455,643,972 | | | USD | | | 13,779,000 | | | | 13,663,441 | | | | 10/11/17 | | | | (115,559 | ) |
| | TRY | | | 481,176,920 | | | USD | | | 136,112,967 | | | | 131,893,615 | | | | 12/20/17 | | | | (4,219,353 | ) |
| | TWD | | | 1,481,215,029 | | | USD | | | 49,281,842 | | | | 48,820,535 | | | | 10/02/17 | | | | (461,307 | ) |
| | TWD | | | 415,137,465 | | | USD | | | 13,831,000 | | | | 13,672,028 | | | | 10/05/17 | | | | (158,972 | ) |
| | |
| 100 | | The accompanying notes are an integral part of these financial statements. |
GOLDMAN SACHS STRATEGIC INCOME FUND
|
| ADDITIONAL INVESTMENT INFORMATION (continued) |
FORWARD FOREIGN CURRENCY EXCHANGE CONTRACTS WITH UNREALIZED LOSS (continued)
| | | | | | | | | | | | | | | | | | | | | | | | |
| Counterparty | | Currency
Purchased | | | Currency
Sold | | | Current
Value | | | Settlement
Date | | | Unrealized
Loss | |
Morgan Stanley & Co. International PLC (continued) | | TWD | | | 3,442,684,695 | | | USD | | | 113,939,082 | | | $ | 113,393,543 | | | | 10/20/17 | | | $ | (545,538 | ) |
| | TWD | | | 659,508,498 | | | USD | | | 21,912,463 | | | | 21,725,803 | | | | 10/23/17 | | | | (186,659 | ) |
| | TWD | | | 1,229,723,383 | | | USD | | | 40,628,058 | | | | 40,516,067 | | | | 10/26/17 | | | | (111,992 | ) |
| | USD | | | 18,669,097 | | | AUD | | | 23,913,000 | | | | 18,739,498 | | | | 12/20/17 | | | | (70,401 | ) |
| | USD | | | 364,589,904 | | | BRL | | | 1,186,917,103 | | | | 374,591,454 | | | | 10/03/17 | | | | (10,001,551 | ) |
| | USD | | | 13,350,000 | | | BRL | | | 42,760,184 | | | | 13,437,155 | | | | 11/03/17 | | | | (87,155 | ) |
| | USD | | | 13,461,000 | | | CHF | | | 13,011,133 | | | | 13,511,931 | | | | 12/20/17 | | | | (50,931 | ) |
| | USD | | | 5,856,376 | | | CNH | | | 39,223,080 | | | | 5,872,392 | | | | 12/20/17 | | | | (16,016 | ) |
| | USD | | | 28,053,208 | | | CNY | | | 187,562,346 | | | | 28,139,417 | | | | 11/10/17 | | | | (86,209 | ) |
| | USD | | | 10,680,000 | | | COP | | | 31,536,939,960 | | | | 10,695,510 | | | | 10/31/17 | | | | (15,510 | ) |
| | USD | | | 592,821,332 | | | EUR | | | 502,893,000 | | | | 594,759,553 | | | | 10/12/17 | | | | (1,938,221 | ) |
| | USD | | | 51,590,711 | | | EUR | | | 43,548,528 | | | | 51,707,750 | | | | 12/20/17 | | | | (117,040 | ) |
| | USD | | | 642,122,140 | | | GBP | | | 478,929,356 | | | | 642,687,357 | | | | 11/16/17 | | | | (565,217 | ) |
| | USD | | | 87,387,073 | | | GBP | | | 65,678,854 | | | | 88,233,566 | | | | 12/20/17 | | | | (846,493 | ) |
| | USD | | | 74,656,452 | | | IDR | | | 1,010,541,168,689 | | | | 74,993,381 | | | | 10/05/17 | | | | (336,929 | ) |
| | USD | | | 32,312,707 | | | INR | | | 2,116,159,197 | | | | 32,361,416 | | | | 10/05/17 | | | | (48,708 | ) |
| | USD | | | 13,397,000 | | | INR | | | 879,586,734 | | | | 13,411,357 | | | | 10/26/17 | | | | (14,357 | ) |
| | USD | | | 34,513,013 | | | INR | | | 2,278,356,917 | | | | 34,709,358 | | | | 11/03/17 | | | | (196,345 | ) |
| | USD | | | 64,666,314 | | | JPY | | | 7,271,882,902 | | | | 64,890,446 | | | | 12/20/17 | | | | (224,132 | ) |
| | USD | | | 65,433,208 | | | KRW | | | 75,151,060,231 | | | | 65,653,227 | | | | 11/10/17 | | | | (220,019 | ) |
| | USD | | | 11,677,399 | | | KRW | | | 13,365,250,348 | | | | 11,677,739 | | | | 11/22/17 | | | | (340 | ) |
| | USD | | | 26,154,911 | | | NZD | | | 36,434,739 | | | | 26,275,158 | | | | 12/20/17 | | | | (120,247 | ) |
| | USD | | | 13,460,000 | | | PHP | | | 689,308,809 | | | | 13,531,317 | | | | 10/19/17 | | | | (71,317 | ) |
| | USD | | | 13,458,000 | | | PHP | | | 687,777,819 | | | | 13,500,341 | | | | 10/20/17 | | | | (42,341 | ) |
| | USD | | | 13,350,000 | | | PHP | | | 682,365,759 | | | | 13,388,624 | | | | 10/26/17 | | | | (38,624 | ) |
| | USD | | | 91,179,661 | | | RUB | | | 5,369,212,855 | | | | 91,897,766 | | | | 12/14/17 | | | | (718,106 | ) |
| | USD | | | 66,449,943 | | | SGD | | | 90,498,884 | | | | 66,778,002 | | | | 12/20/17 | | | | (328,058 | ) |
| | USD | | | 8,010,000 | | | TRY | | | 29,226,007 | | | | 8,011,032 | | | | 12/20/17 | | | | (1,032 | ) |
| | USD | | | 13,006,637 | | | TWD | | | 394,621,357 | | | | 13,006,637 | | | | 10/02/17 | | | | — | |
| | USD | | | 13,642,375 | | | TWD | | | 415,137,465 | | | | 13,672,028 | | | | 10/05/17 | | | | (29,653 | ) |
| | USD | | | 24,240,420 | | | TWD | | | 740,229,715 | | | | 24,381,341 | | | | 10/20/17 | | | | (140,921 | ) |
| | USD | | | 28,053,208 | | | TWD | | | 853,473,966 | | | | 28,125,223 | | | | 10/31/17 | | | | (72,015 | ) |
| | | ZAR | | | 1,922,798,565 | | | USD | | | 145,078,981 | | | | 140,180,065 | | | | 12/20/17 | | | | (4,898,916 | ) |
| TOTAL | | | | | | | | | | | | | | | | | | | | | | $ | (98,984,537 | ) |
FUTURES CONTRACTS — At September 30, 2017, the Fund had the following futures contracts:
| | | | | | | | | | | | | | |
| Description | | Number of
Contracts | | | Expiration
Date | | Notional
Amount | | | Unrealized
Appreciation/
(Depreciation) | |
Long position contracts: | | | | | | | | | | | | | | |
10 Year German Euro-Bund | | | 810 | | | 12/07/17 | | $ | 154,141,202 | | | $ | (976,585 | ) |
10 Year U.S. Treasury Notes | | | 16,930 | | | 12/19/17 | | | 2,121,540,625 | | | | (22,958,330 | ) |
| TOTAL | | | $ | (23,934,915 | ) |
| | |
| The accompanying notes are an integral part of these financial statements. | | 101 |
GOLDMAN SACHS STRATEGIC INCOME FUND
Schedule of Investments (continued)
September 30, 2017 (Unaudited)
|
| ADDITIONAL INVESTMENT INFORMATION (continued) |
FUTURES CONTRACTS (continued)
| | | | | | | | | | | | | | |
| Description | | Number of
Contracts | | | Expiration
Date | | Notional
Amount | | | Unrealized
Appreciation/
(Depreciation) | |
Short position contracts: | | | | | | | | | | | | | | |
Eurodollars | | | (5,860 | ) | | 12/17/18 | | $ | (1,437,677,750 | ) | | $ | (524,939 | ) |
Italian 10 Year Government Bonds | | | (926 | ) | | 12/07/17 | | | (147,705,589 | ) | | | 292,497 | |
Japan 10 Year Government Bonds | | | (129 | ) | | 12/13/17 | | | (172,363,031 | ) | | | 830,746 | |
2 Year U.S. Treasury Notes | | | (1,813 | ) | | 12/29/17 | | | (391,069,767 | ) | | | 1,138,483 | |
5 Year U.S. Treasury Notes | | | (35,881 | ) | | 12/29/17 | | | (4,216,017,500 | ) | | | 27,768,472 | |
20 Year U.S. Treasury Bonds | | | (4,791 | ) | | 12/19/17 | | | (732,124,688 | ) | | | 10,121,911 | |
Ultra 10 Year U.S. Treasury Notes | | | (163 | ) | | 12/19/17 | | | (21,895,484 | ) | | | 256,458 | |
Ultra Long U.S. Treasury Bonds | | | (732 | ) | | 12/19/17 | | | (120,871,500 | ) | | | 2,088,651 | |
TOTAL | | | | | | | | | | | | $ | 41,972,279 | |
| TOTAL FUTURES CONTRACTS | | | $ | 18,037,364 | |
SWAP CONTRACTS — At September 30, 2017, the Fund had the following swap contracts:
OVER THE COUNTER INTEREST RATE SWAP CONTRACTS
| | | | | | | | | | | | | | | | | | |
| Payments Made by the Fund | | Payments
Received by
the Fund | | | Counterparty | | Termination
Date | | | Notional
Amount | | | Unrealized
Appreciation/
(Depreciation)* | |
1M BID Avg(a) | | | 11.935% | | | CS International (London) | | | 01/02/18 | | | BRL | 36,980 | | | $ | (143,896 | ) |
1M BID Avg(b) | | | 11.900 | | | Deutsche Bank AG | | | 01/02/18 | | | | 40 | | | | (168 | ) |
11.980%(b) | | | 1M BID Avg | | | MS & Co. Int. PLC | | | 01/04/21 | | | | 63,100 | | | | (1,146,191 | ) |
| TOTAL | | | | | | | | | | | | | | | | $ | (1,290,255 | ) |
| | * | | There are no upfront payments on the swap contracts, therefore the unrealized gain (loss) on the swap contracts is equal to their market value. |
| | (a) | | Payments made annually. |
| | (b) | | Payments made monthly. |
CENTRALLY CLEARED INTEREST RATE SWAP CONTRACTS
| | | | | | | | | | | | | | | | | | | | | | | | |
| Payments Made by the Fund | | Payments
Received
by Fund | | Termination
Date | | | Notional
Amount | | | Value | | | Upfront
Premium
(Received) Paid | | | Unrealized
Appreciation/
(Depreciation) | |
6M CDOR(a) | | 0.833% | | | 10/25/17 | | | CAD | | | 3,600,300 | | | $ | (691,148 | ) | | $ | 5,402 | | | $ | (696,550 | ) |
6M GBP(b) | | 0.297 | | | 12/14/17 | | | GBP | | | 10,901,620 | (c) | | | (1,253,527 | ) | | | 54,898 | | | | (1,308,425 | ) |
3M STIBOR(d) | | 0.050(b) | | | 06/15/18 | | | SEK | | | 9,855,220 | | | | 2,384,712 | | | | 1,862,234 | | | | 522,478 | |
3M STIBOR(d) | | 0.330(b) | | | 09/15/18 | | | | | | 4,356,760 | | | | 436,911 | | | | 92,651 | | | | 344,260 | |
0.330%(b) | | 3M STIBOR(d) | | | 09/15/18 | | | | | | 4,356,760 | | | | 22,029 | | | | (5,037 | ) | | | 27,066 | |
6M CHFOR | | 0.554 | | | 03/29/19 | | | CHF | | | 1,500,680 | (c) | | | 10,693 | | | | (15,629,746 | ) | | | 15,640,439 | |
1.826 | | 3M LIBOR | | | 05/11/19 | | | $ | | | 1,045,730 | (c) | | | (222,427 | ) | | | (460,805 | ) | | | 238,378 | |
6M WIBOR(e) | | 3.048(b) | | | 06/17/19 | | | PLN | | | 285,790 | | | | 1,734,871 | | | | 675,448 | | | | 1,059,423 | |
3.045(b) | | 6M WIBOR(e) | | | 06/17/19 | | | | | | 285,790 | | | | (1,729,165 | ) | | | 218 | | | | (1,729,383 | ) |
3M STIBOR(d) | | 0.100(b) | | | 06/29/19 | | | SEK | | | 5,775,130 | (c) | | | 38,218 | | | | (6,884,380 | ) | | | 6,922,598 | |
3M NIBOR(e) | | 1.000(b) | | | 09/20/19 | | | NOK | | | 2,023,480 | | | | (376,998 | ) | | | (554,665 | ) | | | 177,667 | |
6M CDOR(e) | | 1.250 | | | 12/20/19 | | | CAD | | | 902,940 | (c) | | | (10,338,057 | ) | | | (10,709,349 | ) | | | 371,292 | |
2.000(e) | | 3M LIBOR(b) | | | 12/20/19 | | | $ | | | 722,390 | (c) | | | (2,793,626 | ) | | | (4,441,116 | ) | | | 1,647,490 | |
6M GBP(a) | | 3.370% | | | 07/15/22 | | | GBP | | | 98,240 | | | | (523,285 | ) | | | 5,153 | | | | (528,438 | ) |
6M CDOR(e) | | 2.028 | | | 07/18/22 | | | CAD | | | 806,840 | (c) | | | (4,477,760 | ) | | | (1,774,821 | ) | | | (2,702,939 | ) |
Mexico IB TIIE 28D(f) | | 6.750 | | | 12/14/22 | | | MXN | | | 1,618,400 | (c) | | | (130,067 | ) | | | 9,088 | | | | (139,155 | ) |
6M EURO(e) | | 0.250(b) | | | 12/20/22 | | | EUR | | | 323,410 | (c) | | | (1,071,223 | ) | | | 12,756 | | | | (1,083,979 | ) |
3M STIBOR(d) | | 0.500(b) | | | 12/20/22 | | | SEK | | | 3,110,200 | (c) | | | (783,918 | ) | | | 273,941 | | | | (1,057,859 | ) |
| | |
| 102 | | The accompanying notes are an integral part of these financial statements. |
GOLDMAN SACHS STRATEGIC INCOME FUND
Schedule of Investments (continued)
September 30, 2017 (Unaudited)
|
| ADDITIONAL INVESTMENT INFORMATION (continued) |
CENTRALLY CLEARED INTEREST RATE SWAP CONTRACTS (continued)
| | | | | | | | | | | | | | | | | | | | | | | | |
| Payments Made by the Fund | | Payments
Received
by Fund | | Termination
Date | | | Notional
Amount | | | Value | | | Upfront
Premium
(Received) Paid | | | Unrealized
Appreciation/
(Depreciation) | |
6M CDOR(e) | | 1.750 % | | | 12/20/22 | | | CAD | | | 351,680 | (c) | | $ | (5,681,757 | ) | | $ | (5,837,277 | ) | | $ | 155,520 | |
2.250%(e) | | 3M LIBOR(d) | | | 12/20/22 | | | $ | | | 441,000 | (c) | | | (4,214,020 | ) | | | (7,231,924 | ) | | | 3,017,904 | |
2.500(e) | | 6M AUDOR | | | 12/20/22 | | | AUD | | | 313,340 | (c) | | | 1,828,264 | | | | (416,346 | ) | | | 2,244,610 | |
0.250(b) | | 6M EURO(d) | | | 12/20/22 | | | EUR | | | 14,930 | (c) | | | 49,452 | | | | 41,303 | | | | 8,149 | |
2.142(e) | | 3M LIBOR(d) | | | 07/03/23 | | | $ | | | 229,890 | (c) | | | (10,000 | ) | | | 386,607 | | | | (396,607 | ) |
3M LIBOR(d) | | 2.065(e) | | | 08/06/23 | | | | | | 583,060 | (c) | | | (2,503,018 | ) | | | 284,339 | | | | (2,787,357 | ) |
0.500(b) | | 6M EURO(e) | | | 12/20/24 | | | EUR | | | 20,100 | (c) | | | 144,989 | | | | (46,098 | ) | | | 191,087 | |
6M EURO(e) | | 1.330(b) | | | 01/12/27 | | | | | | 272,180 | (c) | | | (1,560,001 | ) | | | (3,659,072 | ) | | | 2,099,071 | |
6M GBP(e) | | 1.600(b) | | | 03/16/27 | | | GBP | | | 523,940 | (c) | | | (3,583,834 | ) | | | (28,468,945 | ) | | | 24,885,111 | |
6M EURO(e) | | 1.750 | | | 06/15/27 | | | EUR | | | 185,870 | (c) | | | 2,350,487 | | | | (8,504,160 | ) | | | 10,854,647 | |
6M GBP(b) | | 3.336 | | | 06/15/27 | | | GBP | | | 50,240 | | | | (465,213 | ) | | | (44,175 | ) | | | (421,038 | ) |
6M EURO(b) | | 1.428 | | | 08/15/27 | | | EUR | | | 106,640 | | | | (279,574 | ) | | | (403,378 | ) | | | 123,804 | |
3.352(a) | | 6M GBP | | | 08/15/27 | | | GBP | | | 53,270 | | | | 499,510 | | | | (15,418 | ) | | | 514,928 | |
3M LIBOR(d) | | 2.400(e) | | | 08/31/27 | | | $ | | | 143,750 | (c) | | | (1,120,014 | ) | | | (164,587 | ) | | | (955,427 | ) |
1.500(b) | | 6M EURO(e) | | | 08/31/27 | | | EUR | | | 125,840 | (c) | | | 532,424 | | | | (210,573 | ) | | | 742,997 | |
3.340(a) | | 6M GBP | | | 09/15/27 | | | GBP | | | 86,350 | | | | 509,679 | | | | 87,735 | | | | 421,944 | |
6M CDOR(e) | | 2.500 | | | 09/21/27 | | | CAD | | | 276,140 | (c) | | | (1,841,258 | ) | | | (795,300 | ) | | | (1,045,958 | ) |
2.500(e) | | 3M LIBOR(d) | | | 09/21/27 | | | $ | | | 222,490 | (c) | | | 836,918 | | | | (77,801 | ) | | | 914,719 | |
6M EURO(e) | | 1.000(b) | | | 12/20/27 | | | EUR | | | 353,130 | (c) | | | 1,701,261 | | | | 6,375,992 | | | | (4,674,731 | ) |
6M CDOR(e) | | 2.000 | | | 12/20/27 | | | CAD | | | 386,180 | (c) | | | (12,123,685 | ) | | | (10,061,741 | ) | | | (2,061,944 | ) |
2.500(e) | | 3M LIBOR(d) | | | 12/20/27 | | | $ | | | 183,300 | (c) | | | (3,109,428 | ) | | | (6,636,095 | ) | | | 3,526,667 | |
1.250(e) | | 6M GBP | | | 12/20/27 | | | GBP | | | 190,020 | (c) | | | 5,027,961 | | | | (3,726,886 | ) | | | 8,754,847 | |
0.250(e) | | 6M JYOR | | | 12/20/27 | | | JPY | | | 20,002,210 | (c) | | | 942,064 | | | | 517,278 | | | | 424,786 | |
6M CHFOR(e) | | 1.000(b) | | | 12/21/27 | | | CHF | | | 56,510 | (c) | | | 505,978 | | | | 937,091 | | | | (431,113 | ) |
6M GBP(e) | | 2.000 | | | 12/21/27 | | | GBP | | | 39,260 | (c) | | | 520,150 | | | | 544,875 | | | | (24,725 | ) |
6M CDOR(e) | | 2.500 | | | 12/21/27 | | | CAD | | | 347,540 | (c) | | | (2,641,722 | ) | | | (1,749,733 | ) | | | (891,989 | ) |
2.750(e) | | 3M LIBOR(d) | | | 12/21/27 | | | $ | | | 357,520 | (c) | | | (2,225,919 | ) | | | (3,004,735 | ) | | | 778,816 | |
4.000(e) | | 3M NZDOR | | | 12/21/27 | | | NZD | | | 85,150 | (c) | | | (259,392 | ) | | | (601,148 | ) | | | 341,756 | |
3M LIBOR(d) | | 2.378(e) | | | 07/03/28 | | | $ | | | 881,020 | (c) | | | (108,894 | ) | | | (1,322,951 | ) | | | 1,214,057 | |
2.346(e) | | 3M LIBOR(d) | | | 08/06/28 | | | | | | 327,060 | (c) | | | 1,261,209 | | | | (362,686 | ) | | | 1,623,895 | |
1.940(e) | | 6M GBP | | | 01/11/32 | | | GBP | | | 221,930 | (c) | | | 724,730 | | | | (103,094 | ) | | | 827,824 | |
6M EURO(b) | | 1.600 | | | 08/15/32 | | | EUR | | | 50,420 | | | | (294,349 | ) | | | (52,253 | ) | | | (242,096 | ) |
6M GBP(a) | | 3.461 | | | 08/15/32 | | | GBP | | | 48,330 | | | | (486,171 | ) | | | 22,029 | | | | (508,200 | ) |
6M GBP(a) | | 3.460 | | | 09/15/32 | | | | | | 78,230 | | | | (300,368 | ) | | | 54,674 | | | | (355,042 | ) |
1.500(e) | | 6M GBP | | | 12/20/32 | | | | | | 121,450 | (c) | | | 2,788,177 | | | | (3,753,481 | ) | | | 6,541,658 | |
1.750(e) | | 6M GBP | | | 03/17/37 | | | | | | 378,290 | (c) | | | 8,337,122 | | | | (17,900,226 | ) | | | 26,237,348 | |
6M EURO(e) | | 2.000(b) | | | 06/16/37 | | | EUR | | | 55,350 | (c) | | | (1,037,775 | ) | | | (24,368 | ) | | | (1,013,407 | ) |
2.750(e) | | 3M LIBOR(d) | | | 06/16/37 | | | $ | | | 94,830 | (c) | | | 104,066 | | | | (148,010 | ) | | | 252,076 | |
6M GBP(a) | | 3.507 | | | 08/15/42 | | | GBP | | | 19,590 | | | | (365,511 | ) | | | 10,051 | | | | (375,562 | ) |
6M GBP(a) | | 3.510 | | | 09/15/42 | | | | | | 63,500 | | | | (616,181 | ) | | | (114,892 | ) | | | (501,289 | ) |
2.500(e) | | 3M LIBOR(d) | | | 06/17/47 | | | $ | | | 91,860 | (c) | | | 728,717 | | | | 181,701 | | | | 547,016 | |
3.450(a) | | 6M GBP | | | 09/15/47 | | | GBP | | | 57,990 | | | | 768,936 | | | | 360,445 | | | | 408,491 | |
1.500(e) | | 6M GBP | | | 12/20/47 | | | | | | 39,560 | (c) | | | 2,142,791 | | | | (811,573 | ) | | | 2,954,364 | |
2.560(e) | | 3M LIBOR(d) | | | 07/03/48 | | | $ | | | 364,460 | (c) | | | 546,654 | | | | 1,210,743 | | | | (664,089 | ) |
2.540(e) | | 6M CDOR | | | 07/18/48 | | | CAD | | | 118,400 | (c) | | | 3,001,320 | | | | (111,039 | ) | | | 3,112,359 | |
3.380(a) | | 6M GBP | | | 08/15/52 | | | GBP | | | 16,330 | | | | 554,269 | | | | 33,085 | | | | 521,184 | |
| TOTAL | | | | | | | | | | | | | | $ | (28,184,723 | ) | | $ | (132,780,147 | ) | | $ | 104,595,424 | |
| | (a) | | Payments made at maturity. |
| | (b) | | Payments made annually. |
| | (c) | | Represents forward starting interest rate swaps whose effective dates of commencement of accruals and cash flows occur subsequent to September 30, 2017. |
| | (d) | | Payments made quarterly. |
| | (e) | | Payments made semi-annually. |
| | (f) | | Payments made monthly. |
| | |
| The accompanying notes are an integral part of these financial statements. | | 103 |
GOLDMAN SACHS STRATEGIC INCOME FUND
Schedule of Investments (continued)
September 30, 2017 (Unaudited)
|
| ADDITIONAL INVESTMENT INFORMATION (continued) |
OVER THE COUNTER CREDIT DEFAULT SWAP CONTRACTS
| | | | | | | | | | | | | | | | | | | | | | | | | | | | |
| Reference Obligation/ Index(a) | | Financing Rate
Paid by the
Fund | | | Credit Spread
at September 30,
2017(b) | | | Counterparty | | Termination
Date | | Notional
Amount
(000s) | | | Value | | | Upfront
Premiums
(Received)
Paid | | | Unrealized
Appreciation/
(Depreciation) | |
Protection Purchased: | | | | | | | | | | | | | | | | | | | | | | | | | | | | |
| People’s Republic of China, 4.250% 10/28/17 | | | 1.000 | % | | | 0.191 | % | | BoA Securities LLC | | 03/20/19 | | | 13,180 | | | $ | (160,553 | ) | | $ | (7,309 | ) | | $ | (153,244 | ) |
| People’s Republic of China, 4.250% 10/28/17 | | | 1.000 | | | | 0.191 | | | Barclays Bank PLC | | 03/20/19 | | | 98,670 | | | | (1,201,953 | ) | | | (97,027 | ) | | | (1,104,926 | ) |
| People’s Republic of China, 7.500%, 10/28/27 | | | 1.000 | | | | 0.442 | | | Barclays Bank PLC | | 06/20/21 | | | 10,330 | | | | (211,399 | ) | | | 34,829 | | | | (246,228 | ) |
| People’s Republic of China, 7.500%, 10/28/27 | | | 1.000 | | | | 0.442 | | | Citibank NA | | 06/20/21 | | | 2,060 | | | | (42,157 | ) | | | 14,916 | | | | (57,073 | ) |
| People’s Republic of China, 4.250% 10/28/17 | | | 1.000 | | | | 0.191 | | | Citibank NA | | 03/20/19 | | | 518,290 | | | | (6,313,576 | ) | | | (754,185 | ) | | | (5,559,391 | ) |
| People’s Republic of China, 4.250% 10/28/17 | | | 1.000 | | | | 0.207 | | | Citibank NA | | 06/20/19 | | | 1,072,530 | | | | (14,913,697 | ) | | | (1,978,108 | ) | | | (12,935,589 | ) |
| People’s Republic of China, 7.500%, 10/28/27 | | | 1.000 | | | | 0.442 | | | Deutsche Bank AG | | 06/20/21 | | | 11,160 | | | | (228,383 | ) | | | 31,496 | | | | (259,879 | ) |
| People’s Republic of China, 7.500%, 10/28/27 | | | 1.000 | | | | 0.442 | | | JPMorgan Securities, Inc. | | 06/20/21 | | | 3,640 | | | | (74,491 | ) | | | 14,078 | | | | (88,569 | ) |
| People’s Republic of China, 4.250% 10/28/17 | | | 1.000 | | | | 0.191 | | | JPMorgan Securities, Inc. | | 03/20/19 | | | 66,660 | | | | (812,024 | ) | | | (92,032 | ) | | | (719,992 | ) |
| People’s Republic of China, 4.250% 10/28/17 | | | 1.000 | | | | 0.207 | | | JPMorgan Securities, Inc. | | 06/20/19 | | | 24,020 | | | | (334,002 | ) | | | (48,424 | ) | | | (285,578 | ) |
| People’s Republic of China, 7.500%, 10/28/27 | | | 1.000 | | | | 0.442 | | | UBS AG (London) | | 06/20/21 | | | 5,910 | | | | (120,945 | ) | | | 22,174 | | | | (143,119 | ) |
| TOTAL | | | $ | (24,413,180 | ) | | $ | (2,859,592 | ) | | $ | (21,553,588 | ) |
| | (a) | | Payments made quarterly. |
| | (b) | | Credit spread on the referenced obligation, together with the term of the swap contract, are indicators of payment/performance risk. The likelihood of a credit event occurring which would require a Fund or its counterparty to make a payment or otherwise be required to perform under the swap contract is generally greater as the credit spread and the term of the swap contract increase. |
CENTRALLY CLEARED CREDIT DEFAULT SWAP CONTRACTS
| | | | | | | | | | | | | | | | | | | | | | | | | | | | |
| Referenced Obligation/Index(a) | | Financing Rate
Paid by the
Fund | | | Credit
Spread at
September 30,
2017(b) | | | Termination
Date | | | Notional
Amount | | | Value | | | Upfront
Premiums
(Received) Paid | | | Unrealized
Appreciation/
(Depreciation) | |
Protection Purchased: | | | | | | | | | | | | | | | | | | | | | | | | | | | | |
CDX.EM Index 28 | | | 1.000 | % | | | 1.853% | | | | 12/20/22 | | | $ | 699,210 | | | $ | 28,001,563 | | | $ | 29,198,742 | | | $ | (1,197,179 | ) |
Markit iTraxx Europe Index 27 | | | 1.000 | | | | 0.480 | | | | 06/20/22 | | | | 581,480 | | | | (17,010,320 | ) | | | (14,675,733 | ) | | | (2,334,587 | ) |
CDX.NA.IG Index 28 | | | 1.000 | | | | 0.529 | | | | 06/20/22 | | | | 722,960 | | | | (15,504,020 | ) | | | (13,748,035 | ) | | | (1,755,985 | ) |
CDX.NA.HY Index 29 | | | 1.000 | | | | 3.253 | | | | 12/20/22 | | | | 681,800 | | | | (54,353,338 | ) | | | (50,393,438 | ) | | | (3,959,900 | ) |
CDX.EM Index 27 | | | 1.000 | | | | 1.723 | | | | 06/20/22 | | | | 642,355 | | | | 19,954,952 | | | | 24,725,668 | | | | (4,770,716 | ) |
| TOTAL | | | $ | (38,911,163 | ) | | $ | (24,892,796 | ) | | $ | (14,018,367 | ) |
| | (a) | | Payments made quarterly. |
| | (b) | | Credit spread on the referenced obligation, together with the term of the swap contract, are indicators of payment/performance risk. The likelihood of a credit event occurring which would require a fund or its counterparty to make a payment or otherwise be required to perform under the swap contract is generally greater as the credit spread and the term of the swap contract increase. |
| | |
| 104 | | The accompanying notes are an integral part of these financial statements. |
GOLDMAN SACHS STRATEGIC INCOME FUND
|
| ADDITIONAL INVESTMENT INFORMATION (continued) |
OVER THE COUNTER TOTAL RETURN SWAP CONTRACTS
| | | | | | | | | | | | | | | | | | | | | | | | |
| Reference Obligation/Index | | Financing
Rate
Received/(Paid)
by the Fund# | | Counterparty | | Termination
Date | | | Notional
Amount | | | Value | | | Upfront
Premiums
(Received) Paid | | | Unrealized
Appreciation/
(Depreciation) | |
Markit MBX Fannie-Mae Index, 30Y Fixed Rate, 6.500%, Series 67 | | 1M LIBOR | | CS International (London) | | | 01/12/38 | | | $ | 17,951 | | | $ | 109,676 | | | $ | 26,964 | | | $ | 82,712 | |
Markit MBX Ginnie-Mae Index, 30Y Fixed Rate, 4.500%, Series 10 | | 1M LIBOR | | JPMorgan Securities, Inc. | | | 01/12/41 | | | | 18,076 | | | | (66,931 | ) | | | 50,441 | | | | (117,372 | ) |
| TOTAL | | | $ | 42,745 | | | $ | 77,405 | | | $ | (34,660 | ) |
| | # | | The Fund pays/receives monthly coupon payments in accordance with the swap contracts. On the termination date of the swap contracts, the Fund will either receive from or pay to the counterparty an amount equal to the net of the accrued financing fees and the value of the reference security subtracted from the original notional cost (notional multiplied by the price change of the reference security, converted to U.S. Dollars). |
PURCHASED OPTIONS CONTRACTS — At September 30, 2017 the Fund had following options contracts:
PURCHASED OPTIONS ON INTEREST RATE SWAPTIONS
| | | | | | | | | | | | | | | | | | | | | | | | |
| Description | | Counterparty | | Exercise
Rate | | Expiration
Date | | Number of
Contracts | | Notional Amount | | | Market
Value | | | Premiums
Paid (Received) | | | Unrealized
Appreciation/ (Depreciation) | |
Purchased Options Contracts: | | | | | | | | | | | | | | | | | | | | |
Calls: | | | | | | | | | | | | | | | | | | | | | | | | |
| 5Y IRS | | BoA Securities LLC | | 2.018% | | 01/29/18 | | 80,200,000 | | $ | 80,200,000 | | | $ | 605,510 | | | $ | 657,640 | | | $ | (52,130 | ) |
10Y IRS | | Citibank NA | | 2.273 | | 01/22/18 | | 45,800,000 | | | 45,800,000 | | | | 673,892 | | | | 745,395 | | | | (71,503 | ) |
| 10Y IRS | | Citibank NA | | 2.539 | | 01/24/18 | | 29,800,000 | | | 29,800,000 | | | | 155,940 | | | | 572,160 | | | | (416,220 | ) |
| 10Y IRS | | JPMorgan Securities, Inc. | | 2.048 | | 01/24/18 | | 29,800,000 | | | 29,800,000 | | | | 857,626 | | | | 561,730 | | | | 295,896 | |
| | | | | | | | |
Puts: | | | | | | | | | | | | | | | | | | | | | | | | |
| 5Y IRS | | BoA Securities LLC | | 2.018 | | 01/29/18 | | 80,200,000 | | | 80,200,000 | | | | 409,493 | | | | 657,640 | | | | (248,147 | ) |
10Y IRS | | Citibank NA | | 2.539 | | 01/24/18 | | 29,800,000 | | | 29,800,000 | | | | 720,692 | | | | 572,160 | | | | 148,532 | |
10Y IRS | | Citibank NA | | 2.273 | | 01/22/18 | | 45,800,000 | | | 45,800,000 | | | | 457,217 | | | | 745,395 | | | | (288,178 | ) |
10Y IRS | | JPMorgan Securities, Inc. | | 0.700 | | 10/23/17 | | 145,460,000 | | | 145,460,000 | | | | 11,433 | | | | 907,810 | | | | (896,377 | ) |
10Y IRS | | JPMorgan Securities, Inc. | | 2.048 | | 01/24/18 | | 29,800,000 | | | 29,800,000 | | | | 117,347 | | | | 561,730 | | | | (444,383 | ) |
| TOTAL PURCHASED OPTIONS CONTRACTS | | | | | | | | | | $ | 5,859,075 | | | $ | 7,305,251 | | | $ | (1,446,176 | ) |
PURCHASED OPTIONS ON FUTURES
| | | | | | | | | | | | | | | | | | | | | | | | | | | | | | |
| Description | | Counterparty | | Exercise
Price | | | Expiration
Date | | | Number of
Contracts | | | Notional
Amount | | | Market Value | | | Premiums
Paid (Received)
| | | Unrealized
Appreciation/
(Depreciation) | |
Eurodollar | | MS & Co. LLC | | $ | 98.00 | | | | 06/15/18 | | | | 4,774 | | | $ | 11,935,000 | | | $ | 1,849,925 | | | $ | 1,323,591 | | | $ | 526,334 | |
| | |
|
Abbreviation: |
1M BID Avg | | —1 month Brazilian Interbank Deposit Average |
BoA Securities LLC | | —Bank of America Securities LLC |
CDX.EM Index 27 | | —CDX Emerging Markets Index 27 |
CDX.EM Index 28 | | —CDX Emerging Markets Index 28 |
CDX.NA.HY Index 29 | | —CDX North America High Yield Index 29 |
CDX.NA.IG Index 28 | | —CDX North America Investment Grade Index 28 |
CS International (London) | | —Credit Suisse International (London) |
Mexico IB TIIE 28D | | —Mexico Interbank TIIE 28 Days |
MS & Co. Int. PLC | | —Morgan Stanley & Co. International PLC |
MS & Co. LLC | | —Morgan Stanley & Co. LLC |
|
| | |
| The accompanying notes are an integral part of these financial statements. | | 105 |
GOLDMAN SACHS MULTI-SECTOR FIXED INCOME FUNDS
Statements of Assets and Liabilities
September 30, 2017 (Unaudited)
| | | | | | | | | | | | | | | | | | |
| | | | | Bond Fund | | | Core Fixed
Income Fund | | | Global
Income Fund | | | Strategic
Income Fund | |
| | Assets: | |
| | Investments of unaffiliated issuers, at value (cost $641,380,987, $1,016,591,823, $748,263,557 and $6,107,906,374) | | $ | 646,418,145 | | | $ | 1,032,435,958 | | | $ | 759,145,267 | | | $ | 5,990,115,248 | |
| | Investments of affiliated issuers, at value (cost $24,781,528, $3,949, $15,556,003 and $330,026,490) | | | 24,781,528 | | | | 3,949 | | | | 15,556,003 | | | | 328,659,280 | |
| | Purchased options (cost $891,544, $0, $704,215 and $7,305,251) | | | 709,588 | | | | 46,888 | | | | 560,147 | | | | 5,859,075 | |
| | Cash | | | 9,334,943 | | | | 13,540,526 | | | | 11,370,079 | | | | 115,945,325 | |
| | Foreign currencies, at value (cost $94,855, $36,354, $192,419 and $83,252) | | | 92,276 | | | | 33,733 | | | | 188,844 | | | | 34,062 | |
| | Unrealized gain on swap contracts | | | 13,710 | | | | — | | | | — | | | | 82,712 | |
| | Unrealized gain on forward foreign currency exchange contracts | | | 2,222,864 | | | | 967,131 | | | | 9,754,643 | | | | 101,723,720 | |
| | Variation margin on futures contracts | | | — | | | | — | | | | 146,088 | | | | — | |
| | Variation margin on swap contracts | | | 61,199 | | | | 49,790 | | | | 86,807 | | | | 5,595,082 | |
| | Receivables: | | | | | | | | | | | | | | | | |
| | Investments sold | | | 35,047,117 | | | | 8,710,711 | | | | 50,431,411 | | | | 785,256,658 | |
| | Due from broker — upfront payment | | | 33,044,678 | | | | 21,994,160 | | | | 34,460,402 | | | | — | |
| | Collateral on certain derivative contracts(a) | | | 12,173,611 | | | | 1,618,257 | | | | 13,140,209 | | | | 383,654,640 | |
| | Investments sold on an extended-settlement basis | | | 8,394,437 | | | | 19,641,390 | | | | 10,538,187 | | | | 69,093 | |
| | Interest and dividends | | | 3,430,545 | | | | 5,859,380 | | | | 3,923,250 | | | | 39,950,229 | |
| | Fund shares sold | | | 990,335 | | | | 735,504 | | | | 627,739 | | | | 4,727,359 | |
| | Upfront payments made on swap contracts | | | 55,443 | | | | — | | | | 29,796 | | | | 194,898 | |
| | Reimbursement from investment adviser | | | 54,754 | | | | 39,122 | | | | 54,798 | | | | — | |
| | Due from broker | | | — | | | | 6,719 | | | | — | | | | — | |
| | Other assets | | | 625 | | | | 1,267 | | | | 1,088 | | | | 172,157 | |
| | Total assets | | $ | 776,825,798 | | | | 1,105,684,485 | | | | 910,014,758 | | | | 7,762,039,538 | |
| | | | | | | | | | | | | | | | | | |
| | Liabilities: | |
| | Forward sale contracts, at value (proceeds received $6,284,766, $16,500,313, $8,428,516 and $0) | | | 6,267,969 | | | | 16,411,094 | | | | 8,423,750 | | | | — | |
| | Unrealized loss on swap contracts | | | 375,976 | | | | — | | | | 507,298 | | | | 22,961,214 | |
| | Unrealized loss on forward foreign currency exchange contracts | | | 2,946,016 | | | | 1,338,474 | | | | 4,996,293 | | | | 98,984,537 | |
| | Variation margin on futures contracts | | | 222,844 | | | | 192,610 | | | | — | | | | 4,720,377 | |
| | Payables: | | | | | | | | | | | | | | | | |
| | Investments purchased on an extended — settlement basis | | | 72,270,784 | | | | 56,464,045 | | | | 7,816,765 | | | | 256,313,892 | |
| | Investments purchased | | | 34,294,462 | | | | 15,337,699 | | | | 43,488,995 | | | | 772,149,411 | |
| | Due to broker — upfront payment | | | 33,099,369 | | | | 22,026,737 | | | | 34,514,299 | | | | 6,137,513 | |
| | Fund shares redeemed | | | 842,996 | | | | 1,411,080 | | | | 2,194,466 | | | | 12,875,067 | |
| | Management fees | | | 206,673 | | | | 329,720 | | | | 435,240 | | | | 2,863,958 | |
| | Distribution and Service fees and Transfer Agency fees | | | 99,626 | | | | 66,471 | | | | 54,292 | | | | 636,999 | |
| | Income distribution | | | 66,565 | | | | 32,371 | | | | 22,363 | | | | 24 | |
| | Upfront payments received on swap contracts | | | 27,813 | | | | — | | | | — | | | | 2,977,085 | |
| | Collateral on certain derivative contracts(b) | | | 250,000 | | | | — | | | | — | | | | 649,362 | |
| | Accrued expenses | | | 119,946 | | | | 111,037 | | | | 126,911 | | | | 745,437 | |
| | Total liabilities | | | 151,091,039 | | | | 113,721,338 | | | | 102,580,672 | | | | 1,182,014,876 | |
| | | | | | | | | | | | | | | | | | |
| | Net Assets: | | | | | | | | | | | | | | | | |
| | Paid-in capital | | | 628,717,937 | | | | 998,947,695 | | | | 803,993,232 | | | | 8,636,331,673 | |
| | Undistributed (distributions in excess of) net investment income | | | (1,410,777 | ) | | | 6,501,758 | | | | 8,979,470 | | | | (71,600,858 | ) |
| | Accumulated net realized loss | | | (6,528,921 | ) | | | (29,353,350 | ) | | | (20,698,420 | ) | | | (1,952,472,281 | ) |
| | Net unrealized gain (loss) | | | 4,956,520 | | | | 15,867,044 | | | | 15,159,804 | | | | (32,233,872 | ) |
| | | NET ASSETS | | $ | 625,734,759 | | | $ | 991,963,147 | | | $ | 807,434,086 | | | $ | 6,580,024,662 | |
| | | Net Assets: | | | | | | | | | | | | | | | | |
| | | Class A | | $ | 121,349,496 | | | $ | 66,434,032 | | | $ | 124,931,424 | | | $ | 407,342,369 | |
| | | Class C | | | 16,773,786 | | | | 9,940,857 | | | | 15,582,046 | | | | 344,471,637 | |
| | | Institutional | | | 347,977,694 | | | | 863,590,371 | | | | 564,804,240 | | | | 5,505,600,632 | |
| | | Service | | | 1,386,313 | | | | 1,350,964 | | | | 2,827,039 | | | | — | |
| | | Investor | | | 46,442,679 | | | | 45,599,904 | | | | 93,186,609 | | | | 262,680,767 | |
| | | Class R | | | 26,109,482 | | | | 4,726,182 | | | | — | | | | 8,272,539 | |
| | | Class R6 | | | 65,695,309 | | | | 320,837 | | | | 6,102,728 | | | | 51,656,718 | |
| | | Total Net Assets | | $ | 625,734,759 | | | $ | 991,963,147 | | | $ | 807,434,086 | | | $ | 6,580,024,662 | |
| | | Shares Outstanding $0.001 par value (unlimited number of shares authorized): | | | | | | | | | | | | | | | | |
| | | Class A | | | 11,891,145 | | | | 6,327,603 | | | | 10,161,406 | | | | 42,476,535 | |
| | | Class C | | | 1,644,818 | | | | 942,130 | | | | 1,277,794 | | | | 35,910,787 | |
| | | Institutional | | | 34,112,479 | | | | 81,933,946 | | | | 46,016,020 | | | | 574,094,106 | |
| | | Service | | | 135,877 | | | | 128,125 | | | | 231,639 | | | | — | |
| | | Investor | | | 4,566,314 | | | | 4,340,391 | | | | 7,605,895 | | | | 27,396,759 | |
| | | Class R | | | 2,561,553 | | | | 449,933 | | | | — | | | | 863,343 | |
| | | Class R6 | | | 6,440,728 | | | | 30,417 | | | | 497,252 | | | | 5,388,338 | |
| | | Net asset value, offering and redemption price per share:(c) | | | | | | | | | | | | | | | | |
| | | Class A | | | $10.21 | | | | $10.50 | | | | $12.29 | | | | $9.59 | |
| | | Class C | | | 10.20 | | | | 10.55 | | | | 12.19 | | | | 9.59 | |
| | | Institutional | | | 10.20 | | | | 10.54 | | | | 12.27 | | | | 9.59 | |
| | | Service | | | 10.20 | | | | 10.54 | | | | 12.20 | | | | — | |
| | | Investor | | | 10.17 | | | | 10.51 | | | | 12.25 | | | | 9.59 | |
| | | Class R | | | 10.19 | | | | 10.50 | | | | — | | | | 9.58 | |
| | | Class R6 | | | 10.20 | | | | 10.55 | | | | 12.27 | | | | 9.59 | |
| | (a) | | Segregated for initial Margin and/or collateral as follows: |
| | | | | | | | | | | | |
Fund | | Forwards | | | Futures | | | Swaps | |
Bond | | | 8,200,000 | | | | 908,813 | | | | 3,064,798 | |
Core Fixed Income | | | — | | | | 140,738 | | | | 1,477,519 | |
Global Income | | | 9,470,000 | | | | — | | | | 3,670,209 | |
Strategic income | | | 205,980,000 | | | | 20,529,671 | | | | 157,144,969 | |
| | (b) | | Includes amounts segregated for collateral on swap transactions of $250,000 and $649,632 for Bond and Strategic Income Funds, respectively. |
| | (c) | | Maximum public offering price per share for Class A Shares of the Bond, Core Fixed Income, Global Income and Strategic Income Funds is $10.61, $10.91, $12.77 and $9.96, respectively. At redemption, Class C Shares may be subject to a contingent deferred sales charge, assessed on the amount equal to the lesser of the current net asset value or the original purchase price of the shares. |
| | |
| 106 | | The accompanying notes are an integral part of these financial statements. |
GOLDMAN SACHS MULTI-SECTOR FIXED INCOME FUNDS
Statements of Operations
For the Six Months Ended September 30, 2017 (Unaudited)
| | | | | | | | | | | | | | | | | | |
| | | | | Bond Fund | | | Core Fixed
Income Fund | | | Global
Income Fund | | | Strategic
Income Fund | |
| Investment income: | | | | |
| | Interest (net of foreign withholding taxes of $0, $2,468, $11,792 and $0) | | $ | 8,839,084 | | | $ | 12,670,280 | | | $ | 7,395,992 | | | $ | 114,649,738 | |
| | Dividends — affiliated issuers | | | 81,122 | | | | 86,827 | | | | 51,975 | | | | 731,511 | |
| | Dividends — unaffiliated issuers | | | 7,334 | | | | — | | | | — | | | | — | |
| | Total investment income | | | 8,927,540 | | | | 12,757,107 | | | | 7,447,967 | | | | 115,381,249 | |
| | | | | | | | | | | | | | | | | | |
| | Expenses: | | | | |
| | Management fees | | | 1,327,151 | | | | 2,021,508 | | | | 2,735,818 | | | | 19,173,318 | |
| | Distribution and Service fees(a) | | | 303,834 | | | | 216,593 | | | | 259,024 | | | | 2,735,412 | |
| | Transfer Agency fees(a) | | | 210,442 | | | | 281,809 | | | | 278,848 | | | | 2,044,425 | |
| | Custody, accounting and administrative services | | | 176,769 | | | | 137,680 | | | | 191,854 | | | | 638,445 | |
| | Professional fees | | | 65,089 | | | | 65,248 | | | | 64,685 | | | | 69,394 | |
| | Registration fees | | | 57,740 | | | | 46,629 | | | | 49,102 | | | | 71,663 | |
| | Printing and mailing costs | | | 33,189 | | | | 33,845 | | | | 47,842 | | | | 345,833 | |
| | Trustee fees | | | 9,420 | | | | 9,945 | | | | 9,823 | | | | 17,500 | |
| | Service Share fees — Service Plan | | | 1,654 | | | | 1,804 | | | | 3,441 | | | | — | |
| | Service Share fees — Shareholder Administration Plan | | | 1,654 | | | | 1,804 | | | | 3,441 | | | | — | |
| | Prime Broker fees | | | 12,037 | | | | — | | | | 29,349 | | | | 490,412 | |
| | Other | | | 11,453 | | | | 21,819 | | | | 21,489 | | | | 243,395 | |
| | Total expenses | | | 2,210,432 | | | | 2,838,684 | | | | 3,694,716 | | | | 25,829,797 | |
| | Less — expense reductions | | | (433,954 | ) | | | (260,653 | ) | | | (401,630 | ) | | | (158,476 | ) |
| | Net expenses | | | 1,776,478 | | | | 2,578,031 | | | | 3,293,086 | | | | 25,671,321 | |
| | NET INVESTMENT INCOME | | | 7,151,062 | | | | 10,179,076 | | | | 4,154,881 | | | | 89,709,928 | |
| | | | | | | | | | | | | | | | | | |
| | Realized and unrealized gain (loss): | | | | |
| | Net realized gain (loss) from: | | | | | | | | | | | | | | | | |
| | Investments—unaffiliated issuers | | | 2,863,135 | | | | 669,713 | | | | 6,158,947 | | | | 58,803,368 | |
| | Purchased options | | | 2,388 | | | | — | | | | 2,504 | | | | (10,468 | ) |
| | Futures contracts | | | 1,241,388 | | | | 2,065,552 | | | | 3,994,366 | | | | (33,297,337 | ) |
| | Swap contracts | | | (3,557,034 | ) | | | (1,854,036 | ) | | | (3,272,981 | ) | | | (198,053,539 | ) |
| | Forward foreign currency exchange contracts | | | (400,279 | ) | | | (1,083,684 | ) | | | (26,644,663 | ) | | | (13,011,801 | ) |
| | Foreign currency transactions | | | (49,786 | ) | | | 15,534 | | | | 3,771,535 | | | | (12,775,194 | ) |
| | Net change in unrealized gain (loss) on: | | | | | | | | | | | | | | | | |
| | Investments — unaffiliated issuers | | | 2,818,468 | | | | 10,880,535 | | | | 14,709,886 | | | | (57,138,890 | ) |
| | Investments — affiliated issuers | | | — | | | | — | | | | — | | | | (10,734,637 | ) |
| | Purchased options | | | (181,956 | ) | | | 13,340 | | | | (144,068 | ) | | | (1,446,176 | ) |
| | Futures contracts | | | (862,375 | ) | | | (874,967 | ) | | | (2,157,616 | ) | | | 5,198,683 | |
| | Swap contracts | | | 1,282,950 | | | | 906,397 | | | | 640,159 | | | | 87,760,110 | |
| | Forward foreign currency exchange contracts | | | 817,592 | | | | 768,277 | | | | 10,352,490 | | | | 59,224,510 | |
| | Foreign currency translation | | | (4,652 | ) | | | (564 | ) | | | 37,507 | | | | (29,978 | ) |
| | Net realized and unrealized gain (loss) | | | 3,969,839 | | | | 11,506,097 | | | | 7,448,066 | | | | (115,511,349 | ) |
| | NET INCREASE (DECREASE) IN NET ASSETS RESULTING FROM OPERATIONS | | $ | 11,120,901 | | | $ | 21,685,173 | | | $ | 11,602,947 | | | $ | (25,801,421 | ) |
| | (a) | | Class specific Distribution and Service and Transfer Agent fees were as follows: |
| | | | | | | | | | | | | | | | | | | | | | | | | | | | | | | | | | | | | | | | |
| | | Distribution and Service Fees | | | Transfer Agency Fees | |
Fund | | Class A | | | Class C | | | Class R | | | Class A | | | Class C | | | Institutional | | | Service | | | Investor | | | Class R | | | Class R6 | |
Bond | | $ | 148,804 | | | $ | 89,475 | | | $ | 65,555 | | | $ | 77,378 | | | $ | 11,632 | | | $ | 68,445 | | | $ | 265 | | | $ | 28,706 | | | $ | 17,043 | | | $ | — | |
Core Fixed Income | | | 147,894 | | | | 60,088 | | | | 8,611 | | | | 76,905 | | | | 7,811 | | | | 166,541 | | | | 289 | | | | 27,912 | | | | 2,239 | | | | 112 | |
Global Income | | | 166,808 | | | | 92,216 | | | | – | | | | 86,741 | | | | 11,988 | | | | 117,324 | | | | 551 | | | | 61,552 | | | | — | | | | — | |
Strategic Income | | | 728,509 | | | | 1,985,027 | | | | 21,876 | | | | 378,838 | | | | 258,062 | | | | 1,196,297 | | | | — | | | | 199,474 | | | | 5,688 | | | | — | |
| | |
| The accompanying notes are an integral part of these financial statements. | | 107 |
GOLDMAN SACHS MULTI-SECTOR FIXED INCOME FUNDS
Statements of Changes in Net Assets
| | | | | | | | | | |
| | | | | Bond Fund | |
| | | | | For the
Six Months Ended
September 30, 2017
(Unaudited) | | | For the Fiscal
Year Ended
March 31, 2017 | |
| | From operations: | | | | | | | | |
| | Net investment income | | $ | 7,151,062 | | | $ | 11,214,192 | |
| | Net realized gain (loss) | | | 99,812 | | | | (225,352 | ) |
| | Net change in unrealized gain (loss) | | | 3,870,027 | | | | (4,644,188 | ) |
| | Net increase (decrease) in net assets resulting from operations | | | 11,120,901 | | | | 6,344,652 | |
| | | | | | | | | | |
| | Distributions to shareholders: | | | | | | | | |
| | From net investment income | | | | | | | | |
| | Class A Shares | | | (1,349,290 | ) | | | (3,146,864 | ) |
| | Class C Shares | | | (136,663 | ) | | | (351,987 | ) |
| | Institutional Shares | | | (4,457,323 | ) | | | (8,719,337 | ) |
| | Service Shares | | | (13,928 | ) | | | (28,126 | ) |
| | Investor Shares | | | (555,660 | ) | | | (1,269,574 | ) |
| | Class R Shares | | | (264,514 | ) | | | (449,301 | ) |
| | Class R6 Shares | | | (765,538 | ) | | | (426,872 | ) |
| | From net realized gains | | | | | | | | |
| | Class A Shares | | | — | | | | (62,744 | ) |
| | Class C Shares | | | — | | | | (11,019 | ) |
| | Institutional Shares | | | — | | | | (155,743 | ) |
| | Service Shares | | | — | | | | (677 | ) |
| | Investor Shares | | | — | | | | (17,345 | ) |
| | Class R Shares | | | — | | | | (11,656 | ) |
| | Class R6 Shares | | | — | | | | (5,519 | ) |
| | Return of capital | | | | | | | | |
| | Class A Shares | | | — | | | | — | |
| | Class C Shares | | | — | | | | — | |
| | Institutional Shares | | | — | | | | — | |
| | Investor Shares | | | — | | | | — | |
| | Class R Shares | | | — | | | | — | |
| | Class R6 Shares | | | — | | | | — | |
| | Total distributions to shareholders | | | (7,542,916 | ) | | | (14,656,764 | ) |
| | | | | | | | | | |
| | From share transactions: | | | | | | | | |
| | Proceeds from sales of shares | | | 112,438,812 | | | | 353,168,598 | |
| | Reinvestment of distributions | | | 7,046,440 | | | | 13,507,260 | |
| | Proceeds received in connection with in-kind transactions | | | — | | | | — | |
| | Cost of shares redeemed | | | (85,184,099 | ) | | | (246,857,968 | ) |
| | Net increase (decrease) in net assets resulting from share transactions | | | 34,301,153 | | | | 119,817,890 | |
| | TOTAL INCREASE (DECREASE) | | | 37,879,138 | | | | 111,505,778 | |
| | | | | | | | | | |
| | Net assets: | | | | | | | | |
| | Beginning of period | | | 587,855,621 | | | | 476,349,843 | |
| | End of period | | $ | 625,734,759 | | | $ | 587,855,621 | |
| | Undistributed (distributions in excess of) net investment income | | $ | (1,410,777 | ) | | $ | (1,018,923 | ) |
| | |
| 108 | | The accompanying notes are an integral part of these financial statements. |
GOLDMAN SACHS MULTI-SECTOR FIXED INCOME FUNDS
| | | | | | | | | | | | | | | | | | | | | | | | | | | | | | | | | | |
| | | Core Fixed Income Fund | | | | | Global Income Fund | | | | | Strategic Income Fund | |
| | | For the
Six Months Ended
September 30, 2017
(Unaudited) | | | | | For the Fiscal
Year Ended
March 31, 2017 | | | | | For the
Six Months Ended
September 30, 2017
(Unaudited) | | | | | For the Fiscal
Year Ended
March 31, 2017 | | | | | For the
Six Months Ended
September 30, 2017
(Unaudited) | | | | | For the Fiscal
Year Ended
March 31, 2017 | |
| | | | | | | | | | | | | | | | | | | | | | | | | | | | | | | | | | |
| | $ | 10,179,076 | | | | | $ | 21,213,225 | | | | | $ | 4,154,881 | | | | | $ | 8,133,052 | | | | | $ | 89,709,928 | | | | | $ | 223,740,390 | |
| | | (186,921 | ) | | | | | 2,654,857 | | | | | | (15,990,292 | ) | | | | | 20,120,534 | | | | | | (198,344,971 | ) | | | | | (174,490,813 | ) |
| | | 11,693,018 | | | | | | (11,592,077 | ) | | | | | 23,438,358 | | | | | | (17,551,664 | ) | | | | | 82,833,622 | | | | | | 469,370,381 | |
| | | 21,685,173 | | | | | | 12,276,005 | | | | | | 11,602,947 | | | | | | 10,701,922 | | | | | | (25,801,421 | ) | | | | | 518,619,958 | |
| | | | | | | | | | | | | | | | | | | | | | | | | | | | | | | | | | |
| | | | | | | | | | | | | | | | | | | | | | | | | | | | | | | | | | |
| | | | | | | | | | | | | | | | | | | | | | | | | | | | | | | | | | |
| | | (1,302,380 | ) | | | | | (3,118,825 | ) | | | | | (676,222 | ) | | | | | (1,507,438 | ) | | | | | (4,169,910 | ) | | | | | (13,196,212 | ) |
| | | (87,028 | ) | | | | | (263,457 | ) | | | | | (27,746 | ) | | | | | (42,019 | ) | | | | | (1,444,851 | ) | | | | | (4,462,360 | ) |
| | | (10,533,240 | ) | | | | | (19,801,900 | ) | | | | | (3,940,059 | ) | | | | | (7,839,989 | ) | | | | | (53,066,112 | ) | | | | | (125,582,619 | ) |
| | | (14,670 | ) | | | | | (31,897 | ) | | | | | (11,720 | ) | | | | | (25,907 | ) | | | | | — | | | | | | — | |
| | | (522,631 | ) | | | | | (753,238 | ) | | | | | (593,836 | ) | | | | | (705,723 | ) | | | | | (2,578,114 | ) | | | | | (3,569,204 | ) |
| | | (33,145 | ) | | | | | (168,039 | ) | | | | | — | | | | | | — | | | | | | (52,562 | ) | | | | | (99,932 | ) |
| | | (14,395 | ) | | | | | (1,485,696 | ) | | | | | (39,395 | ) | | | | | (30,091 | ) | | | | | (457,027 | ) | | | | | (288,381 | ) |
| | | | | | | | | | | | | | | | | | | | | | | | | | | | | | | | | | |
| | | — | | | | | | — | | | | | | — | | | | | | (764,512 | ) | | | | | — | | | | | | — | |
| | | — | | | | | | — | | | | | | — | | | | | | (98,370 | ) | | | | | — | | | | | | — | |
| | | — | | | | | | — | | | | | | — | | | | | | (2,652,614 | ) | | | | | — | | | | | | — | |
| | | — | | | | | | — | | | | | | — | | | | | | (13,159 | ) | | | | | — | | | | | | — | |
| | | — | | | | | | — | | | | | | — | | | | | | (279,622 | ) | | | | | — | | | | | | — | |
| | | — | | | | | | — | | | | | | — | | | | | | — | | | | | | — | | | | | | — | |
| | | — | | | | | | — | | | | | | — | | | | | | (14,207 | ) | | | | | — | | | | | | — | |
| | | | | | | | | | | | | | | | | | | | | | | | | | | | | | | | | | |
| | | — | | | | | | — | | | | | | — | | | | | | — | | | | | | — | | | | | | (5,369,204 | ) |
| | | — | | | | | | — | | | | | | — | | | | | | — | | | | | | — | | | | | | (1,815,621 | ) |
| | | — | | | | | | — | | | | | | — | | | | | | — | | | | | | — | | | | | | (51,096,385 | ) |
| | | — | | | | | | — | | | | | | — | | | | | | — | | | | | | — | | | | | | (1,452,219 | ) |
| | | — | | | | | | — | | | | | | — | | | | | | — | | | | | | — | | | | | | (40,660 | ) |
| | | — | | | | | | — | | | | | | — | | | | | | — | | | | | | — | | | | | | (117,335 | ) |
| | | (12,507,489 | ) | | | | | (25,623,052 | ) | | | | | (5,288,978 | ) | | | | | (13,973,651 | ) | | | | | (61,768,576 | ) | | | | | (207,090,132 | ) |
| | | | | | | | | | | | | | | | | | | | | | | | | | | | | | | | | | |
| | | | | | | | | | | | | | | | | | | | | | | | | | | | | | | | | | |
| | | 211,822,403 | | | | | | 429,504,518 | | | | | | 123,297,821 | | | | | | 644,842,488 | | | | | | 814,375,030 | | | | | | 1,926,962,561 | |
| | | 12,279,646 | | | | | | 25,065,156 | | | | | | 5,075,269 | | | | | | 13,434,206 | | | | | | 53,029,539 | | | | | | 173,577,259 | |
| | | — | | | | | | — | | | | | | — | | | | | | — | | | | | | — | | | | | | 101,387,609 | |
| | | (278,915,967 | ) | | | | | (334,556,752 | ) | | | | | (217,204,143 | ) | | | | | (563,821,836 | ) | | | | | (2,152,292,331 | ) | | | | | (8,279,090,939 | ) |
| | | (54,813,918 | ) | | | | | 120,012,922 | | | | | | (88,831,053 | ) | | | | | 94,454,858 | | | | | | (1,284,887,762 | ) | | | | | (6,077,163,510 | ) |
| | | (45,636,234 | ) | | | | | 106,665,875 | | | | | | (82,517,084 | ) | | | | | 91,183,129 | | | | | | (1,372,457,759 | ) | | | | | (5,765,633,684 | ) |
| | | | | | | | | | | | | | | | | | | | | | | | | | | | | | | | | | |
| | | | | | | | | | | | | | | | | | | | | | | | | | | | | | | | | | |
| | | 1,037,599,381 | | | | | | 930,933,506 | | | | | | 889,951,170 | | | | | | 798,768,041 | | | | | | 7,952,482,421 | | | | | | 13,718,116,105 | |
| | $ | 991,963,147 | | | | | $ | 1,037,599,381 | | | | | $ | 807,434,086 | | | | | $ | 889,951,170 | | | | | $ | 6,580,024,662 | | | | | $ | 7,952,482,421 | |
| | $ | 6,501,758 | | | | | $ | 8,830,171 | | | | | $ | 8,979,470 | | | | | $ | 10,113,567 | | | | | $ | (71,600,858 | ) | | | | $ | (99,542,210 | ) |
| | |
| The accompanying notes are an integral part of these financial statements. | | 109 |
GOLDMAN SACHS BOND FUND
Financial Highlights
Selected Data for a Share Outstanding Throughout Each Period
| | | | | | | | | | | | | | | | | | | | | | | | | | | | | | |
| | | | | | From
Investment Operations | | | Distributions
to shareholders | |
| | | Year - Share Class | | Net asset
value,
beginning
of period | | | Net
investment
income(a) | | | Net realized
and unrealized
gain (loss) | | | Total from
investment
operations | | | From net
investment
income | | | From net
realized
gains | | | Total
distributions | |
| | FOR THE SIX MONTHS ENDED SEPTEMBER 30, (UNAUDITED) | |
| | 2017 - A | | $ | 10.14 | | | $ | 0.11 | | | $ | 0.08 | | | $ | 0.19 | | | $ | (0.12 | ) | | $ | — | | | $ | (0.12 | ) |
| | 2017 - C | | | 10.14 | | | | 0.07 | | | | 0.07 | | | | 0.14 | | | | (0.08 | ) | | | — | | | | (0.08 | ) |
| | 2017 - Institutional | | | 10.14 | | | | 0.13 | | | | 0.06 | | | | 0.19 | | | | (0.13 | ) | | | — | | | | (0.13 | ) |
| | 2017 - Service | | | 10.14 | | | | 0.10 | | | | 0.07 | | | | 0.17 | | | | (0.11 | ) | | | — | | | | (0.11 | ) |
| | 2017 - Investor(f) | | | 10.11 | | | | 0.12 | | | | 0.07 | | | | 0.19 | | | | (0.13 | ) | | | — | | | | (0.13 | ) |
| | 2017 - R | | | 10.13 | | | | 0.10 | | | | 0.06 | | | | 0.16 | | | | (0.10 | ) | | | — | | | | (0.10 | ) |
| | 2017 - R6 | | | 10.14 | | | | 0.13 | | | | 0.06 | | | | 0.19 | | | | (0.13 | ) | | | — | | | | (0.13 | ) |
| | | | | | | | | | | | | | | | | | | | | | | | | | | | | | |
| | FOR THE FISCAL YEARS ENDED MARCH 31, | |
| | 2017 - A | | | 10.28 | | | | 0.19 | | | | (0.07 | ) | | | 0.12 | | | | (0.25 | ) | | | (0.01 | ) | | | (0.26 | ) |
| | 2017 - C | | | 10.27 | | | | 0.11 | | | | (0.05 | ) | | | 0.06 | | | | (0.18 | ) | | | (0.01 | ) | | | (0.19 | ) |
| | 2017 - Institutional | | | 10.28 | | | | 0.23 | | | | (0.07 | ) | | | 0.16 | | | | (0.29 | ) | | | (0.01 | ) | | | (0.30 | ) |
| | 2017 - Service | | | 10.28 | | | | 0.17 | | | | (0.06 | ) | | | 0.11 | | | | (0.24 | ) | | | (0.01 | ) | | | (0.25 | ) |
| | 2017 - Investor(f) | | | 10.25 | | | | 0.22 | | | | (0.07 | ) | | | 0.15 | | | | (0.28 | ) | | | (0.01 | ) | | | (0.29 | ) |
| | 2017 - R | | | 10.27 | | | | 0.16 | | | | (0.06 | ) | | | 0.10 | | | | (0.23 | ) | | | (0.01 | ) | | | (0.24 | ) |
| | 2017 - R6 | | | 10.28 | | | | 0.23 | | | | (0.07 | ) | | | 0.16 | | | | (0.29 | ) | | | (0.01 | ) | | | (0.30 | ) |
| | 2016 - A | | | 10.44 | | | | 0.21 | | | | (0.03 | ) | | | 0.18 | | | | (0.34 | ) | | | — | (e) | | | (0.34 | ) |
| | 2016 - C | | | 10.44 | | | | 0.13 | | | | (0.03 | ) | | | 0.10 | | | | (0.27 | ) | | | — | (e) | | | (0.27 | ) |
| | 2016 - Institutional | | | 10.44 | | | | 0.24 | | | | (0.02 | ) | | | 0.22 | | | | (0.38 | ) | | | — | (e) | | | (0.38 | ) |
| | 2016 - Service | | | 10.44 | | | | 0.18 | | | | (0.01 | ) | | | 0.17 | | | | (0.33 | ) | | | — | (e) | | | (0.33 | ) |
| | 2016 - Investor(f) | | | 10.40 | | | | 0.23 | | | | (0.01 | ) | | | 0.22 | | | | (0.37 | ) | | | — | (e) | | | (0.37 | ) |
| | 2016 - R | | | 10.43 | | | | 0.18 | | | | (0.02 | ) | | | 0.16 | | | | (0.32 | ) | | | — | (e) | | | (0.32 | ) |
| | 2016 - R6 (Commenced July 31, 2015) | | | 10.33 | | | | 0.16 | | | | 0.08 | | | | 0.24 | | | | (0.29 | ) | | | — | (e) | | | (0.29 | ) |
| | 2015 - A | | | 10.42 | | | | 0.17 | | | | 0.25 | | | | 0.42 | | | | (0.24 | ) | | | (0.16 | ) | | | (0.40 | ) |
| | 2015 - C | | | 10.41 | | | | 0.10 | | | | 0.25 | | | | 0.35 | | | | (0.16 | ) | | | (0.16 | ) | | | (0.32 | ) |
| | 2015 - Institutional | | | 10.42 | | | | 0.22 | | | | 0.24 | | | | 0.46 | | | | (0.28 | ) | | | (0.16 | ) | | | (0.44 | ) |
| | 2015 - Service | | | 10.42 | | | | 0.17 | | | | 0.24 | | | | 0.41 | | | | (0.23 | ) | | | (0.16 | ) | | | (0.39 | ) |
| | 2015 - Investor(f) | | | 10.38 | | | | 0.19 | | | | 0.26 | | | | 0.45 | | | | (0.27 | ) | | | (0.16 | ) | | | (0.43 | ) |
| | 2015 - R | | | 10.41 | | | | 0.15 | | | | 0.25 | | | | 0.40 | | | | (0.22 | ) | | | (0.16 | ) | | | (0.38 | ) |
| | 2014 - A | | | 10.57 | | | | 0.22 | | | | (0.09 | ) | | | 0.13 | | | | (0.28 | ) | | | — | | | | (0.28 | ) |
| | 2014 - C | | | 10.57 | | | | 0.15 | | | | (0.11 | ) | | | 0.04 | | | | (0.20 | ) | | | — | | | | (0.20 | ) |
| | 2014 - Institutional | | | 10.57 | | | | 0.26 | | | | (0.09 | ) | | | 0.17 | | | | (0.32 | ) | | | — | | | | (0.32 | ) |
| | 2014 - Service | | | 10.57 | | | | 0.21 | | | | (0.10 | ) | | | 0.11 | | | | (0.26 | ) | | | — | | | | (0.26 | ) |
| | 2014 - Investor(f) | | | 10.54 | | | | 0.25 | | | | (0.11 | ) | | | 0.14 | | | | (0.30 | ) | | | — | | | | (0.30 | ) |
| | 2014 - R | | | 10.57 | | | | 0.19 | | | | (0.10 | ) | | | 0.09 | | | | (0.25 | ) | | | — | | | | (0.25 | ) |
| | 2013 - A | | | 10.37 | | | | 0.20 | | | | 0.57 | | | | 0.77 | | | | (0.25 | ) | | | (0.32 | ) | | | (0.57 | ) |
| | 2013 - C | | | 10.37 | | | | 0.12 | | | | 0.57 | | | | 0.69 | | | | (0.17 | ) | | | (0.32 | ) | | | (0.49 | ) |
| | 2013 - Institutional | | | 10.37 | | | | 0.23 | | | | 0.57 | | | | 0.80 | | | | (0.28 | ) | | | (0.32 | ) | | | (0.60 | ) |
| | 2013 - Service | | | 10.37 | | | | 0.18 | | | | 0.57 | | | | 0.75 | | | | (0.23 | ) | | | (0.32 | ) | | | (0.55 | ) |
| | 2013 - Investor(f) | | | 10.34 | | | | 0.22 | | | | 0.57 | | | | 0.79 | | | | (0.27 | ) | | | (0.32 | ) | | | (0.59 | ) |
| | 2013 - R | | | 10.37 | | | | 0.18 | | | | 0.56 | | | | 0.74 | | | | (0.22 | ) | | | (0.32 | ) | | | (0.54 | ) |
| | (a) | | Calculated based on the average shares outstanding methodology. |
| | (b) | | Assumes investment at the NAV at the beginning of the period, reinvestment of all dividends and distributions, a complete redemption of the investment at the NAV at the end of the period and no sales or redemption charges. Total returns would be reduced if a sales or redemption charge was taken into account. Returns do not reflect the impact of taxes to shareholder relating to Fund distributions or the redemption of Fund shares. Total returns for periods less than one full year are not annualized. |
| | (c) | | The Fund’s portfolio turnover rate is calculated in accordance with regulatory requirements, without regard to transactions involving short term investments and certain derivatives. If such transactions were included, the Fund’s portfolio turnover rate may be higher. |
| | (e) | | Rounds to less than $0.01 per share. |
| | (f) | | Effective before the opening of business on August 15, 2017, Class IR Shares were designated as Investor Shares. |
| | |
| 110 | | The accompanying notes are an integral part of these financial statements. |
GOLDMAN SACHS BOND FUND
| | | | | | | | | | | | | | | | | | | | | | | | | | | | | | | | | | | | | | | | |
| | | | | | | | | | | | | | | | | | | | | | | | | | | | | | | | | | |
| | | Net asset
value, end
of period | | | | | Total
return(b) | | | | | Net assets,
end of
period
(in 000s) | | | | | Ratio of
net expenses
to average
net assets | | | | | Ratio of
total expenses
to average
net assets | | | | | Ratio of
net investment
income
to average
net assets | | | | | Portfolio
turnover
rate(c) | |
| | | | | | | | | | | | | | | | | | | | | | | | | | | | | | | | | | | | | | | | |
| | $ | 10.21 | | | | | | 1.74 | % | | | | $ | 121,349 | | | | | | 0.79 | %(d) | | | | | 0.94 | %(d) | | | | | 2.14 | %(d) | | | | | 190 | % |
| | | 10.20 | | | | | | 1.36 | | | | | | 16,774 | | | | | | 1.54 | (d) | | | | | 1.69 | (d) | | | | | 1.39 | (d) | | | | | 190 | |
| | | 10.20 | | | | | | 1.91 | | | | | | 347,978 | | | | | | 0.45 | (d) | | | | | 0.60 | (d) | | | | | 2.48 | (d) | | | | | 190 | |
| | | 10.20 | | | | | | 1.66 | | | | | | 1,386 | | | | | | 0.95 | (d) | | | | | 1.10 | (d) | | | | | 1.98 | (d) | | | | | 190 | |
| | | 10.17 | | | | | | 1.87 | | | | | | 46,443 | | | | | | 0.54 | (d) | | | | | 0.69 | (d) | | | | | 2.39 | (d) | | | | | 190 | |
| | | 10.19 | | | | | | 1.61 | | | | | | 26,109 | | | | | | 1.04 | (d) | | | | | 1.19 | (d) | | | | | 1.89 | (d) | | | | | 190 | |
| | | 10.20 | | | | | | 1.92 | | | | | | 65,695 | | | | | | 0.44 | (d) | | | | | 0.58 | (d) | | | | | 2.49 | (d) | | | | | 190 | |
| | | | | | | | | | | | | | | | | | | | | | | | | | | | | | | | | | | | | | | | |
| | | | |
| | | 10.14 | | | | | | 1.15 | | | | | | 117,249 | | | | | | 0.78 | | | | | | 0.97 | | | | | | 1.87 | | | | | | 517 | |
| | | 10.14 | | | | | | 0.50 | | | | | | 19,081 | | | | | | 1.53 | | | | | | 1.72 | | | | | | 1.10 | | | | | | 517 | |
| | | 10.14 | | | | | | 1.50 | | | | | | 329,358 | | | | | | 0.44 | | | | | | 0.63 | | | | | | 2.19 | | | | | | 517 | |
| | | 10.14 | | | | | | 0.99 | | | | | | 1,293 | | | | | | 0.94 | | | | | | 1.13 | | | | | | 1.69 | | | | | | 517 | |
| | | 10.11 | | | | | | 1.40 | | | | | | 44,207 | | | | | | 0.53 | | | | | | 0.72 | | | | | | 2.12 | | | | | | 517 | |
| | | 10.13 | | | | | | 0.90 | | | | | | 25,639 | | | | | | 1.03 | | | | | | 1.22 | | | | | | 1.58 | | | | | | 517 | |
| | | 10.14 | | | | | | 1.51 | | | | | | 51,028 | | | | | | 0.43 | | | | | | 0.60 | | | | | | 2.24 | | | | | | 517 | |
| | | 10.28 | | | | | | 1.83 | | | | | | 129,351 | | | | | | 0.78 | | | | | | 1.00 | | | | | | 2.00 | | | | | | 588 | |
| | | 10.27 | | | | | | 0.98 | | | | | | 17,254 | | | | | | 1.53 | | | | | | 1.75 | | | | | | 1.25 | | | | | | 588 | |
| | | 10.28 | | | | | | 2.18 | | | | | | 279,435 | | | | | | 0.44 | | | | | | 0.66 | | | | | | 2.33 | | | | | | 588 | |
| | | 10.28 | | | | | | 1.68 | | | | | | 1,119 | | | | | | 0.94 | | | | | | 1.17 | | | | | | 1.74 | | | | | | 588 | |
| | | 10.25 | | | | | | 2.18 | | | | | | 39,939 | | | | | | 0.53 | | | | | | 0.75 | | | | | | 2.23 | | | | | | 588 | |
| | | 10.27 | | | | | | 1.58 | | | | | | 9,241 | | | | | | 1.03 | | | | | | 1.26 | | | | | | 1.77 | | | | | | 588 | |
| | | 10.28 | | | | | | 2.42 | | | | | | 10 | | | | | | 0.47 | (d) | | | | | 0.69 | (d) | | | | | 2.37 | (d) | | | | | 588 | |
| | | 10.44 | | | | | | 4.09 | | | | | | 106,694 | | | | | | 0.80 | | | | | | 1.06 | | | | | | 1.64 | | | | | | 454 | |
| | | 10.44 | | | | | | 3.41 | | | | | | 11,813 | | | | | | 1.56 | | | | | | 1.82 | | | | | | 0.97 | | | | | | 454 | |
| | | 10.44 | | | | | | 4.45 | | | | | | 302,035 | | | | | | 0.47 | | | | | | 0.73 | | | | | | 2.06 | | | | | | 454 | |
| | | 10.44 | | | | | | 3.94 | | | | | | 15 | | | | | | 0.96 | | | | | | 1.23 | | | | | | 1.61 | | | | | | 454 | |
| | | 10.40 | | | | | | 4.36 | | | | | | 24,680 | | | | | | 0.54 | | | | | | 0.80 | | | | | | 1.80 | | | | | | 454 | |
| | | 10.43 | | | | | | 3.84 | | | | | | 363 | | | | | | 1.06 | | | | | | 1.33 | | | | | | 1.47 | | | | | | 454 | |
| | | 10.42 | | | | | | 1.27 | | | | | | 34,403 | | | | | | 0.84 | | | | | | 1.06 | | | | | | 2.15 | | | | | | 580 | |
| | | 10.41 | | | | | | 0.42 | | | | | | 7,298 | | | | | | 1.59 | | | | | | 1.81 | | | | | | 1.40 | | | | | | 580 | |
| | | 10.42 | | | | | | 1.62 | | | | | | 207,604 | | | | | | 0.50 | | | | | | 0.71 | | | | | | 2.46 | | | | | | 580 | |
| | | 10.42 | | | | | | 1.12 | | | | | | 14 | | | | | | 1.00 | | | | | | 1.22 | | | | | | 2.01 | | | | | | 580 | |
| | | 10.38 | | | | | | 1.42 | | | | | | 3,808 | | | | | | 0.59 | | | | | | 0.81 | | | | | | 2.41 | | | | | | 580 | |
| | | 10.41 | | | | | | 0.92 | | | | | | 133 | | | | | | 1.09 | | | | | | 1.29 | | | | | | 1.83 | | | | | | 580 | |
| | | 10.57 | | | | | | 7.48 | | | | | | 40,783 | | | | | | 0.83 | | | | | | 0.98 | | | | | | 1.86 | | | | | | 1,025 | |
| | | 10.57 | | | | | | 6.68 | | | | | | 9,993 | | | | | | 1.58 | | | | | | 1.73 | | | | | | 1.11 | | | | | | 1,025 | |
| | | 10.57 | | | | | | 7.84 | | | | | | 301,201 | | | | | | 0.49 | | | | | | 0.64 | | | | | | 2.20 | | | | | | 1,025 | |
| | | 10.57 | | | | | | 7.31 | | | | | | 14 | | | | | | 0.99 | | | | | | 1.13 | | | | | | 1.70 | | | | | | 1,025 | |
| | | 10.54 | | | | | | 7.76 | | | | | | 2,847 | | | | | | 0.58 | | | | | | 0.73 | | | | | | 2.11 | | | | | | 1,025 | |
| | | 10.57 | | | | | | 7.22 | | | | | | 195 | | | | | | 1.08 | | | | | | 1.24 | | | | | | 1.68 | | | | | | 1,025 | |
| | |
| The accompanying notes are an integral part of these financial statements. | | 111 |
GOLDMAN SACHS CORE FIXED INCOME FUND
Financial Highlights
Selected Data for a Share Outstanding Throughout Each Period
| | | | | | | | | | | | | | | | | | | | | | |
| | | | | | From
Investment Operations | | | | |
| | | Year - Share Class | | Net asset
value,
beginning
of period | | | Net
investment
income(a) | | | Net realized
and unrealized
gain (loss) | | | Total from
investment
operations | | | Distributions
to shareholders
from net
investment
income | |
| | FOR THE SIX MONTHS ENDED SEPTEMBER 30, (UNAUDITED) | |
| | 2017 - A | | $ | 10.40 | | | $ | 0.09 | | | $ | 0.13 | | | $ | 0.22 | | | $ | (0.12 | ) |
| | 2017 - C | | | 10.46 | | | | 0.05 | | | | 0.12 | | | | 0.17 | | | | (0.08 | ) |
| | 2017 - Institutional | | | 10.45 | | | | 0.11 | | | | 0.11 | | | | 0.22 | | | | (0.13 | ) |
| | 2017 - Service | | | 10.45 | | | | 0.08 | | | | 0.12 | | | | 0.20 | | | | (0.11 | ) |
| | 2017 - Investor(e) | | | 10.41 | | | | 0.10 | | | | 0.13 | | | | 0.23 | | | | (0.13 | ) |
| | 2017 - R | | | 10.41 | | | | 0.08 | | | | 0.11 | | | | 0.19 | | | | (0.10 | ) |
| | 2017 - R6 | | | 10.45 | | | | 0.14 | | | | 0.09 | | | | 0.23 | | | | (0.13 | ) |
| | | | | | | | | | | | | | | | | | | | | | |
| | FOR THE FISCAL YEARS ENDED MARCH 31, | |
| | 2017 - A | | | 10.53 | | | | 0.19 | | | | (0.09 | ) | | | 0.10 | | | | (0.23 | ) |
| | 2017 - C | | | 10.59 | | | | 0.11 | | | | (0.09 | ) | | | 0.02 | | | | (0.15 | ) |
| | 2017 - Institutional | | | 10.57 | | | | 0.22 | | | | (0.07 | ) | | | 0.15 | | | | (0.27 | ) |
| | 2017 - Service | | | 10.58 | | | | 0.17 | | | | (0.09 | ) | | | 0.08 | | | | (0.21 | ) |
| | 2017 - Investor(e) | | | 10.54 | | | | 0.21 | | | | (0.08 | ) | | | 0.13 | | | | (0.26 | ) |
| | 2017 - R | | | 10.54 | | | | 0.16 | | | | (0.09 | ) | | | 0.07 | | | | (0.20 | ) |
| | 2017 - R6 | | | 10.57 | | | | 0.23 | | | | (0.08 | ) | | | 0.15 | | | | (0.27 | ) |
| | 2016 - A | | | 10.64 | | | | 0.21 | | | | (0.07 | ) | | | 0.14 | | | | (0.25 | ) |
| | 2016 - C | | | 10.69 | | | | 0.13 | | | | (0.06 | ) | | | 0.07 | | | | (0.17 | ) |
| | 2016 - Institutional | | | 10.68 | | | | 0.24 | | | | (0.06 | ) | | | 0.18 | | | | (0.29 | ) |
| | 2016 - Service | | | 10.69 | | | | 0.19 | | | | (0.07 | ) | | | 0.12 | | | | (0.23 | ) |
| | 2016 - Investor(e) | | | 10.65 | | | | 0.23 | | | | (0.06 | ) | | | 0.17 | | | | (0.28 | ) |
| | 2016 - R | | | 10.65 | | | | 0.19 | | | | (0.08 | ) | | | 0.11 | | | | (0.22 | ) |
| | 2016 - R6 (Commenced July 31, 2015) | | | 10.52 | | | | 0.16 | | | | 0.08 | | | | 0.24 | | | | (0.19 | ) |
| | 2015 - A | | | 10.38 | | | | 0.20 | | | | 0.29 | | | | 0.49 | | | | (0.23 | ) |
| | 2015 - C | | | 10.43 | | | | 0.12 | | | | 0.29 | | | | 0.41 | | | | (0.15 | ) |
| | 2015 - Institutional | | | 10.42 | | | | 0.23 | | | | 0.30 | | | | 0.53 | | | | (0.27 | ) |
| | 2015 - Service | | | 10.43 | | | | 0.18 | | | | 0.30 | | | | 0.48 | | | | (0.22 | ) |
| | 2015 - Investor(e) | | | 10.39 | | | | 0.22 | | | | 0.30 | | | | 0.52 | | | | (0.26 | ) |
| | 2015 - R | | | 10.39 | | | | 0.17 | | | | 0.30 | | | | 0.47 | | | | (0.21 | ) |
| | 2014 - A | | | 10.61 | | | | 0.19 | | | | (0.18 | ) | | | 0.01 | | | | (0.24 | ) |
| | 2014 - C | | | 10.67 | | | | 0.11 | | | | (0.19 | ) | | | (0.08 | ) | | | (0.16 | ) |
| | 2014 - Institutional | | | 10.65 | | | | 0.22 | | | | (0.17 | ) | | | 0.05 | | | | (0.28 | ) |
| | 2014 - Service | | | 10.66 | | | | 0.15 | | | | (0.16 | ) | | | (0.01 | ) | | | (0.22 | ) |
| | 2014 - Investor(e) | | | 10.62 | | | | 0.21 | | | | (0.17 | ) | | | 0.04 | | | | (0.27 | ) |
| | 2014 - R | | | 10.62 | | | | 0.16 | | | | (0.18 | ) | | | (0.02 | ) | | | (0.21 | ) |
| | 2013 - A | | | 10.31 | | | | 0.16 | | | | 0.36 | | | | 0.52 | | | | (0.22 | ) |
| | 2013 - C | | | 10.37 | | | | 0.08 | | | | 0.36 | | | | 0.44 | | | | (0.14 | ) |
| | 2013 - Institutional | | | 10.36 | | | | 0.20 | | | | 0.35 | | | | 0.55 | | | | (0.26 | ) |
| | 2013 - Service | | | 10.36 | | | | 0.14 | | | | 0.37 | | | | 0.51 | | | | (0.21 | ) |
| | 2013 - Investor(e) | | | 10.32 | | | | 0.19 | | | | 0.36 | | | | 0.55 | | | | (0.25 | ) |
| | 2013 - R | | | 10.33 | | | | 0.13 | | | | 0.36 | | | | 0.49 | | | | (0.20 | ) |
| | (a) | | Calculated based on the average shares outstanding methodology. |
| | (b) | | Assumes investment at the NAV at the beginning of the period, reinvestment of all dividends and distributions, a complete redemption of the investment at the NAV at the end of the period and no sales or redemption charges. Total returns would be reduced if a sales or redemption charge was taken into account. Returns do not reflect the impact of taxes to shareholder relating to Fund distributions or the redemption of Fund shares. Total returns for periods less than one full year are not annualized. |
| | (c) | | The Fund’s portfolio turnover rate is calculated in accordance with regulatory requirements, without regard to transactions involving short term investments and certain derivatives. If such transactions were included, the Fund’s portfolio turnover rate may be higher. |
| | (e) | | Effective before the opening of business on August 15, 2017, Class IR Shares were designated as Investor Shares. |
| | |
| 112 | | The accompanying notes are an integral part of these financial statements. |
GOLDMAN SACHS CORE FIXED INCOME FUND
| | | | | | | | | | | | | | | | | | | | | | | | | | | | | | | | | | | | | | | | |
| | | | | | | | | | | | | |
| | | Net asset
value, end
of period | | | | | Total
return(b) | | | | | Net assets,
end of
period
(in 000s) | | | | | Ratio of
net expenses
to average
net assets | | | | | Ratio of
total expenses
to average
net assets | | | | | Ratio of
net investment
income
to average
net assets | | | | | Portfolio
turnover
rate(c) | |
| | | | | | | | | | | | | | | | | | | | | | | | | | | | | | | | | | | | | | | | |
| | $ | 10.50 | | | | | | 2.08 | % | | | | $ | 66,434 | | | | | | 0.79 | %(d) | | | | | 0.84 | %(d) | | | | | 1.74 | %(d) | | | | | 135 | % |
| | | 10.55 | | | | | | 1.59 | | | | | | 9,941 | | | | | | 1.54 | (d) | | | | | 1.59 | (d) | | | | | 0.98 | (d) | | | | | 135 | |
| | | 10.54 | | | | | | 2.15 | | | | | | 863,590 | | | | | | 0.45 | (d) | | | | | 0.50 | (d) | | | | | 2.07 | (d) | | | | | 135 | |
| | | 10.54 | | | | | | 1.89 | | | | | | 1,351 | | | | | | 0.95 | (d) | | | | | 1.00 | (d) | | | | | 1.57 | (d) | | | | | 135 | |
| | | 10.51 | | | | | | 2.20 | | | | | | 45,600 | | | | | | 0.54 | (d) | | | | | 0.59 | (d) | | | | | 1.98 | (d) | | | | | 135 | |
| | | 10.50 | | | | | | 1.85 | | | | | | 4,726 | | | | | | 1.04 | (d) | | | | | 1.09 | (d) | | | | | 1.50 | (d) | | | | | 135 | |
| | | 10.55 | | | | | | 2.25 | | | | | | 321 | | | | | | 0.43 | (d) | | | | | 0.48 | (d) | | | | | 2.64 | (d) | | | | | 135 | |
| | | | | | | | | | | | | | | | | | | | | | | | | | | | | | | | | | | | | | | | |
| | | | | | | | | | | | | | | | | | | | | | | | | | | | | | | | | | | | | | | | |
| | | 10.40 | | | | | | 0.94 | | | | | | 148,548 | | | | | | 0.79 | | | | | | 0.84 | | | | | | 1.77 | | | | | | 363 | |
| | | 10.46 | | | | | | 0.20 | | | | | | 15,714 | | | | | | 1.54 | | | | | | 1.59 | | | | | | 1.02 | | | | | | 363 | |
| | | 10.45 | | | | | | 1.38 | | | | | | 776,135 | | | | | | 0.44 | | | | | | 0.50 | | | | | | 2.11 | | | | | | 363 | |
| | | 10.45 | | | | | | 0.79 | | | | | | 1,522 | | | | | | 0.94 | | | | | | 1.00 | | | | | | 1.61 | | | | | | 363 | |
| | | 10.41 | | | | | | 1.19 | | | | | | 38,620 | | | | | | 0.53 | | | | | | 0.59 | | | | | | 2.01 | | | | | | 363 | |
| | | 10.41 | | | | | | 0.69 | | | | | | 944 | | | | | | 1.03 | | | | | | 1.10 | | | | | | 1.50 | | | | | | 363 | |
| | | 10.45 | | | | | | 1.40 | | | | | | 56,117 | | | | | | 0.42 | | | | | | 0.48 | | | | | | 2.13 | | | | | | 363 | |
| | | 10.53 | | | | | | 1.35 | | | | | | 142,299 | | | | | | 0.78 | | | | | | 0.85 | | | | | | 1.98 | | | | | | 450 | |
| | | 10.59 | | | | | | 0.69 | | | | | | 18,124 | | | | | | 1.53 | | | | | | 1.60 | | | | | | 1.23 | | | | | | 450 | |
| | | 10.57 | | | | | | 1.69 | | | | | | 697,260 | | | | | | 0.44 | | | | | | 0.51 | | | | | | 2.31 | | | | | | 450 | |
| | | 10.58 | | | | | | 1.19 | | | | | | 1,578 | | | | | | 0.94 | | | | | | 1.01 | | | | | | 1.82 | | | | | | 450 | |
| | | 10.54 | | | | | | 1.60 | | | | | | 5,058 | | | | | | 0.53 | | | | | | 0.60 | | | | | | 2.23 | | | | | | 450 | |
| | | 10.54 | | | | | | 1.09 | | | | | | 9,524 | | | | | | 1.03 | | | | | | 1.11 | | | | | | 1.79 | | | | | | 450 | |
| | | 10.57 | | | | | | 2.34 | | | | | | 57,091 | | | | | | 0.43 | (d) | | | | | 0.49 | (d) | | | | | 2.36 | (d) | | | | | 450 | |
| | | 10.64 | | | | | | 4.77 | | | | | | 150,677 | | | | | | 0.83 | | | | | | 0.85 | | | | | | 1.86 | | | | | | 388 | |
| | | 10.69 | | | | | | 3.98 | | | | | | 19,477 | | | | | | 1.58 | | | | | | 1.60 | | | | | | 1.12 | | | | | | 388 | |
| | | 10.68 | | | | | | 5.11 | | | | | | 758,542 | | | | | | 0.49 | | | | | | 0.51 | | | | | | 2.21 | | | | | | 388 | |
| | | 10.69 | | | | | | 4.59 | | | | | | 1,882 | | | | | | 0.99 | | | | | | 1.01 | | | | | | 1.71 | | | | | | 388 | |
| | | 10.65 | | | | | | 5.03 | | | | | | 5,054 | | | | | | 0.56 | | | | | | 0.60 | | | | | | 2.10 | | | | | | 388 | |
| | | 10.65 | | | | | | 4.51 | | | | | | 1,126 | | | | | | 1.07 | | | | | | 1.10 | | | | | | 1.60 | | | | | | 388 | |
| | | 10.38 | | | | | | 0.12 | | | | | | 134,288 | | | | | | 0.83 | | | | | | 0.83 | | | | | | 1.80 | | | | | | 516 | |
| | | 10.43 | | | | | | (0.71 | ) | | | | | 20,262 | | | | | | 1.58 | | | | | | 1.58 | | | | | | 1.05 | | | | | | 516 | |
| | | 10.42 | | | | | | 0.47 | | | | | | 895,504 | | | | | | 0.49 | | | | | | 0.49 | | | | | | 2.13 | | | | | | 516 | |
| | | 10.43 | | | | | | (0.03 | ) | | | | | 1,837 | | | | | | 0.98 | | | | | | 0.98 | | | | | | 1.40 | | | | | | 516 | |
| | | 10.39 | | | | | | 0.37 | | | | | | 1,374 | | | | | | 0.58 | | | | | | 0.58 | | | | | | 2.03 | | | | | | 516 | |
| | | 10.39 | | | | | | (0.13 | ) | | | | | 557 | | | | | | 1.08 | | | | | | 1.08 | | | | | | 1.54 | | | | | | 516 | |
| | | 10.61 | | | | | | 5.08 | | | | | | 159,470 | | | | | | 0.81 | | | | | | 0.81 | | | | | | 1.54 | | | | | | 782 | |
| | | 10.67 | | | | | | 4.28 | | | | | | 25,723 | | | | | | 1.56 | | | | | | 1.56 | | | | | | 0.79 | | | | | | 782 | |
| | | 10.65 | | | | | | 5.32 | | | | | | 1,198,584 | | | | | | 0.47 | | | | | | 0.47 | | | | | | 1.88 | | | | | | 782 | |
| | | 10.66 | | | | | | 4.90 | | | | | | 17,528 | | | | | | 0.97 | | | | | | 0.97 | | | | | | 1.35 | | | | | | 782 | |
| | | 10.62 | | | | | | 5.34 | | | | | | 1,622 | | | | | | 0.56 | | | | | | 0.56 | | | | | | 1.78 | | | | | | 782 | |
| | | 10.62 | | | | | | 4.72 | | | | | | 648 | | | | | | 1.06 | | | | | | 1.06 | | | | | | 1.24 | | | | | | 782 | |
| | |
| The accompanying notes are an integral part of these financial statements. | | 113 |
GOLDMAN SACHS GLOBAL INCOME FUND
Financial Highlights
Selected Data for a Share Outstanding Throughout Each Period
| | | | | | | | | | | | | | | | | | | | | | | | | | | | | | |
| | | | | | From
Investment Operations | | | Distributions
to shareholders | |
| | | Year - Share Class | | Net asset
value,
beginning
of period | | | Net
investment
income(a) | | | Net realized
and unrealized
gain | | | Total from
investment
operations | | | From net
investment
income | | | From net
realized
gains | | | Total
distributions | |
| | FOR THE SIX MONTHS ENDED SEPTEMBER 30, (UNAUDITED) | |
| | 2017 - A | | $ | 12.21 | | | $ | 0.05 | | | $ | 0.09 | | | $ | 0.14 | | | $ | (0.06 | ) | | $ | — | | | $ | (0.06 | ) |
| | 2017 - C | | | 12.11 | | | | — | (e) | | | 0.10 | | | | 0.10 | | | | (0.02 | ) | | | — | | | | (0.02 | ) |
| | 2017 - Institutional | | | 12.19 | | | | 0.07 | | | | 0.09 | | | | 0.16 | | | | (0.08 | ) | | | — | | | | (0.08 | ) |
| | 2017 - Service | | | 12.12 | | | | 0.04 | | | | 0.09 | | | | 0.13 | | | | (0.05 | ) | | | — | | | | (0.05 | ) |
| | 2017 - Investor(f) | | | 12.17 | | | | 0.06 | | | | 0.10 | | | | 0.16 | | | | (0.08 | ) | | | — | | | | (0.08 | ) |
| | 2017 - R6 | | | 12.19 | | | | 0.07 | | | | 0.09 | | | | 0.16 | | | | (0.08 | ) | | | — | | | | (0.08 | ) |
| | | | | | | | | | | | | | | | | | | | | | | | | | | | | | |
| | FOR THE FISCAL YEARS ENDED MARCH 31, | |
| | 2017 - A | | | 12.24 | | | | 0.09 | | | | 0.05 | | | | 0.14 | | | | (0.12 | ) | | | (0.05 | ) | | | (0.17 | ) |
| | 2017 - C | | | 12.14 | | | | — | (e) | | | 0.05 | | | | 0.05 | | | | (0.03 | ) | | | (0.05 | ) | | | (0.08 | ) |
| | 2017 - Institutional | | | 12.22 | | | | 0.13 | | | | 0.05 | | | | 0.18 | | | | (0.16 | ) | | | (0.05 | ) | | | (0.21 | ) |
| | 2017 - Service | | | 12.16 | | | | 0.07 | | | | 0.04 | | | | 0.11 | | | | (0.10 | ) | | | (0.05 | ) | | | (0.15 | ) |
| | 2017 - Investor(f) | | | 12.20 | | | | 0.11 | | | | 0.06 | | | | 0.17 | | | | (0.15 | ) | | | (0.05 | ) | | | (0.20 | ) |
| | 2017 - R6 | | | 12.22 | | | | 0.11 | | | | 0.07 | | | | 0.18 | | | | (0.16 | ) | | | (0.05 | ) | | | (0.21 | ) |
| | 2016 - A | | | 12.76 | | | | 0.13 | | | | 0.07 | | | | 0.20 | | | | (0.71 | ) | | | (0.01 | ) | | | (0.72 | ) |
| | 2016 - C | | | 12.67 | | | | 0.04 | | | | 0.05 | | | | 0.09 | | | | (0.61 | ) | | | (0.01 | ) | | | (0.62 | ) |
| | 2016 - Institutional | | | 12.74 | | | | 0.17 | | | | 0.07 | | | | 0.24 | | | | (0.75 | ) | | | (0.01 | ) | | | (0.76 | ) |
| | 2016 - Service | | | 12.71 | | | | 0.09 | | | | 0.05 | | | | 0.14 | | | | (0.68 | ) | | | (0.01 | ) | | | (0.69 | ) |
| | 2016 - Investor(f) | | | 12.72 | | | | 0.16 | | | | 0.07 | | | | 0.23 | | | | (0.74 | ) | | | (0.01 | ) | | | (0.75 | ) |
| | 2016 - R6 (Commenced July 31, 2015) | | | 12.55 | | | | 0.09 | | | | 0.26 | | | | 0.35 | | | | (0.67 | ) | | | (0.01 | ) | | | (0.68 | ) |
| | 2015 - A | | | 12.70 | | | | 0.16 | | | | 0.50 | | | | 0.66 | | | | (0.31 | ) | | | (0.29 | ) | | | (0.60 | ) |
| | 2015 - C | | | 12.61 | | | | 0.06 | | | | 0.51 | | | | 0.57 | | | | (0.22 | ) | | | (0.29 | ) | | | (0.51 | ) |
| | 2015 - Institutional | | | 12.68 | | | | 0.20 | | | | 0.50 | | | | 0.70 | | | | (0.35 | ) | | | (0.29 | ) | | | (0.64 | ) |
| | 2015 - Service | | | 12.66 | | | | 0.14 | | | | 0.49 | | | | 0.63 | | | | (0.29 | ) | | | (0.29 | ) | | | (0.58 | ) |
| | 2015 - Investor(f) | | | 12.66 | | | | 0.15 | | | | 0.54 | | | | 0.69 | | | | (0.34 | ) | | | (0.29 | ) | | | (0.63 | ) |
| | 2014 - A | | | 13.20 | | | | 0.24 | | | | 0.03 | | | | 0.27 | | | | (0.58 | ) | | | (0.19 | ) | | | (0.77 | ) |
| | 2014 - C | | | 13.11 | | | | 0.14 | | | | 0.03 | | | | 0.17 | | | | (0.48 | ) | | | (0.19 | ) | | | (0.67 | ) |
| | 2014 - Institutional | | | 13.18 | | | | 0.28 | | | | 0.03 | | | | 0.31 | | | | (0.62 | ) | | | (0.19 | ) | | | (0.81 | ) |
| | 2014 - Service | | | 13.16 | | | | 0.22 | | | | 0.03 | | | | 0.25 | | | | (0.56 | ) | | | (0.19 | ) | | | (0.75 | ) |
| | 2014 - Investor(f) | | | 13.17 | | | | 0.27 | | | | 0.02 | | | | 0.29 | | | | (0.61 | ) | | | (0.19 | ) | | | (0.80 | ) |
| | 2013 - A | | | 13.17 | | | | 0.22 | | | | 0.60 | | | | 0.82 | | | | (0.34 | ) | | | (0.45 | ) | | | (0.79 | ) |
| | 2013 - C | | | 13.09 | | | | 0.12 | | | | 0.59 | | | | 0.71 | | | | (0.24 | ) | | | (0.45 | ) | | | (0.69 | ) |
| | 2013 - Institutional | | | 13.15 | | | | 0.27 | | | | 0.60 | | | | 0.87 | | | | (0.39 | ) | | | (0.45 | ) | | | (0.84 | ) |
| | 2013 - Service | | | 13.13 | | | | 0.20 | | | | 0.60 | | | | 0.80 | | | | (0.32 | ) | | | (0.45 | ) | | | (0.77 | ) |
| | 2013 - Investor(f) | | | 13.15 | | | | 0.26 | | | | 0.59 | | | | 0.85 | | | | (0.38 | ) | | | (0.45 | ) | | | (0.83 | ) |
| | (a) | | Calculated based on the average shares outstanding methodology. |
| | (b) | | Assumes investment at the NAV at the beginning of the period, reinvestment of all dividends and distributions, a complete redemption of the investment at the NAV at the end of the period and no sales or redemption charges. Total returns would be reduced if a sales or redemption charge was taken into account. Returns do not reflect the impact of taxes to shareholder relating to Fund distributions or the redemption of Fund shares. Total returns for periods less than one full year are not annualized. |
| | (c) | | The Fund’s portfolio turnover rate is calculated in accordance with regulatory requirements, without regard to transactions involving short term investments and certain derivatives. If such transactions were included, the Fund’s portfolio turnover rate may be higher. |
| | (e) | | Amount is less than $0.005 per share. |
| | (f) | | Effective before the opening of business on August 15, 2017, Class IR Shares were designated as Investor Shares. |
| | |
| 114 | | The accompanying notes are an integral part of these financial statements. |
GOLDMAN SACHS GLOBAL INCOME FUND
| | | | | | | | | | | | | | | | | | | | | | | | | | | | | | | | | | | | | | | | |
| | | | | | | | | | | | | |
| | | Net asset
value, end
of period | | | | | Total
return(b) | | | | | Net assets,
end of
period
(in 000s) | | | | | Ratio of
net expenses
to average
net assets | | | | | Ratio of
total expenses
to average
net assets | | | | | Ratio of
net investment
income (loss)
to average
net assets | | | | | Portfolio
turnover
rate(c) | |
| | | | | | | | | | | | | | | | | | | | | | | | | | | | | | | | | | | | | | | | |
| | $ | 12.29 | | | | | | 1.17 | % | | | | $ | 124,931 | | | | | | 1.03 | %(d) | | | | | 1.13 | %(d) | | | | | 0.75 | %(d) | | | | | 82 | % |
| | | 12.19 | | | | | | 0.81 | | | | | | 15,582 | | | | | | 1.75 | (d) | | | | | 1.88 | (d) | | | | | 0.03 | (d) | | | | | 82 | |
| | | 12.27 | | | | | | 1.34 | | | | | | 564,804 | | | | | | 0.69 | (d) | | | | | 0.79 | (d) | | | | | 1.08 | (d) | | | | | 82 | |
| | | 12.20 | | | | | | 1.09 | | | | | | 2,827 | | | | | | 1.18 | (d) | | | | | 1.29 | (d) | | | | | 0.59 | (d) | | | | | 82 | |
| | | 12.25 | | | | | | 1.29 | | | | | | 93,187 | | | | | | 0.78 | (d) | | | | | 0.88 | (d) | | | | | 0.99 | (d) | | | | | 82 | |
| | | 12.27 | | | | | | 1.34 | | | | | | 6,103 | | | | | | 0.68 | (d) | | | | | 0.77 | (d) | | | | | 1.10 | (d) | | | | | 82 | |
| | | | | | | | | | | | | | | | | | | | | | | | | | | | | | | | | | | | | | | | |
| | | | |
| | | 12.21 | | | | | | 1.14 | | | | | | 136,317 | | | | | | 1.03 | | | | | | 1.13 | | | | | | 0.71 | | | | | | 289 | |
| | | 12.11 | | | | | | 0.42 | | | | | | 20,808 | | | | | | 1.74 | | | | | | 1.88 | | | | | | (0.03 | ) | | | | | 289 | |
| | | 12.19 | | | | | | 1.48 | | | | | | 627,253 | | | | | | 0.69 | | | | | | 0.79 | | | | | | 1.05 | | | | | | 289 | |
| | | 12.12 | | | | | | 0.90 | | | | | | 2,772 | | | | | | 1.19 | | | | | | 1.29 | | | | | | 0.56 | | | | | | 289 | |
| | | 12.17 | | | | | | 1.39 | | | | | | 97,332 | | | | | | 0.78 | | | | | | 0.88 | | | | | | 0.90 | | | | | | 289 | |
| | | 12.19 | | | | | | 1.50 | | | | | | 5,468 | | | | | | 0.67 | | | | | | 0.77 | | | | | | 0.92 | | | | | | 289 | |
| | | 12.24 | | | | | | 1.67 | | | | | | 111,852 | | | | | | 1.03 | | | | | | 1.15 | | | | | | 1.06 | | | | | | 261 | |
| | | 12.14 | | | | | | 0.83 | | | | | | 12,653 | | | | | | 1.77 | | | | | | 1.90 | | | | | | 0.31 | | | | | | 261 | |
| | | 12.22 | | | | | | 2.00 | | | | | | 639,915 | | | | | | 0.69 | | | | | | 0.81 | | | | | | 1.41 | | | | | | 261 | |
| | | 12.16 | | | | | | 1.23 | | | | | | 2,280 | | | | | | 1.18 | | | | | | 1.29 | | | | | | 0.75 | | | | | | 261 | |
| | | 12.20 | | | | | | 1.95 | | | | | | 31,548 | | | | | | 0.78 | | | | | | 0.90 | | | | | | 1.26 | | | | | | 261 | |
| | | 12.22 | | | | | | 2.92 | | | | | | 520 | | | | | | 0.68 | (d) | | | | | 0.79 | (d) | | | | | 1.10 | (d) | | | | | 261 | |
| | | 12.76 | | | | | | 5.27 | | | | | | 64,939 | | | | | | 1.03 | | | | | | 1.18 | | | | | | 1.26 | | | | | | 226 | |
| | | 12.67 | | | | | | 4.53 | | | | | | 6,592 | | | | | | 1.77 | | | | | | 1.93 | | | | | | 0.50 | | | | | | 226 | |
| | | 12.74 | | | | | | 5.63 | | | | | | 437,007 | | | | | | 0.70 | | | | | | 0.84 | | | | | | 1.60 | | | | | | 226 | |
| | | 12.71 | | | | | | 5.03 | | | | | | 358 | | | | | | 1.20 | | | | | | 1.34 | | | | | | 1.12 | | | | | | 226 | |
| | | 12.72 | | | | | | 5.54 | | | | | | 10,261 | | | | | | 0.77 | | | | | | 0.90 | | | | | | 1.20 | | | | | | 226 | |
| | | 12.70 | | | | | | 2.16 | | | | | | 61,198 | | | | | | 1.04 | | | | | | 1.20 | | | | | | 1.83 | | | | | | 288 | |
| | | 12.61 | | | | | | 1.40 | | | | | | 4,688 | | | | | | 1.79 | | | | | | 1.95 | | | | | | 1.08 | | | | | | 288 | |
| | | 12.68 | | | | | | 2.51 | | | | | | 426,746 | | | | | | 0.70 | | | | | | 0.86 | | | | | | 2.19 | | | | | | 288 | |
| | | 12.66 | | | | | | 1.98 | | | | | | 239 | | | | | | 1.20 | | | | | | 1.35 | | | | | | 1.70 | | | | | | 288 | |
| | | 12.66 | | | | | | 2.34 | | | | | | 757 | | | | | | 0.79 | | | | | | 0.95 | | | | | | 2.09 | | | | | | 288 | |
| | | 13.20 | | | | | | 6.32 | | | | | | 79,838 | | | | | | 1.04 | | | | | | 1.15 | | | | | | 1.64 | | | | | | 444 | |
| | | 13.11 | | | | | | 5.57 | | | | | | 5,757 | | | | | | 1.79 | | | | | | 1.90 | | | | | | 0.92 | | | | | | 444 | |
| | | 13.18 | | | | | | 6.69 | | | | | | 387,889 | | | | | | 0.69 | | | | | | 0.81 | | | | | | 1.99 | | | | | | 444 | |
| | | 13.16 | | | | | | 6.16 | | | | | | 145 | | | | | | 1.19 | | | | | | 1.31 | | | | | | 1.49 | | | | | | 444 | |
| | | 13.17 | | | | | | 6.51 | | | | | | 545 | | | | | | 0.79 | | | | | | 0.90 | | | | | | 1.94 | | | | | | 444 | |
| | |
| The accompanying notes are an integral part of these financial statements. | | 115 |
GOLDMAN SACHS STRATEGIC INCOME FUND
Financial Highlights
Selected Data for a Share Outstanding Throughout Each Period
| | | | | | | | | | | | | | | | | | | | | | | | | | | | | | |
| | | | | | | | From
Investment Operations | | | Distributions
to shareholders | |
| | | Year - Share Class | | Net asset
value,
beginning
of period | | | Net
investment
income(a) | | | Net realized
and unrealized
gain (loss) | | | Total from
investment
operations | | | From net
investment
income | | | From
capital | | | Total
distributions | |
| | FOR THE SIX MONTHS ENDED SEPTEMBER 30, (UNAUDITED) | |
| | 2017 - A | | $ | 9.70 | | | $ | 0.11 | | | $ | (0.15 | ) | | $ | (0.04 | ) | | $ | (0.07 | ) | | $ | — | | | $ | (0.07 | ) |
| | 2017 - C | | | 9.71 | | | | 0.07 | | | | (0.16 | ) | | | (0.09 | ) | | | (0.03 | ) | | | — | | | | (0.03 | ) |
| | 2017 - Institutional | | | 9.70 | | | | 0.12 | | | | (0.14 | ) | | | (0.02 | ) | | | (0.09 | ) | | | — | | | | (0.09 | ) |
| | 2017 - Investor(f) | | | 9.70 | | | | 0.12 | | | | (0.15 | ) | | | (0.03 | ) | | | (0.08 | ) | | | — | | | | (0.08 | ) |
| | 2017 - R | | | 9.70 | | | | 0.09 | | | | (0.15 | ) | | | (0.06 | ) | | | (0.06 | ) | | | — | | | | (0.06 | ) |
| | 2017 - R6 | | | 9.70 | | | | 0.12 | | | | (0.14 | ) | | | (0.02 | ) | | | (0.09 | ) | | | — | | | | (0.09 | ) |
| | | | | | | | | | | | | | | | | | | | | | | | | | | | | | |
| | FOR THE FISCAL YEARS ENDED MARCH 31, | |
| | 2017 - A | | | 9.41 | | | | 0.19 | | | | 0.26 | | | | 0.45 | | | | (0.11 | ) | | | (0.05 | ) | | | (0.16 | ) |
| | 2017 - C | | | 9.41 | | | | 0.12 | | | | 0.28 | | | | 0.40 | | | | (0.07 | ) | | | (0.03 | ) | | | (0.10 | ) |
| | 2017 - Institutional | | | 9.41 | | | | 0.22 | | | | 0.26 | | | | 0.48 | | | | (0.13 | ) | | | (0.06 | ) | | | (0.19 | ) |
| | 2017 - Investor(f) | | | 9.41 | | | | 0.21 | | | | 0.26 | | | | 0.47 | | | | (0.13 | ) | | | (0.05 | ) | | | (0.18 | ) |
| | 2017 - R | | | 9.40 | | | | 0.16 | | | | 0.28 | | | | 0.44 | | | | (0.10 | ) | | | (0.04 | ) | | | (0.14 | ) |
| | 2017 - R6 | | | 9.41 | | | | 0.21 | | | | 0.27 | | | | 0.48 | | | | (0.13 | ) | | | (0.06 | ) | | | (0.19 | ) |
| | 2016 - A | | | 10.06 | | | | 0.28 | | | | (0.52 | ) | | | (0.24 | ) | | | (0.41 | ) | | | — | | | | (0.41 | ) |
| | 2016 - C | | | 10.06 | | | | 0.21 | | | | (0.52 | ) | | | (0.31 | ) | | | (0.34 | ) | | | — | | | | (0.34 | ) |
| | 2016 - Institutional | | | 10.06 | | | | 0.31 | | | | (0.52 | ) | | | (0.21 | ) | | | (0.44 | ) | | | — | | | | (0.44 | ) |
| | 2016 - Investor(f) | | | 10.06 | | | | 0.31 | | | | (0.53 | ) | | | (0.22 | ) | | | (0.43 | ) | | | — | | | | (0.43 | ) |
| | 2016 - R | | | 10.05 | | | | 0.25 | | | | (0.52 | ) | | | (0.27 | ) | | | (0.38 | ) | | | — | | | | (0.38 | ) |
| | 2016 - R6 (Commenced July 31, 2015) | | | 10.04 | | | | 0.20 | | | | (0.50 | ) | | | (0.30 | ) | | | (0.33 | ) | | | — | | | | (0.33 | ) |
| | 2015 - A | | | 10.64 | | | | 0.22 | | | | (0.51 | ) | | | (0.29 | ) | | | (0.29 | ) | | | — | (e) | | | (0.29 | ) |
| | 2015 - C | | | 10.64 | | | | 0.14 | | | | (0.51 | ) | | | (0.37 | ) | | | (0.21 | ) | | | — | (e) | | | (0.21 | ) |
| | 2015 - Institutional | | | 10.64 | | | | 0.25 | | | | (0.50 | ) | | | (0.25 | ) | | | (0.33 | ) | | | — | (e) | | | (0.33 | ) |
| | 2015 - Investor(f) | | | 10.63 | | | | 0.24 | | | | (0.49 | ) | | | (0.25 | ) | | | (0.32 | ) | | | — | (e) | | | (0.32 | ) |
| | 2015 - R | | | 10.63 | | | | 0.19 | | | | (0.51 | ) | | | (0.32 | ) | | | (0.26 | ) | | | — | (e) | | | (0.26 | ) |
| | 2014 - A | | | 10.46 | | | | 0.22 | | | | 0.21 | | | | 0.43 | | | | (0.25 | ) | | | — | | | | (0.25 | ) |
| | 2014 - C | | | 10.46 | | | | 0.14 | | | | 0.21 | | | | 0.35 | | | | (0.17 | ) | | | — | | | | (0.17 | ) |
| | 2014 - Institutional | | | 10.46 | | | | 0.26 | | | | 0.21 | | | | 0.47 | | | | (0.29 | ) | | | — | | | | (0.29 | ) |
| | 2014 - Investor(f) | | | 10.46 | | | | 0.25 | | | | 0.20 | | | | 0.45 | | | | (0.28 | ) | | | — | | | | (0.28 | ) |
| | 2014 - R | | | 10.45 | | | | 0.21 | | | | 0.19 | | | | 0.40 | | | | (0.22 | ) | | | — | | | | (0.22 | ) |
| | 2013 - A | | | 9.87 | | | | 0.32 | | | | 0.73 | | | | 1.05 | | | | (0.46 | ) | | | — | | | | (0.46 | ) |
| | 2013 - C | | | 9.88 | | | | 0.24 | | | | 0.72 | | | | 0.96 | | | | (0.38 | ) | | | — | | | | (0.38 | ) |
| | 2013 - Institutional | | | 9.87 | | | | 0.35 | | | | 0.73 | | | | 1.08 | | | | (0.49 | ) | | | — | | | | (0.49 | ) |
| | 2013 - Investor(f) | | | 9.87 | | | | 0.34 | | | | 0.73 | | | | 1.07 | | | | (0.48 | ) | | | — | | | | (0.48 | ) |
| | 2013 - R | | | 9.87 | | | | 0.30 | | | | 0.71 | | | | 1.01 | | | | (0.43 | ) | | | — | | | | (0.43 | ) |
| | (a) | | Calculated based on the average shares outstanding methodology. |
| | (b) | | Assumes investment at the NAV at the beginning of the period, reinvestment of all dividends and distributions, a complete redemption of the investment at the NAV at the end of the period and no sales or redemption charges. Total returns would be reduced if a sales or redemption charge was taken into account. Returns do not reflect the impact of taxes to shareholder relating to Fund distributions or the redemption of Fund shares. Total returns for periods less than one full year are not annualized. |
| | (c) | | The Fund’s portfolio turnover rate is calculated in accordance with regulatory requirements, without regard to transactions involving short term investments and certain derivatives. If such transactions were included, the Fund’s portfolio turnover rate may be higher. |
| | (e) | | Rounds to less than $0.01 per share. |
| | (f) | | Effective before the opening of business on August 15, 2017, Class IR Shares were designated as Investor Shares. |
| | |
| 116 | | The accompanying notes are an integral part of these financial statements. |
GOLDMAN SACHS STRATEGIC INCOME FUND
| | | | | | | | | | | | | | | | | | | | | | | | | | | | | | | | | | | | | | | | |
| | | | | | | | | | | | | | | | | | | | | | | | | | | | | | | | | | |
| | | Net asset
value, end
of period | | | | | Total
return(b) | | | | | Net assets,
end of period (in 000s) | | | | | Ratio of
net expenses
to average
net assets | | | | | Ratio of
total expenses
to average
net assets | | | | | Ratio of
net investment
income
to average
net assets | | | | | Portfolio
turnover
rate(c) | |
| | | | | | | | | | | | | | | | | | | | | | | | | | | | | | | | | | | | | | | | |
| | $ | 9.59 | | | | | | (0.42 | )% | | | | $ | 407,342 | | | | | | 0.95 | %(d) | | | | | 0.95 | %(d) | | | | | 2.22 | %(d) | | | | | 75 | % |
| | | 9.59 | | | | | | (0.88 | ) | | | | | 344,472 | | | | | | 1.70 | (d) | | | | | 1.70 | (d) | | | | | 1.44 | (d) | | | | | 75 | |
| | | 9.59 | | | | | | (0.25 | ) | | | | | 5,505,601 | | | | | | 0.61 | (d) | | | | | 0.61 | (d) | | | | | 2.54 | (d) | | | | | 75 | |
| | | 9.59 | | | | | | (0.29 | ) | | | | | 262,681 | | | | | | 0.70 | (d) | | | | | 0.70 | (d) | | | | | 2.45 | (d) | | | | | 75 | |
| | | 9.58 | | | | | | (0.64 | ) | | | | | 8,273 | | | | | | 1.20 | (d) | | | | | 1.20 | (d) | | | | | 1.94 | (d) | | | | | 75 | |
| | | 9.59 | | | | | | (0.24 | ) | | | | | 51,657 | | | | | | 0.60 | (d) | | | | | 0.60 | (d) | | | | | 2.58 | (d) | | | | | 75 | |
| | | | | | | | | | | | | | | | | | | | | | | | | | | | | | | | | | | | | | | | |
| | | | |
| | | 9.70 | | | | | | 4.84 | | | | | | 646,435 | | | | | | 0.92 | | | | | | 0.93 | | | | | | 1.96 | | | | | | 184 | |
| | | 9.71 | | | | | | 4.25 | | | | | | 448,657 | | | | | | 1.60 | | | | | | 1.68 | | | | | | 1.26 | | | | | | 184 | |
| | | 9.70 | | | | | | 5.19 | | | | | | 6,435,385 | | | | | | 0.58 | | | | | | 0.59 | | | | | | 2.31 | | | | | | 184 | |
| | | 9.70 | | | | | | 5.10 | | | | | | 345,997 | | | | | | 0.67 | | | | | | 0.68 | | | | | | 2.23 | | | | | | 184 | |
| | | 9.70 | | | | | | 4.71 | | | | | | 9,577 | | | | | | 1.14 | | | | | | 1.18 | | | | | | 1.66 | | | | | | 184 | |
| | | 9.70 | | | | | | 5.21 | | | | | | 66,431 | | | | | | 0.56 | | | | | | 0.57 | | | | | | 2.18 | | | | | | 184 | |
| | | 9.41 | | | | | | (2.49 | ) | | | | | 1,383,885 | | | | | | 0.90 | | | | | | 0.91 | | | | | | 2.83 | | | | | | 212 | |
| | | 9.41 | | | | | | (3.21 | ) | | | | | 710,230 | | | | | | 1.65 | | | | | | 1.66 | | | | | | 2.08 | | | | | | 212 | |
| | | 9.41 | | | | | | (2.16 | ) | | | | | 11,261,977 | | | | | | 0.56 | | | | | | 0.57 | | | | | | 3.17 | | | | | | 212 | |
| | | 9.41 | | | | | | (2.24 | ) | | | | | 332,917 | | | | | | 0.65 | | | | | | 0.66 | | | | | | 3.09 | | | | | | 212 | |
| | | 9.40 | | | | | | (2.73 | ) | | | | | 9,399 | | | | | | 1.15 | | | | | | 1.16 | | | | | | 2.58 | | | | | | 212 | |
| | | 9.41 | | | | | | (3.05 | ) | | | | | 19,708 | | | | | | 0.53 | (d) | | | | | 0.55 | (d) | | | | | 3.19 | (d) | | | | | 212 | |
| | | 10.06 | | | | | | (2.78 | ) | | | | | 2,648,848 | | | | | | 0.91 | | | | | | 0.91 | | | | | | 2.10 | | | | | | 188 | |
| | | 10.06 | | | | | | (3.51 | ) | | | | | 1,096,577 | | | | | | 1.66 | | | | | | 1.66 | | | | | | 1.34 | | | | | | 188 | |
| | | 10.06 | | | | | | (2.45 | ) | | | | | 18,685,774 | | | | | | 0.57 | | | | | | 0.57 | | | | | | 2.43 | | | | | | 188 | |
| | | 10.06 | | | | | | (2.44 | ) | | | | | 684,204 | | | | | | 0.66 | | | | | | 0.66 | | | | | | 2.34 | | | | | | 188 | |
| | | 10.05 | | | | | | (3.03 | ) | | | | | 9,418 | | | | | | 1.16 | | | | | | 1.16 | | | | | | 1.85 | | | | | | 188 | |
| | | 10.64 | | | | | | 4.16 | | | | | | 3,694,217 | | | | | | 0.91 | | | | | | 0.91 | | | | | | 2.08 | | | | | | 302 | |
| | | 10.64 | | | | | | 3.37 | | | | | | 1,017,213 | | | | | | 1.66 | | | | | | 1.66 | | | | | | 1.31 | | | | | | 302 | |
| | | 10.64 | | | | | | 4.51 | | | | | | 15,469,529 | | | | | | 0.57 | | | | | | 0.57 | | | | | | 2.44 | | | | | | 302 | |
| | | 10.63 | | | | | | 4.32 | | | | | | 71,823 | | | | | | 0.66 | | | | | | 0.66 | | | | | | 2.32 | | | | | | 302 | |
| | | 10.63 | | | | | | 3.90 | | | | | | 5,454 | | | | | | 1.16 | | | | | | 1.16 | | | | | | 1.96 | | | | | | 302 | |
| | | 10.46 | | | | | | 10.80 | | | | | | 709,730 | | | | | | 0.99 | | | | | | 0.99 | | | | | | 3.17 | | | | | | 727 | |
| | | 10.46 | | | | | | 9.86 | | | | | | 239,501 | | | | | | 1.74 | | | | | | 1.74 | | | | | | 2.36 | | | | | | 727 | |
| | | 10.46 | | | | | | 11.18 | | | | | | 2,428,689 | | | | | | 0.65 | | | | | | 0.65 | | | | | | 3.42 | | | | | | 727 | |
| | | 10.46 | | | | | | 11.07 | | | | | | 107,502 | | | | | | 0.74 | | | | | | 0.74 | | | | | | 3.33 | | | | | | 727 | |
| | | 10.45 | | | | | | 10.45 | | | | | | 12 | | | | | | 1.23 | | | | | | 1.23 | | | | | | 2.98 | | | | | | 727 | |
| | |
| The accompanying notes are an integral part of these financial statements. | | 117 |
GOLDMAN SACHS MULTI-SECTOR FIXED INCOME FUNDS
Notes to Financial Statements
September 30, 2017 (Unaudited)
Goldman Sachs Trust (the “Trust”) is a Delaware statutory trust registered under the Investment Company Act of 1940, as amended (the “Act”), as an open-end management investment company. The following table lists those series of the Trust that are included in this report (collectively, the “Funds” or individually a “Fund”), along with their corresponding share classes and respective diversification status under the Act:
| | | | |
| Fund | | Share Classes Offered | | Diversified/
Non-diversified |
Bond and Core Fixed Income | | A, C, Institutional, Service, Investor, R and R6 | | Diversified |
Global Income | | A, C, Institutional, Service, Investor and R6 | | Non-diversified |
Strategic Income | | A, C, Institutional, Investor, R and R6 | | Diversified |
Class A Shares are sold with a front-end sales charge of up to 3.75%. Class C Shares are sold with a contingent deferred sales charge (“CDSC”) of 1.00%, which is imposed on redemptions made within 12 months of purchase. Institutional, Service, Investor, Class R, and Class R6 Shares are not subject to a sales charge. Prior to August 15, 2017, the Investor Shares were known as Class IR Shares.
Goldman Sachs Asset Management, L.P. (“GSAM”), an affiliate of Goldman Sachs & Co. LLC (formerly Goldman, Sachs & Co.) (“Goldman Sachs”), serves as investment adviser to each of the Bond, Core Fixed Income and Strategic Income Funds pursuant to management agreements with the Trust. Goldman Sachs Asset Management International (“GSAMI”), an affiliate of GSAM and Goldman Sachs, serves as investment adviser pursuant to a management agreement with the Trust on behalf of the Global Income Fund (the management agreements with GSAM and GSAMI are collectively referred to herein as the “Agreements”).
|
| 2. SIGNIFICANT ACCOUNTING POLICIES |
The financial statements have been prepared in accordance with accounting principles generally accepted in the United States of America (“GAAP”) and require management to make estimates and assumptions that may affect the reported amounts and disclosures. Actual results may differ from those estimates and assumptions.
A. Investment Valuation — The Fund’s valuation policy is to value investments at fair value.
B. Investment Income and Investments — Investment income includes interest income, dividend income, and securities lending income. Interest income is accrued daily and adjusted for amortization of premiums and accretion of discounts. Dividend income is recognized on ex-dividend date or, for certain foreign securities, as soon as such information is obtained subsequent to the ex-dividend date. Investment transactions are reflected on trade date. Realized gains and losses are calculated using identified cost. Investment transactions are recorded on the following business day for daily net asset value (“NAV”) calculations. Investment income is recorded net of any foreign withholding taxes, less any amounts reclaimable. The Funds may file withholding tax reclaims in certain jurisdictions to recover a portion of amounts previously withheld. Any foreign capital gains tax is accrued daily based upon net unrealized gains, and is payable upon sale of such investments. Distributions received from the Funds’ investments in U.S. real estate investment trusts (“REITs”) may be characterized as ordinary income, net capital gain or a return of capital. A return of capital is recorded by the Funds as a reduction to the cost basis of the REIT.
For derivative contracts, realized gains and losses are recorded upon settlement of the contract. Upfront payments, if any, are made or received upon entering into a swap agreement and are reflected in the Statements of Assets and Liabilities. Upfront payments are recognized over the contract’s term/event as realized gains or losses, with the exception of forward starting interest rate swaps whose realized gains or losses are recognized from the effective start date. For securities with paydown provisions, principal payments received are treated as a proportionate reduction to the cost basis of the securities, and excess or shortfall amounts are recorded as income. For treasury inflation protected securities (“TIPS”), adjustments to principal due to inflation/deflation are reflected as increases/decreases to interest income with a corresponding adjustment to cost.
118
GOLDMAN SACHS MULTI-SECTOR FIXED INCOME FUNDS
|
| 2. SIGNIFICANT ACCOUNTING POLICIES (continued) |
C. Class Allocations and Expenses — Investment income, realized and unrealized gain (loss), and non-class specific expenses of each Fund are allocated daily based upon the proportion of net assets of each class. Non-class specific expenses directly incurred by a Fund are charged to that Fund, while such expenses incurred by the Trust are allocated across the applicable Funds on a straight-line and/or pro-rata basis depending upon the nature of the expenses. Class specific expenses, where applicable, are borne by the respective share classes and include Distribution and Service, Transfer Agency and Service and Shareholder Administration fees.
D. Federal Taxes and Distributions to Shareholders — It is each Fund’s policy to comply with the requirements of the Internal Revenue Code of 1986, as amended (the “Code”), applicable to regulated investment companies (mutual funds) and to distribute each year substantially all of its investment company taxable income and capital gains to its shareholders. Accordingly, the Funds are not required to make any provisions for the payment of federal income tax. Distributions to shareholders are recorded on the ex-dividend date. Income and capital gains distributions, if any, are declared and paid according to the following schedule:
| | | | | | |
| Fund | | | | Income Distributions
Declared/Paid | | Capital Gains Distributions
Declared/Paid |
Bond | | | | Daily/Monthly | | Annually |
Core Fixed Income | | | | Daily/Monthly | | Annually |
Global Income | | | | Daily/Monthly | | Annually |
Strategic Income* | | | | Monthly/Monthly | | Annually |
| * | | Prior to May 1, 2017, the Fund’s distributions from net investment income were declared daily and paid monthly. |
Net capital losses, if any, are carried forward to future fiscal years and may be used to the extent allowed by the Code to offset any future capital gains. Losses that are carried forward will retain their character as either short-term or long-term capital losses. Utilization of capital loss carryforwards will reduce the requirement of future capital gains distributions.
The characterization of distributions to shareholders for financial reporting purposes is determined in accordance with federal income tax rules, which may differ from GAAP. The source of each Fund’s distributions may be shown in the accompanying financial statements as either from net investment income, net realized gain or capital. Certain components of the Funds’ net assets on the Statements of Assets and Liabilities reflect permanent GAAP/tax differences based on the appropriate tax character.
E. Foreign Currency Translation — The accounting records and reporting currency of the Funds are maintained in U.S. dollars. Assets and liabilities denominated in foreign currencies are translated into U.S. dollars using the current exchange rates at the close of each business day. The effect of changes in foreign currency exchange rates on investments is included within net realized and unrealized gain (loss) on investments. Changes in the value of other assets and liabilities as a result of fluctuations in foreign exchange rates are included in the Statements of Operations within net change in unrealized gain (loss) on foreign currency translations. Transactions denominated in foreign currencies are translated into U.S. dollars on the date the transaction occurred, the effects of which are included within net realized gain (loss) on foreign currency transactions.
F. In-Kind Transactions — The Funds may allow investors, under certain circumstances, to purchase shares with securities instead of cash. In addition, the Trust reserves the right to redeem an investor’s shares by distributing securities instead of cash. These are known as in-kind transactions. Securities included as part of in-kind purchases and redemptions of Fund shares are valued in the same manner as they are valued for purposes of computing a Fund’s NAV, in accordance with the Funds’ Valuation Procedures, and such valuations are as of the date the trade is submitted pursuant to the procedures specified in the Funds’ prospectus.
119
GOLDMAN SACHS MULTI-SECTOR FIXED INCOME FUNDS
Notes to Financial Statements (continued)
September 30, 2017 (Unaudited)
|
| 3. INVESTMENTS AND FAIR VALUE MEASUREMENTS |
U.S. GAAP defines the fair value of a financial instrument as the amount that would be received to sell an asset or paid to transfer a liability in an orderly transaction between market participants at the measurement date (i.e., the exit price); the Funds’ policy is to use the market approach. GAAP establishes a fair value hierarchy that prioritizes the inputs to valuation techniques used to measure fair value. The hierarchy gives the highest priority to unadjusted quoted prices in active markets for identical assets or liabilities (Level 1 measurements) and the lowest priority to unobservable inputs (Level 3 measurements). The levels used for classifying investments are not necessarily an indication of the risk associated with investing in these investments. The three levels of the fair value hierarchy are described below:
Level 1 — Unadjusted quoted prices in active markets that are accessible at the measurement date for identical, unrestricted assets or liabilities;
Level 2 — Quoted prices in markets that are not active or financial instruments for which significant inputs are observable (including, but not limited to, quoted prices for similar investments, interest rates, foreign exchange rates, volatility and credit spreads), either directly or indirectly;
Level 3 — Prices or valuations that require significant unobservable inputs (including GSAM’s and GSAMI’s assumptions in determining fair value measurement).
Changes in valuation techniques may result in transfers into or out of an assigned level within the hierarchy. In accordance with the Funds’ policy, transfers between different levels of the fair value hierarchy resulting from such changes are deemed to have occurred as of the beginning of the reporting period.
The Board of Trustees (“Trustees”) has approved Valuation Procedures that govern the valuation of the portfolio investments held by the Funds, including investments for which market quotations are not readily available. The Trustees have delegated to GSAM and GSAMI day-to-day responsibility for implementing and maintaining internal controls and procedures related to the valuation of the Funds’ investments. To assess the continuing appropriateness of pricing sources and methodologies, GSAM and GSAMI regularly perform price verification procedures and issue challenges as necessary to third party pricing vendors or brokers, and any differences are reviewed in accordance with the Valuation Procedures.
A. Level 1 and Level 2 Fair Value Investments — The valuation techniques and significant inputs used in determining the fair values for investments classified as Level 1 and Level 2 are as follows:
Debt Securities — Debt securities for which market quotations are readily available are valued daily on the basis of quotations supplied by dealers or an independent pricing service approved by the Trustees. The pricing services may use valuation models or matrix pricing, which consider: (i) yield or price with respect to bonds that are considered comparable in characteristics such as rating, interest rate and maturity date or (ii) quotations from securities dealers to determine current value. Short-term debt obligations that mature in sixty days or less and that do not exhibit signs of credit deterioration are valued using available market quotations as provided by a third party pricing vendor or broker. With the exception of treasury securities of G8 countries, which are generally classified as Level 1, these investments are generally classified as Level 2 of the fair value hierarchy.
i. Bank Loans — Bank loans (“Loans”) are interests in amounts owed by corporate, governmental, or other borrowers to lenders or lending syndicates. Loans are arranged through private negotiations between the borrower and one or more financial institutions (“Lenders”). A Fund’s investments in Loans are in the form of either participations in Loans (“Participations”) or assignments of all or a portion of Loans from third parties (“Assignments”). With respect to Participations, a Fund has the right to receive payments of principal, interest and any fees to which it is entitled from the Lender selling the Participations and only upon receipt by the Lender of the payments from the borrower. A Fund generally has no right to enforce compliance by the borrower with the terms of the loan agreement with respect to Participations. Conversely, assignments result in a Fund having a direct contractual relationship with the borrower, and the Fund may be permitted to enforce compliance by the borrower with the terms of the loan agreement.
ii. Commercial Paper — Commercial paper normally represents short-term unsecured promissory notes issued in bearer form by banks or bank holding companies, corporations, finance companies and other issuers. Commercial paper consists of direct U.S. dollar-denominated obligations of domestic or foreign issuers. Asset-backed commercial paper is issued by a
120
GOLDMAN SACHS MULTI-SECTOR FIXED INCOME FUNDS
|
| 3. INVESTMENTS AND FAIR VALUE MEASUREMENTS (continued) |
special purpose entity that is organized to issue the commercial paper and to purchase trade receivables or other financial assets.
iii. Inverse Floaters — The interest rate on inverse floating rate securities (“inverse floaters”) resets in the opposite direction from the market rate of interest to which the inverse floaters are indexed. An inverse floater may be considered to be leveraged to the extent that its interest rate varies by a magnitude that exceeds the magnitude of the change in the index rate of interest. The higher the degree of leverage of an inverse floater, the greater the volatility of its market value
iv. Mortgage-Backed and Asset-Backed Securities — Mortgage-backed securities represent direct or indirect participations in, or are collateralized by and payable from, mortgage loans secured by residential and/or commercial real estate property. Asset-backed securities include securities whose principal and interest payments are collateralized by pools of other assets or receivables. The value of certain mortgage-backed and asset-backed securities (including adjustable rate mortgage loans) may be particularly sensitive to changes in prevailing interest rates. The value of these securities may also fluctuate in response to the market’s perception of the creditworthiness of the issuers.
Asset-backed securities may present credit risks that are not presented by mortgage-backed securities because they generally do not have the benefit of a security interest in collateral that is comparable to mortgage assets. Some asset-backed securities may only have a subordinated claim on collateral.
Stripped mortgage-backed securities are usually structured with two different classes: one that receives substantially all interest payments (interest-only, or “IO” and/or high coupon rate with relatively low principal amount, or “IOette”), and the other that receives substantially all principal payments (principal-only, or “PO”) from a pool of mortgage loans. Little to no principal will be received at the maturity of an IO; as a result, periodic adjustments are recorded to reduce the cost of the security until maturity. These adjustments are included in interest income.
v. Mortgage Dollar Rolls — Mortgage dollar rolls are transactions whereby a Fund sells mortgage-backed-securities and simultaneously contracts with the same counterparty to repurchase similar securities on a specified future date. During the settlement period, a Fund will not be entitled to accrue interest and receive principal payments on the securities sold. The Funds account for mortgage dollar roll transactions as purchases and sales and realize gains and losses on these transactions
vi. Structured Notes — The values of structured notes are based on the price movements of a reference security or index. Upon termination, a Fund will receive a payment from the issuer based on the value of the referenced instrument (notional amount multiplied by price of the referenced instrument) and record a realized gain or loss.
vii. Treasury Inflation Protected Securities — TIPS are treasury securities in which the principal amount is adjusted daily to keep pace with inflation, as measured by the U.S. Consumer Pricing Index for Urban Consumers. The repayment of the original bond principal upon maturity is guaranteed by the full faith and credit of the U.S. Government.
viii. When-Issued Securities and Forward Commitments — When-issued securities, including TBA (“To Be Announced”) securities, are securities that are authorized but not yet issued in the market and purchased in order to secure what is considered to be an advantageous price or yield to a Fund. A forward commitment involves entering into a contract to purchase or sell securities, typically on an extended settlement basis, for a fixed price at a future date. The purchase of securities on a when-issued or forward commitment basis involves a risk of loss if the value of the security to be purchased declines before the settlement date. Conversely, the sale of securities on a forward commitment basis involves the risk that the value of the securities sold may increase before the settlement date. Although a Fund will generally purchase securities on a when-issued or forward commitment basis with the intention of acquiring the securities for its portfolio, the Fund may dispose of when-issued securities or forward commitments prior to settlement, which may result in a realized gain or loss.
Equity Securities — Equity securities traded on a United States (“U.S.”) securities exchange or the NASDAQ system, or those located on certain foreign exchanges, including but not limited to the Americas, are valued daily at their last sale price or official closing price on the principal exchange or system on which they are traded. If there is no sale or official closing price or such price is believed by GSAM and GSAMI to not represent fair value, equity securities are valued at the last bid price for long positions and
121
GOLDMAN SACHS MULTI-SECTOR FIXED INCOME FUNDS
Notes to Financial Statements (continued)
September 30, 2017 (Unaudited)
|
| 3. INVESTMENTS AND FAIR VALUE MEASUREMENTS (continued) |
at the last ask price for short positions. To the extent these investments are actively traded, they are classified as Level 1 of the fair value hierarchy, otherwise they are generally classified as Level 2.
Unlisted equity securities for which market quotations are available are valued at the last sale price on the valuation date, or if no sale occurs, at the last bid price. Securities traded on certain foreign securities exchanges are valued daily at fair value determined by an independent fair value service (if available) under Valuation Procedures approved by the Trustees and consistent with applicable regulatory guidance. The independent fair value service takes into account multiple factors including, but not limited to, movements in the securities markets, certain depositary receipts, futures contracts and foreign currency exchange rates that have occurred subsequent to the close of the foreign securities exchange. These investments are generally classified as Level 2 of the fair value hierarchy.
Private Investments — Private investments may include, but are not limited to, investments in private equity or debt instruments. The investment manager estimates the fair value of private investments based upon various factors, including, but not limited to, transactions in similar instruments, completed or pending third-party transactions in underlying investments or comparable entities, subsequent rounds of financing, recapitalizations, and other transactions across the capital structure, offerings in equity or debt capital markets, and changes in current and projected financial ratios or cash flows.
Money Market Funds — Investments in the Goldman Sachs Financial Square Government Fund (“Underlying Fund”) are valued at the NAV of the Institutional Share class on the day of valuation. These investments are generally classified as Level 1 of the fair value hierarchy. For information regarding an Underlying Fund’s accounting policies and investment holdings, please see the Underlying Fund’s shareholder report.
Derivative Contracts — A derivative is an instrument whose value is derived from underlying assets, indices, reference rates or a combination of these factors. A Fund enters into derivative transactions to hedge against changes in interest rates, securities prices, and/or currency exchange rates, to increase total return, or to gain access to certain markets or attain exposure to other underliers.
Exchange-traded derivatives, including futures and options contracts, are valued at the last sale or settlement price and typically fall within Level 1 of the fair value hierarchy. Over-the-counter (“OTC”) and centrally cleared derivatives are valued using market transactions and other market evidence, including market-based inputs to models, calibration to market-clearing transactions, broker or dealer quotations, or other alternative pricing sources. Where models are used, the selection of a particular model to value OTC and centrally cleared derivatives depends upon the contractual terms of, and specific risks inherent in, the instrument, as well as the availability of pricing information in the market. Valuation models require a variety of inputs, including contractual terms, market prices, yield curves, credit curves, measures of volatility, voluntary and involuntary prepayment rates, loss severity rates and correlations of such inputs. For OTC and centrally cleared derivatives that trade in liquid markets, model inputs can generally be verified and model selection does not involve significant management judgment. OTC and centrally cleared derivatives are classified within Level 2 of the fair value hierarchy when significant inputs are corroborated by market evidence.
i. Forward Contracts — A forward contract is a contract between two parties to buy or sell an asset at a specified price on a future date. A forward contract settlement can occur on a cash or delivery basis. Forward contracts are marked-to-market daily using independent vendor prices, and the change in value, if any, is recorded as an unrealized gain or loss. Cash and certain investments may be used to collateralize forward contracts.
A forward foreign currency exchange contract is a forward contract in which a Fund agrees to receive or deliver a fixed quantity of one currency for another, at a pre-determined price at a future date. All forward foreign currency exchange contracts are marked-to-market daily at the applicable forward rate. Non-deliverable forward foreign currency exchange contracts are settled with the counterparty in cash without the delivery of foreign currency.
ii. Futures Contracts — Futures contracts are contracts to buy or sell a standardized quantity of a specified commodity or security and are valued based on exchanged settlement prices or independent market quotes. Futures contracts are valued at the last settlement price, or in the absence of a sale, the last bid price for long positions and at the last ask price for short positions, at the end of each day on the board of trade or exchange upon which they are traded. Upon entering into a futures contract, a Fund deposits cash or securities in an account on behalf of the broker in an amount sufficient to meet the initial
122
GOLDMAN SACHS MULTI-SECTOR FIXED INCOME FUNDS
|
| 3. INVESTMENTS AND FAIR VALUE MEASUREMENTS (continued) |
margin requirement. Subsequent payments are made or received by a Fund equal to the daily change in the contract value and are recorded as variation margin receivable or payable with a corresponding offset to unrealized gains or losses. For financial reporting purposes, cash collateral that has been pledged to cover obligations of a Fund and cash collateral received, if any, is reported separately on the Statements of Assets and Liabilities as receivables/payables for collateral on certain derivative contracts. Non-cash collateral pledged by a Fund, if any, is noted in the Schedules of Investments.
iii. Options — When a Fund writes call or put options, an amount equal to the premium received is recorded as a liability and is subsequently marked-to-market to reflect the current value of the option written. Swaptions are options on interest rate swap contracts.
Upon the purchase of a call option or a put option by a Fund, the premium paid is recorded as an investment and subsequently marked-to-market to reflect the current value of the option. Certain options may be purchased with premiums to be determined on a future date. The premiums for these options are based upon implied volatility parameters at specified terms.
iv. Swap Contracts — Bilateral swap contracts are agreements in which a Fund and a counterparty agree to exchange periodic payments on a specified notional amount or make a net payment upon termination. Bilateral swap transactions are privately negotiated in the OTC market and payments are settled through direct payments between a Fund and the counterparty. By contrast, certain swap transactions are subject to mandatory central clearing. These swaps are executed through a derivatives clearing member (“DCM”), acting in an agency capacity, and submitted to a central counterparty (“CCP”) (“centrally cleared swaps”), in which case all payments are settled with the CCP through the DCM. Swaps are marked-to-market daily using pricing vendor quotations, counterparty or clearinghouse prices or model prices, and the change in value, if any, is recorded as an unrealized gain or loss. Upon entering into a swap contract, a Fund is required to satisfy an initial margin requirement by delivering cash or securities to the counterparty (or in some cases, segregated in a triparty account on behalf of the counterparty), which can be adjusted by any mark-to-market gains or losses pursuant to bilateral or centrally cleared arrangements. For centrally cleared swaps the daily change in valuation, if any, is recorded as a receivable or payable for variation margin.
An interest rate swap is an agreement that obligates two parties to exchange a series of cash flows at specified intervals, based upon or calculated by reference to changes in interest rates on a specified notional principal amount. The payment flows are usually netted against each other, with the difference being paid by one party to the other.
A credit default swap is an agreement that involves one party (the buyer of protection) making a stream of payments to another party (the seller of protection) in exchange for the right to receive protection on a reference security or obligation, including a group of assets or exposure to the performance of an index. A Fund’s investment in credit default swaps may involve greater risks than if the Fund had invested in the referenced obligation directly. Credit events are contract specific but may include bankruptcy, failure to pay, restructuring and obligation acceleration. If a Fund buys protection through a credit default swap and no credit event occurs, its payments are limited to the periodic payments previously made to the counterparty. Upon the occurrence of a specified credit event, a Fund, as a buyer of credit protection, is entitled to receive an amount equal to the notional amount of the swap and deliver to the seller the defaulted reference obligation in a physically settled trade. A Fund may also receive a net settlement amount in the form of cash or securities equal to the notional amount of the swap reduced by the recovery value of the reference obligation in a cash settled trade.
As a seller of protection, a Fund generally receives a payment stream throughout the term of the swap, provided that there is no credit event. In addition, if a Fund sells protection through a credit default swap, a Fund could suffer a loss because the value of the referenced obligation and the premium payments received may be less than the notional amount of the swap paid to the buyer of protection. Upon the occurrence of a specified credit event, a Fund, as a seller of credit protection, may be required to take possession of the defaulted reference obligation and pay the buyer an amount equal to the notional amount of the swap in a physically settled trade. A Fund may also pay a net settlement amount in the form of cash or securities equal to the notional amount of the swap reduced by the recovery value of the reference obligation in a cash settled trade. Recovery values are at times established through the credit event auction process in which market participants are ensured that a
123
GOLDMAN SACHS MULTI-SECTOR FIXED INCOME FUNDS
Notes to Financial Statements (continued)
September 30, 2017 (Unaudited)
|
| 3. INVESTMENTS AND FAIR VALUE MEASUREMENTS (continued) |
transparent price has been set for the defaulted security or obligation. In addition, a Fund is entitled to a return of any assets, which have been pledged as collateral to the counterparty upon settlement.
The maximum potential amount of future payments (undiscounted) that a Fund as seller of protection could be required to make under a credit default swap would be an amount equal to the notional amount of the agreement. These potential amounts would be partially offset by any recovery values of the respective referenced obligations or net amounts received from a settlement of a credit default swap for the same reference security or obligation where a Fund bought credit protection.
A total return swap is an agreement that gives a Fund the right to receive the appreciation in the value of a specified security, index or other instrument in return for a fee paid to the counterparty, which will typically be an agreed upon interest rate. If the underlying asset declines in value over the term of the swap, a Fund may also be required to pay the dollar value of that decline to the counterparty.
B. Level 3 Fair Value Investments — To the extent that significant inputs to valuation models and other alternative pricing sources are unobservable, or if quotations are not readily available, or if GSAM and GSAMI believe that such quotations do not accurately reflect fair value, the fair value of the Funds’ investments may be determined under Valuation Procedures approved by the Trustees. GSAM and GSAMI, consistent with their procedures and applicable regulatory guidance, may make an adjustment to the most recent valuation prices of either domestic or foreign securities in light of significant events to reflect what they believe to be the fair value of the securities at the time of determining a Fund’s NAV. Significant events which could affect a large number of securities in a particular market may include, but are not limited to: significant fluctuations in U.S. or foreign markets; market dislocations; market disruptions; or unscheduled market closings. Significant events which could also affect a single issuer may include, but are not limited to: corporate actions such as reorganizations, mergers and buy-outs; ratings downgrades; and bankruptcies. To the extent investments are valued using single source broker quotations obtained directly from the broker or passed through from third party pricing vendors, such investments are classified as Level 3 investments. GSAM and GSAMI did not develop the unobservable inputs (examples include but are not limited to single source broker quotations, third party pricing, etc.) for the valuation of Level 3 Assets and Liabilities.
124
GOLDMAN SACHS MULTI-SECTOR FIXED INCOME FUNDS
|
| 3. INVESTMENTS AND FAIR VALUE MEASUREMENTS (continued) |
C. Fair Value Hierarchy — The following is a summary of the Funds’ investments and derivatives classified in the fair value hierarchy as of September 30, 2017:
| | | | | | | | | | | | |
| | | |
| BOND | | | | | | | | | | | | |
| | | |
| Investment Type | | Level 1 | | | Level 2 | | | Level 3 | |
| Assets | |
Fixed Income | | | | | | | | | | | | |
Corporate Obligations | | $ | — | | | $ | 178,729,307 | | | $ | — | |
Mortgage-Backed Obligations | | | — | | | | 180,275,260 | | | | 1,107,136 | |
U.S. Treasury Obligations and/or Other U.S. Government Agencies | | | 130,276,350 | | | | 14,696,570 | | | | — | |
Asset-Backed Securities | | | — | | | | 100,770,722 | | | | — | |
Foreign Debt Obligations | | | — | | | | 10,204,354 | | | | — | |
Structured Notes | | | — | | | | 5,701,198 | | | | — | |
Municipal Debt Obligations | | | — | | | | 7,415,556 | | | | — | |
Common Stock and/or Other Equity Investments(a) | | | | | | | | | | | | |
North America | | | — | | | | 543,571 | | | | — | |
Investment Company | | | 24,781,528 | | | | — | | | | — | |
Short-term Investments | | | — | | | | 16,698,121 | | | | — | |
| Total | | $ | 155,057,878 | | | $ | 515,034,659 | | | $ | 1,107,136 | |
| Liabilities | |
Fixed Income | | | | | | | | | | | | |
Mortgage-Backed Obligations — Forward Sales Contracts | | $ | — | | | $ | (6,267,969 | ) | | $ | — | |
| | | |
| Derivative Type | | Level 1 | | | Level 2 | | | Level 3 | |
| Assets | | | | | | | | | | | | |
Options Purchased | | $ | 79,825 | | | $ | 629,763 | | | $ | — | |
Forward Foreign Currency Exchange Contracts(b) | | | — | | | | 2,222,864 | | | | — | |
Futures Contracts(b) | | | 260,062 | | | | — | | | | — | |
Interest Rate Swap Contracts(b) | | | — | | | | 2,579,938 | | | | — | |
| Total | | $ | 339,887 | | | $ | 5,432,565 | | | $ | — | |
| Liabilities(b) | | | | | | | | | | | | |
Forward Foreign Currency Exchange Contracts | | $ | — | | | $ | (2,946,016 | ) | | $ | — | |
Futures Contracts | | | (701,853 | ) | | | — | | | | — | |
Interest Rate Swap Contracts | | | — | | | | (752,465 | ) | | | — | |
Credit Default Swap Contracts | | | — | | | | (574,638 | ) | | | — | |
| Total | | $ | (701,853 | ) | | $ | (4,273,119 | ) | | $ | — | |
125
GOLDMAN SACHS MULTI-SECTOR FIXED INCOME FUNDS
Notes to Financial Statements (continued)
September 30, 2017 (Unaudited)
|
| 3. INVESTMENTS AND FAIR VALUE MEASUREMENTS (continued) |
| | | | | | | | | | | | |
| CORE FIXED INCOME | | | | | | | | | |
| | | |
| Investment Type | | Level 1 | | | Level 2 | | | Level 3 | |
| Assets | |
Fixed Income | | | | | | | | | | | | |
Corporate Obligations | | $ | — | | | $ | 384,375,330 | | | $ | — | |
Mortgage-Backed Obligations | | | — | | | | 241,802,302 | | | | — | |
U.S. Treasury Obligations and/or Other U.S. Government Agencies | | | 179,567,320 | | | | 56,551,015 | | | | — | |
Asset-Backed Securities | | | — | | | | 125,561,979 | | | | — | |
Foreign Debt Obligations | | | — | | | | 6,468,978 | | | | — | |
Municipal Debt Obligations | | | — | | | | 14,616,969 | | | | — | |
Investment Company | | | 3,949 | | | | — | | | | — | |
Short-term Investments | | | — | | | | 23,492,065 | | | | — | |
| Total | | $ | 179,571,269 | | | $ | 852,868,638 | | | $ | — | |
| Liabilities | | | | | | | | | | | | |
Fixed Income | | | | | | | | | | | | |
Mortgage-Backed Obligations — Forward Sales Contracts | | $ | — | | | $ | (16,411,094 | ) | | $ | — | |
| | | |
| Derivative Type | | Level 1 | | | Level 2 | | | Level 3 | |
| Assets | | | | | | | | | | | | |
Options Purchased | | $ | 46,888 | | | $ | — | | | $ | — | |
Forward Foreign Currency Exchange Contracts(b) | | | — | | | | 967,131 | | | | — | |
Futures Contracts(b) | | | 413,186 | | | | — | | | | — | |
Interest Rate Swap Contracts(b) | | | — | | | | 1,792,505 | | | | — | |
| Total | | $ | 460,074 | | | $ | 2,759,636 | | | $ | — | |
| Liabilities(b) | | | | | | | | | | | | |
Forward Foreign Currency Exchange Contracts | | $ | — | | | $ | (1,338,474 | ) | | $ | — | |
Futures Contracts | | | (1,226,189 | ) | | | — | | | | — | |
Interest Rate Swap Contracts | | | — | | | | (686,913 | ) | | | — | |
| Total | | $ | (1,226,189 | ) | | $ | (2,025,387 | ) | | $ | — | |
126
GOLDMAN SACHS MULTI-SECTOR FIXED INCOME FUNDS
|
| 3. INVESTMENTS AND FAIR VALUE MEASUREMENTS (continued) |
| | | | | | | | | | | | |
| GLOBAL INCOME | | | | | | | | | |
| | | |
| Investment Type | | Level 1 | | | Level 2 | | | Level 3 | |
| Assets | | | | | | | | | | | | |
Fixed Income | | | | | | | | | | | | |
Foreign Sovereign Debt Obligations | | $ | 208,832,858 | | | $ | 48,516,061 | | | $ | — | |
Corporate Obligations | | | — | | | | 150,198,087 | | | | — | |
Foreign Debt Obligations | | | — | | | | 27,539,495 | | | | — | |
Asset-Backed Securities | | | — | | | | 149,194,020 | | | | — | |
Mortgage-Backed Obligations | | | — | | | | 118,434,429 | | | | — | |
U.S. Treasury Obligations and/or Other U.S. Government Agencies | | | 18,756,320 | | | | 6,797,254 | | | | — | |
Municipal Debt Obligation | | | — | | | | 2,836,607 | | | | — | |
Government Guarantee Obligations | | | — | | | | 28,040,136 | | | | — | |
Investment Company | | | 15,556,003 | | | | — | | | | — | |
| Total | | $ | 243,145,181 | | | $ | 531,556,089 | | | $ | — | |
| Liabilities | | | | | | | | | | | | |
Fixed Income | | | | | | | | | | | | |
Mortgage-Backed Obligations — Forward Sales Contracts | | $ | — | | | $ | (8,423,750 | ) | | $ | — | |
| | | |
| Derivative Type | | Level 1 | | | Level 2 | | | Level 3 | |
| Assets | | | | | | | | | | | | |
Options Purchased | | $ | 78,662 | | | $ | 481,485 | | | $ | — | |
Forward Foreign Currency Exchange Contracts(b) | | | — | | | | 9,754,643 | | | | — | |
Futures Contracts(b) | | | 725,437 | | | | — | | | | — | |
Interest Rate Swap Contracts(b) | | | — | | | | 2,676,815 | | | | — | |
| Total | | $ | 804,099 | | | $ | 12,912,943 | | | $ | — | |
| Liabilities(b) | | | | | | | | | | | | |
Forward Foreign Currency Exchange Contracts | | $ | — | | | $ | (4,996,293 | ) | | $ | — | |
Futures Contracts | | | (1,774,708 | ) | | | — | | | | — | |
Interest Rate Swap Contracts | | | — | | | | (1,211,562 | ) | | | — | |
Credit Default Swap Contracts | | | — | | | | (895,090 | ) | | | — | |
| Total | | $ | (1,774,708 | ) | | $ | (7,102,945 | ) | | $ | — | |
127
GOLDMAN SACHS MULTI-SECTOR FIXED INCOME FUNDS
Notes to Financial Statements (continued)
September 30, 2017 (Unaudited)
|
| 3. INVESTMENTS AND FAIR VALUE MEASUREMENTS (continued) |
| | | | | | | | | | | | |
| STRATEGIC INCOME | | | | | | | | | |
| | | |
| Investment Type | | Level 1 | | | Level 2 | | | Level 3 | |
| Assets | |
Fixed Income | | | | | | | | | | | | |
Bank Loans | | $ | — | | | $ | 86,967,900 | | | $ | 58,686,506 | |
Corporate Obligations | | | — | | | | 611,316,248 | | | | — | |
Mortgage-Backed Obligations | | | — | | | | 970,693,948 | | | | 35,991,006 | |
U.S. Treasury Obligations and/or Other U.S. Government Agencies | | | 289,396,350 | | | | 13,691,815 | | | | — | |
Asset-Backed Securities | | | — | | | | 2,096,589,388 | | | | — | |
Foreign Debt Obligations | | | 1,095,457,179 | | | | 497,482,759 | | | | — | |
Structured Notes | | | — | | | | 140,348,935 | | | | — | |
Municipal Debt Obligations | | | — | | | | 93,393,631 | | | | — | |
Common Stock and/or Other Equity Investments(a) | | | | | | | | | | | | |
North America | | | — | | | | 75,142,460 | | | | — | |
Investment Company | | | 253,516,820 | | | | — | | | | — | |
Short-term Investments | | | — | | | | 99,583 | | | | — | |
| Total | | $ | 1,638,370,349 | | | $ | 4,585,726,667 | | | $ | 94,677,512 | |
| | | |
| Derivative Type | | Level 1 | | | Level 2 | | | Level 3 | |
| Assets | | | | | | | | | | | | |
Options Purchased | | $ | 1,849,925 | | | $ | 4,009,150 | | | $ | — | |
Forward Foreign Currency Exchange Contracts(b) | | | — | | | | 101,723,720 | | | | — | |
Futures Contracts(b) | | | 42,497,218 | | | | — | | | | — | |
Interest Rate Swap Contracts(b) | | | — | | | | 131,192,726 | | | | — | |
Total Return Swap Contracts(b) | | | — | | | | 82,712 | | | | — | |
| Total | | $ | 44,347,143 | | | $ | 237,008,308 | | | $ | — | |
| Liabilities(b) | | | | | | | | | | | | |
Forward Foreign Currency Exchange Contracts | | $ | — | | | $ | (98,984,537 | ) | | $ | — | |
Futures Contracts | | | (24,459,854 | ) | | | — | | | | — | |
Interest Rate Swap Contracts | | | — | | | | (27,887,557 | ) | | | — | |
Credit Default Swap Contracts | | | — | | | | (35,571,955 | ) | | | — | |
Total Return Swap Contracts | | | — | | | | (117,372 | ) | | | — | |
| Total | | $ | (24,459,854 | ) | | $ | (162,561,421 | ) | | $ | — | |
128
GOLDMAN SACHS MULTI-SECTOR FIXED INCOME FUNDS
|
| 3. INVESTMENTS AND FAIR VALUE MEASUREMENTS (continued) |
The following is a reconciliation of Level 3 investments for the period ended September 30, 2017:
| | | | | | | | | | | | | | | | |
| | | | |
| Fund | | Bank Loans | | | Collateralized Mortgage Obligations | | | Corporate Bonds | | | Other Asset Backed | |
Beginning Balance as of March 31, 2017 | | $ | 57,319,558 | | | $ | 52,441,925 | | | | — | | | $ | 34,550,000 | |
Realized gain (loss) | | | 39,904 | | | | 2,380,311 | | | | (79,235 | ) | | | — | |
Net change in unrealized gain (loss) relating to instruments still held at reporting date | | | 1,629,113 | | | | 4,071,202 | | | | 247,832 | | | | — | |
Purchases | | | 480,674 | | | | — | | | | — | | | | — | |
Sales | | | (1,374,885 | ) | | | (22,902,432 | ) | | | (62,395 | ) | | | (19,350,000 | ) |
Amortization | | | 592,142 | | | | — | | | | (106,202 | ) | | | — | |
Transfers into Level 3 | | | — | | | | — | | | | — | | | | — | |
Transfers out of Level 3 | | | — | | | | — | | | | — | | | | (15,200,000 | ) |
| Ending Balance as of September 30, 2017 | | $ | 58,686,506 | | | $ | 35,991,006 | | | | — | | | $ | — | |
| (a) | | Amounts are disclosed by continent to highlight the impact of time zone differences between local market close and the calculation of net asset value. Security valuations are based on the principle exchange or system on which they are traded, which may differ from country of domicile noted in table. |
| (b) | | Amount shown represents unrealized gain (loss) at period end. |
Transfers of the above instruments into or out of Level 3 can be attributable to changes in the availability of valid pricing sources or in the observability of significant inputs used to measure the fair value of those instruments.
For further information regarding security characteristics, see the Schedules of Investments.
|
| 4. INVESTMENTS IN DERIVATIVES |
The following tables set forth, by certain risk types, the gross value of derivative contracts as of September 30, 2017. These instruments were used as part of the Funds’ investment strategies and to obtain and/or manage exposure related to the risks below. The values in the tables below exclude the effects of cash collateral received or posted pursuant to these derivative contracts, and therefore are not representative of the Funds’ net exposure.
| | | | | | | | | | | | |
| |
| Bond | | | | |
| Risk | | Statements of Assets
and Liabilities | | Assets | | | Statements of Assets and Liabilities | | Liabilities | |
Interest rate | | Receivable for unrealized gain on swap contracts; Variation margin on futures and swaps contracts; Options Purchased | | $ | 3,549,586 | (a) | | Payable for unrealized loss on swap contracts; Variation margin on futures and swaps contracts | | $ | (1,454,316) | (a)(b) |
Credit | | — | | | — | | | Payable for unrealized loss on swap contracts | | | (574,638) | |
Currency | | Receivable for unrealized gain on forward foreign currency exchange contracts; | | | 2,222,864 | | | Payable for unrealized loss on forward foreign currency exchange contracts; | | | (2,946,016) | |
| Total | | | | $ | 5,772,450 | | | | | $ | (4,974,970) | |
129
GOLDMAN SACHS MULTI-SECTOR FIXED INCOME FUNDS
Notes to Financial Statements (continued)
September 30, 2017 (Unaudited)
|
| 4. INVESTMENTS IN DERIVATIVES (continued) |
| | | | | | | | | | | | |
| |
| Core Fixed Income | | | | |
| Risk | | Statements of Assets
and Liabilities | | Assets | | | Statements of Assets and Liabilities | | Liabilities | |
Interest rate | | Variation margin on futures and swaps contracts; Options Purchased | | $ | 2,252,579 | (a) | | Variation margin on futures and swaps contracts | | $ | (1,913,102) | (a)(b) |
Currency | | Receivable for unrealized gain on forward foreign currency exchange contracts; | | | 967,131 | | | Payable for unrealized loss on forward foreign currency exchange contracts; | | | (1,338,474) | |
| Total | | | | $ | 3,219,710 | | | | | $ | (3,251,576) | |
| |
| Global Income | | | | |
| Risk | | Statements of Assets and Liabilities | | Assets | | | Statements of Assets and Liabilities | | Liabilities | |
Interest rate | | Receivable for unrealized gain on swap contracts; Variation margin on futures and swaps contracts | | $ | 1,491,164 | (a) | | Payable for unrealized loss on swap contracts; Variation margin on futures and swaps contracts | | $ | (2,004,162) | (a)(b) |
Currency | | Receivable for unrealized gain on forward foreign currency exchange contracts; Options Purchased | | | 9,754,643 | | | Payable for unrealized loss on forward foreign currency exchange contracts; Written options, at value | | | (4,996,293) | |
| Total | | | | $ | 11,245,807 | | | | | $ | (7,000,455) | |
| |
| Strategic Income | | | | |
| Risk | | Statements of Assets
and Liabilities | | Assets | | | Statements of Assets and Liabilities | | Liabilities | |
Interest rate | | Investments, at value; Receivable for unrealized gain on swap contracts; Variation margin on futures and swaps contracts | | $ | 179,631,731 | (a) | | Payable for unrealized loss on swap contracts; Variation margin on futures and swaps contracts | | $ | (52,464,783) | (a)(b) |
Credit | | — | | | — | | | Payable for unrealized loss on swap contracts; Variation margin on swaps contracts | | | (35,571,955) | (b) |
Currency | | Receivable for unrealized gain on forward foreign currency exchange contracts | | | 101,723,720 | | | Payable for unrealized loss on forward foreign currency exchange contracts | | | (98,984,537) | |
| Total | | | | $ | 281,355,451 | (a) | | | | $ | (187,021,275) | |
| (a) | | Includes unrealized gain (loss) on futures contracts and centrally cleared swaps described in the Additional Investment Information sections of the Schedules of Investments. Only current day’s variation margin is reported within the Statements of Assets and Liabilities. |
| (b) | | Aggregate of amounts include $222,844, $192,610, $4,720,377 for Bond, Global Income and Strategic Income Funds, which represent the payments to be made pursuant to bilateral agreements should counterparties exercise their “right to terminate” provisions based on, among others, the Funds’ performance, their failure to pay on their obligations or failure to pledge collateral. Such amounts do not include incremental charges directly associated with the close-out of the agreements. They also do not reflect the fair value of any assets pledged as collateral which, through the daily margining process, substantially offsets the aforementioned amounts and for which the Funds are entitled to a full return. |
130
GOLDMAN SACHS MULTI-SECTOR FIXED INCOME FUNDS
|
| 4. INVESTMENTS IN DERIVATIVES (continued) |
The following tables set forth, by certain risk types, the Funds’ gains (losses) related to these derivatives and their indicative volumes for the six months ended September 30, 2017. These gains (losses) should be considered in the context that these derivative contracts may have been executed to create investment opportunities and/or economically hedge certain investments, and accordingly, certain gains (losses) on such derivative contracts may offset certain (losses) gains attributable to investments. These gains (losses) are included in “Net realized gain (loss)” or “Net change in unrealized gain (loss)” on the Statements of Operations:
| | | | | | | | | | | | | | |
|
| Bond | |
| Risk | | Statements of Operations | | Net Realized
Gain (Loss) | | | Net Change in Unrealized Gain
(Loss) | | | Average
Number of
Contracts(a) | |
| Interest rate | | Net realized gain (loss) from futures contracts, swap contracts and purchased options/Net change in unrealized gain (loss) on investments, futures contracts, swap contracts and purchased options | | $ | (1,920,355 | ) | | $ | 1,352,467 | | | $ | 1,394 | |
| Credit | | Net realized gain (loss) from swap contracts/Net change in unrealized gain (loss) on swap contracts | | | (464,382 | ) | | | (222,304 | ) | | | 920 | |
| Currency | | Net realized gain (loss) from investments, forward foreign currency exchange contracts | | | (400,279 | ) | | | 817,592 | | | | 53 | |
| Total | | | (2,785,016 | ) | | | 1,947,755 | | | | 2,367 | |
| | | | |
| Core Fixed Income | | | | | | | | | | | | | | |
| Risk | | Statements of Operations | | Net Realized
Gain (Loss) | | | Net Change in Unrealized
Gain (Loss) | | | Average
Number of
Contracts(a) | |
| Interest rate | | Net realized gain (loss) from futures contracts and swap contracts/Net change in unrealized gain (loss) futures contracts swap contracts, and purchased options | | $ | 193,478 | | | $ | 64,700 | | | | 1440 | |
| Credit | | Net realized gain (loss) from swap contracts/Net change in unrealized gain (loss) on swap contracts | | | 18,038 | | | | (19,930 | ) | | | 1 | |
| Currency | | Net realized gain (loss) from forward foreign currency exchange contracts/Net change in unrealized gain (loss) on forward foreign currency exchange contracts | | | (1,083,684 | ) | | | 768,277 | | | | 462 | |
| Total | | $ | (872,168 | ) | | $ | 813,047 | | | | 1,903 | |
| | | | |
| Global Income | | | | | | | | | | | | | | |
| Risk | | Statements of Operations | | Net Realized
Gain (Loss) | | | Net Change in Unrealized
Gain (Loss) | | | Average
Number of
Contracts(a) | |
| Interest rate | | Net realized gain (loss) from futures contracts and swap contracts /Net change in unrealized gain (loss) on futures contracts and swap contracts | | $ | 3,557,217 | | | $ | (4,570,217 | ) | | | 2,916 | |
| Credit | | Net realized gain (loss) from swap contracts/Net change in unrealized gain (loss) on swap contracts | | | (3,272,981 | ) | | | 640,159 | | | | 1 | |
| Currency | | Net realized gain (loss) from forward foreign currency exchange contracts and purchased options/Net change in unrealized gain (loss) on forward foreign currency exchange contracts and purchased options | | | (26,654,569 | ) | | | 10,352,489 | | | | 871 | |
| Total | | $ | (26,370,333 | ) | | $ | 6,422,431 | | | | 3,788 | |
131
GOLDMAN SACHS MULTI-SECTOR FIXED INCOME FUNDS
Notes to Financial Statements (continued)
September 30, 2017 (Unaudited)
|
| 4. INVESTMENTS IN DERIVATIVES (continued) |
| | | | | | | | | | | | | | |
| | | | |
| Strategic Income | | | | | | | | | | | | | | |
| Risk | | Statements of Operations | | Net Realized
Gain (Loss) | | | Net Change in Unrealized Gain (Loss) | | | Average
Number of
Contracts(a) | |
| Interest rate | | Net realized gain (loss) from futures contracts swap contracts and purchased options/Net change in unrealized gain (loss) on futures contracts and swap contracts and purchased options | | $ | (168,539,032 | ) | | $ | 97,550,394 | | | | 84,814 | |
| Credit | | Net realized gain (loss) from swap contracts/Net change in unrealized gain (loss) on swap contracts | | | (62,822,312 | ) | | | (6,037,777 | ) | | | 54 | |
| Currency | | Net realized gain (loss) from forward foreign currency exchange contracts/Net change in unrealized gain (loss) on forward foreign currency exchange contracts | | | (13,011,801 | ) | | | 59,224,510 | | | | 880 | |
| Total | | $ | (244,373,145 | ) | | $ | 150,737,127 | | | | 85,748 | |
| (a) | | Average number of contracts is based on the average of month end balances for the period ended September 30, 2017. |
In order to better define its contractual rights and to secure rights that will help a Fund mitigate its counterparty risk, a Fund may enter into an International Swaps and Derivatives Association, Inc. Master Agreement (“ISDA Master Agreement”) or similar agreement with its derivatives counterparties. An ISDA Master Agreement is a bilateral agreement between a Fund and a counterparty that governs OTC derivatives (including forward foreign currency exchange contracts, and certain options and swaps), and typically contains, among other things, collateral posting terms and netting provisions in the event of a default and/or termination event. The provisions of the ISDA Master Agreement typically permit a single net payment in the event of a default (close-out netting) or similar event, including the bankruptcy or insolvency of the counterparty.
Collateral and margin requirements differ between exchange traded derivatives and OTC derivatives. Margin requirements are established by the broker or clearing house for exchange-traded and centrally cleared derivatives (financial futures contracts, options and centrally cleared swaps) pursuant to governing agreements for those instrument types. Brokers can ask for margin in excess of the minimum in certain circumstances. Collateral terms are contract-specific for OTC derivatives. For derivatives traded under an ISDA Master Agreement, the collateral requirements are typically calculated by netting the marked to market amount for each transaction under such agreement and comparing that amount to the value of any collateral currently pledged by a Fund and the counterparty. Additionally, a Fund may be required to post initial margin to the counterparty, the terms of which would be outlined in the confirmation of the OTC transaction.
For financial reporting purposes, cash collateral that has been pledged to cover obligations of a Fund and cash collateral received from the counterparty, if any, is reported separately on the Statements of Assets and Liabilities as receivables/payables for collateral on certain derivative contracts. Non-cash collateral pledged by a Fund, if any, is noted in the Schedules of Investments. Generally, the amount of collateral due from or to a counterparty must exceed a minimum transfer amount threshold before a transfer is required to be made. To the extent amounts due to a Fund from its counterparties are not fully collateralized, contractually or otherwise, the Fund bears the risk of loss from counterparty nonperformance. A Fund attempts to mitigate counterparty risk by only entering into agreements with counterparties that the Investment Adviser believes to be of good standing and by monitoring the financial stability of those counterparties.
Additionally, the netting of assets and liabilities and the offsetting of collateral pledged or received are based on contractual netting/set-off provisions in the ISDA Master Agreement or similar agreements. However, in the event of a default or insolvency of a counterparty, a court could determine that such rights are not enforceable due to the restrictions or prohibitions against the right of setoff that may be imposed in accordance with a particular jurisdiction’s bankruptcy or insolvency laws.
132
GOLDMAN SACHS MULTI-SECTOR FIXED INCOME FUNDS
|
| 4. INVESTMENTS IN DERIVATIVES (continued) |
The following tables set forth the Funds’ net exposure for derivative instruments that are subject to enforceable master netting arrangements or similar agreements as of September 30, 2017:
| | | | | | | | | | | | | | | | | | | | | | | | | | | | | | | | | | | | |
| | | | | | | | | |
| Global Income Fund | | | | | | | | | | | | | | | | | | | | | | | | | | | | | | | | | | | | |
| | | Derivative Assets(1) | | | Derivative Liabilities(1) | | | | | | | |
| Counterparty | | Forward
Currency
Contracts | | | Purchased
Options | | | Total | | | Swaps | | | Forward
Currency
Contracts | | | Total | | | Net Derivative
Asset
(Liabilities) | | | Collateral
(Received)
Pledged(1) | | | Net
Amount(2) | |
Bank of America Securities LLC | | $ | — | | | $ | — | | | $ | — | | | $ | (123,011 | ) | | $ | — | | | $ | (123,011 | ) | | $ | (123,011 | ) | | $ | — | | | $ | (123,011 | ) |
Barclays Bank PLC | | | — | | | | — | | | | — | | | | (8,131 | ) | | | — | | | | (8,131 | ) | | | (8,131 | ) | | | — | | | | (8,131 | ) |
Citibank NA | | | — | | | | — | | | | — | | | | (328,923 | ) | | | — | | | | (328,923 | ) | | | (328,923 | ) | | | — | | | | (328,923 | ) |
Deutsche Bank AG | | | — | | | | — | | | | — | | | | (2,029 | ) | | | — | | | | (2,029 | ) | | | (2,029 | ) | | | — | | | | (2,029 | ) |
Morgan Stanley & Co. International PLC | | | 9,754,643 | | | | 78,662 | | | | 9,833,305 | | | | (45,204 | ) | | | (4,996,293 | ) | | | (5,041,497 | ) | | | 4,791,808 | | | | (4,791,808 | ) | | | — | |
Total | | $ | 9,754,643 | | | $ | 78,662 | | | $ | 9,833,305 | | | $ | (507,298 | ) | | $ | (4,996,293 | ) | | $ | (5,503,591 | ) | | $ | 4,329,714 | | | $ | (4,791,808 | ) | | $ | (462,094 | ) |
| | | | | | | | | | | | | | | | | | | | | | | | | | | | | | | | | | | | | | | | |
| | | | |
| Strategic Income Fund | | | | | | | | | | | | | | | | | |
| | | Derivative Assets(1) | | | Derivative Liabilities(1) | | | | | | | | | | |
| Counterparty | | Swaps | | | Forward
Currency
Contracts | | | Purchased Options | | | Total | | | Swaps | | | Forward
Currency
Contracts | | | Total | | | Net Derivative
Asset
(Liabilities) | | | Collateral
(Received)
Pledged(1) | | | Net Amount(2) | |
Bank of America Securities LLC | | $ | — | | | $ | — | | | | — | | | $ | — | | | $ | (153,244 | ) | | $ | — | | | $ | (153,244 | ) | | $ | (153,244 | ) | | $ | — | | | $ | (153,244 | ) |
Barclays Bank PLC | | | — | | | | — | | | | — | | | | — | | | | (1,351,154 | ) | | | — | | | | (1,351,154 | ) | | | (1,351,154 | ) | | | 1,351,154 | | | | — | |
Citibank NA | | | — | | | | — | | | | — | | | | — | | | | (18,552,053 | ) | | | — | | | | (18,552,053 | ) | | | (18,552,053 | ) | | | 16,560,000 | | | | (1,992,053 | ) |
Credit Suisse International (London) | | | 82,712 | | | | — | | | | — | | | | 82,712 | | | | (143,896 | ) | | | — | | | | (143,896 | ) | | | (61,184 | ) | | | — | | | | (61,184 | ) |
Deutsche Bank AG | | | — | | | | — | | | | — | | | | — | | | | (260,047 | ) | | | — | | | | (260,047 | ) | | | (260,047 | ) | | | 220,000 | | | | (40,047 | ) |
JPMorgan Securities, Inc. | | | — | | | | — | | | | — | | | | — | | | | (1,211,511 | ) | | | — | | | | (1,211,511 | ) | | | (1,211,511 | ) | | | 140,000 | | | | (1,071,511 | ) |
Morgan Stanley & Co. International PLC | | | — | | | | 101,723,720 | | | $ | 1,849,925 | | | | 103,573,645 | | | | (1,146,191 | ) | | | (98,984,537 | ) | | | (100,130,728 | ) | | | 3,442,917 | | | | — | | | | 3,442,917 | |
UBS AG (London) | | | — | | | | — | | | | — | | | | — | | | | (143,119 | ) | | | — | | | | (143,119 | ) | | | (143,119 | ) | | | — | | | | (143,119 | ) |
Total | | $ | 82,712 | | | $ | 101,723,720 | | | $ | 1,849,925 | | | $ | 103,656,357 | | | $ | (22,961,215 | ) | | $ | (98,984,537 | ) | | $ | (121,945,752 | ) | | $ | (18,289,395 | ) | | $ | 18,271,154 | | | $ | (18,241 | ) |
| (1) | | Gross amounts available for offset but not netted in the Statements of Assets and Liabilities. |
| (2) | | Net amount represents the net amount due (to) from counterparty in the event of a default based on the contractual set-off rights under the agreement. Net amount excludes any over-collateralized amounts. |
133
GOLDMAN SACHS MULTI-SECTOR FIXED INCOME FUNDS
Notes to Financial Statements (continued)
September 30, 2017 (Unaudited)
|
| 5. AGREEMENTS AND AFFILIATED TRANSACTIONS |
A. Management Agreement — Under the Agreement, GSAM and GSAMI manage the Funds, subject to the general supervision of the Trustees.
As compensation for the services rendered pursuant to the Agreement, the assumption of the expenses related thereto and administration of the Funds’ business affairs, including providing facilities, GSAM and GSAMI are entitled to a management fee, accrued daily and paid monthly, equal to an annual percentage rate of each Fund’s average daily net assets.
For the six months ended September 30, 2017, contractual effective net management fees with GSAM and GSAMI were at the following rates:
| | | | | | | | | | | | | | | | | | | | | | | | | | | | | | |
| | | | | Contractual Management Rate | | | Effective Net
Management
Rate | |
| Fund | | | | First $1 Billion | | | Next $1 Billion | | | Next $3 Billion | | | Next $3 Billion | | | Over $8 Billion | | | Effective
Rate^ | | |
Bond | | | | | 0.41 | % | | | 0.37 | % | | | 0.35 | % | | | 0.34 | % | | | 0.34 | % | | | 0.41 | % | | | 0.40 | %* |
Core Fixed Income | | | | | 0.40 | | | | 0.36 | | | | 0.34 | | | | 0.33 | | | | 0.32 | | | | 0.40 | | | | 0.39 | * |
Global Income | | | | | 0.65 | | | | 0.59 | | | | 0.56 | | | | 0.55 | | | | 0.54 | | | | 0.65 | | | | 0.65 | |
Strategic Income | | | | | 0.60 | | | | 0.54 | | | | 0.51 | | | | 0.50 | | | | 0.49 | | | | 0.51 | | | | 0.51 | |
| * | | The Effective Net Management Rate includes the impact of management fee waivers of affiliated underlying funds, if any. |
Effective July 28, 2017, GSAM reduced the contractual management fee across all breakpoints for the Bond Fund. Prior to July 28, 2017, the Bond Fund’s Effective Rate was 0.45%.
The Funds invest in Institutional Shares Shares of the Goldman Sachs Financial Square Government Fund, which is an affiliated Underlying Fund. GSAM and GSAMI have agreed to waive a portion of its management fee payable by the Funds in an amount equal to the management fee it earns as an investment adviser to any of the affiliated Underlying Funds in which the Funds invest. For the six months ended September 30, 2017, GSAM waived $14,876, $17,892, $9,676 and $158,476 of the Fund’s management fee for the Bond, Core Fixed Income, Global Income and Strategic Income Funds, respectively.
B. Distribution and/or Service (12b-1) Plans — The Trust, on behalf of Class A and Class R Shares of each applicable Fund, has adopted Distribution and Service Plans subject to Rule 12b-1 under the Act. Under the Distribution and Service Plans, Goldman Sachs, which serves as distributor (the “Distributor”), is entitled to a fee accrued daily and paid monthly, for distribution services and personal and account maintenance services, which may then be paid by Goldman Sachs to authorized dealers. These fees are equal to an annual percentage rate of the average daily net assets attributable to Class A or Class R Shares of the Funds, as applicable, as set forth below.
The Trust, on behalf of Class C Shares of each applicable Fund, has adopted a Distribution Plan subject to Rule 12b-1 under the Act. Under the Distribution Plan, Goldman Sachs as Distributor is entitled to a fee accrued daily and paid monthly for distribution services, which may then be paid by Goldman Sachs to authorized dealers. These fees are equal to an annual percentage rate of the average daily net assets attributable to Class C Shares of the Funds, as set forth below.
The Trust, on behalf of Service Shares of each applicable Fund, has adopted a Service Plan subject to Rule 12b-1 under the Act to allow Service Shares to compensate service organizations (including Goldman Sachs) for providing personal and account maintenance services to their customers who are beneficial owners of such shares. The Service Plan provides for compensation to the service organizations equal to an annual percentage rate of the average daily net assets attributable to Service Shares of the Funds.
134
GOLDMAN SACHS MULTI-SECTOR FIXED INCOME FUNDS
|
| 5. AGREEMENTS AND AFFILIATED TRANSACTIONS (continued) |
| | | | | | | | | | | | | | | | |
| | | Distribution and Service Plan Rates | |
| | | Class A* | | | Class C | | | Class R* | | | Service | |
Distribution Plan | | | 0.25 | % | | | 0.75 | % | | | 0.50 | % | | | — | % |
Service Plan | | | — | | | | — | | | | — | | | | 0.25 | |
| * | | With respect to Class A and Class R Shares, the Distributor at its discretion may use compensation for distribution services paid under the Distribution Plan to compensate service organizations for personal and account maintenance services and expenses as long as such total compensation does not exceed the maximum cap on “service fees” imposed by the Financial Industry Regulatory Authority. |
For the six months ended September 30, 2017, Goldman Sachs waived a portion of the distribution and/or service fees equal to 0.02% and 0.02% of the average daily net assets attributable to Class A Shares and Class C Shares of the Global Income Fund.
C. Distribution Agreement — Goldman Sachs, as Distributor of the shares of the Funds pursuant to a Distribution Agreement, may retain a portion of the Class A Shares’ front end sales charge and Class C Shares’ CDSC. For the six months ended September 30, 2017, Goldman Sachs advised that it retained the following amounts:
| | | | | | | | | | |
| | | | | Front End
Sales Charge | | | Contingent Deferred
Sales Charge | |
| Fund | | | | Class A | | | Class C | |
Bond | | | | $ | — | | | $ | — | |
Core Fixed Income | | | | | 1,379 | | | | 399 | |
Global Income | | | | | 1,176 | | | | — | |
Strategic Income | | | | | 5,931 | | | | — | |
D. Service and/or Shareholder Administration Plans — The Trust, on behalf of each applicable Fund, has adopted Service Plan and/or Shareholder Administration Plans to allow Class C and Service Shares, respectively, to compensate service organizations (including Goldman Sachs) for providing varying levels of personal and account maintenance and/or shareholder administration services to their customers who are beneficial owners of such shares. The Service and/or Shareholder Administration Plans each provide for compensation to the service organizations equal to an annual percentage rate of 0.25% of the average daily net assets attributable to Class C or Service Shares of the Funds, as applicable.
E. Transfer Agency Agreement — Goldman Sachs also serves as the transfer agent of the Funds for a fee pursuant to the Transfer Agency Agreement. The fees charged for such transfer agency services are accrued daily and paid monthly at annual rates as follows: 0.13% of the average daily net assets of Class A, Class C, Investor and Class R Shares; 0.03% of the average daily net assets of Class R6 Shares; and 0.04% of the average daily net assets of Institutional and Service Shares.
F. Other Expense Agreements and Affiliated Transactions — GSAM and GSAMI have agreed to limit certain “Other Expenses” of the Funds (excluding acquired fund fees and expenses, transfer agency fees and expenses, service fees and shareholder administration fees (as applicable), taxes, interest, brokerage fees, expenses of shareholder meetings, litigation and indemnification, and extraordinary expenses) to the extent such expenses exceed, on an annual basis, a percentage rate of the average daily net assets of each Fund. Such Other Expense reimbursements, if any, are accrued daily and paid monthly. In addition, the Funds are not obligated to reimburse GSAM and GSAMI for prior fiscal year expense reimbursements, if any. The Other Expense limitations as an annual percentage rate of average daily net assets for the Bond, Core Fixed Income, Global Income and Strategic Income Fund are 0.004%, 0.014%, 0.004% and 0.054%, respectively. These Other Expense limitations will remain in place through at least July 28, 2018, and prior to such date GSAM and GSAMI may not terminate the arrangements without the approval of the Trustees. In addition, the Funds have entered into certain offset arrangements with the transfer agent, which may result in a reduction of the Funds’ expenses and are received irrespective of the application of the “Other Expense” limitations described above.
Goldman Sachs may voluntarily waive a portion of any payments under a Fund’s Distribution and Service Plan, Service Plan and Shareholder Administration Plan, Transfer Agency Agreement, and/or Management Agreement and these waivers may exceed
135
GOLDMAN SACHS MULTI-SECTOR FIXED INCOME FUNDS
Notes to Financial Statements (continued)
September 30, 2017 (Unaudited)
|
| 5. AGREEMENTS AND AFFILIATED TRANSACTIONS (continued) |
what is stipulated in any fee waiver arrangements (as applicable). These temporary waivers may be modified or terminated at any time at the option of Goldman Sachs without shareholder approval.
For the six months ended September 30, 2017, these expense reductions, including any fee waivers and Other Expense reimbursements, were as follows:
| | | | | | | | | | | | | | | | | | |
| Fund | | | | Management Fee
Waiver | | | Distribution
and/or Service Fees | | | Other Expense Reimbursements | | | Total Expense Reductions | |
Bond | | | | $ | 92,535 | | | $ | — | | | $ | 341,419 | | | $ | 433,954 | |
Core Fixed Income | | | | | 17,892 | | | | — | | | | 242,761 | | | | 260,653 | |
Global Income | | | | | 9,677 | | | | 29,873 | | | | 362,080 | | | | 401,630 | |
Strategic Income | | | | | 158,476 | | | | — | | | | — | | | | 158,476 | |
G. Line of Credit Facility — As of September 30, 2017, the Funds participated in a $1,100,000,000 committed, unsecured revolving line of credit facility (the “facility”) together with other funds of the Trust and certain registered investment companies having management agreements with GSAM and GSAMI or its affiliates. This facility is to be used for temporary emergency purposes, or to allow for an orderly liquidation of securities to meet redemption requests. The interest rate on borrowings is based on the federal funds rate. The facility also requires a fee to be paid by the Funds based on the amount of the commitment that has not been utilized. For the six months ended September 30, 2017, the Funds did not have any borrowings under the facility.
H. Other Transactions with Affiliates — For the six months ended September 30, 2017, Goldman Sachs earned $21,546, $20,625 and $943,328, in brokerage commissions from portfolio transactions, including futures transactions executed with Goldman Sachs as the Futures Commission Merchant, on behalf of the Bond, Core Fixed Income and Strategic Income Funds, respectively.
As of September 30, 2017, the following Fund of Funds Portfolios were the beneficial owners of 5% or more of total outstanding shares of the following Fund:
| | | | | | | | | | |
| Fund | | | | Goldman Sachs
Balanced Strategy
Portfolio | | | Goldman Sachs
Growth and Income Strategy Portfolio | |
Global Income | | | | | 17 | % | | | 15 | % |
The table below shows the transactions in and earnings from investments in the Goldman Sachs Financial Square Government Fund for the six months ended September 30, 2017:
| | | | | | | | | | | | | | | | | | | | | | |
| Fund | | | | Market Value 03/31/17 | | | Purchases at Cost | | | Proceeds from Sales | | | Market Value 09/30/17 | | | Dividend Income | |
Bond | | | | $ | 6,270 | | | $ | 159,144,990 | | | $ | (134,369,732 | ) | | $ | 24,781,528 | | | $ | 81,122 | |
Core Fixed Income | | | | | 2,365,955 | | | | 160,165,611 | | | | (162,527,617 | ) | | | 3,949 | | | | 86,827 | |
Global Income | | | | | 15,139 | | | | 253,718,171 | | | | (238,177,307 | ) | | | 15,556,003 | | | | 51,975 | |
Strategic Income | | | | | 339,445,835 | | | | 3,992,764,350 | | | | (4,078,693,365 | ) | | | 253,516,820 | | | | 731,511 | |
The following table provides information about the investment in the shares of an issuer deemed to be an affiliate by the Strategic Income Fund for the six months ended September 30, 2017:
| | | | | | | | | | | | | | | | | | | | |
| Name of Affiliated Issuer | | Market Value 03/31/17 | | | Purchases at Cost | | | Proceeds from Sales | | | Net Change in Unrealized Gain (loss) | | | Market Value 09/30/17 | |
Blue Ridge Mountain Resource, Inc. — Common Stock | | $ | 85,877,097 | | | $ | 28,749,999 | | | $ | — | | | $ | (39,484,636 | ) | | $ | 75,142,460 | |
136
GOLDMAN SACHS MULTI-SECTOR FIXED INCOME FUNDS
|
| 6. PORTFOLIO SECURITIES TRANSACTIONS |
The cost of purchases and proceeds from sales and maturities of long-term securities for the six months ended September 30, 2017, were:
| | | | | | | | | | | | | | | | | | |
| Fund | | | | Purchases of U.S. Government and Agency Obligations | | | Purchases (Excluding U.S. Government and Agency Obligations) | | | Sales and Maturities of U.S. Government and Agency Obligations | | | Sales and Maturities (Excluding U.S. Government and Agency Obligations) | |
Bond | | | | $ | 1,072,644,898 | | | $ | 126,662,312 | | | $ | 1,059,892,976 | | | $ | 66,962,643 | |
Core Fixed Income | | | | | 1,151,942,853 | | | | 185,884,954 | | | | 1,232,794,155 | | | | 140,900,641 | |
Global Income | | | | | 98,229,297 | | | | 560,811,329 | | | | 142,317,337 | | | | 653,767,009 | |
Strategic Income | | | | | 2,597,515,294 | | | | 1,280,383,648 | | | | 2,580,851,959 | | | | 1,344,492,192 | |
As of the Funds’ most recent fiscal year end, March 31, 2017, the Funds’ capital loss carryforwards and certain timing differences on a tax basis were as follows:
| | | | | | | | | | | | | | | | |
| | | Bond | | | Core Fixed
Income | | | Global Income | | | Strategic Income | |
Capital loss carryforwards(1) | | | | | | | | | | | | | | | | |
Expiring 2018 | | $ | — | | | $ | (22,548,038 | ) | | $ | — | | | $ | — | |
Perpetual Short-term | | | — | | | | — | | | | — | | | | (1,072,699,678 | ) |
Perpetual Long-term | | | — | | | | (42,826 | ) | | | — | | | | (677,867,817 | ) |
Total capital loss carryforwards | | $ | — | | | $ | (22,590,864 | ) | | $ | — | | | | (1,750,567,495 | ) |
Timing differences (Qualified Late Year Loss Deferral, Straddle Deferral, Dividend and Distribution Payable) | | $ | (8,992,449 | ) | | $ | (6,995,080 | ) | | $ | (12,555,747 | ) | | $ | (88,811,208 | ) |
| (1) | | With the exception of perpetual capital loss carryforwards, expiration occurs on March 31 of the year indicated. |
As of September 30, 2017, the Funds’ aggregate security unrealized gains and losses based on cost for U.S. federal income tax purposes were as follows:
| | | | | | | | | | | | | | | | |
| | | Bond | | | Core Fixed
Income | | | Global Income | | | Strategic Income | |
Tax Cost | | $ | 666,228,193 | | | $ | 1,017,094,367 | | | $ | 764,106,514 | | | $ | 6,438,120,225 | |
Gross unrealized gain | | | 9,511,224 | | | | 19,063,755 | | | | 17,795,864 | | | | 155,819,171 | |
Gross unrealized loss | | | (4,539,743 | ) | | | (3,718,215 | ) | | | (7,201,108 | ) | | | (275,164,868 | ) |
Net unrealized security gain | | $ | 4,971,481 | | | $ | 15,345,540 | | | $ | 10,594,756 | | | $ | (119,345,697 | ) |
The difference between GAAP-basis and tax-basis unrealized gains (losses) is attributable primarily to wash sales, net mark to market gains/(losses) on regulated futures contracts, foreign currency contracts, and differences related to the tax treatment of inflation protected securities, swap transactions, and material modification of debt securities.
GSAM and GSAMI have reviewed the Funds’ tax positions for all open tax years (the current and prior three years, as applicable) and have concluded that no provision for income tax is required in the Funds’ financial statements. Such open tax years remain subject to examination and adjustment by tax authorities.
137
GOLDMAN SACHS MULTI-SECTOR FIXED INCOME FUNDS
Notes to Financial Statements (continued)
September 30, 2017 (Unaudited)
The Funds’ risks include, but are not limited to, the following:
Derivatives Risk — The Funds’ use of derivatives may result in loss. Derivative instruments, which may pose risks in addition to and greater than those associated with investing directly in securities, currencies or other instruments, may be illiquid or less liquid, volatile, difficult to price and leveraged so that small changes in the value of the underlying instruments may produce disproportionate losses to the Funds. Derivatives are also subject to counterparty risk, which is the risk that the other party in the transaction will not fulfill its contractual obligation. The use of derivatives is a highly specialized activity that involves investment techniques and risks different from those associated with investments in more traditional securities and instruments. Losses from derivatives can also result from a lack of correlation between changes in the value of derivative instruments and the portfolio assets (if any) being hedged.
Foreign Countries Risk — Investing in foreign markets may involve special risks and considerations not typically associated with investing in the United States. Foreign securities may be subject to risk of loss because of more or less foreign government regulation, less public information and less economic, political and social stability in the countries in which the Funds invest. The imposition of exchange controls, confiscations, trade restrictions (including tariffs) and other government restrictions by the United States or other governments, or from problems in share registration, settlement or custody, may also result in losses. Foreign risk also involves the risk of negative foreign currency rate fluctuations, which may cause the value of securities denominated in such foreign currency (or other instruments through which the Funds have exposure to foreign currencies) to decline in value. Currency exchange rates may fluctuate significantly over short periods of time.
To the extent that the Funds also invest in securities of issuers located in emerging markets, these risks may be more pronounced.
Foreign Custody Risk — If a Fund invests in foreign securities, such Fund may hold such securities and cash with foreign banks, agents, and securities depositories appointed by the Fund’s custodian (each a “Foreign Custodian”). Some foreign custodians may be recently organized or new to the foreign custody business. In some countries, Foreign Custodians may be subject to little or no regulatory oversight over, or independent evaluation of, their operations. Further, the laws of certain countries may place limitations on a Fund’s ability to recover its assets if a Foreign Custodian enters bankruptcy.
Geographic Risk — If a Fund focuses its investments in securities of issuers located in a particular country or geographic region, it will subject the Fund, to a greater extent than if its investments were less focused, to the risks of volatile economic cycles and/or conditions and developments that may be particular to that country or region, such as: adverse securities markets; adverse exchange rates; adverse social, political, regulatory, economic, business, environmental or other developments; or natural disasters.
Interest Rate Risk — When interest rates increase, fixed income securities or instruments held by the Funds will generally decline in value. Long-term fixed income securities or instruments will normally have more price volatility because of this risk than short-term fixed income securities or instruments. The risks associated with increasing rates are heightened given that interest rates are near historic lows, but may be expected to increase in the future with unpredictable effects on the markets and the Funds’ investments. Fluctuations in interest rates may also affect the liquidity of fixed income securities and instruments held by the Funds.
Investments in Other Investment Companies Risk — As a shareholder of another investment company, including an exchange-traded fund (“ETF”), a Fund will indirectly bear its proportionate share of any net management fees and other expenses paid by such other investment companies, in addition to the fees and expenses regularly borne by the Fund. ETFs are subject to risks that do not apply to conventional mutual funds, including but not limited to the following: (i) the market price of the ETF’s shares may trade at a premium or a discount to their NAV; and (ii) an active trading market for an ETF’s shares may not develop or be maintained.
Large Shareholder Transactions Risk — A Fund may experience adverse effects when certain large shareholders, such as other funds, institutional investors (including those trading by use of non-discretionary mathematical formulas), financial intermediaries (who may make investment decisions on behalf of underlying clients and/or include a Fund in their investment
138
GOLDMAN SACHS MULTI-SECTOR FIXED INCOME FUNDS
|
| 8. OTHER RISKS (continued) |
model), individuals, accounts and Goldman Sachs affiliates, purchase or redeem large amounts of shares of a Fund. Such large shareholder redemptions may cause a Fund to sell portfolio securities at times when it would not otherwise do so, which may negatively impact a Fund’s NAV and liquidity. These transactions may also accelerate the realization of taxable income to shareholders if such sales of investments resulted in gains, and may also increase transaction costs. In addition, a large redemption could result in a Fund’s current expenses being allocated over a smaller asset base, leading to an increase in the Fund’s expense ratio. Similarly, large Fund share purchases may adversely affect a Fund’s performance to the extent that the Fund is delayed in investing new cash and is required to maintain a larger cash position than it ordinarily would.
Leverage Risk — Leverage creates exposure to potential gains and losses in excess of the initial amount invested. Borrowing and the use of derivatives may result in leverage and may make a Fund more volatile. When a Fund uses leverage, the sum of that Fund’s investment exposure may significantly exceed the amount of assets invested in the Fund, although these exposures may vary over time. Relatively small market movements may result in large changes in the value of a leveraged investment. A Fund will identify liquid assets on its books or otherwise cover transactions that may give rise to such risk, to the extent required by applicable law. The use of leverage may cause a Fund to liquidate portfolio positions to satisfy its obligations or to meet segregation requirements when it may not be advantageous to do so. The use of leverage by a Fund can substantially increase the adverse impact to which the Fund’s investment portfolio may be subject.
Liquidity Risk — A Fund may make investments that are illiquid or that may become less liquid in response to market developments or adverse investor perceptions. Illiquid investments may be more difficult to value. Liquidity risk may also refer to the risk that a Fund will not be able to pay redemption proceeds within the allowable time period because of unusual market conditions, an unusually high volume of redemption requests, or other reasons. To meet redemption requests, a Fund may be forced to sell investments at an unfavorable time and/or under unfavorable conditions.
Liquidity risk may be the result of, among other things, the reduced number and capacity of traditional market participants to make a market in fixed income securities or the lack of an active market. The potential for liquidity risk may be magnified by a rising interest rate environment or other circumstances where investor redemptions from fixed income mutual funds may be higher than normal, potentially causing increased supply in the market due to selling activity
Loan-Related Investments Risk — In addition to risks generally associated with debt investments, loan-related investments such as loan participations and assignments are subject to other risks. Although a loan obligation may be fully collateralized at the time of acquisition, the collateral may decline in value, be relatively illiquid, or lose all or substantially all of its value subsequent to investment. Many loan investments are subject to legal or contractual restrictions on resale and may be relatively illiquid and difficult to value. There is less readily available, reliable information about most loan investments than is the case for many other types of securities. Substantial increases in interest rates may cause an increase in loan obligation defaults. With respect to loan participations, the Fund may not always have direct recourse against a borrower if the borrower fails to pay scheduled principal and/or interest; may be subject to greater delays, expenses and risks than if the Fund had purchased a direct obligation of the borrower; and may be regarded as the creditor of the agent lender (rather than the borrower), subjecting the Fund to the creditworthiness of that lender as well. Investors in loans, such as the Fund, may not be entitled to rely on the anti-fraud protections of the federal securities laws, although they may be entitled to certain contractual remedies. The market for loan obligations may be subject to irregular trading activity, wide bid/ask spreads and extended trade settlement periods. Because transactions in many loans are subject to extended trade settlement periods, the Fund may not receive the proceeds from the sale of a loan for a period after the sale. As a result, sale proceeds related to the sale of loans may not be available to make additional investments or to meet the Fund’s redemption obligations for a period after the sale of the loans, and, as a result, the Fund may have to sell other investments or engage in borrowing transactions, such as borrowing from its credit facility, if necessary to raise cash to meet its obligations.
Senior Loans hold the most senior position in the capital structure of a business entity, and are typically secured with specific collateral, but are nevertheless usually rated below investment grade. Because Second Lien Loans are subordinated or unsecured and thus lower in priority of payment to Senior Loans, they are subject to the additional risk that the cash flow of the borrower and property securing the loan or debt, if any, may be insufficient to meet scheduled payments after giving effect to the senior secured obligations of the borrower. Second Lien Loans generally have greater price volatility than Senior Loans and may be less liquid.
139
GOLDMAN SACHS MULTI-SECTOR FIXED INCOME FUNDS
Notes to Financial Statements (continued)
September 30, 2017 (Unaudited)
|
| 8. OTHER RISKS (continued) |
Market and Credit Risks — In the normal course of business, the Funds trade financial instruments and enter into financial transactions where risk of potential loss exists due to changes in the market (market risk). Additionally, the Funds may also be exposed to credit risk in the event that an issuer or guarantor fails to perform or that an institution or entity with which the Funds have unsettled or open transactions defaults.
Non-Diversification Risk — The Global Income Fund is non-diversified, meaning that it is permitted to invest a larger percentage of its assets in fewer issuers than diversified mutual funds. Thus, a Fund may be more susceptible to adverse developments affecting any single issuer held in its portfolio, and may be more susceptible to greater losses because of these developments.
Sector Risk — To the extent a Fund focuses its investments in securities of issuers in one or more sectors (such as the financial services or telecommunications sectors), the Fund may be subjected, to a greater extent than if its investments were diversified across different sectors, to the risks of volatile economic cycles and/or conditions and developments that may be particular to that sector, such as: adverse economic, business, political, environmental or other developments.
Short Position Risk — A Fund may enter into a short position through a futures contract, an option or swap agreement or through short sales of any instrument that a Fund may purchase for investment. Taking short positions involves leverage of a Fund’s assets and presents various risks, including counterparty risk. If the value of the underlying instrument or market in which a Fund has taken a short position increases, then the Fund will incur a loss equal to the increase in value from the time that the short position was entered into plus any related interest payments or other fees. Taking short positions involves the risk that losses may be disproportionate, may exceed the amount invested, and may be unlimited.
Under the Trust’s organizational documents, its Trustees, officers, employees and agents are indemnified, to the extent permitted by the Act and state law, against certain liabilities that may arise out of performance of their duties to the Funds. Additionally, in the course of business, the Funds enter into contracts that contain a variety of indemnification clauses. The Funds’s maximum exposure under these arrangements is unknown, as this would involve future claims that may be made against the Funds that have not yet occurred. However, GSAM and GSAMI believe the risk of loss under these arrangements to be remote.
Subsequent events after the Statements of Assets and Liabilities date have been evaluated and GSAM and GSAMI have concluded that there is no impact requiring adjustment or disclosure in the financial statements.
140
GOLDMAN SACHS MULTI-SECTOR FIXED INCOME FUNDS
|
| 11. SUMMARY OF SHARE TRANSACTIONS |
Share activity is as follows:
| | | | | | | | | | | | | | | | |
| | | Bond Fund | |
| | | | |
| | | For the Six Months Ended
September 30, 2017
(Unaudited) | | | For the Fiscal Year Ended
March 31, 2017
| |
| | | | |
| | | Shares | | | Dollars | | | Shares | | | Dollars | |
| | | | |
| Class A Shares | | | | | | | | | | | | | | | | |
Shares sold | | | 1,513,345 | | | $ | 15,471,155 | | | | 4,573,734 | | | $ | 46,885,886 | |
Reinvestment of distributions | | | 123,002 | | | | 1,257,963 | | | | 287,760 | | | | 2,949,665 | |
Shares redeemed | | | (1,305,748 | ) | | | (13,345,130 | ) | | | (5,884,460 | ) | | | (60,427,619 | ) |
| | | | 330,599 | | | | 3,383,988 | | | | (1,022,966 | ) | | | (10,592,068 | ) |
| Class C Shares | | | | | | | | | | | | | | | | |
Shares sold | | | 114,998 | | | | 1,176,240 | | | | 912,536 | | | | 9,446,551 | |
Reinvestment of distributions | | | 11,140 | | | | 113,826 | | | | 27,421 | | | | 280,216 | |
Shares redeemed | | | (364,008 | ) | | | (3,719,909 | ) | | | (737,013 | ) | | | (7,547,043 | ) |
| | | | (237,870 | ) | | | (2,429,843 | ) | | | 202,944 | | | | 2,179,724 | |
| Institutional Shares | | | | | | | | | | | | | | | | |
Shares sold | | | 6,089,733 | | | | 62,210,504 | | | | 16,403,447 | | | | 168,499,823 | |
Reinvestment of distributions | | | 416,291 | | | | 4,255,508 | | | | 821,744 | | | | 8,423,275 | |
Shares redeemed | | | (4,880,962 | ) | | | (49,897,291 | ) | | | (11,929,123 | ) | | | (122,040,738 | ) |
| | | | 1,625,062 | | | | 16,568,721 | | | | 5,296,068 | | | | 54,882,360 | |
| Service Shares | | | | | | | | | | | | | | | | |
Shares sold | | | 26,203 | | | | 268,279 | | | | 52,116 | | | | 538,515 | |
Reinvestment of distributions | | | 1,362 | | | | 13,929 | | | | 2,814 | | | | 28,779 | |
Shares redeemed | | | (19,211 | ) | | | (196,786 | ) | | | (36,305 | ) | | | (371,966 | ) |
| | | | 8,354 | | | | 85,422 | | | | 18,625 | | | | 195,328 | |
| Investor Shares | | | | | | | | | | | | | | | | |
Shares sold | | | 1,188,600 | | | | 12,124,226 | | | | 4,741,570 | | | | 48,584,216 | |
Reinvestment of distributions | | | 54,503 | | | | 555,500 | | | | 125,369 | | | | 1,284,093 | |
Shares redeemed | | | (1,050,368 | ) | | | (10,687,924 | ) | | | (4,391,214 | ) | | | (44,665,033 | ) |
| | | | 192,735 | | | | 1,991,802 | | | | 475,725 | | | | 5,203,276 | |
| Class R Shares | | | | | | | | | | | | | | | | |
Shares sold | | | 320,144 | | | | 3,267,878 | | | | 2,162,978 | | | | 22,269,256 | |
Reinvestment of distributions | | | 8,241 | | | | 84,176 | | | | 10,674 | | | | 108,888 | |
Shares redeemed | | | (297,896 | ) | | | (3,042,649 | ) | | | (542,633 | ) | | | (5,572,224 | ) |
| | | | 30,489 | | | | 309,405 | | | | 1,631,019 | | | | 16,805,920 | |
| Class R6 Shares | | | | | | | | | | | | | | | | |
Shares sold | | | 1,752,114 | | | | 17,920,530 | | | | 5,606,585 | | | | 56,944,351 | |
Reinvestment of distributions | | | 74,886 | | | | 765,538 | | | | 42,711 | | | | 432,344 | |
Shares redeemed | | | (420,132 | ) | | | (4,294,410 | ) | | | (616,432 | ) | | | (6,233,345 | ) |
| | | | 1,406,868 | | | | 14,391,658 | | | | 5,032,864 | | | | 51,143,350 | |
NET INCREASE | | | 3,356,237 | | | $ | 34,301,153 | | | | 11,634,279 | | | $ | 119,817,890 | |
141
GOLDMAN SACHS MULTI-SECTOR FIXED INCOME FUNDS
Notes to Financial Statements (continued)
September 30, 2017 (Unaudited)
|
| 11. SUMMARY OF SHARE TRANSACTIONS (continued) |
| | | | | | | | | | | | | | | | |
| |
| | | Core Fixed Income Fund | |
| | | | |
| | | For the Six Months Ended
September 30, 2017
(Unaudited) | | | For the Fiscal Year Ended
March 31, 2017
| |
| | | | |
| | | Shares | | | Dollars | | | Shares | | | Dollars | |
| | | | |
| Class A Shares | | | | | | | | | | | | | | | | |
Shares sold | | | 1,294,534 | | | $ | 13,573,634 | | | | 5,353,486 | | | $ | 56,015,730 | |
Reinvestment of distributions | | | 119,989 | | | | 1,258,853 | | | | 288,507 | | | | 3,037,820 | |
Shares redeemed | | | (9,367,936 | ) | | | (98,334,042 | ) | | | (4,875,469 | ) | | | (51,249,968 | ) |
| | | | (7,953,413 | ) | | | (83,501,555 | ) | | | 766,524 | | | | 7,803,582 | |
| Class C Shares | | | | | | | | | | | | | | | | |
Shares sold | | | 63,435 | | | | 669,613 | | | | 482,737 | | | | 5,142,702 | |
Reinvestment of distributions | | | 7,574 | | | | 79,915 | | | | 23,122 | | | | 244,819 | |
Shares redeemed | | | (631,574 | ) | | | (6,654,213 | ) | | | (715,295 | ) | | | (7,553,396 | ) |
| | | | (560,565 | ) | | | (5,904,685 | ) | | | (209,436 | ) | | | (2,165,875 | ) |
| Institutional Shares | | | | | | | | | | | | | | | | |
Shares sold | | | 17,543,810 | | | | 185,015,829 | | | | 30,126,882 | | | | 317,175,538 | |
Reinvestment of distributions | | | 982,972 | | | | 10,366,254 | | | | 1,832,234 | | | | 19,370,742 | |
Shares redeemed | | | (10,896,050 | ) | | | (115,104,517 | ) | | | (23,597,706 | ) | | | (247,401,131 | ) |
| | | | 7,630,732 | | | | 80,277,566 | | | | 8,361,410 | | | | 89,145,149 | |
| Service Shares | | | | | | | | | | | | | | | | |
Shares sold | | | 2,530 | | | | 26,703 | | | | 46,424 | | | | 491,295 | |
Reinvestment of distributions | | | 577 | | | | 6,084 | | | | 1,315 | | | | 13,913 | |
Shares redeemed | | | (20,639 | ) | | | (217,463 | ) | | | (51,239 | ) | | | (542,945 | ) |
| | | | (17,532 | ) | | | (184,676 | ) | | | (3,500 | ) | | | (37,737 | ) |
| Investor Shares | | | | | | | | | | | | | | | | |
Shares sold | | | 788,927 | | | | 8,309,120 | | | | 3,679,391 | | | | 38,606,126 | |
Reinvestment of distributions | | | 49,707 | | | | 522,531 | | | | 71,462 | | | | 752,538 | |
Shares redeemed | | | (207,381 | ) | | | (2,177,301 | ) | | | (521,690 | ) | | | (5,488,071 | ) |
| | | | 631,253 | | | | 6,654,350 | | | | 3,229,163 | | | | 33,870,593 | |
| Class R Shares | | | | | | | | | | | | | | | | |
Shares sold | | | 374,211 | | | | 3,926,738 | | | | 328,713 | | | | 3,464,601 | |
Reinvestment of distributions | | | 2,992 | | | | 31,463 | | | | 15,139 | | | | 159,713 | |
Shares redeemed | | | (17,932 | ) | | | (188,508 | ) | | | (1,156,890 | ) | | | (12,022,751 | ) |
| | | | 359,271 | | | | 3,769,693 | | | | (813,038 | ) | | | (8,398,437 | ) |
| Class R6 Shares | | | | | | | | | | | | | | | | |
Shares sold | | | 28,215 | | | | 297,382 | | | | 813,776 | | | | 8,608,526 | |
Reinvestment of distributions | | | 1,385 | | | | 14,546 | | | | 140,450 | | | | 1,485,611 | |
Shares redeemed | | | (5,371,204 | ) | | | (56,236,539 | ) | | | (981,123 | ) | | | (10,298,490 | ) |
| | | | (5,341,604 | ) | | | (55,924,611 | ) | | | (26,897 | ) | | | (204,353 | ) |
NET INCREASE (DECREASE) | | | (5,251,858 | ) | | $ | (54,813,918 | ) | | | 11,304,226 | | | $ | 120,012,922 | |
142
GOLDMAN SACHS MULTI-SECTOR FIXED INCOME FUNDS
|
| 11. SUMMARY OF SHARE TRANSACTIONS (continued) |
| | | | | | | | | | | | | | | | |
| | | Global Income Fund | |
| | | | |
| | | For the Six Months Ended
September 30, 2017
(Unaudited) | | | For the Fiscal Year Ended
March 31, 2017
| |
| | | | |
| | | Shares | | | Dollars | | | Shares | | | Dollars | |
| | | | |
| Class A Shares | | | | | | | | | | | | | | | | |
Shares sold | | | 1,182,370 | | | $ | 14,550,145 | | | | 10,314,055 | | | $ | 127,172,006 | |
Reinvestment of distributions | | | 52,794 | | | | 649,445 | | | | 180,137 | | | | 2,206,762 | |
Shares redeemed | | | (2,240,860 | ) | | | (27,573,300 | ) | | | (8,466,815 | ) | | | (103,561,696 | ) |
| | | | (1,005,696 | ) | | | (12,373,710 | ) | | | 2,027,377 | | | | 25,817,072 | |
| Class C Shares | | | | | | | | | | | | | | | | |
Shares sold | | | 92,418 | | | | 1,128,070 | | | | 1,130,610 | | | | 13,879,638 | |
Reinvestment of distributions | | | 2,077 | | | | 25,343 | | | | 10,517 | | | | 126,954 | |
Shares redeemed | | | (535,305 | ) | | | (6,533,079 | ) | | | (464,762 | ) | | | (5,641,966 | ) |
| | | | (440,810 | ) | | | (5,379,666 | ) | | | 676,365 | | | | 8,364,626 | |
| Institutional Shares | | | | | | | | | | | | | | | | |
Shares sold | | | 7,315,165 | | | | 89,897,216 | | | | 32,510,045 | | | | 398,441,316 | |
Reinvestment of distributions | | | 305,808 | | | | 3,755,833 | | | | 819,240 | | | | 10,032,505 | |
Shares redeemed | | | (13,074,966 | ) | | | (160,538,391 | ) | | | (34,231,372 | ) | | | (419,887,389 | ) |
| | | | (5,453,993 | ) | | | (66,885,342 | ) | | | (902,087 | ) | | | (11,413,568 | ) |
| Service Shares | | | | | | | | | | | | | | | | |
Shares sold | | | 39,286 | | | | 479,407 | | | | 289,358 | | | | 3,532,058 | |
Reinvestment of distributions | | | 935 | | | | 11,421 | | | | 3,150 | | | | 38,342 | |
Shares redeemed | | | (37,324 | ) | | | (454,631 | ) | | | (251,304 | ) | | | (3,054,236 | ) |
| | | | 2,897 | | | | 36,197 | | | | 41,204 | | | | 516,164 | |
| Investor Shares | | | | | | | | | | | | | | | | |
Shares sold | | | 1,301,441 | | | | 15,935,027 | | | | 7,806,270 | | | | 95,481,085 | |
Reinvestment of distributions | | | 48,435 | | | | 593,833 | | | | 80,695 | | | | 985,345 | |
Shares redeemed | | | (1,744,299 | ) | | | (21,352,418 | ) | | | (2,472,118 | ) | | | (30,261,447 | ) |
| | | | (394,423 | ) | | | (4,823,558 | ) | | | 5,414,847 | | | | 66,204,983 | |
| Class R6 Shares | | | | | | | | | | | | | | | | |
Shares sold | | | 106,483 | | | | 1,307,956 | | | | 518,135 | | | | 6,336,385 | |
Reinvestment of distributions | | | 3,207 | | | | 39,394 | | | | 3,635 | | | | 44,298 | |
Shares redeemed | | | (61,181 | ) | | | (752,324 | ) | | | (115,606 | ) | | | (1,415,102 | ) |
| | | | 48,509 | | | | 595,026 | | | | 406,164 | | | | 4,965,581 | |
NET INCREASE (DECREASE) | | | (7,243,516 | ) | | $ | (88,831,053 | ) | | | 7,663,870 | | | $ | 94,454,858 | |
143
GOLDMAN SACHS MULTI-SECTOR FIXED INCOME FUNDS
Notes to Financial Statements (continued)
September 30, 2017 (Unaudited)
|
| 11. SUMMARY OF SHARE TRANSACTIONS (continued) |
| | | | | | | | | | | | | | | | |
| | | Strategic Income Fund | |
| | | | |
| | | For the Six Months Ended
September 30, 2017
(Unaudited) | | | For the Fiscal Year Ended
March 31, 2017 | |
| | | | |
| | | Shares | | | Dollars | | | Shares | | | Dollars | |
| | | | |
| Class A Shares | | | | | | | | | | | | | | | | |
Shares sold | | | 6,181,673 | | | $ | 59,641,469 | | | | 16,582,799 | | | $ | 158,475,200 | |
Reinvestment of distributions | | | 407,042 | | | | 3,918,512 | | | | 1,847,651 | | | | 17,587,116 | |
Shares redeemed | | | (30,721,517 | ) | | | (295,571,799 | ) | | | (98,896,828 | ) | | | (945,007,615 | ) |
| | | | (24,132,802 | ) | | | (232,011,818 | ) | | | (80,466,378 | ) | | | (768,945,299 | ) |
| Class C Shares | | | | | | | | | | | | | | | | |
Shares sold | | | 372,264 | | | | 3,589,707 | | | | 2,159,739 | | | | 20,652,979 | |
Reinvestment of distributions | | | 126,490 | | | | 1,218,412 | | | | 535,471 | | | | 5,096,202 | |
Shares redeemed | | | (10,800,871 | ) | | | (104,131,211 | ) | | | (31,938,967 | ) | | | (304,876,701 | ) |
| | | | (10,302,117 | ) | | | (99,323,092 | ) | | | (29,243,757 | ) | | | (279,127,520 | ) |
| Institutional Shares | | | | | | | | | | | | | | | | |
Shares sold | | | 74,742,537 | | | | 719,871,417 | | | | 147,320,824 | | | | 1,409,295,141 | |
Reinvestment of distributions | | | 4,657,721 | | | | 44,830,929 | | | | 15,268,305 | | | | 145,392,821 | |
Shares redeemed in connection with in-kind | | | — | | | | — | | | | 10,674,967 | | | | 101,387,609 | |
Shares redeemed | | | (168,451,442 | ) | | | (1,623,297,256 | ) | | | (706,992,416 | ) | | | (6,736,638,058 | ) |
| | | | (89,051,184 | ) | | | (858,594,910 | ) | | | (533,728,320 | ) | | | (5,080,562,487 | ) |
| Investor Shares | | | | | | | | | | | | | | | | |
Shares sold | | | 2,317,042 | | | | 22,333,713 | | | | 29,140,003 | | | | 280,732,780 | |
Reinvestment of distributions | | | 267,457 | | | | 2,574,238 | | | | 525,915 | | | | 5,008,127 | |
Shares redeemed | | | (10,848,367 | ) | | | (104,564,716 | ) | | | (29,399,265 | ) | | | (280,250,146 | ) |
| | | | (8,263,868 | ) | | | (79,656,765 | ) | | | 266,653 | | | | 5,490,761 | |
| Class R Shares | | | | | | | | | | | | | | | | |
Shares sold | | | 93,002 | | | | 895,418 | | | | 307,026 | | | | 2,930,731 | |
Reinvestment of distributions | | | 3,618 | | | | 34,801 | | | | 9,166 | | | | 87,277 | |
Shares redeemed | | | (220,926 | ) | | | (2,132,386 | ) | | | (328,210 | ) | | | (3,138,818 | ) |
| | | | (124,306 | ) | | | (1,202,167 | ) | | | (12,018 | ) | | | (120,810 | ) |
| Class R6 Shares | | | | | | | | | | | | | | | | |
Shares sold | | | 833,059 | | | | 8,043,306 | | | | 5,668,464 | | | | 54,875,730 | |
Reinvestment of distributions | | | 47,034 | | | | 452,647 | | | | 42,531 | | | | 405,716 | |
Shares redeemed | | | (2,339,396 | ) | | | (22,594,963 | ) | | | (957,824 | ) | | | (9,179,601 | ) |
| | | | (1,459,303 | ) | | | (14,099,010 | ) | | | 4,753,171 | | | | 46,101,845 | |
NET DECREASE | | | (133,333,580 | ) | | $ | (1,284,887,762 | ) | | | (638,430,649 | ) | | $ | (6,077,163,510 | ) |
144
GOLDMAN SACHS MULTI-SECTOR FIXED INCOME FUNDS
Fund Expenses — Six Month Period Ended September 30, 2017 (Unaudited)
As a shareholder of Class A, Class C, Institutional, Service, Investor, Class R or Class R6 Shares of a Fund, you incur two types of costs: (1) transaction costs, including sales charges on purchase payments (with respect to Class A Shares), contingent deferred sales charges on redemptions (with respect to Class C Shares), and (2) ongoing costs, including management fees; distribution and/or service (12b-1) fees (with respect to Class A, Class C, Service and Class R); and other Fund expenses. This Example is intended to help you understand your ongoing costs (in dollars) of investing in Class A, Class C, Institutional, Service, Investor, Class R or Class R6 Shares of the Funds and to compare these costs with the ongoing costs of investing in other mutual funds.
The Example is based on an investment of $1,000 invested at the beginning of the period and held for the entire period from April 1, 2017 through September 30, 2017, which represents a period of 183 days of a 365 day year.
Actual Expenses — The first line under each share class in the table below provides information about actual account values and actual expenses. You may use the information in this line, together with the amount you invested, to estimate the expenses that you paid over the period. Simply divide your account value by $1,000 (for example, an $8,600 account value divided by $1,000=8.6), then multiply the result by the number in the first line under the heading entitled “Expenses Paid” to estimate the expenses you paid on your account during this period.
Hypothetical Example for Comparison Purposes — The second line under each share class in the table below provides information about hypothetical account values and hypothetical expenses based on the Funds’ actual net expense ratios and an assumed rate of return of 5% per year before expenses, which is not the Funds’ actual return. The hypothetical account values and expenses may not be used to estimate the actual ending account balance or expenses you paid for the period. You may use this information to compare the ongoing costs of investing in the Funds and other funds. To do so, compare this 5% hypothetical example with the 5% hypothetical examples that appear in the shareholder reports of the other funds. Please note that the expenses shown in the table are meant to highlight your ongoing costs only and do not reflect any transactional costs, such as sales charges, redemption fees, or exchange fees. Therefore, the second line of the table is useful in comparing ongoing costs only, and will not help you determine the relative total costs of owning different funds. In addition, if these transactional costs were included, your costs would have been higher.
| | | | | | | | | | | | | | | | | | | | | | | | | | | | | | | | | | | | | | | | | | | | | | | | |
| | | Bond Fund | | | Core Fixed Income Fund | | | Global Income Fund | | | Strategic Income Fund | |
| Share Class | | Beginning
Account
Value
4/1/17 | | | Ending
Account
Value
9/30/17 | | | Expenses
Paid for the
6 months ended
9/30/17(a) | | | Beginning
Account
Value
4/1/17 | | | Ending
Account
Value
9/30/17 | | | Expenses
Paid for the
6 months ended
9/30/17(a) | | | Beginning
Account
Value
4/1/17 | | | Ending
Account
Value
9/30/17 | | | Expenses
Paid for the
6 months ended
9/30/17(a) | | | Beginning
Account
Value
4/1/17 | | | Ending
Account
Value
9/30/17 | | | Expenses
Paid for the
6 months ended
9/30/17(a) | |
| Class A | | | | | | | | | | | | | | | | | | | | | | | | | | | | | | | | | | | | | | | | | | | | | | | | |
Actual | | $ | 1,000.00 | | | $ | 1,017.40 | | | $ | 4.00 | | | $ | 1,000.00 | | | $ | 1,020.80 | | | $ | 4.00 | | | $ | 1,000.00 | | | $ | 1,011.70 | | | $ | 5.19 | | | $ | 1,000.00 | | | $ | 995.80 | | | $ | 4.75 | |
Hypothetical 5% return | | | 1,000.00 | | | | 1,021.11 | (b) | | | 4.00 | | | | 1,000.00 | | | | 1,021.11 | (b) | | | 4.00 | | | | 1,000.00 | | | | 1,019.90 | (b) | | | 5.22 | | | | 1,000.00 | | | | 1,020.31 | (b) | | | 4.81 | |
| Class C | | | | | | | | | | | | | | | | | | | | | | | | | | | | | | | | | | | | | | | | | | | | | | | | |
Actual | | | 1,000.00 | | | | 1,013.60 | | | | 7.77 | | | | 1,000.00 | | | | 1,015.90 | | | | 7.78 | | | | 1,000.00 | | | | 1,008.10 | | | | 8.81 | | | | 1,000.00 | | | | 991.20 | | | | 8.49 | |
Hypothetical 5% return | | | 1,000.00 | | | | 1,017.35 | (b) | | | 7.79 | | | | 1,000.00 | | | | 1,017.35 | (b) | | | 7.79 | | | | 1,000.00 | | | | 1,016.29 | (b) | | | 8.85 | | | | 1,000.00 | | | | 1,016.54 | (b) | | | 8.59 | |
| Institutional | | | | | | | | | | | | | | | | | | | | | | | | | | | | | | | | | | | | | | | | | | | | | | | | |
Actual | | | 1,000.00 | | | | 1,019.10 | | | | 2.28 | | | | 1,000.00 | | | | 1,021.50 | | | | 2.28 | | | | 1,000.00 | | | | 1,013.40 | | | | 3.48 | | | | 1,000.00 | | | | 997.50 | | | | 3.05 | |
Hypothetical 5% return | | | 1,000.00 | | | | 1,022.81 | (b) | | | 2.28 | | | | 1,000.00 | | | | 1,022.81 | (b) | | | 2.28 | | | | 1,000.00 | | | | 1,021.61 | (b) | | | 3.50 | | | | 1,000.00 | | | | 1,022.01 | (b) | | | 3.09 | |
| Service | | | | | | | | | | | | | | | | | | | | | | | | | | | | | | | | | | | | | | | | | | | | | | | | |
Actual | | | 1,000.00 | | | | 1,016.60 | | | | 4.80 | | | | 1,000.00 | | | | 1,018.90 | | | | 4.81 | | | | 1,000.00 | | | | 1,010.90 | | | | 5.95 | | | | N/A | | | | N/A | | | | N/A | |
Hypothetical 5% return | | | 1,000.00 | | | | 1,020.30 | (b) | | | 4.81 | | | | 1,000.00 | | | | 1,020.30 | (b) | | | 4.81 | | | | 1,000.00 | | | | 1,019.15 | (b) | | | 5.97 | | | | N/A | | | | N/A | | | | N/A | |
| Investor | | | | | | | | | | | | | | | | | | | | | | | | | | | | | | | | | | | | | | | | | | | | | | | | |
Actual | | | 1,000.00 | | | | 1,018.70 | | | | 2.73 | | | | 1,000.00 | | | | 1,022.00 | | | | 2.74 | | | | 1,000.00 | | | | 1,012.90 | | | | 3.94 | | | | 1,000.00 | | | | 997.10 | | | | 3.50 | |
Hypothetical 5% return | | | 1,000.00 | | | | 1,022.36 | (b) | | | 2.74 | | | | 1,000.00 | | | | 1,022.36 | (b) | | | 2.74 | | | | 1,000.00 | | | | 1,021.16 | (b) | | | 3.95 | | | | 1,000.00 | | | | 1,021.56 | (b) | | | 3.55 | |
| Class R | | | | | | | | | | | | | | | | | | | | | | | | | | | | | | | | | | | | | | | | | | | | | | | | |
Actual | | | 1,000.00 | | | | 1,016.10 | | | | 5.26 | | | | 1,000.00 | | | | 1,018.50 | | | | 5.26 | | | | N/A | | | | N/A | | | | N/A | | | | 1,000.00 | | | | 993.60 | | | | 6.00 | |
Hypothetical 5% return | | | 1,000.00 | | | | 1,019.85 | (b) | | | 5.27 | | | | 1,000.00 | | | | 1,019.85 | (b) | | | 5.27 | | | | N/A | | | | N/A | | | | N/A | | | | 1,000.00 | | | | 1,019.05 | (b) | | | 6.07 | |
| Class R6 | | | | | | | | | | | | | | | | | | | | | | | | | | | | | | | | | | | | | | | | | | | | | | | | |
Actual | | | 1,000.00 | | | | 1,019.20 | | | | 2.23 | | | | 1,000.00 | | | | 1,022.50 | | | | 2.17 | | | | 1,000.00 | | | | 1,013.40 | | | | 3.43 | | | | 1,000.00 | | | | 997.60 | | | | 3.00 | |
Hypothetical 5% return | | | 1,000.00 | | | | 1,022.86 | (b) | | | 2.23 | | | | 1,000.00 | | | | 1,022.92 | (b) | | | 2.17 | | | | 1,000.00 | | | | 1,021.66 | (b) | | | 3.45 | | | | 1,000.00 | | | | 1,022.06 | (b) | | | 3.04 | |
145
GOLDMAN SACHS MULTI-SECTOR FIXED INCOME FUNDS
Fund Expenses — Six Month Period Ended September 30, 2017 (Unaudited) (continued)
| (a) | | Expenses for each share class are calculated using each Fund’s annualized net expense ratio for each class, which represents the ongoing expenses as a percentage of net assets for the six months ended September 30, 2017. Expenses are calculated by multiplying the annualized net expense ratio by the average account value for the period; then multiplying the result by the number of days in the most recent fiscal half year; and then dividing that result by the number of days in the fiscal year. The annualized net expense ratios for the period were as follows: |
| (b) | | Hypothetical expenses are based on each Fund’s actual annualized net expense ratios and an assumed rate of return of 5% per year before expenses. |
| | | | | | | | | | | | | | | | | | | | | | | | | | | | |
| Fund | | Class A | | | Class C | | | Institutional | | | Service | | | Investor | | | Class R | | | Class R6 | |
Bond+ | | | 0.79 | % | | | 1.54 | % | | | 0.45 | % | | | 0.95 | % | | | 0.54 | % | | | 1.04 | % | | | 0.44 | % |
Core Fixed Income+ | | | 0.79 | | | | 1.54 | | | | 0.45 | | | | 0.95 | | | | 0.54 | | | | 1.04 | | | | 0.43 | |
Global Income+ | | | 1.03 | | | | 1.75 | | | | 0.69 | | | | 1.18 | | | | 0.78 | | | | N/A | | | | 0.68 | |
Strategic Income+ | | | 0.95 | | | | 1.70 | | | | 0.61 | | | | N/A | | | | 0.70 | | | | 1.20 | | | | 0.60 | |
| + | | Hypothetical expenses are based on each Fund’s actual annualized net expense ratios and an assumed rate of return of 5% per year before expenses. |
146
GOLDMAN SACHS MULTI-SECTOR FIXED INCOME FUNDS
Statement Regarding Basis for Approval of Management Agreements (Unaudited)
Background
The Goldman Sachs Bond Fund, Goldman Sachs Core Fixed Income Fund, Goldman Sachs Global Income Fund, and Goldman Sachs Strategic Income Fund (the “Funds”) are investment portfolios of Goldman Sachs Trust (the “Trust”). The Board of Trustees oversees the management of the Trust and reviews the investment performance and expenses of the Funds at regularly scheduled meetings held throughout the year. In addition, the Board of Trustees determines annually whether to approve the continuance of the Trust’s investment management agreements (the “Management Agreements”) on behalf of the Bond, Core Fixed Income, and Strategic Income Funds with Goldman Sachs Asset Management, L.P. (“GSAM”) and on behalf of the Global Income Fund with Goldman Sachs Asset Management International (together with GSAM, the “Investment Advisers”).
The Management Agreements were most recently approved for continuation until June 30, 2018 by the Board of Trustees, including those Trustees who are not parties to the Management Agreements or “interested persons” (as defined in the Investment Company Act of 1940, as amended) of any party thereto (the “Independent Trustees”), at a meeting held on June 14-15, 2017 (the “Annual Meeting”).
The review process undertaken by the Trustees spans the course of the year and culminates with the Annual Meeting. To assist the Trustees in their deliberations, the Trustees have established a Contract Review Committee (the “Committee”), comprised of the Independent Trustees. The Committee held four meetings over the course of the year since the Management Agreements were last approved. At those Committee meetings, regularly scheduled Board or other committee meetings, and/or the Annual Meeting, matters relevant to the renewal of the Management Agreements were considered by the Board, or the Independent Trustees, as applicable. With respect to each Fund, such matters included:
| | (a) | | the nature and quality of the advisory, administrative, and other services provided to the Fund by the Investment Adviser and its affiliates, including information about: |
| | (i) | | the structure, staff, and capabilities of the Investment Adviser and its portfolio management teams; |
| | (ii) | | the groups within the Investment Adviser and its affiliates that support the portfolio management teams or provide other types of necessary services, including fund services groups (e.g., accounting and financial reporting, tax, shareholder services, and operations); controls and risk management groups (e.g., legal, compliance, valuation oversight, credit risk management, internal audit, compliance testing, market risk analysis, finance, and central funding); sales and distribution support groups, and others (e.g., information technology and training); |
| | (iii) | | trends in employee headcount; |
| | (iv) | | the Investment Adviser’s financial resources and ability to hire and retain talented personnel and strengthen its operations; and |
| | (v) | | the parent company’s support of the Investment Adviser and its mutual fund business, as expressed by the firm’s senior management; |
| | (b) | | information on the investment performance of the Fund, including comparisons to the performance of similar mutual funds, as provided by a third-party mutual fund data provider engaged as part of the contract review process (the “Outside Data Provider”), a benchmark performance index, and, (in the case of the Strategic Income Fund), a composite of accounts with comparable investment strategies managed by the Investment Adviser; and information on general investment outlooks in the markets in which the Fund invests; |
| | (c) | | information provided by the Investment Adviser indicating the Investment Adviser’s views on whether the Fund’s peer group and/or benchmark index had high, medium, or low relevance given the Fund’s particular investment strategy; |
| | (d) | | the terms of the Management Agreement and other agreements with affiliated service providers entered into by the Trust on behalf of the Fund; |
| | (e) | | fee and expense information for the Fund, including: |
| | (i) | | the relative management fee and expense levels of the Fund as compared to those of comparable funds managed by other advisers, as provided by the Outside Data Provider; |
| | (ii) | | the Fund’s expense trends over time; and |
147
GOLDMAN SACHS MULTI-SECTOR FIXED INCOME FUNDS
Statement Regarding Basis for Approval of Management Agreements (Unaudited) (continued)
| | (iii) | | to the extent the Investment Adviser manages other types of accounts (such as bank collective trusts, private wealth management accounts, institutional separate accounts, sub-advised mutual funds, and non-U.S. funds) having investment objectives and policies similar to those of the Fund, comparative information on the advisory fees charged and services provided to those accounts by the Investment Adviser; |
| | (f) | | with respect to the extensive investment performance and expense comparison data provided by the Outside Data Provider, its processes in producing that data for the Fund; |
| | (g) | | the undertakings of the Investment Adviser and its affiliates to implement fee waivers and/or expense limitations; |
| | (h) | | information relating to the profitability of the Management Agreement and the transfer agency and distribution and service arrangements of the Fund to the Investment Adviser and its affiliates; |
| | (i) | | whether the Fund’s existing management fee schedule adequately addressed any economies of scale; |
| | (j) | | a summary of the “fall-out” benefits derived by the Investment Adviser and its affiliates from their relationships with the Fund, including the fees received by the Investment Adviser’s affiliates from the Fund for transfer agency, portfolio trading, distribution and other services; |
| | (k) | | a summary of potential benefits derived by the Fund as a result of its relationship with the Investment Adviser; |
| | (l) | | information regarding portfolio trading and how the Investment Adviser carries out its duty to seek best execution; |
| | (m) | | portfolio manager ownership of Fund shares; the manner in which portfolio manager compensation is determined; and the number and types of accounts managed by the portfolio managers; |
| | (n) | | the nature and quality of the services provided to the Fund by its unaffiliated service providers, and the Investment Adviser’s general oversight and evaluation (including reports on due diligence) of those service providers as part of the administrative services provided under the Management Agreement; and |
| | (o) | | the Investment Adviser’s processes and policies addressing various types of potential conflicts of interest; its approach to risk management; the annual review of the effectiveness of the Fund’s compliance program; and periodic compliance reports. |
The Trustees also received an overview of the Funds’ distribution arrangements. They received information regarding the Funds’ assets, share purchase and redemption activity, and payment of distribution, service, and shareholder administration fees, as applicable. Information was also provided to the Trustees relating to revenue sharing payments made by and services provided by the Investment Advisers and their affiliates to intermediaries that promote the sale, distribution, and/or servicing of Fund shares. The Independent Trustees also discussed the broad range of other investment choices that are available to Fund investors, including the availability of comparable funds managed by other advisers.
The presentations made at the Board and Committee meetings and at the Annual Meeting encompassed the Funds and other mutual funds for which the Board of Trustees has responsibility. In evaluating the Management Agreements at the Annual Meeting, the Trustees relied upon their knowledge, resulting from their meetings and other interactions throughout the year, of the Investment Advisers and their affiliates, their services, and the Funds. In conjunction with these meetings, the Trustees received written materials and oral presentations on the topics covered, and the Investment Advisers addressed the questions and concerns of the Trustees, including concerns regarding the investment performance of certain of the funds they oversee. The Independent Trustees were advised by their independent legal counsel regarding their responsibilities and other regulatory requirements related to the approval and continuation of mutual fund investment management agreements under applicable law. In addition, the Investment Advisers and their affiliates provided the Independent Trustees with a written response to a formal request for information sent on behalf of the Independent Trustees by their independent legal counsel. During the course of their deliberations, the Independent Trustees met in executive sessions with their independent legal counsel, without representatives of the Investment Advisers or their affiliates present.
148
GOLDMAN SACHS MULTI-SECTOR FIXED INCOME FUNDS
Statement Regarding Basis for Approval of Management Agreements (Unaudited) (continued)
Nature, Extent, and Quality of the Services Provided Under the Management Agreements
As part of their review, the Trustees considered the nature, extent, and quality of the services provided to the Funds by the Investment Advisers. In this regard, the Trustees considered both the investment advisory services and non-advisory services that are provided by the Investment Advisers and their affiliates. The Trustees noted the transition in the leadership and changes in personnel of various of the Investment Advisers’ portfolio management teams that had occurred in recent periods, and the ongoing recruitment efforts aimed at bringing high quality investment talent to the Investment Advisers. They also noted the Investment Advisers’ commitment to maintaining high quality systems and expending substantial resources to respond to ongoing changes to the regulatory and control environment in which the Funds and their service providers operate, as well as the efforts of the Investment Advisers and their affiliates to combat cyber security risks. The Trustees concluded that the Investment Advisers continued to commit substantial financial and operational resources to the Funds and expressed confidence that the Investment Advisers would continue to do so in the future. The Trustees also recognized that the Investment Advisers had made significant commitments to address regulatory compliance requirements applicable to the Funds and the Investment Advisers and their affiliates.
Investment Performance
The Trustees also considered the investment performance of the Funds. In this regard, they compared the investment performance of each Fund to its peers using rankings and ratings compiled by the Outside Data Provider as of December 31, 2016, and updated performance information prepared by the Investment Advisers using the peer group identified by the Outside Data Provider as of March 31, 2017. The information on each Fund’s investment performance was provided for the one-, three-, five-, and ten-year periods ending on the applicable dates, to the extent that each Fund had been in existence for those periods. The Trustees also reviewed each Fund’s investment performance relative to its performance benchmark. As part of this review, they considered the investment performance trends of the Funds over time, and reviewed the investment performance of each Fund in light of its investment objective and policies and market conditions. The Trustees also received information comparing the Strategic Income Fund’s performance to that of a composite of accounts with comparable investment strategies managed by GSAM.
In addition, the Trustees considered materials prepared and presentations made by the Investment Advisers’ senior management and portfolio management personnel in which Fund performance was assessed. The Trustees also considered the Investment Advisers’ periodic reports with respect to the Funds’ risk profiles, and how the Investment Advisers’ approach to risk monitoring and management influences portfolio management.
The Trustees observed that the Bond Fund’s Institutional Shares had placed in the top half of the Fund’s peer group for the three-, five-, and ten-year periods and in the third quartile for the one-year period, and had outperformed the Fund’s benchmark index for the one-, three-, five-, and ten-year periods ended March 31, 2017. They noted that the Core Fixed Income Fund’s Institutional Shares had placed in the second quartile of the Fund’s peer group for the three- and five-year periods and in the third quartile for the one- and ten-year periods, and had outperformed the Fund’s benchmark index for the one-, three-, and five-year periods and underperformed for the ten-year period ended March 31, 2017. The Trustees noted that the Global Income Fund’s Institutional Shares had placed in the top half of the Fund’s peer group for the one-, three-, five-, and ten-year periods, and had outperformed the Fund’s benchmark index for the one-, five-, and ten-year periods and underperformed for the three-year period ended March 31, 2017. They observed that the Strategic Income Fund’s Institutional Shares had placed in the second quartile of the Fund’s peer group for the five-year period, in the third quartile for the one-year period, and in the fourth quartile for the three-year period; had outperformed the Fund’s LIBOR-based benchmark index by 4.45% and 2.72%, respectively, for the one- and five-year periods and underperformed by 0.31% for the three-year period; and had underperformed the average performance of a group of competitor funds, as determined by GSAM, for the one-, three-, and five-year periods ended March 31, 2017.
149
GOLDMAN SACHS MULTI-SECTOR FIXED INCOME FUNDS
Statement Regarding Basis for Approval of Management Agreements (Unaudited) (continued)
Costs of Services Provided and Competitive Information
The Trustees considered the contractual terms of the Management Agreements and the fee rates payable by each Fund under its respective Management Agreement. In this regard, the Trustees considered information on the services rendered by the Investment Advisers to the Funds, which included both advisory and administrative services that were directed to the needs and operations of the Funds as registered mutual funds.
In particular, the Trustees reviewed analyses prepared by the Outside Data Provider regarding the expense rankings of the Funds. The analyses provided a comparison of each Fund’s management fee and breakpoints to those of a relevant peer group and category universe; an expense analysis which compared each Fund’s overall net and gross expenses to a peer group and a category universe; and data comparing each Fund’s net expenses to the peer and category medians. The analyses also compared each Fund’s transfer agency, custody, and distribution fees, other expenses and fee waivers/reimbursements to those of the peer group and category medians. The Trustees concluded that the comparisons provided by the Outside Data Provider were useful in evaluating the reasonableness of the management fees and total expenses paid by the Funds.
With respect to the Bond Fund, the Trustees noted that the management fee breakpoint schedule was being reduced at all asset levels. In addition, the Trustees considered the Investment Advisers’ undertakings to implement fee waivers and/or expense limitations. They also considered, to the extent that the Investment Advisers manage other types of accounts having investment objectives and policies similar to those of the Funds, comparative fee information for services provided by the Investment Advisers to those accounts, and information that indicated that services provided to the Funds differed in various significant respects from the services provided to other types of accounts which, in many cases, operated under less stringent legal and regulatory structures, required fewer services from the Investment Advisers to a smaller number of client contact points, and were less time-intensive.
In addition, the Trustees noted that shareholders are able to redeem their Fund shares at any time if shareholders believe that the Fund fees and expenses are too high or if they are dissatisfied with the performance of the Fund.
Profitability
The Trustees reviewed each Fund’s contribution to the Investment Advisers’ revenues and pre-tax profit margins. In this regard the Trustees noted that they had received, among other things, profitability analyses and summaries, revenue and expense schedules by Fund and by function (i.e., investment management, transfer agency and distribution and service), and information on the Investment Advisers’ expense allocation methodology. They observed that the profitability and expense figures are substantially similar to those used by the Investment Advisers for many internal purposes, including compensation decisions among various business groups, and are thus subject to a vigorous internal debate about how certain revenue and expenses should be allocated. The Trustees also noted that the internal audit group within the Goldman Sachs organization had audited the expense allocation methodology and that the internal audit group was satisfied with the reasonableness, consistency, and accuracy of the Investment Advisers’ expense allocation methodology and profitability analysis calculations. Profitability data for each Fund was provided for 2016 and 2015, and the Trustees considered this information in relation to the Investment Advisers’ overall profitability.
150
GOLDMAN SACHS MULTI-SECTOR FIXED INCOME FUNDS
Statement Regarding Basis for Approval of Management Agreements (Unaudited) (continued)
Economies of Scale
The Trustees considered the information that had been provided regarding the Investment Advisers’ profitability. The Trustees also considered the breakpoints in the fee rate payable under the Management Agreements for each of the Funds at the following annual percentage rates of the average daily net assets of the Funds:
| | | | | | | | | | | | | | | | |
Average Daily Net Assets | | Bond Fund | | | Core Fixed
Income Fund | | | Global Income Fund | | | Strategic Income Fund | |
| First $1 billion | | | 0.45 | % | | | 0.40 | % | | | 0.65 | % | | | 0.60 | % |
| Next $1 billion | | | 0.41 | | | | 0.36 | | | | 0.59 | | | | 0.54 | |
| Next $3 billion | | | 0.39 | | | | 0.34 | | | | 0.56 | | | | 0.51 | |
| Next $3 billion | | | 0.38 | | | | 0.33 | | | | 0.55 | | | | 0.50 | |
| Over $8 billion | | | 0.37 | | | | 0.32 | | | | 0.54 | | | | 0.49 | |
The Trustees noted that the breakpoints were designed to share potential economies of scale, if any, with the Funds and their shareholders as assets under management reach those asset levels. The Trustees considered the amounts of assets in the Funds; the Funds’ recent share purchase and redemption activity; the information provided by the Investment Advisers relating to the costs of the services provided by the Investment Advisers and their affiliates and their realized profits; information comparing fee rates charged by the Investment Advisers with fee rates charged to other funds in the peer groups; and GSAM’s undertaking to waive a portion of its management fee (with respect to the Bond Fund) and the Investment Advisers’ undertakings to limit certain expenses of each Fund that exceed specified levels. Upon reviewing these matters at the Annual Meeting, the Trustees concluded that the fee breakpoints represented a means of assuring that benefits of scalability, if any, would be passed along to shareholders at the specified asset levels. They also noted that GSAM had passed along savings to shareholders of the Strategic Income Fund, which had asset levels above at least the first breakpoint during the prior fiscal year.
Other Benefits to the Investment Advisers and Their Affiliates
The Trustees also considered the other benefits derived by the Investment Advisers and their affiliates from their relationships with the Funds as stated above, including: (a) transfer agency fees received by Goldman Sachs & Co. LLC (“Goldman Sachs”); (b) futures commissions earned by Goldman Sachs for executing futures transactions on behalf of the Funds; (c) trading efficiencies resulting from aggregation of orders of the Funds with those for other funds or accounts managed by the Investment Advisers; (d) the Investment Advisers’ ability to leverage the infrastructure designed to service the Funds on behalf of their other clients; (e) the Investment Advisers’ ability to cross-market other products and services to Fund shareholders; (f) Goldman Sachs’ retention of certain fees as Fund Distributor; (g) the Investment Advisers’ ability to negotiate better pricing with custodians on behalf of their other clients, as a result of the relationship with the Funds; and (h) the possibility that the working relationship between the Investment Advisers and the Funds’ third-party service providers may cause those service providers to be more likely to do business with other areas of Goldman Sachs. In the course of considering the foregoing, the Independent Trustees requested and received further information quantifying certain of these fall-out benefits.
151
GOLDMAN SACHS MULTI-SECTOR FIXED INCOME FUNDS
Statement Regarding Basis for Approval of Management Agreements (Unaudited) (continued)
Other Benefits to the Funds and Their Shareholders
The Trustees also noted that the Funds receive certain potential benefits as a result of their relationship with the Investment Advisers, including: (a) trading efficiencies resulting from aggregation of orders of the Funds with those of other funds or accounts managed by the Investment Advisers; (b) enhanced servicing from vendors because of the volume of business generated by the Investment Advisers and their affiliates; (c) enhanced servicing from broker-dealers because of the volume of business generated by the Investment Advisers and their affiliates; (d) the Investment Advisers’ ability to negotiate favorable terms with derivatives counterparties on behalf of the Funds as a result of the size and reputation of the Goldman Sachs organization; (e) the Investment Advisers’ knowledge and experience gained from managing other accounts and products; (f) the Investment Advisers’ ability to hire and retain qualified personnel to provide services to the Funds because of the reputation of the Goldman Sachs organization; (g) the Funds’ access, through the Investment Advisers, to certain firmwide resources (e.g., proprietary risk management systems and databases), subject to certain restrictions; and (h) the Funds’ access to certain affiliated distribution channels. In addition, the Trustees noted the competitive nature of the mutual fund marketplace, and considered that many of the Funds’ shareholders invested in the Funds in part because of the Funds’ relationship with the Investment Advisers and that those shareholders have a general expectation that the relationship will continue.
Conclusion
In connection with their consideration of the Management Agreements, the Trustees gave weight to each of the factors described above, but did not identify any particular factor as controlling their decision. After deliberation and consideration of all of the information provided, including the factors described above, the Trustees concluded, in the exercise of their business judgment, that the management fees paid by each of the Funds were reasonable in light of the services provided to it by its respective Investment Adviser, the Investment Advisers’ costs and each Fund’s current and reasonably foreseeable asset levels. The Trustees unanimously concluded that the Investment Advisers’ continued management likely would benefit each applicable Fund and its shareholders and that the Management Agreements should be approved and continued with respect to each applicable Fund until June 30, 2018.
152
FUNDS PROFILE
Goldman Sachs Funds
Goldman Sachs is a premier financial services firm, known since 1869 for creating thoughtful and customized investment solutions in complex global markets.
Today, the Investment Management Division of Goldman Sachs serves a diverse set of clients worldwide, including private institutions, public entities and individuals. With approximately $1.25 Trillion in assets under supervision as of September 30, 2017, Goldman Sachs Asset Management (“GSAM”) has portfolio management teams located around the world and our investment professionals bring firsthand knowledge of local markets to every investment decision. Assets under supervision includes assets under management and other client assets for which Goldman Sachs does not have full discretion. GSAM leverages the resources of Goldman Sachs & Co. LLC subject to legal, internal and regulatory restrictions.
Money Market
Financial Square FundsSM
| ∎ | | Financial Square Treasury Solutions Fund1 |
| ∎ | | Financial Square Government Fund1 |
| ∎ | | Financial Square Money Market Fund2 |
| ∎ | | Financial Square Prime Obligations Fund2 |
| ∎ | | Financial Square Treasury Instruments Fund1 |
| ∎ | | Financial Square Treasury Obligations Fund1 |
| ∎ | | Financial Square Federal Instruments Fund1 |
| ∎ | | Financial Square Tax-Exempt Money Market Fund2 |
Investor FundsSM
| ∎ | | Investor Money Market Fund3 |
| ∎ | | Investor Tax-Exempt Money Market Fund3 |
Fixed Income
Short Duration and Government
| ∎ | | High Quality Floating Rate Fund |
| ∎ | | Short-Term Conservative Income Fund |
| ∎ | | Short Duration Government Fund |
| ∎ | | Short Duration Income Fund |
| ∎ | | Inflation Protected Securities Fund |
Multi-Sector
Municipal and Tax-Free
| ∎ | | High Yield Municipal Fund |
| ∎ | | Dynamic Municipal Income Fund |
| ∎ | | Short Duration Tax-Free Fund |
Single Sector
| ∎ | | Investment Grade Credit Fund |
| ∎ | | High Yield Floating Rate Fund |
| ∎ | | Emerging Markets Debt Fund |
| ∎ | | Local Emerging Markets Debt Fund |
| ∎ | | Dynamic Emerging Markets Debt Fund |
Fixed Income Alternatives
| ∎ | | Long Short Credit Strategies Fund |
Fundamental Equity
| ∎ | | Small/Mid Cap Value Fund |
| ∎ | | Small/Mid Cap Growth Fund |
| ∎ | | Concentrated Growth Fund7 |
| ∎ | | Technology Opportunities Fund |
| ∎ | | Growth Opportunities Fund |
| ∎ | | Rising Dividend Growth Fund |
Tax-Advantaged Equity
| ∎ | | U.S. Tax-Managed Equity Fund |
| ∎ | | International Tax-Managed Equity Fund |
| ∎ | | U.S. Equity Dividend and Premium Fund |
| ∎ | | International Equity Dividend and Premium Fund |
Equity Insights
| ∎ | | Small Cap Equity Insights Fund |
| ∎ | | U.S. Equity Insights Fund |
| ∎ | | Small Cap Growth Insights Fund |
| ∎ | | Large Cap Growth Insights Fund |
| ∎ | | Large Cap Value Insights Fund |
| ∎ | | Small Cap Value Insights Fund |
| ∎ | | International Small Cap Insights Fund |
| ∎ | | International Equity Insights Fund |
| ∎ | | Emerging Markets Equity Insights Fund |
Fundamental Equity International
| ∎ | | Strategic International Equity Fund |
| ∎ | | Focused International Equity Fund |
| ∎ | | Emerging Markets Equity Fund |
Select Satellite
| ∎ | | Real Estate Securities Fund |
| ∎ | | International Real Estate Securities Fund |
| ∎ | | Commodity Strategy Fund |
| ∎ | | Global Real Estate Securities Fund |
| ∎ | | Alternative Premia Fund9 |
| ∎ | | Absolute Return Tracker Fund |
| ∎ | | Managed Futures Strategy Fund |
| ∎ | | MLP Energy Infrastructure Fund |
| ∎ | | Multi-Manager Alternatives Fund |
| ∎ | | Absolute Return Multi-Asset Fund |
| ∎ | | Global Infrastructure Fund |
Total Portfolio Solutions
| ∎ | | Global Managed Beta Fund |
| ∎ | | Multi-Manager Non-Core Fixed Income Fund |
| ∎ | | Multi-Manager U.S. Dynamic Equity Fund |
| ∎ | | Multi-Manager Global Equity Fund |
| ∎ | | Multi-Manager International Equity Fund |
| ∎ | | Tactical Tilt Overlay Fund |
| ∎ | | Balanced Strategy Portfolio |
| ∎ | | Multi-Manager U.S. Small Cap Equity Fund |
| ∎ | | Multi-Manager Real Assets Strategy Fund |
| ∎ | | Growth and Income Strategy Portfolio |
| ∎ | | Growth Strategy Portfolio |
| ∎ | | Equity Growth Strategy Portfolio |
| ∎ | | Satellite Strategies Portfolio |
| ∎ | | Enhanced Dividend Global Equity Portfolio |
| ∎ | | Tax-Advantaged Global Equity Portfolio |
| ∎ | | Strategic Factor Allocation Fund |
| ∎ | | Target Date 2020 Portfolio |
| ∎ | | Target Date 2025 Portfolio |
| ∎ | | Target Date 2030 Portfolio |
| ∎ | | Target Date 2035 Portfolio |
| ∎ | | Target Date 2040 Portfolio |
| ∎ | | Target Date 2045 Portfolio |
| ∎ | | Target Date 2050 Portfolio |
| ∎ | | Target Date 2055 Portfolio |
| ∎ | | GQG Partners International Opportunities Fund |
| 1 | | You could lose money by investing in the Fund. Although the Fund seeks to preserve the value of your investment at $1.00 per share, it cannot guarantee it will do so. An investment in the Fund is not a deposit of a bank and is not insured or guaranteed by the Federal Deposit Insurance Corporation or any other government agency. The Fund’s sponsor has no legal obligation to provide financial support to the Fund, and you should not expect that the sponsor will provide financial support to the Fund at any time. |
| 2 | | You could lose money by investing in the Fund. Because the share price of the Fund will fluctuate, when you sell your shares they may be worth more or less than what you originally paid for them. The Fund may impose a fee upon sale of your shares or may temporarily suspend your ability to sell shares if the Fund’s liquidity falls below required minimums because of market conditions or other factors. An investment in the Fund is not a deposit of a bank and is not insured or guaranteed by the Federal Deposit Insurance Corporation or any other government agency. The Fund’s sponsor has no legal obligation to provide financial support to the Fund, and you should not expect that the sponsor will provide financial support to the Fund at any time. |
| 3 | | You could lose money by investing in the Fund. Although the Fund seeks to preserve the value of your investment at $1.00 per share, it cannot guarantee it will do so. The Fund may impose a fee upon sale of your shares or may temporarily suspend your ability to sell shares if the Fund’s liquidity falls below required minimums because of market conditions or other factors. An investment in the Fund is not a deposit of a bank and is not insured or guaranteed by the Federal Deposit Insurance Corporation or any other government agency. The Fund’s sponsor has no legal obligation to provide financial support to the Fund, and you should not expect that the sponsor will provide financial support to the Fund at any time. |
| 4 | | Effective on June 20, 2017, the Goldman Sachs Fixed Income Macro Strategies Fund was renamed the Goldman Sachs Strategic Macro Fund. |
| 5 | | Effective on June 20, 2017, the Goldman Sachs Growth and Income Fund was renamed the Goldman Sachs Equity Income Fund. |
| 6 | | Effective after the close of business on August 31, 2017, the Goldman Sachs Flexible Cap Growth Fund was renamed the Goldman Sachs Flexible Cap Fund. |
| 7 | | Effective on July 28, 2017, the Goldman Sachs Focused Growth Fund was reorganized with and into the Goldman Sachs Concentrated Growth Fund. |
| 8 | | Effective after the close of business on October 31, 2017, the Goldman Sachs Dynamic U.S. Equity Fund was renamed the Goldman Sachs Blue Chip Fund. |
| 9 | | Effective after the close of business on October 30, 2017, the Goldman Sachs Dynamic Allocation Fund was renamed the Goldman Sachs Alternative Premia Fund. Financial Square FundsSM and Investor FundsSM are registered service marks of Goldman Sachs & Co. LLC. |
| *This | | list covers open-end funds only. Please visit our website at www.GSAMFUNDS.com to learn about our closed-end funds and exchange-traded funds. |
| | |
TRUSTEES Ashok N. Bakhru, Chairman Kathryn A. Cassidy Diana M. Daniels Herbert J. Markley James A. McNamara Jessica Palmer Roy W. Templin Gregory G. Weaver | | OFFICERS James A. McNamara, President Scott M. McHugh, Principal Financial Officer, Senior Vice President and Treasurer Joseph F. DiMaria, Assistant Treasurer and Principal Accounting Officer Caroline Kraus, Secretary |
| |
| | GOLDMAN SACHS ASSET MANAGEMENT INTERNATIONAL Investment Adviser |
| |
GOLDMAN SACHS & CO. LLC Distributor and Transfer Agent | | GOLDMAN SACHS ASSET MANAGEMENT, L.P. Investment Adviser |
Visit our web site at www.GSAMFUNDS.com to obtain the most recent month-end returns.
Goldman Sachs Asset Management, L.P., 200 West Street, New York, New York 10282
The reports concerning the Funds included in this shareholder report may contain certain forward-looking statements about the factors that may affect the performance of the Funds in the future. These statements are based on Fund management’s predictions and expectations concerning certain future events and their expected impact on the Funds, such as performance of the economy as a whole and of specific industry sectors, changes in the levels of interest rates, the impact of developing world events, and other factors that may influence the future performance of the Funds. Management believes these forward-looking statements to be reasonable, although they are inherently uncertain and difficult to predict. Actual events may cause adjustments in portfolio management strategies from those currently expected to be employed.
A description of the policies and procedures that the Funds use to determine how to vote proxies relating to portfolio securities and information regarding how a Fund voted proxies relating to portfolio securities during the most recent 12-month period ended June 30 is available (I) without charge, upon request by calling 1-800-526-7384 (for Retail Shareholders) or 1-800-621-2550 (for Institutional Shareholders); and (II) on the Securities and Exchange Commission (“SEC”) web site at http://www.sec.gov.
The Funds file their complete schedule of portfolio holdings with the SEC for the first and third quarters of each fiscal year on Form N-Q. The Funds’ Forms N-Q are available on the SEC’s web site at http://www.sec.gov within 60 days after the Funds’ first and third fiscal quarters. The Funds’ Forms N-Q may be reviewed and copied at the SEC’s Public Reference Room in Washington, D.C., and information on the operation of the Public Reference Room may be obtained by calling 1-800-SEC-0330. Forms N-Q may be obtained upon request and without charge by calling 1-800-526-7384 (for Retail Shareholders) or 1-800-621-2550 (for Institutional Shareholders).
Goldman Sachs & Co. LLC (“Goldman Sachs”) does not provide legal, tax or accounting advice. Any statement contained in this communication (including any attachments) concerning U.S. tax matters was not intended or written to be used, and cannot be used, for the purpose of avoiding penalties under the Internal Revenue Code, and was written to support the promotion or marketing of the transaction(s) or matter(s) addressed. Clients of Goldman Sachs should obtain their own independent tax advice based on their particular circumstances.
Economic and market forecasts presented herein reflect our judgment as of the date of this presentation and are subject to change without notice. These forecasts do not take into account the specific investment objectives, restrictions, tax and financial situation or other needs of any specific client. Actual data will vary and may not be reflected here. These forecasts are subject to high levels of uncertainty that may affect actual performance. Accordingly, these forecasts should be viewed as merely representative of a broad range of possible outcomes. These forecasts are estimated, based on assumptions, and are subject to significant revision and may change materially as economic and market conditions change. Goldman Sachs has no obligation to provide updates or changes to these forecasts. Case studies and examples are for illustrative purposes only.
Fund holdings and allocations shown are as of September 30, 2017 and may not be representative of future investments. Fund holdings should not be relied on in making investment decisions and should not be construed as research or investment advice regarding particular securities.
THIS MATERIAL IS FOR INFORMATIONAL PURPOSES ONLY AND IS PROVIDED SOLELY ON THE BASIS THAT IT WILL NOT CONSTITUTE INVESTMENT OR OTHER ADVICE OR A RECOMMENDATION RELATING TO ANY PERSON’S OR PLAN’S INVESTMENT OR OTHER DECISIONS, AND GOLDMAN SACHS IS NOT A FIDUCIARY OR ADVISOR WITH RESPECT TO ANY PERSON OR PLAN BY REASON OF PROVIDING THE MATERIAL OR CONTENT HEREIN INCLUDING UNDER THE EMPLOYEE RETIREMENT INCOME SECURITY ACT OF 1974 OR DEPARTMENT OF LABOR REGULATIONS. PLAN SPONSORS AND OTHER FIDUCIARIES SHOULD CONSIDER THEIR OWN CIRCUMSTANCES IN ASSESSING ANY POTENTIAL COURSE OF ACTION.
This material is not authorized for distribution to prospective investors unless preceded or accompanied by a current Prospectus or summary prospectus, if applicable. Investors should consider a Fund’s objective, risks, and charges and expenses, and read the summary prospectus, if available, and/or the Prospectus carefully before investing or sending money. The summary prospectus, if available, and the Prospectus contain this and other information about a Fund and may be obtained from your authorized dealer or from Goldman Sachs & Co. LLC by calling (retail – 1-800-526-7384) (institutional – 1-800-621-2550).
Copyright 2017 Goldman Sachs & Co. LLC All rights reserved. 110551-OTU-651518 MSFISAR-17 / 77K
Goldman Sachs Funds

| | | | |
| | |
| Semi-Annual Report | | | | September 30, 2017 |
| | |
| | | | Municipal Fixed Income Funds |
| | | | Dynamic Municipal Income |
| | | | High Yield Municipal |
| | | | Short Duration Tax-Free |

Goldman Sachs Municipal Fixed Income Funds
| ∎ | | DYNAMIC MUNICIPAL INCOME |
| ∎ | | SHORT DURATION TAX-FREE |
| | | | |
| | | |
| NOT FDIC-INSURED | | May Lose Value | | No Bank Guarantee |
GOLDMAN SACHS MUNICIPAL FIXED INCOME FUNDS
What Differentiates the Goldman Sachs Asset Management Fixed Income Investment Process?
At Goldman Sachs Asset Management, L.P. (“GSAM”), the goal of our fixed income investment process is to provide consistent, strong performance by actively managing our portfolios within a research-intensive, risk-managed framework.
A key element of our fixed income investment philosophy is to evaluate the broadest global opportunity set to capture relative value across sectors and instruments. Our globally integrated investment process involves managing dynamically along the risk/return spectrum, as we continue to develop value-added strategies through:

| ∎ | | Assess relative value among securities and sectors |
| ∎ | | Leverage the vast resources of GSAM in selecting securities for each portfolio |

| ∎ | | Team approach to decision making |
| ∎ | | Manage risk by avoiding significant sector and interest rate bets |
| ∎ | | Careful management of yield curve strategies — while closely managing portfolio duration |

Fixed Income portfolios that:
| | ∎ | | Include domestic investment options, tax-free income opportunities, and access to areas of specialization such as high yield securities | |
| | ∎ | | Capitalize on GSAM’s industry-renowned credit research capabilities | |
| | ∎ | | Use a risk-managed framework to seek total return, recognizing the importance of investors’ capital accumulation goals as well as their need for income | |
1
MARKET REVIEW
Goldman Sachs Municipal Fixed Income Funds
Market Review
The municipal bond market generated positive returns during the six months ended September 30, 2017 (the “Reporting Period”), driven by a flattening municipal bond yield curve and supportive supply and demand dynamics. (Yield curve indicates a spectrum of maturities. A flattening yield curve means the differential in yields between longer-term and shorter-term maturities decreased; opposite of steepening yield curve.)
When the Reporting Period began in the second quarter of 2017, municipal bond prices fell, and the yield curve steepened. Yields continued to rise as the market anticipated pro-growth policies from the new Administration in Washington, D.C. However, during the rest of the Reporting Period, concerns about the Federal Reserve’s (the “Fed”) interest rate policy and strengthening market technicals, or supply and demand factors, drove down municipal bond yields, which pushed up prices, and the yield curve flattened. Municipal bond yields were also pressured by signs that the Administration’s policy agenda may not be quickly implemented.
Shorter-term municipal yields (as represented by two-year maturities) fell during the Reporting Period overall, and longer-term municipal yields fell even more. As a result, the municipal yield curve flattened. The yield on a two-year AAA-rated municipal security decreased two basis points to 1.00%; the yield on a 10-year AAA-rated municipal security fell 25 basis points to 2.00%; and the yield on a 30-year AAA-rated municipal security decreased 21 basis points to 2.84%. (A basis point is 1/100th of a percentage point.) By comparison, the yield on a two-year U.S. Treasury security rose 23 basis points to 1.48%; the yield on a 10-year U.S. Treasury fell six basis points to 2.33%; and the yield on a 30-year U.S. Treasury security decreased 15 basis points to 2.86%. (Sources: GSAM, MMD and Bloomberg.)
During the Reporting Period, supply and demand factors had a positive impact on the municipal bond prices with net negative supply especially supportive during the summer of 2017. (Net negative supply means more bonds matured or were redeemed than were issued.) Primary market issuance dropped, with approximately $194 billion of new supply, and demand strengthened. Municipal bond mutual funds saw average investment inflows of $524 million per week during the Reporting Period. (Source: Lipper.)
Regarding individual credits, Illinois passed a full-year budget during the Reporting Period. The state had not had a full-year budget since fiscal 2015 due to political infighting within its General Assembly. Amongst other matters, the Democratic majority in the Illinois House and Senate had been vying over an increase in the state’s income tax to help eliminate Illinois’ structural budgetary imbalance, pay off a significant backlog of past due bills and stabilize the state’s financial position. The Republican governor, who ran on an anti-tax platform, vowed to back such an increase but only if various political and economic reforms were authorized in return. For nearly two years, lawmakers were not able to reach a compromise. During that time, Illinois was downgraded multiple times by credit rating agencies, and consequently, its borrowing costs escalated compared to other states. On July 6, 2017, the Illinois House overrode a budget veto by the governor to end the budget impasse. Illinois municipal bonds rallied leading up to and after the passing of the budget. The end of the budget impasse was an important step for Illinois in stabilizing its fiscal position. That said, long-term financial challenges remain in terms of the state paying down its backlog of past due bills and in managing the projected growth of pension obligations.
2
MARKET REVIEW
High Yield Municipals
During the Reporting Period, the high yield municipal bond market slightly outperformed the investment grade municipal bond market. The main drivers of outperformance were general obligation bonds and water and sewer bonds. Both segments rose by more than 7%, as measured by the Bloomberg Barclays High Yield Municipal Bond Index, during the Reporting Period. As a result of ongoing government negotiations and natural disasters, Puerto Rico’s municipal bonds significantly trailed the Bloomberg Barclays High Yield Municipal Index for the Reporting Period as a whole.
Looking Ahead
At the end of the Reporting Period, municipal bond market technicals were mixed, in our view, with both supply and demand increasing. We believe Fed monetary policy and potential additional interest rate hikes could weigh on the market in the near term. That said, we also think higher interest rates could make the tax-exempt benefits of municipal bonds even more attractive and could boost the relative performance of the asset class. In addition, while tax reform is a key part of the Administration’s policy agenda, there has not been sufficient detail to understand what impact it might have on the municipal bond market. We expect uncertainty on this issue to create some market volatility in the coming months. Meanwhile, we anticipate an increase in infrastructure investment by states and municipalities, and we expect their governments to take advantage of continued low interest rates to issue debt. We also expect to see more headlines around pension cost escalation, as this remains a serious challenge for some states and localities.
In the months ahead, we intend to maintain our approach in which we focus on seeking attractive risk/return opportunities across maturities along the municipal bond yield curve and inclusive of all credit qualities. We will continue seeking to keep the Goldman Sachs Municipal Fixed Income Funds invested in the most tax-efficient manner.
3
PORTFOLIO RESULTS
Goldman Sachs Dynamic Municipal Income Fund
Investment Objective
The Fund seeks a high level of current income that is exempt from regular federal income tax.
Portfolio Management Discussion and Analysis
Below, the Goldman Sachs Municipal Fixed Income Investment Management Team discusses the Goldman Sachs Dynamic Municipal Income Fund’s (the “Fund”) performance and positioning for the six-month period ended September 30, 2017 (the “Reporting Period”).
| Q | | How did the Fund perform during the Reporting Period? |
| A | | During the Reporting Period, the Fund’s Class A, C, Institutional, Service and Investor Shares generated cumulative total returns, without sales charges, of 3.07%, 2.69%, 3.25%, 2.99% and 3.21%, respectively. These returns compare to the 2.13% cumulative total return of the Fund’s benchmark, the Bloomberg Barclays Municipal Bond 1-10 Year Blend Index (the “Index”), during the same time period. |
| Q | | What key factors were responsible for the Fund’s performance during the Reporting Period? |
| A | | During the Reporting Period, the Fund benefited overall from its sector positioning and bottom-up issue selection. In addition, the Fund’s duration and yield curve positioning contributed positively to results. Duration is a measure of the Fund’s sensitivity to changes in interest rates. Yield curve is a spectrum of maturities. |
| Q | | Which municipal bond market sectors most significantly affected Fund performance during the Reporting Period? |
| A | | As the state of Illinois passed a budget for the first time in two years, the Fund was aided by its overweight position relative to the Index in Illinois municipal bonds. Overweights in the tobacco and hospital sectors also added to the Fund’s relative results. Conversely, the Fund’s overweight compared to the Index in Puerto Rico credits detracted modestly from returns, as the commonwealth’s municipal bonds performed poorly during the Reporting Period. |
| Q | | How did duration and yield curve positioning decisions affect the Fund’s performance during the Reporting Period? |
| A | | During the Reporting Period, the Fund’s duration and yield curve positioning added to relative results. The Fund’s long duration position versus that of the Index contributed positively to performance as municipal yields fell during the Reporting Period overall. By the end of the Reporting Period, we had shifted the Fund’s duration to a position shorter than that of the Index. The Fund was also helped by its yield curve positioning relative to the Index, especially its exposure to the longer-maturity segment of the municipal yield curve, as the yield curve flattened. |
| Q | | How did the Fund use derivatives and similar instruments during the Reporting Period as a whole? |
| A | | During the Reporting Period, the Fund used municipal inverse variable rate securities to take advantage of the steepness of the municipal yield curve. The municipal yield curve flattened during the Reporting Period overall, as yields on shorter-term maturity municipal bonds fell less than those on longer-term maturity municipal bonds. Municipal inverse variable rate securities have an inverse relationship to short-term interest rates—the interest rate they pay generally increases as short-term interest rates fall and vice versa—and they therefore have the potential to increase or decrease the Fund’s income. In addition, the Fund used municipal credit default swaps as we sought to capture the upside potential of select securities that were trading below what we considered to be their intrinsic value. The Fund also employed U.S. Treasury futures to manage U.S. interest rate duration. To manage against potential changes in interest rates, the Fund used interest rate swap contracts during the Reporting Period overall. Derivatives did not have a material impact, on a net basis, on the Fund’s performance during the Reporting Period. |
4
PORTFOLIO RESULTS
| Q | | What changes did you make in the Fund’s weightings and investments during the Reporting Period? |
| A | | During the Reporting Period, we increased the Fund’s exposures to hospital and general obligation bonds. We decreased the Fund’s allocations to pre-refunded, special tax and tobacco bonds. (Pre-refunding, also known as advance refunding, is a procedure in which a municipality issues a second bond at a lower interest rate, and uses the proceeds from the sale of the second bond to invest in “escrow collateral” for the first bond. The escrow collateral is typically in Treasury securities. Pre-refunded municipal bonds no longer represent the credit risk profile of the original borrower, and given the high credit quality of the escrow collateral, they often increase in value—sometimes significantly.) Also, during the Reporting Period, we increased the Fund’s exposures to A-rated and BBB-rated issues. We decreased its exposure to other lower credit quality rated municipal bonds. |
| Q | | How was the Fund positioned relative to its benchmark index at the end of the Reporting Period? |
| A | | At the end of the Reporting Period, the Fund held a shorter duration position compared to that of the Index. It was underweight relative to the Index in higher credit quality investment grade municipal bonds and overweight in BBB-rated and other lower credit quality issues. Relative to the Index, the Fund had underweight positions in New York and California municipal bonds. It was overweight in Illinois municipal bonds and slightly overweight in Puerto Rico municipal bonds compared to the Index. |
5
FUND BASICS
Dynamic Municipal Income Fund
as of September 30, 2017
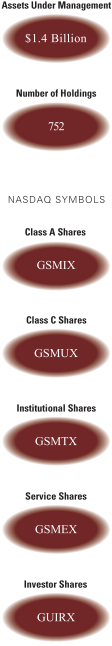
| | | | | | | | | | | | | | | | | | | | | | |
| | PERFORMANCE REVIEW | |
| | | April 1, 2017–
September 30, 2017 | | Fund Total
Return (based on NAV)1 | | | Bloomberg Barclays
Municipal Bond 1-10 Yr
Blend Index2 | | | 30-Day
Standardized
Subsidized
Yield3 | | | 30-Day Standardized Unsubsidized
Yield3 | | | 30-Day
Taxable
Equivalent
Yield4 | |
| | Class A | | | 3.07 | % | | | 2.13 | % | | | 2.25 | % | | | 2.20 | % | | | 3.98 | % |
| | Class C | | | 2.69 | | | | 2.13 | | | | 1.59 | | | | 1.53 | | | | 2.81 | |
| | Institutional | | | 3.25 | | | | 2.13 | | | | 2.68 | | | | 2.62 | | | | 4.73 | |
| | Service | | | 2.99 | | | | 2.13 | | | | 2.19 | | | | 2.13 | | | | 3.87 | |
| | | Investor | | | 3.21 | | | | 2.13 | | | | 2.59 | | | | 2.53 | | | | 4.58 | |
| | 1 | | The net asset value (“NAV”) represents the net assets of the class of the Fund (ex-dividend) divided by the total number of shares of the class outstanding. The Fund’s performance assumes the reinvestment of dividends and other distributions. The Fund’s performance does not reflect the deduction of any applicable sales charges. |
| | 2 | | The Bloomberg Barclays Municipal Bond 1-10 Year Blend Index is an unmanaged broad-based total return index composed of approximately 40,000 investment grade, fixed rate, and tax-exempt issues, with a remaining maturity of at least one year. The Index figures do not reflect any deduction for fees, expenses or taxes. It is not possible to invest directly in an index. |
| | 3 | | The method of calculation of the 30-Day Standardized Subsidized Yield is mandated by the Securities and Exchange Commission and is determined by dividing the net investment income per share earned during the last 30 days of the period by the maximum public offering price (“POP”) per share on the last day of the period. This number is then annualized. The 30-Day Standardized Subsidized Yield reflects fee waivers and/or expense reimbursements recorded by the Fund during the period. Without waivers and/or reimbursements, yields would be reduced. This yield does not necessarily reflect income actually earned and distributed by the Fund and, therefore, may not be correlated with the dividends or other distributions paid to shareholders. The 30-Day Standardized Unsubsidized Yield does not adjust for any fee waivers and/or expense reimbursements in effect. If the Fund does not incur any fee waivers and/or expense reimbursements during the period, the 30-Day Standardized Subsidized Yield and 30-Day Standardized Unsubsidized Yield will be identical. |
| | 4 | | The 30-Day Taxable Equivalent Yield of the Fund is calculated by dividing the current 30-Day Standardized Subsidized Yield by 1 minus the highest 2016 federal income tax rate of 43.4%. |
The returns set forth in the table above represent past performance. Past performance does not guarantee future results. The Fund’s investment return and principal value will fluctuate so that an investor’s shares, when redeemed, may be worth more or less than their original cost. Current performance may be lower or higher than the performance quoted above. Please visit our web site at www.GSAMFUNDS.com to obtain the most recent month-end returns. Performance reflects applicable fee waivers and/or expense limitations in effect during the periods shown. In their absence, performance would be reduced. Returns do not reflect the deduction of taxes that a shareholder would pay on Fund distributions or the redemption of Fund shares.
6
FUND BASICS
| | | | | | | | | | | | | | | | | | | | |
| | STANDARDIZED TOTAL RETURNS5 |
| | | For the period ended 9/30/17 | | One Year | | | Five Years | | | Ten Years | | | Since Inception | | | Inception Date |
| | Class A | | | -2.67 | % | | | 2.05 | % | | | 3.83 | % | | | 4.55 | % | | 7/20/93 |
| | Class C | | | -0.68 | | | | 2.08 | | | | 3.45 | | | | 3.68 | | | 8/15/97 |
| | Institutional | | | 1.42 | | | | 3.18 | | | | 4.58 | | | | 4.83 | | | 8/15/97 |
| | Service | | | 0.93 | | | | 2.67 | | | | 4.05 | | | | 4.33 | | | 8/15/97 |
| | | Investor | | | 1.38 | | | | 3.09 | | | | N/A | | | | 4.54 | | | 7/30/10 |
| | 5 | | The Standardized Total Returns are average annual total returns or cumulative total returns (only if the performance period is one year or less) as of the most recent calendar quarter-end. They assume reinvestment of all distributions at NAV. These returns reflect a maximum initial sales charge of 3.75% for Class A Shares and the assumed contingent deferred sales charge for Class C Shares (1% if redeemed within 12 months of purchase). Prior to July 29, 2009, the maximum initial sales charge applicable to Class A Shares of the Fund was 4.5%, which is not reflected in the figures shown. Because Institutional Shares, Service Shares and Investor Shares do not involve a sales charge, such a charge is not applied to their Standardized Total Returns. |
The returns set forth in the table above represent past performance. Past performance does not guarantee future results. The Fund’s investment return and principal value will fluctuate so that an investor’s shares, when redeemed, may be worth more or less than their original cost. Current performance may be lower or higher than the performance quoted above. Please visit our web site at www.GSAMFUNDS.com to obtain the most recent month-end returns. Performance reflects applicable fee waivers and/or expense limitations in effect during the periods shown. In their absence, performance would be reduced. Returns do not reflect the deduction of taxes that a shareholder would pay on Fund distributions or the redemption of Fund shares.
| | | | | | | | | | |
| | EXPENSE RATIOS6 | |
| | | | | Net Expense Ratio (Current) | | | Gross Expense Ratio (Before Waivers) | |
| | Class A | | | 0.75 | % | | | 0.83 | % |
| | Class C | | | 1.50 | | | | 1.58 | |
| | Institutional | | | 0.41 | | | | 0.49 | |
| | Service | | | 0.91 | | | | 0.99 | |
| | | Investor | | | 0.50 | | | | 0.58 | |
| | 6 | | The expense ratios of the Fund, both current (net of applicable fee waivers and/or expense limitations) and before waivers (gross of applicable fee waivers and/or expense limitations) are as set forth above according to the most recent publicly available Prospectus for the Fund and may differ from the expense ratios disclosed in the Financial Highlights in this report. Pursuant to a contractual arrangement, the Fund’s waivers and/or expense limitations will remain in place through at least July 28, 2018, and prior to such date the investment adviser may not terminate the arrangements without the approval of the Fund’s Board of Trustees. If these arrangements are discontinued in the future, the expense ratios may change without shareholder approval. |
7
FUND BASICS
|
| SECTOR ALLOCATION7 |
| Percentage of Market Value |
| | 7 | | The percentage shown for each investment category reflects the value of investments in that category as a percentage of market value. The above graph depicts the Fund’s investments but may not represent the Fund’s market exposure due to the exclusion of derivatives, if any, as listed in the Additional Investment Information section of the Schedule of Investments. Figures above may not sum to 100% due to rounding and/or exclusion of other assets and liabilities. |
8
PORTFOLIO RESULTS
Goldman Sachs High Yield Municipal Fund
Investment Objective
The Fund seeks a high level of current income that is exempt from regular federal income tax and may also consider the potential for capital appreciation.
Portfolio Management Discussion and Analysis
Below, the Goldman Sachs Municipal Fixed Income Investment Management Team discusses the Goldman Sachs High Yield Municipal Fund’s (the “Fund”) performance and positioning for the six-month period ended September 30, 2017 (the “Reporting Period”).
| Q | | How did the Fund perform during the Reporting Period? |
| A | | During the Reporting Period, the Fund’s Class A, C, Institutional and Investor Shares generated cumulative total returns, without sales charges, of 4.34%, 3.95%, 4.39% and 4.36%, respectively. These returns compare to the 3.33% cumulative total return of the Fund’s benchmark, the Goldman Sachs High Yield Municipal Fund Composite Index (“High Yield Municipal Composite”), during the same time period. |
| The | High Yield Municipal Fund Composite is composed 60% of the Bloomberg Barclays High Yield Municipal Bond Index (with dividends reinvested) and 40% of the Bloomberg Barclays Municipal Bond Index (with dividends reinvested), which generated cumulative total returns of 3.52% and 3.04%, respectively, during the Reporting Period. |
| Q | | What key factors were responsible for the Fund’s performance during the Reporting Period? |
| A | | The Fund benefited overall from sector positioning and bottom-up individual issue selection during the Reporting Period. In addition, the Fund’s duration and yield curve positioning bolstered results. (Duration is a measure of the Fund’s sensitivity to changes in interest rates. Yield curve is a spectrum of maturities.) |
| Q | | Which municipal bond market sectors most significantly affected Fund performance? |
| A | | During the Reporting Period, the Fund’s overweight position relative to the High Yield Municipal Composite in Illinois credits contributed positively to performance, as the state passed a budget for the first time in two years. Although the Fund was hampered by an underweight position in the tobacco sector, which posted strong returns, it was helped by individual issue selection within the sector. An overweight |
| in | | Puerto Rico municipal bonds detracted from Fund results, as the commonwealth’s municipal bonds performed poorly during the Reporting Period. |
| Q | | How did duration and yield curve positioning decisions affect the Fund’s performance? |
| A | | During the Reporting Period, the Fund’s duration and yield curve positioning contributed positively to relative performance. The Fund’s short duration position versus that of the High Yield Municipal Composite particularly added to returns as municipal yields rose during the second quarter of 2017. The Fund was also helped by its yield curve positioning relative to the High Yield Municipal Composite, especially its exposure to the longer-maturity segment of the municipal yield curve, as the yield curve flattened, meaning the differential between longer-term and shorter-term yields decreased. |
| Q | | How did the Fund use derivatives and similar instruments during the Reporting Period? |
| A | | The Fund took a long position in credit default swaps (“CDS”), which means it sold CDS protection, as we sought to capture the upside potential of select securities that were trading below what we considered to be their intrinsic value. In addition, the Fund employed interest rate swaps, tied to LIBOR (London interbank offered rates, which are floating interest rates widely used as reference rates in bank, corporate and government lending agreements), to manage the Fund’s duration position during the Reporting Period. Also during the Reporting Period, the Fund used municipal inverse variable rate securities to take advantage of the steepness of the municipal yield curve. The municipal yield curve flattened during the Reporting Period overall as yields on shorter-term maturity municipal bonds fell less than those on longer-term maturity municipal bonds. Municipal inverse variable rate securities have an inverse relationship to |
9
PORTFOLIO RESULTS
| | short-term interest rates—the interest rate they pay generally increases as short-term interest rates fall and vice versa—and they therefore have the potential to increase or decrease the Fund’s income. Derivatives did not have a material impact, on a net basis, on the Fund’s performance during the Reporting Period. |
| Q | | What changes did you make in the Fund’s weightings and investments during the Reporting Period? |
| A | | During the Reporting Period, we decreased the Fund’s exposure to the water and sewer sector as well as its exposure to the tobacco sector. We increased the Fund’s allocations to general obligation bonds and Illinois credits. |
| Q | | How was the Fund positioned relative to its benchmark index at the end of the Reporting Period? |
| A | | At the end of the Reporting Period, the Fund was underweight relative to the High Yield Municipal Composite in the tobacco sector. Compared to the High Yield Municipal Composite, the Fund was overweight A-rated and BBB-rated issues and underweight below investment grade credits. |
10
FUND BASICS
High Yield Municipal Fund
as of September 30, 2017
| | | | | | | | | | | | | | | | | | | | | | | | | | | | |
| | PERFORMANCE REVIEW | |
| | | April 1, 2017–
September 30, 2017 | | Fund Total
Return
(based
on NAV)1 | | Goldman
Sachs
High Yield
Municipal
Fund
Composite
Index2 | | | Bloomberg
Barclays
Municipal
High Yield
Bond Index3 | | | Bloomberg
Barclays
Municipal Bond Index4 | | | 30-Day
Standardized Subsidized Yield5 | | | 30-Day Standardized Unsubsidized Yield5 | | | 30-Day Taxable Equivalent Yield6 | |
| | Class A | | 4.34% | | | 3.33 | % | | | 3.52 | % | | | 3.04 | % | | | 2.85 | % | | | 2.78 | % | | | 5.04 | % |
| | Class C | | 3.95 | | | 3.33 | | | | 3.52 | | | | 3.04 | | | | 2.23 | | | | 2.16 | | | | 3.94 | |
| | Institutional | | 4.39 | | | 3.33 | | | | 3.52 | | | | 3.04 | | | | 3.27 | | | | 3.25 | | | | 5.78 | |
| | | Investor | | 4.36 | | | 3.33 | | | | 3.52 | | | | 3.04 | | | | 3.23 | | | | 3.16 | | | | 5.71 | |
| | 1 | | The net asset value (“NAV”) represents the net assets of the class of the Fund (ex-dividend) divided by the total number of shares of the class outstanding. The Fund’s performance assumes the reinvestment of dividends and other distributions. The Fund’s performance does not reflect the deduction of any applicable sales charges. |
| | 2 | | The Goldman Sachs High Yield Municipal Fund Composite Index is comprised of the Bloomberg Barclays Municipal High Yield Bond Index (60%) (with dividends reinvested) and the Bloomberg Barclays Municipal Bond Index (40%) (with dividends reinvested) |
| | 3 | | The Bloomberg Barclays Municipal High Yield Bond Index is an unmanaged index made up of bonds that are non-investment grade, unrated, or rated below Ba1 by Moody’s Investors Service with a remaining maturity of at least one year. The Bloomberg Barclays Municipal High Yield Bond Index does not include any deduction for fees, expenses or taxes. It is not possible to invest directly in an index. |
| | 4 | | The Bloomberg Barclays Municipal Bond Index is an unmanaged broad-based total return index composed of approximately 40,000 investment grade, fixed rate, and tax-exempt issues, with a remaining maturity of at least one year. The Bloomberg Barclays Municipal Bond Index does not reflect any deduction for fees, expenses or taxes. It is not possible to invest directly in an index. |
| | 5 | | The method of calculation of the 30-Day Standardized Subsidized Yield is mandated by the Securities and Exchange Commission and is determined by dividing the net investment income per share earned during the last 30 days of the period by the maximum public offering price (“POP”) per share on the last day of the period. This number is then annualized. The 30-Day Standardized Subsidized Yield reflects fee waivers and/or expense reimbursements recorded by the Fund during the period. Without waivers and/or reimbursements, yields would be reduced. This yield does not necessarily reflect income actually earned and distributed by the Fund and, therefore, may not be correlated with the dividends or other distributions paid to shareholders. The 30-Day Standardized Unsubsidized Yield does not adjust for any fee waivers and/or expense reimbursements in effect. If the Fund does not incur any fee waivers and/or expense reimbursements during the period, the 30-Day Standardized Subsidized Yield and 30-Day Standardized Unsubsidized Yield will be identical. |
| | 6 | | The 30-Day Taxable Equivalent Yield of the Fund is calculated by dividing the current 30-Day Standardized Subsidized Yield by 1 minus the highest 2016 federal income tax rate of 43.4%. |
The returns set forth in the table above represent past performance. Past performance does not guarantee future results. The Fund’s investment return and principal value will fluctuate so that an investor’s shares, when redeemed, may be worth more or less than their original cost. Current performance may be lower or higher than the performance quoted above. Please visit our web site at www.GSAMFUNDS.com to obtain the most recent month-end returns. Performance reflects applicable fee waivers and/or expense limitations in effect during the periods shown. In their absence, performance would be reduced. Returns do not reflect the deduction of taxes that a shareholder would pay on Fund distributions or the redemption of Fund shares.
11
FUND BASICS
| | | | | | | | | | | | | | | | | | | | |
| | STANDARDIZED TOTAL RETURNS7 |
| | | For the period ended 9/30/17 | | One Year | | | Five Years | | | Ten Years | | | Since Inception | | | Inception Date |
| | Class A | | | -1.94 | % | | | 4.18 | % | | | 3.30 | % | | | 4.62 | % | | 4/3/00 |
| | Class C | | | 0.91 | | | | 4.36 | | | | 3.01 | | | | 4.11 | | | 4/3/00 |
| | Institutional | | | 2.98 | | | | 5.45 | | | | 4.10 | | | | 5.25 | | | 4/3/00 |
| | | Investor | | | 3.02 | | | | 5.42 | | | | N/A | | | | 6.67 | | | 7/30/10 |
| | 7 | | The Standardized Total Returns are average annual total returns or cumulative total returns (only if the performance period is one year or less) as of the most recent calendar quarter-end. They assume reinvestment of all distributions at NAV. These returns reflect a maximum initial sales charge of 4.5% for Class A Shares and the assumed contingent deferred sales charge for Class C Shares (1% if redeemed within 12 months of purchase). Because Institutional and Investor Shares do not involve a sales charge, such a charge is not applied to their Standardized Total Returns. The Fund will charge a 2% redemption fee on the redemption of shares (including by exchange) held for 60 calendar days or less. The performance figures do not reflect the deduction of the redemption fee. If reflected, the redemption fee would reduce the performance quoted. |
The returns set forth in the table above represent past performance. Past performance does not guarantee future results. The Fund’s investment return and principal value will fluctuate so that an investor’s shares, when redeemed, may be worth more or less than their original cost. Current performance may be lower or higher than the performance quoted above. Please visit our web site at www.GSAMFUNDS.com to obtain the most recent month-end returns. Performance reflects applicable fee waivers and/or expense limitations in effect during the periods shown. In their absence, performance would be reduced. Returns do not reflect the deduction of taxes that a shareholder would pay on Fund distributions or the redemption of Fund shares.
| | | | | | | | | | |
| | EXPENSE RATIOS8 | |
| | | | | Net Expense Ratio (Current) | | | Gross Expense Ratio (Before Waivers) | |
| | Class A | | | 0.85 | % | | | 0.92 | % |
| | Class C | | | 1.60 | | | | 1.67 | |
| | Institutional | | | 0.56 | | | | 0.58 | |
| | | Investor | | | 0.60 | | | | 0.67 | |
| | 8 | | The expense ratios of the Fund, both current (net of applicable fee waivers and/or expense limitations) and before waivers (gross of applicable fee waivers and/or expense limitations) are as set forth above according to the most recent publicly available Prospectus for the Fund and may differ from the expense ratios disclosed in the Financial Highlights in this report. Pursuant to a contractual arrangement, the Fund’s waivers and/or expense limitations will remain in place through at least July 28, 2018, and prior to such date the investment adviser may not terminate the arrangements without the approval of the Fund’s Board of Trustees. If these arrangements are discontinued in the future, the expense ratios may change without shareholder approval. |
12
FUND BASICS
|
| SECTOR ALLOCATION9 |
| Percentage of Market Value |
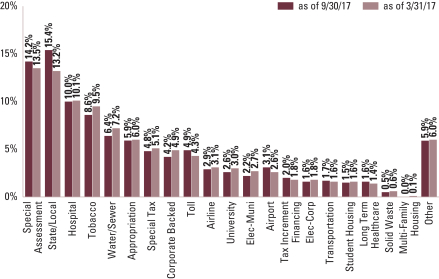
| | 9 | | The percentage shown for each investment category reflects the value of investments in that category as a percentage of market value. The above graph depicts the Fund’s investments but may not represent the Fund’s market exposure due to the exclusion of derivatives, if any, as listed in the Additional Investment Information section of the Schedule of Investments. Figures above may not sum to 100% due to rounding and/or exclusion of other assets and liabilities. |
13
PORTFOLIO RESULTS
Goldman Sachs Short Duration Tax-Free Fund
Investment Objective
The Fund seeks a high level of current income, consistent with relatively low volatility of principal, that is exempt from regular federal income tax.
Portfolio Management Discussion and Analysis
Below, the Goldman Sachs Municipal Fixed Income Investment Management Team discusses the Goldman Sachs Short Duration Tax-Free Fund’s (the “Fund”) performance and positioning for the six-month period ended September 30, 2017 (the “Reporting Period”).
| Q | | How did the Fund perform during the Reporting Period? |
| A | | During the Reporting Period, the Fund’s Class A, C, Institutional, Service and Investor Shares generated cumulative total returns, without sales charges, of 1.03%, 0.83%, 1.28%, 1.02% and 1.16%, respectively. These returns compare to the 0.89% cumulative total return of the Fund’s benchmark, the Bloomberg Barclays Municipal Bond 1-3 Year Blend Index (with dividends reinvested) (the “Index”), during the same time period. |
| Q | | What key factors were responsible for the Fund’s performance during the Reporting Period? |
| A | | The Fund’s duration and yield curve strategy added modestly to relative results during the Reporting Period. (Duration is a measure of the Fund’s sensitivity to changes in interest rates. Yield curve is a spectrum of maturities.) Sector positioning and bottom-up issue selection overall also enhanced relative returns. |
| Q | | Which municipal bond market sectors most significantly affected Fund performance? |
| A | | During the Reporting Period, the Fund benefited from an overweight relative to the Index in Illinois credits, which performed well as the state passed a budget for the first time since 2015. The Fund’s lower credit quality bias also added to relative returns, as municipal credit spreads (yield differentials versus taxable bonds of comparable maturity) tightened during the Reporting Period. On the other hand, the Fund’s investments in Puerto Rico credits detracted from results, as Puerto Rico municipal bonds performed poorly during the Reporting Period. |
| Q | | How did duration and yield curve positioning decisions affect the Fund’s performance? |
| A | | During the Reporting Period, the Fund’s duration and yield curve positioning contributed positively to relative returns. More specifically, the Fund’s longer duration position relative to that of the Index added modestly to performance as municipal yields fell during the Reporting Period overall. The Fund was also helped by its yield curve positioning compared to the Index, especially its exposure to the longer-maturity segment of the municipal yield curve, as the yield curve flattened, meaning the differential between longer-term and shorter-term yields decreased. |
| Q | | How did the Fund use derivatives and similar instruments during the Reporting Period? |
| A | | During the Reporting Period, the Fund took a long position in credit default swaps (“CDS”), which means it sold CDS protection, as we sought to capture the upside potential of select securities that were trading below what we considered their intrinsic value. Derivatives did not have a material impact, on a net basis, on the Fund’s performance during the Reporting Period. |
| Q | | What changes did you make in the Fund’s weightings and investments during the Reporting Period? |
| A | | We reduced the Fund’s exposures to appropriation, tobacco and airport credits during the Reporting Period. We increased its exposures to general obligation and hospital bonds. In addition, we increased the Fund’s allocation to the municipal debt of Texas and decreased its allocation to the municipal debt of Illinois. |
| Q | | How was the Fund positioned relative to its benchmark index at the end of the Reporting Period? |
| A | | At the end of the Reporting Period, the Fund had a slightly long duration position compared to that of the Index but in line with the Fund’s historical range. It was overweight relative to the Index in higher credit quality AAA-rated issues, BBB-rated issues and lower credit quality rated municipal bonds. In addition, the Fund was underweight California and Florida municipal bonds at the end of the Reporting Period. |
14
FUND BASICS
Short Duration Tax-Free Fund
as of September 30, 2017
| | | | | | | | | | | | | | | | | | | | | | |
| | PERFORMANCE REVIEW | |
| | | April 1, 2017–
September 30, 2017 | | Fund Total Return
(based on NAV)1 | | | Bloomberg
Barclays
Municipal Bond
1–3 Year Blend
Index2 | | | 30-Day
Standardized
Subsidized
Yield3 | | | 30-Day
Standardized
Unsubsidized
Yield3 | | | 30-Day Taxable
Equivalent
Yield4 | |
| | Class A | | | 1.03 | % | | | 0.89 | % | | | 0.94 | % | | | 0.88 | % | | | 1.66 | % |
| | Class C | | | 0.83 | | | | 0.89 | | | | 0.56 | | | | 0.15 | | | | 0.99 | |
| | Institutional | | | 1.28 | | | | 0.89 | | | | 1.26 | | | | 1.23 | | | | 2.23 | |
| | Service | | | 1.02 | | | | 0.89 | | | | 0.76 | | | | 0.73 | | | | 1.34 | |
| | | Investor | | | 1.16 | | | | 0.89 | | | | 1.21 | | | | 1.14 | | | | 2.14 | |
| | 1 | | The net asset value (“NAV”) represents the net assets of the class of the Fund (ex-dividend) divided by the total number of shares of the class outstanding. The Fund’s performance reflects the reinvestment of dividends and other distributions. The Fund’s performance does not reflect the deduction of any applicable sales charges. |
| | 2 | | The Bloomberg Barclays Municipal Bond 1-3 Year Blend Index (with dividends reinvested), an unmanaged index, represents investment grade municipal bonds with maturities greater than one year and less than 4 years, and does not reflect any deduction for fees, expenses or taxes. It is not possible to invest directly in an index. |
| | 3 | | The method of calculation of the 30-Day Standardized Subsidized Yield is mandated by the Securities and Exchange Commission and is determined by dividing the net investment income per share earned during the last 30 days of the period by the maximum public offering price (“POP”) per share on the last day of the period. This number is then annualized. The 30-Day Standardized Subsidized Yield reflects fee waivers and/or expense reimbursements recorded by the Fund during the period. Without waivers and/or reimbursements, yields would be reduced. This yield does not necessarily reflect income actually earned and distributed by the Fund and, therefore, may not be correlated with the dividends or other distributions paid to shareholders. The 30-Day Standardized Unsubsidized Yield does not adjust for any fee waivers and/or expense reimbursements in effect. If the Fund does not incur any fee waivers and/or expense reimbursements during the period, the 30-Day Standardized Subsidized Yield and 30-Day Standardized Unsubsidized Yield will be identical. |
| | 4 | | The 30-Day Taxable Equivalent Yield of the Fund is calculated by dividing the current 30-Day Standardized Subsidized Yield by 1 minus the highest 2016 federal income tax rate of 43.4%. |
The returns set forth in the table above represent past performance. Past performance does not guarantee future results. The Fund’s investment return and principal value will fluctuate so that an investor’s shares, when redeemed, may be worth more or less than their original cost. Current performance may be lower or higher than the performance quoted above. Please visit our web site at www.GSAMFUNDS.com to obtain the most recent month-end returns. Performance reflects applicable fee waivers and/or expense limitations in effect during the periods shown. In their absence, performance would be reduced. Returns do not reflect the deduction of taxes that a shareholder would pay on Fund distributions or the redemption of Fund shares.
15
FUND BASICS
| | | | | | | | | | | | | | | | | | | | |
| | STANDARDIZED TOTAL RETURNS5 |
| | | For the period ended 9/30/17 | | One Year | | | Five Years | | | Ten Years | | | Since Inception | | | Inception Date |
| | Class A | | | -0.80 | % | | | 0.43 | % | | | 1.80 | % | | | 2.55 | % | | 5/1/97 |
| | Class C | | | -0.35 | | | | 0.31 | | | | 1.43 | | | | 1.91 | | | 8/15/97 |
| | Institutional | | | 1.00 | | | | 1.06 | | | | 2.29 | | | | 3.20 | | | 10/1/92 |
| | Service | | | 0.50 | | | | 0.56 | | | | 1.79 | | | | 2.66 | | | 9/20/94 |
| | | Investor | | | 0.95 | | | | 0.98 | | | | N/A | | | | 1.40 | | | 7/30/10 |
| | 5 | | The Standardized Total Returns are average annual total returns or cumulative total returns (only if the performance period is one year or less) as of the most recent calendar quarter-end. They assume reinvestment of all distributions at NAV. These returns reflect a maximum initial sales charge of 1.5% for Class A Shares and the assumed contingent deferred sales charge for Class C Shares (0.65% if redeemed within 12 months of purchase). Prior to July 29, 2009, the maximum initial sales charge applicable to Class A Shares of the Fund was 2.0%, which is not reflected in the figures shown. Because Institutional, Service and Investor Shares do not involve a sales charge, such a charge is not applied to their Standardized Total Returns. |
The returns set forth in the table above represent past performance. Past performance does not guarantee future results. The Fund’s investment return and principal value will fluctuate so that an investor’s shares, when redeemed, may be worth more or less than their original cost. Current performance may be lower or higher than the performance quoted above. Please visit our web site at www.GSAMFUNDS.com to obtain the most recent month-end returns. Performance reflects applicable fee waivers and/or expense limitations in effect during the periods shown. In their absence, performance would be reduced. Returns do not reflect the deduction of taxes that a shareholder would pay on Fund distributions or the redemption of Fund shares.
| | | | | | | | | | |
| | EXPENSE RATIOS6 | |
| | | | | Net Expense Ratio (Current) | | | Gross Expense Ratio (Before Waivers) | |
| | Class A | | | 0.69 | % | | | 0.75 | % |
| | Class C | | | 1.09 | | | | 1.50 | |
| | Institutional | | | 0.39 | | | | 0.41 | |
| | Service | | | 0.89 | | | | 0.91 | |
| | | Investor | | | 0.44 | | | | 0.50 | |
| | 6 | | The expense ratios of the Fund, both current (net of applicable fee waivers and/or expense limitations) and before waivers (gross of applicable fee waivers and/or expense limitations) are as set forth above according to the most recent publicly available Prospectus for the Fund and may differ from the expense ratios disclosed in the Financial Highlights in this report. Pursuant to a contractual arrangement, the Fund’s waivers and/or expense limitations will remain in place through at least July 28, 2018, and prior to such date the investment adviser may not terminate the arrangements without the approval of the Fund’s Board of Trustees. If these arrangements are discontinued in the future, the expense ratios may change without shareholder approval. |
16
FUND BASICS
|
| SECTOR ALLOCATION7 |
| Percentage of Market Value |
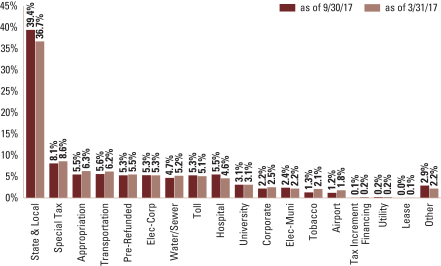
| | 7 | | The percentage shown for each investment category reflects the value of investments in that category as a percentage of market value. The above graph depicts the Fund’s investments but may not represent the Fund’s market exposure due to the exclusion of derivatives, if any, as listed in the Additional Investment Information section of the Schedule of Investments. Figures above may not sum to 100% due to rounding and/or exclusion of other assets and liabilities. |
17
GOLDMAN SACHS DYNAMIC MUNICIPAL INCOME FUND
Schedule of Investments
September 30, 2017 (Unaudited)
| | | | | | | | | | | | | | |
Principal
Amount | | | Interest
Rate | | | Maturity
Date | | | Value | |
| Municipal Bonds – 97.7% | |
| Alabama – 2.5% | |
| Alabama State Port Authority RB for Docks Facilities
Series 2010 (A-/NR)(a) |
|
| $ | 2,500,000 | | | | 5.750% | | | | 10/01/20 | | | $ | 2,834,375 | |
| | Black Belt Energy Gas District RB Series 2016 A (NR/A1)(b)(c) | |
| | 5,000,000 | | | | 4.000 | | | | 06/01/21 | | | | 5,400,900 | |
| Health Care Authority RB for Baptist Health Series 2006 D
(BBB+/A3) |
|
| | 575,000 | | | | 5.000 | | | | 11/15/17 | | | | 576,714 | |
| | 100,000 | | | | 5.000 | | | | 11/15/21 | | | | 100,324 | |
| Houston County Health Care Authority RB for Southeast
Alabama Medical Center Series 2016 A (BBB/NR) |
|
| | 150,000 | | | | 5.000 | | | | 10/01/24 | | | | 173,926 | |
| | 150,000 | | | | 5.000 | | | | 10/01/25 | | | | 172,444 | |
| | 725,000 | | | | 5.000 | | | | 10/01/30 | | | | 809,579 | |
| Jefferson County Senior Lien Sewer RB Warrants Series 2013 A
(AGM) (AA/A2) |
|
| | 700,000 | | | | 5.000 | | | | 10/01/44 | | | | 781,032 | |
| Jefferson County Subordinate Lien Sewer RB Warrants
Series 2013 D (BBB-/NR) |
|
| | 1,000,000 | | | | 5.000 | | | | 10/01/21 | | | | 1,089,700 | |
| | 13,500,000 | | | | 6.000 | | | | 10/01/42 | | | | 15,834,690 | |
| | 6,900,000 | | | | 6.500 | | | | 10/01/53 | | | | 8,278,206 | |
| | | | | | | | | | | | | | |
| | | | | | | | | | | | | 36,051,890 | |
| | |
| Alaska – 0.2% | |
| Northern Tobacco Securitization Corp. RB Refunding Capital
Appreciation Asset-Backed Bonds 1st Subordinate
Series 2006 B (NR/NR)(d) |
|
| | 37,350,000 | | | | 0.000 | | | | 06/01/46 | | | | 3,503,430 | |
| | |
| Arizona – 2.0% | |
| Arizona Health Facilities Authority Hospital RB for Banner
Health Series 2007 B (AA-/NR)(e) |
|
| | 12,925,000 | | |
| (3 Mo. LIBOR + 0.81%),
1.680 |
| | | 01/01/37 | | | | 11,310,021 | |
| Arizona State University System RB Refunding Series 2015 B
(AA/Aa3) |
|
| | 3,000,000 | | | | 5.000 | | | | 07/01/19 | | | | 3,203,160 | |
| City of Phoenix Civic Improvement Corporation Water System
RB Refunding Junior Lien Series 2016 (AAA/Aa2) |
|
| | 7,000,000 | | | | 5.000 | | | | 07/01/30 | | | | 8,458,310 | |
| Maricopa County Arizona Pollution Control Corp. PCRB
Refunding for El Paso Electric Co. Project Series 2009 A
(BBB/Baa1) |
|
| | 2,200,000 | | | | 7.250 | | | | 02/01/40 | | | | 2,354,418 | |
| Maricopa County IDA RB for Banner Health Series 2017 A
(AA-/NR)(f) |
|
| | 2,280,000 | | | | 4.000 | | | | 01/01/41 | | | | 2,343,452 | |
| Yavapai County IDA Solid Waste Disposal RB for Waste
Management, Inc. Project Series 2003 A-2 (AMT) (A-/NR)(b)(c) |
|
| | 1,410,000 | | | | 1.600 | | | | 03/01/18 | | | | 1,411,086 | |
| | | | | | | | | | | | | | |
| | | | | | | | | | | | | 29,080,447 | |
| | |
| Municipal Bonds – (continued) | |
| Arkansas – 0.9% | |
| Arkansas State Development Finance Authority Hospital RB
Refunding for Washington Regional Medical Center
Series 2015 B (NR/A3) |
|
| 770,000 | | | | 3.000 | | | | 02/01/18 | | | | 774,612 | |
| | 1,845,000 | | | | 3.000 | | | | 02/01/19 | | | | 1,884,170 | |
| Arkansas State Development Finance Authority RB for Single
Family Mortgage-Backed Securities Series 2008 B (AMT)
(GNMA) (FNMA) (AA+/NR) |
|
| | 330,000 | | | | 5.500 | | | | 07/01/23 | | | | 333,284 | |
| | City of Little Rock Sewer RB Refunding Series 2015 (NR/Aa3) | |
| | 1,000,000 | | | | 4.000 | | | | 04/01/21 | | | | 1,090,870 | |
| Pulaski County Little Rock School District Construction GO
Bonds Series 2017 (ST AID WITHHLDG) (NR/Aa2) |
|
| | 5,185,000 | | | | 3.000 | | | | 02/01/24 | | | | 5,422,421 | |
| Pulaski County Little Rock School District GO Refunding Bonds
Series 2015 (ST AID WITHHLDG) (NR/Aa2) |
|
| | 3,335,000 | | | | 3.000 | | | | 02/01/23 | | | | 3,465,865 | |
| | | | | | | | | | | | | | |
| | | | | | | | | | | | | 12,971,222 | |
| | |
| California – 13.4% | |
| Alameda County Oakland Unified School District GO Refunding
Bonds Series 2015 (AA-/NR) |
|
| | 1,500,000 | | | | 5.000 | | | | 08/01/19 | | | | 1,610,085 | |
| Alhambra California Unified School District Election of 2008 GO
Bonds Capital Appreciation for Elementary Schools
Improvement District Series B (AGM) (AA/Aa2)(d) |
|
| | 1,000,000 | | | | 0.000 | | | | 08/01/37 | | | | 498,690 | |
| Anaheim Community Facilities District No. 08-1 Special Tax
Refunding Bonds for Platinum Triangle Series 2016 (NR/NR) |
|
| | 875,000 | | | | 4.000 | | | | 09/01/24 | | | | 957,232 | |
| | 745,000 | | | | 4.000 | | | | 09/01/25 | | | | 812,452 | |
| | 535,000 | | | | 4.000 | | | | 09/01/26 | | | | 581,818 | |
| | 590,000 | | | | 4.000 | | | | 09/01/27 | | | | 637,743 | |
| | 575,000 | | | | 4.000 | | | | 09/01/28 | | | | 616,400 | |
| | 465,000 | | | | 4.000 | | | | 09/01/29 | | | | 489,943 | |
| Atwater Wastewater RB Refunding Series 2017 A (AGM)
(AA/NR) |
|
| | 785,000 | | | | 5.000 | | | | 05/01/40 | | | | 904,948 | |
| California County Tobacco Securitization Agency Tobacco
Settlement RB Capital Appreciation Subordinate Series 2006 C
(BB+/NR)(d) |
|
| | 31,220,000 | | | | 0.000 | | | | 06/01/55 | | | | 2,255,645 | |
| California Educational Facilities Authority RB for California
Institute of Technology Series 2009 (AA-/Aa2)(a) |
|
| | 5,000,000 | | | | 5.000 | | | | 11/01/19 | | | | 5,414,550 | |
| California Health Facilities Financing Authority RB for El
Camino Hospital Series 2017 (A+/A1) |
|
| | 500,000 | | | | 5.000 | | | | 02/01/42 | | | | 572,065 | |
| California Health Facilities Financing Authority RB for Lucile
Salter Packard Children’s Hospital Series 2017 A (A+/A1) |
|
| | 375,000 | | | | 5.000 | | | | 11/15/28 | | | | 464,385 | |
| | 350,000 | | | | 5.000 | | | | 11/15/29 | | | | 428,830 | |
| | 565,000 | | | | 5.000 | | | | 11/15/30 | | | | 684,927 | |
| | 1,000,000 | | | | 5.000 | | | | 11/15/42 | | | | 1,162,940 | |
| | 12,000,000 | | | | 5.000 | | | | 11/15/56 | | | | 13,797,840 | |
| | |
| | |
| 18 | | The accompanying notes are an integral part of these financial statements. |
GOLDMAN SACHS DYNAMIC MUNICIPAL INCOME FUND
| | | | | | | | | | | | | | |
Principal
Amount | | | Interest
Rate | | | Maturity
Date | | | Value | |
| Municipal Bonds – (continued) | |
| California – (continued) | |
| California Health Facilities Financing Authority RB for
Providence Health & Services Series 2008 C (AA-/Aa3)(a) |
|
| $ | 1,000,000 | | | | 6.500 | % | | | 10/01/18 | | | $ | 1,055,420 | |
| California Municipal Finance Authority RB for California Baptist
University Series 2016 A (NR/NR)(g) |
|
| | 650,000 | | | | 5.000 | | | | 11/01/46 | | | | 685,698 | |
| California Municipal Finance Authority RB for Community
Medical Centers Series 2017 A (A-/Baa1) |
|
| | 1,300,000 | | | | 5.000 | | | | 02/01/34 | | | | 1,485,107 | |
| | 1,150,000 | | | | 5.000 | | | | 02/01/35 | | | | 1,309,781 | |
| | 450,000 | | | | 5.000 | | | | 02/01/42 | | | | 502,924 | |
| | 1,450,000 | | | | 5.000 | | | | 02/01/47 | | | | 1,618,316 | |
| California Municipal Finance Authority Student Housing RB for
Bowles Hall Foundation Series 2015 A (NR/Baa3) |
|
| | 400,000 | | | | 5.000 | | | | 06/01/35 | | | | 438,868 | |
| California State Kindergarten GO Bonds Series 2004 B3
(AA+/Aa1)(b)(c) |
|
| | 2,000,000 | | | | 0.860 | | | | 10/02/17 | | | | 2,000,000 | |
| California State Various Purpose GO Bonds Series 2009
(AA-/Aa3) |
|
| | 5,000,000 | | | | 5.250 | | | | 10/01/25 | | | | 5,410,300 | |
| | 5,000,000 | | | | 6.500 | | | | 04/01/33 | | | | 5,400,650 | |
| | 2,750,000 | | | | 6.000 | | | | 04/01/38 | | | | 2,945,360 | |
| California State Various Purpose GO Bonds Series 2010
(AA-/Aa3) |
|
| | 1,250,000 | | | | 6.000 | | | | 03/01/33 | | | | 1,394,700 | |
| | 1,500,000 | | | | 5.500 | | | | 03/01/40 | | | | 1,646,790 | |
| California State Various Purpose GO Bonds Series 2017
(AA-/Aa3) |
|
| | 1,500,000 | | | | 5.000 | | | | 08/01/46 | | | | 1,738,665 | |
| California State Veterans GO Refunding Bonds Series 2015 CM
(AMT) (AA/Aa2) |
|
| | 840,000 | | | | 4.000 | | | | 12/01/32 | | | | 890,408 | |
| California Statewide Communities Development Authority
Community Facilities District No. 2007-01 Special Tax
Refunding for Orinda Wilder Project Series 2015 (NR/NR) |
|
| | 345,000 | | | | 5.000 | | | | 09/01/30 | | | | 392,741 | |
| | 375,000 | | | | 5.000 | | | | 09/01/37 | | | | 418,781 | |
| California Statewide Communities Development Authority RB
for Enloe Medical Center Series 2008 (CAL MTG INS)
(AA-/NR)(a) |
|
| | 1,435,000 | | | | 5.750 | | | | 08/15/18 | | | | 1,494,552 | |
| California Statewide Communities Development Authority RB
for Sutter Health Series 2011 A (AA-/Aa3) |
|
| | 2,000,000 | | | | 6.000 | | | | 08/15/42 | | | | 2,247,360 | |
| California Statewide Communities Development Authority RB
Refunding for Front Porch Communities & Services
Series 2017 A (A-/NR) |
|
| | 150,000 | | | | 5.000 | | | | 04/01/30 | | | | 176,934 | |
| | 70,000 | | | | 5.000 | | | | 04/01/31 | | | | 81,997 | |
| | 385,000 | | | | 4.000 | | | | 04/01/32 | | | | 407,134 | |
| | 455,000 | | | | 4.000 | | | | 04/01/34 | | | | 474,365 | |
| California Statewide Communities Development Authority RB
Refunding for Loma Linda University Medical Center
Series 2016 A (BB/NR)(g) |
|
| | 1,725,000 | | | | 5.000 | | | | 12/01/31 | | | | 1,930,482 | |
| | 1,000,000 | | | | 5.250 | | | | 12/01/56 | | | | 1,086,870 | |
| | |
| Municipal Bonds – (continued) | |
| California – (continued) | |
| California Statewide Communities Development Authority
Student Housing RB for University of California Irvine East
Campus Apartments, Phase IV-A CHF – Irvine, LLC
Series 2017 (NR/Baa1) |
|
| 975,000 | | | | 5.000 | | | | 05/15/42 | | | | 1,124,497 | |
| | 1,000,000 | | | | 5.000 | | | | 05/15/47 | | | | 1,147,960 | |
| | 800,000 | | | | 5.000 | | | | 05/15/50 | | | | 913,384 | |
| California Statewide Community Development Authority Water
& Wastewater RB Balance Series 2004 (AGM) (AA/A2) |
|
| | 15,000 | | | | 5.250 | | | | 10/01/19 | | | | 15,046 | |
| Citrus Community College District GO Bonds Capital
Appreciation for Election of 2004 Series 2009 C (AA-/Aa2)(d) |
|
| | 3,500,000 | | | | 0.000 | | | | 06/01/34 | | | | 1,944,180 | |
| City of Sacramento Natomas Meadows Community Facilities
District No. 2007-01 Special Tax Bonds for Improvement Area
No. 1 Series 2017 (NR/NR)(g) |
|
| | 625,000 | | | | 4.000 | | | | 09/01/28 | | | | 642,013 | |
| Commerce Community Development Commission Successor
Agency Tax Allocation Refunding Series 2016 A (AGM)
(AA/NR) |
|
| | 275,000 | | | | 3.125 | | | | 08/01/35 | | | | 267,820 | |
| Foothill/Eastern Transportation Corridor Agency Toll Road RB
Refunding Subseries B-3 (BBB-/Baa3)(b)(c) |
|
| | 675,000 | | | | 5.500 | | | | 01/15/23 | | | | 769,331 | |
| Fullerton Community Facilities District No. 1 Special Tax
Refunding Bonds for Amerige Heights Series 2012 (A-/NR) |
|
| | 500,000 | | | | 5.000 | | | | 09/01/32 | | | | 560,860 | |
| Golden State Tobacco Securitization Corp. California Tobacco
Settlement RB Asset-Backed Bonds for Capital Appreciation
Subseries 2007 B (CCC+/NR)(d) |
|
| | 18,000,000 | | | | 0.000 | | | | 06/01/47 | | | | 2,352,240 | |
| Golden State Tobacco Securitization Corp. California Tobacco
Settlement RB Asset-Backed Bonds for Capital Appreciation
Subseries 2007 C (CCC/NR)(d) |
|
| | 19,500,000 | | | | 0.000 | | | | 06/01/47 | | | | 2,298,660 | |
| Golden State Tobacco Securitization Corp. California Tobacco
Settlement RB Asset-Backed Bonds Series 2015 A
(ST APPROP) (A+/A1) |
|
| | 10,000,000 | | | | 5.000 | | | | 06/01/45 | | | | 11,344,600 | |
| Golden State Tobacco Securitization Corp. California Tobacco
Settlement RB Senior Asset-Backed Bonds Series 2007 A-2
(B/B3) |
|
| | 3,915,000 | | | | 5.300 | | | | 06/01/37 | | | | 3,979,284 | |
| Irvine Unified School District No. 09-1 Special Tax for
Community Facilities Series 2017 A (NR/NR) |
|
| | 650,000 | | | | 5.000 | | | | 09/01/25 | | | | 776,269 | |
| | 650,000 | | | | 5.000 | | | | 09/01/26 | | | | 779,057 | |
| Irvine Unified School District No. 09-1 Special Tax for
Community Facilities Series 2017 B (NR/NR) |
|
| | 480,000 | | | | 5.000 | | | | 09/01/25 | | | | 570,562 | |
| Irvine Unified School District No. 09-1 Special Tax for
Community Facilities Series 2017 C (NR/NR) |
|
| | 430,000 | | | | 5.000 | | | | 09/01/26 | | | | 512,736 | |
| Irvine Unified School District No. 09-1 Special Tax for
Community Facilities Series 2017 D (NR/NR) |
|
| | 180,000 | | | | 4.000 | | | | 09/01/25 | | | | 200,088 | |
| | 175,000 | | | | 4.000 | | | | 09/01/26 | | | | 194,667 | |
| | |
| | |
| The accompanying notes are an integral part of these financial statements. | | 19 |
GOLDMAN SACHS DYNAMIC MUNICIPAL INCOME FUND
Schedule of Investments (continued)
September 30, 2017 (Unaudited)
| | | | | | | | | | | | |
Principal
Amount | | | Interest
Rate | | Maturity
Date | | | Value | |
| Municipal Bonds – (continued) | |
| California – (continued) | |
| Lammersville Joint Unified School District No. 2002 Special Tax
Refunding for Community Facilities Series 2017 (AGM)
(AA/NR) |
|
| $ | 3,000,000 | | | 3.500 % | | | 09/01/35 | | | $ | 2,952,780 | |
| Los Angeles Community College District GO Bonds for 2008
Election Series 2010 C (AA+/Aa1)(a) |
|
| | 5,000,000 | | | 5.250 | | | 08/01/20 | | | | 5,580,550 | |
| Menifee Union School District Riverside County GO Bonds
Capital Appreciation for Election of 2008 Series 2009
C (ASSURED GTY) (AA/Aa3)(d) |
|
| | 2,000,000 | | | 0.000 | | | 08/01/37 | | | | 937,140 | |
| | 4,500,000 | | | 0.000 | | | 08/01/38 | | | | 2,017,080 | |
| | 4,500,000 | | | 0.000 | | | 08/01/39 | | | | 1,924,290 | |
| Merced City School District GO Bonds Capital Appreciation for
Election of 2003 Series 2005 (NATL-RE) (A+/NR)(d) |
|
| | 1,205,000 | | | 0.000 | | | 08/01/26 | | | | 946,841 | |
| | Metropolitan Water District RB Series 2017 A (AAA/Aa1)(b)(c) | |
| | 2,000,000 | | | 0.890 | | | 10/02/17 | | | | 2,000,000 | |
| | M-S-R Energy Authority Gas RB Series 2009 A (BBB+/NR) | |
| | 1,750,000 | | | 6.500 | | | 11/01/39 | | | | 2,491,458 | |
| | M-S-R Energy Authority Gas RB Series 2009 C (BBB+/NR) | |
| | 3,500,000 | | | 6.125 | | | 11/01/29 | | | | 4,458,160 | |
| Mt. Diablo Unified School District GO Bonds Capital
Appreciation for Election of 2010 Series 2010 A (AGM)
(AA/Aa2)(h) |
|
| | 5,000,000 | | | 0.000 | | | 08/01/35 | | | | 4,680,250 | |
| | Palomar Pomerado Health COPS Series 2009 (NR/WR)(a) | |
| | 2,500,000 | | | 6.750 | | | 11/01/19 | | | | 2,794,300 | |
| Palomar Pomerado Health GO Bonds Capital Appreciation for
Election of 2004 Series 2009 A (ASSURED GTY) (AA/A2)(d) |
|
| | 2,150,000 | | | 0.000 | | | 08/01/31 | | | | 1,354,393 | |
| | 4,150,000 | | | 0.000 | | | 08/01/32 | | | | 2,502,699 | |
| | 3,500,000 | | | 0.000 | | | 08/01/33 | | | | 2,014,705 | |
| Palomar Pomerado Health GO Bonds Capital Appreciation for
Election of 2004 Series 2009 A (ASSURED GTY) (AA/A2)(h) |
|
| | 6,450,000 | | | 0.000 | | | 08/01/38 | | | | 7,799,147 | |
| Port of Oakland RB Refunding Senior Lien Series 2012 P (AMT)
(A+/A1) |
|
| | 4,000,000 | | | 5.000 | | | 05/01/31 | | | | 4,511,160 | |
| Rancho Cordova Community Facilities District No. 2003-1
Special Tax Refunding for Sunridge Anatolia Series 2016
(NR/NR) |
|
| | 590,000 | | | 4.000 | | | 09/01/23 | | | | 645,472 | |
| | 320,000 | | | 4.000 | | | 09/01/24 | | | | 350,073 | |
| | 400,000 | | | 4.000 | | | 09/01/25 | | | | 435,916 | |
| | 490,000 | | | 4.000 | | | 09/01/26 | | | | 529,651 | |
| | 305,000 | | | 4.000 | | | 09/01/27 | | | | 327,207 | |
| | 500,000 | | | 4.000 | | | 09/01/28 | | | | 532,785 | |
| River Islands Public Financing Authority Community Facilities
District No. 2003-1 Special Tax Refunding Bonds
Series 2015 A-1 (NR/NR) |
|
| | 4,980,000 | | | 5.000 | | | 09/01/27 | | | | 5,237,018 | |
| | 1,000,000 | | | 5.375 | | | 09/01/31 | | | | 1,080,920 | |
| | 485,000 | | | 5.250 | | | 09/01/34 | | | | 514,958 | |
| | |
| Municipal Bonds – (continued) | |
| California – (continued) | |
| Roseville California Community Facilities District No. 1 Special
Tax Refunding for Fiddyment Ranch Project Series 2017
(NR/NR) |
|
| 750,000 | | | 5.000 | | | 09/01/25 | | | | 868,650 | |
| | 1,000,000 | | | 5.000 | | | 09/01/27 | | | | 1,174,100 | |
| Roseville California Community Facilities District No. 1 Special
Tax Refunding for Fiddyment Ranch Series 2017 (NR/NR) |
|
| | 1,075,000 | | | 5.000 | | | 09/01/26 | | | | 1,252,966 | |
| Sacramento County Sanitation District Financing Authority RB
Refunding for Sacramento County Regional Series 2007 B
(NATL-RE FGIC) (AA/Aa3)(e) |
|
| | 5,000,000 | | | (3 Mo. LIBOR + 0.53%),
1.412 | | | 12/01/35 | | | | 4,507,100 | |
| San Diego County Water Authority COPS Series 2008 A (AGM)
(AA/Aa2)(a) |
|
| | 830,000 | | | 5.000 | | | 05/01/18 | | | | 849,563 | |
| San Diego County Water Authority COPS Series 2008 A (AGM)
(AAA/Aa2)(a) |
|
| | 4,170,000 | | | 5.000 | | | 05/01/18 | | | | 4,268,287 | |
| San Diego Unified School District GO Bonds for Election of 2008
Series 2010 C (AA-/Aa2)(d) |
|
| | 5,000,000 | | | 0.000 | | | 07/01/39 | | | | 2,306,500 | |
| San Francisco City & County Airport Commission San Francisco
International Airport RB Refunding Second Series 2013 A
(AMT) (A+/A1) |
|
| | 2,000,000 | | | 5.500 | | | 05/01/28 | | | | 2,359,580 | |
| San Francisco City & County Redevelopment Financing
Authority Tax Allocation for Mission Bay South
Redevelopment Series 2016 C (A-/NR) |
|
| | 1,000,000 | | | 5.000 | | | 08/01/33 | | | | 1,175,250 | |
| San Joaquin Hills Transportation Corridor Agency RB Refunding
for Capital Appreciation Series 1997 A (NATL-RE) (A/A3)(d) |
|
| | 1,605,000 | | | 0.000 | | | 01/15/26 | | | | 1,250,070 | |
| San Joaquin Hills Transportation Corridor Agency RB Refunding
for Toll Road Senior Lien Series 2014 A (BBB/NR) |
|
| | 1,000,000 | | | 5.000 | | | 01/15/29 | | | | 1,151,830 | |
| Stockton Unified School District GO Refunding Bonds
Series 2016 (A+/A2) |
|
| | 2,735,000 | | | 5.000 | | | 08/01/25 | | | | 3,366,785 | |
| Tobacco Securitization Authority Northern California Tobacco
Settlement RB Asset-Backed Bonds Series 2005 A-1 (B-/B3) |
|
| | 1,650,000 | | | 5.375 | | | 06/01/38 | | | | 1,649,984 | |
| University of California Regents Medical Center Pooled RB
Refunding Series 2007 C-2 (NATL-RE) (AA-/Aa3)(e) |
|
| | 5,000,000 | | | (3 Mo. LIBOR +
0.74%, 12.00% Cap), 1.621 | | | 05/15/43 | | | | 4,242,550 | |
| Vernon California Redevelopment Agency Tax Allocation for
Industrial Redevelopment Project Series 2005 (NATL-RE)
(A/A3) |
|
| | 725,000 | | | 5.250 | | | 09/01/19 | | | | 725,718 | |
| West Contra Costa Unified School District GO Bonds Capital
Appreciation for Election of 2002 Series 2004 C (NATL-RE
FGIC) (AA-/A3)(d) |
|
| | 1,175,000 | | | 0.000 | | | 08/01/25 | | | | 967,331 | |
| | | | | | | | | | | | |
| | | | | | | | | | | 190,253,167 | |
| | |
| | |
| 20 | | The accompanying notes are an integral part of these financial statements. |
GOLDMAN SACHS DYNAMIC MUNICIPAL INCOME FUND
| | | | | | | | | | | | |
Principal
Amount | | | Interest
Rate | | Maturity
Date | | | Value | |
| Municipal Bonds – (continued) | |
| Colorado – 3.3% | |
| Adams County School District No. 1 GO Bonds for Mapleton
Public Schools Series 2017 (ST AID WITHHLDG) (NR/Aa2) |
|
| $ | 7,235,000 | | | 5.250 % | | | 12/01/40 | | | $ | 8,536,577 | |
| Belleview Station Metropolitan District No. 2 GO Refunding &
Improvement Bonds Series 2017 (NR/NR) |
|
| | 1,295,000 | | | 4.500 | | | 12/01/29 | | | | 1,317,947 | |
| Centerra Metropolitan District No. 1 Special RB Refunding &
Improvement Bonds Series 2017 (NR/NR) |
|
| | 4,000,000 | | | 5.000 | | | 12/01/29 | | | | 4,359,240 | |
| | 500,000 | | | 5.000 | | | 12/01/47 | | | | 514,480 | |
| Colorado Health Facilities Authority RB Refunding for Christian
Living Neighborhoods Project Series 2016 (NR/NR) |
|
| | 200,000 | | | 4.000 | | | 01/01/18 | | | | 201,048 | |
| | 200,000 | | | 4.000 | | | 01/01/19 | | | | 204,538 | |
| Colorado Health Facilities Authority RB Refunding for Covenant
Retirement Communities, Inc. Series 2015 A (BBB+/NR) |
|
| | 625,000 | | | 4.000 | | | 12/01/19 | | | | 654,956 | |
| Colorado Health Facilities Authority RB Refunding for
Evangelical Lutheran Good Samaritan Society Project
Series 2017 (BBB/NR) |
|
| | 1,150,000 | | | 5.000 | | | 06/01/47 | | | | 1,265,552 | |
| Cornerstar Metropolitan District GO Refunding Bonds
Series 2017 A (NR/NR) |
|
| | 500,000 | | | 3.500 | | | 12/01/21 | | | | 507,440 | |
| | 500,000 | | | 4.500 | | | 12/01/27 | | | | 522,910 | |
| | Denver City & County Airport RB Series 2013 A (AMT) (A/A2) | |
| | 5,000,000 | | | 5.500 | | | 11/15/29 | | | | 5,901,700 | |
| Denver Colorado Health and Hospital Authority Healthcare RB
Refunding Series 2017 A (BBB/NR)(g) |
|
| | 4,995,000 | | | 5.000 | | | 12/01/25 | | | | 5,775,818 | |
| | 2,490,000 | | | 5.000 | | | 12/01/26 | | | | 2,879,735 | |
| Denver Colorado Health and Hospital Authority Healthcare RB
Series 2007 B (BBB/NR)(e) |
|
| | 5,000,000 | | | (3 Mo. LIBOR + 1.10%,
15.00% Cap),1.982 | | | 12/01/33 | | | | 4,450,450 | |
| Dominion Water & Sanitation District Tap Fee RB Series 2016
(NR/NR) |
|
| | 925,000 | | | 5.750 | | | 12/01/36 | | | | 969,317 | |
| | 2,500,000 | | | 6.000 | | | 12/01/46 | | | | 2,612,100 | |
| | E-470 Public Highway Authority RB Series 2010 A (A-/A3)(d) | |
| | 6,000,000 | | | 0.000 | | | 09/01/40 | | | | 2,325,540 | |
| E-470 Public Highway Authority Senior RB Series 2017 B
(A-/A3)(b) |
|
| | 2,000,000 | | | (1 Mo. LIBOR + 1.05%,
10.00% Cap),1.877 | | | 09/01/21 | | | | 2,030,400 | |
| Palisade Metropolitan District No. 2 GO Refunding Limited Tax
Bonds Series 2016 (NR/NR) |
|
| | 500,000 | | | 4.375 | | | 12/01/31 | | | | 492,450 | |
| | 500,000 | | | 5.000 | | | 12/01/46 | | | | 506,270 | |
| Sterling Hills West Metropolitan District GO Refunding Bonds
Series 2017 (NR/Baa2) |
|
| | 350,000 | | | 5.000 | | | 12/01/32 | | | | 400,999 | |
| | | | | | | | | | | | |
| | | | | | | | | | | 46,429,467 | |
| | |
| Municipal Bonds – (continued) | |
| Connecticut – 1.2% | |
| | Connecticut State GO Refunding Bonds Series 2017 B (A+/A1) | |
| 5,000,000 | | | 5.000 | | | 04/15/28 | | | | 5,932,150 | |
| Hartford County Metropolitan District GO Bonds Series 2016 C
(AGM) (AA/Aa3) |
|
| | 5,540,000 | | | 5.000 | | | 11/01/26 | | | | 6,569,443 | |
| Mohegan Tribal Finance Authority Tribal RB Economic
Development Bonds Series 2015 (B-/NR)(g) |
|
| | 3,760,000 | | | 7.000 | | | 02/01/45 | | | | 3,985,036 | |
| | | | | | | | | | | | |
| | | | | | | | | | | 16,486,629 | |
| | |
| Delaware – 0.6% | |
| | New Castle County Delaware GO Bonds Series 2015 (AAA/Aaa) | |
| | 5,000,000 | | | 5.000 | | | 10/01/26 | | | | 6,136,250 | |
| | University of Delaware RB Series 2015 (AA+/Aa1) | |
| | 1,805,000 | | | 5.000 | | | 11/01/33 | | | | 2,109,287 | |
| | | | | | | | | | | | |
| | | | | | | | | | | 8,245,537 | |
| | |
| District of Columbia – 2.5% | |
| District of Columbia GO Bonds Series 2007 A (NATL-RE)
(AA/Aa1) |
|
| | 10,080,000 | | | 3.000 | | | 06/01/30 | | | | 10,084,335 | |
| District of Columbia GO Refunding Bonds Series 2017 A
(AA/Aa1) |
|
| | 10,000,000 | | | 5.000 | | | 06/01/35 | | | | 11,915,900 | |
| | 1,300,000 | | | 4.000 | | | 06/01/37 | | | | 1,391,377 | |
| District of Columbia Tobacco Settlement Financing Corp. RB
Asset-Backed Bonds Series 2001 (BBB/Baa1) |
|
| | 885,000 | | | 6.500 | | | 05/15/33 | | | | 998,802 | |
| District of Columbia Water & Sewer Authority RB Public Utility
Senior Lien Series 2009 A (AAA/Aa1)(a) |
|
| | 5,000,000 | | | 6.000 | | | 10/01/18 | | | | 5,249,850 | |
| District of Columbia Water & Sewer Authority RB Refunding
Public Utility Subordinate Lien Series 2016 A (AA+/Aa2) |
|
| | 5,000,000 | | | 5.000 | | | 10/01/36 | | | | 5,847,050 | |
| | | | | | | | | | | | |
| | | | | | | | | | | 35,487,314 | |
| | |
| Florida – 11.2% | |
| Anthem Park Community Development District Special
Assessment RB Refunding Senior Series 2016 A-1 (BBB-/NR) |
|
| | 360,000 | | | 2.500 | | | 05/01/24 | | | | 349,743 | |
| | 370,000 | | | 3.000 | | | 05/01/25 | | | | 366,770 | |
| | 380,000 | | | 3.000 | | | 05/01/26 | | | | 374,893 | |
| | 395,000 | | | 3.125 | | | 05/01/27 | | | | 391,599 | |
| Anthem Park Community Development District Special
Assessment RB Refunding Subordinate Series 2016 A-2
(NR/NR) |
|
| | 395,000 | | | 4.250 | | | 05/01/27 | | | | 379,634 | |
| | 410,000 | | | 4.750 | | | 05/01/36 | | | | 383,535 | |
| Arbor Greene Community Development District Special
Assessment Refunding Series 2006 (A/NR) |
|
| | 455,000 | | | 5.000 | | | 05/01/19 | | | | 472,777 | |
| Avalon Groves Community Development District Special
Assessment for Assessment Area One Project Series 2017
(NR/NR) |
|
| | 210,000 | | | 5.000 | | | 05/01/28 | | | | 211,604 | |
| | |
| | |
| The accompanying notes are an integral part of these financial statements. | | 21 |
GOLDMAN SACHS DYNAMIC MUNICIPAL INCOME FUND
Schedule of Investments (continued)
September 30, 2017 (Unaudited)
| | | | | | | | | | | | | | |
Principal
Amount | | | Interest
Rate | | | Maturity
Date | | | Value | |
| Municipal Bonds – (continued) | |
| Florida – (continued) | |
| Avalon Groves Community Development District Special
Assessment for Assessment Area Two Project Series 2017 A-1
(NR/NR) |
|
| $ | 605,000 | | | | 5.375 | % | | | 05/01/28 | | | $ | 602,804 | |
| Avelar Creek Community Development District Special
Assessment Refunding Series 2016 (BBB+/NR) |
|
| | 175,000 | | | | 2.250 | | | | 05/01/22 | | | | 174,470 | |
| | 175,000 | | | | 2.500 | | | | 05/01/23 | | | | 174,365 | |
| | 180,000 | | | | 2.500 | | | | 05/01/24 | | | | 176,562 | |
| | 185,000 | | | | 3.000 | | | | 05/01/25 | | | | 184,748 | |
| | 195,000 | | | | 3.000 | | | | 05/01/26 | | | | 193,247 | |
| Bannon Lakes Community Development District Special
Assessment RB Series 2016 (NR/NR) |
|
| | 100,000 | | | | 4.500 | | | | 11/01/25 | | | | 102,374 | |
| | 185,000 | | | | 5.000 | | | | 11/01/36 | | | | 190,293 | |
| | 320,000 | | | | 5.000 | | | | 11/01/48 | | | | 321,881 | |
| Bartram Park Community Development District Special
Assessment RB Refunding for City of Jacksonville Florida
Senior Lien Series 2015 A-1 (BBB+/NR) |
|
| | 495,000 | | | | 4.250 | | | | 05/01/29 | | | | 526,180 | |
| | 490,000 | | | | 4.500 | | | | 05/01/35 | | | | 510,943 | |
| Bay Laurel Center Community Development District Special
Assessment RB Refunding Series 2016 Candler (BBB+/NR) |
|
| | 135,000 | | | | 2.500 | | | | 05/01/23 | | | | 134,510 | |
| | 140,000 | | | | 2.750 | | | | 05/01/24 | | | | 139,413 | |
| | 145,000 | | | | 3.000 | | | | 05/01/25 | | | | 144,803 | |
| Baywinds Community Development District Senior Special
Assessment Refunding Bonds Series 2017 A-1 (BBB-/NR) |
|
| | 315,000 | | | | 3.500 | | | | 05/01/23 | | | | 328,794 | |
| | 325,000 | | | | 3.500 | | | | 05/01/24 | | | | 338,575 | |
| | 340,000 | | | | 3.500 | | | | 05/01/25 | | | | 352,611 | |
| | 350,000 | | | | 3.500 | | | | 05/01/26 | | | | 360,469 | |
| | 365,000 | | | | 3.500 | | | | 05/01/27 | | | | 372,453 | |
| Bellagio Community Development District Special Assessment
Bond Series 2016 (BBB-/NR) |
|
| | 160,000 | | | | 2.500 | | | | 11/01/22 | | | | 158,640 | |
| | 160,000 | | | | 2.750 | | | | 11/01/23 | | | | 159,288 | |
| | 170,000 | | | | 3.000 | | | | 11/01/25 | | | | 168,431 | |
| Century Gardens at Tamiami Community Development District
Special Assessment Refunding Series 2016 (BBB/NR) |
|
| | 235,000 | | | | 2.500 | | | | 05/01/23 | | | | 231,618 | |
| | 245,000 | | | | 2.500 | | | | 05/01/24 | | | | 237,305 | |
| | 250,000 | | | | 3.000 | | | | 05/01/25 | | | | 246,157 | |
| | 255,000 | | | | 3.000 | | | | 05/01/26 | | | | 248,763 | |
| | 535,000 | | | | 4.250 | | | | 05/01/37 | | | | 551,435 | |
| Charlotte County Industrial Development Authority Utility
System RB for Town & Country Utilities Project Series 2015
(AMT) (NR/NR)(g) |
|
| | 1,250,000 | | | | 5.500 | | | | 10/01/36 | | | | 1,226,900 | |
| City of Cape Coral Water & Sewer RB Refunding Series 2015
(A/A1) |
|
| | 1,000,000 | | | | 4.000 | | | | 10/01/34 | | | | 1,048,120 | |
| City of West Palm Beach Utility System RB Series 2017 A
(AA+/Aa2) |
|
| | 15,000,000 | | | | 5.000 | | | | 10/01/42 | | | | 17,433,300 | |
| | |
| Municipal Bonds – (continued) | |
| Florida – (continued) | |
| Coconut Cay Community Development District Special
Assessment Series 2006 (NR/NR) |
|
| 790,000 | | | | 5.375 | | | | 05/01/36 | | | | 790,126 | |
| Concord Station Community Development District Capital
Improvement RB Refunding Senior Lien Series 2016 A-1
(BBB-/NR) |
|
| | 880,000 | | | | 2.375 | | | | 05/01/23 | | | | 863,033 | |
| | 900,000 | | | | 2.500 | | | | 05/01/24 | | | | 878,571 | |
| | 925,000 | | | | 2.750 | | | | 05/01/25 | | | | 906,343 | |
| | 920,000 | | | | 3.000 | | | | 05/01/26 | | | | 913,100 | |
| | 985,000 | | | | 3.200 | | | | 05/01/27 | | | | 988,664 | |
| | 1,015,000 | | | | 3.250 | | | | 05/01/28 | | | | 1,018,766 | |
| | 1,500,000 | | | | 3.750 | | | | 05/01/46 | | | | 1,421,745 | |
| Coronado Community Development District Special Assessment
Refunding & Improvement Bonds Series 2017 (BBB/NR) |
|
| | 129,000 | | | | 3.000 | | | | 05/01/23 | | | | 130,455 | |
| | 133,000 | | | | 3.250 | | | | 05/01/24 | | | | 134,731 | |
| | 138,000 | | | | 3.500 | | | | 05/01/25 | | | | 140,484 | |
| | 143,000 | | | | 3.625 | | | | 05/01/26 | | | | 146,122 | |
| Country Walk Community Development District Special
Assessment RB Refunding Senior Lien Series 2015 A-1
(A-/NR) |
|
| | 195,000 | | | | 2.875 | | | | 05/01/21 | | | | 199,842 | |
| | 200,000 | | | | 3.000 | | | | 05/01/22 | | | | 205,170 | |
| | 205,000 | | | | 3.250 | | | | 05/01/23 | | | | 211,228 | |
| | 210,000 | | | | 3.375 | | | | 05/01/24 | | | | 215,805 | |
| | 220,000 | | | | 3.500 | | | | 05/01/25 | | | | 227,251 | |
| | 215,000 | | | | 4.125 | | | | 05/01/35 | | | | 223,503 | |
| Crossings at Fleming Island Community Development District
RB Refunding Series 2007 (NATL-RE) (A/A3)(a) |
|
| | 125,000 | | | | 4.750 | | | | 10/01/17 | | | | 125,000 | |
| Crossings at Fleming Island Community Development District
Special Assessment RB Refunding Senior Lien Series 2014
A-1 (BBB/NR) |
|
| | 2,025,000 | | | | 4.000 | | | | 05/01/24 | | | | 2,131,333 | |
| Durbin Crossing Community Development District Special
Assessment Refunding Senior Series 2017 A-1 (AGM)
(AA/NR) |
|
| | 700,000 | | | | 3.750 | | | | 05/01/34 | | | | 721,609 | |
| | 965,000 | | | | 4.000 | | | | 05/01/37 | | | | 1,006,350 | |
| Florida State Municipal Power Agency RB Series 2009 A
(A+/A2)(a) |
|
| | 1,000,000 | | | | 6.250 | | | | 10/01/19 | | | | 1,103,410 | |
| Grand Bay at Doral Community Development District Special
Assessment for South Parcel Assessment Area Project
Series 2016 (NR/NR) |
|
| | 1,000,000 | | | | 4.250 | | | | 05/01/26 | | | | 1,024,450 | |
| Greater Orlando Aviation Authority Airport Facilities RB
Refunding for Jetblue Airways Corp. Project Series 2013
(AMT) (NR/NR) |
|
| | 920,000 | | | | 5.000 | | | | 11/15/36 | | | | 953,644 | |
| Greater Orlando Aviation Authority RB Refunding Series 2012 A
(AMT) (AA-/Aa3) |
|
| | 2,050,000 | | | | 5.000 | | | | 10/01/21 | | | | 2,333,167 | |
| | |
| | |
| 22 | | The accompanying notes are an integral part of these financial statements. |
GOLDMAN SACHS DYNAMIC MUNICIPAL INCOME FUND
| | | | | | | | | | | | | | |
Principal
Amount | | | Interest
Rate | | | Maturity
Date | | | Value | |
| Municipal Bonds – (continued) | |
| Florida – (continued) | |
| Hacienda Lakes Community Development District Special
Assessment Refunding Series 2016 (NR/NR) |
|
| $ | 370,000 | | | | 3.375 | % | | | 05/01/21 | | | $ | 366,855 | |
| | 550,000 | | | | 3.875 | | | | 05/01/26 | | | | 537,609 | |
| Hawks Point Community Development District Special
Assessment Refunding Senior Series 2017 A-1 (BBB+/NR)(g) |
|
| | 265,000 | | | | 4.000 | | | | 05/01/24 | | | | 283,651 | |
| | 265,000 | | | | 4.000 | | | | 05/01/25 | | | | 282,469 | |
| | 140,000 | | | | 4.000 | | | | 05/01/26 | | | | 149,206 | |
| Heritage Isle at Viera Community Development District Special
Assessment Refunding Series 2017 (AGM) (AA/NR) |
|
| | 215,000 | | | | 4.000 | | | | 05/01/24 | | | | 232,411 | |
| | 225,000 | | | | 4.000 | | | | 05/01/25 | | | | 243,317 | |
| | 235,000 | | | | 4.000 | | | | 05/01/26 | | | | 253,946 | |
| | 240,000 | | | | 4.000 | | | | 05/01/27 | | | | 259,224 | |
| | 250,000 | | | | 4.000 | | | | 05/01/28 | | | | 267,875 | |
| Heritage Landing Community Development District Special
Assessment Refunding Bonds Series 2015 (BBB/NR) |
|
| | 585,000 | | | | 3.375 | | | | 05/01/23 | | | | 605,925 | |
| | 605,000 | | | | 3.500 | | | | 05/01/24 | | | | 625,485 | |
| | 630,000 | | | | 3.625 | | | | 05/01/25 | | | | 650,885 | |
| | 650,000 | | | | 3.750 | | | | 05/01/26 | | | | 669,455 | |
| | 1,000,000 | | | | 4.200 | | | | 05/01/31 | | | | 1,055,760 | |
| Highlands Community Development District Special Assessment
Refunding Series 2016 (BBB-/NR) |
|
| | 1,225,000 | | | | 4.250 | | | | 05/01/31 | | | | 1,301,710 | |
| Highlands Meadows II Community Development District Special
Assessment Bonds for Assessment Area Five Project
Series 2017 (NR/NR) |
|
| | 305,000 | | | | 4.250 | | | | 11/01/22 | | | | 309,127 | |
| | 475,000 | | | | 4.875 | | | | 11/01/27 | | | | 493,952 | |
| | 1,100,000 | | | | 5.375 | | | | 11/01/37 | | | | 1,149,126 | |
| | 1,000,000 | | | | 5.500 | | | | 11/01/47 | | | | 1,042,380 | |
| Highlands Meadows II Community Development District Special
Assessment Bonds for Assessment Area Six Project
Series 2017 (NR/NR) |
|
| | 115,000 | | | | 4.875 | | | | 11/01/27 | | | | 119,589 | |
| | 500,000 | | | | 5.500 | | | | 11/01/47 | | | | 521,190 | |
| Lakewood Ranch Stewardship District Special Assessment RB
for Del Webb Project Series 2017 (NR/NR)(g) |
|
| | 635,000 | | | | 3.650 | | | | 05/01/22 | | | | 638,175 | |
| | 520,000 | | | | 4.300 | | | | 05/01/27 | | | | 525,054 | |
| Lakewood Ranch Stewardship District Special Assessment RB
for Lakewood Centre North Project Series 2015 (NR/NR) |
|
| | 1,850,000 | | | | 4.250 | | | | 05/01/25 | | | | 1,870,942 | |
| | 1,710,000 | | | | 4.875 | | | | 05/01/35 | | | | 1,734,282 | |
| | 985,000 | | | | 4.875 | | | | 05/01/45 | | | | 976,844 | |
| Lakewood Ranch Stewardship District Special Assessment RB
for Lakewood National & Polo Run Projects Series 2017
(NR/NR) |
|
| | 500,000 | | | | 4.000 | | | | 05/01/22 | | | | 503,750 | |
| | 940,000 | | | | 4.625 | | | | 05/01/27 | | | | 979,066 | |
| | 1,000,000 | | | | 5.250 | | | | 05/01/37 | | | | 1,065,010 | |
| | |
| Municipal Bonds – (continued) | |
| Florida – (continued) | |
| Lakewood Ranch Stewardship District Special Assessment RB
for Villages of Lakewood Ranch South Project Series 2016
(NR/NR) |
|
| 450,000 | | | | 4.000 | | | | 05/01/21 | | | | 456,498 | |
| | 235,000 | | | | 4.250 | | | | 05/01/26 | | | | 240,607 | |
| | 5,190,000 | | | | 5.000 | | | | 05/01/36 | | | | 5,425,419 | |
| | 5,160,000 | | | | 5.125 | | | | 05/01/46 | | | | 5,364,852 | |
| Lee County Moody River Estates Community Development
District Special Assessment Refunding Senior Series 2017 A-1
(BBB+/NR) |
|
| | 330,000 | | | | 3.500 | | | | 05/01/25 | | | | 342,467 | |
| | 340,000 | | | | 3.500 | | | | 05/01/26 | | | | 350,428 | |
| Longleaf Community Development District Special Assessment
Refunding Series 2006 (NR/NR) |
|
| | 930,000 | | | | 5.375 | | | | 05/01/30 | | | | 928,698 | |
| Meadow Pines Community Development District Special
Assessment Refunding Bonds Senior Lien Series 2014 1
(A-/NR) |
|
| | 750,000 | | | | 4.450 | | | | 05/01/30 | | | | 803,063 | |
| Miami Special Obligation Non-Ad Valorem RB Refunding
Series 2011 A (AGM) (AA/A1) |
|
| | 1,200,000 | | | | 6.000 | | | | 02/01/30 | | | | 1,369,152 | |
| | 1,500,000 | | | | 6.000 | | | | 02/01/31 | | | | 1,710,930 | |
| Miami Special Obligation RB Refunding for Port of Miami
Tunnel Project Series 2012 (A+/A1)(g) |
|
| | 9,500,000 | | | | 5.000 | | | | 03/01/30 | | | | 10,782,310 | |
| Miami World Center Community Development District Special
Assessment Bonds Series 2017 (NR/NR) |
|
| | 250,000 | | | | 4.000 | | | | 11/01/23 | | | | 256,310 | |
| | 250,000 | | | | 4.750 | | | | 11/01/27 | | | | 262,925 | |
| | 850,000 | | | | 5.125 | | | | 11/01/39 | | | | 892,636 | |
| | 2,350,000 | | | | 5.250 | | | | 11/01/49 | | | | 2,493,773 | |
| Miami-Dade County Aviation RB for Miami International Airport
Series 2007 A (AMT) (NATL-RE) (A/A2) |
|
| | 5,000,000 | | | | 5.000 | | | | 10/01/39 | | | | 5,000,000 | |
| Miami-Dade County IDA Solid Waste Disposal RB for Waste
Management Inc. Project Series 2008 (A-/NR)(b)(c) |
|
| | 4,000,000 | | | | 1.450 | | | | 08/01/18 | | | | 3,999,960 | |
| Miromar Lakes Community Development District Capital
Impovement RB Refunding Series 2015 (NR/NR) |
|
| | 615,000 | | | | 3.500 | | | | 05/01/20 | | | | 618,339 | |
| North Sumter County Utility Dependent District RB Series 2010
(AGM) (AA/A2) |
|
| | 1,250,000 | | | | 5.375 | | | | 10/01/40 | | | | 1,386,275 | |
| Osceola County Rolling Oaks Community Development District
Special Assessment Bonds Series 2016 (NR/NR) |
|
| | 3,285,000 | | | | 5.875 | | | | 11/01/37 | | | | 3,561,663 | |
| | 3,500,000 | | | | 6.000 | | | | 11/01/47 | | | | 3,720,115 | |
| Palm Glades Community Development District Special
Assessment Refunding Bonds Series 2016 (BBB/NR) |
|
| | 520,000 | | | | 2.500 | | | | 05/01/22 | | | | 519,324 | |
| | 530,000 | | | | 2.750 | | | | 05/01/23 | | | | 529,178 | |
| | 350,000 | | | | 3.750 | | | | 05/01/31 | | | | 350,504 | |
| | 1,045,000 | | | | 4.000 | | | | 05/01/36 | | | | 1,051,887 | |
| | |
| | |
| The accompanying notes are an integral part of these financial statements. | | 23 |
GOLDMAN SACHS DYNAMIC MUNICIPAL INCOME FUND
Schedule of Investments (continued)
September 30, 2017 (Unaudited)
| | | | | | | | | | | | | | |
Principal
Amount | | | Interest
Rate | | | Maturity
Date | | | Value | |
| Municipal Bonds – (continued) | |
| Florida – (continued) | |
| Palm Glades Community Development District Special
Assessment Refunding Bonds Series 2017 (BBB-/NR) |
|
| $ | 500,000 | | | | 3.500 | % | | | 05/01/21 | | | $ | 500,210 | |
| | 300,000 | | | | 4.000 | | | | 05/01/27 | | | | 300,372 | |
| Pentathlon Community Development District Special Assessment
Revenue Refunding Series 2012 (A-/NR) |
|
| | 1,330,000 | | | | 4.500 | | | | 11/01/33 | | | | 1,353,634 | |
| Randal Park Community Development District Special
Assessment RB Series 2015 (NR/NR) |
|
| | 800,000 | | | | 4.250 | | | | 11/01/25 | | | | 808,208 | |
| River Bend Community Development District Special
Assessment RB Refunding Senior Series 2016 A-1 (BBB+/NR) |
|
| | 890,000 | | | | 4.000 | | | | 05/01/35 | | | | 892,821 | |
| South Fork East Community Development District Capital
Improvement RB Refunding Series 2017 (BBB/NR) |
|
| | 425,000 | | | | 3.000 | | | | 05/01/23 | | | | 429,794 | |
| | 435,000 | | | | 3.250 | | | | 05/01/24 | | | | 440,664 | |
| | 450,000 | | | | 3.450 | | | | 05/01/25 | | | | 456,601 | |
| | 465,000 | | | | 3.625 | | | | 05/01/26 | | | | 475,151 | |
| South Kendall Community Development District Special
Assessment Refunding Series 2016 (BBB-/NR) |
|
| | 350,000 | | | | 2.500 | | | | 11/01/23 | | | | 343,588 | |
| | 355,000 | | | | 2.750 | | | | 11/01/24 | | | | 349,820 | |
| | 370,000 | | | | 3.000 | | | | 11/01/25 | | | | 366,585 | |
| | 585,000 | | | | 4.250 | | | | 11/01/37 | | | | 601,696 | |
| St. Petersburg Health Facilities Authority RB Refunding for All
Children’s Hospital Series 2009 A (NR/Aa3)(a) |
|
| | 2,000,000 | | | | 6.500 | | | | 11/15/19 | | | �� | 2,220,400 | |
| Stonebrier Community Development District Special Assessment
Refunding Series 2016 (A-/NR) |
|
| | 265,000 | | | | 2.500 | | | | 05/01/23 | | | | 265,408 | |
| | 275,000 | | | | 2.500 | | | | 05/01/24 | | | | 272,687 | |
| | 280,000 | | | | 3.000 | | | | 05/01/25 | | | | 281,887 | |
| | 290,000 | | | | 3.000 | | | | 05/01/26 | | | | 286,964 | |
| Talis Park Community Development District Capital
Improvement RB Refunding Senior Series 2016 A-1
(BBB+/NR) |
|
| | 190,000 | | | | 2.500 | | | | 05/01/23 | | | | 189,310 | |
| | 190,000 | | | | 2.500 | | | | 05/01/24 | | | | 186,371 | |
| | 200,000 | | | | 3.000 | | | | 05/01/25 | | | | 199,728 | |
| | 205,000 | | | | 3.000 | | | | 05/01/26 | | | | 203,157 | |
| | 1,135,000 | | | | 3.500 | | | | 05/01/31 | | | | 1,145,896 | |
| | 1,370,000 | | | | 4.000 | | | | 05/01/36 | | | | 1,408,059 | |
| Tampa Palms Open Space & Transportation Community
Development District Special Assessment Refunding for
Capital Improvement Area 7 Project Series 2004 (NATL-RE)
(A/A3) |
|
| | 305,000 | | | | 4.500 | | | | 05/01/18 | | | | 310,899 | |
| Tapestry Community Development District Special Assessment
RB Series 2016 (NR/NR) |
|
| | 220,000 | | | | 3.625 | | | | 05/01/21 | | | | 223,718 | |
| Tison’s Landing Community Development District Special
Assessment RB Refunding & Improvement Bonds Senior
Series 2016 A-1 (BBB/NR) |
|
| | 205,000 | | | | 3.000 | | | | 05/01/27 | | | | 200,312 | |
| | 215,000 | | | | 3.125 | | | | 05/01/28 | | | | 211,093 | |
| | |
| Municipal Bonds – (continued) | |
| Florida – (continued) | |
| TSR Community Development District Special Assessment RB
for Village 1 Project Series 2015 (NR/NR) |
|
| 350,000 | | | | 3.625 | | | | 11/01/20 | | | | 350,563 | |
| | 530,000 | | | | 4.375 | | | | 11/01/25 | | | | 533,244 | |
| Turnbull Creek Community Development District Senior Special
Assessment Refunding Bonds Series 2015 A-1 (BBB/NR) |
|
| | 1,000,000 | | | | 4.250 | | | | 05/01/31 | | | | 1,053,640 | |
| Two Creeks Community Development District RB Refunding for
Capital Improvement Senior Lien Series 2016 A-1 (BBB-/NR) |
|
| | 365,000 | | | | 2.125 | | | | 05/01/22 | | | | 357,868 | |
| | 375,000 | | | | 2.250 | | | | 05/01/23 | | | | 363,847 | |
| | 380,000 | | | | 2.500 | | | | 05/01/24 | | | | 369,174 | |
| | 390,000 | | | | 2.625 | | | | 05/01/25 | | | | 376,798 | |
| | 405,000 | | | | 3.000 | | | | 05/01/26 | | | | 399,557 | |
| | 415,000 | | | | 3.125 | | | | 05/01/27 | | | | 411,427 | |
| | 430,000 | | | | 3.250 | | | | 05/01/28 | | | | 426,947 | |
| Verandah East Community Development District Special
Assessment Refunding & Improvement RB Series 2016
(NR/NR) |
|
| | 1,570,000 | | | | 3.750 | | | | 05/01/26 | | | | 1,547,298 | |
| Verano #1 Community Development District Senior Special
Assessment Refunding for Community Infrastructure Project
Series 2017 A-1 (BBB/NR)(g) |
|
| | 345,000 | | | | 3.250 | | | | 05/01/24 | | | | 349,492 | |
| | 360,000 | | | | 3.500 | | | | 05/01/25 | | | | 366,480 | |
| | 370,000 | | | | 3.625 | | | | 05/01/26 | | | | 378,077 | |
| Verano #1 Community Development District Special Assessment
Bonds for District #1 Project Series 2015 (NR/NR) |
|
| | 750,000 | | | | 4.750 | | | | 11/01/25 | | | | 760,650 | |
| Verona Walk Community Development District Special
Assessment Senior Lien RB Refunding for Capital
Improvement Series 2013 A-1 (A+/NR) |
|
| | 500,000 | | | | 4.250 | | | | 05/01/30 | | | | 530,605 | |
| Village Community Development District No. 6 Special
Assessment RB Refunding Series 2017 (A-/NR) |
|
| | 360,000 | | | | 4.000 | | | | 05/01/26 | | | | 386,478 | |
| | 355,000 | | | | 4.000 | | | | 05/01/27 | | | | 380,077 | |
| | 365,000 | | | | 4.000 | | | | 05/01/28 | | | | 387,367 | |
| | 380,000 | | | | 4.000 | | | | 05/01/29 | | | | 400,087 | |
| Village Community Development District No. 6 Special
Assessment RB Refunding Series 2017 (BAM) (AA/NR) |
|
| | 2,000,000 | | | | 3.500 | | | | 05/01/32 | | | | 2,021,100 | |
| | 2,385,000 | | | | 4.000 | | | | 05/01/37 | | | | 2,436,397 | |
| Vizcaya In Kendall Community Development District Special
Assessment Bonds Series 2016 (BBB-/NR) |
|
| | 220,000 | | | | 2.750 | | | | 11/01/24 | | | | 216,790 | |
| | 225,000 | | | | 3.000 | | | | 11/01/25 | | | | 222,923 | |
| | 230,000 | | | | 3.200 | | | | 11/01/26 | | | | 230,357 | |
| Waterford Landing Community Development District Capital
Improvement RB Series 2014 (NR/NR) |
|
| | 795,000 | | | | 5.500 | | | | 05/01/34 | | | | 826,037 | |
| | 925,000 | | | | 5.750 | | | | 05/01/44 | | | | 971,897 | |
| Waters Edge Community Development District Capital
Improvement RB Refunding Senior Lien Series 2015 A-1
(BBB+/NR) |
|
| | 2,150,000 | | | | 4.000 | | | | 05/01/31 | | | | 2,209,620 | |
| | |
| | |
| 24 | | The accompanying notes are an integral part of these financial statements. |
GOLDMAN SACHS DYNAMIC MUNICIPAL INCOME FUND
| | | | | | | | | | | | |
Principal
Amount | | | Interest
Rate | | Maturity
Date | | | Value | |
| Municipal Bonds – (continued) | |
| Florida – (continued) | |
| Waterset North Community Development District Special
Assessment RB Series 2014 (NR/NR) |
|
| $ | 2,420,000 | | | 5.500 % | | | 11/01/45 | | | $ | 2,519,075 | |
| Wiregrass Community Development District Capital
Improvement RB Series 2016 (NR/NR) |
|
| | 135,000 | | | 4.875 | | | 05/01/36 | | | | 135,983 | |
| | 250,000 | | | 5.000 | | | 05/01/47 | | | | 249,607 | |
| Wynnfield Lakes Community Development District Special
Assessment Refunding Bonds Series 2014 (BBB+/NR) |
|
| | 1,470,000 | | | 4.500 | | | 05/01/36 | | | | 1,488,331 | |
| | | | | | | | | | | | |
| | | | | | | | | | | 159,698,318 | |
| | |
| Georgia – 1.0% | |
| | Atlanta Airport RB Refunding Series 2012 C (AMT) (AA-/Aa3) | |
| | 1,250,000 | | | 5.000 | | | 01/01/27 | | | | 1,405,625 | |
| Burke County Development Authority Pollution Control RB for
Georgia Power Company Plant Vogtle Project First Series 2008
(A-/A3)(b)(c) |
|
| | 3,500,000 | | | 1.650 | | | 06/18/21 | | | | 3,424,435 | |
| Gainesville & Hall County Development Authority RB Refunding
for Riverside Military Academy Series 2017 (BBB-/NR) |
|
| | 700,000 | | | 5.000 | | | 03/01/27 | | | | 784,112 | |
| Metropolitan Atlanta Rapid Transit Authority Sales Tax RB
Series 2009 A (AA+/Aa2)(a) |
|
| | 4,075,000 | | | 5.250 | | | 07/01/19 | | | | 4,370,763 | |
| Milledgeville & Baldwin County Development Authority Student
Housing RB Refunding for Georgia College & State University
Foundation Property V, LLC Project Series 2007 (AMBAC)
(A+/WR)(e) |
|
| | 5,200,000 | | | (3 Mo. LIBOR + 0.65%),
1.520 | | | 10/01/33 | | | | 4,569,656 | |
| | | | | | | | | | | | |
| | | | | | | | | | | 14,554,591 | |
| | |
| Guam – 1.4% | |
| Guam Government Business Privilege Tax RB Refunding
Series 2015 D (A/NR) |
|
| | 3,000,000 | | | 5.000 | | | 11/15/22 | | | | 3,364,650 | |
| Guam Government Business Privilege Tax RB Series 2012 B-1
(A/NR) |
|
| | 2,980,000 | | | 5.000 | | | 01/01/29 | | | | 3,146,880 | |
| Guam Government Limited Obligation RB Section 30
Series 2009 A (BBB+/NR)(a) |
|
| | 850,000 | | | 5.625 | | | 12/01/19 | | | | 932,288 | |
| | 750,000 | | | 5.750 | | | 12/01/19 | | | | 824,603 | |
| Guam Government Limited Obligation RB Section 30
Series 2016 A (BBB+/NR) |
|
| | 2,755,000 | | | 5.000 | | | 12/01/25 | | | | 3,197,067 | |
| | 2,255,000 | | | 5.000 | | | 12/01/26 | | | | 2,626,669 | |
| | 2,000,000 | | | 5.000 | | | 12/01/27 | | | | 2,314,120 | |
| | Guam Power Authority RB 2014 Series A (AGM) (AA/A2) | |
| | 325,000 | | | 5.000 | | | 10/01/39 | | | | 359,531 | |
| | 250,000 | | | 5.000 | | | 10/01/44 | | | | 275,233 | |
| Guam Power Authority RB Refunding Series 2012 A (AGM)
(AA/A2) |
|
| | 1,500,000 | | | 5.000 | | | 10/01/24 | | | | 1,696,905 | |
| | |
| Municipal Bonds – (continued) | |
| Guam – (continued) | |
| Guam Waterworks Authority RB for Water & Wastewater System
Series 2016 (A-/Baa2) |
|
| 1,030,000 | | | | 5.000 | | | | 01/01/46 | | | | 1,101,946 | |
| | | | | | | | | | | | | | |
| | | | | | | | | | | | | 19,839,892 | |
| | |
| Hawaii – 0.4% | |
| Hawaii State Department of Budget & Finance RB Refunding for
Hawaiian Electric Co., Inc. Series 2017 B (AMT) (A-/Baa2) |
|
| | 5,025,000 | | | | 4.000 | | | | 03/01/37 | | | | 5,201,176 | |
| | |
| Idaho – 0.2% | |
| Idaho Health Facilities Authority RB for St. Luke’s Health
System Project Series 2008 (A-/A3) |
|
| | 1,000,000 | | | | 6.750 | | | | 11/01/37 | | | | 1,056,790 | |
| Nez Perce County PCRB Refunding for Potlatch Corp. Project
Series 2016 (BB+/Ba1) |
|
| | 2,000,000 | | | | 2.750 | | | | 10/01/24 | | | | 1,941,540 | |
| | | | | | | | | | | | | | |
| | | | | | | | | | | | | 2,998,330 | |
| | |
| Illinois – 9.1% | |
| Chicago Illinois Board of Education Dedicated Capital
Improvement Series 2016 (A/NR) |
|
| | 3,550,000 | | | | 6.000 | | | | 04/01/46 | | | | 4,176,894 | |
| Chicago Illinois Board of Education GO Bonds Capital
Appreciation for School Reform Series 1998 B-1 (NATL-RE
FGIC) (A/A3)(d) |
|
| | 1,895,000 | | | | 0.000 | | | | 12/01/26 | | | | 1,329,058 | |
| Chicago Illinois Board of Education GO Bonds Capital
Appreciation for School Reform Series 1998 B-1 (NATL-RE)
(A/A3)(d) |
|
| | 2,880,000 | | | | 0.000 | | | | 12/01/29 | | | | 1,739,347 | |
| Chicago Illinois Board of Education GO Bonds Capital
Appreciation Series 2009 C (BBB+/Ba1)(d) |
|
| | 510,000 | | | | 0.000 | | | | 01/01/31 | | | | 276,721 | |
| Chicago Illinois Board of Education GO Bonds Series 2015 C
(B/NR) |
|
| | 2,500,000 | | | | 6.000 | | | | 12/01/35 | | | | 2,706,550 | |
| Chicago Illinois Board of Education GO Refunding Bonds
Series 2015 A (B/NR)(c) |
|
| | 4,500,000 | | | | 9.000 | | | | 03/01/32 | | | | 4,523,670 | |
| Chicago Illinois Board of Education Unlimited Tax GO
Refunding Bonds for Dedicated Revenues Series 2009 E
(B/B3) |
|
| | 2,300,000 | | | | 6.038 | | | | 12/01/29 | | | | 2,195,465 | |
| | 2,500,000 | | | | 6.138 | | | | 12/01/39 | | | | 2,317,225 | |
| Chicago Illinois Board of Education Unlimited Tax GO
Refunding Bonds for Dedicated Revenues Series 2016 A
(B/NR) |
|
| | 5,160,000 | | | | 7.000 | | | | 12/01/44 | | | | 6,028,738 | |
| Chicago Illinois Board of Education Unlimited Tax GO
Refunding Bonds for Dedicated Revenues Series 2016 B
(B/NR) |
|
| | 7,125,000 | | | | 6.500 | | | | 12/01/46 | | | | 8,098,631 | |
| Chicago Illinois Capital Appreciation Refunding & Project
Series 2009 C (BBB+/Ba1)(d) |
|
| | 750,000 | | | | 0.000 | | | | 01/01/32 | | | | 384,817 | |
| | |
| | |
| The accompanying notes are an integral part of these financial statements. | | 25 |
GOLDMAN SACHS DYNAMIC MUNICIPAL INCOME FUND
Schedule of Investments (continued)
September 30, 2017 (Unaudited)
| | | | | | | | | | | | | | |
Principal
Amount | | | Interest
Rate | | | Maturity
Date | | | Value | |
| Municipal Bonds – (continued) | |
| Illinois – (continued) | |
| Chicago Illinois GO Bonds Project and Refunding RMKT
06/08/15 Series 2005 D (BBB+/Ba1) |
|
| $ | 300,000 | | | | 5.500 | % | | | 01/01/37 | | | $ | 325,488 | |
| | 2,720,000 | | | | 5.500 | | | | 01/01/40 | | | | 2,935,179 | |
| Chicago Illinois GO Bonds Project Refunding Series 2014 A
(BBB+/Ba1) |
|
| | 1,500,000 | | | | 5.250 | | | | 01/01/33 | | | | 1,591,545 | |
| | 630,000 | | | | 5.000 | | | | 01/01/34 | | | | 661,273 | |
| | 450,000 | | | | 5.000 | | | | 01/01/36 | | | | 471,326 | |
| Chicago Illinois GO Bonds Project Refunding Series 2017 A
(BBB+/NR) |
|
| | 3,375,000 | | | | 6.000 | | | | 01/01/38 | | | | 3,909,094 | |
| | Chicago Illinois GO Bonds Project Series 2011 A (BBB+/Ba1) | |
| | 640,000 | | | | 5.000 | | | | 01/01/40 | | | | 660,237 | |
| | Chicago Illinois GO Bonds Project Series 2012 A (BBB+/Ba1) | |
| | 150,000 | | | | 5.000 | | | | 01/01/34 | | | | 155,260 | |
| | Chicago Illinois GO Bonds Series 2015 A (BBB+/NR) | |
| | 1,320,000 | | | | 5.500 | | | | 01/01/39 | | | | 1,433,005 | |
| Chicago Illinois GO Refunding Bonds Capital Appreciation
Series 2007 C (NATL-RE) (A/A3) |
|
| | 5,000,000 | | | | 5.000 | | | | 01/01/30 | | | | 5,033,800 | |
| Chicago Illinois GO Refunding Bonds for Taxable Project
Series 2014 B (BBB+/Ba1) |
|
| | 3,000,000 | | | | 6.314 | | | | 01/01/44 | | | | 3,207,840 | |
| | Chicago Illinois GO Refunding Bonds Series 2009 C (BBB+/Ba1) | |
| | 675,000 | | | | 5.000 | | | | 01/01/40 | | | | 689,344 | |
| | Chicago Illinois GO Refunding Bonds Series 2015 C (BBB+/NR) | |
| | 2,545,000 | | | | 5.000 | | | | 01/01/24 | | | | 2,814,439 | |
| | 4,435,000 | | | | 5.000 | | | | 01/01/25 | | | | 4,920,100 | |
| | 1,200,000 | | | | 5.000 | | | | 01/01/38 | | | | 1,270,524 | |
| Chicago Illinois Midway Airport RB Refunding Second Lien
Series 2013 A (AMT) (A/A3) |
|
| | 2,500,000 | | | | 5.500 | | | | 01/01/29 | | | | 2,899,725 | |
| Chicago Illinois O’Hare International Airport RB Refunding
General Airport Senior Lien Series 2015 A (AMT) (A/NR) |
|
| | 820,000 | | | | 5.000 | | | | 01/01/23 | | | | 943,197 | |
| Chicago Illinois O’Hare International Airport RB Refunding
General Airport Senior Lien Series 2016 D (A/NR) |
|
| | 3,000,000 | | | | 5.250 | | | | 01/01/35 | | | | 3,559,920 | |
| | Chicago Illinois Sales Tax Refunding Series 2002 (AA/NR) | |
| | 1,000,000 | | | | 5.000 | | | | 01/01/25 | | | | 1,125,150 | |
| Chicago Illinois Tax Increment Allocation RB Refunding for
Pilsen Redevelopment Project Series 2014 A (A/NR) |
|
| | 1,135,000 | | | | 5.000 | | | | 06/01/20 | | | | 1,219,421 | |
| Chicago Illinois Wastewater Transmission RB Second Lien
Series 2017 A (AGM) (AA/NR) |
|
| | 475,000 | | | | 5.250 | | | | 01/01/42 | | | | 543,372 | |
| | 1,330,000 | | | | 4.000 | | | | 01/01/52 | | | | 1,346,359 | |
| Chicago Illinois Water RB Refunding Second Lien Project
RMKT 05/23/16 Series 2000 (A/Baa2) |
|
| | 600,000 | | | | 5.000 | | | | 11/01/29 | | | | 693,180 | |
| Chicago Illinois Water RB Refunding Second Lien Project
RMKT 05/23/16 Series 2004 (A/NR) |
|
| | 1,500,000 | | | | 5.000 | | | | 11/01/26 | | | | 1,769,460 | |
| | |
| Municipal Bonds – (continued) | |
| Illinois – (continued) | |
| Illinois Finance Authority RB for Edward Hospital Obligated
Group RMKT 04/09/08 Series 2008 A (AMBAC) (A/WR)(a) |
|
| 350,000 | | | | 6.250 | | | | 02/01/18 | | | | 356,087 | |
| Illinois Finance Authority RB Refunding for Franciscan
Communities Project Series 2017 A (BBB-/NR) |
|
| | 1,425,000 | | | | 4.000 | | | | 05/15/27 | | | | 1,482,228 | |
| Illinois Sports Facilities Authority Refunding Bonds Series 2014
(AGM) (AA/NR) |
|
| | 4,160,000 | | | | 5.000 | | | | 06/15/27 | | | | 4,608,157 | |
| Illinois State GO Bonds Pension Funding Series 2003
(BBB-/Baa3) |
|
| | 4,165,000 | | | | 5.100 | | | | 06/01/33 | | | | 4,212,065 | |
| | Illinois State GO Bonds Series 2010-5 (BBB-/Baa3) | |
| | 1,780,000 | | | | 7.350 | | | | 07/01/35 | | | | 2,041,375 | |
| | Illinois State GO Bonds Series 2012 (BBB-/Baa3) | |
| | 1,505,000 | | | | 5.000 | | | | 03/01/21 | | | | 1,619,591 | |
| | Illinois State GO Bonds Series 2013 (BBB-/Baa3) | |
| | 5,000,000 | | | | 5.500 | | | | 07/01/24 | | | | 5,540,700 | |
| | 5,500,000 | | | | 5.250 | | | | 07/01/28 | | | | 5,957,930 | |
| | 5,120,000 | | | | 5.500 | | | | 07/01/38 | | | | 5,523,968 | |
| | Illinois State GO Refunding Bonds Series 2016 (AGM) (AA/A2) | |
| | 3,950,000 | | | | 4.000 | | | | 02/01/30 | | | | 4,052,028 | |
| | 1,185,000 | | | | 4.000 | | | | 02/01/31 | | | | 1,206,212 | |
| Metropolitan Pier & Exposition Authority RB for McCormick
Place Expansion Project Residual Series 2002 A (NATL-RE)
(A/A3) |
|
| | 2,000,000 | | | | 5.700 | | | | 06/15/24 | | | | 2,327,940 | |
| Metropolitan Pier & Exposition Authority Refunding Bonds for
McCormick Place Expansion Project Series 2012 B
(ST APPROP) (BB+/NR) |
|
| | 1,000,000 | | | | 5.000 | | | | 12/15/28 | | | | 1,068,460 | |
| Railsplitter Tobacco Settlement Authority Tobacco Settlement RB
Series 2010 (A-/NR) |
|
| | 1,125,000 | | | | 6.000 | | | | 06/01/28 | | | | 1,272,431 | |
| Southwestern Illinois Development Authority RB Capital
Appreciation for Local Government Program Series 2007
(AGM) (AA/NR)(d) |
|
| | 6,000,000 | | | | 0.000 | | | | 12/01/25 | | | | 4,619,400 | |
| Springfield Illinois Senior Lien Electric RB Refunding Series
2015 (AGM) (AA/A2) |
|
| | 4,000,000 | | | | 3.500 | | | | 03/01/30 | | | | 4,073,240 | |
| | State of Illinois GO Bonds Series 2010-1 (BBB-/Baa3) | |
| | 635,000 | | | | 6.630 | | | | 02/01/35 | | | | 711,822 | |
| | | | | | | | | | | | | | |
| | | | | | | | | | | | | 128,628,988 | |
| | |
| Indiana – 0.3% | |
| Jasper County PCRB Refunding for Northern Indiana Public
Service Co. Project RMKT 08/25/08 Series 1994 C
(NATL-RE) (A/A3) |
|
| | 650,000 | | | | 5.850 | | | | 04/01/19 | | | | 689,241 | |
| Whiting City Environmental Facilities RB for BP Products North
America Inc. Project Series 2015 (AMT) (A-/A1)(b)(c) |
|
| | 3,000,000 | | | | 5.000 | | | | 11/01/22 | | | | 3,443,400 | |
| | | | | | | | | | | | | | |
| | | | | | | | | | | | | 4,132,641 | |
| | |
| | |
| 26 | | The accompanying notes are an integral part of these financial statements. |
GOLDMAN SACHS DYNAMIC MUNICIPAL INCOME FUND
| | | | | | | | | | | | |
Principal
Amount | | | Interest
Rate | | Maturity
Date | | | Value | |
| Municipal Bonds – (continued) | |
| Iowa – 0.1% | |
| | Coralville Iowa COPS Series 2016 E (BBB/NR) | |
| $ | 300,000 | | | 4.000 % | | | 06/01/19 | | | $ | 310,899 | |
| | 460,000 | | | 4.000 | | | 06/01/20 | | | | 483,718 | |
| | 500,000 | | | 4.000 | | | 06/01/21 | | | | 530,935 | |
| | | | | | | | | | | | |
| | | | | | | | | | | 1,325,552 | |
| | |
| Kentucky – 1.7% | |
| Kentucky Asset Liability Commission General Fund RB
Refunding for Floating Rate Project Notes Series 2007 A
(NATL-RE) (A/A1)(e) |
|
| | 6,950,000 | | | (3 Mo. LIBOR + 0.53%),
1.408 | | | 11/01/27 | | | | 6,822,815 | |
| Kentucky Economic Development Finance Authority Hospital RB
Refunding for Owensboro Medical Health System, Inc.
Series 2017 A (AGM) (AA/A2) |
|
| | 1,200,000 | | | 4.000 | | | 06/01/37 | | | | 1,233,888 | |
| | 400,000 | | | 4.000 | | | 06/01/45 | | | | 399,316 | |
| Louisville & Jefferson County Metro Government Health System
RB for Norton Healthcare, Inc. Series 2016 A (A-/NR) |
|
| | 3,175,000 | | | 4.000 | | | 10/01/34 | | | | 3,271,838 | |
| | 4,600,000 | | | 4.000 | | | 10/01/36 | | | | 4,708,284 | |
| Louisville & Jefferson County Metropolitan Government RB for
Jewish Hospital St. Mary’s Healthcare Series 2008 (NR/Aaa)(a) |
|
| | 3,750,000 | | | 6.125 | | | 02/01/18 | | | | 3,814,312 | |
| University of Kentucky General Receipts Refunding Bonds
Series 2015 A (AA/Aa2) |
|
| | 3,260,000 | | | 4.000 | | | 04/01/26 | | | | 3,658,600 | |
| | | | | | | | | | | | |
| | | | | | | | | | | 23,909,053 | |
| | |
| Louisiana – 1.7% | |
| East Baton Rouge Parish Louisiana Sales Tax RB for Road and
Street Improvement Series 2009 A (ASSURED GTY)
(AA/A2)(a) |
|
| | 1,230,000 | | | 5.250 | | | 08/01/19 | | | | 1,323,492 | |
| Louisiana Local Government Environmental Facilities and
Community Development Authority RB for Southeastern
Louisiana Student Series 2004 B (NATL-RE) (NR/A3)(c) |
|
| | 2,925,000 | | | 1.645 | | | 08/01/34 | | | | 2,632,500 | |
| Louisiana Local Government Environmental Facilities and
Community Development Authority RB Refunding for Ragin’
Cajun Facilities, Inc. – Student Housing & Parking Project
Series 2017 (AGM) (AA/NR) |
|
| | 900,000 | | | 2.750 | | | 10/01/23 | | | | 936,918 | |
| | 670,000 | | | 5.000 | | | 10/01/23 | | | | 782,191 | |
| Louisiana Public Facilities Authority RB Refunding for Energy
LLC Project Series 2016 A (A/A2) |
|
| | 2,125,000 | | | 3.375 | | | 09/01/28 | | | | 2,152,689 | |
| Louisiana Public Facilities Authority RB Refunding for Energy
LLC Project Series 2016 B (A/A2) |
|
| | 1,625,000 | | | 3.500 | | | 06/01/30 | | | | 1,651,033 | |
| Louisiana Public Facilities Authority RB Refunding for Ochsner
Clinic Foundation Project Series 2017 (A-/A3) |
|
| | 3,695,000 | | | 4.000 | | | 05/15/42 | | | | 3,750,979 | |
| | 3,000,000 | | | 5.000 | | | 05/15/46 | | | | 3,346,500 | |
| New Orleans Aviation Board GARBs Series 2015 B (AMT)
(A-/A3) |
|
| | 3,750,000 | | | 5.000 | | | 01/01/34 | | | | 4,245,375 | |
| | |
| Municipal Bonds – (continued) | |
| Louisiana – (continued) | |
| New Orleans Aviation Board General Airport RB for North
Terminal Project Series 2017 B (AMT) (A-/A3) |
|
| $ | 1,000,000 | | | 5.000% | | | 01/01/48 | | | $ | 1,127,650 | |
| New Orleans Louisiana Aviation Board RB Refunding for
Restructuring GARBs Series 2009 A-1 (ASSURED GTY)
(AA/A3)(a) |
|
| | 1,350,000 | | | 6.000 | | | 01/01/19 | | | | 1,433,241 | |
| Port of New Orleans Board of Commissioners RB Refunding
Series 2013 B (AMT) (A-/A3) |
|
| | 500,000 | | | 5.000 | | | 04/01/30 | | | | 544,755 | |
| | | | | | | | | | | | |
| | | | | | | | | | | 23,927,323 | |
| | |
| Maine – 0.1% | |
| | Maine Turnpike Authority RB Refunding Series 2015 (AA-/Aa3) | |
| | 1,565,000 | | | 5.000 | | | 07/01/26 | | | | 1,885,293 | |
| | |
| Maryland – 1.1% | |
| Baltimore Maryland Special Obligation Refunding for Baltimore
Research Park Project Series 2017 A (NR/NR) |
|
| | 425,000 | | | 4.000 | | | 09/01/27 | | | | 438,685 | |
| | 650,000 | | | 4.500 | | | 09/01/33 | | | | 670,442 | |
| City of Annapolis GO Refunding Bonds for Public Improvements
Series 2015 B (AA+/Aa2) |
|
| | 1,725,000 | | | 4.000 | | | 08/01/27 | | | | 1,989,788 | |
| Frederick County Maryland Special Tax for Lake Linganore
Village Community Development Series 2001 A (ASSURED
GTY) (AA/NR) |
|
| | 120,000 | | | 5.600 | | | 07/01/20 | | | | 120,331 | |
| | 555,000 | | | 5.700 | | | 07/01/29 | | | | 556,021 | |
| Maryland State GO Bonds for State and Local Facilities Loan
Second Series 2017 A (AAA/Aaa) |
|
| | 10,000,000 | | | 5.000 | | | 08/01/24 | | | | 12,140,200 | |
| | | | | | | | | | | | |
| | | | | | | | | | | 15,915,467 | |
| | |
| Massachusetts – 0.9% | |
| Massachusetts Bay Transportation Authority Sales Tax RB
Refunding for Capital Appreciation Senior Series 2016 A
(AA/Aa2)(d) |
|
| | 2,000,000 | | | 0.000 | | | 07/01/21 | | | | 1,868,820 | |
| Massachusetts Development Finance Agency RB for Harvard
University Series 2010 B-2 (AAA/Aaa)(a) |
|
| | 5,000,000 | | | 5.250 | | | 02/01/21 | | | | 5,662,100 | |
| Massachusetts Educational Financing Authority RB
Series 2008 H (AMT) (ASSURED GTY) (AA/A1) |
|
| | 725,000 | | | 6.350 | | | 01/01/30 | | | | 737,811 | |
| Massachusetts State Health & Educational Facilities Authority RB
for Boston Medical Center Project Series 2008 B (BBB/Baa2)(a) |
|
| | 2,575,000 | | | 5.750 | | | 07/01/18 | | | | 2,665,048 | |
| Massachusetts State Health & Educational Facilities Authority RB
for Boston Medical Center Project Series 2008 B (NR/NR)(a) |
|
| | 315,000 | | | 5.750 | | | 07/01/18 | | | | 326,015 | |
| Massachusetts State Health & Educational Facilities Authority RB
for Tufts University Issue Series 1995 G (AA-/Aa2)(b)(c) |
|
| | 1,365,000 | | | 0.920 | | | 10/02/17 | | | | 1,365,000 | |
| | | | | | | | | | | | |
| | | | | | | | | | | 12,624,794 | |
| | |
| | |
| The accompanying notes are an integral part of these financial statements. | | 27 |
GOLDMAN SACHS DYNAMIC MUNICIPAL INCOME FUND
Schedule of Investments (continued)
September 30, 2017 (Unaudited)
| | | | | | | | | | | | | | |
Principal
Amount | | | Interest
Rate | | | Maturity
Date | | | Value | |
| Municipal Bonds – (continued) | |
| Michigan – 2.4% | |
| Allendale Public School GO Refunding Bonds Series 2016
(Q-SBLF) (AA-/NR) |
|
| $ | 2,700,000 | | | | 5.000 | % | | | 05/01/23 | | | $ | 3,153,411 | |
| | City of Detroit Financial Recovery Series 2014 B-1 (NR/NR)(c) | |
| | 1,025,000 | | | | 4.000 | | | | 04/01/34 | | | | 697,676 | |
| | City of Detroit Financial Recovery Series 2014 C (NR/NR) | |
| | 2,150,000 | | | | 5.000 | | | | 12/10/26 | | | | 2,046,908 | |
| Michigan Finance Authority Hospital Project RB Refunding
Ascension Senior Credit Series 2016 E-1 (AA+/Aa2)(b)(c) |
|
| | 3,000,000 | | | | 1.100 | | | | 08/15/19 | | | | 2,997,240 | |
| Michigan Finance Authority Local Government Loan Program
RB for Detroit Financial Recovery Income Tax Revenue and
Refunding Local Project Bonds Series 2014 F (A/NR) |
|
| | 1,000,000 | | | | 3.875 | | | | 10/01/23 | | | | 1,061,210 | |
| Michigan Finance Authority Local Government Loan Program
RB for Detroit Water and Sewerage Department Sewage
Disposal System Local Project Senior Lien Series 2014 D-4
(A-/A3) |
|
| | 1,000,000 | | | | 5.000 | | | | 07/01/34 | | | | 1,110,290 | |
| Michigan Finance Authority Local Government Loan Program
RB Refunding for Detroit Water and Sewer Department
Sewage Disposal System Second Lien Local Project
Series 2015 C (BBB+/Baa1) |
|
| | 1,945,000 | | | | 5.000 | | | | 07/01/33 | | | | 2,187,639 | |
| Michigan Finance Authority Local Government Loan Program
RB Refunding for Detroit Water and Sewer Series 2014 D-1
(AGM) (AA/A2) |
|
| | 400,000 | | | | 5.000 | | | | 07/01/35 | | | | 449,800 | |
| Michigan Finance Authority Local Government Loan Program
RB Refunding for Detroit Water and Sewer Series 2014 D-1
(NATL-RE FGIC) (A/A3) |
|
| | 650,000 | | | | 5.000 | | | | 07/01/36 | | | | 727,552 | |
| Michigan Finance Authority Local Government Loan Program
RB Refunding for Detroit Water and Sewerage Department
Sewage Disposal System Local Project Senior Lien
Series 2014 C-1 (A-/A3) |
|
| | 1,000,000 | | | | 5.000 | | | | 07/01/44 | | | | 1,081,350 | |
| Michigan Finance Authority Local Government Loan Program
RB Refunding for Detroit Water and Sewerage Department
Sewage Disposal System Local Project Senior Lien
Series 2014 C-3 (AGM) (AA/A2) |
|
| | 325,000 | | | | 5.000 | | | | 07/01/32 | | | | 369,294 | |
| | 250,000 | | | | 5.000 | | | | 07/01/33 | | | | 282,923 | |
| Michigan Finance Authority Local Government Loan Program
RB Refunding for Detroit Water and Sewerage Department
Water Supply System Series 2015 D-1 (A-/A3) |
|
| | 1,000,000 | | | | 5.000 | | | | 07/01/29 | | | | 1,143,940 | |
| Michigan Strategic Fund RB Refunding for The Detroit Edison
Company Pollution Control Bonds Project Series 1995 CC
(A/Aa3)(b)(c) |
|
| | 1,115,000 | | | | 1.450 | | | | 09/01/21 | | | | 1,101,564 | |
| Michigan Tobacco Settlement Finance Authority Asset Backed
RB Senior Series 2007 A (B-/NR) |
|
| | 570,000 | | | | 6.000 | | | | 06/01/48 | | | | 569,994 | |
| | |
| Municipal Bonds – (continued) | |
| Michigan – (continued) | |
| Michigan Tobacco Settlement Finance Authority RB for Capital
Appreciation Series 2007 C (CCC/NR)(d) |
|
| 9,500,000 | | | | 0.000 | | | | 06/01/52 | | | | 533,995 | |
| Roseville Community School District GO Refunding Bonds
(Q-SBLF) (AA-/NR) |
|
| | 1,000,000 | | | | 5.000 | | | | 05/01/20 | | | | 1,095,890 | |
| Warren Consolidated School District Unlimited Tax GO
Refunding Bonds for School Building and Site Bonds
Series 2016 (Q-SBLF) (AA-/NR) |
|
| | 1,145,000 | | | | 5.000 | | | | 05/01/25 | | | | 1,354,478 | |
| | 1,215,000 | | | | 5.000 | | | | 05/01/26 | | | | 1,450,248 | |
| | 3,705,000 | | | | 5.000 | | | | 05/01/27 | | | | 4,359,711 | |
| Washtenaw County Ypsilanti Community Schools Unlimited Tax
GO Refunding Bonds Series 2015 B (Q-SBLF) (AA-/NR) |
|
| | 1,860,000 | | | | 5.000 | | | | 05/01/22 | | | | 2,122,148 | |
| Wayne County Airport Authority RB for Detroit Metropolitan
Wayne County Airport Series 2017 B (AMT) (A/A2)(f) |
|
| | 400,000 | | | | 5.000 | | | | 12/01/33 | | | | 461,144 | |
| | 1,065,000 | | | | 5.000 | | | | 12/01/34 | | | | 1,221,843 | |
| | 650,000 | | | | 5.000 | | | | 12/01/35 | | | | 742,709 | |
| | 800,000 | | | | 5.000 | | | | 12/01/36 | | | | 910,408 | |
| | 880,000 | | | | 5.000 | | | | 12/01/37 | | | | 998,219 | |
| | | | | | | | | | | | | | |
| | | | | | | | | | | | | 34,231,584 | |
| | |
| Minnesota – 0.3% | |
| Minneapolis Minnesota Health Care System RB for Fairview
Health Services Series 2008 A (A+/A2)(a) |
|
| | 1,500,000 | | | | 6.750 | | | | 11/15/18 | | | | 1,594,815 | |
| Minnesota Higher Education Facilities Authority RB Refunding
for Bethel University Project Series 2017 (BBB-/NR) |
|
| | 500,000 | | | | 5.000 | | | | 05/01/47 | | | | 554,555 | |
| Minnesota State Trunk Highway GO Refunding Bonds
Series 2017 E (AA+/Aa1)(f) |
|
| | 1,680,000 | | | | 3.000 | | | | 10/01/29 | | | | 1,755,247 | |
| | | | | | | | | | | | | | |
| | | | | | | | | | | | | 3,904,617 | |
| | |
| Mississippi – 0.4% | |
| Jackson County Mississippi Pollution Control RB Refunding for
Chevron USA, Inc. Project RMKT 11/01/99 Series 1993
(AA-/Aa2)(b)(c) |
|
| | 2,000,000 | | | | 0.960 | | | | 10/02/17 | | | | 2,000,000 | |
| Mississippi Business Finance Corp. RB for Chevron USA, Inc.
Project Series 2010 G (AA-/Aa2)(b)(c) |
|
| | 2,000,000 | | | | 0.940 | | | | 10/02/17 | | | | 2,000,000 | |
| Mississippi Development Bank Special Obligation RB for Hinds
Community College District Capital Improvement Project
Series 2009 (ASSURED GTY) (AA/Aa2)(a) |
|
| | 1,095,000 | | | | 5.375 | | | | 10/01/19 | | | | 1,188,228 | |
| | Mississippi State GO Bonds Series 2015 F (AA/Aa2) | |
| | 1,000,000 | | | | 4.000 | | | | 11/01/35 | | | | 1,075,710 | |
| | | | | | | | | | | | | | |
| | | | | | | | | | | | | 6,263,938 | |
| | |
| | |
| 28 | | The accompanying notes are an integral part of these financial statements. |
GOLDMAN SACHS DYNAMIC MUNICIPAL INCOME FUND
| | | | | | | | | | | | |
Principal
Amount | | | Interest
Rate | | Maturity
Date | | | Value | |
| Municipal Bonds – (continued) | |
| Missouri – 0.2% | |
| Branson IDA Tax Increment RB Refunding for Branson Shoppes
Redevelopment Project Series 2017 A (NR/NR) |
|
| $ | 250,000 | | | 3.000 % | | | 11/01/18 | | | $ | 253,105 | |
| | 400,000 | | | 3.000 | | | 11/01/19 | | | | 405,400 | |
| | 400,000 | | | 3.000 | | | 11/01/20 | | | | 404,936 | |
| | 350,000 | | | 3.000 | | | 11/01/21 | | | | 352,271 | |
| | 350,000 | | | 4.000 | | | 11/01/22 | | | | 365,862 | |
| Kirkwood Industrial Development Authority Retirement
Community RB Refunding for Aberdeen Heights
Series 2017 A (BB/NR) |
|
| | 1,230,000 | | | 5.000 | | | 05/15/18 | | | | 1,253,776 | |
| | | | | | | | | | | | |
| | | | | | | | | | | 3,035,350 | |
| | |
| Montana – 0.1% | |
| | City of Billings RB for Sewer System Series 2017 (AA+/Aa3) | |
| | 575,000 | | | 5.000 | | | 07/01/29 | | | | 703,070 | |
| | |
| Nevada – 0.3% | |
| City of Las Vegas Special Improvement District No. 813 for
Summerlin Village 26 Local Improvement Bonds Series 2017
(NR/NR) |
|
| | 50,000 | | | 2.000 | | | 06/01/18 | | | | 50,120 | |
| | 50,000 | | | 3.000 | | | 06/01/19 | | | | 50,853 | |
| | 100,000 | | | 3.000 | | | 06/01/20 | | | | 102,081 | |
| | 135,000 | | | 3.000 | | | 06/01/21 | | | | 137,677 | |
| | 245,000 | | | 3.000 | | | 06/01/22 | | | | 249,055 | |
| Clark County School District Limited Tax GO Refunding Bonds
Series 2015 B (AA-/A1) |
|
| | 1,000,000 | | | 5.000 | | | 06/15/18 | | | | 1,027,750 | |
| Henderson Nevada Local Improvement District No. T-18
(Inspirada) Special Assessment Refunding Limited Obligation
Series 2016 (NR/NR) |
|
| | 1,285,000 | | | 4.000 | | | 09/01/25 | | | | 1,355,393 | |
| Washoe County Sierra Pacific Power Company Project RB
Refunding for Nevada Gas & Water Facilities Series 2016 B
(A+/A2)(b)(c) |
|
| | 1,800,000 | | | 3.000 | | | 06/01/22 | | | | 1,876,428 | |
| | | | | | | | | | | | |
| | | | | | | | | | | 4,849,357 | |
| | |
| New Hampshire – 0.4% | |
| New Hampshire Business Finance Authority RB for Pollution
Control Project Series 2001 A (AMT) (NATL-RE) (A+/A1)(c) |
|
| | 6,075,000 | | | 1.908 | | | 05/01/21 | | | | 5,918,608 | |
| | |
| New Jersey – 5.9% | |
| Atlantic City New Jersey Tax Appeal Refunding Bonds
Series 2017 A (BAM) (ST AID WITHHLDG) (AA/Baa1) |
|
| | 300,000 | | | 5.000 | | | 03/01/24 | | | | 347,634 | |
| | 250,000 | | | 5.000 | | | 03/01/26 | | | | 293,823 | |
| New Jersey Economic Development Authority RB for Provident
Group – Kean Properties L.L.C. – Kean University Student
Housing Project Series 2017 A (BBB-/NR) |
|
| | 500,000 | | | 5.000 | | | 07/01/32 | | | | 550,885 | |
| New Jersey Economic Development Authority RB for School
Facilities Construction Series 2009 (ASSURED GTY)
(AA+/A3)(a) |
|
| | 1,000,000 | | | 6.000 | | | 12/15/18 | | | | 1,060,220 | |
| | |
| Municipal Bonds – (continued) | |
| New Jersey – (continued) | |
| New Jersey Economic Development Authority RB for School
Facilities Construction Series 2009 AA (BBB+/Baa1) |
|
| 1,315,000 | | | 5.500 | | | 12/15/29 | | | | 1,368,139 | |
| New Jersey Economic Development Authority RB for School
Facilities Construction Series 2009 BB (BBB+/Baa1)(a) |
|
| | 360,000 | | | 5.000 | | | 09/01/19 | | | | 386,478 | |
| New Jersey Economic Development Authority RB for School
Facilities Construction Series 2016 AAA (BBB+/Baa1) |
|
| | 4,000,000 | | | 5.500 | | | 06/15/33 | | | | 4,523,560 | |
| New Jersey Economic Development Authority RB Refunding for
School Facilities Construction Bonds Series 2009 AA
(NR/Baa1)(a) |
|
| | 2,685,000 | | | 5.500 | | | 06/15/19 | | | | 2,884,334 | |
| New Jersey Educational Facilities Authority RB Refunding for
The College of New Jersey Series 2016 F (A/A2) |
|
| | 1,250,000 | | | 3.000 | | | 07/01/40 | | | | 1,127,750 | |
| New Jersey Health Care Facilities Financing Authority RB for St.
Joseph’s Healthcare System Series 2008 (NR/Baa3)(a) |
|
| | 2,500,000 | | | 6.625 | | | 07/01/18 | | | | 2,604,575 | |
| New Jersey State Higher Education Assistance Authority RB for
Student Loan Series 2008 A (AMT) (ASSURED GTY)
(AA/Aaa) |
|
| | 1,645,000 | | | 6.125 | | | 06/01/30 | | | | 1,682,687 | |
| New Jersey State Housing and Mortgage Finance Agency RB for
Single Family Housing Series 2008 AA (AA/Aa3) |
|
| | 30,000 | | | 6.150 | | | 10/01/23 | | | | 30,000 | |
| New Jersey State Turnpike Authority RB Refunding
Series 2000 B (NATL-RE) (A+/A2)(c) |
|
| | 6,300,000 | | | 1.540 | | | 01/01/30 | | | | 6,300,000 | |
| New Jersey State Turnpike Authority RB Refunding
Series 2017 C-5 (A+/A2)(b)(f) |
|
| | 5,000,000 | | | (1 Mo. LIBOR + 0.46%,
8.00% Cap), 0.000 | | | 01/01/21 | | | | 5,000,350 | |
| | New Jersey State Turnpike Authority RB Series 2009 G (A+/A2) | |
| | 1,900,000 | | | 5.000 | | | 01/01/18 | | | | 1,918,658 | |
| New Jersey Transportation Trust Fund Authority RB Capital
Appreciation for Transportation System Bonds Series 2006 C
(AMBAC) (BBB+/Baa1)(d) |
|
| | 19,675,000 | | | 0.000 | | | 12/15/35 | | | | 9,038,302 | |
| New Jersey Transportation Trust Fund Authority RB Capital
Appreciation for Transportation System Bonds Series 2010 A
(BBB+/Baa1)(d) |
|
| | 5,365,000 | | | 0.000 | | | 12/15/26 | | | | 3,763,869 | |
| | 7,000,000 | | | 0.000 | | | 12/15/28 | | | | 4,457,740 | |
| | 1,475,000 | | | 0.000 | | | 12/15/37 | | | | 581,666 | |
| New Jersey Transportation Trust Fund Authority RB for Federal
Highway Reimbursement Notes Subseries 2016 A-2 (A+/Baa1) |
|
| | 10,000,000 | | | 5.000 | | | 06/15/29 | | | | 10,216,400 | |
| New Jersey Transportation Trust Fund Authority RB for
Transportation Program Bonds Series 2015 AA (BBB+/Baa1) |
|
| | 755,000 | | | 5.000 | | | 06/15/46 | | | | 797,899 | |
| New Jersey Transportation Trust Fund Authority RB for
Transportation System Bonds Series 2006 C (NATL-RE)
(A/A3)(d) |
|
| | 4,675,000 | | | 0.000 | | | 12/15/27 | | | | 3,203,591 | |
| | 5,000,000 | | | 0.000 | | | 12/15/31 | | | | 2,821,600 | |
| | |
| | |
| The accompanying notes are an integral part of these financial statements. | | 29 |
GOLDMAN SACHS DYNAMIC MUNICIPAL INCOME FUND
Schedule of Investments (continued)
September 30, 2017 (Unaudited)
| | | | | | | | | | | | |
Principal
Amount | | | Interest
Rate | | Maturity
Date | | | Value | |
| Municipal Bonds – (continued) | |
| New Jersey – (continued) | |
| New Jersey Transportation Trust Fund Authority RB for
Transportation System Bonds Series 2011 B (AMBAC)
(BBB+/Baa1) |
|
| $ | 1,305,000 | | | 5.250 % | | | 12/15/22 | | | $ | 1,483,015 | |
| New Jersey Transportation Trust Fund Authority RB for
Transportation System Bonds Series 2011 B (BBB+/Baa1) |
|
| | 1,000,000 | | | 5.000 | | | 06/15/42 | | | | 1,044,510 | |
| New Jersey Transportation Trust Fund Authority RB for
Transportation System Bonds Series 2013 A (BBB+/Baa1) |
|
| | 2,535,000 | | | 5.000 | | | 06/15/20 | | | | 2,728,978 | |
| New Jersey Transportation Trust Fund Authority RB for
Transportation System Series 2011 A (ST APPROP)
(BBB+/Baa1) |
|
| | 6,515,000 | | | 5.500 | | | 06/15/41 | | | | 6,951,505 | |
| New Jersey Transportation Trust Fund Authority RB Subseries
2016 A-1 & Subseries A-2 (A+/Baa1) |
|
| | 6,000,000 | | | 5.000 | | | 06/15/31 | | | | 6,121,800 | |
| Plainsboro Township GO General Improvement Bonds
Series 2016 (AAA/NR) |
|
| | 1,000,000 | | | 2.000 | | | 08/01/22 | | | | 1,020,850 | |
| | | | | | | | | | | | |
| | | | | | | | | | | 84,310,818 | |
| | |
| New Mexico – 0.4% | |
| Farmington City PCRB Refunding for Public Service Co. of New
Mexico San Juan Project Series 2010 A (BBB+/Baa2)(b)(c) |
|
| | 1,200,000 | | | 5.200 | | | 06/01/20 | | | | 1,302,576 | |
| Farmington New Mexico PCRB Refunding for Public Service Co.
of New Mexico San Juan Project Series 2010 D (BBB+/Baa2) |
|
| | 2,500,000 | | | 5.900 | | | 06/01/40 | | | | 2,730,950 | |
| Santa Fe County New Mexico RB for Gross Receipts Series 2008
(AGM) (AA+/Aa3)(a) |
|
| | 1,000,000 | | | 5.250 | | | 06/01/18 | | | | 1,028,190 | |
| | | | | | | | | | | | |
| | | | | | | | | | | 5,061,716 | |
| | |
| New York – 6.4% | |
| Brooklyn Arena Local Development Corp. Pilot RB Refunding
for Barclays Center Series 2016 A (BBB-/Baa3) |
|
| | 1,075,000 | | | 5.000 | | | 07/15/42 | | | | 1,211,804 | |
| Chautauqua County Industrial Development Agency Exempt
Facility RB for Dunkirk NRG Power Project Series 2009
(BB+/Baa3) |
|
| | 200,000 | | | 5.875 | | | 04/01/42 | | | | 209,014 | |
| City of New Rochelle Corp. for Local Development RB for Iona
College Project Series 2015 A (BBB/Baa2) |
|
| | 325,000 | | | 5.000 | | | 07/01/25 | | | | 378,885 | |
| | 335,000 | | | 5.000 | | | 07/01/26 | | | | 389,779 | |
| | 425,000 | | | 5.000 | | | 07/01/27 | | | | 492,562 | |
| Erie County New York Industrial Development Agency RB for
the City of Buffalo School District Series 2008 A (AGM)
(ST AID WITHHLDG) (AA/Aa2)(a) |
|
| | 9,000,000 | | | 5.750 | | | 05/01/18 | | | | 9,249,840 | |
| Freddie Mac Multifamily ML Certificates RB Pass Through
Series 2017 (AAA/Aaa)(e)(g) |
|
| | 7,482,318 | | | (1 Mo. LIBOR + 0.50%),
1.737 | | | 01/25/33 | | | | 7,520,478 | |
| | |
| Municipal Bonds – (continued) | |
| New York – (continued) | |
| Metropolitan Transportation Authority RB Refunding RMKT
11/01/16 Subseries 2012 G-3 (AA-/A1)(b)(e) |
|
| 5,000,000 | | | (1 Mo. LIBOR + 0.70%,
9.00% Cap), 1.529% | | | 02/01/20 | | | | 5,027,150 | |
| Metropolitan Transportation Authority RB Refunding
Series 2016 C-2B (AA-/A1)(b)(c) |
|
| | 3,250,000 | | | 5.000 | | | 02/15/20 | | | | 3,530,118 | |
| New York City GO Bonds Fiscal 2006 Series H Subseries H1
(AA/Aa2)(b)(c) |
|
| | 2,000,000 | | | 0.970 | | | 10/02/17 | | | | 2,000,000 | |
| New York City GO Bonds Fiscal 2006 Series H Subseries H2
(AA/Aa2)(b)(c) |
|
| | 2,000,000 | | | 0.970 | | | 10/02/17 | | | | 2,000,000 | |
| New York City GO Bonds Fiscal 2014 Series D Subseries D3
(AA/Aa2)(b)(c) |
|
| | 2,000,000 | | | 0.970 | | | 10/02/17 | | | | 2,000,000 | |
| New York City GO Bonds Fiscal 2014 Series I Subseries I-2 (AA/
Aa2)(b)(c) |
|
| | 2,000,000 | | | 0.970 | | | 10/02/17 | | | | 2,000,000 | |
| New York City GO Bonds Fiscal 2015 Series F Subseries F6
(AA/Aa2)(b)(c) |
|
| | 2,000,000 | | | 0.970 | | | 10/02/17 | | | | 2,000,000 | |
| New York City Municipal Water Finance Authority RB for Water
& Sewer System Second General Resolution Fiscal 2011
Subseries AA1 (AA+/Aa1)(b)(c) |
|
| | 2,000,000 | | | 0.970 | | | 10/02/17 | | | | 2,000,000 | |
| New York City Municipal Water Finance Authority RB for Water
& Sewer System Second General Resolution Fiscal 2011
Subseries AA2 (AA+/Aa1)(b)(c) |
|
| | 1,100,000 | | | 0.970 | | | 10/02/17 | | | | 1,100,000 | |
| New York City Transitional Finance Authority RB Future Tax
Subordinate Fiscal 2013 Subseries C-4 (AAA/Aa1)(b)(c) |
|
| | 2,000,000 | | | 0.970 | | | 10/02/17 | | | | 2,000,000 | |
| New York City Transitional Finance Authority RB Future Tax
Subordinate Fiscal 2015 Subseries E-3 (AAA/Aa1)(b)(c) |
|
| | 1,200,000 | | | 0.820 | | | 10/05/17 | | | | 1,200,000 | |
| New York City Transitional Finance Authority RB Future Tax
Subordinate Fiscal 2016 Subseries E-4 (AAA/Aa1)(b)(c) |
|
| | 2,000,000 | | | 0.970 | | | 10/02/17 | | | | 2,000,000 | |
| New York Housing Development Corp. Multi-Family Mortgage
RB for 8 Spruce Street Series 2014 Class E (BBB-/NR) |
|
| | 1,000,000 | | | 3.500 | | | 02/15/48 | | | | 1,020,880 | |
| New York Liberty Development Corporation RB for 3 World
Trade Center Project Series 2014 (NR/NR)(g) |
|
| | 2,825,000 | | | 5.000 | | | 11/15/44 | | | | 3,073,092 | |
| New York State Dormitory Authority General Purpose Personal
Income Tax RB Series 2016 A (AAA/Aa1) |
|
| | 1,400,000 | | | 5.000 | | | 02/15/27 | | | | 1,725,584 | |
| New York State Dormitory Authority General Purpose Personal
Income Tax RB Series 2016 D (AAA/Aa1) |
|
| | 6,190,000 | | | 5.000 | | | 02/15/27 | | | | 7,629,546 | |
| New York State Energy Research & Development Authority RB
for Brooklyn Union Gas Project Series 2000 A-2 (NATL-RE)
(A/A2)(c) |
|
| | 5,800,000 | | | 1.540 | | | 12/01/20 | | | | 5,727,500 | |
| | |
| | |
| 30 | | The accompanying notes are an integral part of these financial statements. |
GOLDMAN SACHS DYNAMIC MUNICIPAL INCOME FUND
| | | | | | | | | | | | | | |
Principal
Amount | | | Interest
Rate | | | Maturity
Date | | | Value | |
| Municipal Bonds – (continued) | |
| New York – (continued) | |
| New York State Energy Research & Development Authority RB
Refunding for Central Hudson Gas & Electric Corp. Projects
Series 1999 B (AMT) (AMBAC) (A-/A2)(c) |
|
| $ | 5,400,000 | | | | 1.365 | % | | | 07/01/34 | | | $ | 4,904,154 | |
| New York State Thruway Authority Junior Indebtedness RB
Series 2013 A (A-/A3) |
|
| | 1,000,000 | | | | 5.000 | | | | 05/01/19 | | | | 1,060,830 | |
| New York State Urban Development Corp. General Purpose
Personal Income Tax RB Series 2014 A (AAA/Aa1) |
|
| | 5,000,000 | | | | 5.000 | | | | 03/15/31 | | | | 5,853,900 | |
| New York Transportation Development Corp. Special Facility RB
Refunding for American Airlines, Inc. John F. Kennedy
International Airport Project Series 2016 (AMT) (BB-/NR) |
|
| | 2,200,000 | | | | 5.000 | | | | 08/01/20 | | | | 2,361,656 | |
| | 2,405,000 | | | | 5.000 | | | | 08/01/21 | | | | 2,635,086 | |
| | 2,250,000 | | | | 5.000 | | | | 08/01/31 | | | | 2,401,403 | |
| New York Transportation Development Corp. Special Facility RB
Refunding for Laguardia Airport Terminal B Redevelopment
Project Series 2016 A (AMT) (BBB/Baa3) |
|
| | 700,000 | | | | 5.000 | | | | 07/01/41 | | | | 770,063 | |
| | 700,000 | | | | 5.000 | | | | 07/01/46 | | | | 766,962 | |
| | 1,750,000 | | | | 5.250 | | | | 01/01/50 | | | | 1,941,345 | |
| Westchester County Local Development Corporation RB for
Westchester Medical Center Obligated Group Project
Series 2016 (BBB/Baa2) |
|
| | 1,000,000 | | | | 5.000 | | | | 11/01/23 | | | | 1,155,380 | |
| | 1,000,000 | | | | 5.000 | | | | 11/01/24 | | | | 1,169,720 | |
| | | | | | | | | | | | | | |
| | | | | | | | | | | | | 90,506,731 | |
| | |
| North Carolina – 0.4% | |
| Charlotte North Carolina Water and Sewer System RB
Series 2009 B (AAA/Aaa) |
|
| | 2,000,000 | | | | 5.000 | | | | 07/01/38 | | | | 2,195,420 | |
| North Carolina Eastern Municipal Power Agency Power System
RB Series 2008 C (ETM) (ASSURED GTY) (AA/A3)(a) |
|
| | 190,000 | | | | 6.000 | | | | 01/01/19 | | | | 196,707 | |
| North Carolina Medical Care Commission Health Care Facilities
RB Refunding First Mortgage for Pennybyrn at Maryfield
Series 2015 (NR/NR) |
|
| | 1,500,000 | | | | 4.000 | | | | 10/01/17 | | | | 1,500,000 | |
| | 885,000 | | | | 5.000 | | | | 10/01/18 | | | | 910,745 | |
| North Carolina Medical Care Commission Retirement Facilities
RB Refunding First Mortgage for United Church Homes and
Services Series 2015 A (NR/NR) |
|
| | 620,000 | | | | 4.000 | | | | 09/01/25 | | | | 627,985 | |
| | | | | | | | | | | | | | |
| | | | | | | | | | | | | 5,430,857 | |
| | |
| Ohio – 2.6% | |
| Buckeye Ohio Tobacco Settlement Financing Authority RB
Asset-Backed Bonds for Capital Appreciation 1st Subordinate
Series 2007 B (BBB+/NR)(d) |
|
| | 33,300,000 | | | | 0.000 | | | | 06/01/47 | | | | 2,208,456 | |
| Buckeye Ohio Tobacco Settlement Financing Authority RB
Senior Turbo Asset-Backed Bonds Series 2007 A-2 (B-/B3) |
|
| | 1,885,000 | | | | 6.500 | | | | 06/01/47 | | | | 1,886,998 | |
| | 2,400,000 | | | | 5.875 | | | | 06/01/47 | | | | 2,291,400 | |
| | |
| Municipal Bonds – (continued) | |
| Ohio – (continued) | |
| Buckeye Ohio Tobacco Settlement Financing Authority RB
Senior Turbo Asset-Backed Bonds Series 2007 A-2 (B-/Caa1) |
|
| 23,685,000 | | | | 5.125 | | | | 06/01/24 | | | | 22,434,195 | |
| | 1,650,000 | | | | 5.875 | | | | 06/01/30 | | | | 1,600,467 | |
| Buckeye Ohio Tobacco Settlement Financing Authority RB
Senior Turbo Asset-Backed Bonds Series 2007 A-3 (B-/Caa1) |
|
| | 1,700,000 | | | | 6.250 | | | | 06/01/37 | | | | 1,686,536 | |
| Centerville Ohio Health Care RB Refunding and Improvement for
Graceworks Lutheran Services Series 2017 (NR/NR) |
|
| | 275,000 | | | | 5.000 | | | | 11/01/20 | | | | 296,596 | |
| | 285,000 | | | | 5.000 | | | | 11/01/21 | | | | 311,297 | |
| | 400,000 | | | | 5.000 | | | | 11/01/22 | | | | 440,776 | |
| | 420,000 | | | | 5.000 | | | | 11/01/23 | | | | 464,377 | |
| Cuyahoga County Ohio Hospital RB Refunding for Metrohealth
System Series 2017 (BBB-/Baa3) |
|
| | 2,865,000 | | | | 5.500 | | | | 02/15/57 | | | | 3,141,501 | |
| | | | | | | | | | | | | | |
| | | | | | | | | | | | | 36,762,599 | |
| | |
| Oklahoma – 0.3% | |
| Oklahoma Turnpike Authority RB Refunding Second Senior
RMKT 03/27/08 Series 2006 F (AA-/Aa3)(b)(c) |
|
| | 2,000,000 | | | | 0.800 | | | | 10/05/17 | | | | 2,000,000 | |
| Tulsa Municipal Airport Trust RB Refunding for American
Airlines, Inc. Series 2015 (AMT) (BB-/NR)(b)(c) |
|
| | 1,500,000 | | | | 5.000 | | | | 06/01/25 | | | | 1,641,540 | |
| | | | | | | | | | | | | | |
| | | | | | | | | | | | | 3,641,540 | |
| | |
| Oregon – 1.3% | |
| Deschutes County Oregon Hospital Facilities Authority RB
Refunding for Cascade Healthcare Series 2008 (NR/A2)(a) |
|
| | 1,500,000 | | | | 8.250 | | | | 01/01/19 | | | | 1,631,175 | |
| Forest Grove Oregon Student Housing RB Refunding for Oak
Tree Foundation Project Series 2017 (BBB-/NR) |
|
| | 1,385,000 | | | | 3.500 | | | | 03/01/29 | | | | 1,392,174 | |
| | 1,540,000 | | | | 3.750 | | | | 03/01/32 | | | | 1,531,484 | |
| Oregon State Department of Transportation Highway User Tax
RB Refunding Series 2015 A (AAA/Aa1) |
|
| | 3,140,000 | | | | 5.000 | | | | 11/15/25 | | | | 3,831,742 | |
| Portland Oregon Community College District GO Refunding
Bonds Series 2013 (AA/Aa1) |
|
| | 2,000,000 | | | | 5.000 | | | | 06/15/26 | | | | 2,345,180 | |
| Portland Oregon Water System RB Refunding First Lien
Series 2016 A (NR/Aaa) |
|
| | 7,090,000 | | | | 4.000 | | | | 04/01/29 | | | | 7,951,222 | |
| | | | | | | | | | | | | | |
| | | | | | | | | | | | | 18,682,977 | |
| | |
| Pennsylvania – 2.7% | |
| Allentown Neighborhood Improvement Zone Development
Authority Tax RB for City Center Refunding Project
Series 2017 (NR/Ba1)(g) |
|
| | 2,420,000 | | | | 5.000 | | | | 05/01/27 | | | | 2,766,108 | |
| | 1,600,000 | | | | 5.000 | | | | 05/01/32 | | | | 1,773,216 | |
| Coatesville School District GO Refunding Bonds Series 2017
(AGM) (ST AID WITHHLDG) (AA/A2) |
|
| | 1,000,000 | | | | 5.000 | | | | 08/01/25 | | | | 1,197,920 | |
| | |
| | |
| The accompanying notes are an integral part of these financial statements. | | 31 |
GOLDMAN SACHS DYNAMIC MUNICIPAL INCOME FUND
Schedule of Investments (continued)
September 30, 2017 (Unaudited)
| | | | | | | | | | | | |
Principal
Amount | | | Interest
Rate | | Maturity
Date | | | Value | |
| Municipal Bonds – (continued) | |
| Pennsylvania – (continued) | |
| Lancaster County Hospital Authority RB for Brethren Village
Project Series 2017 (BB+/NR) |
|
| $ | 855,000 | | | 3.000 % | | | 07/01/19 | | | $ | 869,125 | |
| | 1,155,000 | | | 5.000 | | | 07/01/20 | | | | 1,240,955 | |
| | 900,000 | | | 5.000 | | | 07/01/22 | | | | 997,911 | |
| Pennsylvania Economic Development Financing Authority PCRB
Refunding for PPL Electric Utilities Corp. Project RMKT
10/01/10 Series 2008 (A/A1) |
|
| | 2,500,000 | | | 4.000 | | | 10/01/23 | | | | 2,690,725 | |
| Pennsylvania Economic Development Financing Authority RB
for The Pennsylvania Rapid Bridge Replacement Project
Series 2015 (AMT) (BBB/NR) |
|
| | 750,000 | | | 5.000 | | | 06/30/42 | | | | 834,053 | |
| Pennsylvania Economic Development Financing Authority Solid
Waste Disposal RB for Waste Management, Inc. Project
Series 2004 A (A-/NR)(b)(c) |
|
| | 1,000,000 | | | 1.500 | | | 05/01/18 | | | | 1,001,950 | |
| Pennsylvania Higher Educational Facilities Authority RB for
Foundation for Indiana University of Pennsylvania
Series 2007 A (XLCA) (BBB+/WR)(e) |
|
| | 1,685,000 | | | (3 Mo. LIBOR + 0.60%),
1.470 | | | 07/01/27 | | | | 1,634,349 | |
| Pennsylvania State Commonwealth GO Refunding Bonds First
Series 2016 (A+/Aa3) |
|
| | 4,000,000 | | | 5.000 | | | 09/15/19 | | | | 4,298,520 | |
| Pennsylvania State Commonwealth GO Refunding Bonds First
Series 2016 (AGM) (AA/Aa3) |
|
| | 4,000,000 | | | 5.000 | | | 09/15/25 | | | | 4,796,600 | |
| | Pennsylvania Turnpike Commission RB Series 2013 C (A/A1) | |
| | 1,720,000 | | | 5.500 | | | 12/01/29 | | | | 2,044,220 | |
| Pennsylvania Turnpike Commission RB Subordinate
Series 2017 A (A-/A3) |
|
| | 3,500,000 | | | 5.500 | | | 12/01/42 | | | | 4,125,555 | |
| Pennsylvania Turnpike Commission RB Subordinate Series 2017
B-1 (A-/A3) |
|
| | 5,000,000 | | | 5.250 | | | 06/01/47 | | | | 5,742,750 | |
| | Scranton City GO Refunding Notes Series 2016 (BB+/NR) | |
| | 375,000 | | | 5.000 | | | 11/15/26 | | | | 404,276 | |
| | 500,000 | | | 5.000 | | | 11/15/32 | | | | 522,290 | |
| Scranton Redevelopment Authority RB Refunding for Guaranteed
Lease Series 2016 A (MUN GOVT GTD) (BB+/NR) |
|
| | 300,000 | | | 5.000 | | | 11/15/21 | | | | 311,271 | |
| | 450,000 | | | 5.000 | | | 11/15/28 | | | | 459,630 | |
| | | | | | | | | | | | |
| | | | | | | | | | | 37,711,424 | |
| | |
| Puerto Rico – 2.7% | |
| Puerto Rico Commonwealth Aqueduct & Sewer Authority RB
Senior Lien Series 2008 A (CC/Caa3) |
|
| | 3,275,000 | | | 6.125 | | | 07/01/24 | | | | 2,513,562 | |
| | 2,000,000 | | | 6.000 | | | 07/01/38 | | | | 1,515,000 | |
| | 2,500,000 | | | 6.000 | | | 07/01/44 | | | | 1,881,250 | |
| Puerto Rico Commonwealth Aqueduct & Sewer Authority RB
Senior Lien Series 2012 A (CC/Caa3) |
|
| | 1,060,000 | | | 5.750 | | | 07/01/37 | | | | 768,500 | |
| | Puerto Rico Commonwealth GO Bonds Series 2014 A (D/Caa3)(i) | |
| | 5,175,000 | | | 8.000 | | | 07/01/35 | | | | 2,509,875 | |
| | |
| Municipal Bonds – (continued) | |
| Puerto Rico – (continued) | |
| Puerto Rico Commonwealth GO Refunding Bonds for Public
Improvement Series 2009 B (D/Caa3)(i) |
|
| $ | 3,000,000 | | | 6.500 | | | 07/01/37 | | | | 1,432,500 | |
| Puerto Rico Commonwealth GO Refunding Bonds for Public
Improvement Series 2012 A (D/Caa3)(i) |
|
| | 3,955,000 | | | 5.000 | | | 07/01/41 | | | | 1,794,581 | |
| Puerto Rico Commonwealth GO Refunding Bonds
Subseries 2003 C-7 (NATL-RE) (A/A3) |
|
| | 2,000,000 | | | 6.000 | | | 07/01/27 | | | | 2,085,460 | |
| Puerto Rico Commonwealth Highway & Transportation Authority
RB Refunding Series 2005 L (AMBAC) (D/C) |
|
| | 115,000 | | | 5.250 | | | 07/01/38 | | | | 118,389 | |
| Puerto Rico Commonwealth Highway & Transportation Authority
RB Refunding Series 2005 L (NATL-RE) (A/A3) |
|
| | 185,000 | | | 5.250 | | | 07/01/35 | | | | 191,094 | |
| Puerto Rico Commonwealth Highway & Transportation Authority
RB Refunding Series 2007 N (NATL-RE) (A/A3) |
|
| | 1,600,000 | | | 5.250 | | | 07/01/33 | | | | 1,667,984 | |
| Puerto Rico Commonwelath Highway & Transportation Authority
RB Refunding Series 2007 CC (AGM) (AA/A2) |
|
| | 2,050,000 | | | 5.250 | | | 07/01/33 | | | | 2,375,273 | |
| Puerto Rico Electric Power Authority RB Refunding
Series 2007 UU (AGM) (AA/A2)(e) |
|
| | 10,075,000 | | | (3 Mo. LIBOR + 0.52%,
12.00% Cap), 1.390 | | | 07/01/29 | | | | 8,135,562 | |
| | Puerto Rico Electric Power Authority RB Series 2013 A (D/Ca)(i) | |
| | 3,000,000 | | | 6.750 | | | 07/01/36 | | | | 1,443,750 | |
| Puerto Rico Electric Power Authority RB Series 2016 E-1
(NR/NR)(i) |
|
| | 590,915 | | | 10.000 | | | 01/01/21 | | | | 284,378 | |
| Puerto Rico Electric Power Authority RB Series 2016 E-2
(NR/NR)(i) |
|
| | 590,915 | | | 10.000 | | | 07/01/21 | | | | 284,378 | |
| Puerto Rico Electric Power Authority RB Series 2016 E-3
(NR/NR)(i) |
|
| | 196,972 | | | 10.000 | | | 01/01/22 | | | | 94,793 | |
| Puerto Rico Electric Power Authority RB Series 2016 E-4
(NR/NR)(i) |
|
| | 196,972 | | | 10.000 | | | 07/01/22 | | | | 94,793 | |
| Puerto Rico Public Buildings Authority RB Refunding for
Government Facilities Series 2007 M-2 (AMBAC)
(COMWLTH GTD) (NR/Caa3)(c) |
|
| | 3,240,000 | | | 10.000 | | | 07/01/35 | | | | 3,519,450 | |
| Puerto Rico Sales Tax Financing Corp. RB First Subseries 2010 A
(D/Ca)(i) |
|
| | 975,000 | | | 5.500 | | | 08/01/42 | | | | 202,313 | |
| Puerto Rico Sales Tax Financing Corp. RB for Capital
Appreciation First Subseries 2009 A (D/Ca)(i) |
|
| | 13,000,000 | | | 6.750 | | | 08/01/32 | | | | 2,730,000 | |
| Puerto Rico Sales Tax Financing Corp. RB for Capital
Appreciation Series 2010 A (D/Ca)(d)(i) |
|
| | 7,000,000 | | | 0.000 | | | 08/01/35 | | | | 443,870 | |
| Puerto Rico Sales Tax Financing Corp. RB for Capital
Appreciation Subseries 2009 A (D/Ca)(d)(i) |
|
| | 6,500,000 | | | 0.000 | | | 08/01/34 | | | | 415,285 | |
| | |
| | |
| 32 | | The accompanying notes are an integral part of these financial statements. |
GOLDMAN SACHS DYNAMIC MUNICIPAL INCOME FUND
| | | | | | | | | | | | |
Principal
Amount | | | Interest
Rate | | Maturity
Date | | | Value | |
| Municipal Bonds – (continued) | |
| Puerto Rico – (continued) | |
| Puerto Rico Sales Tax Financing Corp. RB for Capital
Appreciation Subseries 2010 C (D/Ca)(d)(i) |
|
| $ | 1,400,000 | | | 0.000 % | | | 08/01/37 | | | $ | 79,800 | |
| Puerto Rico Sales Tax Financing Corp. Sales Tax RB First
Subseries 2009 A (D/Ca)(i) |
|
| | 5,805,000 | | | 5.000 | | | 08/01/24 | | | | 1,204,538 | |
| | 3,950,000 | | | 6.500 | | | 08/01/44 | | | | 829,500 | |
| | | | | | | | | | | | |
| | | | | | | | | | | 38,615,878 | |
| | |
| Rhode Island – 0.0% | |
| Rhode Island Health and Educational Building Corp. RB for
Woonsocket Public School Financing Program Series 2017 A
(AGM) (MUN GOVT GTD) (AA/A1) |
|
| | 500,000 | | | 5.000 | | | 05/15/24 | | | | 577,100 | |
| | |
| South Carolina – 0.4% | |
| | Clemson University Athletic Facilities RB Series 2015 (NR/Aa3) | |
| | 1,385,000 | | | 4.000 | | | 05/01/25 | | | | 1,568,443 | |
| | 1,570,000 | | | 4.000 | | | 05/01/26 | | | | 1,751,147 | |
| Lexington County School District No. 2 GO Bonds Series 2017 C
(SCSDE) (AA/Aa1)(f) |
|
| | 1,590,000 | | | 4.000 | | | 03/01/32 | | | | 1,741,304 | |
| | | | | | | | | | | | |
| | | | | | | | | | | 5,060,894 | |
| | |
| South Dakota – 0.1% | |
| South Dakota Health & Educational Facilities Authority RB for
Avera Health Series 2008 B (AA-/A1) |
|
| | 500,000 | | | 5.500 | | | 07/01/35 | | | | 514,055 | |
| | 300,000 | | | 5.250 | | | 07/01/38 | | | | 306,912 | |
| | | | | | | | | | | | |
| | | | | | | | | | | 820,967 | |
| | |
| Tennessee – 0.4% | |
| Bristol Industrial Development Board RB for The Pinnacle
Project Series 2016 A (NR/NR)(g) |
|
| | 1,250,000 | | | 5.000 | | | 12/01/35 | | | | 1,232,312 | |
| | 2,250,000 | | | 5.125 | | | 12/01/42 | | | | 2,201,580 | |
| Metropolitan Government Nashville & Davidson County Health
& Educational Facilities Board RB for Charter Village
Apartments Series 2007 (AMT) (FNMA) (NR/NR)(b)(c) |
|
| | 1,000,000 | | | 4.850 | | | 06/01/25 | | | | 1,000,120 | |
| Metropolitan Government Nashville & Davidson County Health
& Educational Facilities Board RB for Vanderbilt University
Medical Center Series 2016 A (NR/A3) |
|
| | 400,000 | | | 5.000 | | | 07/01/40 | | | | 448,364 | |
| | 700,000 | | | 5.000 | | | 07/01/46 | | | | 777,917 | |
| | | | | | | | | | | | |
| | | | | | | | | | | 5,660,293 | |
| | |
| Texas – 8.5% | |
| Central Texas Regional Mobility Authority RB Refunding Senior
Lien Series 2016 (BBB+/Baa2) |
|
| | 250,000 | | | 5.000 | | | 01/01/40 | | | | 282,178 | |
| | 435,000 | | | 5.000 | | | 01/01/46 | | | | 487,974 | |
| City of Celina Texas Municipal Corp. Special Assessment RB for
Glen Crossing Public Improvement District Phase#1 Project
Series 2016 (NR/NR) |
|
| | 250,000 | | | 4.200 | | | 09/01/27 | | | | 242,685 | |
| | 575,000 | | | 4.800 | | | 09/01/37 | | | | 554,254 | |
| | 650,000 | | | 5.250 | | | 09/01/46 | | | | 622,947 | |
| | |
| Municipal Bonds – (continued) | |
| Texas – (continued) | |
| City of Hackberry Special Assessment RB Refunding for
Hackberry Public Improvement District No. 3 Phases #13-16
Project Series 2017 (NR/NR)(f) |
|
| 200,000 | | | 3.250 | | | 09/01/22 | | | | 199,456 | |
| | 570,000 | | | 4.500 | | | 09/01/27 | | | | 587,163 | |
| City of Hackberry Special Assessment RB Refunding for Hidden
Cove Public Improvement District No. 2 Project Series 2017
(BBB/NR) |
|
| | 425,000 | | | 4.000 | | | 09/01/24 | | | | 456,284 | |
| | 440,000 | | | 4.000 | | | 09/01/25 | | | | 471,733 | |
| | 460,000 | | | 4.000 | | | 09/01/26 | | | | 490,162 | |
| | 480,000 | | | 4.000 | | | 09/01/27 | | | | 507,365 | |
| City of Lewisville Texas Combination Contract & Special
Assessment RB Refunding for Lewisville Castle Hills Public
Improvement District No. 3 Project Series 2015 (AGM)
(AA/NR) |
|
| | 1,415,000 | | | 4.000 | | | 09/01/25 | | | | 1,557,080 | |
| Dallas-Fort Worth International Airport Joint RB Refunding
Series 2014 A (AMT) (A+/NR) |
|
| | 2,500,000 | | | 5.250 | | | 11/01/30 | | | | 2,908,350 | |
| Fort Worth Special Assessment RB for Fort Worth Public
Improvement District No. 17 Major Improvement Project
Series 2017 (NR/NR)(g) |
|
| | 395,000 | | | 5.000 | | | 09/01/27 | | | | 409,358 | |
| | 225,000 | | | 5.000 | | | 09/01/32 | | | | 225,164 | |
| | 330,000 | | | 5.125 | | | 09/01/37 | | | | 325,730 | |
| Grand Parkway Transportation Corp. System Toll Convertible RB
Series 2013 B (AA+/NR)(h) |
|
| | 2,500,000 | | | 0.000 | | | 10/01/46 | | | | 2,327,550 | |
| | 3,450,000 | | | 0.000 | | | 10/01/47 | | | | 3,215,296 | |
| Gulf Coast IDA RB for Exxon Mobil Project Series 2012
(AA+/Aaa)(b)(c) |
|
| | 2,000,000 | | | 0.950 | | | 10/02/17 | | | | 2,000,000 | |
| Harris County Cultural Education Facilities Finance Corp. RB
Refunding for Memorial Hermann Health System
Series 2013 B (A+/A1)(e) |
|
| | 6,770,000 | | | (SIFMA Municipal
Swap Index Yield + 0.95%, 18.00% Cap), 1.890 | | | 06/01/23 | | | | 6,782,931 | |
| Hickory Creek Texas Special Assessment RB for Public
Improvement District No. 1 Series 2017 (BBB-/NR) |
|
| | 95,000 | | | 3.000 | | | 09/01/24 | | | | 95,649 | |
| | 100,000 | | | 3.500 | | | 09/01/25 | | | | 103,211 | |
| | 100,000 | | | 3.500 | | | 09/01/26 | | | | 102,152 | |
| | 105,000 | | | 3.500 | | | 09/01/27 | | | | 105,963 | |
| Houston Airport System RB Refunding for United Airlines, Inc.
Series 2015 B-2 (AMT) (BB-/NR) |
|
| | 2,500,000 | | | 5.000 | | | 07/15/20 | | | | 2,681,600 | |
| Houston Airport System RB Refunding Senior Lien
Series 2009 A (AA-/Aa3) |
|
| | 10,000,000 | | | 5.500 | | | 07/01/34 | | | | 10,324,400 | |
| Houston Airport System RB Subordinate Lien Series 2002 D-2
(AMT) (XLCA) (A+/A1)(c) |
|
| | 3,650,000 | | | 2.477 | | | 07/01/32 | | | | 3,483,628 | |
| | |
| | |
| The accompanying notes are an integral part of these financial statements. | | 33 |
GOLDMAN SACHS DYNAMIC MUNICIPAL INCOME FUND
Schedule of Investments (continued)
September 30, 2017 (Unaudited)
| | | | | | | | | | | | | | |
Principal
Amount | | | Interest
Rate | | | Maturity
Date | | | Value | |
| Municipal Bonds – (continued) | |
| Texas – (continued) | |
| Houston Airport System RB Tranche II Series 2000 P-2 (AMT)
(AGM) (AA/A1)(c) |
|
| $ | 950,000 | | | | 2.381 | % | | | 07/01/30 | | | $ | 883,500 | |
| Houston Independent School District Limited Tax GO Refunding
Bonds Series 2017 (PSF-GTD) (AAA/Aaa) |
|
| | 3,425,000 | | | | 4.000 | | | | 02/15/42 | | | | 3,605,429 | |
| Joint Guadalupe County RB Refunding and Improvement Bonds
for City of Seguin Hospital Mortgage Series 2015 (BB/NR) |
|
| | 700,000 | | | | 5.000 | | | | 12/01/17 | | | | 702,884 | |
| | 1,550,000 | | | | 5.000 | | | | 12/01/18 | | | | 1,590,068 | |
| | 1,545,000 | | | | 5.000 | | | | 12/01/19 | | | | 1,617,723 | |
| Kaufman County Fresh Water Supply District No. 1 Refunding
for Road Series 2016 C (AGM) (AA/NR) |
|
| | 455,000 | | | | 3.000 | | | | 09/01/23 | | | | 469,196 | |
| | 280,000 | | | | 3.000 | | | | 09/01/24 | | | | 287,577 | |
| | 505,000 | | | | 3.000 | | | | 09/01/25 | | | | 514,994 | |
| | 530,000 | | | | 4.000 | | | | 09/01/26 | | | | 577,657 | |
| | 560,000 | | | | 4.000 | | | | 09/01/27 | | | | 607,600 | |
| | 490,000 | | | | 4.000 | | | | 09/01/28 | | | | 526,471 | |
| Lamar Consolidated Independent School District Unlimited Tax
Schoolhouse Bonds RMKT 08/15/16 Series 2014 A
(PSF-GTD) (AAA/Aaa)(b)(c) |
|
| | 1,500,000 | | | | 1.050 | | | | 08/15/18 | | | | 1,500,150 | |
| Lower Neches Valley Authority Industrial Development Corp.
RB Refunding for Exxonmobil Project Series 2012
(AA+/Aaa)(b)(c) |
|
| | 2,000,000 | | | | 0.980 | | | | 10/02/17 | | | | 2,000,000 | |
| Matagorda County Texas Navigation District No. 1 PCRB
Refunding for Central Power & Light Co. Project RMKT
07/01/09 Series 2001 A (A-/Baa1) |
|
| | 1,300,000 | | | | 6.300 | | | | 11/01/29 | | | | 1,418,768 | |
| New Hope Cultural Education Facilities Finance Corp. Student
Housing RB for NCCD College Station Properties LLC, Texas
A&M University Project Series 2015 A (BBB-/Baa3) |
|
| | 2,310,000 | | | | 5.000 | | | | 07/01/35 | | | | 2,510,485 | |
| New Hope Cultural Education Facilities Finance Corp. Student
Housing RB for Station I, LLC – Texas A&M University
Collegiate Housing Corpus Christi Project Series 2014 A
(BBB-/NR) |
|
| | 1,000,000 | | | | 5.000 | | | | 04/01/39 | | | | 1,060,810 | |
| New Hope Cultural Education Facilities Finance Corp. Student
Housing RB for Station II, LLC – Texas A&M University
Collegiate Housing Corpus Christi Project Series 2016 A
(BBB-/Baa3) |
|
| | 645,000 | | | | 4.000 | | | | 04/01/22 | | | | 690,421 | |
| | 320,000 | | | | 4.000 | | | | 04/01/23 | | | | 341,447 | |
| | 275,000 | | | | 4.000 | | | | 04/01/24 | | | | 293,964 | |
| | 365,000 | | | | 4.000 | | | | 04/01/25 | | | | 386,312 | |
| | 375,000 | | | | 4.000 | | | | 04/01/26 | | | | 394,871 | |
| New Hope Cultural Education Facilities Finance Corp. Student
Housing RB for Tarleton State University Collegiate Housing
Project Series 2015 A (BBB-/Baa3) |
|
| | 250,000 | | | | 5.000 | | | | 04/01/30 | | | | 275,745 | |
| North Texas Tollway Authority RB Convertible Capital
Appreciation Special Project System Series 2011 (AA+/NR)(h) |
|
| | 1,000,000 | | | | 0.000 | | | | 09/01/43 | | | | 1,066,460 | |
| | |
| Municipal Bonds – (continued) | |
| Texas – (continued) | |
| North Texas Tollway Authority RB First Tier Series 2009 A
(A/A1) |
|
| 205,000 | | | | 6.250 | | | | 01/01/39 | | | | 216,956 | |
| North Texas Tollway Authority RB First Tier Series 2009 A
(A/NR) |
|
| | 470,000 | | | | 6.250 | | | | 01/01/24 | | | | 499,643 | |
| North Texas Tollway Authority RB First Tier Series 2009 A
(NR/NR)(a) |
|
| | 2,925,000 | | | | 6.250 | | | | 01/01/19 | | | | 3,112,492 | |
| North Texas Tollway Authority RB First Tier Series 2016 A
(A/A1) |
|
| | 615,000 | | | | 5.750 | | | | 01/01/40 | | | | 621,716 | |
| North Texas Tollway Authority RB Special Project System Series
2011 A (AA+/NR) |
|
| | 1,000,000 | | | | 5.500 | | | | 09/01/41 | | | | 1,147,680 | |
| | 1,000,000 | | | | 6.000 | | | | 09/01/41 | | | | 1,170,720 | |
| North Texas Tollway Authority System RB Refunding First Tier
Series 2008 A (NR/A1)(a) |
|
| | 1,890,000 | | | | 5.750 | | | | 01/01/18 | | | | 1,912,245 | |
| North Texas Tollway Authority System RB Refunding First Tier
Series 2008 A (NR/NR)(a) |
|
| | 2,495,000 | | | | 5.750 | | | | 01/01/18 | | | | 2,524,067 | |
| North Texas Tollway Authority System RB Refunding First Tier
Series 2016 A (A/A1) |
|
| | 1,500,000 | | | | 5.000 | | | | 01/01/22 | | | | 1,717,065 | |
| North Texas Tollway Authority System RB Refunding for Capital
Appreciation First Tier Series 2008 I (A/A1) |
|
| | 6,000,000 | | | | 6.500 | | | | 01/01/43 | | | | 7,562,880 | |
| Port of Houston Authority Harris County Unlimited Tax GO
Refunding Bonds Series 2008 A (AMT) (AAA/Aaa) |
|
| | 3,000,000 | | | | 6.125 | | | | 10/01/33 | | | | 3,151,440 | |
| Round Rock Texas Independent School District Unlimited Tax
GO Bonds for School Building Series 2009 (AA/Aaa) |
|
| | 2,730,000 | | | | 5.250 | | | | 08/01/34 | | | | 2,824,540 | |
| Tarrant County Cultural Education Facilities Finance Corp. RB
Refunding for Air Force Village Obligated Group Series 2016
(BB+/NR) |
|
| | 2,000,000 | | | | 4.000 | | | | 05/15/18 | | | | 2,022,880 | |
| | 2,375,000 | | | | 4.000 | | | | 05/15/19 | | | | 2,438,294 | |
| | 2,475,000 | | | | 5.000 | | | | 05/15/20 | | | | 2,632,657 | |
| | 2,100,000 | | | | 5.000 | | | | 05/15/21 | | | | 2,269,827 | |
| | 2,730,000 | | | | 5.000 | | | | 05/15/22 | | | | 2,993,281 | |
| Texas Municipal Gas Acquisition & Supply Corp. I RB Senior
Lien Series 2008 D (BBB+/Baa1) |
|
| | 4,950,000 | | | | 6.250 | | | | 12/15/26 | | | | 6,038,703 | |
| Texas Private Activity Bond Surface Transportation Corp. RB
Senior Lien for Mobility Partners LLC Series 2009
(BBB-/Baa2) |
|
| | 8,505,000 | | | | 6.875 | | | | 12/31/39 | | | | 9,449,905 | |
| Texas Transportation Commission Central Turnpike System RB
Refunding Second Tier Series 2015 C (BBB+/Baa1) |
|
| | 1,380,000 | | | | 5.000 | | | | 08/15/42 | | | | 1,536,492 | |
| | | | | | | | | | | | | | |
| | | | | | | | | | | | | 120,716,278 | |
| | |
| | |
| 34 | | The accompanying notes are an integral part of these financial statements. |
GOLDMAN SACHS DYNAMIC MUNICIPAL INCOME FUND
| | | | | | | | | | | | | | |
Principal
Amount | | | Interest
Rate | | | Maturity
Date | | | Value | |
| Municipal Bonds – (continued) | |
| Utah – 0.4% | |
| Salt Lake City RB for International Airport Series 2017 A (AMT)
(A+/A2) |
|
| $ | 2,650,000 | | | | 5.000 | % | | | 07/01/47 | | | $ | 3,027,413 | |
| Utah Transit Authority Sales Tax RB Refunding Subordinate
Series 2015 A (AAA/Aa2) |
|
| | 3,065,000 | | | | 4.000 | | | | 06/15/34 | | | | 3,300,453 | |
| | | | | | | | | | | | | | |
| | | | | | | | | | | | | 6,327,866 | |
| | |
| Vermont – 0.1% | |
| Vermont Economic Development Authority RB Refunding for
Wake Robin Corp. Series 2017 A (NR/NR) |
|
| | 745,000 | | | | 5.000 | | | | 05/01/25 | | | | 819,843 | |
| | 585,000 | | | | 5.000 | | | | 05/01/26 | | | | 643,149 | |
| | | | | | | | | | | | | | |
| | | | | | | | | | | | | 1,462,992 | |
| | |
| Virgin Islands – 0.6% | |
| Virgin Islands Public Finance Authority RB Matching Fund Loan
Note Senior Lien Series 2010 A (CCC+/Caa1) |
|
| | 1,000,000 | | | | 5.000 | | | | 10/01/20 | | | | 806,270 | |
| | 1,410,000 | | | | 5.000 | | | | 10/01/29 | | | | 1,009,913 | |
| Virgin Islands Public Finance Authority RB Matching Fund Loan
Note Series 2012 A (CCC+/Caa1) |
|
| | 700,000 | | | | 5.000 | | | | 10/01/32 | | | | 498,750 | |
| Virgin Islands Public Finance Authority RB Refunding for Virgin
Islands Gross Receipts Taxes Loan Note Series 2014 C
(CCC/NR) |
|
| | 1,450,000 | | | | 5.000 | | | | 10/01/39 | | | | 938,875 | |
| Virgin Islands Public Finance Authority RB Series 2014 A
(AGM) (AA/A2)(g) |
|
| | 5,000,000 | | | | 5.000 | | | | 10/01/34 | | | | 5,337,150 | |
| | | | | | | | | | | | | | |
| | | | | | | | | | | | | 8,590,958 | |
| | |
| Virginia – 1.8% | |
| Amelia County IDA Solid Waste Disposal RB Refunding for
Waste Management, Inc. Project Series 2002 (AMT)
(A-/NR)(b)(c) |
|
| | 2,500,000 | | | | 2.125 | | | | 04/01/20 | | | | 2,528,300 | |
| Fairfax County Economic Development Authority Residential
Care Facilities Mortgage RB Refunding for Goodwin House
Incorporated Series 2016 A (BBB/NR) |
|
| | 1,250,000 | | | | 4.000 | | | | 10/01/42 | | | | 1,270,800 | |
| Newport News Economic Development Authority Residential
Care Facilities RB Refunding For Lifespire of Virginia
Series 2016 (NR/NR) |
|
| | 450,000 | | | | 2.000 | | | | 12/01/18 | | | | 450,562 | |
| Tobacco Settlement Financing Corp. RB for Capital Appreciation
Subseries 2007 C (CCC+/NR)(d) |
|
| | 94,865,000 | | | | 0.000 | | | | 06/01/47 | | | | 8,031,271 | |
| Virginia Commonwealth Transportation Board RB Refunding for
U.S. Route 58 Corridor Development Program Series 2016 C
(AA+/Aa1) |
|
| | 2,285,000 | | | | 5.000 | | | | 05/15/23 | | | | 2,703,384 | |
| Virginia Port Authority Port Facilities RB Refunding Series 2015
A (AMT) (A/Aa3)(a) |
|
| | 2,750,000 | | | | 5.000 | | | | 07/01/25 | | | | 3,332,505 | |
| | |
| Municipal Bonds – (continued) | |
| Virginia – (continued) | |
| Virginia Small Business Financing Authority Senior Lien RB for
95 Express Lanes LLC Project Series 2017 (AMT) (BBB/NR) |
|
| 950,000 | | | | 5.000 | | | | 07/01/34 | | | | 1,031,861 | |
| | 3,325,000 | | | | 5.000 | | | | 01/01/40 | | | | 3,588,008 | |
| Virginia Small Business Financing Authority Senior Lien RB for
Elizabeth River Crossings Opco, LLC Project Series 2012
(AMT) (BBB/NR) |
|
| | 750,000 | | | | 5.500 | | | | 01/01/42 | | | | 832,305 | |
| Washington County IDA RB for Mountain States Health Alliance
Series 2009 C (BBB+/Baa1) |
|
| | 1,000,000 | | | | 7.750 | | | | 07/01/38 | | | | 1,063,620 | |
| | | | | | | | | | | | | | |
| | | | | | | | | | | | | 24,832,616 | |
| | |
| Washington – 1.6% | |
| Seattle City RB Refunding for Municipal Light & Power
Improvement Series 2017 C (AA/Aa2) |
|
| | 8,465,000 | | | | 4.000 | | | | 09/01/37 | | | | 9,103,176 | |
| University of Washington RB Refunding Series 2012 A
(AA+/Aaa) |
|
| | 2,500,000 | | | | 5.000 | | | | 07/01/29 | | | | 2,889,275 | |
| Washington Health Care Facilities Authority RB for MultiCare
Health System RMKT 02/26/09 Series 2008 A (ASSURED
GTY) (AA/Aa3)(a) |
|
| | 250,000 | | | | 6.000 | | | | 08/15/19 | | | | 272,618 | |
| Washington Health Care Facilities Authority RB for MultiCare
Health System RMKT 02/26/09 Series 2008 B (ASSURED
GTY) (AA/Aa3)(a) |
|
| | 250,000 | | | | 6.000 | | | | 08/15/19 | | | | 272,618 | |
| Washington State Motor Vehicle Fuel Tax GO Refunding Bonds
Series 2015 C (AMBAC) (AA+/Aa1)(d) |
|
| | 6,855,000 | | | | 0.000 | | | | 06/01/28 | | | | 5,155,714 | |
| Washington State Various Purpose GO Refunding Bonds
Series R-2010B (AA+/Aa1) |
|
| | 2,475,000 | | | | 5.000 | | | | 01/01/23 | | | | 2,686,068 | |
| | 2,595,000 | | | | 5.000 | | | | 01/01/24 | | | | 2,814,485 | |
| | | | | | | | | | | | | | |
| | | | | | | | | | | | | 23,193,954 | |
| | |
| West Virginia – 0.2% | |
| West Virginia Economic Development Authority Solid Waste
Disposal Facilities RB Refunding for Appalachian Power Co. –
Amos Project Series 2011 A (AMT) (A-/Baa1)(b)(c) |
|
| | 2,375,000 | | | | 1.700 | | | | 09/01/20 | | | | 2,363,600 | |
| West Virginia Hospital Finance Authority Hospital RB Refunding
and Improvement for West Virginia United Health System
Obligated Group Series 2009 C (A/A2)(a) |
|
| | 1,000,000 | | | | 5.500 | | | | 06/01/19 | | | | 1,072,560 | |
| | | | | | | | | | | | | | |
| | | | | | | | | | | | | 3,436,160 | |
| | |
| Wisconsin – 1.0% | |
| Public Finance Authority Exempt Facilities RB Refunding for
Celanese Project Series 2016 C (AMT) (BBB-/Baa3) |
|
| | 1,000,000 | | | | 4.300 | | | | 11/01/30 | | | | 1,023,030 | |
| Public Finance Authority Limited Obligation RB for American
Dream @ Meadowlands Project Series 2017 (NR/NR)(g) |
|
| | 2,805,000 | | | | 7.000 | | | | 12/01/50 | | | | 3,259,606 | |
| | |
| | |
| The accompanying notes are an integral part of these financial statements. | | 35 |
GOLDMAN SACHS DYNAMIC MUNICIPAL INCOME FUND
Schedule of Investments (continued)
September 30, 2017 (Unaudited)
| | | | | | | | | | | | | | |
Principal
Amount | | | Interest
Rate | | | Maturity
Date | | | Value | |
| Municipal Bonds – (continued) | |
| Wisconsin – (continued) | |
| Public Finance Authority Pass-Through RB for Natgasoline LLC
Series 2016 (NR/NR)(g) |
|
| $ | 4,410,000 | | | | 10.000 | % | | | 06/30/21 | | | $ | 4,415,027 | |
| Public Finance Authority Senior Airport Facilities RB Refunding
for Transportation Infrastructure Properties LLC Obligated
Group Series 2012 B (AMT) (BBB/NR) |
|
| | 2,000,000 | | | | 5.250 | | | | 07/01/28 | | | | 2,224,660 | |
| Public Finance Authority Senior Living RB Refunding for Mary’s
Woods at Marylhurst Project Series 2017 B-3 (BB/NR)(g) |
|
| | 1,900,000 | | | | 3.000 | | | | 11/15/22 | | | | 1,923,028 | |
| Wisconsin State Health & Educational Facilities Authority RB for
Upland Hills Health, Inc. Series 2006 A (BBB/NR) |
|
| | 355,000 | | | | 5.125 | | | | 05/15/29 | | | | 356,072 | |
| Wisconsin State Health & Educational Facilities Authority RB for
Upland Hills Health, Inc. Series 2006 B (BBB/NR) |
|
| | 100,000 | | | | 5.000 | | | | 05/15/36 | | | | 100,279 | |
| Wisconsin State Health & Educational Facilities Authority RB
Refunding for Fort Healthcare, Inc. Series 2014 (BBB+/NR) |
|
| | 375,000 | | | | 4.000 | | | | 05/01/18 | | | | 379,759 | |
| | 285,000 | | | | 4.000 | | | | 05/01/19 | | | | 294,436 | |
| | 410,000 | | | | 5.000 | | | | 05/01/20 | | | | 441,177 | |
| | | | | | | | | | | | | | |
| | | | | | | | | | | | | 14,417,074 | |
| | |
| | TOTAL INVESTMENTS – 97.7% | | | | | |
| | (Cost $1,363,333,314) | | | $ | 1,387,878,737 | |
| | |
| OTHER ASSETS IN EXCESS OF
LIABILITIES – 2.3% |
| | | 32,799,685 | |
| | |
| | NET ASSETS – 100.0% | | | $ | 1,420,678,422 | |
| | |
| | |
| The percentage shown for each investment category reflects the value of investments in that category as a percentage of net assets. |
(a) | | Pre-refunded security. Maturity date disclosed is pre-refunding date. |
(b) | | Security with “Put” features and resetting interest rates. Maturity dates disclosed are the puttable dates. Interest rate disclosed is that which is in effect on September 30, 2017. |
(c) | | Variable Rate Demand Instruments – rate shown is that which is in effect on September 30, 2017. Certain variable rate securities are not based on a published reference rate and spread but are determined by the issuer or agent and are based on current market conditions. |
(d) | | Issued with a zero coupon. Income is recognized through the accretion of discount. |
(e) | | Variable rate security. Except for floating rate notes (for which final maturity is disclosed), maturity date disclosed is the next interest reset date. Interest rate disclosed is that which is in effect on September 30, 2017. |
(f) | | When-issued security. |
(g) | | Exempt from registration under Rule 144A of the Securities Act of 1933. Under procedures approved by the Board of Trustees, such securities may be deemed liquid by the Investment Adviser and may be resold, normally to qualified institutional buyers in transactions exempt from registration. Total market value of Rule 144A securities amounts to $66,429,315, which represents approximately 4.7% of net assets as of September 30, 2017 and are unaudited. |
(h) | | Zero coupon bond until next reset date. |
(i) | | Security is currently in default. |
Security ratings disclosed, if any, are issued by either Standard & Poor’s, Moody’s Investor Service or Fitch and are unaudited. A brief description of the ratings is available in the Fund’s Statement of Additional Information.
| | |
|
Investment Abbreviations: |
AGM | | —Insured by Assured Guaranty Municipal Corp. |
AMBAC | | —Insured by American Municipal Bond Assurance Corp. |
AMT | | —Alternative Minimum Tax |
ASSURED GTY | | —Insured by Assured Guaranty |
BAM | | —Build America Mutual Assurance Co. |
CAL MTG INS | | —Insured by California Mortgage Insurance |
COMWLTH GTD | | —Commonwealth Guaranteed |
COPS | | —Certificates of Participation |
ETM | | —Escrowed to Maturity |
FNMA | | —Federal National Mortgage Association |
GARB | | —General Airport Revenue Bond |
GNMA | | —Government National Mortgage Association |
GO | | —General Obligation |
IDA | | —Industrial Development Authority |
LIBOR | | —London Interbank Offered Rate |
Mo. | | —Month |
MUN GOVT GTD | | —Municipal Government Guaranteed |
NATL-RE | | —Insured by National Public Finance Guarantee Corp. |
NATL-RE FGIC | | —Insured by National Public Finance Guarantee Corp., which reinsures Financial Guaranty Insurance Co. |
NR | | —Not Rated |
PCRB | | —Pollution Control Revenue Bond |
PSF-GTD | | —Guaranteed by Permanent School Fund |
Q-SBLF | | —Qualified School Board Loan Fund |
RB | | —Revenue Bond |
RMKT | | —Remarketed |
SCSDE | | —South Carolina State Department of Education |
SIFMA | | —The Securities Industry and Financial Markets Association |
ST AID WITHHLDG | | —State Aid Withholding |
ST APPROP | | —State Appropriation |
U.S. | | —United States |
USD | | —United States Dollar |
WR | | —Withdrawn Rating |
XLCA | | —Insured by XL Capital Assurance, Inc. |
|
| | |
| 36 | | The accompanying notes are an integral part of these financial statements. |
GOLDMAN SACHS DYNAMIC MUNICIPAL INCOME FUND
|
| ADDITIONAL INVESTMENT INFORMATION |
FUTURES CONTRACTS — At September 30, 2017, the Fund had the following futures contracts:
| | | | | | | | | | |
| Description | | Number of
Contracts | | Expiration
Date | | Notional Amount | | Unrealized
Appreciation/
(Depreciation) | |
Short position contracts: | |
| | | | |
U.S. Treasury Ultra Bond | | (49) | | 12/19/2017 | | $(8,091,125) | | $ | 139,111 | |
SWAP CONTRACTS — At September 30, 2017, the Fund had the following swap contracts:
OVER THE COUNTER CREDIT DEFAULT SWAP CONTRACTS
| | | | | | | | | | | | | | | | | | | | | | | | | | | | | | | | |
| Reference Obligation/Index(a) | | Financing
Rate Received
(Paid) by the
Fund (%) | | | Counterparty | | | Termination
Date | | | Notional Amount | | | Credit
Spread on
September 30,
2017(b) | | | Value | | | Upfront
Premium
(Received) Paid | | | Unrealized
Appreciation/
(Depreciation) | |
Protection Sold: | |
California State Various Purpose GO Bonds Series 2003, 5.000%, 11/01/23 | | | 1.000 | | |
| Bank of
America NA |
| | | 03/20/2023 | | | | USD 1,000,000 | | | | 0.485% | | | $ | 26,488 | | | $ | (27,133 | ) | | $ | 53,621 | |
California State Various Purpose GO Bonds Series 2003, 5.250%, 02/01/18 | | | 1.000 | | |
| JPMorgan Chase
Bank NA |
| | | 03/20/2023 | | | | USD 1,000,000 | | | | 0.485 | | | | 26,489 | | | | (27,133 | ) | | | 53,622 | |
| | | | | | | | | | | | | | | | | | | | | | | | | | | $ | (54,266 | ) | | $ | 107,243 | |
| | (a) | | Payments received quarterly. |
| | (b) | | Credit spread on the referenced obligation, together with the period of expiration, are indicators of payment/performance risk. The likelihood of a credit event occurring which would require a fund or its counterparty to make a payment or otherwise be required to perform under the swap contract is generally greater as the credit spread and term of the swap contract increase. |
CENTRALLY CLEARED INTEREST RATE SWAP CONTRACTS
| | | | | | | | | | | | | | | | | | | | | | | | |
Payments
Made by
the Fund
(%)(a) | | Payments
Received by
the Fund | | | Termination Date | | | Notional
Amount | | | Value | | | Upfront
Premium
(Received) Paid | | | Unrealized
Appreciation/
(Depreciation) | |
| 2.500 | | | 3 Month LIBOR | | | | 12/20/2027 | | | | USD 25,100,000 | (b) | | $ | (425,786 | ) | | $ | (662,123 | ) | | $ | 236,337 | |
| 2.250 | | | 3 Month LIBOR | | | | 12/21/2041 | | | | USD 19,600,000 | | | | 889,556 | | | | (1,254,470 | ) | | | 2,144,026 | |
| 2.750 | | | 3 Month LIBOR | | | | 12/20/2047 | | | | USD 94,600,000 | (b) | | | (4,305,854 | ) | | | (6,114,458 | ) | | | 1,808,604 | |
| | | | | | | | | | | | | | | $ | (3,842,084 | ) | | $ | (8,031,051 | ) | | $ | 4,188,967 | |
| | (a) | | Payments made semi-annually. |
| | (b) | | Represents forward starting interest rate swaps whose effective dates of commencement of accruals and cash flows occur subsequent to September 30, 2017. |
| | |
| The accompanying notes are an integral part of these financial statements. | | 37 |
GOLDMAN SACHS HIGH YIELD MUNICIPAL FUND
Schedule of Investments
September 30, 2017 (Unaudited)
| | | | | | | | | | | | |
Principal
Amount | | | Interest
Rate | | Maturity
Date | | | Value | |
| Municipal Bonds – 97.3% | |
| Alabama – 2.8% | |
| Houston County Health Care Authority RB for Southeast
Alabama Medical Center Series 2016 A (BBB/NR) |
|
| $ | 850,000 | | | 5.000% | | | 10/01/24 | | | $ | 985,583 | |
| | 850,000 | | | 5.000 | | | 10/01/25 | | | | 977,185 | |
| | 4,125,000 | | | 5.000 | | | 10/01/30 | | | | 4,606,223 | |
| Jefferson County Senior Lien Sewer RB Warrants Series 2013 C
(AGM) (AA/A2)(a) |
|
| | 5,750,000 | | | 0.000 | | | 10/01/38 | | | | 4,849,205 | |
| | 6,000,000 | | | 0.000 | | | 10/01/42 | | | | 5,033,280 | |
| Jefferson County Subordinate Lien Sewer RB Warrants
Series 2013 D (BBB-/NR) |
|
| | 8,300,000 | | | 6.000 | | | 10/01/42 | | | | 9,735,402 | |
| | 19,850,000 | | | 7.000 | | | 10/01/51 | | | | 24,531,424 | |
| | 78,270,000 | | | 6.500 | | | 10/01/53 | | | | 93,903,650 | |
| | | | | | | | | | | | |
| | | | | | | | | | | 144,621,952 | |
| | |
| Alaska – 0.5% | |
| Northern Tobacco Securitization Corp. RB Refunding Asset-
Backed Bonds Series 2006 A (NR/B3) |
|
| | 25,995,000 | | | 5.000 | | | 06/01/46 | | | | 25,260,641 | |
| Northern Tobacco Securitization Corp. RB Refunding Capital
Appreciation Asset-Backed Bonds 1st Subordinate
Series 2006 B (NR/NR)(b) |
|
| | 4,280,000 | | | 0.000 | | | 06/01/46 | | | | 401,464 | |
| | | | | | | | | | | | |
| | | | | | | | | | | 25,662,105 | |
| | |
| Arizona – 1.8% | |
| Apache County IDA PCRB for Tucson Electric Power Company
Series 2012 A (A-/A3) |
|
| | 4,500,000 | | | 4.500 | | | 03/01/30 | | | | 4,904,010 | |
| Arizona Health Facilities Authority Hospital RB for Banner
Health Series 2007 B (AA-/NR)(c) |
|
| | 54,030,000 | | | (3 Mo. LIBOR + 0.81%),
1.680 | | | 01/01/37 | | | | 47,278,951 | |
| City of Tempe IDA RB Refunding for Friendship Village
Series 2012 A (NR/NR) |
|
| | 1,250,000 | | | 6.250 | | | 12/01/42 | | | | 1,338,925 | |
| | 1,325,000 | | | 6.250 | | | 12/01/46 | | | | 1,416,147 | |
| Maricopa County Arizona Pollution Control Corp. PCRB
Refunding for El Paso Electric Co. Project Series 2009 A
(BBB/Baa1) |
|
| | 8,800,000 | | | 7.250 | | | 02/01/40 | | | | 9,417,672 | |
| Maricopa County Arizona Pollution Control Corp. PCRB
Refunding for Public Service Co. of New Mexico Palo Verde
Project Series 2003 A (BBB+/Baa2) |
|
| | 5,000,000 | | | 6.250 | | | 01/01/38 | | | | 5,467,650 | |
| Maricopa County IDA RB for Banner Health Series 2017 A
(AA-/NR)(d) |
|
| | 8,400,000 | | | 4.000 | | | 01/01/41 | | | | 8,633,772 | |
| Pima County IDA RB Refunding for Tucson Electric Power Co.
Project Series 2012 A (A-/A3) |
|
| | 5,350,000 | | | 4.500 | | | 06/01/30 | | | | 5,847,443 | |
| Pima County IDA RB Refunding for Tucson Electric Power Co.
Project Series 2013 A (A-/A3) |
|
| | 3,390,000 | | | 4.000 | | | 09/01/29 | | | | 3,523,702 | |
| | |
| Municipal Bonds – (continued) | |
| Arizona – (continued) | |
| | University Medical Center Corp. RB Series 2009 (NR/WR)(e) | |
| 500,000 | | | 6.250 | | | 07/01/19 | | | | 543,540 | |
| | 1,360,000 | | | 6.500 | | | 07/01/19 | | | | 1,484,277 | |
| | University Medical Center Corp. RB Series 2011 (NR/WR)(e) | |
| | 3,500,000 | | | 6.000 | | | 07/01/21 | | | | 4,081,070 | |
| | | | | | | | | | | | |
| | | | | | | | | | | 93,937,159 | |
| | |
| California – 15.1% | |
| ABC Unified School District GO Bonds Series 2001 C
(NATL-RE) (A+/Aa3)(b) |
|
| | 1,600,000 | | | 0.000 | | | 08/01/26 | | | | 1,259,392 | |
| Alameda Corridor Transportation Authority RB Refunding
Second Subordinate Lien Series 2016 B (BBB+/Baa2) |
|
| | 5,825,000 | | | 5.000 | | | 10/01/36 | | | | 6,658,441 | |
| | 4,850,000 | | | 5.000 | | | 10/01/37 | | | | 5,527,642 | |
| Alameda County Oakland Unified School District GO Bonds
Election of 2012 Series 2015 A (AA-/Aa3) |
|
| | 3,000,000 | | | 5.000 | | | 08/01/40 | | | | 3,474,630 | |
| Alhambra California Unified School District Election of 2008 GO
Bonds Capital Appreciation for Elementary Schools
Improvement District Series B (AGM) (AA/Aa2)(b) |
|
| | 4,995,000 | | | 0.000 | | | 08/01/37 | | | | 2,490,957 | |
| Alvord Unified School District GO Bonds Capital Appreciation
for 2007 Election Series 2007 B (AGM) (AA/A2)(b) |
|
| | 1,210,000 | | | 0.000 | | | 08/01/36 | | | | 596,082 | |
| Atascadero Unified School District GO Bonds for 2014 Election
Series 2014 B (NATL-RE) (A/Aa3) |
|
| | 3,000,000 | | | 4.000 | | | 08/01/42 | | | | 3,116,130 | |
| Atwater Wastewater RB Refunding Series 2017 A (AGM)
(AA/NR) |
|
| | 465,000 | | | 5.000 | | | 05/01/40 | | | | 536,052 | |
| | 1,000,000 | | | 5.000 | | | 05/01/43 | | | | 1,143,020 | |
| | 1,970,000 | | | 3.500 | | | 05/01/45 | | | | 1,925,576 | |
| Calaveras Unified School District GO Bonds for Capital
Appreciation Series 2000 (AGM) (AA/A2)(b) |
|
| | 1,055,000 | | | 0.000 | | | 08/01/25 | | | | 873,930 | |
| California County Tobacco Securitization Agency Tobacco
Settlement RB Capital Appreciation Subordinate Series 2006 C
(BB+/NR)(b) |
|
| | 130,120,000 | | | 0.000 | | | 06/01/55 | | | | 9,401,170 | |
| California Health Facilities Financing Authority RB for El
Camino Hospital Series 2017 (A+/A1) |
|
| | 1,500,000 | | | 5.000 | | | 02/01/42 | | | | 1,716,195 | |
| | 4,000,000 | | | 5.000 | | | 02/01/47 | | | | 4,552,280 | |
| California Municipal Finance Authority COPS for Community
Hospitals of Central California Obligated Group Series 2009
(A-/Baa1)(e) |
|
| | 19,500,000 | | | 5.500 | | | 02/01/19 | | | | 20,664,930 | |
| California Municipal Finance Authority RB for California Baptist
University Series 2016 A (NR/NR)(f) |
|
| | 3,350,000 | | | 5.000 | | | 11/01/46 | | | | 3,533,982 | |
| California Municipal Finance Authority RB for Community
Medical Centers Series 2017 A (A-/Baa1) |
|
| | 1,800,000 | | | 5.000 | | | 02/01/42 | | | | 2,011,698 | |
| | 17,675,000 | | | 5.000 | | | 02/01/47 | | | | 19,726,714 | |
| | |
| | |
| 38 | | The accompanying notes are an integral part of these financial statements. |
GOLDMAN SACHS HIGH YIELD MUNICIPAL FUND
| | | | | | | | | | | | |
Principal
Amount | | | Interest
Rate | | Maturity
Date | | | Value | |
| Municipal Bonds – (continued) | |
| California – (continued) | |
| California State Various Purpose GO Bonds Series 2017
(AA-/Aa3) |
|
| $ | 11,500,000 | | | 5.000% | | | 08/01/46 | | | $ | 13,329,765 | |
| California State Veterans GO Refunding Bonds Series 2015 CM
(AMT) (AA/Aa2) |
|
| | 3,360,000 | | | 4.000 | | | 12/01/32 | | | | 3,561,634 | |
| California Statewide Communities Development Authority
Community Facilities District No. 2007-01 Special Tax
Refunding for Orinda Wilder Project Series 2015 (NR/NR) |
|
| | 2,000,000 | | | 5.000 | | | 09/01/30 | | | | 2,276,760 | |
| | 2,125,000 | | | 5.000 | | | 09/01/37 | | | | 2,373,094 | |
| California Statewide Communities Development Authority RB
for California Baptist University Series 2007 A (NR/NR) |
|
| | 2,000,000 | | | 5.400 | | | 11/01/27 | | | | 2,046,920 | |
| | 11,850,000 | | | 5.500 | | | 11/01/38 | | | | 12,128,949 | |
| California Statewide Communities Development Authority RB
for Lancer Plaza Project Series 2013 (NR/NR) |
|
| | 1,875,000 | | | 5.875 | | | 11/01/43 | | | | 2,117,944 | |
| California Statewide Communities Development Authority RB
for Methodist Hospital Project Series 2009 (FHA) (NR/WR)(e) |
|
| | 5,340,000 | | | 6.625 | | | 08/01/19 | | | | 5,883,612 | |
| California Statewide Communities Development Authority RB
Refunding for California Baptist University Series 2017 A
(NR/NR)(f) |
|
| | 2,000,000 | | | 3.000 | | | 11/01/22 | | | | 2,006,000 | |
| | 935,000 | | | 5.000 | | | 11/01/32 | | | | 1,033,951 | |
| | 1,875,000 | | | 5.000 | | | 11/01/41 | | | | 2,021,138 | |
| California Statewide Communities Development Authority RB
Refunding for Enloe Medical Center Series 2015 (CAL MTG
INS) (AA-/NR) |
|
| | 2,850,000 | | | 5.000 | | | 08/15/38 | | | | 3,266,613 | |
| California Statewide Communities Development Authority RB
Refunding for Front Porch Communities & Sevices
Series 2017 A (A-/NR) |
|
| | 1,200,000 | | | 5.000 | | | 04/01/47 | | | | 1,349,496 | |
| California Statewide Communities Development Authority RB
Refunding for Loma Linda University Medical Center
Series 2014 A (BB/NR) |
|
| | 10,705,000 | | | 5.250 | | | 12/01/34 | | | | 11,889,187 | |
| | 6,235,000 | | | 5.500 | | | 12/01/54 | | | | 6,852,764 | |
| California Statewide Communities Development Authority RB
Refunding for Loma Linda University Medical Center
Series 2016 A (BB/NR)(f) |
|
| | 10,250,000 | | | 5.250 | | | 12/01/56 | | | | 11,140,418 | |
| California Statewide Communities Development Authority
Student Housing RB for University of California Irvine East
Campus Apartments, Phase IV-A CHF – Irvine, LLC
Series 2017 (NR/Baa1) |
|
| | 3,750,000 | | | 5.000 | | | 05/15/42 | | | | 4,324,987 | |
| | 3,850,000 | | | 5.000 | | | 05/15/47 | | | | 4,419,646 | |
| | 3,075,000 | | | 5.000 | | | 05/15/50 | | | | 3,510,820 | |
| California Statewide Financing Authority Tobacco Settlement RB
Capital Appreciation for Turbo Pooled Program Series 2006 B
(CCC/NR)(b) |
|
| | 35,000,000 | | | 0.000 | | | 06/01/46 | | | | 4,458,650 | |
| | |
| Municipal Bonds – (continued) | |
| California – (continued) | |
| Capistrano Unified School District Special Tax for Capital
Appreciation Series 2005 (NATL-RE) (A/A3)(b) |
|
| $ | 7,000,000 | | | 0.000% | | | 09/01/33 | | | $ | 3,792,040 | |
| City of Davis Redevelopment Agency Tax Allocation for Davis
Redevelopment Project Series 2011 A (A+/NR) |
|
| | 750,000 | | | 6.500 | | | 12/01/26 | | | | 902,385 | |
| | 2,830,000 | | | 7.000 | | | 12/01/36 | | | | 3,458,090 | |
| City of Fremont Community Facilities District No. 1 Special Tax
for Pacific Commons Series 2015 (NR/NR) |
|
| | 3,000,000 | | | 5.000 | | | 09/01/45 | | | | 3,276,030 | |
| City of Goleta Redevelopment Agency Tax Allocation for Goleta
Old Town Redevelopment Project Series 2011 (NR/NR) |
|
| | 670,000 | | | 7.750 | | | 12/01/31 | | | | 672,646 | |
| | 5,000,000 | | | 8.000 | | | 06/01/44 | | | | 5,020,100 | |
| City of Palo Alto Limited Obligation Refunding Improvement
Bonds for University Avenue Area Off-Street Parking
Assessment District Series 2012 (BBB/NR) |
|
| | 600,000 | | | 5.000 | | | 09/02/30 | | | | 650,436 | |
| City of Sacramento Natomas Meadows Community Facilities
District No. 2007-01 Special Tax Bonds for Improvement Area
No. 1 Series 2017 (NR/NR)(f) |
|
| | 280,000 | | | 5.000 | | | 09/01/32 | | | | 304,746 | |
| | 700,000 | | | 5.000 | | | 09/01/37 | | | | 745,577 | |
| | 1,745,000 | | | 5.000 | | | 09/01/47 | | | | 1,832,599 | |
| Coachella Valley Unified School District GO Bonds Capital
Appreciation Series 2012 D (AGM) (AA/WR)(b) |
|
| | 2,500,000 | | | 0.000 | | | 08/01/43 | | | | 887,550 | |
| Coronado Community Development Agency Tax Allocation for
Coronado Community Development Project Series 2005
(AMBAC) (A+/NR) |
|
| | 175,000 | | | 5.000 | | | 09/01/20 | | | | 175,504 | |
| Denair California Unified School District GO Bonds Capital
Appreciation Election 2001 Series 2003 B (NATL-RE)
(A/A3)(b) |
|
| | 1,305,000 | | | 0.000 | | | 08/01/27 | | | | 983,383 | |
| Dublin Community Facilities District No. 2015-1 Improvement
Area No. 1 Special Tax Series 2017 (NR/NR) |
|
| | 640,000 | | | 5.000 | | | 09/01/27 | | | | 730,368 | |
| | 1,115,000 | | | 5.000 | | | 09/01/37 | | | | 1,213,042 | |
| | 2,500,000 | | | 5.000 | | | 09/01/47 | | | | 2,675,300 | |
| El Rancho California Unified School District GO Bonds Capital
Appreciation Election 2003 Series 2007 (NATL-RE) (A-/A3)(b) |
|
| | 5,400,000 | | | 0.000 | | | 08/01/32 | | | | 3,167,586 | |
| Fairfield COPS Capital Appreciation for Water Financing Series
2007 A (XLCA) (AA-/WR)(b) |
|
| | 4,180,000 | | | 0.000 | | | 04/01/29 | | | | 2,879,100 | |
| Folsom Cordova Unified School District No. 4 GO for School
Facilities Improvement Capital Appreciation for Election of
2006 Series 2007 A (NATL-RE) (AA-/Aa3)(b) |
|
| | 3,360,000 | | | 0.000 | | | 10/01/32 | | | | 2,047,752 | |
| Foothill/Eastern Transportation Corridor Agency Toll Road RB
Refunding Capital Appreciation Senior Lien Series 2015 A
(AGM) (AA/A2)(b) |
|
| | 12,000,000 | | | 0.000 | | | 01/15/35 | | | | 6,145,080 | |
| | |
| | |
| The accompanying notes are an integral part of these financial statements. | | 39 |
GOLDMAN SACHS HIGH YIELD MUNICIPAL FUND
Schedule of Investments (continued)
September 30, 2017 (Unaudited)
| | | | | | | | | | | | |
Principal
Amount | | | Interest
Rate | | Maturity
Date | | | Value | |
| Municipal Bonds – (continued) | |
| California – (continued) | |
| Foothill/Eastern Transportation Corridor Agency Toll Road RB
Refunding RMKT 08/24/17 Series 2013 B Subseries B-1
(BBB-/Baa3) |
|
| $ | 4,855,000 | | | 3.950 % | | | 01/15/53 | | | $ | 4,845,581 | |
| Foothill/Eastern Transportation Corridor Agency Toll Road RB
Refunding Series 2013 A (BBB-/Baa3) |
|
| | 13,535,000 | | | 6.000 | | | 01/15/53 | | | | 15,625,887 | |
| Foothill/Eastern Transportation Corridor Agency Toll Road RB
Refunding Subseries B-3 (BBB-/Baa3)(g)(h) |
|
| | 4,425,000 | | | 5.500 | | | 01/15/23 | | | | 5,043,394 | |
| Fullerton Public Financing Authority Tax Allocation Series 2005
(AMBAC) (A/WR) |
|
| | 200,000 | | | 5.000 | | | 09/01/27 | | | | 203,114 | |
| Golden State Tobacco Securitization Corp. California Tobacco
Settlement RB Asset-Backed Bonds for Capital Appreciation
Subseries 2007 B (CCC+/NR)(b) |
|
| | 127,260,000 | | | 0.000 | | | 06/01/47 | | | | 16,630,337 | |
| Golden State Tobacco Securitization Corp. California Tobacco
Settlement RB Asset-Backed Bonds for Capital Appreciation
Subseries 2007 C (CCC/NR)(b) |
|
| | 307,000,000 | | | 0.000 | | | 06/01/47 | | | | 36,189,160 | |
| Golden State Tobacco Securitization Corp. California Tobacco
Settlement RB Asset-Backed Bonds Series 2015 A
(ST APPROP) (A+/A1) |
|
| | 7,975,000 | | | 5.000 | | | 06/01/40 | | | | 9,088,390 | |
| | 48,010,000 | | | 5.000 | | | 06/01/45 | | | | 54,465,425 | |
| Golden State Tobacco Securitization Corp. California Tobacco
Settlement RB Senior Asset-Backed Bonds Series 2007 A-1
(NR/B3) |
|
| | 7,325,000 | | | 5.750 | | | 06/01/47 | | | | 7,340,529 | |
| Golden State Tobacco Securitization Corp. California Tobacco
Settlement RB Senior Asset-Backed Bonds Series 2007 A-2
(B/B3) |
|
| | 27,780,000 | | | 5.300 | | | 06/01/37 | | | | 28,236,148 | |
| Inland Empire Tobacco Securitization Authority RB Turbo Asset-
Backed Bonds for Capital Appreciation Series 2007 C-1
(CCC/NR)(b) |
|
| | 101,195,000 | | | 0.000 | | | 06/01/36 | | | | 29,318,215 | |
| Inland Empire Tobacco Securitization Authority RB Turbo Asset-
Backed Bonds for Capital Appreciation Series 2007 C-2
(CCC/NR)(b) |
|
| | 71,235,000 | | | 0.000 | | | 06/01/47 | | | | 9,606,752 | |
| Inland Empire Tobacco Securitization Authority RB Turbo Asset-
Backed Bonds for Capital Appreciation Series 2007 D
(CCC/NR)(b) |
|
| | 260,660,000 | | | 0.000 | | | 06/01/57 | | | | 13,528,254 | |
| Irvine Unified School District No. 09-1 Special Tax for
Community Facilities Series 2017 A (NR/NR) |
|
| | 1,655,000 | | | 5.000 | | | 09/01/47 | | | | 1,845,193 | |
| | 1,925,000 | | | 5.000 | | | 03/01/57 | | | | 2,115,902 | |
| Lammersville Joint Unified School District Special Tax Bonds for
Community Facilities District No. 2007-1 Series 2013
(NR/NR) |
|
| | 2,750,000 | | | 6.000 | | | 09/01/43 | | | | 3,216,427 | |
| Lemoore Redevelopment Agency Tax Allocation for Lemoore
Redevelopment Project Series 2011 (A-/NR) |
|
| | 215,000 | | | 6.625 | | | 08/01/24 | | | | 215,636 | |
| | |
| Municipal Bonds – (continued) | |
| California – (continued) | |
| Los Angeles County GO Bonds for Westside Union School
District Election Series 2008 B (AA-/Aa3)(b) |
|
| 49,925,000 | | | 0.000 | | | 08/01/50 | | | | 13,591,083 | |
| Los Angeles Department of Airports RB Subordinate
Series 2016 B (AMT) (AA-/A1) |
|
| | 2,500,000 | | | 5.000 | | | 05/15/46 | | | | 2,832,450 | |
| Lynwood Redevelopment Agency Tax Allocation for Housing
Projects Series 2011 A (A-/NR) |
|
| | 1,625,000 | | | 6.750 | | | 09/01/26 | | | | 1,935,570 | |
| | 1,500,000 | | | 7.000 | | | 09/01/31 | | | | 1,797,675 | |
| | 875,000 | | | 7.250 | | | 09/01/38 | | | | 1,054,296 | |
| Merced-Union High School District Election of 2008 GO Bonds
Series 2011 C (NR/Aa3)(b) |
|
| | 3,750,000 | | | 0.000 | | | 08/01/35 | | | | 1,954,050 | |
| | M-S-R Energy Authority Gas RB Series 2009 A (BBB+/NR) | |
| | 8,250,000 | | | 6.500 | | | 11/01/39 | | | | 11,745,443 | |
| | M-S-R Energy Authority Gas RB Series 2009 B (BBB+/NR) | |
| | 2,000,000 | | | 6.500 | | | 11/01/39 | | | | 2,847,380 | |
| | M-S-R Energy Authority Gas RB Series 2009 C (BBB+/NR) | |
| | 10,000,000 | | | 6.125 | | | 11/01/29 | | | | 12,737,600 | |
| | 13,500,000 | | | 6.500 | | | 11/01/39 | | | | 19,219,815 | |
| Mt. Diablo Unified School District GO Bonds Capital
Appreciation for Election of 2010 Series 2010 A (AGM)
(AA/Aa2)(a) |
|
| | 7,000,000 | | | 0.000 | | | 08/01/30 | | | | 6,678,070 | |
| Natomas Unified School District GO Bonds Election of 2014
Series 2013 (BAM) (AA/A1) |
|
| | 14,535,000 | | | 4.000 | | | 08/01/42 | | | | 15,104,627 | |
| New Haven Unified School District GO Refunding Bonds for
Capital Appreciation Series 2009 (ASSURED GTY)
(AA/Aa3)(b) |
|
| | 860,000 | | | 0.000 | | | 08/01/25 | | | | 703,093 | |
| | 1,105,000 | | | 0.000 | | | 08/01/26 | | | | 868,265 | |
| | 5,550,000 | | | 0.000 | | | 08/01/30 | | | | 3,726,214 | |
| | 7,830,000 | | | 0.000 | | | 08/01/32 | | | | 4,728,850 | |
| | 7,000,000 | | | 0.000 | | | 08/01/34 | | | | 3,852,800 | |
| Orange County California Community Facilities District No.
2015-1 Village of Esencia Special Tax Bonds Series 2015 A
(NR/NR) |
|
| | 3,000,000 | | | 5.250 | | | 08/15/45 | | | | 3,327,690 | |
| | Palomar Pomerado Health COPS Series 2009 (NR/WR)(e) | |
| | 16,000,000 | | | 6.750 | | | 11/01/19 | | | | 17,883,520 | |
| | Palomar Pomerado Health COPS Series 2010 (BBB-/Ba1) | |
| | 6,500,000 | | | 6.000 | | | 11/01/41 | | | | 6,999,525 | |
| Palomar Pomerado Health GO Bonds Capital Appreciation for
Election of 2004 Series 2009 A (ASSURED GTY) (AA/A2)(a) |
|
| | 10,750,000 | | | 0.000 | | | 08/01/38 | | | | 12,998,578 | |
| Placer Union High School District GO Bonds for Capital
Appreciation Series 2000 A (NATL-RE) (AA-/Aa2)(b) |
|
| | 1,805,000 | | | 0.000 | | | 08/01/25 | | | | 1,479,107 | |
| Rancho Cordova Community Facilities District No. 2003-1
Special Tax Refunding for Sunridge Anatolia Series 2016
(NR/NR) |
|
| | 500,000 | | | 4.000 | | | 09/01/29 | | | | 527,610 | |
| | 500,000 | | | 4.000 | | | 09/01/30 | | | | 524,850 | |
| | 650,000 | | | 4.000 | | | 09/01/31 | | | | 679,243 | |
| | 900,000 | | | 3.000 | | | 09/01/32 | | | | 839,088 | |
| | 820,000 | | | 3.000 | | | 09/01/33 | | | | 754,211 | |
| | 750,000 | | | 3.000 | | | 09/01/34 | | | | 681,773 | |
| | |
| | |
| 40 | | The accompanying notes are an integral part of these financial statements. |
GOLDMAN SACHS HIGH YIELD MUNICIPAL FUND
| | | | | | | | | | | | |
Principal
Amount | | | Interest
Rate | | Maturity
Date | | | Value | |
| Municipal Bonds – (continued) | |
| California – (continued) | |
| Rialto Unified School District GO Election of 2010 Series 2011 A
(AGM) (AA/A1)(b) |
|
| $ | 6,170,000 | | | 0.000 % | | | 08/01/36 | | | $ | 3,081,545 | |
| River Islands Public Financing Authority Community Facilities
District No. 2003-1 Special Tax Refunding Bonds Series 2015
A-1 (NR/NR) |
|
| | 4,835,000 | | | 5.375 | | | 09/01/31 | | | | 5,226,248 | |
| | 880,000 | | | 5.250 | | | 09/01/34 | | | | 934,358 | |
| | 6,815,000 | | | 5.500 | | | 09/01/45 | | | | 7,268,266 | |
| River Islands Public Financing Authority Special Tax for
Community Facilities District No. 2003-1 Series 2015 B
(NR/NR) |
|
| | 22,500,000 | | | 5.500 | | | 09/01/45 | | | | 24,017,175 | |
| Riverside County Public Financing Authority Tax Allocation RB
Refunding Series 2017 A (BAM) (AA/NR) |
|
| | 4,245,000 | | | 4.000 | | | 10/01/40 | | | | 4,400,919 | |
| Riverside County Redevelopment Agency Tax Allocation for
Capital Appreciation Jurupa Valley Redevelopment Project
Area Series 2011 B (A/NR)(b) |
|
| | 2,220,000 | | | 0.000 | | | 10/01/33 | | | | 1,227,327 | |
| | 2,220,000 | | | 0.000 | | | 10/01/35 | | | | 1,113,796 | |
| | 1,840,000 | | | 0.000 | | | 10/01/37 | | | | 840,070 | |
| | 5,100,000 | | | 0.000 | | | 10/01/38 | | | | 2,215,950 | |
| | 8,425,000 | | | 0.000 | | | 10/01/39 | | | | 3,495,533 | |
| | 13,395,000 | | | 0.000 | | | 10/01/40 | | | | 5,279,773 | |
| | 7,275,000 | | | 0.000 | | | 10/01/41 | | | | 2,740,856 | |
| | 6,360,000 | | | 0.000 | | | 10/01/42 | | | | 2,289,346 | |
| Riverside County Redevelopment Agency Tax Allocation for
Jurupa Valley Redevelopment Project Area Series 2011 B
(A/NR) |
|
| | 1,225,000 | | | 6.500 | | | 10/01/25 | | | | 1,458,460 | |
| | 1,950,000 | | | 6.750 | | | 10/01/30 | | | | 2,335,418 | |
| Riverside County Redevelopment Successor Agency Tax
Allocation Refunding for Mid-County Redevelopment Project
Area Series 2017 C (BAM) (AA/NR) |
|
| | 3,355,000 | | | 4.000 | | | 10/01/40 | | | | 3,504,096 | |
| Riverside County Redevelopment Successor Agency Tax
Allocation Refunding Series 2017 A (BAM) (AA/NR) |
|
| | 8,585,000 | | | 4.000 | | | 10/01/39 | | | | 8,966,517 | |
| Riverside County Transportation Commission Toll Revenue
Senior Lien Bonds Series 2013 A (BBB-/NR) |
|
| | 2,000,000 | | | 5.750 | | | 06/01/48 | | | | 2,229,180 | |
| Roseville California Community Facilities District No. 1 Special
Tax Refunding for Fiddyment Ranch Project Series 2017
(NR/NR) |
|
| | 770,000 | | | 5.000 | | | 09/01/29 | | | | 888,318 | |
| | 1,865,000 | | | 5.000 | | | 09/01/33 | | | | 2,100,848 | |
| Sacramento County Sanitation District Financing Authority RB
Refunding for Sacramento County Regional Series 2007 B
(NATL-RE FGIC) (AA/Aa3)(c) |
|
| | 2,625,000 | | | (3 Mo. LIBOR + 0.53%),
1.412 | | | 12/01/35 | | | | 2,366,228 | |
| Sacramento County Water Financing Authority RB for Water
Agency Zones 40 & 41 2007 Water System Project
Series 2007 B (NATL-RE) (A+/Aa3)(c) |
|
| | 330,000 | | | (3 Mo. LIBOR +
0.55%, 12.00% Cap), 1.432 | | | 06/01/34 | | | | 297,135 | |
| | |
| Municipal Bonds – (continued) | |
| California – (continued) | |
| San Bernardino City Unified School District GO Bonds Capital
Appreciation for Election of 1999 Series 2003 C (NATL-RE)
(A/A2)(b) |
|
| 1,420,000 | | | 0.000 | | | 08/01/25 | | | | 1,167,226 | |
| San Diego Unified School District GO Refunding Bonds
Series 2012 R-1 (AA-/Aa2)(b) |
|
| | 10,000,000 | | | 0.000 | | | 07/01/30 | | | | 6,842,100 | |
| | 3,000,000 | | | 0.000 | | | 07/01/31 | | | | 1,973,610 | |
| San Francisco City & County Redevelopment Financing
Authority Tax Allocation for Mission Bay North
Redevelopment Series 2011 C (A-/NR)(e) |
|
| | 500,000 | | | 6.750 | | | 02/01/21 | | | | 592,410 | |
| San Francisco City & County Redevelopment Financing
Authority Tax Allocation for Mission Bay South
Redevelopment Series 2009 D (BBB+/NR)(e) |
|
| | 750,000 | | | 6.250 | | | 08/01/19 | | | | 821,992 | |
| | 555,000 | | | 6.375 | | | 08/01/19 | | | | 609,529 | |
| | 305,000 | | | 6.500 | | | 08/01/19 | | | | 335,656 | |
| | 1,000,000 | | | 6.625 | | | 08/01/19 | | | | 1,102,760 | |
| San Francisco City & County Redevelopment Financing
Authority Tax Allocation for Mission Bay South
Redevelopment Series 2011 D (BBB+/NR)(e) |
|
| | 435,000 | | | 6.625 | | | 02/01/21 | | | | 513,626 | |
| | 2,500,000 | | | 7.000 | | | 02/01/21 | | | | 2,982,425 | |
| San Joaquin Hills Transportation Corridor Agency RB Refunding
for Toll Road Senior Lien Series 2014 A (BBB/NR) |
|
| | 3,000,000 | | | 5.000 | | | 01/15/29 | | | | 3,455,490 | |
| San Juan Unified School District GO Bonds for Capital
Appreciation Series 2000 (NATL-RE) (A+/Aa2)(b) |
|
| | 1,580,000 | | | 0.000 | | | 08/01/24 | | | | 1,363,508 | |
| | 1,595,000 | | | 0.000 | | | 08/01/25 | | | | 1,326,370 | |
| San Mateo Special Tax Bonds for Community Facilities District
No. 2008-1 Bay Meadows Series 2013 (NR/NR) |
|
| | 2,000,000 | | | 5.000 | | | 09/01/42 | | | | 2,146,360 | |
| San Mateo Special Tax Bonds for Community Facilities District
No. 2008-1 Bay Meadows Series 2014 (NR/NR) |
|
| | 2,000,000 | | | 5.500 | | | 09/01/44 | | | | 2,180,880 | |
| Santa Monica Redevelopment Agency Tax Allocation for
Earthquake Recovery Redevelopment Project Series 2011
(AA/NR) |
|
| | 2,000,000 | | | 5.000 | | | 07/01/32 | | | | 2,246,140 | |
| | 2,000,000 | | | 5.000 | | | 07/01/42 | | | | 2,229,920 | |
| Santee Community Development Commission Tax Allocation for
Santee Community Redevelopment Project Series 2011 A
(A/NR)(e) |
|
| | 3,000,000 | | | 7.000 | | | 02/01/21 | | | | 3,573,480 | |
| Stockton Public Financing Authority Water RB for Delta Water
Supply Project Series 2010 A (A/A3) |
|
| | 2,000,000 | | | 6.250 | | | 10/01/40 | | | | 2,443,760 | |
| Tejon Ranch Public Facilities Financing Authority Special Tax
for Community Facilities District No. 2008-1 Industrial
Complex Public Improvements Series 2012 B (NR/NR) |
|
| | 4,000,000 | | | 5.250 | | | 09/01/42 | | | | 4,217,080 | |
| Temecula Redevelopment Agency Tax Allocation for Housing
Redevelopment Project No. 1 Series 2011 A (BBB+/NR) |
|
| | 1,000,000 | | | 6.750 | | | 08/01/31 | | | | 1,196,210 | |
| | 2,100,000 | | | 7.000 | | | 08/01/39 | | | | 2,490,558 | |
| | |
| | |
| The accompanying notes are an integral part of these financial statements. | | 41 |
GOLDMAN SACHS HIGH YIELD MUNICIPAL FUND
Schedule of Investments (continued)
September 30, 2017 (Unaudited)
| | | | | | | | | | | | |
Principal
Amount | | | Interest
Rate | | Maturity
Date | | | Value | |
| Municipal Bonds – (continued) | |
| California – (continued) | |
| Tobacco Securitization Authority Southern California Tobacco
Settlement RB Senior Asset-Backed Bonds for San Diego
County Tobacco Asset Securitization Corp. Series 2006 A-1
(BB+/B2) |
|
| $ | 2,235,000 | | | 5.000 % | | | 06/01/37 | | | $ | 2,241,079 | |
| Tustin California Community Facilities District No. 2014-1 Tustin
Legacy/Standard Pacific Special Tax Bonds Series 2015 A
(NR/NR) |
|
| | 750,000 | | | 5.000 | | | 09/01/40 | | | | 832,605 | |
| | 1,000,000 | | | 5.000 | | | 09/01/45 | | | | 1,102,120 | |
| Union City Community Redevelopment Agency Tax Allocation
for Community Redevelopment Project Sub Lien Series 2011
(A+/NR)(e) |
|
| | 1,500,000 | | | 6.875 | | | 12/01/21 | | | | 1,841,730 | |
| University of California Regents Medical Center Pooled RB
Refunding Series 2007 C-2 (NATL-RE) (AA-/Aa3)(c) |
|
| | 12,000,000 | | | (3 Mo. LIBOR +
0.74%, 12.00% Cap), 1.621 | | | 05/15/43 | | | | 10,182,120 | |
| West Hollywood Community Development Commission Tax
Allocation for East Side Redevelopment Project Series 2011 A
(A-/NR) |
|
| | 1,000,000 | | | 7.250 | | | 09/01/31 | | | | 1,207,440 | |
| | 5,000,000 | | | 7.500 | | | 09/01/42 | | | | 6,025,300 | |
| William S. Hart Union High School District GO Bonds Capital
Appreciation 2008 Election Series B (AGM) (AA/Aa2)(b) |
|
| | 8,360,000 | | | 0.000 | | | 08/01/34 | | | | 4,685,864 | |
| Yosemite Community College District GO Bonds Election of
2004 Series 2010 D (AA-/Aa2)(a) |
|
| | 19,135,000 | | | 0.000 | | | 08/01/42 | | | | 13,596,948 | |
| | | | | | | | | | | | |
| | | | | | | | | | | 796,150,961 | |
| | |
| Colorado – 4.2% | |
| Belleview Station Metropolitan District No. 2 GO Refunding &
Improvement Bonds Series 2017 (NR/NR) |
|
| | 2,375,000 | | | 5.125 | | | 12/01/46 | | | | 2,429,815 | |
| Canyons Metropolitan District No. 5 GO Refunding &
Improvement Bonds Senior Series 2017 A (NR/NR) |
|
| | 1,750,000 | | | 6.000 | | | 12/01/37 | | | | 1,774,605 | |
| | 4,000,000 | | | 6.125 | | | 12/01/47 | | | | 4,057,240 | |
| Canyons Metropolitan District No. 5 GO Refunding &
Improvement Bonds Series 2017 A (NR/NR) |
|
| | 2,000,000 | | | 6.125 | | | 12/01/47 | | | | 2,005,520 | |
| Centerra Metropolitan District No. 1 Special RB Refunding &
Improvement Bonds Series 2017 (NR/NR) |
|
| | 6,500,000 | | | 5.000 | | | 12/01/47 | | | | 6,688,240 | |
| Clear Creek Station Metropolitan District No. 2 GO Bonds
Subordinate Series 2017 B (NR/NR) |
|
| | 500,000 | | | 7.375 | | | 12/15/47 | | | | 505,075 | |
| Clear Creek Station Metropolitan District No. 2 GO Refunding &
Improvement Bonds Series 2017 A (NR/NR) |
|
| | 790,000 | | | 4.375 | | | 12/01/32 | | | | 799,433 | |
| | 1,000,000 | | | 5.000 | | | 12/01/47 | | | | 1,018,710 | |
| Colorado Crossing Metropolitan District No. 2 Limited Property
Tax Supported RB Series 2017 (NR/NR) |
|
| | 7,390,000 | | | 7.500 | | | 12/01/47 | | | | 7,402,711 | |
| | |
| Municipal Bonds – (continued) | |
| Colorado – (continued) | |
| Colorado Health Facilities Authority RB for Covenant Retirement
Communities, Inc. Series 2012 A (BBB+/NR) |
|
| 3,500,000 | | | 4.500 | | | 12/01/33 | | | | 3,540,775 | |
| | 3,500,000 | | | 5.000 | | | 12/01/33 | | | | 3,752,595 | |
| Colorado Health Facilities Authority RB for Covenant Retirement
Communities, Inc. Series 2013 A (BBB+/NR) |
|
| | 3,000,000 | | | 5.750 | | | 12/01/36 | | | | 3,428,160 | |
| Colorado Health Facilities Authority RB for The Evangelical
Lutheran Good Samaritan Society Project Series 2013
(BBB/Baa2) |
|
| | 3,000,000 | | | 5.625 | | | 06/01/43 | | | | 3,387,090 | |
| Colorado Health Facilities Authority RB Refunding for
Evangelical Lutheran Good Samaritan Society Project
Series 2017 (BBB/NR) |
|
| | 4,410,000 | | | 5.000 | | | 06/01/47 | | | | 4,853,117 | |
| Colorado High Performance Transportation Enterprise C-470
Express Lanes RB Series 2017 (BBB/NR) |
|
| | 965,000 | | | 5.000 | | | 12/31/47 | | | | 1,067,927 | |
| | 965,000 | | | 5.000 | | | 12/31/51 | | | | 1,060,110 | |
| | 1,925,000 | | | 5.000 | | | 12/31/56 | | | | 2,110,840 | |
| Colorado Regional Transportation District Tax-Exempt Private
Activity RB for Denver Transit Partners Eagle P3 Project
Series 2010 (BBB+/Baa3) |
|
| | 12,860,000 | | | 6.000 | | | 01/15/41 | | | | 14,142,528 | |
| Copperleaf Metropolitan District No. 2 Limited Tax Convertible
to Unlimited Tax GO Refunding (NR/NR) |
|
| | 500,000 | | | 5.250 | | | 12/01/30 | | | | 529,590 | |
| | 2,000,000 | | | 5.750 | | | 12/01/45 | | | | 2,114,360 | |
| Cornerstar Metropolitan District GO Refunding Bonds Series
2017 A (NR/NR) |
|
| | 1,000,000 | | | 5.125 | | | 12/01/37 | | | | 1,042,230 | |
| | 2,100,000 | | | 5.250 | | | 12/01/47 | | | | 2,184,630 | |
| Cross Creek Metropolitan District No. 2 GO Refunding Bonds
Limited Tax Series 2006 (NR/NR)(h) |
|
| | 4,500,000 | | | 5.000 | | | 12/01/37 | | | | 4,493,115 | |
| Denver Colorado City & County Special Facilities Airport RB
Refunding for United Air Lines, Inc. Project Series 2007 A
(AMT) (BB-/Ba3) |
|
| | 925,000 | | | 5.250 | | | 10/01/32 | | | | 927,655 | |
| | 7,000,000 | | | 5.750 | | | 10/01/32 | | | | 7,014,280 | |
| Denver Colorado City & County Special Facilities Airport RB
Refunding for United Air Lines, Inc. Project Series 2017
(AMT) (BB-/NR) |
|
| | 5,750,000 | | | 5.000 | | | 10/01/32 | | | | 6,258,127 | |
| Denver Colorado Health and Hospital Authority Healthcare RB
Refunding Series 2017 A (BBB/NR)(f) |
|
| | 2,655,000 | | | 5.000 | | | 12/01/26 | | | | 3,070,561 | |
| | 5,285,000 | | | 5.000 | | | 12/01/27 | | | | 6,129,331 | |
| | 5,555,000 | | | 5.000 | | | 12/01/28 | | | | 6,374,751 | |
| | 7,200,000 | | | 5.000 | | | 12/01/34 | | | | 7,935,048 | |
| | 4,800,000 | | | 4.000 | | | 12/01/35 | | | | 4,702,560 | |
| | 4,800,000 | | | 4.000 | | | 12/01/36 | | | | 4,655,808 | |
| Denver Colorado Health and Hospital Authority Healthcare RB
Series 2007 B (BBB/NR)(c) |
|
| | 16,520,000 | | | (3 Mo. LIBOR +
1.10%, 15.00% Cap), 1.982 | | | 12/01/33 | | | | 14,704,287 | |
| | |
| | |
| 42 | | The accompanying notes are an integral part of these financial statements. |
GOLDMAN SACHS HIGH YIELD MUNICIPAL FUND
| | | | | | | | | | | | |
Principal
Amount | | | Interest
Rate | | Maturity
Date | | | Value | |
| Municipal Bonds – (continued) | |
| Colorado – (continued) | |
| Denver Connection West Metropolitan District GO Bonds
Series 2017 A (NR/NR) |
|
| $ | 2,470,000 | | | 5.375 % | | | 08/01/47 | | | $ | 2,483,585 | |
| Denver Connection West Metropolitan District GO Bonds
Subordinate Series 2017 B (NR/NR) |
|
| | 1,269,000 | | | 8.000 | | | 08/01/47 | | | | 1,270,599 | |
| Dominion Water & Sanitation District Tap Fee RB Series 2016
(NR/NR) |
|
| | 8,000,000 | | | 5.750 | | | 12/01/36 | | | | 8,383,280 | |
| | 10,345,000 | | | 6.000 | | | 12/01/46 | | | | 10,808,870 | |
| E-470 Public Highway Authority RB Refunding Capital
Appreciation Series 2006 B (NATL-RE) (A/A3)(b) |
|
| | 3,000,000 | | | 0.000 | | | 09/01/39 | | | | 1,110,600 | |
| E-470 Public Highway Authority RB Series 2004 A (NATL-RE)
(A/A3)(b) |
|
| | 15,000,000 | | | 0.000 | | | 09/01/28 | | | | 10,665,600 | |
| | 4,100,000 | | | 0.000 | | | 09/01/34 | | | | 2,227,653 | |
| E-470 Public Highway Authority RB Series 2004 B (NATL-RE)
(A/A3)(b) |
|
| | 1,715,000 | | | 0.000 | | | 09/01/28 | | | | 1,032,601 | |
| | E-470 Public Highway Authority RB Series 2010 A (A-/A3)(b) | |
| | 20,000,000 | | | 0.000 | | | 09/01/40 | | | | 7,751,800 | |
| High Plains Metropolitan District GO Refunding Bonds
Series 2017 (NATL-RE) (A/Baa2) |
|
| | 475,000 | | | 5.000 | | | 12/01/35 | | | | 547,756 | |
| | 2,400,000 | | | 4.000 | | | 12/01/47 | | | | 2,470,680 | |
| Leyden Rock Metropolitan District No. 10 Limited Tax GO
Refunding & Improvement Bonds Series 2016 A (NR/NR) |
|
| | 1,250,000 | | | 5.000 | | | 12/01/45 | | | | 1,270,962 | |
| North Range Metropolitan District No. 2 GO Refunding Bonds
Series 2017 A (NR/NR) |
|
| | 3,270,000 | | | 5.625 | | | 12/01/37 | | | | 3,307,017 | |
| | 5,380,000 | | | 5.750 | | | 12/01/47 | | | | 5,442,354 | |
| Palisade Metropolitan District No. 2 GO Refunding Limited Tax
Bonds Series 2016 (NR/NR) |
|
| | 2,135,000 | | | 4.375 | | | 12/01/31 | | | | 2,102,761 | |
| | 1,825,000 | | | 5.000 | | | 12/01/46 | | | | 1,847,886 | |
| Park Meadows Business Improvement District RB Series 2007
(NR/NR) |
|
| | 475,000 | | | 5.300 | | | 12/01/27 | | | | 476,553 | |
| | 720,000 | | | 5.350 | | | 12/01/31 | | | | 722,405 | |
| Plaza Metropolitan District No. 1 RB Refunding Series 2013
(NR/NR)(f) |
|
| | 1,000,000 | | | 5.000 | | | 12/01/40 | | | | 1,039,070 | |
| Public Authority for Colorado Energy RB for Natural Gas
Purchase Series 2008 (BBB+/Baa1) |
|
| | 4,000,000 | | | 6.500 | | | 11/15/38 | | | | 5,645,800 | |
| Sierra Ridge Metropolitan District No. 2 Douglas County GO
Bonds Series 2016 A (NR/NR) |
|
| | 750,000 | | | 4.500 | | | 12/01/31 | | | | 743,760 | |
| | 1,500,000 | | | 5.500 | | | 12/01/46 | | | | 1,543,665 | |
| Southglenn Metropolitan District Special RB Refunding
Series 2016 (NR/NR) |
|
| | 1,535,000 | | | 5.000 | | | 12/01/30 | | | | 1,596,692 | |
| | 810,000 | | | 5.000 | | | 12/01/36 | | | | 824,580 | |
| | 2,100,000 | | | 5.000 | | | 12/01/46 | | | | 2,121,252 | |
| | |
| Municipal Bonds – (continued) | |
| Colorado – (continued) | |
| Sterling Hills West Metropolitan District GO Refunding Bonds
Series 2017 (NR/Baa2) |
|
| 650,000 | | | 5.000 | | | 12/01/39 | | | | 717,515 | |
| Vista Ridge Metropolitan District GO Refunding Bonds Limited
Tax Subseries 2006 B (NR/NR)(a)(e) |
|
| | 1,725,000 | | | 0.000 | | | 12/01/21 | | | | 2,286,625 | |
| Windshire Park Metropolitan District No. 2 GO Refunding &
Improvement Bonds Senior Series 2017 A (NR/NR) |
|
| | 1,500,000 | | | 6.500 | | | 12/01/47 | | | | 1,640,520 | |
| | | | | | | | | | | | |
| | | | | | | | | | | 218,243,265 | |
| | |
| Connecticut – 0.4% | |
| Mohegan Tribal Finance Authority Tribal RB Economic
Development Bonds Series 2015 (B-/NR)(f) |
|
| | 20,265,000 | | | 7.000 | | | 02/01/45 | | | | 21,477,860 | |
| | Town of Hamden Refunding GO Series 2013 (AGM) (AA/A2) | |
| | 500,000 | | | 5.000 | | | 08/15/23 | | | | 579,930 | |
| | | | | | | | | | | | |
| | | | | | | | | | | 22,057,790 | |
| | |
| Delaware – 0.2% | |
| Bridgeville Delaware Special Obligation Special Tax for Heritage
Shores Special Development District Series 2005 A (NR/NR) |
|
| | 5,345,000 | | | 5.450 | | | 07/01/35 | | | | 5,344,733 | |
| Delaware Economic Development Authority Gas Facilities RB
Refunding for Delmarva Power & Light Co. Project
Series 2010 (BBB+/Baa1) |
|
| | 3,000,000 | | | 5.400 | | | 02/01/31 | | | | 3,249,660 | |
| Delaware Economic Development Authority RB for Indian River
Power LLC Project Series 2010 (NR/Baa3) |
|
| | 2,050,000 | | | 5.375 | | | 10/01/45 | | | | 2,136,448 | |
| | | | | | | | | | | | |
| | | | | | | | | | | 10,730,841 | |
| | |
| District of Columbia – 1.6% | |
| District of Columbia GO Refunding Bonds Series 2017 A
(AA/Aa1) |
|
| | 5,485,000 | | | 4.000 | | | 06/01/37 | | | | 5,870,541 | |
| Metropolitan Washington DC Airports Authority Dulles Toll
Road RB Second Senior Lien Capital Appreciation for Dulles
Metrorail and Capital Improvement Project Series 2009 C
(ASSURED GTY) (AA/A3) |
|
| | 25,000,000 | | | 6.500 | | | 10/01/41 | | | | 32,057,750 | |
| Metropolitan Washington DC Airports Authority Dulles Toll
Road RB Second Senior Lien Capital Appreciation for Dulles
Metrorail and Capital Improvement Project Series 2010 B
(BBB+/Baa1)(a) |
|
| | 37,100,000 | | | 0.000 | | | 10/01/44 | | | | 44,271,059 | |
| | | | | | | | | | | | |
| | | | | | | | | | | 82,199,350 | |
| | |
| Florida – 11.3% | |
| Amelia National Community Development District Special
Assessment for Capital Improvement Series 2004 A (NR/NR) |
|
| | 3,680,000 | | | 6.300 | | | 05/01/35 | | | | 3,682,723 | |
| Anthem Park Community Development District Special
Assessment RB Refunding Senior Series 2016 A-1 (BBB-/NR) |
|
| | 1,725,000 | | | 3.500 | | | 05/01/31 | | | | 1,710,234 | |
| | 2,170,000 | | | 3.750 | | | 05/01/36 | | | | 2,104,857 | |
| | |
| | |
| The accompanying notes are an integral part of these financial statements. | | 43 |
GOLDMAN SACHS HIGH YIELD MUNICIPAL FUND
Schedule of Investments (continued)
September 30, 2017 (Unaudited)
| | | | | | | | | | | | |
Principal
Amount | | | Interest
Rate | | Maturity
Date | | | Value | |
| Municipal Bonds – (continued) | |
| Florida – (continued) | |
| Arborwood Community Development District RB Capital
Improvement for Master Infrastructure Projects Series 2005
A-2 (NR/NR) |
|
| $ | 13,840,000 | | | 5.350 % | | | 05/01/36 | | | $ | 13,865,742 | |
| Arborwood Community Development District Special
Assessment Capital Improvement for Centex Homes Project
Series 2006 A-2 (NR/NR) |
|
| | 195,000 | | | 5.250 | | | 05/01/36 | | | | 195,388 | |
| Arborwood Community Development District Special
Assessment Capital Improvement for Centex Homes Project
Series 2006 A-3 (NR/NR) |
|
| | 2,695,000 | | | 5.500 | | | 05/01/36 | | | | 2,701,684 | |
| Arborwood Community Development District Special
Assessment Capital Improvement Refunding Series 2014 B
(NR/NR) |
|
| | 8,840,000 | | | 6.900 | | | 05/01/25 | | | | 10,164,674 | |
| Arborwood Community Development District Special
Assessment Capital Improvement Refunding Series 2014 B A-1
(NR/NR) |
|
| | 3,965,000 | | | 6.900 | | | 05/01/36 | | | | 4,491,790 | |
| Arborwood Community Development District Special
Assessment Capital Improvement Refunding Series 2014 B A-2
(NR/NR) |
|
| | 1,015,000 | | | 6.900 | | | 05/01/36 | | | | 1,136,394 | |
| Avalon Groves Community Development District Special
Assessment for Assessment Area One Project Series 2017
(NR/NR) |
|
| | 750,000 | | | 5.750 | | | 05/01/48 | | | | 764,137 | |
| Avalon Groves Community Development District Special
Assessment for Assessment Area Two Project Series 2017 A-1
(NR/NR) |
|
| | 1,850,000 | | | 6.000 | | | 05/01/48 | | | | 1,858,417 | |
| Avalon Groves Community Development District Special
Assessment for Assessment Area Two Project Series 2017 A-2
(NR/NR) |
|
| | 1,700,000 | | | 6.000 | | | 05/01/29 | | | | 1,702,720 | |
| Avelar Creek Community Development District Special
Assessment Refunding Series 2016 (BBB+/NR) |
|
| | 1,070,000 | | | 3.625 | | | 05/01/31 | | | | 1,090,159 | |
| Babcock Ranch Community Independent Special District Special
Assessment RB Series 2015 (NR/NR) |
|
| | 2,380,000 | | | 5.250 | | | 11/01/46 | | | | 2,412,725 | |
| Bannon Lakes Community Development District Special
Assessment RB Series 2016 (NR/NR) |
|
| | 375,000 | | | 4.500 | | | 11/01/25 | | | | 383,902 | |
| | 1,000,000 | | | 5.000 | | | 11/01/36 | | | | 1,028,610 | |
| | 1,850,000 | | | 5.000 | | | 11/01/48 | | | | 1,860,878 | |
| Bartram Park Community Development District Special
Assessment RB Refunding for City of Jacksonville Florida
Senior Lien Series 2015 A-1 (BBB+/NR) |
|
| | 1,970,000 | | | 4.250 | | | 05/01/29 | | | | 2,094,090 | |
| Bartram Park Community Development District Special
Assessment RB Refunding for City of Jacksonville Subordinate
Lien Series 2015 A-2 (NR/NR) |
|
| | 1,000,000 | | | 5.000 | | | 05/01/35 | | | | 1,032,420 | |
| | |
| Municipal Bonds – (continued) | |
| Florida – (continued) | |
| Bay Laurel Center Community Development District Special
Assessment RB Refunding Series 2016 Candler (BBB+/NR) |
|
| 985,000 | | | 3.750 | | | 05/01/31 | | | | 1,015,407 | |
| | 1,140,000 | | | 4.000 | | | 05/01/37 | | | | 1,136,911 | |
| Baywinds Community Development District Senior Special
Assessment Refunding Bonds Series 2017 A-1 (BBB-/NR) |
|
| | 1,610,000 | | | 4.250 | | | 05/01/31 | | | | 1,680,824 | |
| | 2,810,000 | | | 4.250 | | | 05/01/37 | | | | 2,899,245 | |
| Bellagio Community Development District Special Assessment
Bonds Series 2013 (BBB-/NR) |
|
| | 760,000 | | | 6.000 | | | 11/01/27 | | | | 853,366 | |
| | 490,000 | | | 3.750 | | | 11/01/31 | | | | 496,394 | |
| | 3,000,000 | | | 6.500 | | | 11/01/43 | | | | 3,617,910 | |
| | 1,500,000 | | | 4.125 | | | 11/01/46 | | | | 1,518,675 | |
| Belmont Community Development District Capital Improvement
Phase 1 Project Series 2013 A (NR/NR) |
|
| | 775,000 | | | 6.125 | | | 11/01/33 | | | | 892,707 | |
| | 1,000,000 | | | 6.500 | | | 11/01/43 | | | | 1,152,310 | |
| Bexley Community Development District Special Assessment
Bonds Series 2016 (NR/NR) |
|
| | 390,000 | | | 3.500 | | | 05/01/21 | | | | 390,515 | |
| | 500,000 | | | 4.100 | | | 05/01/26 | | | | 500,705 | |
| | 1,755,000 | | | 4.700 | | | 05/01/36 | | | | 1,731,413 | |
| | 3,200,000 | | | 4.875 | | | 05/01/47 | | | | 3,187,456 | |
| Brevard County Health Facilities Authority RB for Health First,
Inc. Project Series 2009 (A/A2)(e) |
|
| | 4,750,000 | | | 7.000 | | | 04/01/19 | | | | 5,166,480 | |
| Bridgewater Community Development District Special
Assessment Refunding Bonds for Assessment Area Two
Series 2015 (NR/NR) |
|
| | 7,830,000 | | | 5.750 | | | 05/01/35 | | | | 8,468,067 | |
| Centre Lake Community Development District Special
Assessment Series 2016 (NR/NR) |
|
| | 375,000 | | | 4.125 | | | 12/15/27 | | | | 372,667 | |
| | 500,000 | | | 4.500 | | | 12/15/32 | | | | 492,395 | |
| | 975,000 | | | 4.700 | | | 12/15/37 | | | | 967,395 | |
| Century Parc Community Development District Special
Assessment Refunding Series 2012 (A-/NR) |
|
| | 200,000 | | | 3.500 | | | 11/01/20 | | | | 209,520 | |
| | 210,000 | | | 3.750 | | | 11/01/21 | | | | 223,047 | |
| | 215,000 | | | 3.875 | | | 11/01/22 | | | | 227,900 | |
| | 25,000 | | | 4.000 | | | 11/01/23 | | | | 26,625 | |
| | 1,705,000 | | | 4.500 | | | 11/01/31 | | | | 1,817,257 | |
| Charlotte County Industrial Development Authority Utility
System RB for Town & Country Utilities Project Series 2015
(AMT) (NR/NR)(f) |
|
| | 500,000 | | | 5.500 | | | 10/01/36 | | | | 490,760 | |
| City of Cape Coral Water & Sewer RB Refunding Series 2015
(A/A1) |
|
| | 1,750,000 | | | 4.000 | | | 10/01/34 | | | | 1,834,210 | |
| CityPlace Community Development District Special Assessment
RB Refunding Series 2012 (A/NR) |
|
| | 2,250,000 | | | 5.000 | | | 05/01/26 | | | | 2,543,445 | |
| | |
| | |
| 44 | | The accompanying notes are an integral part of these financial statements. |
GOLDMAN SACHS HIGH YIELD MUNICIPAL FUND
| | | | | | | | | | | | |
Principal
Amount | | | Interest
Rate | | Maturity
Date | | | Value | |
| Municipal Bonds – (continued) | |
| Florida – (continued) | |
| Concord Station Community Development District Capital
Improvement RB Refunding Senior Lien Series 2016 A-1
(BBB-/NR) |
|
| $ | 2,995,000 | | | 3.500 % | | | 05/01/32 | | | $ | 2,961,186 | |
| | 1,500,000 | | | 3.625 | | | 05/01/35 | | | | 1,457,145 | |
| | 1,750,000 | | | 3.750 | | | 05/01/46 | | | | 1,658,703 | |
| Concord Station Community Development District Capital
Improvement RB Refunding Subordinate Lien Series 2016 A-2
(NR/NR) |
|
| | 635,000 | | | 4.125 | | | 05/01/26 | | | | 609,447 | |
| | 945,000 | | | 4.625 | | | 05/01/35 | | | | 920,005 | |
| | 300,000 | | | 4.750 | | | 05/01/46 | | | | 290,418 | |
| Concorde Estates Community Development District Special
Assessment for Capital Improvement Series 2004 A (NR/NR)(i) |
|
| | 3,305,000 | | | 5.850 | | | 05/01/35 | | | | 33 | |
| Concorde Estates Community Development District Special
Assessment for Capital Improvement Series 2004 B (NR/NR)(i) |
|
| | 3,980,000 | | | 5.000 | | | 05/01/11 | | | | 40 | |
| Concorde Estates Community Development District Special
Assessment for Capital Improvement Series 2011 A-1 (NR/NR) |
|
| | 3,565,000 | | | 5.850 | | | 05/01/35 | | | | 3,566,212 | |
| Concorde Estates Community Development District Special
Assessment for Capital Improvement Series 2011 A-2 (NR/NR) |
|
| | 2,290,000 | | | 5.850 | | | 05/01/35 | | | | 2,054,634 | |
| Concorde Estates Community Development District Special
Assessment for Capital Improvement Series 2011 B (NR/NR)(b) |
|
| | 5,670,000 | | | 0.000 | | | 11/01/17 | | | | 5,669,490 | |
| Coronado Community Development District Special Assessment
Refunding & Improvement Bonds Series 2017 (BBB/NR) |
|
| | 782,000 | | | 4.000 | | | 05/01/31 | | | | 803,794 | |
| | 1,407,000 | | | 4.250 | | | 05/01/38 | | | | 1,447,888 | |
| Country Walk Community Development District Special
Assessment RB Refunding Senior Lien Series 2015 A-1
(A-/NR) |
|
| | 960,000 | | | 3.750 | | | 05/01/29 | | | | 972,144 | |
| Durbin Crossing Community Development District Special
Assessment Refunding Senior Series 2017 A-1 (AGM)
(AA/NR) |
|
| | 3,110,000 | | | 3.750 | | | 05/01/34 | | | | 3,206,006 | |
| | 4,300,000 | | | 4.000 | | | 05/01/37 | | | | 4,484,255 | |
| Escambia County Health Facilities Authority Health Care
Facilities RB for Baptist Hospital, Inc. Project Series 2010 A
(A-/A3) |
|
| | 27,000,000 | | | 6.000 | | | 08/15/36 | | | | 29,715,660 | |
| Estancia at Wiregrass Community Development District Capital
Improvement RB Series 2013 (NR/NR) |
|
| | 1,185,000 | | | 6.375 | | | 11/01/26 | | | | 1,338,161 | |
| | 3,245,000 | | | 7.000 | | | 11/01/45 | | | | 3,929,598 | |
| Estancia at Wiregrass Community Development District Capital
Improvements RB Series 2015 (NR/NR) |
|
| | 1,000,000 | | | 5.250 | | | 11/01/35 | | | | 1,011,790 | |
| | 1,500,000 | | | 5.375 | | | 11/01/46 | | | | 1,499,385 | |
| Fishhawk Community Development District II Special
Assessment RB Refunding Series 2013 A (A-/NR) |
|
| | 1,480,000 | | | 4.375 | | | 05/01/34 | | | | 1,521,618 | |
| | |
| Municipal Bonds – (continued) | |
| Florida – (continued) | |
| Florida Development Finance Corp. Solid Waste Disposal RB for
Waste Pro USA, Inc. Project Series 2017 (NR/NR)(f)(g)(h) |
|
| 1,850,000 | | | 5.000 | | | 08/01/22 | | | | 1,894,455 | |
| Florida Higher Educational Facilities Financing Authority RB
Refunding for Nova Southeastern University Project
Series 2012 A (A-/NR) |
|
| | 600,000 | | | 5.000 | | | 04/01/32 | | | | 667,170 | |
| | 5,820,000 | | | 5.250 | | | 04/01/42 | | | | 6,517,411 | |
| Fontainbleau Lakes Community Development District Special
Assessment RB Refunding Series 2016 (BBB+/NR) |
|
| | 700,000 | | | 4.000 | | | 05/01/31 | | | | 719,537 | |
| | 1,000,000 | | | 4.125 | | | 05/01/38 | | | | 1,010,280 | |
| Greater Orlando Aviation Authority Airport Facilities RB
Refunding for Jetblue Airways Corp. Project Series 2013
(AMT) (NR/NR) |
|
| | 3,165,000 | | | 5.000 | | | 11/15/26 | | | | 3,347,969 | |
| | 5,000,000 | | | 5.000 | | | 11/15/36 | | | | 5,182,850 | |
| Hacienda Lakes Community Development District Special
Assessment Refunding Series 2016 (NR/NR) |
|
| | 1,525,000 | | | 4.500 | | | 05/01/36 | | | | 1,491,130 | |
| | 2,305,000 | | | 4.625 | | | 05/01/46 | | | | 2,239,054 | |
| Hawks Point Community Development District Special
Assessment Refunding Senior Series 2017 A-1 (BBB+/NR)(f) |
|
| | 1,725,000 | | | 4.000 | | | 05/01/31 | | | | 1,802,711 | |
| | 1,335,000 | | | 4.250 | | | 05/01/35 | | | | 1,389,508 | |
| | 1,810,000 | | | 4.250 | | | 05/01/39 | | | | 1,871,776 | |
| | Heights Community Development District (NR/NR) | |
| | 3,200,000 | | | 5.000 | | | 01/01/50 | | | | 3,230,432 | |
| Heights Community Development District Special Assessment
RB Series 2017 (NR/NR) |
|
| | 1,850,000 | | | 5.000 | | | 01/01/38 | | | | 1,913,547 | |
| Heritage Harbour North Community Development District
Special Assessment Series 2014 (NR/NR) |
|
| | 1,000,000 | | | 5.000 | | | 05/01/34 | | | | 1,080,920 | |
| | 2,170,000 | | | 5.125 | | | 05/01/45 | | | | 2,395,354 | |
| Heritage Harbour South Community Development District RB
Refunding for Senior Lien Capital Improvement
Series 2013 A-1 (A/NR) |
|
| | 500,000 | | | 5.050 | | | 05/01/31 | | | | 545,830 | |
| | 500,000 | | | 5.150 | | | 05/01/34 | | | | 543,840 | |
| Heritage Isle at Viera Community Development District Special
Assessment Refunding Series 2017 (AGM) (AA/NR) |
|
| | 1,540,000 | | | 3.400 | | | 05/01/37 | | | | 1,482,265 | |
| Heritage Lake Park Community Development District Special
Assessment Series 2005 (NR/NR) |
|
| | 2,125,000 | | | 5.700 | | | 05/01/36 | | | | 2,142,531 | |
| Heritage Landing Community Development District Special
Assessment Refunding Bonds Series 2015 (BBB/NR) |
|
| | 2,205,000 | | | 4.200 | | | 05/01/31 | | | | 2,327,951 | |
| | 2,000,000 | | | 4.350 | | | 05/01/36 | | | | 2,070,460 | |
| Highlands Community Development District Special Assessment
Refunding Series 2016 (BBB-/NR) |
|
| | 1,000,000 | | | 4.250 | | | 05/01/31 | | | | 1,062,620 | |
| | 2,150,000 | | | 4.250 | | | 05/01/36 | | | | 2,222,369 | |
| Islands at Doral III Community Development District Special
Assessment Refunding Series 2013 (A-/NR) |
|
| | 2,500,000 | | | 4.125 | | | 05/01/35 | | | | 2,546,725 | |
| | |
| | |
| The accompanying notes are an integral part of these financial statements. | | 45 |
GOLDMAN SACHS HIGH YIELD MUNICIPAL FUND
Schedule of Investments (continued)
September 30, 2017 (Unaudited)
| | | | | | | | | | | | |
Principal
Amount | | | Interest
Rate | | Maturity
Date | | | Value | |
| Municipal Bonds – (continued) | |
| Florida – (continued) | |
| Isles Bartram Park Community Development District Special
Assessment Bonds Series 2017 (NR/NR) |
|
| $ | 275,000 | | | 4.000 % | | | 11/01/27 | | | $ | 275,179 | |
| | 500,000 | | | 4.625 | | | 11/01/37 | | | | 500,180 | |
| | 1,000,000 | | | 5.000 | | | 11/01/47 | | | | 1,024,630 | |
| Lakewood Ranch Stewardship District Special Assessment for
Lake Club Project Series 2005 (NR/NR) |
|
| | 285,000 | | | 7.210 | | | 11/01/20 | | | | 286,379 | |
| Lakewood Ranch Stewardship District Special Assessment for
Lake Club Project Series 2006 B (NR/NR) |
|
| | 650,000 | | | 6.770 | | | 11/01/20 | | | | 652,925 | |
| Lakewood Ranch Stewardship District Special Assessment RB for
Country Club East Project Series 2013 A (NR/NR) |
|
| | 2,270,000 | | | 6.700 | | | 05/01/33 | | | | 2,502,085 | |
| | 4,830,000 | | | 7.000 | | | 05/01/43 | | | | 5,389,555 | |
| Lakewood Ranch Stewardship District Special Assessment RB for
Country Club East Project Series 2014 (NR/NR) |
|
| | 6,340,000 | | | 5.600 | | | 05/01/44 | | | | 6,754,446 | |
| Lakewood Ranch Stewardship District Special Assessment RB for
Del Webb Project Series 2017 (NR/NR)(f) |
|
| | 1,000,000 | | | 5.000 | | | 05/01/37 | | | | 1,045,650 | |
| | 2,390,000 | | | 5.125 | | | 05/01/47 | | | | 2,493,750 | |
| Lakewood Ranch Stewardship District Special Assessment RB for
Lakewood Centre & NW Sector Project Series 2011 (NR/NR) |
|
| | 19,440,000 | | | 8.000 | | | 05/01/40 | | | | 23,032,901 | |
| Lakewood Ranch Stewardship District Special Assessment RB for
Lakewood National & Polo Run Projects Series 2017 (NR/NR) |
|
| | 800,000 | | | 4.000 | | | 05/01/22 | | | | 806,000 | |
| | 1,125,000 | | | 4.625 | | | 05/01/27 | | | | 1,171,755 | |
| | 2,500,000 | | | 5.250 | | | 05/01/37 | | | | 2,662,525 | |
| | 5,825,000 | | | 5.375 | | | 05/01/47 | | | | 6,189,878 | |
| Lakewood Ranch Stewardship District Special Assessment RB for
Villages of Lakewood Ranch South Project Series 2016
(NR/NR) |
|
| | 2,315,000 | | | 4.000 | | | 05/01/21 | | | | 2,348,429 | |
| | 1,335,000 | | | 4.250 | | | 05/01/26 | | | | 1,366,853 | |
| | 3,775,000 | | | 5.000 | | | 05/01/36 | | | | 3,946,234 | |
| | 14,885,000 | | | 5.125 | | | 05/01/46 | | | | 15,475,934 | |
| Lee County IDA Health Care Facilities RB Refunding for Shell
Point Project Series 2011 B (BBB/NR) |
|
| | 2,600,000 | | | 6.500 | | | 11/15/31 | | | | 3,005,444 | |
| Lee County Moody River Estates Community Development
District Special Assessment Refunding Senior Series 2017 A-1
(BBB+/NR) |
|
| | 1,435,000 | | | 4.000 | | | 05/01/31 | | | | 1,476,428 | |
| | 1,860,000 | | | 4.000 | | | 05/01/36 | | | | 1,891,081 | |
| Longleaf Community Development District Special Assessment
Refunding Series 2005 (NR/NR) |
|
| | 4,230,000 | | | 5.400 | | | 05/01/30 | | | | 3,798,836 | |
| Longleaf Community Development District Special Assessment
Refunding Series 2006 (NR/NR) |
|
| | 2,075,000 | | | 5.375 | | | 05/01/30 | | | | 2,072,095 | |
| Marshall Creek Community Development District Special
Assessment Refunding Series 2015 A (NR/NR) |
|
| | 1,940,000 | | | 5.000 | | | 05/01/32 | | | | 1,936,838 | |
| | |
| Municipal Bonds – (continued) | |
| Florida – (continued) | |
| Meadow Pointe IV Community Development District RB for
Capital Improvement Series 2005 (NR/NR)(i) |
|
| 880,000 | | | 5.250 | | | 05/01/15 | | | | 9 | |
| Meadow Pointe IV Community Development District RB for
Capital Improvement Series 2007 B (NR/NR)(i) |
|
| | 1,380,000 | | | 6.150 | | | 11/01/14 | | | | 14 | |
| Meadow Pointe IV Community Development District RB for
Capital Improvement Series 2012 A-1 (NR/NR) |
|
| | 410,000 | | | 6.000 | | | 05/01/36 | | | | 406,261 | |
| Meadow Pointe IV Community Development District RB for
Capital Improvement Series 2012 A-2 (NR/NR) |
|
| | 795,000 | | | 6.250 | | | 05/01/38 | | | | 833,478 | |
| Meadow Pointe IV Community Development District RB for
Capital Improvement Series 2012 B (NR/NR) |
|
| | 610,000 | | | 6.810 | | | 05/01/20 | | | | 613,660 | |
| Meadow Pointe IV Community Development District RB for
Capital Improvement Series 2014 A (NR/NR) |
|
| | 630,000 | | | 7.250 | | | 05/01/35 | | | | 700,768 | |
| Meadow Pointe IV Community Development District RB for
Capital Improvement Series 2014 B (NR/NR) |
|
| | 490,000 | | | 7.250 | | | 05/01/22 | | | | 535,634 | |
| Meadow Pointe IV Community Development District Special
Assessment for Capital Improvement Series 2005 (NR/NR)(i) |
|
| | 1,075,000 | | | 5.250 | | | 05/01/15 | | | | 11 | |
| Miami Beach Health Facilities Authority Hospital RB Refunding
for Mount Sinai Medical Center of Florida Series 2014
(BBB+/Baa1) |
|
| | 1,500,000 | | | 5.000 | | | 11/15/39 | | | | 1,621,950 | |
| Miami Special Obligation RB Refunding for Port of Miami
Tunnel Project Series 2012 (A+/A1)(f) |
|
| | 11,760,000 | | | 5.000 | | | 03/01/30 | | | | 13,347,365 | |
| Miami World Center Community Development District Special
Assessment Bonds Series 2017 (NR/NR) |
|
| | 600,000 | | | 4.000 | | | 11/01/23 | | | | 615,144 | |
| | 600,000 | | | 4.750 | | | 11/01/27 | | | | 631,020 | |
| | 4,000,000 | | | 5.125 | | | 11/01/39 | | | | 4,200,640 | |
| | 4,135,000 | | | 5.250 | | | 11/01/49 | | | | 4,387,979 | |
| Midtown Miami Community Development District Special
Assessment RB Refunding for Parking Garage Project
Series 2014 A (NR/NR) |
|
| | 3,455,000 | | | 5.000 | | | 05/01/29 | | | | 3,674,012 | |
| | 3,265,000 | | | 5.000 | | | 05/01/37 | | | | 3,450,093 | |
| Miromar Lakes Community Development District RB Refunding
for Capital Improvement Series 2015 (NR/NR) |
|
| | 3,265,000 | | | 5.000 | | | 05/01/28 | | | | 3,447,383 | |
| | 2,000,000 | | | 5.000 | | | 05/01/35 | | | | 2,036,520 | |
| Monterra Community Development District Special Assessment
Refunding Bonds Series 2015 (AGM) (AA/NR) |
|
| | 1,820,000 | | | 3.500 | | | 05/01/36 | | | | 1,800,326 | |
| Naples Reserve Community Development District Special
Assessment Bonds Series 2014 (NR/NR) |
|
| | 750,000 | | | 5.250 | | | 11/01/35 | | | | 774,105 | |
| | 1,250,000 | | | 5.625 | | | 11/01/45 | | | | 1,314,275 | |
| New River Community Development District Special Assessment
RB for Capital Improvement Series 2010 A-1 (NR/NR) |
|
| | 1,910,000 | | | 5.750 | | | 05/01/38 | | | | 1,911,146 | |
| | |
| | |
| 46 | | The accompanying notes are an integral part of these financial statements. |
GOLDMAN SACHS HIGH YIELD MUNICIPAL FUND
| | | | | | | | | | | | |
Principal
Amount | | | Interest
Rate | | Maturity
Date | | | Value | |
| Municipal Bonds – (continued) | |
| Florida – (continued) | |
| New River Community Development District Special Assessment
RB for Capital Improvement Series 2010 B-1 (NR/NR) |
|
| $ | 190,000 | | | 5.000 % | | | 05/01/19 | | | $ | 190,477 | |
| New River Community Development District Special Assessment
Series 2006 B (NR/NR)(i) |
|
| | 3,260,000 | | | 5.000 | | | 05/01/13 | | | | 33 | |
| Orlando Florida Community Redevelopment Agency Tax
Increment RB Refunding for Conroy Road District Series 2012
(A-/NR) |
|
| | 1,680,000 | | | 5.000 | | | 04/01/24 | | | | 1,855,997 | |
| | 1,765,000 | | | 5.000 | | | 04/01/25 | | | | 1,942,012 | |
| | 1,005,000 | | | 5.000 | | | 04/01/26 | | | | 1,101,319 | |
| Overoaks Community Development District RB for Capital
Improvement Series 2010 A-1 (NR/NR) |
|
| | 945,000 | | | 6.125 | | | 05/01/35 | | | | 946,247 | |
| Overoaks Community Development District RB for Capital
Improvement Series 2010 A-2 (NR/NR) |
|
| | 1,310,000 | | | 6.125 | | | 05/01/35 | | | | 1,311,729 | |
| Overoaks Community Development District Special Assessment
for Capital Improvement Series 2004 A (NR/NR)(i) |
|
| | 1,200,000 | | | 5.125 | | | 05/01/09 | | | | 408,000 | |
| | 210,000 | | | 6.125 | | | 05/01/35 | | | | 71,400 | |
| Palm Glades Community Development District Special
Assessment Refunding Bonds Series 2016 (BBB/NR) |
|
| | 3,155,000 | | | 3.750 | | | 05/01/31 | | | | 3,159,543 | |
| | 2,040,000 | | | 4.000 | | | 05/01/36 | | | | 2,053,444 | |
| Palm Glades Community Development District Special
Assessment Refunding Bonds Series 2017 (BBB-/NR) |
|
| | 700,000 | | | 4.000 | | | 05/01/27 | | | | 700,868 | |
| | 2,380,000 | | | 5.000 | | | 05/01/39 | | | | 2,428,885 | |
| Panther Trace II Community Development District Special
Assessment RB Refunding Series 2014 (AGM) (AA/NR) |
|
| | 530,000 | | | 4.125 | | | 05/01/35 | | | | 542,291 | |
| Paseo Community Development District Capital Improvement
Revenue Bonds Capital Appreciation Series 2011 A-2
(NR/NR)(b) |
|
| | 15,205,000 | | | 0.000 | | | 05/01/36 | | | | 5,725,139 | |
| Paseo Community Development District Capital Improvement
Revenue Bonds Special Assessment Series 2011 A-1 (NR/NR) |
|
| | 1,930,000 | | | 5.400 | | | 05/01/36 | | | | 1,933,995 | |
| Paseo Community Development District RB for Capital
Improvement Series 2005 A (NR/NR)(i) |
|
| | 6,355,000 | | | 5.400 | | | 05/01/36 | | | | 64 | |
| Paseo Community Development District RB for Capital
Improvement Series 2005 B (NR/NR)(i) |
|
| | 3,670,000 | | | 4.875 | | | 05/01/10 | | | | 37 | |
| Paseo Community Development District RB for Capital
Improvement Series 2006 (NR/NR)(i) |
|
| | 2,600,000 | | | 5.000 | | | 02/01/11 | | | | 26 | |
| Portofino Isles Community Development District Special
Assessment RB Refunding Series 2013 (BBB-/NR) |
|
| | 2,805,000 | | | 4.750 | | | 05/01/33 | | | | 2,933,413 | |
| Reunion East Community Development District Special
Assessment Refunding Bonds Series 2015 1 (NR/NR) |
|
| | 3,125,000 | | | 6.600 | | | 05/01/33 | | | | 3,210,875 | |
| | |
| Municipal Bonds – (continued) | |
| Florida – (continued) | |
| Reunion East Community Development District Special
Assessment Refunding Bonds Series 2015 2 (NR/NR) |
|
| 855,000 | | | 6.600 | | | 05/01/36 | | | | 878,495 | |
| Reunion East Community Development District Special
Assessment Refunding Bonds Series 2015 3 (NR/NR) |
|
| | 2,560,000 | | | 6.600 | | | 05/01/33 | | | | 2,630,349 | |
| Reunion East Community Development District Special
Assessment Refunding Bonds Series 2015 A (NR/NR) |
|
| | 3,070,000 | | | 5.000 | | | 05/01/25 | | | | 3,267,677 | |
| | 6,840,000 | | | 5.000 | | | 05/01/33 | | | | 7,169,141 | |
| Reunion East Community Development District Special
Assessment Series 2002 A-2 (NR/NR)(i) |
|
| | 2,170,000 | | | 7.200 | | | 05/01/22 | | | | 22 | |
| River Bend Community Development District Special
Assessment RB Refunding Senior Series 2016 A-1 (BBB+/NR) |
|
| | 2,395,000 | | | 4.000 | | | 05/01/31 | | | | 2,461,844 | |
| River Hall Community Development District Special Assessment
for Capital Improvement Series 2011 A (NR/NR) |
|
| | 4,780,000 | | | 5.450 | | | 05/01/36 | | | | 4,779,761 | |
| Sandy Creek Community Development District Special
Assessment Refunding Series 2007 B (NR/NR) |
|
| | 1,335,000 | | | 5.500 | | | 05/01/20 | | | | 1,331,142 | |
| Sarasota County Public Hospital District RB for Sarasota
Memorial Hospital Project Series 2009 A (AA-/A1) |
|
| | 1,500,000 | | | 5.625 | | | 07/01/39 | | | | 1,594,305 | |
| South Kendall Community Development District Special
Assessment Refunding Series 2016 (BBB-/NR) |
|
| | 1,345,000 | | | 4.250 | | | 11/01/37 | | | | 1,383,386 | |
| | 330,000 | | | 4.125 | | | 11/01/40 | | | | 330,116 | |
| South Village Community Development District Capital
Improvement and Special Assessment Refunding Senior Lien
Series 2016 A-1 (BBB/NR) |
|
| | 805,000 | | | 3.500 | | | 05/01/32 | | | | 768,574 | |
| | 505,000 | | | 3.625 | | | 05/01/35 | | | | 475,149 | |
| | 1,020,000 | | | 3.750 | | | 05/01/38 | | | | 958,494 | |
| South Village Community Development District Capital
Improvement and Special Assessment Refunding Subordinate
Lien Series 2016 A-2 (NR/NR) |
|
| | 645,000 | | | 4.350 | | | 05/01/26 | | | | 653,120 | |
| | 500,000 | | | 4.875 | | | 05/01/35 | | | | 507,865 | |
| | 95,000 | | | 5.000 | | | 05/01/38 | | | | 96,453 | |
| South-Dade Venture Community Development District Special
Assessment RB Refunding Series 2013 (NR/NR) |
|
| | 2,015,000 | | | 5.250 | | | 05/01/34 | | | | 2,212,047 | |
| Southern Hills Plantation I Community Development District
Special Assessment for Capital Improvement Series 2011 A-1
(NR/NR) |
|
| | 3,990,000 | | | 5.800 | | | 05/01/35 | | | | 3,882,709 | |
| Southern Hills Plantation I Community Development District
Special Assessment for Capital Improvement Series 2011 A-2
(NR/NR) |
|
| | 2,980,000 | | | 5.800 | | | 05/01/35 | | | | 2,671,242 | |
| Spring Lake Community Development District Special
Assessment for Assessment Area Two Project Series 2017
(NR/NR)(f) |
|
| | 1,250,000 | | | 5.125 | | | 11/01/37 | | | | 1,276,100 | |
| | 1,790,000 | | | 5.250 | | | 11/01/47 | | | | 1,830,705 | |
| | |
| | |
| The accompanying notes are an integral part of these financial statements. | | 47 |
GOLDMAN SACHS HIGH YIELD MUNICIPAL FUND
Schedule of Investments (continued)
September 30, 2017 (Unaudited)
| | | | | | | | | | | | |
Principal
Amount | | | Interest
Rate | | Maturity
Date | | | Value | |
| Municipal Bonds – (continued) | |
| Florida – (continued) | |
| Spring Ridge Community Development District Special
Assessment RB Series A-1 (NR/NR) |
|
| $ | 1,290,000 | | | 4.800 % | | | 05/01/35 | | | $ | 1,273,372 | |
| St. Petersburg Health Facilities Authority RB Refunding for All
Children’s Hospital Series 2009 A (NR/Aa3)(e) |
|
| | 5,835,000 | | | 6.500 | | | 11/15/19 | | | | 6,478,017 | |
| Sterling Hill Community Development District RB for Capital
Improvement Series 2003 B (NR/NR)(i) |
|
| | 418,112 | | | 5.500 | | | 11/01/10 | | | | 292,679 | |
| Stonegate Community Development District Special Assessment
Refunding Bonds Series 2013 (NR/NR) |
|
| | 2,160,000 | | | 5.000 | | | 05/01/34 | | | | 2,326,234 | |
| Stoneybrook South Community Development District Special
Assessment Bonds Refunding for Assessment Area Two-A
Project Series 2014 (NR/NR) |
|
| | 1,500,000 | | | 5.125 | | | 11/01/34 | | | | 1,627,365 | |
| | 3,500,000 | | | 5.500 | | | 11/01/44 | | | | 4,031,545 | |
| Stoneybrook South Community Development District Special
Assessment RB Refunding for Assessment Area One Project
Series 2013 (NR/NR) |
|
| | 2,440,000 | | | 6.500 | | | 05/01/39 | | | | 2,787,993 | |
| Talis Park Community Development District Capital
Improvement RB Refunding Subordinate Series 2016 A-2
(NR/NR) |
|
| | 670,000 | | | 3.250 | | | 05/01/21 | | | | 664,177 | |
| | 975,000 | | | 3.750 | | | 05/01/26 | | | | 963,700 | |
| | 1,600,000 | | | 4.000 | | | 05/01/33 | | | | 1,565,440 | |
| | 905,000 | | | 4.125 | | | 05/01/36 | | | | 889,398 | |
| Talis Park Community Development District Capital
Improvement RB Series 2013 (NR/NR) |
|
| | 1,370,000 | | | 5.250 | | | 11/01/34 | | | | 1,408,648 | |
| | 2,365,000 | | | 6.000 | | | 11/01/44 | | | | 2,570,045 | |
| Tapestry Community Development District Special Assessment
RB Series 2016 (NR/NR) |
|
| | 390,000 | | | 4.250 | | | 05/01/26 | | | | 399,988 | |
| | 1,110,000 | | | 4.800 | | | 05/01/36 | | | | 1,126,339 | |
| | 1,715,000 | | | 5.000 | | | 05/01/46 | | | | 1,737,621 | |
| Tison’s Landing Community Development District Special
Assessment RB Refunding & Improvement Bonds Senior
Series 2016 A-1 (BBB/NR) |
|
| | 700,000 | | | 3.375 | | | 05/01/32 | | | | 674,527 | |
| | 1,355,000 | | | 3.600 | | | 05/01/37 | | | | 1,315,962 | |
| Toscana Isles Community Development District Special
Assessment RB Series 2014 (NR/NR) |
|
| | 450,000 | | | 5.750 | | | 11/01/27 | | | | 494,554 | |
| | 2,000,000 | | | 6.250 | | | 11/01/44 | | | | 2,203,000 | |
| Triple Creek Community Development District Special
Assessment Series 2017 A (NR/NR) |
|
| | 1,965,000 | | | 5.250 | | | 11/01/27 | | | | 1,996,715 | |
| | 2,745,000 | | | 6.125 | | | 11/01/46 | | | | 2,798,088 | |
| TSR Community Development District Special Assessment RB
for 2016 Project Series 2016 (NR/NR) |
|
| | 745,000 | | | 3.500 | | | 11/01/21 | | | | 742,459 | |
| | 1,340,000 | | | 4.000 | | | 11/01/27 | | | | 1,333,367 | |
| | 3,160,000 | | | 4.625 | | | 11/01/37 | | | | 3,105,111 | |
| | 2,790,000 | | | 4.750 | | | 11/01/47 | | | | 2,737,325 | |
| | |
| Municipal Bonds – (continued) | |
| Florida – (continued) | |
| TSR Community Development District Special Assessment RB
for Village 4 Project Series 2015 A (NR/NR) |
|
| 400,000 | | | 4.250 | | | 11/01/21 | | | | 406,276 | |
| | 2,440,000 | | | 5.625 | | | 11/01/45 | | | | 2,613,460 | |
| Turnbull Creek Community Development District Senior Special
Assessment Refunding Series 2015 A-1 (BBB/NR) |
|
| | 2,270,000 | | | 4.375 | | | 05/01/35 | | | | 2,384,181 | |
| Two Creeks Community Development District RB Refunding for
Capital Improvement Senior Lien Series 2016 A-1 (BBB-/NR) |
|
| | 1,775,000 | | | 3.500 | | | 05/01/32 | | | | 1,745,073 | |
| | 2,650,000 | | | 3.625 | | | 05/01/37 | | | | 2,582,717 | |
| Two Creeks Community Development District RB Refunding for
Capital Improvement Subordinate Lien Series 2016 A-2
(NR/NR) |
|
| | 625,000 | | | 4.750 | | | 05/01/37 | | | | 610,950 | |
| Two Lakes Community Development District Special Assessment
Series 2017 (NR/NR)(f) |
|
| | 1,880,000 | | | 3.250 | | | 12/15/22 | | | | 1,874,586 | |
| | 2,000,000 | | | 4.000 | | | 12/15/28 | | | | 2,004,340 | |
| | 1,000,000 | | | 5.000 | | | 12/15/32 | | | | 1,059,250 | |
| | 1,705,000 | | | 5.000 | | | 12/15/37 | | | | 1,776,968 | |
| | 3,800,000 | | | 5.000 | | | 12/15/47 | | | | 3,918,408 | |
| Union Park East Community Development District Capital
Improvement RB for Assessment Area One Series 2017 A-1
(NR/NR)(f) |
|
| | 1,400,000 | | | 5.500 | | | 11/01/47 | | | | 1,439,718 | |
| Venetian Community Development District Capital Improvement
RB Refunding Series 2012 A-1 (NR/NR) |
|
| | 500,000 | | | 5.500 | | | 05/01/34 | | | | 519,410 | |
| | 750,000 | | | 6.125 | | | 05/01/42 | | | | 787,545 | |
| Venetian Parc Community Development District Special
Assessment Area One Project Series 2013 (NR/NR) |
|
| | 580,000 | | | 6.000 | | | 11/01/27 | | | | 660,017 | |
| | 2,050,000 | | | 6.500 | | | 11/01/43 | | | | 2,708,296 | |
| Venetian Parc Community Development District Special
Assessment Area Two Project Series 2013 (NR/NR) |
|
| | 830,000 | | | 6.375 | | | 11/01/27 | | | | 905,505 | |
| | 2,300,000 | | | 7.125 | | | 11/01/44 | | | | 2,729,801 | |
| Verandah East Community Development District Special
Assessment Refunding & Improvement RB Series 2016
(NR/NR) |
|
| | 1,425,000 | | | 3.375 | | | 05/01/21 | | | | 1,424,259 | |
| | 2,460,000 | | | 3.750 | | | 05/01/26 | | | | 2,424,429 | |
| | 4,360,000 | | | 4.000 | | | 05/01/31 | | | | 4,265,911 | |
| | 1,750,000 | | | 4.125 | | | 05/01/34 | | | | 1,711,885 | |
| | 1,000,000 | | | 4.250 | | | 05/01/37 | | | | 977,850 | |
| Verano #1 Community Development District Senior Special
Assessment Refunding for Community Infrastructure Project
Series 2017 A-1 (BBB/NR)(f) |
|
| | 1,985,000 | | | 4.000 | | | 05/01/31 | | | | 2,040,322 | |
| | 2,940,000 | | | 4.000 | | | 05/01/37 | | | | 2,952,436 | |
| Verano #1 Community Development District Special Assessment
Bonds for District #1 Project Series 2015 (NR/NR) |
|
| | 750,000 | | | 5.125 | | | 11/01/35 | | | | 779,797 | |
| | 1,000,000 | | | 5.250 | | | 11/01/46 | | | | 1,039,910 | |
| | |
| | |
| 48 | | The accompanying notes are an integral part of these financial statements. |
GOLDMAN SACHS HIGH YIELD MUNICIPAL FUND
| | | | | | | | | | | | |
Principal
Amount | | | Interest
Rate | | Maturity
Date | | | Value | |
| Municipal Bonds – (continued) | |
| Florida – (continued) | |
| Village Community Development District No. 10 Special
Assessment RB Series 2012 (NR/NR) |
|
| $ | 2,600,000 | | | 5.000 % | | | 05/01/32 | | | $ | 2,902,120 | |
| | 6,190,000 | | | 5.125 | | | 05/01/43 | | | | 6,942,704 | |
| Village Community Development District No. 10 Special
Assessment RB Series 2014 (NR/NR) |
|
| | 4,800,000 | | | 6.000 | | | 05/01/44 | | | | 5,653,056 | |
| Village Community Development District No. 5 Special
Assessment RB Refunding Phase I Series 2013 (A/NR) |
|
| | 1,635,000 | | | 4.000 | | | 05/01/33 | | | | 1,650,434 | |
| Village Community Development District No. 5 Special
Assessment RB Refunding Phase II Series 2013 (A/NR) |
|
| | 1,280,000 | | | 4.000 | | | 05/01/34 | | | | 1,288,883 | |
| Village Community Development District No. 8 Special
Assessment RB Series 2008 (NR/NR) |
|
| | 7,290,000 | | | 6.375 | | | 05/01/38 | | | | 7,447,027 | |
| Village Community Development District No. 8 Special
Assessment Refunding Phase II Series 2010 (NR/NR) |
|
| | 7,755,000 | | | 6.125 | | | 05/01/39 | | | | 8,491,105 | |
| Village Community Development District No. 9 Special
Assessment RB Series 2011 (NR/NR) |
|
| | 4,685,000 | | | 7.000 | | | 05/01/41 | | | | 5,495,130 | |
| Village Community Development District No. 9 Special
Assessment Refunding Series 2012 (NR/NR) |
|
| | 1,925,000 | | | 5.500 | | | 05/01/42 | | | | 2,100,945 | |
| Villasol Community Development District RB Series 2003 A
(NR/NR) |
|
| | 2,125,000 | | | 6.600 | | | 05/01/34 | | | | 2,126,232 | |
| Vizcaya In Kendall Community Development District Special
Assessment Bonds Series 2016 (BBB-/NR) |
|
| | 1,000,000 | | | 3.750 | | | 11/01/31 | | | | 1,013,050 | |
| | 1,000,000 | | | 4.000 | | | 11/01/36 | | | | 1,001,490 | |
| | 1,300,000 | | | 4.125 | | | 11/01/46 | | | | 1,288,001 | |
| Waterford Landing Community Development District Capital
Improvement RB Series 2014 (NR/NR) |
|
| | 3,150,000 | | | 5.500 | | | 05/01/34 | | | | 3,272,976 | |
| | 3,825,000 | | | 5.750 | | | 05/01/44 | | | | 4,018,927 | |
| Waters Edge Community Development District Capital
Improvement RB Refunding Series 2012 A-1 (NR/NR) |
|
| | 14,000 | | | 5.350 | | | 05/01/39 | | | | 13,719 | |
| Waters Edge Community Development District Capital
Improvement RB Refunding Series 2012 A-2 (NR/NR) |
|
| | 495,000 | | | 6.600 | | | 05/01/39 | | | | 497,673 | |
| Waters Edge Community Development District Pasco County
Capital Improvement RB Refunding Senior Lien
Series 2015 A-1 (BBB+/NR) |
|
| | 3,240,000 | | | 4.200 | | | 05/01/36 | | | | 3,322,782 | |
| Waterset North Community Development District Special
Assessment RB Series 2014 (NR/NR) |
|
| | 1,240,000 | | | 5.125 | | | 11/01/35 | | | | 1,281,924 | |
| | 2,000,000 | | | 5.500 | | | 11/01/45 | | | | 2,081,880 | |
| Winding Cypress Community Development District Special
Assessment Phase 1 and Phase 2 Assessment Area Series 2015
(NR/NR) |
|
| | 265,000 | | | 4.000 | | | 11/01/20 | | | | 266,402 | |
| | 400,000 | | | 4.375 | | | 11/01/25 | | | | 405,288 | |
| | 1,770,000 | | | 5.000 | | | 11/01/45 | | | | 1,794,426 | |
| | |
| Municipal Bonds – (continued) | |
| Florida – (continued) | |
| Wiregrass Community Development District Capital
Improvement RB Series 2014 (NR/NR) |
|
| 470,000 | | | 5.375 | | | 05/01/35 | | | | 493,373 | |
| | 3,060,000 | | | 5.625 | | | 05/01/45 | | | | 3,216,672 | |
| Wiregrass Community Development District Capital
Improvement RB Series 2016 (NR/NR) |
|
| | 780,000 | | | 4.875 | | | 05/01/36 | | | | 785,679 | |
| | 1,445,000 | | | 5.000 | | | 05/01/47 | | | | 1,442,731 | |
| | | | | | | | | | | | |
| | | | | | | | | | | 595,275,348 | |
| | |
| Georgia – 1.3% | |
| Altlanta Development Authority RB for New Downtown Atlanta
Stadium Project Senior Lien Series 2015 A-1 (A+/Aa3) |
|
| | 1,500,000 | | | 5.250 | | | 07/01/40 | | | | 1,733,865 | |
| | 5,500,000 | | | 5.250 | | | 07/01/44 | | | | 6,320,600 | |
| Altlanta Development Authority RB for New Downtown Atlanta
Stadium Project Senior Lien Series 2015 B (A/A1) |
|
| | 1,000,000 | | | 4.000 | | | 07/01/40 | | | | 1,037,750 | |
| Clayton County Development Authority Special Facilities RB for
Delta Airlines, Inc. Series 2009 A (BB+/Baa3) |
|
| | 11,700,000 | | | 8.750 | | | 06/01/29 | | | | 13,537,836 | |
| Fulton County Development Authority RB for Tuff Caub LLC
Project Series 2007 A (NR/NR) |
|
| | 1,900,000 | | | 5.250 | | | 11/01/28 | | | | 1,850,144 | |
| Gainesville & Hall County Development Authority RB Refunding
for Riverside Military Academy Series 2017 (BBB-/NR) |
|
| | 900,000 | | | 5.000 | | | 03/01/47 | | | | 950,229 | |
| | 900,000 | | | 5.125 | | | 03/01/52 | | | | 948,384 | |
| Milledgeville & Baldwin County Development Authority Student
Housing RB Refunding for Georgia College & State University
Foundation Property V, LLC Project Series 2007 (AMBAC)
(A+/WR)(c) |
|
| | 49,820,000 | | | (3 Mo. LIBOR + 0.65%),
1.520 | | | 10/01/33 | | | | 43,780,820 | |
| | | | | | | | | | | | |
| | | | | | | | | | | 70,159,628 | |
| | |
| Guam – 1.2% | |
| A.B. Won Pat International Airport Authority RB Refunding
General Series 2013 B (AGM) (AA/A2) |
|
| | 1,500,000 | | | 5.750 | | | 10/01/43 | | | | 1,737,990 | |
| Guam Government Department of Education COPS for John F.
Kennedy High School Project Series 2010 A (B+/NR) |
|
| | 2,500,000 | | | 6.625 | | | 12/01/30 | | | | 2,633,400 | |
| | 3,355,000 | | | 6.875 | | | 12/01/40 | | | | 3,531,205 | |
| Guam Government Limited Obligation RB Section 30
Series 2016 A (BBB+/NR) |
|
| | 500,000 | | | 5.000 | | | 12/01/31 | | | | 563,855 | |
| | 3,410,000 | | | 5.000 | | | 12/01/46 | | | | 3,702,339 | |
| Guam International Airport Authority RB Refunding for
Series 2013 C (AMT) (AGM) (AA/A2) |
|
| | 7,300,000 | | | 6.125 | | | 10/01/43 | | | | 8,586,187 | |
| Guam International Airport Authority RB Refunding for
Series 2013 C (AMT) (BBB/Baa2) |
|
| | 2,000,000 | | | 6.375 | | | 10/01/43 | | | | 2,278,100 | |
| | Guam Power Authority RB Series 2010 A (BBB/Baa2) | |
| | 10,000,000 | | | 5.500 | | | 10/01/40 | | | | 10,505,800 | |
| | |
| | |
| The accompanying notes are an integral part of these financial statements. | | 49 |
GOLDMAN SACHS HIGH YIELD MUNICIPAL FUND
Schedule of Investments (continued)
September 30, 2017 (Unaudited)
| | | | | | | | | | | | |
Principal
Amount | | | Interest
Rate | | Maturity
Date | | | Value | |
| Municipal Bonds – (continued) | |
| Guam – (continued) | |
| Guam Waterworks Authority RB for Water & Wastewater System
Series 2010 (A-/Baa2) |
|
| $ | 10,365,000 | | | 5.625 % | | | 07/01/40 | | | $ | 11,002,966 | |
| Guam Waterworks Authority RB for Water & Wastewater System
Series 2013 (A-/Baa2) |
|
| | 13,705,000 | | | 5.500 | | | 07/01/43 | | | | 15,152,796 | |
| Guam Waterworks Authority RB for Water & Wastewater System
Series 2016 (A-/Baa2) |
|
| | 4,880,000 | | | 5.000 | | | 01/01/46 | | | | 5,220,868 | |
| | | | | | | | | | | | |
| | | | | | | | | | | 64,915,506 | |
| | |
| Idaho – 0.0% | |
| Idaho Health Facilities Authority RB Refunding for Madison
Memorial Hospital Project Series 2016 (BB+/NR) |
|
| | 1,000,000 | | | 5.000 | | | 09/01/37 | | | | 1,064,280 | |
| | |
| Illinois – 14.7% | |
| Chicago Illinois Board of Education Dedicated Capital
Improvement Series 2016 (A/NR) |
|
| | 16,000,000 | | | 6.000 | | | 04/01/46 | | | | 18,825,440 | |
| Chicago Illinois Board of Education GO Bonds Capital
Appreciation for School Reform Series 1998 B-1 (NATL-RE)
(A/A3)(b) |
|
| | 2,500,000 | | | 0.000 | | | 12/01/27 | | | | 1,670,075 | |
| | 350,000 | | | 0.000 | | | 12/01/28 | | | | 222,264 | |
| | 8,925,000 | | | 0.000 | | | 12/01/29 | | | | 5,390,164 | |
| | 405,000 | | | 0.000 | | | 12/01/30 | | | | 232,551 | |
| Chicago Illinois Board of Education GO Bonds Capital
Appreciation for School Reform Series 1999 A (NATL-RE)
(A/A3)(b) |
|
| | 125,000 | | | 0.000 | | | 12/01/29 | | | | 75,493 | |
| | 150,000 | | | 0.000 | | | 12/01/30 | | | | 86,130 | |
| Chicago Illinois Board of Education GO Bonds Capital
Appreciation Refunding for School Reform Series 1999 A
(NATL-RE) (A/A3)(b) |
|
| | 15,340,000 | | | 0.000 | | | 12/01/31 | | | | 8,374,720 | |
| Chicago Illinois Board of Education GO Bonds Series 2011 A
(B/B3) |
|
| | 2,770,000 | | | 5.000 | | | 12/01/41 | | | | 2,731,580 | |
| Chicago Illinois Board of Education GO Bonds Series 2012 A
(B/B3) |
|
| | 5,550,000 | | | 5.000 | | | 12/01/42 | | | | 5,486,952 | |
| Chicago Illinois Board of Education GO Bonds Series 2017 A
(NR/NR)(f) |
|
| | 5,500,000 | | | 7.000 | | | 12/01/46 | | | | 6,596,095 | |
| Chicago Illinois Board of Education GO Refunding Bonds for
School Reform Series 1999 A (NATL-RE) (A/A3) |
|
| | 9,535,000 | | | 5.500 | | | 12/01/26 | | | | 11,022,937 | |
| Chicago Illinois Board of Education GO Refunding Bonds Series
2005 A (AMBAC) (B/B3) |
|
| | 8,965,000 | | | 5.500 | | | 12/01/29 | | | | 9,805,827 | |
| Chicago Illinois Board of Education GO Refunding Bonds
Series 2010 F (B/B3) |
|
| | 1,060,000 | | | 5.000 | | | 12/01/31 | | | | 1,052,495 | |
| Chicago Illinois Board of Education Unlimited Tax GO Bonds for
Dedicated Alternate Revenues Series 2015 C (B/NR) |
|
| | 19,705,000 | | | 5.250 | | | 12/01/35 | | | | 19,657,905 | |
| | 15,235,000 | | | 5.250 | | | 12/01/39 | | | | 15,056,903 | |
| | |
| Municipal Bonds – (continued) | |
| Illinois – (continued) | |
| Chicago Illinois Board of Education Unlimited Tax GO Bonds for
Dedicated Alternate Revenues Series 2015 E (B/NR) |
|
| 5,315,000 | | | 5.125 | | | 12/01/32 | | | | 5,284,173 | |
| Chicago Illinois Board of Education Unlimited Tax GO Bonds for
Dedicated Revenues Series 2011 A (B/B3) |
|
| | 315,000 | | | 5.500 | | | 12/01/39 | | | | 317,652 | |
| Chicago Illinois Board of Education Unlimited Tax GO
Refunding Bonds for Dedicated Revenues Series 2005 A
(AMBAC) (B/B3) |
|
| | 2,300,000 | | | 5.500 | | | 12/01/30 | | | | 2,504,907 | |
| Chicago Illinois Board of Education Unlimited Tax GO
Refunding Bonds for Dedicated Revenues Series 2008 C
(B/B3) |
|
| | 6,325,000 | | | 5.000 | | | 12/01/28 | | | | 6,324,557 | |
| Chicago Illinois Board of Education Unlimited Tax GO
Refunding Bonds for Dedicated Revenues Series 2009 E
(B/B3) |
|
| | 9,750,000 | | | 6.038 | | | 12/01/29 | | | | 9,306,862 | |
| | 10,265,000 | | | 6.138 | | | 12/01/39 | | | | 9,514,526 | |
| Chicago Illinois Board of Education Unlimited Tax GO
Refunding Bonds for Dedicated Revenues Series 2016 A
(B/NR) |
|
| | 54,475,000 | | | 7.000 | | | 12/01/44 | | | | 63,646,411 | |
| Chicago Illinois Board of Education Unlimited Tax GO
Refunding Bonds for Dedicated Revenues Series 2016 B
(B/NR) |
|
| | 61,135,000 | | | 6.500 | | | 12/01/46 | | | | 69,489,098 | |
| Chicago Illinois Capital Appreciation Refunding & Project
Series 2009 C (BBB+/Ba1)(b) |
|
| | 11,415,000 | | | 0.000 | | | 01/01/32 | | | | 5,856,922 | |
| Chicago Illinois GO Bonds Project and Refunding RMKT
06/08/15 Series 2005 D (BBB+/Ba1) |
|
| | 1,700,000 | | | 5.500 | | | 01/01/37 | | | | 1,844,432 | |
| Chicago Illinois GO Bonds Project Refunding Series 2014 A
(BBB+/Ba1) |
|
| | 8,375,000 | | | 5.250 | | | 01/01/33 | | | | 8,886,126 | |
| | 6,295,000 | | | 5.000 | | | 01/01/34 | | | | 6,607,484 | |
| | 10,500,000 | | | 5.000 | | | 01/01/36 | | | | 10,997,595 | |
| Chicago Illinois GO Bonds Project Refunding Series 2017 A
(BBB+/NR) |
|
| | 6,100,000 | | | 6.000 | | | 01/01/38 | | | | 7,065,325 | |
| | Chicago Illinois GO Bonds Project Series 2011 A (BBB+/Ba1) | |
| | 6,170,000 | | | 5.250 | | | 01/01/35 | | | | 6,364,170 | |
| | 3,000,000 | | | 5.000 | | | 01/01/40 | | | | 3,094,860 | |
| | Chicago Illinois GO Bonds Project Series 2012 A (BBB+/Ba1) | |
| | 18,000,000 | | | 5.000 | | | 01/01/33 | | | | 18,673,740 | |
| | 3,850,000 | | | 5.000 | | | 01/01/34 | | | | 3,985,019 | |
| | Chicago Illinois GO Bonds Series 2015 A (BBB+/NR) | |
| | 4,180,000 | | | 5.500 | | | 01/01/39 | | | | 4,537,850 | |
| Chicago Illinois GO Refunding & Project Bonds Series 2009 C
(BBB+/Ba1) |
|
| | 1,170,000 | | | 5.000 | | | 01/01/34 | | | | 1,201,216 | |
| Chicago Illinois GO Refunding Bonds for Taxable Project Series
2014 B (BBB+/Ba1) |
|
| | 12,000,000 | | | 6.314 | | | 01/01/44 | | | | 12,831,360 | |
| | |
| | |
| 50 | | The accompanying notes are an integral part of these financial statements. |
GOLDMAN SACHS HIGH YIELD MUNICIPAL FUND
| | | | | | | | | | | | |
Principal
Amount | | | Interest
Rate | | Maturity
Date | | | Value | |
| Municipal Bonds – (continued) | |
| Illinois – (continued) | |
| Chicago Illinois GO Refunding Bonds RMKT 06/08/15
Series 2007 E (BBB+/Ba1) |
|
| $ | 3,775,000 | | | 5.500 % | | | 01/01/42 | | | $ | 4,061,447 | |
| Chicago Illinois GO Refunding Bonds RMKT 06/08/15
Series 2007 F (BBB+/Ba1) |
|
| | 2,500,000 | | | 5.500 | | | 01/01/42 | | | | 2,689,700 | |
| | Chicago Illinois GO Refunding Bonds Series 2009 C (BBB+/Ba1) | |
| | 3,825,000 | | | 5.000 | | | 01/01/40 | | | | 3,906,281 | |
| Chicago Illinois GO Refunding Bonds Series 2014 A
(BBB+/Ba1) |
|
| | 4,230,000 | | | 5.000 | | | 01/01/35 | | | | 4,430,460 | |
| | Chicago Illinois GO Refunding Bonds Series 2015 C (BBB+/NR) | |
| | 13,300,000 | | | 5.000 | | | 01/01/38 | | | | 14,081,641 | |
| Chicago Illinois Second Lien RB Refunding for Wastewater
Transmission RMKT 10/19/15 Series 2008 C (A/NR) |
|
| | 1,500,000 | | | 5.000 | | | 01/01/39 | | | | 1,632,780 | |
| Chicago Illinois Wastewater Transmission RB Second Lien
Series 2017 A (AGM) (AA/NR) |
|
| | 1,950,000 | | | 5.250 | | | 01/01/42 | | | | 2,230,683 | |
| | 5,460,000 | | | 4.000 | | | 01/01/52 | | | | 5,527,158 | |
| Chicago Illinois Water RB Refunding Second Lien Project
RMKT 05/23/16 Series 2000 (A/Baa2) |
|
| | 1,500,000 | | | 5.000 | | | 11/01/28 | | | | 1,743,300 | |
| | 1,050,000 | | | 5.000 | | | 11/01/29 | | | | 1,213,065 | |
| | 1,000,000 | | | 5.000 | | | 11/01/30 | | | | 1,149,310 | |
| Cortland Illinois Special Service Area No. 9 Special Tax Bonds
for Richland Trails Project Series 2007-1 (NR/NR) |
|
| | 2,074,000 | | | 5.800 | | | 03/01/37 | | | | 2,017,421 | |
| Du Page County Special Service Area No. 31 Special Tax for
Monarch Landing Project Series 2006 (NR/NR) |
|
| | 1,401,000 | | | 5.625 | | | 03/01/36 | | | | 1,404,096 | |
| Illinois Finance Authority RB for Christian Homes, Inc.
Series 2007 A (BBB-/NR) |
|
| | 2,780,000 | | | 5.750 | | | 05/15/31 | | | | 2,787,172 | |
| Illinois Finance Authority RB for Christian Homes, Inc.
Series 2010 (BBB-/NR) |
|
| | 805,000 | | | 6.125 | | | 05/15/27 | | | | 869,303 | |
| Illinois Finance Authority RB for Christian Homes, Inc.
Series 2010 (NR/NR)(e) |
|
| | 445,000 | | | 6.125 | | | 05/15/20 | | | | 501,898 | |
| Illinois Finance Authority RB for Midwest Regional Medical
Center Series 2006 A (NR/NR)(f) |
|
| | 33,325,000 | | | 6.750 | | | 10/01/46 | | | | 33,386,985 | |
| Illinois Finance Authority RB Refunding for Franciscan
Communities Project Series 2017 A (BBB-/NR) |
|
| | 1,645,000 | | | 4.000 | | | 05/15/27 | | | | 1,711,063 | |
| | 2,825,000 | | | 5.000 | | | 05/15/37 | | | | 3,026,931 | |
| | 1,055,000 | | | 5.000 | | | 05/15/47 | | | | 1,118,395 | |
| Illinois Finance Authority RB Refunding for Franciscan
Communities, Inc. Series 2013 A (BBB-/NR) |
|
| | 4,500,000 | | | 5.250 | | | 05/15/47 | | | | 4,740,930 | |
| Illinois Finance Authority RB Refunding for Illinois Wesleyan
University Series 2016 (A-/Baa1) |
|
| | 490,000 | | | 5.000 | | | 09/01/36 | | | | 539,137 | |
| | 3,470,000 | | | 5.000 | | | 09/01/46 | | | | 3,757,594 | |
| | |
| Municipal Bonds – (continued) | |
| Illinois – (continued) | |
| Illinois Finance Authority RB Refunding for OSF Healthcare
System Series 2010 A (A/A2) |
|
| 4,955,000 | | | 6.000 | | | 05/15/39 | | | | 5,249,426 | |
| Illinois Finance Authority Recovery Zone Facility RB for
Navistar International Corp. Project Series 2010 (CCC+/Caa1) |
|
| | 15,650,000 | | | 6.500 | | | 10/15/40 | | | | 16,875,395 | |
| Illinois State GO Bonds Pension Funding Series 2003
(BBB-/Baa3) |
|
| | 30,170,000 | | | 5.100 | | | 06/01/33 | | | | 30,510,921 | |
| | Illinois State GO Bonds Series 2010-5 (BBB-/Baa3) | |
| | 7,220,000 | | | 7.350 | | | 07/01/35 | | | | 8,280,185 | |
| | Illinois State GO Bonds Series 2012 (BBB-/Baa3) | |
| | 500,000 | | | 5.000 | | | 03/01/31 | | | | 521,045 | |
| | 750,000 | | | 5.000 | | | 03/01/37 | | | | 772,688 | |
| | Illinois State GO Bonds Series 2013 (BBB-/Baa3) | |
| | 5,050,000 | | | 5.500 | | | 07/01/38 | | | | 5,448,445 | |
| | Illinois State GO Bonds Series 2014 (AGM) (AA/A2) | |
| | 20,000,000 | | | 5.000 | | | 02/01/39 | | | | 21,107,200 | |
| | Illinois State GO Bonds Series 2014 (BBB-/Baa3) | |
| | 9,500,000 | | | 5.000 | | | 04/01/31 | | | | 10,066,485 | |
| | 15,000,000 | | | 5.000 | | | 05/01/31 | | | | 15,904,050 | |
| | 5,000,000 | | | 5.000 | | | 05/01/39 | | | | 5,213,050 | |
| | Illinois State GO Bonds Series 2016 (BBB-/Baa3) | |
| | 4,415,000 | | | 5.000 | | | 11/01/21 | | | | 4,799,193 | |
| | Illinois State GO Refunding Bonds Series 2012 (BBB-/Baa3) | |
| | 7,300,000 | | | 5.000 | | | 08/01/21 | | | | 7,909,185 | |
| | Illinois State GO Refunding Bonds Series 2016 (AGM) (AA/A2) | |
| | 20,175,000 | | | 4.000 | | | 02/01/30 | | | | 20,696,120 | |
| Illinois State Toll Highway Authority Toll Highway
Senior RB 2015 Series A (AA-/Aa3) |
|
| | 7,920,000 | | | 5.000 | | | 01/01/40 | | | | 8,937,007 | |
| Lincolnshire Special Service Area No. 1 Special Tax for
Sedgebrook Project Series 2004 A (NR/NR) |
|
| | 2,105,000 | | | 6.250 | | | 03/01/34 | | | | 2,109,063 | |
| Metropolitan Pier & Exposition Authority RB for McCormick
Place Expansion Project Residual Series 2002 A (NATL-RE)
(A/A3)(b) |
|
| | 9,900,000 | | | 0.000 | | | 06/15/30 | | | | 6,153,048 | |
| Metropolitan Pier & Exposition Authority RB Refunding Capital
Appreciation for McCormick Place Expansion Project
Series 2010 B1 (AGM) (AA/A2)(b) |
|
| | 3,200,000 | | | 0.000 | | | 06/15/44 | | | | 1,035,680 | |
| Metropolitan Pier & Exposition Authority RB Refunding for
Mccormick Place Expansion Dedicated Sales Tax Project
Series 2010 B2 (ST APPROP) (BB+/Ba1) |
|
| | 50,000,000 | | | 5.000 | | | 06/15/50 | | | | 50,247,000 | |
| Plano Special Service Area No. 5 Special Tax for Lakewood
Springs Club Unit 6 Series 2006 (NR/NR)(i) |
|
| | 4,555,000 | | | 6.000 | | | 03/01/36 | | | | 2,915,200 | |
| Quad Cities Regional Economic Development Authority RB for
Augustana College Series 2012 (NR/Baa1) |
|
| | 840,000 | | | 4.750 | | | 10/01/29 | | | | 913,584 | |
| | 1,010,000 | | | 4.750 | | | 10/01/32 | | | | 1,073,287 | |
| Regional Transportation Authority Illinois GO Bonds
Series 2016 A (AA/A2) |
|
| | 7,730,000 | | | 4.000 | | | 06/01/46 | | | | 7,877,179 | |
| | |
| | |
| The accompanying notes are an integral part of these financial statements. | | 51 |
GOLDMAN SACHS HIGH YIELD MUNICIPAL FUND
Schedule of Investments (continued)
September 30, 2017 (Unaudited)
| | | | | | | | | | | | |
Principal
Amount | | | Interest
Rate | | Maturity
Date | | | Value | |
| Municipal Bonds – (continued) | |
| Illinois – (continued) | |
| Southwestern Illinois Development Authority Health Facility RB
for Memorial Group, Inc. Series 2013 (NR/NR)(e) |
|
| $ | 19,200,000 | | | 7.125 % | | | 11/01/23 | | | $ | 25,267,968 | |
| | 5,000,000 | | | 7.625 | | | 11/01/23 | | | | 6,724,250 | |
| Southwestern Illinois Development Authority RB Capital
Appreciation for United States Steel Corporation Project
Series 2012 (AMT) (B/Caa1) |
|
| | 12,505,000 | | | 5.750 | | | 08/01/42 | | | | 12,389,579 | |
| Springfield Illinois Senior Lien Electric RB Refunding
Series 2015 (AGM) (AA/A2) |
|
| | 13,625,000 | | | 4.000 | | | 03/01/40 | | | | 13,905,266 | |
| | State of Illinois GO Bonds Series 2010 (BBB-/Baa3) | |
| | 7,500,000 | | | 5.250 | | | 02/01/28 | | | | 7,667,475 | |
| | State of Illinois GO Bonds Series 2010 A (BBB-/Baa3) | |
| | 3,500,000 | | | 4.000 | | | 01/01/21 | | | | 3,648,085 | |
| | State of Illinois GO Bonds Series 2010-1 (BBB-/Baa3) | |
| | 2,570,000 | | | 6.630 | | | 02/01/35 | | | | 2,880,919 | |
| | | | | | | | | | | | |
| | | | | | | | | | | 770,246,544 | |
| | |
| Indiana – 0.6% | |
| Anderson Indiana Economic Development RB Refunding &
Improvement for Anderson University Project Series 2007
(BB/NR) |
|
| | 1,355,000 | | | 5.000 | | | 10/01/24 | | | | 1,359,106 | |
| | 1,500,000 | | | 5.000 | | | 10/01/32 | | | | 1,504,545 | |
| Gary/Chicago International Airport Authority Airport
Development Zone RB Series 2014 (AMT) (BBB+/NR) |
|
| | 1,300,000 | | | 5.000 | | | 02/01/29 | | | | 1,461,538 | |
| | 1,250,000 | | | 5.250 | | | 02/01/34 | | | | 1,403,675 | |
| | 1,500,000 | | | 5.000 | | | 02/01/39 | | | | 1,639,560 | |
| Indiana Finance Authority Environmental Improvement RB for
United States Steel Corp. Project Series 2012 (AMT) (B/Caa1) |
|
| | 795,000 | | | 5.750 | | | 08/01/42 | | | | 787,662 | |
| Indiana Finance Authority Hospital RB for Indiana University
Health Obligated Group Series 2011 N (AA/Aa2) |
|
| | 2,000,000 | | | 5.125 | | | 03/01/38 | | | | 2,162,420 | |
| Indiana Finance Authority Midwestern Disaster Relief RB for
Ohio Valley Electric Co. Project Series 2012 A (BBB-/Ba1) |
|
| | 6,825,000 | | | 5.000 | | | 06/01/39 | | | | 6,924,918 | |
| Indiana Finance Authority RB for Private Activity for Ohio River
Bridges East End Crossing Project Series 2013 A (AMT)
(BBB/NR) |
|
| | 6,250,000 | | | 5.000 | | | 07/01/48 | | | | 6,726,938 | |
| Indiana Municipal Power Agency Power Supply System RB
Refunding Series 2016 A (A+/A1) |
|
| | 7,750,000 | | | 5.000 | | | 01/01/42 | | | | 8,800,047 | |
| Indianapolis Airport Authority Special Facilities RB for United
Air Lines, Inc. Project Series 1995 A (AMT) (NR/WR)(i) |
|
| | 7,520,823 | | | 6.500 | | | 11/15/31 | | | | 19,554 | |
| | | | | | | | | | | | |
| | | | | | | | | | | 32,789,963 | |
| | |
| Iowa – 0.0% | |
| Pottawattamie County RB Refunding for Christian Homes, Inc.
Series 2007 E (BBB-/NR) |
|
| | 1,355,000 | | | 5.750 | | | 05/15/31 | | | | 1,358,496 | |
| | |
| Municipal Bonds – (continued) | |
| Kentucky – 1.4% | |
| Kentucky Economic Development Finance Authority Hospital RB
for Owensboro Medical Health System, Inc. Series 2010 A
(BBB/Baa3)(e) |
|
| 8,000,000 | | | 6.375 | | | 06/01/20 | | | | 9,090,000 | |
| | 8,250,000 | | | 6.500 | | | 06/01/20 | | | | 9,400,958 | |
| Kentucky Economic Development Finance Authority Hospital RB
Refunding for Owensboro Medical Health System, Inc. Series
2017 A (AGM) (AA/A2) |
|
| | 3,300,000 | | | 4.000 | | | 06/01/37 | | | | 3,393,192 | |
| | 3,000,000 | | | 4.000 | | | 06/01/45 | | | | 2,994,870 | |
| Kentucky Economic Development Finance Authority Hospital RB
Refunding for Owensboro Medical Health System, Inc.
Series 2017 B (AGM) (AA/A2) |
|
| | 1,000,000 | | | 4.000 | | | 06/01/37 | | | | 1,028,240 | |
| Louisville & Jefferson County Metro Government Health System
RB for Norton Healthcare, Inc. Series 2013 A (A-/NR) |
|
| | 5,000,000 | | | 5.750 | | | 10/01/42 | | | | 5,761,100 | |
| Louisville & Jefferson County Metro Government Health System
RB for Norton Healthcare, Inc. Series 2016 A (A-/NR) |
|
| | 17,575,000 | | | 4.000 | | | 10/01/34 | | | | 18,111,037 | |
| | 25,205,000 | | | 4.000 | | | 10/01/36 | | | | 25,798,326 | |
| | | | | | | | | | | | |
| | | | | | | | | | | 75,577,723 | |
| | |
| Louisiana – 3.4% | |
| Louisiana Local Government Environmental Facilities and
Community Development Authority RB for Westlake Chemical
Corp. Projects Series 2010 A-2 (BBB/Baa3) |
|
| | 5,000,000 | | | 6.500 | | | 11/01/35 | | | | 5,636,300 | |
| Louisiana Local Government Environmental Facilities and
Community Development Authority RB for Women’s Hospital
Foundation Project Series 2010 A (A/A2)(e) |
|
| | 19,265,000 | | | 6.000 | | | 10/01/20 | | | | 21,982,906 | |
| Louisiana Local Government Environmental Facilities and
Community Development Authority RB Refunding for Ragin’
Cajun Facilities, Inc. – Student Housing & Parking Project
Series 2017 (AGM) (AA/NR) |
|
| | 2,600,000 | | | 5.000 | | | 10/01/39 | | | | 2,914,860 | |
| | 4,850,000 | | | 4.000 | | | 10/01/41 | | | | 4,974,693 | |
| Louisiana Public Facilities Authority RB Refunding for Energy
LLC Project Series 2016 A (A/A2) |
|
| | 14,475,000 | | | 3.375 | | | 09/01/28 | | | | 14,663,609 | |
| Louisiana Public Facilities Authority RB Refunding for Energy
LLC Project Series 2016 B (A/A2) |
|
| | 13,950,000 | | | 3.500 | | | 06/01/30 | | | | 14,173,479 | |
| Louisiana Public Facilities Authority RB Refunding for Ochsner
Clinic Foundation Project Series 2017 (A-/A3) |
|
| | 12,725,000 | | | 4.000 | | | 05/15/42 | | | | 12,917,784 | |
| | 4,825,000 | | | 5.000 | | | 05/15/42 | | | | 5,403,132 | |
| | 21,250,000 | | | 5.000 | | | 05/15/46 | | | | 23,704,375 | |
| New Orleans Aviation Board General Airport RB for North
Terminal Project Series 2015 B (AMT) (A-/A3) |
|
| | 18,500,000 | | | 5.000 | | | 01/01/40 | | | | 20,675,230 | |
| | 32,395,000 | | | 5.000 | | | 01/01/45 | | | | 36,004,451 | |
| New Orleans Aviation Board General Airport RB for North
Terminal Project Series 2017 B (AMT) (A-/A3) |
|
| | 4,850,000 | | | 5.000 | | | 01/01/48 | | | | 5,469,103 | |
| | |
| | |
| 52 | | The accompanying notes are an integral part of these financial statements. |
GOLDMAN SACHS HIGH YIELD MUNICIPAL FUND
| | | | | | | | | | | | |
Principal
Amount | | | Interest
Rate | | Maturity
Date | | | Value | |
| Municipal Bonds – (continued) | |
| Louisiana – (continued) | |
| New Orleans Aviation Board Gulf Opportunity Zone RB for
Consolidated Rental Car Project Series 2009 A (A-/Baa1) |
|
| $ | 7,470,000 | | | 6.500 % | | | 01/01/40 | | | $ | 7,857,095 | |
| | | | | | | | | | | | |
| | | | | | | | | | | 176,377,017 | |
| | |
| Maryland – 1.0% | |
| Baltimore Maryland RB Refunding for Convention Center Hotel
Project Series 2017 (BBB-/NR) |
|
| | 2,000,000 | | | 5.000 | | | 09/01/39 | | | | 2,269,080 | |
| | 1,725,000 | | | 5.000 | | | 09/01/42 | | | | 1,944,696 | |
| | 3,500,000 | | | 5.000 | | | 09/01/46 | | | | 3,936,380 | |
| Baltimore Maryland Special Obligation Refunding for Baltimore
Research Park Project Series 2017 A (NR/NR) |
|
| | 2,950,000 | | | 4.500 | | | 09/01/33 | | | | 3,042,778 | |
| | 1,500,000 | | | 5.000 | | | 09/01/38 | | | | 1,593,915 | |
| Frederick County Maryland Educational Facilities RB for Mount
St. Mary’s University Series 2007 (BB+/Ba2) |
|
| | 2,590,000 | | | 5.000 | | | 09/01/30 | | | | 2,590,984 | |
| Frederick County Maryland Special Tax Limited Obligations
Bonds for Jefferson Technology Park Series 2013 A (NR/NR) |
|
| | 2,980,000 | | | 7.250 | | | 07/01/43 | | | | 3,146,522 | |
| Frederick County Maryland Tax Incremental & Special Tax
Limited Obligations Bonds for Jefferson Technology Park
Series 2013 B (NR/NR) |
|
| | 8,850,000 | | | 7.125 | | | 07/01/43 | | | | 9,635,349 | |
| Maryland Stadium Authority RB for Baltimore City Public
Schools Construction & Revitalization Program Series 2016
(AA-/Aa3) |
|
| | 10,000,000 | | | 5.000 | | | 05/01/46 | | | | 11,308,600 | |
| Maryland State Health & Higher Educational Facilities Authority
RB for Doctors Community Hospital Series 2010 (NR/Baa3)(e) |
|
| | 9,500,000 | | | 5.750 | | | 07/01/20 | | | | 10,671,540 | |
| Maryland State Health & Higher Educational Facilities Authority
RB for Mercy Medical Center Series 2012 (BBB/Baa2) |
|
| | 2,100,000 | | | 5.000 | | | 07/01/31 | | | | 2,272,767 | |
| | | | | | | | | | | | |
| | | | | | | | | | | 52,412,611 | |
| | |
| Massachusetts – 0.5% | |
| Massachusetts Development Finance Agency RB for Simmons
College Issue Series 2015 K-1 (BBB+/Baa1) |
|
| | 1,950,000 | | | 5.000 | | | 10/01/36 | | | | 2,246,342 | |
| Massachusetts Development Finance Agency RB for Suffolk
University Issue Series 2009 A (BBB/Baa2) |
|
| | 4,215,000 | | | 5.750 | | | 07/01/39 | | | | 4,501,789 | |
| Massachusetts Development Finance Agency RB for Suffolk
University Issue Series 2009 A (NR/NR)(e) |
|
| | 8,285,000 | | | 5.750 | | | 07/01/19 | | | | 8,957,659 | |
| Massachusetts Development Finance Agency RB Series 2013 A
(NR/NR)(f) |
|
| | 2,250,000 | | | 6.500 | | | 11/15/43 | | | | 2,538,112 | |
| Massachusetts State GO Bonds Consolidated Loan Series 2007 A
(NATL-RE FGIC) (AA/Aa1)(c) |
|
| | 4,970,000 | | | (3 Mo. LIBOR +
0.57%, 20.00% Cap), 1.448 | | | 05/01/37 | | | | 4,684,374 | |
| | |
| Municipal Bonds – (continued) | |
| Massachusetts – (continued) | |
| Massachusetts State GO Bonds Consolidated Loan Series 2012 A
(BHAC-CR) (AA+/Aa1)(c) |
|
| 2,950,000 | | | (3 Mo. LIBOR +
0.57%, 20.00% Cap), 1.448% | | | 05/01/37 | | | | 2,831,410 | |
| | | | | | | | | | | | |
| | | | | | | | | | | 25,759,686 | |
| | |
| Michigan – 1.4% | |
| | City of Detroit Financial Recovery Series 2014 B-1 (NR/NR)(h) | |
| | 6,475,000 | | | 4.000 | | | 04/01/44 | | | | 4,407,273 | |
| | City of Detroit Financial Recovery Series 2014 C (NR/NR) | |
| | 12,850,000 | | | 5.000 | | | 12/10/26 | | | | 12,233,843 | |
| Detroit Michigan School District GO Bonds for School Building
and Site Improvement Series 2002 A (FGIC-Q-SBLF)
(AA-/Aa1) |
|
| | 3,500,000 | | | 6.000 | | | 05/01/20 | | | | 3,891,090 | |
| | 3,000,000 | | | 6.000 | | | 05/01/21 | | | | 3,439,140 | |
| Detroit Michigan Sewage Disposal System RB Refunding Series
2006 D (AGM) (AA/A2)(c) |
|
| | 4,675,000 | | | (3 Mo. LIBOR +
0.60%, 15.00% Cap), 1.470 | | | 07/01/32 | | | | 4,249,575 | |
| Detroit Michigan Water & Sewerage Department Sewage
Disposal System RB Refunding Senior Lien Series 2012 A
(A-/A3) |
|
| | 2,000,000 | | | 5.250 | | | 07/01/39 | | | | 2,200,320 | |
| Michigan Finance Authority Local Government Loan Program
RB Refunding for Detroit Financial Recovery Income Tax
Local Project Series 2014 F (A/NR) |
|
| | 2,000,000 | | | 4.500 | | | 10/01/29 | | | | 2,100,320 | |
| Michigan Finance Authority Local Government Loan Program
RB Refunding for Detroit Water and Sewer Department
Sewage Disposal System Second Lien Local Project
Series 2015 C (BBB+/Baa1) |
|
| | 355,000 | | | 5.000 | | | 07/01/33 | | | | 399,286 | |
| Michigan Finance Authority Local Government Loan Program
RB Refunding for Detroit Water and Sewer Series 2014 D-1
(AGM) (AA/A2) |
|
| | 2,600,000 | | | 5.000 | | | 07/01/35 | | | | 2,923,700 | |
| Michigan Finance Authority Local Government Loan Program
RB Refunding for Detroit Water and Sewerage Department
Sewage Disposal System Local Project Senior Lien
Series 2014 C-3 (AGM) (AA/A2) |
|
| | 2,175,000 | | | 5.000 | | | 07/01/32 | | | | 2,471,431 | |
| | 1,750,000 | | | 5.000 | | | 07/01/33 | | | | 1,980,457 | |
| Michigan Finance Authority Local Government Loan Program
RB Refunding for Detroit Water and Sewerage Department
Water Supply System Series 2015 D-1 (A-/A3) |
|
| | 1,250,000 | | | 5.000 | | | 07/01/34 | | | | 1,399,562 | |
| | 750,000 | | | 5.000 | | | 07/01/35 | | | | 838,103 | |
| Michigan Finance Authority Local Government Loan Program
RB Refunding for Detroit Water and Sewerage Department
Water Supply System Series 2015 D-2 (BBB+/Baa1) |
|
| | 2,100,000 | | | 5.000 | | | 07/01/34 | | | | 2,346,687 | |
| Michigan Tobacco Settlement Finance Authority Asset Backed
RB Senior Series 2007 A (B-/NR) |
|
| | 3,330,000 | | | 6.000 | | | 06/01/48 | | | | 3,329,967 | |
| | |
| | |
| The accompanying notes are an integral part of these financial statements. | | 53 |
GOLDMAN SACHS HIGH YIELD MUNICIPAL FUND
Schedule of Investments (continued)
September 30, 2017 (Unaudited)
| | | | | | | | | | | | |
Principal
Amount | | | Interest
Rate | | Maturity
Date | | | Value | |
| Municipal Bonds – (continued) | |
| Michigan – (continued) | |
| Michigan Tobacco Settlement Finance Authority RB for Capital
Appreciation Series 2007 B (CCC+/NR)(b) |
|
| $ | 238,600,000 | | | 0.000 % | | | 06/01/52 | | | $ | 14,721,620 | |
| Michigan Tobacco Settlement Finance Authority RB for Capital
Appreciation Series 2007 C (CCC/NR)(b) |
|
| | 180,100,000 | | | 0.000 | | | 06/01/52 | | | | 10,123,421 | |
| | | | | | | | | | | | |
| | | | | | | | | | | 73,055,795 | |
| | |
| Minnesota – 0.2% | |
| Duluth Economic Development Authority Health Care Facilities
RB for St. Luke’s Hospital Series 2012 (NR/NR) |
|
| | 2,500,000 | | | 5.750 | | | 06/15/32 | | | | 2,740,550 | |
| | 3,750,000 | | | 6.000 | | | 06/15/39 | | | | 4,168,275 | |
| Minnesota Higher Education Facilities Authority RB Refunding
for Bethel University Project Series 2017 (BBB-/NR) |
|
| | 2,400,000 | | | 5.000 | | | 05/01/47 | | | | 2,661,864 | |
| | | | | | | | | | | | |
| | | | | | | | | | | 9,570,689 | |
| | |
| Mississippi – 0.0% | |
| Mississippi Business Finance Corp. Solid Waste Disposal RB for
Waste Pro USA, Inc. Project Series 2017 (AMT)
(NR/NR)(f)(g)(h) |
|
| | 2,000,000 | | | 5.000 | | | 08/01/22 | | | | 2,048,060 | |
| | |
| Missouri – 0.1% | |
| Branson Regional Airport Transportation Development District
RB for Branson Regional Airport Series 2007 A (NR/NR)(i) |
|
| | 1,535,000 | | | 6.000 | | | 07/01/37 | | | | 82,890 | |
| Branson Regional Airport Transportation Development District
RB for Branson Regional Airport Series 2007 B (AMT)
(NR/NR)(i) |
|
| | 7,750,000 | | | 6.000 | | | 07/01/25 | | | | 418,500 | |
| Cape Girardeau County IDA Health Facilities RB Refunding for
South Eastern Health Series 2017 A (BBB-/Baa3) |
|
| | 1,925,000 | | | 5.000 | | | 03/01/36 | | | | 2,119,078 | |
| Kansas City Missouri Industrial Development Authority Senior
Sales Tax RB Refunding and Improvement Bonds for Ward
Parkway Center Community Improvement District
Series 2016 A (NR/NR)(f) |
|
| | 1,000,000 | | | 5.000 | | | 04/01/36 | | | | 972,950 | |
| | 1,150,000 | | | 5.000 | | | 04/01/46 | | | | 1,085,071 | |
| Stone Canyon Community Improvement District RB for Public
Infrastructure Improvement Project Series 2007 (NR/NR)(i) |
|
| | 1,250,000 | | | 5.750 | | | 04/01/27 | | | | 312,500 | |
| | | | | | | | | | | | |
| | | | | | | | | | | 4,990,989 | |
| | |
| Nevada – 0.3% | |
| City of Las Vegas Special Improvement District No. 607 for
Local Improvement Refunding Series 2013 (NR/NR) |
|
| | 645,000 | | | 4.000 | | | 06/01/18 | | | | 650,141 | |
| | 710,000 | | | 4.000 | | | 06/01/19 | | | | 723,710 | |
| | 600,000 | | | 4.000 | | | 06/01/20 | | | | 617,856 | |
| | 765,000 | | | 4.000 | | | 06/01/21 | | | | 792,655 | |
| | 415,000 | | | 5.000 | | | 06/01/22 | | | | 449,524 | |
| | 370,000 | | | 5.000 | | | 06/01/23 | | | | 402,023 | |
| | 200,000 | | | 4.250 | | | 06/01/24 | | | | 207,030 | |
| | 250,000 | | | 5.000 | | | 06/01/24 | | | | 270,552 | |
| | |
| Municipal Bonds – (continued) | |
| Nevada – (continued) | |
| City of Las Vegas Special Improvement District No. 813 for
Summerlin Village 26 Local Improvement Bonds Series 2017
(NR/NR) |
|
| 325,000 | | | 4.250 | | | 06/01/37 | | | | 320,298 | |
| | 475,000 | | | 4.375 | | | 06/01/42 | | | | 468,972 | |
| | 550,000 | | | 4.500 | | | 06/01/47 | | | | 549,076 | |
| Henderson Local Improvement District No. T-16 Special
Assessment Limited Obligation Series 2005 (NR/NR) |
|
| | 1,925,000 | | | 5.000 | | | 03/01/20 | | | | 1,901,534 | |
| | 1,925,000 | | | 5.100 | | | 03/01/21 | | | | 1,894,508 | |
| | 1,005,000 | | | 5.100 | | | 03/01/22 | | | | 981,523 | |
| | 2,700,000 | | | 5.125 | | | 03/01/25 | | | | 2,592,459 | |
| Henderson Local Improvement District No. T-18 Limited
Obligation Series 2016 (NR/NR) |
|
| | 2,200,000 | | | 4.000 | | | 09/01/35 | | | | 2,158,508 | |
| | | | | | | | | | | | |
| | | | | | | | | | | 14,980,369 | |
| | |
| New Jersey – 5.7% | |
| Atlantic City Tax Appeal Refunding Bonds Series 2017 A (BAM)
(ST AID WITHHLDG) (AA/Baa1) |
|
| | 725,000 | | | 5.000 | | | 03/01/32 | | | | 834,120 | |
| | 965,000 | | | 5.000 | | | 03/01/37 | | | | 1,087,603 | |
| | 1,205,000 | | | 5.000 | | | 03/01/42 | | | | 1,347,805 | |
| New Jersey Economic Development Authority Cigarette Tax RB
Refunding Series 2012 (BBB+/Baa1) |
|
| | 2,500,000 | | | 5.000 | | | 06/15/26 | | | | 2,706,150 | |
| | 1,000,000 | | | 5.000 | | | 06/15/28 | | | | 1,075,210 | |
| New Jersey Economic Development Authority Energy Facilities
RB for UMM Energy Partners, LLC Project Series 2012 A
(AMT) (NR/Baa3) |
|
| | 1,000,000 | | | 4.750 | | | 06/15/32 | | | | 1,041,800 | |
| | 1,000,000 | | | 5.000 | | | 06/15/37 | | | | 1,041,970 | |
| | 1,000,000 | | | 5.125 | | | 06/15/43 | | | | 1,044,660 | |
| New Jersey Economic Development Authority Private Activity
RB for Goethals Bridge Replacement Project Series 2013
(AMT) (BBB-/NR) |
|
| | 1,000,000 | | | 5.375 | | | 01/01/43 | | | | 1,110,810 | |
| New Jersey Economic Development Authority RB for Provident
Group – Kean Properties L.L.C. – Kean University Student
Housing Project Series 2017 A (BBB-/NR) |
|
| | 500,000 | | | 5.000 | | | 07/01/37 | | | | 540,700 | |
| | 1,150,000 | | | 5.000 | | | 07/01/47 | | | | 1,236,227 | |
| | 1,175,000 | | | 5.000 | | | 01/01/50 | | | | 1,258,413 | |
| New Jersey Economic Development Authority RB for School
Facilities Construction Series 2009 BB (BBB+/Baa1)(e) |
|
| | 1,640,000 | | | 5.000 | | | 09/01/19 | | | | 1,760,622 | |
| New Jersey Economic Development Authority RB for School
Facilities Construction Series 2016 AAA (BBB+/Baa1) |
|
| | 4,500,000 | | | 5.000 | | | 06/15/41 | | | | 4,811,085 | |
| New Jersey Economic Development Authority Special Facilities
RB for Continental Airlines, Inc. Project Series 1998 (AMT)
(BB-/Ba3) |
|
| | 7,500,000 | | | 5.500 | | | 04/01/28 | | | | 7,525,200 | |
| New Jersey Economic Development Authority Special Facilities
RB for Continental Airlines, Inc. Project Series 1999 (AMT)
(BB-/Ba3) |
|
| | 8,500,000 | | | 5.250 | | | 09/15/29 | | | | 9,291,520 | |
| | |
| | |
| 54 | | The accompanying notes are an integral part of these financial statements. |
GOLDMAN SACHS HIGH YIELD MUNICIPAL FUND
| | | | | | | | | | | | |
Principal
Amount | | | Interest
Rate | | Maturity
Date | | | Value | |
| Municipal Bonds – (continued) | |
| New Jersey – (continued) | |
| New Jersey Economic Development Authority Special Facilities
RB for Continental Airlines, Inc. Project Series 2000 A (AMT)
(BB-/Ba3) |
|
| $ | 5,000,000 | | | 5.625 % | | | 11/15/30 | | | $ | 5,698,850 | |
| New Jersey Economic Development Authority Special Facilities
RB for Continental Airlines, Inc. Project Series 2000 B (AMT)
(BB-/Ba3) |
|
| | 5,000,000 | | | 5.625 | | | 11/15/30 | | | | 5,698,850 | |
| New Jersey Health Care Facilities Financing Authority RB
Refunding for University Hospital Series 2015 A (AGM)
(AA/A2) |
|
| | 9,700,000 | | | 4.125 | | | 07/01/38 | | | | 10,154,639 | |
| | 5,600,000 | | | 5.000 | | | 07/01/46 | | | | 6,233,528 | |
| New Jersey Health Care Facilities Financing Authority RB
Refunding for Trinitas Regional Medical Center Series 2017 A
(BBB/Baa2) |
|
| | 1,000,000 | | | 5.000 | | | 07/01/28 | | | | 1,151,120 | |
| | 1,000,000 | | | 5.000 | | | 07/01/29 | | | | 1,144,510 | |
| | 900,000 | | | 5.000 | | | 07/01/30 | | | | 1,022,670 | |
| New Jersey Transportation Trust Fund Authority RB Capital
Appreciation for Transportation System Bonds Series 2006 C
(AMBAC) (BBB+/Baa1)(b) |
|
| | 119,365,000 | | | 0.000 | | | 12/15/35 | | | | 54,833,894 | |
| | 62,370,000 | | | 0.000 | | | 12/15/36 | | | | 27,196,438 | |
| New Jersey Transportation Trust Fund Authority RB Capital
Appreciation for Transportation System Bonds Series 2008 A
(BBB+/Baa1)(b) |
|
| | 46,545,000 | | | 0.000 | | | 12/15/35 | | | | 20,450,942 | |
| | 1,320,000 | | | 0.000 | | | 12/15/38 | | | | 494,023 | |
| New Jersey Transportation Trust Fund Authority RB Capital
Appreciation for Transportation System Bonds Series 2010 A
(BBB+/Baa1)(b) |
|
| | 8,805,000 | | | 0.000 | | | 12/15/28 | | | | 5,607,200 | |
| | 1,900,000 | | | 0.000 | | | 12/15/34 | | | | 880,802 | |
| | 4,875,000 | | | 0.000 | | | 12/15/36 | | | | 2,028,244 | |
| New Jersey Transportation Trust Fund Authority RB for Federal
Highway Reimbursement Notes Subseries 2016 A-1 (A+/Baa1) |
|
| | 3,000,000 | | | 5.000 | | | 06/15/29 | | | | 3,344,370 | |
| | 3,335,000 | | | 5.000 | | | 06/15/30 | | | | 3,696,681 | |
| New Jersey Transportation Trust Fund Authority RB for
Transportation Program Bonds Series 2014 AA (BBB+/Baa1) |
|
| | 26,070,000 | | | 5.000 | | | 06/15/38 | | | | 27,697,550 | |
| New Jersey Transportation Trust Fund Authority RB for
Transportation Program Bonds Series 2015 AA (BBB+/Baa1) |
|
| | 2,500,000 | | | 5.250 | | | 06/15/41 | | | | 2,696,600 | |
| | 5,075,000 | | | 5.000 | | | 06/15/45 | | | | 5,366,812 | |
| | 1,750,000 | | | 5.000 | | | 06/15/46 | | | | 1,849,435 | |
| New Jersey Transportation Trust Fund Authority RB for
Transportation System Bonds Series 2006 C (AGM) (AA/A2)(b) |
|
| | 11,150,000 | | | 0.000 | | | 12/15/33 | | | | 5,860,551 | |
| | 25,400,000 | | | 0.000 | | | 12/15/34 | | | | 12,701,778 | |
| New Jersey Transportation Trust Fund Authority RB for
Transportation System Bonds Series 2006 C (NATL-RE)
(A/A3)(b) |
|
| | 25,900,000 | | | 0.000 | | | 12/15/27 | | | | 17,748,234 | |
| | 10,055,000 | | | 0.000 | | | 12/15/30 | | | | 5,953,566 | |
| | |
| Municipal Bonds – (continued) | |
| New Jersey – (continued) | |
| New Jersey Transportation Trust Fund Authority RB for
Transportation System Bonds Series 2011 B (BBB+/Baa1) |
|
| 12,875,000 | | | 5.000 | | | 06/15/42 | | | | 13,448,066 | |
| New Jersey Transportation Trust Fund Authority RB for
Transportation System Series 2009 A (BBB+/Baa1)(b) |
|
| | 2,550,000 | | | 0.000 | | | 12/15/33 | | | | 1,247,970 | |
| | 740,000 | | | 0.000 | | | 12/15/39 | | | | 262,693 | |
| New Jersey Transportation Trust Fund Authority RB for
Transportation System Series 2011 A (ST APPROP)
(BBB+/Baa1) |
|
| | 4,350,000 | | | 5.500 | | | 06/15/41 | | | | 4,641,450 | |
| Newark New Jersey Housing Authority RB for South Ward
Police Facility Series 2009 A (ASSURED GTY) (NR/A3)(e) |
|
| | 2,000,000 | | | 6.750 | | | 12/01/19 | | | | 2,242,460 | |
| Tobacco Settlement Financing Corp. RB Senior Asset-Backed
Bonds for Capital Appreciation Series 2007 1-A (BB-/B3) |
|
| | 3,950,000 | | | 4.750 | | | 06/01/34 | | | | 3,865,194 | |
| Tobacco Settlement Financing Corp. Tobacco Settlement Asset-
Backed Bonds Series 2007 1-A (B/B3) |
|
| | 8,900,000 | | | 5.000 | | | 06/01/41 | | | | 8,623,388 | |
| | | | | | | | | | | | |
| | | | | | | | | | | 301,556,403 | |
| | |
| New Mexico – 0.3% | |
| Farmington New Mexico PCRB Refunding for Public Service Co.
of New Mexico San Juan Project Series 2010 D (BBB+/Baa2) |
|
| | 14,000,000 | | | 5.900 | | | 06/01/40 | | | | 15,293,320 | |
| Farmington New Mexico PCRB Refunding for Public Service Co.
of New Mexico San Juan Project Series 2010 F (AMT)
(BBB+/Baa2) |
|
| | 1,500,000 | | | 6.250 | | | 06/01/40 | | | | 1,654,080 | |
| | | | | | | | | | | | |
| | | | | | | | | | | 16,947,400 | |
| | |
| New York – 2.3% | |
| Brooklyn Arena Local Development Corp. Pilot RB Refunding
for Barclays Center Series 2016 A (AGM) (AA/A2) |
|
| | 1,240,000 | | | 3.000 | | | 07/15/43 | | | | 1,165,414 | |
| Brooklyn Arena Local Development Corp. Pilot RB Refunding
for Barclays Center Series 2016 A (BBB-/Baa3) |
|
| | 5,925,000 | | | 5.000 | | | 07/15/42 | | | | 6,679,015 | |
| Chautauqua County Industrial Development Agency Exempt
Facility RB for Dunkirk NRG Power Project Series 2009
(BB+/Baa3) |
|
| | 2,650,000 | | | 5.875 | | | 04/01/42 | | | | 2,769,436 | |
| Hempstead Town Local Development Corp. RB Refunding for
Molloy College Project Series 2017 (BBB/NR) |
|
| | 645,000 | | | 5.000 | | | 07/01/30 | | | | 757,436 | |
| | 865,000 | | | 5.000 | | | 07/01/33 | | | | 999,127 | |
| | 815,000 | | | 5.000 | | | 07/01/35 | | | | 933,265 | |
| | 640,000 | | | 5.000 | | | 07/01/36 | | | | 731,725 | |
| | 455,000 | | | 5.000 | | | 07/01/38 | | | | 519,391 | |
| New York City Capital Resource Corp. RB for YMCA of Greater
New York Project Series 2015 (A-/Baa1) |
|
| | 1,000,000 | | | 5.000 | | | 08/01/40 | | | | 1,109,110 | |
| New York City Housing Development Corp. Multi-Family
Mortgage RB for 8 Spruce Street Series 2014 F (NR/NR) |
|
| | 2,000,000 | | | 4.500 | | | 02/15/48 | | | | 2,087,180 | |
| | |
| | |
| The accompanying notes are an integral part of these financial statements. | | 55 |
GOLDMAN SACHS HIGH YIELD MUNICIPAL FUND
Schedule of Investments (continued)
September 30, 2017 (Unaudited)
| | | | | | | | | | | | |
Principal
Amount | | | Interest
Rate | | Maturity
Date | | | Value | |
| Municipal Bonds – (continued) | |
| New York – (continued) | |
| New York City Industrial Development Agency PILOT RB for
Queens Baseball Stadium Project Series 2009 (ASSURED
GTY) (AA/A3) |
|
| $ | 1,000,000 | | | 6.125 % | | | 01/01/29 | | | $ | 1,058,580 | |
| | 3,000,000 | | | 6.375 | | | 01/01/39 | | | | 3,190,350 | |
| | 5,000,000 | | | 6.500 | | | 01/01/46 | | | | 5,309,500 | |
| New York Convention Center Development Corporation RB
Refunding for Hotel Unit Fee Secured Series 2015 (NR/Aa3) |
|
| | 5,000,000 | | | 5.000 | | | 11/15/40 | | | | 5,734,900 | |
| New York Liberty Development Corporation RB for 3 World
Trade Center Project Series 2014 (NR/NR)(f) |
|
| | 8,200,000 | | | 5.000 | | | 11/15/44 | | | | 8,920,124 | |
| New York Transportation Development Corp. Special Facility RB
for Laguardia Airport Terminal B Redevelopment Project
Series 2016 A (AMT) (AGM) (AA/A2) |
|
| | 5,000,000 | | | 4.000 | | | 07/01/35 | | | | 5,209,900 | |
| New York Transportation Development Corp. Special Facility RB
for Laguardia Airport Terminal B Redevelopment Project
Series 2016 A (AMT) (BBB/Baa3) |
|
| | 9,480,000 | | | 4.000 | | | 07/01/33 | | | | 9,872,093 | |
| | 5,000,000 | | | 5.000 | | | 07/01/34 | | | | 5,553,050 | |
| New York Transportation Development Corp. Special Facility RB
Refunding for Laguardia Airport Terminal B Redevelopment
Project Series 2016 A (AMT) (AGM) (AA/A2) |
|
| | 12,600,000 | | | 4.000 | | | 01/01/51 | | | | 12,868,506 | |
| New York Transportation Development Corp. Special Facility RB
Refunding for Laguardia Airport Terminal B Redevelopment
Project Series 2016 A (AMT) (BBB/Baa3) |
|
| | 4,540,000 | | | 5.000 | | | 07/01/41 | | | | 4,994,409 | |
| | 25,500,000 | | | 5.250 | | | 01/01/50 | | | | 28,288,170 | |
| | Newburgh New York GO Serial Bonds Series 2012 A (NR/Baa2) | |
| | 1,565,000 | | | 5.750 | | | 06/15/35 | | | | 1,734,896 | |
| Onondaga Civic Development Corp. RB for St. Joseph’s Hospital
Health Center Project Series 2014 A (NR/WR)(e) |
|
| | 1,750,000 | | | 5.125 | | | 07/01/19 | | | | 1,874,180 | |
| Troy City Capital Resource Corp. RB for Rensselaer Polytechnic
Institute Project Series 2010 A (BBB+/A3) |
|
| | 5,000,000 | | | 5.125 | | | 09/01/40 | | | | 5,455,950 | |
| Westchester County Local Development Corporation RB for
Westchester Medical Center Obligated Group Project Series
2016 (BBB/Baa2) |
|
| | 4,375,000 | | | 5.000 | | | 11/01/46 | | | | 4,739,306 | |
| | | | | | | | | | | | |
| | | | | | | | | | | 122,555,013 | |
| | |
| North Carolina – 0.2% | |
| Columbus County Industrial Facilities and Pollution Control
Financing Authority Recovery Zone Facility RB Series 2010 A
(BBB/Baa2) |
|
| | 1,000,000 | | | 5.700 | | | 05/01/34 | | | | 1,099,650 | |
| North Carolina Medical Care Commission Health Care Facilities
RB Refunding First Mortgage for Lutheran Services for the
Aging Series 2012 A (NR/NR) |
|
| | 3,800,000 | | | 4.750 | | | 03/01/32 | | | | 4,000,412 | |
| | 1,000,000 | | | 5.000 | | | 03/01/37 | | | | 1,060,790 | |
| | 1,000,000 | | | 5.000 | | | 03/01/42 | | | | 1,056,180 | |
| | |
| Municipal Bonds – (continued) | |
| North Carolina – (continued) | |
| North Carolina Medical Care Commission Retirement Facilities
RB Refunding First Mortgage for United Church Homes and
Services Series 2015 A (NR/NR) |
|
| 1,000,000 | | | 4.500 | | | 09/01/30 | | | | 1,020,720 | |
| | 2,000,000 | | | 5.000 | | | 09/01/37 | | | | 2,076,800 | |
| | | | | | | | | | | | |
| | | | | | | | | | | 10,314,552 | |
| | |
| Ohio – 5.2% | |
| Bowling Green City Student Housing RB for CFP I LLC –
Bowling Green State University Project Series 2010
(BBB-/NR)(e) |
|
| | 7,000,000 | | | 6.000 | | | 06/01/20 | | | | 7,865,480 | |
| Buckeye Ohio Tobacco Settlement Financing Authority RB
Asset-Backed Bonds for Capital Appreciation 1st Subordinate
Series 2007 B (BBB+/NR)(b) |
|
| | 146,850,000 | | | 0.000 | | | 06/01/47 | | | | 9,739,092 | |
| Buckeye Ohio Tobacco Settlement Financing Authority RB
Asset-Backed Bonds for Capital Appreciation 2nd Subordinate
Series 2007 C (NR/NR)(b) |
|
| | 255,550,000 | | | 0.000 | | | 06/01/52 | | | | 8,072,825 | |
| Buckeye Ohio Tobacco Settlement Financing Authority RB
Senior Turbo Asset-Backed Bonds Series 2007 A-2 (B-/B3) |
|
| | 20,000,000 | | | 6.500 | | | 06/01/47 | | | | 20,021,200 | |
| | 2,440,000 | | | 5.875 | | | 06/01/47 | | | | 2,329,590 | |
| Buckeye Ohio Tobacco Settlement Financing Authority RB
Senior Turbo Asset-Backed Bonds Series 2007 A-2 (B-/Caa1) |
|
| | 70,300,000 | | | 5.125 | | | 06/01/24 | | | | 66,587,457 | |
| | 63,565,000 | | | 5.875 | | | 06/01/30 | | | | 61,656,779 | |
| | 4,420,000 | | | 5.750 | | | 06/01/34 | | | | 4,254,692 | |
| Buckeye Ohio Tobacco Settlement Financing Authority RB
Senior Turbo Asset-Backed Bonds Series 2007 A-3 (B-/Caa1) |
|
| | 23,905,000 | | | 6.250 | | | 06/01/37 | | | | 23,715,672 | |
| Centerville Ohio Health Care RB Refunding and Improvement for
Graceworks Lutheran Services Series 2017 (NR/NR) |
|
| | 2,400,000 | | | 5.250 | | | 11/01/37 | | | | 2,570,592 | |
| | 2,700,000 | | | 5.250 | | | 11/01/47 | | | | 2,860,272 | |
| | 2,320,000 | | | 5.250 | | | 11/01/50 | | | | 2,451,938 | |
| Cleveland Airport Special RB for Continental Airlines, Inc.
Project Series 1998 (AMT) (BB-/Ba3) |
|
| | 22,320,000 | | | 5.375 | | | 09/15/27 | | | | 22,388,969 | |
| Cuyahoga County Ohio Hospital RB Refunding for Metrohealth
System Series 2017 (BBB-/Baa3) |
|
| | 6,250,000 | | | 5.000 | | | 02/15/37 | | | | 6,728,938 | |
| | 7,500,000 | | | 5.000 | | | 02/15/42 | | | | 7,984,200 | |
| | 7,500,000 | | | 4.750 | | | 02/15/47 | | | | 7,624,425 | |
| | 1,500,000 | | | 5.000 | | | 02/15/57 | | | | 1,568,355 | |
| | 1,000,000 | | | 5.500 | | | 02/15/57 | | | | 1,096,510 | |
| Hamilton County Health Care RB Refunding for Life Enriching
Community Project Series 2012 (BBB/NR) |
|
| | 2,000,000 | | | 5.000 | | | 01/01/42 | | | | 2,125,740 | |
| | 1,610,000 | | | 5.000 | | | 01/01/46 | | | | 1,707,276 | |
| Muskingum County Hospital Facilities RB Refunding for Genesis
Healthcare System Project Series 2013 (BB+/Ba2) |
|
| | 8,000,000 | | | 5.000 | | | 02/15/48 | | | | 8,315,920 | |
| | | | | | | | | | | | |
| | | | | | | | | | | 271,665,922 | |
| | |
| | |
| 56 | | The accompanying notes are an integral part of these financial statements. |
GOLDMAN SACHS HIGH YIELD MUNICIPAL FUND
| | | | | | | | | | | | |
Principal
Amount | | | Interest
Rate | | Maturity
Date | | | Value | |
| Municipal Bonds – (continued) | |
| Oklahoma – 1.1% | |
| Oklahoma Development Finance Authority RB Provident
Oklahoma Education Resources Inc., Cross Village Student
Housing Project Series 2017 A (BBB-/NR) |
|
| $ | 6,220,000 | | | 5.000 % | | | 08/01/47 | | | $ | 6,800,388 | |
| | 14,075,000 | | | 5.000 | | | 08/01/52 | | | | 15,125,839 | |
| | 3,875,000 | | | 5.250 | | | 08/01/57 | | | | 4,209,374 | |
| Tulsa Municipal Airport Trust RB Refunding for American
Airlines, Inc. Series 2001 A (AMT) (NR/NR) |
|
| | 2,680,000 | | | 5.500 | | | 12/01/35 | | | | 2,914,232 | |
| Tulsa Municipal Airport Trust RB Refunding for American
Airlines, Inc. Series 2001 B (AMT) (NR/NR) |
|
| | 24,300,000 | | | 5.500 | | | 12/01/35 | | | | 26,423,820 | |
| Tulsa Municipal Airport Trust RB Refunding for American
Airlines, Inc. Series 2015 (AMT) (BB-/NR)(g)(h) |
|
| | 3,500,000 | | | 5.000 | | | 06/01/25 | | | | 3,830,260 | |
| | | | | | | | | | | | |
| | | | | | | | | | | 59,303,913 | |
| | |
| Oregon – 0.2% | |
| | University of Oregon RB Series 2015 A (AA-/Aa2) | |
| | 7,345,000 | | | 5.000 | | | 04/01/45 | | | | 8,340,248 | |
| | |
| Pennsylvania – 2.9% | |
| Allegheny County Higher Education Building Authority RB for
Chatham University Series 2012 A (BBB/NR) |
|
| | 1,500,000 | | | 5.000 | | | 09/01/30 | | | | 1,641,450 | |
| | 1,000,000 | | | 5.000 | | | 09/01/35 | | | | 1,064,850 | |
| Allentown Neighborhood Improvement Zone Development
Authority Tax RB for City Center Refunding Project
Series 2017 (NR/Ba1)(f) |
|
| | 2,000,000 | | | 5.000 | | | 05/01/27 | | | | 2,286,040 | |
| | 1,400,000 | | | 5.000 | | | 05/01/32 | | | | 1,551,564 | |
| | 6,950,000 | | | 5.000 | | | 05/01/42 | | | | 7,458,184 | |
| Allentown Neighborhood Improvement Zone Development
Authority Tax RB Series 2012 A (NR/Baa2) |
|
| | 18,000,000 | | | 5.000 | | | 05/01/42 | | | | 19,062,180 | |
| Chester County IDA Student Housing RB for University Student
Housing, LLC Project West Chester University Series 2013 A
(NR/Baa3) |
|
| | 500,000 | | | 5.000 | | | 08/01/35 | | | | 530,600 | |
| | 1,000,000 | | | 5.000 | | | 08/01/45 | | | | 1,047,760 | |
| | City of Philadelphia GO Bonds Series 2011 (A+/A2)(e) | |
| | 4,000,000 | | | 6.000 | | | 08/01/20 | | | | 4,541,760 | |
| Clairton Municipal Authority Sewer RB Series 2012 B
(BBB+/NR) |
|
| | 1,000,000 | | | 5.000 | | | 12/01/42 | | | | 1,083,980 | |
| County of Allegheny GO Notes Refunding Series 2007 C-59B
(AGM) (AA/A1)(c) |
|
| | 1,000,000 | | | (3 Mo. LIBOR + 0.55%),
1.428 | | | 11/01/26 | | | | 982,960 | |
| Cumberland County Municipal Authority RB for Diakon
Lutheran Social Ministries Project Series 2015 (BBB+/NR) |
|
| | 1,500,000 | | | 5.000 | | | 01/01/38 | | | | 1,628,805 | |
| Geisinger Authority Health System RB for Geisinger Health
System Series 2007 (AA/Aa2)(c) |
|
| | 49,750,000 | | | (3 Mo. LIBOR + 0.77%),
1.648 | | | 05/01/37 | | | | 42,928,280 | |
| | |
| Municipal Bonds – (continued) | |
| Pennsylvania – (continued) | |
| Lancaster County Hospital Authority Health Facilities RB for St.
Anne’s Retirement Community, Inc. Project Series 2012
(BB+/NR) |
|
| 1,400,000 | | | 5.000 | | | 04/01/27 | | | | 1,468,810 | |
| | 1,500,000 | | | 5.000 | | | 04/01/33 | | | | 1,546,815 | |
| Pennsylvania Economic Development Financing Authority RB
for The Pennsylvania Rapid Bridge Replacement Project
Series 2015 (AMT) (BBB/NR) |
|
| | 8,500,000 | | | 5.000 | | | 06/30/42 | | | | 9,452,595 | |
| Pennsylvania Economic Development Financing Authority
Sewage Sludge Disposal RB for Philadelphia Biosolids Facility
Project Series 2009 (BBB+/Baa3) |
|
| | 7,400,000 | | | 6.250 | | | 01/01/32 | | | | 7,803,966 | |
| Pennsylvania Economic Development Financing Authority
Special Facilities RB for US Airways Group, Inc. Project
Series 2010 B (BB-/B1) |
|
| | 2,460,000 | | | 8.000 | | | 05/01/29 | | | | 2,750,182 | |
| Pennsylvania Higher Educational Facilities Authority RB for
Foundation for Indiana University of Pennsylvania
Series 2007 A (XLCA) (BBB+/WR)(c) |
|
| | 13,095,000 | | | (3 Mo. LIBOR + 0.60%),
1.470 | | | 07/01/27 | | | | 12,701,364 | |
| | 10,750,000 | | | (3 Mo. LIBOR + 0.65%),
1.520 | | | 07/01/39 | | | | 8,663,640 | |
| Pennsylvania Higher Educational Facilities Authority RB for La
Salle University Series 2012 (BBB-/NR) |
|
| | 4,000,000 | | | 5.000 | | | 05/01/42 | | | | 4,217,760 | |
| Pennsylvania Higher Educational Facilities Authority Student
Housing RB Refunding for University Properties, Inc. Student
Housing Project Series 2016 A (NR/Baa3) |
|
| | 400,000 | | | 5.000 | | | 07/01/35 | | | | 432,620 | |
| Philadelphia Hospitals & Higher Education Facilities Authority
RB Refunding for Temple University Health System Obligated
Group Series 2012 B (BBB-/Ba1) |
|
| | 5,000,000 | | | 6.250 | | | 07/01/23 | | | | 5,020,950 | |
| | Scranton City GO Refunding Notes Series 2016 (BB+/NR) | |
| | 1,875,000 | | | 5.000 | | | 11/15/26 | | | | 2,021,381 | |
| | 2,625,000 | | | 5.000 | | | 11/15/32 | | | | 2,742,023 | |
| Scranton Redevelopment Authority RB Refunding for Guaranteed
Lease Series 2016 A (MUN GOVT GTD) (BB+/NR) |
|
| | 1,700,000 | | | 5.000 | | | 11/15/21 | | | | 1,763,869 | |
| | 2,450,000 | | | 5.000 | | | 11/15/28 | | | | 2,502,430 | |
| State Public School Building Authority RB Refunding for
Philadelphia School District Project Series 2016 A (AGM)
(ST AID WITHHLDG) (AA/A2) |
|
| | 2,400,000 | | | 5.000 | | | 06/01/31 | | | | 2,738,544 | |
| | | | | | | | | | | | |
| | | | | | | | | | | 151,635,362 | |
| | |
| Puerto Rico – 4.7% | |
| Puerto Rico Commonwealth Aqueduct & Sewer Authority RB
Senior Lien Series 2008 A (CC/Caa3) |
|
| | 56,440,000 | | | 6.000 | | | 07/01/38 | | | | 42,753,300 | |
| | 25,995,000 | | | 6.000 | | | 07/01/44 | | | | 19,561,238 | |
| | |
| | |
| The accompanying notes are an integral part of these financial statements. | | 57 |
GOLDMAN SACHS HIGH YIELD MUNICIPAL FUND
Schedule of Investments (continued)
September 30, 2017 (Unaudited)
| | | | | | | | | | | | |
Principal
Amount | | | Interest
Rate | | Maturity
Date | | | Value | |
| Municipal Bonds – (continued) | |
| Puerto Rico – (continued) | |
| Puerto Rico Commonwealth Aqueduct & Sewer Authority RB
Senior Lien Series 2012 A (CC/Caa3) |
|
| $ | 115,000 | | | 4.500 % | | | 07/01/27 | | | $ | 82,369 | |
| | 370,000 | | | 5.000 | | | 07/01/30 | | | | 265,475 | |
| | 5,115,000 | | | 5.125 | | | 07/01/37 | | | | 3,657,225 | |
| | 12,835,000 | | | 5.250 | | | 07/01/42 | | | | 9,177,025 | |
| | 3,470,000 | | | 6.000 | | | 07/01/47 | | | | 2,559,125 | |
| Puerto Rico Commonwealth GO Bonds for Public Improvement
Series 2006 A (D/Caa3)(i) |
|
| | 115,000 | | | 5.250 | | | 07/01/30 | | | | 53,187 | |
| | Puerto Rico Commonwealth GO Bonds Series 2014 A (D/Caa3)(i) | |
| | 30,460,000 | | | 8.000 | | | 07/01/35 | | | | 14,773,100 | |
| Puerto Rico Commonwealth GO Refunding Bonds for Public
Improvement Series 2012 A (D/Caa3)(i) |
|
| | 5,185,000 | | | 5.500 | | | 07/01/39 | | | | 2,423,987 | |
| Puerto Rico Commonwealth Highway & Transportation Authority
RB Refunding Series 2005 L (AGC-ICC) (AA/A3) |
|
| | 360,000 | | | 5.250 | | | 07/01/41 | | | | 418,536 | |
| Puerto Rico Commonwealth Highway & Transportation Authority
RB Refunding Series 2005 L (AMBAC) (D/C) |
|
| | 27,515,000 | | | 5.250 | | | 07/01/38 | | | | 28,325,867 | |
| Puerto Rico Commonwealth Highway & Transportation Authority
RB Refunding Series 2005 L (NATL-RE) (A/A3) |
|
| | 1,095,000 | | | 5.250 | | | 07/01/35 | | | | 1,131,069 | |
| Puerto Rico Commonwealth Highway & Transportation Authority
RB Refunding Series 2007 N (NATL-RE) (A/A3) |
|
| | 200,000 | | | 5.250 | | | 07/01/33 | | | | 208,498 | |
| Puerto Rico Commonwealth Highway & Transportation Authority
RB Series 2003 (D/C)(i) |
|
| | 215,000 | | | 5.000 | | | 07/01/28 | | | | 4,300 | |
| Puerto Rico Commonwealth Infrastructure Financing Authority
Special Tax RB Series 2005 C (AMBAC) (D/C) |
|
| | 1,500,000 | | | 5.500 | | | 07/01/23 | | | | 1,637,700 | |
| | 1,000,000 | | | 5.500 | | | 07/01/27 | | | | 1,083,840 | |
| Puerto Rico Commonwealth Public Improvement GO Bonds
Series 2007 A (D/Caa3)(i) |
|
| | 4,000,000 | | | 5.250 | | | 07/01/32 | | | | 1,860,000 | |
| | 4,000,000 | | | 5.250 | | | 07/01/37 | | | | 1,850,000 | |
| Puerto Rico Commonwealth Public Improvement GO Refunding
Bonds Series 2009 B (D/Caa3)(i) |
|
| | 645,000 | | | 5.875 | | | 07/01/36 | | | | 301,537 | |
| Puerto Rico Commonwealth Public Improvement GO Refunding
Bonds Series 2011 A (D/Caa3)(i) |
|
| | 1,260,000 | | | 5.750 | | | 07/01/41 | | | | 582,750 | |
| Puerto Rico Commonwealth Public Improvement GO Refunding
Bonds Series 2011 C (D/Caa3)(i) |
|
| | 140,000 | | | 6.000 | | | 07/01/35 | | | | 63,700 | |
| | 205,000 | | | 6.500 | | | 07/01/40 | | | | 97,375 | |
| Puerto Rico Commonwelath Highway & Transportation Authority
RB Refunding Series 2007 CC (AGM) (AA/A2) |
|
| | 300,000 | | | 5.250 | | | 07/01/33 | | | | 347,601 | |
| | 680,000 | | | 5.250 | | | 07/01/34 | | | | 786,501 | |
| | 1,025,000 | | | 5.250 | | | 07/01/36 | | | | 1,182,840 | |
| Puerto Rico Electric Power Authority RB Refunding
Series 2007 UU (AGM) (AA/A2)(c) |
|
| | 42,317,000 | | | (3 Mo. LIBOR +
0.52%, 12.00% Cap), 1.390 | | | 07/01/29 | | | | 34,170,978 | |
| | |
| Municipal Bonds – (continued) | |
| Puerto Rico – (continued) | |
| Puerto Rico Electric Power Authority RB Refunding Series 2010
ZZ (D/Ca)(i) |
|
| 9,700,000 | | | 5.250 | | | 07/01/26 | | | | 4,668,125 | |
| Puerto Rico Electric Power Authority RB Refunding
Series 2012 A (D/Ca)(i) |
|
| | 19,720,000 | | | 5.000 | | | 07/01/42 | | | | 9,490,250 | |
| Puerto Rico Electric Power Authority RB Series 2008 WW
(D/Ca)(i) |
|
| | 2,000,000 | | | 5.500 | | | 07/01/20 | | | | 962,500 | |
| | 3,275,000 | | | 5.000 | | | 07/01/28 | | | | 1,576,094 | |
| | 825,000 | | | 5.250 | | | 07/01/33 | | | | 397,031 | |
| Puerto Rico Electric Power Authority RB Series 2010 XX
(D/Ca)(i) |
|
| | 7,590,000 | | | 5.250 | | | 07/01/40 | | | | 3,652,687 | |
| | Puerto Rico Electric Power Authority RB Series 2013 A (D/Ca)(i) | |
| | 5,210,000 | | | 7.000 | | | 07/01/33 | | | | 2,507,313 | |
| | 5,205,000 | | | 6.750 | | | 07/01/36 | | | | 2,504,906 | |
| | 5,440,000 | | | 7.000 | | | 07/01/40 | | | | 2,618,000 | |
| Puerto Rico Electric Power Authority RB Series 2016 A-4
(NR/NR)(i) |
|
| | 747,236 | | | 10.000 | | | 07/01/19 | | | | 359,607 | |
| Puerto Rico Electric Power Authority RB Series 2016 B-4
(NR/NR)(i) |
|
| | 747,235 | | | 10.000 | | | 07/01/19 | | | | 359,607 | |
| Puerto Rico Electric Power Authority RB Series 2016 E-1
(NR/NR)(i) |
|
| | 5,036,850 | | | 10.000 | | | 01/01/21 | | | | 2,423,984 | |
| Puerto Rico Electric Power Authority RB Series 2016 E-2
(NR/NR)(i) |
|
| | 5,036,850 | | | 10.000 | | | 07/01/21 | | | | 2,423,984 | |
| Puerto Rico Electric Power Authority RB Series 2016 E-3
(NR/NR)(i) |
|
| | 1,678,950 | | | 10.000 | | | 01/01/22 | | | | 807,995 | |
| Puerto Rico Electric Power Authority RB Series 2016 E-4
(NR/NR)(i) |
|
| | 1,678,950 | | | 10.000 | | | 07/01/22 | | | | 807,995 | |
| Puerto Rico Highway & Transportation Authority RB Refunding
Series 2007 N (AMBAC) (D/C) |
|
| | 3,280,000 | | | 5.250 | | | 07/01/31 | | | | 3,429,666 | |
| Puerto Rico Highway & Transportation Authority RB Refunding
Series 2007 N (ASSURED GTY) (AA/A3) |
|
| | 265,000 | | | 5.250 | | | 07/01/34 | | | | 306,295 | |
| | 960,000 | | | 5.250 | | | 07/01/36 | | | | 1,105,171 | |
| Puerto Rico Infrastructure Financing Authority Special Tax RB
Series 2005 A (AMBAC) (D/C)(b) |
|
| | 4,750,000 | | | 0.000 | | | 07/01/34 | | | | 1,811,080 | |
| | 3,750,000 | | | 0.000 | | | 07/01/35 | | | | 1,349,812 | |
| Puerto Rico Public Buildings Authority RB Refunding for
Government Facilities Series 2009 P (COMWLTH GTD)
(D/Caa3) |
|
| | 1,000,000 | | | 6.125 | | | 07/01/23 | | | | 435,000 | |
| Puerto Rico Sales Tax Financing Corp. RB First Subseries 2009 A
(D/Ca)(i) |
|
| | 2,000,000 | | | 6.375 | | | 08/01/39 | | | | 420,000 | |
| | 2,700,000 | | | 6.000 | | | 08/01/42 | | | | 560,250 | |
| | |
| | |
| 58 | | The accompanying notes are an integral part of these financial statements. |
GOLDMAN SACHS HIGH YIELD MUNICIPAL FUND
| | | | | | | | | | | | |
Principal
Amount | | | Interest
Rate | | Maturity
Date | | | Value | |
| Municipal Bonds – (continued) | |
| Puerto Rico – (continued) | |
| Puerto Rico Sales Tax Financing Corp. RB First Subseries 2010 A
(D/Ca)(i) |
|
| $ | 500,000 | | | 5.000 % | | | 08/01/26 | | | $ | 103,750 | |
| | 4,925,000 | | | 5.375 | | | 08/01/39 | | | | 1,021,938 | |
| | 8,470,000 | | | 5.500 | | | 08/01/42 | | | | 1,757,525 | |
| Puerto Rico Sales Tax Financing Corp. RB First Subseries 2010 C
(D/Ca)(i) |
|
| | 40,875,000 | | | 5.250 | | | 08/01/41 | | | | 8,481,563 | |
| Puerto Rico Sales Tax Financing Corp. RB First Subseries 2010 C
(D/Ca)(b)(i) |
|
| | 25,000,000 | | | 0.000 | | | 08/01/39 | | | | 1,250,750 | |
| Puerto Rico Sales Tax Financing Corp. RB First Subseries 2011
A-1 (D/Ca)(i) |
|
| | 1,500,000 | | | 5.000 | | | 08/01/43 | | | | 311,250 | |
| Puerto Rico Sales Tax Financing Corp. RB for Capital
Appreciation First Subseries 2009 A (D/Ca)(i) |
|
| | 23,300,000 | | | 6.750 | | | 08/01/32 | | | | 4,893,000 | |
| Puerto Rico Sales Tax Financing Corp. RB for Capital
Appreciation Series 2010 A (D/Ca)(b)(i) |
|
| | 10,000,000 | | | 0.000 | | | 08/01/33 | | | | 727,900 | |
| | 35,085,000 | | | 0.000 | | | 08/01/35 | | | | 2,224,740 | |
| Puerto Rico Sales Tax Financing Corp. RB for Capital
Appreciation Series 2010 A (D/Ca)(a)(i) |
|
| | 10,130,000 | | | 0.000 | | | 08/01/33 | | | | 1,798,075 | |
| Puerto Rico Sales Tax Financing Corp. RB for Capital
Appreciation Subseries 2009 A (D/Ca)(b)(i) |
|
| | 35,100,000 | | | 0.000 | | | 08/01/34 | | | | 2,242,539 | |
| Puerto Rico Sales Tax Financing Corp. RB for Capital
Appreciation Subseries 2010 C (D/Ca)(b)(i) |
|
| | 8,400,000 | | | 0.000 | | | 08/01/37 | | | | 478,800 | |
| Puerto Rico Sales Tax Financing Corp. Sales Tax RB First
Subseries 2009 A (D/Ca)(i) |
|
| | 32,290,000 | | | 6.500 | | | 08/01/44 | | | | 6,780,900 | |
| Puerto Rico Sales Tax Financing Corp. Sales Tax RB Refunding
First Subseries 2010 C (D/Ca)(i) |
|
| | 9,580,000 | | | 5.500 | | | 08/01/40 | | | | 1,987,850 | |
| Puerto Rico Sales Tax Financing Corp. Sales Tax RB Refunding
Series 2011 A-1 (D/Ca)(i) |
|
| | 500,000 | | | 5.250 | | | 08/01/43 | | | | 103,750 | |
| Puerto Rico Sales Tax Financing Corp. Sales Tax RB Refunding
Series 2011 C (D/Caa3)(i) |
|
| | 500,000 | | | 5.000 | | | 08/01/40 | | | | 265,000 | |
| Puerto Rico Sales Tax Financing Corp. Sales Tax RB Refunding
Subseries A (D/Ca)(i) |
|
| | 485,000 | | | 5.750 | | | 08/01/37 | | | | 100,638 | |
| | | | | | | | | | | | |
| | | | | | | | | | | 248,866,443 | |
| | |
| | Rhode Island – 0.3% | |
| Rhode Island Health and Educational Building Corp. RB
Refunding for Care New England Series 2013 A (BB/NR)(e) |
|
| | 2,500,000 | | | 6.000 | | | 09/01/23 | | | | 3,116,425 | |
| Tobacco Settlement Financing Corp. RB Asset-Backed Bonds
Series 2007 B (CCC/NR)(b) |
|
| | 124,220,000 | | | 0.000 | | | 06/01/52 | | | | 10,954,962 | |
| | | | | | | | | | | | |
| | | | | | | | | | | 14,071,387 | |
| | |
| Municipal Bonds – (continued) | |
| South Carolina – 0.3% | |
| Lancaster County Assessment RB for Edgewater Improvement
District Series 2003 A (NR/NR) |
|
| 3,481,000 | | | 6.875 | | | 11/01/35 | | | | 3,491,652 | |
| South Carolina Jobs – Economic Development Authority Hospital
RB Refunding for Palmetto Health Series 2011 A (AGM)
(AA/A2) |
|
| | 4,000,000 | | | 6.500 | | | 08/01/39 | | | | 4,610,440 | |
| South Carolina Public Service Authority RB Tax-Exempt
Series 2015 E (A+/A1) |
|
| | 7,750,000 | | | 5.250 | | | 12/01/55 | | | | 8,705,187 | |
| | | | | | | | | | | | |
| | | | | | | | | | | 16,807,279 | |
| | |
| | Tennessee – 0.7% | |
| Bristol Industrial Development Board RB for The Pinnacle
Project Series 2016 A (NR/NR)(f) |
|
| | 7,150,000 | | | 5.000 | | | 12/01/35 | | | | 7,048,828 | |
| | 12,450,000 | | | 5.125 | | | 12/01/42 | | | | 12,182,076 | |
| Johnson City Health & Educational Board Retirement Facilities
RB for Mountain States Health Alliance Series 2012 A
(BBB+/Baa1) |
|
| | 1,500,000 | | | 5.000 | | | 08/15/42 | | | | 1,596,360 | |
| Johnson City Health & Educational Facilities Board RB for
Mountain States Health Alliance Series 2010 A (BBB+/Baa1) |
|
| | 5,500,000 | | | 6.500 | | | 07/01/38 | | | | 6,036,745 | |
| Metropolitan Government Nashville & Davidson County Health
& Educational Facilities Board RB for Vanderbilt University
Medical Center Series 2016 A (NR/A3) |
|
| | 2,500,000 | | | 5.000 | | | 07/01/40 | | | | 2,802,275 | |
| | 4,200,000 | | | 5.000 | | | 07/01/46 | | | | 4,667,502 | |
| Shelby County Health Educational & Housing Facilities Board
RB Refunding for The Village at Germantown Residential Care
Facility Mortgage Series 2012 (NR/NR) |
|
| | 2,000,000 | | | 5.375 | | | 12/01/47 | | | | 2,084,340 | |
| | | | | | | | | | | | |
| | | | | | | | | | | 36,418,126 | |
| | |
| | Texas – 5.2% | |
| Bexar County Texas Health Facilities Development Corp. RB for
Army Retirement Residence Foundation Project Series 2010
(BBB/NR)(e) |
|
| | 3,250,000 | | | 6.200 | | | 07/01/20 | | | | 3,690,180 | |
| Board of Managers, Joint Guadalupe County – City of Seguin
Hospital Mortgage Improvement RB Refunding Bonds
Series 2015 (BB/NR) |
|
| | 1,950,000 | | | 5.250 | | | 12/01/35 | | | | 2,105,512 | |
| | 2,435,000 | | | 5.000 | | | 12/01/40 | | | | 2,512,214 | |
| | 1,950,000 | | | 5.000 | | | 12/01/45 | | | | 1,999,745 | |
| | Brazos River Authority Bonds Series 2003 (NR/NR)(i)(j) | |
| | 9,275,000 | | | 6.750 | | | 10/01/38 | | | | — | |
| | Brazos River Authority Bonds Series 2006 (NR/NR)(i)(j) | |
| | 4,740,000 | | | 5.000 | | | 03/01/41 | | | | — | |
| Central Texas Regional Mobility Authority RB Refunding Senior
Lien Series 2015 A (BBB+/Baa2) |
|
| | 3,900,000 | | | 5.000 | | | 01/01/45 | | | | 4,363,788 | |
| Central Texas Regional Mobility Authority RB Refunding Senior
Lien Series 2016 (BBB+/Baa2) |
|
| | 1,600,000 | | | 5.000 | | | 01/01/40 | | | | 1,805,936 | |
| | 2,465,000 | | | 5.000 | | | 01/01/46 | | | | 2,765,188 | |
| | |
| | |
| The accompanying notes are an integral part of these financial statements. | | 59 |
GOLDMAN SACHS HIGH YIELD MUNICIPAL FUND
Schedule of Investments (continued)
September 30, 2017 (Unaudited)
| | | | | | | | | | | | |
Principal
Amount | | | Interest
Rate | | Maturity
Date | | | Value | |
| Municipal Bonds – (continued) | |
| Texas – (continued) | |
| City of Celina Texas Municipal Corp. Special Assessment RB for
Wells South Public Improvement District Major Improvement
Area Project Series 2015 (NR/NR) |
|
| $ | 3,920,000 | | | 7.500 % | | | 09/01/45 | | | $ | 4,287,735 | |
| City of Celina Texas Municipal Corp. Special Assessment RB for
Wells South Public Improvement District Neighorhood
Improvement Area #1 Project Series 2015 (NR/NR) |
|
| | 1,845,000 | | | 6.250 | | | 09/01/45 | | | | 1,914,981 | |
| City of Hackberry Special Assessment RB Refunding for
Hackberry Public Improvement District No. 3 Phases #13-16
Project Series 2017 (NR/NR)(d) |
|
| | 1,390,000 | | | 4.500 | | | 09/01/37 | | | | 1,379,116 | |
| | 1,175,000 | | | 5.000 | | | 09/01/44 | | | | 1,204,481 | |
| City of Hackberry Special Assessment RB Refunding for Hidden
Cove Public Improvement District No. 2 Project Series 2017
(BBB/NR) |
|
| | 2,235,000 | | | 4.500 | | | 09/01/32 | | | | 2,374,531 | |
| | 3,340,000 | | | 4.500 | | | 09/01/38 | | | | 3,492,137 | |
| Dallas County Flood Control District No. 1 Unlimited Tax GO
Refunding Series 2015 (NR/NR)(f) |
|
| | 3,250,000 | | | 5.000 | | | 04/01/32 | | | | 3,386,110 | |
| Fort Bend County Industrial Development Corp. RB for NRG
Energy, Inc. Project Series 2012 A (NR/Baa3) |
|
| | 1,545,000 | | | 4.750 | | | 05/01/38 | | | | 1,602,752 | |
| Fort Bend County Industrial Development Corp. RB for NRG
Energy, Inc. Project Series 2012 B (NR/Baa3) |
|
| | 5,685,000 | | | 4.750 | | | 11/01/42 | | | | 5,876,357 | |
| Fort Worth Special Assessment RB for Fort Worth Public
Improvement District No. 17 Major Improvement Project
Series 2017 (NR/NR)(f) |
|
| | 1,575,000 | | | 5.000 | | | 09/01/27 | | | | 1,632,251 | |
| | 895,000 | | | 5.000 | | | 09/01/32 | | | | 895,654 | |
| | 1,315,000 | | | 5.125 | | | 09/01/37 | | | | 1,297,984 | |
| Grand Parkway Transportation Corp. System Toll Convertible RB
Series 2013 B (AA+/NR)(a) |
|
| | 10,370,000 | | | 0.000 | | | 10/01/46 | | | | 9,654,677 | |
| | 11,100,000 | | | 0.000 | | | 10/01/47 | | | | 10,344,867 | |
| Grand Parkway Transportation Corp. System Toll RB First Tier
Series 2013 A (BBB/NR) |
|
| | 11,850,000 | | | 5.500 | | | 04/01/53 | | | | 13,513,147 | |
| Harris County Cultural Education Facilities Finance Corp. RB
First Mortgage for Brazos Presbyterian Homes, Inc. Project
Series 2013 B (BB+/NR)(e) |
|
| | 3,030,000 | | | 7.000 | | | 01/01/23 | | | | 3,853,342 | |
| Harris County Toll Road RB Refunding Senior Lien
Series 2007 B (AMBAC) (AA-/Aa2)(c) |
|
| | 1,000,000 | | | (3 Mo. LIBOR +
0.67%), 1.551 | | | 08/15/35 | | | | 871,960 | |
| Hickory Creek Texas Special Assessment RB for Public
Improvement District No. 1 Series 2017 (BBB-/NR) |
|
| | 595,000 | | | 3.750 | | | 09/01/32 | | | | 595,476 | |
| | 510,000 | | | 3.875 | | | 09/01/37 | | | | 510,194 | |
| | 955,000 | | | 4.000 | | | 09/01/47 | | | | 955,745 | |
| Houston Airport System Special Facilities RB for Continental
Airlines, Inc. Terminal Improvement Projects Series 2011 A
(AMT) (BB-/Ba3) |
|
| | 9,000,000 | | | 6.625 | | | 07/15/38 | | | | 9,964,350 | |
| | |
| Municipal Bonds – (continued) | |
| Texas – (continued) | |
| Houston Airport System Special Facilities RB Refunding for
United Airlines, Inc. Terminal E Project Series 2014 A (AMT)
(BB-/Ba3) |
|
| 9,250,000 | | | 5.000 | | | 07/01/29 | | | | 10,105,717 | |
| Houston Airport System Special Facilities RB Refunding for
United Airlines, Inc. Terminal Improvement Projects Series
2015 B-1 (AMT) (BB-/NR) |
|
| | 7,500,000 | | | 5.000 | | | 07/15/35 | | | | 8,122,125 | |
| Houston Independent School District Limited Tax GO Refunding
Bonds Series 2017 (PSF-GTD) (AAA/Aaa) |
|
| | 14,575,000 | | | 4.000 | | | 02/15/42 | | | | 15,342,811 | |
| Houston Utilities System RB Refunding First Lien Series 2016 B
(AA/Aa2) |
|
| | 11,380,000 | | | 5.000 | | | 11/15/36 | | | | 13,381,742 | |
| Kaufman County Fresh Water Supply District No. 1-C Refunding
for Road Series 2016 C (AGM) (AA/NR) |
|
| | 525,000 | | | 4.000 | | | 09/01/29 | | | | 559,004 | |
| | 1,100,000 | | | 3.000 | | | 09/01/32 | | | | 1,006,555 | |
| | 1,400,000 | | | 4.000 | | | 09/01/35 | | | | 1,434,804 | |
| Matagorda County Texas Navigation District No. 1 PCRB
Refunding for Central Power & Light Co. Project RMKT
07/01/09 Series 2001 A (A-/Baa1) |
|
| | 5,200,000 | | | 6.300 | | | 11/01/29 | | | | 5,675,072 | |
| Mission Economic Development Corp. RB for Natgasoline
Project Senior Lien Series 2016 A (AMT) (BB-/NR)(f) |
|
| | 14,000,000 | | | 5.750 | | | 10/01/31 | | | | 14,686,840 | |
| Mission Economic Development Corp. RB for Natgasoline
Project Senior Lien Series 2016 B (AMT) (BB-/NR)(f) |
|
| | 9,500,000 | | | 5.750 | | | 10/01/31 | | | | 9,966,070 | |
| New Hope Cultural Education Facilities Finance Corp. Student
Housing RB for NCCD College Station Properties LLC, Texas
A&M University Project Series 2015 A (BBB-/Baa3) |
|
| | 6,180,000 | | | 5.000 | | | 07/01/47 | | | | 6,638,803 | |
| New Hope Cultural Education Facilities Finance Corp. Student
Housing RB for Station II, LLC – Texas A&M University
Collegiate Housing Corpus Christi Project Series 2016 A
(BBB-/Baa3) |
|
| | 335,000 | | | 5.000 | | | 04/01/31 | | | | 369,837 | |
| | 300,000 | | | 5.000 | | | 04/01/36 | | | | 324,795 | |
| | 1,250,000 | | | 5.000 | | | 04/01/48 | | | | 1,334,287 | |
| New Hope Cultural Education Facilities Finance Corp. Student
Housing RB for Tarleton State University Collegiate Housing
Project Series 2015 A (BBB-/Baa3) |
|
| | 1,000,000 | | | 5.000 | | | 04/01/47 | | | | 1,064,870 | |
| New Hope Cultural Education Facilities Finance Corp. Student
Housing RB for Texas A&M University at Galveston
Collegiate Housing Project Series 2014 A (NR/Baa3) |
|
| | 1,385,000 | | | 4.750 | | | 04/01/46 | | | | 1,444,694 | |
| North Texas Tollway Authority RB First Tier Series 2009 A
(A/A1) |
|
| | 4,790,000 | | | 6.250 | | | 01/01/39 | | | | 5,069,353 | |
| North Texas Tollway Authority System RB Refunding First Tier
Series 2016 A (A/A1) |
|
| | 3,000,000 | | | 5.000 | | | 01/01/39 | | | | 3,432,870 | |
| | |
| | |
| 60 | | The accompanying notes are an integral part of these financial statements. |
GOLDMAN SACHS HIGH YIELD MUNICIPAL FUND
| | | | | | | | | | | | |
Principal
Amount | | | Interest
Rate | | Maturity
Date | | | Value | |
| Municipal Bonds – (continued) | |
| Texas – (continued) | |
| Ponder Texas Special Assessment RB for Ponder Public
Improvement District No. 1 Series 2017 (NR/NR) |
|
| $ | 175,000 | | | 4.000 % | | | 09/01/27 | | | $ | 174,004 | |
| | 705,000 | | | 5.000 | | | 09/01/45 | | | | 721,575 | |
| | 825,000 | | | 5.000 | | | 09/01/47 | | | | 843,084 | |
| Rowlett Special Assessment RB for Bayside Public Improvement
District North Improvement Area Project Series 2016 (NR/NR) |
|
| | 280,000 | | | 5.750 | | | 09/15/36 | | | | 270,900 | |
| | 750,000 | | | 6.000 | | | 09/15/46 | | | | 721,148 | |
| | Sabine River Authority Tax Bonds Series 2005 (NR/NR)(i)(j) | |
| | 5,950,000 | | | 5.200 | | | 05/01/28 | | | | — | |
| Tarrant County Cultural Education Facilities Finance Corp. RB
Refunding for Air Force Village Obligated Group Series 2016
(BB+/NR) |
|
| | 7,300,000 | | | 5.000 | | | 05/15/45 | | | | 7,616,236 | |
| Texas Municipal Gas Acquisition & Supply Corp. I RB Senior
Lien Series 2006 B (BBB+/Baa1)(c) |
|
| | 7,825,000 | | | (3 Mo. LIBOR +
0.70%), 1.584 | | | 12/15/26 | | | | 7,656,058 | |
| Texas Municipal Gas Acquisition & Supply Corp. I RB Senior
Lien Series 2008 D (BBB+/Baa1) |
|
| | 18,785,000 | | | 6.250 | | | 12/15/26 | | | | 22,916,573 | |
| Texas Private Activity Bond Surface Transportation Corp. RB
Senior Lien for Blueridge Transportation Group, LLC SH 288
Toll Lanes Project Series 2016 (AMT) (BBB-/Baa3) |
|
| | 3,900,000 | | | 5.000 | | | 12/31/50 | | | | 4,280,445 | |
| | 3,900,000 | | | 5.000 | | | 12/31/55 | | | | 4,265,898 | |
| Texas Private Activity Bond Surface Transportation Corp. RB
Senior Lien for Mobility Partners LLC Series 2009
(BBB-/Baa2) |
|
| | 7,500,000 | | | 6.875 | | | 12/31/39 | | | | 8,333,250 | |
| Texas Private Activity Bond Surface Transportation Corp. RB
Senior Lien for Mobility Partners LLC Series 2013 (AMT)
(BBB-/Baa3) |
|
| | 5,000,000 | | | 6.750 | | | 06/30/43 | | | | 5,960,750 | |
| Texas Transportation Commission Central Turnpike System RB
Refunding Second Tier Series 2015 C (BBB+/Baa1) |
|
| | 7,850,000 | | | 5.000 | | | 08/15/42 | | | | 8,740,190 | |
| Viridian Municipal Management District Tarrant County Special
Assessment RB Series 2015 (NR/NR) |
|
| | 301,000 | | | 4.000 | | | 12/01/21 | | | | 312,922 | |
| | 500,000 | | | 4.000 | | | 12/01/27 | | | | 495,035 | |
| | 1,547,000 | | | 4.750 | | | 12/01/35 | | | | 1,552,492 | |
| | | | | | | | | | | | |
| | | | | | | | | | | 273,671,219 | |
| | |
| Utah – 0.6% | |
| Carbon County Solid Waste Disposal RB Refunding for
Sunnyside Cogeneration Series 1999 A (AMT) (NR/NR) |
|
| | 15,515,000 | | | 7.100 | | | 08/15/23 | | | | 17,122,199 | |
| Salt Lake City RB for International Airport Series 2017 A (AMT)
(A+/A2) |
|
| | 11,000,000 | | | 5.000 | | | 07/01/47 | | | | 12,566,620 | |
| | | | | | | | | | | | |
| | | | | | | | | | | 29,688,819 | |
| | |
| Vermont – 0.1% | |
| Vermont Economic Development Authority RB Refunding for
Wake Robin Corp. Series 2017 A (NR/NR) |
|
| | 1,000,000 | | | 5.000 | | | 05/01/47 | | | | 1,032,230 | |
| | |
| Municipal Bonds – (continued) | |
| Vermont – (continued) | |
| Vermont Educational & Health Buildings Financing Agency RB
for St. Michael’s College Project Series 2012 (BBB+/Baa1) |
|
| 2,250,000 | | | 5.000 | | | 10/01/42 | | | | 2,408,738 | |
| | | | | | | | | | | | |
| | | | | | | | | | | 3,440,968 | |
| | |
| Virgin Islands – 0.5% | |
| Virgin Islands Public Finance Authority RB Matching Fund Loan
Note Senior Lien Series 2010 A (CCC+/Caa1) |
|
| | 10,775,000 | | | 5.000 | | | 10/01/25 | | | | 7,784,937 | |
| | 7,910,000 | | | 5.000 | | | 10/01/29 | | | | 5,665,538 | |
| Virgin Islands Public Finance Authority RB Matching Fund Loan
Note Series 2012 A (CCC+/Caa1) |
|
| | 6,080,000 | | | 5.000 | | | 10/01/32 | | | | 4,332,000 | |
| Virgin Islands Public Finance Authority RB Refunding for Virgin
Islands Gross Receipts Taxes Loan Note Series 2014 C
(CCC/NR) |
|
| | 8,350,000 | | | 5.000 | | | 10/01/39 | | | | 5,406,625 | |
| Virgin Islands Public Finance Authority RB Refunding
Series 2014 C (AGM) (AA/A2) |
|
| | 3,515,000 | | | 5.000 | | | 10/01/39 | | | | 3,721,014 | |
| Virgin Islands Public Finance Authority RB Senior Lien
Matching Fund Loan Notes Refunding for Cruzan Project
Series 2009 A (NR/Caa2) |
|
| | 2,000,000 | | | 6.000 | | | 10/01/39 | | | | 1,270,000 | |
| | | | | | | | | | | | |
| | | | | | | | | | | 28,180,114 | |
| | |
| Virginia – 1.0% | |
| Alexandria City IDA for Residential Care Facilities Mortgage RB
for Goodwin House, Inc. Series 2015 (BBB/NR) |
|
| | 2,700,000 | | | 5.000 | | | 10/01/45 | | | | 2,966,463 | |
| Mosaic District Community Development Authority RB
Series 2011 A (NR/NR) |
|
| | 3,115,000 | | | 6.250 | | | 03/01/21 | | | | 3,402,733 | |
| | 2,000,000 | | | 6.625 | | | 03/01/26 | | | | 2,187,120 | |
| | 7,000,000 | | | 6.875 | | | 03/01/36 | | | | 7,670,530 | |
| Tobacco Settlement Financing Corp. RB for Capital Appreciation
Subseries 2007 C (CCC+/NR)(b) |
|
| | 150,475,000 | | | 0.000 | | | 06/01/47 | | | | 12,739,213 | |
| Virginia Small Business Financing Authority Senior Lien RB for
95 Express Lanes LLC Project Series 2017 (AMT) (BBB/NR) |
|
| | 3,900,000 | | | 5.000 | | | 07/01/34 | | | | 4,236,063 | |
| | 13,650,000 | | | 5.000 | | | 01/01/40 | | | | 14,729,715 | |
| Washington County IDA RB for Mountain States Health Alliance
Series 2009 C (BBB+/Baa1) |
|
| | 4,000,000 | | | 7.750 | | | 07/01/38 | | | | 4,254,480 | |
| | | | | | | | | | | | |
| | | | | | | | | | | 52,186,317 | |
| | |
| Washington – 1.0% | |
| Central Puget Sound Regional Transit Authority Sales Tax &
Motor Vehicle Excise Tax RB Series 2016 S-1 (AAA/Aa1) |
|
| | 10,000,000 | | | 5.000 | | | 11/01/46 | | | | 13,142,200 | |
| Skagit County Public Hospital District No. 1 RB for Skagit Valley
Hospital Series 2010 (NR/Baa2) |
|
| | 4,000,000 | | | 5.750 | | | 12/01/35 | | | | 4,300,400 | |
| Washington Health Care Facilities Authority RB for Kadlec
Regional Medical Center Series 2012 (NR/WR)(e) |
|
| | 3,000,000 | | | 5.000 | | | 12/01/21 | | | | 3,456,030 | |
| | |
| | |
| The accompanying notes are an integral part of these financial statements. | | 61 |
GOLDMAN SACHS HIGH YIELD MUNICIPAL FUND
Schedule of Investments (continued)
September 30, 2017 (Unaudited)
| | | | | | | | | | | | |
Principal
Amount | | | Interest
Rate | | Maturity
Date | | | Value | |
| Municipal Bonds – (continued) | |
| Washington – (continued) | |
| Washington Health Care Facilities Authority RB for MultiCare
Health System RMKT 02/26/09 Series 2008 A (ASSURED
GTY) (AA/Aa3)(e) |
|
| $ | 750,000 | | | 6.000 % | | | 08/15/19 | | | $ | 817,852 | |
| Washington Health Care Facilities Authority RB for MultiCare
Health System RMKT 02/26/09 Series 2008 B (ASSURED
GTY) (AA/Aa3)(e) |
|
| | 1,750,000 | | | 6.000 | | | 08/15/19 | | | | 1,908,323 | |
| Washington State Various Purpose GO Refunding Bonds
Series R-2010B (AA+/Aa1) |
|
| | 14,015,000 | | | 5.000 | | | 01/01/23 | | | | 15,210,199 | |
| | 14,700,000 | | | 5.000 | | | 01/01/24 | | | | 15,943,326 | |
| | | | | | | | | | | | |
| | | | | | | | | | | 54,778,330 | |
| | |
| West Virginia – 0.1% | |
| Monongalia County Commission Special District Excise Tax RB
Refunding and Improvement for University Town Center
Economic Opportunity Development District Series 2017 A
(NR/NR)(d)(f) |
|
| | 900,000 | | | 5.750 | | | 06/01/43 | | | | 904,554 | |
| West Virginia Economic Development Authority Solid Waste
Disposal Facilities RB Refunding for Appalachian Power Co. –
Amos Project Series 2010 A (A-/Baa1) |
|
| | 4,000,000 | | | 5.375 | | | 12/01/38 | | | | 4,380,520 | |
| | | | | | | | | | | | |
| | | | | | | | | | | 5,285,074 | |
| | |
| Wisconsin – 0.9% | |
| Public Finance Authority Exempt Facilities RB Refunding for
Celanese Project Series 2016 C (AMT) (BBB-/Baa3) |
|
| | 5,900,000 | | | 4.300 | | | 11/01/30 | | | | 6,035,877 | |
| Public Finance Authority Limited Obligation RB for American
Dream @ Meadowlands Project Series 2017 (NR/NR)(f) |
|
| | 11,050,000 | | | 7.000 | | | 12/01/50 | | | | 12,840,873 | |
| Public Finance Authority Pass-Through RB for Natgasoline LLC
Series 2016 (NR/NR)(f) |
|
| | 23,152,500 | | | 10.000 | | | 06/30/21 | | | | 23,178,894 | |
| Public Finance Authority Student Housing RB for CHF-
Cullowhee, LLC-Western Carolina University Project
Series 2015 A (BBB-/NR) |
|
| | 3,250,000 | | | 5.250 | | | 07/01/47 | | | | 3,488,940 | |
| | | | | | | | | | | | |
| | | | | | | | | | | 45,544,584 | |
| | |
| | TOTAL INVESTMENTS – 97.3% | | | | | |
| | (Cost $4,921,906,449) | | | $ | 5,115,443,600 | |
| | |
| OTHER ASSETS IN EXCESS OF
LIABILITIES – 2.7% |
| | | 141,647,620 | |
| | |
| | NET ASSETS – 100.0% | | | $ | 5,257,091,220 | |
| | |
| | |
| The percentage shown for each investment category reflects the value of investments in that category as a percentage of net assets. |
(a) | | Zero coupon bond until next reset date. |
(b) | | Issued with a zero coupon. Income is recognized through the accretion of discount. |
| | |
(c) | | Variable rate security. Except for floating rate notes (for which final maturity is disclosed), maturity date disclosed is the next interest reset date. Interest rate disclosed is that which is in effect on September 30, 2017. |
(d) | | When-issued security. |
(e) | | Pre-refunded security. Maturity date disclosed is pre-refunding date. |
(f) | | Exempt from registration under Rule 144A of the Securities Act of 1933. Under procedures approved by the Board of Trustees, such securities may be deemed liquid by the Investment Adviser and may be resold, normally to qualified institutional buyers in transactions exempt from registration. Total market value of Rule 144A securities amounts to $277,375,527, which represents approximately 5.3% of net assets as of September 30, 2017 and are unaudited. |
(g) | | Security with “Put” features and resetting interest rates. Maturity dates disclosed are the puttable dates. Interest rate disclosed is that which is in effect on September 30, 2017. |
(h) | | Variable Rate Demand Instruments – rate shown is that which is in effect on September 30, 2017. Certain variable rate securities are not based on a published reference rate and spread but are determined by the issuer or agent and are based on current market conditions. |
(i) | | Security is currently in default. |
(j) | | Significant unobservable inputs were used in the valuation of this portfolio security; i.e. Level 3. |
Security ratings disclosed, if any, are issued by either Standard & Poor’s, Moody’s Investor Service or Fitch and are unaudited. A brief description of the ratings is available in the Fund’s Statement of Additional Information.
| | |
|
Investment Abbreviations: |
AGC-ICC | | —Agency Insured Custody Certificate |
AGM | | —Insured by Assured Guaranty Municipal Corp. |
AMBAC | | —Insured by American Municipal Bond Assurance Corp. |
AMT | | —Alternative Minimum Tax |
ASSURED GTY | | —Insured by Assured Guaranty |
BAM | | —Build America Mutual Assurance Co. |
BHAC-CR | | —Insured by Berkshire Hathaway Assurance Corp. - Insured Custodial Receipts |
CAL MTG INS | | —Insured by California Mortgage Insurance |
COMWLTH GTD | | —Commonwealth Guaranteed |
COPS | | —Certificates of Participation |
FGIC | | —Insured by Financial Guaranty Insurance Co. |
FHA | | —Federal Housing Administration |
GO | | —General Obligation |
IDA | | —Industrial Development Authority |
LIBOR | | —London Interbank Offered Rate |
Mo. | | —Month |
MUN GOVT GTD | | —Municipal Government Guaranteed |
NATL-RE | | —Insured by National Public Finance Guarantee Corp. |
NATL-RE FGIC | | —Insured by National Public Finance Guarantee Corp., which reinsures Financial Guaranty Insurance Co. |
NR | | —Not Rated |
PCRB | | —Pollution Control Revenue Bond |
PILOT | | —Payment in Lieu of Taxes |
PSF-GTD | | —Guaranteed by Permanent School Fund |
Q-SBLF | | —Qualified School Board Loan Fund |
RB | | —Revenue Bond |
RMKT | | —Remarketed |
ST AID WITHHLDG | | —State Aid Withholding |
ST APPROP | | —State Appropriation |
USD | | —United States Dollar |
WR | | —Withdrawn Rating |
XLCA | | —Insured by XL Capital Assurance, Inc. |
|
| | |
| 62 | | The accompanying notes are an integral part of these financial statements. |
GOLDMAN SACHS HIGH YIELD MUNICIPAL FUND
|
| ADDITIONAL INVESTMENT INFORMATION |
SWAP CONTRACTS — At September 30, 2017, the Fund had the following swap contracts:
OVER THE COUNTER CREDIT DEFAULT SWAP CONTRACTS
| | | | | | | | | | | | | | | | | | | | | | | | | | | | | | | | | | | | |
| Reference Obligation/Index(a) | | Financing
Rate Received
(Paid) by the
Fund (%) | | | Counterparty | | | Termination
Date | | | Notional
Amount | | | Credit
Spread on
September 30,
2017(b) | | | Value | | | Upfront
Premium
(Received) Paid | | | Unrealized
Appreciation/
(Depreciation) | |
Protection Sold: | | | | | | | | | | | | | | | | | | | | | | | | | | | | | | | | | | | | |
California State Various Purpose GO Bonds Series 2003, 5.000%, 11/01/23 | | | 1.000 | | |
| Bank of
America NA |
| | | 03/20/2023 | | | | USD | | | | 4,000,000 | | | | 0.485 | % | | $ | 105,953 | | | $ | (108,533 | ) | | $ | 214,486 | |
California State Various Purpose GO Bonds, Series 2003, 5.250%, 02/01/2018 | | | 1.000 | | |
| JPMorgan Chase
Bank NA |
| | | 03/20/2023 | | | | USD | | | | 9,000,000 | | | | 0.485 | | | | 238,395 | | | | (244,199 | ) | | | 482,594 | |
California State Various Purpose GO Bonds, Series 2003, 5.250%, 02/01/2018 | | | 1.700 | | | | | | | | 06/20/2021 | | | | USD | | | | 10,000,000 | | | | 0.312 | | | | 503,094 | | | | — | | | | 503,094 | |
California State Various Purpose GO Bonds, Series 2003, 5.250%, 02/01/2018 | | | 1.000 | | | | | | | | 09/20/2023 | | | | USD | | | | 15,000,000 | | | | 0.539 | | | | 383,095 | | | | (417,008 | ) | | | 800,103 | |
Illinois State GO Bonds, Series A, 5.000%, 06/01/2029 | | | 1.830 | | | | | | | | 06/20/2021 | | | | USD | | | | 10,000,000 | | | | 2.216 | | | | (118,945 | ) | | | — | | | | (118,945 | ) |
California State Various Purpose GO Bonds, Series 2003, 5.250%, 02/01/2018 | | | 1.000 | | |
| Morgan Stanley
Co., Inc. |
| | | 12/20/2023 | | | | USD | | | | 10,000,000 | | | | 0.563 | | | | 250,835 | | | | (176,310 | ) | | | 427,145 | |
Illinois State GO Bonds, Series A, 5.000%, 06/01/2029 | | | 1.000 | | | | | | | | 12/20/2023 | | | | USD | | | | 10,000,000 | | | | 2.818 | | | | (818,939 | ) | | | (477,240 | ) | | | (341,699 | ) |
| | | | | | | | | | | | | | | | | | | | | | | | | | | | | | | $ | (1,423,290 | ) | | $ | 1,966,778 | |
| | (a) | | Payments received quarterly. |
| | (b) | | Credit spread on the referenced obligation, together with the period of expiration, are indicators of payment/performance risk. The likelihood of a credit event occurring which would require a fund or its counterparty to make a payment or otherwise be required to perform under the swap contract is generally greater as the credit spread and term of the swap contract increase. |
CENTRALLY CLEARED INTEREST RATE SWAP CONTRACTS
| | | | | | | | | | | | | | | | | | | | | | | | |
Payments
Made by
the Fund
(%)(a) | | | Payments
Received by
the Fund | | Termination
Date | | | Notional
Amount | | | Value | | | Upfront
Premium
(Received) Paid | | | Unrealized
Appreciation/
(Depreciation) | |
| | 2.250 | | | 3 Month LIBOR | | | 12/21/2041 | | | | USD 169,400,000 | | | $ | 7,688,308 | | | $ | (10,852,836 | ) | | $ | 18,541,144 | |
| | 2.750 | | | 3 Month LIBOR | | | 12/20/2047 | | | | USD 250,600,000 | (b) | | | (11,406,416 | ) | | | (15,090,843 | ) | | | 3,684,427 | |
| | | | | | | | | | | | | | | $ | (3,718,108 | ) | | $ | (25,943,679 | ) | | $ | 22,225,571 | |
| | (a) | | Payments made quarterly. |
| | (b) | | Represents forward starting interest rate swaps whose effective dates of commencement of accruals and cash flows occur subsequent to September 30, 2017. |
| | |
| The accompanying notes are an integral part of these financial statements. | | 63 |
GOLDMAN SACHS SHORT DURATION TAX-FREE FUND
Schedule of Investments
September 30, 2017 (Unaudited)
| | | | | | | | | | | | |
Principal
Amount | | | Interest
Rate | | Maturity
Date | | | Value | |
| Municipal Bonds – 101.7% | |
| Alabama – 1.9% | |
| Alabama 21st Century Authority Tobacco Settlement RB
Series 2012 A (A/NR) |
|
| $ | 1,500,000 | | | 5.000% | | | 06/01/18 | | | $ | 1,536,390 | |
| Alabama State Public School & College Authority Capital
Improvement RB Refunding Series 2014 B (AA/Aa1) |
|
| | 8,275,000 | | | 5.000 | | | 01/01/21 | | | | 9,275,365 | |
| | Auburn University General Fee RB Series 2011 A (AA-/Aa2)(a) | |
| | 35,345,000 | | | 5.000 | | | 06/01/21 | | | | 40,114,101 | |
| | Black Belt Energy Gas District RB Series 2016 A (NR/A1)(b)(c) | |
| | 20,000,000 | | | 4.000 | | | 06/01/21 | | | | 21,603,600 | |
| Houston County Health Care Authority RB for Southeast
Alabama Medical Center Series 2016 A (BBB/NR) |
|
| | 100,000 | | | 3.000 | | | 10/01/17 | | | | 100,000 | |
| | 210,000 | | | 3.000 | | | 10/01/18 | | | | 212,597 | |
| | 160,000 | | | 3.000 | | | 10/01/19 | | | | 163,491 | |
| | 75,000 | | | 4.000 | | | 10/01/20 | | | | 79,429 | |
| | 85,000 | | | 4.000 | | | 10/01/21 | | | | 91,292 | |
| | 85,000 | | | 4.000 | | | 10/01/22 | | | | 92,031 | |
| Industrial Development Board PCRB for Alabama Power
Company Barry Plant Project RMKT 03/20/17
Series 2007 A (A-/A1)(b)(c) |
|
| | 6,000,000 | | | 1.850 | | | 03/24/20 | | | | 6,047,880 | |
| | Jefferson County RB Refunding Warrants Series 2017 (AA/NR) | |
| | 1,275,000 | | | 5.000 | | | 09/15/19 | | | | 1,366,813 | |
| | 3,000,000 | | | 5.000 | | | 09/15/21 | | | | 3,392,580 | |
| | 1,200,000 | | | 5.000 | | | 09/15/22 | | | | 1,382,916 | |
| | 2,000,000 | | | 5.000 | | | 09/15/23 | | | | 2,337,420 | |
| Jefferson County Subordinate Lien Sewer RB Warrants
Series 2013 D (BBB-/NR) |
|
| | 1,750,000 | | | 5.000 | | | 10/01/17 | | | | 1,750,000 | |
| | 1,875,000 | | | 5.000 | | | 10/01/18 | | | | 1,932,563 | |
| | 1,300,000 | | | 5.000 | | | 10/01/21 | | | | 1,416,610 | |
| | 1,745,000 | | | 5.000 | | | 10/01/22 | | | | 1,925,328 | |
| | | | | | | | | | | | |
| | | | | | | | | | | 94,820,406 | |
| | |
| Alaska – 0.1% | |
| Northern Tobacco Securitization Corp. RB Asset-Backed Bonds
Series 2006 A (NR/Ba2) |
|
| | 3,260,000 | | | 4.625 | | | 06/01/23 | | | | 3,360,962 | |
| | |
| Arizona – 3.3% | |
| Arizona Health Facilities Authority Hospital RB for Banner
Health Series 2007 B (AA-/NR)(d) |
|
| | 52,475,000 | | | (3 Mo. LIBOR + 0.81%),
1.680 | | | 01/01/37 | | | | 45,918,249 | |
| Arizona Health Facilities Authority Hospital RB Refunding for
Phoenix Children’s Hospital Series 2013 A (BBB+/NR)(b) |
|
| | 5,000,000 | | | (SIFMA Municipal
Swap Index Yield +
1.85%, 12.00% Cap),
2.790 | | | 02/05/20 | | | | 5,091,250 | |
| Arizona School Facilities Board COPS Refunding Series 2015 A
(AA-/Aa3) |
|
| | 8,000,000 | | | 5.000 | | | 09/01/20 | | | | 8,864,640 | |
| Arizona Transportation Board Excise Tax RB Refunding for
Regional Area Road Series 2014 (AA+/Aa1) |
|
| | 4,150,000 | | | 5.000 | | | 07/01/19 | | | | 4,434,067 | |
| | |
| | Municipal Bonds – (continued) | |
| | Arizona – (continued) | |
| Arizona Transportation Board Excise Tax RB Refunding for
Regional Area Road Series 2016 (AA+/Aa1) |
|
| 5,820,000 | | | 5.000 | | | 07/01/21 | | | | 6,636,488 | |
| | Glendale City GO Refunding Bonds Series 2015 (AGM) (AA/A1) | |
| | 365,000 | | | 4.000 | | | 07/01/18 | | | | 373,041 | |
| | 1,600,000 | | | 4.000 | | | 07/01/19 | | | | 1,680,208 | |
| | 3,000,000 | | | 4.000 | | | 07/01/20 | | | | 3,227,760 | |
| | 3,400,000 | | | 4.000 | | | 07/01/21 | | | | 3,734,390 | |
| | 1,665,000 | | | 5.000 | | | 07/01/22 | | | | 1,930,867 | |
| Glendale City Senior Lien Water & Sewer RB Refunding
Obligations Series 2015 (AA/A1) |
|
| | 10,830,000 | | | 5.000 | | | 07/01/19 | | | | 11,559,509 | |
| | Maricopa County Arizona COPS Series 2015 (AA+/Aa1) | |
| | 9,000,000 | | | 3.000 | | | 07/01/18 | | | | 9,135,810 | |
| Maricopa County Arizona Paradise Valley Unified School District
No. 69 GO Refunding Bonds for School Improvement Project
of 2011 Series 2015 E (AAA/Aa2) |
|
| | 12,115,000 | | | 3.000 | | | 07/01/19 | | | | 12,537,087 | |
| Maricopa County Arizona Pollution Control Corp. PCRB
Refunding for Arizona Public Service Co. Palo Verde Project
RMKT 05/30/13 Series 2009 C (A-/A2)(b)(c) |
|
| | 6,500,000 | | | 1.750 | | | 05/30/18 | | | | 6,520,345 | |
| Maricopa County Arizona School Improvement Refunding for
Peoria Unified School District No. 11 Series 2015
(AGM) (AA/A2) |
|
| | 3,000,000 | | | 4.000 | | | 07/01/19 | | | | 3,146,670 | |
| Maricopa County Community College District GO Bonds
Series 2013 (AAA/Aaa) |
|
| | 10,010,000 | | | 3.000 | | | 07/01/19 | | | | 10,351,741 | |
| Maricopa County Community College District GO Refunding
Bonds Series 2016 (AAA/Aaa) |
|
| | 16,400,000 | | | 5.000 | | | 07/01/23 | | | | 19,487,956 | |
| Maricopa County Phoenix High School District No. 210 School
Improvement GO Refunding Bonds Series 2014 (AA/Aa2) |
|
| | 1,000,000 | | | 4.000 | | | 07/01/18 | | | | 1,023,240 | |
| | 1,000,000 | | | 3.000 | | | 07/01/19 | | | | 1,034,840 | |
| | Pima County COPS Series 2016 A (A+/NR) | |
| | 5,335,000 | | | 5.000 | | | 12/01/18 | | | | 5,571,767 | |
| Yavapai County IDA Solid Waste Disposal RB for Waste
Management, Inc. Project Series 2002 (AMT) (A-/NR)(b)(c) |
|
| | 5,000,000 | | | 2.125 | | | 06/01/18 | | | | 5,018,150 | |
| | | | | | | | | | | | |
| | | | | | | | | | | 167,278,075 | |
| | |
| | Arkansas – 1.0% | |
| Arkansas Development Finance Authority State Park Facilities
RB Refunding for Mt. Magazine Project Series 2012 (AGM)
(AA/NR) |
|
| | 1,885,000 | | | 3.000 | | | 01/01/18 | | | | 1,894,538 | |
| Arkansas State Federal Highway GO Bonds Series 2014
(AA/Aa1) |
|
| | 2,000,000 | | | 5.000 | | | 10/01/20 | | | | 2,227,880 | |
| Arkansas State GO Bonds for Four-Lane Highway Construction
& Improvement Series 2013 (AA/Aa1) |
|
| | 17,775,000 | | | 3.250 | | | 06/15/22 | | | | 19,062,977 | |
| Jefferson County Pollution Control RB Refunding for Entergy
Arkansas, Inc. Project Series 2013 (A/A2) |
|
| | 3,000,000 | | | 1.550 | | | 10/01/17 | | | | 3,000,000 | |
| | |
| | |
| 64 | | The accompanying notes are an integral part of these financial statements. |
GOLDMAN SACHS SHORT DURATION TAX-FREE FUND
| | | | | | | | | | | | |
Principal
Amount | | | Interest
Rate | | Maturity
Date | | | Value | |
| | Municipal Bonds – (continued) | |
| | Arkansas – (continued) | |
| | Little Rock Arkansas Sewer RB Refunding Series 2015 (NR/Aa3) | |
| $ | 1,240,000 | | | 3.000 % | | | 04/01/20 | | | $ | 1,294,064 | |
| | 1,075,000 | | | 3.000 | | | 10/01/20 | | | | 1,129,470 | |
| Pulaski County Little Rock School District Construction GO
Bonds Series 2017 (ST AID WITHHLDG) (NR/Aa2) |
|
| | 4,725,000 | | | 3.000 | | | 02/01/21 | | | | 4,965,172 | |
| | 5,395,000 | | | 3.000 | | | 02/01/23 | | | | 5,690,430 | |
| Pulaski County Little Rock School District GO Refunding Bonds
Series 2015 (ST AID WITHHLDG) (NR/Aa2) |
|
| | 6,000,000 | | | 3.000 | | | 02/01/21 | | | | 6,315,000 | |
| Springdale Arkansas Sales and Use Tax RB Series 2012
(AA-/NR) |
|
| | 1,915,000 | | | 2.000 | | | 11/01/17 | | | | 1,916,590 | |
| | 1,465,000 | | | 2.000 | | | 11/01/18 | | | | 1,479,401 | |
| | 720,000 | | | 2.000 | | | 11/01/19 | | | | 730,742 | |
| | | | | | | | | | | | |
| | | | | | | | | | | 49,706,264 | |
| | |
| | California – 8.5% | |
| Alameda Corridor Transportation Authority RB for Capital
Appreciation Refunding Subordinate Lien Series 2004 A
(AMBAC) (BBB+/Baa2)(e) |
|
| | 745,000 | | | 0.000 | | | 10/01/19 | | | | 709,963 | |
| | 255,000 | | | 0.000 | | | 10/01/20 | | | | 236,227 | |
| Alameda Corridor Transportation Authority RB for Capital
Appreciation Refunding Subordinate Lien Series 2004 A
(ETM) (AMBAC) (AAA/Aaa)(a)(e) |
|
| | 9,420,000 | | | 0.000 | | | 10/01/19 | | | | 9,225,289 | |
| | 12,300,000 | | | 0.000 | | | 10/01/20 | | | | 11,870,730 | |
| Anaheim Redevelopment Agency Tax Allocation Refunding for
Merged Redevelopment Project Area Series 2007 A
(AGM) (AA/A2) |
|
| | 50,000 | | | 5.000 | | | 02/01/24 | | | | 50,655 | |
| Atwater Wastewater RB Refunding Series 2017 A (AGM)
(AA/NR) |
|
| | 220,000 | | | 5.000 | | | 05/01/20 | | | | 240,568 | |
| | 500,000 | | | 5.000 | | | 05/01/21 | | | | 562,410 | |
| | 325,000 | | | 5.000 | | | 05/01/22 | | | | 373,740 | |
| | 300,000 | | | 5.000 | | | 05/01/23 | | | | 351,594 | |
| | 265,000 | | | 5.000 | | | 05/01/24 | | | | 315,567 | |
| Bay Area Toll Authority Toll Bridge Authority RB for San
Francisco Bay Area RMKT 05/01/13 Series 2006 C-1
(AA/Aa3)(b) |
|
| | 10,000,000 | | | (SIFMA Municipal
Swap Index Yield +
0.90%, 12.00% Cap),
1.840 | | | 05/01/23 | | | | 10,107,400 | |
| Bay Area Toll Authority Toll Bridge Authority RB for San
Francisco Bay Area RMKT 06/03/13 Series 2006 C-1
(AA/Aa3)(b) |
|
| | 7,000,000 | | | (SIFMA Municipal
Swap Index Yield +
0.90%, 12.00% Cap),
1.840 | | | 05/01/23 | | | | 7,075,180 | |
| | |
| | Municipal Bonds – (continued) | |
| | California – (continued) | |
| Bay Area Toll Authority Toll Bridge Authority RB for San
Francisco Bay Area RMKT 12/20/12 Series 2007 E-3
(AA/Aa3)(b) |
|
| $ | 1,225,000 | | | (SIFMA Municipal
Swap Index Yield +
0.70%, 12.00% Cap),
1.640% | | | 10/01/19 | | | $ | 1,228,957 | |
| Bay Area Toll Authority Toll Bridge Authority RB for San
Francisco Bay Area Series 2001 A (AA/NR)(b) |
|
| | 15,000,000 | | | (SIFMA Municipal
Swap Index Yield +
1.25%, 12.00% Cap),
2.190 | | | 04/01/27 | | | | 15,242,250 | |
| Bay Area Toll Authority Toll Bridge Authority RB for San
Francisco Bay Area Series 2014 (AA/Aa3)(b)(c) |
|
| | 2,000,000 | | | 1.500 | | | 04/02/18 | | | | 2,000,000 | |
| Bay Area Toll Authority Toll Bridge Authority RB for San
Francisco Bay Area Series 2017 E (AA/Aa3)(b)(c) |
|
| | 14,430,000 | | | 1.375 | | | 04/01/20 | | | | 14,437,071 | |
| Benicia Unified School District GO Refunding Bonds
Series 1997 A (NATL-RE FGIC) (A+/Aa3)(e) |
|
| | 1,510,000 | | | 0.000 | | | 08/01/18 | | | | 1,496,108 | |
| Bonita Canyon Public Facilities Financing Authority Special Tax
for Community Facilities District No. 98-1 Series 2012
(NR/NR) |
|
| | 1,000,000 | | | 3.250 | | | 09/01/18 | | | | 1,008,500 | |
| California Municipal Finance Authority RB for Community
Medical Centers Series 2017 A (A-/Baa1) |
|
| | 750,000 | | | 5.000 | | | 02/01/18 | | | | 758,932 | |
| | 1,000,000 | | | 5.000 | | | 02/01/19 | | | | 1,045,820 | |
| | 1,100,000 | | | 5.000 | | | 02/01/20 | | | | 1,186,680 | |
| California Municipal Finance Authority RB Refunding for
NorthBay Healthcare Group Series 2013 B (BBB-/NR) |
|
| | 3,480,000 | | | 5.000 | | | 11/01/17 | | | | 3,489,709 | |
| California Municipal Finance Authority RB Refunding for
NorthBay Healthcare Group Series 2016 A (BBB-/NR) |
|
| | 750,000 | | | 2.000 | | | 11/01/18 | | | | 752,070 | |
| California Municipal Finance Authority Student Housing RB for
Bowles Hall Foundation Series 2015 A (NR/Baa3) |
|
| | 150,000 | | | 3.000 | | | 06/01/20 | | | | 153,199 | |
| | 100,000 | | | 4.000 | | | 06/01/22 | | | | 107,013 | |
| California Pollution Control Financing Authority PCRB
Refunding for U.S.A. Waste Services, Inc. Series 1998 A
(AMT) (A-/NR) |
|
| | 1,900,000 | | | 1.500 | | | 06/01/18 | | | | 1,906,365 | |
| California State University Systemwide RB Series 2016 B-1
(AA-/Aa2)(b)(c) |
|
| | 10,000,000 | | | 3.000 | | | 11/01/19 | | | | 10,290,000 | |
| California State Various Purpose GO Bonds Series 2009
(AA-/Aa3) |
|
| | 22,955,000 | | | 6.000 | | | 04/01/38 | | | | 24,585,723 | |
| California State Various Purpose GO Bonds Series 2010
(AA-/Aa3) |
|
| | 15,000,000 | | | 6.000 | | | 03/01/33 | | | | 16,736,400 | |
| | |
| | |
| The accompanying notes are an integral part of these financial statements. | | 65 |
GOLDMAN SACHS SHORT DURATION TAX-FREE FUND
Schedule of Investments (continued)
September 30, 2017 (Unaudited)
| | | | | | | | | | | | | | |
Principal
Amount | | | Interest
Rate | | | Maturity
Date | | | Value | |
| | Municipal Bonds – (continued) | |
| | California – (continued) | |
| California State Various Purpose GO Bonds Series 2011
(AA-/Aa3) |
|
| $ | 5,070,000 | | | | 5.000 | % | | | 10/01/19 | | | $ | 5,470,530 | |
| California State Various Purpose GO Bonds Series 2016
(AA-/Aa3) |
|
| | 5,000,000 | | | | 5.000 | | | | 09/01/20 | | | | 5,558,650 | |
| California State Various Purpose GO Bonds Series 2016
(AA-/Aa3)(b)(c) |
|
| | 52,000,000 | | | | 4.000 | | | | 12/01/21 | | | | 57,081,440 | |
| California State Various Purpose GO Refunding Bonds
Series 2012 (AA-/Aa3) |
|
| | 2,055,000 | | | | 5.000 | | | | 09/01/19 | | | | 2,209,392 | |
| California Statewide Communities Development Authority
Student Housing RB for University of California Irvine East
Campus Apartments, Phase IV-A CHF – Irvine, LLC
Series 2017 (NR/Baa1) |
|
| | 1,545,000 | | | | 5.000 | | | | 05/15/21 | | | | 1,748,059 | |
| | 1,750,000 | | | | 5.000 | | | | 05/15/22 | | | | 2,028,110 | |
| | 1,470,000 | | | | 5.000 | | | | 05/15/23 | | | | 1,735,673 | |
| Corona-Norco Unified School District Public Financing Authority
Special Tax Refunding Senior Lien Series 2013 A (A-/NR) |
|
| | 275,000 | | | | 4.000 | | | | 09/01/18 | | | | 282,260 | |
| | Del Mar Race Track Authority RB Series 2015 (BBB-/NR) | |
| | 295,000 | | | | 3.000 | | | | 10/01/17 | | | | 295,000 | |
| Fontana Redevelopment Agency Tax Allocation Refunding for
Jurupa Hills Redevelopment Project Series 1999 A (A/NR) |
|
| | 240,000 | | | | 5.500 | | | | 10/01/17 | | | | 240,000 | |
| Golden State Tobacco Securitization Corp. California Tobacco
Settlement RB Asset-Backed Bonds Series 2017 A-1 (A/NR) |
|
| | 6,000,000 | | | | 5.000 | | | | 06/01/20 | | | | 6,608,580 | |
| Golden State Tobacco Securitization Corp. California Tobacco
Settlement RB Asset-Backed Bonds Series 2017 A-1
(BBB+/NR) |
|
| | 5,000,000 | | | | 5.000 | | | | 06/01/21 | | | | 5,655,450 | |
| | 6,000,000 | | | | 5.000 | | | | 06/01/22 | | | | 6,924,300 | |
| | 6,000,000 | | | | 5.000 | | | | 06/01/23 | | | | 7,025,340 | |
| Irvine City Limited Obligation Improvement Bond Reassessment
District No. 12-1 Series 2012 Act 1915 (BBB+/NR) |
|
| | 1,250,000 | | | | 4.000 | | | | 09/02/18 | | | | 1,283,100 | |
| | 1,895,000 | | | | 4.000 | | | | 09/02/19 | | | | 1,996,193 | |
| Irvine City Limited Obligation Improvement Bond Reassessment
District No. 15-2 Series 2015 (NR/NR) |
|
| | 500,000 | | | | 4.000 | | | | 09/02/18 | | | | 512,680 | |
| | 1,000,000 | | | | 4.000 | | | | 09/02/19 | | | | 1,049,700 | |
| | 725,000 | | | | 4.000 | | | | 09/02/20 | | | | 775,409 | |
| | 775,000 | | | | 5.000 | | | | 09/02/21 | | | | 870,806 | |
| Irvine Unified School District No. 09-1 Special Tax for
Community Facilities Series 2017 A (NR/NR) |
|
| | 1,765,000 | | | | 5.000 | | | | 09/01/22 | | | | 2,034,692 | |
| | 1,135,000 | | | | 5.000 | | | | 09/01/23 | | | | 1,330,141 | |
| Irvine Unified School District No. 09-1 Special Tax for
Community Facilities Series 2017 B (NR/NR) |
|
| | 600,000 | | | | 4.000 | | | | 09/01/23 | | | | 667,644 | |
| Irvine Unified School District No. 09-1 Special Tax for
Community Facilities Series 2017 C (NR/NR) |
|
| | 520,000 | | | | 4.000 | | | | 09/01/23 | | | | 578,625 | |
| | |
| | Municipal Bonds – (continued) | |
| | California – (continued) | |
| Irvine Unified School District No. 09-1 Special Tax for
Community Facilities Series 2017 D (NR/NR) |
|
| $ | 255,000 | | | | 3.000 | % | | | 09/01/22 | | | $ | 267,725 | |
| | 415,000 | | | | 4.000 | | | | 09/01/23 | | | | 459,828 | |
| Lake Elsinore Public Financing Authority Local Agency RB
Refunding for Community Facilities District No. 88-3
Series 2015 B (AGM) (AA/NR) |
|
| | 1,235,000 | | | | 5.000 | | | | 09/01/20 | | | | 1,365,478 | |
| Lake Elsinore Public Financing Authority Local Agency RB
Refunding Series 2015 (NR/NR) |
|
| | 1,495,000 | | | | 4.000 | | | | 09/01/18 | | | | 1,529,774 | |
| | 1,000,000 | | | | 4.000 | | | | 09/01/19 | | | | 1,046,720 | |
| | 840,000 | | | | 5.000 | | | | 09/01/21 | | | | 938,028 | |
| Long Beach California Harbor Revenue Short-Term Notes
Series 2014 C (AA/NR) |
|
| | 20,000,000 | | | | 5.000 | | | | 11/15/18 | | | | 20,911,200 | |
| Los Angeles County Public Works Financing Authority Lease RB
for Multiple Capital Projects II Series 2012 (AA/Aa2) |
|
| | 1,500,000 | | | | 5.000 | | | | 08/01/18 | | | | 1,551,345 | |
| Miramar Ranch North California Special Tax Refunding for
Community Facilities District No.1 Series 2012 (A/NR) |
|
| | 3,075,000 | | | | 4.000 | | | | 09/01/19 | | | | 3,242,557 | |
| Mountain View California Shoreline Regional Park Community
Tax Allocation Series 2011 A (A/NR) |
|
| | 350,000 | | | | 5.000 | | | | 08/01/18 | | | | 361,389 | |
| Murrieta Public Financing Authority Special Tax RB Refunding
Series 2012 (BBB-/NR) |
|
| | 1,965,000 | | | | 5.000 | | | | 09/01/18 | | | | 2,031,712 | |
| | 1,000,000 | | | | 5.000 | | | | 09/01/19 | | | | 1,066,860 | |
| Natomas Unified School District GO Refunding Bonds
Series 2013 (BAM) (AA/A1) |
|
| | 410,000 | | | | 3.000 | | | | 09/01/18 | | | | 417,679 | |
| | 730,000 | | | | 4.000 | | | | 09/01/20 | | | | 789,393 | |
| | 650,000 | | | | 4.000 | | | | 09/01/21 | | | | 717,490 | |
| Orange County Sanitation District COPS RB Refunding
Certificate Anticipation Notes Series 2016 B (AAA/NR) |
|
| | 21,065,000 | | | | 2.000 | | | | 12/15/18 | | | | 21,342,847 | |
| Palm Desert Financing Authority Tax Allocation RB Refunding
for Housing Set-Aside Series 2007 (NATL-RE) (NR/A3)(a) |
|
| | 100,000 | | | | 5.000 | | | | 10/01/17 | | | | 100,000 | |
| Palo Alto Limited Obligation Refunding & Improvement for
University Avenue Area Off-Street Parking Assessment
District Series 2012 (BBB/NR) |
|
| | 385,000 | | | | 3.000 | | | | 09/02/18 | | | | 391,102 | |
| Rancho Cordova Community Facilities District No. 2003-1 Special
Tax Refunding for Sunridge Anatolia Series 2016 (NR/NR) |
|
| | 450,000 | | | | 3.000 | | | | 09/01/18 | | | | 456,943 | |
| | 650,000 | | | | 4.000 | | | | 09/01/20 | | | | 690,944 | |
| | 380,000 | | | | 4.000 | | | | 09/01/22 | | | | 412,961 | |
| Roseville California Community Facilities District No. 1 Special Tax
Refunding for Fiddyment Ranch Project Series 2017 (NR/NR) |
|
| | 175,000 | | | | 2.000 | | | | 09/01/18 | | | | 176,503 | |
| | 725,000 | | | | 3.000 | | | | 09/01/19 | | | | 746,931 | |
| | 1,000,000 | | | | 4.000 | | | | 09/01/20 | | | | 1,066,810 | |
| | 675,000 | | | | 5.000 | | | | 09/01/21 | | | | 753,503 | |
| | 800,000 | | | | 5.000 | | | | 09/01/22 | | | | 903,720 | |
| | 1,835,000 | | | | 5.000 | | | | 09/01/23 | | | | 2,099,699 | |
| | |
| | |
| 66 | | The accompanying notes are an integral part of these financial statements. |
GOLDMAN SACHS SHORT DURATION TAX-FREE FUND
| | | | | | | | | | | | |
Principal
Amount | | | Interest
Rate | | Maturity
Date | | | Value | |
| | Municipal Bonds – (continued) | |
| | California – (continued) | |
| Sacramento City Schools Joint Powers Financing Authority Lease
RB Refunding Series 2014 A (BAM) (AA/NR) |
|
| $ | 1,000,000 | | | 4.000% | | | 03/01/18 | | | $ | 1,013,140 | |
| Sacramento County Regional Transit District Farebox RB
Series 2012 (ETM) (A-/A3)(a) |
|
| | 250,000 | | | 5.000 | | | 03/01/18 | | | | 254,215 | |
| | 730,000 | | | 5.000 | | | 03/01/19 | | | | 771,230 | |
| Sacramento County Sanitation District Financing Authority RB
Refunding for Sacramento County Regional Series 2007 B
(NATL-RE FGIC) (AA/Aa3)(d) |
|
| | 43,220,000 | | | (3 Mo. LIBOR + 0.53%),
1.412 | | | 12/01/35 | | | | 38,959,372 | |
| Salida Area Public Facilities Financing Agency Community
Facilities District No. 1988-1 Special Tax Bonds Series 2011
(AGM) (AA/NR) |
|
| | 1,310,000 | | | 3.000 | | | 09/01/18 | | | | 1,335,257 | |
| San Bernardino City Unified School District GO Refunding
Bonds Series 2013 A (A/A2) |
|
| | 800,000 | | | 5.000 | | | 08/01/18 | | | | 826,504 | |
| San Bernardino City Unified School District GO Refunding
Bonds Series 2013 A (AGM) (AA/A2) |
|
| | 150,000 | | | 5.000 | | | 08/01/19 | | | | 160,697 | |
| San Francisco City & County GO Bonds for Clean & Safe
Neighborhood Parks Series 2012 B (AA+/Aa1) |
|
| | 2,750,000 | | | 4.000 | | | 06/15/19 | | | | 2,893,963 | |
| San Francisco City & County Public Utilities Commission Water
RB Refunding Series 2009 A (AA-/Aa3)(a) |
|
| | 19,915,000 | | | 5.125 | | | 11/01/19 | | | | 21,617,135 | |
| San Francisco City & County Unified School District Election
2016 GO Bonds Series 2017 A (AA-/Aa2) |
|
| | 13,335,000 | | | 3.000 | | | 06/15/19 | | | | 13,808,526 | |
| San Juan Unified School District Election of 2012 GO Bonds
Series 2014 B (NR/Aa2) |
|
| | 2,000,000 | | | 3.000 | | | 08/01/19 | | | | 2,075,960 | |
| San Marcos Public Financing Authority Special Tax RB
Refunding Series 2012 (A-/NR) |
|
| | 1,000,000 | | | 4.000 | | | 09/01/19 | | | | 1,053,520 | |
| San Ramon Valley Unified School District GO Bonds
Series 1998 A (NATL-RE FGIC) (AA/Aa1)(e) |
|
| | 2,000,000 | | | 0.000 | | | 07/01/18 | | | | 1,981,820 | |
| Simi Valley Community Development Agency Tax Allocation
Refunding for Tapo Canyon and West End Project Series 2003
(NATL-RE FGIC) (AA-/A3) |
|
| | 600,000 | | | 5.250 | | | 09/01/18 | | | | 601,944 | |
| Stockton Public Financing Authority RB Refunding Series 2016
A (A-/NR) |
|
| | 710,000 | | | 2.000 | | | 09/02/18 | | | | 715,531 | |
| | 410,000 | | | 2.000 | | | 09/02/19 | | | | 416,187 | |
| Stockton Unified School District GO Refunding Bonds
Series 2012 (AGM) (AA/A2) |
|
| | 1,090,000 | | | 5.000 | | | 07/01/19 | | | | 1,164,207 | |
| Tobacco Securitization Authority Northern California Tobacco
Settlement RB Asset-Backed Bonds Series 2005 A-1 (B+/Ba2) |
|
| | 1,120,000 | | | 4.750 | | | 06/01/23 | | | | 1,120,179 | |
| | |
| | Municipal Bonds – (continued) | |
| | California – (continued) | |
| University of California Regents Medical Center Pooled RB
Refunding Series 2007 C-2 (NATL-RE) (AA-/Aa3)(d) |
|
| $ | 3,500,000 | | | (3 Mo. LIBOR +
0.61%, 12.00% Cap),
1.491% | | | 05/15/30 | | | $ | 3,388,560 | |
| | 15,000,000 | | | (3 Mo. LIBOR +
0.74%, 12.00% Cap),
1.621 | | | 05/15/43 | | | | 12,727,650 | |
| Ventura County Capital Appreciation GO Bonds for Conejo
Valley Unified School District for Election of 2014 Series A
(AGM) (AA/A1)(e) |
|
| | 1,775,000 | | | 0.000 | | | 08/01/20 | | | | 1,700,130 | |
| | | | | | | | | | | | |
| | | | | | | | | | | 425,930,762 | |
| | |
| Colorado – 1.6% | |
| Colorado E-470 Public Highway Authority Senior RB Refunding
Series 2015 A (A-/A3) |
|
| | 1,000,000 | | | 5.000 | | | 09/01/20 | | | | 1,102,630 | |
| Colorado Health Facilities Authority RB Refunding for Covenant
Retirement Communities, Inc. Series 2015 A (BBB+/NR) |
|
| | 500,000 | | | 4.000 | | | 12/01/18 | | | | 514,270 | |
| | 1,000,000 | | | 5.000 | | | 12/01/20 | | | | 1,094,000 | |
| Colorado Health Facilities Authority RB Refunding for
Evangelical Lutheran Good Samaritan Society Project
Series 2017 (BBB/NR) |
|
| | 500,000 | | | 5.000 | | | 06/01/18 | | | | 511,595 | |
| | 500,000 | | | 5.000 | | | 06/01/19 | | | | 527,495 | |
| | 400,000 | | | 5.000 | | | 06/01/20 | | | | 435,724 | |
| | 700,000 | | | 5.000 | | | 06/01/21 | | | | 779,534 | |
| | 500,000 | | | 5.000 | | | 06/01/22 | | | | 567,620 | |
| Denver Colorada City & County Board Water Commissioners RB
Refunding for Master Resolution Water Series 2016 A
(AAA/Aaa) |
|
| | 2,770,000 | | | 5.000 | | | 09/15/21 | | | | 3,176,027 | |
| Denver Colorada City & County Board Water Commissioners RB
Refunding for Master Resolution Water Series 2016 B
(AAA/Aaa) |
|
| | 2,655,000 | | | 5.000 | | | 09/15/21 | | | | 3,044,170 | |
| Denver Colorado City & County COPS Series 2008 A1
(AA+/Aa1)(b)(c) |
|
| | 2,200,000 | | | 0.950 | | | 10/02/17 | | | | 2,200,000 | |
| Denver Colorado City & County COPS Series 2008 A2
(AA+/Aa1)(b)(c) |
|
| | 1,000,000 | | | 0.800 | | | 10/05/17 | | | | 1,000,000 | |
| Denver Colorado City & County COPS Series 2008 A3
(AA+/Aa1)(b)(c) |
|
| | 1,600,000 | | | 0.950 | | | 10/02/17 | | | | 1,600,000 | |
| Denver Colorado Health and Hospital Authority Healthcare RB
Refunding Series 2017 A (BBB/NR)(f) |
|
| | 2,000,000 | | | 5.000 | | | 12/01/18 | | | | 2,080,700 | |
| | 2,000,000 | | | 5.000 | | | 12/01/19 | | | | 2,142,060 | |
| | 2,415,000 | | | 5.000 | | | 12/01/20 | | | | 2,649,810 | |
| | 4,110,000 | | | 5.000 | | | 12/01/21 | | | | 4,594,610 | |
| | 4,315,000 | | | 5.000 | | | 12/01/22 | | | | 4,885,529 | |
| | 4,530,000 | | | 5.000 | | | 12/01/23 | | | | 5,178,379 | |
| | 4,760,000 | | | 5.000 | | | 12/01/24 | | | | 5,485,091 | |
| | |
| | |
| The accompanying notes are an integral part of these financial statements. | | 67 |
GOLDMAN SACHS SHORT DURATION TAX-FREE FUND
Schedule of Investments (continued)
September 30, 2017 (Unaudited)
| | | | | | | | | | | | | | |
Principal
Amount | | | Interest
Rate | | | Maturity
Date | | | Value | |
| | Municipal Bonds – (continued) | |
| | Colorado – (continued) | |
| Denver Colorado Health and Hospital Authority Healthcare RB
Series 2007 B (BBB/NR)(d) |
|
| $ | 16,355,000 | | |
| (3 Mo. LIBOR +
1.10%, 15.00% Cap),
1.982% |
| | | 12/01/33 | | | $ | 14,557,422 | |
| E-470 Public Highway Authority Senior RB Series 2017 A
(A-/A3)(b) |
|
| | 5,250,000 | | |
| (1 Mo. LIBOR +
0.90%, 10.00% Cap),
1.725 |
| | | 09/01/19 | | | | 5,283,390 | |
| University of Colorado Hospital Authority RB Series 2017 C-1
(AA-/Aa3)(b)(c) |
|
| | 6,360,000 | | | | 4.000 | | | | 03/01/20 | | | | 6,684,296 | |
| University of Colorado Hospital Authority RB Series 2017 C-2
(AA-/Aa3)(b)(c) |
|
| | 7,215,000 | | | | 5.000 | | | | 03/01/22 | | | | 8,132,532 | |
| | | | | | | | | | | | | | |
| | | | | | | | | | | | | 78,226,884 | |
| | |
| Connecticut – 2.3% | |
| | Connecticut State GO Bonds Series 2013 A (A+/A1)(d) | |
| | 2,000,000 | | |
| (SIFMA Municipal
Swap Index Yield +
0.42%, 10.00% Cap),
1.360 |
| | | 03/01/18 | | | | 2,000,880 | |
| | Connecticut State GO Bonds Series 2013 C (A+/A1) | |
| | 7,555,000 | | | | 5.000 | | | | 07/15/19 | | | | 8,051,590 | |
| | Connecticut State GO Bonds Series 2015 C (A+/A1)(d) | |
| | 10,000,000 | | |
| (SIFMA Municipal
Swap Index Yield +
0.80%, 10.00% Cap),
1.740 |
| | | 06/15/20 | | | | 10,018,500 | |
| | Connecticut State GO Bonds Series 2015 F (A+/A1) | |
| | 4,435,000 | | | | 5.000 | | | | 11/15/23 | | | | 5,133,690 | |
| | Connecticut State GO Bonds Series 2016 D (A+/A1) | |
| | 12,490,000 | | | | 5.000 | | | | 08/15/20 | | | | 13,697,158 | |
| | Connecticut State GO Bonds Series 2017 A (A+/A1) | |
| | 1,705,000 | | | | 5.000 | | | | 04/15/22 | | | | 1,927,980 | |
| | Connecticut State GO Refunding Bonds Series 2017 B (A+/A1) | |
| | 18,110,000 | | | | 3.000 | | | | 04/15/22 | | | | 18,915,171 | |
| Connecticut State Health & Educational Facilities Authority RB
for Sacred Heart University Series 2012 H (AGM) (AA/A2) |
|
| | 1,260,000 | | | | 4.000 | | | | 07/01/18 | | | | 1,287,002 | |
| Connecticut State Health & Educational Facilities Authority RB
Refunding for Yale University Series 2017 B-1 (AAA/Aaa)(b)(c) |
|
| | 23,880,000 | | | | 5.000 | | | | 07/01/20 | | | | 26,301,671 | |
| Hartford County Metropolitan District GO Refunding Bonds
Series 2017 B (SP-1+/NR) |
|
| | 12,000,000 | | | | 3.000 | | | | 08/01/18 | | | | 12,127,920 | |
| New Haven GO Refunding Bonds Series 2015 B (BAM)
(AA/Baa1) |
|
| | 6,115,000 | | | | 5.000 | | | | 08/15/21 | | | | 6,835,347 | |
| | Town of Hamden GO Refunding Bonds Series 2013 (A+/Baa1) | |
| | 1,685,000 | | | | 5.000 | | | | 08/15/18 | | | | 1,737,201 | |
| | 2,000,000 | | | | 5.000 | | | | 08/15/19 | | | | 2,130,260 | |
| | |
| | Municipal Bonds – (continued) | |
| | Connecticut – (continued) | |
| | University of Connecticut RB Refunding Series 2010 A (AA-/A1) | |
| $ | 2,775,000 | | | | 5.000 | % | | | 02/15/21 | | | $ | 3,007,379 | |
| | West Haven GO Refunding Bonds Series 2012 (AGM) (AA/A2) | |
| | 2,100,000 | | | | 4.000 | | | | 08/01/18 | | | | 2,143,512 | |
| | | | | | | | | | | | | | |
| | | | | | | | | | | | | 115,315,261 | |
| | |
| Delaware – 0.1% | |
| Delaware Transportation Authority Transportation System Senior
RB Refunding Series 2010 A (AA+/Aa2) |
|
| | 1,900,000 | | | | 5.000 | | | | 07/01/19 | | | | 2,029,713 | |
| New Castle County GO Refunding Bonds Series 2015
(AAA/Aaa) |
|
| | 1,000,000 | | | | 5.000 | | | | 10/01/20 | | | | 1,115,200 | |
| | | | | | | | | | | | | | |
| | | | | | | | | | | | | 3,144,913 | |
| | |
| Florida – 3.3% | |
| Anthem Park Community Development District Special
Assessment RB Refunding Senior Series 2016 A-1 (BBB-/NR) |
|
| | 315,000 | | | | 2.000 | | | | 05/01/18 | | | | 315,214 | |
| | 320,000 | | | | 2.000 | | | | 05/01/19 | | | | 319,357 | |
| | 325,000 | | | | 2.000 | | | | 05/01/20 | | | | 321,929 | |
| | 335,000 | | | | 2.250 | | | | 05/01/21 | | | | 331,807 | |
| | 340,000 | | | | 2.250 | | | | 05/01/22 | | | | 333,737 | |
| | 350,000 | | | | 2.500 | | | | 05/01/23 | | | | 344,075 | |
| Atlantic Beach Health Care Facilities RB Refunding for Fleet
Landing Project Series 2013 A (BBB/NR) |
|
| | 970,000 | | | | 4.000 | | | | 11/15/18 | | | | 994,560 | |
| Avelar Creek Community Development District Special
Assessment Refunding Series 2016 (BBB+/NR) |
|
| | 160,000 | | | | 2.000 | | | | 05/01/18 | | | | 160,448 | |
| | 165,000 | | | | 2.000 | | | | 05/01/19 | | | | 165,612 | |
| | 170,000 | | | | 2.000 | | | | 05/01/20 | | | | 169,956 | |
| | 170,000 | | | | 2.000 | | | | 05/01/21 | | | | 169,009 | |
| Bartram Park Community Development District Special
Assessment RB Refunding for City of Jacksonville Florida
Senior Lien Series 2015 A-1 (BBB+/NR) |
|
| | 570,000 | | | | 2.000 | | | | 05/01/18 | | | | 571,596 | |
| | 580,000 | | | | 2.300 | | | | 05/01/19 | | | | 584,849 | |
| | 600,000 | | | | 2.600 | | | | 05/01/20 | | | | 608,844 | |
| | 615,000 | | | | 3.000 | | | | 05/01/21 | | | | 632,472 | |
| | 500,000 | | | | 3.125 | | | | 05/01/22 | | | | 517,380 | |
| | 500,000 | | | | 3.250 | | | | 05/01/23 | | | | 517,555 | |
| Bay Laurel Center Community Development District Special
Assessment RB Refunding Series 2016 Candler (BBB+/NR) |
|
| | 125,000 | | | | 2.000 | | | | 05/01/18 | | | | 125,350 | |
| | 105,000 | | | | 2.000 | | | | 05/01/19 | | | | 105,389 | |
| | 130,000 | | | | 2.250 | | | | 05/01/20 | | | | 130,779 | |
| | 130,000 | | | | 2.250 | | | | 05/01/21 | | | | 130,355 | |
| | 135,000 | | | | 2.250 | | | | 05/01/22 | | | | 134,591 | |
| Baywinds Community Development District Senior Special
Assessment Refunding Bonds Series 2017 A-1 (BBB-/NR) |
|
| | 265,000 | | | | 3.500 | | | | 05/01/18 | | | | 267,730 | |
| | 275,000 | | | | 3.500 | | | | 05/01/19 | | | | 281,157 | |
| | 285,000 | | | | 3.500 | | | | 05/01/20 | | | | 294,231 | |
| | 295,000 | | | | 3.500 | | | | 05/01/21 | | | | 306,573 | |
| | 305,000 | | | | 3.500 | | | | 05/01/22 | | | | 318,112 | |
| | |
| | |
| 68 | | The accompanying notes are an integral part of these financial statements. |
GOLDMAN SACHS SHORT DURATION TAX-FREE FUND
| | | | | | | | | | | | | | |
Principal
Amount | | | Interest
Rate | | | Maturity
Date | | | Value | |
| | Municipal Bonds – (continued) | |
| | Florida – (continued) | |
| Cape Coral Florida Water & Sewer Revenue Special Assessment
Refunding Various Areas Series 2017 (AGM) (AA/A2) |
|
| $ | 990,000 | | | | 1.900 | % | | | 09/01/20 | | | $ | 1,005,771 | |
| | 1,240,000 | | | | 2.125 | | | | 09/01/22 | | | | 1,264,130 | |
| | 1,095,000 | | | | 2.250 | | | | 09/01/23 | | | | 1,116,320 | |
| Century Gardens at Tamiami Community Development District
Special Assessment Refunding Series 2016 (BBB/NR) |
|
| | 210,000 | | | | 2.000 | | | | 05/01/18 | | | | 210,323 | |
| | 215,000 | | | | 2.000 | | | | 05/01/19 | | | | 215,065 | |
| | 220,000 | | | | 2.000 | | | | 05/01/20 | | | | 218,737 | |
| | 225,000 | | | | 2.250 | | | | 05/01/21 | | | | 224,001 | |
| Century Parc Community Development District Special
Assessment Refunding Series 2012 (A-/NR) |
|
| | 185,000 | | | | 2.750 | | | | 11/01/17 | | | | 185,205 | |
| | 190,000 | | | | 3.000 | | | | 11/01/18 | | | | 193,240 | |
| | 195,000 | | | | 3.250 | | | | 11/01/19 | | | | 201,345 | |
| CityPlace Community Development District Special Assessment
RB Refunding Series 2012 (A/NR) |
|
| | 1,375,000 | | | | 5.000 | | | | 05/01/18 | | | | 1,402,967 | |
| | 1,890,000 | | | | 5.000 | | | | 05/01/19 | | | | 1,986,674 | |
| Concord Station Community Development District Capital
Improvement RB Refunding Senior Lien Series 2016 A-1
(BBB-/NR) |
|
| | 795,000 | | | | 2.000 | | | | 05/01/18 | | | | 795,541 | |
| | 810,000 | | | | 2.000 | | | | 05/01/19 | | | | 808,372 | |
| | 830,000 | | | | 2.000 | | | | 05/01/20 | | | | 823,800 | |
| | 845,000 | | | | 2.000 | | | | 05/01/21 | | | | 832,046 | |
| | 860,000 | | | | 2.125 | | | | 05/01/22 | | | | 842,473 | |
| Coronado Community Development District Special Assessment
Refunding & Improvement Bonds Series 2017 (BBB/NR) |
|
| | 114,000 | | | | 2.125 | | | | 05/01/18 | | | | 114,258 | |
| | 117,000 | | | | 2.125 | | | | 05/01/19 | | | | 117,261 | |
| | 119,000 | | | | 2.375 | | | | 05/01/20 | | | | 119,428 | |
| | 122,000 | | | | 2.625 | | | | 05/01/21 | | | | 123,018 | |
| | 126,000 | | | | 2.750 | | | | 05/01/22 | | | | 127,189 | |
| Country Walk Community Development District Special
Assessment Senior Lien RB Refunding Series 2015 A-1
(A-/NR) |
|
| | 180,000 | | | | 2.250 | | | | 05/01/18 | | | | 180,877 | |
| | 180,000 | | | | 2.500 | | | | 05/01/19 | | | | 182,372 | |
| | 185,000 | | | | 2.750 | | | | 05/01/20 | | | | 188,937 | |
| Double Branch Community Development District Special
Assessment Refunding Senior Lien Series 2013 A-1 (A-/NR) |
|
| | 250,000 | | | | 2.400 | | | | 05/01/18 | | | | 251,432 | |
| | 250,000 | | | | 2.700 | | | | 05/01/19 | | | | 254,070 | |
| | 250,000 | | | | 3.000 | | | | 05/01/20 | | | | 256,885 | |
| Durbin Crossing Community Development District Special
Assessment Refunding Senior Series 2017 A-1 (AGM)
(AA/NR) |
|
| | 1,415,000 | | | | 2.000 | | | | 05/01/18 | | | | 1,419,457 | |
| | 1,445,000 | | | | 2.000 | | | | 05/01/19 | | | | 1,455,765 | |
| | 1,475,000 | | | | 2.000 | | | | 05/01/20 | | | | 1,493,954 | |
| | 1,505,000 | | | | 2.125 | | | | 05/01/21 | | | | 1,529,201 | |
| Florida Higher Educational Facilities Financing Authority RB for
Nova Southeastern University Project Series 2012 A (A-/Baa1) |
|
| | 500,000 | | | | 5.000 | | | | 04/01/18 | | | | 509,365 | |
| | 500,000 | | | | 5.000 | | | | 04/01/19 | | | | 525,995 | |
| | |
| | Municipal Bonds – (continued) | |
| | Florida – (continued) | |
| Florida State Full Faith and Credit State Board of Education
Public Education Capital Outlay Tax-Exempt Bonds
Series 2008 C (AAA/Aa1) |
|
| $ | 2,990,000 | | | | 5.000 | % | | | 06/01/20 | | | $ | 3,186,503 | |
| Florida State Full Faith and Credit State Board of Education
Public Education Capital Outlay Tax-Exempt Bonds
Series 2011 A (AAA/Aa1) |
|
| | 5,810,000 | | | | 5.000 | | | | 06/01/21 | | | | 6,407,384 | |
| Florida State Municipal Power Agency RB Refunding for St.
Lucie Project Series 2002-1 (AMBAC) (A/A2)(b)(c) |
|
| | 1,700,000 | | | | 1.645 | | | | 10/01/21 | | | | 1,662,124 | |
| Florida State Municipal Power Agency RB Refunding for St.
Lucie Project Series 2002-2 (AMBAC) (A/A2)(c) |
|
| | 5,550,000 | | | | 1.540 | | | | 10/01/21 | | | | 5,426,363 | |
| Florida State Municipal Power Agency RB Refunding for St.
Lucie Project Series 2002-3 (AMBAC) (A/A2)(c) |
|
| | 1,425,000 | | | | 1.540 | | | | 10/01/21 | | | | 1,393,252 | |
| Fontainbleau Lakes Community Development District Special
Assessment RB Refunding Series 2016 (BBB+/NR) |
|
| | 215,000 | | | | 2.000 | | | | 05/01/18 | | | | 215,602 | |
| | 220,000 | | | | 2.000 | | | | 05/01/19 | | | | 220,816 | |
| | 225,000 | | | | 2.000 | | | | 05/01/20 | | | | 224,941 | |
| | 230,000 | | | | 2.000 | | | | 05/01/21 | | | | 228,659 | |
| | 235,000 | | | | 2.500 | | | | 05/01/22 | | | | 236,826 | |
| | 245,000 | | | | 2.500 | | | | 05/01/23 | | | | 244,111 | |
| | 245,000 | | | | 2.500 | | | | 05/01/24 | | | | 240,321 | |
| | 255,000 | | | | 2.750 | | | | 05/01/25 | | | | 250,364 | |
| | 260,000 | | | | 3.000 | | | | 05/01/26 | | | | 257,663 | |
| Hawks Point Community Development District Special
Assessment Refunding Senior Series 2017 A-1 (BBB+/NR)(f) |
|
| | 215,000 | | | | 3.500 | | | | 05/01/19 | | | | 220,895 | |
| | 225,000 | | | | 3.500 | | | | 05/01/20 | | | | 233,550 | |
| | 235,000 | | | | 3.500 | | | | 05/01/21 | | | | 245,700 | |
| | 245,000 | | | | 3.500 | | | | 05/01/22 | | | | 257,485 | |
| | 250,000 | | | | 3.500 | | | | 05/01/23 | | | | 262,007 | |
| Heritage Isle at Viera Community Development District Special
Assessment Refunding Series 2017 (AGM) (AA/NR) |
|
| | 170,000 | | | | 4.000 | | | | 05/01/18 | | | | 172,484 | |
| | 175,000 | | | | 4.000 | | | | 05/01/19 | | | | 181,517 | |
| | 185,000 | | | | 4.000 | | | | 05/01/20 | | | | 195,204 | |
| | 190,000 | | | | 4.000 | | | | 05/01/21 | | | | 203,327 | |
| | 200,000 | | | | 4.000 | | | | 05/01/22 | | | | 215,050 | |
| | 205,000 | | | | 4.000 | | | | 05/01/23 | | | | 221,246 | |
| Heritage Landing Community Development District Special
Assessment Refunding Series 2015 (BBB/NR) |
|
| | 415,000 | | | | 2.000 | | | | 05/01/18 | | | | 415,639 | |
| | 425,000 | | | | 2.250 | | | | 05/01/19 | | | | 426,773 | |
| | 535,000 | | | | 2.500 | | | | 05/01/20 | | | | 539,130 | |
| Highlands Community Development District Special Assessment
Refunding Series 2016 (BBB-/NR) |
|
| | 275,000 | | | | 2.000 | | | | 05/01/18 | | | | 275,187 | |
| | 280,000 | | | | 2.000 | | | | 05/01/19 | | | | 279,437 | |
| | 285,000 | | | | 2.250 | | | | 05/01/20 | | | | 284,077 | |
| | 290,000 | | | | 2.250 | | | | 05/01/21 | | | | 287,236 | |
| | 295,000 | | | | 2.250 | | | | 05/01/22 | | | | 289,566 | |
| | 305,000 | | | | 2.500 | | | | 05/01/23 | | | | 299,836 | |
| | 315,000 | | | | 2.750 | | | | 05/01/24 | | | | 310,697 | |
| | 320,000 | | | | 3.000 | | | | 05/01/25 | | | | 317,207 | |
| | |
| | |
| The accompanying notes are an integral part of these financial statements. | | 69 |
GOLDMAN SACHS SHORT DURATION TAX-FREE FUND
Schedule of Investments (continued)
September 30, 2017 (Unaudited)
| | | | | | | | | | | | | | |
Principal
Amount | | | Interest
Rate | | | Maturity
Date | | | Value | |
| | Municipal Bonds – (continued) | |
| | Florida – (continued) | |
| Lakeland Hospital RB for Lakeland Regional Health System
Series 2011 (NR/A2) |
|
| $ | 6,315,000 | | | | 5.000 | % | | | 11/15/17 | | | $ | 6,344,175 | |
| | 6,250,000 | | | | 5.000 | | | | 11/15/18 | | | | 6,516,875 | |
| Lee County Moody River Estates Community Development
District Special Assessment Refunding Senior Series 2017 A-1
(BBB+/NR) |
|
| | 260,000 | | | | 3.500 | | | | 05/01/18 | | | | 262,766 | |
| | 270,000 | | | | 3.500 | | | | 05/01/19 | | | | 276,086 | |
| | 275,000 | | | | 3.500 | | | | 05/01/20 | | | | 283,979 | |
| | 290,000 | | | | 3.500 | | | | 05/01/21 | | | | 301,478 | |
| | 300,000 | | | | 3.500 | | | | 05/01/22 | | | | 313,029 | |
| | 305,000 | | | | 3.500 | | | | 05/01/23 | | | | 318,517 | |
| | 320,000 | | | | 3.500 | | | | 05/01/24 | | | | 333,562 | |
| Mediterra South Community Development District Capital
Improvement RB Refunding Series 2012 (A-/NR) |
|
| | 285,000 | | | | 3.800 | | | | 05/01/18 | | | | 288,919 | |
| Miami Beach Health Facilities Authority Hospital RB Refunding
for Mount Sinai Medical Center Series 2012 (BBB+/Baa1) |
|
| | 1,750,000 | | | | 4.000 | | | | 11/15/17 | | | | 1,755,372 | |
| | 2,220,000 | | | | 4.000 | | | | 11/15/18 | | | | 2,278,697 | |
| Miami Special Obligation Non-Ad Valorem RB for Port of Miami
Tunnel Project Series 2012 (A+/A1)(f) |
|
| | 2,300,000 | | | | 4.000 | | | | 03/01/18 | | | | 2,328,129 | |
| | 2,390,000 | | | | 5.000 | | | | 03/01/19 | | | | 2,519,108 | |
| | 2,510,000 | | | | 5.000 | | | | 03/01/20 | | | | 2,721,593 | |
| | 2,635,000 | | | | 5.000 | | | | 03/01/21 | | | | 2,935,864 | |
| | 2,770,000 | | | | 5.000 | | | | 03/01/22 | | | | 3,151,789 | |
| Miami-Dade County Aviation RB for Miami International Airport
Series 2007 A (AMT) (NATL-RE) (A/A2) |
|
| | 15,000,000 | | | | 5.000 | | | | 10/01/39 | | | | 15,000,000 | |
| Miami-Dade County IDA Solid Waste Disposal RB for Waste
Management Inc. Project Series 2006 (A-/NR) |
|
| | 2,000,000 | | | | 1.500 | | | | 10/01/18 | | | | 2,010,060 | |
| Orange County School Board COPS Refunding Series 2012 B
(AA/Aa2)(a) |
|
| | 1,475,000 | | | | 5.000 | | | | 08/01/22 | | | | 1,722,018 | |
| Orlando Florida Capital Improvement Special RB Refunding
Series 2016 B (AA/Aa2) |
|
| | 1,525,000 | | | | 5.000 | | | | 10/01/21 | | | | 1,743,304 | |
| Orlando Florida Community Redevelopment Agency Tax
Increment RB Refunding for Conroy Road District Series 2012
(A-/NR) |
|
| | 1,245,000 | | | | 5.000 | | | | 04/01/18 | | | | 1,266,265 | |
| | 1,305,000 | | | | 5.000 | | | | 04/01/19 | | | | 1,366,896 | |
| | 1,375,000 | | | | 5.000 | | | | 04/01/20 | | | | 1,477,671 | |
| Orlando Utilities Commission, Utility System RB Refunding
Series 2017 A (AA/Aa2)(b)(c) |
|
| | 7,340,000 | | | | 3.000 | | | | 10/01/20 | | | | 7,720,799 | |
| Palm Beach County Health Facilities Authority Hospital RB
Refunding for Jupiter Medical Center, Inc. Project
Series 2013 A (BBB+/Baa2) |
|
| | 720,000 | | | | 4.000 | | | | 11/01/17 | | | | 721,325 | |
| | 630,000 | | | | 4.000 | | | | 11/01/18 | | | | 643,904 | |
| Palm Glades Community Development District Special
Assessment Refunding Bonds Series 2016 (BBB/NR) |
|
| | 475,000 | | | | 2.000 | | | | 05/01/18 | | | | 475,731 | |
| | 485,000 | | | | 2.000 | | | | 05/01/19 | | | | 485,146 | |
| | |
| | Municipal Bonds – (continued) | |
| | Florida – (continued) | |
| Parklands Lee Community Development District Special
Assessment Refunding Senior Lien Series 2013 A-1 (A/NR) |
|
| $ | 135,000 | | | | 2.250 | % | | | 05/01/18 | | | $ | 135,767 | |
| | 140,000 | | | | 2.875 | | | | 05/01/19 | | | | 142,968 | |
| Portofino Isles Community Development District Special
Assessment Refunding Series 2013 (BBB-/NR) |
|
| | 225,000 | | | | 2.625 | | | | 05/01/18 | | | | 225,956 | |
| | 230,000 | | | | 3.000 | | | | 05/01/19 | | | | 233,087 | |
| Reedy Creek Improvement District GO Bonds Series 2017 A
(AA-/Aa3)(g) |
|
| | 4,345,000 | | | | 5.000 | | | | 06/01/20 | | | | 4,775,676 | |
| | 4,630,000 | | | | 5.000 | | | | 06/01/21 | | | | 5,238,197 | |
| Reunion East Community Development District Special
Assessment Refunding Series 2015 A (NR/NR) |
|
| | 1,930,000 | | | | 4.000 | | | | 05/01/20 | | | | 1,974,332 | |
| River Bend Community Development District Special
Assessment RB Refunding Senior Series 2016 A-1 (BBB+/NR) |
|
| | 355,000 | | | | 2.000 | | | | 05/01/18 | | | | 355,994 | |
| | 360,000 | | | | 2.000 | | | | 05/01/19 | | | | 361,336 | |
| | 365,000 | | | | 2.000 | | | | 05/01/20 | | | | 364,905 | |
| | 375,000 | | | | 2.000 | | | | 05/01/21 | | | | 372,814 | |
| | 385,000 | | | | 2.500 | | | | 05/01/22 | | | | 387,991 | |
| | 395,000 | | | | 2.500 | | | | 05/01/23 | | | | 393,566 | |
| | 405,000 | | | | 2.500 | | | | 05/01/24 | | | | 397,265 | |
| | 415,000 | | | | 2.750 | | | | 05/01/25 | | | | 407,455 | |
| | 425,000 | | | | 3.000 | | | | 05/01/26 | | | | 421,179 | |
| Sausalito Bay Community Development District Special
Assessment Refunding Series 2013 (A-/NR) |
|
| | 95,000 | | | | 2.500 | | | | 05/01/18 | | | | 95,598 | |
| | 90,000 | | | | 2.750 | | | | 05/01/19 | | | | 91,535 | |
| | 100,000 | | | | 3.000 | | | | 05/01/20 | | | | 102,754 | |
| South Fork East Community Development District Capital
Improvement RB Refunding Series 2017 (BBB/NR) |
|
| | 215,000 | | | | 2.000 | | | | 05/01/18 | | | | 215,318 | |
| | 380,000 | | | | 2.125 | | | | 05/01/19 | | | | 380,848 | |
| | 390,000 | | | | 2.250 | | | | 05/01/20 | | | | 390,191 | |
| | 400,000 | | | | 2.625 | | | | 05/01/21 | | | | 403,336 | |
| | 405,000 | | | | 2.875 | | | | 05/01/22 | | | | 410,998 | |
| South Kendall Community Development District Special
Assessment Refunding Series 2016 (BBB-/NR) |
|
| | 280,000 | | | | 2.000 | | | | 11/01/17 | | | | 280,067 | |
| | 320,000 | | | | 2.000 | | | | 11/01/18 | | | | 320,406 | |
| | 325,000 | | | | 2.000 | | | | 11/01/19 | | | | 324,142 | |
| | 330,000 | | | | 2.250 | | | | 11/01/20 | | | | 328,733 | |
| | 330,000 | | | | 2.250 | | | | 11/01/21 | | | | 326,439 | |
| | 335,000 | | | | 2.250 | | | | 11/01/22 | | | | 328,200 | |
| South Village Community Development District Capital
Improvement and Special Assessment Refunding Senior Lien
Series 2016 A-1 (BBB/NR) |
|
| | 295,000 | | | | 2.000 | | | | 05/01/18 | | | | 295,454 | |
| | 300,000 | | | | 2.000 | | | | 05/01/19 | | | | 300,090 | |
| | 310,000 | | | | 2.000 | | | | 05/01/20 | | | | 308,221 | |
| | 100,000 | | | | 2.000 | | | | 05/01/21 | | | | 98,703 | |
| | 100,000 | | | | 2.125 | | | | 05/01/22 | | | | 98,259 | |
| | 100,000 | | | | 2.375 | | | | 05/01/23 | | | | 97,920 | |
| | 100,000 | | | | 2.500 | | | | 05/01/24 | | | | 96,859 | |
| | 100,000 | | | | 2.750 | | | | 05/01/25 | | | | 96,795 | |
| | 100,000 | | | | 3.000 | | | | 05/01/26 | | | | 97,554 | |
| | |
| | |
| 70 | | The accompanying notes are an integral part of these financial statements. |
GOLDMAN SACHS SHORT DURATION TAX-FREE FUND
| | | | | | | | | | | | | | |
Principal
Amount | | | Interest
Rate | | | Maturity
Date | | | Value | |
| | Municipal Bonds – (continued) | |
| | Florida – (continued) | |
| South-Dade Venture Community Development District Special
Assessment RB Refunding Series 2012 (BBB-/NR) |
|
| $ | 330,000 | | | | 4.000 | % | | | 05/01/18 | | | $ | 333,997 | |
| | 345,000 | | | | 4.125 | | | | 05/01/19 | | | | 355,619 | |
| | 375,000 | | | | 4.375 | | | | 05/01/21 | | | | 398,516 | |
| | 390,000 | | | | 4.500 | | | | 05/01/22 | | | | 420,381 | |
| Spicewood Community Development District Special Assessment
Refunding Series 2013 (BBB+/NR) |
|
| | 110,000 | | | | 2.500 | | | | 05/01/18 | | | | 110,624 | |
| | 115,000 | | | | 2.875 | | | | 05/01/19 | | | | 116,986 | |
| Stonebrier Community Development District Special Assessment
Refunding Series 2016 (A-/NR) |
|
| | 240,000 | | | | 2.000 | | | | 05/01/18 | | | | 240,562 | |
| | 245,000 | | | | 2.000 | | | | 05/01/19 | | | | 246,061 | |
| | 250,000 | | | | 2.000 | | | | 05/01/20 | | | | 251,065 | |
| | 255,000 | | | | 2.250 | | | | 05/01/21 | | | | 256,749 | |
| | 260,000 | | | | 2.250 | | | | 05/01/22 | | | | 260,109 | |
| Talis Park Community Development District Capital
Improvement RB Refunding Senior Series 2016 A-1
(BBB+/NR) |
|
| | 170,000 | | | | 2.000 | | | | 05/01/18 | | | | 170,476 | |
| | 175,000 | | | | 2.000 | | | | 05/01/19 | | | | 175,649 | |
| | 175,000 | | | | 2.000 | | | | 05/01/20 | | | | 174,955 | |
| | 180,000 | | | | 2.250 | | | | 05/01/21 | | | | 180,491 | |
| | 185,000 | | | | 2.250 | | | | 05/01/22 | | | | 184,440 | |
| Trails at Monterey Community Development District Special
Assessment Refunding Series 2012 (A-/NR) |
|
| | 110,000 | | | | 3.000 | | | | 05/01/18 | | | | 111,009 | |
| | 110,000 | | | | 3.250 | | | | 05/01/19 | | | | 112,729 | |
| | 115,000 | | | | 3.500 | | | | 05/01/20 | | | | 119,606 | |
| | 115,000 | | | | 3.750 | | | | 05/01/21 | | | | 121,302 | |
| | 125,000 | | | | 3.875 | | | | 05/01/22 | | | | 132,946 | |
| | 125,000 | | | | 4.000 | | | | 05/01/23 | | | | 133,628 | |
| | 135,000 | | | | 4.125 | | | | 05/01/24 | | | | 144,034 | |
| | 140,000 | | | | 4.150 | | | | 05/01/25 | | | | 148,834 | |
| | 145,000 | | | | 4.250 | | | | 05/01/26 | | | | 154,510 | |
| Turnbull Creek Community Development District Senior Special
Assessment Refunding Series 2015 A-1 (BBB/NR) |
|
| | 415,000 | | | | 2.300 | | | | 05/01/19 | | | | 417,050 | |
| | 125,000 | | | | 2.600 | | | | 05/01/20 | | | | 126,151 | |
| Two Creeks Community Development District RB Refunding for
Capital Improvement Senior Lien Series 2016 A-1 (BBB-/NR) |
|
| | 165,000 | | | | 2.000 | | | | 05/01/18 | | | | 165,254 | |
| | 170,000 | | | | 2.000 | | | | 05/01/19 | | | | 170,314 | |
| | 170,000 | | | | 2.000 | | | | 05/01/20 | | | | 169,448 | |
| | 355,000 | | | | 2.250 | | | | 05/01/21 | | | | 353,424 | |
| Venetian Isles Community Development District Special
Assessment RB Refunding Series 2013 (A+/NR) |
|
| | 230,000 | | | | 2.500 | | | | 05/01/18 | | | | 231,941 | |
| | 235,000 | | | | 2.875 | | | | 05/01/19 | | | | 241,357 | |
| | 240,000 | | | | 3.000 | | | | 05/01/20 | | | | 246,425 | |
| | |
| | Municipal Bonds – (continued) | |
| | Florida – (continued) | |
| Verano #1 Community Development District Senior Special
Assessment Refunding for Community Infrastructure Project
Series 2017 A-1 (BBB/NR)(f) |
|
| $ | 295,000 | | | | 2.000 | % | | | 05/01/18 | | | $ | 295,454 | |
| | 300,000 | | | | 2.250 | | | | 05/01/19 | | | | 301,251 | |
| | 305,000 | | | | 2.500 | | | | 05/01/20 | | | | 307,050 | |
| | 315,000 | | | | 2.750 | | | | 05/01/21 | | | | 318,972 | |
| | 325,000 | | | | 3.000 | | | | 05/01/22 | | | | 331,559 | |
| | 335,000 | | | | 3.100 | | | | 05/01/23 | | | | 340,497 | |
| Village Community Development District No. 10 Special
Assessment RB Series 2012 (NR/NR) |
|
| | 960,000 | | | | 4.500 | | | | 05/01/23 | | | | 1,013,990 | |
| Village Community Development District No. 6 Special
Assessment RB Refunding Series 2017 (A-/NR) |
|
| | 250,000 | | | | 4.000 | | | | 05/01/18 | | | | 253,435 | |
| | 250,000 | | | | 4.000 | | | | 05/01/19 | | | | 258,832 | |
| | 355,000 | | | | 4.000 | | | | 05/01/20 | | | | 372,931 | |
| | 365,000 | | | | 4.000 | | | | 05/01/21 | | | | 388,389 | |
| | 380,000 | | | | 4.000 | | | | 05/01/22 | | | | 407,056 | |
| | 400,000 | | | | 4.000 | | | | 05/01/23 | | | | 430,188 | |
| | 420,000 | | | | 4.000 | | | | 05/01/24 | | | | 452,437 | |
| | 325,000 | | | | 4.000 | | | | 05/01/25 | | | | 349,616 | |
| Village Community Development District No. 7 Special
Assessment RB Refunding Series 2015 (A/NR) |
|
| | 1,435,000 | | | | 3.000 | | | | 05/01/19 | | | | 1,463,915 | |
| Vizcaya In Kendall Community Development District Special
Assessment Bonds Series 2016 (BBB-/NR) |
|
| | 185,000 | | | | 2.000 | | | | 11/01/17 | | | | 185,044 | |
| | 195,000 | | | | 2.000 | | | | 11/01/18 | | | | 195,248 | |
| | 195,000 | | | | 2.000 | | | | 11/01/19 | | | | 194,485 | |
| | 200,000 | | | | 2.250 | | | | 11/01/20 | | | | 199,232 | |
| | 205,000 | | | | 2.250 | | | | 11/01/21 | | | | 202,788 | |
| | 210,000 | | | | 2.250 | | | | 11/01/22 | | | | 205,737 | |
| | 215,000 | | | | 2.500 | | | | 11/01/23 | | | | 211,061 | |
| Waters Edge Community Development District Capital
Improvement RB Refunding Senior Lien Series 2015 A-1
(BBB+/NR) |
|
| | 375,000 | | | | 2.500 | | | | 05/01/18 | | | | 377,126 | |
| | 385,000 | | | | 2.000 | | | | 05/01/19 | | | | 386,428 | |
| | 390,000 | | | | 2.375 | | | | 05/01/20 | | | | 393,557 | |
| | 400,000 | | | | 2.625 | | | | 05/01/21 | | | | 406,228 | |
| Wyndam Park Community Development District Special
Assessment Refunding Series 2013 (A-/NR) |
|
| | 95,000 | | | | 2.250 | | | | 05/01/18 | | | | 95,463 | |
| | 95,000 | | | | 2.875 | | | | 05/01/19 | | | | 96,804 | |
| | | | | | | | | | | | | | |
| | | | | | | | | | | | | 163,507,700 | |
| | |
| Georgia – 4.3% | |
| Atlanta Water & Wastewater RB Refunding Series 2009 A
(AA-/Aa2)(a) |
|
| | 9,145,000 | | | | 6.000 | | | | 11/01/19 | | | | 10,070,840 | |
| Burke County Development Authority Pollution Control RB for
Georgia Power Company Plant Vogtle Project First Series 2012
(A-/A3)(b)(c) |
|
| | 6,500,000 | | | | 1.850 | | | | 08/22/19 | | | | 6,494,020 | |
| | |
| | |
| The accompanying notes are an integral part of these financial statements. | | 71 |
GOLDMAN SACHS SHORT DURATION TAX-FREE FUND
Schedule of Investments (continued)
September 30, 2017 (Unaudited)
| | | | | | | | | | | | |
Principal
Amount | | | Interest
Rate | | Maturity
Date | | | Value | |
| | Municipal Bonds – (continued) | |
| | Georgia – (continued) | |
| | City of Augusta GO Bonds Series 2016 (NR/Aa2) | |
| $ | 12,810,000 | | | 5.000% | | | 10/01/19 | | | $ | 13,790,221 | |
| | 12,135,000 | | | 5.000 | | | 10/01/20 | | | | 13,472,156 | |
| De Kalb County School District GO Sales Tax Bonds Series 2017
(ST AID WITHHLDG) (AA+/Aa1) |
|
| | 34,820,000 | | | 4.000 | | | 10/01/20 | | | | 37,732,693 | |
| | 31,115,000 | | | 4.000 | | | 10/01/21 | | | | 34,361,850 | |
| | 18,845,000 | | | 4.000 | | | 10/01/22 | | | | 21,123,172 | |
| Dougherty County School District Sales Tax GO Bonds for
Georgia State Aid Intercept Program Series 2013 (ST AID
WITHHLDG) (NR/Aa1) |
|
| | 2,055,000 | | | 5.000 | | | 12/01/17 | | | | 2,068,604 | |
| Fulton County Development Authority RB Refunding for
Spelman College Series 2012 (NR/A1) |
|
| | 1,010,000 | | | 4.000 | | | 06/01/18 | | | | 1,029,503 | |
| | Georgia State GO Bonds Series 2017 A-1 (AAA/Aaa) | |
| | 20,000,000 | | | 5.000 | | | 02/01/21 | | | | 22,513,600 | |
| | Georgia State GO Refunding Bonds Series 2011 E-2 (AAA/Aaa) | |
| | 9,265,000 | | | 5.000 | | | 09/01/21 | | | | 10,606,109 | |
| Gwinnett County School District Sales Tax GO Bonds Series
2012 A (AAA/Aaa) |
|
| | 14,215,000 | | | 4.500 | | | 10/01/17 | | | | 14,215,000 | |
| Gwinnett County School District Sales Tax GO Bonds Series
2012 A (ETM) (NR/NR)(a) |
|
| | 1,550,000 | | | 4.500 | | | 10/01/17 | | | | 1,550,000 | |
| Jackson County School District GO Refunding Bonds Series 2012
(ST AID WITHHLDG) (AA+/Aa2) |
|
| | 4,215,000 | | | 5.000 | | | 03/01/18 | | | | 4,285,728 | |
| Milledgeville & Baldwin County Development Authority Student
Housing RB Refunding for Georgia College & State University
Foundation Property V, LLC Project Series 2007 (AMBAC)
(A+/WR)(d) |
|
| | 13,905,000 | | | (3 Mo. LIBOR +
0.60%), 1.470 | | | 10/01/24 | | | | 13,801,825 | |
| Public Gas Partners Inc., Gas Project RB for Gas Supply Pool No.
1 Series 2009 A (A+/WR) |
|
| | 5,950,000 | | | 5.000 | | | 10/01/19 | | | | 6,349,185 | |
| Richmond County Board of Education GO Bonds for Sales Tax
Series 2012 (ST AID WITHHLDG) (AA+/Aa1) |
|
| | 2,000,000 | | | 3.000 | | | 10/01/17 | | | | 2,000,000 | |
| | | | | | | | | | | | |
| | | | | | | | | | | 215,464,506 | |
| | |
| | Guam – 0.2% | |
| Guam Government Limited Obligation RB Section 30
Series 2016 A (BBB+/NR) |
|
| | 355,000 | | | 5.000 | | | 12/01/17 | | | | 357,049 | |
| | 1,000,000 | | | 5.000 | | | 12/01/18 | | | | 1,038,870 | |
| | 1,500,000 | | | 5.000 | | | 12/01/19 | | | | 1,603,710 | |
| Guam Government Privilege Special Tax Refunding Bonds Series
2015 D (A/NR) |
|
| | 265,000 | | | 4.000 | | | 11/15/18 | | | | 270,666 | |
| | 3,775,000 | | | 5.000 | | | 11/15/21 | | | | 4,176,735 | |
| Guam Waterworks Authority RB for Water & Wastewater System
Series 2016 (A-/Baa2) |
|
| | 310,000 | | | 5.000 | | | 07/01/21 | | | | 343,145 | |
| | 500,000 | | | 5.000 | | | 07/01/22 | | | | 562,200 | |
| | | | | | | | | | | | |
| | | | | | | | | | | 8,352,375 | |
| | |
| | Municipal Bonds – (continued) | |
| | Hawaii – 0.5% | |
| | Hawaii State GO Refunding Bonds Series 2016 FH (AA+/Aa1) | |
| $ | 15,000,000 | | | 3.000% | | | 10/01/21 | | | $ | 15,977,400 | |
| | Honolulu City and County GO Bonds Series C (AA+/Aa1) | |
| | 10,220,000 | | | 4.000 | | | 10/01/19 | | | | 10,811,431 | |
| | | | | | | | | | | | |
| | | | | | | | | | | 26,788,831 | |
| | |
| Idaho – 0.0% | |
| Boise City Independent School District GO Refunding Bonds
Series 2012 B (AA/Aa1) |
|
| | 2,095,000 | | | 4.000 | | | 08/01/18 | | | | 2,147,710 | |
| | |
| | Illinois – 7.7% | |
| Chicago Illinois Board of Education Dedicated Revenues Series
2007 D (AGM) (AA/A2) |
|
| | 5,000,000 | | | 5.000 | | | 12/01/21 | | | | 5,029,500 | |
| Chicago Illinois Board of Education GO Bonds Series 1999 A
(NATL-RE-IBC FGIC) (A/A3) |
|
| | 1,575,000 | | | 5.250 | | | 12/01/20 | | | | 1,689,424 | |
| Chicago Illinois Board of Education GO Refunding Bonds Series
1999 A (NATL-RE FGIC) (A/A3)(e) |
|
| | 1,070,000 | | | 0.000 | | | 12/01/17 | | | | 1,065,859 | |
| | 6,595,000 | | | 0.000 | | | 12/01/19 | | | | 6,220,998 | |
| Chicago Illinois Board of Education GO Refunding Bonds
Series 2015 A (B/NR)(c) |
|
| | 27,000,000 | | | 9.000 | | | 03/01/32 | | | | 27,142,020 | |
| Chicago Illinois Capital Appreciation GO Refunding Bonds and
Project Series C (BBB+/Ba1)(e) |
|
| | 4,645,000 | | | 0.000 | | | 01/01/23 | | | | 3,818,701 | |
| Chicago Illinois Emergency Telephone System GO Refunding
Bonds Series 1999 (NATL-RE) (A/A3) |
|
| | 10,020,000 | | | 5.500 | | | 01/01/23 | | | | 10,922,000 | |
| Chicago Illinois GO Bonds Project and Refunding RMKT
05/29/15 Series 2003 B (BBB+/Ba1) |
|
| | 4,980,000 | | | 5.000 | | | 01/01/23 | | | | 5,472,472 | |
| Chicago Illinois GO Bonds Project and Refunding Series 2009 A
(BBB+/Ba1) |
|
| | 5,400,000 | | | 5.000 | | | 01/01/22 | | | | 5,656,446 | |
| Chicago Illinois GO Bonds Project and Refunding Series 2014 A
(BBB+/Ba1) |
|
| | 2,075,000 | | | 5.000 | | | 01/01/22 | | | | 2,256,396 | |
| Chicago Illinois GO Refunding Bonds Capital Appreciation
Series 2007 C (NATL-RE) (A/A3) |
|
| | 5,000,000 | | | 5.000 | | | 01/01/30 | | | | 5,033,800 | |
| | Chicago Illinois GO Refunding Bonds Series 2012 C (BBB+/Ba1) | |
| | 14,345,000 | | | 5.000 | | | 01/01/22 | | | | 15,599,040 | |
| | Chicago Illinois GO Refunding Bonds Series 2015 C (BBB+/NR) | |
| | 1,350,000 | | | 5.000 | | | 01/01/20 | | | | 1,425,897 | |
| | 2,000,000 | | | 5.000 | | | 01/01/21 | | | | 2,153,520 | |
| | 16,000,000 | | | 5.000 | | | 01/01/22 | | | | 17,398,720 | |
| | 13,250,000 | | | 5.000 | | | 01/01/23 | | | | 14,560,292 | |
| Chicago Illinois Midway Airport Second Lien RB Refunding
Series 2014 B (A/A3) |
|
| | 400,000 | | | 5.000 | | | 01/01/19 | | | | 419,632 | |
| | |
| | |
| 72 | | The accompanying notes are an integral part of these financial statements. |
GOLDMAN SACHS SHORT DURATION TAX-FREE FUND
| | | | | | | | | | | | |
Principal
Amount | | | Interest
Rate | | Maturity
Date | | | Value | |
| | Municipal Bonds – (continued) | |
| | Illinois – (continued) | |
| Chicago Illinois Modern Schools Across Chicago Program GO
Bonds Series 2010 A (BBB+/Ba1) |
|
| $ | 6,450,000 | | | 4.000% | | | 12/01/17 | | | $ | 6,466,834 | |
| | 1,080,000 | | | 5.000 | | | 12/01/19 | | | | 1,141,808 | |
| Chicago Illinois O’Hare International Airport RB Refunding
General Airport Senior Lien Series 2015 B (A/NR) |
|
| | 4,000,000 | | | 5.000 | | | 01/01/21 | | | | 4,465,920 | |
| Chicago Illinois Sales Tax Refunding RMKT 06/09/15
Series 2002 (AA/NR) |
|
| | 1,250,000 | | | 5.000 | | | 01/01/21 | | | | 1,350,000 | |
| Chicago Illinois Wastewater Transmission RB Refunding Second
Lien Project Series 2008 C (A/NR) |
|
| | 1,000,000 | | | 5.000 | | | 01/01/21 | | | | 1,102,380 | |
| Chicago Illinois Wastewater Transmission RB Refunding Second
Lien Series 2017 B (A/NR) |
|
| | 2,050,000 | | | 5.000 | | | 01/01/21 | | | | 2,259,879 | |
| | 1,450,000 | | | 5.000 | | | 01/01/22 | | | | 1,631,786 | |
| Chicago Illinois Wastewater Transmission RB Second Lien
Series 2017 A (A/NR) |
|
| | 600,000 | | | 5.000 | | | 01/01/21 | | | | 661,428 | |
| | 1,660,000 | | | 5.000 | | | 01/01/22 | | | | 1,868,114 | |
| Chicago Illinois Water RB Refunding Second Lien Project
RMKT 05/23/16 Series 2004 (A/NR) |
|
| | 2,500,000 | | | 5.000 | | | 11/01/20 | | | | 2,750,300 | |
| Cook County Illinois GO Refunding Bonds Series 2012 C
(AA-/A2) |
|
| | 1,500,000 | | | 5.000 | | | 11/15/19 | | | | 1,599,540 | |
| | 1,000,000 | | | 4.000 | | | 11/15/20 | | | | 1,063,870 | |
| | Glenview GO Refunding Bonds Series 2012 B (NR/Aaa) | |
| | 1,365,000 | | | 4.000 | | | 12/01/18 | | | | 1,409,881 | |
| Illinois Educational Facilities Authority RB for University of
Chicago Series 2001 B-2 (AA-/Aa2)(b)(c) |
|
| | 6,000,000 | | | 1.550 | | | 02/13/20 | | | | 6,006,900 | |
| Illinois Finance Authority RB for Advocate Health Care Network
Series 2008 C-3B (AA/Aa2)(b)(c) |
|
| | 2,750,000 | | | 1.050 | | | 07/30/18 | | | | 2,747,965 | |
| Illinois Finance Authority RB for Prairie Power, Inc. Project
RMKT 05/08/17 Series 2017 A (A/NR)(b)(c) |
|
| | 7,000,000 | | | 1.750 | | | 05/06/20 | | | | 7,030,100 | |
| Illinois Finance Authority RB Refunding for Franciscan
Communities Project Series 2017 A (BBB-/NR) |
|
| | 2,070,000 | | | 3.250 | | | 05/15/22 | | | | 2,108,833 | |
| Illinois Finance Authority RB Refunding for Illinois Wesleyan
University Series 2016 (A-/Baa1) |
|
| | 255,000 | | | 4.000 | | | 09/01/20 | | | | 269,647 | |
| | 500,000 | | | 4.000 | | | 09/01/21 | | | | 534,320 | |
| | Illinois State GO Bonds Series 2012 (BBB-/Baa3) | |
| | 14,360,000 | | | 4.000 | | | 01/01/19 | | | | 14,700,189 | |
| | 2,445,000 | | | 5.000 | | | 03/01/19 | | | | 2,544,071 | |
| | Illinois State GO Bonds Series 2012 A (BBB-/Baa3) | |
| | 10,085,000 | | | 3.000 | | | 01/01/18 | | | | 10,115,356 | |
| | Illinois State GO Bonds Series 2013 (BBB-/Baa3) | |
| | 3,645,000 | | | 5.000 | | | 07/01/19 | | | | 3,825,027 | |
| | 3,990,000 | | | 5.500 | | | 07/01/24 | | | | 4,421,479 | |
| | Illinois State GO Bonds Series 2014 (BBB-/Baa3) | |
| | 3,450,000 | | | 4.000 | | | 02/01/18 | | | | 3,474,805 | |
| | 3,730,000 | | | 5.000 | | | 02/01/19 | | | | 3,872,300 | |
| | |
| | Municipal Bonds – (continued) | |
| | Illinois – (continued) | |
| | Illinois State GO Refunding Bonds Series 2009 A (BBB-/Baa3) | |
| $ | 16,000,000 | | | 4.000% | | | 09/01/20 | | | $ | 16,220,320 | |
| | Illinois State GO Refunding Bonds Series 2010 (BBB-/Baa3) | |
| | 18,505,000 | | | 5.000 | | | 01/01/18 | | | | 18,650,450 | |
| | 16,490,000 | | | 5.000 | | | 01/01/20 | | | | 17,409,647 | |
| | Illinois State GO Refunding Bonds Series 2012 (BBB-/Baa3) | |
| | 7,295,000 | | | 5.000 | | | 08/01/19 | | | | 7,672,225 | |
| | 10,925,000 | | | 5.000 | | | 08/01/20 | | | | 11,668,883 | |
| | Illinois State GO Refunding Bonds Series 2016 (BBB-/Baa3) | |
| | 20,000,000 | | | 5.000 | | | 02/01/20 | | | | 21,151,200 | |
| | 25,110,000 | | | 5.000 | | | 02/01/21 | | | | 26,985,215 | |
| | 5,000,000 | | | 5.000 | | | 02/01/22 | | | | 5,426,100 | |
| Illinois State Sales Tax RB Junior Obligation Series 2016 A
(AA-/NR) |
|
| | 1,475,000 | | | 5.000 | | | 06/15/22 | | | | 1,665,437 | |
| Illinois State Sales Tax RB Refunding Junior Obligation
Series 2016 C (AA-/NR) |
|
| | 675,000 | | | 4.000 | | | 06/15/21 | | | | 724,397 | |
| | 2,875,000 | | | 5.000 | | | 06/15/22 | | | | 3,246,191 | |
| Illinois State Sales Tax RB Refunding Junior Obligation Series
2016 D (AA-/NR) |
|
| | 3,185,000 | | | 4.000 | | | 06/15/21 | | | | 3,418,078 | |
| McHenry and Lake County Community High School No. 156 GO
Refunding Bonds Series 2013 A (NR/Aa2) |
|
| | 2,690,000 | | | 3.000 | | | 02/01/18 | | | | 2,706,275 | |
| Metropolitan Pier & Exposition Authority RB Refunding Capital
Appreciation for McCormick Place Expansion Project
Series 1993 A (NATL-RE) (A/A3)(e) |
|
| | 2,505,000 | | | 0.000 | | | 06/15/18 | | | | 2,471,884 | |
| Quad Cities Regional Economic Development Authority RB for
Augustana College Series 2012 (NR/Baa1) |
|
| | 840,000 | | | 3.000 | | | 10/01/17 | | | | 840,000 | |
| Springfield Electric RB Refunding Senior Lien Series 2015
(A/A3) |
|
| | 2,000,000 | | | 5.000 | | | 03/01/21 | | | | 2,217,100 | |
| State of Illinois Build Illinois Sales Tax RB Refunding Bonds
Series 2010 (AA-/NR) |
|
| | 1,170,000 | | | 5.000 | | | 06/15/18 | | | | 1,200,958 | |
| | State of Illinois GO Bonds Series 2014 (BBB-/Baa3) | |
| | 3,245,000 | | | 5.000 | | | 02/01/23 | | | | 3,557,201 | |
| | State of Illinois GO Refunding Bonds Series 2016 (BBB-/Baa3) | |
| | 2,000,000 | | | 5.000 | | | 02/01/19 | | | | 2,076,300 | |
| | 2,360,000 | | | 5.000 | | | 02/01/23 | | | | 2,587,056 | |
| University of Illinois Board Trustees COP RB Refunding
Series 2016 A (A-/A1) |
|
| | 5,250,000 | | | 5.000 | | | 08/15/20 | | | | 5,683,493 | |
| | 5,000,000 | | | 5.000 | | | 08/15/21 | | | | 5,531,750 | |
| Will & Kendall Counties Community Consolidated School
District No. 202 GO Refunding Bonds Series 2017 (NR/Aa2) |
|
| | 9,650,000 | | | 2.000 | | | 01/01/19 | | | | 9,728,262 | |
| | | | | | | | | | | | |
| | | | | | | | | | | 388,125,871 | |
| | |
| Indiana – 0.8% | |
| City of Whiting Environmental Facilities RB for BP Products
North America, Inc. Project Series 2008 (A-/A1)(b)(c) |
|
| | 15,000,000 | | | 1.850 | | | 10/01/19 | | | | 15,114,600 | |
| | |
| | |
| The accompanying notes are an integral part of these financial statements. | | 73 |
GOLDMAN SACHS SHORT DURATION TAX-FREE FUND
Schedule of Investments (continued)
September 30, 2017 (Unaudited)
| | | | | | | | | | | | | | |
Principal
Amount | | | Interest
Rate | | | Maturity
Date | | | Value | |
| | Municipal Bonds – (continued) | |
| | Indiana – (continued) | |
| Delaware County Indiana Hospital Authority RB Refunding for
Ball Memorial Hospital, Inc. Obligated Group Series 2009 A
(ETM) (NR/WR)(a) |
|
| $ | 4,585,000 | | | | 5.625 | % | | | 08/01/18 | | | $ | 4,760,101 | |
| Indiana Finance Authority Hospital RB for Indiana University
Health Obligated Group Series 2012 A (A/A2) |
|
| | 855,000 | | | | 5.000 | | | | 05/01/20 | | | | 933,788 | |
| Indiana Finance Authority RB for Community Foundation of
Northwest Indiana Obligated Group Series 2012 (A+/NR) |
|
| | 800,000 | | | | 5.000 | | | | 03/01/18 | | | | 812,984 | |
| | 500,000 | | | | 5.000 | | | | 03/01/19 | | | | 526,500 | |
| | 650,000 | | | | 5.000 | | | | 03/01/20 | | | | 704,152 | |
| Indiana Health Facility Financing Authority Ascension Health
Subordinate Credit Group RB RMKT 06/01/17 Series 2017
A-9 (AA+/Aa3)(b)(c) |
|
| | 5,000,000 | | | | 1.375 | | | | 05/01/20 | | | | 4,996,850 | |
| Indiana Health Facility Financing Authority Ascension Health
Subordinate Credit Group RB RMKT 08/01/17
Series 2005 A-3 (AA/Aa3)(b)(c) |
|
| | 5,000,000 | | | | 1.350 | | | | 08/04/20 | | | | 4,988,900 | |
| Indiana Health Facility Financing Authority Ascension Health
Subordinate Credit Group RB Series 2005 A-5 (AA/Aa3)(b)(c) |
|
| | 6,000,000 | | | | 1.350 | | | | 08/04/20 | | | | 5,986,680 | |
| | | | | | | | | | | | | | |
| | | | | | | | | | | | | 38,824,555 | |
| | |
| Iowa – 0.0% | |
| Iowa Finance Authority State Revolving Fund RB Series 2013
(AAA/Aaa) |
|
| | 1,000,000 | | | | 5.000 | | | | 08/01/18 | | | | 1,033,220 | |
| | |
| | Kansas – 0.5% | |
| Johnson County Public Building Commission RB Refunding for
Kansas Lease Purchase Series 2015 B (AAA/Aaa) |
|
| | 2,735,000 | | | | 2.000 | | | | 09/01/19 | | | | 2,784,011 | |
| | 3,810,000 | | | | 2.000 | | | | 09/01/20 | | | | 3,903,535 | |
| Johnson County Unified School District No. 229 GO Bonds for
Kansas Blue Valley Series 2015 B (AA+/Aaa) |
|
| | 8,125,000 | | | | 5.000 | | | | 10/01/19 | | | | 8,755,094 | |
| Sedgwick County Kansas Unified School District No. 259 GO
Refunding and Improvement Bonds Series 2015 A (NR/Aa2) |
|
| | 3,455,000 | | | | 4.000 | | | | 10/01/20 | | | | 3,739,761 | |
| | 3,000,000 | | | | 4.000 | | | | 10/01/21 | | | | 3,320,460 | |
| | Wichita GO Refunding Bonds Series 2012 A (AA+/Aa1) | |
| | 2,585,000 | | | | 4.000 | | | | 09/01/19 | | | | 2,728,390 | |
| | Wichita GO Sales Tax Bonds Series 2012 D (AA+/Aa1) | |
| | 1,130,000 | | | | 3.000 | | | | 10/01/19 | | | | 1,173,381 | |
| | | | | | | | | | | | | | |
| | | | | | | | | | | | | 26,404,632 | |
| | |
| Kentucky – 0.9% | |
| Kentucky Economic Development Finance Authority Hospital RB
Refunding for Owensboro Medical Health System, Inc.
Series 2017 A (BBB/Baa3) |
|
| | 200,000 | | | | 5.000 | | | | 06/01/18 | | | | 204,262 | |
| | 350,000 | | | | 5.000 | | | | 06/01/19 | | | | 367,650 | |
| | 500,000 | | | | 5.000 | | | | 06/01/20 | | | | 537,190 | |
| | 1,100,000 | | | | 5.000 | | | | 06/01/21 | | | | 1,206,117 | |
| | 2,450,000 | | | | 5.000 | | | | 06/01/22 | | | | 2,723,543 | |
| | 1,000,000 | | | | 5.000 | | | | 06/01/23 | | | | 1,125,550 | |
| | |
| | Municipal Bonds – (continued) | |
| | Kentucky – (continued) | |
| Kentucky State Property and Buildings Commission for Project
117 RB Refunding Series 2017 D (A+/A1) |
|
| $ | 4,000,000 | | | | 5.000 | % | | | 05/01/21 | | | $ | 4,469,560 | |
| Kentucky State Property and Buildings Commission for Project
99 RB Refunding Series 2010 A (A/A1) |
|
| | 4,480,000 | | | | 5.000 | | | | 11/01/18 | | | | 4,667,130 | |
| Kentucky State Turnpike Authority Economic Development Road
RB Refunding for Revitalization Projects Series 2016 A
(AA-/Aa3) |
|
| | 950,000 | | | | 2.000 | | | | 07/01/20 | | | | 968,126 | |
| Louisville & Jefferson County Metro Government Health System
RB for Norton Healthcare, Inc. Series 2016 A (A-/NR) |
|
| | 625,000 | | | | 5.000 | | | | 10/01/19 | | | | 669,100 | |
| | 550,000 | | | | 5.000 | | | | 10/01/20 | | | | 606,160 | |
| Louisville & Jefferson County Metropolitan Government
Environmental Facilities RB Refunding for Louisville Gas &
Electric Company Project RMKT 06/01/17 Series 2017 A
(A/A1)(b)(c) |
|
| | 4,000,000 | | | | 1.250 | | | | 06/03/19 | | | | 3,997,360 | |
| Louisville & Jefferson County PCRB for Louisville Gas &
Electric Company Project RMKT 04/03/17 Series 2003 A
(A/A1)(b)(c) |
|
| | 6,000,000 | | | | 1.500 | | | | 04/01/19 | | | | 6,020,340 | |
| Trimble County Kentucky Pollution Control RB for Gas and
Electric Company Project Series 2001 A (A/A1)(b)(c) |
|
| | 6,000,000 | | | | 1.050 | | | | 03/01/18 | | | | 5,995,080 | |
| University of Kentucky General Receipts RB Refunding
Series 2015 B (AA/Aa2) |
|
| | 3,730,000 | | | | 5.000 | | | | 10/01/18 | | | | 3,877,633 | |
| University of Kentucky General Receipts RB Refunding
Series 2015 C (AA/Aa2) |
|
| | 1,705,000 | | | | 4.000 | | | | 10/01/18 | | | | 1,755,656 | |
| University of Louisville General Receipts RB Refunding
Series 2016 C (AA-/A1) |
|
| | 4,680,000 | | | | 3.000 | | | | 09/01/21 | | | | 4,938,336 | |
| | | | | | | | | | | | | | |
| | | | | | | | | | | | | 44,128,793 | |
| | |
| Louisiana – 0.6% | |
| City of Shreveport Louisiana Water and Sewer RB Refunding
Series 2014 A (BAM) (AA/A3) |
|
| | 3,000,000 | | | | 5.000 | | | | 12/01/19 | | | | 3,235,740 | |
| Ernest N. Morial New Orleans Exhibition Hall Authority Special
Tax Refunding Bonds Series 2012 (AA+/A1) |
|
| | 680,000 | | | | 2.000 | | | | 07/15/18 | | | | 684,917 | |
| | 1,040,000 | | | | 4.000 | | | | 07/15/18 | | | | 1,063,691 | |
| | 1,000,000 | | | | 5.000 | | | | 07/15/19 | | | | 1,066,100 | |
| Jefferson Parish Sales Tax RB Refunding School Series 2012
(AA/NR) |
|
| | 1,565,000 | | | | 3.000 | | | | 02/01/18 | | | | 1,575,204 | |
| Louisiana Local Government Environmental Facilities and
Community Development Authority RB for Southeastern
Louisiana Student Series 2004 B (NATL-RE) (NR/A3)(c) |
|
| | 10,675,000 | | | | 1.645 | | | | 08/01/34 | | | | 9,607,500 | |
| | |
| | |
| 74 | | The accompanying notes are an integral part of these financial statements. |
GOLDMAN SACHS SHORT DURATION TAX-FREE FUND
| | | | | | | | | | | | |
Principal
Amount | | | Interest
Rate | | Maturity
Date | | | Value | |
| | Municipal Bonds – (continued) | |
| | Louisiana – (continued) | |
| Louisiana Local Government Environmental Facilities and
Community Development Authority RB Refunding for Ragin’
Cajun Facilities, Inc. – Student Housing & Parking Project
Series 2017 (AGM) (AA/NR) |
|
| $ | 735,000 | | | 2.250% | | | 10/01/21 | | | $ | 752,838 | |
| | 815,000 | | | 5.000 | | | 10/01/21 | | | | 921,137 | |
| | 800,000 | | | 2.500 | | | 10/01/22 | | | | 825,088 | |
| | 950,000 | | | 5.000 | | | 10/01/22 | | | | 1,092,624 | |
| New Orleans Audubon Commission for Aquarium Tax Bonds
Series 2011 (A/NR) |
|
| | 2,825,000 | | | 5.000 | | | 10/01/17 | | | | 2,825,000 | |
| | New Orleans GO Refunding Bonds Series 2012 (AA-/A3) | |
| | 4,030,000 | | | 4.000 | | | 12/01/17 | | | | 4,048,780 | |
| | | | | | | | | | | | |
| | | | | | | | | | | 27,698,619 | |
| | |
| Maine – 0.1% | |
| Maine Governmental Facilities Authority Lease Rental RB
Series 2015 B (AA-/Aa3) |
|
| | 685,000 | | | 5.000 | | | 10/01/19 | | | | 737,416 | |
| | 1,985,000 | | | 4.000 | | | 10/01/20 | | | | 2,143,721 | |
| | 1,345,000 | | | 4.000 | | | 10/01/21 | | | | 1,478,195 | |
| | | | | | | | | | | | |
| | | | | | | | | | | 4,359,332 | |
| | |
| Maryland – 3.5% | |
| Baltimore Maryland RB Refunding for Convention Center Hotel
Project Series 2017 (BBB-/NR) |
|
| | 200,000 | | | 3.000 | | | 09/01/18 | | | | 203,086 | |
| | 350,000 | | | 4.000 | | | 09/01/19 | | | | 366,555 | |
| | 500,000 | | | 5.000 | | | 09/01/20 | | | | 547,560 | |
| | 500,000 | | | 5.000 | | | 09/01/21 | | | | 559,755 | |
| | 500,000 | | | 5.000 | | | 09/01/22 | | | | 572,090 | |
| Carroll County Maryland Consolidated Public Improvement and
Refunding Bonds Series 2011 (AAA/Aa1) |
|
| | 2,075,000 | | | 5.000 | | | 11/01/17 | | | | 2,081,640 | |
| | 3,055,000 | | | 4.000 | | | 11/01/18 | | | | 3,154,318 | |
| Charles County Maryland GO Refunding Bonds Series 2011
(AAA/Aaa) |
|
| | 5,405,000 | | | 4.000 | | | 11/01/17 | | | | 5,418,188 | |
| City of Baltimore RB for Water Projects Series 2002 Subseries B
(NATL-RE FGIC) (AA/Aa2)(c) |
|
| | 11,350,000 | | | 1.637 | | | 07/01/37 | | | | 9,773,547 | |
| City of Baltimore RB for Water Projects Series 2002 Subseries C
(AA-/Aa3)(c) |
|
| | 7,025,000 | | | 1.652 | | | 10/04/17 | | | | 5,842,099 | |
| County of Baltimore GO Bonds for Consolidated Public
Improvement Series 2017 (AAA/Aaa) |
|
| | 2,825,000 | | | 5.000 | | | 03/01/23 | | | | 3,338,613 | |
| Maryland State Department of Transportation Consolidated RB
Series 2013 (AAA/Aa1) |
|
| | 6,965,000 | | | 4.000 | | | 02/15/20 | | | | 7,443,983 | |
| Maryland State Economic Development Corporation Student
Housing RB Refunding for University of Maryland College
Park Projects Series 2016 (AGM) (AA/A2) |
|
| | 600,000 | | | 4.000 | | | 06/01/19 | | | | 627,744 | |
| | 600,000 | | | 4.000 | | | 06/01/20 | | | | 638,814 | |
| | 660,000 | | | 4.000 | | | 06/01/21 | | | | 715,849 | |
| | |
| | Municipal Bonds – (continued) | |
| | Maryland – (continued) | |
| Maryland State GO Bonds for State and Local Facilities Loan
Second Series 2014 B (AAA/Aaa)(a) |
|
| $ | 19,845,000 | | | 5.000% | | | 08/01/22 | | | $ | 23,168,442 | |
| Maryland State GO Bonds for State and Local Facilities Loan
Second Series 2014 C (AAA/Aaa) |
|
| | 58,585,000 | | | 5.000 | | | 08/01/21 | | | | 66,841,384 | |
| Maryland State GO Bonds for State and Local Facilities Loan
Series 2012 B (AAA/Aaa) |
|
| | 8,980,000 | | | 5.000 | | | 03/15/20 | | | | 9,831,125 | |
| Maryland State GO Bonds for State and Local Facilities Loan
Series 2013 B (AAA/Aaa)(a) |
|
| | 5,140,000 | | | 5.000 | | | 03/01/21 | | | | 5,783,477 | |
| Prince George’s County GO Refunding Bonds for Consolidated
Public Improvement Series 2016 B (AAA/Aaa) |
|
| | 5,000,000 | | | 4.000 | | | 07/15/21 | | | | 5,514,300 | |
| University of Maryland RB Refunding Revolving Loan
Series 2003 A (AA+/Aa1)(b)(c) |
|
| | 2,010,000 | | | 1.250 | | | 06/01/18 | | | | 2,008,010 | |
| Washington Suburban Sanitary District GO Refunding Bonds
Consolidated Public Improvement Second Series 2016
(AAA/Aaa) |
|
| | 5,660,000 | | | 5.000 | | | 06/01/18 | | | | 5,811,405 | |
| | 5,555,000 | | | 5.000 | | | 06/01/19 | | | | 5,920,075 | |
| Washington Suburban Sanitary District GO Refunding Bonds
Consolidated Public Improvement Series 2015 (AAA/Aaa) |
|
| | 9,905,000 | | | 3.000 | | | 06/01/19 | | | | 10,230,478 | |
| | | | | | | | | | | | |
| | | | | | | | | | | 176,392,537 | |
| | |
| Massachusetts – 5.2% | |
| Massachusetts Bay Transportation Authority RB Series 2017
(AA/Aa3)(g) |
|
| | 50,000,000 | | | 4.000 | | | 12/01/21 | | | | 55,312,000 | |
| Massachusetts Bay Transportation Authority Sales Tax RB
Refunding for Capital Appreciation Senior Series 2016 A
(AA/Aa2)(e) |
|
| | 8,255,000 | | | 0.000 | | | 07/01/21 | | | | 7,713,554 | |
| Massachusetts Commonwealth GO Refunding Bonds
Series 2017 A (AA/Aa1)(d) |
|
| | 40,000,000 | | | (SIFMA Municipal
Swap Index Yield +
0.47%, 11.00% Cap),
1.410 | | | 02/01/19 | | | | 40,058,000 | |
| Massachusetts Commonwealth Transportation Fund RB for
Accelerated Bridge Program Series 2012 A (AAA/Aa1)(a) |
|
| | 10,000,000 | | | 5.000 | | | 06/01/21 | | | | 11,368,500 | |
| Massachusetts Commonwealth Transportation Fund RB for Rail
Enhancement Program Series 2015 A (AAA/Aa1) |
|
| | 4,000,000 | | | 5.000 | | | 06/01/20 | | | | 4,410,160 | |
| | 11,155,000 | | | 5.000 | | | 06/01/21 | | | | 12,677,323 | |
| Massachusetts Development Finance Agency RB for Harvard
University Series 2009 A (NR/NR)(a) |
|
| | 28,790,000 | | | 5.500 | | | 11/15/18 | | | | 30,244,471 | |
| | |
| | |
| The accompanying notes are an integral part of these financial statements. | | 75 |
GOLDMAN SACHS SHORT DURATION TAX-FREE FUND
Schedule of Investments (continued)
September 30, 2017 (Unaudited)
| | | | | | | | | | | | |
Principal
Amount | | | Interest
Rate | | Maturity
Date | | | Value | |
| | Municipal Bonds – (continued) | |
| | Massachusetts – (continued) | |
| Massachusetts Development Finance Agency RB for Partners
HealthCare System Series 2014 M-5 (AA-/Aa3)(b) |
|
| $ | 19,340,000 | | | (SIFMA Municipal
Swap Index Yield +
0.55%, 10.00% Cap),
1.490% | | | 01/30/18 | | | $ | 19,348,123 | |
| Massachusetts School Building Authority RB Refunding Senior
Dedicated Sales Tax Series 2012 B (AA+/Aa2) |
|
| | 3,000,000 | | | 5.000 | | | 08/15/20 | | | | 3,329,250 | |
| Massachusetts State Development Finance Agency RB Refunding
for Boston University Issue Series Z-1 (A+/A1) |
|
| | 10,000,000 | | | 1.500 | | | 08/01/19 | | | | 10,063,100 | |
| Massachusetts State GO Bonds Consolidated Loan Series 2007 A
(NATL-RE FGIC) (AA/Aa1)(d) |
|
| | 14,895,000 | | | (3 Mo. LIBOR +
0.57%, 20.00% Cap),
1.448 | | | 05/01/37 | | | | 14,038,984 | |
| Massachusetts State GO Bonds Consolidated Loan Series 2009 A
(AA/Aa1)(a) |
|
| | 5,210,000 | | | 5.000 | | | 03/01/19 | | | | 5,500,510 | |
| Massachusetts State GO Bonds Consolidated Loan Series 2012 A
(BHAC-CR) (AA+/Aa1)(d) |
|
| | 26,075,000 | | | (3 Mo. LIBOR +
0.57%, 20.00% Cap),
1.448 | | | 05/01/37 | | | | 25,026,785 | |
| Massachusetts State GO Bonds Consolidated Loan Series 2012 D
(AA/Aa1)(d) |
|
| | 7,000,000 | | | (SIFMA Municipal
Swap Index Yield +
0.43%, 11.00% Cap),
1.370 | | | 01/01/18 | | | | 6,999,860 | |
| Massachusetts State GO Refunding Bonds Series 2007 A
(AA/Aa1)(d) |
|
| | 8,000,000 | | | (3 Mo. LIBOR +
0.55%, 20.00% Cap),
1.428 | | | 11/01/25 | | | | 7,986,160 | |
| Massachusetts State Health & Educational Facilities Authority RB
for Tufts University Issue Series 2008 N-2 (AA-/Aa2)(b)(c) |
|
| | 8,000,000 | | | 0.770 | | | 10/05/17 | | | | 8,000,000 | |
| | | | | | | | | | | | |
| | | | | | | | | | | 262,076,780 | |
| | |
| Michigan – 2.8% | |
| Allen Park Public School District GO Refunding Bonds
Series 2016 (Q-SBLF) (AA-/NR) |
|
| | 3,635,000 | | | 5.000 | | | 05/01/21 | | | | 4,094,137 | |
| Allendale Public School GO Refunding Bonds Series 2016
(Q-SBLF) (AA-/NR) |
|
| | 2,500,000 | | | 5.000 | | | 05/01/22 | | | | 2,866,575 | |
| | 1,275,000 | | | 5.000 | | | 11/01/22 | | | | 1,477,495 | |
| Detroit Michigan Sewage Disposal System RB Refunding Senior
Lien Series 2004 A (AGM) (AA/A2) |
|
| | 2,990,000 | | | 5.250 | | | 07/01/20 | | | | 3,296,266 | |
| Detroit Michigan Sewage Disposal System RB Senior Lien
RMKT 06/17/09 Series 2003 B (AGM) (AA/NR)(a) |
|
| | 1,800,000 | | | 7.500 | | | 07/01/19 | | | | 2,000,448 | |
| | |
| | Municipal Bonds – (continued) | |
| | Michigan – (continued) | |
| Macomb County Michigan L’anse Creuse Public Schools
Unlimited Tax GO Refunding Bonds Series 2015 (Q-SBLF)
(AA-/NR) |
|
| $ | 1,250,000 | | | 5.000% | | | 05/01/20 | | | $ | 1,364,862 | |
| Macomb County Michigan Roseville Community Schools
Unlimited Tax GO Refunding Bonds Series 2014 (Q-SBLF)
(AA-/NR) |
|
| | 365,000 | | | 5.000 | | | 05/01/18 | | | | 372,979 | |
| | 900,000 | | | 5.000 | | | 05/01/19 | | | | 951,390 | |
| Michigan Finance Authority Hospital RB Refunding for
Beaumont Health Credit Group Series 2015 A (A/A1) |
|
| | 2,300,000 | | | 4.000 | | | 08/01/20 | | | | 2,466,520 | |
| | 3,635,000 | | | 5.000 | | | 08/01/21 | | | | 4,102,134 | |
| Michigan Finance Authority Hospital RB Refunding for Henry
Ford Health System Series 2016 (A/A3) |
|
| | 200,000 | | | 5.000 | | | 11/15/19 | | | | 215,310 | |
| | 200,000 | | | 5.000 | | | 11/15/20 | | | | 221,686 | |
| | 500,000 | | | 5.000 | | | 11/15/21 | | | | 567,885 | |
| Michigan Finance Authority Local Government Loan Program
RB for City of Detroit Distributable State Aid Fourth Lien Utgo
Refunding Local Project Bonds Series 2016 C-3 (MUN GOVT
GTD) (A-/A2) |
|
| | 3,500,000 | | | 5.000 | | | 04/01/20 | | | | 3,764,005 | |
| | 1,510,000 | | | 5.000 | | | 04/01/21 | | | | 1,662,691 | |
| Michigan Finance Authority Local Government Loan Program
RB for Detroit Financial Recovery Income Tax Revenue and
Refunding Local Project Bonds Series 2014 F (A/NR) |
|
| | 500,000 | | | 3.400 | | | 10/01/20 | | | | 516,265 | |
| | 500,000 | | | 3.600 | | | 10/01/21 | | | | 522,725 | |
| | 500,000 | | | 3.800 | | | 10/01/22 | | | | 528,415 | |
| Michigan Finance Authority Local Government Loan Program
RB for Detroit Water and Sewerage Department Sewage
Disposal System RB Refunding Local Project Bonds Senior
Lien Series 2014 C-3 (AGM) (AA/A2) |
|
| | 5,125,000 | | | 5.000 | | | 07/01/21 | | | | 5,771,672 | |
| Michigan Finance Authority Local Government Loan Program
RB for Detroit Water and Sewerage Department Sewage
Disposal System RB Refunding Local Project Bonds Senior
Lien Series 2014 C-5 (NATL-RE FGIC) (A/A3) |
|
| | 1,500,000 | | | 5.000 | | | 07/01/18 | | | | 1,540,950 | |
| Michigan Finance Authority Local Government Loan Program
RB for Detroit Water and Sewerage Department Water Supply
System RB Refunding Local Project Bonds Senior Lien
Series 2014 D-1 (AGM) (AA/A2) |
|
| | 3,165,000 | | | 5.000 | | | 07/01/20 | | | | 3,467,954 | |
| | 10,000,000 | | | 5.000 | | | 07/01/21 | | | | 11,238,500 | |
| | 9,225,000 | | | 5.000 | | | 07/01/22 | | | | 10,561,426 | |
| | 5,000,000 | | | 5.000 | | | 07/01/23 | | | | 5,827,750 | |
| Michigan Finance Authority Local Government Loan Program
RB for Detroit Water and Sewerage Department Water Supply
System RB Refunding Local Project Bonds Senior Lien
Series 2014 D-3 (NATL-RE FGIC) (A/A3) |
|
| | 7,410,000 | | | 5.000 | | | 07/01/18 | | | | 7,612,293 | |
| | 5,000,000 | | | 5.000 | | | 07/01/19 | | | | 5,313,500 | |
| | 1,390,000 | | | 5.000 | | | 07/01/20 | | | | 1,523,051 | |
| | |
| | |
| 76 | | The accompanying notes are an integral part of these financial statements. |
GOLDMAN SACHS SHORT DURATION TAX-FREE FUND
| | | | | | | | | | | | | | |
Principal
Amount | | | Interest
Rate | | | Maturity
Date | | | Value | |
| | Municipal Bonds – (continued) | |
| | Michigan – (continued) | |
| Michigan Finance Authority Local Government Loan Program
RB for Detroit Water and Sewerage Department Water Supply
System RB Refunding Local Project Bonds Series 2015 D-1
(A-/A3) |
|
| $ | 700,000 | | | | 5.000 | % | | | 07/01/19 | | | $ | 742,637 | |
| | 375,000 | | | | 5.000 | | | | 07/01/20 | | | | 409,305 | |
| | 750,000 | | | | 5.000 | | | | 07/01/21 | | | | 835,642 | |
| Michigan Finance Authority Local Government Loan Program
RB for Public Lighting Authority Local Project Bonds
Series 2014 B (A-/NR) |
|
| | 1,400,000 | | | | 4.000 | | | | 07/01/18 | | | | 1,424,010 | |
| | 1,125,000 | | | | 5.000 | | | | 07/01/19 | | | | 1,184,929 | |
| | 1,200,000 | | | | 5.000 | | | | 07/01/20 | | | | 1,296,300 | |
| Michigan Finance Authority Local Government Loan Program
RB Refunding for Regional Convention Facility Local Project
Series 2014 H-1 (AA-/NR) |
|
| | 1,135,000 | | | | 5.000 | | | | 10/01/18 | | | | 1,178,663 | |
| | 825,000 | | | | 5.000 | | | | 10/01/19 | | | | 884,738 | |
| | 1,140,000 | | | | 5.000 | | | | 10/01/20 | | | | 1,218,341 | |
| Michigan Finance Authority RB Refunding for Unemployment
Obligation Assessment Series 2012 B (AAA/Aaa) |
|
| | 4,085,000 | | | | 5.000 | | | | 01/01/20 | | | | 4,370,501 | |
| Michigan Flushing Community Schools Unlimited Tax GO
Refunding Bonds Series 2015 (Q-SBLF) (NR/Aa1) |
|
| | 1,040,000 | | | | 4.000 | | | | 05/01/19 | | | | 1,084,866 | |
| | 500,000 | | | | 4.000 | | | | 05/01/20 | | | | 534,505 | |
| Michigan State Hospital Finance Authority RB Refunding for
Ascension Health Credit Group Series 2010 F-1 (AA+/Aa2)(b)(c) |
|
| | 3,050,000 | | | | 2.000 | | | | 05/30/18 | | | | 3,067,141 | |
| Michigan State Hospital Finance Authority RB Refunding for
Ascension Health Senior Credit Group RMKT 03/01/17
Series 2010 F-2 (AA+/Aa2)(b)(c) |
|
| | 2,600,000 | | | | 1.900 | | | | 04/01/21 | | | | 2,634,398 | |
| Michigan State Hospital Finance Authority RB Refunding for
Ascension Health Senior Credit Group RMKT 03/15/17
Series 2010 F-5 (AA+/Aa2)(b)(c) |
|
| | 4,400,000 | | | | 2.400 | | | | 03/15/23 | | | | 4,517,964 | |
| Michigan Strategic Fund RB Refunding for The Detroit Edison
Company Pollution Control Bonds Project RMKT 09/01/16
Series 2008 ET-2 (A/Aa3)(b)(c) |
|
| | 2,000,000 | | | | 1.450 | | | | 09/01/21 | | | | 1,975,920 | |
| Michigan Strategic Fund RB Refunding for The Detroit Edison
Company Pollution Control Bonds Project Series 1995 CC
(A/Aa3)(b)(c) |
|
| | 4,000,000 | | | | 1.450 | | | | 09/01/21 | | | | 3,951,800 | |
| Pinckney Community Schools Livingston and Washtenaw County
GO Refunding Bonds Series 2014 (Q-SBLF) (AA-/NR) |
|
| | 1,000,000 | | | | 5.000 | | | | 05/01/18 | | | | 1,021,390 | |
| | 2,475,000 | | | | 5.000 | | | | 05/01/20 | | | | 2,697,799 | |
| Rochester Community School District GO Refunding Bonds
Series 2012 (Q-SBLF) (AA-/NR) |
|
| | 875,000 | | | | 4.000 | | | | 05/01/18 | | | | 890,382 | |
| | 700,000 | | | | 4.000 | | | | 05/01/19 | | | | 731,885 | |
| Royal Oak Hospital Finance Authority RB for William Beaumont
Hospital Series 2014 D (A/A1) |
|
| | 1,500,000 | | | | 5.000 | | | | 09/01/19 | | | | 1,604,400 | |
| | |
| | Municipal Bonds – (continued) | |
| | Michigan – (continued) | |
| St. Clair County Michigan East China School District 2015
School Bus GO Refunding Bonds Series I (Q-SBLF) (AA-/NR) |
|
| $ | 3,170,000 | | | | 3.000 | % | | | 05/01/19 | | | $ | 3,257,397 | |
| | University of Michigan RB Refunding Series 2010 C (AAA/Aaa) | |
| | 4,555,000 | | | | 5.000 | | | | 04/01/21 | | | | 4,982,669 | |
| Warren Consolidated School District Unlimited Tax GO
Refunding Bonds Series 2016 B (BAM) (AA/NR) |
|
| | 1,625,000 | | | | 4.000 | | | | 05/01/18 | | | | 1,652,625 | |
| | 1,790,000 | | | | 5.000 | | | | 05/01/19 | | | | 1,894,232 | |
| Washtenaw County Ypsilanti Community Schools Unlimited Tax
GO Refunding Bonds Series 2015 A (Q-SBLF) (AA-/NR) |
|
| | 1,420,000 | | | | 4.000 | | | | 05/01/19 | | | | 1,475,139 | |
| Washtenaw County Ypsilanti Community Schools Unlimited Tax
GO Refunding Bonds Series 2016 A (Q-SBLF) (AA-/NR) |
|
| | 1,260,000 | | | | 4.000 | | | | 05/01/20 | | | | 1,341,661 | |
| | 1,000,000 | | | | 5.000 | | | | 05/01/21 | | | | 1,118,870 | |
| | 1,000,000 | | | | 5.000 | | | | 05/01/22 | | | | 1,140,940 | |
| Wayne County Airport Authority RB Refunding for Detroit
Metropolitan Wayne County Airport Series 2012 A (A/A2) |
|
| | 1,270,000 | | | | 5.000 | | | | 12/01/18 | | | | 1,328,636 | |
| | 1,385,000 | | | | 5.000 | | | | 12/01/19 | | | | 1,499,096 | |
| Western Township Utilities Authority Sewage Disposal System
Limited Tax RB for Series 2012 (MUN GOVT GTD) (AA/NR) |
|
| | 1,000,000 | | | | 4.000 | | | | 01/01/19 | | | | 1,034,970 | |
| | | | | | | | | | | | | | |
| | | | | | | | | | | | | 142,832,635 | |
| | |
| Minnesota – 1.1% | |
| Circle Pines Minnesota Independent School District No. 012 GO
Bonds Series 2015 A (SD CRED PROG) (AA+/NR)(e) |
|
| | 675,000 | | | | 0.000 | | | | 02/01/21 | | | | 642,674 | |
| Farmington Minnesota Independent School District No. 192 GO
School Building Refunding Bonds Series 2012 D (SD CRED
PROG) (NR/Aa2) |
|
| | 3,190,000 | | | | 1.500 | | | | 06/01/18 | | | | 3,200,878 | |
| Maple Grove Minnesota Health Care Facilities RB Refunding for
Maple Grove Hospital Corporation Series 2017 (NR/Baa1) |
|
| | 500,000 | | | | 4.000 | | | | 05/01/21 | | | | 538,305 | |
| | 500,000 | | | | 4.000 | | | | 05/01/22 | | | | 543,075 | |
| | 500,000 | | | | 5.000 | | | | 05/01/23 | | | | 573,385 | |
| Minneapolis Minnesota Convention Center GO Refunding Bonds
Series 2011 A (AAA/Aa1) |
|
| | 7,980,000 | | | | 2.000 | | | | 12/01/17 | | | | 7,994,524 | |
| Minneapolis Minnesota Various Purpose GO Improvement Bonds
Series 2016 (AAA/Aa1) |
|
| | 10,000,000 | | | | 2.000 | | | | 12/01/20 | | | | 10,259,900 | |
| Minnesota Higher Education Facilities Authority RB for
University of St. Thomas Series 2013 7-U (NR/A2) |
|
| | 500,000 | | | | 5.000 | | | | 04/01/18 | | | | 509,890 | |
| Minnesota State Trunk Highway GO Bonds Series 2017 B
(AA+/Aa1)(g) |
|
| | 5,200,000 | | | | 5.000 | | | | 10/01/19 | | | | 5,595,616 | |
| | 5,700,000 | | | | 5.000 | | | | 10/01/21 | | | | 6,513,903 | |
| | 5,700,000 | | | | 5.000 | | | | 10/01/22 | | | | 6,661,362 | |
| Minnesota State Trunk Highway GO Refunding Bonds
Series 2014 E (AA+/Aa1) |
|
| | 12,220,000 | | | | 2.000 | | | | 08/01/18 | | | | 12,323,503 | |
| | | | | | | | | | | | | | |
| | | | | | | | | | | | | 55,357,015 | |
| | |
| | |
| The accompanying notes are an integral part of these financial statements. | | 77 |
GOLDMAN SACHS SHORT DURATION TAX-FREE FUND
Schedule of Investments (continued)
September 30, 2017 (Unaudited)
| | | | | | | | | | | | |
Principal
Amount | | | Interest
Rate | | Maturity
Date | | | Value | |
| | Municipal Bonds – (continued) | |
| | Mississippi – 0.4% | |
| Jackson County Mississippi Pollution Control RB Refunding for
Chevron USA, Inc. Project RMKT 11/01/99 Series 1993
(AA-/Aa2)(b)(c) |
|
| $ | 6,150,000 | | | 0.960% | | | 10/02/17 | | | $ | 6,150,000 | |
| Mississippi Business Finance Corp. RB for Chevron USA, Inc.
Project Series 2011 B (AA-/Aa2)(b)(c) |
|
| | 7,000,000 | | | 0.960 | | | 10/02/17 | | | | 7,000,000 | |
| | Mississippi State GO Refunding Bonds Series 2017 B (AA/Aa2)(b) | |
| | 7,000,000 | | | (1 Mo. LIBOR + 0.33%,
11.00% Cap), 1.159 | | | 09/01/20 | | | | 6,997,480 | |
| | | | | | | | | | | | |
| | | | | | | | | | | 20,147,480 | |
| | |
| | Missouri – 1.4% | |
| Cape Girardeau County IDA Health Facilities RB Refunding for
South Eastern Health Series 2017 A (BBB-/Baa3) |
|
| | 300,000 | | | 5.000 | | | 03/01/19 | | | | 313,785 | |
| | 325,000 | | | 5.000 | | | 03/01/20 | | | | 348,549 | |
| | 400,000 | | | 5.000 | | | 03/01/21 | | | | 436,744 | |
| City of Columbia Electric Utility Special Obligation RB for
Annual Appropriation Series 2012 E (AA/NR) |
|
| | 1,995,000 | | | 4.000 | | | 09/01/18 | | | | 2,049,683 | |
| | 2,075,000 | | | 4.000 | | | 09/01/19 | | | | 2,188,876 | |
| Missouri State Development Finance Board Infrastructure
Facilities Leasehold Improvement and RB Refunding for City of
Independence Electric System Projects Series 2012 F (A/NR) |
|
| | 1,180,000 | | | 4.000 | | | 06/01/18 | | | | 1,202,302 | |
| | 960,000 | | | 4.000 | | | 06/01/19 | | | | 1,003,258 | |
| | 1,000,000 | | | 4.000 | | | 06/01/20 | | | | 1,056,360 | |
| Missouri State Highways and Transportation Commission Second
Lien GO Refunding State Road Bonds Series 2014 B (AAA/Aa1) |
|
| | 34,540,000 | | | 5.000 | | | 05/01/18 | | | | 35,347,890 | |
| | 24,275,000 | | | 5.000 | | | 05/01/19 | | | | 25,790,974 | |
| St. Louis Airport RB Refunding for Lambert St. Louis
International Airport Series 2013 (A-/A3) |
|
| | 765,000 | | | 5.000 | | | 07/01/18 | | | | 787,277 | |
| | | | | | | | | | | | |
| | | | | | | | | | | 70,525,698 | |
| | |
| | Montana – 0.4% | |
| | City of Billings RB for Sewer System Series 2017 (AA+/Aa3) | |
| | 275,000 | | | 4.000 | | | 07/01/19 | | | | 289,033 | |
| | 240,000 | | | 4.000 | | | 07/01/20 | | | | 258,423 | |
| | 210,000 | | | 4.000 | | | 07/01/21 | | | | 230,815 | |
| | 310,000 | | | 5.000 | | | 07/01/22 | | | | 360,276 | |
| Forsyth Montana Pollution Control RB Refunding for
Northwestern Corp. Colstrip Project Series 2016 (A-/A2) |
|
| | 11,000,000 | | | 2.000 | | | 08/01/23 | | | | 10,933,890 | |
| Gallatin County High School District No. 7 GO Bonds for School
Building Series 2017 A (NR/Aa2) |
|
| | 330,000 | | | 4.000 | | | 06/01/19 | | | | 346,154 | |
| | 345,000 | | | 4.000 | | | 12/01/19 | | | | 366,918 | |
| | 400,000 | | | 4.000 | | | 06/01/20 | | | | 430,224 | |
| | 500,000 | | | 4.000 | | | 12/01/20 | | | | 544,105 | |
| | 645,000 | | | 4.000 | | | 06/01/21 | | | | 709,003 | |
| | 510,000 | | | 4.000 | | | 12/01/21 | | | | 565,814 | |
| | 260,000 | | | 5.000 | | | 06/01/22 | | | | 301,959 | |
| | 445,000 | | | 5.000 | | | 12/01/22 | | | | 522,550 | |
| | |
| | Municipal Bonds – (continued) | |
| | Montana – (continued) | |
| Montana State Department of Transportation Refunding Grant
Anticipation Notes for Highway 93 Advance Construction
Project-Garvees Series 2012 (AA/A2) |
|
| $ | 1,750,000 | | | 3.000% | | | 06/01/18 | | | $ | 1,771,717 | |
| | 800,000 | | | 4.000 | | | 06/01/18 | | | | 815,176 | |
| | | | | | | | | | | | |
| | | | | | | | | | | 18,446,057 | |
| | |
| | Nebraska – 0.5% | |
| Gas Supply RB Refunding for Central Plains Energy Project
Series 2014 (NR/A1)(b)(c) |
|
| | 20,000,000 | | | 5.000 | | | 12/01/19 | | | | 21,536,000 | |
| Lincoln County Hospital Authority No. 1 RB Refunding for Great
Plains Regional Medical Center Project Series 2012 (A-/NR) |
|
| | 435,000 | | | 4.000 | | | 11/01/17 | | | | 435,979 | |
| | 750,000 | | | 4.000 | | | 11/01/19 | | | | 780,990 | |
| | 690,000 | | | 4.000 | | | 11/01/20 | | | | 730,986 | |
| Omaha Nebraska Special Tax RB Refunding for Performing Arts
Project Series 2012 (AA+/Aa2) |
|
| | 1,785,000 | | | 3.000 | | | 10/15/18 | | | | 1,820,860 | |
| | | | | | | | | | | | |
| | | | | | | | | | | 25,304,815 | |
| | |
| | Nevada – 1.0% | |
| Clark County Pollution Control RB Refunding for Nevada Power
Company Project Series 2017 (A+/A2)(b)(c) |
|
| | 1,850,000 | | | 1.600 | | | 05/21/20 | | | | 1,849,038 | |
| Clark County School District Limited Tax GO Refunding Bonds
Series 2015 B (AA-/A1) |
|
| | 11,900,000 | | | 5.000 | | | 06/15/18 | | | | 12,230,225 | |
| | 10,300,000 | | | 5.000 | | | 06/15/19 | | | | 10,969,088 | |
| Las Vegas City Limited Tax GO Bonds Medium-Term Various
Purpose Series 2011 A (AA/Aa2) |
|
| | 2,810,000 | | | 4.000 | | | 12/01/17 | | | | 2,813,091 | |
| Nevada State Limited Tax GO Refunding Bonds for Capital
Improvement Series 2015 D (AA/Aa2) |
|
| | 18,085,000 | | | 5.000 | | | 04/01/21 | | | | 20,396,806 | |
| | | | | | | | | | | | |
| | | | | | | | | | | 48,258,248 | |
| | |
| | New Hampshire – 1.0% | |
| New Hampshire Business Finance Authority RB for Pollution
Control Project Series 2001 A (AMT) (NATL-RE) (A+/A1)(c) |
|
| | 50,475,000 | | | 1.908 | | | 05/01/21 | | | | 49,175,592 | |
| New Hampshire State Business Finance Authority RB for Waste
Management, Inc. Series 2003 (AMT) (A-/NR)(b)(c) |
|
| | 1,200,000 | | | 2.125 | | | 06/01/18 | | | | 1,204,752 | |
| | | | | | | | | | | | |
| | | | | | | | | | | 50,380,344 | |
| | |
| | New Jersey – 7.4% | |
| Atlantic City New Jersey Tax Appeal Refunding Bonds
Series 2017 A (BAM) (ST AID WITHHLDG) (AA/Baa1) |
|
| | 220,000 | | | 5.000 | | | 03/01/20 | | | | 236,859 | |
| | 500,000 | | | 5.000 | | | 03/01/23 | | | | 571,315 | |
| Bergen County New Jersey GO Refunding Bonds for General
Improvement Series 2011 A (ST AID WITHHLDG) (NR/Aaa) |
|
| | 2,355,000 | | | 2.000 | | | 12/01/17 | | | | 2,359,380 | |
| Burlington County New Jersey GO Bonds Series 2015 A
(AA/Aa2) |
|
| | 1,080,000 | | | 2.000 | | | 05/01/18 | | | | 1,086,199 | |
| | 1,275,000 | | | 2.000 | | | 05/01/19 | | | | 1,293,500 | |
| | |
| | |
| 78 | | The accompanying notes are an integral part of these financial statements. |
GOLDMAN SACHS SHORT DURATION TAX-FREE FUND
| | | | | | | | | | | | |
Principal
Amount | | | Interest
Rate | | Maturity
Date | | | Value | |
| | Municipal Bonds – (continued) | |
| | New Jersey – (continued) | |
| Casino Reinvestment Development Authority Luxury Tax RB
Series 2014 (BBB+/Baa2) |
|
| $ | 1,000,000 | | | 4.000% | | | 11/01/17 | | | $ | 1,001,270 | |
| East Brunswick Township Board of Education Refunding Bonds
Series 2012 (SCH BD RES FD) (NR/Aa2) |
|
| | 1,130,000 | | | 4.000 | | | 11/01/18 | | | | 1,165,505 | |
| | 1,300,000 | | | 5.000 | | | 11/01/19 | | | | 1,401,894 | |
| Gloucester County Improvement Authority RB Refunding for
Solid Waste Management, Inc. Project Series 1999 A
(A-/NR)(b)(c) |
|
| | 2,950,000 | | | 2.125 | | | 12/01/17 | | | | 2,953,924 | |
| Gloucester County New Jersey GO Refunding Bonds Series 2011
(AA/NR) |
|
| | 1,245,000 | | | 3.000 | | | 10/01/17 | | | | 1,245,000 | |
| Hudson County New Jersey GO Refunding Bonds Series 2015
(AGM) (AA/Aa3) |
|
| | 700,000 | | | 4.000 | | | 02/15/19 | | | | 726,383 | |
| | 725,000 | | | 4.000 | | | 02/15/20 | | | | 771,342 | |
| | 1,025,000 | | | 4.000 | | | 02/15/21 | | | | 1,114,093 | |
| | Mercer County New Jersey GO Bonds Series 2015 (AA+/NR) | |
| | 2,155,000 | | | 0.050 | | | 02/01/18 | | | | 2,149,354 | |
| | 2,355,000 | | | 0.050 | | | 02/01/19 | | | | 2,326,787 | |
| | Mercer County New Jersey GO Bonds Series 2016 (AA+/NR) | |
| | 3,380,000 | | | 1.500 | | | 07/15/21 | | | | 3,392,405 | |
| Middlesex County New Jersey GO Bonds for General
Improvements Series 2016 (AAA/NR) |
|
| | 4,675,000 | | | 3.000 | | | 01/15/20 | | | | 4,877,942 | |
| Morris County Improvement Authority RB Refunding for
Governmental Loan Series 2015 (CNTY GTD) (AAA/Aaa) |
|
| | 4,000,000 | | | 3.000 | | | 05/01/19 | | | | 4,123,640 | |
| New Jersey Economic Development Authority RB for Provident
Group – Kean Properties L.L.C. – Kean University Student
Housing Project Series 2017 A (BBB-/NR) |
|
| | 180,000 | | | 4.000 | | | 07/01/21 | | | | 190,580 | |
| | 220,000 | | | 4.000 | | | 01/01/22 | | | | 233,204 | |
| | 225,000 | | | 4.000 | | | 07/01/22 | | | | 239,279 | |
| | 270,000 | | | 4.000 | | | 01/01/23 | | | | 286,775 | |
| | 275,000 | | | 4.000 | | | 07/01/23 | | | | 292,540 | |
| | 320,000 | | | 4.000 | | | 01/01/24 | | | | 339,210 | |
| | 325,000 | | | 4.000 | | | 07/01/24 | | | | 344,698 | |
| New Jersey Economic Development Authority RB for School
Facilities Construction Bonds Series 2011 GG (ETM)
(ST APPROP) (NR/Baa1)(a) |
|
| | 4,485,000 | | | 5.000 | | | 09/01/19 | | | | 4,814,872 | |
| New Jersey Economic Development Authority RB for School
Facilities Construction Series 2017 DDD (BBB+/Baa1)(g) |
|
| | 500,000 | | | 5.000 | | | 06/15/19 | | | | 526,830 | |
| | 600,000 | | | 5.000 | | | 06/15/20 | | | | 646,476 | |
| New Jersey Educational Facilities Authority RB for Rider
University Series 2012 A (BBB-/Baa2) |
|
| | 1,265,000 | | | 4.000 | | | 07/01/18 | | | | 1,281,597 | |
| New Jersey Educational Facilities Authority RB Refunding for
New Jersey City University Series 2016 D (AGM) (AA/A2) |
|
| | 2,085,000 | | | 3.000 | | | 07/01/19 | | | | 2,145,924 | |
| | 2,150,000 | | | 3.000 | | | 07/01/20 | | | | 2,237,548 | |
| | 2,210,000 | | | 3.000 | | | 07/01/21 | | | | 2,319,505 | |
| | |
| | Municipal Bonds – (continued) | |
| | New Jersey – (continued) | |
| New Jersey Educational Facilities Authority RB Refunding for
Stevens Institute of Technology Series 2017 A (A-/NR) |
|
| $ | 630,000 | | | 4.000% | | | 07/01/18 | | | $ | 642,927 | |
| | 315,000 | | | 5.000 | | | 07/01/19 | | | | 335,371 | |
| | 315,000 | | | 5.000 | | | 07/01/20 | | | | 345,511 | |
| | 485,000 | | | 5.000 | | | 07/01/21 | | | | 545,441 | |
| | 440,000 | | | 5.000 | | | 07/01/22 | | | | 504,605 | |
| New Jersey Health Care Facilities Financing Authority RB for
Princeton Healthcare System Issue Series 2016 A (BBB/Baa2) |
|
| | 750,000 | | | 5.000 | | | 07/01/21 | | | | 836,220 | |
| New Jersey Health Care Facilities Financing Authority RB
Refunding for Barnabas Health Series 2012 A (A+/A1) |
|
| | 400,000 | | | 5.000 | | | 07/01/18 | | | | 411,620 | |
| New Jersey Health Care Facilities Financing Authority RB
Refunding for Trinitas Regional Medical Center Series 2017 A
(BBB/Baa2) |
|
| | 4,300,000 | | | 5.000 | | | 07/01/18 | | | | 4,406,038 | |
| | 1,530,000 | | | 5.000 | | | 07/01/19 | | | | 1,616,109 | |
| | 1,000,000 | | | 5.000 | | | 07/01/20 | | | | 1,084,450 | |
| | 1,000,000 | | | 5.000 | | | 07/01/21 | | | | 1,109,210 | |
| | 1,240,000 | | | 5.000 | | | 07/01/22 | | | | 1,397,951 | |
| | New Jersey State GO Refunding Bonds Series 2016 T (A-/A3) | |
| | 7,515,000 | | | 5.000 | | | 06/01/18 | | | | 7,702,875 | |
| New Jersey State Transit Corp. Refunding Grant Anticipation
Notes Series 2014 A (A/A3) |
|
| | 7,500,000 | | | 5.000 | | | 09/15/18 | | | | 7,734,375 | |
| New Jersey State Turnpike Authority RB Refunding
Series 2014 C (A+/A2) |
|
| | 22,000,000 | | | 5.000 | | | 01/01/20 | | | | 23,840,300 | |
| New Jersey State Turnpike Authority RB Refunding
Series 2017 C-1 (A+/A2)(d)(g) |
|
| | 1,290,000 | | | (1 Mo. LIBOR + 0.34%,
8.00% Cap), 0.000 | | | 01/01/21 | | | | 1,288,400 | |
| New Jersey State Turnpike Authority RB Refunding
Series 2017 C-2 (A+/A2)(d)(g) |
|
| | 5,000,000 | | | (1 Mo. LIBOR + 0.48%,
8.00% Cap),0.000 | | | 01/01/22 | | | | 4,991,950 | |
| New Jersey State Turnpike Authority RB Refunding
Series 2017 C-3 (A+/A2)(d)(g) |
|
| | 15,565,000 | | | (1 Mo. LIBOR + 0.60%,
8.00% Cap),0.000 | | | 01/01/23 | | | | 15,568,580 | |
| New Jersey State Turnpike Authority RB Series 2000 C
(NATL-RE) (A+/A2)(c) |
|
| | 21,625,000 | | | 1.540 | | | 01/01/30 | | | | 21,625,000 | |
| New Jersey State Turnpike Authority RB Series 2000 D
(NATL-RE) (A+/A2)(c) |
|
| | 21,500,000 | | | 1.645 | | | 01/01/30 | | | | 21,500,000 | |
| | New Jersey State Turnpike Authority RB Series 2012 B (A+/A2) | |
| | 10,000,000 | | | 5.000 | | | 01/01/19 | | | | 10,484,400 | |
| New Jersey State Turnpike Authority RB Series 2013 A
(NR/NR)(a) |
|
| | 5,930,000 | | | 5.000 | | | 07/01/22 | | | | 6,906,493 | |
| | |
| | |
| The accompanying notes are an integral part of these financial statements. | | 79 |
GOLDMAN SACHS SHORT DURATION TAX-FREE FUND
Schedule of Investments (continued)
September 30, 2017 (Unaudited)
| | | | | | | | | | | | |
Principal
Amount | | | Interest
Rate | | Maturity
Date | | | Value | |
| | Municipal Bonds – (continued) | |
| | New Jersey – (continued) | |
| New Jersey Transportation Trust Fund Authority RB Capital
Appreciation for Transportation System Bonds Series 2010 A
(BBB+/Baa1)(e) |
|
| $ | 5,000,000 | | | 0.000% | | | 12/15/28 | | | $ | 3,184,100 | |
| New Jersey Transportation Trust Fund Authority RB for Federal
Highway Reimbursement Notes Subseries 2016 A-2 (A+/Baa1) |
|
| | 19,950,000 | | | 5.000 | | | 06/15/29 | | | | 20,381,718 | |
| New Jersey Transportation Trust Fund Authority RB for
Transportation Program Bonds Series 2012 AA (ST APPROP)
(BBB+/Baa1) |
|
| | 2,945,000 | | | 5.000 | | | 06/15/19 | | | | 3,103,529 | |
| New Jersey Transportation Trust Fund Authority RB for
Transportation Program Bonds Series 2014 AA (BBB+/Baa1) |
|
| | 10,000,000 | | | 5.000 | | | 06/15/21 | | | | 10,989,400 | |
| New Jersey Transportation Trust Fund Authority RB for
Transportation Program Bonds Series 2015 AA (BBB+/Baa1) |
|
| | 1,000,000 | | | 5.000 | | | 06/15/21 | | | | 1,098,940 | |
| New Jersey Transportation Trust Fund Authority RB for
Transportation System Bonds Series 2006 A (BBB+/Baa1) |
|
| | 15,550,000 | | | 5.250 | | | 12/15/20 | | | | 17,052,752 | |
| New Jersey Transportation Trust Fund Authority RB for
Transportation System Bonds Series 2006 C (AMBAC)
(BBB+/Baa1)(e) |
|
| | 10,000,000 | | | 0.000 | | | 12/15/25 | | | | 7,505,600 | |
| New Jersey Transportation Trust Fund Authority RB for
Transportation System Bonds Series 2006 C (NATL-RE)
(A/A3)(e) |
|
| | 15,000,000 | | | 0.000 | | | 12/15/27 | | | | 10,278,900 | |
| | 14,390,000 | | | 0.000 | | | 12/15/30 | | | | 8,520,319 | |
| | 5,000,000 | | | 0.000 | | | 12/15/31 | | | | 2,821,600 | |
| New Jersey Transportation Trust Fund Authority RB for
Transportation System Bonds Series 2008 A (AA+/Aaa)(a) |
|
| | 1,435,000 | | | 6.000 | | | 12/15/18 | | | | 1,521,416 | |
| New Jersey Transportation Trust Fund Authority RB for
Transportation System Bonds Series 2010 D (BBB+/Baa1) |
|
| | 3,015,000 | | | 5.000 | | | 12/15/23 | | | | 3,404,659 | |
| New Jersey Transportation Trust Fund Authority RB for
Transportation System Bonds Series 2013 A (BBB+/Baa1) |
|
| | 2,010,000 | | | 4.000 | | | 06/15/18 | | | | 2,044,693 | |
| | 1,485,000 | | | 5.000 | | | 06/15/20 | | | | 1,598,632 | |
| New Jersey Transportation Trust Fund Authority RB for
Transportation System Series 2011 A (ST APPROP)
(BBB+/Baa1) |
|
| | 5,115,000 | | | 5.000 | | | 06/15/23 | | | | 5,564,046 | |
| New Jersey Transportation Trust Fund Authority RB for
Transportation System Series 2013 A (BBB+/Baa1) |
|
| | 6,235,000 | | | 5.000 | | | 12/15/19 | | | | 6,646,572 | |
| New Jersey Transportation Trust Fund Authority RB Refunding
for Transportation Systems Series 2010 D (BBB+/Baa1) |
|
| | 26,545,000 | | | 5.250 | | | 12/15/23 | | | | 30,351,818 | |
| New Jersey Transportation Trust Fund Authority RB
Subseries 2016 A-1 & Subseries A-2 (A+/Baa1) |
|
| | 8,560,000 | | | 5.000 | | | 06/15/30 | | | | 8,740,958 | |
| | 23,850,000 | | | 5.000 | | | 06/15/31 | | | | 24,334,155 | |
| | |
| | Municipal Bonds – (continued) | |
| | New Jersey – (continued) | |
| New Jersey Turnpike Authority Turnpike RB Series 2014 B-3
(A+/A2)(b) |
|
| $ | 3,750,000 | | | (1 Mo. LIBOR + 0.57%,
10.00% Cap),1.399% | | | 01/01/18 | | | $ | 3,750,450 | |
| | Princeton GO Refunding Bonds Series 2016 (AAA/Aaa) | |
| | 540,000 | | | 3.000 | | | 01/01/20 | | | | 563,663 | |
| Toms River Township General Improvement Bonds Series 2010
(AA/NR) |
|
| | 3,260,000 | | | 3.000 | | | 06/15/18 | | | | 3,306,944 | |
| Township of Parsippany Troy Hills GO Bonds for General
Improvement Water Utility 2017 (AA/NR) |
|
| | 4,255,000 | | | 2.000 | | | 09/15/21 | | | | 4,370,055 | |
| | 4,170,000 | | | 2.000 | | | 09/15/23 | | | | 4,220,457 | |
| | Union County New Jersey GO Bonds Series B (AA+/Aaa) | |
| | 1,240,000 | | | 3.000 | | | 03/01/19 | | | | 1,274,484 | |
| Union County New Jersey GO Refunding Bonds Series B (ETM)
(NR/NR)(a) |
|
| | 25,000 | | | 3.000 | | | 03/01/19 | | | | 25,677 | |
| | | | | | | | | | | | |
| | | | | | | | | | | 370,229,193 | |
| | |
| | New Mexico – 1.0% | |
| Farmington City PCRB Refunding for Public Service Co. of
New Mexico San Juan & Four Corners Projects Series 2016 A
(BBB+/Baa2)(b)(c) |
|
| | 4,000,000 | | | 1.875 | | | 10/01/21 | | | | 3,990,040 | |
| Farmington City PCRB Refunding for Public Servicing Co. of
New Mexico San Juan & Four Corners Projects Series 2016 B
(BBB+/Baa2)(b)(c) |
|
| | 11,000,000 | | | 1.875 | | | 10/01/21 | | | | 10,972,610 | |
| Farmington New Mexico PCRB Refunding for Public Service Co.
of New Mexico San Juan Project RMKT 06/01/17
Series 2017 B (BBB+/Baa2)(b)(c) |
|
| | 3,750,000 | | | 2.125 | | | 06/01/22 | | | | 3,772,388 | |
| | New Mexico State GO Refunding Bonds Series 2017 B (AA/Aa1) | |
| | 11,275,000 | | | 5.000 | | | 03/01/20 | | | | 12,326,845 | |
| | 16,470,000 | | | 5.000 | | | 03/01/21 | | | | 18,561,360 | |
| | | | | | | | | | | | |
| | | | | | | | | | | 49,623,243 | |
| | |
| | New York – 13.3% | |
| Brooklyn Arena Local Development Corp. Pilot RB Refunding
for Barclays Center Series 2016 A (BBB-/Baa3) |
|
| | 1,250,000 | | | 5.000 | | | 07/15/21 | | | | 1,416,712 | |
| | 500,000 | | | 5.000 | | | 07/15/22 | | | | 577,720 | |
| | 500,000 | | | 5.000 | | | 07/15/23 | | | | 584,200 | |
| City of Yonkers New York School GO Refunding Bonds
Series 2014 A (AGM) (AA/A2) |
|
| | 2,890,000 | | | 5.000 | | | 09/01/18 | | | | 2,991,872 | |
| | 3,135,000 | | | 5.000 | | | 09/01/19 | | | | 3,361,849 | |
| Metropolitan Transportation Authority RB Refunding RMKT
11/01/16 Subseries 2012 G-3 (AA-/A1)(b) |
|
| | 20,000,000 | | | (1 Mo. LIBOR + 0.70%,
9.00% Cap), 1.529 | | | 02/01/20 | | | | 20,108,600 | |
| Metropolitan Transportation Authority RB Refunding
Series 2008 B-4 (AA-/A1)(b)(c) |
|
| | 20,725,000 | | | 5.000 | | | 11/15/19 | | | | 22,325,177 | |
| | |
| | |
| 80 | | The accompanying notes are an integral part of these financial statements. |
GOLDMAN SACHS SHORT DURATION TAX-FREE FUND
| | | | | | | | | | | | |
Principal
Amount | | | Interest
Rate | | Maturity
Date | | | Value | |
| | Municipal Bonds – (continued) | |
| | New York – (continued) | |
| Metropolitan Transportation Authority RB Refunding
Series 2016 C-2B (AA-/A1)(b)(c) |
|
| $ | 13,675,000 | | | 5.000% | | | 02/15/20 | | | $ | 14,853,648 | |
| Metropolitan Transportation Authority RB Series 2011 B
(AA-/A1)(b) |
|
| | 50,000,000 | | | (1 Mo. LIBOR +
0.35%, 10.00% Cap),
1.179 | | | 11/01/17 | | | | 50,001,500 | |
| New York City GO Bonds Fiscal 2006 Series H Subseries H1
(AA/Aa2)(b)(c) |
|
| | 7,750,000 | | | 0.970 | | | 10/02/17 | | | | 7,750,000 | |
| New York City GO Bonds Fiscal 2006 Series H Subseries H2
(AA/Aa2)(b)(c) |
|
| | 3,900,000 | | | 0.970 | | | 10/02/17 | | | | 3,900,000 | |
| New York City GO Bonds Fiscal 2014 Series D Subseries D3
(AA/Aa2)(b)(c) |
|
| | 4,165,000 | | | 0.970 | | | 10/02/17 | | | | 4,165,000 | |
| New York City GO Bonds Fiscal 2014 Series I Subseries I-2
(AA/Aa2)(b)(c) |
|
| | 9,700,000 | | | 0.970 | | | 10/02/17 | | | | 9,700,000 | |
| New York City GO Bonds Fiscal 2015 Series F Subseries F6
(AA/Aa2)(b)(c) |
|
| | 8,000,000 | | | 0.970 | | | 10/02/17 | | | | 8,000,000 | |
| | New York City GO Bonds Series 2014 J (AA/Aa2) | |
| | 52,045,000 | | | 5.000 | | | 08/01/18 | | | | 53,760,403 | |
| New York City GO Refunding Bonds RMKT 03/19/13
Subseries 2008 J-4 (AA/Aa2)(d) |
|
| | 6,250,000 | | | (SIFMA Municipal
Swap Index Yield +
0.55%, 9.00% Cap),
1.490 | | | 08/01/25 | | | | 6,247,562 | |
| New York City Municipal Water Finance Authority RB for Water
& Sewer System Second General Resolution Fiscal 2011
Subseries AA1 (AA+/Aa1)(b)(c) |
|
| | 4,125,000 | | | 0.970 | | | 10/02/17 | | | | 4,125,000 | |
| New York City Municipal Water Finance Authority RB for Water
& Sewer System Second General Resolution Fiscal 2011
Subseries AA2 (AA+/Aa1)(b)(c) |
|
| | 8,325,000 | | | 0.970 | | | 10/02/17 | | | | 8,325,000 | |
| New York City Municipal Water Finance Authority RB for Water
& Sewer System Second General Resolution Fiscal 2015
Subseries BB4 (AA+/Aa1)(b)(c) |
|
| | 5,670,000 | | | 0.920 | | | 10/02/17 | | | | 5,670,000 | |
| New York City Transitional Finance Authority RB for New York
City Recovery Project 2002 Subseries 1-C (AAA/Aa1)(b)(c) |
|
| | 8,030,000 | | | 0.970 | | | 10/02/17 | | | | 8,030,000 | |
| New York City Transitional Finance Authority RB Future Tax
Subordinate Fiscal 2013 Series B (AAA/Aa1) |
|
| | 8,620,000 | | | 5.000 | | | 11/01/17 | | | | 8,647,584 | |
| New York City Transitional Finance Authority RB Future Tax
Subordinate Fiscal 2013 Series B (ETM) (NR/NR)(a) |
|
| | 2,030,000 | | | 5.000 | | | 11/01/17 | | | | 2,036,415 | |
| New York City Transitional Finance Authority RB Future Tax
Subordinate Fiscal 2013 Subseries C-4 (AAA/Aa1)(b)(c) |
|
| | 7,975,000 | | | 0.970 | | | 10/02/17 | | | | 7,975,000 | |
| | |
| | Municipal Bonds – (continued) | |
| | New York – (continued) | |
| New York City Transitional Finance Authority RB Future Tax
Subordinate Fiscal 2016 Subseries E-4 (AAA/Aa1)(b)(c) |
|
| $ | 8,245,000 | | | 0.970% | | | 10/02/17 | | | $ | 8,245,000 | |
| New York City Transitional Finance Authority RB Refunding for
Future Tax Fiscal 2013 Series 2012 E (AAA/Aa1) |
|
| | 3,775,000 | | | 5.000 | | | 11/01/22 | | | | 4,426,678 | |
| New York State Dormitory Authority General Purpose Personal
Income Tax RB Refunding Series 2016 D (AAA/Aa1) |
|
| | 7,790,000 | | | 5.000 | | | 02/15/22 | | | | 8,984,519 | |
| New York State Dormitory Authority General Purpose Personal
Income Tax RB Series 2015 E (AAA/Aa1) |
|
| | 7,145,000 | | | 5.000 | | | 03/15/21 | | | | 8,057,274 | |
| New York State Dormitory Authority General Purpose Personal
Income Tax RB Series 2016 D (AAA/Aa1) |
|
| | 5,000,000 | | | 3.000 | | | 02/15/19 | | | | 5,133,300 | |
| | 1,880,000 | | | 4.000 | | | 02/15/20 | | | | 2,008,367 | |
| | 1,885,000 | | | 4.000 | | | 02/15/21 | | | | 2,058,627 | |
| New York State Dormitory Authority RB Refunding for Long
Island University Series 2012 A (BBB/Baa2) |
|
| | 3,665,000 | | | 5.000 | | | 09/01/18 | | | | 3,780,924 | |
| New York State Dormitory Authority State Sales Tax RB
Series 2015 A (AAA/Aa1) |
|
| | 23,960,000 | | | 5.000 | | | 03/15/19 | | | | 25,325,480 | |
| New York State Dormitory Authority State Sales Tax RB
Series 2015 B (AAA/Aa1) |
|
| | 15,275,000 | | | 5.000 | | | 03/15/20 | | | | 16,726,583 | |
| | 30,000,000 | | | 5.000 | | | 03/15/21 | | | | 33,873,900 | |
| New York State Energy Research & Development Authority
Facilities RB Refunding for Consolidated Edison Co.
Subseries 1999 A-2 (AMT) (AMBAC) (A-/A2)(c) |
|
| | 70,250,000 | | | 1.435 | | | 05/01/34 | | | | 65,019,721 | |
| New York State Energy Research & Development Authority
Pollution Control RB for Rochester Gas & Electric Corp.
Series (NATL-RE) (A/A3)(b)(c) |
|
| | 6,550,000 | | | 1.760 | | | 08/01/32 | | | | 5,845,875 | |
| New York State Energy Research & Development Authority RB
for Brooklyn Union Gas Project Series 2000 (NATL-RE)
(A/A2)(c) |
|
| | 20,100,000 | | | 1.540 | | | 12/01/20 | | | | 19,848,750 | |
| New York State Energy Research & Development Authority RB
Refunding for Central Hudson Gas & Electric Corp. Projects
Series 1999 B (AMT) (AMBAC) (A-/A2)(c) |
|
| | 27,750,000 | | | 1.365 | | | 07/01/34 | | | | 25,201,902 | |
| New York State Tax Exempt GO Bonds Series 2011 E
(AA+/Aa1) |
|
| | 6,950,000 | | | 5.000 | | | 12/15/17 | | | | 7,008,380 | |
| New York State Thruway Authority Junior Indebtedness RB
Series 2013 A (A-/A3) |
|
| | 29,525,000 | | | 5.000 | | | 05/01/19 | | | | 31,321,006 | |
| New York State Urban Development Corp. General Purpose
Personal Income Tax RB Refunding Series 2014 A (AAA/Aa1) |
|
| | 20,000,000 | | | 5.000 | | | 03/15/20 | | | | 21,890,400 | |
| New York State Urban Development Corp. General Purpose
Personal Income Tax RB Refunding Series 2015 A (AAA/Aa1) |
|
| | 28,510,000 | | | 5.000 | | | 03/15/21 | | | | 32,150,157 | |
| | |
| | |
| The accompanying notes are an integral part of these financial statements. | | 81 |
GOLDMAN SACHS SHORT DURATION TAX-FREE FUND
Schedule of Investments (continued)
September 30, 2017 (Unaudited)
| | | | | | | | | | | | | | |
Principal
Amount | | | Interest
Rate | | | Maturity
Date | | | Value | |
| | Municipal Bonds – (continued) | |
| | New York – (continued) | |
| New York State Urban Development Corp. RB for State Personal
Income Tax Series 2013 E (AAA/Aa1) |
|
| $ | 26,365,000 | | | | 5.000 | % | | | 03/15/18 | | | $ | 26,843,261 | |
| New York Transportation Development Corp. Special Facility RB
Refunding for Terminal One Group Association L.P. Project
Series 2015 (AMT) (A-/Baa1) |
|
| | 4,800,000 | | | | 5.000 | | | | 01/01/20 | | | | 5,174,832 | |
| | 2,000,000 | | | | 5.000 | | | | 01/01/21 | | | | 2,214,120 | |
| Niagara Frontier Transportation Authority RB Refunding for
Buffalo International Airport Series 2014 B (BBB+/Baa1) |
|
| | 670,000 | | | | 4.000 | | | | 04/01/18 | | | | 679,521 | |
| | 300,000 | | | | 5.000 | | | | 04/01/19 | | | | 316,857 | |
| | Rockland County GO Bonds Series 2014 A (AGM) (AA/A2) | |
| | 1,825,000 | | | | 5.000 | | | | 03/01/18 | | | | 1,854,164 | |
| | 2,250,000 | | | | 5.000 | | | | 03/01/19 | | | | 2,370,240 | |
| | 3,000,000 | | | | 5.000 | | | | 03/01/20 | | | | 3,261,870 | |
| Rockland County New York GO Refunding Bonds Series 2014
(BAM) (AA/Baa1) |
|
| | 1,500,000 | | | | 3.000 | | | | 02/15/19 | | | | 1,536,060 | |
| | 635,000 | | | | 3.000 | | | | 02/15/20 | | | | 659,467 | |
| Suffolk County New York GO Bonds for Public Improvement
Series 2016 A (AGM) (AA/NR) |
|
| | 4,080,000 | | | | 2.000 | | | | 06/15/19 | | | | 4,134,060 | |
| Suffolk County New York GO Bonds for Public Improvement
Series 2016 B (BAM) (AA/NR) |
|
| | 3,545,000 | | | | 2.000 | | | | 10/15/19 | | | | 3,599,629 | |
| | 5,105,000 | | | | 2.000 | | | | 10/15/20 | | | | 5,203,271 | |
| | 5,200,000 | | | | 2.000 | | | | 10/15/21 | | | | 5,299,320 | |
| Suffolk County New York GO Refunding Serial Bonds
Series 2012 B (A-/A3) |
|
| | 1,000,000 | | | | 4.000 | | | | 10/01/17 | | | | 1,000,000 | |
| Suffolk County New York GO Refunding Serial Bonds Series
2017 A (AGM) (AA/NR) |
|
| | 7,035,000 | | | | 4.000 | | | | 02/01/23 | | | | 7,848,105 | |
| Suffolk County New York GO Refunding Serial Bonds
Series 2017 B (AGM) (AA/NR) |
|
| | 6,360,000 | | | | 4.000 | | | | 10/15/23 | | | | 7,156,526 | |
| Suffolk Tobacco Asset Securitization Corp. RB Tobacco
Settlement Asset-Backed Bonds Series 2012 B (A/NR) |
|
| | 490,000 | | | | 4.000 | | | | 06/01/18 | | | | 498,771 | |
| | 575,000 | | | | 5.000 | | | | 06/01/19 | | | | 608,177 | |
| | 620,000 | | | | 5.000 | | | | 06/01/20 | | | | 674,182 | |
| TSASC Inc., Tobacco Settlement RB Senior Series 2017 A
(A/NR) |
|
| | 2,000,000 | | | | 5.000 | | | | 06/01/20 | | | | 2,174,240 | |
| | 1,000,000 | | | | 5.000 | | | | 06/01/21 | | | | 1,112,490 | |
| TSASC Inc., Tobacco Settlement RB Subordinated Series 2017 B
(BBB/NR) |
|
| | 1,000,000 | | | | 5.000 | | | | 06/01/20 | | | | 1,068,480 | |
| Utility Debt Securitization Authority Restructuring RB Refunding
Series 2016 B (AAA/Aaa) |
|
| | 2,000,000 | | | | 5.000 | | | | 12/15/23 | | | | 2,304,140 | |
| | | | | | | | | | | | | | |
| | | | | | | | | | | | | 669,051,868 | |
| | |
| | Municipal Bonds – (continued) | |
| | North Carolina – 0.9% | |
| Mecklenburg County Public Facilities Corp. RB Refunding Bonds
Series 2017 (AA+/Aa1) |
|
| $ | 7,000,000 | | | | 3.000 | % | | | 02/01/21 | | | $ | 7,405,020 | |
| | 8,500,000 | | | | 3.000 | | | | 02/01/22 | | | | 9,072,730 | |
| North Carolina Eastern Municipal Power Agency Power System
RB Refunding Series 2012 B (ETM) (AAA/WR)(a) |
|
| | 4,900,000 | | | | 5.000 | | | | 01/01/19 | | | | 5,141,717 | |
| North Carolina Eastern Municipal Power Agency Power System
RB Series 2012 A (ETM) (AAA/WR)(a) |
|
| | 2,000,000 | | | | 3.000 | | | | 01/01/18 | | | | 2,010,160 | |
| | 1,275,000 | | | | 5.000 | | | | 01/01/18 | | | | 1,287,686 | |
| | 2,000,000 | | | | 3.000 | | | | 01/01/19 | | | | 2,049,320 | |
| | 1,000,000 | | | | 5.000 | | | | 01/01/19 | | | | 1,049,330 | |
| North Carolina Medical Care Commission Health Care Facilities
RB Refunding for Wake Forest Baptist Obligated Group
Series 2012 B (A/A2) |
|
| | 1,375,000 | | | | 5.000 | | | | 12/01/18 | | | | 1,436,022 | |
| North Carolina State Capital Improvement RB Series 2011 A
(ST APPROP) (AA+/Aa1)(a) |
|
| | 10,000,000 | | | | 5.250 | | | | 05/01/20 | | | | 11,038,300 | |
| Raleigh North Carolina Combined Enterprise System RB
Refunding Series 2015 B (AAA/Aaa) |
|
| | 6,140,000 | | | | 5.000 | | | | 12/01/20 | | | | 6,879,809 | |
| | | | | | | | | | | | | | |
| | | | | | | | | | | | | 47,370,094 | |
| | |
| | Ohio – 1.4% | |
| | Akron City Ohio Jedd RB Refunding Series 2011 (AA-/NR) | |
| | 1,740,000 | | | | 5.000 | | | | 12/01/17 | | | | 1,751,466 | |
| American Municipal Power, Inc., RB for Hydroelectric Projects
Series 2009 C (A/A2)(a) |
|
| | 4,000,000 | | | | 5.000 | | | | 02/15/20 | | | | 4,366,360 | |
| Buckeye Ohio Tobacco Settlement Financing Authority RB
Senior Turbo Asset-Backed Bonds Series 2007 A-2 (B-/Caa1) |
|
| | 13,740,000 | | | | 5.125 | | | | 06/01/24 | | | | 13,014,391 | |
| | 3,415,000 | | | | 5.375 | | | | 06/01/24 | | | | 3,271,809 | |
| City of Columbus Various Purpose Limited Tax Bonds
Series 2016 B (AAA/Aaa) |
|
| | 1,600,000 | | | | 1.500 | | | | 08/15/21 | | | | 1,609,008 | |
| Cleveland Airport Various Purpose GO Refunding Bonds
Series 2015 (AA+/A1) |
|
| | 1,455,000 | | | | 5.000 | | | | 12/01/20 | | | | 1,619,735 | |
| County of Franklin Hospital Facilities RB Refunding
Series 2011 B (AA+/Aa2)(b)(c) |
|
| | 11,500,000 | | | | 4.000 | | | | 11/01/18 | | | | 11,853,280 | |
| Cuyahoga County Ohio Hospital RB Refunding for Metrohealth
System Series 2017 (BBB-/Baa3) |
|
| | 1,750,000 | | | | 5.000 | | | | 02/15/23 | | | | 1,953,490 | |
| | 3,000,000 | | | | 5.000 | | | | 02/15/24 | | | | 3,382,320 | |
| | 1,500,000 | | | | 5.000 | | | | 02/15/25 | | | | 1,699,005 | |
| Hamilton County Health Care RB Refunding for Life Enriching
Community Project Series 2012 (BBB/NR) |
|
| | 400,000 | | | | 4.000 | | | | 01/01/18 | | | | 402,452 | |
| | 415,000 | | | | 4.000 | | | | 01/01/19 | | | | 426,591 | |
| | 435,000 | | | | 4.000 | | | | 01/01/20 | | | | 455,166 | |
| | |
| | |
| 82 | | The accompanying notes are an integral part of these financial statements. |
GOLDMAN SACHS SHORT DURATION TAX-FREE FUND
| | | | | | | | | | | | |
Principal
Amount | | | Interest
Rate | | Maturity
Date | | | Value | |
| | Municipal Bonds – (continued) | |
| | Ohio – (continued) | |
| New Albany Community Authority RB Refunding Series 2012 C
(NR/Aa3) |
|
| $ | 1,100,000 | | | 4.000% | | | 10/01/17 | | | $ | 1,100,000 | |
| | 800,000 | | | 4.000 | | | 10/01/18 | | | | 823,528 | |
| Ohio State GO Refunding Bonds for Common Schools
Series 2014 A (AA+/Aa1) |
|
| | 9,775,000 | | | 5.000 | | | 09/15/22 | | | | 11,436,848 | |
| Ohio State Higher Educational Facility Commission RB for
Cleveland Clinic Health System Obligations Series 2013 A-2
(AA/Aa2)(d) |
|
| | 2,250,000 | | | (SIFMA Municipal
Swap Index Yield+
0.47%, 12.00% Cap),
1.410 | | | 01/01/18 | | | | 2,251,665 | |
| Ohio Turnpike and Infrastructure Commission RB Refunding
Series 2017 A (AA-/Aa3) |
|
| | 7,770,000 | | | 3.000 | | | 02/15/22 | | | | 8,318,640 | |
| University of Akron General Receipts Bonds Series 2015 A
(AA-/A1) |
|
| | 1,100,000 | | | 4.000 | | | 01/01/19 | | | | 1,139,028 | |
| | | | | | | | | | | | |
| | | | | | | | | | | 70,874,782 | |
| | |
| | Oklahoma – 0.9% | |
| Edmond Public Works Authority Sales Tax and Utility System
RB Series 2017 (AA-/NR)(g) |
|
| | 1,000,000 | | | 3.000 | | | 07/01/20 | | | | 1,046,310 | |
| | 2,000,000 | | | 3.000 | | | 07/01/21 | | | | 2,114,960 | |
| | 1,295,000 | | | 3.000 | | | 07/01/22 | | | | 1,375,873 | |
| Oklahoma County Independent School District No. 1 Combined
Purpose GO Bonds for Putnam City Board of Education
District Series 2016 (A+/NR) |
|
| | 5,000,000 | | | 2.000 | | | 01/01/18 | | | | 5,010,800 | |
| | 3,585,000 | | | 2.000 | | | 01/01/19 | | | | 3,618,054 | |
| | 2,900,000 | | | 2.000 | | | 01/01/21 | | | | 2,948,488 | |
| Oklahoma County Independent School District No. 12 Combined
Purpose GO Bonds for Edmond School District Series 2017
(AA/NR) |
|
| | 4,250,000 | | | 2.000 | | | 08/01/19 | | | | 4,314,345 | |
| | 4,800,000 | | | 2.000 | | | 08/01/20 | | | | 4,895,664 | |
| | 4,900,000 | | | 2.000 | | | 08/01/22 | | | | 4,972,373 | |
| Oklahoma County Independent School District No. 89 GO Bonds
Series 2015 (AA/Aa3) |
|
| | 6,200,000 | | | 3.000 | | | 07/01/19 | | | | 6,393,130 | |
| Tulsa County Independent School District No. 3 GO Bonds Series
2017 (AA/NR) |
|
| | 5,800,000 | | | 2.000 | | | 04/01/20 | | | | 5,919,422 | |
| | | | | | | | | | | | |
| | | | | | | | | | | 42,609,419 | |
| | |
| | Oregon – 1.0% | |
| Forest Grove Oregon Student Housing RB Refunding for Oak
Tree Foundation Project Series 2017 (BBB-/NR) |
|
| | 175,000 | | | 3.000 | | | 03/01/18 | | | | 176,246 | |
| | 300,000 | | | 4.000 | | | 03/01/19 | | | | 310,218 | |
| | 995,000 | | | 4.000 | | | 03/01/21 | | | | 1,057,576 | |
| | 385,000 | | | 5.000 | | | 03/01/23 | | | | 431,146 | |
| | 200,000 | | | 5.000 | | | 03/01/24 | | | | 225,904 | |
| | 200,000 | | | 5.000 | | | 03/01/25 | | | | 226,968 | |
| | |
| | Municipal Bonds – (continued) | |
| | Oregon – (continued) | |
| Lane County Oregon Springfield School District No. 19 GO
Refunding Bonds Series 2015 (SCH BD GTY) (AA+/Aa1)(e) |
|
| $ | 3,740,000 | | | 0.000% | | | 06/15/20 | | | $ | 3,575,776 | |
| | 3,780,000 | | | 0.000 | | | 06/15/21 | | | | 3,534,905 | |
| Oregon Coast Community College District GO Refunding Bonds
Series 2012 (SCH BD GTY) (NR/Aa1) |
|
| | 1,165,000 | | | 2.000 | | | 06/15/18 | | | | 1,173,749 | |
| | 1,445,000 | | | 3.000 | | | 06/15/19 | | | | 1,493,827 | |
| Oregon State GO Refunding Bonds for Oregon University System
Series 2012 B (AA+/Aa1) |
|
| | 1,120,000 | | | 3.000 | | | 08/01/18 | | | | 1,138,973 | |
| Portland Oregon Community College District GO Refunding
Bonds Series 2015 (AA/Aa1) |
|
| | 10,000,000 | | | 5.000 | | | 06/15/18 | | | | 10,283,900 | |
| Portland Oregon Community College District GO Refunding
Bonds Series 2016 (AA/Aa1) |
|
| | 1,500,000 | | | 5.000 | | | 06/15/20 | | | | 1,654,755 | |
| | 1,900,000 | | | 5.000 | | | 06/15/21 | | | | 2,159,768 | |
| | 2,300,000 | | | 5.000 | | | 06/15/22 | | | | 2,676,464 | |
| Portland Oregon Sewer System RB Refunding Second Lien
Series 2016 B (AA-/Aa3) |
|
| | 6,960,000 | | | 5.000 | | | 06/15/22 | | | | 8,085,432 | |
| Portland Oregon Water System RB Refunding First Lien
Series 2016 A (NR/Aaa) |
|
| | 10,845,000 | | | 5.000 | | | 04/01/19 | | | | 11,491,904 | |
| | 2,130,000 | | | 5.000 | | | 04/01/22 | | | | 2,469,948 | |
| | | | | | | | | | | | |
| | | | | | | | | | | 52,167,459 | |
| | |
| | Pennsylvania – 3.1% | |
| Abington School District GO Bonds Series 2017 (ST AID
WITHHLDG) (AA/NR) |
|
| | 1,375,000 | | | 5.000 | | | 10/01/21 | | | | 1,567,225 | |
| | 1,950,000 | | | 5.000 | | | 10/01/22 | | | | 2,267,031 | |
| Allegheny County Higher Education Building Authority RB for
Chatham University Series 2012 A (BBB/NR) |
|
| | 750,000 | | | 5.000 | | | 09/01/18 | | | | 774,420 | |
| Allegheny County Redevelopment Authority Tax Increment
Refunding for Waterfront Project Series 2007 A (A/NR) |
|
| | 645,000 | | | 4.250 | | | 12/15/17 | | | | 649,128 | |
| Allentown School District GO Refunding Series 2016 (AGM) (ST
AID WITHHLDG) (AA/NR) |
|
| | 500,000 | | | 2.000 | | | 02/15/19 | | | | 504,790 | |
| Butler County Hospital Authority RB for Health System Project
Series 2015 A (A-/Baa1) |
|
| | 1,265,000 | | | 3.000 | | | 07/01/18 | | | | 1,278,409 | |
| | 310,000 | | | 3.000 | | | 07/01/19 | | | | 317,161 | |
| | 265,000 | | | 4.000 | | | 07/01/20 | | | | 280,831 | |
| | 1,000,000 | | | 4.000 | | | 07/01/21 | | | | 1,075,530 | |
| Chester County Downingtown Area School District GO Bonds
Series 2010 (ST AID WITHHLDG) (NR/Aaa)(b) |
|
| | 5,000,000 | | | (SIFMA Municipal
Swap Index Yield +
0.70%, 12.00% Cap),
1.640 | | | 05/01/19 | | | | 5,018,800 | |
| | |
| | |
| The accompanying notes are an integral part of these financial statements. | | 83 |
GOLDMAN SACHS SHORT DURATION TAX-FREE FUND
Schedule of Investments (continued)
September 30, 2017 (Unaudited)
| | | | | | | | | | | | |
Principal
Amount | | | Interest
Rate | | Maturity
Date | | | Value | |
| | Municipal Bonds – (continued) | |
| | Pennsylvania – (continued) | |
| Chester County IDA RB for University Student Housing, LLC
Project at West Chester University Series 2013 A (NR/Baa3) |
|
| $ | 530,000 | | | 3.000% | | | 08/01/18 | | | $ | 531,452 | |
| City of Philadelphia GO Bonds Series 2016 F (ST AID
WITHHLDG) (A+/A2) |
|
| | 1,000,000 | | | 5.000 | | | 09/01/19 | | | | 1,057,310 | |
| | 4,000,000 | | | 5.000 | | | 09/01/20 | | | | 4,350,680 | |
| | 4,000,000 | | | 5.000 | | | 09/01/21 | | | | 4,447,640 | |
| | City of Philadelphia GO Bonds Series 2017 (A+/A2) | |
| | 4,500,000 | | | 5.000 | | | 08/01/19 | | | | 4,809,870 | |
| Coatesville School District GO Refunding Bonds Series 2017
(AGM) (ST AID WITHHLDG) (AA/A2) |
|
| | 325,000 | | | 4.000 | | | 08/01/20 | | | | 347,220 | |
| | 1,270,000 | | | 5.000 | | | 08/01/21 | | | | 1,428,674 | |
| | 1,125,000 | | | 5.000 | | | 08/01/22 | | | | 1,290,724 | |
| Cumberland County Municipal Authority RB Refunding for
Diakon Lutheran Social Ministries Project Series 2015
(BBB+/NR) |
|
| | 535,000 | | | 4.000 | | | 01/01/19 | | | | 551,419 | |
| | 1,000,000 | | | 4.000 | | | 01/01/20 | | | | 1,053,590 | |
| Lehigh County Industrial Development Authority PCRB
Refunding for PPL Electric Utilities Corp. Project RMKT
08/15/17 Series 2016 B (A/A1)(b)(c) |
|
| | 9,000,000 | | | 1.800 | | | 08/15/22 | | | | 8,937,540 | |
| Montgomery County Higher Education and Health Authority RB
Refunding for Holy Redeemer Health System Series 2014 A
(BBB+/Baa3) |
|
| | 1,000,000 | | | 4.000 | | | 10/01/18 | | | | 1,021,390 | |
| | 1,000,000 | | | 4.000 | | | 10/01/19 | | | | 1,041,510 | |
| Montgomery County IDA Pollution Control RB Refunding for
PECO Energy Company Project Series 1999 B (BBB/Baa2)(b)(c) |
|
| | 5,000,000 | | | 2.500 | | | 04/01/20 | | | | 5,042,300 | |
| Pennsylvania Economic Development Financing Authority RB
Refunding for Unemployment Compensation Series 2012 A
(AA+/Aaa) |
|
| | 6,635,000 | | | 5.000 | | | 07/01/19 | | | | 7,085,517 | |
| Pennsylvania Economic Development Financing Authority Solid
Waste Disposal RB for Waste Management, Inc. Project
Series 2004 A (A-/NR)(b)(c) |
|
| | 1,750,000 | | | 1.500 | | | 05/01/18 | | | | 1,753,413 | |
| Pennsylvania Economic Development Financing Authority
Unemployment Compensation RB Series 2012 B (AA+/Aaa) |
|
| | 16,335,000 | | | 5.000 | | | 07/01/20 | | | | 17,482,534 | |
| Pennsylvania Higher Educational Facilities Authority RB for La
Salle University Series 2012 (BBB-/NR) |
|
| | 1,165,000 | | | 5.000 | | | 05/01/18 | | | | 1,184,490 | |
| | 1,000,000 | | | 5.000 | | | 05/01/19 | | | | 1,042,380 | |
| Pennsylvania State Commonwealth GO Bonds Second
Series 2015 (A+/Aa3) |
|
| | 2,175,000 | | | 5.000 | | | 08/15/20 | | | | 2,400,047 | |
| Pennsylvania State Commonwealth GO Refunding Bonds First
Series 2015 (A+/Aa3) |
|
| | 8,115,000 | | | 5.000 | | | 08/15/20 | | | | 8,954,659 | |
| Pennsylvania State Commonwealth GO Refunding Bonds First
Series 2016 (A+/Aa3) |
|
| | 3,000,000 | | | 5.000 | | | 09/15/18 | | | | 3,111,420 | |
| | 16,775,000 | | | 5.000 | | | 09/15/19 | | | | 18,026,918 | |
| | 13,670,000 | | | 5.000 | | | 09/15/20 | | | | 15,120,661 | |
| | |
| | Municipal Bonds – (continued) | |
| | Pennsylvania – (continued) | |
| Pennsylvania State Commonwealth GO Refunding Bonds Second
Series 2010 A (A+/Aa3) |
|
| $ | 7,520,000 | | | 5.000% | | | 05/01/21 | | | $ | 8,247,184 | |
| Pennsylvania State Commonwealth GO Refunding Bonds Second
Series 2016 (A+/Aa3) |
|
| | 4,500,000 | | | 5.000 | | | 01/15/22 | | | | 5,112,855 | |
| Pennsylvania State GO Bonds First Refunding Series 2015
(AGM) (AA/Aa3) |
|
| | 5,000,000 | | | 5.000 | | | 08/15/22 | | | | 5,749,800 | |
| Pennsylvania Turnpike Commission RB Series 2014 B-1
(A/A1)(d) |
|
| | 7,000,000 | | | (SIFMA Municipal
Swap Index Yield +
0.88%, 12.00% Cap),
1.820 | | | 12/01/20 | | | | 7,069,650 | |
| Scranton School District GO Refunding Bonds Series 2017 A (ST
AID WITHHLDG) (A+/A2) |
|
| | 350,000 | | | 4.000 | | | 06/01/18 | | | | 355,194 | |
| | 500,000 | | | 5.000 | | | 06/01/19 | | | | 526,055 | |
| | 645,000 | | | 5.000 | | | 06/01/20 | | | | 688,647 | |
| | 680,000 | | | 5.000 | | | 06/01/21 | | | | 738,854 | |
| | | | | | | | | | | | |
| | | | | | | | | | | 154,294,922 | |
| | |
| | Puerto Rico – 1.3% | |
| Puerto Rico Commonwealth Aqueduct & Sewer Authority RB
Senior Lien Series 2012 A (CC/Caa3) |
|
| | 7,285,000 | | | 5.000 | | | 07/01/19 | | | | 5,555,395 | |
| Puerto Rico Commonwealth Public Improvement GO Refunding
Bonds Series 2002 A (FGIC) (D/WR)(h) |
|
| | 772,500 | | | 5.500 | | | 07/01/17 | | | | 587,100 | |
| Puerto Rico Electric Power Authority RB Refunding Series 2007
UU (AGM) (AA/A2)(d) |
|
| | 41,925,000 | | | (3 Mo. LIBOR +
0.52%, 12.00% Cap),
1.390 | | | 07/01/29 | | | | 33,854,438 | |
| Puerto Rico Electric Power Authority RB Refunding Series 2007
UU (D/Ca)(d)(h) |
|
| | 25,850,000 | | | (3 Mo. LIBOR +
0.70%, 12.00% Cap),
1.570 | | | 07/01/31 | | | | 12,311,063 | |
| Puerto Rico Public Buildings Authority RB Refunding for
Government Facilities Series 2002 C (COMWLTH GTD)
(CC/WR) |
|
| | 654,385 | | | 5.500 | | | 07/01/16 | | | | 353,368 | |
| Puerto Rico Public Buildings Authority RB Refunding for
Government Facilities Series 2007 M-2 (AMBAC)
(COMWLTH GTD) (NR/Caa3)(c) |
|
| | 1,000,000 | | | 10.000 | | | 07/01/35 | | | | 1,086,250 | |
| Puerto Rico Public Buildings Authority RB Refunding for
Government Facilities Series 2007 M-2 (COMWLTH GTD)
(D/Caa3)(b)(h) |
|
| | 10,835,000 | | | 10.000 | | | 07/01/34 | | | | 4,686,137 | |
| Puerto Rico Public Buildings Authority RB Refunding for
Government Facilities Series 2007 M-2 (COMWLTH GTD)
(NR/NR)(a)(c) |
|
| | 15,000 | | | 10.000 | | | 07/01/18 | | | | 21,206 | |
| | |
| | |
| 84 | | The accompanying notes are an integral part of these financial statements. |
GOLDMAN SACHS SHORT DURATION TAX-FREE FUND
| | | | | | | | | | | | |
Principal
Amount | | | Interest
Rate | | Maturity
Date | | | Value | |
| | Municipal Bonds – (continued) | |
| | Puerto Rico – (continued) | |
| Puerto Rico Sales Tax Financing Corp. RB First
Subseries 2009 A (D/Ca)(h) |
|
| $ | 5,000,000 | | | 5.500% | | | 08/01/28 | | | $ | 1,037,500 | |
| Puerto Rico Sales Tax Financing Corp. Sales Tax RB First
Subseries 2009 A (D/Ca)(h) |
|
| | 8,000,000 | | | 5.500 | | | 08/01/21 | | | | 1,660,160 | |
| | 10,000,000 | | | 5.500 | | | 08/01/22 | | | | 2,075,000 | |
| | 19,315,000 | | | 5.500 | | | 08/01/23 | | | | 4,007,863 | |
| | | | | | | | | | | | |
| | | | | | | | | | | 67,235,480 | |
| | |
| | Rhode Island – 0.4% | |
| | Providence GO Bonds Series 2013 A (A-/Baa1) | |
| | 315,000 | | | 4.000 | | | 01/15/18 | | | | 317,246 | |
| | 1,545,000 | | | 5.000 | | | 01/15/19 | | | | 1,610,215 | |
| Rhode Island Health and Educational Building Corp. Higher
Education Facility RB Refunding for Brown University Issue
Series 2012 (AA+/Aa1) |
|
| | 4,770,000 | | | 5.000 | | | 09/01/21 | | | | 5,452,587 | |
| Rhode Island Health and Educational Building Corp. Higher
Education Facility RB Refunding for University of Rhode
Island Auxiliary Enterprise Series 2013 C (A+/A1) |
|
| | 500,000 | | | 4.000 | | | 09/15/18 | | | | 513,470 | |
| Rhode Island Health and Educational Building Corp. RB for
Newport Public School Financing Program Series 2013 C
(AA+/NR) |
|
| | 280,000 | | | 4.000 | | | 05/15/18 | | | | 285,132 | |
| Rhode Island Health and Educational Building Corp. RB for
Woonsocket Public School Financing Program Series 2017 A
(MUN GOVT GTD) (NR/A1) |
|
| | 815,000 | | | 4.000 | | | 05/15/20 | | | | 859,972 | |
| | 820,000 | | | 5.000 | | | 05/15/21 | | | | 906,001 | |
| | 1,415,000 | | | 5.000 | | | 05/15/22 | | | | 1,587,998 | |
| Tobacco Settlement Financing Corp. RB Asset-Backed Bonds
Series 2015 B (BBB+/NR) |
|
| | 7,280,000 | | | 2.250 | | | 06/01/41 | | | | 7,292,740 | |
| | | | | | | | | | | | |
| | | | | | | | | | | 18,825,361 | |
| | |
| | South Carolina – 0.9% | |
| Anderson County School District No. 5 GO Refunding Bonds
Series 2016 (SCSDE) (AA/Aa1) |
|
| | 1,645,000 | | | 5.000 | | | 03/01/21 | | | | 1,850,938 | |
| Berkeley County School District GO Bonds Series 2014 A
(SCSDE) (AA/Aa1) |
|
| | 1,380,000 | | | 5.000 | | | 03/01/19 | | | | 1,456,342 | |
| City of Florence Waterworks & Sewerage System RB Refunding
Series 2016 (AA-/Aa2) |
|
| | 900,000 | | | 2.000 | | | 09/01/19 | | | | 916,308 | |
| | 1,560,000 | | | 2.000 | | | 09/01/20 | | | | 1,594,694 | |
| | 1,000,000 | | | 2.000 | | | 09/01/21 | | | | 1,025,830 | |
| | Clemson University RB Refunding Series 2012 (AA/Aa2) | |
| | 5,000,000 | | | 2.000 | | | 05/01/18 | | | | 5,030,450 | |
| Colleton County South Carolina GO Bonds for Capital Project
Sales Series 2015 (AA-/Aa3) |
|
| | 725,000 | | | 1.500 | | | 07/01/18 | | | | 727,733 | |
| | 2,985,000 | | | 2.000 | | | 07/01/19 | | | | 3,033,357 | |
| | |
| | Municipal Bonds – (continued) | |
| | South Carolina – (continued) | |
| Fort Mill School District No. 4 GO Bonds Series 2017 B
(SCSDE) (AA/Aa1) |
|
| $ | 4,700,000 | | | 5.000% | | | 03/01/22 | | | $ | 5,430,004 | |
| Richland County South Carolina School District No. 1 GO
Refunding Bonds Series 2014 B (SCSDE) (AA/Aa1) |
|
| | 2,920,000 | | | 5.000 | | | 03/01/19 | | | | 3,081,534 | |
| | 3,165,000 | | | 5.000 | | | 03/01/20 | | | | 3,456,307 | |
| South Carolina Public Service Authority RB Tax-Exempt
Series 2010 C (A+/A1) |
|
| | 9,645,000 | | | 5.000 | | | 12/01/19 | | | | 10,372,812 | |
| South Carolina Public Service Authority RB Tax-Exempt
Series 2014 A (A+/A1)(a)(c) |
|
| | 1,000,000 | | | 2.500 | | | 06/01/19 | | | | 1,032,420 | |
| York County School District No. 3 Rock Hill GO Bonds
Series 2017 B (SCSDE) (AA/Aa1) |
|
| | 4,690,000 | | | 5.000 | | | 03/01/20 | | | | 5,125,185 | |
| | 2,880,000 | | | 5.000 | | | 03/01/21 | | | | 3,245,702 | |
| | | | | | | | | | | | |
| | | | | | | | | | | 47,379,616 | |
| | |
| | Tennessee – 0.4% | |
| Knox County Health Educational & Housing Facilities Board RB
for University Health System, Inc. Series 2017 (BBB+/NR) |
|
| | 800,000 | | | 3.000 | | | 04/01/18 | | | | 805,928 | |
| | 335,000 | | | 4.000 | | | 04/01/19 | | | | 346,675 | |
| | 350,000 | | | 5.000 | | | 04/01/20 | | | | 377,555 | |
| | 750,000 | | | 4.000 | | | 04/01/21 | | | | 802,215 | |
| | 750,000 | | | 5.000 | | | 04/01/22 | | | | 841,448 | |
| Metropolitan Government Nashville & Davidson County Health
& Educational Facilities Board RB for Vanderbilt University
Series 2009 B (AA/Aa2)(a) |
|
| | 7,000,000 | | | 5.500 | | | 10/01/19 | | | | 7,613,200 | |
| Tennessee State GO Bonds Special Tax Series 2015 A
(AAA/Aaa) |
|
| | 2,655,000 | | | 5.000 | | | 08/01/20 | | | | 2,942,483 | |
| Tennessee State GO Refunding Bonds Special Tax Series 2015 B
(AAA/Aaa) |
|
| | 2,210,000 | | | 5.000 | | | 08/01/20 | | | | 2,449,299 | |
| Tennessee State School Bond Authority RB Higher Educational
Facilities Second Program Series 2017 A (AA+/Aa1) |
|
| | 2,610,000 | | | 5.000 | | | 11/01/19 | | | | 2,823,002 | |
| | | | | | | | | | | | |
| | | | | | | | | | | 19,001,805 | |
| | |
| | Texas – 10.6% | |
| Alamo Community College District GO Refunding Bonds Series
2017 (AAA/Aaa) |
|
| | 5,720,000 | | | 3.000 | | | 08/15/20 | | | | 6,017,497 | |
| | 10,695,000 | | | 3.000 | | | 08/15/21 | | | | 11,382,582 | |
| | 8,500,000 | | | 3.000 | | | 08/15/22 | | | | 9,100,270 | |
| Austin Convention Enterprises, Inc. Convention Center Hotel
Second Tier RB Refunding Series 2017 B (BBB-/NR) |
|
| | 200,000 | | | 5.000 | | | 01/01/18 | | | | 201,666 | |
| | 600,000 | | | 5.000 | | | 01/01/19 | | | | 624,264 | |
| | 500,000 | | | 5.000 | | | 01/01/20 | | | | 534,685 | |
| | 500,000 | | | 5.000 | | | 01/01/21 | | | | 548,200 | |
| | 465,000 | | | 5.000 | | | 01/01/22 | | | | 520,879 | |
| | 750,000 | | | 5.000 | | | 01/01/23 | | | | 851,070 | |
| | |
| | |
| The accompanying notes are an integral part of these financial statements. | | 85 |
GOLDMAN SACHS SHORT DURATION TAX-FREE FUND
Schedule of Investments (continued)
September 30, 2017 (Unaudited)
| | | | | | | | | | | | |
Principal
Amount | | | Interest
Rate | | Maturity
Date | | | Value | |
| | Municipal Bonds – (continued) | |
| | Texas – (continued) | |
| Austin Texas Water and Wastewater System RB Refunding Series
2014 (AA/Aa2) |
|
| $ | 1,675,000 | | | 5.000% | | | 11/15/19 | | | $ | 1,813,489 | |
| Central Texas Regional Mobility Authority RB Refunding Senior
Lien Series 2015 B (BBB+/Baa2)(b)(c) |
|
| | 7,500,000 | | | 5.000 | | | 01/07/21 | | | | 8,215,800 | |
| City of Arlington for Permanent Improvement Bonds
Series 2015 A (AAA/Aa1) |
|
| | 1,075,000 | | | 2.500 | | | 08/15/18 | | | | 1,089,437 | |
| | 725,000 | | | 3.000 | | | 08/15/19 | | | | 751,745 | |
| City of Carrollton Texas GO Refunding Bonds Series 2012
(AAA/Aa1) |
|
| | 2,005,000 | | | 4.000 | | | 08/15/19 | | | | 2,112,508 | |
| City of El Paso Water and Sewer RB Refunding for Improvement
Series 2012 A (AA+/NR) |
|
| | 1,750,000 | | | 2.000 | | | 03/01/18 | | | | 1,757,735 | |
| | 845,000 | | | 4.000 | | | 03/01/19 | | | | 880,186 | |
| City of Hackberry Special Assessment RB Refunding for
Hackberry Public Improvement District No. 3 Phases #13-16
Project Series 2017 (NR/NR)(e)(g) |
|
| | 70,000 | | | 0.000 | | | 09/01/19 | | | | 65,204 | |
| | 70,000 | | | 0.000 | | | 09/01/20 | | | | 62,658 | |
| | 70,000 | | | 0.000 | | | 09/01/21 | | | | 60,106 | |
| | 70,000 | | | 0.000 | | | 09/01/22 | | | | 57,529 | |
| | 70,000 | | | 0.000 | | | 09/01/23 | | | | 54,859 | |
| City of Hackberry Special Assessment RB Refunding for Hidden
Cove Public Improvement District No. 2 Project Series 2017
(BBB/NR)(e) |
|
| | 200,000 | | | 0.000 | | | 09/01/18 | | | | 196,158 | |
| | 685,000 | | | 0.000 | | | 09/01/19 | | | | 655,210 | |
| | 685,000 | | | 0.000 | | | 09/01/20 | | | | 636,475 | |
| | 685,000 | | | 0.000 | | | 09/01/21 | | | | 615,835 | |
| | 685,000 | | | 0.000 | | | 09/01/22 | | | | 593,525 | |
| City of Hackberry Special Assessment RB Refunding for Hidden
Cove Public Improvement District No. 2 Project Series 2017
(BBB/NR) |
|
| | 405,000 | | | 4.000 | | | 09/01/23 | | | | 433,808 | |
| City of Lewisville Texas Combination Contract & Special
Assessment RB Refunding for Lewisville Castle Hills Public
Improvement District No. 3 Project Series 2015 (AGM)
(AA/NR) |
|
| | 250,000 | | | 3.000 | | | 09/01/18 | | | | 253,697 | |
| | 375,000 | | | 3.000 | | | 09/01/19 | | | | 386,130 | |
| Corpus Christi Independent School District GO Bonds for School
Building Series 2017 A (PSF-GTD) (AAA/Aaa)(b)(c) |
|
| | 5,500,000 | | | 2.000 | | | 08/15/19 | | | | 5,575,845 | |
| Dallas County Community College District GO Refunding Bonds
Series 2017 (AAA/Aaa) |
|
| | 3,125,000 | | | 5.000 | | | 02/15/19 | | | | 3,293,781 | |
| | 11,975,000 | | | 5.000 | | | 02/15/20 | | | | 13,051,193 | |
| | 2,355,000 | | | 5.000 | | | 02/15/21 | | | | 2,642,734 | |
| Dallas County Highland Park Independent School District
Unlimited Tax GO Refunding Bonds Series 2015 (NR/Aaa) |
|
| | 2,070,000 | | | 4.000 | | | 02/15/20 | | | | 2,210,346 | |
| | Dallas County Limited Tax GO Notes Series 2011 (AAA/Aaa) | |
| | 3,855,000 | | | 5.000 | | | 02/15/18 | | | | 3,913,095 | |
| | |
| | Municipal Bonds – (continued) | |
| | Texas – (continued) | |
| Dallas-Fort Worth International Airport Joint RB Refunding
Series 2011 D (A+/A1) |
|
| $ | 250,000 | | | 4.000% | | | 11/01/17 | | | $ | 250,617 | |
| Dallas-Fort Worth International Airport Joint RB Refunding
Series 2012 B (A+/A1) |
|
| | 1,750,000 | | | 5.000 | | | 11/01/18 | | | | 1,824,637 | |
| East Central Independent School District Unlimited Tax for
School Building Series 2016 (PSF-GTD) (AAA/Aaa) |
|
| | 1,305,000 | | | 4.000 | | | 08/15/22 | | | | 1,459,499 | |
| Fort Bend Independent School District GO Bonds for School
Building RMKT 08/01/17 Series 2015 B (PSF-GTD)
(AAA/NR)(b)(c) |
|
| | 7,145,000 | | | 1.350 | | | 08/01/19 | | | | 7,147,501 | |
| Fort Worth Texas GO Refunding and Improvement Bonds
Series 2012 (AA+/Aa3) |
|
| | 2,000,000 | | | 4.000 | | | 03/01/19 | | | | 2,083,560 | |
| Garland Independent School District Unlimited Tax Refunding
Bonds Series 2015 A (PSF-GTD) (AAA/Aaa) |
|
| | 6,640,000 | | | 2.000 | | | 02/15/18 | | | | 6,666,627 | |
| | 4,710,000 | | | 3.000 | | | 02/15/19 | | | | 4,834,909 | |
| Harris County Cultural Education Facilities Finance Corp. RB
Refunding for Memorial Hermann Health System
Series 2013 B (A+/A1)(d) |
|
| | 5,685,000 | | | (SIFMA Municipal
Swap Index Yield +
1.05%, 18.00% Cap),
1.990 | | | 06/01/24 | | | | 5,693,414 | |
| Hickory Creek Texas Special Assessment RB for Public
Improvement District No. 1 Series 2017 (BBB-/NR) |
|
| | 80,000 | | | 3.000 | | | 09/01/18 | | | | 80,907 | |
| | 85,000 | | | 3.000 | | | 09/01/19 | | | | 86,601 | |
| | 85,000 | | | 3.000 | | | 09/01/20 | | | | 86,930 | |
| | 90,000 | | | 3.000 | | | 09/01/21 | | | | 92,037 | |
| | 90,000 | | | 3.000 | | | 09/01/22 | | | | 91,815 | |
| | 95,000 | | | 3.000 | | | 09/01/23 | | | | 96,234 | |
| Houston Airport System RB Subordinate Lien Series 2002 C
(AMT) (XLCA) (A+/A1)(c) |
|
| | 15,750,000 | | | 2.470 | | | 07/01/32 | | | | 15,030,772 | |
| Houston Airport System RB Subordinate Lien Series 2002 D-2
(AMT) (XLCA) (A+/A1)(c) |
|
| | 18,550,000 | | | 2.477 | | | 07/01/32 | | | | 17,704,465 | |
| Houston Independent School District Limited Tax GO Refunding
Bonds RMKT 01/06/17 Series 2017 (PSF-GTD)
(AAA/Aaa)(b)(c) |
|
| | 10,420,000 | | | 1.450 | | | 06/01/20 | | | | 10,395,617 | |
| Houston Independent School District Limited Tax GO Refunding
Bonds Series 2014 B (PSF-GTD) (AAA/Aaa) |
|
| | 12,000,000 | | | 5.000 | | | 02/15/19 | | | | 12,643,080 | |
| Houston Independent School District Limited Tax GO Refunding
Bonds Series 2017 (PSF-GTD) (AAA/Aaa) |
|
| | 22,990,000 | | | 3.000 | | | 02/15/21 | | | | 24,335,605 | |
| | 24,000,000 | | | 3.000 | | | 02/15/22 | | | | 25,610,400 | |
| Houston Independent School District Limited Tax Schoolhouse
GO Bonds RMKT 06/01/17 Series 2017 A-2 (PSF-GTD)
(AAA/Aaa)(b)(c) |
|
| | 17,750,000 | | | 3.000 | | | 06/01/19 | | | | 18,261,910 | |
| | |
| | |
| 86 | | The accompanying notes are an integral part of these financial statements. |
GOLDMAN SACHS SHORT DURATION TAX-FREE FUND
| | | | | | | | | | | | |
Principal
Amount | | | Interest
Rate | | Maturity
Date | | | Value | |
| | Municipal Bonds – (continued) | |
| | Texas – (continued) | |
| Houston Independent School District Limited Tax Schoolhouse
GO Bonds RMKT 06/01/17 Series 2017 B (PSF-GTD)
(AAA/Aaa)(b)(c) |
|
| $ | 15,000,000 | | | 1.450% | | | 06/01/20 | | | $ | 14,972,700 | |
| Kaufman County Fresh Water Supply District No. 1 Refunding
for Road Series 2016 C (AGM) (AA/NR) |
|
| | 370,000 | | | 3.000 | | | 09/01/19 | | | | 378,650 | |
| | 390,000 | | | 3.000 | | | 09/01/20 | | | | 401,977 | |
| | 310,000 | | | 3.000 | | | 09/01/21 | | | | 320,537 | |
| | 330,000 | | | 3.000 | | | 09/01/22 | | | | 342,065 | |
| Lamar Consolidated Independent School District Unlimited Tax
Schoolhouse Bonds RMKT 08/15/16 Series 2014 A
(PSF-GTD) (AAA/Aaa)(b)(c) |
|
| | 5,000,000 | | | 1.050 | | | 08/15/18 | | | | 5,000,500 | |
| Leander Independent School District Unlimited Tax GO
Refunding Bonds Series 2015 A (PSF-GTD) (AAA/NR)(e) |
|
| | 2,000,000 | | | 0.000 | | | 08/15/19 | | | | 1,957,640 | |
| | 1,500,000 | | | 0.000 | | | 08/15/20 | | | | 1,445,310 | |
| Leander Independent School District Unlimited Tax GO
Refunding Bonds Series 2016 (PSF-GTD) (AAA/NR)(e) |
|
| | 2,500,000 | | | 0.000 | | | 08/16/20 | | | | 2,408,750 | |
| | 5,000,000 | | | 0.000 | | | 08/16/21 | | | | 4,731,800 | |
| Lower Neches Valley Authority Industrial Development Corp.
RB Refunding for Exxonmobil Project Series 2012
(AA+/Aaa)(b)(c) |
|
| | 8,000,000 | | | 0.980 | | | 10/02/17 | | | | 8,000,000 | |
| Mansfield Independent School District GO Bonds Series 2012
(PSF-GTD) (AAA/Aaa)(b)(c) |
|
| | 8,250,000 | | | 2.500 | | | 08/01/21 | | | | 8,546,340 | |
| Midway Independent School District Unlimited Tax GO
Refunding Bonds Series 2015 (PSF-GTD) (AAA/NR) |
|
| | 4,905,000 | | | 5.000 | | | 08/01/21 | | | | 5,576,494 | |
| Mission Economic Development Corp. Solid Waste Disposal RB
for Waste Management, Inc. Project RMKT 06/01/15
Series 2006 (A-/NR) |
|
| | 5,000,000 | | | 1.800 | | | 12/01/18 | | | | 5,043,700 | |
| New Hope Cultural Education Facilities Finance Corp. Student
Housing RB for Station I, LLC – Texas A&M University
Collegiate Housing Project Series 2014 A (AGM) (AA/A2) |
|
| | 170,000 | | | 4.000 | | | 04/01/20 | | | | 179,211 | |
| | 400,000 | | | 4.000 | | | 04/01/21 | | | | 427,848 | |
| New Hope Cultural Education Facilities Finance Corp. Student
Housing RB for Station II, LLC – Texas A&M University
Collegiate Housing Corpus Christi Project Series 2016 A
(BBB-/Baa3) |
|
| | 145,000 | | | 4.000 | | | 04/01/19 | | | | 149,314 | |
| | 300,000 | | | 4.000 | | | 04/01/20 | | | | 313,557 | |
| | 620,000 | | | 4.000 | | | 04/01/21 | | | | 658,198 | |
| North Texas Municipal Water District Upper East Fork
Wastewater Interceptor System Contract RB Refunding &
Improvement Series 2016 (AAA/Aa1) |
|
| | 2,085,000 | | | 5.000 | | | 06/01/22 | | | | 2,418,412 | |
| North Texas Tollway Authority RB Refunding for First Tier
Series 2008 A (NATL-RE-IBC) (A/A1) |
|
| | 4,470,000 | | | 6.000 | | | 01/01/19 | | | | 4,525,026 | |
| | |
| | Municipal Bonds – (continued) | |
| | Texas – (continued) | |
| North Texas Tollway Authority RB Refunding for First Tier
Series 2012 C (A/A1)(b)(c) |
|
| $ | 18,000,000 | | | 1.950% | | | 01/01/19 | | | $ | 18,115,380 | |
| North Texas Tollway Authority System RB Refunding First Tier
Series 2011 B (A/A1) |
|
| | 3,000,000 | | | 5.000 | | | 01/01/19 | | | | 3,146,070 | |
| North Texas Tollway Authority System RB Refunding First Tier
Series 2014 A (A/A1) |
|
| | 2,000,000 | | | 5.000 | | | 01/01/20 | | | | 2,167,760 | |
| North Texas Tollway Authority System RB Refunding First Tier
Series 2014 C (A/A1)(b) |
|
| | 5,000,000 | | | (SIFMA Municipal
Swap Index Yield +
0.67%, 9.00% Cap),
1.610 | | | 01/01/20 | | | | 5,016,350 | |
| North Texas Tollway Authority System RB Refunding for Second
Tier Series 2015 A (A-/A2) |
|
| | 1,070,000 | | | 4.000 | | | 01/01/18 | | | | 1,077,779 | |
| | 1,000,000 | | | 5.000 | | | 01/01/19 | | | | 1,048,310 | |
| Northside Texas Independent School District Unlimited Tax
School Building GO Bonds Series 2017 (PSF-GTD)
(AAA/Aaa)(b)(c) |
|
| | 15,000,000 | | | 1.450 | | | 06/01/20 | | | | 15,046,800 | |
| Plano Independent School District Unlimited Tax Refunding
Bonds Series 2016 B (PSF-GTD) (AAA/Aaa) |
|
| | 10,580,000 | | | 5.000 | | | 02/15/20 | | | | 11,554,206 | |
| Round Rock Independent School District Unlimited Tax GO
Bonds for School Building RMKT 08/01/16 Series 2015
(PSF-GTD) (AAA/Aaa)(b)(c) |
|
| | 19,575,000 | | | 1.500 | | | 08/01/21 | | | | 19,590,856 | |
| Sam Rayburn Municipal Power Agency RB Refunding
Series 2012 (BBB+/NR) |
|
| | 2,315,000 | | | 5.000 | | | 10/01/19 | | | | 2,470,313 | |
| San Antonio Electric and Gas Systems Junior Lien RB Refunding
Series 2012 A (AA-/NR)(b)(c) |
|
| | 5,000,000 | | | 2.000 | | | 12/01/18 | | | | 5,022,550 | |
| San Antonio Electric and Gas Systems Junior Lien RB Refunding
Series 2015 B (AA-/Aa2)(b)(c) |
|
| | 8,000,000 | | | 2.000 | | | 12/01/21 | | | | 8,116,160 | |
| San Antonio Independent School District Unlimited Tax
Refunding Bonds Series 2014 B (PSF-GTD) (AAA/Aaa)(b)(c) |
|
| | 9,530,000 | | | 2.000 | | | 08/01/18 | | | | 9,607,479 | |
| San Antonio Water System RB Refunding Junior Lien
Series 2016 C (AA/Aa2) |
|
| | 1,255,000 | | | 3.000 | | | 05/15/19 | | | | 1,294,733 | |
| Spring Branch Independent School District Schoolhouse GO
Bonds RMKT 06/15/17 Series 2013 (PSF-GTD)
(AAA/Aaa)(b)(c) |
|
| | 22,095,000 | | | 3.000 | | | 06/18/19 | | | | 22,750,117 | |
| Texas Municipal Gas Acquisition & Supply Corp. III RB
Series 2012 D (BBB/A3) |
|
| | 5,000,000 | | | 5.000 | | | 12/15/17 | | | | 5,041,500 | |
| | 4,500,000 | | | 5.000 | | | 12/15/18 | | | | 4,717,980 | |
| | |
| | |
| The accompanying notes are an integral part of these financial statements. | | 87 |
GOLDMAN SACHS SHORT DURATION TAX-FREE FUND
Schedule of Investments (continued)
September 30, 2017 (Unaudited)
| | | | | | | | | | | | |
Principal
Amount | | | Interest
Rate | | Maturity
Date | | | Value | |
| | Municipal Bonds – (continued) | |
| | Texas – (continued) | |
| Texas Municipal Gas Acquisition & Supply Corp. RB for Senior
Lien Series 2008 D (BBB+/Baa1) |
|
| $ | 3,105,000 | | | 5.625% | | | 12/15/17 | | | $ | 3,121,519 | |
| Texas Municipal Gas Acquisition and Supply Corp. I RB for Gas
Supply Senior Lien Series 2006 B (BBB+/Baa1)(d) |
|
| | 995,000 | | | (3 Mo. LIBOR + 0.55%),
1.434 | | | 12/15/17 | | | | 994,841 | |
| Texas Private Activity Bond Surface Transportation Corp. RB
Senior Lien for Mobility Partners LLC Series 2009
(BBB-/Baa2) |
|
| | 7,800,000 | | | 6.875 | | | 12/31/39 | | | | 8,666,580 | |
| Texas Transportation Commission Central Turnpike System RB
Refunding Series 2015 A (A-/A3)(b)(c) |
|
| | 5,000,000 | | | 5.000 | | | 04/01/20 | | | | 5,423,050 | |
| Texas Transportation Commission Highway Improvement GO
Bonds Series 2014 (AAA/Aaa) |
|
| | 20,000,000 | | | 5.000 | | | 04/01/19 | | | | 21,193,000 | |
| | 2,500,000 | | | 5.000 | | | 04/01/21 | | | | 2,822,325 | |
| Texas Transportation Commission State Highway Fund First Tier
RB Refunding Series 2014 A (AAA/Aaa) |
|
| | 14,625,000 | | | 5.000 | | | 04/01/18 | | | | 14,920,133 | |
| Texas Transportation Commission State Highway Fund First Tier
RB Series 2016 A (AAA/Aaa) |
|
| | 15,250,000 | | | 3.000 | | | 10/01/21 | | | | 16,280,595 | |
| Texas University System Financing RB Refunding Series 2017 A
(AA/Aa2) |
|
| | 1,800,000 | | | 5.000 | | | 03/15/20 | | | | 1,968,300 | |
| | 1,800,000 | | | 5.000 | | | 03/15/21 | | | | 2,029,176 | |
| Texas Water Development Board State Water Implementation
Fund RB Series 2015 A (AAA/NR) |
|
| | 2,300,000 | | | 4.000 | | | 10/15/19 | | | | 2,437,586 | |
| | 1,305,000 | | | 4.000 | | | 04/15/20 | | | | 1,398,947 | |
| Travis County GO Bonds for Texas Unlimited Tax Road
Series 2016 (AAA/Aaa) |
|
| | 3,265,000 | | | 1.500 | | | 03/01/20 | | | | 3,295,201 | |
| Victoria Independent School District Unlimited Tax Refunding
Bonds Series 2016 (PSF-GTD) (AAA/Aaa) |
|
| | 1,350,000 | | | 3.000 | | | 02/15/19 | | | | 1,385,802 | |
| | 2,940,000 | | | 3.000 | | | 02/15/20 | | | | 3,064,509 | |
| | 2,175,000 | | | 3.000 | | | 02/15/21 | | | | 2,297,126 | |
| | | | | | | | | | | | |
| | | | | | | | | | | 530,518,400 | |
| | |
| | Utah – 0.6% | |
| Board of Education of Alpine School District GO Refunding
Bonds for Utah SCH BD GTY Program Series 2015 (SCH BD
GTY) (AAA/Aaa) |
|
| | 11,550,000 | | | 5.000 | | | 03/15/19 | | | | 12,196,107 | |
| Board of Education of Alpine School District GO Refunding
Bonds for Utah SCH BD GTY Program Series 2017 (SCH BD
GTY) (AAA/Aaa) |
|
| | 7,800,000 | | | 5.000 | | | 03/15/21 | | | | 8,818,524 | |
| | 7,995,000 | | | 5.000 | | | 03/15/22 | | | | 9,273,720 | |
| Utah Associated Municipal Power Systems RB for Horse Butte
Wind Project Series 2012 A (A/NR) |
|
| | 500,000 | | | 5.000 | | | 09/01/18 | | | | 517,300 | |
| | 500,000 | | | 5.000 | | | 09/01/19 | | | | 535,395 | |
| | | | | | | | | | | | |
| | | | | | | | | | | 31,341,046 | |
| | |
| | Municipal Bonds – (continued) | |
| | Vermont – 0.1% | |
| Vermont Educational & Health Buildings Financing Agency RB
Refunding for St. Michael’s College Project Series 2012
(BBB+/Baa1) |
|
| $ | 1,680,000 | | | 4.000% | | | 10/01/17 | | | $ | 1,680,000 | |
| Vermont Educational & Health Buildings Financing Agency RB
Refunding for The University of Vermont Medical Center
Project Series 2016 A (A-/A3) |
|
| | 500,000 | | | 3.000 | | | 12/01/17 | | | | 501,525 | |
| | 450,000 | | | 4.000 | | | 12/01/19 | | | | 473,629 | |
| | 400,000 | | | 4.000 | | | 12/01/20 | | | | 429,084 | |
| | 350,000 | | | 5.000 | | | 12/01/21 | | | | 395,000 | |
| | | | | | | | | | | | |
| | | | | | | | | | | 3,479,238 | |
| | |
| | Virgin Islands – 0.2% | |
| Virgin Islands Public Finance Authority Grant Anticipation RB
for Federal Highway Grant Anticipation Revenue Loan Note
Series 2015 (A/NR)(f) |
|
| | 250,000 | | | 5.000 | | | 09/01/18 | | | | 255,805 | |
| | 645,000 | | | 5.000 | | | 09/01/19 | | | | 676,037 | |
| | 825,000 | | | 5.000 | | | 09/01/20 | | | | 880,795 | |
| | 2,015,000 | | | 5.000 | | | 09/01/21 | | | | 2,184,804 | |
| Virgin Islands Public Finance Authority RB Refunding for Virgin
Islands Gross Receipts Taxes Loan Note Series 2012 A
(CCC/NR) |
|
| | 4,320,000 | | | 2.250 | | | 10/01/17 | | | | 4,320,000 | |
| | 2,085,000 | | | 4.000 | | | 10/01/22 | | | | 1,443,863 | |
| | | | | | | | | | | | |
| | | | | | | | | | | 9,761,304 | |
| | |
| | Virginia – 2.0% | |
| Fairfax County GO Refunding Bonds for Virginia Public
Improvement Series 2016 A (ST AID WITHHLDG)
(AAA/Aaa) |
|
| | 9,995,000 | | | 4.000 | | | 10/01/21 | | | | 11,075,060 | |
| Fairfax County GO Refunding Bonds for Virginia Public
Improvement Series 2016 A (ST AID WITHHLDG)
(AAA/Aaa)(a) |
|
| | 8,450,000 | | | 5.000 | | | 10/01/21 | | | | 9,695,107 | |
| Louisa IDA Pollution Control RB Refunding for Virginia Electric
& Power Company Project RMKT 12/01/16 Series 2008 C
(BBB+/A2)(b)(c) |
|
| | 8,000,000 | | | 1.850 | | | 05/16/19 | | | | 8,060,000 | |
| Peninsula Ports Authority of Virginia Coal Terminal RB
Refunding for Dominion Terminal Associates Project
Series 2003 (BBB/NR)(b)(c) |
|
| | 2,750,000 | | | 1.550 | | | 10/01/19 | | | | 2,745,160 | |
| Virginia Commonwealth Transportation Board RB for
Transportation Capital Projects Series 2012 (AA+/Aa1) |
|
| | 5,000,000 | | | 5.000 | | | 05/15/19 | | | | 5,322,400 | |
| Virginia Commonwealth Transportation Board RB Refunding for
Northern Virginia Transportation District Program
Series 2014 A (AA+/Aa1) |
|
| | 8,375,000 | | | 5.000 | | | 05/15/19 | | | | 8,915,020 | |
| Virginia Commonwealth Transportation Board RB Refunding for
U.S. Route 58 Corridor Development Program Series 2014 B
(AA+/Aa1) |
|
| | 20,650,000 | | | 5.000 | | | 05/15/19 | | | | 21,981,512 | |
| | 11,680,000 | | | 5.000 | | | 05/15/20 | | | | 12,838,890 | |
| | |
| | |
| 88 | | The accompanying notes are an integral part of these financial statements. |
GOLDMAN SACHS SHORT DURATION TAX-FREE FUND
| | | | | | | | | | | | | | |
Principal
Amount | | | Interest
Rate | | | Maturity
Date | | | Value | |
| | Municipal Bonds – (continued) | |
| | Virginia – (continued) | |
| Virginia Electric and Power Company Industrial Development
Authority of Wise County RB for Solid Waste and Sewage
Disposal RMKT 08/13/15 Series 2009 A (BBB+/A2)(b)(c) |
|
| $ | 6,000,000 | | | | 2.150 | % | | | 09/01/20 | | | $ | 6,103,740 | |
| Virginia Electric and Power Company Industrial Development
Authority of Wise County RB for Solid Waste and Sewage
Disposal RMKT 11/02/15 Series 2010 A (BBB+/A2)(b)(c) |
|
| | 4,500,000 | | | | 1.875 | | | | 06/01/20 | | | | 4,539,105 | |
| Virginia State Public Building Authority RB for Public Facilities
Series 2009 B (ST APPROP) (AA+/Aa1)(a) |
|
| | 3,005,000 | | | | 5.000 | | | | 08/01/19 | | | | 3,222,682 | |
| Virginia State Public Building Authority RB for Public Facilities
Series 2011 A (AA+/Aa1)(a) |
|
| | 5,375,000 | | | | 5.000 | | | | 08/01/21 | | | | 6,130,295 | |
| York County Economic Development Authority Electricity and
Power RB Refunding Series 2009 A (BBB+/A2)(b)(c) |
|
| | 2,000,000 | | | | 1.875 | | | | 05/16/19 | | | | 2,015,780 | |
| | | | | | | | | | | | | | |
| | | | | | | | | | | | | 102,644,751 | |
| | |
| | Washington – 0.8% | |
| City of Spokane Washington Water and Wastewater System RB
Series 2014 (AA/Aa2) |
|
| | 2,805,000 | | | | 5.000 | | | | 12/01/18 | | | | 2,935,180 | |
| Seattle City RB Refunding for Municipal Light & Power
Improvement Series 2016 C (AA/Aa2) |
|
| | 10,660,000 | | | | 5.000 | | | | 10/01/22 | | | | 12,482,540 | |
| Seattle City RB Refunding for Municipal Light & Power
Improvement Series 2017 C (AA/Aa2) |
|
| | 2,310,000 | | | | 5.000 | | | | 09/01/20 | | | | 2,564,585 | |
| Washington State COPS for State and Local Agency Real and
Personal Property Series 2014 B (NR/Aa2) |
|
| | 3,020,000 | | | | 5.000 | | | | 07/01/19 | | | | 3,220,196 | |
| Washington State COPS for State and Local Agency Real and
Personal Property Series 2015 B (NR/Aa2) |
|
| | 5,745,000 | | | | 5.000 | | | | 01/01/20 | | | | 6,236,255 | |
| Washington State COPS Refunding for State and Local Agency
Real and Personal Property Series 2016 A (NR/Aa2) |
|
| | 6,420,000 | | | | 5.000 | | | | 07/01/20 | | | | 7,078,435 | |
| Washington State Motor Vehicle Fuel Tax GO Refunding Bonds
Series 2015 R-F (AA+/Aa1) |
|
| | 6,770,000 | | | | 5.000 | | | | 07/01/19 | | | | 7,229,683 | |
| | | | | | | | | | | | | | |
| | | | | | | | | | | | | 41,746,874 | |
| | |
| | West Virginia – 0.2% | |
| Mason County Pollution Control RB for Appalachian Power Co.
Project Series 2003 L (A-/Baa1)(b)(c) |
|
| | 3,000,000 | | | | 1.625 | | | | 10/01/18 | | | | 3,009,900 | |
| Monongalia County Board of Education Public School GO
Refunding Bonds Series 2012 (AA-/NR) |
|
| | 1,520,000 | | | | 5.000 | | | | 05/01/18 | | | | 1,554,839 | |
| Princeton West Virginia Hospitals RB Refunding Princeton
Community Hospital Project Series 2012 A (BBB+/NR) |
|
| | 1,445,000 | | | | 5.000 | | | | 05/01/18 | | | | 1,470,085 | |
| | 1,565,000 | | | | 5.000 | | | | 05/01/19 | | | | 1,637,037 | |
| | | | | | | | | | | | | | |
| | | | | | | | | | | | | 7,671,861 | |
| | |
| | Municipal Bonds – (continued) | |
| | Wisconsin – 0.2% | |
| | Wisconsin State GO Bonds Series 2006 A (AA/Aa1)(a) | |
| $ | 11,030,000 | | | | 5.000 | % | | | 05/01/21 | | | $ | 12,489,269 | |
| | |
| | TOTAL INVESTMENTS – 101.7% | |
| | (Cost $5,108,036,332) | | | $ | 5,102,657,265 | |
| | |
| LIABILITIES IN EXCESS OF OTHER
ASSETS – (1.7)% |
| | | (83,189,153 | ) |
| | |
| | NET ASSETS – 100.0% | | | $ | 5,019,468,112 | |
| | |
| | |
| The percentage shown for each investment category reflects the value of investments in that category as a percentage of net assets. |
(a) | | Pre-refunded security. Maturity date disclosed is pre-refunding date. |
(b) | | Security with “Put” features and resetting interest rates. Maturity dates disclosed are the puttable dates. Interest rate disclosed is that which is in effect on September 30, 2017. |
(c) | | Variable Rate Demand Instruments – rate shown is that which is in effect on September 30, 2017. Certain variable rate securities are not based on a published reference rate and spread but are determined by the issuer or agent and are based on current market conditions. |
(d) | | Variable rate security. Except for floating rate notes (for which final maturity is disclosed), maturity date disclosed is the next interest reset date. Interest rate disclosed is that which is in effect on September 30, 2017. |
(e) | | Issued with a zero coupon. Income is recognized through the accretion of discount. |
(f) | | Exempt from registration under Rule 144A of the Securities Act of 1933. Under procedures approved by the Board of Trustees, such securities may be deemed liquid by the Investment Adviser and may be resold, normally to qualified institutional buyers in transactions exempt from registration. Total market value of Rule 144A securities amounts to $47,784,523, which represents approximately 1.0% of net assets as of September 30, 2017 and are unaudited. |
(g) | | When-issued security. |
(h) | | Security is currently in default. |
| | |
| The accompanying notes are an integral part of these financial statements. | | 89 |
GOLDMAN SACHS SHORT DURATION TAX-FREE FUND
Schedule of Investments (continued)
September 30, 2017 (Unaudited)
Security ratings disclosed, if any, are issued by either Standard & Poor’s, Moody’s Investor Service or Fitch and are unaudited. A brief description of the ratings is available in the Fund’s Statement of Additional Information.
| | |
|
Investment Abbreviations: |
AGM | | —Insured by Assured Guaranty Municipal Corp. |
AMBAC | | —Insured by American Municipal Bond Assurance Corp. |
AMT | | —Alternative Minimum Tax |
BAM | | —Build America Mutual Assurance Co. |
BHAC-CR | | —Insured by Berkshire Hathaway Assurance Corp. - Insured Custodial Receipts |
CNTY GTD | | —County Guaranteed |
COMWLTH GTD | | —Commonwealth Guaranteed |
COPS | | —Certificates of Participation |
ETM | | —Escrowed to Maturity |
FGIC | | —Insured by Financial Guaranty Insurance Co. |
GO | | —General Obligation |
IDA | | —Industrial Development Authority |
LIBOR | | —London Interbank Offered Rate |
Mo. | | —Month |
MUN GOVT GTD | | —Municipal Government Guaranteed |
NATL-RE | | —Insured by National Public Finance Guarantee Corp. |
NATL-RE FGIC | | —Insured by National Public Finance Guarantee Corp., which reinsures Financial Guaranty Insurance Co. |
NATL-RE-IBC | | —Insured by National Public Finance Guarantee Corp. - Insured Bond Certificates |
NR | | —Not Rated |
PCRB | | —Pollution Control Revenue Bond |
PSF-GTD | | —Guaranteed by Permanent School Fund |
Q-SBLF | | —Qualified School Board Loan Fund |
RB | | —Revenue Bond |
RMKT | | —Remarketed |
SCH BD GTY | | —School Bond Guaranty |
SCH BD RES FD | | —School Bond Reserve Fund |
SCSDE | | —South Carolina State Department of Education |
SD CRED PROG | | —School District Credit Program |
SIFMA | | —The Securities Industry and Financial Markets Association |
ST AID WITHHLDG | | —State Aid Withholding |
ST APPROP | | —State Appropriation |
U.S. | | —United States |
USD | | —United States Dollar |
WR | | —Withdrawn Rating |
XLCA | | —Insured by XL Capital Assurance, Inc. |
|
| | |
| 90 | | The accompanying notes are an integral part of these financial statements. |
GOLDMAN SACHS SHORT DURATION TAX-FREE FUND
|
| ADDITIONAL INVESTMENT INFORMATION |
SWAP CONTRACTS — At September 30, 2017, the Fund had the following swap contracts:
OVER THE COUNTER CREDIT DEFAULT SWAP CONTRACTS
| | | | | | | | | | | | | | | | | | | | | | | | | | | | | | | | | | | | |
| Reference Obligation/Index(a) | | Financing
Rate Received
(Paid) by the
Fund (%) | | | Counterparty | | | Termination
Date | | | Notional
Amount | | | Credit
Spread on
September 30,
2017(b) | | | Value | | | Upfront
Premium
(Received) Paid | | | Unrealized
Appreciation/
(Depreciation) | |
Protection Sold: | |
California State Various Purpose GO Bonds Series 2003, 5.000%, 11/01/23 | | | 1.000 | | |
| Bank of
America NA |
| | | 03/20/2023 | | | | USD | | | | 5,000,000 | | | | 0.485 | % | | $ | 132,442 | | | $ | (135,666 | ) | | $ | 268,108 | |
California State Various Purpose GO Bonds Series 2003, 5.250%, 02/01/18 | | | 1.000 | | |
| JPMorgan Chase
Bank NA |
| | | 03/20/2023 | | | | USD | | | | 10,000,000 | | | | 0.485 | | | | 264,882 | | | | (271,333 | ) | | | 536,215 | |
| | | | | | | | | | | | | | | | | | | | | | | | | | | | | | | $ | (406,999 | ) | | $ | 804,323 | |
| | (a) | | Payments received quarterly. |
| | (b) | | Credit spread on the referenced obligation, together with the period of expiration, are indicators of payment/performance risk. The likelihood of a credit event occurring which would require a fund or its counterparty to make a payment or otherwise be required to perform under the swap contract is generally greater as the credit spread and term of the swap contract increase. |
| | |
| The accompanying notes are an integral part of these financial statements. | | 91 |
GOLDMAN SACHS MUNICIPAL FIXED INCOME FUNDS
Statements of Assets and Liabilities
September 30, 2017 (Unaudited)
| | | | | | | | | | | | | | |
| | | | | Dynamic
Municipal
Income Fund | | | High Yield
Municipal Fund | | | Short Duration
Tax-Free Fund | |
| | Assets: | |
| | Investments in unaffiliated issuers, at value (cost $1,363,333,314, $4,921,906,449 and $5,108,036,332) | | $ | 1,387,878,737 | | | $ | 5,115,443,600 | | | $ | 5,102,657,265 | |
| | Cash | | | 8,230,175 | | | | 5,355,866 | | | | 20,148,322 | |
| | Receivables: | | | | | | | | | | | | |
| | Collateral on certain derivative contracts(a) | | | 17,837,736 | | | | 57,828,359 | | | | — | |
| | Interest | | | 16,337,662 | | | | 69,593,732 | | | | 43,865,960 | |
| | Fund shares sold | | | 8,906,241 | | | | 7,940,411 | | | | 11,668,288 | |
| | Reimbursement from investment adviser | | | 39,746 | | | | 94,259 | | | | 74,248 | |
| | Investments sold | | | — | | | | 30,848,833 | | | | — | |
| | Variation margin on swaps | | | 155,666 | | | | — | | | | — | |
| | Unrealized gain on swap contracts | | | 107,243 | | | | 2,427,422 | | | | 804,323 | |
| | Other assets | | | 1,192 | | | | 5,138 | | | | 5,679 | |
| | Total assets | | | 1,439,494,398 | | | | 5,289,537,620 | | | | 5,179,224,085 | |
| | | | | | | | | | | | | | |
| | Liabilities: | | | | | | | | | | | | |
| | Variation margin on futures | | | 19,903 | | | | — | | | | — | |
| | Variation margin on swaps | | | — | | | | 919,568 | | | | — | |
| | Unrealized loss on swap contracts | | | — | | | | 460,644 | | | | — | |
| | Payables: | | | | | | | | | | | | |
| | Investments purchased on an extended-settlement basis | | | 15,973,274 | | | | 13,864,174 | | | | 138,763,002 | |
| | Fund shares redeemed | | | 1,718,304 | | | | 12,053,294 | | | | 7,610,936 | |
| | Management fees | | | 415,702 | | | | 2,243,972 | | | | 1,359,066 | |
| | Income distribution | | | 380,817 | | | | 420,943 | | | | 229,089 | |
| | Distribution and Service fees and Transfer Agency fees | | | 164,982 | | | | 284,380 | | | | 203,336 | |
| | Upfront payments received on swap contracts | | | 54,266 | | | | 1,423,290 | | | | 406,999 | |
| | Investments purchased | | | — | | | | — | | | | 11,047,500 | |
| | Collateral on certain derivative contracts(a) | | | — | | | | 660,000 | | | | — | |
| | Accrued expenses | | | 88,728 | | | | 116,135 | | | | 136,045 | |
| | Total liabilities | | | 18,815,976 | | | | 32,446,400 | | | | 159,755,973 | |
| | | | | | | | | | | | | | |
| | Net Assets: | | | | | | | | | | | | |
| | Paid-in capital | | | 1,398,646,081 | | | | 5,600,968,466 | | | | 5,012,024,219 | |
| | Undistributed net investment income | | | 9,537,594 | | | | 125,040,789 | | | | 19,886,951 | |
| | Accumulated net realized loss | | | (16,485,997 | ) | | | (686,647,535 | ) | | | (7,868,314 | ) |
| | Net unrealized gain (loss) | | | 28,980,744 | | | | 217,729,500 | | | | (4,574,744 | ) |
| | | NET ASSETS | | $ | 1,420,678,422 | | | $ | 5,257,091,220 | | | $ | 5,019,468,112 | |
| | | Net Assets: | | | | |
| | | Class A | | $ | 267,126,075 | | | $ | 237,063,095 | | | $ | 101,653,677 | |
| | | Class C | | | 44,496,304 | | | | 61,639,772 | | | | 21,642,074 | |
| | | Institutional | | | 1,000,337,712 | | | | 4,911,752,612 | | | | 4,880,674,432 | |
| | | Service | | | 36,448 | | | | — | | | | 293,893 | |
| | | Investor(b) | | | 108,681,883 | | | | 46,635,741 | | | | 15,204,036 | |
| | | Total Net Assets | | $ | 1,420,678,422 | | | $ | 5,257,091,220 | | | $ | 5,019,468,112 | |
| | | Shares outstanding $0.001 par value (unlimited shares authorized): | | | | |
| | | Class A | | | 17,010,280 | | | | 24,779,671 | | | | 9,613,143 | |
| | | Class C | | | 2,832,390 | | | | 6,443,186 | | | | 2,048,903 | |
| | | Institutional | | | 63,715,340 | | | | 513,290,131 | | | | 462,201,317 | |
| | | Service | | | 2,310 | | | | — | | | | 27,831 | |
| | | Investor(b) | | | 6,928,491 | | | | 4,868,640 | | | | 1,439,486 | |
| | | Net asset value, offering and redemption price per share:(c) | | | | |
| | | Class A | | | $15.70 | | | | $9.57 | | | | $10.57 | |
| | | Class C | | | 15.71 | | | | 9.57 | | | | 10.56 | |
| | | Institutional | | | 15.70 | | | | 9.57 | | | | 10.56 | |
| | | Service | | | 15.78 | | | | — | | | | 10.56 | |
| | | Investor(b) | | | 15.69 | | | | 9.58 | | | | 10.56 | |
| | (a) | | Segregated for initial margin and/or collateral on transactions as follows: |
| | | | | | | | |
Fund | | Futures | | | Swaps | |
Dynamic Municipal Income | | $ | 199,430 | | | $ | 17,638,306 | |
High Yield Municipal | | | — | | | | 57,168,359 | |
| | (b) | | Effective August 15, 2017, Class IR changed its name to Investor. |
| | (c) | | Maximum public offering price per share for Class A Shares of the Dynamic Municipal Income, High Yield Municipal and Short Duration Tax-Free Funds is $16.31, $10.02 and $10.73, respectively. At redemption, Class C Shares may be subject to a contingent deferred sales charge assessed on the amount equal to the lesser of the current NAV or the original purchase price of the shares. |
| | |
| 92 | | The accompanying notes are an integral part of these financial statements. |
GOLDMAN SACHS MUNICIPAL FIXED INCOME FUNDS
Statements of Operations
For the Six Months Ended September 30, 2017 (Unaudited)
| | | | | | | | | | | | | | |
| | | | | Dynamic
Municipal
Income Fund | | | High Yield
Municipal Fund | | | Short Duration
Tax-Free Fund | |
| | Investment income: | |
| | Interest | | $ | 23,514,658 | | | $ | 121,240,572 | | | $ | 44,152,607 | |
| | | | | | | | | | | | | | |
| | Expenses: | |
| | Management fees | | | 2,995,835 | | | | 12,960,415 | | | | 8,423,161 | |
| | Distribution and Service fees(a) | | | 516,405 | | | | 617,537 | | | | 250,134 | |
| | Transfer Agency fees(a) | | | 414,400 | | | | 1,152,166 | | | | 1,019,518 | |
| | Custody, accounting and administrative services | | | 73,751 | | | | 268,877 | | | | 252,504 | |
| | Professional fees | | | 66,565 | | | | 134,316 | | | | 80,280 | |
| | Registration fees | | | 58,925 | | | | 83,182 | | | | 91,507 | |
| | Printing and mailing costs | | | 23,387 | | | | 35,882 | | | | 30,750 | |
| | Trustee fees | | | 10,053 | | | | 13,541 | | | | 13,779 | |
| | Service share fees — Service Plan | | | 45 | | | | — | | | | 280 | |
| | Service share fees — Shareholder Administration Plan | | | 45 | | | | — | | | | 280 | |
| | Other | | | 17,702 | | | | 67,931 | | | | 48,078 | |
| | Total expenses | | | 4,177,113 | | | | 15,333,847 | | | | 10,210,271 | |
| | Less — expense reductions | | | (824,473 | ) | | | (600,760 | ) | | | (799,700 | ) |
| | Net expenses | | | 3,352,640 | | | | 14,733,087 | | | | 9,410,571 | |
| | NET INVESTMENT INCOME | | | 20,162,018 | | | | 106,507,485 | | | | 34,742,036 | |
| | | | | | | | | | | | | | |
| | Realized and unrealized gain (loss): | |
| | Net realized gain (loss) from: | | | | | | | | | | | | |
| | Investments | | | 1,814,282 | | | | 10,478,475 | | | | (642,524 | ) |
| | Futures contracts | | | (477,795 | ) | | | — | | | | — | |
| | Swap contracts | | | (2,068,898 | ) | | | (2,333,651 | ) | | | 113,570 | |
| | Net change in unrealized gain on: | | | | | | | | | | | | |
| | Investments | | | 15,896,376 | | | | 95,523,901 | | | | 23,490,769 | |
| | Futures contracts | | | 160,042 | | | | — | | | | — | |
| | Swap contracts | | | 2,283,486 | | | | 1,421,961 | | | | 98,848 | |
| | Net realized and unrealized gain | | | 17,607,493 | | | | 105,090,687 | | | | 23,060,663 | |
| | NET INCREASE IN NET ASSETS RESULTING FROM OPERATIONS | | $ | 37,769,511 | | | $ | 211,598,171 | | | $ | 57,802,699 | |
| | (a) | | Class specific Distribution and Service, and Transfer Agency fees were as follows: |
| | | | | | | | | | | | | | | | | | | | | | | | | | | | |
| | | Distribution and Service Fees | | | Transfer Agency Fees | |
Fund | | Class A | | | Class C | | | Class A | | | Class C | | | Institutional | | | Service | | | Investor(b) | |
Dynamic Municipal Income | | $ | 301,873 | | | $ | 214,532 | | | $ | 156,972 | | | $ | 27,889 | | | $ | 173,707 | | | $ | 7 | | | $ | 55,825 | |
High Yield Municipal | | | 296,786 | | | | 320,751 | | | | 154,327 | | | | 41,697 | | | | 928,475 | | | | — | | | | 27,667 | |
Short Duration Tax-Free | | | 138,628 | | | | 111,506 | | | | 72,086 | | | | 14,496 | | | | 924,933 | | | | 45 | | | | 7,958 | |
| | (b) | | Effective August 15, 2017, Class IR changed its name to Investor. |
| | |
| The accompanying notes are an integral part of these financial statements. | | 93 |
GOLDMAN SACHS MUNICIPAL FIXED INCOME FUNDS
Statements of Changes in Net Assets
| | | | | | | | | | |
| | | | | Dynamic Municipal Income Fund | |
| | | | | For the
Six Months Ended
September 30, 2017
(Unaudited) | | | For the Fiscal
Year Ended
March 31, 2017 | |
| | From operations: | | | | |
| | Net investment income | | $ | 20,162,018 | | | $ | 31,743,256 | |
| | Net realized gain (loss) | | | (732,411 | ) | | | 1,026,212 | |
| | Net change in unrealized gain (loss) | | | 18,339,904 | | | | (18,142,958 | ) |
| | Net increase in net assets resulting from operations | | | 37,769,511 | | | | 14,626,510 | |
| | | | | | | | | | |
| | Distributions to shareholders: | | | | | | | | |
| | From net investment income | | | | | | | | |
| | Class A Shares | | | (3,575,594 | ) | | | (6,721,546 | ) |
| | Class C Shares | | | (475,841 | ) | | | (938,714 | ) |
| | Institutional Shares | | | (14,339,106 | ) | | | (21,877,860 | ) |
| | Service Shares | | | (511 | ) | | | (1,093 | ) |
| | Investor Shares(a) | | | (1,374,192 | ) | | | (830,278 | ) |
| | From net realized gains | | | | | | | | |
| | Class A Shares | | | — | | | | — | |
| | Class C Shares | | | — | | | | — | |
| | Institutional Shares | | | — | | | | — | |
| | Service Shares | | | — | | | | — | |
| | Investor Shares(a) | | | — | | | | — | |
| | Total distributions to shareholders | | | (19,765,244 | ) | | | (30,369,491 | ) |
| | | | | | | | | | |
| | From share transactions: | | | | | | | | |
| | Proceeds from sales of shares | | | 398,088,319 | | | | 687,374,981 | |
| | Reinvestment of distributions | | | 17,554,893 | | | | 26,910,582 | |
| | Cost of shares redeemed | | | (114,139,400 | ) | | | (301,678,135 | ) |
| | Net increase in net assets resulting from share transactions | | | 301,503,812 | | | | 412,607,428 | |
| | TOTAL INCREASE | | | 319,508,079 | | | | 396,864,447 | |
| | | | | | | | | | |
| | Net assets: | | | | | | | | |
| | Beginning of period | | | 1,101,170,343 | | | | 704,305,896 | |
| | End of period | | $ | 1,420,678,422 | | | $ | 1,101,170,343 | |
| | Undistributed net investment income | | $ | 9,537,594 | | | $ | 9,140,820 | |
| | (a) | | Effective August 15, 2017, Class IR changed its name to Investor. |
| | (b) | | Net of $61,110 of redemption fees. |
| | (c) | | Net of $213,148 of redemption fees. |
| | |
| 94 | | The accompanying notes are an integral part of these financial statements. |
GOLDMAN SACHS MUNICIPAL FIXED INCOME FUNDS
| | | | | | | | | | | | | | | | | | | | | | |
| | High Yield Municipal Fund | | | | | Short Duration Tax-Free Fund | |
| | | For the
Six Months Ended
September 30, 2017
(Unaudited) | | | | | For the Fiscal
Year Ended
March 31, 2017 | | | | | For the
Six Months Ended
September 30, 2017
(Unaudited) | | | | | For the Fiscal
Year Ended
March 31, 2017 | |
| | | | | | | | | | | | | | | | | | | | | | |
| | $ | 106,507,485 | | | | | $ | 230,710,172 | | | | | $ | 34,742,036 | | | | | $ | 63,839,360 | |
| | | 8,144,824 | | | | | | 24,714,784 | | | | | | (528,954 | ) | | | | | (6,978,394 | ) |
| | | 96,945,862 | | | | | | (59,638,875 | ) | | | | | 23,589,617 | | | | | | (20,135,274 | ) |
| | | 211,598,171 | | | | | | 195,786,081 | | | | | | 57,802,699 | | | | | | 36,725,692 | |
| | | | | | | | | | | | | | | | | | | | | | |
| | | | | | | | | | | | | | | | | | | | | | |
| | | | | | | | | | | | | | | | | | | | | | |
| | | (4,579,334 | ) | | | | | (11,510,859 | ) | | | | | (607,264 | ) | | | | | (1,390,674 | ) |
| | | (997,548 | ) | | | | | (2,727,881 | ) | | | | | (77,555 | ) | | | | | (171,895 | ) |
| | | (95,952,166 | ) | | | | | (194,879,728 | ) | | | | | (32,180,154 | ) | | | | | (57,690,133 | ) |
| | | — | | | | | | — | | | | | | (1,006 | ) | | | | | (2,014 | ) |
| | | (873,221 | ) | | | | | (1,264,428 | ) | | | | | (81,953 | ) | | | | | (59,098 | ) |
| | | | | | | | | | | | | | | | | | | | | | |
| | | — | | | | | | — | | | | | | — | | | | | | (9,194 | ) |
| | | — | | | | | | — | | | | | | — | | | | | | (1,890 | ) |
| | | — | | | | | | — | | | | | | — | | | | | | (301,050 | ) |
| | | — | | | | | | — | | | | | | — | | | | | | (18 | ) |
| | | — | | | | | | — | | | | | | — | | | | | | (253 | ) |
| | | (102,402,269 | ) | | | | | (210,382,896 | ) | | | | | (32,947,932 | ) | | | | | (59,626,219 | ) |
| | | | | | | | | | | | | | | | | | | | | | |
| | | | | | | | | | | | | | | | | | | | | | |
| | | 726,205,355 | | | | | | 1,590,375,609 | | | | | | 1,175,964,896 | | | | | | 2,398,940,664 | |
| | | 99,886,412 | | | | | | 205,521,625 | | | | | | 31,568,744 | | | | | | 56,995,237 | |
| | | (306,373,079 | )(b) | | | | | (1,263,566,782 | )(c) | | | | | (819,299,432 | ) | | | | | (2,329,028,148 | ) |
| | | 519,718,688 | | | | | | 532,330,452 | | | | | | 388,234,208 | | | | | | 126,907,753 | |
| | | 628,914,590 | | | | | | 517,733,637 | | | | | | 413,088,975 | | | | | | 104,007,226 | |
| | | | | | | | | | | | | | | | | | | | | | |
| | | | | | | | | | | | | | | | | | | | | | |
| | | 4,628,176,630 | | | | | | 4,110,442,993 | | | | | | 4,606,379,137 | | | | | | 4,502,371,911 | |
| | $ | 5,257,091,220 | | | | | $ | 4,628,176,630 | | | | | $ | 5,019,468,112 | | | | | $ | 4,606,379,137 | |
| | $ | 125,040,789 | | | | | $ | 120,935,573 | | | | | $ | 19,886,951 | | | | | $ | 18,092,847 | |
| | |
| The accompanying notes are an integral part of these financial statements. | | 95 |
GOLDMAN SACHS DYNAMIC MUNICIPAL INCOME FUND
Financial Highlights
Selected Data for a Share Outstanding Throughout Each Period
| | | | | | | | | | | | | | | | | | | | | | |
| | | | | | | | Income (loss) from
investment operations | | | | |
| | | Year - Share Class | | Net asset
value,
beginning
of period | | | Net
investment
income(a) | | | Net realized
and unrealized
gain (loss) | | | Total from
investment
operations | | | Distributions
to shareholders
from net
investment
income | |
| | FOR THE SIX MONTHS ENDED SEPTEMBER 30, (UNAUDITED) | |
| | 2017 - A | | $ | 15.46 | | | $ | 0.24 | | | $ | 0.23 | | | $ | 0.47 | | | $ | (0.23 | ) |
| | 2017 - C | | | 15.47 | | | | 0.18 | | | | 0.23 | | | | 0.41 | | | | (0.17 | ) |
| | 2017 - Institutional | | | 15.46 | | | | 0.26 | | | | 0.24 | | | | 0.50 | | | | (0.26 | ) |
| | 2017 - Service | | | 15.54 | | | | 0.23 | | | | 0.23 | | | | 0.46 | | | | (0.22 | ) |
| | 2017 - Investor(e) | | | 15.45 | | | | 0.26 | | | | 0.23 | | | | 0.49 | | | | (0.25 | ) |
| | | | | | | | | | | | | | | | | | | | | | |
| | FOR THE FISCAL YEARS ENDED MARCH 31, | |
| | 2017 - A | | | 15.69 | | | | 0.52 | | | | (0.25 | ) | | | 0.27 | | | | (0.50 | ) |
| | 2017 - C | | | 15.69 | | | | 0.41 | | | | (0.25 | ) | | | 0.16 | | | | (0.38 | ) |
| | 2017 - Institutional | | | 15.68 | | | | 0.58 | | | | (0.25 | ) | | | 0.33 | | | | (0.55 | ) |
| | 2017 - Service | | | 15.77 | | | | 0.50 | | | | (0.25 | ) | | | 0.25 | | | | (0.48 | ) |
| | 2017 - Investor(e) | | | 15.67 | | | | 0.56 | | | | (0.24 | ) | | | 0.32 | | | | (0.54 | ) |
| | 2016 - A | | | 15.81 | | | | 0.56 | | | | (0.14 | ) | | | 0.42 | | | | (0.54 | ) |
| | 2016 - C | | | 15.82 | | | | 0.45 | | | | (0.16 | ) | | | 0.29 | | | | (0.42 | ) |
| | 2016 - Institutional | | | 15.81 | | | | 0.62 | | | | (0.16 | ) | | | 0.46 | | | | (0.59 | ) |
| | 2016 - Service | | | 15.89 | | | | 0.54 | | | | (0.15 | ) | | | 0.39 | | | | (0.51 | ) |
| | 2016 - Investor(e) | | | 15.79 | | | | 0.60 | | | | (0.15 | ) | | | 0.45 | | | | (0.57 | ) |
| | 2015 - A | | | 15.45 | | | | 0.60 | | | | 0.32 | | | | 0.92 | | | | (0.56 | ) |
| | 2015 - C | | | 15.46 | | | | 0.48 | | | | 0.32 | | | | 0.80 | | | | (0.44 | ) |
| | 2015 - Institutional | | | 15.45 | | | | 0.65 | | | | 0.32 | | | | 0.97 | | | | (0.61 | ) |
| | 2015 - Service | | | 15.53 | | | | 0.58 | | | | 0.32 | | | | 0.90 | | | | (0.54 | ) |
| | 2015 - Investor(e) | | | 15.43 | | | | 0.63 | | | | 0.33 | | | | 0.96 | | | | (0.60 | ) |
| | 2014 - A | | | 16.16 | | | | 0.61 | | | | (0.76 | ) | | | (0.15 | ) | | | (0.56 | ) |
| | 2014 - C | | | 16.16 | | | | 0.50 | | | | (0.75 | ) | | | (0.25 | ) | | | (0.45 | ) |
| | 2014 - Institutional | | | 16.16 | | | | 0.67 | | | | (0.76 | ) | | | (0.09 | ) | | | (0.62 | ) |
| | 2014 - Service | | | 16.24 | | | | 0.59 | | | | (0.76 | ) | | | (0.17 | ) | | | (0.54 | ) |
| | 2014 - Investor(e) | | | 16.14 | | | | 0.65 | | | | (0.76 | ) | | | (0.11 | ) | | | (0.60 | ) |
| | 2013 - A | | | 15.73 | | | | 0.61 | | | | 0.41 | | | | 1.02 | | | | (0.59 | ) |
| | 2013 - C | | | 15.73 | | | | 0.49 | | | | 0.40 | | | | 0.89 | | | | (0.46 | ) |
| | 2013 - Institutional | | | 15.72 | | | | 0.66 | | | | 0.42 | | | | 1.08 | | | | (0.64 | ) |
| | 2013 - Service | | | 15.80 | | | | 0.59 | | | | 0.41 | | | | 1.00 | | | | (0.56 | ) |
| | 2013 - Investor(e) | | | 15.71 | | | | 0.64 | | | | 0.41 | | | | 1.05 | | | | (0.62 | ) |
| | (a) | | Calculated based on the average shares outstanding methodology. |
| | (b) | | Assumes investment at the net asset value at the beginning of the period, reinvestment of all distributions, a complete redemption of the investment at the net asset value at the end of the period and no sales or redemption charges. Total returns would be reduced if a sales or redemption charge was taken into account. Returns do not reflect the impact of taxes to shareholders relating to Fund distributions or the redemption of Fund shares. Total returns for periods less than one full year are not annualized. |
| | (c) | | The Fund’s portfolio turnover rate is calculated in accordance with regulatory requirements, without regard to transactions involving short term investments and certain derivatives. If such transactions were included, the Fund’s portfolio turnover rate may be higher. |
| | (e) | | Effective August 15, 2017, Class IR changed its name to Investor. |
| | |
| 96 | | The accompanying notes are an integral part of these financial statements. |
GOLDMAN SACHS DYNAMIC MUNICIPAL INCOME FUND
| | | | | | | | | | | | | | | | | | | | | | | | | | | | | | | | | | | | | | | | |
| | | | | | | | | | | | | |
| | | Net asset
value, end
of period | | | | | Total
return(b) | | | | | Net assets,
end of
period
(in 000s) | | | | | Ratio of
net expenses
to average
net assets | | | | | Ratio of
total expenses
to average
net assets | | | | | Ratio of
net investment
income
to average
net assets | | | | | Portfolio
turnover
rate(c) | |
| | | | | | | | | | | | | | | | | | | | | | | | | | | | | | | | | | | | | | | | |
| | $ | 15.70 | | | | | | 3.07 | % | | | | $ | 267,126 | | | | | | 0.77 | %(d) | | | | | 0.91 | %(d) | | | | | 3.02 | %(d) | | | | | 4 | % |
| | | 15.71 | | | | | | 2.69 | | | | | | 44,496 | | | | | | 1.52 | (d) | | | | | 1.66 | (d) | | | | | 2.28 | (d) | | | | | 4 | |
| | | 15.70 | | | | | | 3.25 | | | | | | 1,000,338 | | | | | | 0.43 | (d) | | | | | 0.56 | (d) | | | | | 3.37 | (d) | | | | | 4 | |
| | | 15.78 | | | | | | 2.99 | | | | | | 36 | | | | | | 0.93 | (d) | | | | | 1.06 | (d) | | | | | 2.88 | (d) | | | | | 4 | |
| | | 15.69 | | | | | | 3.21 | | | | | | 108,682 | | | | | | 0.52 | (d) | | | | | 0.65 | (d) | | | | | 3.27 | (d) | | | | | 4 | |
| | | | | | | | | | | | | | | | | | | | | | | | | | | | | | | | | | | | | | | | |
| | | | | | | | | | | | | | | | | | | | | | | | | | | | | | | | | | | | | | | | |
| | | 15.46 | | | | | | 1.73 | | | | | | 218,699 | | | | | | 0.78 | | | | | | 0.98 | | | | | | 3.34 | | | | | | 28 | |
| | | 15.47 | | | | | | 1.04 | | | | | | 42,353 | | | | | | 1.53 | | | | | | 1.73 | | | | | | 2.59 | | | | | | 28 | |
| | | 15.46 | | | | | | 2.13 | | | | | | 774,777 | | | | | | 0.44 | | | | | | 0.64 | | | | | | 3.67 | | | | | | 28 | |
| | | 15.54 | | | | | | 1.57 | | | | | | 36 | | | | | | 0.94 | | | | | | 1.14 | | | | | | 3.19 | | | | | | 28 | |
| | | 15.45 | | | | | | 2.03 | | | | | | 65,306 | | | | | | 0.53 | | | | | | 0.73 | | | | | | 3.57 | | | | | | 28 | |
| | | 15.69 | | | | | | 2.70 | | | | | | 177,985 | | | | | | 0.78 | | | | | | 0.99 | | | | | | 3.62 | | | | | | 15 | |
| | | 15.69 | | | | | | 1.86 | | | | | | 30,116 | | | | | | 1.54 | | | | | | 1.75 | | | | | | 2.87 | | | | | | 15 | |
| | | 15.68 | | | | | | 2.98 | | | | | | 486,485 | | | | | | 0.44 | | | | | | 0.65 | | | | | | 3.96 | | | | | | 15 | |
| | | 15.77 | | | | | | 2.53 | | | | | | 36 | | | | | | 0.94 | | | | | | 1.16 | | | | | | 3.46 | | | | | | 15 | |
| | | 15.67 | | | | | | 2.95 | | | | | | 9,684 | | | | | | 0.53 | | | | | | 0.74 | | | | | | 3.87 | | | | | | 15 | |
| | | 15.81 | | | | | | 6.00 | | | | | | 172,221 | | | | | | 0.78 | | | | | | 1.01 | | | | | | 3.79 | | | | | | 14 | |
| | | 15.82 | | | | | | 5.21 | | | | | | 22,182 | | | | | | 1.53 | | | | | | 1.76 | | | | | | 3.04 | | | | | | 14 | |
| | | 15.81 | | | | | | 6.36 | | | | | | 393,120 | | | | | | 0.44 | | | | | | 0.67 | | | | | | 4.12 | | | | | | 14 | |
| | | 15.89 | | | | | | 5.79 | | | | | | 39 | | | | | | 0.94 | | | | | | 1.16 | | | | | | 3.62 | | | | | | 14 | |
| | | 15.79 | | | | | | 6.27 | | | | | | 5,728 | | | | | | 0.53 | | | | | | 0.76 | | | | | | 4.00 | | | | | | 14 | |
| | | 15.45 | | | | | | (0.83 | ) | | | | | 160,259 | | | | | | 0.79 | | | | | | 1.00 | | | | | | 3.99 | | | | | | 15 | |
| | | 15.46 | | | | | | (1.50 | ) | | | | | 20,131 | | | | | | 1.54 | | | | | | 1.75 | | | | | | 3.24 | | | | | | 15 | |
| | | 15.45 | | | | | | (0.49 | ) | | | | | 305,706 | | | | | | 0.45 | | | | | | 0.66 | | | | | | 4.33 | | | | | | 15 | |
| | | 15.53 | | | | | | (0.98 | ) | | | | | 37 | | | | | | 0.94 | | | | | | 1.16 | | | | | | 3.83 | | | | | | 15 | |
| | | 15.43 | | | | | | (0.58 | ) | | | | | 2,357 | | | | | | 0.54 | | | | | | 0.75 | | | | | | 4.23 | | | | | | 15 | |
| | | 16.16 | | | | | | 6.51 | | | | | | 204,892 | | | | | | 0.78 | | | | | | 0.98 | | | | | | 3.78 | | | | | | 16 | |
| | | 16.16 | | | | | | 5.72 | | | | | | 27,047 | | | | | | 1.53 | | | | | | 1.73 | | | | | | 3.03 | | | | | | 16 | |
| | | 16.16 | | | | | | 6.93 | | | | | | 385,480 | | | | | | 0.44 | | | | | | 0.64 | | | | | | 4.10 | | | | | | 16 | |
| | | 16.24 | | | | | | 6.31 | | | | | | 42 | | | | | | 0.94 | | | | | | 1.15 | | | | | | 3.63 | | | | | | 16 | |
| | | 16.14 | | | | | | 6.77 | | | | | | 3,544 | | | | | | 0.53 | | | | | | 0.73 | | | | | | 3.97 | | | | | | 16 | |
| | |
| The accompanying notes are an integral part of these financial statements. | | 97 |
GOLDMAN SACHS HIGH YIELD MUNICIPAL FUND
Financial Highlights
Selected Data for a Share Outstanding Throughout Each Period
| | | | | | | | | | | | | | | | | | | | | | |
| | | | | | | | Income (loss) from
investment operations | | | | |
| | | Year - Share Class | | Net asset
value,
beginning
of period | | | Net
investment
income(a) | | | Net realized
and unrealized
gain (loss) | | | Total from
investment
operations | | | Distributions
to shareholders
from net
investment
income | |
| | FOR THE SIX MONTHS ENDED SEPTEMBER 30, (UNAUDITED) | |
| | 2017 - A | | $ | 9.35 | | | $ | 0.19 | | | $ | 0.21 | | | $ | 0.40 | | | $ | (0.18 | ) |
| | 2017 - C | | | 9.35 | | | | 0.16 | | | | 0.21 | | | | 0.37 | | | | (0.15 | ) |
| | 2017 - Institutional | | | 9.36 | | | | 0.20 | | | | 0.21 | | | | 0.41 | | | | (0.20 | ) |
| | 2017 - Investor(e) | | | 9.37 | | | | 0.20 | | | | 0.21 | | | | 0.41 | | | | (0.20 | ) |
| | | | | | | | | | | | | | | | | | | | | | |
| | FOR THE FISCAL YEARS ENDED MARCH 31, | |
| | 2017 - A | | | 9.36 | | | | 0.47 | | | | (0.06 | ) | | | 0.41 | | | | (0.42 | ) |
| | 2017 - C | | | 9.36 | | | | 0.40 | | | | (0.06 | ) | | | 0.34 | | | | (0.35 | ) |
| | 2017 - Institutional | | | 9.36 | | | | 0.49 | | | | (0.04 | ) | | | 0.45 | | | | (0.45 | ) |
| | 2017 - Investor(e) | | | 9.37 | | | | 0.50 | | | | (0.05 | ) | | | 0.45 | | | | (0.45 | ) |
| | 2016 - A | | | 9.34 | | | | 0.46 | | | | (0.02 | ) | | | 0.44 | | | | (0.42 | ) |
| | 2016 - C | | | 9.34 | | | | 0.39 | | | | (0.02 | ) | | | 0.37 | | | | (0.35 | ) |
| | 2016 - Institutional | | | 9.34 | | | | 0.48 | | | | (0.01 | ) | | | 0.47 | | | | (0.45 | ) |
| | 2016 - Investor(e) | | | 9.35 | | | | 0.48 | | | | (0.01 | ) | | | 0.47 | | | | (0.45 | ) |
| | 2015 - A | | | 8.93 | | | | 0.45 | | | | 0.38 | | | | 0.83 | | | | (0.42 | ) |
| | 2015 - C | | | 8.93 | | | | 0.38 | | | | 0.39 | | | | 0.77 | | | | (0.36 | ) |
| | 2015 - Institutional | | | 8.93 | | | | 0.48 | | | | 0.38 | | | | 0.86 | | | | (0.45 | ) |
| | 2015 - Investor(e) | | | 8.93 | | | | 0.48 | | | | 0.39 | | | | 0.87 | | | | (0.45 | ) |
| | 2014 - A | | | 9.51 | | | | 0.44 | | | | (0.60 | ) | | | (0.16 | ) | | | (0.42 | ) |
| | 2014 - C | | | 9.51 | | | | 0.37 | | | | (0.59 | ) | | | (0.22 | ) | | | (0.36 | ) |
| | 2014 - Institutional | | | 9.52 | | | | 0.47 | | | | (0.61 | ) | | | (0.14 | ) | | | (0.45 | ) |
| | 2014 - Investor(e) | | | 9.51 | | | | 0.47 | | | | (0.61 | ) | | | (0.14 | ) | | | (0.44 | ) |
| | 2013 - A | | | 8.90 | | | | 0.43 | | | | 0.59 | | | | 1.02 | | | | (0.41 | ) |
| | 2013 - C | | | 8.90 | | | | 0.36 | | | | 0.59 | | | | 0.95 | | | | (0.34 | ) |
| | 2013 - Institutional | | | 8.91 | | | | 0.46 | | | | 0.59 | | | | 1.05 | | | | (0.44 | ) |
| | 2013 - Investor(e) | | | 8.91 | | | | 0.45 | | | | 0.58 | | | | 1.03 | | | | (0.43 | ) |
| | (a) | | Calculated based on the average shares outstanding methodology. |
| | (b) | | Assumes investment at the net asset value at the beginning of the period, reinvestment of all distributions, a complete redemption of the investment at the net asset value at the end of the period and no sales or redemption charges. Total returns would be reduced if a sales or redemption charge was taken into account. Returns do not reflect the impact of taxes to shareholders relating to Fund distributions or the redemption of Fund shares. Total returns for periods less than one full year are not annualized. |
| | (c) | | The Fund’s portfolio turnover rate is calculated in accordance with regulatory requirements, without regard to transactions involving short term investments and certain derivatives. If such transactions were included, the Fund’s portfolio turnover rate may be higher. |
| | (e) | | Effective August 15, 2017, Class IR changed its name to Investor. |
| | |
| 98 | | The accompanying notes are an integral part of these financial statements. |
GOLDMAN SACHS HIGH YIELD MUNICIPAL FUND
| | | | | | | | | | | | | | | | | | | | | | | | | | | | | | | | | | | | | | | | |
| | | | | | | | | | | | | |
| | | Net asset
value, end
of period | | | | | Total
return(b) | | | | | Net assets,
end of
period
(in 000s) | | | | | Ratio of
net expenses
to average
net assets | | | | | Ratio of
total expenses
to average
net assets | | | | | Ratio of
net investment
income
to average
net assets | | | | | Portfolio
turnover
rate(c) | |
| | | | | | | | | | | | | | | | | | | | | | | | | | | | | | | | | | | | | | | | |
| | $ | 9.57 | | | | | | 4.34 | % | | | | $ | 237,063 | | | | | | 0.85 | %(d) | | | | | 0.92 | %(d) | | | | | 4.02 | %(d) | | | | | 4 | % |
| | | 9.57 | | | | | | 3.95 | | | | | | 61,640 | | | | | | 1.60 | (d) | | | | | 1.67 | (d) | | | | | 3.27 | (d) | | | | | 4 | |
| | | 9.57 | | | | | | 4.39 | | | | | | 4,911,753 | | | | | | 0.56 | (d) | | | | | 0.58 | (d) | | | | | 4.30 | (d) | | | | | 4 | |
| | | 9.58 | | | | | | 4.36 | | | | | | 46,636 | | | | | | 0.60 | (d) | | | | | 0.67 | (d) | | | | | 4.27 | (d) | | | | | 4 | |
| | | | | | | | | | | | | | | | | | | | | | | | | | | | | | | | | | | | | | | | |
| | | | | | | | | | | | | | | | | | | | | | | | | | | | | | | | | | | | | | | | |
| | | 9.35 | | | | | | 4.48 | | | | | | 234,550 | | | | | | 0.85 | | | | | | 0.92 | | | | | | 4.93 | | | | | | 31 | |
| | | 9.35 | | | | | | 3.70 | | | | | | 66,772 | | | | | | 1.60 | | | | | | 1.67 | | | | | | 4.18 | | | | | | 31 | |
| | | 9.36 | | | | | | 4.88 | | | | | | 4,284,703 | | | | | | 0.56 | | | | | | 0.58 | | | | | | 5.23 | | | | | | 31 | |
| | | 9.37 | | | | | | 4.81 | | | | | | 42,152 | | | | | | 0.60 | | | | | | 0.67 | | | | | | 5.25 | | | | | | 31 | |
| | | 9.36 | | | | | | 4.89 | | | | | | 262,193 | | | | | | 0.86 | | | | | | 0.93 | | | | | | 4.98 | | | | | | 11 | |
| | | 9.36 | | | | | | 4.11 | | | | | | 73,498 | | | | | | 1.62 | | | | | | 1.68 | | | | | | 4.24 | | | | | | 11 | |
| | | 9.36 | | | | | | 5.19 | | | | | | 3,754,010 | | | | | | 0.57 | | | | | | 0.59 | | | | | | 5.25 | | | | | | 11 | |
| | | 9.37 | | | | | | 5.15 | | | | | | 20,741 | | | | | | 0.61 | | | | | | 0.68 | | | | | | 5.22 | | | | | | 11 | |
| | | 9.34 | | | | | | 9.47 | | | | | | 257,803 | | | | | | 0.86 | | | | | | 0.93 | | | | | | 4.89 | | | | | | 14 | |
| | | 9.34 | | | | | | 8.66 | | | | | | 81,018 | | | | | | 1.61 | | | | | | 1.68 | | | | | | 4.14 | | | | | | 14 | |
| | | 9.34 | | | | | | 9.79 | | | | | | 3,005,752 | | | | | | 0.57 | | | | | | 0.59 | | | | | | 5.18 | | | | | | 14 | |
| | | 9.35 | | | | | | 9.86 | | | | | | 17,265 | | | | | | 0.61 | | | | | | 0.68 | | | | | | 5.13 | | | | | | 14 | |
| | | 8.93 | | | | | | (1.52 | ) | | | | | 255,002 | | | | | | 0.87 | | | | | | 0.93 | | | | | | 4.94 | | | | | | 25 | |
| | | 8.93 | | | | | | (2.25 | ) | | | | | 75,433 | | | | | | 1.62 | | | | | | 1.68 | | | | | | 4.19 | | | | | | 25 | |
| | | 8.93 | | | | | | (1.34 | ) | | | | | 2,584,691 | | | | | | 0.58 | | | | | | 0.59 | | | | | | 5.23 | | | | | | 25 | |
| | | 8.93 | | | | | | (1.28 | ) | | | | | 12,703 | | | | | | 0.62 | | | | | | 0.69 | | | | | | 5.31 | | | | | | 25 | |
| | | 9.51 | | | | | | 11.64 | | | | | | 347,693 | | | | | | 0.86 | | | | | | 0.92 | | | | | | 4.62 | | | | | | 19 | |
| | | 9.51 | | | | | | 10.82 | | | | | | 108,291 | | | | | | 1.61 | | | | | | 1.67 | | | | | | 3.87 | | | | | | 19 | |
| | | 9.52 | | | | | | 11.95 | | | | | | 3,425,590 | | | | | | 0.57 | | | | | | 0.58 | | | | | | 4.90 | | | | | | 19 | |
| | | 9.51 | | | | | | 11.79 | | | | | | 7,134 | | | | | | 0.61 | | | | | | 0.67 | | | | | | 4.82 | | | | | | 19 | |
| | |
| The accompanying notes are an integral part of these financial statements. | | 99 |
GOLDMAN SACHS SHORT DURATION TAX-FREE FUND
Financial Highlights
Selected Data for a Share Outstanding Throughout Each Period
| | | | | | | | | | | | | | | | | | | | | | | | | | | | | | |
| | | | | | | | Income (loss) from
investment operations | | | Distributions
to shareholders | |
| | | Year - Share Class | |
Net asset
value,
beginning
of period | | | Net
investment
income(a) | | | Net realized
and unrealized
gain (loss) | | | Total from
investment
operations | | | From net
investment
income | | | From net
realized
gains | | | Total
distributions | |
| | FOR THE SIX MONTHS ENDED SEPTEMBER 30, (UNAUDITED) | |
| | 2017 - A | | $ | 10.52 | | | $ | 0.06 | | | $ | 0.05 | | | $ | 0.11 | | | $ | (0.06 | ) | | $ | — | | | $ | (0.06 | ) |
| | 2017 - C | | | 10.51 | | | | 0.04 | | | | 0.05 | | | | 0.09 | | | | (0.04 | ) | | | — | | | | (0.04 | ) |
| | 2017 - Institutional | | | 10.50 | | | | 0.08 | | | | 0.05 | | | | 0.13 | | | | (0.07 | ) | | | — | | | | (0.07 | ) |
| | 2017 - Service | | | 10.50 | | | | 0.05 | | | | 0.06 | | | | 0.11 | | | | (0.05 | ) | | | — | | | | (0.05 | ) |
| | 2017 - Investor(e) | | | 10.51 | | | | 0.08 | | | | 0.04 | | | | 0.12 | | | | (0.07 | ) | | | — | | | | (0.07 | ) |
| | | | | | | | | | | | | | | | | | | | | | | | | | | | | | |
| | FOR THE FISCAL YEARS ENDED MARCH 31, | |
| | 2017 - A | | | 10.56 | | | | 0.12 | | | | (0.05 | ) | | | 0.07 | | | | (0.11 | ) | | | — | (f) | | | (0.11 | ) |
| | 2017 - C | | | 10.55 | | | | 0.07 | | | | (0.05 | ) | | | 0.02 | | | | (0.06 | ) | | | — | (f) | | | (0.06 | ) |
| | 2017 - Institutional | | | 10.54 | | | | 0.15 | | | | (0.05 | ) | | | 0.10 | | | | (0.14 | ) | | | — | (f) | | | (0.14 | ) |
| | 2017 - Service | | | 10.54 | | | | 0.10 | | | | (0.05 | ) | | | 0.05 | | | | (0.09 | ) | | | — | (f) | | | (0.09 | ) |
| | 2017 - Investor(e) | | | 10.55 | | | | 0.14 | | | | (0.05 | ) | | | 0.09 | | | | (0.13 | ) | | | — | (f) | | | (0.13 | ) |
| | 2016 - A | | | 10.59 | | | | 0.10 | | | | (0.04 | ) | | | 0.06 | | | | (0.09 | ) | | | — | (f) | | | (0.09 | ) |
| | 2016 - C | | | 10.58 | | | | 0.06 | | | | (0.04 | ) | | | 0.02 | | | | (0.05 | ) | | | — | (f) | | | (0.05 | ) |
| | 2016 - Institutional | | | 10.58 | | | | 0.14 | | | | (0.05 | ) | | | 0.09 | | | | (0.13 | ) | | | — | (f) | | | (0.13 | ) |
| | 2016 - Service | | | 10.58 | | | | 0.09 | | | | (0.05 | ) | | | 0.04 | | | | (0.08 | ) | | | — | (f) | | | (0.08 | ) |
| | 2016 - Investor(e) | | | 10.58 | | | | 0.13 | | | | (0.04 | ) | | | 0.09 | | | | (0.12 | ) | | | — | (f) | | | (0.12 | ) |
| | 2015 - A | | | 10.57 | | | | 0.10 | | | | 0.01 | | | | 0.11 | | | | (0.09 | ) | | | — | (f) | | | (0.09 | ) |
| | 2015 - C | | | 10.55 | | | | 0.05 | | | | 0.02 | | | | 0.07 | | | | (0.04 | ) | | | — | (f) | | | (0.04 | ) |
| | 2015 - Institutional | | | 10.55 | | | | 0.13 | | | | 0.02 | | | | 0.15 | | | | (0.12 | ) | | | — | (f) | | | (0.12 | ) |
| | 2015 - Service | | | 10.55 | | | | 0.08 | | | | 0.02 | | | | 0.10 | | | | (0.07 | ) | | | — | (f) | | | (0.07 | ) |
| | 2015 - Investor(e) | | | 10.55 | | | | 0.12 | | | | 0.02 | | | | 0.14 | | | | (0.11 | ) | | | — | (f) | | | (0.11 | ) |
| | 2014 - A | | | 10.69 | | | | 0.10 | | | | (0.12 | ) | | | (0.02 | ) | | | (0.09 | ) | | | (0.01 | ) | | | (0.10 | ) |
| | 2014 - C | | | 10.68 | | | | 0.06 | | | | (0.13 | ) | | | (0.07 | ) | | | (0.05 | ) | | | (0.01 | ) | | | (0.06 | ) |
| | 2014 - Institutional | | | 10.68 | | | | 0.13 | | | | (0.13 | ) | | | — | (f) | | | (0.12 | ) | | | (0.01 | ) | | | (0.13 | ) |
| | 2014 - Service | | | 10.67 | | | | 0.08 | | | | (0.12 | ) | | | (0.04 | ) | | | (0.07 | ) | | | (0.01 | ) | | | (0.08 | ) |
| | 2014 - Investor(e) | | | 10.68 | | | | 0.13 | | | | (0.14 | ) | | | (0.01 | ) | | | (0.11 | ) | | | (0.01 | ) | | | (0.12 | ) |
| | 2013 - A | | | 10.62 | | | | 0.13 | | | | 0.07 | | | | 0.20 | | | | (0.13 | ) | | | — | | | | (0.13 | ) |
| | 2013 - C | | | 10.62 | | | | 0.08 | | | | 0.06 | | | | 0.14 | | | | (0.08 | ) | | | — | | | | (0.08 | ) |
| | 2013 - Institutional | | | 10.61 | | | | 0.16 | | | | 0.07 | | | | 0.23 | | | | (0.16 | ) | | | — | | | | (0.16 | ) |
| | 2013 - Service | | | 10.61 | | | | 0.12 | | | | 0.05 | | | | 0.17 | | | | (0.11 | ) | | | — | | | | (0.11 | ) |
| | 2013 - Investor(e) | | | 10.61 | | | | 0.15 | | | | 0.07 | | | | 0.22 | | | | (0.15 | ) | | | — | | | | (0.15 | ) |
| | (a) | | Calculated based on the average shares outstanding methodology. |
| | (b) | | Assumes investment at the net asset value at the beginning of the period, reinvestment of all distributions, a complete redemption of the investment at the net asset value at the end of the period and no sales or redemption charges. Total returns would be reduced if a sales or redemption charge was taken into account. Returns do not reflect the impact of taxes to shareholders relating to Fund distributions or the redemption of Fund shares. Total returns for periods less than one full year are not annualized. |
| | (c) | | The Fund’s portfolio turnover rate is calculated in accordance with regulatory requirements, without regard to transactions involving short term investments and certain derivatives. If such transactions were included, the Fund’s portfolio turnover rate may be higher. |
| | (e) | | Effective August 15, 2017, Class IR changed its name to Investor. |
| | (f) | | Amount is less than $0.005 per share. |
| | |
| 100 | | The accompanying notes are an integral part of these financial statements. |
GOLDMAN SACHS SHORT DURATION TAX-FREE FUND
| | | | | | | | | | | | | | | | | | | | | | | | | | | | | | | | | | | | | | | | |
| | | | | | | | | | | | | |
| | | Net asset
value, end
of period | | | | | Total
return(b) | | | | | Net assets,
end of
period
(in 000s) | | | | | Ratio of
net expenses
to average
net assets | | | | | Ratio of
total expenses
to average
net assets | | | | | Ratio of
net investment
income
to average
net assets | | | | | Portfolio
turnover
rate(c) | |
| | | | | | | | | | | | | | | | | | | | | | | | | | | | | | | | | | | | | | | | |
| | $ | 10.57 | | | | | | 1.03 | % | | | | $ | 101,654 | | | | | | 0.69 | %(d) | | | | | 0.76 | %(d) | | | | | 1.16 | %(d) | | | | | 11 | % |
| | | 10.56 | | | | | | 0.83 | | | | | | 21,642 | | | | | | 1.09 | (d) | | | | | 1.51 | (d) | | | | | 0.77 | (d) | | | | | 11 | |
| | | 10.56 | | | | | | 1.28 | | | | | | 4,880,674 | | | | | | 0.38 | (d) | | | | | 0.41 | (d) | | | | | 1.47 | (d) | | | | | 11 | |
| | | 10.56 | | | | | | 1.02 | | | | | | 294 | | | | | | 0.88 | (d) | | | | | 0.92 | (d) | | | | | 0.98 | (d) | | | | | 11 | |
| | | 10.56 | | | | | | 1.16 | | | | | | 15,204 | | | | | | 0.43 | (d) | | | | | 0.50 | (d) | | | | | 1.42 | (d) | | | | | 11 | |
| | | | | | | | | | | | | | | | | | | | | | | | | | | | | | | | | | | | | | | | |
| | | | | | | | | | | | | | | | | | | | | | | | | | | | | | | | | | | | | | | | |
| | | 10.52 | | | | | | 0.63 | | | | | | 124,586 | | | | | | 0.70 | | | | | | 0.76 | | | | | | 1.09 | | | | | | 40 | |
| | | 10.51 | | | | | | 0.23 | | | | | | 23,220 | | | | | | 1.10 | | | | | | 1.51 | | | | | | 0.69 | | | | | | 40 | |
| | | 10.50 | | | | | | 0.94 | | | | | | 4,448,309 | | | | | | 0.39 | | | | | | 0.42 | | | | | | 1.41 | | | | | | 40 | |
| | | 10.50 | | | | | | 0.44 | | | | | | 263 | | | | | | 0.89 | | | | | | 0.92 | | | | | | 0.91 | | | | | | 40 | |
| | | 10.51 | | | | | | 0.88 | | | | | | 10,002 | | | | | | 0.45 | | | | | | 0.51 | | | | | | 1.37 | | | | | | 40 | |
| | | 10.56 | | | | | | 0.62 | | | | | | 147,949 | | | | | | 0.73 | | | | | | 0.76 | | | | | | 0.98 | | | | | | 24 | |
| | | 10.55 | | | | | | 0.22 | | | | | | 33,787 | | | | | | 1.13 | | | | | | 1.51 | | | | | | 0.58 | | | | | | 24 | |
| | | 10.54 | | | | | | 0.86 | | | | | | 4,316,949 | | | | | | 0.39 | | | | | | 0.42 | | | | | | 1.32 | | | | | | 24 | |
| | | 10.54 | | | | | | 0.36 | | | | | | 161 | | | | | | 0.89 | | | | | | 0.92 | | | | | | 0.82 | | | | | | 24 | |
| | | 10.55 | | | | | | 0.87 | | | | | | 3,526 | | | | | | 0.48 | | | | | | 0.51 | | | | | | 1.23 | | | | | | 24 | |
| | | 10.59 | | | | | | 1.01 | | | | | | 189,890 | | | | | | 0.73 | | | | | | 0.76 | | | | | | 0.90 | | | | | | 24 | |
| | | 10.58 | | | | | | 0.71 | | | | | | 35,443 | | | | | | 1.13 | | | | | | 1.51 | | | | | | 0.50 | | | | | | 24 | |
| | | 10.58 | | | | | | 1.45 | | | | | | 4,100,431 | | | | | | 0.39 | | | | | | 0.41 | | | | | | 1.23 | | | | | | 24 | |
| | | 10.58 | | | | | | 0.96 | | | | | | 60 | | | | | | 0.89 | | | | | | 0.92 | | | | | | 0.76 | | | | | | 24 | |
| | | 10.58 | | | | | | 1.36 | | | | | | 3,661 | | | | | | 0.48 | | | | | | 0.51 | | | | | | 1.16 | | | | | | 24 | |
| | | 10.57 | | | | | | (0.24 | ) | | | | | 231,329 | | | | | | 0.73 | | | | | | 0.76 | | | | | | 0.93 | | | | | | 17 | |
| | | 10.55 | | | | | | (0.73 | ) | | | | | 43,189 | | | | | | 1.13 | | | | | | 1.51 | | | | | | 0.53 | | | | | | 17 | |
| | | 10.55 | | | | | | 0.01 | | | | | | 3,745,916 | | | | | | 0.39 | | | | | | 0.42 | | | | | | 1.27 | | | | | | 17 | |
| | | 10.55 | | | | | | (0.40 | ) | | | | | 306 | | | | | | 0.89 | | | | | | 0.92 | | | | | | 0.79 | | | | | | 17 | |
| | | 10.55 | | | | | | (0.08 | ) | | | | | 9,554 | | | | | | 0.48 | | | | | | 0.51 | | | | | | 1.19 | | | | | | 17 | |
| | | 10.69 | | | | | | 1.85 | | | | | | 327,845 | | | | | | 0.73 | | | | | | 0.76 | | | | | | 1.26 | | | | | | 28 | |
| | | 10.68 | | | | | | 1.35 | | | | | | 57,257 | | | | | | 1.13 | | | | | | 1.50 | | | | | | 0.79 | | | | | | 28 | |
| | | 10.68 | | | | | | 2.20 | | | | | | 4,266,884 | | | | | | 0.39 | | | | | | 0.42 | | | | | | 1.48 | | | | | | 28 | |
| | | 10.67 | | | | | | 1.60 | | | | | | 1,320 | | | | | | 0.89 | | | | | | 0.92 | | | | | | 1.15 | | | | | | 28 | |
| | | 10.68 | | | | | | 2.11 | | | | | | 18,362 | | | | | | 0.48 | | | | | | 0.50 | | | | | | 1.41 | | | | | | 28 | |
| | |
| The accompanying notes are an integral part of these financial statements. | | 101 |
GOLDMAN SACHS MUNICIPAL FIXED INCOME FUNDS
Notes to Financial Statements
September 30, 2017 (Unaudited)
Goldman Sachs Trust (the “Trust”) is a Delaware statutory trust registered under the Investment Company Act of 1940, as amended (the “Act”), as an open-end management investment company. The following table lists those series of the Trust that are included in this report (collectively, the “Funds” or individually a “Fund”), along with their corresponding share classes and respective diversification status under the Act:
| | | | |
| Fund | | Share Classes Offered | | Diversified/
Non-diversified |
Dynamic Municipal Income,
Short Duration Tax-Free | | A, C, Institutional, Service and Investor(a) | | Diversified |
High Yield Municipal | | A, C, Institutional and Investor(a) | | Diversified |
| (a) | | Effective August 15, 2017, Class IR changed its name to Investor. |
Class A Shares of the Dynamic Municipal Income, High Yield Municipal and Short Duration Tax-Free Funds are sold with a front-end sales charge of up to 3.75%, 4.50% and 1.50%, respectively. Class C Shares of Dynamic Municipal Income, High Yield Municipal and Short Duration Tax-Free Funds are sold with a contingent deferred sales charge (“CDSC”) of 1.00%, 1.00% and 0.65%, respectively, which is imposed on redemptions made within 12 months of purchase. Institutional, Service and Investor Shares are not subject to a sales charge.
Goldman Sachs Asset Management, L.P. (“GSAM”), an affiliate of Goldman Sachs & Co. LLC (formerly, Goldman, Sachs & Co.) (“Goldman Sachs”), serves as investment adviser to the Funds pursuant to management agreements (the “Agreements”) with the Trust.
|
| 2. SIGNIFICANT ACCOUNTING POLICIES |
The financial statements have been prepared in accordance with accounting principles generally accepted in the United States of America (“GAAP”) and require management to make estimates and assumptions that may affect the reported amounts and disclosures. Actual results may differ from those estimates and assumptions.
A. Investment Valuation — The Funds’ valuation policy is to value investments at fair value.
B. Investment Income and Investments — Investment income includes interest income, dividend income, and securities lending income. Interest income is accrued daily and adjusted for amortization of premiums and accretion of discounts. Dividend income is recognized on ex-dividend date or, for certain foreign securities, as soon as such information is obtained subsequent to the ex-dividend date. Investment transactions are reflected on trade date. Realized gains and losses are calculated using identified cost. Investment transactions are recorded on the following business day for daily net asset value (“NAV”) calculations.
For derivative contracts, realized gains and losses are recorded upon settlement of the contract. Upfront payments, if any, are made or received upon entering into a swap agreement and are reflected in the Statements of Assets and Liabilities. Upfront payments are recognized over the contract’s term/event as realized gains or losses, with the exception of forward starting interest rate swaps whose realized gains or losses are recognized from the effective start date. For securities with paydown provisions, principal payments received are treated as a proportionate reduction to the cost basis of the securities, and excess or shortfall amounts are recorded as income. For treasury inflation protected securities (“TIPS”), adjustments to principal due to inflation/deflation are reflected as increases/decreases to interest income with a corresponding adjustment to cost.
C. Class Allocations and Expenses — Investment income, realized and unrealized gain (loss), if any, and non-class specific expenses of each Fund are allocated daily based upon the proportion of net assets of each class. Non-class specific expenses directly incurred by a Fund are charged to that Fund, while such expenses incurred by the Trust are allocated across the applicable Funds on a straight-line and/or pro-rata basis depending upon the nature of the expenses. Class specific expenses, where applicable, are borne by the respective share classes and include Distribution and Service, Transfer Agency and Service and Shareholder Administration fees.
102
GOLDMAN SACHS MUNICIPAL FIXED INCOME FUNDS
|
| 2. SIGNIFICANT ACCOUNTING POLICIES (continued) |
D. Redemption Fees — A 2% redemption fee is imposed on the redemption of shares (including by exchange) of the High Yield Municipal Fund held for 60 calendar days or less. For this purpose, the High Yield Municipal Fund uses a first-in first-out method so that shares held longest will be treated as being redeemed first and shares held shortest will be treated as being redeemed last. Redemption fees are reimbursed to the Fund and are reflected as a reduction in share redemptions. Redemption fees are credited to Paid-in Capital and are allocated to each share class of the Fund on a pro-rata basis.
E. Federal Taxes and Distributions to Shareholders — It is each Fund’s policy to comply with the requirements of the Internal Revenue Code of 1986, as amended (the “Code”), applicable to regulated investment companies (mutual funds) and to distribute each year substantially all of its investment company taxable income and capital gains to its shareholders. Accordingly, each Fund is not required to make any provisions for the payment of federal income tax. Distributions to shareholders are recorded on the ex-dividend date. Income distributions, if any, are declared daily and paid monthly, and capital gains distributions, if any, are declared and paid annually.
Net capital losses, if any, are carried forward to future fiscal years and may be used to the extent allowed by the Code to offset any future capital gains. Losses that are carried forward will retain their character as either short-term or long-term capital losses. Utilization of capital loss carryforwards will reduce the requirement of future capital gains distributions.
The characterization of distributions to shareholders for financial reporting purposes is determined in accordance with federal income tax rules, which may differ from GAAP. The source of each Fund’s distributions may be shown in the accompanying financial statements as either from net investment income, net realized gain or capital. Certain components of the Funds’ net assets on the Statements of Assets and Liabilities reflect permanent GAAP/tax differences based on the appropriate tax character.
|
| 3. INVESTMENTS AND FAIR VALUE MEASUREMENTS |
U.S. GAAP defines the fair value of a financial instrument as the amount that would be received to sell an asset or paid to transfer a liability in an orderly transaction between market participants at the measurement date (i.e., the exit price); the Funds’ policy is to use the market approach. GAAP establishes a fair value hierarchy that prioritizes the inputs to valuation techniques used to measure fair value. The hierarchy gives the highest priority to unadjusted quoted prices in active markets for identical assets or liabilities (Level 1 measurements) and the lowest priority to unobservable inputs (Level 3 measurements). The levels used for classifying investments are not necessarily an indication of the risk associated with investing in these investments. The three levels of the fair value hierarchy are described below:
Level 1 — Unadjusted quoted prices in active markets that are accessible at the measurement date for identical, unrestricted assets or liabilities;
Level 2 — Quoted prices in markets that are not active or financial instruments for which significant inputs are observable (including, but not limited to, quoted prices for similar investments, interest rates, foreign exchange rates, volatility and credit spreads), either directly or indirectly;
Level 3 — Prices or valuations that require significant unobservable inputs (including GSAM’s assumptions in determining fair value measurement).
Changes in valuation techniques may result in transfers into or out of an assigned level within the hierarchy. In accordance with the Funds’ policy, transfers between different levels of the fair value hierarchy resulting from such changes are deemed to have occurred as of the beginning of the reporting period.
The Board of Trustees (“Trustees”) has approved Valuation Procedures that govern the valuation of the portfolio investments held by the Funds, including investments for which market quotations are not readily available. The Trustees have delegated to GSAM day-to-day responsibility for implementing and maintaining internal controls and procedures related to the valuation of the Funds’ investments. To assess the continuing appropriateness of pricing sources and methodologies, GSAM regularly performs price verification procedures and issues challenges as necessary to third party pricing vendors or brokers, and any differences are reviewed in accordance with the Valuation Procedures.
103
GOLDMAN SACHS MUNICIPAL FIXED INCOME FUNDS
Notes to Financial Statements (continued)
September 30, 2017 (Unaudited)
|
| 3. INVESTMENTS AND FAIR VALUE MEASUREMENTS (continued) |
A. Level 1 and Level 2 Fair Value Investments — The valuation techniques and significant inputs used in determining the fair values for investments classified as Level 1 and Level 2 are as follows:
Debt Securities — Debt securities for which market quotations are readily available are valued daily on the basis of quotations supplied by dealers or an independent pricing service approved by the Trustees. The pricing services may use valuation models or matrix pricing, which consider: (i) yield or price with respect to bonds that are considered comparable in characteristics such as rating, interest rate and maturity date or (ii) quotations from securities dealers to determine current value. With the exception of treasury securities of G8 countries, which are generally classified as Level 1, these investments are generally classified as Level 2 of the fair value hierarchy.
i. Inverse Floaters — The interest rate on inverse floating rate securities (“inverse floaters”) resets in the opposite direction from the market rate of interest to which the inverse floaters are indexed. An inverse floater may be considered to be leveraged to the extent that its interest rate varies by a magnitude that exceeds the magnitude of the change in the index rate of interest. The higher the degree of leverage of an inverse floater, the greater the volatility of its market value.
ii. When-Issued Securities and Forward Commitments — When-issued securities, including TBA (“To Be Announced”) securities, are securities that are authorized but not yet issued in the market and purchased in order to secure what is considered to be an advantageous price or yield to a Fund. A forward commitment involves entering into a contract to purchase or sell securities, typically on an extended settlement basis, for a fixed price at a future date. The purchase of securities on a when-issued or forward commitment basis involves a risk of loss if the value of the security to be purchased declines before the settlement date. Conversely, the sale of securities on a forward commitment basis involves the risk that the value of the securities sold may increase before the settlement date. Although a Fund will generally purchase securities on a when-issued or forward commitment basis with the intention of acquiring the securities for its portfolio, the Fund may dispose of when-issued securities or forward commitments prior to settlement, which may result in a realized gain or loss.
Derivative Contracts — A derivative is an instrument whose value is derived from underlying assets, indices, reference rates or a combination of these factors. A Fund enters into derivative transactions to hedge against changes in interest rates, securities prices, and/or currency exchange rates, to increase total return, or to gain access to certain markets or attain exposure to other underliers.
Exchange-traded derivatives, including futures and options contracts, are valued at the last sale or settlement price and typically fall within Level 1 of the fair value hierarchy. Over-the-counter (“OTC”) and centrally cleared derivatives are valued using market transactions and other market evidence, including market-based inputs to models, calibration to market-clearing transactions, broker or dealer quotations, or other alternative pricing sources. Where models are used, the selection of a particular model to value OTC and centrally cleared derivatives depends upon the contractual terms of, and specific risks inherent in, the instrument, as well as the availability of pricing information in the market. Valuation models require a variety of inputs, including contractual terms, market prices, yield curves, credit curves, measures of volatility, voluntary and involuntary prepayment rates, loss severity rates and correlations of such inputs. For OTC and centrally cleared derivatives that trade in liquid markets, model inputs can generally be verified and model selection does not involve significant management judgment. OTC and centrally cleared derivatives are classified within Level 2 of the fair value hierarchy when significant inputs are corroborated by market evidence.
i. Futures Contracts — Futures contracts are contracts to buy or sell a standardized quantity of a specified commodity or security and are valued based on exchanged settlement prices or independent market quotes. Futures contracts are valued at the last settlement price, or in the absence of a sale, the last bid price for long positions and at the last ask price for short positions, at the end of each day on the board of trade or exchange upon which they are traded. Upon entering into a futures contract, a Fund deposits cash or securities in an account on behalf of the broker in an amount sufficient to meet the initial margin requirement. Subsequent payments are made or received by a Fund equal to the daily change in the contract value and are recorded as variation margin receivable or payable with a corresponding offset to unrealized gains or losses. For financial reporting purposes, cash collateral that has been pledged to cover obligations of a Fund and cash collateral received, if any, is reported separately on the Statements of Assets and Liabilities as receivables/payables for collateral on certain derivative contracts. Non-cash collateral pledged by a Fund, if any, is noted in the Schedules of Investments.
104
GOLDMAN SACHS MUNICIPAL FIXED INCOME FUNDS
|
| 3. INVESTMENTS AND FAIR VALUE MEASUREMENTS (continued) |
ii. Swap Contracts — Bilateral swap contracts are agreements in which a Fund and a counterparty agree to exchange periodic payments on a specified notional amount or make a net payment upon termination. Bilateral swap transactions are privately negotiated in the OTC market and payments are settled through direct payments between a Fund and the counterparty. By contrast, certain swap transactions are subject to mandatory central clearing. These swaps are executed through a derivatives clearing member (“DCM”), acting in an agency capacity, and submitted to a central counterparty (“CCP”) (“centrally cleared swaps”), in which case all payments are settled with the CCP through the DCM. Swaps are marked-to-market daily using pricing vendor quotations, counterparty or clearinghouse prices or model prices, and the change in value, if any, is recorded as an unrealized gain or loss. Upon entering into a swap contract, a Fund is required to satisfy an initial margin requirement by delivering cash or securities to the counterparty (or in some cases, segregated in a triparty account on behalf of the counterparty), which can be adjusted by any mark-to-market gains or losses pursuant to bilateral or centrally cleared arrangements. For centrally cleared swaps the daily change in valuation, if any, is recorded as a receivable or payable for variation margin.
An interest rate swap is an agreement that obligates two parties to exchange a series of cash flows at specified intervals, based upon or calculated by reference to changes in interest rates on a specified notional principal amount. The payment flows are usually netted against each other, with the difference being paid by one party to the other.
A credit default swap is an agreement that involves one party (the buyer of protection) making a stream of payments to another party (the seller of protection) in exchange for the right to receive protection on a reference security or obligation, including a group of assets or exposure to the performance of an index. A Fund’s investment in credit default swaps may involve greater risks than if the Fund had invested in the referenced obligation directly. Credit events are contract specific but may include bankruptcy, failure to pay, restructuring and obligation acceleration. If a Fund buys protection through a credit default swap and no credit event occurs, its payments are limited to the periodic payments previously made to the counterparty. Upon the occurrence of a specified credit event, a Fund, as a buyer of credit protection, is entitled to receive an amount equal to the notional amount of the swap and deliver to the seller the defaulted reference obligation in a physically settled trade. A Fund may also receive a net settlement amount in the form of cash or securities equal to the notional amount of the swap reduced by the recovery value of the reference obligation in a cash settled trade.
As a seller of protection, a Fund generally receives a payment stream throughout the term of the swap, provided that there is no credit event. In addition, if a Fund sells protection through a credit default swap, a Fund could suffer a loss because the value of the referenced obligation and the premium payments received may be less than the notional amount of the swap paid to the buyer of protection. Upon the occurrence of a specified credit event, a Fund, as a seller of credit protection, may be required to take possession of the defaulted reference obligation and pay the buyer an amount equal to the notional amount of the swap in a physically settled trade. A Fund may also pay a net settlement amount in the form of cash or securities equal to the notional amount of the swap reduced by the recovery value of the reference obligation in a cash settled trade. Recovery values are at times established through the credit event auction process in which market participants are ensured that a transparent price has been set for the defaulted security or obligation. In addition, a Fund is entitled to a return of any assets, which have been pledged as collateral to the counterparty upon settlement.
The maximum potential amount of future payments (undiscounted) that a Fund as seller of protection could be required to make under a credit default swap would be an amount equal to the notional amount of the agreement. These potential amounts would be partially offset by any recovery values of the respective referenced obligations or net amounts received from a settlement of a credit default swap for the same reference security or obligation where a Fund bought credit protection.
B. Level 3 Fair Value Investments — To the extent that significant inputs to valuation models and other alternative pricing sources are unobservable, or if quotations are not readily available, or if GSAM believes that such quotations do not accurately reflect fair value, the fair value of a Fund’s investments may be determined under Valuation Procedures approved by the Trustees. GSAM, consistent with its procedures and applicable regulatory guidance, may make an adjustment to the most recent valuation prices of either domestic or foreign securities in light of significant events to reflect what it believes to be the fair value of the securities at the time of determining a Fund’s NAV. Significant events which could affect a large number of securities in a particular market may include, but are not limited to: significant fluctuations in United States (“U.S.”) or foreign markets; market
105
GOLDMAN SACHS MUNICIPAL FIXED INCOME FUNDS
Notes to Financial Statements (continued)
September 30, 2017 (Unaudited)
|
| 3. INVESTMENTS AND FAIR VALUE MEASUREMENTS (continued) |
dislocations; market disruptions; or unscheduled market closings. Significant events which could also affect a single issuer may include, but are not limited to: corporate actions such as reorganizations, mergers and buy-outs; ratings downgrades; and bankruptcies.
C. Fair Value Hierarchy — The following is a summary of the Funds’ investments and derivatives classified in the fair value hierarchy as of September 30, 2017:
| | | | | | | | | | | | |
| | | |
| DYNAMIC MUNICIPAL INCOME | | | | | | | | | | | | |
| | | |
| Investment Type | | Level 1 | | | Level 2 | | | Level 3 | |
| Assets | | | | | | | | | | | | |
Municipal Debt Obligations | | $ | — | | | $ | 1,387,878,737 | | | $ | — | |
| | | |
| Derivative Type | | | | | | | | | |
| Assets(a) | | | | | | | | | | | | |
Credit Default Swap Contracts | | $ | — | | | $ | 107,243 | | | $ | — | |
Futures Contracts | | | 139,111 | | | | — | | | | — | |
Interest Rate Swap Contracts | | | — | | | | 4,188,967 | | | | — | |
| Total | | $ | 139,111 | | | $ | 4,296,210 | | | $ | — | |
| | | |
| HIGH YIELD MUNICIPAL | | | | | | | | | | | | |
| | | |
| Investment Type | | Level 1 | | | Level 2 | | | Level 3 | |
| Assets | | | | | | | | | | | | |
Municipal Debt Obligations | | $ | — | | | $ | 5,115,443,600 | | | $ | — | |
| | | |
| Derivative Type | | | | | | | | | |
| Assets(a) | | | | | | | | | | | | |
Credit Default Swap Contracts | | $ | — | | | $ | 2,427,422 | | | $ | — | |
Interest Rate Swap Contracts | | | — | | | | 22,225,571 | | | | — | |
| Total | | $ | — | | | $ | 24,652,993 | | | $ | — | |
| Liabilities(a) | | | | | | | | | | | | |
Credit Default Swap Contracts | | $ | — | | | $ | (460,644 | ) | | $ | — | |
| | | |
| SHORT DURATION TAX-FREE | | | | | | | | | | | | |
| | | |
| Investment Type | | Level 1 | | | Level 2 | | | Level 3 | |
| Assets | | | | | | | | | | | | |
Municipal Debt Obligations | | $ | — | | | $ | 5,102,657,265 | | | $ | — | |
| | | |
| Derivative Type | | | | | | | | | |
| Assets(a) | | | | | | | | | | | | |
Credit Default Swap Contracts | | $ | — | | | $ | 804,323 | | | $ | — | |
| (a) | | Amount shown represents unrealized gain (loss) at period end. |
106
GOLDMAN SACHS MUNICIPAL FIXED INCOME FUNDS
|
| 3. INVESTMENTS AND FAIR VALUE MEASUREMENTS (continued) |
For further information regarding security characteristics, see the Schedules of Investments.
|
| 4. INVESTMENTS IN DERIVATIVES |
The following tables set forth, by certain risk types, the gross value of derivative contracts as of September 30, 2017. These instruments were used as part of the Funds’ investment strategies and to obtain and/or manage exposure related to the risks below. The values in the tables below exclude the effects of cash collateral received or posted pursuant to these derivative contracts, and therefore are not representative of the Funds’ net exposure.
| | | | | | | | | | | | |
| | | |
| DYNAMIC MUNICIPAL INCOME | | | | | | | | | | |
| Risk | | Statements of Assets
and Liabilities | | Assets | | | Statements of Assets
and Liabilities | | Liabilities | |
Credit | | Receivable for unrealized gain on swap contracts | | $ | 107,243 | | | — | | $ | — | |
Interest Rate | | Variation margin on certain derivative contracts | | | 4,328,078 | (a) | | — | | | — | |
| Total | | | | $ | 4,435,321 | | | | | $ | — | |
| | | |
| HIGH YIELD MUNICIPAL | | | | | | | | | | |
| Risk | | Statements of Assets
and Liabilities | | Assets | | | Statements of Assets
and Liabilities | | Liabilities | |
Credit | | Receivable for unrealized gain on swap contracts | | $ | 2,427,422 | | | Payable for unrealized loss on swap contracts | | $ | (460,644 | )(b) |
Interest Rate | | Variation margin on certain derivative contracts | | | 22,225,571 | (a) | | — | | | — | |
| Total | | | | $ | 24,652,993 | | | | | $ | (460,644 | ) |
| | | |
| SHORT DURATION TAX-FREE | | | | | | | | | | |
| Risk | | Statements of Assets
and Liabilities | | Assets | | | Statements of Assets
and Liabilities | | Liabilities | |
Credit | | Receivable for unrealized gain on swap contracts | | $ | 804,323 | | | — | | $ | — | |
| (a) | | Includes unrealized gain (loss) on futures contracts and centrally cleared swap contracts described in the Additional Investment Information sections of the Schedules of Investments. Only the variation margin as of September 30, 2017 is reported within the Statements of Assets and Liabilities. |
| (b) | | Aggregate of amounts represents the payments to be made pursuant to bilateral agreements should counterparties exercise their “right to terminate” provisions based on, among others, the Fund’s performance, its failure to pay on its obligations or failure to pledge collateral. The amounts do not include incremental charges directly associated with the close-out of the agreements. They also do not reflect the fair value of any assets pledged as collateral which, through the daily margining process, substantially offsets the aforementioned amounts and for which the Funds are entitled to a full return. |
107
GOLDMAN SACHS MUNICIPAL FIXED INCOME FUNDS
Notes to Financial Statements (continued)
September 30, 2017 (Unaudited)
|
| 4. INVESTMENTS IN DERIVATIVES (continued) |
The following tables set forth, by certain risk types, the Funds’ gains (losses) related to these derivatives and their indicative volumes for the six months ended September 30, 2017. These gains (losses) should be considered in the context that these derivative contracts may have been executed to create investment opportunities and/or economically hedge certain investments, and accordingly, certain gains (losses) on such derivative contracts may offset certain (losses) gains attributable to investments. These gains (losses) are included in “Net realized gain (loss)” or “Net change in unrealized gain (loss)” on the Statements of Operations:
| | | | | | | | | | | | | | |
| DYNAMIC MUNICIPAL INCOME | |
| Risk | | Statements of Operations | | Net Realized
Gain (Loss) | | | Net Change
in Unrealized
Gain (Loss) | | | Average
Number of
Contracts(a) | |
| Credit | | Net realized gain (loss) from swap contracts/Net change in unrealized gain (loss) on swap contracts | | $ | 15,197 | | | $ | 13,180 | | | | 2 | |
| Interest Rate | | Net realized gain (loss) from futures contracts and swap contracts/Net change in unrealized gain (loss) on futures contract and swap contracts | | | (2,561,890 | ) | | | 2,430,348 | | | | 52 | |
| Total | | | | $ | (2,546,693 | ) | | $ | 2,443,528 | | | | 54 | |
|
| HIGH YIELD MUNICIPAL | |
| Risk | | Statements of Operations | | Net Realized
Gain (Loss) | | | Net Change
in Unrealized
Gain (Loss) | | | Average
Number of
Contracts(a) | |
| Credit | | Net realized gain (loss) from swap contracts/Net change in unrealized gain (loss) on swap contracts | | $ | 544,792 | | | $ | 1,084,261 | | | | 7 | |
| Interest Rate | | Net realized gain (loss) from swap contracts/Net change in unrealized gain (loss) on swap contracts | | | (2,878,443 | ) | | | 337,700 | | | | 2 | |
| Total | | | | $ | (2,333,651 | ) | | $ | 1,421,961 | | | | 9 | |
|
| SHORT DURATION TAX-FREE | |
| Risk | | Statements of Operations | | Net Realized
Gain (Loss) | | | Net Change
in Unrealized
Gain (Loss) | | | Average
Number of
Contracts(a) | |
| Credit | | Net realized gain (loss) from swap contracts/Net change in unrealized gain (loss) on swap contracts | | $ | 113,570 | | | $ | 98,848 | | | | 2 | |
| (a) | | Average number of contracts is based on the average of month end balances for the six months ended September 30, 2017. |
|
| 5. AGREEMENTS AND AFFILIATED TRANSACTIONS |
A. Management Agreement — Under the Agreement, GSAM manages the Funds, subject to the general supervision of the Trustees.
As compensation for the services rendered pursuant to the Agreement, the assumption of the expenses related thereto and administration of the Funds’ business affairs, including providing facilities, GSAM is entitled to a management fee, accrued daily and paid monthly, equal to an annual percentage rate of each Fund’s average daily net assets.
108
GOLDMAN SACHS MUNICIPAL FIXED INCOME FUNDS
|
| 5. AGREEMENTS AND AFFILIATED TRANSACTIONS (continued) |
For the six months ended September 30, 2017, contractual and effective net management fees with GSAM were at the following rates:
| | | | | | | | | | | | | | | | | | | | | | | | | | | | | | |
| | | | | Contractual Management Rate | | | Effective Net
Management
Rate^ | |
| Fund | | | | First
$1 billion | | | Next
$1 billion | | | Next
$3 billion | | | Next
$3 billion | | | Over
$8 billion | | | Effective
Rate | | |
Dynamic Municipal Income | | | | | 0.40 | % | | | 0.36 | % | | | 0.34 | % | | | 0.34 | % | | | 0.33 | % | | | 0.48 | % | | | 0.39 | %(1)(2) |
High Yield Municipal | | | | | 0.55 | | | | 0.55 | | | | 0.50 | | | | 0.48 | | | | 0.47 | | | | 0.52 | | | | 0.52 | |
Short Duration Tax-Free | | | | | 0.39 | | | | 0.35 | | | | 0.33 | | | | 0.33 | | | | 0.32 | | | | 0.35 | | | | 0.34 | (2)(3) |
| ^ | | Effective Net Management Rate includes the impact of management fee waivers of affiliated underlying funds, if any. |
| (1) | | GSAM agreed to waive a portion of its management fee in order to achieve a net management rate, as defined in the Fund’s most recent prospectus. This waiver will be effective through at least July 28, 2018, and prior to such date GSAM may not terminate the arrangement without approval of the Trustees. |
| (2) | | Effective July 28, 2017, GSAM reduced the contractual management fee across all breakpoints for Dynamic Municipal Income Fund and Short Duration Tax-Free Fund. Prior to July 28, 2017, the Effective Net Management Rates were 0.40% and 0.35%, respectively. |
| (3) | | GSAM agreed to waive a portion of its management fee in order to achieve a net management fee rate of 0.35% of the average daily net assets of the Fund until July 29, 2017. This waiver terminated on July 29, 2017. |
B. Distribution and/or Service (12b-1) Plans — The Trust, on behalf of Class A Shares of each Fund, has adopted a Distribution and Service Plan subject to Rule 12b-1 under the Act. Under the Distribution and Service Plan, Goldman Sachs, which serves as distributor (the “Distributor”), is entitled to a fee accrued daily and paid monthly for distribution services and personal and account maintenance services, which may then be paid by Goldman Sachs to authorized dealers. These fees are equal to an annual percentage rate of the average daily net assets attributable to Class A Shares of the Funds, as set forth below.
The Trust, on behalf of Class C Shares of each Fund, has adopted a Distribution Plan subject to Rule 12b-1 under the Act. Under the Distribution Plan, Goldman Sachs as Distributor is entitled to a fee accrued daily and paid monthly for distribution services, which may then be paid by Goldman Sachs to authorized dealers. These fees are equal to an annual percentage rate of the average daily net assets attributable to Class C Shares of the Funds, as set forth below.
The Trust, on behalf of Service Shares of each applicable Fund, has adopted a Service Plan subject to Rule 12b-1 under the Act to allow Service Shares to compensate service organizations (including Goldman Sachs) for providing personal and account maintenance services to their customers who are beneficial owners of such shares. The Service Plan provides for compensation to the service organizations equal to an annual percentage rate of the average daily net assets attributable to Service Shares of the Funds, as set forth below.
| | | | | | | | | | | | |
| | | Distribution and Service Plan Rates | |
| | | Class A* | | | Class C | | | Service | |
Distribution Plan | | | 0.25 | % | | | 0.75 | % | | | — | % |
Service Plan | | | — | | | | — | | | | 0.25 | |
| * | | With respect to Class A Shares, the Distributor at its discretion may use compensation for distribution services paid under the Distribution Plan to compensate service organizations for personal and account maintenance services and expenses as long as such total compensation does not exceed the maximum cap on “service fees” imposed by the Financial Industry Regulatory Authority. |
For the six months ended September 30, 2017, Goldman Sachs agreed to waive a portion of the distribution and service fees equal to 0.35% as an annual percentage rate of the average daily net assets attributable to Class C Shares of the Short Duration Tax-Free Fund. This arrangement will remain in place through at least July 28, 2018. Prior to such date, Goldman Sachs may not terminate this arrangement without the approval of the Trustees.
C. Distribution Agreement — Goldman Sachs, as Distributor of the shares of the Funds pursuant to a Distribution Agreement, may retain a portion of the Class A Shares’ front end sales charge and Class C Shares’ CDSC. During the six months ended September 30, 2017, Goldman Sachs advised that it retained front end sales charges of $12,675, $10,126 and $1,564 for the
109
GOLDMAN SACHS MUNICIPAL FIXED INCOME FUNDS
Notes to Financial Statements (continued)
September 30, 2017 (Unaudited)
|
| 5. AGREEMENTS AND AFFILIATED TRANSACTIONS (continued) |
Dynamic Municipal Income, High Yield Municipal and Short Duration Tax-Free Funds, respectively. Goldman Sachs retained no contingent deferred sales charges.
D. Service and/or Shareholder Administration Plans — The Trust, on behalf of each applicable Fund, has adopted Service and/or Shareholder Administration Plans to allow Class C and Service Shares, respectively, to compensate service organizations (including Goldman Sachs) for providing varying levels of personal and account maintenance and/or shareholder administration services to their customers who are beneficial owners of such shares. The Service and/or Shareholder Administration Plans each provide for compensation to the service organizations equal to an annual percentage rate of 0.25% of the average daily net assets attributable to Class C or Service Shares of the Funds, respectively.
E. Transfer Agency Agreement — Goldman Sachs also serves as the transfer agent of the Funds for a fee pursuant to the Transfer Agency Agreement. The fees charged for such transfer agency services are accrued daily and paid monthly at annual rates as follows: 0.13% of the average daily net assets of Class A, Class C and Investor Shares; and 0.04% of the average daily net assets of Institutional and Service Shares. Goldman Sachs agreed to waive a portion of the transfer agency fee equal to 0.05% and 0.04% as an annual percentage rate of the average daily net assets attributable to Class A, Class C and Investor Shares of the High Yield Municipal and Short Duration Tax-Free Funds, respectively. This arrangement will remain in effect through at least July 28, 2018, and prior to such date, Goldman Sachs may not terminate the arrangement without the approval of the Trustees.
F. Other Expense Agreements and Affiliated Transactions — GSAM has agreed to limit certain “Other Expenses” of the
Funds (excluding acquired fund fees and expenses, transfer agency fees and expenses, service fees and shareholder administration fees (as applicable), taxes, interest, brokerage fees, expenses of shareholder meetings, litigation and indemnification, and extraordinary expenses) to the extent such expenses exceed, on an annual basis, a percentage rate of the average daily net assets of each Fund. Such Other Expense reimbursements, if any, are accrued daily and paid monthly. In addition, the Funds are not obligated to reimburse GSAM for prior fiscal year expense reimbursements, if any. The Other Expense limitations as an annual percentage rate of average daily net assets for the Funds is 0.004%. These Other Expense limitations will remain in place through at least July 28, 2018, and prior to such date GSAM may not terminate the arrangements without the approval of the Trustees. In addition, the Funds have entered into certain offset arrangements with the custodian and the transfer agent, which may result in a reduction of the Funds’ expenses and are received irrespective of the application of the “Other Expense” limitations described above.
For the six months ended September 30, 2017, these expense reductions, including any fee waivers and Other Expense reimbursements, were as follows:
| | | | | | | | | | | | | | | | | | | | | | | | | | |
| | | | | Fee Waivers | | | | | | | | | | |
| Fund | | | | Management
Fee | | | Class C
Distribution and
Service Fee | | | Transfer
Agency
Fee | | | Other
Expense
Reimbursement | | | Custody Fee
Credits | | | Total
Expense
Reductions | |
Dynamic Municipal Income | | | | $ | 595,799 | | | $ | — | | | $ | — | | | $ | 225,603 | | | $ | 3,071 | | | $ | 824,473 | |
High Yield Municipal | | | | | — | | | | — | | | | 86,038 | (a) | | | 503,986 | | | | 10,736 | | | | 600,760 | |
Short Duration Tax-Free | | | | | 300,834 | | | | 39,027 | | | | 29,090 | (a) | | | 421,490 | | | | 9,259 | | | | 799,700 | |
| (a) | | Applicable to Class A, C and Investor Shares. |
G. Line of Credit Facility — As of September 30, 2017, the Funds participated in a $1,100,000,000 committed, unsecured revolving line of credit facility (the “facility”) together with other funds of the Trust and certain registered investment companies having management agreements with GSAM or its affiliates. This facility is to be used for temporary emergency purposes, or to allow for an orderly liquidation of securities to meet redemption requests. The interest rate on borrowings is based on the federal funds rate. The facility also requires a fee to be paid by the Funds based on the amount of the commitment that has not been utilized. For the six months ended September 30, 2017, the Funds did not have any borrowings under the facility.
110
GOLDMAN SACHS MUNICIPAL FIXED INCOME FUNDS
|
| 5. AGREEMENTS AND AFFILIATED TRANSACTIONS (continued) |
H. Other Transactions with Affiliates — As of September 30, 2017, The Goldman Sachs Group, Inc. was the beneficial owner of approximately 10% of the Service Class Shares of the Dynamic Municipal Income Fund.
The Funds may purchase securities from, or sell securities to, an affiliated fund provided the affiliation is solely due to having a common investment adviser, common officers, or common trustees. For the six months ended September 30, 2017, there were no purchase and sale transactions and related net realized gain (loss) for the Funds with an affiliated fund in compliance with Rule 17a-7 under the Act.
| | |
| 6. PORTFOLIO SECURITIES TRANSACTIONS | | |
The cost of purchases and proceeds from sales and maturities of long-term securities for the six months ended September 30, 2017, were as follows:
| | | | | | | | | | | | | | | | | | |
| Fund | | | | Purchases of
U.S. Government and
Agency Obligations | | | Purchases (Excluding
U.S. Government and
Agency Obligations) | | | Sales and
Maturities of
U.S. Government and
Agency Obligations | | | Sales and
Maturities (Excluding
U.S. Government and
Agency Obligations) | |
Dynamic Municipal Income | | | | $ | — | | | $ | 316,926,676 | | | $ | — | | | $ | 51,511,303 | |
High Yield Municipal | | | | | — | | | | 750,725,352 | | | | — | | | | 213,877,383 | |
Short Duration Tax-Free | | | | | 49,916,263 | | | | 918,031,576 | | | | 50,065,846 | | | | 462,475,616 | |
As of the Funds’ most recent fiscal year end, March 31, 2017, the Funds’ capital loss carryforwards and certain timing differences, on a tax-basis were as follows:
| | | | | | | | | | | | |
| | | Dynamic Municipal
Income | | | High Yield
Municipal | | | Short Duration
Tax-Free | |
Capital loss carryforwards: | | | | | | | | | | | | |
Expiring 2018(1) | | $ | (11,494,807 | ) | | $ | (431,157,569 | ) | | $ | — | |
Expiring 2019(1) | | | (704,599 | ) | | | (11,866,582 | ) | | | — | |
Perpetual Short-term | | | (3,575,092 | ) | | | (103,612,649 | ) | | | — | |
Perpetual Long-term | | | — | | | | (136,308,708 | ) | | | — | |
Total capital loss carryforwards | | $ | (15,774,498 | ) | | $ | (682,945,508 | ) | | $ | — | |
Timing differences (Qualified Late Year Loss Deferral, Defaulted Bond Income and Distribution Payable) | | $ | (385,877 | ) | | $ | (1,742,976 | ) | | $ | (7,546,326 | ) |
| (1) | | Expiration occurs on March 31 of the year indicated. |
As of September 30, 2017, the Funds’ aggregate securities unrealized gains and losses based on cost for U.S. federal income tax purposes were as follows:
| | | | | | | | | | | | |
| | | Dynamic Municipal
Income | | | High Yield
Municipal | | | Short Duration
Tax-Free | |
Tax cost | | $ | 1,361,880,321 | | | $ | 4,899,550,897 | | | $ | 5,090,683,180 | |
Gross unrealized gain | | | 63,786,877 | | | | 457,710,985 | | | | 81,209,238 | |
Gross unrealized loss | | | (41,438,457 | ) | | | (244,992,902 | ) | | | (68,837,829 | ) |
Net unrealized gain (loss) | | $ | 22,348,420 | | | $ | 212,718,083 | | | $ | 12,371,409 | |
111
GOLDMAN SACHS MUNICIPAL FIXED INCOME FUNDS
Notes to Financial Statements (continued)
September 30, 2017 (Unaudited)
|
| 7. TAX INFORMATION (continued) |
The difference between GAAP-basis and tax-basis unrealized gains (losses), as of the most recent fiscal year end, is attributable primarily to wash sales, net mark to market gains (losses) on regulated futures, differences in the tax treatment of swap transactions, and market discount accretion and premium amortization.
GSAM has reviewed the Funds’ tax positions for all open tax years (the current and prior three years, as applicable) and has concluded that no provision for income tax is required in the Funds’ financial statements. Such open tax years remain subject to examination and adjustment by tax authorities.
The Funds’ risks include, but are not limited to, the following:
Derivatives Risk — The Funds’ use of derivatives may result in loss. Derivative instruments, which may pose risks in addition to and greater than those associated with investing directly in securities, currencies or other instruments, may be illiquid or less liquid, volatile, difficult to price and leveraged so that small changes in the value of the underlying instruments may produce disproportionate losses to the Funds. Derivatives are also subject to counterparty risk, which is the risk that the other party in the transaction will not fulfill its contractual obligation. The use of derivatives is a highly specialized activity that involves investment techniques and risks different from those associated with investments in more traditional securities and instruments. Losses from derivatives can also result from a lack of correlation between changes in the value of derivative instruments and the portfolio assets (if any) being hedged.
Interest Rate Risk — When interest rates increase, fixed income securities or instruments held by a Fund will generally decline in value. Long-term fixed income securities or instruments will normally have more price volatility because of this risk than short-term fixed income securities or instruments. The risks associated with increasing rates are heightened given that interest rates are near historic lows, but may be expected to increase in the future with unpredictable effects on the markets and a Fund’s investments. Fluctuations in interest rates may also affect the liquidity of fixed income securities and instruments held by the Funds.
Large Shareholder Transactions Risk — A Fund may experience adverse effects when certain large shareholders, such as other funds, institutional investors (including those trading by use of non-discretionary mathematical formulas), financial intermediaries (who may make investment decisions on behalf of underlying clients and/or include a Fund in their investment model), individuals, accounts and Goldman Sachs affiliates, purchase or redeem large amounts of shares of a Fund. Such large shareholder redemptions may cause a Fund to sell portfolio securities at times when it would not otherwise do so, which may negatively impact a Fund’s NAV and liquidity. These transactions may also accelerate the realization of taxable income to shareholders if such sales of investments resulted in gains, and may also increase transaction costs. In addition, a large redemption could result in a Fund’s current expenses being allocated over a smaller asset base, leading to an increase in the Fund’s expense ratio. Similarly, large Fund share purchases may adversely affect a Fund’s performance to the extent that the Fund is delayed in investing new cash and is required to maintain a larger cash position than it ordinarily would.
Liquidity Risk — A Fund may make investments that are illiquid or that may become less liquid in response to market developments or adverse investor perceptions. Illiquid investments may be more difficult to value. Liquidity risk may also refer to the risk that a Fund will not be able to pay redemption proceeds within the allowable time period because of unusual market conditions, an unusually high volume of redemption requests, or other reasons. To meet redemption requests, a Fund may be forced to sell investments at an unfavorable time and/or under unfavorable conditions. Liquidity risk may be the result of, among other things, the reduced number and capacity of traditional market participants to make a market in fixed income securities or the lack of an active market. The potential for liquidity risk may be magnified by a rising interest rate environment or other circumstances where investor redemptions from fixed income mutual funds may be higher than normal, potentially causing increased supply in the market due to selling activity.
112
GOLDMAN SACHS MUNICIPAL FIXED INCOME FUNDS
|
| 8. OTHER RISKS (continued) |
Market and Credit Risks — In the normal course of business, a Fund trades financial instruments and enters into financial transactions where risk of potential loss exists due to changes in the market (market risk). Additionally, a Fund may also be exposed to credit risk in the event that an issuer or guarantor fails to perform or that an institution or entity with which the Fund has unsettled or open transactions defaults.
State/Territory Specific Risk — A Fund’s investments in municipal obligations of issuers located in a particular state or U.S. territory may be adversely affected by political, economic and regulatory developments within that state or U.S. territory. Such developments may affect the financial condition of a state’s or territory’s political subdivisions, agencies, instrumentalities and public authorities and heighten the risks associated with investing in bonds issued by such parties, which could, in turn, adversely affect a Fund’s income, NAV, liquidity, and/or ability to preserve or realize capital appreciation.
Tax Risk — The Funds may be adversely impacted by changes in tax rates and policies. Because interest income from Municipal Securities is normally not subject to regular federal income taxation, the attractiveness of Municipal Securities in relation to other investment alternatives is affected by changes in federal and state income tax rates or changes in the tax-exempt status of interest income from Municipal Securities. Any proposed or actual changes in such rates or exempt status, therefore, can significantly affect the demand for and supply, liquidity and marketability of Municipal Securities. This could in turn affect a Fund’s net asset value and ability to acquire and dispose of Municipal Securities at desirable yield and price levels. Additionally, these Funds would not be a suitable investment for IRAs, other tax-exempt or tax-deferred accounts or for other investors who are not sensitive to the federal, state or local income tax consequences of their investments.
Under the Trust’s organizational documents, its Trustees, officers, employees and agents are indemnified, to the extent permitted by the Act and state law, against certain liabilities that may arise out of performance of their duties to the Funds. Additionally, in the course of business, the Funds enter into contracts that contain a variety of indemnification clauses. The Funds’ maximum exposure under these arrangements is unknown, as this would involve future claims that may be made against the Funds that have not yet occurred. However, GSAM believes the risk of loss under these arrangements to be remote.
Subsequent events after the Statements of Assets and Liabilities date have been evaluated, and GSAM has concluded that there is no impact requiring adjustment or disclosure in the financial statements.
113
GOLDMAN SACHS MUNICIPAL FIXED INCOME FUNDS
Notes to Financial Statements (continued)
September 30, 2017 (Unaudited)
|
| 11. SUMMARY OF SHARE TRANSACTIONS |
Share activity is as follows:
| | | | | | | | | | | | | | | | |
| | | Dynamic Municipal Income Fund | |
| | | | |
| | | For the Six Months Ended
September 30, 2017
(Unaudited) | | | For the Fiscal Year Ended
March 31, 2017 | |
| | | | |
| | | Shares | | | Dollars | | | Shares | | | Dollars | |
| | | | |
| Class A Shares | | | | | | | | | | | | | | | | |
Shares sold | | | 4,993,666 | | | $ | 78,052,275 | | | | 6,872,998 | | | $ | 107,860,167 | |
Reinvestment of distributions | | | 203,426 | | | | 3,182,169 | | | | 385,810 | | | | 6,051,521 | |
Shares redeemed | | | (2,328,739 | ) | | | (36,389,336 | ) | | | (4,461,562 | ) | | | (69,311,835 | ) |
| | | | 2,868,353 | | | | 44,845,108 | | | | 2,797,246 | | | | 44,599,853 | |
| Class C Shares | | | | | | | | | | | | | | | | |
Shares sold | | | 451,395 | | | | 7,062,676 | | | | 1,310,890 | | | | 20,660,621 | |
Reinvestment of distributions | | | 25,882 | | | | 405,012 | | | | 50,080 | | | | 785,361 | |
Shares redeemed | | | (382,529 | ) | | | (5,978,242 | ) | | | (542,263 | ) | | | (8,472,434 | ) |
| | | | 94,748 | | | | 1,489,446 | | | | 818,707 | | | | 12,973,548 | |
| Institutional Shares | | | | | | | | | | | | | | | | |
Shares sold | | | 16,974,470 | | | | 265,667,027 | | | | 31,710,596 | | | | 495,175,716 | |
Reinvestment of distributions | | | 805,072 | | | | 12,593,450 | | | | 1,228,194 | | | | 19,243,175 | |
Shares redeemed | | | (4,175,097 | ) | | | (65,244,385 | ) | | | (13,844,781 | ) | | | (215,197,001 | ) |
| | | | 13,604,445 | | | | 213,016,092 | | | | 19,094,009 | | | | 299,221,890 | |
| Service Shares | | | | | | | | | | | | | | | | |
Reinvestment of distributions | | | 14 | | | | 226 | | | | 30 | | | | 478 | |
Shares redeemed | | | — | | | | — | | | | — | | | | (6 | ) |
| | | | 14 | | | | 226 | | | | 30 | | | | 472 | |
| Investor Shares(a) | | | | | | | | | | | | | | | | |
Shares sold | | | 3,030,972 | | | | 47,306,341 | | | | 4,116,665 | | | | 63,678,477 | |
Reinvestment of distributions | | | 87,886 | | | | 1,374,036 | | | | 53,340 | | | | 830,047 | |
Shares redeemed | | | (417,878 | ) | | | (6,527,437 | ) | | | (560,587 | ) | | | (8,696,859 | ) |
| | | | 2,700,980 | | | | 42,152,940 | | | | 3,609,418 | | | | 55,811,665 | |
NET INCREASE | | | 19,268,540 | | | $ | 301,503,812 | | | | 26,319,410 | | | $ | 412,607,428 | |
| (a) | | Effective August 15, 2017, Class IR changed its name to Investor. |
114
GOLDMAN SACHS MUNICIPAL FIXED INCOME FUNDS
|
| 11. SUMMARY OF SHARE TRANSACTIONS (continued) |
Share activity is as follows:
| | | | | | | | | | | | | | | | |
| | | High Yield Municipal Fund | |
| | | | |
| | | For the Six Months Ended
September 30, 2017
(Unaudited) | | | For the Fiscal Year Ended
March 31, 2017 | |
| | | | |
| | | Shares | | | Dollars | | | Shares | | | Dollars | |
| | | | |
| Class A Shares | | | | | | | | | | | | | | | | |
Shares sold | | | 1,703,226 | | | $ | 16,170,869 | | | | 3,763,874 | | | $ | 35,397,906 | |
Reinvestment of distributions | | | 434,206 | | | | 4,130,175 | | | | 1,092,481 | | | | 10,321,390 | |
Shares redeemed | | | (2,433,134 | ) | | | (23,132,865 | ) | | | (7,789,348 | ) | | | (72,782,918 | ) |
| | | | (295,702 | ) | | | (2,831,821 | ) | | | (2,932,993 | ) | | | (27,063,622 | ) |
| Class C Shares | | | | | | | | | | | | | | | | |
Shares sold | | | 309,627 | | | | 2,938,039 | | | | 903,874 | | | | 8,619,231 | |
Reinvestment of distributions | | | 85,523 | | | | 813,434 | | | | 224,431 | | | | 2,119,997 | |
Shares redeemed | | | (1,090,622 | ) | | | (10,361,984 | ) | | | (1,841,287 | ) | | | (17,267,725 | ) |
| | | | (695,472 | ) | | | (6,610,511 | ) | | | (712,982 | ) | | | (6,528,497 | ) |
| Institutional Shares | | | | | | | | | | | | | | | | |
Shares sold | | | 73,292,935 | | | | 696,328,951 | | | | 162,400,568 | | | | 1,522,008,228 | |
Reinvestment of distributions | | | 9,886,405 | | | | 94,069,717 | | | | 20,301,816 | | | | 191,816,554 | |
Shares redeemed | | | (27,846,205 | ) | | | (264,786,733 | ) | | | (125,700,317 | ) | | | (1,169,120,154 | ) |
| | | | 55,333,135 | | | | 525,611,935 | | | | 57,002,067 | | | | 544,704,628 | |
| Investor Shares(a) | | | | | | | | | | | | | | | | |
Shares sold | | | 1,129,151 | | | | 10,767,496 | | | | 2,618,781 | | | | 24,350,244 | |
Reinvestment of distributions | | | 91,675 | | | | 873,086 | | | | 134,000 | | | | 1,263,684 | |
Shares redeemed | | | (853,014 | ) | | | (8,091,497 | ) | | | (465,898 | ) | | | (4,395,985 | ) |
| | | | 367,812 | | | | 3,549,085 | | | | 2,286,883 | | | | 21,217,943 | |
NET INCREASE | | | 54,709,773 | | | $ | 519,718,688 | | | | 55,642,975 | | | $ | 532,330,452 | |
| (a) | | Effective August 15, 2017, Class IR changed its name to Investor. |
115
GOLDMAN SACHS MUNICIPAL FIXED INCOME FUNDS
Notes to Financial Statements (continued)
September 30, 2017 (Unaudited)
|
| 11. SUMMARY OF SHARE TRANSACTIONS (continued) |
Share activity is as follows:
| | | | | | | | | | | | | | | | |
| | | Short Duration Tax-Free Fund | |
| | | | |
| | | For the Six Months Ended
September 30, 2017
(Unaudited) | | | For the Fiscal Year Ended
March 31, 2017 | |
| | | | |
| | | Shares | | | Dollars | | | Shares | | | Dollars | |
| | | | |
| Class A Shares | | | | | | | | | | | | | | | | |
Shares sold | | | 960,433 | | | $ | 10,140,470 | | | | 3,104,726 | | | $ | 32,784,249 | |
Reinvestment of distributions | | | 44,442 | | | | 469,369 | | | | 107,739 | | | | 1,136,819 | |
Shares redeemed | | | (3,237,900 | ) | | | (34,189,863 | ) | | | (5,378,469 | ) | | | (56,633,882 | ) |
| | | | (2,233,025 | ) | | | (23,580,024 | ) | | | (2,166,004 | ) | | | (22,712,814 | ) |
| Class C Shares | | | | | | | | | | | | | | | | |
Shares sold | | | 132,387 | | | | 1,398,434 | | | | 303,581 | | | | 3,198,288 | |
Reinvestment of distributions | | | 5,371 | | | | 56,672 | | | | 11,574 | | | | 121,984 | |
Shares redeemed | | | (299,061 | ) | | | (3,155,160 | ) | | | (1,308,227 | ) | | | (13,757,315 | ) |
| | | | (161,303 | ) | | | (1,700,054 | ) | | | (993,072 | ) | | | (10,437,043 | ) |
| Institutional Shares | | | | | | | | | | | | | | | | |
Shares sold | | | 109,501,410 | | | | 1,155,457,733 | | | | 223,462,919 | | | | 2,354,031,726 | |
Reinvestment of distributions | | | 2,934,553 | | | | 30,960,025 | | | | 5,285,410 | | | | 55,676,089 | |
Shares redeemed | | | (73,773,294 | ) | | | (778,081,536 | ) | | | (214,618,744 | ) | | | (2,256,247,980 | ) |
| | | | 38,662,669 | | | | 408,336,222 | | | | 14,129,585 | | | | 153,459,835 | |
| Service Shares | | | | | | | | | | | | | | | | |
Shares sold | | | 12,299 | | | | 130,000 | | | | 10,621 | | | | 112,155 | |
Reinvestment of distributions | | | 69 | | | | 729 | | | | 115 | | | | 1,211 | |
Shares redeemed | | | (9,558 | ) | | | (100,647 | ) | | | (1,001 | ) | | | (10,490 | ) |
| | | | 2,810 | | | | 30,082 | | | | 9,735 | | | | 102,876 | |
| Investor Shares(a) | | | | | | | | | | | | | | | | |
Shares sold | | | 837,700 | | | | 8,838,259 | | | | 838,460 | | | | 8,814,246 | |
Reinvestment of distributions | | | 7,765 | | | | 81,949 | | | | 5,614 | | | | 59,134 | |
Shares redeemed | | | (357,897 | ) | | | (3,772,226 | ) | | | (226,457 | ) | | | (2,378,481 | ) |
| | | | 487,568 | | | | 5,147,982 | | | | 617,617 | | | | 6,494,899 | |
NET INCREASE | | | 36,758,719 | | | $ | 388,234,208 | | | | 11,597,861 | | | $ | 126,907,753 | |
| (a) | | Effective August 15, 2017, Class IR changed its name to Investor. |
116
GOLDMAN SACHS MUNICIPAL FIXED INCOME FUNDS
Fund Expenses — Six Month Period Ended September 30, 2017 (Unaudited)
As a shareholder of Class A, Class C, Institutional, Service or Investor Shares of a Fund you incur two types of costs: (1) transaction costs, including sales charges on purchase payments (with respect to Class A Shares) and contingent deferred sales charges on redemptions (with respect to Class C Shares); and redemption fees (with respect to Class A, Class C, Institutional and Investor Shares, if any); and (2) ongoing costs, including management fees; distribution and/or service (12b-1) fees (with respect to Class A, Class C and Service Shares); and other Fund expenses. This example is intended to help you understand your ongoing costs (in dollars) of investing in Class A, Class C, Institutional, Service and Investor Shares of the Funds and to compare these costs with the ongoing costs of investing in other mutual funds.
The example is based on an investment of $1,000 invested at the beginning of the period and held for the entire period from April 1, 2017 through September 30, 2017, which represents a period of 183 days of a 365 day year.
Actual Expenses — The first line under each share class in the table below provides information about actual account values and actual expenses. You may use the information in this line, together with the amount you invested, to estimate the expenses that you paid over the period. Simply divide your account value by $1,000 (for example, an $8,600 account value divided by $1,000=8.6), then multiply the result by the number in the first line under the heading entitled “Expenses Paid” to estimate the expenses you paid on your account during this period.
Hypothetical Example for Comparison Purposes — The second line under each share class in the table below provides information about hypothetical account values and hypothetical expenses based on the Funds’ actual net expense ratio and an assumed rate of return of 5% per year before expenses, which is not the Funds’ actual return. The hypothetical account values and expenses may not be used to estimate the actual ending account balance or expenses you paid for the period. You may use this information to compare the ongoing costs of investing in the Funds and other funds. To do so, compare this 5% hypothetical example with the 5% hypothetical examples that appear in the shareholder reports of the other funds.
Please note that the expenses shown in the table are meant to highlight your ongoing costs only and do not reflect any transactional costs, such as sales charges, redemption fees, or exchange fees. Therefore, the second line of the table is useful in comparing ongoing costs only, and will not help you determine the relative total costs of owning different funds. In addition, if these transactional costs were included, your costs would have been higher.
| | | | | | | | | | | | | | | | | | | | | | | | | | | | | | | | | | | | |
| | | Dynamic Municipal Income Fund | | | High Yield Municipal Fund | | | Short Duration Tax-Free Fund | |
| Share Class | | Beginning
Account
Value
4/01/17 | | | Ending
Account
Value
9/30/17 | | | Expenses
Paid for the
6 Months Ended
9/30/17* | | | Beginning
Account
Value
4/01/17 | | | Ending
Account
Value
9/30/17 | | | Expenses
Paid for the
6 Months Ended
9/30/17* | | | Beginning
Account
Value
4/01/17 | | | Ending
Account
Value
9/30/17 | | | Expenses
Paid for the
6 Months Ended
9/30/17* | |
| Class A | | | | | | | | | | | | | | | | | | | | | | | | | | | | | | | | | | | | |
Actual | | $ | 1,000 | | | $ | 1,030.70 | | | $ | 3.92 | | | $ | 1,000 | | | $ | 1,043.40 | | | $ | 4.35 | | | $ | 1,000 | | | $ | 1,010.30 | | | $ | 3.48 | |
Hypothetical 5% return | | | 1,000 | | | | 1,021.21 | + | | | 3.90 | | | | 1,000 | | | | 1,020.81 | + | | | 4.31 | | | | 1,000 | | | | 1,021.61 | + | | | 3.50 | |
| Class C | | | | | | | | | | | | | | | | | | | | | | | | | | | | | | | | | | | | |
Actual | | | 1,000 | | | | 1,026.90 | | | | 7.72 | | | | 1,000 | | | | 1,039.50 | | | | 8.18 | | | | 1,000 | | | | 1,008.30 | | | | 5.49 | |
Hypothetical 5% return | | | 1,000 | | | | 1,017.45 | + | | | 7.69 | | | | 1,000 | | | | 1,017.05 | + | | | 8.09 | | | | 1,000 | | | | 1,019.60 | + | | | 5.52 | |
| Institutional | | | | | | | | | | | | | | | | | | | | | | | | | | | | | | | | | | | | |
Actual | | | 1,000 | | | | 1,032.50 | | | | 2.19 | | | | 1,000 | | | | 1,043.90 | | | | 2.87 | | | | 1,000 | | | | 1,012.80 | | | | 1.92 | |
Hypothetical 5% return | | | 1,000 | | | | 1,022.91 | + | | | 2.18 | | | | 1,000 | | | | 1,022.26 | + | | | 2.84 | | | | 1,000 | | | | 1,023.16 | + | | | 1.93 | |
| Service | | | | | | | | | | | | | | | | | | | | | | | | | | | | | | | | | | | | |
Actual | | | 1,000 | | | | 1,029.90 | | | | 4.73 | | | | N/A | | | | N/A | | | | N/A | | | | 1,000 | | | | 1,010.20 | | | | 4.43 | |
Hypothetical 5% return | | | 1,000 | | | | 1,020.41 | + | | | 4.71 | | | | N/A | | | | N/A | | | | N/A | | | | 1,000 | | | | 1,020.66 | + | | | 4.46 | |
| Investor(a) | | | | | | | | | | | | | | | | | | | | | | | | | | | | | | | | | | | | |
Actual | | | 1,000 | | | | 1,032.10 | | | | 2.65 | | | | 1,000 | | | | 1,043.60 | | | | 3.07 | | | | 1,000 | | | | 1,011.60 | | | | 2.17 | |
Hypothetical 5% return | | | 1,000 | | | | 1,022.46 | + | | | 2.64 | | | | 1,000 | | | | 1,022.06 | + | | | 3.04 | | | | 1,000 | | | | 1,022.91 | + | | | 2.18 | |
| * | | Expenses are calculated using each Fund’s annualized net expense ratio for each class, which represents the ongoing expenses as a percentage of net assets for the six months ended September 30, 2017. Expenses are calculated by multiplying the annualized net expense ratio by the average account value for the period; then multiplying the result by the number of days in the most recent fiscal half year; and then dividing that result by the number of days in the fiscal year. The annualized net expense ratios for the period were as follows: |
| | | | | | | | | | | | | | | | | | | | |
| Fund | | Class A | | | Class C | | | Institutional | | | Service | | | Investor(a) | |
Dynamic Municipal Income | | | 0.77 | % | | | 1.52 | % | | | 0.43 | % | | | 0.93 | % | | | 0.52 | % |
High Yield Municipal | | | 0.85 | | | | 1.60 | | | | 0.56 | | | | N/A | | | | 0.60 | |
Short Duration Tax-Free | | | 0.69 | | | | 1.09 | | | | 0.38 | | | | 0.88 | | | | 0.43 | |
| + | | Hypothetical expenses are based on each Fund’s actual annualized net expense ratios and an assumed rate of return of 5% per year before expenses. |
| (a) | | Effective August 15, 2017, Class IR changed its name to Investor. |
117
GOLDMAN SACHS MUNICIPAL FIXED INCOME FUNDS
Statement Regarding Basis for Approval of Management Agreements (Unaudited)
Background
The Goldman Sachs Dynamic Municipal Income Fund, Goldman Sachs High Yield Municipal Fund, and Goldman Sachs Short Duration Tax-Free Fund (the “Funds”) are investment portfolios of Goldman Sachs Trust (the “Trust”). The Board of Trustees oversees the management of the Trust and reviews the investment performance and expenses of the Funds at regularly scheduled meetings held throughout the year. In addition, the Board of Trustees determines annually whether to approve the continuance of the Trust’s investment management agreements (the “Management Agreements”) with Goldman Sachs Asset Management, L.P. (the “Investment Adviser”) on behalf of the Funds.
The Management Agreements were most recently approved for continuation until June 30, 2018 by the Board of Trustees, including those Trustees who are not parties to the Management Agreements or “interested persons” (as defined in the Investment Company Act of 1940, as amended) of any party thereto (the “Independent Trustees”), at a meeting held on June 14-15, 2017 (the “Annual Meeting”).
The review process undertaken by the Trustees spans the course of the year and culminates with the Annual Meeting. To assist the Trustees in their deliberations, the Trustees have established a Contract Review Committee (the “Committee”), comprised of the Independent Trustees. The Committee held four meetings over the course of the year since the Management Agreements were last approved. At those Committee meetings, regularly scheduled Board or other committee meetings, and/or the Annual Meeting, matters relevant to the renewal of the Management Agreements were considered by the Board, or the Independent Trustees, as applicable. With respect to each Fund, such matters included:
| | (a) | | the nature and quality of the advisory, administrative, and other services provided to the Fund by the Investment Adviser and its affiliates, including information about: |
| | (i) | | the structure, staff, and capabilities of the Investment Adviser and its portfolio management teams; |
| | (ii) | | the groups within the Investment Adviser and its affiliates that support the portfolio management teams or provide other types of necessary services, including fund services groups (e.g., accounting and financial reporting, tax, shareholder services, and operations); controls and risk management groups (e.g., legal, compliance, valuation oversight, credit risk management, internal audit, compliance testing, market risk analysis, finance, and central funding); sales and distribution support groups, and others (e.g., information technology and training); |
| | (iii) | | trends in employee headcount; |
| | (iv) | | the Investment Adviser’s financial resources and ability to hire and retain talented personnel and strengthen its operations; and |
| | (v) | | the parent company’s support of the Investment Adviser and its mutual fund business, as expressed by the firm’s senior management; |
| | (b) | | information on the investment performance of the Fund, including comparisons to the performance of similar mutual funds, as provided by a third-party mutual fund data provider engaged as part of the contract review process (the |
118
GOLDMAN SACHS MUNICIPAL FIXED INCOME FUNDS
Statement Regarding Basis for Approval of Management Agreements (Unaudited) (continued)
| | “Outside Data Provider”), and a benchmark performance index; and information on general investment outlooks in the markets in which the Fund invests; |
| | (c) | | information provided by the Investment Adviser indicating the Investment Adviser’s views on whether the Fund’s peer group and/or benchmark index had high, medium, or low relevance given the Fund’s particular investment strategy; |
| | (d) | | the terms of the Management Agreement and other agreements with affiliated service providers entered into by the Trust on behalf of the Fund; |
| | (e) | | fee and expense information for the Fund, including: |
| | (i) | | the relative management fee and expense levels of the Fund as compared to those of comparable funds managed by other advisers, as provided by the Outside Data Provider; |
| | (ii) | | the Fund’s expense trends over time; and |
| | (iii) | | to the extent the Investment Adviser manages other types of accounts (such as bank collective trusts, private wealth management accounts, institutional separate accounts, sub-advised mutual funds, and non-U.S. funds) having investment objectives and policies similar to those of the Fund, comparative information on the advisory fees charged and services provided to those accounts by the Investment Adviser; |
| | (f) | | with respect to the extensive investment performance and expense comparison data provided by the Outside Data Provider, its processes in producing that data for the Fund; |
| | (g) | | the undertakings of the Investment Adviser and its affiliates to implement fee waivers and/or expense limitations; |
| | (h) | | information relating to the profitability of the Management Agreement and the transfer agency and distribution and service arrangements of the Fund to the Investment Adviser and its affiliates; |
| | (i) | | whether the Fund’s existing management fee schedule adequately addressed any economies of scale; |
| | (j) | | a summary of the “fall-out” benefits derived by the Investment Adviser and its affiliates from their relationships with the Fund, including the fees received by the Investment Adviser’s affiliates from the Fund for transfer agency, portfolio trading, distribution and other services; |
| | (k) | | a summary of potential benefits derived by the Fund as a result of its relationship with the Investment Adviser; |
| | (l) | | information regarding portfolio trading and how the Investment Adviser carries out its duty to seek best execution; |
| | (m) | | portfolio manager ownership of Fund shares; the manner in which portfolio manager compensation is determined; and the number and types of accounts managed by the portfolio managers; |
| | (n) | | the nature and quality of the services provided to the Fund by its unaffiliated service providers, and the Investment Adviser’s general oversight and evaluation (including reports on due diligence) of those service providers as part of the administrative services provided under the Management Agreement; and |
| | (o) | | the Investment Adviser’s processes and policies addressing various types of potential conflicts of interest; its approach to risk management; the annual review of the effectiveness of the Fund’s compliance program; and periodic compliance reports. |
119
GOLDMAN SACHS MUNICIPAL FIXED INCOME FUNDS
Statement Regarding Basis for Approval of Management Agreements (Unaudited) (continued)
The Trustees also received an overview of the Funds’ distribution arrangements. They received information regarding the Funds’ assets, share purchase and redemption activity, and payment of distribution, service, and shareholder administration fees, as applicable. Information was also provided to the Trustees relating to revenue sharing payments made by and services provided by the Investment Adviser and its affiliates to intermediaries that promote the sale, distribution, and/or servicing of Fund shares. The Independent Trustees also discussed the broad range of other investment choices that are available to Fund investors, including the availability of comparable funds managed by other advisers.
The presentations made at the Board and Committee meetings and at the Annual Meeting encompassed the Funds and other mutual funds for which the Board of Trustees has responsibility. In evaluating the Management Agreements at the Annual Meeting, the Trustees relied upon their knowledge, resulting from their meetings and other interactions throughout the year, of the Investment Adviser and its affiliates, their services, and the Funds. In conjunction with these meetings, the Trustees received written materials and oral presentations on the topics covered, and the Investment Adviser addressed the questions and concerns of the Trustees, including concerns regarding the investment performance of certain of the funds they oversee. The Independent Trustees were advised by their independent legal counsel regarding their responsibilities and other regulatory requirements related to the approval and continuation of mutual fund investment management agreements under applicable law. In addition, the Investment Adviser and its affiliates provided the Independent Trustees with a written response to a formal request for information sent on behalf of the Independent Trustees by their independent legal counsel. During the course of their deliberations, the Independent Trustees met in executive sessions with their independent legal counsel, without representatives of the Investment Adviser or its affiliates present.
Nature, Extent, and Quality of the Services Provided Under the Management Agreements
As part of their review, the Trustees considered the nature, extent, and quality of the services provided to the Funds by the Investment Adviser. In this regard, the Trustees considered both the investment advisory services and non-advisory services that are provided by the Investment Adviser and its affiliates. The Trustees noted the transition in the leadership and changes in personnel of various of the Investment Adviser’s portfolio management teams that had occurred in recent periods, and the ongoing recruitment efforts aimed at bringing high quality investment talent to the Investment Adviser. They also noted the Investment Adviser’s commitment to maintaining high quality systems and expending substantial resources to respond to ongoing changes to the regulatory and control environment in which the Funds and their service providers operate, as well as the efforts of the Investment Adviser and its affiliates to combat cyber security risks. The Trustees concluded that the Investment Adviser continued to commit substantial financial and operational resources to the Funds and expressed confidence that the Investment Adviser would continue to do so in the future. The Trustees also recognized that the Investment Adviser had made significant commitments to address regulatory compliance requirements applicable to the Funds and the Investment Adviser and its affiliates.
120
GOLDMAN SACHS MUNICIPAL FIXED INCOME FUNDS
Statement Regarding Basis for Approval of Management Agreements (Unaudited) (continued)
Investment Performance
The Trustees also considered the investment performance of the Funds. In this regard, they compared the investment performance of each Fund to its peers using rankings and ratings compiled by the Outside Data Provider as of December 31, 2016, and updated performance information prepared by the Investment Adviser using the peer group identified by the Outside Data Provider as of March 31, 2017. The information on each Fund’s investment performance was provided for the one-, three-, five-, and ten-year periods ending on the applicable dates. The Trustees also reviewed each Fund’s investment performance relative to its performance benchmark. As part of this review, they considered the investment performance trends of the Funds over time, and reviewed the investment performance of each Fund in light of its investment objective and policies and market conditions.
In addition, the Trustees considered materials prepared and presentations made by the Investment Adviser’s senior management and portfolio management personnel in which Fund performance was assessed. The Trustees also considered the Investment Adviser’s periodic reports with respect to the Funds’ risk profiles, and how the Investment Adviser’s approach to risk monitoring and management influences portfolio management.
The Trustees observed that the Dynamic Municipal Income Fund’s Institutional Shares had placed in the first quartile of the Fund’s peer group and had outperformed the Fund’s benchmark index for the one-, three-, five-, and ten-year periods ended March 31, 2017. They noted that the High Yield Municipal Fund’s Institutional Shares had placed in the first quartile of the Fund’s peer group for the one-, three-, and five-year periods and in the third quartile for the ten-year period, and had outperformed the Fund’s benchmark index for the one-, three-, and five-year periods and underperformed for the ten-year period ended March 31, 2017. The Trustees noted that the Short Duration Tax-Free Fund’s Institutional Shares had placed in the top half of the Fund’s peer group for the one-, three-, five-, and ten-year periods, and had outperformed the Fund’s benchmark index for the one-, three-, and five-year periods and underperformed for the ten-year period ended March 31, 2017.
Costs of Services Provided and Competitive Information
The Trustees considered the contractual terms of the Management Agreements and the fee rates payable by each Fund under its respective Management Agreement. In this regard, the Trustees considered information on the services rendered by the Investment Adviser to the Funds, which included both advisory and administrative services that were directed to the needs and operations of the Funds as registered mutual funds.
In particular, the Trustees reviewed analyses prepared by the Outside Data Provider regarding the expense rankings of the Funds. The analyses provided a comparison of each Fund’s management fee and breakpoints to those of a relevant peer group and category universe; an expense analysis which compared each Fund’s overall net and gross expenses to a peer group and a category universe; and data comparing each Fund’s net expenses to the peer and category medians. The analyses also compared each Fund’s transfer agency, custody, and distribution fees, other expenses and fee waivers/reimbursements to those of the peer group and
121
GOLDMAN SACHS MUNICIPAL FIXED INCOME FUNDS
Statement Regarding Basis for Approval of Management Agreements (Unaudited) (continued)
category medians. The Trustees concluded that the comparisons provided by the Outside Data Provider were useful in evaluating the reasonableness of the management fees and total expenses paid by the Funds.
With respect to the Dynamic Municipal Income and Short Duration Tax-Free Funds, the Trustees noted that the management fee breakpoint schedules were being reduced at certain asset levels. In addition, the Trustees considered the Investment Adviser’s undertakings to implement fee waivers and/or expense limitations. The Trustees also noted that certain changes were being made to existing fee waiver or expense limitation arrangements of the Dynamic Municipal Income Fund that would have the effect of decreasing total Fund expenses, with such changes taking effect in connection with the Fund’s next annual registration statement update. They also considered, to the extent that the Investment Adviser manages other types of accounts having investment objectives and policies similar to those of the Funds, comparative fee information for services provided by the Investment Adviser to those accounts, and information that indicated that services provided to the Funds differed in various significant respects from the services provided to other types of accounts which, in many cases, operated under less stringent legal and regulatory structures, required fewer services from the Investment Adviser to a smaller number of client contact points, and were less time-intensive.
In addition, the Trustees noted that shareholders are able to redeem their Fund shares at any time if shareholders believe that the Fund fees and expenses are too high or if they are dissatisfied with the performance of the Fund.
Profitability
The Trustees reviewed each Fund’s contribution to the Investment Adviser’s revenues and pre-tax profit margins. In this regard the Trustees noted that they had received, among other things, profitability analyses and summaries, revenue and expense schedules by Fund and by function (i.e., investment management, transfer agency and distribution and service), and information on the Investment Adviser’s expense allocation methodology. They observed that the profitability and expense figures are substantially similar to those used by the Investment Adviser for many internal purposes, including compensation decisions among various business groups, and are thus subject to a vigorous internal debate about how certain revenue and expenses should be allocated. The Trustees also noted that the internal audit group within the Goldman Sachs organization had audited the expense allocation methodology and that the internal audit group was satisfied with the reasonableness, consistency, and accuracy of the Investment Adviser’s expense allocation methodology and profitability analysis calculations. Profitability data for each Fund was provided for 2016 and 2015, and the Trustees considered this information in relation to the Investment Adviser’s overall profitability.
122
GOLDMAN SACHS MUNICIPAL FIXED INCOME FUNDS
Statement Regarding Basis for Approval of Management Agreements (Unaudited) (continued)
Economies of Scale
The Trustees considered the information that had been provided regarding the Investment Adviser’s profitability. The Trustees also considered the breakpoints in the fee rate payable under the Management Agreements for each of the Funds at the following annual percentage rates of the average daily net assets of the Funds:
| | | | | | | | | | | | |
Average Daily
Net Assets | | Dynamic
Municipal
Income Fund | | | High Yield
Municipal
Fund | | | Short Duration
Tax-Free Fund | |
| First $1 billion | | | 0.55 | % | | | 0.55 | % | | | 0.40 | % |
| Next $1 billion | | | 0.50 | | | | 0.55 | | | | 0.36 | |
| Next $3 billion | | | 0.48 | | | | 0.50 | | | | 0.34 | |
| Next $3 billion | | | 0.47 | | | | 0.48 | | | | 0.33 | |
| Over $8 billion | | | 0.46 | | | | 0.47 | | | | 0.32 | |
The Trustees noted that the breakpoints were designed to share potential economies of scale, if any, with the Funds and their shareholders as assets under management reach those asset levels. The Trustees considered the amounts of assets in the Funds; the Funds’ recent share purchase and redemption activity; the information provided by the Investment Adviser relating to the costs of the services provided by the Investment Adviser and its affiliates and their realized profits; information comparing fee rates charged by the Investment Adviser with fee rates charged to other funds in the peer groups; and the Investment Adviser’s undertakings to waive a portion of its management fee (with respect to the Dynamic Municipal Income and Short Duration Tax-Free Funds) and to limit certain expenses of the Funds that exceed specified levels, as well as Goldman Sachs & Co. LLC’s (“Goldman Sachs”) undertaking to waive a portion of the distribution and service fees paid by the Short Duration Tax-Free Fund’s Class C Shares and a portion of the transfer agency fees paid by the High Yield Municipal and Short Duration Tax-Free Funds’ Class A, Class C, and Investor Shares. Upon reviewing these matters at the Annual Meeting, the Trustees concluded that the fee breakpoints represented a means of assuring that benefits of scalability, if any, would be passed along to shareholders at the specified asset levels. They also noted that the Investment Adviser had passed along savings to shareholders of the High Yield Municipal and Short Duration Tax-Free Funds, which each had asset levels above at least the first breakpoint during the prior fiscal year.
Other Benefits to the Investment Adviser and Its Affiliates
The Trustees also considered the other benefits derived by the Investment Adviser and its affiliates from their relationships with the Funds as stated above, including: (a) transfer agency fees received by Goldman Sachs; (b) futures commissions earned by Goldman Sachs for executing futures transactions on behalf of the Funds; (c) trading efficiencies resulting from aggregation of orders of the Funds with those for other funds or accounts managed by the Investment Adviser; (d) the Investment Adviser’s ability to leverage the infrastructure designed to service the Funds on behalf of its other clients; (e) the Investment Adviser’s ability to cross-market other products and services to Fund shareholders; (f) Goldman Sachs’ retention of certain fees as Fund Distributor; (g) the Investment Adviser’s ability to negotiate better pricing with custodians on behalf of its other clients, as a result of the relationship with the Funds; and (h) the possibility that the working relationship between the Investment Adviser and the Funds’ third-party service providers may cause those service providers to be more likely to do business with other areas of Goldman Sachs. In the course of considering the foregoing, the Independent Trustees requested and received further information quantifying certain of these fall-out benefits.
123
GOLDMAN SACHS MUNICIPAL FIXED INCOME FUNDS
Statement Regarding Basis for Approval of Management Agreements (Unaudited) (continued)
Other Benefits to the Funds and Their Shareholders
The Trustees also noted that the Funds receive certain potential benefits as a result of their relationship with the Investment Adviser, including: (a) trading efficiencies resulting from aggregation of orders of the Funds with those of other funds or accounts managed by the Investment Adviser; (b) enhanced servicing from vendors because of the volume of business generated by the Investment Adviser and its affiliates; (c) enhanced servicing from broker-dealers because of the volume of business generated by the Investment Adviser and its affiliates; (d) the Investment Adviser’s ability to negotiate favorable terms with derivatives counterparties on behalf of the Funds as a result of the size and reputation of the Goldman Sachs organization; (e) the Investment Adviser’s knowledge and experience gained from managing other accounts and products; (f) the Investment Adviser’s ability to hire and retain qualified personnel to provide services to the Funds because of the reputation of the Goldman Sachs organization; (g) the Funds’ access, through the Investment Adviser, to certain firmwide resources (e.g., proprietary risk management systems and databases), subject to certain restrictions; and (h) the Funds’ access to certain affiliated distribution channels. In addition, the Trustees noted the competitive nature of the mutual fund marketplace, and considered that many of the Funds’ shareholders invested in the Funds in part because of the Funds’ relationship with the Investment Adviser and that those shareholders have a general expectation that the relationship will continue.
Conclusion
In connection with their consideration of the Management Agreements, the Trustees gave weight to each of the factors described above, but did not identify any particular factor as controlling their decision. After deliberation and consideration of all of the information provided, including the factors described above, the Trustees concluded, in the exercise of their business judgment, that the management fees paid by each of the Funds were reasonable in light of the services provided to it by the Investment Adviser, the Investment Adviser’s costs and each Fund’s current and reasonably foreseeable asset levels. The Trustees unanimously concluded that the Investment Adviser’s continued management likely would benefit each Fund and its shareholders and that the Management Agreements should be approved and continued with respect to each applicable Fund until June 30, 2018.
124
FUNDS PROFILE
Goldman Sachs Funds
Goldman Sachs is a premier financial services firm, known since 1869 for creating thoughtful and customized investment solutions in complex global markets.
Today, the Investment Management Division of Goldman Sachs serves a diverse set of clients worldwide, including private institutions, public entities and individuals. With approximately $1.25 trillion in assets under supervision as of September 30, 2017, Goldman Sachs Asset Management (“GSAM”) has portfolio management teams located around the world and our investment professionals bring firsthand knowledge of local markets to every investment decision. Assets under supervision includes assets under management and other client assets for which Goldman Sachs does not have full discretion. GSAM leverages the resources of Goldman Sachs & Co. LLC subject to legal, internal and regulatory restrictions.
Money Market
Financial Square FundsSM
| ∎ | | Financial Square Treasury Solutions Fund1 |
| ∎ | | Financial Square Government Fund1 |
| ∎ | | Financial Square Money Market Fund2 |
| ∎ | | Financial Square Prime Obligations Fund2 |
| ∎ | | Financial Square Treasury Instruments Fund1 |
| ∎ | | Financial Square Treasury Obligations Fund1 |
| ∎ | | Financial Square Federal Instruments Fund1 |
| ∎ | | Financial Square Tax-Exempt Money Market Fund2 |
Investor FundsSM
| ∎ | | Investor Money Market Fund3 |
| ∎ | | Investor Tax-Exempt Money Market Fund3 |
Fixed Income
Short Duration and Government
| ∎ | | High Quality Floating Rate Fund |
| ∎ | | Short-Term Conservative Income Fund |
| ∎ | | Short Duration Government Fund |
| ∎ | | Short Duration Income Fund |
| ∎ | | Inflation Protected Securities Fund |
Multi-Sector
Municipal and Tax-Free
| ∎ | | High Yield Municipal Fund |
| ∎ | | Dynamic Municipal Income Fund |
| ∎ | | Short Duration Tax-Free Fund |
Single Sector
| ∎ | | Investment Grade Credit Fund |
| ∎ | | High Yield Floating Rate Fund |
| ∎ | | Emerging Markets Debt Fund |
| ∎ | | Local Emerging Markets Debt Fund |
| ∎ | | Dynamic Emerging Markets Debt Fund |
Fixed Income Alternatives
| ∎ | | Long Short Credit Strategies Fund |
Fundamental Equity
| ∎ | | Small/Mid Cap Value Fund |
| ∎ | | Small/Mid Cap Growth Fund |
| ∎ | | Concentrated Growth Fund7 |
| ∎ | | Technology Opportunities Fund |
| ∎ | | Growth Opportunities Fund |
| ∎ | | Rising Dividend Growth Fund |
Tax-Advantaged Equity
| ∎ | | U.S. Tax-Managed Equity Fund |
| ∎ | | International Tax-Managed Equity Fund |
| ∎ | | U.S. Equity Dividend and Premium Fund |
| ∎ | | International Equity Dividend and Premium Fund |
Equity Insights
| ∎ | | Small Cap Equity Insights Fund |
| ∎ | | U.S. Equity Insights Fund |
| ∎ | | Small Cap Growth Insights Fund |
| ∎ | | Large Cap Growth Insights Fund |
| ∎ | | Large Cap Value Insights Fund |
| ∎ | | Small Cap Value Insights Fund |
| ∎ | | International Small Cap Insights Fund |
| ∎ | | International Equity Insights Fund |
| ∎ | | Emerging Markets Equity Insights Fund |
Fundamental Equity International
| ∎ | | Strategic International Equity Fund |
| ∎ | | Focused International Equity Fund |
| ∎ | | Emerging Markets Equity Fund |
Select Satellite
| ∎ | | Real Estate Securities Fund |
| ∎ | | International Real Estate Securities Fund |
| ∎ | | Commodity Strategy Fund |
| ∎ | | Global Real Estate Securities Fund |
| ∎ | | Alternative Premia Fund9 |
| ∎ | | Absolute Return Tracker Fund |
| ∎ | | Managed Futures Strategy Fund |
| ∎ | | MLP Energy Infrastructure Fund |
| ∎ | | Multi-Manager Alternatives Fund |
| ∎ | | Absolute Return Multi-Asset Fund |
| ∎ | | Global Infrastructure Fund |
Total Portfolio Solutions
| ∎ | | Global Managed Beta Fund |
| ∎ | | Multi-Manager Non-Core Fixed Income Fund |
| ∎ | | Multi-Manager U.S. Dynamic Equity Fund |
| ∎ | | Multi-Manager Global Equity Fund |
| ∎ | | Multi-Manager International Equity Fund |
| ∎ | | Tactical Tilt Overlay Fund |
| ∎ | | Balanced Strategy Portfolio |
| ∎ | | Multi-Manager U.S. Small Cap Equity Fund |
| ∎ | | Multi-Manager Real Assets Strategy Fund |
| ∎ | | Growth and Income Strategy Portfolio |
| ∎ | | Growth Strategy Portfolio |
| ∎ | | Equity Growth Strategy Portfolio |
| ∎ | | Satellite Strategies Portfolio |
| ∎ | | Enhanced Dividend Global Equity Portfolio |
| ∎ | | Tax-Advantaged Global Equity Portfolio |
| ∎ | | Strategic Factor Allocation Fund |
| ∎ | | Target Date 2020 Portfolio |
| ∎ | | Target Date 2025 Portfolio |
| ∎ | | Target Date 2030 Portfolio |
| ∎ | | Target Date 2035 Portfolio |
| ∎ | | Target Date 2040 Portfolio |
| ∎ | | Target Date 2045 Portfolio |
| ∎ | | Target Date 2050 Portfolio |
| ∎ | | Target Date 2055 Portfolio |
| ∎ | | GQG Partners International Opportunities Fund |
| 1 | | You could lose money by investing in the Fund. Although the Fund seeks to preserve the value of your investment at $1.00 per share, it cannot guarantee it will do so. An investment in the Fund is not a deposit of a bank and is not insured or guaranteed by the Federal Deposit Insurance Corporation or any other government agency. The Fund’s sponsor has no legal obligation to provide financial support to the Fund, and you should not expect that the sponsor will provide financial support to the Fund at any time. |
| 2 | | You could lose money by investing in the Fund. Because the share price of the Fund will fluctuate, when you sell your shares they may be worth more or less than what you originally paid for them. The Fund may impose a fee upon sale of your shares or may temporarily suspend your ability to sell shares if the Fund’s liquidity falls below required minimums because of market conditions or other factors. An investment in the Fund is not a deposit of a bank and is not insured or guaranteed by the Federal Deposit Insurance Corporation or any other government agency. The Fund’s sponsor has no legal obligation to provide financial support to the Fund, and you should not expect that the sponsor will provide financial support to the Fund at any time. |
| 3 | | You could lose money by investing in the Fund. Although the Fund seeks to preserve the value of your investment at $1.00 per share, it cannot guarantee it will do so. The Fund may impose a fee upon sale of your shares or may temporarily suspend your ability to sell shares if the Fund’s liquidity falls below required minimums because of market conditions or other factors. An investment in the Fund is not a deposit of a bank and is not insured or guaranteed by the Federal Deposit Insurance Corporation or any other government agency. The Fund’s sponsor has no legal obligation to provide financial support to the Fund, and you should not expect that the sponsor will provide financial support to the Fund at any time. |
| 4 | | Effective on June 20, 2017, the Goldman Sachs Fixed Income Macro Strategies Fund was renamed the Goldman Sachs Strategic Macro Fund. |
| 5 | | Effective on June 20, 2017, the Goldman Sachs Growth and Income Fund was renamed the Goldman Sachs Equity Income Fund. |
| 6 | | Effective after the close of business on August 31, 2017, the Goldman Sachs Flexible Cap Growth Fund was renamed the Goldman Sachs Flexible Cap Fund. |
| 7 | | Effective on July 28, 2017, the Goldman Sachs Focused Growth Fund was reorganized with and into the Goldman Sachs Concentrated Growth Fund. |
| 8 | | Effective after the close of business on October 31, 2017, the Goldman Sachs Dynamic U.S. Equity Fund was renamed the Goldman Sachs Blue Chip Fund. |
| 9 | | Effective after the close of business on October 30, 2017, the Goldman Sachs Dynamic Allocation Fund was renamed the Goldman Sachs Alternative Premia Fund. Financial Square FundsSM and Investor FundsSM are registered service marks of Goldman Sachs & Co. LLC. |
| *This | | list covers open-end funds only. Please visit our website at www.GSAMFUNDS.com to learn about our closed-end funds and exchange-traded funds. |
| | |
TRUSTEES Ashok N. Bakhru, Chairman Kathryn A. Cassidy Diana M. Daniels Herbert J. Markley James A. McNamara Jessica Palmer Roy W. Templin Gregory G. Weaver | | OFFICERS James A. McNamara, President Scott M. McHugh, Treasurer, Senior Vice President and Principal Financial Officer Joseph F. DiMaria, Assistant Treasurer and Principal Accounting Officer Caroline L. Kraus, Secretary |
| |
GOLDMAN SACHS & CO. LLC Distributor and Transfer Agent | | GOLDMAN SACHS ASSET MANAGEMENT, L.P. Investment Adviser |
Visit our web site at www.GSAMFUNDS.com to obtain the most recent month-end returns.
Goldman Sachs Asset Management, L.P. 200 West Street, New York, New York 10282
The reports concerning the Funds included in this shareholder report may contain certain forward-looking statements about the factors that may affect the performance of the Funds in the future. These statements are based on Fund management’s predictions and expectations concerning certain future events and their expected impact on the Funds, such as performance of the economy as a whole and of specific industry sectors, changes in the levels of interest rates, the impact of developing world events, and other factors that may influence the future performance of the Funds. Management believes these forward-looking statements to be reasonable, although they are inherently uncertain and difficult to predict. Actual events may cause adjustments in portfolio management strategies from those currently expected to be employed.
A description of the policies and procedures that the Funds use to determine how to vote proxies relating to portfolio securities and information regarding how a Fund voted proxies relating to portfolio securities during the most recent 12-month period ended June 30 is available (I) without charge, upon request by calling 1-800-526-7384 (for Retail Shareholders) or 1-800-621-2550 (for Institutional Shareholders); and (II) on the Securities and Exchange Commission (“SEC”) Web site at http://www.sec.gov.
The Funds file their complete schedule of portfolio holdings with the SEC for the first and third quarters of each fiscal year on Form N-Qs. The Funds’ Form N-Qs are available on the SEC’s web site at http://www.sec.gov within 60 days after the Funds’ first and third fiscal quarters. The Funds’ Form N-Qs may be reviewed and copied at the SEC’s Public Reference Room in Washington, D.C. and information on the operation of the Public Reference Room may also be obtained by calling 1-800-SEC-0330. Form N-Qs may be obtained upon request and without charge by calling 1-800-526-7384 (for Retail Shareholders) or 1-800-621-2550 (for Institutional Shareholders).
Goldman Sachs & Co. LLC (“Goldman Sachs”) does not provide legal, tax or accounting advice. Any statement contained in this communication (including any attachments) concerning U.S. tax matters was not intended or written to be used, and cannot be used, for the purpose of avoiding penalties under the Internal Revenue Code, and was written to support the promotion or marketing of the transaction(s) or matter(s) addressed. Clients of Goldman Sachs should obtain their own independent tax advice based on their particular circumstances.
The website links provided are for your convenience only and are not an endorsement or recommendation by GSAM of any of these websites or the products or services offered. GSAM is not responsible for the accuracy and validity of the content of these websites.
Economic and market forecasts presented herein reflect our judgment as of the date of this presentation and are subject to change without notice. These forecasts do not take into account the specific investment objectives, restrictions, tax and financial situation or other needs of any specific client. Actual data will vary and may not be reflected here. These forecasts are subject to high levels of uncertainty that may affect actual performance. Accordingly, these forecasts should be viewed as merely representative of a broad range of possible outcomes. These forecasts are estimated, based on assumptions, and are subject to significant revision and may change materially as economic and market conditions change. Goldman Sachs has no obligation to provide updates or changes to these forecasts. Case studies and examples are for illustrative purposes only.
Fund holdings and allocations shown are as of September 30, 2017 and may not be representative of future investments. Fund holdings should not be relied on in making investment decisions and should not be construed as research or investment advice regarding particular securities. Current and future holdings are subject to risk.
THIS MATERIAL IS FOR INFORMATIONAL PURPOSES ONLY AND IS PROVIDED SOLELY ON THE BASIS THAT IT WILL NOT CONSTITUTE INVESTMENT OR OTHER ADVICE OR A RECOMMENDATION RELATING TO ANY PERSON’S OR PLAN’S INVESTMENT OR OTHER DECISIONS, AND GOLDMAN SACHS IS NOT A FIDUCIARY OR ADVISOR WITH RESPECT TO ANY PERSON OR PLAN BY REASON OF PROVIDING THE MATERIAL OR CONTENT HEREIN INCLUDING UNDER THE EMPLOYEE RETIREMENT INCOME SECURITY ACT OF 1974 OR DEPARTMENT OF LABOR REGULATIONS. PLAN SPONSORS AND OTHER FIDUCIARIES SHOULD CONSIDER THEIR OWN CIRCUMSTANCES IN ASSESSING ANY POTENTIAL COURSE OF ACTION.
This material is not authorized for distribution to prospective investors unless preceded or accompanied by a current Prospectus or summary prospectus, if applicable. Investors should consider a Fund’s objective, risks, and charges and expenses, and read the summary prospectus, if available, and/or the Prospectus carefully before investing or sending money. The summary prospectus, if available, and the Prospectus contain this and other information about a Fund and may be obtained from your authorized dealer or from Goldman Sachs & Co. LLC by calling (retail – 1-800-526-7384) (institutional – 1-800-621-2550).
Goldman Sachs & Co. LLC is the distributor of the Goldman Sachs Funds. © 2017 Goldman Sachs. All rights reserved. 110677-OTU-651527 TFFISAR-17/17K
Goldman Sachs Funds

| | | | |
| | |
| Semi-Annual Report | | | | September 30, 2017 |
| | |
| | | | Short Duration and Government
Fixed Income Funds |
| | | | Enhanced Income |
| | | | Government Income |
| | | | High Quality Floating Rate |
| | | | Inflation Protected Securities |
| | | | Short Duration Government |
| | | | Short Duration Income |
| | | | Short-Term Conservative Income |

Goldman Sachs Short Duration and Government Fixed Income Funds
| ∎ | | HIGH QUALITY FLOATING RATE |
| ∎ | | INFLATION PROTECTED SECURITIES |
| ∎ | | SHORT DURATION GOVERNMENT |
| ∎ | | SHORT-TERM CONSERVATIVE INCOME |
| | | | |
| | | |
| NOT FDIC-INSURED | | May Lose Value | | No Bank Guarantee |
GOLDMAN SACHS SHORT DURATION AND GOVERNMENT FIXED INCOME FUNDS
What Differentiates Goldman Sachs Asset Management’s Fixed Income Investment Process?
At Goldman Sachs Asset Management, L.P. (“GSAM”), the goal of our fixed income investment process is to provide consistent, strong performance by actively managing our portfolios within a research-intensive, risk-managed framework.
A key element of our fixed income investment philosophy is to evaluate the broadest global opportunity set to capture relative value across sectors and instruments. Our globally integrated investment process involves managing dynamically along the risk/return spectrum, as we continue to develop value-added strategies through:

| ∎ | | Assess relative value among securities and sectors |
| ∎ | | Leverage the vast resources of GSAM in selecting securities for each portfolio |

| ∎ | | Team approach to decision making |
| ∎ | | Manage risk by avoiding significant sector and interest rate bets |
| ∎ | | Careful management of yield curve strategies — while closely managing portfolio duration |

Fixed Income portfolios that:
| | ∎ | | Include domestic and global investment options, income opportunities, and access to areas of specialization such as high yield | |
| | ∎ | | Capitalize on GSAM’s industry-renowned credit research capabilities | |
| | ∎ | | Use a risk-managed framework to seek total return, recognizing the importance of investors’ capital accumulation goals as well as their need for income | |
1
MARKET REVIEW
Goldman Sachs Short Duration and Government Fixed Income Funds
Market Review
During the six months ended September 30, 2017 (the “Reporting Period”), the performance of the global fixed income markets was primarily driven by geopolitical events, improving economic growth around the world and changing market expectations about central monetary policy.
When the Reporting Period began with the second quarter of 2017, spread, or non-government bond, sectors generally recorded positive returns, though with mixed results relative to U.S. Treasury securities. Political developments led to temporary bouts of volatility early in the quarter, driving weakness in Brazilian, U.S. and U.K. fixed income assets as well as a credit rating downgrade of South Africa’s sovereign debt. Political risks receded in May 2017 on the centrist candidate’s victory in the French presidential election, which was supportive of French and European peripheral bonds broadly. On the economic front, U.S. core inflation weakened for the third consecutive month in May 2017, casting uncertainty over the pace of Federal Reserve (“Fed”) monetary tightening. Nonetheless, comments included in minutes from the Fed’s May and June 2017 policy meetings suggested an announcement about how and when the Fed would begin reducing the size of its balance sheet would be made sooner than the markets had previously anticipated. In Europe, economic data continued to surprise to the upside. At its June 2017 policy meeting, the European Central Bank (“ECB”) provided an optimistic assessment of the risks to growth, but revised downward its medium-term inflation forecasts. The ECB, Bank of Japan (“BoJ”) and Bank of England (“BoE”) left their respective monetary policies unchanged during the second calendar quarter, while the Fed raised interest rates for the second time in 2017 and the fourth time in a decade at its June 2017 policy meeting. As the quarter came to an end, a string of comments from global central bankers triggered a hawkish market reaction. (Hawkish suggests higher interest rates; opposite of dovish.) Global interest rates rose as the market anticipated a faster than expected pace of monetary policy tightening by the BoE, ECB and Bank of Canada (“BoC”). During the second quarter of 2017, the U.S. dollar weakened versus many global currencies.
During the third quarter of 2017, spread sectors broadly advanced, outperforming U.S. Treasury securities. The Fed kept its monetary policy unchanged but unveiled its plans for balance sheet normalization. (Balance sheet normalization refers to the steps the Fed will take to reverse quantitative easing and remove the substantial monetary accommodation it has provided to the economy since the financial crisis began in 2007.) This prompted a hawkish market reaction, with the U.S. dollar appreciating and yields on U.S. government bonds rising. However, the U.S. Treasury yield curve, or spectrum of maturities, only steepened modestly due to geopolitical uncertainty and mixed U.S. economic data, including weak inflation readings. (A steepening yield curve is one wherein the differential in yields between longer-term and shorter-term maturities widens.) The central banks of other developed countries also set the stage for less accommodative monetary policy. The BoE noted “a majority” of its policymakers were in favor of tightening policy “over the coming months,” while the BoC surprised the markets with two consecutive rate hikes. The market’s expectations for a BoE rate hike in November 2017, along with a constructive tone for Brexit negotiations, also drove the British pound higher versus the U.S. dollar. (Brexit refers to the U.K.’s efforts to exit the European Union.) Overall, the U.S. dollar continued to weaken relative to many global currencies during the third calendar quarter.
For the Reporting Period as a whole, spread sectors outperformed U.S. Treasury securities, led by high yield corporate bonds, sovereign emerging markets debt and investment grade
2
MARKET REVIEW
corporate bonds. Commercial mortgage-backed securities, agency securities, asset-backed securities and mortgage-backed securities also outperformed U.S. Treasuries, albeit to a lesser extent. The U.S. Treasury yield curve flattened slightly during the Reporting Period, as yields on shorter-term maturities generally rose and yields on intermediate- and longer-term maturities fell. The yield on the bellwether 10-year U.S. Treasury declined approximately seven basis points (a basis point is 1/100th of one percent) to end the Reporting Period at 2.33%. (A flattening yield curve is one wherein the differential in yields between longer-term and shorter-term maturities narrows.)
Looking Ahead
At the end of the Reporting Period, we believed global economic growth remained strong, with broad-based expansion in all corners of the world. Business investment appeared to be improving, in our view, with the drag from commodity-oriented countries fading and global trade buoyant despite protectionist rhetoric following the 2016 U.S. elections. We also note that forward-looking activity indicators, including purchasing managers’ surveys, pointed to further momentum, particularly within developed markets.
Regarding the U.S., we believe economic growth is supported by a healthy labor market and robust consumption as well as by revived proposals for fiscal stimulus toward the end of the Reporting Period. In the Eurozone, economic growth surprised to the upside, driven by consumption and trade, though we expect some moderation in the near term due to the strength of the euro. In the longer term, we expect spillover effects from Brexit. However, during the Reporting Period, the supportive global economic growth environment boosted trade and appeared to be cushioning the impact of Brexit negotiations on both the U.K. and the European Union. In Japan, economic growth surprised to the upside and consumer sentiment remained healthy despite stagnant wage growth. As for China, we expect an ongoing focus on deleveraging but think there will be little tolerance if the country’s Gross Domestic Product drops below 6.4% given policymakers’ commitment to doubling incomes and growth from their 2010 levels by the year 2020.
The expansion in global economic growth during the Reporting Period had not yet been reflected in inflation data, which remained below central bank targets in key markets. In our opinion, low inflation has been due in part to structural trends, such as increased migration, lower productivity and lower inflation expectations. We expect inflation to gradually trend higher should labor markets tighten further and output gaps diminish. (The output gap is an economic measure of the difference between the actual output of an economy and its potential output.)
As for central bank policy, the job-rich recovery has resulted in a shift in tone. In our view, the Fed’s plans to normalize its balance sheet marks the beginning of an era of less monetary accommodation. Also, by the end of 2017, we expect the ECB to communicate its plans to reduce asset purchases through its quantitative easing program with tapered purchases likely to continue, we believe, through 2018. In the U.K., we see scope for a BoE rate hike in November 2017 given policymakers’ recent communications. Meanwhile, the BoC has commenced a rate hiking cycle, though we expect the trajectory for its future rate hikes to be shallower than in the U.S.
Overall, at the end of the Reporting Period, we believed the macro backdrop of solid economic growth, subdued inflation and contained volatility was supportive for riskier asset classes. We saw opportunities in high-yielding emerging market currencies versus the U.S. dollar. That
3
MARKET REVIEW
said, proposed U.S. tax reform could be inflationary and require more monetary tightening than currently expected. This would likely be supportive for the U.S. dollar, particularly if we see more hawkish leadership at the Fed.
Among spread sectors, we remained cautious about corporate bonds at the end of the Reporting Period, given that the U.S. is in the late stage of the credit cycle and because of extended valuations, in our view. When the Reporting Period concluded, corporate credit spreads (yield differentials versus duration-equivalent U.S. Treasury securities) were near historically tight levels. We think this makes corporate credit vulnerable to a sharp pickup in volatility, which could arise from several catalysts, including an unwinding of global central bank quantitative easing programs, an inflation surprise that leads to a more hawkish monetary policy outlook than the market had previously priced in, increasing geopolitical tensions and/or missteps by central bank policymakers, particularly in China. Overall, at the end of the Reporting Period, we continued to see value in Federal Family Education Loan Program (“FFELP”) student loan asset backed securities, which we believe offer attractive yields along with strong credit protection. We also had a positive view of collateralized loan obligations and residential mortgage-backed securities. Within residential mortgage-backed securities, we favored legacy non-agency mortgage backed securities (in general, those issued before the 2008-2009 financial crisis), which should continue to benefit, in our opinion, from low supply and improving collateral performance.
4
PORTFOLIO RESULTS
Goldman Sachs Enhanced Income Fund
Investment Objective
The Fund seeks to generate return in excess of traditional money market products while maintaining an emphasis on preservation of capital and liquidity.
Portfolio Management Discussion and Analysis
Below, the Goldman Sachs U.S. Fixed Income Investment Management Team discusses the Goldman Sachs Enhanced Income Fund’s (the “Fund”) performance and positioning for the six-month period ended September 30, 2017 (the “Reporting Period”).
| Q | | How did the Fund perform during the Reporting Period? |
| A | | During the Reporting Period, the Fund’s Class A, Institutional, Administration, Investor and Class R6 Shares generated cumulative total returns, without sales charges, of 0.55%, 0.72%, 0.59%, 0.67% and 0.73%, respectively. These returns compare to the 0.47% cumulative total return of the Goldman Sachs Enhanced Income Fund Composite Index (the “Enhanced Income Composite”) during the same period. The Enhanced Income Composite is comprised 50% of the Bank of America Merrill Lynch Six-Month U.S. Treasury Bill Index (“BofA ML Six-Month U.S. Treasury Bill Index”) and 50% of the Bank of America Merrill Lynch One-Year U.S. Treasury Note Index (“BofA ML One-Year U.S. Treasury Note Index”), which generated cumulative total returns of 0.55% and 0.39%, respectively, over the same time period. |
| Q | | What key factors were responsible for the Fund’s performance during the Reporting Period? |
| A | | Both bottom-up and top-down strategies had an impact on the Fund’s performance during the Reporting Period. Bottom-up individual issue selection amongst short-dated corporate bonds, U.S. Treasuries and securitized bonds boosted results, while selection amongst high quality corporate securities detracted from the Fund performance. |
| | Within our top-down strategies, our cross-sector strategy contributed positively to the Fund’s results during the Reporting Period. Our cross-sector strategy is one in which we invest Fund assets across a variety of fixed income sectors, including some that may not be included in the Fund’s benchmark. Our duration and yield curve positioning strategy detracted from the Fund’s results during the Reporting Period. Duration is a measure of the Fund’s sensitivity to changes in interest rates. Yield curve indicates the spectrum of maturities within a particular sector. |
| | The duration and government/swaps selection strategies are primarily implemented via interest rate swaps and/ or futures. Derivatives are used in combination with cash securities to implement our views in the Fund. |
| Q | | Which fixed income market sectors most significantly affected Fund performance? |
| A | | Our individual security selection strategies overall contributed most positively to the Fund’s relative results during the Reporting Period, especially individual selection of short-dated investment grade industrial and financial corporate bonds. Within the government/swaps sector, our selection of short-dated U.S. Treasury swaps proved particularly effective. Within the securitized sector, selection of asset-backed securities added the most value. These gains were slightly offset by selection of higher quality corporate bonds and Treasury inflation protected securities (“TIPS”), which detracted. |
| | Overall, our cross-sector strategy also contributed positively to the Fund’s results during the Reporting Period due mostly to the Fund’s exposure to corporate bonds and asset-backed securities. Investment grade corporate bonds strengthened during the Reporting Period with spreads, or yield differentials to U.S. Treasuries, tightening on improving U.S. economic data and rising consumer confidence. These gains were slightly offset by the Fund’s exposure to U.S. Treasury swaps, which detracted. The government/swaps selection strategy is primarily implemented via interest rate swaps and/or futures. |
5
PORTFOLIO RESULTS
| Q | | Did the Fund’s duration and yield curve positioning strategy help or hurt its results during the Reporting Period? |
| A | | Tactical management of the Fund’s duration and yield curve positioning detracted from Fund performance during the Reporting Period, largely due to tactical U.S. duration positioning. During the Reporting Period, U.S. Treasury yields pushed higher at the front, or short-term, end of the yield curve in response to interest rate hikes by the Federal Reserve (the “Fed”). However, the intermediate and long- term ends of the U.S. Treasury yield curve rallied, or moved lower, on political uncertainty, increased geopolitical risks and fewer positive economic surprises. In particular, soft inflation data throughout 2017 year-to-date weighed on market expectations for further interest rate hikes by the Fed. While we recognized recent weakness in inflation, we maintained the Fund’s underweight U.S. duration position relative to that of the Enhanced Income Composite given our expectations that global economic growth is likely to remain strong and that tightness in the labor market and easy financial conditions may warrant further monetary tightening in the U.S. We also expected inflation to rebound from recent weakness should wage growth begin to emerge. |
| Q | | How did the Fund use derivatives and similar instruments during the Reporting Period? |
| A | | The Fund used Treasury futures and Eurodollar futures during the Reporting Period for the purpose of managing the duration and term structure of the Fund. (Term structure, most often depicted as a yield curve, refers to the term structure of interest rates, which is the relationship between the yield to maturity and the time to maturity for pure discount bonds.) The use of derivatives did not have a material impact on the Fund’s performance during the Reporting Period. |
| Q | | Were there any notable changes in the Fund’s weightings during the Reporting Period? |
| A | | The Fund’s allocations to asset-backed securities and investment grade corporate bonds, as measured by contribution to duration, decreased during the Reporting Period. A corresponding increase in allocation was concentrated in agency debentures. Additionally, while the Fund’s overall duration positioning remained the same through the Reporting Period, we did make adjustments in weightings along the U.S. Treasury yield curve as market conditions changed. |
| Q | | How was the Fund positioned relative to its benchmark index at the end of September 2017? |
| A | | While the Fund’s benchmark is based on U.S. Treasuries, the Fund continued to hold a portion of its assets in non-Treasury sectors not represented in the Enhanced Income Composite. Indeed, the Fund maintained exposures to high quality spread, or non-Treasury, sectors throughout the Reporting Period, most notably investment grade corporate bonds, asset-backed securities and quasi-government securities. The Fund maintained an underweighted exposure to government bonds at the end of the Reporting Period. The Fund also had a significant position in cash at the end of the Reporting Period. Further, the Fund maintained a shorter duration position than that of the Enhanced Income Composite at the end of the Reporting Period, as we expect the Fed to further tighten monetary policy toward the end of 2017 and into 2018 should economic growth continue to improve. |
6
FUND BASICS
Enhanced Income Fund
as of September 30, 2017
| | | | | | | | | | | | | | | | | | | | | | | | | | |
| | PERFORMANCE REVIEW | |
| | | April 1, 2017–
September 30, 2017 | | Fund Total Return (based on NAV)1 | | | Enhanced Income Composite2 | | | BofA ML
Six-Month
U.S. Treasury
Bill Index3 | | | BofA ML
One-Year
U.S. Treasury
Note Index3 | | | 30-Day
Standardized
Subsidized Yield4 | | | 30-Day
Standardized Unsubsidized Yield4 | |
| | Class A | | | 0.55 | % | | | 0.47 | % | | | 0.55 | % | | | 0.39 | % | | | 0.97 | % | | | 0.96 | % |
| | Institutional | | | 0.72 | | | | 0.47 | | | | 0.55 | | | | 0.39 | | | | 1.32 | | | | 1.31 | |
| | Administration | | | 0.59 | | | | 0.47 | | | | 0.55 | | | | 0.39 | | | | 1.07 | | | | 1.06 | |
| | Investor | | | 0.67 | | | | 0.47 | | | | 0.55 | | | | 0.39 | | | | 1.23 | | | | 1.22 | |
| | | Class R6 | | | 0.73 | | | | 0.47 | | | | 0.55 | | | | 0.39 | | | | 1.27 | | | | 1.31 | |
| | 1 | | The net asset value (NAV) represents the net assets of the class of the Fund (ex-dividend) divided by the total number of shares of the class outstanding. The Fund’s performance assumes the reinvestment of dividends and other distributions. The Fund’s performance does not reflect the deduction of any applicable sales charges. |
| | 2 | | The Enhanced Income Composite is an equal weight blend of the BofA ML Six-Month U.S. Treasury Bill Index and the BofA ML One-Year U.S. Treasury Note Index. |
| | 3 | | The BofA ML Six-Month U.S. Treasury Bill Index measures the performance of Treasury Bill with time to maturity of less than 6 months. The BofA ML One-Year U.S. Treasury Note Index is an unmanaged index that tracks the performance of the direct sovereign debt of the U.S. Government having a maturity of at least one year. The BofA ML Six-Month U.S. Treasury Bill Index and BofA ML One-Year U.S. Treasury Note Index, as reported by Bank of America Merrill Lynch, do not reflect any deduction for fees, expenses or taxes. It is not possible to invest directly in an index. |
| | 4 | | The method of calculation of the 30-Day Standardized Subsidized Yield is mandated by the Securities and Exchange Commission and is determined by dividing the net investment income per share earned during the last 30 days of the period by the maximum public offering price (“POP”) per share on the last day of the period. This number is then annualized. The 30-Day Standardized Subsidized Yield reflects fee waivers and/or expense reimbursements recorded by the Fund during the period. Without waivers and/or reimbursements, yields would be reduced. This yield does not necessarily reflect income actually earned and distributed by the Fund and, therefore, may not be correlated with the dividends or other distributions paid to shareholders. The 30-Day Standardized Unsubsidized Yield does not adjust for any fee waivers and/or expense reimbursements in effect. If the Fund does not incur any fee waivers and/or expense reimbursements during the period, the 30-Day Standardized Subsidized Yield and 30-Day Standardized Unsubsidized Yield will be identical. |
The returns set forth in the table above represent past performance. Past performance does not guarantee future results. The Fund’s investment return and principal value will fluctuate so that an investor’s shares, when redeemed, may be worth more or less than their original cost. Current performance may be lower or higher than the performance quoted above. Please visit our web site at www.GSAMFUNDS.com to obtain the most recent month-end returns. Performance reflects applicable fee waivers and/or expense limitations in effect during the periods shown. In their absence, performance would be reduced. Returns do not reflect the deduction of taxes that a shareholder would pay on Fund distributions or the redemption of Fund shares.
7
FUND BASICS
| | | | | | | | | | | | | | | | | | | | |
| | STANDARDIZED TOTAL RETURNS5 |
| | | For the period ended 9/30/17 | | One Year | | | Five Years | | | Ten Years | | | Since Inception | | | Inception Date |
| | Class A | | | -0.37 | % | | | 0.06 | % | | | 0.75 | % | | | 1.87 | % | | 8/2/00 |
| | Institutional | | | 1.45 | | | | 0.71 | | | | 1.25 | | | | 2.32 | | | 8/2/00 |
| | Administration | | | 1.20 | | | | 0.44 | | | | 1.01 | | | | 2.08 | | | 8/2/00 |
| | Investor | | | 1.36 | | | | 0.60 | | | | N/A | | | | 0.60 | | | 7/30/10 |
| | | Class R6 | | | 1.47 | | | | N/A | | | | N/A | | | | 1.31 | | | 7/31/15 |
| | 5 | | The Standardized Total Returns are average annual total returns or cumulative total returns (only if the performance period is one year or less) as of the most recent calendar quarter-end. They assume reinvestment of all distributions at NAV. These returns reflect a maximum initial sales charge of 1.5% for Class A Shares. Because Institutional Shares, Administration Shares, Investor Shares and Class R6 Shares do not involve a sales charge, such a charge is not applied to their Standardized Total Returns. |
The returns set forth in the table above represent past performance. Past performance does not guarantee future results. The Fund’s investment return and principal value will fluctuate so that an investor’s shares, when redeemed, may be worth more or less than their original cost. Current performance may be lower or higher than the performance quoted above. Please visit our web site at www.GSAMFUNDS.com to obtain the most recent month-end returns. Performance reflects applicable fee waivers and/or expense limitations in effect during the periods shown. In their absence, performance would be reduced. Returns do not reflect the deduction of taxes that a shareholder would pay on Fund distributions or the redemption of Fund shares.
| | | | | | | | | | |
| | EXPENSE RATIOS6 | |
| | | | | Net Expense Ratio (Current) | | | Gross Expense Ratio (Before Waivers) | |
| | Class A | | | 0.69 | % | | | 0.70 | % |
| | Institutional | | | 0.35 | | | | 0.36 | |
| | Administration | | | 0.60 | | | | 0.61 | |
| | Investor | | | 0.44 | | | | 0.45 | |
| | | Class R6 | | | 0.34 | | | | 0.35 | |
| | 6 | | The expense ratios of the Fund, both current (net of applicable fee waivers and/or expense limitations) and before waivers (gross of applicable fee waivers and/or expense limitations) are as set forth above according to the most recent publicly available Prospectus for the Fund and may differ from the expense ratios disclosed in the Financial Highlights in this report. Pursuant to a contractual arrangement, the Fund’s waivers and/or expense limitations will remain in place through at least July 28, 2018, and prior to such date the investment adviser may not terminate the arrangements without the approval of the Fund’s Board of Trustees. If these arrangements are discontinued in the future, the expense ratios may change without shareholder approval. |
8
FUND BASICS
|
| FUND COMPOSITION7 |
| Percentage of Net Assets |

| | 7 | | The percentage shown for each investment category reflects the value of investments in that category as a percentage of net assets. Short-term investments represent certificates of deposits and commercial papers. Figures in the graph may not sum to 100% due to the exclusion of other assets and liabilities. The graph depicts the Fund’s investments but may not represent the Fund’s market exposure due to the exclusion of certain derivatives, if any, as listed in the Additional Investment Information section of the Schedule of Investments. |
9
PORTFOLIO RESULTS
Goldman Sachs Government Income Fund
Investment Objective
The Fund seeks a high level of current income, consistent with safety of principal.
Portfolio Management Discussion and Analysis
Below, the Goldman Sachs U.S. Fixed Income Investment Management Team discusses the Goldman Sachs Government Income Fund’s (the “Fund”) performance and positioning for the six-month period ended September 30, 2017 (the “Reporting Period”).
| Q | | How did the Fund perform during the Reporting Period? |
| A | | During the Reporting Period, the Fund’s Class A, Class C, Institutional, Service, Investor, Class R and Class R6 Shares generated cumulative total returns, without sales charges, of 1.35%, 0.97%, 1.45%, 1.27%, 1.47%, 1.22% and 1.53%, respectively. These returns compare to the 1.68% cumulative total return of the Fund’s benchmark, the Bloomberg Barclays U.S. Government/Mortgage Index (the “Bloomberg Barclays Index”), during the same time period. |
| Q | | What key factors were responsible for the Fund’s performance during the Reporting Period? |
| A | | Both top-down and bottom-up strategies had an impact on the Fund’s performance during the Reporting Period. Within our top-down strategies, our duration strategy detracted from the Fund’s performance during the Reporting Period. The duration strategy is typically implemented via interest rate swaps and/or futures. Duration is a measure of the Fund’s sensitivity to changes in interest rates. |
| | Our cross-sector strategy contributed positively to the Fund’s results during the Reporting Period. Our cross-sector strategy is one in which we invest Fund assets across a variety of fixed income sectors, including some that may not be included in the Fund’s benchmark. |
| | Bottom-up individual issue selection overall also contributed positively, although selection amongst mortgage-backed securities detracted. |
| Q | | Which fixed income market sectors most significantly affected Fund performance? |
| A | | Within our cross-sector strategy, the Fund’s underweight exposure to agency mortgage-backed securities relative to the Bloomberg Barclays Index detracted from performance, especially in September 2017. Strong demand for agency mortgage-backed securities boosted the sector, as spreads, or yield differentials to U.S. Treasuries, tightened into the end of the third calendar quarter. Fund results were also dampened by having an exposure to Treasury inflation protected securities (“TIPS”), which posted weak performance overall, driven by disappointing U.S. inflation data. On the positive side, an overweight to asset-backed securities added value. A tactical allocation to agency debentures, and selection of individual bonds within the sector, further aided the Fund’s performance. |
| | Individual issue selection among mortgage-backed securities detracted most from the Fund’s relative results, especially among agency mortgage-backed securities. An emphasis on higher coupon agency mortgage-backed securities hurt amid an environment of lower mortgage rates, a flatter yield curve and subdued interest rate volatility. (A flatter yield curve is one in which the yield differential between shorter-term and longer-term maturities narrows.) Partially offsetting this detractor was individual issue selection of Federal Family Education Loan Program (“FFELP”) asset-backed securities, which contributed positively. |
| Q | | Did the Fund’s duration and yield curve positioning strategy help or hurt its results during the Reporting Period? |
| A | | The Fund’s duration positioning modestly detracted from the Fund’s relative results during the Reporting Period. The Fund maintained a shorter duration than that of the Bloomberg Barclays Index through most of the Reporting Period due to strong labor market data coupled with our anticipation of tightening action from the Federal Reserve (the “Fed”). We even shifted to a more significantly shorter duration relative to that of the Bloomberg Barclays Index |
10
PORTFOLIO RESULTS
| | toward the end of the Reporting Period in anticipation of further interest rate increases by the Fed amidst improving macroeconomic data in the U.S. |
| | The Fund’s yield curve positioning contributed positively, albeit modestly, to the Fund’s relative results during the Reporting Period. The U.S. Treasury yield curve flattened during the Reporting Period, as yields at the short-term end of the curve, or spectrum of maturities, rose in response to Fed policy tightening. However, yields on 10-year U.S. Treasuries declined. Low yields on government bonds in developed markets outside of the U.S., as well as heightened geopolitical tensions, helped keep longer U.S. Treasury yields anchored overall. |
| Q | | How did the Fund use derivatives and similar instruments during the Reporting Period? |
| A | | The Fund used Treasury futures, Eurodollar futures and bond exchange traded futures contracts to hedge interest rate exposure, i.e., to manage exposure to fluctuations in interest rates, and to facilitate specific duration and yield curve strategies. Interest rate swaps were used to hedge interest rate exposure and express an outright duration and term structure view. (Term structure, most often depicted as a yield curve, refers to the term structure of interest rates, which is the relationship between the yield to maturity and the time to maturity for pure discount bonds.) The Fund employed swaptions (or options on interest rate swap contracts) to hedge and express an outright term structure view and to help manage volatility. The Fund used forward contracts to help manage duration. Derivatives generally dampened relative performance during the Reporting Period. |
| | Overall, we employ derivatives for the efficient management of the Fund’s portfolio. Derivatives and similar instruments allow us to manage interest rate risks more effectively by allowing us both to apply active investment views with greater versatility and to afford greater risk management precision than we would otherwise be able to implement. |
| Q | | Were there any notable changes in the Fund’s weightings during the Reporting Period? |
| A | | We moved to a greater underweight in the Fund’s allocation to agency mortgage-backed securities, as we expected spreads to widen in response to both the impending tapering of agency mortgage-backed securities reinvestments by the Fed and increased interest rate volatility. Conversely, we gradually increased the Fund’s overweight relative to the Bloomberg Barclays Index in asset-backed securities, particularly FFELP asset-backed securities, as we favored what we saw as their strong credit protection and attractive spreads. Additionally, as mentioned earlier, we modestly shifted the Fund’s duration positioning during the Reporting Period as market conditions changed. |
| Q | | How was the Fund positioned relative to its benchmark index at the end of September 2017? |
| A | | At the end of September 2017, the Fund had overweighted allocations relative to the Bloomberg Barclays Index on a market-value weighted basis in asset-backed securities and in quasi-government securities such as agency debentures. The Fund was underweight relative to the Bloomberg Barclays Index in U.S. Treasury securities and in residential mortgage-backed securities, specifically pass-through mortgage-backed securities. The Fund had a rather neutral exposure to commercial mortgage-backed securities and also had an exposure to TIPS, which are not a component of the Bloomberg Barclays Index. The Fund had a shorter duration than that of the Bloomberg Barclays Index at the end of the Reporting Period. |
11
FUND BASICS
Government Income Fund
as of September 30, 2017
| | | | | | | | | | | | | | | | | | |
| | PERFORMANCE REVIEW | |
| | | April 1, 2017–
September 30, 2017 | | Fund Total
Return
(based on NAV)1 | | | Barclays
Index2 | | | 30-Day
Standardized
Subsidized
Yield3 | | | 30-Day
Standardized
Unsubsidized
Yield3 | |
| | Class A | | | 1.35 | % | | | 1.68 | % | | | 0.76 | % | | | 0.64 | % |
| | Class C | | | 0.97 | | | | 1.68 | | | | 0.05 | | | | -0.08 | |
| | Institutional | | | 1.45 | | | | 1.68 | | | | 1.13 | | | | 1.00 | |
| | Service | | | 1.27 | | | | 1.68 | | | | 0.63 | | | | 0.50 | |
| | Investor | | | 1.47 | | | | 1.68 | | | | 1.04 | | | | 0.91 | |
| | Class R | | | 1.22 | | | | 1.68 | | | | 0.54 | | | | 0.41 | |
| | | Class R6 | | | 1.53 | | | | 1.68 | | | | 1.14 | | | | 1.01 | |
| | 1 | | The net asset value (NAV) represents the net assets of the class of the Fund (ex-dividend) divided by the total number of shares of the class outstanding. The Fund’s performance assumes the reinvestment of dividends and other distributions. The Fund’s performance does not reflect the deduction of any applicable sales charges. |
| | 2 | | The Bloomberg Barclays Index, an unmanaged index, measures the performance of U.S. government bonds and mortgage-related securities. The Bloomberg Barclays Index does not reflect any deduction for fees, expenses or taxes. It is not possible to invest directly in an index. |
| | 3 | | The method of calculation of the 30-Day Standardized Subsidized Yield is mandated by the Securities and Exchange Commission and is determined by dividing the net investment income per share earned during the last 30 days of the period by the maximum public offering price (“POP”) per share on the last day of the period. This number is then annualized. The 30-Day Standardized Subsidized Yield reflects fee waivers and/or expense reimbursements recorded by the Fund during the period. Without waivers and/or reimbursements, yields would be reduced. This yield does not necessarily reflect income actually earned and distributed by the Fund and, therefore, may not be correlated with the dividends or other distributions paid to shareholders. The 30-Day Standardized Unsubsidized Yield does not adjust for any fee waivers and/or expense reimbursements in effect. If the Fund does not incur any fee waivers and/or expense reimbursements during the period, the 30-Day Standardized Subsidized Yield and 30-Day Standardized Unsubsidized Yield will be identical. |
The returns set forth in the table above represent past performance. Past performance does not guarantee future results. The Fund’s investment return and principal value will fluctuate so that an investor’s shares, when redeemed, may be worth more or less than their original cost. Current performance may be lower or higher than the performance quoted above. Please visit our web site at www.GSAMFUNDS.com to obtain the most recent month-end returns. Performance reflects applicable fee waivers and/or expense limitations in effect during the periods shown. In their absence, performance would be reduced. Returns do not reflect the deduction of taxes that a shareholder would pay on Fund distributions or the redemption of Fund shares.
12
FUND BASICS
| | | | | | | | | | | | | | | | | | | | |
| | STANDARDIZED TOTAL RETURNS4 |
| | | For the period ended 9/30/17 | | One Year | | | Five Years | | | Ten Years | | | Since Inception | | | Inception Date |
| | Class A | | | -4.75 | % | | | 0.12 | % | | | 2.72 | % | | | 4.59 | % | | 2/10/93 |
| | Class C | | | -2.75 | | | | 0.15 | | | | 2.35 | | | | 3.51 | | | 8/15/97 |
| | Institutional | | | -0.77 | | | | 1.22 | | | | 3.45 | | | | 4.66 | | | 8/15/97 |
| | Service | | | -1.20 | | | | 0.73 | | | | 2.94 | | | | 4.14 | | | 8/15/97 |
| | Investor | | | -0.79 | | | | 1.14 | | | | N/A | | | | 3.12 | | | 11/30/07 |
| | Class R | | | -1.35 | | | | 0.63 | | | | N/A | | | | 2.63 | | | 11/30/07 |
| | | Class R6 | | | -0.75 | | | | N/A | | | | N/A | | | | 1.58 | | | 7/31/15 |
| | 4 | | The Standardized Total Returns are average annual total returns or cumulative total returns (only if the performance period is one year or less) as of the most recent calendar quarter-end. They assume reinvestment of all distributions at NAV. These returns reflect a maximum initial sales charge of 3.75% for Class A Shares, and the assumed contingent deferred sales charge for Class C Shares (1% if redeemed within 12 months of purchase). Prior to July 29, 2009, the maximum initial sales charge applicable to Class A Shares was 4.5%, which is not reflected in the figures shown. Because Institutional Shares, Service Shares, Investor Shares, Class R Shares and Class R6 Shares do not involve a sales charge, such a charge is not applied to their Standardized Total Returns. |
The returns set forth in the table above represent past performance. Past performance does not guarantee future results. The Fund’s investment return and principal value will fluctuate so that an investor’s shares, when redeemed, may be worth more or less than their original cost. Current performance may be lower or higher than the performance quoted above. Please visit our web site at www.GSAMFUNDS.com to obtain the most recent month-end returns. Performance reflects applicable fee waivers and/or expense limitations in effect during the periods shown. In their absence, performance would be reduced. Returns do not reflect the deduction of taxes that a shareholder would pay on Fund distributions or the redemption of Fund shares.
| | | | | | | | | | |
| | EXPENSE RATIOS5 | |
| | | | | Net Expense Ratio (Current) | | | Gross Expense Ratio (Before Waivers) | |
| | Class A | | | 0.92 | % | | | 1.06 | % |
| | Class C | | | 1.67 | | | | 1.81 | |
| | Institutional | | | 0.58 | | | | 0.72 | |
| | Service | | | 1.08 | | | | 1.22 | |
| | Investor | | | 0.67 | | | | 0.81 | |
| | Class R | | | 1.17 | | | | 1.31 | |
| | | Class R6 | | | 0.56 | | | | 0.70 | |
| | 5 | | The expense ratios of the Fund, both current (net of applicable fee waivers and/or expense limitations) and before waivers (gross of applicable fee waivers and/or expense limitations) are as set forth above according to the most recent publicly available Prospectus for the Fund and may differ from the expense ratios disclosed in the Financial Highlights in this report. Pursuant to a contractual arrangement, the Fund’s waivers and/or expense limitations will remain in place through at least July 28, 2018, and prior to such date the Investment Adviser may not terminate the arrangements without the approval of the Fund’s Board of Trustees. If these arrangements are discontinued in the future, the expense ratios may change without shareholder approval. |
13
FUND BASICS
| | | | | | |
| | SECTOR ALLOCATIONS6 |
| | | Percentage of Net Assets |
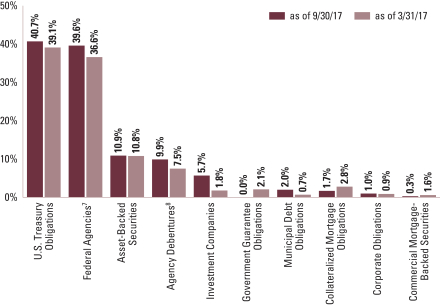
| | 6 | | The percentage shown for each investment category reflects the value of investments in that category as a percentage of net assets. Figures in the graph may not sum to 100% due to the exclusion of other assets and liabilities. The graph depicts the Fund’s investments but may not represent the Fund’s market exposure due to the exclusion of certain derivatives, if any, as listed in the Additional Investment Information section of the Schedule of Investments. |
| | 7 | | “Federal Agencies” are mortgage-backed securities guaranteed by the Government National Mortgage Association (“GNMA”), Federal National Mortgage Association (“FNMA”) and Federal Home Loan Mortgage Corp. (“FHLMC”). GNMA instruments are backed by the full faith and credit of the U.S. Government. |
| | 8 | | “Agency Debentures” include agency securities offered by companies such as FNMA and Federal Home Loan Bank (“FHLB”), which operate under a government charter. While they are required to report to a government regulator, their assets are not explicitly guaranteed by the government and they otherwise operate like any other publicly traded company. |
14
PORTFOLIO RESULTS
Goldman Sachs High Quality Floating Rate Fund
Investment Objective
The Fund seeks a high level of current income, consistent with low volatility of principal.
Portfolio Management Discussion and Analysis
Below, the Goldman Sachs U.S. Fixed Income Investment Management Team discusses the Goldman Sachs High Quality Floating Rate Fund’s (the “Fund”) performance and positioning for the six-month period ended September 30, 2017 (the “Reporting Period”).
| Q | | How did the Fund perform during the Reporting Period? |
| A | | During the Reporting Period, the Fund’s Class A, Institutional, Service, Investor and Class R6 Shares generated cumulative total returns, without sales charges, of 0.64%, 0.81%, 0.44%, 0.77% and 0.70%, respectively. These returns compare to the 0.47% cumulative total return of the Fund’s benchmark, the Bank of America Merrill Lynch Three-Month U.S. Treasury Bill Index (“BofA ML Three-Month U.S. Treasury Bill Index”). |
| Q | | What key factors were responsible for the Fund’s performance during the Reporting Period? |
| A | | Both bottom-up and top-down strategies had an impact on the Fund’s performance during the Reporting Period. Bottom-up individual issue selection overall added value. Within our top-down strategies, our cross-sector strategy contributed most positively to the Fund’s results during the Reporting Period. Our cross-sector strategy is one in which we invest Fund assets across a variety of fixed income sectors, including some that may not be included in the Fund’s benchmark. Our duration and yield curve positioning strategy detracted, albeit only modestly, from Fund performance. Duration is a measure of the Fund’s sensitivity to changes in interest rates. Yield curve indicates the spectrum of maturities within a particular sector. |
| | The duration and government/swaps selection strategies are primarily implemented via interest rate swaps and/ or futures. Derivatives are used in combination with cash securities to implement our views in the Fund. |
| Q | | Which fixed income market sectors most significantly affected Fund performance? |
| A | | Cross-sector positioning was the primary positive contributor to the Fund’s results during the Reporting Period, especially exposure to agency mortgage-backed securities. Agency mortgage-backed securities significantly outperformed duration-neutral U.S. Treasuries, especially during the third calendar quarter, due to multi-decade low volatility coupled with 10-year U.S. Treasury yields selling off substantially. Strong demand, specifically from mortgage real estate investment trusts (“REITs”), also helped the mortgage-backed securities sector, as spreads, or yield differentials to U.S. Treasuries, tightened. The Fund’s exposure to collateralized loan obligations (“CLOs”) and asset-backed securities also proved beneficial to relative results during the Reporting Period. These gains were slightly offset by the Fund’s exposure to U.S. Treasury swaps, which detracted. |
| | Overall, individual security selection contributed positively to the Fund’s relative results. Individual issue selection of U.S. Treasuries within the government/swaps sector was additive to relative results during the Reporting Period, while selection of Treasury inflation protected securities (“TIPS”) detracted. Within the securitized sector, selection of asset-backed securities added value, while selection of CLOs detracted. |
| Q | | Did the Fund’s duration and yield curve positioning strategy help or hurt its results during the Reporting Period? |
| A | | Tactical management of the Fund’s duration and yield curve positioning detracted, albeit only modestly, from its results during the Reporting Period. During the Reporting Period, U.S. Treasury yields pushed higher at the front, or short-term, end of the yield curve in response to interest rate hikes |
15
PORTFOLIO RESULTS
| | by the Federal Reserve (the “Fed”). However, the intermediate and long-term ends of the U.S. Treasury yield curve rallied, or moved lower, on political uncertainty, increased geopolitical risks and fewer positive economic surprises. In particular, soft inflation data throughout 2017 year-to-date weighed on market expectations for further interest rate hikes by the Fed. While we recognized recent weakness in inflation, we maintained the Fund’s underweight U.S. duration position relative to that of the BofA ML Three-Month U.S. Treasury Bill Index given our expectations that global economic growth is likely to remain strong and that tightness in the labor market and easy financial conditions may warrant further monetary tightening in the U.S. We also expected inflation to rebound from recent weakness should wage growth begin to emerge. |
| Q | | How did the Fund use derivatives and similar instruments during the Reporting Period? |
| A | | The Fund used Treasury futures and Eurodollar futures, as well as interest rate swaps and options, during the Reporting Period for the purpose of managing the duration and term structure of the Fund. (Term structure, most often depicted as a yield curve, refers to the term structure of interest rates, which is the relationship between the yield to maturity and the time to maturity for pure discount bonds.) Derivatives did not have a material impact, on a net basis, on the Fund’s performance during the Reporting Period. |
| Q | | Were there any notable changes in the Fund’s weightings during the Reporting Period? |
| A | | The Fund’s allocations to asset-backed securities and agency collateralized mortgage obligations increased during the Reporting Period. There was a corresponding decrease in exposure to cash. As measured by contribution to duration, the Fund’s allocation to government securities decreased. Additionally, while the Fund’s overall duration positioning remained the same through the Reporting Period, we did make adjustments in weightings along the U.S. Treasury yield curve as market conditions changed. |
| Q | | How was the Fund positioned relative to its benchmark index at the end of September 2017? |
| A | | While the Fund’s benchmark is based on U.S. Treasuries, the Fund held a significant portion of its assets in non-Treasury sectors not represented in the benchmark index at the end of the Reporting Period. Indeed, the Fund maintained exposures to high quality spread, or non-Treasury, sectors throughout the Reporting Period, most notably agency mortgage-backed securities and asset-backed securities. The Fund maintained an underweighted exposure to government bonds at the end of the Reporting Period. Further, the Fund maintained a shorter duration position than that of the BofA ML Three-Month U.S. Treasury Bill Index at the end of the Reporting Period, as we expect the Fed to further tighten monetary policy toward the end of 2017 and into 2018 should economic growth continue to improve. |
16
FUND BASICS
High Quality Floating Rate Fund
as of September 30, 2017
| | | | | | | | | | | | | | | | | | |
| | PERFORMANCE REVIEW | |
| | | April 1, 2017–
September 30, 2017 | | Fund Total
Return (based on NAV)1 | | | BofA ML
Three-Month
U.S. Treasury
Bill Index2 | | | 30-Day
Standardized
Subsidized
Yield3 | | | 30-Day
Standardized
Unsubsidized
Yield3 | |
| | Class A | | | 0.64 | % | | | 0.47 | % | | | 1.09 | % | | | 1.05 | % |
| | Institutional | | | 0.81 | | | | 0.47 | | | | 1.45 | | | | 1.40 | |
| | Service | | | 0.44 | | | | 0.47 | | | | 0.95 | | | | 0.91 | |
| | Investor | | | 0.77 | | | | 0.47 | | | | 1.36 | | | | 1.31 | |
| | | Class R6 | | | 0.70 | | | | 0.47 | | | | 1.37 | | | | 1.45 | |
| | 1 | | The net asset value (NAV) represents the net assets of the class of the Fund (ex-dividend) divided by the total number of shares of the class outstanding. The Fund’s performance assumes the reinvestment of dividends and other distributions. The Fund’s performance does not reflect the deduction of any applicable sales charges. |
| | 2 | | The BofA ML Three-Month U.S. Treasury Bill Index measures total return on cash, including price and interest income, based on short-term government Treasury Bills of about 90-day maturity, as reported by Bank of America Merrill Lynch, do not reflect any deduction for fees, expenses or taxes. It is not possible to invest directly in an unmanaged index. |
| | 3 | | The method of calculation of the 30-Day Standardized Subsidized Yield is mandated by the Securities and Exchange Commission and is determined by dividing the net investment income per share earned during the last 30 days of the period by the maximum public offering price (“POP”) per share on the last day of the period. This number is then annualized. The 30-Day Standardized Subsidized Yield reflects fee waivers and/or expense reimbursements recorded by the Fund during the period. Without waivers and/or reimbursements, yields would be reduced. This yield does not necessarily reflect income actually earned and distributed by the Fund and, therefore, may not be correlated with the dividends or other distributions paid to shareholders. The 30-Day Standardized Unsubsidized Yield does not adjust for any fee waivers and/or expense reimbursements in effect. If the Fund does not incur any fee waivers and/or expense reimbursements during the period, the 30-Day Standardized Subsidized Yield and 30-Day Standardized Unsubsidized Yield will be identical. |
| | | | | | | | | | | | | | | | | | | | |
| | STANDARDIZED TOTAL RETURNS4 |
| | | For the period ended 9/30/17 | | One Year | | | Five Years | | | Ten Years | | | Since Inception | | | Inception Date |
| | Class A | | | 0.08 | % | | | 0.00 | % | | | 0.32 | % | | | 2.52 | % | | 5/15/95 |
| | Institutional | | | 1.81 | | | | 0.57 | | | | 0.79 | | | | 3.21 | | | 7/17/91 |
| | Service | | | 1.30 | | | | 0.11 | | | | 0.32 | | | | 2.13 | | | 3/27/97 |
| | Investor | | | 1.71 | | | | 0.45 | | | | N/A | | | | 0.63 | | | 11/30/07 |
| | | Class R6 | | | 1.82 | | | | N/A | | | | N/A | | | | 1.14 | | | 7/31/15 |
| | 4 | | The Standardized Total Returns are average annual total returns or cumulative total returns (only if the performance period is one year or less) as of the most recent calendar quarter-end. They assume reinvestment of all distributions at NAV. These returns reflect a maximum initial sales charge of 1.5% for Class A Shares. Because Institutional Shares, Service Shares, Investor Shares and Class R6 Shares do not involve a sales charge, such a charge is not applied to their Standardized Total Returns. |
The returns set forth in the tables above represent past performance. Past performance does not guarantee future results. The Fund’s investment return and principal value will fluctuate so that an investor’s shares, when redeemed, may be worth more or less than their original cost. Current performance may be lower or higher than the performance quoted above. Please visit our web site at www.GSAMFUNDS.com to obtain the most recent month-end returns. Performance reflects applicable fee waivers and/or expense limitations in effect during the periods shown. In their absence, performance would be reduced. Returns do not reflect the deduction of taxes that a shareholder would pay on Fund distributions or the redemption of Fund shares.
17
FUND BASICS
| | | | | | | | | | |
| | EXPENSE RATIOS5 | |
| | | | | Net Expense Ratio (Current) | | | Gross Expense Ratio (Before Waivers) | |
| | Class A | | | 0.71 | % | | | 0.81 | % |
| | Institutional | | | 0.37 | | | | 0.47 | |
| | Service | | | 0.87 | | | | 0.97 | |
| | Investor | | | 0.45 | | | | 0.55 | |
| | | Class R6 | | | 0.35 | | | | 0.44 | |
| | 5 | | The expense ratios of the Fund, both current (net of applicable fee waivers and/or expense limitations) and before waivers (gross of applicable fee waivers and/or expense limitations) are as set forth above according to the most recent publicly available Prospectus for the Fund and may differ from the expense ratios disclosed in the Financial Highlights in this report. Pursuant to a contractual arrangement, the Fund’s waivers and/or expense limitations will remain in place through at least July 28, 2018, and prior to such date the investment adviser may not terminate the arrangements without the approval of the Fund’s Board of Trustees. If these arrangements are discontinued in the future, the expense ratios may change without shareholder approval. |
| | | | | | |
| | FUND COMPOSITION6 |
| | | Percentage of Net Assets |
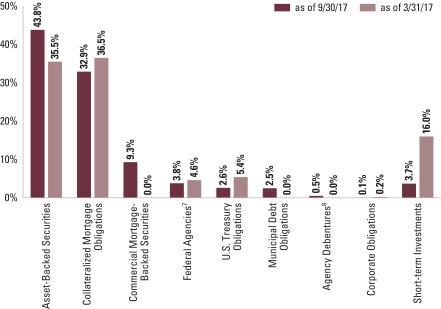
| | 6 | | The percentage shown for each investment category reflects the value of investments in that category as a percentage of net assets. Short-term investments represent repurchase agreements. Figures in the graph may not sum to 100% due to the exclusion of other assets and liabilities. The graph depicts the Fund’s investments but may not represent the Fund’s market exposure due to the exclusion of certain derivatives, if any, as listed in the Additional Investment Information section of the Schedule of Investments. |
| | 7 | | “Federal Agencies” are mortgage-backed securities guaranteed by the Government National Mortgage Association (“GNMA”), Federal National Mortgage Association (“FNMA”) and Federal Home Loan Mortgage Corp. (“FHLMC”). GNMA instruments are backed by the full faith and credit of the U.S. Government. |
| | 8 | | “Agency Debentures” include agency securities offered by companies such as FNMA and FHLMC, which operate under a government charter. While they are required to report to a government regulator, their assets are not explicitly guaranteed by the government and they otherwise operate like any other publicly traded company. |
18
PORTFOLIO RESULTS
Goldman Sachs Inflation Protected Securities Fund
Investment Objective
The Fund seeks real return consistent with preservation of capital.
Portfolio Management Discussion and Analysis
Below, the Goldman Sachs U.S. Fixed Income Investment Management Team discusses the Goldman Sachs Inflation Protected Securities Fund’s (the “Fund”) performance and positioning for the six-month period ended September 30, 2017 (the “Reporting Period”).
| Q | | How did the Fund perform during the Reporting Period? |
| A | | During the Reporting Period, the Fund’s Class A, Class C, Institutional, Investor, Class R and Class R6 Shares generated cumulative total returns, without sales charges, of 0.20%, -0.16%, 0.36%, 0.32%, 0.12% and 0.37%, respectively. These returns compare to the 0.46% cumulative total return of the Fund’s benchmark, the Bloomberg Barclays U.S. Treasury Inflation-Protected Securities (TIPS) Index (“Bloomberg Barclays U.S. TIPS Index”), during the same time period. |
| Q | | What key factors were responsible for the Fund’s performance during the Reporting Period? |
| A | | The Fund’s duration strategy detracted most from its results during the Reporting Period. The duration strategy for the Fund is primarily implemented via interest rate swaps and/ or futures. Furthermore, derivatives are used in combination with cash securities to implement our views in the Fund. Duration is a measure of the Fund’s sensitivity to changes in interest rates. Yield curve positioning, which indicates the spectrum of maturities within a particular sector, also detracted from Fund performance during the Reporting Period. |
| | Bottom-up individual issue selection of various maturity U.S. Treasury inflation protected securities (“TIPS”) was the key positive contributor to the Fund’s performance during the Reporting Period. |
| | The Fund’s cross-sector strategy also contributed positively, albeit modestly, to its results during the Reporting Period. |
| | The cross-sector strategy is one in which we invest Fund assets across a variety of fixed income sectors, including some that may not be included in the Fund’s benchmark, including interest rate swaps and/or futures. |
| Q | | Which fixed income market sectors most significantly affected Fund performance? |
| A | | Positioning across the U.S. government securities yield curve detracted from the Fund’s performance during the Reporting Period, attributable primarily to the second quarter of 2017. Tactical positioning across the U.S. government securities yield curve actually added value during the third quarter of 2017. |
| | Individual issue selection of various maturity TIPS contributed most positively to Fund performance during the Reporting Period. Particularly beneficial to relative results was the Fund’s tactical emphasis on TIPS with maturities of less than seven years. These gains were only somewhat offset by an underweight to longer-dated TIPS, which detracted. |
| Q | | Did the Fund’s duration and yield curve positioning strategy help or hurt its results during the Reporting Period? |
| A | | The Fund’s duration strategy detracted from its relative results during the Reporting Period. During the second quarter of 2017, the Fund’s shorter duration than that of the Bloomberg Barclays U.S. TIPS Index hurt, as longer-term U.S. rates rallied, mainly in April 2017, on the back of receding inflation expectations in spite of positive economic data. However, the Fund’s shorter duration stance modestly |
19
PORTFOLIO RESULTS
| | aided performance in the third calendar quarter, specifically in September 2017 when longer-term U.S. rates moved higher. We maintained the Fund’s duration position at the end of the Reporting Period, as we expected one further interest rate hike by the Federal Reserve (the “Fed”) before calendar year-end. |
| | As mentioned earlier, tactical positioning along the yield curve also detracted from the Fund’s results for the Reporting Period overall. |
| Q | | How did the Fund use derivatives and similar instruments during the Reporting Period? |
| A | | The Fund used Treasury futures and Eurodollar futures to hedge interest rate exposure and to facilitate specific duration and yield curve strategies. We used interest rate and bond exchange traded futures contracts to help implement duration positioning within the Fund. Interest rate swaps and options were similarly used to manage interest rate exposure and express an outright term structure view. (Term structure, most often depicted as a yield curve, refers to the term structure of interest rates, which is the relationship between the yield to maturity and the time to maturity for pure discount bonds.) Inflation-linked swaps were used to help grant us greater precision and versatility in the management of active strategies. |
| | The use of derivatives to manage interest rate risk and to express views on the yield curve detracted from performance. The use of inflation-linked swaps — from a bottom-up security selection perspective — contributed positively to performance during the Reporting Period. |
| Q | | Were there any notable changes in the Fund’s weightings during the Reporting Period? |
| A | | We tactically managed our views on inflation in the Fund via varying allocations to TIPS throughout the Reporting Period. We also modestly shifted the Fund’s duration positioning during the Reporting Period as market conditions changed. However, there were no significant changes in the Fund’s weightings or positioning during the Reporting Period. |
| Q | | How was the Fund positioned relative to its benchmark index at the end of September 2017? |
| A | | At the end of September 2017, the Fund had most of its total assets invested in TIPS, with the remainder in cash. Within the Fund’s TIPS allocation, we maintained an overweight to the short, i.e. seven years and less, end of the TIPS rate curve and an underweight to TIPS with a maturity of greater than seven years. The Fund had a shorter duration than that of the Bloomberg Barclays U.S. TIPS Index at the end of the Reporting Period due to strong labor market data coupled with our expectations for further tightening action from the Fed toward the end of 2017 and into 2018. |
| | At the end of the Reporting Period, global economic growth expansion had not yet translated to inflation, which remained below central bank targets in key markets, including the U.S. That said, we expect inflation to gradually trend higher should labor markets continue to grind tighter and output gaps move further into positive territory. (The output gap is an economic measure of the difference between the actual output of an economy and its potential output.) Potential headwinds may come from execution risk on the part of the current Administration regarding tax reform, trade policy and healthcare reform and the potentially consequential effects of such on monetary policies. |
| | Going forward, we intend to continue to closely monitor macro developments both domestically and abroad for the potential impact on inflation expectations as we position the Fund’s portfolio. |
20
FUND BASICS
Inflation Protected Securities Fund
as of September 30, 2017
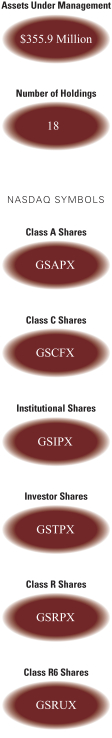
| | | | | | | | | | | | | | | | |
| | PERFORMANCE REVIEW |
| | | April 1, 2017–
September 30, 2017 | | Fund Total
Return
(based on NAV)1 | | | Bloomberg
Barclays U.S.
TIPS Index2 | | | 30-Day
Standardized
Subsidized
Yield3 | | | 30-Day
Standardized
Unsubsidized
Yield3 |
| | Class A | | | 0.20 | % | | | 0.46 | % | | | -0.94 | % | | -0.99% |
| | Class C | | | -0.16 | | | | 0.46 | | | | -1.71 | | | -1.77 |
| | Institutional | | | 0.36 | | | | 0.46 | | | | -0.64 | | | -0.70 |
| | Investor | | | 0.32 | | | | 0.46 | | | | -0.73 | | | -0.78 |
| | Class R | | | 0.12 | | | | 0.46 | | | | -1.22 | | | -1.28 |
| | | Class R6 | | | 0.37 | | | | 0.46 | | | | -0.63 | | | -0.69 |
| | 1 | | The net asset value (NAV) represents the net assets of the class of the Fund (ex-dividend) divided by the total number of shares of the class outstanding. The Fund’s performance assumes the reinvestment of dividends and other distributions. The Fund’s performance does not reflect the deduction of any applicable sales charges. |
| | 2 | | The Bloomberg Barclays U.S. TIPS Index represents securities that protect against adverse inflation and provide a minimum level of real return. To be included in this index, bonds must have cash flows linked to an inflation index, be sovereign issues denominated in U.S. currency, and have more than one year to maturity, and, as a portion of the index, total a minimum amount outstanding of 100 million U.S. dollars. The Bloomberg Barclays U.S. TIPS Index does not reflect any deduction for fees, expenses or taxes. It is not possible to invest directly in an index. |
| | 3 | | The method of calculation of the 30-Day Standardized Subsidized Yield is mandated by the Securities and Exchange Commission and is determined by dividing the net investment income per share earned during the last 30 days of the period by the maximum public offering price (“POP”) per share on the last day of the period. This number is then annualized. The 30-Day Standardized Subsidized Yield reflects fee waivers and/or expense reimbursements recorded by the Fund during the period. Without waivers and/or reimbursements, yields would be reduced. This yield does not necessarily reflect income actually earned and distributed by the Fund and, therefore, may not be correlated with the dividends or other distributions paid to shareholders. The 30-Day Standardized Unsubsidized Yield does not adjust for any fee waivers and/ or expense reimbursements in effect. If the Fund does not incur any fee waivers and/or expense reimbursements during the period, the 30-Day Standardized Subsidized Yield and 30-Day Standardized Unsubsidized Yield will be identical. |
The returns set forth in the table above represent past performance. Past performance does not guarantee future results. The Fund’s investment return and principal value will fluctuate so that an investor’s shares, when redeemed, may be worth more or less than their original cost. Current performance may be lower or higher than the performance quoted above. Please visit our web site at www.GSAMFUNDS.com to obtain the most recent month-end returns. Performance reflects applicable fee waivers and/or expense limitations in effect during the periods shown. In their absence, performance would be reduced. Returns do not reflect the deduction of taxes that a shareholder would pay on Fund distributions or the redemption of Fund shares.
21
FUND BASICS
| | | | | | | | | | | | | | | | | | | | |
| | STANDARDIZED TOTAL RETURNS4 |
| | | For the period ended 9/30/17 | | One Year | | | Five Years | | | Ten Years | | | Since Inception | | | Inception Date |
| | Class A | | | -4.83 | % | | | -1.19 | % | | | 3.15 | % | | | 3.24 | % | | 8/31/07 |
| | Class C | | | -2.77 | | | | -1.17 | | | | 2.82 | | | | 2.90 | | | 8/31/07 |
| | Institutional | | | -0.82 | | | | -0.09 | | | | 3.94 | | | | 4.02 | | | 8/31/07 |
| | Investor | | | -0.90 | | | | -0.20 | | | | N/A | | | | 3.36 | | | 11/30/07 |
| | Class R | | | -1.36 | | | | -0.67 | | | | N/A | | | | 2.88 | | | 11/30/07 |
| | | Class R6 | | | -0.81 | | | | N/A | | | | N/A | | | | 2.01 | | | 7/31/15 |
| | 4 | | The Standardized Total Returns are average annual total returns as of the most recent calendar quarter-end. They assume reinvestment of all distributions at NAV. These returns reflect a maximum initial sales charge of 3.75% for Class A Shares and the assumed contingent deferred sales charge for Class C Shares (1% if redeemed within 12 months of purchase). Prior to July 29, 2009, the maximum initial sales charge applicable to Class A Shares of the Fund was 4.5%, which is not reflected in the figures shown. Because Institutional Shares, Investor Shares, Class R Shares and Class R6 Shares do not involve a sales charge, such a charge is not applied to their Standardized Total Returns. |
The returns set forth in the table above represent past performance. Past performance does not guarantee future results. The Fund’s investment return and principal value will fluctuate so that an investor’s shares, when redeemed, may be worth more or less than their original cost. Current performance may be lower or higher than the performance quoted above. Please visit our web site at www.GSAMFUNDS.com to obtain the most recent month-end returns. Performance reflects applicable fee waivers and/or expense limitations in effect during the periods shown. In their absence, performance would be reduced. Returns do not reflect the deduction of taxes that a shareholder would pay on Fund distributions or the redemption of Fund shares.
| | | | | | | | | | |
| | EXPENSE RATIOS5 | |
| | | | | Net Expense Ratio (Current) | | | Gross Expense Ratio (Before Waivers) | |
| | Class A | | | 0.68 | % | | | 0.77 | % |
| | Class C | | | 1.43 | | | | 1.53 | |
| | Institutional | | | 0.34 | | | | 0.43 | |
| | Investor | | | 0.43 | | | | 0.52 | |
| | Class R | | | 0.93 | | | | 1.02 | |
| | | Class R6 | | | 0.33 | | | | 0.41 | |
| | 5 | | The expense ratios of the Fund, both current (net of applicable fee waivers and/or expense limitations) and before waivers (gross of applicable fee waivers and/or expense limitations) are as set forth above according to the most recent publicly available Prospectus for the Fund and may differ from the expense ratios disclosed in the Financial Highlights in this report. Pursuant to a contractual arrangement, the Fund’s waivers and/or expense limitations will remain in place through at least July 28, 2018, and prior to such date the investment adviser may not terminate the arrangements without the approval of the Fund’s Board of Trustees. If these arrangements are discontinued in the future, the expense ratios may change without shareholder approval. |
22
FUND BASICS
| | | | | | |
| | FUND COMPOSITION6 |
| | | Percentage of Net Assets |
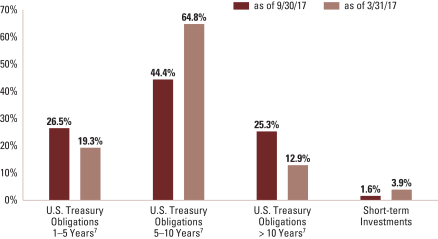
| | 6 | | The percentage shown for each investment category reflects the value of investments in that category as a percentage of net assets. Figures in the graph may not sum to 100% due to the exclusion of other assets and liabilities. The graph depicts the Fund’s investments but may not represent the Fund’s market exposure due to the exclusion of certain derivatives, if any, as listed in the Additional Investment Information section of the Schedule of Investments. |
| | 7 | | “U.S. Treasury Obligations” percentages are grouped by effective maturity. The weighted average maturity was 9.3 and 8.7 years, respectively, at September 30, 2017 and March 31, 2017. |
23
PORTFOLIO RESULTS
Goldman Sachs Short Duration Government Fund
Investment Objective
The Fund seeks a high level of current income and secondarily, in seeking current income, may also consider the potential for capital appreciation.
Portfolio Management Discussion and Analysis
Below, the Goldman Sachs U.S. Fixed Income Investment Management Team discusses the Goldman Sachs Short Duration Government Fund’s (the “Fund”) performance and positioning for the six-month period ended September 30, 2017 (the “Reporting Period”).
| Q | | How did the Fund perform during the Reporting Period? |
| A | | During the Reporting Period, the Fund’s Class A, Class C, Institutional, Service, Investor and Class R6 Shares generated cumulative total returns, without sales charges, of 0.30%, 0.09%, 0.47%, 0.21%, 0.42% and 0.37%, respectively. These returns compare to the 0.29% cumulative total return of the Fund’s benchmark, the Bank of America Merrill Lynch Two-Year U.S. Treasury Note Index (“BofA ML Two-Year U.S. Treasury Note Index”), during the same time period. |
| Q | | What key factors were responsible for the Fund’s performance during the Reporting Period? |
| A | | Both bottom-up and top-down strategies had an impact on the Fund’s performance during the Reporting Period. Bottom-up individual issue selection was the primary positive contributor to the Fund’s relative results. |
| | Within our top-down strategies, our cross-sector strategy was the primary positive contributor to relative performance. Our cross-sector strategy is one in which we invest Fund assets across a variety of fixed income sectors, including some that may not be included in the Fund’s benchmark. Our duration and yield curve positioning strategy detracted from relative performance. Duration is a measure of the Fund’s sensitivity to changes in interest rates. Yield curve indicates the spectrum of maturities within a particular sector. |
| | The duration and government/swaps selection strategies are primarily implemented via interest rates swaps and/ or futures. Derivatives are used in combination with cash securities to implement our views in the Fund. |
| Q | | Which fixed income market sectors most significantly affected Fund performance? |
| A | | Individual issue selection as a whole was additive to the Fund’s relative results. Within the government/swaps sector, selection of U.S. Treasuries proved beneficial, while our selection of Treasury inflation protected securities (“TIPS”) detracted. Within the securitized sector, selection of mortgage pass-through securities added most to relative returns. |
| | Sector positioning contributed positively to the Fund’s results during the Reporting Period. The majority of outperformance came from exposure to agency mortgage-backed securities. Agency mortgage-backed securities significantly outperformed duration-neutral U.S. Treasuries, especially during the third calendar quarter, due to multi-decade low volatility coupled with 10-year U.S. Treasury yields selling off substantially. Strong demand, specifically from mortgage real estate investment trusts (“REITs”), also helped the mortgage-backed securities sector, as spreads, or yield differentials to U.S. Treasuries, tightened. These gains were slightly offset by the Fund’s exposure to U.S. Treasury swaps, which detracted from Fund performance. |
24
PORTFOLIO RESULTS
| Q | | Did the Fund’s duration and yield curve positioning strategy help or hurt its results during the Reporting Period? |
| A | | Tactical management of the Fund’s duration and yield curve positioning detracted from its results during the Reporting Period. During the Reporting Period, U.S. Treasury yields pushed higher at the front, or short-term, end of the yield curve in response to interest rate hikes by the Federal Reserve (the “Fed”). However, the intermediate and long-term ends of the U.S. Treasury yield curve rallied, or moved lower, on political uncertainty, increased geopolitical risks and fewer positive economic surprises. In particular, soft inflation data throughout 2017 year-to-date weighed on market expectations for further interest rate hikes by the Fed. While we recognized recent weakness in inflation, we maintained the Fund’s underweight U.S. duration position relative to that of the BofA ML Two-Year U.S. Treasury Note Index given our expectations that global economic growth is likely to remain strong and that tightness in the labor market and easy financial conditions may warrant further monetary tightening in the U.S. We also expected inflation to rebound from recent weakness should wage growth begin to emerge. |
| Q | | How did the Fund use derivatives and similar instruments during the Reporting Period? |
| A | | The Fund used Treasury futures, Eurodollar futures as well as interest rate swaps and option during the Reporting Period for the purpose of managing the duration and term structure of the Fund. (Term structure, most often depicted as a yield curve, refers to the term structure of interest rates, which is the relationship between the yield to maturity and the time to maturity for pure discount bonds.) The Fund used forward sales contracts and futures contracts to help manage duration. Derivatives did not have a material impact, on a net basis, on the Fund’s performance during the Reporting Period. |
| Q | | Were there any notable changes in the Fund’s weightings during the Reporting Period? |
| A | | The Fund’s exposure to cash increased during the Reporting Period. A corresponding decrease in allocation was concentrated in U.S. Treasury securities. Additionally, while the Fund’s overall duration positioning remained the same through the Reporting Period, we did make adjustments in weightings along the U.S. Treasury yield curve as market conditions changed. |
| Q | | How was the Fund positioned relative to its benchmark index at the end of September 2017? |
| A | | While the Fund’s benchmark is based on U.S. Treasuries, the Fund continued to hold a portion of its assets in non-Treasury sectors not represented in the benchmark index. Indeed, the Fund maintained exposures to high quality spread, or non-Treasury, sectors throughout the Reporting Period, most notably agency mortgage-backed securities and mortgage pass-through securities. The Fund maintained an underweighted exposure to government bonds at the end of the Reporting Period. Further, the Fund maintained a shorter duration position than that of the BofA ML Two-Year U.S. Treasury Note Index at the end of the Reporting Period, as we expect the Fed to further tighten monetary policy toward the end of 2017 and into 2018 should economic growth continue to improve. |
25
FUND BASICS
Short Duration Government Fund
as of September 30, 2017
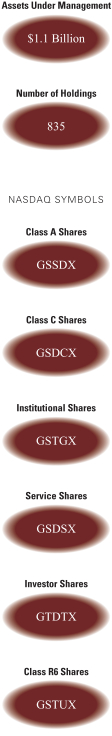
| | | | | | | | | | | | | | | | | | |
| | PERFORMANCE REVIEW | |
| | | April 1, 2017–September 30, 2017 | | Fund Total
Return
(based on NAV)1 | | | BofA ML
Two-Year
U.S. Treasury
Note Index2 | | | 30-Day
Standardized
Subsidized
Yield3 | | | 30-Day
Standardized
Unsubsidized
Yield3 | |
| | Class A | | | 0.30 | % | | | 0.29 | % | | | 1.08 | % | | | 1.03 | % |
| | Class C | | | 0.09 | | | | 0.29 | | | | 0.70 | | | | 0.30 | |
| | Institutional | | | 0.47 | | | | 0.29 | | | | 1.43 | | | | 1.38 | |
| | Service | | | 0.21 | | | | 0.29 | | | | 0.93 | | | | 0.89 | |
| | Investor | | | 0.42 | | | | 0.29 | | | | 1.34 | | | | 1.29 | |
| | | Class R6 | | | 0.37 | | | | 0.29 | | | | 1.44 | | | | 1.39 | |
| | 1 | | The net asset value (NAV) represents the net assets of the class of the Fund (ex-dividend) divided by the total number of shares of the class outstanding. The Fund’s performance assumes the reinvestment of dividends and other distributions. The Fund’s performance does not reflect the deduction of any applicable sales charges. |
| | 2 | | The BofA ML Two-Year U.S. Treasury Note Index is a one-security index comprised of the most recently issued 2-year U.S. Treasury note. The BofA ML Two-Year U.S. Treasury Note Index is rebalanced monthly. In order to qualify for inclusion, a 2-year note must be auctioned on or before the third business day before the last business day of the month. The BofA ML Two-Year U.S. Treasury Note Index does not reflect any deduction for fees, expenses or taxes. It is not possible to invest directly in an unmanaged index. |
| | 3 | | The method of calculation of the 30-Day Standardized Subsidized Yield is mandated by the Securities and Exchange Commission and is determined by dividing the net investment income per share earned during the last 30 days of the period by the maximum public offering price (“POP”) per share on the last day of the period. This number is then annualized. The 30-Day Standardized Subsidized Yield reflects fee waivers and/or expense reimbursements recorded by the Fund during the period. Without waivers and/or reimbursements, yields would be reduced. This yield does not necessarily reflect income actually earned and distributed by the Fund and, therefore, may not be correlated with the dividends or other distributions paid to shareholders. The 30-Day Standardized Unsubsidized Yield does not adjust for any fee waivers and/or expense reimbursements in effect. If the Fund does not incur any fee waivers and/or expense reimbursements during the period, the 30-Day Standardized Subsidized Yield and 30-Day Standardized Unsubsidized Yield will be identical. |
The returns set forth in the table above represent past performance. Past performance does not guarantee future results. The Fund’s investment return and principal value will fluctuate so that an investor’s shares, when redeemed, may be worth more or less than their original cost. Current performance may be lower or higher than the performance quoted above. Please visit our web site at www.GSAMFUNDS.com to obtain the most recent month-end returns. Performance reflects applicable fee waivers and/or expense limitations in effect during the periods shown. In their absence, performance would be reduced. Returns do not reflect the deduction of taxes that a shareholder would pay on Fund distributions or the redemption of Fund shares.
26
FUND BASICS
| | | | | | | | | | | | | | | | | | | | |
| | STANDARDIZED TOTAL RETURNS4 |
| | | For the period ended 9/30/17 | | One Year | | | Five Years | | | Ten Years | | | Since Inception | | | Inception Date |
| | Class A | | | -1.17 | % | | | -0.02 | % | | | 1.72 | % | | | 3.19 | % | | 5/1/97 |
| | Class C | | | -0.76 | | | | -0.11 | | | | 1.39 | | | | 2.54 | | | 8/15/97 |
| | Institutional | | | 0.64 | | | | 0.65 | | | | 2.23 | | | | 4.67 | | | 8/15/88 |
| | Service | | | 0.13 | | | | 0.12 | | | | 1.71 | | | | 3.28 | | | 4/10/96 |
| | Investor | | | 0.45 | | | | 0.54 | | | | N/A | | | | 1.97 | | | 11/30/07 |
| | | Class R6 | | | 0.55 | | | | N/A | | | | N/A | | | | 0.75 | | | 7/31/15 |
| | 4 | | The Standardized Total Returns are average annual total returns or cumulative total returns (only if the performance period is one year or less) as of the most recent calendar quarter-end. They assume reinvestment of all distributions at NAV. These returns reflect a maximum initial sales charge of 1.5% for Class A Shares and the assumed contingent deferred sales charge for Class C Shares (0.65% if redeemed within 12 months of purchase). Prior to July 29, 2009, the maximum initial sales charge applicable to Class A Shares of the Fund was 2.0%, which is not reflected in the figures shown. Because Institutional Shares, Service Shares, Investor Shares and Class R6 Shares do not involve a sales charge, such a charge is not applied to their Standardized Total Returns. |
The returns set forth in the table above represent past performance. Past performance does not guarantee future results. The Fund’s investment return and principal value will fluctuate so that an investor’s shares, when redeemed, may be worth more or less than their original cost. Current performance may be lower or higher than the performance quoted above. Please visit our web site at www.GSAMFUNDS.com to obtain the most recent month-end returns. Performance reflects applicable fee waivers and/or expense limitations in effect during the periods shown. In their absence, performance would be reduced. Returns do not reflect the deduction of taxes that a shareholder would pay on Fund distributions or the redemption of Fund shares.
| | | | | | | | | | |
| | EXPENSE RATIOS5 | |
| | | | | Net Expense Ratio (Current) | | | Gross Expense Ratio (Before Waivers) | |
| | Class A | | | 0.81 | % | | | 0.87 | % |
| | Class C | | | 1.21 | | | | 1.62 | |
| | Institutional | | | 0.47 | | | | 0.53 | |
| | Service | | | 0.97 | | | | 1.03 | |
| | Investor | | | 0.56 | | | | 0.62 | |
| | | Class R6 | | | 0.46 | | | | 0.52 | |
| | 5 | | The expense ratios of the Fund, both current (net of applicable fee waivers and/or expense limitations) and before waivers (gross of applicable fee waivers and/or expense limitations) are as set forth above according to the most recent publicly available Prospectus for the Fund and may differ from the expense ratios disclosed in the Financial Highlights in this report. Pursuant to a contractual arrangement, the Fund’s waivers and/or expense limitations will remain in place through at least July 28, 2018, and prior to such date the investment adviser may not terminate the arrangements without the approval of the Fund’s Board of Trustees. If these arrangements are discontinued in the future, the expense ratios may change without shareholder approval. |
27
FUND BASICS
|
| FUND COMPOSITION6 |
| Percentage of Net Assets |
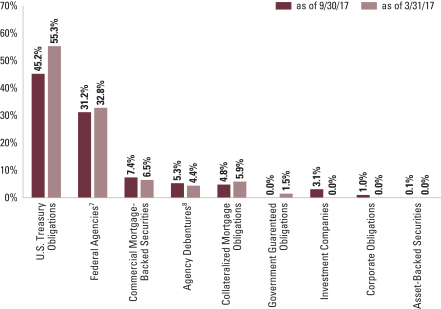
| | 6 | | The percentage shown for each investment category reflects the value of investments in that category as a percentage of net assets. Figures in the graph may not sum to 100% due to the exclusion of other assets and liabilities. The graph depicts the Fund’s investments but may not represent the Fund’s market exposure due to the exclusion of certain derivatives, if any, as listed in the Additional Investment Information section of the Schedule of Investments. |
| | 7 | | “Federal Agencies” are mortgage-backed securities guaranteed by the Government National Mortgage Association (“GNMA”), Federal National Mortgage Association (“FNMA”) and Federal Home Loan Mortgage Corp. (“FHLMC”). GNMA instruments are backed by the full faith and credit of the U.S. Government. |
| | 8 | | “Agency Debentures” include agency securities offered by companies such as FNMA and FHLMC, which operate under a government charter. While they are required to report to a government regulator, their assets are not explicitly guaranteed by the government and they otherwise operate like any other publicly traded company. |
28
PORTFOLIO RESULTS
Goldman Sachs Short Duration Income Fund
Investment Objective
The Fund seeks total return consisting of income and capital appreciation.
Portfolio Management Discussion and Analysis
Below, the Goldman Sachs Global Liquidity Management Team discusses the Goldman Sachs Short Duration Income Fund’s (the “Fund”) performance and positioning for the six-month period ended September 30, 2017 (the “Reporting Period”).
| Q | | How did the Fund perform during the Reporting Period? |
| A | | During the Reporting Period, the Fund’s Class A, Class C, Institutional, Investor, Class R and Class R6 Shares generated cumulative total returns, without sales charges, of 0.88%, 0.58%, 0.95%, 0.91%, 0.66% and 0.94%, respectively. These returns compare to the 1.20% cumulative total return of the Goldman Sachs Short Duration Income Fund Composite Index (the “Short Duration Income Composite”) during the same period. The Short Duration Income Composite is comprised 50% of the Bloomberg Barclays U.S. 1-5 Year Corporate Bond Index and 50% of the Bloomberg Barclays U.S. 1-5 Year Government Bond Index, which generated cumulative total returns of 1.69% and 0.70%, respectively, over the same time period. |
| Q | | What key factors were responsible for the Fund’s performance during the Reporting Period? |
| A | | Both top-down and bottom-up strategies had an impact on the Fund’s performance during the Reporting Period. Within our top-down strategies, our duration and yield curve positioning strategy detracted from Fund performance. Duration is a measure of the fund’s sensitivity to changes in interest rates. Yield curve indicates the spectrum of maturities within a particular sector. Our country strategy also dampened relative results, with performance driven by an overweight position in European rates versus U.S. rates and by an overweight position in Canadian rates versus U.S. rates. |
| | Conversely, our currency strategy contributed positively overall, with the Fund’s overweight positions in Central Eastern European and Scandinavian currencies, such as the Czech koruna, Polish zloty, Hungarian forint and Swedish krona, versus the euro performing well. These gains were partially offset by the Fund’s exposure to European currency forwards, which detracted. Our cross-sector strategy also contributed positively to the Fund’s results during the Reporting Period. Our cross-sector strategy is one in which we invest Fund assets across a variety of fixed income sectors, including some that may not be included in the Fund’s benchmark. |
| | Bottom-up individual issue selection was the primary positive contributor to the Fund’s relative results. |
| | The duration, country, currency and government/swaps selection strategies are primarily implemented via interest rate swaps and/or futures. Derivatives are used in combination with cash securities to implement our views in the Fund. |
| Q | | Which fixed income market sectors most significantly affected Fund performance? |
| A | | Sector positioning contributed positively to the Fund’s results during the Reporting Period, with exposure to collateralized loan obligations (“CLOs”), asset-backed securities and high yield corporate bonds performing best. Exposure to emerging markets debt detracted from the Fund’s relative results during the Reporting Period. |
| | Overall, security selection was the primary positive contributor to relative results. That said, within the government/swaps sector, selection of U.S. Treasuries proved effective, while selection of Treasury inflation protected securities (“TIPS”) detracted. Within the securitized sector, selection of mortgage pass-through securities and asset-backed securities contributed positively, while selection of CLOs dampened relative results. Selection of tax-exempt Puerto Rico municipal bonds detracted from returns following Governor Ricardo’s initiation of the Commonwealth to enter a Title III restructuring. Market expectations of the negative economic impact from |
29
PORTFOLIO RESULTS
| | Hurricane Maria added to these bonds’ headwinds. (Title III is an in-court debt restructuring process akin to U.S. bankruptcy protection, since Puerto Rico is barred from using Chapter 9 of the U.S. federal bankruptcy code reserved for insolvent public entities. It should be noted that this action was taken on May 3, 2017, well before the devastation caused by Hurricane Maria.) |
| Q | | Did the Fund’s duration and yield curve positioning strategy help or hurt its results during the Reporting Period? |
| A | | Tactical management of the Fund’s duration and yield curve positioning detracted from its results during the Reporting Period. During the Reporting Period, U.S. Treasury yields pushed higher at the front, or short-term, end of the yield curve in response to interest rate hikes by the Federal Reserve (the “Fed”). However, the intermediate and long- term ends of the U.S. Treasury yield curve rallied, or moved lower, on political uncertainty, increased geopolitical risks and fewer positive economic surprises. In particular, soft inflation data throughout 2017 year-to-date weighed on market expectations for further interest rate hikes by the Fed. While we recognized recent weakness in inflation, we maintained the Fund’s underweight U.S. duration position relative to that of the Short Duration Income Composite given our expectations that global economic growth is likely to remain strong and that tightness in the labor market and easy financial conditions may warrant further monetary tightening in the U.S. We also expected inflation to rebound from recent weakness should wage growth begin to emerge. |
| Q | | How did the Fund use derivatives and similar instruments during the Reporting Period? |
| A | | The Fund used Treasury futures, Eurodollar futures as well as interest rate swaps and options during the Reporting Period for the purpose of managing the duration and term structure of the Fund. (Term structure, most often depicted as a yield curve, refers to the term structure of interest rates, which is the relationship between the yield to maturity and the time to maturity for pure discount bonds.) The Fund employed credit default swaps to manage the credit profile of the Fund. Additionally, the Fund used currency forwards to hedge its exposure to foreign currency exposure and increase total return. Derivatives had a negative impact, on a net basis, on the Fund’s performance during the Reporting Period. |
| Q | | Were there any notable changes in the Fund’s weightings during the Reporting Period? |
| A | | The Fund’s allocations to industrial-related investment grade corporate bonds and emerging markets debt increased during the Reporting Period. A corresponding decrease in allocation was concentrated in U.S. Treasuries. Additionally, while the Fund’s overall duration positioning remained the same through the Reporting Period, we did make adjustments in weightings along the U.S. Treasury yield curve as market conditions changed. |
| Q | | How was the Fund positioned relative to its benchmark index at the end of September 2017? |
| A | | While the Fund’s benchmark is based on an equally-balanced composite of the Bloomberg Barclays U.S. Corporate 1-5 Year Index and the Bloomberg Barclays U.S. Government 1-5 Year Bond Index, the Fund held a portion of its assets in non- Treasury sectors not represented in the Short Duration Income Composite. Indeed, in addition to investment grade corporate bonds, the Fund maintained exposure to several other high quality spread, or non-Treasury, sectors throughout the Reporting Period, most notably asset-backed securities, mortgage pass-through securities and agency mortgage-backed securities. The Fund also had exposure to high yield corporate bonds, quasi-government bonds and emerging markets debt at the end of the Reporting Period. Further, the Fund maintained a shorter U.S. duration position than that of the Short Duration Income Composite at the end of the Reporting Period, as we expect the Fed to further tighten monetary policy toward the end of 2017 and into 2018 should economic growth continue to improve. |
30
FUND BASICS
Short Duration Income Fund
as of September 30, 2017
| | | | | | | | | | | | | | | | | | | | | | | | | | |
| | PERFORMANCE REVIEW | |
| | | April 1, 2017–
September 30, 2017 | | Fund Total
Return
(based on NAV)1 | | | Short Duration
Income Fund
Composite2 | | | Bloomberg
Barclays
U.S. 1-5 Year
Bond Index3 | | | Bloomberg
Barclays
U.S. 1-5 Year
Corporate
Government
Bond Index4 | | | 30-Day
Standardized
Subsidized
Unsubsidized
Yield5 | | | 30-Day
Standardized
Yield5 | |
| | Class A | | | 0.88 | % | | | 1.20 | % | | | 1.69 | % | | | 0.70 | % | | | 1.43 | % | | | 1.37 | % |
| | Class C | | | 0.58 | | | | 1.20 | | | | 1.69 | | | | 0.70 | | | | 1.03 | | | | 0.62 | |
| | Institutional | | | 0.95 | | | | 1.20 | | | | 1.69 | | | | 0.70 | | | | 1.78 | | | | 1.72 | |
| | Investor | | | 0.91 | | | | 1.20 | | | | 1.69 | | | | 0.70 | | | | 1.73 | | | | 1.67 | |
| | Class R | | | 0.66 | | | | 1.20 | | | | 1.69 | | | | 0.70 | | | | 1.17 | | | | 1.13 | |
| | | Class R6 | | | 0.94 | | | | 1.20 | | | | 1.69 | | | | 0.70 | | | | 1.87 | | | | 1.67 | |
| | 1 | | The net asset value (NAV) represents the net assets of the class of the Fund (ex-dividend) divided by the total number of shares of the class outstanding. The Fund’s performance assumes the reinvestment of dividends and other distributions. The Fund’s performance does not reflect the deduction of any applicable sales charges. |
| | 2 | | The Short Duration Income Fund Composite is comprised of the Bloomberg Barclays U.S. 1-5 Year Corporate Bond Index (50%) and the Bloomberg Barclays U.S. 1-5 Year Government Bond Index (50%). |
| | 3 | | The Bloomberg Barclays U.S. 1-5 Year Corporate Bond Index provides a broad based measure of the global investment grade corporate sector with final maturities ranging between one and five years. The corporate sectors include industrial, utility and finance, for U.S. and non-U.S. corporations. The Bloomberg Barclays U.S. 1-5 Year Corporate Bond Index does not reflect any deduction for fees, expenses or taxes. It is not possible to invest directly in an index. |
| | 4 | | The Bloomberg Barclays U.S. 1-5 Year Government Bond Index provides a broad based measure of securities issued by the U.S. government with final maturities ranging from one to five years. This includes public obligations of the U.S. Treasury, U.S. government agencies, quasi-federal corporations and corporate or foreign debt guaranteed by the U.S. government. The Bloomberg Barclays U.S. 1-5 Year Government Bond Index does not reflect any deduction for fees, expenses or taxes. It is not possible to invest directly in an index. |
| | 5 | | The method of calculation of the 30-Day Standardized Subsidized Yield is mandated by the Securities and Exchange Commission and is determined by dividing the net investment income per share earned during the last 30 days of the period by the maximum public offering price (“POP”) per share on the last day of the period. This number is then annualized. The 30-Day Standardized Subsidized Yield reflects fee waivers and/or expense reimbursements recorded by the Fund during the period. Without waivers and/or reimbursements, yields would be reduced. This yield does not necessarily reflect income actually earned and distributed by the Fund and, therefore, may not be correlated with the dividends or other distributions paid to shareholders. The 30-Day Standardized Unsubsidized Yield does not adjust for any fee waivers and/or expense reimbursements in effect. If the Fund does not incur any fee waivers and/or expense reimbursements during the period, the 30-Day Standardized Subsidized Yield and 30-Day Standardized Unsubsidized Yield will be identical. |
The returns set forth in the table above represent past performance. Past performance does not guarantee future results. The Fund’s investment return and principal value will fluctuate so that an investor’s shares, when redeemed, may be worth more or less than their original cost. Current performance may be lower or higher than the performance quoted above. Please visit our web site at www.GSAMFUNDS.com to obtain the most recent month-end returns. Performance reflects applicable fee waivers and/or expense limitations in effect during the periods shown. In their absence, performance would be reduced. Returns do not reflect the deduction of taxes that a shareholder would pay on Fund distributions or the redemption of Fund shares.
31
FUND BASICS
| | | | | | | | | | | | | | | | |
| | STANDARDIZED TOTAL RETURNS6 |
| | | For the period ended 9/30/17 | | One Year | | | Five Years | | | Since Inception | | | Inception Date |
| | Class A | | | -0.55 | % | | | 0.99 | % | | | 1.26 | % | | 2/29/12 |
| | Class C | | | -0.22 | | | | 0.84 | | | | 1.11 | | | 2/29/12 |
| | Institutional | | | 1.18 | | | | 1.61 | | | | 1.89 | | | 2/29/12 |
| | Investor | | | 1.19 | | | | 1.52 | | | | 1.80 | | | 2/29/12 |
| | Class R | | | 0.59 | | | | 1.02 | | | | 1.30 | | | 2/29/12 |
| | | Class R6 | | | 1.16 | | | | N/A | | | | 1.79 | | | 7/31/15 |
| | 6 | | The Standardized Total Returns are average annual total returns or cumulative total returns (only if the performance period is one year or less) as of the most recent calendar quarter-end. They assume reinvestment of all distributions at NAV. These returns reflect a maximum initial sales charge of 1.5% for Class A Shares and the assumed contingent deferred sales charge for Class C Shares (0.65% if redeemed within 12 months of purchase). Because Institutional Shares, Investor Shares, Class R Shares and Class R6 Shares do not involve a sales charge, such a charge is not applied to their Standardized Total Returns. |
The returns set forth in the table above represent past performance. Past performance does not guarantee future results. The Fund’s investment return and principal value will fluctuate so that an investor’s shares, when redeemed, may be worth more or less than their original cost. Current performance may be lower or higher than the performance quoted above. Please visit our web site at www.GSAMFUNDS.com to obtain the most recent month-end returns. Performance reflects applicable fee waivers and/or expense limitations in effect during the periods shown. In their absence, performance would be reduced. Returns do not reflect the deduction of taxes that a shareholder would pay on Fund distributions or the redemption of Fund shares.
| | | | | | | | | | |
| | EXPENSE RATIOS7 | |
| | | | | Net Expense Ratio (Current) | | | Gross Expense Ratio (Before Waivers) | |
| | Class A | | | 0.79 | % | | | 0.90 | % |
| | Class C | | | 1.19 | | | | 1.65 | |
| | Institutional | | | 0.45 | | | | 0.56 | |
| | Investor | | | 0.54 | | | | 0.65 | |
| | Class R | | | 1.04 | | | | 1.15 | |
| | | Class R6 | | | 0.45 | | | | 0.55 | |
| | 7 | | The expense ratios of the Fund, both current (net of applicable fee waivers and/or expense limitations) and before waivers (gross of applicable fee waivers and/or expense limitations) are as set forth above according to the most recent publicly available Prospectus for the Fund and may differ from the expense ratios disclosed in the Financial Highlights in this report. Pursuant to a contractual arrangement, the Fund’s waivers and/or expense limitations will remain in place through at least July 28, 2018, and prior to such date the investment adviser may not terminate the arrangements without the approval of the Fund’s Board of Trustees. If these arrangements are discontinued in the future, the expense ratios may change without shareholder approval. |
32
FUND BASICS
| | | | | | |
| | FUND COMPOSITION8 |
| | | Percentage of Net Assets |
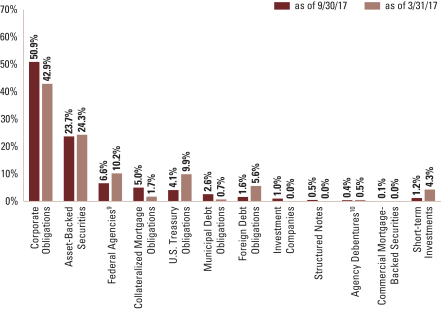
| | 8 | | The percentage shown for each investment category reflects the value of investments in that category as a percentage of net assets. Short-term investments represent certificates of deposits and commercial papers. Figures in the graph may not sum to 100% due to the exclusion of other assets and liabilities. The graph depicts the Fund’s investments but may not represent the Fund’s market exposure due to the exclusion of certain derivatives, if any, as listed in the Additional Investment Information section of the Schedule of Investments. |
| | 9 | | “Federal Agencies” are mortgage-backed securities guaranteed by the Government National Mortgage Association (“GNMA”), Federal National Mortgage Association (“FNMA”) and Federal Home Loan Mortgage Corp. (“FHLMC”). GNMA instruments are backed by the full faith and credit of the U.S. Government. |
| | 10 | | “Agency Debentures” include agency securities offered by companies such as FNMA and FHLMC, which operate under a government charter. While they are required to report to a government regulator, their assets are not explicitly guaranteed by the government and they otherwise operate like any other publicly traded company. |
33
PORTFOLIO RESULTS
Goldman Sachs Short-Term Conservative Income Fund
Investment Objective
The Fund seeks to generate current income and secondarily maintain an emphasis on preservation of capital and liquidity.
Portfolio Management Discussion and Analysis
Below, the Goldman Sachs U.S. Fixed Income Investment Management Team discusses the Goldman Sachs Short-Term Conservative Income Fund’s (the “Fund”) performance and positioning for the six-month period ended September 30, 2017 (the “Reporting Period”).
| Q | | How did the Fund perform during the Reporting Period? |
| A | | During the Reporting Period, the Fund’s Class A, Institutional, Administration and Preferred Shares generated cumulative total returns, without sales charges, of 0.50%, 0.68%, 0.66% and 0.63%, respectively. These returns compare to the 0.55% cumulative total return of the Fund’s benchmark, the Bloomberg Barclays Short- Term Government/Corporate Index (“Bloomberg Barclays Index”), during the same time period. The Fund’s secondary benchmark, the Bank of America Merrill Lynch 3-6 Month U.S. Treasury Bill Index, had a cumulative total return of 0.48% during the same time period. |
| Q | | What key factors were responsible for the Fund’s performance during the Reporting Period? |
| A | | Both bottom-up and top-down strategies had an impact on the Fund’s performance during the Reporting Period. Bottom-up individual issue selection was the main driver of performance during the Reporting Period, contributing positively. |
| | Within our top-down strategies, our cross-sector strategy contributed positively to the Fund’s relative results during the Reporting Period. Our cross-sector strategy is one in which we invest Fund assets across a variety of fixed income sectors, including some that may not be included in the Fund’s benchmark. Our duration and yield curve positioning strategy detracted from the Fund’s performance. Duration is a measure of the Fund’s sensitivity to changes in interest rates. Yield curve indicates the spectrum of maturities within a particular sector. |
| Q | | Which fixed income market sectors most significantly affected Fund performance? |
| A | | Our individual security selection strategies were the primary positive contributors to the Fund’s relative results during the Reporting Period. Within the government/swaps sector, selection of short-dated U.S. Treasuries proved most effective. In addition, selection of short-dated corporate bonds, especially within the industrials sector, contributed positively. These gains were partially offset by selection amongst high quality corporate bonds, which detracted from Fund performance. |
| | Cross-sector positioning was positive, driven by the Fund’s exposure to the corporate bond sector, as spreads, or yield differentials to U.S. Treasuries, tightened during the Reporting Period. These gains were slightly offset by the Fund’s exposure to U.S. Treasury swaps, which detracted from Fund performance. |
| Q | | Did the Fund’s duration and yield curve positioning strategy help or hurt its results during the Reporting Period? |
| A | | Tactical management of the Fund’s duration and yield curve positioning detracted from the Fund’s results during the Reporting Period. During the Reporting Period, U.S. Treasury yields pushed higher at the front, or short-term, end of the yield curve in response to interest rate hikes by the Federal Reserve (the “Fed”). However, the intermediate and |
34
PORTFOLIO RESULTS
| | long-term ends of the U.S. Treasury yield curve rallied, or moved lower, on political uncertainty, increased geopolitical risks and fewer positive economic surprises. In particular, soft inflation data throughout 2017 year-to-date weighed on market expectations for further interest rate hikes by the Fed. While we recognized recent weakness in inflation, we maintained the Fund’s underweight U.S. duration position relative to that of the Bloomberg Barclays Index given our expectations that global economic growth is likely to remain strong and that tightness in the labor market and easy financial conditions may warrant further monetary tightening in the U.S. We also expected inflation to rebound from recent weakness should wage growth begin to emerge. |
| Q | | How did the Fund use derivatives and similar instruments during the Reporting Period? |
| A | | The Fund does not use derivatives. |
| Q | | Were there any notable changes in the Fund’s weightings during the Reporting Period? |
| A | | The Fund’s allocation to industrials-related investment grade corporate bonds increased during the Reporting Period. A corresponding decrease in allocation was concentrated in commercial paper and certificates of deposit. Additionally, while the Fund’s overall duration positioning remained the same through the Reporting Period, we did make adjustments in weightings along the U.S. Treasury yield curve as market conditions changed. |
| Q | | How was the Fund positioned relative to its benchmark index at the end of September 2017? |
| A | | At the end of the Reporting Period, the Fund had an emphasis on financials-related investment grade corporate bonds and cash and cash equivalents. Further, the Fund maintained a shorter U.S. duration position than that of the Bloomberg Barclays Index at the end of the Reporting Period, as we expect the Fed to further tighten monetary policy toward the end of 2017 and into 2018 should economic growth continue to improve. |
35
FUND BASICS
Short-Term Conservative Income Fund
as of September 30, 2017
| | | | | | | | | | | | | | | | | | | | | | |
| | PERFORMANCE REVIEW | |
| | | April 1, 2017–
September 30, 2017 | | Fund Total
Return
(based on NAV)1 | | | Bloomberg
Barclays
Index2 | | | BofA ML
3-6 Month
U.S. Treasury
Bill Index3 | | | 30-Day
Standardized
Subsidized
Yield4 | | | 30-Day
Standardized
Unsubsidized
Yield4 | |
| | Class A | | | 0.50 | % | | | 0.55 | % | | | 0.48 | % | | | 1.02 | % | | | 0.92 | % |
| | Institutional | | | 0.68 | | | | 0.55 | | | | 0.48 | | | | 1.44 | | | | 1.26 | |
| | Administration | | | 0.66 | | | | 0.55 | | | | 0.48 | | | | 1.19 | | | | 1.01 | |
| | | Preferred | | | 0.63 | | | | 0.55 | | | | 0.48 | | | | 1.29 | | | | 1.17 | |
| | 1 | | The net asset value (NAV) represents the net assets of the class of the Fund (ex-dividend) divided by the total number of shares of the class outstanding. The Fund’s performance assumes the reinvestment of dividends and other distributions. The Fund’s performance does not reflect the deduction of any applicable sales charges. |
| | 2 | | The Bloomberg Barclays Index measures the performance of U.S. dollar-denominated U.S. Treasury bonds, government related bonds, and investment grade U.S. corporate bonds |
| | 3 | | The BofA ML 3-6 Month U.S. Treasury Bill Index measures total return on cash, including price and interest income, based on short-term government Treasury Bills of about 90 to 180-day maturity. The BofA ML 3-6 Month U.S. Treasury Bill Index is unmanaged, does not reflect any deduction for fees, expenses or taxes. It is not possible to invest directly in an index. |
| | 4 | | The method of calculation of the 30-Day Standardized Subsidized Yield is mandated by the Securities and Exchange Commission and is determined by dividing the net investment income per share earned during the last 30 days of the period by the maximum public offering price (“POP”) per share on the last day of the period. This number is then annualized. The 30-Day Standardized Subsidized Yield reflects fee waivers and/or expense reimbursements recorded by the Fund during the period. Without waivers and/or reimbursements, yields would be reduced. This yield does not necessarily reflect income actually earned and distributed by the Fund and, therefore, may not be correlated with the dividends or other distributions paid to shareholders. The 30-Day Standardized Unsubsidized Yield does not adjust for any fee waivers and/or expense reimbursements in effect. If the Fund does not incur any fee waivers and/or expense reimbursements during the period, the 30-Day Standardized Subsidized Yield and 30-Day Standardized Unsubsidized Yield will be identical. |
| | | | | | | | | | | | |
| | STANDARDIZED TOTAL RETURNS5 |
| | | For the period ended 9/30/17 | | One Year | | | Since Inception | | | Inception Date |
| | Class A | | | N/A | | | | -0.57 | % | | 10/31/16 |
| | Institutional | | | 1.34 | % | | | 0.80 | | | 2/28/14 |
| | Administration | | | 1.18 | | | | 0.58 | | | 2/28/14 |
| | | Preferred | | | N/A | | | | 1.16 | | | 10/31/16 |
| | 5 | | The Standardized Total Returns are average annual total returns or cumulative total returns (only if the performance period is one year or less) as of the most recent calendar quarter-end. They assume reinvestment of all distributions at NAV. These returns reflect a maximum initial sales charge of 1.50% for Class A Shares. Because Institutional Shares, Administration Shares and Preferred Shares do not involve a sales charge, such a charge is not applied to their Standardized Total Returns. |
The returns set forth in the tables above represent past performance. Past performance does not guarantee future results. The Fund’s investment return and principal value will fluctuate so that an investor’s shares, when redeemed, may be worth more or less than their original cost. Current performance may be lower or higher than the performance quoted above. Please visit our web site at www.GSAMFUNDS.com to obtain the most recent month-end returns. Performance reflects applicable fee waivers and/or expense limitations in effect during the periods shown. In their absence, performance would be reduced. Returns do not reflect the deduction of taxes that a shareholder would pay on Fund distributions or the redemption of Fund shares.
36
FUND BASICS
| | | | | | | | | | |
| | EXPENSE RATIOS6 | |
| | | | | Net Expense Ratio (Current) | | | Gross Expense Ratio (Before Waivers) | |
| | Class A | | | 0.57 | % | | | 1.54 | % |
| | Institutional | | | 0.20 | | | | 1.20 | |
| | Administration | | | 0.45 | | | | 1.45 | |
| | | Preferred | | | 0.30 | | | | 1.30 | |
| | 6 | | The expense ratios of the Fund, both current (net of applicable fee waivers and/or expense limitations) and before waivers (gross of applicable fee waivers and/or expense limitations) are as set forth above according to the most recent publicly available Prospectus for the Fund and may differ from the expense ratios disclosed in the Financial Highlights in this report. Pursuant to a contractual arrangement, the Fund’s waivers and/or expense limitations will remain in place through at least July 28, 2018, and prior to such date the investment adviser may not terminate the arrangements without the approval of the Fund’s Board of Trustees. If these arrangements are discontinued in the future, the expense ratios may change without shareholder approval. Through October 31, 2017, the Net Expense Ratio was 0.53%, 0.16%, 0.41%, and 0.26% respectively, for Class A, Institutional, Administration, and Preferred Shares. |
| | | | | | |
| | FUND COMPOSITION7 |
| | | Percentage of Net Assets |
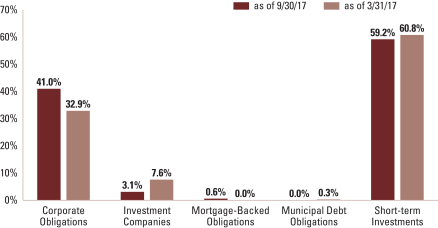
| | 7 | | The percentage shown for each investment category reflects the value of investments in that category as a percentage of net assets. Short-term investments represent certificates of deposits, commercial papers and repurchase agreements. Figures in the graph may not sum to 100% due to the exclusion of other assets and liabilities. The graph depicts the Fund’s investments but may not represent the Fund’s market exposure due to the exclusion of certain derivatives, if any, as listed in the Additional Investment Information section of the Schedule of Investments. |
37
GOLDMAN SACHS ENHANCED INCOME FUND
Schedule of Investments
September 30, 2017 (Unaudited)
| | | | | | | | | | | | | | |
Principal
Amount | | | Interest
Rate | | | Maturity
Date | | | Value | |
| Corporate Obligations – 46.8% | |
| Aerospace & Defense – 0.2% | |
| | Harris Corp. | |
| $ | 925,000 | | | | 1.999 | % | | | 04/27/18 | | | $ | 926,615 | |
| | |
| Agriculture – 2.3% | |
| | BAT Capital Corp.(a) | |
| | 9,325,000 | | | | 2.297 | | | | 08/14/20 | | | | 9,354,780 | |
| | BAT International Finance PLC(a) | |
| | 1,575,000 | | | | 1.850 | | | | 06/15/18 | | | | 1,575,439 | |
| | Philip Morris International, Inc. | |
| | 575,000 | | | | 1.375 | | | | 02/25/19 | | | | 572,137 | |
| | Reynolds American, Inc. | |
| | 2,900,000 | | | | 2.300 | | | | 06/12/18 | | | | 2,912,744 | |
| | | | | | | | | | | | | | |
| | | | | | | | | | | | | 14,415,100 | |
| | |
| Automotive – 1.3% | |
| | BMW US Capital LLC(a) | |
| | 1,050,000 | | | | 1.500 | | | | 04/11/19 | | | | 1,046,894 | |
| | Daimler Finance North America LLC(a) | |
| | 1,400,000 | | | | 1.650 | | | | 05/18/18 | | | | 1,399,654 | |
| | 1,050,000 | | | | 2.250 | | | | 03/02/20 | | | | 1,052,439 | |
| | Ford Motor Credit Co. LLC | |
| | 3,950,000 | | | | 2.425 | | | | 06/12/20 | | | | 3,950,396 | |
| | Harley-Davidson Financial Services, Inc.(a)(b) | |
| | 800,000 | | | | 2.150 | | | | 02/26/20 | | | | 797,290 | |
| | | | | | | | | | | | | | |
| | | | | | | | | | | | | 8,246,673 | |
| | |
| Banks – 18.2% | |
| | ABN AMRO Bank NV(a) | |
| | 7,925,000 | | | | 2.500 | | | | 10/30/18 | | | | 7,981,410 | |
| | Bank of America Corp. | |
| | 1,400,000 | | | | 6.875 | | | | 04/25/18 | | | | 1,440,298 | |
| | 1,150,000 | | | | 2.625 | | | | 10/19/20 | | | | 1,162,291 | |
| | 3,050,000 | | | | 2.151 | (b) | | | 11/09/20 | | | | 3,041,242 | |
| | (3M USD LIBOR + 0.660%) | |
| | 1,375,000 | | | | 2.369 | (b)(c) | | | 07/21/21 | | | | 1,375,102 | |
| | Bank of Montreal | |
| | 25,000 | | | | 1.800 | | | | 07/31/18 | | | | 25,047 | |
| | Banque Federative du Credit Mutuel SA(a) | |
| | 1,150,000 | | | | 2.000 | | | | 04/12/19 | | | | 1,152,287 | |
| | 700,000 | | | | 2.200 | | | | 07/20/20 | | | | 699,612 | |
| | BNP Paribas SA | |
| | 900,000 | | | | 2.375 | | | | 05/21/20 | | | | 908,853 | |
| | BPCE SA | |
| | 1,726,000 | | | | 2.500 | | | | 12/10/18 | | | | 1,740,153 | |
| | Capital One NA/Mclean VA(b) | |
| | 625,000 | | | | 1.850 | | | | 09/13/19 | | | | 620,613 | |
| | Citigroup, Inc. | |
| | 200,000 | | | | 6.125 | | | | 05/15/18 | | | | 205,265 | |
| | 150,000 | | | | 2.500 | | | | 09/26/18 | | | | 150,998 | |
| | 7,400,000 | | | | 2.050 | | | | 12/07/18 | | | | 7,410,686 | |
| | 875,000 | | | | 2.400 | | | | 02/18/20 | | | | 881,519 | |
| | Citizens Bank NA(b)(c) (3M USD LIBOR + 0.540%) | |
| | 1,175,000 | | | | 1.856 | | | | 03/02/20 | | | | 1,175,552 | |
| | Credit Suisse AG | |
| | 1,475,000 | | | | 1.750 | | | | 01/29/18 | | | | 1,476,155 | |
| | |
| Corporate Obligations – (continued) | |
| Banks – (continued) | |
| | Deutsche Bank AG | |
| $ | 2,225,000 | | | | 2.700 | % | | | 07/13/20 | | | $ | 2,233,001 | |
| | Discover Bank(b) | |
| | 1,600,000 | | | | 2.600 | | | | 11/13/18 | | | | 1,610,410 | |
| | HSBC USA, Inc. | |
| | 3,075,000 | | | | 1.500 | | | | 11/13/17 | | | | 3,075,456 | |
| | 3,000,000 | | | | 2.000 | | | | 08/07/18 | | | | 3,009,728 | |
| | ING Bank NV(a) | |
| | 1,600,000 | | | | 1.800 | | | | 03/16/18 | | | | 1,602,084 | |
| | 1,425,000 | | | | 2.050 | | | | 08/17/18 | | | | 1,427,925 | |
| | JPMorgan Chase & Co. (3M USD LIBOR + 0.630%) | |
| | 3,925,000 | | | | 1.944 | (c) | | | 01/28/19 | | | | 3,947,633 | |
| | 1,275,000 | | | | 2.200 | | | | 10/22/19 | | | | 1,282,604 | |
| | 1,775,000 | | | | 2.750 | (b) | | | 06/23/20 | | | | 1,808,490 | |
| | Kreditanstalt fuer Wiederaufbau(d) | |
| | 7,030,000 | | | | 4.500 | | | | 07/16/18 | | | | 7,193,420 | |
| | 21,280,000 | | | | 1.500 | | | | 02/06/19 | | | | 21,257,230 | |
| | Lloyds Bank PLC | |
| | 2,225,000 | | | | 1.750 | | | | 03/16/18 | | | | 2,227,084 | |
| | 1,100,000 | | | | 2.000 | | | | 08/17/18 | | | | 1,100,723 | |
| | 1,750,000 | | | | 2.300 | | | | 11/27/18 | | | | 1,760,064 | |
| | Macquarie Bank Ltd.(a) | |
| | 3,000,000 | | | | 1.670 | | | | 03/15/19 | | | | 2,999,423 | |
| | Mizuho Bank Ltd.(a) | |
| | 1,150,000 | | | | 1.550 | | | | 10/17/17 | | | | 1,150,091 | |
| | Morgan Stanley, Inc. | |
| | 1,425,000 | | | | 2.500 | | | | 04/21/21 | | | | 1,429,614 | |
| | (3M USD LIBOR + 1.180%) | |
| | 4,575,000 | | | | 2.487 | (b)(c) | | | 01/20/22 | | | | 4,639,367 | |
| | MUFG Americas Holdings Corp.(b) | |
| | 550,000 | | | | 1.625 | | | | 02/09/18 | | | | 549,990 | |
| | MUFG Union Bank NA(b) | |
| | 2,250,000 | | | | 2.625 | | | | 09/26/18 | | | | 2,268,856 | |
| | Nordea Bank AB(a) | |
| | 1,900,000 | | | | 1.875 | | | | 09/17/18 | | | | 1,903,629 | |
| | Santander Holdings USA, Inc.(b) | |
| | 250,000 | | | | 2.650 | | | | 04/17/20 | | | | 251,145 | |
| | Santander UK PLC | |
| | 1,225,000 | | | | 2.000 | | | | 08/24/18 | | | | 1,227,267 | |
| | Sumitomo Mitsui Trust Bank Ltd.(a) | |
| | 1,175,000 | | | | 2.050 | | | | 03/06/19 | | | | 1,176,008 | |
| | The Bank of Tokyo-Mitsubishi UFJ Ltd.(a) | |
| | 1,625,000 | | | | 1.700 | | | | 03/05/18 | | | | 1,625,348 | |
| | The Huntington National Bank(c) (3M USD LIBOR + 0.510%) | |
| | 1,175,000 | | | | 1.827 | | | | 03/10/20 | | | | 1,182,439 | |
| | UBS AG(a)(b) | |
| | 2,600,000 | | | | 2.200 | | | | 06/08/20 | | | | 2,604,670 | |
| | US Bank NA(b) | |
| | 1,175,000 | | | | 1.400 | | | | 04/26/19 | | | | 1,168,635 | |
| | Westpac Banking Corp. | |
| | 5,025,000 | | | | 2.300 | | | | 05/26/20 | | | | 5,064,966 | |
| | | | | | | | | | | | | | |
| | | | | 114,224,383 | |
| | |
| | |
| 38 | | The accompanying notes are an integral part of these financial statements. |
GOLDMAN SACHS ENHANCED INCOME FUND
| | | | | | | | | | | | | | |
Principal
Amount | | | Interest
Rate | | | Maturity
Date | | | Value | |
| Corporate Obligations – (continued) | |
| Beverages – 1.0% | |
| | Anheuser-Busch InBev Finance, Inc. | |
| $ | 4,025,000 | | | | 1.900 | % | | | 02/01/19 | | | $ | 4,035,397 | |
| | Molson Coors Brewing Co. | |
| | 975,000 | | | | 1.900 | (a) | | | 03/15/19 | | | | 973,611 | |
| | 1,375,000 | | | | 1.450 | | | | 07/15/19 | | | | 1,360,045 | |
| | | | | | | | | | | | | | |
| | | | | 6,369,053 | |
| | |
| Chemicals – 0.5% | |
| | E.I. du Pont de Nemours & Co.(c) (3M USD LIBOR + 0.530%) | |
| | 825,000 | | | | 1.841 | | | | 05/01/20 | | | | 831,958 | |
| | The Sherwin-Williams Co. | |
| | 1,175,000 | | | | 2.250 | | | | 05/15/20 | | | | 1,179,651 | |
| | 1,300,000 | | | | 2.750 | (b) | | | 06/01/22 | | | | 1,308,752 | |
| | | | | | | | | | | | | | |
| | | | | | | | | | | | | 3,320,361 | |
| | |
| Commercial Services – 0.3% | |
| | Ecolab, Inc. | |
| | 2,025,000 | | | | 1.550 | | | | 01/12/18 | | | | 2,024,007 | |
| | |
| Computers – 0.9% | |
| | Dell International LLC/EMC Corp.(a) | |
| | 2,600,000 | | | | 3.480 | | | | 06/01/19 | | | | 2,651,629 | |
| | DXC Technology Co. | |
| | 550,000 | | | | 2.875 | | | | 03/27/20 | | | | 557,334 | |
| | Hewlett Packard Enterprise Co.(b) | |
| | 2,550,000 | | | | 3.600 | | | | 10/15/20 | | | | 2,643,192 | |
| | | | | | | | | | | | | | |
| | | | | | | | | | | | | 5,852,155 | |
| | |
| Diversified Financial Services – 1.8% | |
| | AerCap Ireland Capital DAC/AerCap Global Aviation Trust | |
| | 1,900,000 | | | | 3.750 | | | | 05/15/19 | | | | 1,944,213 | |
| | AIG Global Funding(a) | |
| | 675,000 | | | | 2.150 | | | | 07/02/20 | | | | 674,049 | |
| | American Express Credit Corp.(b) | |
| | 3,675,000 | | | | 2.375 | | | | 05/26/20 | | | | 3,712,718 | |
| | CBOE Holdings, Inc. | |
| | 475,000 | | | | 1.950 | | | | 06/28/19 | | | | 474,525 | |
| | International Lease Finance Corp. | |
| | 600,000 | | | | 6.250 | | | | 05/15/19 | | | | 637,731 | |
| | Synchrony Financial(b) | |
| | 1,200,000 | | | | 2.600 | | | | 01/15/19 | | | | 1,207,686 | |
| | Visa, Inc.(b) | |
| | 2,675,000 | | | | 2.200 | | | | 12/14/20 | | | | 2,702,312 | |
| | | | | | | | | | | | | | |
| | | | | | | | | | | | | 11,353,234 | |
| | |
| Electrical – 2.3% | |
| | CMS Energy Corp. | |
| | 2,263,000 | | | | 8.750 | | | | 06/15/19 | | | | 2,510,850 | |
| | Commonwealth Edison Co.(b) | |
| | 525,000 | | | | 2.150 | | | | 01/15/19 | | | | 527,527 | |
| | Consolidated Edison, Inc.(b) | |
| | 350,000 | | | | 2.000 | | | | 05/15/21 | | | | 346,583 | |
| | Dominion Energy, Inc. | |
| | 1,150,000 | | | | 1.900 | | | | 06/15/18 | | | | 1,151,871 | |
| | 300,000 | | | | 1.600 | | | | 08/15/19 | | | | 298,067 | |
| | Emera US Finance LP | |
| | 1,375,000 | | | | 2.150 | | | | 06/15/19 | | | | 1,375,552 | |
| | |
| Corporate Obligations – (continued) | |
| Electrical – (continued) | |
| | NextEra Energy Capital Holdings, Inc. | |
| 375,000 | | | | 2.300 | | | | 04/01/19 | | | | 376,912 | |
| | Public Service Enterprise Group, Inc. | |
| | 1,950,000 | | | | 1.600 | | | | 11/15/19 | | | | 1,928,732 | |
| | Southern Power Co.(b) | |
| | 1,150,000 | | | | 2.500 | | | | 12/15/21 | | | | 1,145,038 | |
| | The Southern Co. | |
| | 2,360,000 | | | | 1.550 | | | | 07/01/18 | | | | 2,357,871 | |
| | 1,300,000 | | | | 1.850 | | | | 07/01/19 | | | | 1,299,337 | |
| | Virginia Electric & Power Co.(b) | |
| | 900,000 | | | | 1.200 | | | | 01/15/18 | | | | 898,917 | |
| | | | | | | | | | | | | | |
| | | | | | | | | | | | | 14,217,257 | |
| | |
| Electronics – 0.5% | |
| | Amphenol Corp.(b) | |
| | 1,000,000 | | | | 2.550 | | | | 01/30/19 | | | | 1,006,489 | |
| | Fortive Corp. | |
| | 750,000 | | | | 1.800 | | | | 06/15/19 | | | | 747,886 | |
| | Honeywell International, Inc.(b) | |
| | 1,400,000 | | | | 1.850 | | | | 11/01/21 | | | | 1,383,119 | |
| | | | | | | | | | | | | | |
| | | | | | | | | | | | | 3,137,494 | |
| | |
| Food & Drug Retailing – 2.2% | |
| | Danone SA(a) | |
| | 2,925,000 | | | | 1.691 | | | | 10/30/19 | | | | 2,905,674 | |
| | Kraft Heinz Foods Co. | |
| | 1,925,000 | | | | 2.000 | | | | 07/02/18 | | | | 1,928,953 | |
| | Mondelez International Holdings Netherlands BV(a)(b) | |
| | 3,300,000 | | | | 2.000 | | | | 10/28/21 | | | | 3,240,303 | |
| | Sysco Corp.(b) | |
| | 625,000 | | | | 2.600 | | | | 10/01/20 | | | | 634,194 | |
| | The JM Smucker Co. | |
| | 2,025,000 | | | | 1.750 | | | | 03/15/18 | | | | 2,026,960 | |
| | 575,000 | | | | 2.500 | | | | 03/15/20 | | | | 580,379 | |
| | The Kroger Co. | |
| | 450,000 | | | | 2.000 | | | | 01/15/19 | | | | 450,784 | |
| | Wm Wrigley Jr Co.(a) | |
| | 1,900,000 | | | | 2.000 | | | | 10/20/17 | | | | 1,899,736 | |
| | | | | | | | | | | | | | |
| | | | | | | | | | | | | 13,666,983 | |
| | |
| Healthcare Providers & Services – 1.6% | |
| | Abbott Laboratories(b) | |
| | 1,275,000 | | | | 2.900 | | | | 11/30/21 | | | | 1,298,376 | |
| | Becton Dickinson & Co. | |
| | 1,250,000 | | | | 2.133 | | | | 06/06/19 | | | | 1,253,441 | |
| | 675,000 | | | | 2.404 | | | | 06/05/20 | | | | 677,368 | |
| | Danaher Corp. | |
| | 850,000 | | | | 1.650 | | | | 09/15/18 | | | | 851,076 | |
| | Stryker Corp. | |
| | 1,550,000 | | | | 2.000 | | | | 03/08/19 | | | | 1,553,267 | |
| | UnitedHealth Group, Inc. | |
| | 1,400,000 | | | | 1.900 | | | | 07/16/18 | | | | 1,403,691 | |
| | 2,675,000 | | | | 2.300 | | | | 12/15/19 | | | | 2,698,969 | |
| | | | | | | | | | | | | | |
| | | | | | | | | | | | | 9,736,188 | |
| | |
| | |
| The accompanying notes are an integral part of these financial statements. | | 39 |
GOLDMAN SACHS ENHANCED INCOME FUND
Schedule of Investments (continued)
September 30, 2017 (Unaudited)
| | | | | | | | | | | | | | |
Principal
Amount | | | Interest
Rate | | | Maturity
Date | | | Value | |
| Corporate Obligations – (continued) | |
| Insurance – 0.6% | |
| | Chubb INA Holdings, Inc.(b) | |
| $ | 875,000 | | | | 2.300 | % | | | 11/03/20 | | | $ | 881,411 | |
| | MetLife, Inc. | |
| | 1,150,000 | | | | 7.717 | | | | 02/15/19 | | | | 1,241,076 | |
| | Reliance Standard Life Global Funding II(a) | |
| | 1,375,000 | | | | 2.500 | | | | 04/24/19 | | | | 1,383,618 | |
| | | | | | | | | | | | | | |
| | | | | | | | | | | | | 3,506,105 | |
| | |
| Internet(a) – 0.3% | |
| | Amazon.com, Inc. | |
| | 1,825,000 | | | | 1.900 | | | | 08/21/20 | | | | 1,829,457 | |
| | |
| Machinery—Construction & Mining – 0.1% | |
| | Caterpillar Financial Services Corp. | |
| | 735,000 | | | | 2.450 | | | | 09/06/18 | | | | 740,479 | |
| | |
| Machinery-Diversified(b) – 0.1% | |
| | Roper Technologies, Inc. | |
| | 775,000 | | | | 2.800 | | | | 12/15/21 | | | | 782,095 | |
| | |
| Mining(a) – 0.2% | |
| | Glencore Finance Canada Ltd. | |
| | 1,475,000 | | | | 2.700 | | | | 10/25/17 | | | | 1,475,516 | |
| | |
| Miscellaneous Manufacturing(a) – 0.4% | |
| | Siemens Financieringsmaat NV | |
| | 2,750,000 | | | | 1.300 | | | | 09/13/19 | | | | 2,718,278 | |
| | |
| Oil Field Services – 0.5% | |
| | EOG Resources, Inc. | |
| | 1,125,000 | | | | 5.625 | | | | 06/01/19 | | | | 1,189,815 | |
| | Phillips 66(a)(b)(c) (3M USD LIBOR + 0.750%) | |
| | 750,000 | | | | 2.054 | | | | 04/15/20 | | | | 751,079 | |
| | Statoil ASA(c) (3M USD LIBOR + 0.290%) | |
| | 1,200,000 | | | | 1.605 | | | | 05/15/18 | | | | 1,202,162 | |
| | | | | | | | | | | | | | |
| | | | | | | | | | | | | 3,143,056 | |
| | |
| Pharmaceuticals – 4.1% | |
| | AbbVie, Inc. | |
| | 9,750,000 | | | | 1.800 | | | | 05/14/18 | | | | 9,763,548 | |
| | Allergan Funding SCS(b) | |
| | 5,378,000 | | | | 3.000 | | | | 03/12/20 | | | | 5,490,551 | |
| | Bayer US Finance LLC(a)(c) (3M USD LIBOR + 0.280%) | |
| | 3,350,000 | | | | 1.582 | | | | 10/06/17 | | | | 3,350,067 | |
| | EMD Finance LLC(a)(b) | |
| | 3,100,000 | | | | 2.400 | | | | 03/19/20 | | | | 3,124,341 | |
| | Forest Laboratories LLC(a)(b) | |
| | 484,000 | | | | 4.375 | | | | 02/01/19 | | | | 496,343 | |
| | Mylan, Inc. | |
| | 450,000 | | | | 2.550 | | | | 03/28/19 | | | | 452,082 | |
| | Shire Acquisitions Investments Ireland DAC | |
| | 3,025,000 | | | | 1.900 | | | | 09/23/19 | | | | 3,019,019 | |
| | | | | | | | | | | | | | |
| | | | | | | | | | | | | 25,695,951 | |
| | |
| Pipelines – 2.1% | |
| | Columbia Pipeline Group, Inc. | |
| | 825,000 | | | | 2.450 | | | | 06/01/18 | | | | 827,838 | |
| | Enbridge Energy Partners LP | |
| | 846,000 | | | | 5.200 | | | | 03/15/20 | | | | 900,659 | |
| | |
| Corporate Obligations – (continued) | |
| Pipelines – (continued) | |
| | Enterprise Products Operating LLC | |
| 1,450,000 | | | | 5.250 | | | | 01/31/20 | | | | 1,550,418 | |
| | Kinder Morgan Energy Partners LP | |
| | 2,325,000 | | | | 6.850 | | | | 02/15/20 | | | | 2,551,753 | |
| | Kinder Morgan, Inc.(b) | |
| | 625,000 | | | | 3.050 | | | | 12/01/19 | | | | 636,302 | |
| | Magellan Midstream Partners LP | |
| | 1,075,000 | | | | 6.400 | | | | 07/15/18 | | | | 1,112,102 | |
| | 1,225,000 | | | | 6.550 | | | | 07/15/19 | | | | 1,316,494 | |
| | Sabine Pass Liquefaction LLC(b) | |
| | 2,300,000 | | | | 6.250 | | | | 03/15/22 | | | | 2,586,912 | |
| | TransCanada PipeLines Ltd. | |
| | 1,550,000 | | | | 1.875 | | | | 01/12/18 | | | | 1,551,321 | |
| | | | | | | | | | | | | | |
| | | | | | | | | | | | | 13,033,799 | |
| | |
| Real Estate Investment Trust(b) – 0.7% | |
| | American Tower Corp. | |
| | 1,810,000 | | | | 2.800 | | | | 06/01/20 | | | | 1,837,427 | |
| | 1,125,000 | | | | 3.300 | | | | 02/15/21 | | | | 1,152,757 | |
| | Digital Realty Trust LP | |
| | 1,125,000 | | | | 3.400 | | | | 10/01/20 | | | | 1,160,128 | |
| | Select Income REIT | |
| | 450,000 | | | | 2.850 | | | | 02/01/18 | | | | 451,026 | |
| | | | | | | | | | | | | | |
| | | | | | | | | | | | | 4,601,338 | |
| | |
| Retailing – 0.7% | |
| | AutoZone, Inc. | |
| | 300,000 | | | | 1.625 | | | | 04/21/19 | | | | 298,358 | |
| | CVS Health Corp. | |
| | 275,000 | | | | 1.900 | | | | 07/20/18 | | | | 275,659 | |
| | 1,325,000 | | | | 2.800 | (b) | | | 07/20/20 | | | | 1,347,841 | |
| | 2,200,000 | | | | 2.125 | (b) | | | 06/01/21 | | | | 2,179,655 | |
| | | | | | | | | | | | | | |
| | | | | | | | | | | | | 4,101,513 | |
| | |
| Semiconductors – 1.1% | |
| | Broadcom Corp./Broadcom Cayman Finance Ltd.(a) | |
| | 5,800,000 | | | | 2.375 | | | | 01/15/20 | | | | 5,832,039 | |
| | QUALCOMM, Inc. | |
| | 875,000 | | | | 1.850 | | | | 05/20/19 | | | | 877,494 | |
| | 350,000 | | | | 2.100 | | | | 05/20/20 | | | | 352,665 | |
| | | | | | | | | | | | | | |
| | | | | | | | | | | | | 7,062,198 | |
| | |
| Software – 0.9% | |
| | Fidelity National Information Services, Inc. | |
| | 1,400,000 | | | | 2.850 | | | | 10/15/18 | | | | 1,416,354 | |
| | 1,050,000 | | | | 2.250 | (b) | | | 08/15/21 | | | | 1,042,940 | |
| | Fiserv, Inc.(b) | |
| | 1,025,000 | | | | 2.700 | | | | 06/01/20 | | | | 1,036,852 | |
| | VMware, Inc. | |
| | 1,825,000 | | | | 2.300 | | | | 08/21/20 | | | | 1,830,343 | |
| | | | | | | | | | | | | | |
| | | | | | | | | | | | | 5,326,489 | |
| | |
| Telecommunication Services – 1.6% | |
| | AT&T, Inc. | |
| | 2,000,000 | | | | 5.875 | | | | 10/01/19 | | | | 2,148,828 | |
| | 825,000 | | | | 2.800 | (b) | | | 02/17/21 | | | | 834,824 | |
| | 425,000 | | | | 3.875 | | | | 08/15/21 | | | | 444,876 | |
| | 1,625,000 | | | | 3.000 | | | | 02/15/22 | | | | 1,642,180 | |
| | |
| | |
| 40 | | The accompanying notes are an integral part of these financial statements. |
GOLDMAN SACHS ENHANCED INCOME FUND
| | | | | | | | | | | | | | |
Principal
Amount | | | Interest
Rate | | | Maturity
Date | | | Value | |
| Corporate Obligations – (continued) | |
| Telecommunication Services – (continued) | |
| | Verizon Communications, Inc. | |
| $ | 676,000 | | | | 2.625 | % | | | 02/21/20 | | | $ | 687,131 | |
| | 4,050,000 | | | | 1.750 | | | | 08/15/21 | | | | 3,964,324 | |
| | 425,000 | | | | 3.000 | (b) | | | 11/01/21 | | | | 433,722 | |
| | | | | | | | | | | | | | |
| | | | | | | | | | | | | 10,155,885 | |
| | |
| Trucking & Leasing(a) – 0.3% | |
| | Penske Truck Leasing Co. LP/PTL Finance Corp. | |
| | 1,625,000 | | | | 2.875 | | | | 07/17/18 | | | | 1,640,156 | |
| | | | | | | | | | | | | | |
| | | | | | | | | | | | | 1,640,156 | |
| | |
| | TOTAL CORPORATE OBLIGATIONS | |
| | (Cost $293,022,755) | | | $ | 293,301,818 | |
| | |
| | | | | | | | | | | | | | |
| Mortgage-Backed Obligations(a) – 1.0% | |
| Collateralized Mortgage Obligations – 1.0% | |
| Sequential Floating Rate – 1.0% | |
| Mortgage Repurchase Agreement Financing Trust Series 2016-1,
Class A2(c) (1M USD LIBOR + 0.950%) |
|
| $ | 1,000,000 | | | | 2.181 | % | | | 04/10/19 | | | $ | 1,000,021 | |
| Mortgage Repurchase Agreement Financing Trust Series 2017-1,
Class A1(c) (1M USD LIBOR + 0.850%) |
|
| | 650,000 | | | | 2.081 | | | | 07/10/19 | | | | 650,167 | |
| Mortgage Repurchase Agreement Financing Trust Series 2017-2,
Class A1 |
|
| | 4,300,000 | | | | 1.781 | | | | 08/12/19 | | | | 4,300,348 | |
| Station Place Securitization Trust Series 2015-2, Class A(c)
(1M USD LIBOR + 1.050%) |
|
| | 589,528 | | | | 2.279 | | | | 05/15/18 | | | | 589,528 | |
| | |
| | TOTAL MORTGAGE-BACKED OBLIGATIONS | |
| | (Cost $6,539,528) | | | $ | 6,540,064 | |
| | |
| | | | | | | | | | | | | | |
| Asset-Backed Securities – 15.4% | |
| Automotive – 2.5% | |
| | Ally Master Owner Trust Series 2015-2, Class A2 | |
| $ | 4,000,000 | | | | 1.830 | % | | | 01/15/21 | | | $ | 3,998,239 | |
| | Ally Master Owner Trust Series 2017-3, Class A2 | |
| | 3,750,000 | | | | 2.040 | | | | 06/15/22 | | | | 3,740,407 | |
| | Chesapeake Funding II LLC Series 2016-2A, Class A1(a) | |
| | 2,963,110 | | | | 1.880 | | | | 06/15/28 | | | | 2,964,954 | |
| | Ford Credit Auto Owner Trust Series 2016-2, Class A(a) | |
| | 1,600,000 | | | | 2.030 | | | | 12/15/27 | | | | 1,587,572 | |
| | GM Financial Automobile Leasing Trust Series 2015-1, Class A3 | |
| | 313,889 | | | | 1.530 | | | | 09/20/18 | | | | 313,939 | |
| GMF Floorplan Owner Revolving Trust Series 2016-1,
Class A1(a) |
|
| | 1,550,000 | | | | 1.960 | | | | 05/17/21 | | | | 1,552,920 | |
| | Nissan Master Owner Receivables Trust Series 2016-A, Class A2 | |
| | 1,200,000 | | | | 1.540 | | | | 06/15/21 | | | | 1,192,731 | |
| | | | | | | | | | | | | | |
| | | | | | | | | | | | | 15,350,762 | |
| | |
| Asset-Backed Securities – (continued) | |
| Credit Card – 6.2% | |
| Bank of America Credit Card Trust Series 2014-A1, Class A(c)
(1M LIBOR + 0.380%) |
|
| 7,000,000 | | | | 1.614 | | | | 06/15/21 | | | | 7,028,105 | |
| | Barclays Dryrock Issuance Trust Series 2015-1, Class A | |
| | 3,450,000 | | | | 2.200 | | | | 12/15/22 | | | | 3,464,735 | |
| | Barclays Dryrock Issuance Trust Series 2016-1, Class A | |
| | 1,600,000 | | | | 1.520 | | | | 05/16/22 | | | | 1,589,726 | |
| Capital One Multi-Asset Execution Trust Series 2016-A5,
Class A5 |
|
| | 3,650,000 | | | | 1.660 | | | | 06/17/24 | | | | 3,592,692 | |
| CARDS II Trust Series 2016-1A, Class A(a)(c)
(1M LIBOR + 0.700%) |
|
| | 2,150,000 | | | | 1.934 | | | | 07/15/21 | | | | 2,158,928 | |
| | Chase Issuance Trust Series 2016-A2, Class A | |
| | 2,900,000 | | | | 1.370 | | | | 06/15/21 | | | | 2,880,632 | |
| | Chase Issuance Trust Series 2016-A5, Class A5 | |
| | 3,950,000 | | | | 1.270 | | | | 07/15/21 | | | | 3,914,592 | |
| Evergreen Credit Card Trust Series 2016-1, Class A(a)(c)
(1M LIBOR + 0.720%) |
|
| | 3,350,000 | | | | 1.954 | | | | 04/15/20 | | | | 3,360,080 | |
| | Golden Credit Card Trust Series 2016-5A, Class A(a) | |
| | 2,800,000 | | | | 1.600 | | | | 09/15/21 | | | | 2,780,955 | |
| | Golden Credit Card Trust Series 2017-2A, Class A(a) | |
| | 1,900,000 | | | | 1.980 | | | | 04/15/22 | | | | 1,900,376 | |
| | Master Credit Card Trust II Series 2017-1A, Class A(a) | |
| | 2,600,000 | | | | 2.260 | | | | 07/21/21 | | | | 2,615,037 | |
| Trillium Credit Card Trust II Series 2016-1A, Class A(a)(c)
(1M LIBOR + 0.720%) |
|
| | 3,650,000 | | | | 1.958 | | | | 05/26/21 | | | | 3,655,565 | |
| | | | | | | | | | | | | | |
| | | | | | | | | | | | | 38,941,423 | |
| | |
| Home Equity – 0.0% | |
| Amresco Residential Securities Mortgage Loan Trust
Series 1998-2, Class M1F |
|
| | 4,697 | | | | 6.745 | | | | 06/25/28 | | | | 5,667 | |
| Centex Home Equity Series 2004-D, Class MV3(c)
(1M USD LIBOR + 1.000%) |
|
| | 67,270 | | | | 2.734 | | | | 09/25/34 | | | | 66,586 | |
| Morgan Stanley ABS Capital I Series 2004-HE4, Class M3(c)
(1M USD LIBOR + 2.250%) |
|
| | 28,679 | | | | 3.484 | | | | 05/25/34 | | | | 28,955 | |
| | | | | | | | | | | | | | |
| | | | | | | | | | | | | 101,208 | |
| | |
| Manufactured Housing – 0.0% | |
| Lehman ABS Manufactured Housing Contract Series 2001-B,
Class A3 |
|
| | 9,187 | | | | 4.350 | | | | 04/15/40 | | | | 9,249 | |
| | | | | | | | | | | | | | |
| | | | | | | | | | | | | 9,249 | |
| | |
| Student Loan(c) – 6.7% | |
| ECMC Group Student Loan Trust Series 2016-1A, Class A(a)
(1M USD LIBOR + 1.350%) |
|
| | 2,157,556 | | | | 2.584 | | | | 07/26/66 | | | | 2,158,912 | |
| ECMC Group Student Loan Trust Series 2017-1A, Class A(a)
(1M USD LIBOR + 1.200%) |
|
| | 3,827,017 | | | | 2.434 | | | | 12/27/66 | | | | 3,830,389 | |
| | |
| | |
| The accompanying notes are an integral part of these financial statements. | | 41 |
GOLDMAN SACHS ENHANCED INCOME FUND
Schedule of Investments (continued)
September 30, 2017 (Unaudited)
| | | | | | | | | | | | | | |
Principal
Amount | | | Interest
Rate | | | Maturity
Date | | | Value | |
| Asset-Backed Securities – (continued) | |
| Student Loan(c) – (continued) | |
| Education Loan Asset-Backed Trust I Series 2013-1, Class A1(a)
(1M USD LIBOR + 0.800%) |
|
| $ | 1,823,311 | | | | 2.034 | % | | | 06/25/26 | | | $ | 1,825,210 | |
| Educational Services of America, Inc. Series 2010-1, Class A1(a)
(3M USD LIBOR + 0.850%) |
|
| | 1,059,231 | | | | 2.006 | | | | 07/25/23 | | | | 1,059,912 | |
| Educational Services of America, Inc. Series 2014-1, Class A(a)
(1M USD LIBOR + 0.700%) |
|
| | 1,987,272 | | | | 1.934 | | | | 02/25/39 | | | | 1,962,010 | |
| GCO Education Loan Funding Master Trust-II Series 2006-2A,
Class A3L(a) (3M USD LIBOR + 0.120%) |
|
| | 85,378 | | | | 1.309 | | | | 08/25/28 | | | | 85,367 | |
| GCO Education Loan Funding Trust Series 2007-1A, Class A6L(a)
(3M LIBOR + 0.110%) |
|
| | 2,402,823 | | | | 1.427 | | | | 11/25/26 | | | | 2,387,831 | |
| Goal Capital Funding Trust Series 2007-1, Class A3
(3M USD LIBOR + 0.090%) |
|
| | 61,310 | | | | 1.386 | | | | 09/25/28 | | | | 61,283 | |
| Higher Education Funding I Series 2005-1, Class A4
(3M USD LIBOR + 0.140%) |
|
| | 123,562 | | | | 1.329 | | | | 02/25/30 | | | | 123,529 | |
| Illinois Student Assistance Commission Series 2010-1, Class A3
(3M USD LIBOR + 0.900%) |
|
| | 1,450,000 | | | | 2.056 | | | | 07/25/45 | | | | 1,454,726 | |
| Navient Student Loan Trust Series 2016-5A, Class A(a)
(1M USD LIBOR + 1.250%) |
|
| | 4,793,615 | | | | 2.484 | | | | 06/25/65 | | | | 4,889,758 | |
| Navient Student Loan Trust Series 2016-7A, Class A(a)
(1M USD LIBOR + 1.150%) |
|
| | 2,396,502 | | | | 2.384 | | | | 03/25/66 | | | | 2,425,538 | |
| Navient Student Loan Trust Series 2017-2A, Class A(a)
(1M USD LIBOR + 1.050%) |
|
| | 3,985,655 | | | | 2.284 | | | | 12/27/66 | | | | 4,040,107 | |
| Nelnet Student Loan Trust Series 2005-4, Class A3
(3M USD LIBOR + 0.130%) |
|
| | 255,607 | | | | 1.417 | | | | 06/22/26 | | | | 255,519 | |
| Nelnet Student Loan Trust Series 2006-2, Class A5
(3M USD LIBOR + 0.100%) |
|
| | 2,168,137 | | | | 1.256 | | | | 01/25/30 | | | | 2,165,287 | |
| Northstar Education Finance, Inc. Series 2012-1, Class A(a)
(1M USD LIBOR + 0.700%) |
|
| | 1,628,156 | | | | 1.934 | | | | 12/26/31 | | | | 1,615,409 | |
| SLC Student Loan Center Series 2011-1, Class A(a)
(1M USD LIBOR + 1.220%) |
|
| | 6,791,565 | | | | 2.454 | | | | 10/25/27 | | | | 6,883,341 | |
| SLM Student Loan Trust Series 2003-12, Class A5(a)
(3M USD LIBOR + 0.280%) |
|
| | 237,411 | | | | 1.526 | | | | 09/15/22 | | | | 237,542 | |
| SLM Student Loan Trust Series 2003-14, Class A5
(3M USD LIBOR + 0.230%) |
|
| | 182,947 | | | | 1.386 | | | | 01/25/23 | | | | 183,037 | |
| SLM Student Loan Trust Series 2004-1, Class A3
(3M USD LIBOR + 0.210%) |
|
| | 743,334 | | | | 1.366 | | | | 04/25/23 | | | | 743,556 | |
| SLM Student Loan Trust Series 2006-2, Class A5
(3M USD LIBOR + 0.110%) |
|
| | 1,415,874 | | | | 1.266 | | | | 07/25/25 | | | | 1,415,802 | |
| | |
| Asset-Backed Securities – (continued) | |
| Student Loan(c) – (continued) | |
| SLM Student Loan Trust Series 2013-3, Class A2
(1M USD LIBOR + 0.300%) |
|
| 60,240 | | | | 1.534 | | | | 05/26/20 | | | | 60,267 | |
| SLM Student Loan Trust Series 2014-1, Class A2
(1M USD LIBOR + 0.380%) |
|
| | 95,852 | | | | 1.614 | �� | | | 07/26/21 | | | | 95,886 | |
| South Texas Higher Education Authority, Inc. Series 2012-1,
Class A2 (3M USD LIBOR + 0.850%) |
|
| | 891,046 | | | | 1.998 | | | | 10/01/24 | | | | 894,314 | |
| Utah State Board of Regents Series 2011-1, Class A3
(3M USD LIBOR + 0.850%) |
|
| | 1,100,000 | | | | 2.020 | | | | 05/01/35 | | | | 1,086,349 | |
| Wachovia Student Loan Trust Series 2005-1, Class A5
(3M USD LIBOR + 0.130%) |
|
| | 174,505 | | | | 1.286 | | | | 01/26/26 | | | | 174,450 | |
| | | | | | | | | | | | | | |
| | | | | 42,115,331 | |
| | |
| | TOTAL ASSET-BACKED SECURITIES | | | | | |
| | (Cost $96,347,537) | | | $ | 96,517,973 | |
| | |
| | | | | | | | | | | | | | |
| Municipal Debt Obligation(b)(c) – 0.1% | |
| Utah – 0.1% | | | | | | | | | | |
| Utah State Board of Regents Student Loan RB (Taxable)
Series 2011, Class A2 (3M USD LIBOR + 0.850%) |
|
| $ | 954,677 | | | | 2.161 | % | | | 05/01/29 | | | $ | 957,656 | |
| | |
| | | | | | | | | | | | | | |
| U.S. Treasury Obligations – 10.5% | |
| | United States Treasury Inflation Indexed Bonds | |
| $ | 8,683,554 | | | | 0.125 | %(e) | | | 04/15/18 | | | $ | 8,690,761 | |
| | 4,703,895 | | | | 0.125 | | | | 04/15/20 | | | | 4,728,497 | |
| | United States Treasury Notes | |
| | 5,130,000 | | | | 1.375 | | | | 09/30/20 | | | | 5,092,141 | |
| | 23,100,000 | | | | 1.250 | | | | 03/31/21 | | | | 22,727,628 | |
| | 24,800,000 | | | | 1.375 | | | | 04/30/21 | | | | 24,486,280 | |
| | |
| | TOTAL U.S. TREASURY OBLIGATIONS | |
| | (Cost $66,229,828) | | | $ | 65,725,307 | |
| | |
| | | | | | | | | | | | | | |
| Shares | | | Distribution
Rate | | | Value | |
| Investment Company(f)– 10.9% | |
| Goldman Sachs Financial Square Government Fund –
Institutional Shares |
|
| | 68,129,485 | | | | 0.914% | | | $ | 68,129,485 | |
| | (Cost $68,129,485) | |
| | |
| TOTAL INVESTMENTS BEFORE
SHORT-TERM INVESTMENT |
|
| | (Cost $531,225,633) | | | $ | 531,172,303 | |
| | |
| | |
| 42 | | The accompanying notes are an integral part of these financial statements. |
GOLDMAN SACHS ENHANCED INCOME FUND
| | | | | | | | | | | | | | |
Principal
Amount | | | Interest
Rate | | | Maturity
Date | | | Value | |
| Short-term Investments – 13.3% | |
| Certificates of Deposit – 5.5% | |
| | Bank of Montreal | |
| $ | 2,800,000 | | | | 1.783 | % | | | 10/24/17 | | | $ | 2,801,152 | |
| | Mizuho Bank Ltd. | |
| | 1,500,000 | | | | 1.828 | | | | 09/24/18 | | | | 1,499,707 | |
| | BNP Paribas New York | |
| | 3,200,000 | | | | 1.440 | | | | 01/02/18 | | | | 3,201,092 | |
| | Barclays Bank PLC (3M USD LIBOR + 0.750%) | |
| | 2,000,000 | | | | 2.066 | | | | 12/06/17 | | | | 2,002,984 | |
| | (3M USD LIBOR + 0.420%) | |
| | 3,000,000 | | | | 1.706 | | | | 03/29/18 | | | | 3,002,254 | |
| | Credit Suisse New York | |
| | 3,000,000 | | | | 1.557 | | | | 09/20/18 | | | | 2,999,983 | |
| | National Bank of Canada | |
| | 2,500,000 | | | | 1.467 | | | | 09/21/18 | | | | 2,500,431 | |
| | Sumitomo Mitsui Trust Bank Ltd.(c) (1M USD LIBOR + 0.200%) | |
| | 6,000,000 | | | | 1.432 | | | | 02/06/18 | | | | 6,001,030 | |
| | (3M USD LIBOR + 0.370%) | |
| | 4,000,000 | | | | 1.674 | | | | 01/17/19 | | | | 3,998,977 | |
| | Nordea Bank Finland PLC | |
| | 4,200,000 | | | | 1.762 | | | | 11/07/18 | | | | 4,199,079 | |
| | UBS AG Stamford | |
| | 2,000,000 | | | | 1.530 | | | | 12/19/17 | | | | 2,000,956 | |
| | | | | | | | | | | | | | |
| | | | | | | | | | | | | 34,207,645 | |
| | |
| Commercial Paper – 7.8% | |
| | UBS AG London(a) | |
| | 2,000,000 | | | | 1.472 | | | | 06/15/18 | | | | 2,000,963 | |
| | Versailles Commercial Paper LLC | |
| | 4,000,000 | | | | 0.010 | | | | 10/02/17 | | | | 3,999,850 | |
| | ABN AMRO Funding USA LLC | |
| | 3,000,000 | | | | 0.000 | (g) | | | 03/26/18 | | | | 2,978,536 | |
| | Alpine Securitization Ltd. | |
| | 1,000,000 | | | | 0.000 | (g) | | | 07/25/18 | | | | 986,105 | |
| | Canadian Imperial Bank of Commerce | |
| | 1,000,000 | | | | 1.444 | | | | 07/16/18 | | | | 1,000,067 | |
| | Dominion Energy, Inc. | |
| | 1,000,000 | | | | 0.000 | (g) | | | 10/12/17 | | | | 999,503 | |
| | Bayerische Landesbank | |
| | 2,500,000 | | | | 1.000 | | | | 08/23/18 | | | | 2,501,711 | |
| | Cafco LLC | |
| | 3,000,000 | | | | 0.000 | (g) | | | 02/02/18 | | | | 2,985,751 | |
| | Dominion Resources, Inc. | |
| | 3,000,000 | | | | 0.000 | (g) | | | 10/16/17 | | | | 2,998,044 | |
| | Ei Dupont | |
| | 3,000,000 | | | | 0.000 | (g) | | | 10/12/17 | | | | 2,998,510 | |
| | 4,000,000 | | | | 0.000 | (g) | | | 10/16/17 | | | | 3,997,391 | |
| | Ford Motor Credit Co. LLC | |
| | 2,500,000 | | | | 0.010 | | | | 07/10/18 | | | | 2,462,508 | |
| | ING Funding LLC | |
| | 2,000,000 | | | | 1.448 | | | | 05/11/18 | | | | 2,000,054 | |
| | Schlumberger Holdings | |
| | 2,500,000 | | | | 0.000 | (g) | | | 10/03/17 | | | | 2,499,604 | |
| | Autozone, Inc. | |
| | 3,000,000 | | | | 0.000 | %(g) | | | 10/20/17 | | | | 2,997,578 | |
| | John Deere Ltd. | |
| | 1,110,000 | | | | 0.000 | (g) | | | 10/20/17 | | | | 1,109,266 | |
| | |
| Short-term Investments – (continued) | |
| Commercial Paper – (continued) | |
| | Edison International | |
| $ | 3,000,000 | | | | 0.000 | %(g) | | | 10/02/17 | | | $ | 2,999,662 | |
| | Whirlpool Corp. | |
| | 3,000,000 | | | | 0.000 | (g) | | | 12/18/17 | | | | 2,990,113 | |
| | Electricite de France SA | |
| | 2,600,000 | | | | 0.000 | (g) | | | 01/05/18 | | | | 2,589,143 | |
| | Societe Generale SA | |
| | 2,000,000 | | | | 1.590 | | | | 01/18/18 | | | | 2,001,711 | |
| | | | | | | | | | | | | | |
| | | | | | | | | | | | | 49,096,070 | |
| | |
| | TOTAL SHORT-TERM INVESTMENTS | | | | | |
| | (Cost $83,302,879) | | | $ | 83,303,715 | |
| | |
| | TOTAL INVESTMENTS – 98.0% | | | | | |
| | (Cost $614,528,512) | | | $ | 614,476,018 | |
| | |
| OTHER ASSETS IN EXCESS OF
LIABILITIES – 2.0% |
| | | 12,783,898 | |
| | |
| | NET ASSETS – 100.0% | | | $ | 627,259,916 | |
| | |
| | |
| The percentage shown for each investment category reflects the value of investments in that category as a percentage of net assets. |
(a) | | Exempt from registration under Rule 144A of the Securities Act of 1933. Such securities may be deemed liquid by the investment adviser and may be resold, normally to qualified institutional buyers in transactions exempt from registration. Total market value of Rule 144A securities amounts to $139,013,619, which represents approximately 22.2% of net assets as of September 30, 2017 and are unaudited. |
(b) | | Security with “Call” features with resetting interest rates. Maturity dates disclosed are the final maturity dates. |
(c) | | Variable rate security. Interest rate or distribution rate disclosed is that which is in effect on September 30, 2017. |
(d) | | Guaranteed by a foreign government until maturity. |
(e) | | All or a portion of security is segregated as collateral for initial margin requirements on futures transactions. |
(f) | | Represents an Affiliated Issuer. |
(g) | | Issued with a zero coupon. Income is recognized through the accretion of discount. |
| | |
|
Currency Abbreviations: |
USD | | —U.S. Dollar |
| | |
Investment Abbreviations: |
LIBOR | | —London Interbank Offered Rate |
LLC | | —Limited Liability Company |
LP | | —Limited Partnership |
PLC | | —Public Limited Company |
RB | | —Revenue Bond |
REIT | | —Real Estate Investment Trust |
|
| | |
| The accompanying notes are an integral part of these financial statements. | | 43 |
GOLDMAN SACHS ENHANCED INCOME FUND
Schedule of Investments (continued)
September 30, 2017 (Unaudited)
|
| ADDITIONAL INVESTMENT INFORMATION |
FUTURES CONTRACTS — At September 30, 2017, the Fund had the following futures contracts:
| | | | | | | | | | | | | | |
| Description | | Number of
Contracts | | | Expiration
Date | | Notional
Amount | | | Unrealized
Appreciation/
(Depreciation) | |
Long position contracts: | | | | | | | | | | | | | | |
Eurodollars | | | 65 | | | 12/18/17 | | $ | 16,009,500 | | | $ | (9,201 | ) |
Short position contracts: | | | | | | | | | | | | | | |
2 Year U.S. Treasury Notes | | | (326 | ) | | 12/29/17 | | | (70,319,219 | ) | | | 198,129 | |
5 Year U.S. Treasury Notes | | | (293 | ) | | 12/29/17 | | | (34,427,500 | ) | | | 241,985 | |
Eurodollars | | | (68 | ) | | 03/19/18 | | | (16,729,700 | ) | | | 59,905 | |
Eurodollars | | | (76 | ) | | 06/18/18 | | | (18,677,000 | ) | | | 19,775 | |
Eurodollars | | | (76 | ) | | 09/17/18 | | | (18,661,800 | ) | | | 16,924 | |
Eurodollars | | | (76 | ) | | 12/17/18 | | | (18,645,650 | ) | | | 13,124 | |
Eurodollars | | | (157 | ) | | 03/18/19 | | | (38,500,325 | ) | | | 167,512 | |
Eurodollars | | | (173 | ) | | 06/17/19 | | | (42,404,463 | ) | | | 199,067 | |
Eurodollars | | | (124 | ) | | 09/16/19 | | | (30,381,550 | ) | | | 163,007 | |
Eurodollars | | | (124 | ) | | 12/16/19 | | | (30,362,950 | ) | | | 165,839 | |
Eurodollars | | | (132 | ) | | 03/16/20 | | | (32,311,950 | ) | | | 149,446 | |
Eurodollars | | | (79 | ) | | 06/15/20 | | | (19,332,287 | ) | | | 89,883 | |
Eurodollars | | | (51 | ) | | 09/14/20 | | | (12,475,875 | ) | | | (755 | ) |
Eurodollars | | | (51 | ) | | 12/14/20 | | | (12,469,500 | ) | | | (1,730 | ) |
Eurodollars | | | (27 | ) | | 03/15/21 | | | (6,599,475 | ) | | | (20,312 | ) |
| Total | | | | | | | | | | | | $ | 1,461,799 | |
| TOTAL FUTURES CONTRACTS | | | | | | | | | | | | $ | 1,452,598 | |
| | |
| 44 | | The accompanying notes are an integral part of these financial statements. |
GOLDMAN SACHS GOVERNMENT INCOME FUND
Schedule of Investments
September 30, 2017 (Unaudited)
| | | | | | | | | | | | | | |
Principal
Amount | | | Interest
Rate | | | Maturity
Date | | | Value | |
| Corporate Obligations – 1.0% | |
| Sovereign – 1.0% | |
| | NCUA Guaranteed Notes Series A4 | |
| $ | 3,400,000 | | | | 3.000 | % | | | 06/12/19 | | | $ | 3,473,438 | |
| | |
| | | | | | | | | | | | | | |
| Mortgage-Backed Obligations – 41.6% | |
| Collateralized Mortgage Obligations – 1.7% | |
| Adjustable Rate Non-Agency – 0.1% | |
| Merrill Lynch Mortgage Investors Trust Series 2004-E,
Class A2B (6M USD LIBOR + 0.720%) |
|
| $ | 273,111 | | | | 2.148 | % | | | 11/25/29 | | | $ | 271,769 | |
| | |
| Interest Only(a) – 0.0% | |
| CS First Boston Mortgage Securities Corp. Series 2003-AR20,
Class 2X |
|
| | 13,764 | | | | 0.000 | | | | 08/25/33 | | | | — | |
| CS First Boston Mortgage-Backed Pass-Through Certificates
Series 2003-AR18, Class 2X |
|
| | 14,091 | | | | 0.000 | | | | 07/25/33 | | | | — | |
| | FNMA STRIPS Series 151, Class 2 | |
| | 665 | | | | 9.500 | | | | 07/25/22 | | | | 72 | |
| Master Adjustable Rate Mortgages Trust Series 2003-2,
Class 3AX |
|
| | 17,426 | | | | 0.123 | | | | 08/25/33 | | | | 101 | |
| Master Adjustable Rate Mortgages Trust Series 2003-2,
Class 4AX |
|
| | 2,904 | | | | 0.320 | | | | 07/25/33 | | | | 53 | |
| | | | | | | | | | | | | | |
| | | | | | | | | | | | | 226 | |
| | |
| Inverse Floaters – 0.0% | |
| GNMA REMIC Series 2002-13, Class SB
(-1x1M LIBOR + 37.567%) |
|
| | 35,592 | | | | 31.806 | | | | 02/16/32 | | | | 54,657 | |
| | |
| Principal Only(b) – 0.0% | |
| | FNMA REMIC Series G-35, Class N | |
| | 1,964 | | | | 0.000 | | | | 10/25/21 | | | | 1,918 | |
| | |
| Regular Floater – 0.1% | |
| | FHLMC REMIC Series 1760, Class ZB T10Y – 0.600%) | |
| | 75,335 | | | | 1.670 | | | | 05/15/24 | | | | 75,096 | |
| NCUA Guaranteed Notes Series 2010-R1, Class 1A
(1M LIBOR + 0.450%) |
|
| | 347,313 | | | | 1.688 | | | | 10/07/20 | | | | 348,154 | |
| | | | | | | | | | | | | | |
| | | | | | | | | | | | | 423,250 | |
| | |
| Sequential Fixed Rate – 0.6% | |
| | FHLMC REMIC Series 2329, Class ZA | |
| | 503,420 | | | | 6.500 | | | | 06/15/31 | | | | 567,267 | |
| | GNMA REMIC Series 2002-42, Class KZ | |
| | 1,342,805 | | | | 6.000 | | | | 06/16/32 | | | | 1,477,037 | |
| | | | | | | | | | | | | | |
| | | | | | | | | | | | | 2,044,304 | |
| | |
| Sequential Fixed Rate – 0.9% | |
| | FHLMC REMIC Series 4273, Class PD | |
| | 808,877 | | | | 6.500 | | | | 11/15/43 | | | | 933,455 | |
| | FNMA REMIC Series 2011-52, Class GB | |
| | 798,912 | | | | 5.000 | | | | 06/25/41 | | | | 876,636 | |
| | |
| Mortgage-Backed Obligations – (continued) | |
| Sequential Fixed Rate – (continued) | |
| | FNMA REMIC Series 2011-99, Class DB | |
| 796,782 | | | | 5.000 | | | | 10/25/41 | | | | 873,426 | |
| | FNMA REMIC Series 2012-111, Class B | |
| | 105,049 | | | | 7.000 | | | | 10/25/42 | | | | 120,836 | |
| | FNMA REMIC Series 2012-153, Class B | |
| | 461,980 | | | | 7.000 | | | | 07/25/42 | | | | 536,008 | |
| | | | | | | | | | | | | | |
| | | | | | | | | | | | | 3,340,361 | |
| | |
| TOTAL COLLATERALIZED
MORTGAGE OBLIGATIONS |
| | $ | 6,136,485 | |
| | |
| Commercial Mortgage-Backed Securities – 0.3% | |
| Sequential Floating Rate – 0.3% | |
| Citigroup Commercial Mortgage Trust Series 2008-C7,
Class A1A |
|
| $ | 928,683 | | | | 6.341 | % | | | 12/10/49 | | | $ | 928,326 | |
| | |
| Federal Agencies – 39.6% | |
| Adjustable Rate FHLMC – 0.2% | |
| | (1 year CMT + 2.224%) | |
| | 105,689 | | | | 2.743 | | | | 11/01/32 | | | | 110,985 | |
| | (1 year CMT + 2.250%) | |
| | 569,030 | | | | 2.798 | | | | 09/01/33 | | | | 601,048 | |
| | | | | | | | | | | | | | |
| | | | | | | | | | | | | 712,033 | |
| | |
| Adjustable Rate FNMA – 0.7% | |
| | (12M USD LIBOR + 1.670%) | |
| | 20,180 | | | | 3.170 | | | | 11/01/32 | | | | 21,179 | |
| | (12M USD LIBOR + 1.386%) | |
| | 82,881 | | | | 3.107 | | | | 12/01/32 | | | | 85,081 | |
| | (6M USD LIBOR + 1.413%) | |
| | 715,205 | | | | 2.788 | | | | 05/01/33 | | | | 735,246 | |
| | (1 year CMT + 2.216%) | |
| | 19,530 | | | | 3.148 | | | | 06/01/33 | | | | 20,561 | |
| | (12M USD LIBOR + 1.660%) | |
| | 568,252 | | | | 3.154 | | | | 10/01/33 | | | | 587,746 | |
| | (1 year CMT + 2.196%) | |
| | 609,837 | | | | 2.880 | | | | 02/01/35 | | | | 643,522 | |
| | (12M USD LIBOR + 1.499%) | |
| | 534,009 | | | | 2.889 | | | | 09/01/35 | | | | 556,620 | |
| | | | | | | | | | | | | | |
| | | | | | | | | | | | | 2,649,955 | |
| | |
| Adjustable Rate GNMA (1 year CMT + 1.500%) – 0.7% | |
| | 39,328 | | | | 2.625 | | | | 06/20/23 | | | | 39,830 | |
| | 18,943 | | | | 2.125 | | | | 07/20/23 | | | | 19,204 | |
| | 18,303 | | | | 2.125 | | | | 08/20/23 | | | | 18,558 | |
| | 48,303 | | | | 2.125 | | | | 09/20/23 | | | | 48,984 | |
| | 15,949 | | | | 2.375 | | | | 03/20/24 | | | | 16,161 | |
| | 138,810 | | | | 2.625 | | | | 04/20/24 | | | | 140,800 | |
| | 15,456 | | | | 2.625 | | | | 05/20/24 | | | | 15,680 | |
| | 137,037 | | | | 2.625 | | | | 06/20/24 | | | | 139,052 | |
| | 79,591 | | | | 2.125 | | | | 07/20/24 | | | | 80,836 | |
| | 109,189 | | | | 2.125 | | | | 08/20/24 | | | | 110,913 | |
| | 34,102 | | | | 2.125 | | | | 09/20/24 | | | | 34,645 | |
| | 44,758 | | | | 2.250 | | | | 11/20/24 | | | | 45,430 | |
| | 17,808 | | | | 2.250 | | | | 12/20/24 | | | | 18,078 | |
| | 31,017 | | | | 2.500 | | | | 12/20/24 | | | | 31,518 | |
| | 30,949 | | | | 2.375 | | | | 01/20/25 | | | | 31,406 | |
| | |
| | |
| The accompanying notes are an integral part of these financial statements. | | 45 |
GOLDMAN SACHS GOVERNMENT INCOME FUND
Schedule of Investments (continued)
September 30, 2017 (Unaudited)
| | | | | | | | | | | | | | |
Principal
Amount | | | Interest
Rate | | | Maturity
Date | | | Value | |
| Mortgage-Backed Obligations – (continued) | |
| Adjustable Rate GNMA – (continued) | |
| $ | 17,492 | | | | 2.375 | % | | | 02/20/25 | | | $ | 17,753 | |
| | 61,417 | | | | 2.625 | | | | 05/20/25 | | | | 62,413 | |
| | 49,452 | | | | 2.125 | | | | 07/20/25 | | | | 50,311 | |
| | 22,146 | | | | 2.375 | | | | 02/20/26 | | | | 22,523 | |
| | 1,163 | | | | 2.125 | | | | 07/20/26 | | | | 1,185 | |
| | 58,641 | | | | 2.375 | | | | 01/20/27 | | | | 59,690 | |
| | 21,746 | | | | 2.375 | | | | 02/20/27 | | | | 22,138 | |
| | 167,229 | | | | 2.625 | | | | 04/20/27 | | | | 170,430 | |
| | 16,856 | | | | 2.625 | | | | 05/20/27 | | | | 17,181 | |
| | 22,213 | | | | 2.625 | | | | 06/20/27 | | | | 22,657 | |
| | 8,874 | | | | 2.250 | | | | 11/20/27 | | | | 9,053 | |
| | 26,587 | | | | 2.250 | | | | 12/20/27 | | | | 27,111 | |
| | 58,661 | | | | 2.375 | | | | 01/20/28 | | | | 59,789 | |
| | 20,564 | | | | 2.375 | | | | 02/20/28 | | | | 20,961 | |
| | 23,835 | | | | 2.375 | | | | 03/20/28 | | | | 24,298 | |
| | 89,078 | | | | 2.125 | | | | 07/20/29 | | | | 91,110 | |
| | 56,825 | | | | 2.125 | | | | 08/20/29 | | | | 58,126 | |
| | 10,912 | | | | 2.125 | | | | 09/20/29 | | | | 11,163 | |
| | 51,190 | | | | 2.250 | | | | 10/20/29 | | | | 52,296 | |
| | 66,706 | | | | 2.250 | | | | 11/20/29 | | | | 68,172 | |
| | 14,513 | | | | 2.250 | | | | 12/20/29 | | | | 14,842 | |
| | 19,478 | | | | 2.375 | | | | 01/20/30 | | | | 19,899 | |
| | 8,934 | | | | 2.375 | | | | 02/20/30 | | | | 9,129 | |
| | 51,460 | | | | 2.375 | | | | 03/20/30 | | | | 52,578 | |
| | 61,219 | | | | 2.625 | | | | 04/20/30 | | | | 62,613 | |
| | 158,171 | | | | 2.625 | | | | 05/20/30 | | | | 161,793 | |
| | 15,420 | | | | 2.625 | | | | 06/20/30 | | | | 15,787 | |
| | 147,548 | | | | 2.125 | | | | 07/20/30 | | | | 151,071 | |
| | 22,154 | | | | 2.125 | | | | 09/20/30 | | | | 22,687 | |
| | 47,178 | | | | 2.250 | | | | 10/20/30 | | | | 48,260 | |
| | 86,757 | | | | 2.375 | | | | 03/20/32 | | | | 88,811 | |
| | | | | | | | | | | | | | |
| | | | | | | | | | | | | 2,306,925 | |
| | |
| FHLMC – 3.5% | |
| | 26 | | | | 7.000 | | | | 10/01/17 | | | | 26 | |
| | 2,459 | | | | 5.500 | | | | 05/01/18 | | | | 2,470 | |
| | 29,192 | | | | 5.500 | | | | 06/01/18 | | | | 29,412 | |
| | 1,508 | | | | 4.500 | | | | 09/01/18 | | | | 1,523 | |
| | 21,155 | | | | 5.000 | | | | 06/01/19 | | | | 21,591 | |
| | 845 | | | | 10.000 | | | | 07/01/20 | | | | 847 | |
| | 19,420 | | | | 6.500 | | | | 07/01/21 | | | | 20,695 | |
| | 1,646 | | | | 6.500 | | | | 08/01/22 | | | | 1,752 | |
| | 29,921 | | | | 9.000 | | | | 10/01/22 | | | | 32,947 | |
| | 89,923 | | | | 4.500 | | | | 10/01/23 | | | | 96,362 | |
| | 453,367 | | | | 5.000 | | | | 08/01/24 | | | | 484,360 | |
| | 48,866 | | | | 6.500 | | | | 07/01/28 | | | | 52,214 | |
| | 450,685 | | | | 4.500 | | | | 03/01/29 | | | | 483,681 | |
| | 4,172 | | | | 8.000 | | | | 07/01/30 | | | | 5,019 | |
| | 5,267 | | | | 7.500 | | | | 12/01/30 | | | | 5,281 | |
| | 31,054 | | | | 7.000 | | | | 04/01/31 | | | | 34,064 | |
| | 18,529 | | | | 5.000 | | | | 08/01/33 | | | | 20,276 | |
| | 3,446 | | | | 5.000 | | | | 09/01/33 | | | | 3,771 | |
| | 7,854 | | | | 5.000 | | | | 10/01/33 | | | | 8,594 | |
| | 14,229 | | | | 5.500 | | | | 09/01/34 | | | | 15,872 | |
| | 66,990 | | | | 6.000 | | | | 10/01/34 | | | | 76,345 | |
| | 4,645 | | | | 5.000 | | | | 11/01/34 | | | | 5,084 | |
| | 260,522 | | | | 5.000 | | | | 12/01/34 | | | | 285,122 | |
| | |
| Mortgage-Backed Obligations – (continued) | |
| FHLMC – (continued) | |
| $ | 880 | | | | 5.500 | % | | | 03/01/35 | | | $ | 976 | |
| | 13,285 | | | | 5.000 | | | | 07/01/35 | | | | 14,539 | |
| | 1,846 | | | | 5.500 | | | | 07/01/35 | | | | 2,050 | |
| | 3,384 | | | | 5.000 | | | | 11/01/35 | | | | 3,703 | |
| | 2,936 | | | | 5.500 | | | | 11/01/35 | | | | 3,299 | |
| | 26,135 | | | | 5.000 | | | | 12/01/35 | | | | 28,961 | |
| | 61,969 | | | | 5.500 | | | | 01/01/36 | | | | 69,533 | |
| | 172 | | | | 5.500 | | | | 02/01/36 | | | | 193 | |
| | 1,858 | | | | 6.000 | | | | 06/01/36 | | | | 2,077 | |
| | 37,898 | | | | 5.000 | | | | 02/01/37 | | | | 41,507 | |
| | 3,437 | | | | 5.000 | | | | 03/01/38 | | | | 3,772 | |
| | 75,175 | | | | 5.500 | | | | 03/01/38 | | | | 84,037 | |
| | 36,708 | | | | 5.500 | | | | 04/01/38 | | | | 41,036 | |
| | 5,568 | | | | 5.500 | | | | 11/01/38 | | | | 6,341 | |
| | 9,235 | | | | 5.500 | | | | 12/01/38 | | | | 10,243 | |
| | 390,273 | | | | 7.000 | | | | 02/01/39 | | | | 454,293 | |
| | 2,535 | | | | 5.500 | | | | 03/01/39 | | | | 2,806 | |
| | 165,061 | | | | 5.000 | | | | 07/01/39 | | | | 180,896 | |
| | 3,799 | | | | 5.500 | | | | 10/01/39 | | | | 4,245 | |
| | 7,994 | | | | 5.500 | | | | 03/01/40 | | | | 8,931 | |
| | 18,044 | | | | 4.000 | | | | 06/01/40 | | | | 19,127 | |
| | 19,521 | | | | 5.500 | | | | 06/01/40 | | | | 21,816 | |
| | 10,088 | | | | 5.000 | | | | 08/01/40 | | | | 11,053 | |
| | 701,019 | | | | 5.500 | | | | 08/01/40 | | | | 776,584 | |
| | 2,781 | | | | 4.500 | | | | 11/01/40 | | | | 2,993 | |
| | 191,979 | | | | 4.000 | | | | 02/01/41 | | | | 203,263 | |
| | 2,954 | | | | 5.000 | | | | 04/01/41 | | | | 3,249 | |
| | 8,177 | | | | 5.000 | | | | 06/01/41 | | | | 8,959 | |
| | 359,570 | | | | 5.000 | | | | 07/01/41 | | | | 391,685 | |
| | 14,111 | | | | 4.000 | | | | 11/01/41 | | | | 14,960 | |
| | 20,122 | | | | 3.000 | | | | 05/01/42 | | | | 20,304 | |
| | 258,001 | | | | 3.500 | | | | 06/01/42 | | | | 268,563 | |
| | 19,525 | | | | 3.000 | | | | 08/01/42 | | | | 19,702 | |
| | 23,593 | | | | 3.000 | | | | 01/01/43 | | | | 23,816 | |
| | 79,673 | | | | 3.000 | | | | 02/01/43 | | | | 80,426 | |
| | 4,131,548 | | | | 3.500 | | | | 04/01/43 | | | | 4,285,190 | |
| | 466,884 | | | | 3.500 | | | | 06/01/45 | | | | 484,902 | |
| | 369,733 | | | | 3.500 | | | | 10/01/45 | | | | 383,887 | |
| | 2,573,480 | | | | 3.500 | | | | 03/01/46 | | | | 2,670,790 | |
| | | | | | | | | | | | | | |
| | | | | | | | | | | | | 12,342,015 | |
| | |
| FNMA – 19.9% | |
| | 2,375 | | | | 4.500 | | | | 08/01/18 | | | | 2,397 | |
| | 22,841 | | | | 5.000 | | | | 09/01/18 | | | | 23,074 | |
| | 154,698 | | | | 5.000 | | | | 10/01/18 | | | | 156,702 | |
| | 13,799 | | | | 6.500 | | | | 08/01/19 | | | | 15,291 | |
| | 6,558 | | | | 9.500 | | | | 10/01/20 | | | | 6,596 | |
| | 164,929 | | | | 5.500 | | | | 02/01/23 | | | | 182,257 | |
| | 283,172 | | | | 5.500 | | | | 08/01/23 | | | | 312,922 | |
| | 81,298 | | | | 6.000 | | | | 11/01/28 | | | | 92,189 | |
| | 6,227 | | | | 6.500 | | | | 11/01/28 | | | | 6,720 | |
| | 54,486 | | | | 7.000 | | | | 07/01/31 | | | | 59,902 | |
| | 943 | | | | 5.500 | | | | 03/01/33 | | | | 1,049 | |
| | 3,851 | | | | 6.000 | | | | 03/01/33 | | | | 4,371 | |
| | 3,168,651 | | | | 5.500 | | | | 04/01/33 | | | | 3,551,360 | |
| | 1,899 | | | | 6.000 | | | | 05/01/33 | | | | 2,148 | |
| | 5,204 | | | | 5.000 | | | | 07/01/33 | | | | 5,753 | |
| | |
| | |
| 46 | | The accompanying notes are an integral part of these financial statements. |
GOLDMAN SACHS GOVERNMENT INCOME FUND
| | | | | | | | | | | | | | |
Principal
Amount | | | Interest
Rate | | | Maturity
Date | | | Value | |
| Mortgage-Backed Obligations – (continued) | |
| FNMA – (continued) | |
| $ | 636,366 | | | | 5.500 | % | | | 07/01/33 | | | $ | 694,467 | |
| | 22,903 | | | | 5.000 | | | | 08/01/33 | | | | 25,189 | |
| | 4,435 | | | | 5.500 | | | | 09/01/33 | | | | 4,954 | |
| | 21,941 | | | | 5.500 | | | | 12/01/33 | | | | 24,516 | |
| | 925 | | | | 6.000 | | | | 12/01/33 | | | | 1,053 | |
| | 5,552 | | | | 5.500 | | | | 02/01/34 | | | | 6,201 | |
| | 1,927 | | | | 5.500 | | | | 03/01/34 | | | | 2,157 | |
| | 1,099 | | | | 5.500 | | | | 04/01/34 | | | | 1,233 | |
| | 7,558 | | | | 5.500 | | | | 05/01/34 | | | | 8,450 | |
| | 53 | | | | 5.500 | | | | 06/01/34 | | | | 59 | |
| | 7,709 | | | | 5.500 | | | | 08/01/34 | | | | 8,658 | |
| | 4,277 | | | | 5.500 | | | | 09/01/34 | | | | 4,780 | |
| | 3,896 | | | | 5.500 | | | | 10/01/34 | | | | 4,343 | |
| | 2,766 | | | | 5.500 | | | | 11/01/34 | | | | 3,093 | |
| | 35,532 | | | | 5.500 | | | | 12/01/34 | | | | 39,700 | |
| | 6,625 | | | | 5.500 | | | | 04/01/35 | | | | 7,401 | |
| | 178,944 | | | | 6.000 | | | | 04/01/35 | | | | 202,559 | |
| | 5,028 | | | | 5.000 | | | | 05/01/35 | | | | 5,596 | |
| | 3,980 | | | | 5.500 | | | | 05/01/35 | | | | 4,442 | |
| | 7,607 | | | | 5.000 | | | | 07/01/35 | | | | 8,412 | |
| | 7,634 | | | | 5.500 | | | | 07/01/35 | | | | 8,538 | |
| | 3,009 | | | | 5.000 | | | | 08/01/35 | | | | 3,333 | |
| | 785 | | | | 5.500 | | | | 08/01/35 | | | | 881 | |
| | 7,025 | | | | 5.500 | | | | 09/01/35 | | | | 7,881 | |
| | 75,960 | | | | 6.000 | | | | 10/01/35 | | | | 86,896 | |
| | 36,947 | | | | 6.000 | | | | 11/01/35 | | | | 42,083 | |
| | 3,339 | | | | 5.500 | | | | 12/01/35 | | | | 3,753 | |
| | 129 | | | | 5.500 | | | | 02/01/36 | | | | 145 | |
| | 44,546 | | | | 6.000 | | | | 03/01/36 | | | | 50,797 | |
| | 61,795 | | | | 6.000 | | | | 04/01/36 | | | | 70,421 | |
| | 2,480 | | | | 4.500 | | | | 07/01/36 | | | | 2,683 | |
| | 442 | | | | 5.500 | | | | 02/01/37 | | | | 496 | |
| | 15,345 | | | | 5.500 | | | | 04/01/37 | | | | 17,263 | |
| | 242 | | | | 5.500 | | | | 06/01/37 | | | | 271 | |
| | 788,474 | | | | 5.500 | | | | 08/01/37 | | | | 876,611 | |
| | 198,972 | | | | 6.000 | | | | 10/01/37 | | | | 226,642 | |
| | 148,845 | | | | 7.500 | | | | 11/01/37 | | | | 165,780 | |
| | 246 | | | | 5.500 | | | | 12/01/37 | | | | 276 | |
| | 10,594 | | | | 5.500 | | | | 02/01/38 | | | | 11,787 | |
| | 4,191 | | | | 5.500 | | | | 03/01/38 | | | | 4,698 | |
| | 7,642 | | | | 6.000 | | | | 03/01/38 | | | | 8,694 | |
| | 18,956 | | | | 5.500 | | | | 04/01/38 | | | | 21,332 | |
| | 5,607 | | | | 5.500 | | | | 05/01/38 | | | | 6,310 | |
| | 1,296 | | | | 5.500 | | | | 06/01/38 | | | | 1,453 | |
| | 1,225 | | | | 5.500 | | | | 07/01/38 | | | | 1,374 | |
| | 1,103 | | | | 5.500 | | | | 08/01/38 | | | | 1,237 | |
| | 1,088 | | | | 5.500 | | | | 09/01/38 | | | | 1,221 | |
| | 368 | | | | 5.500 | | | | 12/01/38 | | | | 412 | |
| | 6,445 | | | | 5.500 | | | | 02/01/39 | | | | 7,257 | |
| | 254,208 | | | | 7.000 | | | | 03/01/39 | | | | 294,561 | |
| | 3,178 | | | | 4.500 | | | | 04/01/39 | | | | 3,430 | |
| | 11,288 | | | | 4.500 | | | | 05/01/39 | | | | 12,325 | |
| | 5,884 | | | | 5.500 | | | | 06/01/39 | | | | 6,596 | |
| | 5,984 | | | | 4.000 | | | | 08/01/39 | | | | 6,342 | |
| | 26,988 | | | | 4.500 | | | | 08/01/39 | | | | 29,468 | |
| | 50,444 | | | | 5.000 | | | | 09/01/39 | | | | 55,141 | |
| | |
| Mortgage-Backed Obligations – (continued) | |
| FNMA – (continued) | |
| 5,027 | | | | 5.500 | | | | 11/01/39 | | | | 5,636 | |
| | 468,201 | | | | 4.500 | | | | 12/01/39 | | | | 511,217 | |
| | 308,385 | | | | 5.000 | | | | 07/01/40 | | | | 344,307 | |
| | 323,149 | | | | 5.000 | | | | 03/01/41 | | | | 353,418 | |
| | 88,297 | | | | 5.000 | | | | 04/01/41 | | | | 96,567 | |
| | 168,038 | | | | 4.500 | | | | 05/01/41 | | | | 181,276 | |
| | 30,206 | | | | 5.000 | | | | 06/01/41 | | | | 33,035 | |
| | 133,165 | | | | 5.000 | | | | 07/01/41 | | | | 145,639 | |
| | 170,457 | | | | 4.500 | | | | 08/01/41 | | | | 184,200 | |
| | 162,267 | | | | 5.000 | | | | 10/01/41 | | | | 177,466 | |
| | 31,243 | | | | 3.500 | | | | 11/01/41 | | | | 32,412 | |
| | 279,373 | | | | 5.000 | | | | 04/01/42 | | | | 305,541 | |
| | 38,051 | | | | 3.500 | | | | 06/01/42 | | | | 39,523 | |
| | 157,917 | | | | 4.500 | | | | 08/01/42 | | | | 172,475 | |
| | 22,088 | | | | 3.500 | | | | 10/01/42 | | | | 22,942 | |
| | 17,408 | | | | 3.000 | | | | 11/01/42 | | | | 17,615 | |
| | 220,876 | | | | 3.000 | | | | 12/01/42 | | | | 223,500 | |
| | 575,959 | | | | 3.000 | | | | 01/01/43 | | | | 582,799 | |
| | 109,316 | | | | 3.000 | | | | 02/01/43 | | | | 110,614 | |
| | 670,538 | | | | 3.000 | | | | 03/01/43 | | | | 678,712 | |
| | 1,089,823 | | | | 3.000 | | | | 04/01/43 | | | | 1,103,106 | |
| | 98,838 | | | | 3.500 | | | | 04/01/43 | | | | 102,357 | |
| | 741,426 | | | | 3.000 | | | | 05/01/43 | | | | 750,463 | |
| | 66,798 | | | | 3.500 | | | | 05/01/43 | | | | 69,402 | |
| | 125,928 | | | | 3.000 | | | | 06/01/43 | | | | 127,463 | |
| | 1,142,039 | | | | 3.000 | | | | 07/01/43 | | | | 1,155,957 | |
| | 1,804,742 | | | | 3.500 | | | | 07/01/43 | | | | 1,869,010 | |
| | 305,195 | | | | 3.500 | | | | 08/01/43 | | | | 316,184 | |
| | 38,445 | | | | 3.500 | | | | 09/01/43 | | | | 39,955 | |
| | 96,790 | | | | 3.500 | | | | 01/01/44 | | | | 100,594 | |
| | 241,743 | | | | 3.500 | | | | 04/01/45 | | | | 251,016 | |
| | 1,526,251 | | | | 4.500 | | | | 04/01/45 | | | | 1,670,529 | |
| | 178,969 | | | | 4.500 | | | | 05/01/45 | | | | 195,916 | |
| | 65,665 | | | | 3.500 | | | | 06/01/45 | | | | 68,183 | |
| | 25,014 | | | | 3.500 | | | | 09/01/45 | | | | 25,978 | |
| | 48,845 | | | | 3.500 | | | | 10/01/45 | | | | 50,703 | |
| | 45,691 | | | | 3.500 | | | | 11/01/45 | | | | 47,429 | |
| | 987,807 | | | | 4.000 | | | | 11/01/45 | | | | 1,041,191 | |
| | 69,214 | | | | 3.500 | | | | 01/01/46 | | | | 71,848 | |
| | 911,062 | | | | 3.500 | | | | 06/01/46 | | | | 949,711 | |
| | 47,000,000 | | | | 4.000 | | | | TBA-30yr | (c) | | | 49,478,517 | |
| | | | | | | | | | | | | | |
| | | | | | | | | | | | | 71,222,788 | |
| | |
| GNMA – 14.6% | |
| | 72,354 | | | | 7.000 | | | | 12/15/27 | | | | 79,156 | |
| | 13,856 | | | | 6.500 | | | | 08/15/28 | | | | 15,291 | |
| | 99,546 | | | | 6.000 | | | | 01/15/29 | | | | 112,298 | |
| | 163,043 | | | | 7.000 | | | | 10/15/29 | | | | 188,665 | |
| | 53,044 | | | | 5.500 | | | | 11/15/32 | | | | 59,407 | |
| | 838,283 | | | | 5.500 | | | | 12/15/32 | | | | 942,602 | |
| | 32,689 | | | | 5.500 | | | | 01/15/33 | | | | 36,567 | |
| | 66,928 | | | | 5.500 | | | | 02/15/33 | | | | 74,454 | |
| | 63,976 | | | | 5.500 | | | | 03/15/33 | | | | 71,171 | |
| | 63,553 | | | | 5.500 | | | | 07/15/33 | | | | 70,930 | |
| | 33,217 | | | | 5.500 | | | | 08/15/33 | | | | 36,952 | |
| | 21,875 | | | | 5.500 | | | | 09/15/33 | | | | 24,335 | |
| | |
| | |
| The accompanying notes are an integral part of these financial statements. | | 47 |
GOLDMAN SACHS GOVERNMENT INCOME FUND
Schedule of Investments (continued)
September 30, 2017 (Unaudited)
| | | | | | | | | | | | | | |
Principal
Amount | | | Interest
Rate | | | Maturity
Date | | | Value | |
| Mortgage-Backed Obligations – (continued) | |
| GNMA – (continued) | |
| $ | 40,874 | | | | 5.500 | % | | | 04/15/34 | | | $ | 45,458 | |
| | 19,011 | | | | 5.500 | | | | 05/15/34 | | | | 21,142 | |
| | 409,247 | | | | 5.500 | | | | 06/15/34 | | | | 455,137 | |
| | 302,533 | | | | 5.500 | | | | 09/15/34 | | | | 336,457 | |
| | 275,524 | | | | 5.500 | | | | 12/15/34 | | | | 306,420 | |
| | 235,114 | | | | 5.500 | | | | 01/15/35 | | | | 261,478 | |
| | 181,617 | | | | 5.000 | | | | 03/15/38 | | | | 199,381 | |
| | 1,596 | | | | 5.000 | | | | 11/15/38 | | | | 1,760 | |
| | 10,678 | | | | 4.000 | | | | 02/20/41 | | | | 11,367 | |
| | 16,413 | | | | 4.000 | | | | 11/20/41 | | | | 17,438 | |
| | 2,705 | | | | 4.000 | | | | 01/20/42 | | | | 2,874 | |
| | 8,791 | | | | 4.000 | | | | 04/20/42 | | | | 9,341 | |
| | 4,762 | | | | 4.000 | | | | 10/20/42 | | | | 5,060 | |
| | 661,610 | | | | 4.000 | | | | 08/20/43 | | | | 702,133 | |
| | 6,664,335 | | | | 4.000 | | | | 10/20/43 | | | | 7,072,526 | |
| | 9,488 | | | | 4.000 | | | | 03/20/44 | | | | 10,069 | |
| | 11,540 | | | | 4.000 | | | | 05/20/44 | | | | 12,247 | |
| | 802,233 | | | | 4.000 | | | | 11/20/44 | | | | 850,868 | |
| | 3,635,950 | | | | 4.000 | | | | 06/20/45 | | | | 3,855,243 | |
| | 2,607,435 | | | | 4.000 | | | | 07/20/45 | | | | 2,764,696 | |
| | 3,800,049 | | | | 4.000 | | | | 09/20/45 | | | | 4,025,677 | |
| | 4,169,872 | | | | 4.000 | | | | 10/20/45 | | | | 4,417,458 | |
| | 813,818 | | | | 4.000 | | | | 11/20/45 | | | | 862,138 | |
| | 3,165,443 | | | | 4.000 | | | | 01/20/46 | | | | 3,349,434 | |
| | 1,547,628 | | | | 4.000 | | | | 02/20/46 | | | | 1,637,584 | |
| | 4,367,192 | | | | 4.000 | | | | 04/20/46 | | | | 4,621,035 | |
| | 562,644 | | | | 4.000 | | | | 05/20/46 | | | | 595,348 | |
| | 3,456,536 | | | | 4.000 | | | | 05/20/47 | | | | 3,647,185 | |
| | 5,930,656 | | | | 4.000 | | | | 06/20/47 | | | | 6,261,475 | |
| | 994,770 | | | | 4.000 | | | | 07/20/47 | | | | 1,049,271 | |
| | 2,993,355 | | | | 4.000 | | | | 08/20/47 | | | | 3,165,005 | |
| | | | | | | | | | | | | | |
| | | | | | | | | | | | | 52,284,533 | |
| | |
| | TOTAL FEDERAL AGENCIES | | | $ | 141,518,249 | |
| | |
| | TOTAL MORTGAGE-BACKED OBLIGATIONS | |
| | (Cost $147,325,643) | | | $ | 148,583,060 | |
| | |
| | | | | | | | | | | | | | |
| Agency Debentures – 9.9% | |
| | FHLB | |
| $ | 2,200,000 | | | | 1.875 | % | | | 03/13/20 | | | $ | 2,212,364 | |
| | 3,700,000 | | | | 2.125 | | | | 06/09/23 | | | | 3,710,275 | |
| | 2,100,000 | | | | 3.375 | | | | 09/08/23 | | | | 2,239,555 | |
| | 300,000 | | | | 3.375 | | | | 12/08/23 | | | | 320,378 | |
| | FNMA | |
| | 1,400,000 | | | | 1.875 | | | | 09/24/26 | | | | 1,331,260 | |
| | 2,600,000 | | | | 6.250 | | | | 05/15/29 | | | | 3,501,238 | |
| | 4,000,000 | | | | 6.625 | | | | 11/15/30 | | | | 5,674,360 | |
| | Hashemite Kingdom of Jordan Government AID Bond(d) | |
| | 4,600,000 | | | | 2.503 | | | | 10/30/20 | | | | 4,702,856 | |
| | Israel Government AID Bond(d) | |
| | 1,400,000 | | | | 5.500 | | | | 09/18/23 | | | | 1,656,004 | |
| | 500,000 | | | | 5.500 | | | | 12/04/23 | | | | 591,870 | |
| | 700,000 | | | | 5.500 | | | | 04/26/24 | | | | 839,006 | |
| | New Valley Generation V | |
| | 1,768,138 | | | | 4.929 | | | | 01/15/21 | | | | 1,877,342 | |
| | Tennessee Valley Authority | |
| | 6,500,000 | | | | 3.875 | | | | 02/15/21 | | | | 6,936,930 | |
| | |
| | TOTAL AGENCY DEBENTURES | |
| | (Cost $35,078,918) | | | $ | 35,593,438 | |
| | |
| Asset-Backed Securities – 10.9% | |
| Automotive(e) – 2.9% | |
| Avis Budget Rental Car Funding AESOP LLC Series 2015-2A,
Class A |
|
| $ | 2,150,000 | | | | 2.630 | % | | | 12/20/21 | | | $ | 2,150,304 | |
| | |
| | Chesapeake Funding II LLC Series 2017-2A, Class A1 | |
| | 1,850,000 | | | | 1.990 | | | | 05/15/29 | | | | 1,851,415 | |
| | Ford Credit Auto Owner Trust Series 2016-2, Class A | |
| | 1,300,000 | | | | 2.030 | | | | 12/15/27 | | | | 1,289,903 | |
| | GMF Floorplan Owner Revolving Trust Series 2015-1, Class A1 | |
| | 2,000,000 | | | | 1.650 | | | | 05/15/20 | | | | 2,000,421 | |
| | GMF Floorplan Owner Revolving Trust Series 2016-1, Class A1 | |
| | 1,250,000 | | | | 1.960 | | | | 05/17/21 | | | | 1,252,354 | |
| Mercedes-Benz Master Owner Trust Series 2017-BA, Class A
(1M LIBOR + 0.420%) |
|
| | 1,850,000 | | | | 1.654 | | | | 05/16/22 | | | | 1,855,761 | |
| | | | | | | | | | | | | | |
| | | | | | | | | | | | | 10,400,158 | |
| | |
| Sovereign – 0.0% | |
| | Small Business Administration | |
| | 4,685 | | | | 6.300 | | | | 05/01/18 | | | | 4,731 | |
| | 4,670 | | | | 6.300 | | | | 06/01/18 | | | | 4,720 | |
| | | | | | | | | | | | | | |
| | | | | | | | | | | | | 9,451 | |
| | |
| Student Loan – 8.0% | |
| Access Group, Inc. Series 2005-2, Class A3
(3M USD LIBOR + 0.180%) |
|
| | 631,074 | | | | 1.352 | | | | 11/22/24 | | | | 631,072 | |
| Access Group, Inc. Series 2015-1, Class A(e)
(1M USD LIBOR + 0.700%) |
|
| | 633,530 | | | | 1.934 | | | | 07/25/56 | | | | 634,307 | |
| ECMC Group Student Loan Trust Series 2016-1A, Class A(e)
(1M USD LIBOR + 1.350%) |
|
| | 1,579,639 | | | | 2.584 | | | | 07/26/66 | | | | 1,580,632 | |
| Edsouth Indenture No. 9 LLC Series 2015-1, Class A(e)
(1M USD LIBOR + 0.800%) |
|
| | 1,310,654 | | | | 2.034 | | | | 10/25/56 | | | | 1,311,459 | |
| Education Loan Asset-Backed Trust I Series 2013-1, Class A2(e)
(1M USD LIBOR + 0.800%) |
|
| | 2,750,000 | | | | 2.034 | | | | 04/26/32 | | | | 2,706,406 | |
| GCO Education Loan Funding Trust Series 2007-1A, Class A6L(e)
(3M LIBOR + 0.110%) |
|
| | 1,709,701 | | | | 1.427 | | | | 11/25/26 | | | | 1,699,034 | |
| Higher Education Funding I Series 2005-1, Class A4
(3M USD LIBOR + 0.140%) |
|
| | 104,553 | | | | 1.329 | | | | 02/25/30 | | | | 104,525 | |
| Higher Education Funding I Series 2014-1, Class A(e)
(3M USD LIBOR + 1.050%) |
|
| | 1,363,685 | | | | 2.239 | | | | 05/25/34 | | | | 1,358,226 | |
| Navient Student Loan Trust Series 2016-5A, Class A(e)
(1M USD LIBOR + 1.250%) |
|
| | 3,606,206 | | | | 2.484 | | | | 06/25/65 | | | | 3,678,533 | |
| Navient Student Loan Trust Series 2016-7A, Class A(e)
(1M USD LIBOR + 1.150%) |
|
| | 1,673,030 | | | | 2.384 | | | | 03/25/66 | | | | 1,693,300 | |
| Navient Student Loan Trust Series 2017-4A, Class A2(e)
(1M USD LIBOR + 0.500%) |
|
| | 850,000 | | | | 1.755 | | | | 09/27/66 | | | | 853,242 | |
| | Navient Student Loan Trust Series 2017-5A, Class A(e) | |
| | 3,500,000 | | | | 2.048 | | | | 07/26/66 | | | | 3,499,980 | |
| | |
| | |
| 48 | | The accompanying notes are an integral part of these financial statements. |
GOLDMAN SACHS GOVERNMENT INCOME FUND
| | | | | | | | | | | | | | |
Principal
Amount | | | Interest
Rate | | | Maturity
Date | | | Value | |
| Asset-Backed Securities – (continued) | |
| Student Loan – (continued) | |
| Nelnet Student Loan Trust Series 2005-4, Class A3
(3M USD LIBOR + 0.130%) |
|
| $ | 211,537 | | | | 1.417 | % | | | 06/22/26 | | | $ | 211,464 | |
| Nelnet Student Loan Trust Series 2013-5A, Class A(e) (1M USD
LIBOR + 0.630%) |
|
| | 331,471 | | | | 1.864 | | | | 01/25/37 | | | | 329,046 | |
| North Carolina State Education Assistance Authority
Series 2010-1, Class A1 (3M USD LIBOR + 0.900%) |
|
| | 692,991 | | | | 2.056 | | | | 07/25/41 | | | | 690,553 | |
| PHEAA Student Loan Trust Series 2016-1A, Class A(e) (1M USD
LIBOR + 1.150%) |
|
| | 1,702,626 | | | | 2.384 | | | | 09/25/65 | | | | 1,732,873 | |
| Scholar Funding Trust Series 2013-A, Class A(e) (1M USD
LIBOR + 0.650%) |
|
| | 2,048,965 | | | | 1.884 | | | | 01/30/45 | | | | 2,028,160 | |
| SLM Student Loan Trust Series 2003-14, Class A5 (3M USD
LIBOR + 0.230%) |
|
| | 151,130 | | | | 1.386 | | | | 01/25/23 | | | | 151,205 | |
| SLM Student Loan Trust Series 2004-8A, Class A6(e) (3M USD
LIBOR + 0.630%) |
|
| | 850,000 | | | | 1.786 | | | | 01/25/40 | | | | 850,250 | |
| SLM Student Loan Trust Series 2008-5, Class A4 (3M USD
LIBOR + 1.700%) |
|
| | 1,982,272 | | | | 2.856 | | | | 07/25/23 | | | | 2,039,250 | |
| Utah State Board of Regents Series 2011-1, Class A3 (3M USD
LIBOR + 0.850%) |
|
| | 800,000 | | | | 2.020 | | | | 05/01/35 | | | | 790,072 | |
| Wachovia Student Loan Trust Series 2005-1, Class A5 (3M USD
LIBOR + 0.130%) |
|
| | 157,054 | | | | 1.286 | | | | 01/26/26 | | | | 157,005 | |
| | | | | | | | | | | | | | |
| | | | | | | | | | | | | 28,730,594 | |
| | |
| | TOTAL ASSET-BACKED SECURITIES | |
| | (Cost $38,944,257) | | | $ | 39,140,203 | |
| | |
| | | | | | | | | | | | | | |
| Municipal Debt Obligations – 2.0% | |
| Alaska(f) – 0.7% | | | | | | | |
| | Alaska State Student Loan Corp. Series 2013, Class A | |
| $ | 2,592,417 | | | | 1.734 | % | | | 08/25/31 | | | $ | 2,552,248 | |
| | | | | | | | | | | | | | |
| | | | | | | | | | | | | 2,552,248 | |
| | |
| New Hampshire(f) – 0.4% | |
| New Hampshire Higher Education Loan Corp. Series 2011-1,
Class A3 |
|
| | 1,200,000 | | | | 2.164 | | | | 10/25/37 | | | | 1,173,768 | |
| | | | | | | | | | | | | | |
| | | | | | | | | | | | | 1,173,768 | |
| | |
| New Jersey – 0.7% | |
| | New Jersey Economic Development Authority Series A | |
| | 2,000,000 | | | | 7.425 | | | | 02/15/29 | | | | 2,493,900 | |
| | | | | | | | | | | | | | |
| | | | | | | | | | | | | 2,493,900 | |
| | |
| Texas(f) – 0.2% | |
| Brazos Higher Education Authority, Inc. Series 2005-2,
Class I-A12 |
|
| | 800,000 | | | | 1.456 | | | | 03/27/23 | | | | 795,401 | |
| | | | | | | | | | | | | | |
| | | | | | | | | | | | | 795,401 | |
| | |
| | TOTAL MUNICIPAL DEBT OBLIGATIONS | |
| | (Cost $6,562,108) | | | $ | 7,015,317 | |
| | |
| U.S. Treasury Obligations – 40.7% | |
| | United States Treasury Bonds | |
| 3,830,000 | | | | 3.625 | %(g) | | | 02/15/44 | | | | 4,403,236 | |
| | 3,320,000 | | | | 3.125 | | | | 08/15/44 | | | | 3,503,663 | |
| | 3,200,000 | | | | 3.000 | | | | 11/15/44 | | | | 3,298,592 | |
| | 1,570,000 | | | | 2.875 | | | | 08/15/45 | | | | 1,578,007 | |
| | 16,190,000 | | | | 2.875 | | | | 11/15/46 | | | | 16,249,903 | |
| | 60,000 | | | | 3.000 | | | | 05/15/47 | | | | 61,750 | |
| | United States Treasury Inflation Indexed Bonds | |
| | 5,044,933 | | | | 0.125 | | | | 04/15/18 | | | | 5,049,120 | |
| | 1,672,496 | | | | 0.125 | | | | 04/15/20 | | | | 1,681,243 | |
| | 1,653,616 | | | | 0.250 | | | | 01/15/25 | | | | 1,638,204 | |
| | 344,787 | | | | 0.875 | | | | 02/15/47 | | | | 340,112 | |
| | United States Treasury Notes | |
| | 10,050,000 | | | | 1.250 | | | | 11/30/18 | | | | 10,034,222 | |
| | 13,700,000 | | | | 1.250 | | | | 12/31/18 | | | | 13,676,299 | |
| | 2,650,000 | | | | 1.500 | | | | 08/15/20 | | | | 2,642,235 | |
| | 6,900,000 | | | | 1.750 | | | | 12/31/20 | | | | 6,913,731 | |
| | 3,570,000 | | | | 1.375 | | | | 04/30/21 | | | | 3,524,840 | |
| | 7,100,000 | | | | 1.125 | | | | 06/30/21 | | | | 6,936,487 | |
| | 7,090,000 | | | | 1.125 | | | | 07/31/21 | | | | 6,917,784 | |
| | 820,000 | | | | 1.875 | | | | 01/31/22 | | | | 820,476 | |
| | 5,920,000 | | | | 1.875 | | | | 04/30/22 | | | | 5,914,553 | |
| | 500,000 | | | | 2.000 | (g) | | | 07/31/22 | | | | 501,960 | |
| | 1,810,000 | | | | 1.875 | | | | 10/31/22 | | | | 1,803,792 | |
| | 5,660,000 | | | | 2.125 | | | | 07/31/24 | | | | 5,651,623 | |
| | 500,000 | | | | 2.125 | | | | 05/15/25 | | | | 496,820 | |
| | 400,000 | | | | 2.000 | | | | 08/15/25 | | | | 393,172 | |
| | 19,210,000 | | | | 2.250 | | | | 11/15/25 | | | | 19,210,960 | |
| | 9,180,000 | | | | 1.625 | | | | 05/15/26 | | | | 8,708,332 | |
| | United States Treasury Strip Coupon(b) | |
| | 12,400,000 | | | | 0.000 | | | | 11/15/35 | | | | 7,516,508 | |
| | 3,200,000 | | | | 0.000 | | | | 02/15/36 | | | | 1,925,248 | |
| | 1,300,000 | | | | 0.000 | | | | 05/15/36 | | | | 775,073 | |
| | 6,000,000 | | | | 0.000 | | | | 11/15/37 | | | | 3,400,800 | |
| | |
| | TOTAL U.S. TREASURY OBLIGATIONS | |
| | (Cost $145,815,175) | | | $ | 145,568,745 | |
| | |
| | | | | | | | | | | | | | |
| Shares | | | Distribution
Rate | | | Value | |
| Investment Company(h) – 5.7% | |
| Goldman Sachs Financial Square Government Fund –
Institutional Shares |
|
| | 20,262,525 | | | | 0.927% | | | $ | 20,262,525 | |
| | (Cost $20,262,525) | | | | | |
| | |
| | TOTAL INVESTMENTS – 111.8% | | | | | |
| | (Cost $397,387,787) | | | $ | 399,636,726 | |
| | |
| LIABILITIES IN EXCESS OF
OTHER ASSETS – (11.8)% |
| | | (42,098,378 | ) |
| | |
| | NET ASSETS – 100.0% | | | $ | 357,538,348 | |
| | |
| | |
| The accompanying notes are an integral part of these financial statements. | | 49 |
GOLDMAN SACHS GOVERNMENT INCOME FUND
Schedule of Investments (continued)
September 30, 2017 (Unaudited)
| | |
| The percentage shown for each investment category reflects the value of investments in that category as a percentage of net assets. |
(a) | | Security with a notional or nominal principal amount. The actual effective yield of this security is different than the stated interest rate. |
(b) | | Issued with a zero coupon. Income is recognized through the accretion of discount. |
(c) | | TBA (To Be Announced) Securities are purchased on a forward commitment basis with an approximate principal amount and no defined maturity date. The actual principal and maturity date will be determined upon settlement when the specific mortgage pools are assigned. Total market value of TBA securities (excluding forward sales contracts, if any) amounts to $49,478,517 which represents approximately 13.8% of net assets as of September 30, 2017. |
(d) | | Guaranteed by the United States Government until maturity. Total market value for these securities amounts to $7,789,736, which represents approximately 2.2% of net assets as of September 30, 2017. |
(e) | | Exempt from registration under Rule 144A of the Securities Act of 1933. Such securities may be deemed liquid by the investment adviser and may be resold, normally to qualified institutional buyers in transactions exempt from registration. Total market value of |
| | |
| | Rule 144A securities amounts to $34,355,606, which represents approximately 9.6% of net assets as of September 30, 2017 and are unaudited. |
(f) | | Security with “Call” features with resetting interest rates. Maturity dates disclosed are the final maturity dates. |
(g) | | All or a portion of security is segregated as collateral for initial margin requirements on futures transactions. |
(h) | | Represents an Affiliated Issuer. |
| | |
|
Currency Abbreviation: |
USD | | —U.S. Dollar |
|
Investment Abbreviations: |
CMT | | —Constant Maturity Treasury Indexes |
COF | | —Cost of Funds |
FHLB | | —Federal Home Loan Bank |
FHLMC | | —Federal Home Loan Mortgage Corp. |
FNMA | | —Federal National Mortgage Association |
GNMA | | —Government National Mortgage Association |
LIBOR | | —London Interbank Offered Rate |
LLC | | —Limited Liability Company |
NCUA | | —National Credit Union Administration |
REMIC | | —Real Estate Mortgage Investment Conduit |
STRIPS | | —Separate Trading of Registered Interest and Principal of Securities |
|
|
| ADDITIONAL INVESTMENT INFORMATION |
FORWARD SALES CONTRACTS — At September 30, 2017, the Fund had the following forward sales contracts:
| | | | | | | | | | | | | | | | | | |
| Description | | Interest
Rate | | | Maturity
Date(a) | | Settlement
Date | | | Principal
Amount | | | Value | |
FHLMC | | | 3.500 | % | | TBA-30yr | | | 10/12/17 | | | $ | (4,000,000 | ) | | $ | (4,124,375 | ) |
FNMA | | | 3.000 | | | TBA-30yr | | | 10/12/17 | | | | (4,000,000 | ) | | | (4,012,500 | ) |
FNMA | | | 3.500 | | | TBA-30yr | | | 10/12/17 | | | | (1,000,000 | ) | | | (1,030,860 | ) |
GNMA | | | 4.000 | | | TBA-30yr | | | 10/23/17 | | | | (8,000,000 | ) | | | (8,423,750 | ) |
| TOTAL (Proceeds Receivable: $17,636,133) | | | $ | (17,591,485 | ) |
FUTURES CONTRACTS — At September 30, 2017, the Fund had the following futures contracts:
| | | | | | | | | | | | | | | | |
| Description | | Number of
Contracts | | | Expiration
Date | | | Notional
Amount | | | Unrealized
Appreciation/
(Depreciation) | |
Long position contracts: | | | | | | | | | | | | | | | | |
2 Year U.S. Treasury Notes | | | 75 | | | | 12/29/17 | | | $ | 16,177,734 | | | $ | (45,438 | ) |
10 Year U.S. Treasury Notes | | | 231 | | | | 12/19/17 | | | | 28,947,188 | | | | (317,700 | ) |
| Total | | | $ | (363,138 | ) |
Short position contracts: | | | | | | | | | | | | | | | | |
Eurodollars | | | (90 | ) | | | 12/17/18 | | | | (22,080,375 | ) | | | (8,008 | ) |
5 Year U.S. Treasury Notes | | | (5 | ) | | | 12/29/17 | | | | (587,500 | ) | | | 6,788 | |
Ultra 10 Year U.S. Treasury Notes | | | (3 | ) | | | 12/19/17 | | | | (402,984 | ) | | | 4,720 | |
Ultra Long U.S. Treasury Bonds | | | (66 | ) | | | 12/19/17 | | | | (10,898,250 | ) | | | 185,421 | |
U.S. Long Bonds | | | (1 | ) | | | 12/19/17 | | | | (152,813 | ) | | | 2,286 | |
| Total | | | $ | 191,207 | |
| TOTAL FUTURES CONTRACTS | | | $ | (171,931 | ) |
| | |
| 50 | | The accompanying notes are an integral part of these financial statements. |
GOLDMAN SACHS GOVERNMENT INCOME FUND
|
| ADDITIONAL INVESTMENT INFORMATION (continued) |
SWAP CONTRACTS — At September 30, 2017, the Fund had the following swap contracts:
CENTRALLY CLEARED INTEREST RATE SWAP CONTRACTS
| | | | | | | | | | | | | | | | | | | | | | |
| Payments Made by the Fund | | Payments
Received
by Fund | | Termination Date | | | Notional
Amount | | | Value | | | Upfront
Premium
(Received) Paid | | | Unrealized
Appreciation/
(Depreciation) | |
2.142%(a) | | 3M LIBOR(b) | | | 07/03/23 | | | $ | 1,900,000 | (c) | | $ | (83 | ) | | $ | (1,485 | ) | | $ | 1,402 | |
3M LIBOR(d) | | 2.065%(a) | | | 08/06/23 | | | | 6,490,000 | (c) | | | (27,861 | ) | | | 3,545 | | | | (31,406 | ) |
3M LIBOR(b) | | 2.377(a) | | | 07/03/28 | | | | 5,750,000 | (c) | | | (710 | ) | | | 93 | | | | (803 | ) |
2.346(a) | | 3M LIBOR(b) | | | 08/06/28 | | | | 3,660,000 | (c) | | | 14,114 | | | | (4,275 | ) | | | 18,389 | |
1.231(d) | | 3M LIBOR | | | 09/09/36 | | | | 9,100,000 | | | | 1,305,011 | | | | 18,435 | | | | 1,286,576 | |
2.560(a) | | 3M LIBOR(b) | | | 07/03/48 | | | | 2,400,000 | (c) | | | 3,599 | | | | 86 | | | | 3,513 | |
| TOTAL | | | | | | | | | | | | $ | 1,294,070 | | | $ | 16,399 | | | $ | 1,277,671 | |
| | (a) | | Payments made semi-annually. |
| | (b) | | Payments made quarterly. |
| | (c) | | Represents forward starting interest rate swaps whose effective dates of commencement of accruals and cash flows occur subsequent to September 30, 2017. |
| | (d) | | Payments made annually. |
OPTIONS CONTRACTS — At September 30, 2017, the Fund had the following options contracts:
| | | | | | | | | | | | | | | | | | | | | | | | | | | | | | |
| Description | | Counterparty | | Strike
Price | | | Expiration
Date | | | Number of
Contracts | | | Notional Amount | | | Market Value | | | Premiums
Paid
(Received)
by Fund | | | Unrealized
Appreciation/ (Depreciation) | |
Purchased Options Contracts: | | | | | | | | | | | | | | | | | | | | | | | | | | | | |
Puts: | | | | | | | | | | | | | | | | | | | | | | | | | | | | |
| Eurodollar Futures | | CitiGroup Global Markets, Inc.,
1Y Mid Curve | | $ | 98.00 | | | | 06/15/18 | | | | 83 | | | $ | 207,500 | | | $ | 32,163 | | | $ | 23,012 | | | $ | 9,151 | |
| | |
| The accompanying notes are an integral part of these financial statements. | | 51 |
GOLDMAN SACHS HIGH QUALITY FLOATING RATE FUND
Schedule of Investments
September 30, 2017 (Unaudited)
| | | | | | | | | | | | | | |
Principal
Amount | | | Interest
Rate | | | Maturity
Date | | | Value | |
| Corporate Obligations(a) – 0.1% | |
| Banks – 0.1% | |
| | DnB Boligkreditt AS | |
| $ | 800,000 | | | | 1.450 | % | | | 03/21/19 | | | $ | 799,742 | |
| | |
| | | | | | | | | | | | | | |
| Mortgage-Backed Obligations – 46.0% | |
| Collateralized Mortgage Obligations – 32.9% | |
| Interest Only(b) – 0.0% | |
| | FNMA REMIC Series 1990-145, Class B | |
| $ | 62 | | | | 1,004.961 | % | | | 12/25/20 | | | $ | 229 | |
| | |
| Regular Floater – 32.3% | |
| | FHLMC REMIC Series 1826, Class F (1M LIBOR + 0.400%) | |
| | 14,478 | | | | 1.627 | | | | 09/15/21 | | | | 14,507 | |
| | FHLMC REMIC Series 3049, Class FP (1M LIBOR + 0.350%) | |
| | 3,660,325 | | | | 1.577 | | | | 10/15/35 | | | | 3,647,546 | |
| | FHLMC REMIC Series 3208, Class FB (1M LIBOR + 0.400%) | |
| | 498,205 | | | | 1.627 | | | | 08/15/36 | | | | 499,031 | |
| | FHLMC REMIC Series 3208, Class FD (1M LIBOR + 0.400%) | |
| | 1,215,400 | | | | 1.627 | | | | 08/15/36 | | | | 1,221,468 | |
| | FHLMC REMIC Series 3208, Class FG (1M LIBOR + 0.400%) | |
| | 1,182,552 | | | | 1.627 | | | | 08/15/36 | | | | 1,188,455 | |
| | FHLMC REMIC Series 3307, Class FA (1M LIBOR + 0.430%) | |
| | 8,877,334 | | | | 1.664 | | | | 07/15/34 | | | | 8,906,234 | |
| | FHLMC REMIC Series 3312, Class HF (1M LIBOR + 0.300%) | |
| | 4,125,669 | | | | 1.527 | | | | 08/15/33 | | | | 4,134,859 | |
| | FHLMC REMIC Series 3371, Class FA (1M LIBOR + 0.600%) | |
| | 818,223 | | | | 1.827 | | | | 09/15/37 | | | | 826,071 | |
| | FHLMC REMIC Series 3374, Class FT (1M LIBOR + 0.300%) | |
| | 193,141 | | | | 1.527 | | | | 04/15/37 | | | | 192,978 | |
| | FHLMC REMIC Series 3471, Class FB (1M LIBOR + 1.000%) | |
| | 1,760,593 | | | | 2.234 | | | | 08/15/35 | | | | 1,797,343 | |
| | FHLMC REMIC Series 3545, Class FA (1M LIBOR + 0.850%) | |
| | 368,562 | | | | 2.077 | | | | 06/15/39 | | | | 372,375 | |
| | FHLMC REMIC Series 4039, Class FA (1M LIBOR + 0.500%) | |
| | 2,775,061 | | | | 1.727 | | | | 05/15/42 | | | | 2,796,200 | |
| | FHLMC REMIC Series 4057, Class CF (1M LIBOR + 0.450%) | |
| | 4,999,490 | | | | 1.677 | | | | 04/15/39 | | | | 5,014,802 | |
| | FHLMC REMIC Series 4272, Class FD (1M LIBOR + 0.350%) | |
| | 5,033,328 | | | | 1.584 | | | | 11/15/43 | | | | 5,037,167 | |
| | FHLMC REMIC Series 4316, Class FY (1M LIBOR + 0.400%) | |
| | 1,765,110 | | | | 1.627 | | | | 11/15/39 | | | | 1,769,534 | |
| | FHLMC REMIC Series 4477, Class FG (1M LIBOR + 0.300%) | |
| | 6,242,600 | | | | 1.527 | | | | 10/15/40 | | | | 6,226,571 | |
| | FHLMC REMIC Series 4508, Class CF (1M LIBOR + 0.400%) | |
| | 12,604,832 | | | | 1.627 | | | | 09/15/45 | | | | 12,634,424 | |
| | FHLMC REMIC Series 4614, Class FK (1M LIBOR + 0.500%) | |
| | 8,759,554 | | | | 1.727 | | | | 09/15/46 | | | | 8,826,906 | |
| | FHLMC REMIC Series 4631, Class GF (1M LIBOR + 0.500%) | |
| | 14,428,932 | | | | 1.727 | | | | 11/15/46 | | | | 14,537,993 | |
| | FHLMC REMIC Series 4637, Class QF (1M LIBOR + 1.000%) | |
| | 14,835,420 | | | | 2.237 | | | | 04/15/44 | | | | 14,914,578 | |
| | FHLMC REMIC Series 4680, Class YF (1M LIBOR + 1.000%) | |
| | 9,629,944 | | | | 2.232 | | | | 12/15/46 | | | | 9,676,627 | |
| | FHLMC STRIPS Series 237, Class F23 (1M LIBOR + 0.400%) | |
| | 338,786 | | | | 1.634 | | | | 05/15/36 | | | | 339,016 | |
| | FHLMC STRIPS Series 350, Class F2 (1M LIBOR + 0.350%) | |
| | 19,303,332 | | | | 1.587 | | | | 09/15/40 | | | | 19,282,635 | |
| | |
| Mortgage-Backed Obligations – (continued) | |
| Regular Floater – (continued) | |
| | FNMA REMIC Series 1998-66, Class FC (1M LIBOR + 0.500%) | |
| 46,138 | | | | 1.734 | | | | 11/17/28 | | | | 46,357 | |
| | FNMA REMIC Series 2006-42, Class CF (1M LIBOR + 0.450%) | |
| | 7,933,915 | | | | 1.684 | | | | 06/25/36 | | | | 7,972,114 | |
| | FNMA REMIC Series 2006-72, Class XF (1M LIBOR + 0.500%) | |
| | 336,836 | | | | 1.734 | | | | 08/25/36 | | | | 338,192 | |
| | FNMA REMIC Series 2007-33, Class HF (1M LIBOR + 0.350%) | |
| | 51,771 | | | | 1.584 | | | | 04/25/37 | | | | 51,892 | |
| | FNMA REMIC Series 2007-36, Class F (1M LIBOR + 0.230%) | |
| | 1,049,170 | | | | 1.467 | | | | 04/25/37 | | | | 1,044,675 | |
| | FNMA REMIC Series 2007-92, Class OF (1M LIBOR + 0.570%) | |
| | 391,206 | | | | 1.804 | | | | 09/25/37 | | | | 394,737 | |
| | FNMA REMIC Series 2008-22, Class FD (1M LIBOR + 0.840%) | |
| | 526,892 | | | | 2.077 | | | | 04/25/48 | | | | 535,205 | |
| | FNMA REMIC Series 2009-75, Class MF (1M LIBOR + 1.150%) | |
| | 804,621 | | | | 2.384 | | | | 09/25/39 | | | | 824,700 | |
| | FNMA REMIC Series 2010-123, Class FL (1M LIBOR + 0.430%) | |
| | 1,669,275 | | | | 1.664 | | | | 11/25/40 | | | | 1,675,093 | |
| | FNMA REMIC Series 2010-8, Class FE (1M LIBOR + 0.790%) | |
| | 9,003,988 | | | | 2.024 | | | | 02/25/40 | | | | 9,118,261 | |
| | FNMA REMIC Series 2011-110, Class FE (1M LIBOR + 0.400%) | |
| | 2,779,150 | | | | 1.634 | | | | 04/25/41 | | | | 2,787,723 | |
| | FNMA REMIC Series 2011-53, Class FT (1M LIBOR + 0.580%) | |
| | 617,683 | | | | 1.814 | | | | 06/25/41 | | | | 622,996 | |
| | FNMA REMIC Series 2011-63, Class FG (1M LIBOR + 0.450%) | |
| | 619,277 | | | | 1.684 | | | | 07/25/41 | | | | 622,489 | |
| | FNMA REMIC Series 2012-56, Class FG (1M LIBOR + 0.500%) | |
| | 2,123,571 | | | | 1.734 | | | | 03/25/39 | | | | 2,132,089 | |
| | FNMA REMIC Series 2013-96, Class FW (1M LIBOR + 0.400%) | |
| | 158,378 | | | | 1.634 | | | | 09/25/43 | | | | 158,899 | |
| | FNMA REMIC Series 2014-19, Class FA (1M LIBOR + 0.400%) | |
| | 1,584,524 | | | | 1.634 | | | | 11/25/39 | | | | 1,588,353 | |
| | FNMA REMIC Series 2014-19, Class FJ (1M LIBOR + 0.400%) | |
| | 1,790,860 | | | | 1.634 | | | | 11/25/39 | | | | 1,795,251 | |
| | FNMA REMIC Series 2016-1, Class FT (1M LIBOR + 0.350%) | |
| | 6,236,185 | | | | 1.587 | | | | 02/25/46 | | | | 6,242,980 | |
| | FNMA REMIC Series 2016-23, Class FT (1M LIBOR + 0.500%) | |
| | 1,213,635 | | | | 1.734 | | | | 11/25/45 | | | | 1,222,462 | |
| | FNMA REMIC Series 2016-33, Class PF (1M LIBOR + 0.500%) | |
| | 2,584,652 | | | | 1.734 | | | | 06/25/46 | | | | 2,605,014 | |
| | FNMA REMIC Series 2017-16, Class FG (1M LIBOR + 0.450%) | |
| | 19,085,446 | | | | 1.687 | | | | 03/25/47 | | | | 19,195,725 | |
| | FNMA REMIC Series 2017-45, Class FA (1M LIBOR + 0.320%) | |
| | 11,958,898 | | | | 1.557 | | | | 06/25/47 | | | | 11,950,356 | |
| | FNMA REMIC Series 2017-57, Class FA (1M LIBOR + 0.400%) | |
| | 19,604,122 | | | | 1.637 | | | | 08/25/57 | | | | 19,658,654 | |
| | GNMA REMIC Series 2008-51, Class FG (1M LIBOR + 0.770%) | |
| | 1,913,873 | | | | 2.004 | | | | 06/16/38 | | | | 1,947,427 | |
| | GNMA REMIC Series 2010-53, Class FC (1M LIBOR + 0.820%) | |
| | 846,688 | | | | 2.056 | | | | 04/20/40 | | | | 857,695 | |
| | GNMA REMIC Series 2011-101, Class EF (1M LIBOR + 0.860%) | |
| | 7,155,793 | | | | 2.094 | | | | 10/16/39 | | | | 7,277,013 | |
| | GNMA REMIC Series 2011-117, Class FJ (1M LIBOR + 0.870%) | |
| | 4,865,545 | | | | 2.106 | | | | 08/20/41 | | | | 4,959,785 | |
| | GNMA REMIC Series 2012-12, Class HF (1M LIBOR + 0.400%) | |
| | 1,109,573 | | | | 1.636 | | | | 01/20/42 | | | | 1,109,364 | |
| | |
| | |
| 52 | | The accompanying notes are an integral part of these financial statements. |
GOLDMAN SACHS HIGH QUALITY FLOATING RATE FUND
| | | | | | | | | | | | | | |
Principal
Amount | | | Interest
Rate | | | Maturity
Date | | | Value | |
| Mortgage-Backed Obligations – (continued) | |
| Regular Floater – (continued) | |
| NCUA Guaranteed Notes Series 2011-R1, Class 1A
(1M LIBOR + 0.450%) |
|
| $ | 452,048 | | | | 1.688 | % | | | 01/08/20 | | | $ | 452,914 | |
| NCUA Guaranteed Notes Series 2011-R2, Class 1A
(1M LIBOR + 0.400%) |
|
| | 1,400,492 | | | | 1.638 | | | | 02/06/20 | | | | 1,402,352 | |
| NCUA Guaranteed Notes Series 2011-R3, Class 1A
(1M LIBOR + 0.400%) |
|
| | 1,137,899 | | | | 1.637 | | | | 03/11/20 | | | | 1,139,455 | |
| NCUA Guaranteed Notes Series 2011-R4, Class 1A
(1M LIBOR + 0.380%) |
|
| | 43,852 | | | | 1.611 | | | | 03/06/20 | | | | 43,852 | |
| | | | | | | | | | | | | | |
| | | | | | | | | | | | | 235,631,394 | |
| | |
| Sequential Fixed Rate – 0.1% | |
| | FHLMC REMIC Series 4248, Class LM | |
| | 706,435 | | | | 6.500 | | | | 05/15/41 | | | | 819,574 | |
| | |
| Sequential Floating Rate – 0.5% | |
| | FHLMC REMIC Series 3588, Class CW | |
| | 2,196,113 | | | | 3.645 | | | | 10/15/37 | | | | 2,304,108 | |
| | FNMA REMIC Series 1990-145, Class A | |
| | 25,354 | | | | 1.945 | | | | 12/25/20 | | | | 25,412 | |
| | FNMA REMIC Series 1997-20, Class F | |
| | 121,788 | | | | 1.422 | | | | 03/25/27 | | | | 121,911 | |
| | Mill City Mortgage Loan Trust Series 2016-1, Class A1(a) | |
| | 945,618 | | | | 2.500 | | | | 04/25/57 | | | | 944,765 | |
| | | | | | | | | | | | | | |
| | | | | | | | | | | | | 3,396,196 | |
| | |
| TOTAL COLLATERALIZED
MORTGAGE OBLIGATIONS |
| | $ | 239,847,393 | |
| | |
| Commercial Mortgage-Backed Securities – 9.3% | |
| Sequential Floating Rate – 9.3% | |
| | FNMA ACES Series 2013-M11, Class FA (1M LIBOR + 0.330%) | |
| $ | 11,276 | | | | 1.567 | % | | | 01/25/18 | | | $ | 11,269 | |
| FHLMC Multifamily Structured Pass-Through Certificates
Series KF02, Class A1 (1M LIBOR + 0.380%) |
|
| | 259,013 | | | | 1.612 | | | | 07/25/20 | | | | 258,997 | |
| FHLMC Multifamily Structured Pass Through Certificates
Series KF03, Class A (1M LIBOR + 0.340%) |
|
| | 2,894,589 | | | | 1.572 | | | | 01/25/21 | | | | 2,893,683 | |
| FHLMC Multifamily Structured Pass-Through Certificates
Series KS02, Class A (1M LIBOR + 0.380%) |
|
| | 5,387,695 | | | | 1.612 | | | | 08/25/23 | | | | 5,387,676 | |
| FHLMC Multifamily Structured Pass-Through Certificates
Series KF19, Class A (1M LIBOR + 0.450%) |
|
| | 6,453,100 | | | | 1.682 | | | | 06/25/23 | | | | 6,461,148 | |
| | FNMA ACES Series 2017-M5, Class FA (1M LIBOR + 0.490%) | |
| | 18,945,863 | | | | 1.721 | | | | 04/25/24 | | | | 18,977,941 | |
| FHLMC Multifamily Structured Pass-Through Certificates
Series KF31, Class A (1M LIBOR + 0.370%) |
|
| | 7,000,000 | | | | 1.602 | | | | 04/25/24 | | | | 7,002,205 | |
| FHLMC Multifamily Structured Pass-Through Certificates
Series KF32, Class A (1M LIBOR + 0.370%) |
|
| | 12,999,278 | | | | 1.602 | | | | 05/25/24 | | | | 13,011,088 | |
| | |
| Mortgage-Backed Obligations – (continued) | |
| Sequential Floating Rate – (continued) | |
| FHLMC Multifamily Structured Pass-Through Certificates
Series J15L, Class AFL (1M LIBOR + 0.350%) |
|
| 13,951,071 | | | | 1.582 | | | | 08/25/25 | | | | 13,936,380 | |
| | |
| TOTAL COMMERCIAL MORTGAGE-
BACKED SECURITIES |
| | $ | 67,940,387 | |
| | |
| Federal Agencies – 3.8% | |
| Adjustable Rate FHLMC – 0.8% | |
| | (COF + 1.925%) | |
| $ | 4,221 | | | | 2.589 | % | | | 08/01/18 | | | $ | 4,232 | |
| | (COF + 2.000%) | |
| | 1,892 | | | | 2.625 | | | | 11/01/18 | | | | 1,900 | |
| | (3 year CMT + 2.125%) | |
| | 1,228 | | | | 3.089 | | | | 11/01/18 | | | | 1,228 | |
| | (COF + 1.625%) | |
| | 918 | | | | 2.250 | | | | 02/01/19 | | | | 919 | |
| | (COF + 1.250%) | |
| | 3,111 | | | | 1.895 | | | | 03/01/19 | | | | 3,108 | |
| | (COF + 1.915%) | |
| | 591 | | | | 2.540 | | | | 03/01/19 | | | | 592 | |
| | (COF + 1.078%) | |
| | 5,227 | | | | 2.110 | | | | 06/01/19 | | | | 5,233 | |
| | (COF + 1.645%) | |
| | 1,617 | | | | 2.270 | | | | 07/01/19 | | | | 1,617 | |
| | (COF + 1.887%) | |
| | 67,073 | | | | 2.546 | | | | 11/01/19 | | | | 67,275 | |
| | (1 year CMT + 2.136%) | |
| | 54,012 | | | | 6.880 | | | | 11/01/19 | | | | 55,430 | |
| | (COF + 1.250%) | |
| | 4,583 | | | | 3.342 | | | | 01/01/20 | | | | 4,604 | |
| | (COF + 1.250%) | |
| | 11,118 | | | | 1.895 | | | | 05/01/21 | | | | 11,128 | |
| | (COF + 1.250%) | |
| | 1,662 | | | | 1.895 | | | | 10/01/26 | | | | 1,670 | |
| | (3 year CMT + 2.553%) | |
| | 388,381 | | | | 3.506 | | | | 08/01/28 | | | | 403,246 | |
| | (6M CMT + 2.235%) | |
| | 124,293 | | | | 3.518 | | | | 05/01/29 | | | | 128,153 | |
| | (COF + 1.250%) | |
| | 8,998 | | | | 4.099 | | | | 06/01/29 | | | | 9,593 | |
| | (COF + 1.250%) | |
| | 22,207 | | | | 1.841 | | | | 04/01/30 | | | | 22,326 | |
| | (COF + 1.249%) | |
| | 17,708 | | | | 4.398 | | | | 06/01/30 | | | | 18,879 | |
| | (6M USD LIBOR + 2.173%) | |
| | 106,340 | | | | 3.548 | | | | 12/01/30 | | | | 110,830 | |
| | (COF + 1.198%) | |
| | 6,867 | | | | 2.448 | | | | 02/01/31 | | | | 6,936 | |
| | (12M MTA + 2.155%) | |
| | 6,615 | | | | 2.807 | | | | 06/01/31 | | | | 6,901 | |
| | (12M USD LIBOR + 1.860%) | |
| | 1,326,439 | | | | 3.708 | | | | 05/01/34 | | | | 1,397,338 | |
| | (12M USD LIBOR + 1.750%) | |
| | 1,006,609 | | | | 3.533 | | | | 05/01/35 | | | | 1,057,034 | |
| | (3 year CMT + 2.333%) | |
| | 50,384 | | | | 4.407 | | | | 05/01/35 | | | | 52,032 | |
| | |
| | |
| The accompanying notes are an integral part of these financial statements. | | 53 |
GOLDMAN SACHS HIGH QUALITY FLOATING RATE FUND
Schedule of Investments (continued)
September 30, 2017 (Unaudited)
| | | | | | | | | | | | | | |
Principal
Amount | | | Interest
Rate | | | Maturity
Date | | | Value | |
| Mortgage-Backed Obligations – (continued) | |
| Federal Agencies – (continued) | |
| Adjustable Rate FHLMC – (continued) | |
| | (1 year CMT + 2.282%) | |
| $ | 2,399,616 | | | | 2.891 | % | | | 01/01/38 | | | $ | 2,537,085 | |
| | | | | | | | | | | | | | |
| | | | | | | | | | | | | 5,909,289 | |
| | |
| Adjustable Rate FNMA – 1.1% | |
| | (COF + 1.350%) | |
| | 659 | | | | 1.958 | | | | 03/01/18 | | | | 659 | |
| | (COF + 1.250%) | |
| | 625 | | | | 2.635 | | | | 03/01/18 | | | | 624 | |
| | (COF + 1.350%) | |
| | 7,114 | | | | 2.026 | | | | 07/01/18 | | | | 7,107 | |
| | (COF + 1.250%) | |
| | 3,746 | | | | 1.878 | | | | 10/01/18 | | | | 3,747 | |
| | (COF + 1.250%) | |
| | 1,867 | | | | 2.673 | | | | 10/01/18 | | | | 1,865 | |
| | (COF + 1.250%) | |
| | 4,579 | | | | 2.721 | | | | 10/01/18 | | | | 4,578 | |
| | (COF + 1.250%) | |
| | 12,432 | | | | 1.875 | | | | 01/01/19 | | | | 12,440 | |
| | (COF + 1.650%) | |
| | 22,245 | | | | 3.973 | | | | 04/01/19 | | | | 22,477 | |
| | (COF + 1.250%) | |
| | 2,897 | | | | 6.043 | | | | 04/01/19 | | | | 2,938 | |
| | (COF + 1.250%) | |
| | 89,475 | | | | 1.875 | | | | 05/01/19 | | | | 89,603 | |
| | (6 Month CMT + 1.999%) | |
| | 3,788 | | | | 6.099 | | | | 07/01/19 | | | | 3,838 | |
| | (COF + 1.650%) | |
| | 19,515 | | | | 4.288 | | | | 08/01/19 | | | | 19,739 | |
| | (1 year CMT + 2.896%) | |
| | 15,469 | | | | 6.686 | | | | 05/01/20 | | | | 15,993 | |
| | (COF + 1.250%) | |
| | 41,816 | | | | 1.875 | | | | 06/01/20 | | | | 41,866 | |
| | (1 year CMT + 2.000%) | |
| | 2,789 | | | | 6.713 | | | | 02/01/22 | | | | 2,912 | |
| | 17,135 | | | | 2.566 | | | | 05/20/22 | | | | 17,113 | |
| | (6M USD LIBOR + 1.822%) | |
| | 69,055 | | | | 3.197 | | | | 02/01/23 | | | | 70,640 | |
| | (6M USD LIBOR + 1.869%) | |
| | 149,329 | | | | 3.314 | | | | 01/01/24 | | | | 153,298 | |
| | (6M USD LIBOR + 1.925%) | |
| | 204,105 | | | | 3.300 | | | | 03/01/24 | | | | 209,860 | |
| | 94,951 | | | | 2.472 | | | | 06/20/24 | | | | 94,821 | |
| | (3 year CMT + 1.850%) | |
| | 745 | | | | 2.975 | | | | 08/01/24 | | | | 746 | |
| | (6M CMT + 1.865%) | |
| | 42,973 | | | | 5.115 | | | | 01/01/25 | | | | 45,625 | |
| | (COF + 1.250%) | |
| | 6,810 | | | | 3.293 | | | | 06/01/27 | | | | 6,941 | |
| | (COF + 1.250%) | |
| | 5,096 | | | | 4.250 | | | | 12/01/27 | | | | 5,432 | |
| | (COF + 1.250%) | |
| | 6,035 | | | | 4.489 | | | | 01/01/28 | | | | 6,434 | |
| | (COF + 1.250%) | |
| | 5,594 | | | | 1.849 | | | | 06/01/29 | | | | 5,641 | |
| | (COF + 1.250%) | |
| | 7,117 | | | | 2.103 | | | | 06/01/29 | | | | 7,207 | |
| | |
| Mortgage-Backed Obligations – (continued) | |
| Adjustable Rate FNMA – (continued) | |
| | (1 year CMT + 2.275%) | |
| 1,209,293 | | | | 3.228 | | | | 07/01/33 | | | | 1,275,725 | |
| | (1 year CMT + 2.360%) | |
| | 280,311 | | | | 3.229 | | | | 11/01/34 | | | | 297,321 | |
| | (COF + 1.254%) | |
| | 4,092 | | | | 3.919 | | | | 05/01/36 | | | | 4,257 | |
| | (12M USD LIBOR + 1.930%) | |
| | 1,468,744 | | | | 3.519 | | | | 03/01/37 | | | | 1,552,670 | |
| | (12M USD LIBOR + 1.825%) | |
| | 188,781 | | | | 3.575 | | | | 09/01/37 | | | | 200,434 | |
| | (12M MTA + 1.400%) | |
| | 57,899 | | | | 2.230 | | | | 06/01/40 | | | | 58,460 | |
| | (12M MTA + 1.400%) | |
| | 5,744 | | | | 2.030 | | | | 02/01/41 | | | | 5,764 | |
| | (12M USD LIBOR + 1.580%) | |
| | 1,179,192 | | | | 2.514 | | | | 04/01/44 | | | | 1,226,200 | |
| | (12M USD LIBOR + 1.550%) | |
| | 2,645,330 | | | | 2.583 | | | | 09/01/44 | | | | 2,700,457 | |
| | | | | | | | | | | | | | |
| | | | | | | | | | | | | 8,175,432 | |
| | |
| Adjustable Rate GNMA – 0.2% | |
| | 908,138 | | | | 2.625 | | | | 04/20/33 | | | | 931,327 | |
| | 188,524 | | | | 2.625 | | | | 05/20/33 | | | | 196,226 | |
| | 352,173 | | | | 2.125 | | | | 08/20/34 | | | | 361,367 | |
| | | | | | | | | | | | | | |
| | | | | | | | | | | | | 1,488,920 | |
| | |
| FHLMC – 0.1% | |
| | 34,879 | | | | 5.500 | | | | 01/01/20 | | | | 35,808 | |
| | 45,246 | | | | 7.000 | | | | 04/01/21 | | | | 47,049 | |
| | 22,485 | | | | 7.000 | | | | 08/01/21 | | | | 23,640 | |
| | 68,850 | | | | 7.000 | | | | 05/01/22 | | | | 72,923 | |
| | 213,981 | | | | 7.000 | | | | 06/01/22 | | | | 226,225 | |
| | 1,613 | | | | 4.500 | | | | 05/01/23 | | | | 1,709 | |
| | | | | | | | | | | | | | |
| | | | | | | | | | | | | 407,354 | |
| | |
| FNMA – 1.6% | |
| | 3,680 | | | | 5.500 | | | | 03/01/18 | | | | 3,700 | |
| | 180 | | | | 5.500 | | | | 04/01/18 | | | | 180 | |
| | 1,968 | | | | 5.000 | | | | 09/01/19 | | | | 2,022 | |
| | 209 | | | | 5.000 | | | | 11/01/19 | | | | 211 | |
| | 2,343 | | | | 5.000 | | | | 01/01/20 | | | | 2,398 | |
| | 21,901 | | | | 7.000 | | | | 07/01/21 | | | | 22,971 | |
| | 53,828 | | | | 7.000 | | | | 11/01/21 | | | | 56,849 | |
| | 33,025 | | | | 7.000 | | | | 12/01/21 | | | | 33,382 | |
| | 80,931 | | | | 7.000 | | | | 01/01/22 | | | | 83,246 | |
| | 12,023 | | | | 7.000 | | | | 02/01/22 | | | | 12,680 | |
| | 46,375 | | | | 7.000 | | | | 01/01/28 | | | | 50,236 | |
| | 19,569 | | | | 6.500 | | | | 04/01/33 | | | | 22,811 | |
| | 23,381 | | | | 6.000 | | | | 05/01/38 | | | | 26,543 | |
| | 29,446 | | | | 6.000 | | | | 11/01/38 | | | | 33,433 | |
| | 65,832 | | | | 6.000 | | | | 09/01/39 | | | | 74,741 | |
| | 24,090 | | | | 6.000 | | | | 10/01/39 | | | | 27,415 | |
| | 16,826 | | | | 6.000 | | | | 10/01/40 | | | | 19,100 | |
| | 24,151 | | | | 6.000 | | | | 05/01/41 | | | | 27,412 | |
| | 9,716,793 | | | | 4.000 | | | | 10/01/42 | | | | 10,295,884 | |
| | 854,187 | | | | 3.500 | | | | 05/01/46 | | | | 881,202 | |
| | | | | | | | | | | | | | |
| | | | | | | | | | | | | 11,676,416 | |
| | |
| | |
| 54 | | The accompanying notes are an integral part of these financial statements. |
GOLDMAN SACHS HIGH QUALITY FLOATING RATE FUND
| | | | | | | | | | | | | | |
Principal
Amount | | | Interest
Rate | | | Maturity
Date | | | Value | |
| Mortgage-Backed Obligations – (continued) | |
| GNMA – 0.0% | |
| $ | 24,242 | | | | 7.000 | % | | | 04/15/26 | | | $ | 26,336 | |
| | |
| | TOTAL FEDERAL AGENCIES | | | $ | 27,683,747 | |
| | |
| | TOTAL MORTGAGE-BACKED OBLIGATIONS | |
| | (Cost $335,047,703) | | | $ | 335,471,527 | |
| | |
| | | | | | | | | | | | | | |
| Agency Debenture(c) – 0.5% | |
| | Hashemite Kingdom of Jordan Government AID Bond | |
| $ | 4,000,000 | | | | 2.503 | % | | | 10/30/20 | | | $ | 4,089,440 | |
| | |
| | | | | | | | | | | | | | |
| Asset-Backed Securities – 43.8% | |
| Automotive – 4.0% | |
| Ally Master Owner Trust Series 2017-3, Class A1
(1M LIBOR + 0.430%) |
|
| $ | 11,500,000 | | | | 1.664 | % | | | 06/15/22 | | | $ | 11,514,007 | |
| Chesapeake Funding II LLC Series 2016-2A, Class A2(a)
(1M USD LIBOR + 1.000%) |
|
| | 2,497,478 | | | | 2.227 | | | | 06/15/28 | | | | 2,512,838 | |
| Chesapeake Funding II LLC Series 2017-3A, Class A2(a)
(1M USD LIBOR + 0.340%) |
|
| | 5,250,000 | | | | 1.913 | | | | 08/15/29 | | | | 5,256,134 | |
| GMF Floorplan Owner Revolving Trust Series 2017-2,
Class A2(a) |
|
| | 9,650,000 | | | | 1.664 | | | | 07/15/22 | | | | 9,664,098 | |
| | | | | | | | | | | | | | |
| | | | | | | | | | | | | 28,947,077 | |
| | |
| Collateralized Loan Obligations(a) – 15.1% | |
| ACIS CLO Ltd. Series 2013-1A, Class A1
(3M USD LIBOR + 0.870%) |
|
| | 1,015,170 | | | | 2.028 | | | | 04/18/24 | | | | 1,015,744 | |
| AIMCO CLO Series 2014-AA, Class AR
(3M USD LIBOR + 1.100%) |
|
| | 2,650,000 | | | | 2.181 | | | | 07/20/26 | | | | 2,649,981 | |
| Anchorage Capital CLO 4 Ltd. Series 2014-4A, Class A1AR
(3M USD LIBOR + 1.140%) |
|
| | 3,150,000 | | | | 2.312 | | | | 07/28/26 | | | | 3,156,278 | |
| | Apex Credit CLO II LLC Series 2017-2A, Class A | |
| | 3,000,000 | | | | 2.600 | | | | 09/20/29 | | | | 3,013,740 | |
| Atrium X CLO Series 2017-10A, Class AR
(3M USD LIBOR + 0.950%) |
|
| | 2,600,000 | | | | 2.036 | | | | 07/16/25 | | | | 2,605,837 | |
| B&M CLO Ltd. Series 2014-1A, Class A1
(3M USD LIBOR + 1.400%) |
|
| | 750,000 | | | | 2.558 | | | | 04/16/26 | | | | 749,827 | |
| Benefit Street Partners CLO II Ltd. Series 2013-IIA, Class A1R
(3M USD LIBOR + 1.250%) |
|
| | 6,000,000 | | | | 2.454 | | | | 07/15/29 | | | | 6,040,296 | |
| CBAM CLO Management LLC Series 2017-2A, Class A
(3M USD LIBOR + 1.240%) |
|
| | 3,500,000 | | | | 2.631 | | | | 10/17/29 | | | | 3,517,836 | |
| Cedar Funding II CLO Ltd. Series 2013-1A, Class A1R
(3M USD LIBOR + 1.230%) |
|
| | 1,700,000 | | | | 2.519 | | | | 06/09/30 | | | | 1,705,117 | |
| | |
| Asset-Backed Securities – (continued) | |
| Collateralized Loan Obligations(a) – (continued) | |
| Crown Point CLO Ltd. Series 2012-1A, Class A1LA
(3M USD LIBOR + 0.750%) |
|
| 71,606 | | | | 1.922 | | | | 11/21/22 | | | | 71,614 | |
| Crown Point CLO Ltd. Series 2013-2A, Class A1L
(3M USD LIBOR + 0.970%) |
|
| | 4,514,291 | | | | 2.128 | | | | 12/31/23 | | | | 4,502,514 | |
| Cutwater Ltd. Series 2014-1A, Class A1AR
(3M USD LIBOR + 1.250%) |
|
| | 2,500,000 | | | | 2.469 | | | | 07/15/26 | | | | 2,504,955 | |
| Dryden XXVI Senior Loan Fund Series 2013-26A, Class A
(3M USD LIBOR + 1.100%) |
|
| | 1,704,876 | | | | 2.258 | | | | 07/15/25 | | | | 1,705,340 | |
| ICG US CLO Ltd. Series 2014-1A, Class A1
(3M USD LIBOR + 1.150%) |
|
| | 2,100,000 | | | | 2.306 | | | | 04/20/26 | | | | 2,094,559 | |
| Jamestown CLO VII Ltd. Series 2015-7A, Class A1
(3M USD LIBOR + 1.550%) |
|
| | 2,350,000 | | | | 2.706 | | | | 07/25/27 | | | | 2,351,121 | |
| Jamestown CLO X Ltd. Series 2017-10A, Class A1
(3M USD LIBOR + 1.250%) |
|
| | 4,750,000 | | | | 2.720 | | | | 07/17/29 | | | | 4,777,360 | |
| LCM XVI LP Series 2017-16A, Class AR
(3M USD LIBOR + 1.030%) |
|
| | 3,650,000 | | | | 2.188 | | | | 07/15/26 | | | | 3,653,756 | |
| OCP CLO Ltd. Series 2012-2A, Class A1R
(3M USD LIBOR + 1.400%) |
|
| | 650,000 | | | | 2.572 | | | | 11/22/25 | | | | 653,608 | |
| OCP CLO Ltd. Series 2014-5A, Class A1
(3M USD LIBOR + 1.000%) |
|
| | 7,480,000 | | | | 2.167 | | | | 04/26/26 | | | | 7,495,327 | |
| OCP CLO Ltd. Series 2017-13A, Class A1A
(3M USD LIBOR + 1.260%) |
|
| | 3,150,000 | | | | 2.561 | | | | 07/15/30 | | | | 3,169,221 | |
| OFSI Fund V Ltd. Series 2013-5A, Class A1LA
(3M USD LIBOR + 0.930%) |
|
| | 778,702 | | | | 2.088 | | | | 04/17/25 | | | | 779,010 | |
| OFSI Fund VI Ltd. Series 2014-6A, Class A1
(3M USD LIBOR + 1.030%) |
|
| | 2,250,000 | | | | 2.188 | | | | 03/20/25 | | | | 2,234,065 | |
| OFSI Fund VII Ltd. Series 2014-7A, Class A
(3M USD LIBOR + 1.340%) |
|
| | 2,100,000 | | | | 2.498 | | | | 10/18/26 | | | | 2,101,048 | |
| | OFSI Fund VII Ltd. Series 2014-7A, Class AR | |
| | 3,550,000 | | | | 2.200 | | | | 10/18/26 | | | | 3,566,259 | |
| | Palmer Square Loan Funding Ltd. Series 2017-1A, Class A1 | |
| | 3,700,000 | | | | 2.060 | | | | 10/15/25 | | | | 3,699,978 | |
| Regatta III Funding Ltd. Series 2014-1A, Class A1AR
(3M USD LIBOR + 1.050%) |
|
| | 4,900,000 | | | | 2.346 | | | | 04/15/26 | | | | 4,908,129 | |
| Shackleton CLO Ltd. Series 2014-5A, Class AR
(3M USD LIBOR + 1.140%) |
|
| | 5,200,000 | | | | 2.319 | | | | 05/07/26 | | | | 5,207,504 | |
| Sound Point CLO VI Ltd. Series 2014-2A, Class A2R
(3M USD LIBOR + 1.140%) |
|
| | 2,250,000 | | | | 2.296 | | | | 10/20/26 | | | | 2,255,715 | |
| | |
| | |
| The accompanying notes are an integral part of these financial statements. | | 55 |
GOLDMAN SACHS HIGH QUALITY FLOATING RATE FUND
Schedule of Investments (continued)
September 30, 2017 (Unaudited)
| | | | | | | | | | | | | | |
Principal
Amount | | | Interest
Rate | | | Maturity
Date | | | Value | |
| Asset-Backed Securities – (continued) | |
| Collateralized Loan Obligations(a) – (continued) | |
| Sound Point CLO Vlll Ltd. Series 2015-1A, Class A
(3M USD LIBOR + 1.530%) |
|
| $ | 5,100,000 | | | | 2.688 | % | | | 04/15/27 | | | $ | 5,107,512 | |
| TRESTLES CLO Ltd. Series 2017-1A, Class A1A
(3M USD LIBOR + 1.290%) |
|
| | 6,350,000 | | | | 2.594 | | | | 07/25/29 | | | | 6,374,727 | |
| Trinitas CLO II Ltd. Series 2014-2A, Class A1R
(3M USD LIBOR + 1.180%) |
|
| | 6,250,000 | | | | 2.339 | | | | 07/15/26 | | | | 6,258,912 | |
| Voya CLO Ltd. Series 2017-3A, Class A1A
(3M USD LIBOR + 1.230%) |
|
| | 8,750,000 | | | | 2.548 | | | | 07/20/30 | | | | 8,790,075 | |
| Zais CLO 1 Ltd. Series 2014-1A, Class A1
(3M USD LIBOR + 1.400%) |
|
| | 1,700,000 | | | | 2.558 | | | | 04/15/26 | | | | 1,707,145 | |
| | | | | | | | | | | | | | |
| | | | | | | | | | | | | 110,424,110 | |
| | |
| Credit Card – 7.9% | |
| Bank of America Credit Card Trust Series 2014-A1, Class A
(1M LIBOR + 0.380%) |
|
| | 5,650,000 | | | | 1.614 | | | | 06/15/21 | | | | 5,672,685 | |
| CARDS II Trust Series 2016-1A, Class A(a)
(1M LIBOR + 0.700%) |
|
| | 1,500,000 | | | | 1.934 | | | | 07/15/21 | | | | 1,506,229 | |
| CARDS II Trust Series 2017-1A, Class A(a)
(1M LIBOR + 0.370%) |
|
| | 2,500,000 | | | | 1.604 | | | | 04/18/22 | | | | 2,506,138 | |
| Chase Issuance Trust Series 2013-A9, Class A
(1M LIBOR + 0.420%) |
|
| | 10,000,000 | | | | 1.654 | | | | 11/16/20 | | | | 10,040,478 | |
| Citibank Credit Card Issuance Trust Series 2013-A7, Class A7
(1M LIBOR + 0.430%) |
|
| | 3,900,000 | | | | 1.665 | | | | 09/10/20 | | | | 3,914,944 | |
| Citibank Credit Card Issuance Trust Series 2017-A5, Class A5
(1M LIBOR + 0.620%) |
|
| | 10,100,000 | | | | 1.856 | | | | 04/22/26 | | | | 10,201,535 | |
| Citibank Credit Card Issuance Trust Series 2017-A7, Class A7
(1M LIBOR + 0.370%) |
|
| | 7,650,000 | | | | 1.602 | | | | 08/08/24 | | | | 7,677,542 | |
| Evergreen Credit Card Trust Series 2016-1, Class A(a)
(1M LIBOR + 0.720%) |
|
| | 2,550,000 | | | | 1.954 | | | | 04/15/20 | | | | 2,557,673 | |
| | Golden Credit Card Trust Series 2017-4A, Class A(a) | |
| | 11,200,000 | | | | 1.754 | | | | 07/15/24 | | | | 11,211,389 | |
| Trillium Credit Card Trust II Series 2016-1A, Class A(a)
(1M LIBOR + 0.720%) |
|
| | 2,800,000 | | | | 1.958 | | | | 05/26/21 | | | | 2,804,269 | |
| | | | | | | | | | | | | | |
| | | | | | | | | | | | | 58,092,882 | |
| | |
| Student Loan – 16.8% | |
| Academic Loan Funding Trust Series 2013-1, Class A(a)
(1M USD LIBOR + 0.800%) |
|
| | 2,738,838 | | | | 2.034 | | | | 12/26/44 | | | | 2,727,103 | |
| Access Group, Inc. Series 2005-2, Class A3
(3M USD LIBOR + 0.180%) |
|
| | 734,684 | | | | 1.352 | | | | 11/22/24 | | | | 734,681 | |
| | |
| Asset-Backed Securities – (continued) | |
| Student Loan – (continued) | |
| Access Group, Inc. Series 2013-1, Class A(a)
(1M USD LIBOR + 0.500%) |
|
| 1,229,998 | | | | 1.734 | | | | 02/25/36 | | | | 1,223,189 | |
| Access Group, Inc. Series 2015-1, Class A(a)
(1M USD LIBOR + 0.700%) |
|
| | 1,362,090 | | | | 1.934 | | | | 07/25/56 | | | | 1,363,760 | |
| Access to Loans for Learning Student Loan Corp. Series 2013-I,
Class A (1M USD LIBOR + 0.800%) |
|
| | 2,237,537 | | | | 2.034 | | | | 02/25/41 | | | | 2,236,853 | |
| Bank of America Student Loan Trust Series 2010-1A, Class A(a)
(3M USD LIBOR + 0.800%) |
|
| | 1,404,172 | | | | 1.956 | | | | 02/25/43 | | | | 1,411,024 | |
| Brazos Higher Education Authority, Inc. Series 2011-1, Class A2
(3M USD LIBOR + 0.800%) |
|
| | 290,472 | | | | 1.989 | | | | 02/25/30 | | | | 291,963 | |
| ECMC Group Student Loan Trust Series 2016-1A, Class A(a)
(1M USD LIBOR + 1.350%) |
|
| | 1,502,584 | | | | 2.584 | | | | 07/26/66 | | | | 1,503,528 | |
| Education Loan Asset-Backed Trust I Series 2013-1, Class A1(a)
(1M USD LIBOR + 0.800%) |
|
| | 2,142,391 | | | | 2.034 | | | | 06/25/26 | | | | 2,144,622 | |
| Education Loan Asset-Backed Trust I Series 2013-1, Class A2(a)
(1M USD LIBOR + 0.800%) |
|
| | 3,000,000 | | | | 2.034 | | | | 04/26/32 | | | | 2,952,443 | |
| Educational Funding of the South, Inc. Series 2012-1, Class A
(1M USD LIBOR + 1.050%) |
|
| | 2,221,939 | | | | 2.284 | | | | 03/25/36 | | | | 2,233,147 | |
| Educational Services of America, Inc. Series 2010-1, Class A1(a)
(3M USD LIBOR + 0.850%) |
|
| | 1,342,343 | | | | 2.006 | | | | 07/25/23 | | | | 1,343,207 | |
| Educational Services of America, Inc. Series 2012-1, Class A1(a)
(1M USD LIBOR + 1.150%) |
|
| | 2,465,306 | | | | 2.384 | | | | 09/25/40 | | | | 2,500,909 | |
| Educational Services of America, Inc. Series 2014-1, Class A(a)
(1M USD LIBOR + 0.700%) |
|
| | 2,222,325 | | | | 1.934 | | | | 02/25/39 | | | | 2,194,076 | |
| EFS Volunteer No. 2 LLC Series 2012-1, Class A2(a) (1M USD
LIBOR + 1.350%) |
|
| | 1,950,000 | | | | 2.584 | | | | 03/25/36 | | | | 1,977,446 | |
| EFS Volunteer No. 3 LLC Series 2012-1, Class A3(a) (1M USD
LIBOR + 1.000%) |
|
| | 1,200,000 | | | | 2.234 | | | | 04/25/33 | | | | 1,199,999 | |
| GCO Education Loan Funding Master Trust-II Series 2006-2A,
Class A3L(a) (3M USD LIBOR + 0.120%) |
|
| | 66,918 | | | | 1.309 | | | | 08/25/28 | | | | 66,909 | |
| GCO Education Loan Funding Trust Series 2006-1, Class A8L
(3M USD LIBOR + 0.130%) |
|
| | 8,446,989 | | | | 1.319 | | | | 05/25/25 | | | | 8,430,165 | |
| GCO Education Loan Funding Trust Series 2007-1A,
Class A6L(a) (3M LIBOR + 0.110%) |
|
| | 1,894,533 | | | | 1.427 | | | | 11/25/26 | | | | 1,882,713 | |
| Goal Capital Funding Trust Series 2007-1, Class A3
(3M USD LIBOR + 0.090%) |
|
| | 1,866,384 | | | | 1.386 | | | | 09/25/28 | | | | 1,865,562 | |
| Goal Capital Funding Trust Series 2010-1, Class A(a)
(3M USD LIBOR + 0.700%) |
|
| | 58,167 | | | | 1.889 | | | | 08/25/48 | | | | 57,664 | |
| | |
| | |
| 56 | | The accompanying notes are an integral part of these financial statements. |
GOLDMAN SACHS HIGH QUALITY FLOATING RATE FUND
| | | | | | | | | | | | | | |
Principal
Amount | | | Interest
Rate | | | Maturity
Date | | | Value | |
| Asset-Backed Securities – (continued) | |
| Student Loan – (continued) | |
| Higher Education Funding I Series 2005-1, Class A4
(3M USD LIBOR + 0.140%) |
|
| $ | 123,562 | | | | 1.329 | % | | | 02/25/30 | | | $ | 123,529 | |
| Higher Education Funding I Series 2014-1, Class A(a)
(3M USD LIBOR + 1.050%) |
|
| | 1,500,054 | | | | 2.239 | | | | 05/25/34 | | | | 1,494,048 | |
| Illinois Student Assistance Commission Series 2010-1, Class A3
(3M USD LIBOR + 0.900%) |
|
| | 1,150,000 | | | | 2.056 | | | | 07/25/45 | | | | 1,153,748 | |
| Kentucky Higher Education Student Loan Corp. Series 2015-1,
Class A1 (1M USD LIBOR + 0.750%) |
|
| | 4,590,768 | | | | 1.982 | | | | 12/01/31 | | | | 4,573,323 | |
| Knowledgeworks Foundation Student Loan Series 2010-1,
Class A (3M USD LIBOR + 0.950%) |
|
| | 1,594,154 | | | | 2.139 | | | | 02/25/42 | | | | 1,602,279 | |
| Massachusetts Educational Financing Authority Series 2008-1,
Class A1 (3M USD LIBOR + 0.950%) |
|
| | 578,035 | | | | 2.106 | | | | 04/25/38 | | | | 582,689 | |
| Missouri Higher Education Loan Authority Series 2010-2,
Class A1 (3M USD LIBOR + 0.850%) |
|
| | 2,920,033 | | | | 2.039 | | | | 08/27/29 | | | | 2,939,596 | |
| Montana Higher Education Student Assistance Corp.
Series 2012-1, Class A2 (1M USD LIBOR + 1.000%) |
|
| | 3,376,123 | | | | 2.231 | | | | 05/20/30 | | | | 3,394,062 | |
| Navient Student Loan Trust Series 2016-5A, Class A(a)
(1M USD LIBOR + 1.250%) |
|
| | 3,298,359 | | | | 2.484 | | | | 06/25/65 | | | | 3,364,512 | |
| Navient Student Loan Trust Series 2016-7A, Class A(a)
(1M USD LIBOR + 1.150%) |
|
| | 1,627,813 | | | | 2.384 | | | | 03/25/66 | | | | 1,647,535 | |
| NCUA Guaranteed Notes Series 2010-A1, Class A
(1M LIBOR + 0.350%) |
|
| | 218,316 | | | | 1.582 | | | | 12/07/20 | | | | 218,460 | |
| Nelnet Student Loan Trust Series 2005-4, Class A3
(3M USD LIBOR + 0.130%) |
|
| | 246,793 | | | | 1.417 | | | | 06/22/26 | | | | 246,708 | |
| Nelnet Student Loan Trust Series 2006-1, Class A5
(3M USD LIBOR + 0.110%) |
|
| | 7,526,347 | | | | 1.296 | | | | 08/23/27 | | | | 7,505,218 | |
| Nelnet Student Loan Trust Series 2006-2, Class A5
(3M USD LIBOR + 0.100%) |
|
| | 2,039,082 | | | | 1.256 | | | | 01/25/30 | | | | 2,036,401 | |
| Nelnet Student Loan Trust Series 2013-5A, Class A(a)
(1M USD LIBOR + 0.630%) |
|
| | 662,941 | | | | 1.864 | | | | 01/25/37 | | | | 658,091 | |
| Nelnet Student Loan Trust Series 2014-4A, Class A1(a)
(1M USD LIBOR + 0.540%) |
|
| | 10,613,405 | | | | 1.774 | | | | 11/27/39 | | | | 10,657,944 | |
| North Carolina State Education Assistance Authority
Series 2010-1, Class A1 (3M USD LIBOR + 0.900%) |
|
| | 764,680 | | | | 2.056 | | | | 07/25/41 | | | | 761,989 | |
| Northstar Education Finance, Inc. Series 2012-1, Class A(a)
(1M USD LIBOR + 0.700%) |
|
| | 711,149 | | | | 1.934 | | | | 12/26/31 | | | | 705,581 | |
| Rhode Island Student Loan Authority Series 2012-1, Class A1
(1M USD LIBOR + 0.900%) |
|
| | 2,206,441 | | | | 2.132 | | | | 07/01/31 | | | | 2,197,985 | |
| | |
| Asset-Backed Securities – (continued) | |
| Student Loan – (continued) | |
| Scholar Funding Trust Series 2010-A, Class A(a)
(3M USD LIBOR + 0.750%) |
|
| 695,206 | | | | 1.922 | | | | 10/28/41 | | | | 690,669 | |
| Scholar Funding Trust Series 2013-A, Class A(a)
(1M USD LIBOR + 0.650%) |
|
| | 2,731,389 | | | | 1.884 | | | | 01/30/45 | | | | 2,703,655 | |
| SLC Student Loan Center Series 2011-1, Class A(a)
(1M USD LIBOR + 1.220%) |
|
| | 1,189,763 | | | | 2.454 | | | | 10/25/27 | | | | 1,205,841 | |
| SLC Student Loan Trust Series 2005-1, Class A3
(3M USD LIBOR + 0.100%) |
|
| | 7,509,794 | | | | 1.282 | | | | 02/15/25 | | | | 7,502,356 | |
| SLC Student Loan Trust Series 2010-1, Class A
(3M USD LIBOR + 0.875%) |
|
| | 826,868 | | | | 2.064 | | | | 11/25/42 | | | | 839,170 | |
| SLM Student Loan Trust Series 2003-12, Class A5(a)
(3M USD LIBOR + 0.280%) |
|
| | 349,521 | | | | 1.526 | | | | 09/15/22 | | | | 349,715 | |
| SLM Student Loan Trust Series 2003-14, Class A5
(3M USD LIBOR + 0.230%) |
|
| | 174,993 | | | | 1.386 | | | | 01/25/23 | | | | 175,079 | |
| SLM Student Loan Trust Series 2004-1, Class A3
(3M USD LIBOR + 0.210%) |
|
| | 792,345 | | | | 1.366 | | | | 04/25/23 | | | | 792,582 | |
| SLM Student Loan Trust Series 2004-8A, Class A5(a)
(3M USD LIBOR + 0.500%) |
|
| | 1,134,585 | | | | 1.656 | | | | 04/25/24 | | | | 1,138,215 | |
| SLM Student Loan Trust Series 2005-5, Class A4
(3M USD LIBOR + 0.140%) |
|
| | 11,250,000 | | | | 1.296 | | | | 10/25/28 | | | | 11,194,362 | |
| SLM Student Loan Trust Series 2005-9, Class A6
(3M USD LIBOR + 0.550%) |
|
| | 1,873,342 | | | | 1.706 | | | | 10/26/26 | | | | 1,878,167 | |
| SLM Student Loan Trust Series 2006-2, Class A5
(3M USD LIBOR + 0.110%) |
|
| | 665,461 | | | | 1.266 | | | | 07/25/25 | | | | 665,427 | |
| SLM Student Loan Trust Series 2008-2, Class A3
(3M USD LIBOR + 0.750%) |
|
| | 644,844 | | | | 1.906 | | | | 04/25/23 | | | | 643,700 | |
| SLM Student Loan Trust Series 2008-5, Class A4
(3M USD LIBOR + 1.700%) |
|
| | 648,050 | | | | 2.856 | | | | 07/25/23 | | | | 666,678 | |
| SLM Student Loan Trust Series 2012-3, Class A
(1M USD LIBOR + 0.650%) |
|
| | 1,141,058 | | | | 1.884 | | | | 12/26/25 | | | | 1,149,791 | |
| SLM Student Loan Trust Series 2013-3, Class A2
(1M USD LIBOR + 0.300%) |
|
| | 60,240 | | | | 1.534 | | | | 05/26/20 | | | | 60,267 | |
| SLM Student Loan Trust Series 2014-1, Class A2
(1M USD LIBOR + 0.380%) |
|
| | 89,861 | | | | 1.614 | | | | 07/26/21 | | | | 89,893 | |
| South Texas Higher Education Authority, Inc. Series 2012-1,
Class A2 (3M USD LIBOR + 0.850%) |
|
| | 678,892 | | | | 1.998 | | | | 10/01/24 | | | | 681,382 | |
| Utah State Board of Regents Series 2011-1, Class A3 (3M USD
LIBOR + 0.850%) |
|
| | 900,000 | | | | 2.020 | | | | 05/01/35 | | | | 888,831 | |
| | |
| | |
| The accompanying notes are an integral part of these financial statements. | | 57 |
GOLDMAN SACHS HIGH QUALITY FLOATING RATE FUND
Schedule of Investments (continued)
September 30, 2017 (Unaudited)
| | | | | | | | | | | | | | |
Principal
Amount | | | Interest
Rate | | | Maturity
Date | | | Value | |
| Asset-Backed Securities – (continued) | |
| Student Loan – (continued) | |
| Utah State Board of Regents Series 2015-1, Class A (1M USD
LIBOR + 0.600%) |
|
| $ | 2,715,132 | | | | 1.834 | % | | | 02/25/43 | | | $ | 2,709,046 | |
| Wachovia Student Loan Trust Series 2005-1, Class A5 (3M USD
LIBOR + 0.130%) |
|
| | 174,505 | | | | 1.286 | | | | 01/26/26 | | | | 174,450 | |
| | | | | | | | | | | | | | |
| | | | | | | | | | | | | 122,403,937 | |
| | |
| | TOTAL ASSET-BACKED SECURITIES | |
| | (Cost $318,654,602) | | | $ | 319,868,006 | |
| | |
| | | | | | | | | | | | | | |
| Municipal Debt Obligations – 2.5% | |
| Alaska(d) – 0.3% | |
| | Alaska State Student Loan Corp. Series 2013, Class A | |
| $ | 2,008,210 | | | | 1.734 | % | | | 08/25/31 | | | $ | 1,977,093 | |
| | |
| New Hampshire(d) – 0.6% | |
| New Hampshire Higher Education Loan Corp. Series 2011-1,
Class A3 |
|
| | 1,300,000 | | | | 2.010 | | | | 10/25/37 | | | | 1,271,582 | |
| New Hampshire State Higher Education Loan Corp. (Taxable –
Student Loan) Series 2012-1 |
|
| | 2,908,033 | | | | 1.734 | | | | 10/25/28 | | | | 2,904,805 | |
| | | | | | | | | | | | | | |
| | | | | | | | | | | | | 4,176,387 | |
| | |
| New York(a) – 0.1% | |
| FHLMC Multifamily ML Certificates Trust RB (Pass – Through)
Series 2017-ML01 |
|
| | 900,871 | | | | 1.737 | | | | 01/25/33 | | | | 901,794 | |
| | |
| Rhode Island(d) – 0.1% | |
| Rhode Island Student Loan Authority RB (Taxable – FFELP
Loan Backed) Series 2014-1 |
|
| | 565,741 | | | | 1.932 | | | | 10/02/28 | | | | 565,985 | |
| | |
| Utah(d) – 1.4% | |
| Utah State Board of Regents RB (Taxable-Student Loan)
Series 2012-1 |
|
| | 9,535,422 | | | | 1.984 | | | | 12/26/31 | | | | 9,596,353 | |
| Utah State Board of Regents Student Loan RB (Taxable)
Series 2011-A2 |
|
| | 750,104 | | | | 2.020 | | | | 05/01/29 | | | | 752,444 | |
| | | | | | | | | | | | | | |
| | | | | | | | | | | | | 10,348,797 | |
| | |
| | TOTAL MUNICIPAL DEBT OBLIGATIONS | |
| | (Cost $17,977,414) | | | $ | 17,970,056 | |
| | |
| | | | | | | | | | | | | | |
| U.S. Treasury Obligations – 2.6% | |
| | United States Treasury Inflation Indexed Bonds | |
| $ | 8,577,657 | | | | 0.125 | % | | | 04/15/18 | | | $ | 8,584,776 | |
| | 5,696,940 | | | | 0.125 | | | | 04/15/20 | | | | 5,726,735 | |
| | 4,647,825 | | | | 0.125 | | | | 04/15/21 | | | | 4,662,930 | |
| | |
| | TOTAL U.S. TREASURY OBLIGATIONS | |
| | (Cost $19,015,701) | | | $ | 18,974,441 | |
| | |
| U.S. Treasury Obligations – (continued) | |
| TOTAL INVESTMENTS BEFORE SHORT-TERM
INVESTMENT |
|
| | (Cost $695,495,243) | | | $ | 697,173,212 | |
| | |
| | | | | | | | | | | | | | |
| Short-term Investment(e) – 3.7% | |
| Repurchase Agreements – 3.7% | |
| | Joint Repurchase Agreement Account II | |
| $ | 27,100,000 | | | | 1.072 | % | | | 10/02/17 | | | $ | 27,100,000 | |
| | (Cost $27,100,000) | | | | | |
| | |
| | TOTAL INVESTMENTS – 99.2% | |
| | (Cost $722,595,243) | | | $ | 724,273,212 | |
| | |
| OTHER ASSETS IN EXCESS OF
LIABILITIES – 0.8% |
| | | 5,514,210 | |
| | |
| | NET ASSETS – 100.0% | | | $ | 729,787,422 | |
| | |
| | |
| The percentage shown for each investment category reflects the value of investments in that category as a percentage of net assets. |
(a) | | Exempt from registration under Rule 144A of the Securities Act of 1933. Such securities may be deemed liquid by the investment adviser and may be resold, normally to qualified institutional buyers in transactions exempt from registration. Total market value of Rule 144A securities amounts to $200,253,577, which represents approximately 27.4% of net assets as of September 30, 2017 and are unaudited. |
(b) | | Security with a notional or nominal principal amount. The actual effective yield of this security is different than the stated interest rate. |
(c) | | Guaranteed by the United States Government until maturity. Total market value for these securities amounts to $4,089,440, which represents approximately 0.6% of net assets as of September 30, 2017. |
(d) | | Security with “Call” features with resetting interest rates. Maturity dates disclosed are the final maturity dates. |
(e) | | Joint repurchase agreement was entered into on September 29, 2017. Additional information appears on page 93. |
| | |
|
| Currency Abbreviations: |
USD | | —U.S. Dollar |
| | |
Investment Abbreviations: |
ACES | | —Alternative Credit Enhancement Securities |
CLO | | —Collateralized Loan Obligation |
CMT | | —Constant Maturity Treasury Indexes |
COF | | —Cost of Funds |
FHLMC | | —Federal Home Loan Mortgage Corp. |
FNMA | | —Federal National Mortgage Association |
GNMA | | —Government National Mortgage Association |
LIBOR | | —London Interbank Offered Rate |
LLC | | —Limited Liability Company |
LP | | —Limited Partnership |
MTA | | —Monthly Treasury Average |
NCUA | | —National Credit Union Administration |
RB | | —Revenue Bond |
REMIC | | —Real Estate Mortgage Investment Conduit |
STRIPS | | —Separate Trading of Registered Interest and Principal of Securities |
|
| | |
| 58 | | The accompanying notes are an integral part of these financial statements. |
GOLDMAN SACHS HIGH QUALITY FLOATING RATE FUND
|
| ADDITIONAL INVESTMENT INFORMATION |
FUTURES CONTRACTS — At September 30, 2017, the Fund had the following futures contracts:
| | | | | | | | | | | | | | |
| Description | | Number of
Contracts | | | Expiration
Date | | Notional
Amount | | | Unrealized
Appreciation/
(Depreciation) | |
Long position contracts: | | | | | | | | | | | | | | |
Ultra Long U.S. Treasury Bonds | | | (43 | ) | | 12/19/17 | | $ | (7,100,375 | ) | | $ | 122,042 | |
Ultra 10 Year U.S. Treasury Notes | | | (26 | ) | | 12/19/17 | | | (3,492,531 | ) | | | 40,907 | |
2 Year U.S. Treasury Notes | | | (24 | ) | | 12/29/17 | | | (5,176,875 | ) | | | 14,959 | |
5 Year U.S. Treasury Notes | | | (394 | ) | | 12/29/17 | | | (46,295,000 | ) | | | 304,963 | |
20 Year U.S. Treasury Bonds | | | (30 | ) | | 12/19/17 | | | (4,584,375 | ) | | | 64,973 | |
| Total | | | | | | | | | | | | $ | 547,844 | |
Short position contracts: | | | | | | | | | | | | | | |
10 Year U.S. Treasury Notes | | | 276 | | | 12/19/17 | | | 34,586,250 | | | | (373,322 | ) |
| TOTAL FUTURES CONTRACTS | | | | | | | | | | | | $ | 174,522 | |
| | |
| The accompanying notes are an integral part of these financial statements. | | 59 |
GOLDMAN SACHS INFLATION PROTECTED SECURITIES FUND
Schedule of Investments
September 30, 2017 (Unaudited)
| | | | | | | | | | | | | | |
Principal
Amount | | | Interest
Rate | | | Maturity
Date | | | Value | |
| U.S. Treasury Obligations – 96.2% | |
| | United States Treasury Inflation Indexed Bonds | |
| $ | 3,343,008 | | | | 0.125 | % | | | 04/15/19 | | | $ | 3,356,480 | |
| | 22,012,224 | | | | 1.875 | | | | 07/15/19 | | | | 22,939,379 | |
| | 20,877,756 | | | | 1.250 | | | | 07/15/20 | | | | 21,758,171 | |
| | 46,013,468 | | | | 0.125 | | | | 04/15/21 | | | | 46,163,011 | |
| | 14,268,032 | | | | 0.625 | | | | 01/15/24 | | | | 14,577,648 | |
| | 4,278,401 | | | | 0.125 | (a) | | | 07/15/24 | | | | 4,237,927 | |
| | 60,563,686 | | | | 0.250 | (a) | | | 01/15/25 | | | | 59,999,232 | |
| | 4,934,870 | | | | 2.375 | | | | 01/15/25 | | | | 5,641,198 | |
| | 26,090,119 | | | | 0.375 | | | | 07/15/25 | | | | 26,111,774 | |
| | 43,217,729 | | | | 0.625 | | | | 01/15/26 | | | | 43,822,777 | |
| | 3,574,340 | | | | 0.125 | | | | 07/15/26 | | | | 3,477,940 | |
| | 22,062,096 | | | | 2.500 | | | | 01/15/29 | | | | 26,651,012 | |
| | 4,077,216 | | | | 2.125 | | | | 02/15/40 | | | | 5,137,211 | |
| | 31,835,805 | | | | 1.375 | | | | 02/15/44 | | | | 35,174,745 | |
| | 9,491,789 | | | | 0.875 | | | | 02/15/47 | | | | 9,363,080 | |
| | United States Treasury Strip Coupon(b) | |
| | 19,800,000 | | | | 0.000 | | | | 11/15/34 | | | | 12,385,891 | |
| | 3,000,000 | | | | 0.000 | | | | 11/15/40 | | | | 1,533,990 | |
| | |
| | TOTAL U.S. TREASURY OBLIGATIONS | |
| | (Cost $341,722,455) | | | $ | 342,331,466 | |
| | |
| | | | | | | | | | |
| Shares | | | Distribution
Rate | | | Value | |
| Investment Company(c) – 1.6% | |
| Goldman Sachs Financial Square Government Fund –
Institutional Shares |
|
| | 5,846,883 | | | | 0.927 | % | | $ | 5,846,883 | |
| | (Cost $5,846,883) | | | | | |
| | |
| | TOTAL INVESTMENTS – 97.8% | |
| | (Cost $347,569,338) | | | $ | 348,178,349 | |
| | |
| OTHER ASSETS IN EXCESS OF
LIABILITIES – 2.2% |
| | | 7,696,757 | |
| | |
| | NET ASSETS – 100.0% | | | $ | 355,875,106 | |
| | |
| | |
| The percentage shown for each investment category reflects the value of investments in that category as a percentage of net assets. |
(a) | | All or a portion of security is segregated as collateral for initial margin requirements on futures transactions. |
(b) | | Issued with a zero coupon. Income is recognized through the accretion of discount. |
(c) | | Represents Affiliated Issuer. |
| | |
|
Currency Abbreviations: |
CAD | | —Canadian Dollar |
USD | | —U.S. Dollar |
| | |
Investment Abbreviations: |
CDOR | | —Canadian Dollar Offered Rate |
LIBOR | | —London Interbank Offered Rate |
LLC | | —Limited Liability Company |
PLC | | —Public Limited Company |
|
| | |
| 60 | | The accompanying notes are an integral part of these financial statements. |
GOLDMAN SACHS INFLATION PROTECTED SECURITIES FUND
|
| ADDITIONAL INVESTMENT INFORMATION |
FUTURES CONTRACTS — At September 30, 2017, the Fund had the following futures contracts:
| | | | | | | | | | | | | | | | |
| Description | | Number of
Contracts | | | Expiration
Date | | | Notional
Amount | | | Unrealized
Appreciation/
(Depreciation) | |
Long position contracts: | |
2 Year U.S. Treasury Notes | | | 110 | | | | 12/29/17 | | | | $23,727,344 | | | $ | (70,623 | ) |
5 Year U.S. Treasury Notes | | | 162 | | | | 12/29/17 | | | | 19,035,000 | | | | (102,890 | ) |
10 Year U.S. Treasury Notes | | | 564 | | | | 12/19/17 | | | | 70,676,250 | | | | (733,425 | ) |
| Total | | | | | | | | | | | | | | $ | (906,938 | ) |
Short position contracts: | |
Eurodollars | | | (45 | ) | | | 03/19/18 | | | | (11,071,125 | ) | | | 9,571 | |
Eurodollars | | | (41 | ) | | | 06/18/18 | | | | (10,075,750 | ) | | | 5,992 | |
Eurodollars | | | (39 | ) | | | 09/17/18 | | | | (9,576,450 | ) | | | 1,860 | |
Eurodollars | | | (65 | ) | | | 12/17/18 | | | | (15,946,938 | ) | | | (2,238 | ) |
Eurodollars | | | (39 | ) | | | 03/18/19 | | | | (9,563,775 | ) | | | (2,040 | ) |
Eurodollars | | | (39 | ) | | | 06/17/19 | | | | (9,559,388 | ) | | | (3,015 | ) |
Eurodollars | | | (39 | ) | | | 09/16/19 | | | | (9,555,487 | ) | | | (4,965 | ) |
Eurodollars | | | (39 | ) | | | 12/16/19 | | | | (9,549,637 | ) | | | 28,672 | |
Eurodollars | | | (39 | ) | | | 03/16/20 | | | | (9,546,712 | ) | | | 29,160 | |
U.S. Long Bonds | | | (214 | ) | | | 12/19/17 | | | | (32,701,875 | ) | | | 470,768 | |
Ultra Long U.S. Treasury Bonds | | | (68 | ) | | | 12/19/17 | | | | (11,228,500 | ) | | | 184,291 | |
Ultra 10 Year U.S. Treasury Notes | | | (207 | ) | | | 12/19/17 | | | | (27,805,922 | ) | | | 289,170 | |
| Total | | | | | | | | | | | | | | $ | 1,007,226 | |
| TOTAL FUTURES CONTRACTS | | | | | | | | | | | | | | $ | 100,288 | |
SWAP CONTRACTS — At September 30, 2017, the Fund had the following swap contracts:
OVER THE COUNTER INTEREST RATE SWAP CONTRACTS
| | | | | | | | | | | | | | | | | | |
Payments Made by
the Fund(a) | | Payments
Received by
the Fund | | | Counterparty | | Termination
Date | | | Notional
Amount | | | Unrealized
Appreciation/
(Depreciation)* | |
| 1.697% | | | 3M LIBOR | | | BoA Securities LLC | | | 06/02/21 | | | $ | 9,400 | | | $ | 161,407 | |
| 1.475 | | | 3M LIBOR | | | BoA Securities LLC | | | 08/03/21 | | | | 4,200 | | | | 105,529 | |
| 1.492 | | | 3M LIBOR | | | BoA Securities LLC | | | 08/15/21 | | | | 4,200 | | | | 98,970 | |
| 3M LIBOR | | | 1.880% | | | BoA Securities LLC | | | 06/02/26 | | | | 9,400 | | | | (216,590 | ) |
| 3M LIBOR | | | 1.700 | | | BoA Securities LLC | | | 08/03/26 | | | | 2,100 | | | | (79,896 | ) |
| 3M LIBOR | | | 1.713 | | | BoA Securities LLC | | | 08/15/26 | | | | 2,100 | | | | (76,006 | ) |
| 1.667 | | | 3M LIBOR | | | Barclays Bank PLC | | | 06/20/19 | | | | 3,900 | | | | 41,426 | |
| 1.642 | | | 3M LIBOR | | | Barclays Bank PLC | | | 07/08/19 | | | | 10,000 | | | | 102,478 | |
| 1.702 | | | 3M LIBOR | | | JPMorgan Securities, Inc. | | | 05/26/19 | | | | 9,300 | | | | 100,880 | |
| TOTAL | | | | | | | | | | | | | | | | $ | 238,198 | |
| | * | | There are no upfront payments on the swap contracts, therefore the unrealized gain (loss) on the swap contracts is equal to their market value. |
| | (a) | | Payments made annually. |
| | |
| The accompanying notes are an integral part of these financial statements. | | 61 |
GOLDMAN SACHS INFLATION PROTECTED SECURITIES FUND
Schedule of Investments (continued)
September 30, 2017 (Unaudited)
|
| ADDITIONAL INVESTMENT INFORMATION (continued) |
CENTRALLY CLEARED INTEREST RATE SWAP CONTRACTS
| | | | | | | | | | | | | | | | | | | | | | | | |
| Payments Made by the Fund | | Payments
Received
by Fund | | | Termination
Date | | | Notional
Amount | | | Value | | | Upfront
Premium
(Received) Paid | | | Unrealized
Appreciation/
(Depreciation) | |
1.515%(a) | | | 3M LIBOR | | | | 09/06/21 | | | $ | 2,200 | | | $ | 48,186 | | | $ | 16 | | | $ | 48,170 | |
1.579(a) | | | 3M LIBOR | | | | 09/13/21 | | | | 3,300 | | | | 63,760 | | | | 24 | | | | 63,736 | |
2.015(a) | | | 3M LIBOR | | | | 11/14/21 | | | | 5,300 | | | | (4,724 | ) | | | 40 | | | | (4,764 | ) |
6M CDOR(b) | | | 2.028% | | | | 07/18/22 | | | CAD | 6,810 | (c) | | | (37,794 | ) | | | (39,441 | ) | | | 1,647 | |
2.197(d) | | | 3M LIBOR | | | | 02/22/23 | | | $ | 18,000 | | | | (241,899 | ) | | | 168 | | | | (242,067 | ) |
2.142(b) | | | 3M LIBOR(e) | | | | 07/03/23 | | | | 4,580 | (c) | | | (200 | ) | | | 20,925 | | | | (21,125 | ) |
3M LIBOR(e) | | | 2.065(b) | | | | 08/06/23 | | | | 13,010 | (c) | | | (55,850 | ) | | | 6,258 | | | | (62,108 | ) |
2.057(a) | | | 3M LIBOR | | | | 04/21/24 | | | | 6,500 | | | | (42,290 | ) | | | 82 | | | | (42,372 | ) |
2.060(a) | | | 3M LIBOR | | | | 04/21/24 | | | | 15,300 | | | | (102,229 | ) | | | 192 | | | | (102,421 | ) |
2.120(d) | | | 3M LIBOR | | | | 05/02/24 | | | | 13,200 | | | | (139,754 | ) | | | 166 | | | | (139,920 | ) |
2.100(a) | | | 3M LIBOR | | | | 05/03/24 | | | | 10,100 | | | | (91,467 | ) | | | 127 | | | | (91,594 | ) |
2.110(a) | | | 3M LIBOR | | | | 05/03/24 | | | | 11,700 | | | | (114,180 | ) | | | 148 | | | | (114,328 | ) |
3M LIBOR(a) | | | 1.740 | | | | 09/06/26 | | | | 2,200 | | | | (72,801 | ) | | | 30 | | | | (72,831 | ) |
3M LIBOR(a) | | | 1.780 | | | | 09/13/26 | | | | 3,300 | | | | (98,421 | ) | | | 45 | | | | (98,466 | ) |
3M LIBOR(a) | | | 2.239 | | | | 11/14/26 | | | | 5,300 | | | | 73,684 | | | | 74 | | | | 73,610 | |
3M LIBOR(a) | | | 2.170 | | | | 04/21/27 | | | | 10,600 | | | | 109,478 | | | | 154 | | | | 109,324 | |
3M LIBOR(a) | | | 2.175 | | | | 04/21/27 | | | | 6,500 | | | | 70,397 | | | | 94 | | | | 70,303 | |
3M LIBOR(d) | | | 2.233 | | | | 05/02/27 | | | | 9,200 | | | | 149,806 | | | | 134 | | | | 149,672 | |
3M LIBOR(d) | | | 2.212 | | | | 05/03/27 | | | | 7,000 | | | | 98,602 | | | | 102 | | | | 98,500 | |
3M LIBOR(a) | | | 2.215 | | | | 05/03/27 | | | | 7,000 | | | | 100,365 | | | | 102 | | | | 100,263 | |
3M LIBOR(a) | | | 2.225 | | | | 05/03/27 | | | | 8,200 | | | | 125,834 | | | | 119 | | | | 125,715 | |
3M LIBOR(e) | | | 2.378(b) | | | | 07/03/28 | | | | 17,030 | (a) | | | (2,105 | ) | | | (26,481 | ) | | | 24,376 | |
2.346(b) | | | 3M LIBOR(e) | | | | 08/06/28 | | | | 7,340 | (a) | | | 28,304 | | | | (8,372 | ) | | | 36,676 | |
2.560(b) | | | 3M LIBOR(e) | | | | 07/03/48 | | | | 7,060 | (a) | | | 10,589 | | | | 4,910 | | | | 5,679 | |
2.540(b) | | | 6M CDOR | | | | 07/18/48 | | | CAD | 1,010 | (a) | | | 25,602 | | | | 19,591 | | | | 6,011 | |
| TOTAL | | | | | | | | | | | | | | $ | (99,107 | ) | | $ | (20,793 | ) | | $ | (78,314 | ) |
| | (a) | | Payments made annually. |
| | (b) | | Payments made semi-annually. |
| | (c) | | Represents forward starting interest rate swaps whose effective dates of commencement of accruals and cash flows occur subsequent to September 30, 2017. |
| | (d) | | Payments made at maturity. |
| | (e) | | Payments made quarterly. |
OPTIONS ON FUTURES CONTRACTS — At September 30, 2017 the Fund had following options contracts:
| | | | | | | | | | | | | | | | | | | | | | | | | | | | | | |
| Description | | Counterparty | | Exercise
Price | | | Expiration
Date | | | Number of
Contracts | | | Notional Amount | | | Market Value | | | Premiums
Paid (Received)
by Fund | | | Unrealized
Appreciation/ (Depreciation) | |
Puts: | | | | | | | | | | | | | | | | | | | | | | | | | | | | | | |
| Eurodollar Futures | | MS & Co. LLC | | $ | 98.00 | | | | 06/15/18 | | | | 42 | | | $ | 105,000 | | | $ | 16,275 | | | $ | 11,645 | | | $ | 4,630 | |
| | |
|
Abbreviation |
BoA Securities LLC | | —Bank of America Securities LLC |
MS & Co. LLC | | —Morgan Stanley & Co. LLC |
|
| | |
| 62 | | The accompanying notes are an integral part of these financial statements. |
GOLDMAN SACHS SHORT DURATION GOVERNMENT FUND
Schedule of Investments
September 30, 2017 (Unaudited)
| | | | | | | | | | | | | | |
Principal
Amount | | | Interest
Rate | | | Maturity
Date | | | Value | |
| Corporate Obligations – 1.0% | |
| Sovereign – 1.0% | |
| | NCUA Guaranteed Notes Series A4 | |
| $ | 11,000,000 | | | | 3.000 | % | | | 06/12/19 | | | $ | 11,237,595 | |
| | |
| | | | | | | | | | | | | | |
| Mortgage-Backed Obligations – 43.4% | |
| Collateralized Mortgage Obligations – 4.8% | |
| Interest Only(a) – 0.0% | |
| | FHLMC REMIC Series 1161, Class U | |
| $ | 97 | | | | 1,172.807 | % | | | 11/15/21 | | | $ | 1,285 | |
| FHLMC REMIC Series 4273, Class PS (-1x1M LIBOR +
6.100%) |
|
| | 1,692,805 | | | | 4.866 | | | | 11/15/43 | | | | 277,951 | |
| | | | | | | | | | | | | | |
| | | | | 279,236 | |
| | |
| Inverse Floaters – 0.0% | |
| FNMA REMIC Series 1990-134, Class SC (-1x1M LIBOR +
21.600%) |
|
| | 4,691 | | | | 19.748 | | | | 11/25/20 | | | | 5,579 | |
| | |
| Regular Floater – 2.3% | |
| | FNMA REMIC Series 2007-33, Class HF (1M LIBOR + 0.350%) | |
| | 445,549 | | | | 1.584 | | | | 04/25/37 | | | | 446,586 | |
| NCUA Guaranteed Notes Series 2010-R1, Class 1A
(1M LIBOR + 0.450%) |
|
| | 2,133,494 | | | | 1.688 | | | | 10/07/20 | | | | 2,138,661 | |
| NCUA Guaranteed Notes Series 2010-R2, Class 1A
(1M LIBOR + 0.370%) |
|
| | 2,715,551 | | | | 1.608 | | | | 11/06/17 | | | | 2,715,551 | |
| NCUA Guaranteed Notes Series 2011-R1, Class 1A
(1M LIBOR + 0.450%) |
|
| | 2,647,712 | | | | 1.688 | | | | 01/08/20 | | | | 2,652,780 | |
| NCUA Guaranteed Notes Series 2011-R2, Class 1A
(1M LIBOR + 0.400%) |
|
| | 9,383,295 | | | | 1.638 | | | | 02/06/20 | | | | 9,395,757 | |
| NCUA Guaranteed Notes Series 2011-R3, Class 1A
(1M LIBOR + 0.400%) |
|
| | 7,712,429 | | | | 1.637 | | | | 03/11/20 | | | | 7,722,973 | |
| NCUA Guaranteed Notes Series 2011-R4, Class 1A
(1M LIBOR + 0.380%) |
|
| | 295,002 | | | | 1.611 | | | | 03/06/20 | | | | 295,002 | |
| | | | | | | | | | | | | | |
| | | | | 25,367,310 | |
| | |
| Sequential Fixed Rate – 0.5% | |
| FDIC Structured Sale Guaranteed Notes Series 2010-S1,
Class 2A(b) |
|
| | 3,456,161 | | | | 3.250 | | | | 04/25/38 | | | | 3,479,520 | |
| | FHLMC REMIC Series 108, Class G | |
| | 4,859 | | | | 8.500 | | | | 12/15/20 | | | | 5,082 | |
| | FHLMC REMIC Series 1980, Class Z | |
| | 377,704 | | | | 7.000 | | | | 07/15/27 | | | | 428,177 | |
| | FHLMC REMIC Series 2019, Class Z | |
| | 321,943 | | | | 6.500 | | | | 12/15/27 | | | | 351,133 | |
| | FHLMC REMIC Series 2755, Class ZA | |
| | 781,081 | | | | 5.000 | | | | 02/15/34 | | | | 855,930 | |
| | | | | | | | | | | | | | |
| | | | | 5,119,842 | |
| | |
| Mortgage-Backed Obligations – (continued) | |
| Sequential Fixed Rate – 2.0% | |
| | FHLMC REMIC Series 3530, Class DB | |
| 4,292,524 | | | | 4.000 | | | | 05/15/24 | | | | 4,474,260 | |
| | FHLMC REMIC Series 4273, Class PD | |
| | 1,300,875 | | | | 6.500 | | | | 11/15/43 | | | | 1,501,227 | |
| | FHLMC REMIC Series 4619, Class NA | |
| | 5,154,466 | | | | 3.000 | | | | 03/15/44 | | | | 5,255,900 | |
| | FNMA REMIC Series 1989-66, Class J | |
| | 31,111 | | | | 7.000 | | | | 09/25/19 | | | | 31,757 | |
| | FNMA REMIC Series 1990-16, Class E | |
| | 42,658 | | | | 9.000 | | | | 03/25/20 | | | | 44,945 | |
| | FNMA REMIC Series 2012-111, Class B | |
| | 533,997 | | | | 7.000 | | | | 10/25/42 | | | | 614,251 | |
| | FNMA REMIC Series 2012-153, Class B | |
| | 1,957,334 | | | | 7.000 | | | | 07/25/42 | | | | 2,270,981 | |
| | FNMA REMIC Series 2015-30, Class EA | |
| | 8,312,994 | | | | 3.000 | | | | 05/25/45 | | | | 8,483,672 | |
| | | | | | | | | | | | | | |
| | | | | 22,676,993 | |
| | |
| Sequential Floating Rate – 0.0% | |
| | FNMA REMIC Series 1988-12, Class A | |
| | 155 | | | | 4.738 | | | | 02/25/18 | | | | 156 | |
| | FNMA REMIC Series 1988-12, Class B | |
| | 80 | | | | 0.000 | | | | 02/25/18 | | | | 79 | |
| | | | | | | | | | | | | | |
| | | | | 235 | |
| | |
| TOTAL COLLATERALIZED MORTGAGE
OBLIGATIONS |
| | $ | 53,449,195 | |
| | |
| Commercial Mortgage-Backed Securities – 7.4% | |
| Sequential Fixed Rate – 3.2% | |
| FHLMC Multifamily Structured Pass Through Certificates
Series K716, Class A2 |
|
| $ | 16,100,000 | | | | 3.130 | % | | | 06/25/21 | | | $ | 16,651,504 | |
| FHLMC Multifamily Structured Pass Through Certificates
Series K717, Class A2 |
|
| | 18,600,000 | | | | 2.991 | | | | 09/25/21 | | | | 19,176,544 | |
| | | | | | | | | | | | | | |
| | | | | 35,828,048 | |
| | |
| Sequential Floating Rate – 4.2% | |
| FHLMC Multifamily Structured Pass-Through Certificates
Series KF02, Class A1 (1M LIBOR + 0.380%) |
|
| | 1,222,842 | | | | 1.612 | | | | 07/25/20 | | | | 1,222,766 | |
| | FNMA ACES Series 2014-M1, Class ASQ2 | |
| | 22,025,402 | | | | 2.323 | | | | 11/25/18 | | | | 22,074,250 | |
| FHLMC Multifamily Structured Pass Through Certificates
Series KF03, Class A (1M LIBOR + 0.340%) |
|
| | 2,208,588 | | | | 1.572 | | | | 01/25/21 | | | | 2,207,897 | |
| FHLMC Multifamily Structured Pass Through Certificates
Series KP02, Class A2 |
|
| | 21,325,387 | | | | 2.355 | | | | 04/25/21 | | | | 21,488,750 | |
| | | | | | | | | | | | | | |
| | | | | 46,993,663 | |
| | |
| TOTAL COMMERCIAL MORTGAGE-
BACKED SECURITIES |
| | $ | 82,821,711 | |
| | |
| | |
| The accompanying notes are an integral part of these financial statements. | | 63 |
GOLDMAN SACHS SHORT DURATION GOVERNMENT FUND
Schedule of Investments (continued)
September 30, 2017 (Unaudited)
| | | | | | | | | | | | | | |
Principal
Amount | | | Interest
Rate | | | Maturity
Date | | | Value | |
| Mortgage-Backed Obligations – (continued) | |
| Federal Agencies – 31.2% | |
| Adjustable Rate FHLMC – 1.0% | |
| | (3 year CMT + 1.365%) | |
| $ | 5,402 | | | | 2.365 | % | | | 05/01/18 | | | $ | 5,390 | |
| | (3 year CMT + 2.155%) | |
| | 5,042 | | | | 3.102 | | | | 10/01/25 | | | | 5,089 | |
| | (12M USD LIBOR + 1.840%) | |
| | 368,991 | | | | 3.356 | | | | 11/01/34 | | | | 383,135 | |
| | (1 year CMT + 2.250%) | |
| | 1,461,581 | | | | 3.033 | | | | 06/01/35 | | | | 1,543,570 | |
| | (12M USD LIBOR + 2.304%) | |
| | 133,314 | | | | 4.060 | | | | 05/01/36 | | | | 141,543 | |
| | (6M USD LIBOR + 1.842%) | |
| | 38,528 | | | | 3.205 | | | | 10/01/36 | | | | 39,794 | |
| | (12M USD LIBOR + 2.000%) | |
| | 38,824 | | | | 3.500 | | | | 11/01/36 | | | | 41,221 | |
| | (12M USD LIBOR + 1.738%) | |
| | 787,001 | | | | 2.538 | | | | 06/01/42 | | | | 810,132 | |
| | (12M USD LIBOR + 1.610%) | |
| | 7,987,456 | | | | 2.559 | | | | 11/01/44 | | | | 8,144,284 | |
| | | | | | | | | | | | | | |
| | | | | 11,114,158 | |
| | |
| Adjustable Rate FNMA – 1.4% | |
| | (6M Avicola Gaesti SA) | |
| | 1,971 | | | | 2.885 | | | | 06/01/18 | | | | 1,972 | |
| | (1 year CMT + 2.896%) | |
| | 7,672 | | | | 6.686 | | | | 05/01/20 | | | | 7,932 | |
| | (3 year CMT + 2.195%) | |
| | 960 | | | | 3.195 | | | | 01/01/23 | | | | 960 | |
| | (1 year CMT + 2.017%) | |
| | 21,066 | | | | 3.641 | | | | 02/01/27 | | | | 21,190 | |
| | (COF + 1.770%) | |
| | 93,604 | | | | 2.427 | | | | 08/01/29 | | | | 94,707 | |
| | (1 year CMT + 2.255%) | |
| | 45,403 | | | | 3.380 | | | | 07/01/32 | | | | 47,927 | |
| | (12M USD LIBOR + 1.755%) | |
| | 33,295 | | | | 3.505 | | | | 07/01/32 | | | | 35,034 | |
| | (12M USD LIBOR + 1.225%) | |
| | 26,716 | | | | 2.600 | | | | 01/01/33 | | | | 27,510 | |
| | (12M USD LIBOR + 1.800%) | |
| | 1,112,597 | | | | 3.633 | | | | 05/01/33 | | | | 1,169,782 | |
| | (6M USD LIBOR + 2.250%) | |
| | 148,858 | | | | 3.750 | | | | 08/01/33 | | | | 157,644 | |
| | (COF + 1.250%) | |
| | 856,566 | | | | 4.613 | | | | 08/01/33 | | | | 913,207 | |
| | (1 year CMT + 2.288%) | |
| | 660,615 | | | | 3.019 | | | | 02/01/34 | | | | 687,191 | |
| | (12M USD LIBOR + 1.720%) | |
| | 544,289 | | | | 3.487 | | | | 05/01/34 | | | | 570,135 | |
| | (12M USD LIBOR + 1.695%) | |
| | 332,363 | | | | 3.570 | | | | 05/01/34 | | | | 350,094 | |
| | (1 year CMT + 2.220%) | |
| | 504,267 | | | | 3.226 | | | | 06/01/34 | | | | 532,870 | |
| | (12M USD LIBOR + 1.671%) | |
| | 399,758 | | | | 2.921 | | | | 10/01/34 | | | | 418,880 | |
| | (12M USD LIBOR + 1.695%) | |
| | 296,224 | | | | 3.181 | | | | 10/01/34 | | | | 311,907 | |
| | |
| Mortgage-Backed Obligations – (continued) | |
| Adjustable Rate FNMA – (continued) | |
| | (12M USD LIBOR + 1.506%) | |
| 569,335 | | | | 3.155 | | | | 02/01/35 | | | | 586,823 | |
| | (12M USD LIBOR + 1.554%) | |
| | 95,836 | | | | 3.179 | | | | 02/01/35 | | | | 100,401 | |
| | (12M USD LIBOR + 1.650%) | |
| | 248,477 | | | | 3.399 | | | | 03/01/35 | | | | 261,376 | |
| | (12M USD LIBOR + 1.720%) | |
| | 599,121 | | | | 3.425 | | | | 03/01/35 | | | | 631,853 | |
| | (12M USD LIBOR + 1.325%) | |
| | 846,712 | | | | 3.068 | | | | 04/01/35 | | | | 879,448 | |
| | (12M USD LIBOR + 1.720%) | |
| | 330,390 | | | | 3.470 | | | | 04/01/35 | | | | 348,523 | |
| | (12M USD LIBOR + 1.431%) | |
| | 254,807 | | | | 3.143 | | | | 05/01/35 | | | | 265,263 | |
| | (12M USD LIBOR + 1.525%) | |
| | 133,173 | | | | 3.316 | | | | 05/01/35 | | | | 139,449 | |
| | (1 year CMT + 2.055%) | |
| | 326,691 | | | | 2.662 | | | | 10/01/35 | | | | 342,445 | |
| | (12M USD LIBOR + 1.700%) | |
| | 814,672 | | | | 3.427 | | | | 03/01/36 | | | | 860,367 | |
| | (12M MTA + 2.343%) | |
| | 374,003 | | | | 3.185 | | | | 04/01/36 | | | | 390,888 | |
| | (12M USD LIBOR + 1.945%) | |
| | 1,020,184 | | | | 3.697 | | | | 04/01/36 | | | | 1,080,494 | |
| | (12M MTA + 2.333%) | |
| | 597,340 | | | | 3.177 | | | | 06/01/36 | | | | 624,324 | |
| | (12M USD LIBOR + 1.900%) | |
| | 1,004,135 | | | | 3.654 | | | | 06/01/36 | | | | 1,061,220 | |
| | (12M MTA + 2.322%) | |
| | 1,372,946 | | | | 3.162 | | | | 07/01/36 | | | | 1,434,223 | |
| | (12M USD LIBOR + 1.935%) | |
| | 204,592 | | | | 3.435 | | | | 11/01/36 | | | | 215,847 | |
| | (12M USD LIBOR + 1.789%) | |
| | 1,087,137 | | | | 3.538 | | | | 07/01/37 | | | | 1,143,613 | |
| | (12M USD LIBOR + 1.820%) | |
| | 54,265 | | | | 3.412 | | | | 12/01/46 | | | | 57,614 | |
| | | | | | | | | | | | | | |
| | | | | 15,773,113 | |
| | |
| Adjustable Rate GNMA – 0.4% | |
| | (1 year CMT + 1.500%) | |
| | 213,749 | | | | 2.625 | | | | 05/20/34 | | | | 219,346 | |
| | 447,266 | | | | 2.125 | | | | 07/20/34 | | | | 459,417 | |
| | 308,347 | | | | 2.125 | | | | 08/20/34 | | | | 316,396 | |
| | 2,506,526 | | | | 2.125 | | | | 09/20/34 | | | | 2,574,812 | |
| | 289,100 | | | | 2.250 | | | | 10/20/34 | | | | 296,321 | |
| | 396,482 | | | | 2.250 | | | | 12/20/34 | | | | 406,430 | |
| | | | | | | | | | | | | | |
| | | | | 4,272,722 | |
| | |
| FHLMC – 1.3% | |
| | 172,645 | | | | 5.500 | | | | 01/01/20 | | | | 177,244 | |
| | 93,782 | | | | 7.000 | | | | 04/01/22 | | | | 98,545 | |
| | 1,613 | | | | 4.500 | | | | 05/01/23 | | | | 1,709 | |
| | 12,624 | | | | 7.500 | | | | 01/01/31 | | | | 13,604 | |
| | 56,900 | | | | 4.500 | | | | 07/01/33 | | | | 61,429 | |
| | 1,453,475 | | | | 4.500 | | | | 08/01/33 | | | | 1,569,170 | |
| | 2,915,638 | | | | 4.500 | | | | 09/01/33 | | | | 3,147,722 | |
| | |
| | |
| 64 | | The accompanying notes are an integral part of these financial statements. |
GOLDMAN SACHS SHORT DURATION GOVERNMENT FUND
| | | | | | | | | | | | | | |
Principal
Amount | | | Interest
Rate | | | Maturity
Date | | | Value | |
| Mortgage-Backed Obligations – (continued) | |
| FHLMC – (continued) | |
| $ | 282,176 | | | | 4.500 | % | | | 10/01/33 | | | $ | 304,637 | |
| | 9,926 | | | | 4.500 | | | | 04/01/34 | | | | 10,683 | |
| | 6,672 | | | | 4.500 | | | | 04/01/35 | | | | 7,180 | |
| | 3,089 | | | | 4.500 | | | | 07/01/35 | | | | 3,313 | |
| | 13,571 | | | | 4.500 | | | | 08/01/35 | | | | 14,596 | |
| | 57,615 | | | | 4.500 | | | | 09/01/35 | | | | 61,967 | |
| | 23,713 | | | | 4.500 | | | | 10/01/35 | | | | 25,462 | |
| | 2,741 | | | | 4.500 | | | | 12/01/35 | | | | 2,940 | |
| | 1,816 | | | | 4.500 | | | | 05/01/36 | | | | 1,955 | |
| | 1,858 | | | | 6.000 | | | | 06/01/36 | | | | 2,077 | |
| | 165,988 | | | | 4.500 | | | | 01/01/38 | | | | 178,651 | |
| | 2,422 | | | | 4.500 | | | | 04/01/38 | | | | 2,598 | |
| | 885 | | | | 4.500 | | | | 05/01/38 | | | | 948 | |
| | 9,654 | | | | 4.500 | | | | 06/01/38 | | | | 10,367 | |
| | 252,171 | | | | 4.500 | | | | 09/01/38 | | | | 272,513 | |
| | 5,894 | | | | 4.500 | | | | 01/01/39 | | | | 6,336 | |
| | 146,660 | | | | 4.500 | | | | 02/01/39 | | | | 157,801 | |
| | 1,771,237 | | | | 7.000 | | | | 02/01/39 | | | | 2,061,793 | |
| | 66,256 | | | | 4.500 | | | | 03/01/39 | | | | 71,418 | |
| | 17,029 | | | | 4.500 | | | | 04/01/39 | | | | 18,356 | |
| | 443,891 | | | | 4.500 | | | | 05/01/39 | | | | 478,478 | |
| | 1,226,726 | | | | 4.500 | | | | 06/01/39 | | | | 1,322,309 | |
| | 43,085 | | | | 4.500 | | | | 07/01/39 | | | | 46,442 | |
| | 66,826 | | | | 4.500 | | | | 08/01/39 | | | | 72,033 | |
| | 84,954 | | | | 4.500 | | | | 09/01/39 | | | | 91,574 | |
| | 15,869 | | | | 4.500 | | | | 10/01/39 | | | | 17,105 | |
| | 30,375 | | | | 4.500 | | | | 11/01/39 | | | | 32,742 | |
| | 55,309 | | | | 4.500 | | | | 12/01/39 | | | | 59,619 | |
| | 48,524 | | | | 4.500 | | | | 01/01/40 | | | | 52,305 | |
| | 12,287 | | | | 4.500 | | | | 02/01/40 | | | | 13,231 | |
| | 35,909 | | | | 4.500 | | | | 04/01/40 | | | | 38,653 | |
| | 58,099 | | | | 4.500 | | | | 05/01/40 | | | | 62,513 | |
| | 66,346 | | | | 4.500 | | | | 06/01/40 | | | | 71,387 | |
| | 59,700 | | | | 4.500 | | | | 07/01/40 | | | | 64,235 | |
| | 56,856 | | | | 4.500 | | | | 08/01/40 | | | | 61,177 | |
| | 35,989 | | | | 4.500 | | | | 09/01/40 | | | | 38,723 | |
| | 13,952 | | | | 4.500 | | | | 10/01/40 | | | | 15,012 | |
| | 25,124 | | | | 4.500 | | | | 02/01/41 | | | | 27,041 | |
| | 46,938 | | | | 4.500 | | | | 03/01/41 | | | | 50,579 | |
| | 128,436 | | | | 4.500 | | | | 04/01/41 | | | | 138,398 | |
| | 117,262 | | | | 4.500 | | | | 05/01/41 | | | | 126,358 | |
| | 221,947 | | | | 4.500 | | | | 06/01/41 | | | | 239,164 | |
| | 16,201 | | | | 4.500 | | | | 07/01/41 | | | | 17,458 | |
| | 559,789 | | | | 4.500 | | | | 08/01/41 | | | | 603,196 | |
| | 599,887 | | | | 4.500 | | | | 09/01/41 | | | | 645,491 | |
| | 33,960 | | | | 4.500 | | | | 12/01/41 | | | | 36,594 | |
| | 419,782 | | | | 4.500 | | | | 03/01/42 | | | | 452,346 | |
| | 1,000,000 | | | | 3.500 | | | | TBA-30yr | (c) | | | 1,031,094 | |
| | | | | | | | | | | | | | |
| | | | | | | | | | | | | 14,190,271 | |
| | |
| FNMA – 25.6% | |
| | 142 | | | | 5.500 | | | | 01/01/18 | | | | 143 | |
| | 6,735,690 | | | | 2.800 | | | | 03/01/18 | | | | 6,730,505 | |
| | 47,010,508 | | | | 3.725 | | | | 06/01/18 | | | | 47,057,124 | |
| | 22,546 | | | | 5.500 | | | | 07/01/18 | | | | 22,802 | |
| | 2,037 | | | | 5.500 | | | | 08/01/18 | | | | 2,045 | |
| | |
| Mortgage-Backed Obligations – (continued) | |
| FNMA – (continued) | |
| 24,457 | | | | 5.500 | | | | 09/01/18 | | | | 24,771 | |
| | 15,800,000 | | | | 2.960 | | | | 11/01/18 | | | | 15,903,520 | |
| | 4,450 | | | | 5.500 | | | | 12/01/18 | | | | 4,525 | |
| | 3,426 | | | | 5.500 | | | | 01/01/19 | | | | 3,494 | |
| | 3,007 | | | | 5.500 | | | | 03/01/19 | | | | 3,067 | |
| | 302 | | | | 5.500 | | | | 08/01/19 | | | | 302 | |
| | 2,861 | | | | 5.000 | | | | 09/01/19 | | | | 2,940 | |
| | 5,404 | | | | 7.000 | | | | 11/01/19 | | | | 5,440 | |
| | 36,411,094 | | | | 4.313 | | | | 07/01/21 | | | | 38,916,138 | |
| | 890,924 | | | | 5.500 | | | | 09/01/23 | | | | 944,025 | |
| | 228,278 | | | | 5.500 | | | | 10/01/23 | | | | 242,779 | |
| | 1,547,710 | | | | 6.000 | | | | 02/01/24 | | | | 1,740,880 | |
| | 2,439 | | | | 7.000 | | | | 12/01/24 | | | | 2,703 | |
| | 678,426 | | | | 6.000 | | | | 08/01/26 | | | | 763,101 | |
| | 114,002 | | | | 6.000 | | | | 10/01/26 | | | | 128,256 | |
| | 882 | | | | 7.000 | | | | 08/01/27 | | | | 1,007 | |
| | 223,368 | | | | 6.000 | | | | 11/01/27 | | | | 251,298 | |
| | 1,642,703 | | | | 6.000 | | | | 02/01/28 | | | | 1,847,729 | |
| | 750,919 | | | | 6.000 | | | | 07/01/28 | | | | 844,641 | |
| | 183,685 | | | | 6.000 | | | | 08/01/28 | | | | 206,611 | |
| | 308,855 | | | | 6.000 | | | | 09/01/28 | | | | 347,404 | |
| | 998 | | | | 7.000 | | | | 10/01/28 | | | | 1,072 | |
| | 16,550 | | | | 6.000 | | | | 01/01/29 | | | | 18,616 | |
| | 849 | | | | 7.000 | | | | 01/01/29 | | | | 949 | |
| | 54,467 | | | | 6.000 | | | | 03/01/29 | | | | 61,277 | |
| | 704,959 | | | | 4.500 | | | | 09/01/29 | | | | 757,866 | |
| | 360 | | | | 7.000 | | | | 11/01/29 | | | | 362 | |
| | 611 | | | | 7.000 | | | | 04/01/31 | | | | 663 | |
| | 25,812 | | | | 6.000 | | | | 12/01/31 | | | | 29,081 | |
| | 6,612 | | | | 7.000 | | | | 05/01/32 | | | | 7,280 | |
| | 5,336 | | | | 7.000 | | | | 06/01/32 | | | | 5,762 | |
| | 1,071 | | | | 7.000 | | | | 08/01/32 | | | | 1,263 | |
| | 90,495 | | | | 6.000 | | | | 09/01/32 | | | �� | 102,433 | |
| | 44,447 | | | | 6.000 | | | | 10/01/32 | | | | 50,415 | |
| | 42,510 | | | | 6.000 | | | | 11/01/32 | | | | 48,054 | |
| | 18,521 | | | | 6.000 | | | | 02/01/33 | | | | 20,964 | |
| | 27,561 | | | | 6.000 | | | | 03/01/33 | | | | 31,290 | |
| | 4,325 | | | | 6.000 | | | | 04/01/33 | | | | 4,907 | |
| | 1,093,612 | | | | 6.500 | | | | 04/01/33 | | | | 1,270,468 | |
| | 3,294 | | | | 6.000 | | | | 11/01/33 | | | | 3,740 | |
| | 1,080 | | | | 7.000 | | | | 04/01/34 | | | | 1,261 | |
| | 32,033,202 | | | | 6.000 | | | | 05/01/34 | | | | 36,294,431 | |
| | 69,477 | | | | 6.000 | | | | 07/01/34 | | | | 79,272 | |
| | 5,389 | | | | 6.000 | | | | 10/01/34 | | | | 6,130 | |
| | 138,805 | | | | 6.000 | | | | 01/01/35 | | | | 158,372 | |
| | 108,121 | | | | 6.000 | | | | 03/01/35 | | | | 122,826 | |
| | 1,923,645 | | | | 6.000 | | | | 04/01/35 | | | | 2,177,514 | |
| | 185,869 | | | | 6.000 | | | | 05/01/35 | | | | 211,661 | |
| | 271,014 | | | | 6.000 | | | | 06/01/35 | | | | 309,276 | |
| | 35,218 | | | | 6.000 | | | | 08/01/35 | | | | 40,284 | |
| | 107,557 | | | | 6.000 | | | | 09/01/35 | | | | 122,723 | |
| | 771,137 | | | | 6.000 | | | | 11/01/35 | | | | 880,088 | |
| | 976,161 | | | | 6.000 | | | | 12/01/35 | | | | 1,112,018 | |
| | 1,772,540 | | | | 6.000 | | | | 01/01/36 | | | | 2,030,106 | |
| | 658,808 | | | | 6.000 | | | | 02/01/36 | | | | 749,447 | |
| | |
| | |
| The accompanying notes are an integral part of these financial statements. | | 65 |
GOLDMAN SACHS SHORT DURATION GOVERNMENT FUND
Schedule of Investments (continued)
September 30, 2017 (Unaudited)
| | | | | | | | | | | | | | |
Principal
Amount | | | Interest
Rate | | | Maturity
Date | | | Value | |
| Mortgage-Backed Obligations – (continued) | |
| FNMA – (continued) | |
| $ | 348,536 | | | | 6.000 | % | | | 03/01/36 | | | $ | 396,320 | |
| | 2,828,663 | | | | 6.000 | | | | 04/01/36 | | | | 3,215,242 | |
| | 422,270 | | | | 6.000 | | | | 05/01/36 | | | | 480,527 | |
| | 517,478 | | | | 6.000 | | | | 06/01/36 | | | | 588,773 | |
| | 996,070 | | | | 6.000 | | | | 07/01/36 | | | | 1,130,265 | |
| | 4,976,444 | | | | 6.000 | | | | 08/01/36 | | | | 5,669,603 | |
| | 1,254,497 | | | | 6.000 | | | | 09/01/36 | | | | 1,419,182 | |
| | 2,090,931 | | | | 6.000 | | | | 10/01/36 | | | | 2,379,856 | |
| | 677,584 | | | | 4.500 | | | | 11/01/36 | | | | 730,965 | |
| | 3,426,138 | | | | 6.000 | | | | 11/01/36 | | | | 3,901,890 | |
| | 685,601 | | | | 6.000 | | | | 12/01/36 | | | | 777,664 | |
| | 7,680 | | | | 6.000 | | | | 01/01/37 | | | | 8,719 | |
| | 245,754 | | | | 6.000 | | | | 02/01/37 | | | | 279,580 | |
| | 579,286 | | | | 6.000 | | | | 03/01/37 | | | | 657,690 | |
| | 362,453 | | | | 6.000 | | | | 04/01/37 | | | | 411,226 | |
| | 9,615,300 | | | | 6.000 | | | | 05/01/37 | | | | 10,938,351 | |
| | 566,666 | | | | 6.000 | | | | 07/01/37 | | | | 643,234 | |
| | 1,103,437 | | | | 6.000 | | | | 08/01/37 | | | | 1,252,903 | |
| | 724,653 | | | | 6.000 | | | | 09/01/37 | | | | 823,622 | |
| | 222,885 | | | | 6.000 | | | | 10/01/37 | | | | 253,602 | |
| | 240,449 | | | | 7.500 | | | | 10/01/37 | | | | 267,586 | |
| | 496,617 | | | | 6.000 | | | | 11/01/37 | | | | 561,756 | |
| | 3,812,811 | | | | 6.000 | | | | 12/01/37 | | | | 4,328,973 | |
| | 4,437,341 | | | | 6.000 | | | | 01/01/38 | | | | 5,037,778 | |
| | 2,863,852 | | | | 6.000 | | | | 02/01/38 | | | | 3,249,432 | |
| | 470,717 | | | | 6.000 | | | | 03/01/38 | | | | 538,446 | |
| | 7,254 | | | | 6.000 | | | | 04/01/38 | | | | 8,244 | |
| | 9,332,547 | | | | 6.000 | | | | 05/01/38 | | | | 10,590,998 | |
| | 94,888 | | | | 6.000 | | | | 06/01/38 | | | | 107,879 | |
| | 10,800,105 | | | | 6.000 | | | | 07/01/38 | | | | 12,260,883 | |
| | 208,289 | | | | 6.000 | | | | 08/01/38 | | | | 236,701 | |
| | 959,245 | | | | 6.000 | | | | 09/01/38 | | | | 1,089,728 | |
| | 141,499 | | | | 6.000 | | | | 10/01/38 | | | | 160,715 | |
| | 1,169,309 | | | | 6.000 | | | | 11/01/38 | | | | 1,317,206 | |
| | 1,039,150 | | | | 6.000 | | | | 12/01/38 | | | | 1,164,968 | |
| | 154,672 | | | | 6.000 | | | | 01/01/39 | | | | 175,978 | |
| | 165,316 | | | | 4.500 | | | | 02/01/39 | | | | 177,838 | |
| | 1,016,831 | | | | 7.000 | | | | 03/01/39 | | | | 1,178,244 | |
| | 150,214 | | | | 4.500 | | | | 04/01/39 | | | | 162,128 | |
| | 296,275 | | | | 6.000 | | | | 04/01/39 | | | | 336,579 | |
| | 12,782 | | | | 4.500 | | | | 08/01/39 | | | | 13,956 | |
| | 627,783 | | | | 6.000 | | | | 08/01/39 | | | | 713,092 | |
| | 4,796,393 | | | | 6.000 | | | | 09/01/39 | | | | 5,445,473 | |
| | 1,162,289 | | | | 6.000 | | | | 10/01/39 | | | | 1,319,997 | |
| | 43,737 | | | | 6.000 | | | | 11/01/39 | | | | 49,669 | |
| | 1,049,059 | | | | 6.000 | | | | 01/01/40 | | | | 1,190,780 | |
| | 2,476 | | | | 6.000 | | | | 02/01/40 | | | | 2,812 | |
| | 115,426 | | | | 6.000 | | | | 03/01/40 | | | | 131,145 | |
| | 17,392 | | | | 6.000 | | | | 04/01/40 | | | | 19,753 | |
| | 1,186,609 | | | | 6.000 | | | | 06/01/40 | | | | 1,347,977 | |
| | 528,939 | | | | 6.000 | | | | 07/01/40 | | | | 600,428 | |
| | 116,279 | | | | 6.000 | | | | 09/01/40 | | | | 132,171 | |
| | 851,860 | | | | 6.000 | | | | 10/01/40 | | | | 966,993 | |
| | 663,323 | | | | 6.000 | | | | 11/01/40 | | | | 754,527 | |
| | |
| Mortgage-Backed Obligations – (continued) | |
| FNMA – (continued) | |
| 32,283 | | | | 6.000 | | | | 04/01/41 | | | | 36,608 | |
| | 11,103 | | | | 4.500 | | | | 05/01/41 | | | | 11,978 | |
| | 25,877,121 | | | | 6.000 | | | | 05/01/41 | | | | 29,344,930 | |
| | 1,597,384 | | | | 6.000 | | | | 07/01/41 | | | | 1,815,298 | |
| | 681,828 | | | | 4.500 | | | | 08/01/41 | | | | 736,801 | |
| | 136,393 | | | | 4.500 | | | | 10/01/41 | | | | 147,138 | |
| | 129,017 | | | | 5.000 | | | | 02/01/42 | | | | 141,465 | |
| | 1,000,000 | | | | 3.500 | | | | TBA-30yr | (c) | | | 1,030,859 | |
| | | | | | | | | | | | | | |
| | | | | | | | | | | | | 287,574,245 | |
| | |
| GNMA – 1.5% | |
| | 74,224 | | | | 5.500 | | | | 07/15/20 | | | | 76,288 | |
| | 1,395 | | | | 6.500 | | | | 01/15/32 | | | | 1,540 | |
| | 7,451 | | | | 6.500 | | | | 02/15/32 | | | | 8,223 | |
| | 8,020 | | | | 6.500 | | | | 08/15/34 | | | | 9,119 | |
| | 16,145 | | | | 6.500 | | | | 05/15/35 | | | | 18,630 | |
| | 4,120 | | | | 6.500 | | | | 06/15/35 | | | | 4,723 | |
| | 12,105 | | | | 6.500 | | | | 07/15/35 | | | | 13,975 | |
| | 3,200 | | | | 6.500 | | | | 08/15/35 | | | | 3,699 | |
| | 6,896 | | | | 6.500 | | | | 09/15/35 | | | | 7,942 | |
| | 4,715 | | | | 6.500 | | | | 10/15/35 | | | | 5,446 | |
| | 22,621 | | | | 6.500 | | | | 11/15/35 | | | | 26,141 | |
| | 17,893 | | | | 6.500 | | | | 12/15/35 | | | | 20,528 | |
| | 32,388 | | | | 6.500 | | | | 01/15/36 | | | | 37,340 | |
| | 42,601 | | | | 6.500 | | | | 02/15/36 | | | | 49,205 | |
| | 42,463 | | | | 6.500 | | | | 03/15/36 | | | | 49,072 | |
| | 75,581 | | | | 6.500 | | | | 04/15/36 | | | | 86,577 | |
| | 125,491 | | | | 6.500 | | | | 05/15/36 | | | | 144,912 | |
| | 96,722 | | | | 6.500 | | | | 06/15/36 | | | | 111,681 | |
| | 393,326 | | | | 6.500 | | | | 07/15/36 | | | | 450,147 | |
| | 385,092 | | | | 6.500 | | | | 08/15/36 | | | | 442,354 | |
| | 673,768 | | | | 6.500 | | | | 09/15/36 | | | | 774,653 | |
| | 251,857 | | | | 6.500 | | | | 10/15/36 | | | | 290,441 | |
| | 341,171 | | | | 6.500 | | | | 11/15/36 | | | | 390,250 | |
| | 150,944 | | | | 6.500 | | | | 12/15/36 | | | | 173,333 | |
| | 78,268 | | | | 6.500 | | | | 01/15/37 | | | | 90,597 | |
| | 25,922 | | | | 6.500 | | | | 02/15/37 | | | | 29,955 | |
| | 14,362 | | | | 6.500 | | | | 03/15/37 | | | | 16,608 | |
| | 35,602 | | | | 6.500 | | | | 04/15/37 | | | | 41,240 | |
| | 23,925 | | | | 6.500 | | | | 05/15/37 | | | | 26,404 | |
| | 17,864 | | | | 6.500 | | | | 08/15/37 | | | | 20,668 | |
| | 95,305 | | | | 6.500 | | | | 09/15/37 | | | | 109,804 | |
| | 89,860 | | | | 6.500 | | | | 10/15/37 | | | | 106,207 | |
| | 55,199 | | | | 6.500 | | | | 11/15/37 | | | | 63,112 | |
| | 1,418 | | | | 6.500 | | | | 02/15/38 | | | | 1,642 | |
| | 31,142 | | | | 6.500 | | | | 05/15/38 | | | | 35,973 | |
| | 870 | | | | 6.500 | | | | 08/15/38 | | | | 990 | |
| | 73,962 | | | | 6.000 | | | | 11/15/38 | | | | 85,108 | |
| | 20,374 | | | | 6.500 | | | | 11/15/38 | | | | 23,532 | |
| | 10,970 | | | | 6.500 | | | | 01/15/39 | | | | 12,517 | |
| | 19,149 | | | | 6.500 | | | | 02/15/39 | | | | 22,107 | |
| | 12,166,962 | | | | 4.000 | | | | 10/20/43 | | | | 12,912,189 | |
| | 654,654 | | | | 4.000 | | | | 10/20/45 | | | | 693,524 | |
| | | | | | | | | | | | | | |
| | | | | | | | | | | | | 17,488,396 | |
| | |
| | TOTAL FEDERAL AGENCIES | | | $ | 350,412,905 | |
| | |
| | |
| 66 | | The accompanying notes are an integral part of these financial statements. |
GOLDMAN SACHS SHORT DURATION GOVERNMENT FUND
| | | | | | | | | | | | | | |
Principal
Amount | | | Interest
Rate | | | Maturity
Date | | | Value | |
| Mortgage-Backed Obligations – (continued) | |
| TOTAL MORTGAGE-BACKED
OBLIGATIONS
(Cost $490,998,846) |
| | $ | 486,683,811 | |
| | |
| | | | | | | | | | | | | | |
| Agency Debentures – 5.3% | |
| | FHLB | |
| $ | 7,000,000 | | | | 1.875 | % | | | 03/13/20 | | | $ | 7,039,340 | |
| | 1,800,000 | | | | 5.375 | | | | 08/15/24 | | | | 2,135,106 | |
| | FNMA | |
| | 5,200,000 | | | | 6.250 | | | | 05/15/29 | | | | 7,002,476 | |
| | 16,080,000 | | | | 7.125 | | | | 01/15/30 | | | | 23,326,291 | |
| | Hashemite Kingdom of Jordan Government AID Bond(d) | |
| | 19,300,000 | | | | 2.503 | | | | 10/30/20 | | | | 19,731,548 | |
| | |
| TOTAL AGENCY DEBENTURES
(Cost $58,063,953) |
| | $ | 59,234,761 | |
| | |
| | | | | | | | | | | | | | |
| Asset-Backed Securities – 0.1% | |
| Other – 0.0% | | | | | | | | | | |
| | Small Business Administration | |
| $ | 9,371 | | | | 6.300 | % | | | 05/01/18 | | | $ | 9,461 | |
| | 11,676 | | | | 6.300 | | | | 06/01/18 | | | | 11,801 | |
| | | | | | | | | | | | | | |
| | | | | | | | | | | | | 21,262 | |
| | |
| Student Loan – 0.1% | |
| NCUA Guaranteed Notes Series 2010-A1, Class A
(1M LIBOR + 0.350%) |
|
| | 1,346,284 | | | | 1.582 | | | | 12/07/20 | | | | 1,347,168 | |
| | | | | | | | | | | | | | |
| | | | | | | | | | | | | 1,347,168 | |
| | |
| TOTAL ASSET-BACKED SECURITIES
(Cost $1,367,482) |
| | $ | 1,368,430 | |
| | |
| | | | | | | | | | | | | | |
| U.S. Treasury Obligations – 45.2% | |
| | United States Treasury Bonds(e) | |
| $ | 210,000 | | | | 3.000 | % | | | 11/15/45 | | | $ | 216,174 | |
| | 510,000 | | | | 3.000 | | | | 05/15/47 | | | | 524,877 | |
| | United States Treasury Inflation Indexed Bonds(e) | |
| | 15,778,653 | | | | 0.125 | | | | 04/15/18 | | | | 15,791,749 | |
| | United States Treasury Notes | |
| | 25,000,000 | | | | 1.250 | | | | 11/30/18 | | | | 24,960,750 | |
| | 92,890,000 | | | | 1.625 | (e) | | | 07/31/20 | | | | 92,955,023 | |
| | 25,800,000 | | | | 1.375 | | | | 09/30/20 | | | | 25,609,596 | |
| | 78,770,000 | | | | 1.750 | | | | 12/31/20 | | | | 78,926,750 | |
| | 13,700,000 | | | | 1.125 | | | | 02/28/21 | | | | 13,434,357 | |
| | 73,500,000 | | | | 1.250 | | | | 03/31/21 | | | | 72,315,180 | |
| | 71,000,000 | | | | 1.375 | | | | 04/30/21 | | | | 70,101,851 | |
| | 26,690,000 | | | | 1.125 | | | | 06/30/21 | | | | 26,075,329 | |
| | 47,200,000 | | | | 1.125 | | | | 07/31/21 | | | | 46,053,511 | |
| | 5,410,000 | | | | 2.125 | | | | 07/31/24 | | | | 5,401,993 | |
| U.S. Treasury Obligations – (continued) | |
| | United States Treasury Strip Coupon(f) | |
| 54,200,000 | | | | 0.000 | | | | 11/15/35 | | | | 32,854,415 | |
| | 2,800,000 | | | | 0.000 | | | | 05/15/36 | | | | 1,669,388 | |
| | |
| TOTAL U.S. TREASURY OBLIGATIONS
(Cost $510,541,256) |
| | $ | 506,890,943 | |
| | |
| | | | | | | | | | | | | | |
| | | | | | | | | | |
| Shares | | | Distribution
Rate | | | Value | |
| Investment Company(g) – 3.1% | |
| Goldman Sachs Financial Square Government Fund –
Institutional Shares |
|
| | 34,770,975 | | | | 0.927 | % | | $ | 34,770,975 | |
| (Cost $34,770,975) | | | | |
| | |
| | TOTAL INVESTMENTS – 98.1% | |
| | (Cost $1,106,739,799) | | | $ | 1,100,186,515 | |
| | |
| OTHER ASSETS IN EXCESS OF
LIABILITIES — 1.9% |
| | | 21,461,709 | |
| | |
| | NET ASSETS — 100.0% | | | $ | 1,121,648,224 | |
| | |
| | |
| The percentage shown for each investment category reflects the value of investments in that category as a percentage of net assets. |
(a) | | Security with a notional or nominal principal amount. The actual effective yield of this security is different than the stated interest rate. |
(b) | | Exempt from registration under Rule 144A of the Securities Act of 1933. Such securities may be deemed liquid by the investment adviser and may be resold, normally to qualified institutional buyers in transactions exempt from registration. Total market value of Rule 144A securities amounts to $3,479,520, which represents approximately 0.3% of net assets as of September 30, 2017 and are unaudited. |
(c) | | TBA (To Be Announced) Securities are purchased on a forward commitment basis with an approximate principal amount and no defined maturity date. The actual principal and maturity date will be determined upon settlement when the specific mortgage pools are assigned. Total market value of TBA securities (excluding forward sales contracts, if any) amounts to $2,061,953 which represents approximately 0.2% of net assets as of September 30, 2017. |
(d) | | Guaranteed by the United States Government until maturity. Total market value for these securities amounts to $19,731,548, which represents approximately 1.8% of net assets as of September 30, 2017. |
(e) | | All or a portion of security is segregated as collateral for initial margin requirements on futures transactions. |
(f) | | Issued with a zero coupon. Income is recognized through the accretion of discount. |
| (g) | | Represents an Affiliated Issuer. |
| | |
| The accompanying notes are an integral part of these financial statements. | | 67 |
GOLDMAN SACHS SHORT DURATION GOVERNMENT FUND
Schedule of Investments (continued)
September 30, 2017 (Unaudited)
| | |
|
Currency Abbreviation: |
USD | | —U.S. Dollar |
| | |
Investment Abbreviations: |
ACES | | —Alternative Credit Enhancement Securities |
CMT | | —Constant Maturity Treasury Indexes |
COF | | —Cost of Funds |
FDIC | | —Federal Deposit Insurance Corp. |
FHLB | | —Federal Home Loan Bank |
FHLMC | | —Federal Home Loan Mortgage Corp. |
FNMA | | —Federal National Mortgage Association |
GNMA | | —Government National Mortgage Association |
LIBOR | | —London Interbank Offered Rate |
MTA | | —Monthly Treasury Average |
NCUA | | —National Credit Union Administration |
REMIC | | —Real Estate Mortgage Investment Conduit |
|
| | |
| 68 | | The accompanying notes are an integral part of these financial statements. |
GOLDMAN SACHS SHORT DURATION GOVERNMENT FUND
|
| ADDITIONAL INVESTMENT INFORMATION |
FUTURES CONTRACTS — At September 30, 2017, the Fund had the following futures contracts:
| | | | | | | | | | | | | | | | |
| Description | | Number of
Contracts | | | Expiration
Date | | | Notional
Amount | | | Unrealized
Appreciation/
(Depreciation) | |
Long position contracts: | | | | | | | | | | | | | | | | |
2 Year U.S. Treasury Notes | | | 2,474 | | | | 12/29/17 | | | $ | 533,649,534 | | | $ | (1,540,517 | ) |
10 Year U.S. Treasury Notes | | | 139 | | | | 12/19/17 | | | | 17,418,437 | | | | (230,732 | ) |
Ultra Long U.S. Treasury Bonds | | | 49 | | | | 12/19/17 | | | | 8,091,125 | | | | (132,597 | ) |
| Total | | | $ | (1,903,846 | ) |
Short position contracts: | | | | | | | | | | | | | | | | |
Eurodollars | | | (136 | ) | | | 12/18/17 | | | | (33,496,800 | ) | | | 32,086 | |
Eurodollars | | | (497 | ) | | | 03/19/18 | | | | (122,274,425 | ) | | | 185,227 | |
Eurodollars | | | (226 | ) | | | 09/17/18 | | | | (55,494,300 | ) | | | 149,203 | |
Eurodollars | | | (158 | ) | | | 12/17/18 | | | | (38,763,325 | ) | | | (14,466 | ) |
Eurodollars | | | (181 | ) | | | 03/18/19 | | | | (44,385,725 | ) | | | 125,033 | |
Eurodollars | | | (146 | ) | | | 06/17/19 | | | | (35,786,425 | ) | | | 5,088 | |
Eurodollars | | | (532 | ) | | | 09/16/19 | | | | (130,346,650 | ) | | | 383,321 | |
Eurodollars | | | (317 | ) | | | 12/16/19 | | | | (77,621,412 | ) | | | 242,118 | |
Eurodollars | | | (641 | ) | | | 03/16/20 | | | | (156,908,788 | ) | | | 273,597 | |
Eurodollars | | | (636 | ) | | | 06/15/20 | | | | (155,637,150 | ) | | | 230,321 | |
Eurodollars | | | (274 | ) | | | 09/14/20 | | | | (67,027,250 | ) | | | (224,583 | ) |
Eurodollars | | | (274 | ) | | | 12/14/20 | | | | (66,993,000 | ) | | | (233,446 | ) |
Eurodollars | | | (23 | ) | | | 03/15/21 | | | | (5,621,775 | ) | | | (19,316 | ) |
5 Year U.S. Treasury Notes | | | (840 | ) | | | 12/29/17 | | | | (98,700,000 | ) | | | 779,649 | |
Ultra 10 Year U.S. Treasury Notes | | | (202 | ) | | | 12/19/17 | | | | (27,134,281 | ) | | | 317,819 | |
U.S. Long Bonds | | | (376 | ) | | | 12/19/17 | | | | (57,457,500 | ) | | | 815,032 | |
| Total | | | $ | 3,046,683 | |
| TOTAL FUTURES CONTRACTS | | | $ | 1,142,837 | |
SWAP CONTRACTS — At September 30, 2017, the Fund had the following swap contracts:
CENTRALLY CLEARED INTEREST RATE SWAP CONTRACTS
| | | | | | | | | | | | | | | | | | | | | | |
Payments Made by
the Fund | | Payments
Received
by Fund | | Termination
Date | | | Notional
Amount | | | Market
Value | | | Upfront
Premium
(Received) Paid | | | Unrealized
Appreciation/
(Depreciation) | |
2.143%(a) | | 3M LIBOR(b) | | | 07/03/23 | | | $ | 4,250,000 | (c) | | $ | (185 | ) | | $ | 20,957 | | | $ | (21,142 | ) |
3M LIBOR(b) | | 2.065%(a) | | | 08/06/23 | | | | 10,930,000 | (c) | | | (46,921 | ) | | | 4,603 | | | | (51,524 | ) |
3M LIBOR(b) | | 2.378(a) | | | 07/03/28 | | | | 15,290,000 | (c) | | | (1,890 | ) | | | (24,299 | ) | | | 22,409 | |
2.346(a) | | 3M LIBOR(b) | | | 08/06/28 | | | | 6,150,000 | (c) | | | 23,716 | | | | (5,448 | ) | | | 29,164 | |
1.231(d) | | 3M LIBOR | | | 09/09/36 | | | | 29,100,000 | | | | 4,173,166 | | | | 61,871 | | | | 4,111,295 | |
2.560(a) | | 3M LIBOR(b) | | | 07/03/48 | | | | 6,340,000 | (c) | | | 9,509 | | | | 4,504 | | | | 5,005 | |
| TOTAL | | | | | | | | | | | | $ | 4,157,395 | | | $ | 62,188 | | | $ | 4,095,207 | |
| | (a) | | Payments made semi-annually. |
| | (b) | | Payments made quarterly. |
| | (c) | | Represents forward starting interest rate swaps whose effective dates of commencement of accruals and cash flows occur subsequent to September 30, 2017. |
| | (d) | | Payments made annually. |
| | |
| The accompanying notes are an integral part of these financial statements. | | 69 |
GOLDMAN SACHS SHORT DURATION INCOME FUND
Schedule of Investments
September 30, 2017 (Unaudited)
| | | | | | | | | | | | | | |
Principal
Amount | | | Interest
Rate | | | Maturity
Date | | | Value | |
| Corporate Obligations – 50.9% | |
| Aerospace & Defense – 0.1% | |
| | Harris Corp. | |
| $ | 550,000 | | | | 1.999 | % | | | 04/27/18 | | | $ | 550,960 | |
| | | | | | | | | | | | | | |
| | | | | 550,960 | |
| | |
| Agriculture – 2.2% | |
| | BAT Capital Corp.(a) | |
| | 5,325,000 | | | | 2.297 | | | | 08/14/20 | | | | 5,342,006 | |
| | 4,925,000 | | | | 2.764 | (b) | | | 08/15/22 | | | | 4,952,671 | |
| | BAT International Finance PLC(a) | |
| | 1,225,000 | | | | 1.850 | | | | 06/15/18 | | | | 1,225,341 | |
| | Reynolds American, Inc. | |
| | 1,925,000 | | | | 2.300 | | | | 06/12/18 | | | | 1,933,460 | |
| | 975,000 | | | | 3.250 | | | | 06/12/20 | | | | 1,001,940 | |
| | | | | | | | | | | | | | |
| | | | | 14,455,418 | |
| | |
| Automotive – 1.2% | | | | |
| | Daimler Finance North America LLC(a) | |
| | 1,500,000 | | | | 2.450 | | | | 05/18/20 | | | | 1,510,536 | |
| | Ford Motor Credit Co. LLC | |
| | 5,575,000 | | | | 8.125 | | | | 01/15/20 | | | | 6,279,064 | |
| | | | | | | | | | | | | | |
| | | | | 7,789,600 | |
| | |
| Banks – 20.2% | |
| | ABN AMRO Bank NV(a) | |
| | 2,350,000 | | | | 1.800 | | | | 06/04/18 | | | | 2,352,028 | |
| | Banco Bilbao Vizcaya Argentaria SA | |
| | 1,025,000 | | | | 3.000 | | | | 10/20/20 | | | | 1,045,250 | |
| | Banco del Estado de Chile(a) | |
| | 170,000 | | | | 2.000 | | | | 11/09/17 | | | | 169,575 | |
| | Banco Santander SA | |
| | 1,400,000 | | | | 3.500 | | | | 04/11/22 | | | | 1,433,758 | |
| | Bank of America Corp. | |
| | 5,350,000 | | | | 2.600 | | | | 01/15/19 | | | | 5,393,241 | |
| | 1,200,000 | | | | 2.650 | | | | 04/01/19 | | | | 1,210,800 | |
| | 1,025,000 | | | | 2.625 | | | | 10/19/20 | | | | 1,035,955 | |
| | 8,175,000 | | | | 2.151 | (b) | | | 11/09/20 | | | | 8,151,525 | |
| | 1,250,000 | | | | 2.625 | | | | 04/19/21 | | | | 1,258,594 | |
| | Bank of America NA | |
| | 2,700,000 | | | | 1.750 | | | | 06/05/18 | | | | 2,702,873 | |
| | Banque Federative du Credit Mutuel SA(a) | |
| | 1,025,000 | | | | 2.000 | | | | 04/12/19 | | | | 1,027,038 | |
| | Barclays Bank PLC | |
| | 1,100,000 | | | | 5.140 | | | | 10/14/20 | | | | 1,176,530 | |
| | BNP Paribas SA | |
| | 550,000 | | | | 2.375 | | | | 05/21/20 | | | | 555,410 | |
| | 1,600,000 | | | | 2.950 | (a) | | | 05/23/22 | | | | 1,614,073 | |
| | BPCE SA(a) | |
| | 2,425,000 | | | | 3.000 | | | | 05/22/22 | | | | 2,438,396 | |
| | Capital One NA/Mclean VA(b) | |
| | 3,150,000 | | | | 1.850 | | | | 09/13/19 | | | | 3,127,891 | |
| | Citigroup, Inc. | |
| | 950,000 | | | | 2.050 | | | | 12/07/18 | | | | 951,372 | |
| | 1,325,000 | | | | 2.500 | | | | 07/29/19 | | | | 1,336,095 | |
| | 2,650,000 | | | | 2.650 | | | | 10/26/20 | | | | 2,677,236 | |
| | 5,500,000 | | | | 2.350 | | | | 08/02/21 | | | | 5,460,592 | |
| | 2,400,000 | | | | 2.750 | (b) | | | 04/25/22 | | | | 2,411,540 | |
| | Compass Bank(b) | |
| | 775,000 | | | | 2.750 | | | | 09/29/19 | | | | 779,963 | |
| | |
| Corporate Obligations – (continued) | |
| Banks – (continued) | |
| | Credit Suisse AG | |
| 725,000 | | | | 1.750 | | | | 01/29/18 | | | | 725,568 | |
| | Credit Suisse Group Funding Guernsey Ltd. | |
| | 1,425,000 | | | | 2.750 | | | | 03/26/20 | | | | 1,439,834 | |
| | Deutsche Bank AG | |
| | 4,150,000 | | | | 2.700 | | | | 07/13/20 | | | | 4,164,923 | |
| | Discover Bank(b) | |
| | 1,150,000 | | | | 2.600 | | | | 11/13/18 | | | | 1,157,482 | |
| | HBOS PLC(a) | |
| | 1,325,000 | | | | 6.750 | | | | 05/21/18 | | | | 1,362,932 | |
| | HSBC Holdings PLC | |
| | 1,050,000 | | | | 2.950 | | | | 05/25/21 | | | | 1,066,340 | |
| | ING Bank NV(a) | |
| | 1,525,000 | | | | 1.800 | | | | 03/16/18 | | | | 1,526,987 | |
| | Intesa Sanpaolo SpA | |
| | 2,550,000 | | | | 3.875 | | | | 01/16/18 | | | | 2,564,078 | |
| | JPMorgan Chase & Co. | |
| | 400,000 | | | | 1.700 | (b) | | | 03/01/18 | | | | 400,120 | |
| | 3,400,000 | | | | 2.200 | | | | 10/22/19 | | | | 3,420,277 | |
| | 1,825,000 | | | | 2.250 | (b) | | | 01/23/20 | | | | 1,834,825 | |
| | 1,250,000 | | | | 2.295 | (b) | | | 08/15/21 | | | | 1,249,053 | |
| | KBC Bank NV(b) (5 year USD Swap + 7.097%) | |
| | 400,000 | | | | 8.000 | | | | 01/25/23 | | | | 406,766 | |
| | Kreditanstalt fuer Wiederaufbau(c) | |
| | 19,180,000 | | | | 1.500 | | | | 09/09/19 | | | | 19,125,529 | |
| | Lloyds Bank PLC | |
| | 400,000 | | | | 1.750 | | | | 03/16/18 | | | | 400,375 | |
| | 1,000,000 | | | | 2.300 | | | | 11/27/18 | | | | 1,005,751 | |
| | Macquarie Bank Ltd.(a) | |
| | 700,000 | | | | 1.600 | | | | 10/27/17 | | | | 700,094 | |
| | Mitsubishi UFJ Financial Group, Inc. | |
| | 425,000 | | | | 2.950 | | | | 03/01/21 | | | | 431,803 | |
| | Mizuho Bank Ltd.(d) (3M USD LIBOR + 0.500%) | |
| | 1,500,000 | | | | 1.828 | | | | 09/24/18 | | | | 1,499,707 | |
| | Morgan Stanley | |
| | 3,250,000 | | | | 2.500 | | | | 04/21/21 | | | | 3,260,524 | |
| | 7,550,000 | | | | 2.625 | | | | 11/17/21 | | | | 7,576,898 | |
| | Morgan Stanley, Inc. | |
| | 775,000 | | | | 2.650 | | | | 01/27/20 | | | | 783,883 | |
| | MUFG Americas Holdings Corp.(b) | |
| | 625,000 | | | | 1.625 | | | | 02/09/18 | | | | 624,989 | |
| | Nordea Bank Finland PLC(d) (3M USD LIBOR + 0.450%) | |
| | 2,900,000 | | | | 1.762 | | | | 11/07/18 | | | | 2,899,364 | |
| | Santander Holdings USA, Inc.(b) | |
| | 1,275,000 | | | | 2.650 | | | | 04/17/20 | | | | 1,280,838 | |
| | Santander UK PLC | |
| | 1,600,000 | | | | 2.375 | | | | 03/16/20 | | | | 1,612,100 | |
| | Sumitomo Mitsui Financial Group, Inc. | |
| | 1,750,000 | | | | 2.442 | | | | 10/19/21 | | | | 1,741,265 | |
| | 7,150,000 | | | | 2.784 | | | | 07/12/22 | | | | 7,177,691 | |
| | The Bank of Tokyo-Mitsubishi UFJ Ltd.(a) | |
| | 1,100,000 | | | | 1.700 | | | | 03/05/18 | | | | 1,100,236 | |
| | 700,000 | | | | 2.150 | | | | 09/14/18 | | | | 701,817 | |
| | UBS Group Funding Switzerland AG(a) | |
| | 3,450,000 | | | | 3.000 | | | | 04/15/21 | | | | 3,497,496 | |
| | |
| | |
| 70 | | The accompanying notes are an integral part of these financial statements. |
GOLDMAN SACHS SHORT DURATION INCOME FUND
| | | | | | | | | | | | | | |
Principal
Amount | | | Interest
Rate | | | Maturity
Date | | | Value | |
| Corporate Obligations – (continued) | |
| Banks – (continued) | |
| | UniCredit SpA(a) | |
| $ | 2,000,000 | | | | 3.750 | % | | | 04/12/22 | | | $ | 2,050,130 | |
| | Wells Fargo & Co. | |
| | 600,000 | | | | 2.150 | | | | 01/30/20 | | | | 601,626 | |
| | Westpac Banking Corp. | |
| | 4,650,000 | | | | 1.950 | | | | 11/23/18 | | | | 4,656,639 | |
| | | | | | | | | | | | | | |
| | | | | 132,357,675 | |
| | |
| Beverages – 1.3% | |
| | Anheuser-Busch InBev Finance, Inc. | |
| | 3,450,000 | | | | 1.900 | | | | 02/01/19 | | | | 3,458,912 | |
| | 3,125,000 | | | | 2.650 | (b) | | | 02/01/21 | | | | 3,175,752 | |
| | Beam Suntory, Inc. | |
| | 800,000 | | | | 1.750 | | | | 06/15/18 | | | | 798,829 | |
| | Molson Coors Brewing Co. | |
| | 1,150,000 | | | | 1.450 | | | | 07/15/19 | | | | 1,137,492 | |
| | | | | | | | | | | | | | |
| | | | | | | | | | | | | | |
| | | | | 8,570,985 | |
| | |
| Chemicals – 1.2% | |
| | E.I. du Pont de Nemours & Co. (3M USD LIBOR + 0.530%) | |
| | 2,100,000 | | | | 1.841 | | | | 05/01/20 | | | | 2,117,712 | |
| | Eastman Chemical Co.(b) | |
| | 1,250,000 | | | | 2.700 | | | | 01/15/20 | | | | 1,265,041 | |
| | The Sherwin-Williams Co. | |
| | 2,275,000 | | | | 2.250 | | | | 05/15/20 | | | | 2,284,004 | |
| | 700,000 | | | | 2.750 | (b) | | | 06/01/22 | | | | 704,713 | |
| | Westlake Chemical Corp.(b) | |
| | 1,350,000 | | | | 4.625 | | | | 02/15/21 | | | | 1,395,225 | |
| | | | | | | | | | | | | | |
| | | | | 7,766,695 | |
| | |
| Computers(b) – 0.2% | |
| | DXC Technology Co. | |
| | 1,425,000 | | | | 2.266 | | | | 03/01/21 | | | | 1,430,400 | |
| | | | | | | | | | | | | | |
| | | | | 1,430,400 | |
| | |
| Diversified Financial Services – 1.4% | |
| | AerCap Ireland Capital DAC/AerCap Global Aviation Trust | |
| | 250,000 | | | | 4.500 | | | | 05/15/21 | | | | 264,508 | |
| | Air Lease Corp. | |
| | 2,975,000 | | | | 2.125 | | | | 01/15/20 | | | | 2,970,305 | |
| | Ally Financial, Inc. | |
| | 800,000 | | | | 6.250 | | | | 12/01/17 | | | | 804,000 | |
| | Capital One Bank USA NA(b) | |
| | 800,000 | | | | 2.250 | | | | 02/13/19 | | | | 802,304 | |
| | International Lease Finance Corp. | |
| | 750,000 | | | | 7.125 | (a) | | | 09/01/18 | | | | 785,284 | |
| | 2,425,000 | | | | 4.625 | | | | 04/15/21 | | | | 2,576,597 | |
| | Navient Corp. | |
| | 1,150,000 | | | | 8.450 | | | | 06/15/18 | | | | 1,201,704 | |
| | | | | | | | | | | | | | |
| | | | | 9,404,702 | |
| | |
| Electrical – 1.6% | |
| | Dominion Energy, Inc. | |
| | 900,000 | | | | 1.900 | | | | 06/15/18 | | | | 901,464 | |
| | 1,350,000 | | | | 2.579 | | | | 07/01/20 | | | | 1,361,265 | |
| | Duke Energy Corp.(b) | |
| | 950,000 | | | | 1.800 | | | | 09/01/21 | | | | 930,821 | |
| | |
| Corporate Obligations – (continued) | |
| Electrical – (continued) | |
| | Enel Finance International NV(a) | |
| 3,125,000 | | | | 2.875 | | | | 05/25/22 | | | | 3,145,245 | |
| | Exelon Corp.(b) | |
| | 350,000 | | | | 2.850 | | | | 06/15/20 | | | | 356,958 | |
| | 750,000 | | | | 2.450 | | | | 04/15/21 | | | | 750,067 | |
| | Puget Sound Energy, Inc.(b) (3M USD LIBOR + 2.530%) | |
| | 1,000,000 | | | | 6.974 | | | | 06/01/67 | | | | 975,000 | |
| | The Southern Co. | |
| | 1,150,000 | | | | 1.850 | | | | 07/01/19 | | | | 1,149,414 | |
| | 800,000 | | | | 2.750 | (b) | | | 06/15/20 | | | | 813,183 | |
| | | | | | | | | | | | | | |
| | | | | 10,383,417 | |
| | |
| Electronics(b) – 0.1% | |
| | Fortive Corp. | |
| | 775,000 | | | | 2.350 | | | | 06/15/21 | | | | 770,150 | |
| | | | | | | | | | | | | | |
| | | | | 770,150 | |
| | |
| Entertainment(b) – 0.1% | |
| | GLP Capital LP/GLP Financing II, Inc. | |
| | 450,000 | | | | 4.875 | | | | 11/01/20 | | | | 475,313 | |
| | | | | | | | | | | | | | |
| | | | | 475,313 | |
| | |
| Food & Drug Retailing – 1.0% | |
| | Conagra Brands, Inc. | |
| | 61,000 | | | | 4.950 | | | | 08/15/20 | | | | 65,083 | |
| | Kraft Heinz Foods Co. | |
| | 1,300,000 | | | | 2.000 | | | | 07/02/18 | | | | 1,302,670 | |
| | Mondelez International Holdings Netherlands BV(a)(b) | |
| | 1,975,000 | | | | 2.000 | | | | 10/28/21 | | | | 1,939,272 | |
| | Smithfield Foods, Inc.(a) | |
| | 625,000 | | | | 2.700 | | | | 01/31/20 | | | | 626,924 | |
| | 2,350,000 | | | | 2.650 | (b) | | | 10/03/21 | | | | 2,347,640 | |
| | Sysco Corp.(b) | |
| | 400,000 | | | | 2.600 | | | | 10/01/20 | | | | 405,884 | |
| | | | | | | | | | | | | | |
| | | | | 6,687,473 | |
| | |
| Gaming – 0.2% | |
| | MGM Resorts International | |
| | 975,000 | | | | 8.625 | | | | 02/01/19 | | | | 1,053,000 | |
| | | | | | | | | | | | | | |
| | | | | 1,053,000 | |
| | |
| Gas(b) – 0.2% | |
| | Sempra Energy | |
| | 1,100,000 | | | | 2.400 | | | | 03/15/20 | | | | 1,104,148 | |
| | | | | | | | | | | | | | |
| | | | | 1,104,148 | |
| | |
| Healthcare Providers & Services – 2.5% | |
| | Acadia Healthcare Co., Inc.(b) | |
| | 500,000 | | | | 6.125 | | | | 03/15/21 | | | | 513,750 | |
| | Becton Dickinson & Co. | |
| | 4,750,000 | | | | 2.133 | | | | 06/06/19 | | | | 4,763,076 | |
| | 959,000 | | | | 2.675 | | | | 12/15/19 | | | | 970,514 | |
| | 2,625,000 | | | | 2.404 | | | | 06/05/20 | | | | 2,634,210 | |
| | 4,375,000 | | | | 2.894 | (b) | | | 06/06/22 | | | | 4,389,234 | |
| | CHS/Community Health Systems, Inc.(b) | |
| | 1,100,000 | | | | 8.000 | | | | 11/15/19 | | | | 1,072,500 | |
| | HCA, Inc. | |
| | 1,600,000 | | | | 5.875 | | | | 03/15/22 | | | | 1,772,000 | |
| | Thermo Fisher Scientific, Inc. | |
| | 475,000 | | | | 2.150 | | | | 12/14/18 | | | | 477,109 | |
| | | | | | | | | | | | | | |
| | | | | 16,592,393 | |
| | |
| | |
| The accompanying notes are an integral part of these financial statements. | | 71 |
GOLDMAN SACHS SHORT DURATION INCOME FUND
Schedule of Investments (continued)
September 30, 2017 (Unaudited)
| | | | | | | | | | | | | | |
Principal
Amount | | | Interest
Rate | | | Maturity
Date | | | Value | |
| Corporate Obligations – (continued) | |
| Insurance – 0.4% | |
| | Reliance Standard Life Global Funding II(a) | |
| $ | 1,700,000 | | | | 2.150 | % | | | 10/15/18 | | | $ | 1,706,816 | |
| | The Chubb Corp.(b)(3M USD LIBOR + 2.250%) | |
| | 1,075,000 | | | | 3.554 | | | | 03/29/67 | | | | 1,069,088 | |
| | | | | | | | | | | | | | |
| | | | | 2,775,904 | |
| | |
| Internet(a) – 0.5% | |
| | Amazon.com, Inc. | |
| | 1,475,000 | | | | 1.900 | | | | 08/21/20 | | | | 1,478,602 | |
| | 1,475,000 | | | | 2.400 | (b) | | | 02/22/23 | | | | 1,471,392 | |
| | | | | | | | | | | | | | |
| | | | | 2,949,994 | |
| | |
| Machinery-Diversified(b) – 0.2% | |
| | Roper Technologies, Inc. | |
| | 225,000 | | | | 3.000 | | | | 12/15/20 | | | | 229,558 | |
| | 775,000 | | | | 2.800 | | | | 12/15/21 | | | | 782,095 | |
| | | | | | | | | | | | | | |
| | | | | 1,011,653 | |
| | |
| Media – 0.8% | |
| | 21st Century Fox America, Inc. | |
| | 550,000 | | | | 6.900 | | | | 03/01/19 | | | | 587,455 | |
| Charter Communications Operating LLC/Charter
Communications Operating Capital(b) |
|
| | 3,400,000 | | | | 3.579 | | | | 07/23/20 | | | | 3,490,363 | |
| | Time Warner Cable LLC | |
| | 775,000 | | | | 5.000 | | | | 02/01/20 | | | | 819,361 | |
| | | | | | | | | | | | | | |
| | | | | 4,897,179 | |
| | |
| Metals & Mining – 0.3% | |
| | Glencore Finance Canada Ltd.(a) | |
| | 1,700,000 | | | | 2.700 | | | | 10/25/17 | | | | 1,700,595 | |
| | Teck Resources Ltd.(b) | |
| | 450,000 | | | | 4.750 | | | | 01/15/22 | | | | 474,750 | |
| | | | | | | | | | | | | | |
| | | | | 2,175,345 | |
| | |
| Oil Field Services – 0.7% | |
| | EOG Resources, Inc. | |
| | 1,300,000 | | | | 5.625 | | | | 06/01/19 | | | | 1,374,898 | |
| | Petrobras Global Finance BV | |
| | 30,000 | | | | 8.750 | | | | 05/23/26 | | | | 36,107 | |
| | 500,000 | | | | 7.375 | | | | 01/17/27 | | | | 550,625 | |
| | 245,000 | | | | 5.999 | (a) | | | 01/27/28 | | | | 245,000 | |
| | 250,000 | | | | 6.850 | | | | 06/05/15 | (e) | | | 237,406 | |
| | Petroleos Mexicanos | |
| | 18,000 | | | | 6.375 | | | | 02/04/21 | | | | 19,670 | |
| EUR | 170,000 | | | | 5.125 | | | | 03/15/23 | | | | 230,057 | |
| $ | 410,000 | | | | 6.500 | (a) | | | 03/13/27 | | | | 454,374 | |
| | 20,000 | | | | 5.500 | | | | 06/27/44 | | | | 18,600 | |
| | 30,000 | | | | 6.375 | | | | 01/23/45 | | | | 30,570 | |
| | 10,000 | | | | 5.625 | | | | 01/23/46 | | | | 9,335 | |
| | 140,000 | | | | 6.750 | (a) | | | 09/21/47 | | | | 149,016 | |
| | Phillips 66(a)(b)(3M USD LIBOR + 0.750%) | |
| | 950,000 | | | | 2.054 | | | | 04/15/20 | | | | 951,366 | |
| | Range Resources Corp.(a)(b) | |
| | 500,000 | | | | 5.750 | | | | 06/01/21 | | | | 517,500 | |
| | | | | | | | | | | | | | |
| | | | | 4,824,524 | |
| | |
| Corporate Obligations – (continued) | |
| Pharmaceuticals – 3.8% | |
| | AbbVie, Inc. | |
| 2,075,000 | | | | 1.800 | | | | 05/14/18 | | | | 2,077,883 | |
| | Allergan Funding SCS(b) | |
| | 6,900,000 | | | | 3.450 | | | | 03/15/22 | | | | 7,154,703 | |
| | Cardinal Health, Inc. | |
| | 905,000 | | | | 4.625 | | | | 12/15/20 | | | | 967,416 | |
| | EMD Finance LLC(a)(b) | |
| | 1,600,000 | | | | 2.400 | | | | 03/19/20 | | | | 1,612,563 | |
| | Forest Laboratories LLC(a)(b) | |
| | 530,000 | | | | 4.375 | | | | 02/01/19 | | | | 543,516 | |
| | McKesson Corp. | |
| | 175,000 | | | | 1.400 | | | | 03/15/18 | | | | 174,826 | |
| | 650,000 | | | | 2.284 | | | | 03/15/19 | | | | 653,764 | |
| | Mead Johnson Nutrition Co. | |
| | 475,000 | | | | 3.000 | | | | 11/15/20 | | | | 487,996 | |
| | Mylan NV | |
| | 2,825,000 | | | | 2.500 | | | | 06/07/19 | | | | 2,836,149 | |
| | Mylan, Inc. | |
| | 1,350,000 | | | | 2.550 | | | | 03/28/19 | | | | 1,356,244 | |
| | Shire Acquisitions Investments Ireland DAC | |
| | 2,625,000 | | | | 1.900 | | | | 09/23/19 | | | | 2,619,810 | |
| | Teva Pharmaceutical Finance Netherlands III BV | |
| | 4,575,000 | | | | 2.200 | | | | 07/21/21 | | | | 4,404,827 | |
| | | | | | | | | | | | | | |
| | | | | 24,889,697 | |
| | |
| Pipelines – 3.4% | |
| | Columbia Pipeline Group, Inc. | |
| | 475,000 | | | | 2.450 | | | | 06/01/18 | | | | 476,634 | |
| | Enbridge Energy Partners LP | |
| | 2,114,000 | | | | 5.200 | | | | 03/15/20 | | | | 2,250,583 | |
| | Enbridge, Inc.(b) | |
| | 1,325,000 | | | | 2.900 | | | | 07/15/22 | | | | 1,332,756 | |
| | Enterprise Products Operating LLC | |
| | 1,550,000 | | | | 5.200 | | | | 09/01/20 | | | | 1,679,812 | |
| | 1,150,000 | | | | 5.018 | (b) | | | 08/01/66 | | | | 1,150,575 | |
| | Kinder Morgan Energy Partners LP | |
| | 1,150,000 | | | | 2.650 | | | | 02/01/19 | | | | 1,157,853 | |
| | 1,250,000 | | | | 6.850 | | | | 02/15/20 | | | | 1,371,910 | |
| | Kinder Morgan, Inc.(b) | |
| | 1,450,000 | | | | 3.050 | | | | 12/01/19 | | | | 1,476,220 | |
| | NGPL PipeCo LLC(a)(b) | |
| | 215,000 | | | | 4.375 | | | | 08/15/22 | | | | 223,063 | |
| | 410,000 | | | | 4.875 | | | | 08/15/27 | | | | 429,475 | |
| | Plains All American Pipeline LP/PAA Finance Corp. | |
| | 1,690,000 | | | | 5.750 | | | | 01/15/20 | | | | 1,794,987 | |
| | 990,000 | | | | 3.650 | (b) | | | 06/01/22 | | | | 995,233 | |
| | Sabine Pass Liquefaction LLC(b) | |
| | 3,185,000 | | | | 5.625 | | | | 02/01/21 | | | | 3,447,019 | |
| | Texas Eastern Transmission LP(a)(b) | |
| | 1,225,000 | | | | 4.125 | | | | 12/01/20 | | | | 1,284,512 | |
| | TransCanada PipeLines Ltd. | |
| | 570,000 | | | | 1.875 | | | | 01/12/18 | | | | 570,486 | |
| | Western Gas Partners LP(b) | |
| | 1,470,000 | | | | 2.600 | | | | 08/15/18 | | | | 1,476,678 | |
| | Williams Partners LP | |
| | 1,300,000 | | | | 5.250 | | | | 03/15/20 | | | | 1,395,337 | |
| | | | | | | | | | | | | | |
| | | | | 22,513,133 | |
| | |
| | |
| 72 | | The accompanying notes are an integral part of these financial statements. |
GOLDMAN SACHS SHORT DURATION INCOME FUND
| | | | | | | | | | | | | | |
Principal
Amount | | | Interest
Rate | | | Maturity
Date | | | Value | |
| Corporate Obligations – (continued) | |
| Real Estate Investment Trust – 2.1% | |
| | American Tower Corp. | |
| $ | 2,010,000 | | | | 3.400 | % | | | 02/15/19 | | | $ | 2,046,666 | |
| | 1,565,000 | | | | 2.800 | (b) | | | 06/01/20 | | | | 1,588,715 | |
| | China Evergrande Group(b) | |
| | 500,000 | | | | 8.750 | | | | 06/28/25 | | | | 506,931 | |
| | Equinix, Inc.(b) | |
| | 450,000 | | | | 5.375 | | | | 01/01/22 | | | | 471,375 | |
| | HCP, Inc.(b) | |
| | 600,000 | | | | 3.750 | | | | 02/01/19 | | | | 610,948 | |
| | Public Storage(b) | |
| | 850,000 | | | | 2.370 | | | | 09/15/22 | | | | 847,682 | |
| | Realty Income Corp.(b) | |
| | 125,000 | | | | 2.000 | | | | 01/31/18 | | | | 125,108 | |
| | Select Income REIT(b) | |
| | 1,275,000 | | | | 3.600 | | | | 02/01/20 | | | | 1,293,532 | |
| | Senior Housing Properties Trust(b) | |
| | 750,000 | | | | 3.250 | | | | 05/01/19 | | | | 758,500 | |
| | Ventas Realty LP/Ventas Capital Corp.(b) | |
| | 900,000 | | | | 2.000 | | | | 02/15/18 | | | | 900,822 | |
| | VEREIT Operating Partnership LP(b) | |
| | 3,475,000 | | | | 3.000 | | | | 02/06/19 | | | | 3,501,062 | |
| | Welltower, Inc.(b) | |
| | 1,225,000 | | | | 4.125 | | | | 04/01/19 | | | | 1,258,773 | |
| | | | | | | | | | | | | | |
| | | | | 13,910,114 | |
| | |
| Retailing – 0.5% | |
| | Alimentation Couche-Tard, Inc.(a)(b) | |
| | 425,000 | | | | 2.700 | | | | 07/26/22 | | | | 426,377 | |
| | AutoZone, Inc. | |
| | 250,000 | | | | 1.625 | | | | 04/21/19 | | | | 248,632 | |
| | Brinker International, Inc. | |
| | 150,000 | | | | 2.600 | | | | 05/15/18 | | | | 150,585 | |
| | New Red Finance, Inc.(a)(b) | |
| | 1,000,000 | | | | 4.625 | | | | 01/15/22 | | | | 1,022,500 | |
| | Walgreens Boots Alliance, Inc.(b) | |
| | 1,550,000 | | | | 2.700 | | | | 11/18/19 | | | | 1,571,173 | |
| | Yum! Brands, Inc. | |
| | 135,000 | | | | 6.250 | | | | 03/15/18 | | | | 137,194 | |
| | | | | | | | | | | | | | |
| | | | | 3,556,461 | |
| | |
| Semiconductors – 1.3% | |
| | Broadcom Corp./Broadcom Cayman Finance Ltd.(a)(b) | |
| | 4,700,000 | | | | 3.000 | | | | 01/15/22 | | | | 4,778,406 | |
| | NXP BV/NXP Funding LLC(a) | |
| | 750,000 | | | | 3.750 | | | | 06/01/18 | | | | 756,563 | |
| | 325,000 | | | | 4.125 | | | | 06/15/20 | | | | 339,219 | |
| | 1,250,000 | | | | 4.125 | | | | 06/01/21 | | | | 1,307,812 | |
| | QUALCOMM, Inc. | |
| | 1,450,000 | | | | 2.250 | | | | 05/20/20 | | | | 1,465,355 | |
| | | | | | | | | | | | | | |
| | | | | 8,647,355 | |
| | |
| Software(b) – 0.4% | |
| | Fidelity National Information Services, Inc. | |
| | 900,000 | | | | 2.250 | | | | 08/15/21 | | | | 893,949 | |
| | First Data Corp.(a) | |
| | 850,000 | | | | 7.000 | | | | 12/01/23 | | | | 908,437 | |
| | Fiserv, Inc. | |
| | 625,000 | | | | 2.700 | | | | 06/01/20 | | | | 632,227 | |
| | | | | | | | | | | | | | |
| | | | | 2,434,613 | |
| | |
| Corporate Obligations – (continued) | |
| Telecommunication Services – 2.8% | |
| | America Movil SAB de CV | |
| MXN | 2,760,000 | | | | 6.000 | | | | 06/09/19 | | | | 147,407 | |
| | AT&T, Inc. | |
| $ | 1,350,000 | | | | 1.750 | | | | 01/15/18 | | | | 1,350,823 | |
| | 1,955,000 | | | | 2.300 | | | | 03/11/19 | | | | 1,965,193 | |
| | 1,125,000 | | | | 5.875 | | | | 10/01/19 | | | | 1,208,715 | |
| | 2,225,000 | | | | 2.450 | (b) | | | 06/30/20 | | | | 2,240,860 | |
| | 900,000 | | | | 3.000 | | | | 02/15/22 | | | | 909,515 | |
| | CenturyLink, Inc. | |
| | 650,000 | | | | 6.450 | | | | 06/15/21 | | | | 679,250 | |
| | Sprint Corp. | |
| | 1,000,000 | | | | 7.250 | | | | 09/15/21 | | | | 1,107,500 | |
| | Telefonica Emisiones SAU | |
| | 825,000 | | | | 3.192 | | | | 04/27/18 | | | | 831,678 | |
| | Verizon Communications, Inc. | |
| | 2,475,000 | | | | 1.750 | | | | 08/15/21 | | | | 2,422,643 | |
| | 650,000 | | | | 3.000 | (b) | | | 11/01/21 | | | | 663,339 | |
| | 4,542,000 | | | | 2.946 | | | | 03/15/22 | | | | 4,618,960 | |
| | Windstream Services LLC(b) | |
| | 300,000 | | | | 7.750 | | | | 10/15/20 | | | | 240,000 | |
| | | | | | | | | | | | | | |
| | | | | 18,385,883 | |
| | |
| Trucking & Leasing(a) – 0.2% | |
| | Penske Truck Leasing Co. LP/PTL Finance Corp. | |
| | 1,101,000 | | | | 3.375 | | | | 03/15/18 | | | | 1,109,471 | |
| | | | | | | | | | | | | | |
| | | | | | | | | | | | | 1,109,471 | |
| | |
| | TOTAL CORPORATE OBLIGATIONS | |
| | (Cost $332,102,411) | | | $ | 333,473,655 | |
| | |
| | | | | | | | | | | | | | |
| Mortgage-Backed Obligations – 11.7% | |
| Collateralized Mortgage Obligations – 5.0% | |
| Interest Only(f) – 1.0% | |
| FHLMC REMIC Series 3852, Class SW (-1x1M LIBOR +
6.000%) |
|
| $ | 1,312,080 | | | | 4.773 | % | | | 05/15/41 | | | $ | 208,733 | |
| FHLMC REMIC Series 4314, Class SE (-1x1M LIBOR +
6.050%) |
|
| | 879,014 | | | | 4.816 | | | | 03/15/44 | | | | 152,870 | |
| FHLMC REMIC Series 4320, Class SD (-1x1M LIBOR +
6.100%) |
|
| | 228,926 | | | | 4.866 | | | | 07/15/39 | | | | 35,816 | |
| FHLMC REMIC Series 4326, Class GS (-1x1M LIBOR +
6.050%) |
|
| | 566,268 | | | | 4.816 | | | | 04/15/44 | | | | 97,787 | |
| FHLMC REMIC Series 4583, Class ST (-1x1M LIBOR +
6.000%) |
|
| | 989,467 | | | | 4.766 | | | | 05/15/46 | | | | 188,770 | |
| | FHLMC STRIPS Series 304, Class C45 | |
| | 385,986 | | | | 3.000 | | | | 12/15/27 | | | | 35,533 | |
| FNMA REMIC Series 2010-135, Class AS (-1x1M LIBOR +
5.950%) |
|
| | 384,169 | | | | 4.713 | | | | 12/25/40 | | | | 58,852 | |
| | FNMA REMIC Series 2012-146, Class IO | |
| | 4,041,047 | | | | 3.500 | | | | 01/25/43 | | | | 766,680 | |
| FNMA REMIC Series 2013-121, Class SA (-1x1M LIBOR +
6.100%) |
|
| | 431,748 | | | | 4.866 | | | | 12/25/43 | | | | 68,496 | |
| | |
| | |
| The accompanying notes are an integral part of these financial statements. | | 73 |
GOLDMAN SACHS SHORT DURATION INCOME FUND
Schedule of Investments (continued)
September 30, 2017 (Unaudited)
| | | | | | | | | | | | | | |
Principal
Amount | | | Interest
Rate | | | Maturity
Date | | | Value | |
| Mortgage-Backed Obligations – (continued) | |
| Interest Only(f) – (continued) | |
| FNMA REMIC Series 2013-130, Class SN (-1x1M LIBOR +
6.650%) |
|
| $ | 988,295 | | | | 5.413 | % | | | 10/25/42 | | | $ | 190,963 | |
| FNMA REMIC Series 2013-96, Class SW (-1x1M LIBOR +
6.100%) |
|
| | 270,562 | | | | 4.866 | | | | 09/25/43 | | | | 43,640 | |
| FNMA REMIC Series 2014-19, Class MS (-1x1M LIBOR +
6.600%) |
|
| | 370,369 | | | | 5.366 | | | | 11/25/39 | | | | 40,312 | |
| FNMA REMIC Series 2014-87, Class MS (-1x1M LIBOR +
6.250%) |
|
| | 135,088 | | | | 5.016 | | | | 01/25/45 | | | | 22,147 | |
| FNMA REMIC Series 2015-20, Class ES (-1x1M LIBOR +
6.150%) |
|
| | 741,190 | | | | 4.916 | | | | 04/25/45 | | | | 150,969 | |
| FNMA REMIC Series 2015-28, Class PS (-1x1M LIBOR +
5.600%) |
|
| | 1,850,092 | | | | 4.366 | | | | 08/25/44 | | | | 274,632 | |
| FNMA REMIC Series 2015-79, Class SA (-1x1M LIBOR +
6.250%) |
|
| | 572,401 | | | | 5.016 | | | | 11/25/45 | | | | 95,993 | |
| FNMA REMIC Series 2015-81, Class SA (-1x1M LIBOR +
5.700%) |
|
| | 1,996,680 | | | | 4.466 | | | | 11/25/45 | | | | 284,808 | |
| FNMA REMIC Series 2015-82, Class MS (-1x1M LIBOR +
5.700%) |
|
| | 419,706 | | | | 4.466 | | | | 11/25/45 | | | | 60,797 | |
| FNMA REMIC Series 2016-1, Class SJ (-1x1M LIBOR +
6.150%) |
|
| | 1,552,151 | | | | 4.913 | | | | 02/25/46 | | | | 301,946 | |
| | FNMA REMIC Series 2016-3, Class IP | |
| | 762,756 | | | | 4.000 | | | | 02/25/46 | | | | 154,120 | |
| GNMA REMIC Series 2010-1, Class SD (-1x1M LIBOR +
5.790%) |
|
| | 28,572 | | | | 4.554 | | | | 01/20/40 | | | | 4,529 | |
| GNMA REMIC Series 2010-20, Class SE (-1x1M LIBOR +
6.250%) |
|
| | 165,490 | | | | 5.014 | | | | 02/20/40 | | | | 27,790 | |
| GNMA REMIC Series 2010-31, Class SA (-1x1M LIBOR +
5.750%) |
|
| | 289,856 | | | | 4.514 | | | | 03/20/40 | | | | 42,770 | |
| GNMA REMIC Series 2010-98, Class QS (-1x1M LIBOR +
6.600%) |
|
| | 165,842 | | | | 5.364 | | | | 01/20/40 | | | | 21,641 | |
| GNMA REMIC Series 2011-17, Class SA (-1x1M LIBOR +
6.100%) |
|
| | 207,611 | | | | 4.864 | | | | 09/20/40 | | | | 29,718 | |
| GNMA REMIC Series 2011-61, Class CS (-1x1M LIBOR +
6.680%) |
|
| | 71,330 | | | | 5.444 | | | | 12/20/35 | | | | 2,610 | |
| GNMA REMIC Series 2013-113, Class SD (-1x1M LIBOR +
6.700%) |
|
| | 161,188 | | | | 5.466 | | | | 08/16/43 | | | | 28,617 | |
| GNMA REMIC Series 2013-124, Class CS (-1x1M LIBOR +
6.050%) |
|
| | 930,394 | | | | 4.814 | | | | 08/20/43 | | | | 159,500 | |
| GNMA REMIC Series 2013-134, Class DS (-1x1M LIBOR +
6.100%) |
|
| | 107,685 | | | | 4.864 | | | | 09/20/43 | | | | 17,385 | |
| GNMA REMIC Series 2013-152, Class TS (-1x1M LIBOR +
6.100%) |
|
| | 380,072 | | | | 4.864 | | | | 06/20/43 | | | | 60,220 | |
| | |
| Mortgage-Backed Obligations – (continued) | |
| Interest Only(f) – (continued) | |
| GNMA REMIC Series 2014-117, Class SJ (-1x1M LIBOR +
5.600%) |
|
| 2,686,266 | | | | 4.364 | | | | 08/20/44 | | | | 403,878 | |
| GNMA REMIC Series 2014-132, Class SL (-1x1M LIBOR +
6.100%) |
|
| | 1,011,898 | | | | 4.864 | | | | 10/20/43 | | | | 147,405 | |
| GNMA REMIC Series 2014-133, Class BS (-1x1M LIBOR +
5.600%) |
|
| | 861,812 | | | | 4.364 | | | | 09/20/44 | | | | 121,214 | |
| GNMA REMIC Series 2014-158, Class SA (-1x1M LIBOR +
5.600%) |
|
| | 1,239,003 | | | | 4.366 | | | | 10/16/44 | | | | 183,817 | |
| GNMA REMIC Series 2014-162, Class SA (-1x1M LIBOR +
5.600%) |
|
| | 379,045 | | | | 4.364 | | | | 11/20/44 | | | | 53,104 | |
| | GNMA REMIC Series 2014-188, Class IB | |
| | 1,032,151 | | | | 4.000 | | | | 12/20/44 | | | | 151,868 | |
| GNMA REMIC Series 2014-20, Class SA (-1x1M LIBOR +
6.100%) |
|
| | 1,750,879 | | | | 4.864 | | | | 02/20/44 | | | | 287,746 | |
| GNMA REMIC Series 2014-41, Class SA (-1x1M LIBOR +
6.100%) |
|
| | 121,729 | | | | 4.864 | | | | 03/20/44 | | | | 20,125 | |
| GNMA REMIC Series 2015-110, Class MS (-1x1M LIBOR +
5.710%) |
|
| | 773,859 | | | | 4.474 | | | | 08/20/45 | | | | 112,461 | |
| | GNMA REMIC Series 2015-111, Class IM | |
| | 717,300 | | | | 4.000 | | | | 08/20/45 | | | | 113,120 | |
| GNMA REMIC Series 2015-123, Class SP (-1x1M LIBOR +
6.250%) |
|
| | 624,654 | | | | 5.014 | | | | 09/20/45 | | | | 104,258 | |
| GNMA REMIC Series 2015-126, Class HS (-1x1M LIBOR +
6.200%) |
|
| | 1,365,012 | | | | 4.964 | | | | 09/20/45 | | | | 222,308 | |
| GNMA REMIC Series 2015-57, Class AS (-1x1M LIBOR +
5.600%) |
|
| | 1,559,979 | | | | 4.364 | | | | 04/20/45 | | | | 219,368 | |
| | GNMA REMIC Series 2015-95, Class GI | |
| | 696,186 | | | | 4.500 | | | | 07/16/45 | | | | 147,475 | |
| | GNMA REMIC Series 2016-109, Class IH | |
| | 2,974,050 | | | | 4.000 | | | | 10/20/45 | | | | 472,785 | |
| | GNMA REMIC Series 2016-27, Class IA | |
| | 620,075 | | | | 4.000 | | | | 06/20/45 | | | | 86,046 | |
| | | | | | | | | | | | | | |
| | | | | 6,475,622 | |
| | |
| Regular Floater – 1.3% | |
| Credit Suisse European Mortgage Capital Ltd.
Series 2015-1HWA, Class A(a)(g) (3 mo. Euribor + 2.750%) |
|
| EUR | 629,214 | | | | 2.750 | | | | 04/20/20 | | | | 738,091 | |
| | FNMA REMIC Series 2007-33, Class HF (1M LIBOR + 0.350%) | |
| $ | 26,670 | | | | 1.584 | | | | 04/25/37 | | | | 26,732 | |
| Mortgage Repurchase Agreement Financing Trust Series 2016-1,
Class A2(a) (1M USD LIBOR + 0.950%) |
|
| | 2,200,000 | | | | 2.181 | | | | 04/10/19 | | | | 2,200,046 | |
| Mortgage Repurchase Agreement Financing Trust Series 2017-1,
Class A1(a) (1M USD LIBOR + 0.850%) |
|
| | 1,300,000 | | | | 2.081 | | | | 07/10/19 | | | | 1,300,334 | |
| Mortgage Repurchase Agreement Financing Trust Series 2017-2,
Class A1(a) |
|
| | 3,750,000 | | | | 1.781 | | | | 08/12/19 | | | | 3,750,304 | |
| | |
| | |
| 74 | | The accompanying notes are an integral part of these financial statements. |
GOLDMAN SACHS SHORT DURATION INCOME FUND
| | | | | | | | | | | | | | |
Principal
Amount | | | Interest
Rate | | | Maturity
Date | | | Value | |
| Mortgage-Backed Obligations – (continued) | |
| Regular Floater – (continued) | |
| Station Place Securitization Trust Series 2015-2, Class A(a)
(1M USD LIBOR + 1.050%) |
|
| $ | 527,472 | | | | 2.279 | % | | | 05/15/18 | | | $ | 527,472 | |
| | | | | | | | | | | | | | |
| | | | | 8,542,979 | |
| | |
| Sequential Fixed Rate – 2.6% | |
| | FHLMC REMIC Series 4619, Class NA | |
| | 2,878,630 | | | | 3.000 | | | | 03/15/44 | | | | 2,935,278 | |
| | FHLMC REMIC Series 4630, Class MC | |
| | 1,605,793 | | | | 4.000 | | | | 08/15/54 | | | | 1,699,514 | |
| | FHLMC REMIC Series 4649, Class ML | |
| | 11,682,529 | | | | 4.000 | | | | 11/15/54 | | | | 12,364,219 | |
| | FNMA REMIC Series 2012-111, Class B | |
| | 35,016 | | | | 7.000 | | | | 10/25/42 | | | | 40,279 | |
| | FNMA REMIC Series 2012-153, Class B | |
| | 121,574 | | | | 7.000 | | | | 07/25/42 | | | | 141,055 | |
| | | | | | | | | | | | | | |
| | | | | 17,180,345 | |
| | |
| Sequential Floating Rate(a) – 0.1% | |
| | New Residential Mortgage Loan Trust Series 2015-1A, Class A1 | |
| | 436,583 | | | | 3.750 | | | | 05/28/52 | | | | 448,399 | |
| | |
| | Springleaf Mortgage Loan Trust Series 2013-2A, Class A | |
| | 102,146 | | | | 1.780 | | | | 12/25/65 | | | | 102,089 | |
| | | | | | | | | | | | | | |
| | | | | | | | | | | | | 550,488 | |
| | |
| TOTAL COLLATERALIZED
MORTGAGE OBLIGATIONS |
| | $ | 32,749,434 | |
| | |
| Commercial Mortgage-Backed Securities – 0.1% | |
| Sequential Fixed Rate – 0.1% | |
| FHLMC Multifamily Structured Pass-Through Certificates
Series K707, Class A2 |
|
| $ | 100,000 | | | | 2.220 | % | | | 12/25/18 | | | $ | 100,414 | |
| FHLMC Multifamily Structured Pass-Through Certificates
Series K710, Class A2 |
|
| | 100,000 | | | | 1.883 | | | | 05/25/19 | | | | 99,937 | |
| FHLMC Multifamily Structured Pass-Through Certificates
Series K030, Class A1 |
|
| | 206,986 | | | | 2.779 | | | | 09/25/22 | | | | 210,395 | |
| | |
| TOTAL COMMERCIAL MORTGAGE-
BACKED SECURITIES |
| | $ | 410,746 | |
| | |
| Federal Agencies – 6.6% | |
| FHLMC – 0.1% | |
| $ | 150,105 | | | | 7.000 | % | | | 02/01/39 | | | $ | 174,728 | |
| | 1,000,000 | | | | 3.500 | | | | TBA-30yr | (h) | | | 1,031,094 | |
| | | | | | | | | | | | | | |
| | | | | 1,205,822 | |
| | |
| FNMA – 5.9% | |
| | 5,413 | | | | 6.000 | | | | 11/01/23 | | | | 6,089 | |
| | 1,845,354 | | | | 6.000 | | | | 02/01/24 | | | | 2,075,673 | |
| | 1,287,345 | | | | 6.000 | | | | 01/01/28 | | | | 1,448,041 | |
| | 858,959 | | | | 6.000 | | | | 08/01/28 | | | | 966,167 | |
| | 23,427 | | | | 6.000 | | | | 01/01/29 | | | | 26,351 | |
| | 1,758 | | | | 6.000 | | | | 10/01/31 | | | | 1,784 | |
| | 43,279 | | | | 6.000 | | | | 01/01/32 | | | | 49,456 | |
| | 9,220 | | | | 6.000 | | | | 11/01/32 | | | | 10,420 | |
| | 687,028 | | | | 6.000 | | | | 12/01/32 | | | | 767,086 | |
| | 5,491,320 | | | | 6.000 | | | | 05/01/34 | | | | 6,221,805 | |
| | 9,658 | | | | 6.000 | | | | 11/01/34 | | | | 10,970 | |
| | |
| Mortgage-Backed Obligations – (continued) | |
| FNMA – (continued) | |
| 43,990 | | | | 6.000 | | | | 06/01/35 | | | | 50,147 | |
| | 531,552 | | | | 6.000 | | | | 10/01/35 | | | | 605,884 | |
| | 1,926,809 | | | | 6.000 | | | | 11/01/35 | | | | 2,196,518 | |
| | 99,844 | | | | 6.000 | | | | 12/01/35 | | | | 114,027 | |
| | 2,503 | | | | 6.000 | | | | 01/01/36 | | | | 2,840 | |
| | 9,458 | | | | 6.000 | | | | 02/01/36 | | | | 10,732 | |
| | 3,039 | | | | 6.000 | | | | 03/01/36 | | | | 3,453 | |
| | 1,407,804 | | | | 6.000 | | | | 05/01/36 | | | | 1,600,363 | |
| | 78,061 | | | | 6.000 | | | | 06/01/36 | | | | 88,973 | |
| | 925,947 | | | | 6.000 | | | | 07/01/36 | | | | 1,052,416 | |
| | 77,037 | | | | 6.000 | | | | 08/01/36 | | | | 87,685 | |
| | 1,452,741 | | | | 6.000 | | | | 09/01/36 | | | | 1,653,145 | |
| | 2,642,809 | | | | 6.000 | | | | 10/01/36 | | | | 3,008,968 | |
| | 58,666 | | | | 6.000 | | | | 11/01/36 | | | | 66,757 | |
| | 749,354 | | | | 6.000 | | | | 02/01/37 | | | | 838,043 | |
| | 11,193 | | | | 6.000 | | | | 03/01/37 | | | | 12,708 | |
| | 57,239 | | | | 6.000 | | | | 05/01/37 | | | | 65,115 | |
| | 612,363 | | | | 6.000 | | | | 11/01/37 | | | | 697,218 | |
| | 99,320 | | | | 6.000 | | | | 12/01/37 | | | | 112,853 | |
| | 226,653 | | | | 6.000 | | | | 03/01/38 | | | | 257,830 | |
| | 380,638 | | | | 6.000 | | | | 04/01/38 | | | | 432,409 | |
| | 1,608,690 | | | | 6.000 | | | | 05/01/38 | | | | 1,827,618 | |
| | 10,122 | | | | 6.000 | | | | 07/01/38 | | | | 11,490 | |
| | 738,348 | | | | 6.000 | | | | 09/01/38 | | | | 838,633 | |
| | 232,190 | | | | 6.000 | | | | 10/01/38 | | | | 263,502 | |
| | 950,378 | | | | 6.000 | | | | 11/01/38 | | | | 1,080,375 | |
| | 162,110 | | | | 6.000 | | | | 12/01/38 | | | | 184,252 | |
| | 743,675 | | | | 6.000 | | | | 01/01/39 | | | | 845,640 | |
| | 84,736 | | | | 7.000 | | | | 03/01/39 | | | | 98,187 | |
| | 530,456 | | | | 6.000 | | | | 09/01/39 | | | | 602,582 | |
| | 771,583 | | | | 6.000 | | | | 06/01/40 | | | | 876,490 | |
| | 1,188,444 | | | | 6.000 | | | | 10/01/40 | | | | 1,349,134 | |
| | 5,342,262 | | | | 6.000 | | | | 05/01/41 | | | | 6,067,836 | |
| | 55,614 | | | | 6.000 | | | | 06/01/41 | | | | 63,173 | |
| | | | | | | | | | | | | | |
| | | | | 38,650,838 | |
| | |
| GNMA – 0.6% | |
| | 3,105,198 | | | | 4.000 | | | | 10/20/43 | | | | 3,295,392 | |
| | 654,654 | | | | 4.000 | | | | 10/20/45 | | | | 693,524 | |
| | | | | | | | | | | | | | |
| | | | | | | | | | | | | 3,988,916 | |
| | |
| | TOTAL FEDERAL AGENCIES | | | $ | 43,845,576 | |
| | |
| | TOTAL MORTGAGE-BACKED OBLIGATIONS | |
| | (Cost $76,752,434) | | | $ | 77,005,756 | |
| | |
| | | | | | | | | | | | | | |
| Agency Debenture – 0.4% | |
| | FHLB | |
| $ | 2,685,000 | | | | 1.625 | % | | | 06/14/19 | | | $ | 2,689,591 | |
| | |
| | | | | | | | | | | | | | |
| Asset-Backed Securities – 23.7% | |
| Automotive – 1.3% | | | | |
| | Ally Master Owner Trust Series 2015-2, Class A2 | |
| $ | 2,050,000 | | | | 1.830 | % | | | 01/15/21 | | | $ | 2,049,097 | |
| | Ford Credit Auto Owner Trust Series 2016-2, Class A(a) | |
| | 1,400,000 | | | | 2.030 | | | | 12/15/27 | | | | 1,389,126 | |
| | |
| | |
| The accompanying notes are an integral part of these financial statements. | | 75 |
GOLDMAN SACHS SHORT DURATION INCOME FUND
Schedule of Investments (continued)
September 30, 2017 (Unaudited)
| | | | | | | | | | | | | | |
Principal
Amount | | | Interest
Rate | | | Maturity
Date | | | Value | |
| Asset-Backed Securities – (continued) | |
| Automotive – (continued) | | | | |
| Ford Credit Floorplan Master Owner Trust Series 2016-5,
Class A1 |
|
| $ | 3,850,000 | | | | 1.950 | % | | | 11/15/21 | | | $ | 3,851,637 | |
| GMF Floorplan Owner Revolving Trust Series 2016-1,
Class A1(a) |
|
| | 1,350,000 | | | | 1.960 | | | | 05/17/21 | | | | 1,352,543 | |
| | | | | | | | | | | | | | |
| | | | | 8,642,403 | |
| | |
| Collateralized Loan Obligations(a) – 11.8% | |
| ACIS CLO Ltd. Series 2013-1A, Class A1 (3M USD LIBOR +
0.870%) |
|
| | 1,402,206 | | | | 2.028 | | | | 04/18/24 | | | | 1,402,998 | |
| ACIS CLO Ltd. Series 2013-1A, Class B (3M USD LIBOR +
1.950%) |
|
| | 313,530 | | | | 3.108 | | | | 04/18/24 | | | | 313,609 | |
| ACIS CLO Ltd. Series 2013-1A, Class C (3M USD LIBOR +
2.950%) |
|
| | 198,030 | | | | 4.108 | | | | 04/18/24 | | | | 198,450 | |
| ACIS CLO Ltd. Series 2013-2A, Class C1R (3M USD LIBOR +
1.300%) |
|
| | 129,943 | | | | 2.459 | | | | 10/14/22 | | | | 129,957 | |
| AIMCO CLO Series 2017-AA, Class A (3M USD LIBOR +
1.260%) |
|
| | 3,150,000 | | | | 2.593 | | | | 07/20/29 | | | | 3,151,531 | |
| Apidos CLO X Series 2012-10A, Class A (3M USD LIBOR +
1.420%) |
|
| | 1,523,292 | | | | 2.590 | | | | 10/30/22 | | | | 1,524,882 | |
| Atrium X CLO Series 2017-10A, Class AR (3M USD LIBOR +
0.950%) |
|
| | 3,050,000 | | | | 2.036 | | | | 07/16/25 | | | | 3,056,847 | |
| B&M CLO Ltd. Series 2014-1A, Class A1 (3M USD LIBOR +
1.400%) |
|
| | 600,000 | | | | 2.558 | | | | 04/16/26 | | | | 599,861 | |
| B&M CLO Ltd. Series 2014-1A, Class A2 (3M USD LIBOR +
1.950%) |
|
| | 100,000 | | | | 3.108 | | | | 04/16/26 | | | | 99,999 | |
| Babson CLO Ltd. Series 2014-3A, Class AR (3M USD LIBOR +
1.320%) |
|
| | 3,250,000 | | | | 2.478 | | | | 01/15/26 | | | | 3,278,594 | |
| BlueMountain CLO Ltd. Series 2014-2A, Class AR (3M USD
LIBOR + 0.930%) |
|
| | 3,150,000 | | | | 2.237 | | | | 07/20/26 | | | | 3,162,471 | |
| Bowman Park CLO Ltd. Series 2014-1A, Class AR (3M USD
LIBOR + 1.180%) |
|
| | 1,650,000 | | | | 2.366 | | | | 11/23/25 | | | | 1,656,805 | |
| Cedar Funding II CLO Ltd. Series 2013-1A, Class A1R (3M USD
LIBOR + 1.230%) |
|
| | 3,100,000 | | | | 2.519 | | | | 06/09/30 | | | | 3,109,331 | |
| Cedar Funding V CLO Ltd. Series 2016-5A, Class A1 (3M USD
LIBOR + 1.610%) |
|
| | 3,400,000 | | | | 2.768 | | | | 07/17/28 | | | | 3,428,893 | |
| Crown Point CLO Ltd. Series 2012-1A, Class A1LA (3M USD
LIBOR + 0.750%) |
|
| | 10,229 | | | | 1.922 | | | | 11/21/22 | | | | 10,231 | |
| Crown Point CLO Ltd. Series 2013-2A, Class A1L (3M USD
LIBOR + 0.970%) |
|
| | 2,174,841 | | | | 2.128 | | | | 12/31/23 | | | | 2,169,166 | |
| Cutwater Ltd. Series 2014-1A, Class A1AR (3M USD LIBOR +
1.250%) |
|
| | 3,050,000 | | | | 2.469 | | | | 07/15/26 | | | | 3,056,045 | |
| | |
| Asset-Backed Securities – (continued) | |
| Collateralized Loan Obligations(a) – (continued) | |
| Halcyon Loan Advisors Funding Ltd. Series 2015-2A, Class A
(3M USD LIBOR + 1.390%) |
|
| 1,650,000 | | | | 2.546 | | | | 07/25/27 | | | | 1,647,881 | |
| ICG US CLO Ltd. Series 2014-1A, Class A1 (3M USD LIBOR +
1.150%) |
|
| | 871,175 | | | | 2.306 | | | | 04/20/26 | | | | 868,918 | |
| Jamestown CLO X Ltd. Series 2017-10A, Class A1 (3M USD
LIBOR + 1.250%) |
|
| | 6,250,000 | | | | 2.720 | | | | 07/17/29 | | | | 6,286,000 | |
| LCM XVI LP Series 2017-16A, Class AR (3M USD LIBOR +
1.030%) |
|
| | 6,250,000 | | | | 2.188 | | | | 07/15/26 | | | | 6,256,431 | |
| Neuberger Berman CLO XIX Ltd. Series 2015-19A, Class A1R
(3M USD LIBOR + 1.050%) |
|
| | 3,150,000 | | | | 2.354 | | | | 07/15/27 | | | | 3,155,560 | |
| OCP CLO Ltd. Series 2012-2A, Class A1R (3M USD LIBOR +
1.400%) |
|
| | 200,000 | | | | 2.572 | | | | 11/22/25 | | | | 201,110 | |
| OCP CLO Ltd. Series 2014-5A, Class A1 (3M USD LIBOR +
1.000%) |
|
| | 1,200,000 | | | | 2.167 | | | | 04/26/26 | | | | 1,202,459 | |
| OFSI Fund V Ltd. Series 2013-5A, Class A1LA (3M USD
LIBOR + 0.930%) |
|
| | 180,569 | | | | 2.088 | | | | 04/17/25 | | | | 180,640 | |
| OFSI Fund VI Ltd. Series 2014-6A, Class A1 (3M USD LIBOR +
1.030%) |
|
| | 860,777 | | | | 2.188 | | | | 03/20/25 | | | | 854,681 | |
| Parallel Ltd. Series 2015-1A, Class A (3M USD LIBOR +
1.450%) |
|
| | 1,250,000 | | | | 2.606 | | | | 07/20/27 | | | | 1,250,435 | |
| Parallel Ltd. Series 2017-1A, Class A1 (3M USD LIBOR +
1.310%) |
|
| | 2,700,000 | | | | 2.623 | | | | 07/20/29 | | | | 2,699,965 | |
| | Recette CLO Ltd. Series 2015-1A, Class AR | |
| | 4,550,000 | | | | 0.000 | | | | 10/20/27 | | | | 4,550,000 | |
| Regatta IV Funding Ltd. Series 2014-1A, Class A1R (3M USD
LIBOR + 1.020%) |
|
| | 3,000,000 | | | | 2.176 | | | | 07/25/26 | | | | 3,002,931 | |
| Shackleton CLO Ltd. Series 2014-5A, Class AR (3M USD
LIBOR + 1.140%) |
|
| | 1,300,000 | | | | 2.319 | | | | 05/07/26 | | | | 1,301,876 | |
| Sound Point CLO XI Ltd. Series 2016-1A, Class A (3M USD
LIBOR + 1.650%) |
|
| | 4,150,000 | | | | 2.806 | | | | 07/20/28 | | | | 4,176,929 | |
| TICP CLO VI Ltd. Series 2016-6A, Class A (3M USD LIBOR +
1.550%) |
|
| | 2,600,000 | | | | 2.676 | | | | 01/15/29 | | | | 2,610,010 | |
| Whitehorse Ltd. Series 2014-9A, Class AR (3M USD LIBOR +
1.160%) |
|
| | 3,600,000 | | | | 2.464 | | | | 07/17/26 | | | | 3,604,576 | |
| WhiteHorse VIII Ltd. Series 2014-1A, Class A (3M USD LIBOR
+ 1.500%) |
|
| | 1,250,000 | | | | 2.670 | | | | 05/01/26 | | | | 1,251,563 | |
| Z Capital Credit Partners CLO Ltd. Series 2015-1A, Class A1
(3M USD LIBOR + 1.330%) |
|
| | 1,500,515 | | | | 2.488 | | | | 07/16/27 | | | | 1,504,509 | |
| Zais CLO 1 Ltd. Series 2014-1A, Class A1 (3M USD LIBOR +
1.400%) |
|
| | 661,898 | | | | 2.558 | | | | 04/15/26 | | | | 664,680 | |
| | | | | | | | | | | | | | |
| | | | | 77,620,824 | |
| | |
| | |
| 76 | | The accompanying notes are an integral part of these financial statements. |
GOLDMAN SACHS SHORT DURATION INCOME FUND
| | | | | | | | | | | | | | |
Principal
Amount | | | Interest
Rate | | | Maturity
Date | | | Value | |
| Asset-Backed Securities – (continued) | |
| Credit Card(a) – 2.4% | |
| | CARDS II Trust Series 2016-1A, Class A (1M LIBOR + 0.700%) | |
| $ | 1,750,000 | | | | 1.934 | % | | | 07/15/21 | | | $ | 1,757,267 | |
| | CARDS II Trust Series 2017-1A, Class A (1M LIBOR + 0.370%) | |
| | 2,550,000 | | | | 1.604 | | | | 04/18/22 | | | | 2,556,260 | |
| Evergreen Credit Card Trust Series 2016-1, Class A (1M LIBOR
+ 0.720%) |
|
| | 3,000,000 | | | | 1.954 | | | | 04/15/20 | | | | 3,009,027 | |
| | Golden Credit Card Trust Series 2016-5A, Class A | |
| | 2,600,000 | | | | 1.600 | | | | 09/15/21 | | | | 2,582,315 | |
| | Golden Credit Card Trust Series 2017-2A, Class A | |
| | 2,450,000 | | | | 1.980 | | | | 04/15/22 | | | | 2,450,485 | |
| Trillium Credit Card Trust II Series 2016-1A, Class A (1M
LIBOR + 0.720%) |
|
| | 3,150,000 | | | | 1.958 | | | | 05/26/21 | | | | 3,154,803 | |
| | | | | | | | | | | | | | |
| | | | | 15,510,157 | |
| | |
| Student Loan – 8.2% | |
| Access to Loans for Learning Student Loan Corp. Series 2013-I,
Class A (1M USD LIBOR + 0.800%) |
|
| | 648,562 | | | | 2.034 | | | | 02/25/41 | | | | 648,363 | |
| ECMC Group Student Loan Trust Series 2016-1A, Class A(a) (1M
USD LIBOR + 1.350%) |
|
| | 1,887,861 | | | | 2.584 | | | | 07/26/66 | | | | 1,889,048 | |
| Education Loan Asset-Backed Trust I Series 2013-1, Class A2(a)
(1M USD LIBOR + 0.800%) |
|
| | 4,200,000 | | | | 2.034 | | | | 04/26/32 | | | | 4,133,421 | |
| Educational Funding of the South, Inc. Series 2012-1, Class A
(1M USD LIBOR + 1.050%) |
|
| | 3,078,311 | | | | 2.284 | | | | 03/25/36 | | | | 3,093,839 | |
| Educational Services of America, Inc. Series 2012-1, Class A1(a)
(1M USD LIBOR + 1.150%) |
|
| | 64,876 | | | | 2.384 | | | | 09/25/40 | | | | 65,813 | |
| Educational Services of America, Inc. Series 2014-1, Class A(a)
(1M USD LIBOR + 0.700%) |
|
| | 940,215 | | | | 1.934 | | | | 02/25/39 | | | | 928,263 | |
| Educational Services of America, Inc. Series 2015-2, Class A(a)
(1M USD LIBOR + 1.000%) |
|
| | 1,029,558 | | | | 2.234 | | | | 12/25/56 | | | | 1,034,852 | |
| EFS Volunteer No. 2 LLC Series 2012-1, Class A2(a) (1M USD
LIBOR + 1.350%) |
|
| | 2,700,000 | | | | 2.584 | | | | 03/25/36 | | | | 2,738,002 | |
| EFS Volunteer No. 3 LLC Series 2012-1, Class A2(a) (1M USD
LIBOR + 1.000%) |
|
| | 182,827 | | | | 2.234 | | | | 02/25/25 | | | | 183,194 | |
| EFS Volunteer No. 3 LLC Series 2012-1, Class A3(a) (1M USD
LIBOR + 1.000%) |
|
| | 1,700,000 | | | | 2.234 | | | | 04/25/33 | | | | 1,699,999 | |
| GCO Education Loan Funding Master Trust-II Series 2006-2A,
Class A3L(a) (3M USD LIBOR + 0.120%) |
|
| | 94,608 | | | | 1.309 | | | | 08/25/28 | | | | 94,596 | |
| GCO Education Loan Funding Trust Series 2007-1A,
Class A6L(a) (3M LIBOR + 0.110%) |
|
| | 2,633,863 | | | | 1.427 | | | | 11/25/26 | | | | 2,617,430 | |
| Higher Education Funding I Series 2005-1, Class A4 (3M USD
LIBOR + 0.140%) |
|
| | 85,543 | | | | 1.329 | | | | 02/25/30 | | | | 85,520 | |
| Illinois Student Assistance Commission Series 2010-1, Class A3
(3M USD LIBOR + 0.900%) |
|
| | 1,900,000 | | | | 2.056 | | | | 07/25/45 | | | | 1,906,193 | |
| Kentucky Higher Education Student Loan Corp.
Series 2015-1, Class A1 (1M USD LIBOR + 0.750%) |
|
| | 2,341,600 | | | | 1.982 | | | | 12/01/31 | | | | 2,332,702 | |
| Montana Higher Education Student Assistance Corp.
Series 2012-1, Class A2 (1M USD LIBOR + 1.000%) |
|
| | 2,532,092 | | | | 2.231 | | | | 05/20/30 | | | | 2,545,546 | |
| Navient Student Loan Trust Series 2016-5A, Class A(a) (1M USD
LIBOR + 1.250%) |
|
| | 3,958,031 | | | | 2.484 | | | | 06/25/65 | | | | 4,037,415 | |
| | |
| Asset-Backed Securities – (continued) | |
| Student Loan – (continued) | |
| Navient Student Loan Trust Series 2016-7A, Class A(a) (1M USD
LIBOR + 1.150%) |
|
| 1,989,549 | | | | 2.384 | | | | 03/25/66 | | | | 2,013,654 | |
| Nelnet Student Loan Trust Series 2005-4, Class A3 (3M USD
LIBOR + 0.130%) |
|
| | 167,467 | | | | 1.417 | | | | 06/22/26 | | | | 167,409 | |
| North Carolina State Education Assistance Authority
Series 2010-1, Class A1 (3M USD LIBOR + 0.900%) |
|
| | 1,075,331 | | | | 2.056 | | | | 07/25/41 | | | | 1,071,547 | |
| Northstar Education Finance, Inc. Series 2012-1, Class A(a) (1M
USD LIBOR + 0.700%) |
|
| | 131,001 | | | | 1.934 | | | | 12/26/31 | | | | 129,976 | |
| Pennsylvania Higher Education Assistance Agency Series 12-1A,
Class A1(a) (1M USD LIBOR + 0.550%) |
|
| | 66,261 | | | | 1.784 | | | | 05/25/57 | | | | 65,704 | |
| PHEAA Student Loan Trust Series 2016-1A, Class A(a) (1M USD
LIBOR + 1.150%) |
|
| | 2,026,936 | | | | 2.384 | | | | 09/25/65 | | | | 2,062,945 | |
| SLC Student Loan Center Series 2011-1, Class A(a) (1M USD
LIBOR + 1.220%) |
|
| | 7,469,069 | | | | 2.454 | | | | 10/25/27 | | | | 7,570,000 | |
| SLC Student Loan Trust Series 2005-3, Class A3 (3M USD
LIBOR + 0.120%) |
|
| | 1,400,000 | | | | 1.366 | | | | 06/15/29 | | | | 1,392,311 | |
| SLM Student Loan Trust Series 2003-12, Class A5(a) (3M USD
LIBOR + 0.280%) |
|
| | 194,545 | | | | 1.526 | | | | 09/15/22 | | | | 194,653 | |
| SLM Student Loan Trust Series 2003-14, Class A5 (3M USD
LIBOR + 0.230%) |
|
| | 119,313 | | | | 1.386 | | | | 01/25/23 | | | | 119,372 | |
| SLM Student Loan Trust Series 2004-1, Class A3 (3M USD
LIBOR + 0.210%) |
|
| | 490,110 | | | | 1.366 | | | | 04/25/23 | | | | 490,257 | |
| SLM Student Loan Trust Series 2004-8A, Class A5(a) (3M USD
LIBOR + 0.500%) |
|
| | 756,390 | | | | 1.656 | | | | 04/25/24 | | | | 758,810 | |
| SLM Student Loan Trust Series 2005-5, Class A4 (3M USD
LIBOR + 0.140%) |
|
| | 1,400,000 | | | | 1.296 | | | | 10/25/28 | | | | 1,393,076 | |
| SLM Student Loan Trust Series 2006-2, Class A5 (3M USD
LIBOR + 0.110%) |
|
| | 906,159 | | | | 1.266 | | | | 07/25/25 | | | | 906,113 | |
| SLM Student Loan Trust Series 2007-7, Class A4 (3M USD
LIBOR + 0.330%) |
|
| | 1,095,428 | | | | 1.486 | | | | 01/25/22 | | | | 1,078,946 | |
| SLM Student Loan Trust Series 2008-4, Class A4 (3M USD
LIBOR + 1.650%) |
|
| | 410,594 | | | | 2.806 | | | | 07/25/22 | | | | 420,398 | |
| SLM Student Loan Trust Series 2012-3, Class A (1M USD
LIBOR + 0.650%) |
|
| | 1,300,806 | | | | 1.884 | | | | 12/26/25 | | | | 1,310,761 | |
| South Texas Higher Education Authority, Inc. Series 2012-1,
Class A2 (3M USD LIBOR + 0.850%) |
|
| | 975,908 | | | | 1.998 | | | | 10/01/24 | | | | 979,487 | |
| Utah State Board of Regents Series 2011-1, Class A3 (3M USD
LIBOR + 0.850%) |
|
| | 1,200,000 | | | | 2.020 | | | | 05/01/35 | | | | 1,185,108 | |
| Wachovia Student Loan Trust Series 2005-1, Class A5 (3M USD
LIBOR + 0.130%) |
|
| | 122,153 | | | | 1.286 | | | | 01/26/26 | | | | 122,115 | |
| | | | | | | | | | | | | | |
| | | | | | | | | | | | | 53,466,838 | |
| | |
| | TOTAL ASSET-BACKED SECURITIES | |
| | (Cost $154,228,124) | | | $ | 155,240,222 | |
| | |
| | |
| The accompanying notes are an integral part of these financial statements. | | 77 |
GOLDMAN SACHS SHORT DURATION INCOME FUND
Schedule of Investments (continued)
September 30, 2017 (Unaudited)
| | | | | | | | | | | | | | |
Principal
Amount | | | Interest
Rate | | | Maturity
Date | | | Value | |
| Foreign Debt Obligations – 1.6% | |
| Sovereign – 1.6% | | | | |
| | Dominican Republic | |
| $ | 91,810 | | | | 9.040 | % | | | 01/23/18 | | | $ | 93,187 | |
| | 1,210,000 | | | | 7.500 | | | | 05/06/21 | | | | 1,341,588 | |
| | 520,000 | | | | 5.500 | (a) | | | 01/27/25 | | | | 548,600 | |
| | Perusahaan Penerbit SBSN(a) | |
| | 820,000 | | | | 4.150 | | | | 03/29/27 | | | | 845,469 | |
| | Republic of Argentina | |
| EUR | 40,000 | | | | 2.260 | (i) | | | 12/31/38 | | | | 32,266 | |
| $ | 70,000 | | | | 2.500 | (i) | | | 12/31/38 | | | | 49,525 | |
| | 1,370,000 | | | | 7.125 | (a) | | | 06/28/17 | (e) | | | 1,367,260 | |
| | Republic of Ecuador | |
| | 480,000 | | | | 9.650 | | | | 12/13/26 | | | | 504,000 | |
| | 200,000 | | | | 9.625 | (a) | | | 06/02/27 | | | | 209,000 | |
| | 390,000 | | | | 9.625 | | | | 06/02/27 | | | | 407,550 | |
| | Republic of Indonesia | |
| | 600,000 | | | | 6.875 | (a) | | | 01/17/18 | | | | 609,660 | |
| | 320,000 | | | | 6.875 | | | | 01/17/18 | | | | 325,152 | |
| | 200,000 | | | | 5.875 | | | | 01/15/24 | | | | 229,270 | |
| EUR | 250,000 | | | | 2.150 | (a) | | | 07/18/24 | | | | 303,970 | |
| $ | 200,000 | | | | 4.750 | (a) | | | 01/08/26 | | | | 218,062 | |
| | 840,000 | | | | 3.850 | (a) | | | 07/18/27 | | | | 864,066 | |
| | Republic of South Africa | |
| ZAR | 4,500,000 | | | | 7.000 | | | | 02/28/31 | | | | 276,810 | |
| | 8,525,000 | | | | 8.250 | | | | 03/31/32 | | | | 575,572 | |
| | 1,570,000 | | | | 8.875 | | | | 02/28/35 | | | | 109,569 | |
| | 1,810,000 | | | | 8.500 | | | | 01/31/37 | | | | 120,354 | |
| | 900,000 | | | | 6.500 | | | | 02/28/41 | | | | 47,120 | |
| | 870,000 | | | | 8.750 | | | | 01/31/44 | | | | 58,050 | |
| | 2,747,000 | | | | 8.750 | | | | 02/28/48 | | | | 183,510 | |
| | United Mexican States | |
| MXN | 10,679,700 | | | | 6.500 | | | | 06/10/21 | | | | 582,061 | |
| | 11,540,800 | | | | 6.500 | | | | 06/09/22 | | | | 627,684 | |
| | 1,916,700 | | | | 8.000 | | | | 12/07/23 | | | | 111,838 | |
| | 46,900 | | | | 8.000 | | | | 11/07/47 | | | | 2,807 | |
| | |
| | TOTAL FOREIGN DEBT OBLIGATIONS | |
| | (Cost $10,354,913) | | | $ | 10,644,000 | |
| | |
| | | | | | | | | | | | | | |
| Structured Notes(j) – 0.6% | |
| | Arab Republic of Egypt (Issuer Citibank NA) | |
| $ | 7,920,000 | | | | 0.000 | (a) | | | 11/02/17 | | | $ | 441,604 | |
| | 9,200,000 | | | | 0.000 | | | | 11/09/17 | | | | 511,124 | |
| | 14,570,000 | | | | 0.000 | (a) | | | 05/03/18 | | | | 745,645 | |
| | 18,450,000 | | | | 0.000 | (a) | | | 05/10/18 | | | | 938,358 | |
| | |
| | Arab Republic of Egypt (Issuer HSBC Bank PLC)(a) | |
| | 9,700,000 | | | | 0.000 | | | | 06/07/18 | | | | 489,677 | |
| | Arab Republic of Egypt (Issuer JPMorgan Chase Bank NA)(a) | |
| | 6,275,000 | | | | 0.000 | | | | 02/15/18 | | | | 332,834 | |
| | 5,100,000 | | | | 0.000 | | | | 05/17/18 | | | | 259,253 | |
| | 5,100,000 | | | | 0.000 | | | | 07/26/18 | | | | 251,374 | |
| | |
| | TOTAL STRUCTURED NOTES | |
| | (Cost $3,931,088) | | | $ | 3,969,869 | |
| | |
| | | | | | | | | | | | | | |
| Municipal Debt Obligations(b) – 2.6% | |
| Florida – 1.9% | | | | |
| Florida State Board of Administration Finance Corp. Series 2016,
Class A |
|
| $ | 12,625,000 | | | | 2.638 | % | | | 07/01/21 | | | $ | 12,691,786 | |
| | | | | | | | | | | | | | |
| | | | | | | | | | | | | 12,691,786 | |
| | |
| New Hampshire(d) – 0.3% | | | | |
| New Hampshire Higher Education Loan Corp. Series 2011-1,
Class A3 |
|
| | 1,800,000 | | | | 2.164 | | | | 10/25/37 | | | | 1,760,653 | |
| | | | | | | | | | | | | | |
| | | | | | | | | | | | | 1,760,653 | |
| | |
| Puerto Rico(k) – 0.2% | | | | |
| Puerto Rico Commonwealth Aqueduct & Sewer Authority RB
(Senior Lien) Series 2008 A |
|
| | 45,000 | | | | 6.000 | | | | 07/01/38 | | | | 34,087 | |
| | 15,000 | | | | 6.000 | | | | 07/01/44 | | | | 11,288 | |
| Puerto Rico Commonwealth Aqueduct & Sewer Authority RB
(Senior Lien) Series 2012 A |
|
| | 15,000 | | | | 5.500 | | | | 07/01/28 | | | | 11,250 | |
| | 20,000 | | | | 5.750 | | | | 07/01/37 | | | | 14,500 | |
| | 35,000 | | | | 5.250 | | | | 07/01/42 | | | | 25,025 | |
| | 25,000 | | | | 6.000 | | | | 07/01/47 | | | | 18,438 | |
| Puerto Rico Commonwealth Aqueduct & Sewer Authority RB
(Senior Lien) Series 2012 D |
|
| | 50,000 | | | | 5.000 | | | | 07/01/33 | | | | 35,750 | |
| Puerto Rico Commonwealth GO Bonds for Public Improvement
Series 2011 A |
|
| | 10,000 | | | | 5.750 | | | | 07/01/41 | | | | 4,625 | |
| Puerto Rico Commonwealth GO Bonds Refunding for Public
Improvement Series 2008 A |
|
| | 35,000 | | | | 5.500 | | | | 07/01/32 | | | | 16,144 | |
| Puerto Rico Commonwealth GO Bonds Refunding for Public
Improvement Series 2009 B |
|
| | 10,000 | | | | 5.875 | | | | 07/01/36 | | | | 4,675 | |
| Puerto Rico Commonwealth GO Bonds Refunding for Public
Improvement Series 2011 A |
|
| | 10,000 | | | | 6.000 | | | | 07/01/34 | | | | 4,475 | |
| Puerto Rico Commonwealth GO Bonds Refunding for Public
Improvement Series 2012 A |
|
| | 10,000 | | | | 5.500 | | | | 07/01/26 | | | | 4,675 | |
| | 165,000 | | | | 5.500 | | | | 07/01/39 | | | | 77,137 | |
| | 180,000 | | | | 5.000 | | | | 07/01/41 | | | | 81,675 | |
| | Puerto Rico Commonwealth GO Bonds Series 2014 A | |
| | 615,000 | | | | 8.000 | | | | 07/01/35 | | | | 298,275 | |
| Puerto Rico Commonwealth GO Bonds Unrefunded Balance for
Public Improvement Series 2006 A |
|
| | 10,000 | | | | 5.250 | | | | 07/01/27 | | | | 4,650 | |
| Puerto Rico Sales Tax Financing Corp. Sales Tax RB Capital
Appreciation Series 2010 A(j) |
|
| | 10,000 | | | | 0.000 | | | | 08/01/35 | | | | 634 | |
| Puerto Rico Sales Tax Financing Corp. Sales Tax RB Capital
Appreciation SubSeries 2010 C(j) |
|
| | 10,000 | | | | 0.000 | | | | 08/01/37 | | | | 570 | |
| | 10,000 | | | | 0.000 | | | | 08/01/38 | | | | 534 | |
| Puerto Rico Sales Tax Financing Corp. Sales Tax RB
SubSeries 2009 A |
|
| | 10,000 | | | | 5.250 | | | | 08/01/27 | | | | 2,075 | |
| | 200,000 | | | | 6.750 | | | | 08/01/32 | | | | 42,000 | |
| | 60,000 | | | | 5.750 | | | | 08/01/37 | | | | 12,450 | |
| | 5,000 | | | | 6.375 | | | | 08/01/39 | | | | 1,050 | |
| | 465,000 | | | | 6.000 | | | | 08/01/42 | | | | 96,487 | |
| | |
| | |
| 78 | | The accompanying notes are an integral part of these financial statements. |
GOLDMAN SACHS SHORT DURATION INCOME FUND
| | | | | | | | | | | | | | |
Principal
Amount | | | Interest
Rate | | | Maturity
Date | | | Value | |
| Municipal Debt Obligations(b) – (continued) | |
| Puerto Rico – (continued) | | | | |
| Puerto Rico Sales Tax Financing Corp. Sales Tax RB
SubSeries 2010 A |
|
| $ | 25,000 | | | | 0.000 | % | | | 08/01/33 | | | $ | 4,438 | |
| | 345,000 | | | | 5.500 | | | | 08/01/37 | | | | 71,587 | |
| | 580,000 | | | | 5.375 | (k) | | | 08/01/39 | | | | 120,350 | |
| | 105,000 | | | | 5.500 | | | | 08/01/42 | | | | 21,787 | |
| Puerto Rico Sales Tax Financing Corp. Sales Tax RB
SubSeries 2010 C |
|
| | 25,000 | | | | 5.000 | | | | 08/01/35 | | | | 5,188 | |
| | 95,000 | | | | 5.375 | | | | 08/01/38 | | | | 19,713 | |
| | 5,000 | | | | 6.000 | (k) | | | 08/01/39 | | | | 1,038 | |
| | 665,000 | | | | 5.250 | | | | 08/01/41 | | | | 137,987 | |
| Puerto Rico Sales Tax Financing Corp. Sales Tax RB
SubSeries 2011 A-1 |
|
| | 230,000 | | | | 5.000 | | | | 08/01/43 | | | | 47,725 | |
| | 165,000 | | | | 5.250 | | | | 08/01/43 | | | | 34,237 | |
| Puerto Rico Sales Tax Financing Corp. Sales Tax RB Unrefunded
SubSeries 2009 A |
|
| | 120,000 | | | | 5.500 | | | | 08/01/28 | | | | 24,900 | |
| | | | | | | | | | | | | | |
| | | | | | | | | | | | | 1,291,419 | |
| | |
| Utah – 0.2% | | | | |
| Utah State Board of Regents Student Loan RB (Taxable)
Series 2011-A2 |
|
| | 1,056,964 | | | | 2.161 | | | | 05/01/29 | | | | 1,060,262 | |
| | | | | | | | | | | | | | |
| | | | | | | | | | | | | 1,060,262 | |
| | |
| | TOTAL MUNICIPAL DEBT OBLIGATIONS | |
| | (Cost $18,208,206) | | | $ | 16,804,120 | |
| | |
| | | | | | | | | | | | | | |
| U.S. Treasury Obligations – 4.1% | |
| | United States Treasury Bonds | |
| $ | 520,000 | | | | 2.750 | % | | | 11/15/42 | | | $ | 513,573 | |
| | 470,000 | | | | 3.125 | | | | 02/15/43 | | | | 496,146 | |
| | 1,010,000 | | | | 3.625 | (l) | | | 02/15/44 | | | | 1,161,167 | |
| | 540,000 | | | | 3.125 | | | | 08/15/44 | | | | 569,873 | |
| | 50,000 | | | | 3.000 | | | | 11/15/44 | | | | 51,541 | |
| | United States Treasury Inflation Indexed Bonds | |
| | 9,213,039 | | | | 0.125 | | | | 04/15/18 | | | | 9,220,686 | |
| | 5,014,512 | | | | 0.125 | | | | 04/15/19 | | | | 5,034,720 | |
| | 5,466,971 | | | | 0.125 | (l) | | | 04/15/20 | | | | 5,495,564 | |
| | 1,751,374 | | | | 0.625 | | | | 01/15/26 | | | | 1,775,893 | |
| | 571,894 | | | | 0.125 | | | | 07/15/26 | | | | 556,470 | |
| | |
| | United States Treasury Notes | |
| | 490,000 | | | | 1.375 | (l) | | | 04/30/21 | | | | 483,801 | |
| | 1,200,000 | | | | 2.375 | | | | 08/15/24 | | | | 1,216,920 | |
| | |
| TOTAL U.S. TREASURY
OBLIGATIONS |
| | | | |
| | (Cost $26,498,701) | | | $ | 26,576,354 | |
| | |
| Shares | | | Distribution
Rate | | | Value | |
| Investment Company(m) – 1.0% | |
| Goldman Sachs Financial Square Government Fund –
Institutional Shares |
|
| | 6,812,687 | | | | 0.927% | | | $ | 6,812,687 | |
| | (Cost $6,812,687) | |
| | |
| TOTAL INVESTMENTS BEFORE
SHORT-TERM INVESTMENTS |
| | | | |
| | (Cost $631,606,822) | | | $ | 633,216,254 | |
| | |
| Short-term Investments(j) – 1.1% | |
| Commercial Paper – 1.1% | |
| | Electricite de France SA | |
| $ | 2,700,000 | | | | 0.000 | % | | | 01/05/18 | | | $ | 2,688,725 | |
| | Dominion Energy, Inc. | |
| | 2,000,000 | | | | 0.000 | | | | 10/12/17 | | | | 1,999,007 | |
| | VW Credit, Inc. | |
| | 3,000,000 | | | | 0.000 | | | | 10/11/17 | | | | 2,998,628 | |
| | |
| | TOTAL SHORT-TERM INVESTMENTS | | | | | |
| | (Cost $7,684,370) | | | $ | 7,686,360 | |
| | |
| | TOTAL INVESTMENTS – 97.7% | | | | | |
| | (Cost $639,291,192) | | | $ | 640,902,614 | |
| | |
| OTHER ASSETS IN EXCESS OF
LIABILITIES – 2.3% |
| | | 14,780,103 | |
| | |
| | NET ASSETS – 100.0% | | | $ | 655,682,717 | |
| | |
| | |
| The percentage shown for each investment category reflects the value of investments in that category as a percentage of net assets. |
(a) | | Exempt from registration under Rule 144A of the Securities Act of 1933. Such securities may be deemed liquid by the investment adviser and may be resold, normally to qualified institutional buyers in transactions exempt from registration. Total market value of Rule 144A securities amounts to $209,414,288, which represents approximately 31.9% of net assets as of September 30, 2017 and are unaudited. |
(b) | | Security with “Call” features with resetting interest rates. Maturity dates disclosed are the final maturity dates. |
(c) | | Guaranteed by a foreign government until maturity. |
(d) | | Variable rate security. Interest rate or distribution rate disclosed is that which is in effect on September 30, 2017. |
(e) | | Actual maturity date is 06/28/2117. |
(f) | | Security with a notional or nominal principal amount. The actual effective yield of this security is different than the stated interest rate. |
(g) | | Significant unobservable inputs were used in the valuation of this portfolio security; i.e. Level 3. |
(h) | | TBA (To Be Announced) Securities are purchased on a forward commitment basis with an approximate principal amount and no defined maturity date. The actual principal and maturity date will be determined upon settlement when the specific mortgage pools are assigned. Total market value of TBA securities (excluding forward sales contracts, if any) amounts to $1,031,094 which represents approximately 0.2% of net assets as of September 30, 2017. |
(i) | | Coupon changes periodically based upon a predetermined schedule. Interest rate disclosed is that which is in effect on September 30, 2017. |
(j) | | Issued with a zero coupon. Income is recognized through the accretion of discount. |
(k) | | Security is currently in default and/or non-income producing. |
(l) | | All or a portion of security is segregated as collateral for initial margin requirements on futures transactions. |
(m) | | Represents an Affiliated Issuer. |
| | |
|
Currency Abbreviations: |
ARS | | —Argentine Peso |
AUD | | —Australian Dollar |
BRL | | —Brazilian Real |
CAD | | —Canadian Dollar |
CHF | | —Swiss Franc |
CLP | | —Chilean Peso |
CNH | | —Chinese Yuan Renminbi Offshore |
CNY | | —Chinese Yuan Renminbi |
COP | | —Colombian Peso |
CZK | | —Czech Koruna |
| | |
| The accompanying notes are an integral part of these financial statements. | | 79 |
GOLDMAN SACHS SHORT DURATION INCOME FUND
Schedule of Investments (continued)
September 30, 2017 (Unaudited)
| | |
EGP | | —Egyptian Pound |
EUR | | —Euro |
GBP | | —British Pound |
HKD | | —Hong Kong Dollar |
HUF | | —Hungarian Forint |
IDR | | —Indonesian Rupiah |
INR | | —Indian Rupee |
JPY | | —Japanese Yen |
KRW | | —South Korean Won |
MXN | | —Mexican Peso |
NOK | | —Norwegian Krone |
NZD | | —New Zealand Dollar |
PEN | | —Peruvian Nuevo Sol |
PHP | | —Philippine Peso |
PLN | | —Polish Zloty |
RUB | | —Russian Ruble |
SEK | | —Swedish Krona |
SGD | | —Singapore Dollar |
THB | | —Thai Baht |
TRY | | —Turkish Lira |
TWD | | —Taiwan Dollar |
USD | | —U.S. Dollar |
ZAR | | —South African Rand |
| | |
Investment Abbreviations: |
AUDOR | | —Australian Dollar Offered Rate |
BP | | —British Pound Offered Rate |
CDOR | | —Canadian Dollar Offered Rate |
CHFOR | | —Swiss Franc Offered Rate |
CLO | | —Collateralized Loan Obligation |
EURO | | —Euro Offered Rate |
FHLB | | —Federal Home Loan Bank |
FHLMC | | —Federal Home Loan Mortgage Corp. |
FNMA | | —Federal National Mortgage Association |
GNMA | | —Government National Mortgage Association |
GO | | —General Obligation |
JYOR | | —Japanese Yen Offered Rate |
LIBOR | | —London Interbank Offered Rate |
LLC | | —Limited Liability Company |
LP | | —Limited Partnership |
NZDOR | | —New Zealand Dollar Offered Rate |
OTC | | —Over the Counter |
PLC | | —Public Limited Company |
RB | | —Revenue Bond |
REIT | | —Real Estate Investment Trust |
REMIC | | —Real Estate Mortgage Investment Conduit |
STIBOR | | —Stockholm Interbank Offered Rate |
STRIPS | | —Separate Trading of Registered Interest and Principal of Securities |
TIIE | | —La Tasa de Interbank Equilibrium Interest Rate |
|
|
| ADDITIONAL INVESTMENT INFORMATION |
FORWARD FOREIGN CURRENCY EXCHANGE CONTRACTS — At September 30, 2017, the Fund had the following forward foreign currency exchange contracts:
FORWARD FOREIGN CURRENCY EXCHANGE CONTRACTS WITH UNREALIZED GAIN
| | | | | | | | | | | | | | | | | | | | | | | | |
| Counterparty | | Currency
Purchased | | | Currency
Sold | | | Current
Value | | | Settlement
Date | | | Unrealized
Gain | |
Morgan Stanley & Co. International PLC | | ARS | | | 6,595,013 | | | USD | | | 375,000 | | | $ | 379,875 | | | | 10/05/17 | | | $ | 4,875 | |
| | ARS | | | 10,131,171 | | | USD | | | 578,877 | | | | 583,223 | | | | 10/06/17 | | | | 4,346 | |
| | ARS | | | 13,396,335 | | | USD | | | 745,517 | | | | 769,417 | | | | 10/10/17 | | | | 23,900 | |
| | ARS | | | 2,526,564 | | | USD | | | 144,623 | | | | 145,030 | | | | 10/11/17 | | | | 407 | |
| | ARS | | | 1,223,375 | | | USD | | | 69,967 | | | | 70,184 | | | | 10/12/17 | | | | 217 | |
| | ARS | | | 10,617,547 | | | USD | | | 595,298 | | | | 605,299 | | | | 10/23/17 | | | | 10,001 | |
| | ARS | | | 6,113,781 | | | USD | | | 348,106 | | | | 348,145 | | | | 10/25/17 | | | | 40 | |
| | ARS | | | 4,728,121 | | | USD | | | 264,236 | | | | 268,475 | | | | 10/30/17 | | | | 4,240 | |
| | ARS | | | 8,661,861 | | | USD | | | 482,018 | | | | 491,574 | | | | 11/01/17 | | | | 9,556 | |
| | ARS | | | 4,997,842 | | | USD | | | 280,364 | | | | 283,480 | | | | 11/02/17 | | | | 3,116 | |
| | ARS | | | 6,364,790 | | | USD | | | 357,713 | | | | 360,027 | | | | 11/07/17 | | | | 2,313 | |
| | ARS | | | 6,321,547 | | | USD | | | 356,143 | | | | 357,385 | | | | 11/08/17 | | | | 1,242 | |
| | ARS | | | 10,711,283 | | | USD | | | 602,018 | | | | 603,906 | | | | 11/13/17 | | | | 1,888 | |
| | ARS | | | 4,364,445 | | | USD | | | 244,918 | | | | 245,534 | | | | 11/17/17 | | | | 615 | |
| | ARS | | | 3,599,511 | | | USD | | | 199,585 | | | | 201,732 | | | | 11/24/17 | | | | 2,148 | |
| | AUD | | | 1,241,690 | | | USD | | | 971,025 | | | | 973,055 | | | | 12/20/17 | | | | 2,030 | |
| | BRL | | | 10,845,501 | | | USD | | | 3,403,187 | | | | 3,422,844 | | | | 10/03/17 | | | | 19,656 | |
| | BRL | | | 16,865,113 | | | USD | | | 5,260,672 | | | | 5,299,769 | | | | 11/03/17 | | | | 39,098 | |
| | CAD | | | 188,832 | | | AUD | | | 191,000 | | | | 151,417 | | | | 12/20/17 | | | | 1,740 | |
| | CAD | | | 205,617 | | | USD | | | 164,853 | | | | 164,877 | | | | 12/20/17 | | | | 24 | |
| | CHF | | | 2,232,129 | | | EUR | | | 1,939,864 | | | | 2,318,045 | | | | 12/20/17 | | | | 14,727 | |
| | CNH | | | 9,795,195 | | | USD | | | 1,463,093 | | | | 1,466,514 | | | | 12/20/17 | | | | 3,422 | |
| | CZK | | | 43,999,388 | | | EUR | | | 1,665,664 | | | | 2,001,837 | | | | 10/03/17 | | | | 32,868 | |
| | CZK | | | 17,301,989 | | | EUR | | | 648,000 | | | | 788,711 | | | | 11/09/17 | | | | 21,201 | |
| | CZK | | | 23,608,258 | | | EUR | | | 882,528 | | | | 1,076,889 | | | | 11/21/17 | | | | 30,917 | |
| | CZK | | | 51,365,218 | | | EUR | | | 1,965,083 | | | | 2,343,149 | | | | 11/22/17 | | | | 14,005 | |
| | CZK | | | 120,707,483 | | | EUR | | | 4,639,193 | | | | 5,521,431 | | | | 12/20/17 | | | | 13,042 | |
| | |
| 80 | | The accompanying notes are an integral part of these financial statements. |
GOLDMAN SACHS SHORT DURATION INCOME FUND
|
| ADDITIONAL INVESTMENT INFORMATION (continued) |
FORWARD FOREIGN CURRENCY EXCHANGE CONTRACTS WITH UNREALIZED GAIN (continued)
| | | | | | | | | | | | | | | | | | | | | | | | |
| Counterparty | | Currency
Purchased | | | Currency
Sold | | | Current
Value | | | Settlement
Date | | | Unrealized
Gain | |
Morgan Stanley & Co. International PLC (continued) | | CZK | | | 50,715,915 | | | EUR | | | 1,900,953 | | | $ | 2,322,939 | | | | 01/03/18 | | | $ | 63,924 | |
| | EUR | | | 325,000 | | | CHF | | | 371,075 | | | | 385,892 | | | | 12/20/17 | | | | 533 | |
| | EUR | | | 165,678 | | | GBP | | | 146,265 | | | | 196,719 | | | | 12/20/17 | | | | 225 | |
| | EUR | | | 322,000 | | | HUF | | | 99,838,293 | | | | 382,330 | | | | 12/20/17 | | | | 2,204 | |
| | EUR | | | 1,293,000 | | | NOK | | | 12,053,724 | | | | 1,535,256 | | | | 12/20/17 | | | | 18,957 | |
| | EUR | | | 454,671 | | | PLN | | | 1,953,502 | | | | 539,857 | | | | 12/20/17 | | | | 4,379 | |
| | EUR | | | 424,000 | | | SEK | | | 4,031,976 | | | | 503,440 | | | | 12/20/17 | | | | 5,986 | |
| | EUR | | | 3,829,490 | | | USD | | | 4,514,287 | | | | 4,529,047 | | | | 10/12/17 | | | | 14,759 | |
| | EUR | | | 2,516,386 | | | USD | | | 2,975,573 | | | | 2,987,855 | | | | 12/20/17 | | | | 12,281 | |
| | GBP | | | 1,153,920 | | | EUR | | | 1,289,482 | | | | 1,550,187 | | | | 12/20/17 | | | | 19,109 | |
| | GBP | | | 284,000 | | | JPY | | | 42,678,100 | | | | 381,528 | | | | 12/20/17 | | | | 691 | |
| | GBP | | | 1,462,000 | | | USD | | | 1,960,169 | | | | 1,961,895 | | | | 11/16/17 | | | | 1,725 | |
| | GBP | | | 905,363 | | | USD | | | 1,205,912 | | | | 1,216,273 | | | | 12/20/17 | | | | 10,361 | |
| | HKD | | | 8,229,863 | | | USD | | | 1,053,360 | | | | 1,053,621 | | | | 10/03/17 | | | | 260 | |
| | HKD | | | 4,181,487 | | | USD | | | 537,000 | | | | 537,450 | | | | 03/27/18 | | | | 450 | |
| | IDR | | | 10,589,083,155 | | | USD | | | 778,869 | | | | 783,948 | | | | 11/02/17 | | | | 5,081 | |
| | IDR | | | 15,282,503,525 | | | USD | | | 1,119,187 | | | | 1,125,382 | | | | 12/20/17 | | | | 6,195 | |
| | IDR | | | 10,279,052,090 | | | USD | | | 751,118 | | | | 756,845 | | | | 12/21/17 | | | | 5,727 | |
| | INR | | | 15,044,888 | | | USD | | | 229,000 | | | | 229,200 | | | | 11/03/17 | | | | 200 | |
| | INR | | | 49,385,911 | | | USD | | | 745,200 | | | | 746,612 | | | | 01/12/18 | | | | 1,412 | |
| | JPY | | | 43,059,100 | | | EUR | | | 321,000 | | | | 384,237 | | | | 12/20/17 | | | | 3,095 | |
| | JPY | | | 350,946,945 | | | USD | | | 3,130,455 | | | | 3,131,665 | | | | 12/20/17 | | | | 1,210 | |
| | KRW | | | 490,455,209 | | | USD | | | 428,345 | | | | 428,376 | | | | 10/12/17 | | | | 31 | |
| | KRW | | | 82,693,758 | | | USD | | | 72,219 | | | | 72,232 | | | | 10/25/17 | | | | 13 | |
| | NZD | | | 1,030,803 | | | USD | | | 742,522 | | | | 743,371 | | | | 12/20/17 | | | | 848 | |
| | PHP | | | 39,429,453 | | | USD | | | 768,638 | | | | 775,083 | | | | 10/05/17 | | | | 6,444 | |
| | PHP | | | 31,833,667 | | | USD | | | 621,298 | | | | 625,288 | | | | 10/10/17 | | | | 3,990 | |
| | PHP | | | 19,281,250 | | | USD | | | 377,546 | | | | 378,496 | | | | 10/19/17 | | | | 951 | |
| | PHP | | | 61,670,893 | | | USD | | | 1,202,396 | | | | 1,208,380 | | | | 11/14/17 | | | | 5,984 | |
| | PLN | | | 1,407,841 | | | EUR | | | 325,000 | | | | 385,906 | | | | 12/20/17 | | | | 14 | |
| | PLN | | | 1,042,299 | | | HUF | | | 74,785,085 | | | | 285,706 | | | | 12/20/17 | | | | 969 | |
| | RUB | | | 126,467,197 | | | USD | | | 2,152,000 | | | | 2,164,573 | | | | 12/14/17 | | | | 12,573 | |
| | SEK | | | 8,135,977 | | | EUR | | | 844,156 | | | | 1,003,795 | | | | 12/20/17 | | | | 1,479 | |
| | SGD | | | 207,542 | | | USD | | | 153,000 | | | | 153,142 | | | | 12/20/17 | | | | 142 | |
| | TRY | | | 2,792,668 | | | USD | | | 762,607 | | | | 765,488 | | | | 12/20/17 | | | | 2,881 | |
| | TWD | | | 22,022,220 | | | USD | | | 721,307 | | | | 725,358 | | | | 10/20/17 | | | | 4,051 | |
| | TWD | | | 11,253,750 | | | USD | | | 370,128 | | | | 370,781 | | | | 10/26/17 | | | | 652 | |
| | USD | | | 380,116 | | | ARS | | | 6,595,013 | | | | 379,875 | | | | 10/05/17 | | | | 241 | |
| | USD | | | 965,600 | | | AUD | | | 1,207,000 | | | | 946,310 | | | | 11/08/17 | | | | 19,290 | |
| | USD | | | 8,362,438 | | | AUD | | | 10,467,290 | | | | 8,202,725 | | | | 12/20/17 | | | | 159,712 | |
| | USD | | | 1,533,000 | | | BRL | | | 4,819,736 | | | | 1,521,111 | | | | 10/03/17 | | | | 11,889 | |
| | USD | | | 179,822 | | | BRL | | | 571,925 | | | | 179,724 | | | | 11/03/17 | | | | 98 | |
| | USD | | | 1,257,085 | | | CAD | | | 1,529,999 | | | | 1,226,513 | | | | 11/06/17 | | | | 30,573 | |
| | USD | | | 4,318,935 | | | CAD | | | 5,330,451 | | | | 4,274,289 | | | | 12/20/17 | | | | 44,647 | |
| | USD | | | 384,000 | | | CHF | | | 367,576 | | | | 381,724 | | | | 12/20/17 | | | | 2,276 | |
| | USD | | | 392,000 | | | CLP | | | 242,206,216 | | | | 378,340 | | | | 10/12/17 | | | | 13,660 | |
| | USD | | | 381,732 | | | CLP | | | 239,346,108 | | | | 373,837 | | | | 10/16/17 | | | | 7,895 | |
| | USD | | | 2,545,303 | | | CNH | | | 16,912,169 | | | | 2,532,052 | | | | 12/20/17 | | | | 13,251 | |
| | USD | | | 177,016 | | | CNY | | | 1,179,881 | | | | 177,014 | | | | 11/10/17 | | | | 2 | |
| | USD | | | 384,000 | | | COP | | | 1,123,776,000 | | | | 381,381 | | | | 10/25/17 | | | | 2,619 | |
| | USD | | | 14,619,724 | | | EUR | | | 12,180,067 | | | | 14,462,115 | | | | 12/20/17 | | | | 157,608 | |
| | |
| The accompanying notes are an integral part of these financial statements. | | 81 |
GOLDMAN SACHS SHORT DURATION INCOME FUND
Schedule of Investments (continued)
September 30, 2017 (Unaudited)
|
| ADDITIONAL INVESTMENT INFORMATION (continued) |
FORWARD FOREIGN CURRENCY EXCHANGE CONTRACTS WITH UNREALIZED GAIN (continued)
| | | | | | | | | | | | | | | | | | | | | | | | |
| Counterparty | | Currency
Purchased | | | Currency
Sold | | | Current
Value | | | Settlement
Date | | | Unrealized
Gain | |
Morgan Stanley & Co. International PLC (continued) | | USD | | | 1,860,234 | | | GBP | | | 1,377,610 | | | $ | 1,850,693 | | | | 12/20/17 | | | $ | 9,541 | |
| | USD | | | 1,860,590 | | | HKD | | | 14,426,868 | | | | 1,846,987 | | | | 10/03/17 | | | | 13,603 | |
| | USD | | | 1,996,557 | | | HKD | | | 15,516,766 | | | | 1,986,893 | | | | 10/10/17 | | | | 9,664 | |
| | USD | | | 4,428,899 | | | HKD | | | 34,274,781 | | | | 4,405,370 | | | | 03/27/18 | | | | 23,529 | |
| | USD | | | 1,412,000 | | | HKD | | | 10,939,470 | | | | 1,407,121 | | | | 05/11/18 | | | | 4,879 | |
| | USD | | | 1,909,000 | | | HKD | | | 14,810,290 | | | | 1,908,322 | | | | 09/19/18 | | | | 678 | |
| | USD | | | 779,099 | | | IDR | | | 10,306,453,549 | | | | 764,516 | | | | 10/10/17 | | | | 14,584 | |
| | USD | | | 365,943 | | | IDR | | | 4,917,905,400 | | | | 364,612 | | | | 10/16/17 | | | | 1,331 | |
| | USD | | | 1,154,000 | | | IDR | | | 15,334,605,880 | | | | 1,136,704 | | | | 10/18/17 | | | | 17,296 | |
| | USD | | | 367,596 | | | INR | | | 24,018,750 | | | | 367,307 | | | | 10/05/17 | | | | 289 | |
| | USD | | | 875,136 | | | INR | | | 56,046,357 | | | | 856,374 | | | | 10/10/17 | | | | 18,762 | |
| | USD | | | 2,578,076 | | | INR | | | 165,734,330 | | | | 2,529,691 | | | | 10/18/17 | | | | 48,386 | |
| | USD | | | 756,249 | | | INR | | | 49,125,973 | | | | 749,139 | | | | 10/25/17 | | | | 7,110 | |
| | USD | | | 1,036,195 | | | JPY | | | 112,565,517 | | | | 1,001,620 | | | | 10/25/17 | | | | 34,576 | |
| | USD | | | 1,707,041 | | | JPY | | | 187,943,888 | | | | 1,677,112 | | | | 12/20/17 | | | | 29,930 | |
| | USD | | | 1,207,192 | | | KRW | | | 1,376,802,081 | | | | 1,202,200 | | | | 10/02/17 | | | | 4,992 | |
| | USD | | | 2,289,981 | | | KRW | | | 2,606,710,177 | | | | 2,276,741 | | | | 10/10/17 | | | | 13,240 | |
| | USD | | | 1,577,189 | | | KRW | | | 1,787,687,873 | | | | 1,561,412 | | | | 10/12/17 | | | | 15,777 | |
| | USD | | | 530,323 | | | KRW | | | 601,234,561 | | | | 525,172 | | | | 10/25/17 | | | | 5,151 | |
| | USD | | | 2,063,169 | | | KRW | | | 2,354,046,042 | | | | 2,056,534 | | | | 11/10/17 | | | | 6,634 | |
| | USD | | | 1,364,371 | | | MXN | | | 24,375,780 | | | | 1,337,205 | | | | 10/06/17 | | | | 27,166 | |
| | USD | | | 3,059,724 | | | MXN | | | 55,250,141 | | | | 2,994,914 | | | | 12/20/17 | | | | 64,809 | |
| | USD | | | 2,156,236 | | | NZD | | | 2,968,000 | | | | 2,140,393 | | | | 12/20/17 | | | | 15,842 | |
| | USD | | | 347,734 | | | PHP | | | 17,685,282 | | | | 347,380 | | | | 10/10/17 | | | | 354 | |
| | USD | | | 767,000 | | | PHP | | | 38,928,501 | | | | 763,812 | | | | 10/26/17 | | | | 3,188 | |
| | USD | | | 153,000 | | | PHP | | | 7,786,843 | | | | 152,719 | | | | 11/02/17 | | | | 281 | |
| | USD | | | 1,419,904 | | | RUB | | | 82,610,418 | | | | 1,413,934 | | | | 12/14/17 | | | | 5,970 | |
| | USD | | | 2,006,820 | | | SGD | | | 2,696,549 | | | | 1,989,750 | | | | 12/20/17 | | | | 17,070 | |
| | USD | | | 383,000 | | | THB | | | 12,762,544 | | | | 382,712 | | | | 10/11/17 | | | | 288 | |
| | USD | | | 3,286,519 | | | TRY | | | 11,830,749 | | | | 3,242,882 | | | | 12/20/17 | | | | 43,637 | |
| | USD | | | 1,023,658 | | | TWD | | | 30,613,528 | | | | 1,009,016 | | | | 10/02/17 | | | | 14,642 | |
| | USD | | | 154,000 | | | TWD | | | 4,617,690 | | | | 152,088 | | | | 10/19/17 | | | | 1,912 | |
| | USD | | | 5,529,591 | | | TWD | | | 166,704,368 | | | | 5,490,832 | | | | 10/20/17 | | | | 38,760 | |
| | USD | | | 2,046,868 | | | TWD | | | 61,666,044 | | | | 2,031,427 | | | | 10/23/17 | | | | 15,441 | |
| | USD | | | 1,511,405 | | | TWD | | | 45,652,000 | | | | 1,504,110 | | | | 10/26/17 | | | | 7,295 | |
| | USD | | | 183,663 | | | TWD | | | 5,567,017 | | | | 183,454 | | | | 10/31/17 | | | | 209 | |
| | USD | | | 3,244,595 | | | TWD | | | 96,970,216 | | | | 3,197,312 | | | | 11/10/17 | | | | 47,283 | |
| | USD | | | 1,258,009 | | | ZAR | | | 16,917,331 | | | | 1,240,446 | | | | 11/14/17 | | | | 17,563 | |
| | USD | | | 178,189 | | | ZAR | | | 2,441,954 | | | | 178,029 | | | | 12/20/17 | | | | 160 | |
| | | ZAR | | | 15,803,212 | | | USD | | | 1,148,000 | | | | 1,152,120 | | | | 12/20/17 | | | | 4,120 | |
| TOTAL | | | | | | | | $ | 1,551,123 | |
FORWARD FOREIGN CURRENCY EXCHANGE CONTRACTS WITH UNREALIZED LOSS
| | | | | | | | | | | | | | | | | | | | | | | | |
| Counterparty | | Currency
Purchased | | | Currency
Sold | | | Current
Value | | | Settlement
Date | | | Unrealized
Loss | |
Morgan Stanley & Co. International PLC | | ARS | | | 6,595,013 | | | USD | | | 374,398 | | | $ | 373,867 | | | | 11/03/17 | | | $ | (531 | ) |
| | ARS | | | 12,722,122 | | | USD | | | 721,515 | | | | 714,164 | | | | 11/21/17 | | | | (7,351 | ) |
| | ARS | | | 7,964,319 | | | USD | | | 448,315 | | | | 446,355 | | | | 11/24/17 | | | | (1,960 | ) |
| | AUD | | | 481,000 | | | NZD | | | 529,182 | | | | 376,937 | | | | 12/20/17 | | | | (4,686 | ) |
| | |
| 82 | | The accompanying notes are an integral part of these financial statements. |
GOLDMAN SACHS SHORT DURATION INCOME FUND
|
| ADDITIONAL INVESTMENT INFORMATION (continued) |
FORWARD FOREIGN CURRENCY EXCHANGE CONTRACTS WITH UNREALIZED LOSS (continued)
| | | | | | | | | | | | | | | | | | | | | | | | |
| Counterparty | | Currency
Purchased | | | Currency
Sold | | | Current
Value | | | Settlement
Date | | | Unrealized
Loss | |
Morgan Stanley & Co. International PLC (continued) | | AUD | | | 1,085,327 | | | USD | | | 868,262 | | | $ | 850,916 | | | | 11/08/17 | | | $ | (17,346 | ) |
| | AUD | | | 7,012,373 | | | USD | | | 5,562,571 | | | | 5,495,265 | | | | 12/20/17 | | | | (67,304 | ) |
| | BRL | | | 12,029,426 | | | USD | | | 3,834,299 | | | | 3,796,491 | | | | 10/03/17 | | | | (37,806 | ) |
| | BRL | | | 2,417,375 | | | USD | | | 756,612 | | | | 756,509 | | | | 12/04/17 | | | | (103 | ) |
| | CAD | | | 2,516,410 | | | USD | | | 2,067,546 | | | | 2,017,263 | | | | 11/06/17 | | | | (50,283 | ) |
| | CAD | | | 7,337,743 | | | USD | | | 6,004,568 | | | | 5,883,862 | | | | 12/20/17 | | | | (120,709 | ) |
| | CNH | | | 19,674,315 | | | USD | | | 2,977,483 | | | | 2,945,595 | | | | 12/20/17 | | | | (31,888 | ) |
| | CNY | | | 5,050,451 | | | USD | | | 765,652 | | | | 758,591 | | | | 10/26/17 | | | | (7,061 | ) |
| | CNY | | | 4,483,167 | | | USD | | | 676,429 | | | | 670,975 | | | | 12/14/17 | | | | (5,453 | ) |
| | COP | | | 1,672,085,211 | | | USD | | | 574,857 | | | | 567,463 | | | | 10/25/17 | | | | (7,393 | ) |
| | EUR | | | 1,899,842 | | | CHF | | | 2,184,698 | | | | 2,255,794 | | | | 12/20/17 | | | | (12,992 | ) |
| | EUR | | | 1,689,685 | | | CZK | | | 43,999,388 | | | | 1,997,365 | | | | 10/03/17 | | | | (4,472 | ) |
| | EUR | | | 2,252,071 | | | GBP | | | 2,006,371 | | | | 2,674,018 | | | | 12/20/17 | | | | (21,359 | ) |
| | EUR | | | 2,562,359 | | | USD | | | 3,073,663 | | | | 3,042,441 | | | | 12/20/17 | | | | (31,222 | ) |
| | GBP | | | 2,841,332 | | | EUR | | | 3,217,000 | | | | 3,817,071 | | | | 12/20/17 | | | | (2,665 | ) |
| | GBP | | | 3,662,528 | | | USD | | | 4,980,990 | | | | 4,920,273 | | | | 12/20/17 | | | | (60,718 | ) |
| | HKD | | | 6,197,005 | | | USD | | | 793,420 | | | | 793,366 | | | | 10/03/17 | | | | (54 | ) |
| | HUF | | | 101,483,800 | | | EUR | | | 326,000 | | | | 386,390 | | | | 12/20/17 | | | | (689 | ) |
| | HUF | | | 495,668,955 | | | USD | | | 1,951,837 | | | | 1,887,214 | | | | 12/20/17 | | | | (64,622 | ) |
| | IDR | | | 25,561,555,615 | | | USD | | | 1,911,206 | | | | 1,896,953 | | | | 10/05/17 | | | | (14,254 | ) |
| | IDR | | | 16,230,657,889 | | | USD | | | 1,216,395 | | | | 1,203,963 | | | | 10/10/17 | | | | (12,432 | ) |
| | IDR | | | 24,631,805,077 | | | USD | | | 1,837,143 | | | | 1,826,193 | | | | 10/16/17 | | | | (10,950 | ) |
| | IDR | | | 8,648,302,984 | | | USD | | | 648,360 | | | | 640,624 | | | | 10/26/17 | | | | (7,736 | ) |
| | IDR | | | 10,318,189,950 | | | USD | | | 765,000 | | | | 764,056 | | | | 10/31/17 | | | | (944 | ) |
| | IDR | | | 12,411,396,051 | | | USD | | | 921,410 | | | | 917,498 | | | | 11/16/17 | | | | (3,912 | ) |
| | INR | | | 73,404,661 | | | USD | | | 1,145,074 | | | | 1,122,542 | | | | 10/05/17 | | | | (22,532 | ) |
| | INR | | | 106,803,020 | | | USD | | | 1,661,095 | | | | 1,631,924 | | | | 10/10/17 | | | | (29,171 | ) |
| | INR | | | 229,753,648 | | | USD | | | 3,563,940 | | | | 3,506,851 | | | | 10/18/17 | | | | (57,089 | ) |
| | INR | | | 153,871,942 | | | USD | | | 2,362,536 | | | | 2,346,449 | | | | 10/25/17 | | | | (16,087 | ) |
| | INR | | | 155,248,235 | | | USD | | | 2,383,921 | | | | 2,367,123 | | | | 10/26/17 | | | | (16,798 | ) |
| | INR | | | 24,018,750 | | | USD | | | 366,173 | | | | 365,911 | | | | 11/03/17 | | | | (262 | ) |
| | JPY | | | 42,683,062 | | | EUR | | | 323,310 | | | | 380,881 | | | | 12/20/17 | | | | (3,004 | ) |
| | JPY | | | 21,965,166 | | | GBP | | | 150,483 | | | | 196,006 | | | | 12/20/17 | | | | (6,156 | ) |
| | JPY | | | 106,391,000 | | | USD | | | 979,357 | | | | 946,678 | | | | 10/25/17 | | | | (32,679 | ) |
| | JPY | | | 416,168,880 | | | USD | | | 3,781,143 | | | | 3,713,671 | | | | 12/20/17 | | | | (67,472 | ) |
| | KRW | | | 1,376,802,081 | | | USD | | | 1,224,194 | | | | 1,202,200 | | | | 10/02/17 | | | | (21,993 | ) |
| | KRW | | | 2,606,710,177 | | | USD | | | 2,312,782 | | | | 2,276,740 | | | | 10/10/17 | | | | (36,042 | ) |
| | KRW | | | 1,297,232,664 | | | USD | | | 1,148,032 | | | | 1,133,036 | | | | 10/12/17 | | | | (14,996 | ) |
| | KRW | | | 2,206,147,501 | | | USD | | | 1,943,789 | | | | 1,927,048 | | | | 10/25/17 | | | | (16,740 | ) |
| | KRW | | | 1,368,532,645 | | | USD | | | 1,209,685 | | | | 1,195,573 | | | | 11/10/17 | | | | (14,112 | ) |
| | KRW | | | 3,673,342,871 | | | USD | | | 3,227,442 | | | | 3,209,543 | | | | 11/22/17 | | | | (17,900 | ) |
| | MXN | | | 106,549,081 | | | USD | | | 5,902,731 | | | | 5,775,650 | | | | 12/20/17 | | | | (127,082 | ) |
| | NOK | | | 38,951,102 | | | EUR | | | 4,156,143 | | | | 4,899,849 | | | | 12/20/17 | | | | (34,985 | ) |
| | NOK | | | 1,906,922 | | | GBP | | | 179,737 | | | | 239,881 | | | | 12/20/17 | | | | (1,580 | ) |
| | NOK | | | 2,767,903 | | | USD | | | 354,429 | | | | 348,188 | | | | 12/20/17 | | | | (6,242 | ) |
| | NZD | | | 528,146 | | | EUR | | | 322,000 | | | | 380,876 | | | | 12/20/17 | | | | (1,453 | ) |
| | NZD | | | 6,293,361 | | | USD | | | 4,574,602 | | | | 4,538,499 | | | | 12/20/17 | | | | (36,105 | ) |
| | PEN | | | 1,217,250 | | | USD | | | 375,000 | | | | 372,809 | | | | 10/05/17 | | | | (2,191 | ) |
| | PEN | | | 2,536,725 | | | USD | | | 783,000 | | | | 776,798 | | | | 10/10/17 | | | | (6,202 | ) |
| | PEN | | | 2,409,549 | | | USD | | | 738,672 | | | | 735,622 | | | | 12/14/17 | | | | (3,050 | ) |
| | PLN | | | 26,825,720 | | | EUR | | | 6,279,229 | | | | 7,353,253 | | | | 12/20/17 | | | | (102,448 | ) |
| | |
| The accompanying notes are an integral part of these financial statements. | | 83 |
GOLDMAN SACHS SHORT DURATION INCOME FUND
Schedule of Investments (continued)
September 30, 2017 (Unaudited)
|
| ADDITIONAL INVESTMENT INFORMATION (continued) |
FORWARD FOREIGN CURRENCY EXCHANGE CONTRACTS WITH UNREALIZED LOSS (continued)
| | | | | | | | | | | | | | | | | | | | | | | | |
| Counterparty | | Currency
Purchased | | | Currency
Sold | | | Current
Value | | | Settlement
Date | | | Unrealized
Loss | |
Morgan Stanley & Co. International PLC (continued) | | PLN | | | 13,001,683 | | | USD | | | 3,661,324 | | | $ | 3,563,918 | | | | 12/20/17 | | | $ | (97,406 | ) |
| | RUB | | | 343,307,895 | | | USD | | | 5,893,940 | | | | 5,875,951 | | | | 12/14/17 | | | | (17,989 | ) |
| | SEK | | | 117,266,888 | | | EUR | | | 12,286,977 | | | | 14,468,075 | | | | 12/20/17 | | | | (120,983 | ) |
| | SEK | | | 2,444,419 | | | USD | | | 306,430 | | | | 301,586 | | | | 12/20/17 | | | | (4,844 | ) |
| | SGD | | | 2,701,867 | | | USD | | | 2,008,921 | | | | 1,993,675 | | | | 12/20/17 | | | | (15,247 | ) |
| | THB | | | 12,962,656 | | | USD | | | 392,000 | | | | 388,712 | | | | 10/11/17 | | | | (3,288 | ) |
| | TRY | | | 12,641,091 | | | USD | | | 3,574,056 | | | | 3,465,005 | | | | 12/20/17 | | | | (109,052 | ) |
| | TWD | | | 39,572,082 | | | USD | | | 1,316,612 | | | | 1,304,287 | | | | 10/02/17 | | | | (12,324 | ) |
| | TWD | | | 11,253,750 | | | USD | | | 375,000 | | | | 370,628 | | | | 10/05/17 | | | | (4,372 | ) |
| | TWD | | | 76,259,378 | | | USD | | | 2,522,839 | | | | 2,511,795 | | | | 10/20/17 | | | | (11,041 | ) |
| | TWD | | | 18,603,396 | | | USD | | | 618,107 | | | | 612,841 | | | | 10/23/17 | | | | (5,266 | ) |
| | TWD | | | 27,151,050 | | | USD | | | 897,510 | | | | 894,554 | | | | 10/26/17 | | | | (2,955 | ) |
| | USD | | | 534,802 | | | AUD | | | 685,000 | | | | 536,802 | | | | 12/20/17 | | | | (2,001 | ) |
| | USD | | | 5,660,230 | | | BRL | | | 18,055,191 | | | | 5,698,224 | | | | 10/03/17 | | | | (37,994 | ) |
| | USD | | | 383,000 | | | BRL | | | 1,226,753 | | | | 385,500 | | | | 11/03/17 | | | | (2,500 | ) |
| | USD | | | 384,000 | | | CHF | | | 371,167 | | | | 385,453 | | | | 12/20/17 | | | | (1,453 | ) |
| | USD | | | 168,161 | | | CNH | | | 1,126,256 | | | | 168,621 | | | | 12/20/17 | | | | (460 | ) |
| | USD | | | 799,443 | | | CNY | | | 5,345,038 | | | | 801,900 | | | | 11/10/17 | | | | (2,457 | ) |
| | USD | | | 306,000 | | | COP | | | 903,586,482 | | | | 306,444 | | | | 10/31/17 | | | | (444 | ) |
| | USD | | | 5,684,265 | | | EUR | | | 4,821,987 | | | | 5,702,849 | | | | 10/12/17 | | | | (18,585 | ) |
| | USD | | | 1,631,958 | | | EUR | | | 1,377,288 | | | | 1,635,334 | | | | 12/20/17 | | | | (3,380 | ) |
| | USD | | | 1,629,992 | | | GBP | | | 1,215,736 | | | | 1,631,427 | | | | 11/16/17 | | | | (1,435 | ) |
| | USD | | | 1,784,616 | | | GBP | | | 1,341,423 | | | | 1,802,080 | | | | 12/20/17 | | | | (17,464 | ) |
| | USD | | | 1,888,965 | | | IDR | | | 25,561,555,615 | | | | 1,896,952 | | | | 10/05/17 | | | | (7,987 | ) |
| | USD | | | 754,099 | | | INR | | | 49,385,911 | | | | 755,235 | | | | 10/05/17 | | | | (1,137 | ) |
| | USD | | | 383,000 | | | INR | | | 25,155,440 | | | | 383,554 | | | | 10/26/17 | | | | (554 | ) |
| | USD | | | 983,714 | | | INR | | | 64,923,663 | | | | 989,072 | | | | 11/03/17 | | | | (5,358 | ) |
| | USD | | | 1,855,033 | | | JPY | | | 208,603,264 | | | | 1,861,467 | | | | 12/20/17 | | | | (6,432 | ) |
| | USD | | | 1,870,443 | | | KRW | | | 2,149,462,151 | | | | 1,877,806 | | | | 11/10/17 | | | | (7,363 | ) |
| | USD | | | 428,517 | | | KRW | | | 490,455,209 | | | | 428,530 | | | | 11/22/17 | | | | (12 | ) |
| | USD | | | 749,577 | | | NZD | | | 1,044,187 | | | | 753,022 | | | | 12/20/17 | | | | (3,447 | ) |
| | USD | | | 384,000 | | | PHP | | | 19,665,274 | | | | 386,035 | | | | 10/19/17 | | | | (2,035 | ) |
| | USD | | | 384,000 | | | PHP | | | 19,624,512 | | | | 385,208 | | | | 10/20/17 | | | | (1,208 | ) |
| | USD | | | 383,000 | | | PHP | | | 19,576,486 | | | | 384,108 | | | | 10/26/17 | | | | (1,108 | ) |
| | USD | | | 2,280,059 | | | RUB | | | 134,295,648 | | | | 2,298,562 | | | | 12/14/17 | | | | (18,503 | ) |
| | USD | | | 1,899,143 | | | SGD | | | 2,586,233 | | | | 1,908,348 | | | | 12/20/17 | | | | (9,205 | ) |
| | USD | | | 369,824 | | | TWD | | | 11,253,750 | | | | 370,628 | | | | 10/05/17 | | | | (804 | ) |
| | USD | | | 1,208,032 | | | TWD | | | 36,889,661 | | | | 1,215,054 | | | | 10/20/17 | | | | (7,023 | ) |
| | USD | | | 799,443 | | | TWD | | | 24,321,783 | | | | 801,496 | | | | 10/31/17 | | | | (2,052 | ) |
| | | ZAR | | | 52,025,536 | | | USD | | | 3,922,807 | | | | 3,792,880 | | | | 12/20/17 | | | | (129,932 | ) |
| TOTAL | | | | | | | | $ | (2,000,366 | ) |
| | |
| 84 | | The accompanying notes are an integral part of these financial statements. |
GOLDMAN SACHS SHORT DURATION INCOME FUND
|
| ADDITIONAL INVESTMENT INFORMATION (continued) |
FUTURES CONTRACTS — At September 30, 2017, the Fund had the following futures contracts:
| | | | | | | | | | | | | | |
| Description | | Number of
Contracts | | | Expiration
Date | | Notional
Amount | | | Unrealized
Appreciation/
(Depreciation) | |
Long position contracts: | | | | | | | | | | | | | | |
Eurodollars | | | 204 | | | 09/16/19 | | $ | 49,982,550 | | | $ | (158,571 | ) |
Ultra Long U.S. Treasury Bonds | | | 16 | | | 12/19/17 | | | 2,642,000 | | | | (47,304 | ) |
10 Year German Euro-Bund | | | 21 | | | 12/07/17 | | | 3,996,253 | | | | (24,487 | ) |
2 Year U.S. Treasury Notes | | | 378 | | | 12/29/17 | | | 81,535,782 | | | | (228,958 | ) |
5 Year U.S. Treasury Notes | | | 1,009 | | | 12/29/17 | | | 118,557,500 | | | | (960,081 | ) |
| TOTAL | | | | | | | | | | | | $ | (1,419,401 | ) |
Short position contracts: | | | | | | | | | | | | | | |
Eurodollars | | | (143 | ) | | 12/17/18 | | | (35,083,263 | ) | | | (12,682 | ) |
Eurodollars | | | (64 | ) | | 06/17/19 | | | (15,687,200 | ) | | | 37,352 | |
Eurodollars | | | (81 | ) | | 03/16/20 | | | (19,827,787 | ) | | | 19,463 | |
Eurodollars | | | (69 | ) | | 06/15/20 | | | (16,885,162 | ) | | | (5,747 | ) |
Eurodollars | | | (145 | ) | | 09/14/20 | | | (35,470,625 | ) | | | 31,715 | |
Eurodollars | | | (145 | ) | | 12/14/20 | | | (35,452,500 | ) | | | 29,902 | |
Eurodollars | | | (145 | ) | | 03/15/21 | | | (35,441,625 | ) | | | 27,453 | |
Italian 10 Year Government Bonds | | | (25 | ) | | 12/07/17 | | | (3,987,732 | ) | | | 6,851 | |
U.S. Long Bonds | | | (88 | ) | | 12/19/17 | | | (13,447,500 | ) | | | 190,937 | |
Ultra 10 Year U.S. Treasury Notes | | | (5 | ) | | 12/19/17 | | | (671,641 | ) | | | 7,867 | |
10 Year U.S. Treasury Notes | | | (34 | ) | | 12/19/17 | | | (4,260,625 | ) | | | 2,879 | |
TOTAL | | | $ | 335,990 | |
| TOTAL FUTURES CONTRACTS | | | $ | (1,083,411 | ) |
SWAP CONTRACTS — At September 30, 2017, the Fund had the following swap contracts:
CENTRALLY CLEARED INTEREST RATE SWAP CONTRACTS
| | | | | | | | | | | | | | | | | | | | | | | | | | |
| Payments Made by the Fund | | Payments
Received
by Fund | | Termination
Date | | | Notional
Amount | | | Value | | | Upfront
Premium
(Received) Paid | | | Unrealized
Appreciation/
(Depreciation) | |
6M CDOR(a) | | 0.832% | | | 10/25/17 | | | | CAD | | | | 111,430 | | | $ | (21,391 | ) | | $ | 167 | | | $ | (21,558 | ) |
12M BP(b) | | 0.297 | | | 12/14/17 | | | | GBP | | | | 269,410 | (c) | | | (30,979 | ) | | | 2,208 | | | | (33,187 | ) |
3M STIBOR(d) | | 0.050(b) | | | 06/15/18 | | | | SEK | | | | 96,860 | (c) | | | 23,443 | | | | 17,070 | | | | 6,373 | |
3M STIBOR(d) | | 0.330(b) | | | 09/15/18 | | | | | | | | 87,960 | | | | 8,821 | | | | 442 | | | | 8,379 | |
0.330(b) | | 3M STIBOR(d) | | | 09/15/18 | | | | | | | | 87,960 | | | | 451 | | | | (102 | ) | | | 553 | |
6M CHFOR | | 0.554 | | | 03/29/19 | | | | CHF | | | | 25,420 | (c) | | | 181 | | | | (240,567 | ) | | | 240,748 | |
1.826 | | 3M LIBOR | | | 05/11/19 | | | | $ | | | | 17,550 | (c) | | | (3,733 | ) | | | (2,901 | ) | | | (832 | ) |
3M STIBOR(d) | | 0.100(b) | | | 06/29/19 | | | | SEK | | | | 205,050 | (c) | | | 1,357 | | | | (2,942 | ) | | | 4,299 | |
3M CDOR(e) | | 1.250 | | | 12/20/19 | | | | CAD | | | | 24,010 | (c) | | | (274,898 | ) | | | (284,771 | ) | | | 9,873 | |
2.000(e) | | 3M LIBOR(d) | | | 12/20/19 | | | | $ | | | | 19,970 | (c) | | | (77,228 | ) | | | (122,772 | ) | | | 45,544 | |
6M BP(a) | | 3.370 | | | 07/15/22 | | | | GBP | | | | 2,510 | | | | (13,369 | ) | | | 132 | | | | (13,501 | ) |
Mexico Interbank TIIE 28 Days(f) | | 6.750 | | | 12/14/22 | | | | MXN | | | | 35,075 | (c) | | | (2,819 | ) | | | (329 | ) | | | (2,490 | ) |
6M EURO(e) | | 0.250(b) | | | 12/20/22 | | | | EUR | | | | 9,850 | (c) | | | (32,625 | ) | | | 389 | | | | (33,014 | ) |
3M STIBOR(d) | | 0.500(b) | | | 12/20/22 | | | | SEK | | | | 82,690 | (c) | | | (20,842 | ) | | | 14,371 | | | | (35,213 | ) |
6M CDOR(e) | | 1.750 | | | 12/20/22 | | | | CAD | | | | 8,500 | (c) | | | (137,326 | ) | | | (141,085 | ) | | | 3,759 | |
2.250(e) | | 3M LIBOR(d) | | | 12/20/22 | | | | $ | | | | 13,510 | (c) | | | (129,096 | ) | | | (221,549 | ) | | | 92,453 | |
| | |
| The accompanying notes are an integral part of these financial statements. | | 85 |
GOLDMAN SACHS SHORT DURATION INCOME FUND
Schedule of Investments (continued)
September 30, 2017 (Unaudited)
|
| ADDITIONAL INVESTMENT INFORMATION (continued) |
CENTRALLY CLEARED INTEREST RATE SWAP CONTRACTS (continued)
| | | | | | | | | | | | | | | | | | | | | | | | | | |
| Payments Made by the Fund | | Payments
Received
by Fund | | Termination
Date | | | Notional
Amount | | | Value | | | Upfront
Premium
(Received) Paid | | | Unrealized
Appreciation/
(Depreciation) | |
2.500%(e) | | 6M AUDOR(d) | | | 12/20/22 | | | | AUD | | | | 8,150 | (c) | | $ | 47,553 | | | $ | (10,829 | ) | | $ | 58,382 | |
2.143(e) | | 3M LIBOR | | | 07/03/23 | | | | $ | | | | 1,340 | (c) | | | (59 | ) | | | (448 | ) | | | 389 | |
3M LIBOR(d) | | 2.065%(e) | | | 08/06/23 | | | | | | | | 4,730 | (c) | | | (20,306 | ) | | | 1,914 | | | | (22,220 | ) |
6M EURO(e) | | 1.330(a) | | | 01/12/27 | | | | EUR | | | | 6,720 | (c) | | | (38,516 | ) | | | (79,595 | ) | | | 41,079 | |
6M BP(e) | | 1.600 | | | 03/16/27 | | | | GBP | | | | 7,420 | (c) | | | (50,754 | ) | | | 7,285 | | | | (58,039 | ) |
3M EURO(e) | | 1.750(b) | | | 06/15/27 | | | | EUR | | | | 4,780 | (c) | | | 60,447 | | | | (300,653 | ) | | | 361,100 | |
12M BP(b) | | 3.36 | | | 06/15/27 | | | | GBP | | | | 1,220 | | | | (11,297 | ) | | | (956 | ) | | | (10,341 | ) |
12M EURO(b) | | 1.427 | | | 08/15/27 | | | | EUR | | | | 660 | | | | (1,730 | ) | | | 1,053 | | | | (2,783 | ) |
3M LIBOR(d) | | 2.400(e) | | | 08/31/27 | | | | $ | | | | 3,070 | (c) | | | (23,920 | ) | | | (3,547 | ) | | | (20,373 | ) |
1.500(b) | | 6M EURO(e) | | | 08/31/27 | | | | EUR | | | | 2,700 | (c) | | | 11,423 | | | | (4,523 | ) | | | 15,946 | |
3M CDOR(e) | | 2.500 | | | 09/21/27 | | | | CAD | | | | 7,750 | (c) | | | (51,676 | ) | | | (22,331 | ) | | | (29,345 | ) |
2.500(e) | | 3M LIBOR(d) | | | 09/21/27 | | | | $ | | | | 6,240 | (c) | | | 23,473 | | | | (2,170 | ) | | | 25,643 | |
6M EURO(e) | | 1.000(b) | | | 12/20/27 | | | | EUR | | | | 9,830 | (c) | | | 47,358 | | | | 177,487 | | | | (130,129 | ) |
3M CDOR(e) | | 2.000 | | | 12/20/27 | | | | CAD | | | | 10,830 | (c) | | | (339,996 | ) | | | (282,171 | ) | | | (57,825 | ) |
2.500(e) | | 3M LIBOR(d) | | | 12/20/27 | | | | $ | | | | 6,520 | (c) | | | (110,602 | ) | | | (232,501 | ) | | | 121,899 | |
1.250(e) | | 6M BP | | | 12/20/27 | | | | GBP | | | | 4,380 | (c) | | | 115,896 | | | | (78,845 | ) | | | 194,741 | |
0.250(e) | | 6M JYOR | | | 12/20/27 | | | | JPY | | | | 648,500 | (c) | | | 30,543 | | | | 16,824 | | | | 13,719 | |
6M CHFOR(e) | | 1.000(b) | | | 12/21/27 | | | | CHF | | | | 1,730 | (c) | | | 15,490 | | | | 30,270 | | | | (14,780 | ) |
3M CDOR(e) | | 2.500 | | | 12/21/27 | | | | CAD | | | | 19,540 | (c) | | | (148,527 | ) | | | (94,282 | ) | | | (54,245 | ) |
2.750(e) | | 3M LIBOR(d) | | | 12/21/27 | | | | $ | | | | 14,880 | (c) | | | (92,643 | ) | | | (136,658 | ) | | | 44,015 | |
4.000(e) | | 3M NZDOR(d) | | | 12/21/27 | | | | NZD | | | | 6,060 | (c) | | | (18,461 | ) | | | (43,418 | ) | | | 24,957 | |
3M LIBOR(d) | | 2.378(e) | | | 07/03/28 | | | | $ | | | | 5,050 | (c) | | | (624 | ) | | | 81 | | | | (705 | ) |
2.346(e) | | 3M LIBOR(c) | | | 08/06/28 | | | | | | | | 2,670 | (c) | | | 10,296 | | | | (2,973 | ) | | | 13,269 | |
1.940(e) | | 6M BP | | | 01/11/32 | | | | GBP | | | | 5,260 | (c) | | | 17,177 | | | | 7,664 | | | | 9,513 | |
12M EURO(b) | | 1.600 | | | 08/15/32 | | | | EUR | | | | 600 | | | | (3,503 | ) | | | 15 | | | | (3,518 | ) |
1.500(e) | | 6M BP(d) | | | 12/20/32 | | | | GBP | | | | 3,200 | (c) | | | 73,464 | | | | (83,686 | ) | | | 157,150 | |
1.750(e) | | 6M BP | | | 03/17/37 | | | | | | | | 5,360 | (c) | | | 118,129 | | | | 30,901 | | | | 87,228 | |
6M EURO(e) | | 2.000(b) | | | 06/16/37 | | | | EUR | | | | 1,260 | (c) | | | (23,624 | ) | | | (604 | ) | | | (23,020 | ) |
2.750(e) | | 3M LIBOR(c) | | | 06/16/37 | | | | $ | | | | 2,680 | (c) | | | 2,941 | | | | (6,097 | ) | | | 9,038 | |
2.500(e) | | 3M LIBOR(c) | | | 06/17/47 | | | | | | | | 2,490 | (c) | | | 19,753 | | | | 4,027 | | | | 15,726 | |
1.500(e) | | 6M BP | | | 12/20/47 | | | | GBP | | | | 850 | (c) | | | 46,041 | | | | (17,438 | ) | | | 63,479 | |
2.560(e) | | 3M LIBOR(c) | | | 07/03/48 | | | | $ | | | | 2,060 | (c) | | | 3,090 | | | | 74 | | | | 3,016 | |
| TOTAL | | | | | | | | | | | | | | | | $ | (1,003,217 | ) | | $ | (2,108,369 | ) | | $ | 1,105,152 | |
| | (a) | | Payments made at maturity. |
| | (b) | | Payments made annually. |
| | (c) | | Represents forward starting interest rate swaps whose effective dates of commencement of accruals and cash flows occur subsequent to September 30, 2017. |
| | (d) | | Payments made quarterly. |
| | (e) | | Payments made semi-annually. |
| | (f) | | Payments made monthly. |
| | |
| 86 | | The accompanying notes are an integral part of these financial statements. |
GOLDMAN SACHS SHORT DURATION INCOME FUND
|
| ADDITIONAL INVESTMENT INFORMATION (continued) |
CENTRALLY CLEARED CREDIT DEFAULT SWAP CONTRACTS
| | | | | | | | | | | | | | | | | | | | | | | | |
| Referenced Obligation/Index | | Financing
Rate Received/
(Paid) by the
Fund(a) | | Credit
Spread at
September 30,
2017(b) | | Termination
Date | | | Notional
Amount | | | Value | | | Upfront
Premiums
(Received) Paid | | | Unrealized
Appreciation/
(Depreciation) | |
Protection Purchased: | | | | | | | | | | | | | | | | | | | | | | | | |
CDX.EM Index 28 | | 1.000% | | 1.727% | | | 06/20/22 | | | $ | 15,025 | | | $ | 466,756 | | | $ | 550,777 | | | $ | (84,021 | ) |
CDX.EM Index 28 | | (1.000) | | 1.854 | | | 12/20/22 | | | | 17,090 | | | | 684,411 | | | | 713,665 | | | | (29,254 | ) |
iTraxx Europe Series 27 | | (1.000) | | 0.480 | | | 06/20/22 | | | | 13,470 | | | | (394,044 | ) | | | (339,892 | ) | | | (54,152 | ) |
CDX.NA.IG Index 28 | | (1.000) | | 0.529 | | | 06/20/22 | | | | 16,930 | | | | (363,082 | ) | | | (319,028 | ) | | | (44,054 | ) |
| TOTAL | | | $ | 394,041 | | | $ | 605,522 | | | $ | (211,481 | ) |
| | (a) | | Payments made quarterly. |
| | (b) | | Credit spread on the referenced obligation, together with the term of the swap contract, are indicators of payment/performance risk. The likelihood of a credit event occurring which would require a fund or its counterparty to make a payment or otherwise be required to perform under the swap contract is generally greater as the credit spread and the term of the swap contract increase. |
OPTIONS ON FUTURES CONTRACTS
| | | | | | | | | | | | | | | | | | | | | | | | | | | | |
| Description | | Counterparty | | Exercise
Price | | Expiration
Date | | | Number of
Contracts | | | Notional Amount | | | Market Value | | | Premiums
Paid
(Received)
by Fund | | | Unrealized
Appreciation/ (Depreciation) | |
Purchased Options Contracts: | | | | | | | | | | | | | | | | | | | | | | | | | | | | |
Puts: | | | | | | | | | | | | | | | | | | | | | | | | | | | | |
Eurodollar Futures | | MS&Co. LLC | | $98.00 | | | 06/15/18 | | | | 154 | | | $ | 385,000 | | | $ | 59,675 | | | $ | 42,697 | | | $ | 16,978 | |
OVER THE COUNTER OPTIONS ON INTEREST RATE SWAPTIONS
| | | | | | | | | | | | | | | | | | | | | | | | | | | | |
| Description | | Counterparty | | Exercise
Price | | Expiration
Date | | | Number of
Contracts | | | Notional Amount | | | Market Value | | | Premiums
Paid
(Received)
by Fund | | | Unrealized
Appreciation/ (Depreciation) | |
Purchased Options Contracts: | | | | | | | | | | | | | | | | | | | | | | | | | | | | |
Puts: | | | | | | | | | | | | | | | | | | | | | | | | | | | | |
OTC – 10Y IRS | | JPMorgan
Securities, Inc. | | 0.700 | | | 10/23/17 | | | | 3,770,000 | | | | 3,770,000 | | | | 296 | | | | 23,528 | | | | (23,232 | ) |
| | |
|
| Abbreviation: |
CDX.EM Index 28 | | —CDX Emerging Markets Index 28 |
CDX.NA.IG Index 28 | | —CDX North America Investment Grade Index 28 |
|
| | |
| The accompanying notes are an integral part of these financial statements. | | 87 |
GOLDMAN SACHS SHORT-TERM CONSERVATIVE INCOME FUND
Schedule of Investments
September 30, 2017 (Unaudited)
| | | | | | | | | | | | | | |
Principal
Amount | | | Interest
Rate | | | Maturity
Date | | | Value | |
| Corporate Obligations – 41.0% | |
| Agriculture(a)(b) – 0.4% | |
| | BAT Capital Corp. | |
| $ | 4,600,000 | | | | 1.905 | % | | | 08/14/20 | | | $ | 4,608,262 | |
| | | | | | | | | | | | | | |
| | | | | | | | | | | | | 4,608,262 | |
| | |
| Automotive – 2.2% | |
| | BMW US Capital LLC(a)(b) (3M USD LIBOR + 0.380%) | |
| | 2,000,000 | | | | 1.682 | | | | 04/06/20 | | | | 2,009,991 | |
| | Daimler Finance North America LLC(b) | |
| | 3,105,000 | | | | 1.875 | | | | 01/11/18 | | | | 3,107,812 | |
| | 3,315,000 | | | | 1.650 | | | | 03/02/18 | | | | 3,315,808 | |
| | 4,727,000 | | | | 2.000 | | | | 08/03/18 | | | | 4,739,781 | |
| | 2,681,000 | | | | 1.932 | (a) | | | 01/06/20 | | | | 2,693,006 | |
| | 2,800,000 | | | | 1.842 | (a) | | | 05/05/20 | | | | 2,810,825 | |
| | Ford Motor Credit Co. LLC(a) | |
| | 1,000,000 | | | | 1.886 | | | | 12/06/17 | | | | 1,000,559 | |
| | 2,000,000 | | | | 2.140 | | | | 03/12/19 | | | | 2,009,574 | |
| | 1,000,000 | | | | 2.304 | | | | 01/09/20 | | | | 1,008,314 | |
| | Toyota Motor Credit Corp.(a) (3M USD LIBOR + 0.150%) | |
| | 5,500,000 | | | | 1.478 | | | | 12/24/18 | | | | 5,502,775 | |
| | | | | | | | | | | | | | |
| | | | | | | | | | | | | 28,198,445 | |
| | |
| Banks – 30.1% | |
| | ABN AMRO Bank NV(b) | |
| | 6,300,000 | | | | 2.500 | | | | 10/30/18 | | | | 6,344,843 | |
| | 5,000,000 | | | | 1.944 | (a) | | | 01/18/19 | | | | 5,022,290 | |
| | Australia & New Zealand Banking Group Ltd.(b) | |
| | 3,044,000 | | | | 1.750 | | | | 03/29/18 | | | | 3,047,915 | |
| | 2,200,000 | | | | 1.911 | (a) | | | 01/30/19 | | | | 2,200,000 | |
| | 10,500,000 | | | | 1.988 | (a) | | | 09/23/19 | | | | 10,579,057 | |
| | Bank of America Corp. | |
| | 1,500,000 | | | | 6.875 | | | | 04/25/18 | | | | 1,543,176 | |
| | 6,365,000 | | | | 5.650 | | | | 05/01/18 | | | | 6,510,333 | |
| | Bank of America NA(a) (3M USD LIBOR + 0.760%) | |
| | 500,000 | | | | 2.077 | | | | 12/07/18 | | | | 503,536 | |
| | Bank of Montreal(c) | |
| | 1,245,000 | | | | 1.450 | | | | 04/09/18 | | | | 1,244,981 | |
| Banque Federative du Credit Mutuel SA(a)(b) (3M USD LIBOR +
0.490%) |
|
| | 11,300,000 | | | | 1.797 | | | | 07/20/20 | | | | 11,322,030 | |
| | Barclays Bank PLC | |
| | 8,000,000 | | | | 1.862 | | | | 08/07/19 | | | | 8,013,803 | |
| | Bayerische Landesbank(a) (3M USD LIBOR + 0.470%) | |
| | 1,000,000 | | | | 1.798 | | | | 03/23/18 | | | | 1,002,179 | |
| | BB&T Corp.(a)(c) (3M USD LIBOR + 0.715%) | |
| | 10,186,000 | | | | 2.019 | | | | 01/15/20 | | | | 10,255,549 | |
| | BNP Paribas SA | |
| | 900,000 | | | | 2.700 | | | | 08/20/18 | | | | 908,055 | |
| | BNZ International Funding Ltd.(a)(b) (3M USD LIBOR + 0.700%) | |
| | 3,250,000 | | | | 2.016 | | | | 02/21/20 | | | | 3,267,147 | |
| | BPCE SA | |
| | 1,750,000 | | | | 1.625 | | | | 01/26/18 | | | | 1,749,592 | |
| | Branch Banking & Trust Co.(a)(c) (3M USD LIBOR + 0.530%) | |
| | 390,000 | | | | 1.841 | | | | 05/01/19 | | | | 392,030 | |
| | Capital One Financial Corp.(a)(c) (3M USD LIBOR + 0.760%) | |
| | 4,945,000 | | | | 2.069 | | | | 05/12/20 | | | | 4,970,190 | |
| | |
| Corporate Obligations – (continued) | |
| Banks – (continued) | |
| | Capital One NA(a)(c) (3M USD LIBOR + 0.765%) | |
| 3,075,000 | | | | 2.082 | | | | 09/13/19 | | | | 3,095,217 | |
| | Citibank NA(a) (3M USD LIBOR + 0.500%) | |
| | 3,000,000 | | | | 1.810 | | | | 06/12/20 | | | | 3,014,320 | |
| | Citigroup, Inc.(a)(c) (3M USD LIBOR + 0.790%) | |
| | 1,000,000 | | | | 2.094 | | | | 01/10/20 | | | | 1,007,457 | |
| | Citizens Bank NA/Providence RI(a) (3M USD LIBOR + 0.570%) | |
| | 6,650,000 | | | | 1.887 | | | | 05/26/20 | | | | 6,663,965 | |
| | Commonwealth Bank of Australia(a)(b) | |
| | 12,500,000 | | | | 1.721 | | | | 09/18/20 | | | | 12,499,625 | |
| | Credit Agricole SA(b) | |
| | 500,000 | | | | 2.125 | | | | 04/17/18 | | | | 501,465 | |
| | 2,200,000 | | | | 2.625 | | | | 10/03/18 | | | | 2,219,204 | |
| | 8,462,000 | | | | 2.104 | (a) | | | 04/15/19 | | | | 8,537,137 | |
| | Credit Suisse AG | |
| | 1,000,000 | | | | 1.700 | | | | 04/27/18 | | | | 1,000,787 | |
| | Credit Suisse New York(a) (3M USD LIBOR + 0.690%) | |
| | 160,000 | | | | 2.001 | | | | 01/29/18 | | | | 160,297 | |
| | Danske Bank A/S(a)(b) (3M USD LIBOR + 0.510%) | |
| | 3,900,000 | | | | 1.826 | | | | 03/02/20 | | | | 3,909,586 | |
| | DBS Group Holdings Ltd.(a)(b) (3M USD LIBOR + 0.490%) | |
| | 10,000,000 | | | | 1.807 | | | | 06/08/20 | | | | 10,011,200 | |
| | Dexia Credit Local SA(a)(b) (3M USD LIBOR + 0.500%) | |
| | 10,000,000 | | | | 1.815 | | | | 02/15/19 | | | | 10,042,265 | |
| | DNB Bank ASA(a)(b) | |
| | 12,000,000 | | | | 1.705 | | | | 10/02/20 | | | | 12,060,528 | |
| | HSBC Bank PLC(a)(b) (3M USD LIBOR + 0.640%) | |
| | 1,290,000 | | | | 1.955 | | | | 05/15/18 | | | | 1,294,258 | |
| | HSBC USA, Inc. | |
| | 1,200,000 | | | | 1.500 | | | | 11/13/17 | | | | 1,200,178 | |
| | 2,000,000 | | | | 1.625 | | | | 01/16/18 | | | | 2,000,747 | |
| | 2,610,000 | | | | 2.208 | (a) | | | 09/24/18 | | | | 2,629,508 | |
| Industrial & Commercial Bank of China Ltd.(a) (3M USD LIBOR
+ 1.190%) |
|
| | 5,250,000 | | | | 2.499 | | | | 11/13/17 | | | | 5,251,366 | |
| | ING Bank NV(b) | |
| | 3,000,000 | | | | 2.050 | | | | 08/17/18 | | | | 3,006,157 | |
| | 5,625,000 | | | | 2.300 | | | | 03/22/19 | | | | 5,654,820 | |
| | 3,250,000 | | | | 1.925 | (a) | | | 08/15/19 | | | | 3,267,174 | |
| | 1,000,000 | | | | 2.025 | (a) | | | 10/01/19 | | | | 1,006,894 | |
| | JPMorgan Chase & Co.(a) (3M USD LIBOR + 0.955%) | |
| | 4,044,000 | | | | 2.268 | | | | 01/23/20 | | | | 4,106,431 | |
| | Lloyds Bank PLC | |
| | 950,000 | | | | 1.841 | (a) | | | 03/16/18 | | | | 951,761 | |
| | 1,500,000 | | | | 2.000 | | | | 08/17/18 | | | | 1,500,986 | |
| | 9,000,000 | | | | 2.313 | (a) | | | 01/22/19 | | | | 9,088,788 | |
| | Macquarie Bank Ltd.(b) | |
| | 1,380,000 | | | | 2.350 | | | | 01/15/19 | | | | 1,385,738 | |
| | 1,100,000 | | | | 2.484 | (a) | | | 01/15/19 | | | | 1,111,339 | |
| | 4,500,000 | | | | 1.870 | | | | 02/28/19 | | | | 4,485,903 | |
| | 5,000,000 | | | | 1.670 | (a) | | | 03/15/19 | | | | 4,999,038 | |
| | Mizuho Bank Ltd.(b) | |
| | 2,000,000 | | | | 1.850 | | | | 03/21/18 | | | | 2,001,895 | |
| | 2,880,000 | | | | 1.800 | | | | 03/26/18 | | | | 2,882,853 | |
| | 2,000,000 | | | | 2.150 | | | | 10/20/18 | | | | 2,005,829 | |
| | 3,497,000 | | | | 2.450 | | | | 04/16/19 | | | | 3,520,048 | |
| | |
| | |
| 88 | | The accompanying notes are an integral part of these financial statements. |
GOLDMAN SACHS SHORT-TERM CONSERVATIVE INCOME FUND
| | | | | | | | | | | | | | |
Principal
Amount | | | Interest
Rate | | | Maturity
Date | | | Value | |
| Corporate Obligations – (continued) | |
| Banks – (continued) | |
| | Morgan Stanley(a) | |
| $ | 3,500,000 | | | | 2.109 | % (c) | | | 02/14/20 | | | $ | 3,517,811 | |
| | 7,460,000 | | | | 2.301 | | | | 06/16/20 | | | | 7,553,776 | |
| | Morgan Stanley, Inc. | |
| | 2,000,000 | | | | 5.950 | | | | 12/28/17 | | | | 2,020,353 | |
| | 5,240,000 | | | | 6.625 | | | | 04/01/18 | | | | 5,368,065 | |
| | National Australia Bank Ltd.(a)(b) | |
| | 8,650,000 | | | | 1.894 | | | | 01/10/20 | | | | 8,701,016 | |
| | 4,000,000 | | | | 1.825 | | | | 05/22/20 | | | | 4,017,053 | |
| | National Bank of Canada(a) (3M USD LIBOR + 0.600%) | |
| | 4,000,000 | | | | 1.904 | | | | 01/17/20 | | | | 4,021,080 | |
| | Nordea Bank AB(b) | |
| | 1,000,000 | | | | 1.625 | | | | 05/15/18 | | | | 1,000,236 | |
| | 4,050,000 | | | | 1.875 | | | | 09/17/18 | | | | 4,057,737 | |
| | 3,382,000 | | | | 1.953 | (a) | | | 09/30/19 | | | | 3,407,503 | |
| | PNC Bank NA(c) | |
| | 2,879,000 | | | | 1.850 | | | | 07/20/18 | | | | 2,883,518 | |
| | 2,175,000 | | | | 1.700 | | | | 12/07/18 | | | | 2,172,530 | |
| | Regions Bank(c) | |
| | 5,410,000 | | | | 2.250 | | | | 09/14/18 | | | | 5,432,886 | |
| | Royal Bank of Canada(a) (3M USD LIBOR + 0.380%) | |
| | 2,150,000 | | | | 1.696 | | | | 03/02/20 | | | | 2,152,745 | |
| | Santander UK PLC | |
| | 6,500,000 | | | | 3.050 | | | | 08/23/18 | | | | 6,577,548 | |
| | 1,185,000 | | | | 2.167 | (a) | | | 08/24/18 | | | | 1,191,678 | |
| | 950,000 | | | | 2.799 | (a) | | | 03/14/19 | | | | 965,527 | |
| | Skandinaviska Enskilda Banken AB(b) | |
| | 4,690,000 | | | | 1.750 | | | | 03/19/18 | | | | 4,692,279 | |
| | 2,350,000 | | | | 1.887 | (a) | | | 09/13/19 | | | | 2,362,336 | |
| | Societe Generale SA | |
| | 1,500,000 | | | | 2.750 | | | | 10/12/17 | | | | 1,500,529 | |
| | 10,000,000 | | | | 2.415 | (a) | | | 10/01/18 | | | | 10,083,907 | |
| | Sumitomo Mitsui Banking Corp. | |
| | 3,760,000 | | | | 1.762 | | | | 10/19/18 | | | | 3,759,891 | |
| | 2,200,000 | | | | 1.845 | (a) | | | 01/11/19 | | | | 2,209,249 | |
| | 6,592,000 | | | | 1.966 | | | | 01/11/19 | | | | 6,598,706 | |
| | Sumitomo Mitsui Trust Bank Ltd.(b) | |
| | 3,595,000 | | | | 2.050 | | | | 03/06/19 | | | | 3,598,085 | |
| | 3,000,000 | | | | 1.764 | (a) | | | 09/19/19 | | | | 2,996,514 | |
| | 8,967,000 | | | | 2.214 | (a) | | | 10/18/19 | | | | 9,052,919 | |
| | Svenska Handelsbanken AB | |
| | 1,800,000 | | | | 1.625 | | | | 03/21/18 | | | | 1,801,004 | |
| | 5,100,000 | | | | 1.806 | (a) | | | 09/06/19 | | | | 5,123,989 | |
| | Swedbank AB(b) | |
| | 5,800,000 | | | | 1.750 | | | | 03/12/18 | | | | 5,802,204 | |
| The Bank of New York Mellon Corp.(a) (3M USD LIBOR +
0.560%) |
|
| | 581,000 | | | | 1.871 | | | | 08/01/18 | | | | 583,642 | |
| | The Bank of Tokyo-Mitsubishi UFJ Ltd.(b) | |
| | 8,584,000 | | | | 1.700 | | | | 03/05/18 | | | | 8,585,838 | |
| | 6,000,000 | | | | 2.700 | | | | 09/09/18 | | | | 6,049,739 | |
| | 1,750,000 | | | | 2.339 | (a) | | | 09/14/18 | | | | 1,763,707 | |
| | 3,815,000 | | | | 2.300 | | | | 03/10/19 | | | | 3,832,981 | |
| | The Toronto-Dominion Bank(a) (3M USD LIBOR + 0.420%) | |
| | 1,000,000 | | | | 1.724 | | | | 01/18/19 | | | | 1,003,150 | |
| | |
| Corporate Obligations – (continued) | |
| Banks – (continued) | |
| | UBS AG(a)(b)(c) (3M USD LIBOR + 0.580%) | |
| 9,800,000 | | | | 1.897 | | | | 06/08/20 | | | | 9,836,750 | |
| | UBS AG/Stamford CT | |
| | 1,000,000 | | | | 1.800 | | | | 03/26/18 | | | | 1,001,622 | |
| | 1,444,000 | | | | 5.750 | | | | 04/25/18 | | | | 1,478,120 | |
| | 1,210,000 | | | | 2.166 | (a) | | | 06/01/20 | | | | 1,224,448 | |
| | US Bancorp(a)(c) (3M USD LIBOR + 0.400%) | |
| | 1,324,000 | | | | 1.714 | | | | 04/25/19 | | | | 1,329,113 | |
| | Wells Fargo Bank NA | |
| | 700,000 | | | | 1.650 | | | | 01/22/18 | | | | 700,566 | |
| | 1,000,000 | | | | 1.966 | (a) | | | 12/06/19 | | | | 1,009,895 | |
| | Westpac Banking Corp.(a) | |
| | 1,880,000 | | | | 2.019 | | | | 05/13/19 | | | | 1,893,491 | |
| | 2,274,000 | | | | 1.876 | | | | 08/19/19 | | | | 2,287,395 | |
| | 1,730,000 | | | | 1.746 | | | | 03/06/20 | | | | 1,735,371 | |
| | 5,000,000 | | | | 1.676 | (b) | | | 09/01/20 | | | | 4,994,173 | |
| | | | | | | | | | | | | | |
| | | | | | | | | | | | | 390,884,145 | |
| | |
| Computers – 1.3% | |
| | Hewlett Packard Enterprise Co. | |
| | 11,609,000 | | | | 2.850 | | | | 10/05/18 | | | | 11,725,055 | |
| | International Business Machines Corp. | |
| | 5,350,000 | | | | 7.625 | | | | 10/15/18 | | | | 5,674,697 | |
| | | | | | | | | | | | | | |
| | | | | | | | | | | | | 17,399,752 | |
| | |
| Diversified Financial Services – 2.2% | |
| | AIG Global Funding(a)(b) (3M USD LIBOR + 0.480%) | |
| | 5,000,000 | | | | 1.815 | | | | 07/02/20 | | | | 5,007,843 | |
| | American Express Credit Corp.(a)(c) | |
| | 1,800,000 | | | | 1.641 | | | | 05/03/19 | | | | 1,804,550 | |
| | 1,000,000 | | | | 1.881 | | | | 10/30/19 | | | | 1,005,398 | |
| | National Rural Utilities Cooperative Finance Corp. | |
| | 4,073,000 | | | | 10.375 | | | | 11/01/18 | | | | 4,448,324 | |
| | Nomura Holdings, Inc. | |
| | 4,803,000 | | | | 2.750 | | | | 03/19/19 | | | | 4,846,241 | |
| | Protective Life Global Funding(a)(b) (3M USD LIBOR + 0.550%) | |
| | 3,900,000 | | | | 1.867 | | | | 06/08/18 | | | | 3,912,491 | |
| | The Bear Stearns Cos. LLC | |
| | 7,399,000 | | | | 4.650 | | | | 07/02/18 | | | | 7,558,535 | |
| | | | | | | | | | | | | | |
| | | | | | | | | | | | | 28,583,382 | |
| | |
| Electrical(c) – 0.1% | |
| | Public Service Electric & Gas Co. | |
| | 1,500,000 | | | | 2.000 | | | | 08/15/19 | | | | 1,502,826 | |
| | | | | | | | | | | | | | |
| | | | | | | | | | | | | 1,502,826 | |
| | |
| Food & Drug Retailing(a) – 0.7% | |
| Mondelez International Holdings Netherlands BV(b)
(3M USD LIBOR + 0.610%) |
|
| | 3,021,000 | | | | 1.924 | | | | 10/28/19 | | | | 3,033,657 | |
| | Mondelez International, Inc. (3M USD LIBOR + 0.520%) | |
| | 6,000,000 | | | | 1.831 | | | | 02/01/19 | | | | 6,013,193 | |
| | | | | | | | | | | | | | |
| | | | | | | | | | | | | 9,046,850 | |
| | |
| | |
| The accompanying notes are an integral part of these financial statements. | | 89 |
GOLDMAN SACHS SHORT-TERM CONSERVATIVE INCOME FUND
Schedule of Investments (continued)
September 30, 2017 (Unaudited)
| | | | | | | | | | | | | | |
Principal
Amount | | | Interest
Rate | | | Maturity
Date | | | Value | |
| Corporate Obligations – (continued) | |
| Insurance(b) – 1.0% | |
| | Metropolitan Life Global Funding I | |
| $ | 1,200,000 | | | | 1.754 | % (a) | | | 12/19/18 | | | $ | 1,205,769 | |
| | 5,000,000 | | | | 2.300 | | | | 04/10/19 | | | | 5,034,850 | |
| | 4,000,000 | | | | 1.710 | (a) | | | 06/12/20 | | | | 4,018,652 | |
| | New York Life Global Funding | |
| | 1,345,000 | | | | 2.150 | | | | 06/18/19 | | | | 1,350,010 | |
| | 1,000,000 | | | | 1.703 | (a) | | | 10/24/19 | | | | 1,005,261 | |
| | | | | | | | | | | | | | |
| | | | | | | | | | | | | 12,614,542 | |
| | |
| Machinery-Diversified(a) – 0.5% | |
| | John Deere Capital Corp. (3M USD LIBOR + 0.290%) | |
| | 6,000,000 | | | | 1.613 | | | | 06/22/20 | | | | 6,009,840 | |
| | |
| Media – 0.2% | |
| | RELX Capital, Inc. | |
| | 1,854,000 | | | | 8.625 | | | | 01/15/19 | | | | 2,002,900 | |
| | |
| Oil Field Services(b) – 0.4% | |
| | Schlumberger Holdings Corp. | |
| | 5,000,000 | | | | 2.350 | | | | 12/21/18 | | | | 5,028,658 | |
| | |
| Pharmaceuticals(b) – 0.1% | |
| | Bayer US Finance LLC | |
| | 2,000,000 | | | | 1.500 | | | | 10/06/17 | | | | 2,000,000 | |
| | |
| Pipelines – 1.1% | |
| | Spectra Energy Partners LP(a) (3M USD LIBOR + 0.700%) | |
| | 10,000,000 | | | | 2.016 | | | | 06/05/20 | | | | 10,081,788 | |
| | TransCanada PipeLines Ltd. | |
| | 4,000,000 | | | | 1.625 | | | | 11/09/17 | | | | 3,999,584 | |
| | | | | | | | | | | | | | |
| | | | | | | | | | | | | 14,081,372 | |
| | |
| Real Estate Investment Trust(c) – 0.1% | |
| | Realty Income Corp. | |
| | 2,000,000 | | | | 2.000 | | | | 01/31/18 | | | | 2,001,729 | |
| | |
| Semiconductors(a) – 0.3% | |
| | QUALCOMM, Inc. (3M USD LIBOR + 0.450%) | |
| | 4,000,000 | | | | 1.766 | | | | 05/20/20 | | | | 4,025,335 | |
| | |
| Telecommunication Services(a) – 0.3% | |
| | Verizon Communications, Inc. (3M USD LIBOR + 0.550%) | |
| | 4,300,000 | | | | 1.865 | | | | 05/22/20 | | | | 4,305,930 | |
| | |
| | TOTAL CORPORATE OBLIGATIONS
| |
| | (Cost $531,966,084) | | | | | | | $ | 532,293,968 | |
| | |
| | | | | | | | | | | | | | |
| Mortgage-Backed Obligations(a)(b) – 0.6% | |
| Collateralized Mortgage Obligations – 0.6% | |
| Sequential Floating Rate – 0.6% | |
| Mortgage Repurchase Agreement Financing Trust Series 2016-1,
Class A2 (1M USD LIBOR + 0.950%) |
|
| | 4,000,000 | | | | 2.181 | | | | 04/10/19 | | | | 4,000,085 | |
| Mortgage-Backed Obligations(a)(b) – (continued) | |
| Collateralized Mortgage Obligations – (continued) | |
| Sequential Floating Rate – (continued) | |
| Mortgage Repurchase Agreement Financing Trust Series 2017-1,
Class A1 (1M USD LIBOR + 0.850%) |
|
| 4,000,000 | | | | 2.081 | | | | 07/10/19 | | | | 4,001,028 | |
| | |
| | TOTAL MORTGAGE-BACKED OBLIGATIONS
| |
| | (Cost $8,000,157) | | | | | | | $ | 8,001,113 | |
| | |
| | | | | | | | |
| Shares | | | Distribution
Rate | | Value | |
| | | | | | | | |
| Investment Company(d) – 3.1% | |
| Goldman Sachs Financial Square Government Fund –
Institutional Shares |
|
| | 40,930,812 | | | 0.914% | | $ | 40,930,812 | |
| | (Cost $40,930,812) | | | | |
| | |
| TOTAL INVESTMENTS BEFORE SHORT-TERM
INVESTMENTS
|
|
| | (Cost $580,897,053) | | $ | 581,225,893 | |
| | |
| | | | | | | | | | | | | | |
Principal
Amount | | | Interest
Rate | | | Maturity
Date | | | Value | |
| Short-term Investments – 60.2% | |
| Certificates of Deposit – 25.0% | |
| | Bank of Montreal | |
| $ | 500,000 | | | | 1.783 | % | | | 10/24/17 | | | $ | 500,206 | |
| | The Bank of Tokyo-Mitsubishi UFJ Ltd. | |
| | 200,000 | | | | 1.600 | | | | 11/10/17 | | | | 200,080 | |
| | Canadian Imperial Bank of Commerce | |
| | 400,000 | | | | 1.734 | | | | 10/12/17 | | | | 400,081 | |
| | Credit Suisse New York | |
| | 500,000 | | | | 2.051 | | | | 11/03/17 | | | | 500,411 | |
| | Societe Generale NY | |
| | 500,000 | | | | 1.844 | | | | 10/13/17 | | | | 500,130 | |
| | The Toronto-Dominion Bank | |
| | 500,000 | | | | 1.704 | | | | 10/17/17 | | | | 500,131 | |
| | UBS AG Stamford | |
| | 500,000 | | | | 1.420 | | | | 11/02/17 | | | | 500,071 | |
| | Bank of Montreal | |
| | 800,000 | | | | 1.721 | | | | 06/18/18 | | | | 799,886 | |
| | Natixis NY | |
| | 700,000 | | | | 1.801 | | | | 11/01/17 | | | | 700,366 | |
| | The Bank of Tokyo-Mitsubishi UFJ Ltd. | |
| | 1,000,000 | | | | 1.520 | | | | 10/31/17 | | | | 1,000,255 | |
| | Barclays Bank PLC | |
| | 6,600,000 | | | | 2.066 | | | | 12/06/17 | | | | 6,609,849 | |
| | 1,000,000 | | | | 1.936 | | | | 02/21/18 | | | | 1,001,660 | |
| | Bayerische Landesbank(a) | |
| | 1,000,000 | | | | 1.814 | | | | 02/16/18 | | | | 1,001,897 | |
| | Canadian Imperial Bank | |
| | 1,500,000 | | | | 1.567 | | | | 09/13/18 | | | | 1,499,857 | |
| | Credit Agricole SA | |
| | 2,000,000 | | | | 1.864 | | | | 07/13/18 | | | | 2,003,237 | |
| | |
| | |
| 90 | | The accompanying notes are an integral part of these financial statements. |
GOLDMAN SACHS SHORT-TERM CONSERVATIVE INCOME FUND
| | | | | | | | | | | | | | |
Principal
Amount | | | Interest
Rate | | | Maturity
Date | | | Value | |
| Short-term Investments – (continued) | |
| Certificates of Deposit – (continued) | |
| | Credit Suisse New York | |
| $ | 1,000,000 | | | | 2.056 | % | | | 11/21/17 | | | $ | 1,001,213 | |
| | DG Bank NY | |
| | 1,000,000 | | | | 1.754 | | | | 01/17/19 | | | | 999,743 | |
| | 1,175,000 | | | | 1.686 | | | | 08/16/18 | | | | 1,174,795 | |
| | Dexia Credit Local SA | |
| | 1,500,000 | | | | 1.646 | | | | 11/22/17 | | | | 1,500,927 | |
| | 1,750,000 | | | | 1.586 | | | | 12/20/17 | | | | 1,751,234 | |
| | Landesbank Baden-Wuerttemberg | |
| | 1,500,000 | | | | 0.010 | | | | 02/02/18 | | | | 1,501,601 | |
| | 1,500,000 | | | | 0.010 | | | | 03/23/18 | | | | 1,502,132 | |
| | Mizuho Bank Ltd. | |
| | 2,000,000 | | | | 1.828 | | | | 09/24/18 | | | | 1,999,609 | |
| | Norinchukin Bank NY | |
| | 800,000 | | | | 2.019 | | | | 10/12/17 | | | | 800,244 | |
| | 2,000,000 | | | | 1.720 | | | | 03/22/18 | | | | 2,002,505 | |
| | Societe Generale NY | |
| | 1,000,000 | | | | 1.450 | | | | 10/20/17 | | | | 1,000,144 | |
| | Standard Chartered Bank | |
| | 1,000,000 | | | | 0.000 | (e) | | | 02/05/18 | | | | 995,026 | |
| | 1,500,000 | | | | 1.674 | | | | 12/19/17 | | | | 1,501,353 | |
| | Sumitomo Mitsui Banking Corp. | |
| | 1,000,000 | | | | 1.861 | | | | 08/03/18 | | | | 1,001,240 | |
| | Svenska Handelsbanken AB | |
| | 2,000,000 | | | | 1.709 | | | | 02/12/19 | | | | 1,999,456 | |
| | Swedbank (Sparbank) | |
| | 1,000,000 | | | | 1.684 | | | | 07/10/18 | | | | 999,847 | |
| | UBS AG Stamford | |
| | 1,000,000 | | | | 1.631 | | | | 03/07/18 | | | | 1,001,127 | |
| | Banco Del Estado De Chile | |
| | 5,000,000 | | | | 0.010 | | | | 02/12/18 | | | | 4,971,060 | |
| | The Bank of Nova Scotia | |
| | 1,500,000 | | | | 1.604 | | | | 04/12/19 | | | | 1,499,548 | |
| | 1,000,000 | | | | 1.561 | | | | 11/02/18 | | | | 999,784 | |
| | Bank of Nova Scotia | |
| | 2,500,000 | | | | 1.511 | | | | 11/09/18 | | | | 2,499,450 | |
| | The Bank of Nova Scotia | |
| | 2,000,000 | | | | 1.615 | | | | 05/15/19 | | | | 1,999,358 | |
| | Barclays Bank PLC | |
| | 1,000,000 | | | | 1.726 | | | | 02/20/18 | | | | 1,000,784 | |
| | Canadian Imperial Bank of Commerce | |
| | 1,500,000 | | | | 1.750 | | | | 05/01/19 | | | | 1,500,219 | |
| | 4,000,000 | | | | 1.647 | | | | 05/29/19 | | | | 3,998,685 | |
| | 4,000,000 | | | | 1.444 | | | | 07/16/18 | | | | 4,000,266 | |
| | Credit Agricole SA | |
| | 3,000,000 | | | | 1.786 | | | | 06/03/19 | | | | 2,999,006 | |
| | Credit Suisse New York | |
| | 1,000,000 | | | | 1.329 | | | | 11/20/17 | | | | 1,000,441 | |
| | Credit Industriel et Commercial SA | |
| | 3,050,000 | | | | 1.440 | | | | 01/02/18 | | | | 3,051,363 | |
| | Credit Suisse New York | |
| | 6,000,000 | | | | 1.640 | | | | 05/03/18 | | | | 6,002,478 | |
| | Dexia Credit Local SA | |
| | 2,000,000 | | | | 1.611 | | | | 12/07/17 | | | | 2,001,370 | |
| | 2,000,000 | | | | 1.601 | | | | 04/04/18 | | | | 2,002,350 | |
| | |
| Short-term Investments – (continued) | |
| Certificates of Deposit – (continued) | |
| | National Bank of Canada | |
| 750,000 | | | | 1.545 | | | | 10/11/18 | | | | 749,848 | |
| | 1,750,000 | | | | 1.750 | | | | 05/08/19 | | | | 1,750,357 | |
| | Natixis NY | |
| | 2,000,000 | | | | 1.664 | | | | 05/15/18 | | | | 2,002,586 | |
| | Royal Bank of Canada | |
| | 3,000,000 | | | | 1.434 | | | | 07/16/18 | | | | 3,000,200 | |
| | Standard Chartered Bank | |
| | 2,000,000 | | | | 1.388 | | | | 01/11/18 | | | | 2,001,772 | |
| | 2,500,000 | | | | 1.537 | | | | 06/21/18 | | | | 2,501,877 | |
| | Sumitomo Mitsui Banking Corp. | |
| | 1,750,000 | | | | 2.050 | | | | 05/03/19 | | | | 1,750,000 | |
| | Svenska Handelsbanken AB | |
| | 5,000,000 | | | | 1.506 | | | | 01/03/19 | | | | 4,998,758 | |
| | Banco Del Estado De Chile | |
| | 4,000,000 | | | | 1.480 | | | | 01/19/18 | | | | 4,001,325 | |
| | Bank of China Ltd.(e) | |
| | 4,000,000 | | | | 0.000 | | | | 10/16/17 | | | | 3,997,284 | |
| | Bank of Montreal | |
| | 6,000,000 | | | | 1.635 | | | | 07/11/19 | | | | 5,998,950 | |
| | Bank of Nova Scotia | |
| | 5,000,000 | | | | 1.527 | | | | 02/28/19 | | | | 4,995,813 | |
| | Barclays Bank PLC | |
| | 6,175,000 | | | | 1.706 | | | | 03/29/18 | | | | 6,179,639 | |
| | Bayerische Landesbank | |
| | 5,000,000 | | | | 1.000 | | | | 08/23/18 | | | | 5,003,421 | |
| | China Construction Banking Corp. | |
| | 5,000,000 | | | | 1.750 | | | | 10/16/17 | | | | 5,000,714 | |
| | Cooperatieve Rabobank UA | |
| | 7,250,000 | | | | 1.658 | | | | 03/24/20 | | | | 7,246,479 | |
| | Credit Suisse New York | |
| | 4,000,000 | | | | 1.557 | | | | 09/20/18 | | | | 3,999,978 | |
| | Dexia Credit Local SA | |
| | 400,000 | | | | 1.581 | | | | 01/05/18 | | | | 400,310 | |
| | National Bank of Canada | |
| | 4,000,000 | | | | 1.467 | | | | 09/21/18 | | | | 4,000,689 | |
| | National Bank of Kuwait SAKP | |
| | 2,000,000 | | | | 1.700 | | | | 01/12/18 | | | | 2,001,156 | |
| | 4,000,000 | | | | 1.530 | | | | 12/22/17 | | | | 4,000,891 | |
| | Royal Bank of Canada | |
| | 5,000,000 | | | | 1.445 | | | | 08/09/18 | | | | 5,000,575 | |
| | Sumitomo Mitsui Banking Corp. | |
| | 3,600,000 | | | | 1.674 | | | | 07/11/19 | | | | 3,598,743 | |
| | Sumitomo Mitsui Trust Bank Ltd. | |
| | 5,500,000 | | | | 1.674 | | | | 01/17/19 | | | | 5,498,594 | |
| | The Toronto-Dominion Bank | |
| | 3,300,000 | | | | 1.600 | | | | 07/20/18 | | | | 3,302,656 | |
| | 3,400,000 | | | | 1.600 | | | | 08/22/18 | | | | 3,402,421 | |
| | Versailles LLC(e) | |
| | 2,400,000 | | | | 0.000 | | | | 11/09/17 | | | | 2,396,507 | |
| | Banco del Estado de Chile | |
| | 4,500,000 | | | | 1.417 | | | | 03/27/18 | | | | 4,500,000 | |
| | Bank of China Ltd.(e) | |
| | 7,000,000 | | | | 0.000 | | | | 11/06/17 | | | | 6,988,850 | |
| | |
| | |
| The accompanying notes are an integral part of these financial statements. | | 91 |
GOLDMAN SACHS SHORT-TERM CONSERVATIVE INCOME FUND
Schedule of Investments (continued)
September 30, 2017 (Unaudited)
| | | | | | | | | | | | | | |
Principal
Amount | | | Interest
Rate | | | Maturity
Date | | | Value | |
| Short-term Investments – (continued) | |
| Certificates of Deposit – (continued) | |
| | Bank of Montreal | |
| $ | 5,000,000 | | | | 1.474 | % | | | 10/17/18 | | | $ | 4,999,434 | |
| | Can Ast & Can, Ltd. Jt(e) | |
| | 3,000,000 | | | | 0.000 | | | | 10/06/17 | | | | 2,999,312 | |
| | European Investment Bank(e) | |
| | 30,000,000 | | | | 0.000 | | | | 10/04/17 | | | | 29,994,954 | |
| | Landesbank Baden-Wuerttemberg | |
| | 20,000,000 | | | | 1.140 | | | | 10/04/17 | | | | 20,000,000 | |
| | National Bank of Kuwait SAKP | |
| | 4,500,000 | | | | 1.650 | | | | 03/07/18 | | | | 4,500,500 | |
| | 3,000,000 | | | | 1.000 | | | | 01/18/18 | | | | 3,000,295 | |
| | 5,000,000 | | | | 1.700 | | | | 03/21/18 | | | | 5,000,603 | |
| | Nordea Bank Finland PLC | |
| | 3,000,000 | | | | 1.762 | | | | 11/07/18 | | | | 2,999,342 | |
| | Thunder Bay Funding LLC(e) | |
| | 11,000,000 | | | | 0.000 | | | | 03/20/18 | | | | 10,924,215 | |
| | Versailles LLC(e) | |
| | 4,800,000 | | | | 0.000 | | | | 10/31/17 | | | | 4,794,611 | |
| | Industrial & Commercial Bank of China Ltd. | |
| | 7,000,000 | | | | 1.850 | | | | 01/16/18 | | | | 7,000,000 | |
| | China Construction Banking Corp. | |
| | 5,000,000 | | | | 1.000 | | | | 11/02/17 | | | | 4,992,893 | |
| | 6,000,000 | | | | 1.850 | | | | 01/16/18 | | | | 6,000,000 | |
| | Credit Industriel et Commercial SA | |
| | 10,000,000 | | | | 1.461 | | | | 10/05/17 | | | | 10,000,503 | |
| | DBS Bank Ltd.(e) | |
| | 7,000,000 | | | | 0.000 | | | | 01/19/18 | | | | 6,971,754 | |
| | DnB NOR Bank ASA | |
| | 10,000,000 | | | | 1.560 | | | | 09/19/18 | | | | 9,995,176 | |
| | | | | | | | | | | | | | |
| | | | | | | | | | | | | 324,420,460 | |
| | |
| Commercial Paper – 27.7% | |
| | The Bank of Nova Scotia | |
| | 500,000 | | | | 1.443 | | | | 11/07/17 | | | | 500,298 | |
| | Commonwealth Bank of Australia | |
| | 500,000 | | | | 1.280 | | | | 10/12/17 | | | | 500,096 | |
| | Jupiter Securitization Co. LLC | |
| | 750,000 | | | | 1.611 | | | | 11/03/17 | | | | 750,296 | |
| | Atlantic Asset Securitization Corp. | |
| | 3,000,000 | | | | 1.567 | | | | 12/15/17 | | | | 3,001,230 | |
| | Bedford Row Funding Corp. | |
| | 1,500,000 | | | | 1.342 | | | | 03/16/18 | | | | 1,501,022 | |
| | Collateralized Commercial Paper Co. Ltd. | |
| | 2,000,000 | | | | 0.000 | (e) | | | 12/18/17 | | | | 1,994,089 | |
| | 1,750,000 | | | | 1.352 | | | | 12/12/17 | | | | 1,750,893 | |
| | Electricite de France SA(e) | |
| | 1,100,000 | | | | 0.000 | | | | 01/05/18 | | | | 1,095,407 | |
| | ING Funding LLC(e) | |
| | 1,000,000 | | | | 0.000 | | | | 11/01/17 | | | | 998,871 | |
| | Private Export Funding Corp. | |
| | 3,500,000 | | | | 1.495 | | | | 03/28/18 | | | | 3,501,480 | |
| | ABN AMRO Funding USA LLC | |
| | 3,500,000 | | | | 0.000 | (e) | | | 02/22/18 | | | | 3,480,142 | |
| | 2,000,000 | | | | 1.000 | | | | 03/08/18 | | | | 1,987,378 | |
| | Abbey National Treasury Services PLC | |
| | 5,500,000 | | | | 1.414 | | | | 12/15/17 | | | | 5,501,759 | |
| | |
| Short-term Investments – (continued) | |
| Commercial Paper – (continued) | |
| | Alpine Securitization Ltd. | |
| 4,000,000 | | | | 1.456 | | | | 11/17/17 | | | | 4,001,304 | |
| | 2,000,000 | | | | 1.345 | | | | 12/04/17 | | | | 2,001,036 | |
| | Anheuser-Busch InBev Worldwide, Inc.(e) | |
| | 3,000,000 | | | | 0.000 | | | | 03/01/18 | | | | 2,980,442 | |
| | Bedford Row Funding Corp. | |
| | 2,000,000 | | | | 1.144 | | | | 02/20/18 | | | | 2,000,102 | |
| | 1,400,000 | | | | 1.454 | | | | 04/13/18 | | | | 1,400,823 | |
| | Dominion Energy, Inc.(e) | |
| | 2,000,000 | | | | 0.000 | | | | 10/12/17 | | | | 1,999,007 | |
| | Ford Motor Credit Co. LLC(e) | |
| | 1,000,000 | | | | 0.000 | | | | 05/02/18 | | | | 989,250 | |
| | 1,400,000 | | | | 0.000 | | | | 05/11/18 | | | | 1,384,198 | |
| | ING Funding LLC | |
| | 1,000,000 | | | | 1.325 | | | | 01/26/18 | | | | 1,000,775 | |
| | Landesbank Hessen-Thuringen | |
| | 5,000,000 | | | | 0.010 | | | | 02/13/18 | | | | 4,972,438 | |
| | Matchpoint Finance PLC | |
| | 3,000,000 | | | | 0.000 | (e) | | | 10/03/17 | | | | 2,999,571 | |
| | 4,000,000 | | | | 0.000 | (e) | | | 12/12/17 | | | | 3,988,505 | |
| | 2,000,000 | | | | 1.470 | | | | 12/12/17 | | | | 1,994,253 | |
| | Thunder Bay Funding LLC | |
| | 2,000,000 | | | | 1.234 | | | | 03/07/18 | | | | 1,999,892 | |
| | Cafco LLC(e) | |
| | 7,000,000 | | | | 0.000 | | | | 02/02/18 | | | | 6,966,754 | |
| | Dominion Resources, Inc.(e) | |
| | 4,000,000 | | | | 0.000 | | | | 10/16/17 | | | | 3,997,391 | |
| | Ei Dupont(e) | |
| | 5,000,000 | | | | 0.000 | | | | 10/23/17 | | | | 4,995,380 | |
| | Electricite de France SA(e) | |
| | 9,600,000 | | | | 0.000 | | | | 10/10/17 | | | | 9,595,981 | |
| | Ford Motor Credit Co.(e) | |
| | 1,000,000 | | | | 0.000 | | | | 02/02/18 | | | | 994,190 | |
| | Ford Motor Credit Co. LLC(e) | |
| | 2,300,000 | | | | 0.000 | | | | 07/10/18 | | | | 2,265,507 | |
| | Gotham Funding Corp.(e) | |
| | 8,400,000 | | | | 0.000 | | | | 12/04/17 | | | | 8,379,703 | |
| | LMA SA LMA Americas | |
| | 5,000,000 | | | | 0.000 | (e) | | | 01/24/18 | | | | 4,977,331 | |
| | 13,000,000 | | | | 1.000 | | | | 02/01/18 | | | | 12,930,009 | |
| | Matchpoint Finance PLC | |
| | 2,500,000 | | | | 1.481 | | | | 12/12/17 | | | | 2,492,816 | |
| | Old Line Funding LLC(e) | |
| | 8,400,000 | | | | 0.000 | | | | 12/04/17 | | | | 8,379,980 | |
| | Private Export Funding Corp. | |
| | 5,580,000 | | | | 1.606 | | | | 01/19/18 | | | | 5,585,386 | |
| | Schlumberger Holdings Corp.(e) | |
| | 11,000,000 | | | | 0.000 | | | | 10/27/17 | | | | 10,987,603 | |
| | Albion Capital Corp.(e) | |
| | 15,000,000 | | | | 0.000 | | | | 10/06/17 | | | | 14,996,558 | |
| | Alpine Securitization Ltd.(e) | |
| | 5,000,000 | | | | 0.000 | | | | 02/02/18 | | | | 4,975,325 | |
| | CBS Corp.(e) | |
| | 5,000,000 | | | | 0.000 | | | | 10/23/17 | | | | 4,995,380 | |
| | Dominion Resources, Inc.(e) | |
| | 6,000,000 | | | | 0.000 | | | | 11/27/17 | | | | 5,986,560 | |
| | |
| | |
| 92 | | The accompanying notes are an integral part of these financial statements. |
GOLDMAN SACHS SHORT-TERM CONSERVATIVE INCOME FUND
| | | | | | | | | | | | | | |
Principal
Amount | | | Interest
Rate | | | Maturity
Date | | | Value | |
| Short-term Investments – (continued) | |
| Commercial Paper – (continued) | |
| | Ei Dupont(e) | |
| $ | 3,000,000 | | | | 0.000 | % | | | 12/11/17 | | | $ | 2,991,064 | |
| | Edison International(e) | |
| | 5,000,000 | | | | 0.000 | | | | 10/02/17 | | | | 4,999,438 | |
| | First Abu Dhabi Bank PJSC(e) | |
| | 25,000,000 | | | | 0.000 | | | | 10/04/17 | | | | 24,996,222 | |
| | Gotham Funding Corp.(e) | |
| | 6,000,000 | | | | 0.000 | | | | 03/28/18 | | | | 5,955,000 | |
| | Liberty Funding LLC | |
| | 3,000,000 | | | | 1.000 | | | | 01/09/18 | | | | 2,988,355 | |
| | 12,000,000 | | | | 0.000 | (e) | | | 01/17/18 | | | | 11,949,290 | |
| | LMA SA LMA Americas(e) | |
| | 20,000,000 | | | | 0.000 | | | | 10/02/17 | | | | 19,998,183 | |
| | 6,500,000 | | | | 0.000 | | | | 04/04/18 | | | | 6,449,017 | |
| | Matchpoint Finance PLC(e) | |
| | 19,000,000 | | | | 0.000 | | | | 10/02/17 | | | | 18,997,966 | |
| | Nieuw Amsterdam Receivables Corp.(e) | |
| | 13,000,000 | | | | 0.000 | | | | 01/16/18 | | | | 12,944,973 | |
| | Oversea-Chinese Banking Corp. Ltd.(e) | |
| | 15,000,000 | | | | 0.000 | | | | 10/03/17 | | | | 14,998,088 | |
| | 15,000,000 | | | | 0.000 | | | | 10/04/17 | | | | 14,997,602 | |
| | Regency Markets No.1 LLC(e) | |
| | 12,000,000 | | | | 0.000 | | | | 10/24/17 | | | | 11,989,608 | |
| | Southern Co.(e) | |
| | 5,000,000 | | | | 0.000 | | | | 10/06/17 | | | | 4,998,678 | |
| | VW Credit, Inc.(e) | |
| | 7,000,000 | | | | 0.000 | | | | 12/18/17 | | | | 6,976,931 | |
| | Victory Receivables(e) | |
| | 10,000,000 | | | | 0.000 | | | | 10/10/17 | | | | 9,996,333 | |
| | 10,000,000 | | | | 0.000 | | | | 12/18/17 | | | | 9,970,444 | |
| | | | | | | | | | | | | | |
| | | | | | | | | | | | | 359,973,603 | |
| | |
| Repurchase Agreement – 7.5% | |
| | Citigroup Global Markets, Inc. | |
| | 19,000,000 | | | | 2.014 | | | | 12/20/17 | | | | 19,000,000 | |
| | Maturity Value: $19,095,665 | | | | | |
| | Settlement Date: 09/21/17 | | | | | |
| Collateralized by various corporate obligations, 0.000% to
11.250%, due 10/01/17 to 12/01/37; various mortgages backed
obligations, 3.000% to 5.375%, due 04/25/24 to 08/25/56; a
foreign debt obligation, 7.500%, due 06/01/27. The aggregate
market value of the collateral, including accrued interest, was
$22,010,990. |
|
| | |
| | BNP Paribas SA | |
| | 25,000,000 | | | | 1.400 | | | | 10/02/17 | | | | 25,000,000 | |
| | Maturity Value: $25,002,917 | | | | | |
| | Settlement Date: 09/29/17 | | | | | |
| Collateralized by various foreign debt obligations, 2.625% to
8.875%, due 06/10/19 to 04/15/24. The aggregate market value
of the collateral, including accrued interest, was $27,500,400. |
|
| | |
| Short-term Investments – (continued) | |
| Repurchase Agreement – (continued) | |
| | Nomura | |
| $ | 19,000,000 | | | | 2.487 | % | | | 01/12/18 | | | $ | 19,000,000 | |
| | Maturity Value: $19,147,009 | | | | | |
| | Settlement Date: 09/22/17 | | | | | |
| Collateralized by various mortgage backed obligations, 0.000% to
7.138%, due 09/27/21 to 01/25/58. The aggregate market value
of the collateral, including accrued interest, was $22,738,996. |
|
| | |
| | Mizuho Securities USA | |
| | 3,000,000 | | | | 2.262 | | | | 11/08/17 | | | | 3,000,000 | |
| | Maturity Value: $3,035,627 | | | | | |
| | Settlement Date: 05/03/17 | | | | | |
| Collateralized by various U.S. Treasury obligations, 0.750%
1.750%, due 02/15/19 to 01/31/23. The aggregate market value
of the collateral, including accrued interest, was $3,060,091. |
|
| | |
| | Bank of America Corp. | |
| | 15,000,000 | | | | 1.890 | | | | 11/01/17 | | | | 15,000,000 | |
| | Maturity Value: $15,070,875 | |
| | Settlement Date: 08/03/17 | |
| Collateralized by various exchange traded funds. The aggregate
market value of the collateral, including accrued interest, was
$16,200,000. |
|
| | |
| | Wells Fargo | |
| | 17,000,000 | | | | 1.720 | | | | 12/12/17 | | | | 17,000,000 | |
| | Maturity Value: $17,074,724 | |
| | Settlement Date: 09/11/17 | |
| Collateralized by various municipal debt obligations, 4.000% to
5.000 %, due 12/10/26 to 04/01/44. The aggregate market value
of the collateral, including accrued interest, was $18,700,000. |
|
| | | | | | | | | | | | | | |
| | | | | | | | | | | | | 98,000,000 | |
| | |
| | TOTAL SHORT-TERM INVESTMENTS
| | | | | |
| | (Cost $782,337,780) | | | $ | 782,394,063 | |
| | |
| | TOTAL INVESTMENTS – 104.9%
| | | | | |
| | (Cost $1,363,234,833) | | | $ | 1,363,619,956 | |
| | |
| LIABILITIES IN EXCESS OF OTHER
ASSETS – (4.9)% |
| | | (63,720,168 | ) |
| | |
| | NET ASSETS – 100.0% | | | $ | 1,299,899,788 | |
| | |
| | |
| The percentage shown for each investment category reflects the value of investments in that category as a percentage of net assets. |
(a) | | Variable rate security. Interest rate or distribution rate disclosed is that which is in effect on September 30, 2017. |
(b) | | Exempt from registration under Rule 144A of the Securities Act of 1933. Such securities may be deemed liquid by the investment adviser and may be resold, normally to qualified institutional buyers in transactions exempt from registration. Total market value of Rule 144A securities amounts to $285,821,096, which represents approximately 22.0% of net assets as of September 30, 2017 and are unaudited. |
(c) | | Security with “Call” features with resetting interest rates. Maturity dates disclosed are the final maturity dates. |
(d) | | Represents an Affiliated Issuer. |
(e) | | Issued with a zero coupon. Income is recognized through the accretion of discount. |
| | |
| The accompanying notes are an integral part of these financial statements. | | 93 |
GOLDMAN SACHS SHORT-TERM CONSERVATIVE INCOME FUND
Schedule of Investments (continued)
September 30, 2017 (Unaudited)
| | |
|
Currency Abbreviations: |
USD | | —U.S. Dollar |
| | |
Investment Abbreviations: |
LIBOR | | —London Interbank Offered Rate |
LLC | | —Limited Liability Company |
LP | | —Limited Partnership |
PLC | | —Public Limited Company |
|
| | |
| 94 | | The accompanying notes are an integral part of these financial statements. |
GOLDMAN SACHS SHORT DURATION AND GOVERNMENT FIXED INCOME FUNDS
|
| ADDITIONAL INVESTMENT INFORMATION |
JOINT REPURCHASE AGREEMENT ACCOUNT II — At September 30, 2017, the High Quality Floating Rate Fund had undivided interests in the Joint Repurchase Agreement Account II, with a maturity date of October 2, 2017, as follows:
| | | | |
| Principal Amount | | Maturity Value | | Collateral Allocation Value |
| $27,100,000 | | $27,101,614 | | $27,642,816 |
REPURCHASE AGREEMENTS — At September 30, 2017, the Principal Amounts of the Fund’s interest in the Joint Repurchase Agreement Account II were as follows:
| | | | | | | | |
| Counterparty | | Interest Rate | | | High Quality Floating Rate Fund | |
Citigroup Global Markets, Inc. | | | 1.080 | % | | $ | 4,676,686 | |
Merrill Lynch & Co., Inc. | | | 1.070 | | | | 22,423,314 | |
| TOTAL | | | | | | $ | 27,100,000 | |
At September 30, 2017, the Joint Repurchase Agreement Account II was fully collateralized by:
| | | | | | | | |
| Issuer | | Interest Rates | | | Maturity Dates | |
Federal Home Loan Mortgage Corp. | | | 2.500% to 5.500 | % | | | 09/01/27 to 01/01/29 | |
Government National Mortgage Association | | | 3.000 to 4.000 | | | | 11/20/46 to 09/20/47 | |
United States Treasury Notes | | | 1.250 to 3.625 | | | | 02/15/21 to 08/15/27 | |
United States Treasury Stripped Securities | | | 0.000 | | | | 08/15/28 to 05/15/47 | |
| | |
| The accompanying notes are an integral part of these financial statements. | | 95 |
GOLDMAN SACHS SHORT DURATION AND GOVERNMENT FIXED INCOME FUNDS
Statements of Assets and Liabilities
September 30, 2017 (Unaudited)
| | | | | | |
| | | | |
Enhanced
Income Fund | |
| | Assets: | | | | |
| | Investments of unaffiliated issuers, at value (cost $546,399,027, $377,125,262, $695,495,243, $341,722,455, $1,071,968,824, $632,478,505 and $1,211,382,310) | | $ | 546,346,533 | |
| | Investments of affiliated issuers, at value (cost $68,129,485, $20,262,525, $0, $5,846,883, $34,770,975, $6,812,687 and $40,930,812) | | | 68,129,485 | |
| | Repurchase agreement, at value which equals cost | | | — | |
| | Purchased options (cost $0, $23,012, $0, $11,645, $0, $66,225, and $0 ) | | | — | |
| | Cash | | | 10,008,893 | |
| | Foreign currencies, at value (cost $0, $0, $0, $0, $0, $62,378 and $0, respectively) | | | — | |
| | Unrealized gain on swap contracts | | | — | |
| | Unrealized gain on forward foreign currency exchange contracts | | | — | |
| | Variation margin on swap contracts | | | — | |
| | Variation margin on futures contracts | | | — | |
| | Receivables: | | | | |
| | Interest | | | 2,334,676 | |
| | Investments sold | | | 360,472 | |
| | Fund shares sold | | | 455,654 | |
| | Investments sold on an extended-settlement basis | | | — | |
| | Reimbursement from investment adviser | | | — | |
| | Due from broker | | | — | |
| | Due from broker — upfront payment | | | — | |
| | Collateral on certain derivative contracts (a) | | | — | |
| | Other assets | | | 646 | |
| | Total assets | | | 627,636,359 | |
| | | | | | |
| | Liabilities: | | | | |
| | Unrealized loss on swap contracts | | | — | |
| | Unrealized loss on forward foreign currency exchange contracts | | | — | |
| | Variation margin on futures contracts | | | 3 | |
| | Variation margin on swap contracts | | | — | |
| | Forward sale contracts, at value (proceeds received $0, $17,636,133, $0, $0, $0, $0 and $0, respectively) | | | — | |
| | Payables: | | | | |
| | Management fees | | | 120,993 | |
| | Fund shares redeemed | | | 119,228 | |
| | Investments purchased | | | 33,889 | |
| | Distribution and Service fees and Transfer Agency fees | | | 29,699 | |
| | Income distribution | | | 9,304 | |
| | Collateral on certain derivative contracts(b)(c) | | | — | |
| | Investments purchased on an extended — settlement basis | | | — | |
| | Due to broker — upfront payment | | | — | |
| | Due to Broker | | | — | |
| | Accrued expenses | | | 63,327 | |
| | Total liabilities | | | 376,443 | |
| | | | | | |
| | Net Assets: | | | | |
| | Paid-in capital | | | 642,374,141 | |
| | Undistributed (distributions in excess of) net investment income | | | 741,394 | |
| | Accumulated net realized gain (loss) | | | (17,255,723 | ) |
| | Net unrealized gain (loss) | | | 1,400,104 | |
| | | NET ASSETS | | $ | 627,259,916 | |
| | | Net Assets: | | | | |
| | | Class A | | $ | 34,678,766 | |
| | | Preferred | | | — | |
| | | Class C | | | — | |
| | | Institutional | | | 588,539,590 | |
| | | Service | | | — | |
| | | Investor(d) | | | 3,874,301 | |
| | | Class R | | | — | |
| | | Administration | | | 156,968 | |
| | | Class R6 | | | 10,291 | |
| | | Total Net Assets | | $ | 627,259,916 | |
| | | Shares Outstanding $0.001 par value (unlimited number of shares authorized): | | | | |
| | | Class A | | | 3,673,239 | |
| | | Preferred | | | — | |
| | | Class C | | | — | |
| | | Institutional | | | 62,410,738 | |
| | | Service | | | — | |
| | | Investor(d) | | | 411,115 | |
| | | Class R | | | — | |
| | | Administration | | | 16,590 | |
| | | Class R6 | | | 1,091 | |
| | | Net asset value, offering and redemption price per share:(e) | | | | |
| | | Class A | | | $9.44 | |
| | | Preferred | | | — | |
| | | Class C | | | — | |
| | | Institutional | | | 9.43 | |
| | | Service | | | — | |
| | | Investor(d) | | | 9.42 | |
| | | Class R | | | — | |
| | | Administration | | | 9.46 | |
| | | Class R6 | | | 9.43 | |
| | (a) | | Segregated for initial margin and/or collateral on transactions as follows: |
| | | | | | | | | | | | |
| Fund | | Forwards | | | Futures | | | Swaps | |
Government Income | | $ | — | | | $ | — | | | $ | 1,012,968 | |
Inflation Protected Securities | | | — | | | | — | | | | 2,357,363 | |
Short Duration Government | | | — | | | | — | | | | 3,095,560 | |
Short Duration Income | | | 5,640,000 | | | | 159,165 | | | | 2,961,692 | |
| | (b) | | Includes amounts segregated for initial margin and/or collateral for swap transactions. |
| | (c) | | Segregated for initial margin on swap transactions of $363,594 for the Inflation Protected Securities Fund. |
| | (d) | | Effective August 15, 2017, Class IR Shares changed its name to Investor Shares. |
| | (e) | | Maximum public offering price per share for Class A Shares of the Enhanced Income, Government Income, High Quality Floating Rate, Inflation Protected Securities, Short Duration Government, Short Duration Income and Short-Term Conservative Income Funds is $9.58, $15.28, $8.86, $10.78, $10.08, $10.10 and $10.17, respectively. At redemption, Class C Shares may be subject to a contingent deferred sales charge, assessed on the amount equal to the lesser of the current net asset value or the original purchase price of the shares. |
| | |
| 96 | | The accompanying notes are an integral part of these financial statements. |
GOLDMAN SACHS SHORT DURATION AND GOVERNMENT FIXED INCOME FUNDS
| | | | | | | | | | | | | | | | | | | | | | | | | | | | | | | | | | |
| | | Government
Income Fund | | | | | High Quality
Floating Rate
Fund | | | | | Inflation Protected
Securities Fund | | | | | Short Duration
Government Fund | | | | | Short Duration
Income Fund | | | | | Short-Term
Conservative
Income Fund | |
| | | | | | | | | | | | | | | | | | | | | | | | | | | | | | | | | | |
| | $ | 379,374,201 | | | | | $ | 697,173,212 | | | | | $ | 342,331,466 | | | | | $ | 1,065,415,540 | | | | | $ | 634,089,927 | | | | | $ | 1,224,689,144 | |
| | | 20,262,525 | | | | | | — | | | | | | 5,846,883 | | | | | | 34,770,975 | | | | | | 6,812,687 | | | | | | 40,930,812 | |
| | | — | | | | | | 27,100,000 | | | | | | — | | | | | | — | | | | | | — | | | | | | 98,000,000 | |
| | | 32,163 | | | | | | — | | | | | | 16,275 | | | | | | — | | | | | | 59,971 | | | | | | — | |
| | | 5,411,481 | | | | | | 53,683 | | | | | | 5,088,259 | | | | | | 16,925,369 | | | | | | 9,915,112 | | | | | | 7,859,633 | |
| | | — | | | | | | — | | | | | | — | | | | | | — | | | | | | 60,003 | | | | | | — | |
| | | — | | | | | | — | | | | | | 610,690 | | | | | | — | | | | | | — | | | | | | — | |
| | | — | | | | | | — | | | | | | — | | | | | | — | | | | | | 1,551,123 | | | | | | — | |
| | | — | | | | | | — | | | | | | — | | | | | | 152,379 | | | | | | — | | | | | | — | |
| | | 33,677 | | | | | | — | | | | | | 20 | | | | | | 121,636 | | | | | | 59,027 | | | | | | — | |
| | | | | | | | | | | | | | | | | | | | | | | | | | | | | | | | | | |
| | | 1,502,349 | | | | | | 1,200,252 | | | | | | 530,447 | | | | | | 4,290,783 | | | | | | 3,467,662 | | | | | | 3,024,630 | |
| | | 8,801,886 | | | | | | 1,403,981 | | | | | | 6,925,670 | | | | | | 14,125,526 | | | | | | 25,692,312 | | | | | | — | |
| | | 297,337 | | | | | | 9,308,856 | | | | | | 428,224 | | | | | | 4,798,109 | | | | | | 1,712,093 | | | | | | 1,685,600 | |
| | | 20,775,000 | | | | | | — | | | | | | — | | | | | | — | | | | | | — | | | | | | — | |
| | | 36,396 | | | | | | 23,924 | | | | | | 15,532 | | | | | | 38,956 | | | | | | 31,971 | | | | | | 38,752 | |
| | | 43,353 | | | | | | — | | | | | | — | | | | | | — | | | | | | — | | | | | | — | |
| | | — | | | | | | — | | | | | | — | | | | | | — | | | | | | 23,388,808 | | | | | | — | |
| | | 1,012,968 | | | | | | — | | | | | | 2,357,363 | | | | | | 3,095,560 | | | | | | 8,760,858 | | | | | | — | |
| | | 451 | | | | | | 512 | | | | | | 329 | | | | | | 1,574 | | | | | | 681 | | | | | | 11,601 | |
| | | 437,583,787 | | | | | | 736,264,420 | | | | | | 364,151,158 | | | | | | 1,143,736,407 | | | | | | 715,602,235 | | | | | | 1,376,240,172 | |
| | | | | | | | | | | | | | | | | | | | | | | | | | | | | | | | | | |
| | | | | | | | | | | | | | | | | | | | | | | | | | | | | | | | | | |
| | | — | | | | | | — | | | | | | 372,492 | | | | | | — | | | | | | — | | | | | | — | |
| | | — | | | | | | — | | | | | | — | | | | | | — | | | | | | 2,000,366 | | | | | | — | |
| | | 82,313 | | | | | | 10,995 | | | | | | — | | | | | | — | | | | | | 312,917 | | | | | | — | |
| | | — | | | | | | — | | | | | | 132,729 | | | | | | — | | | | | | — | | | | | | — | |
| | | 17,591,485 | | | | | | — | | | | | | — | | | | | | — | | | | | | — | | | | | | — | |
| | | | | | | | | | | | | | | | | | | | | | | | | | | | | | | | | | |
| | | 153,902 | | | | | | 183,150 | | | | | | 74,630 | | | | | | 397,923 | | | | | | 214,509 | | | | | | 120,591 | |
| | | 442,293 | | | | | | 2,611,444 | | | | | | 173,233 | | | | | | 5,532,446 | | | | | | 628,615 | | | | | | 2,588,607 | |
| | | 8,813,666 | | | | | | — | | | | | | 6,939,972 | | | | | | 13,792,182 | | | | | | 27,601,731 | | | | | | 47,512,761 | |
| | | 61,913 | | | | | | 26,524 | | | | | | 53,992 | | | | | | 88,883 | | | | | | 26,457 | | | | | | 8,478 | |
| | | 103,387 | | | | | | 5,272 | | | | | | — | | | | | | 102,912 | | | | | | — | | | | | | 36,431 | |
| | | — | | | | | | — | | | | | | 363,594 | | | | | | — | | | | | | — | | | | | | — | |
| | | 52,661,680 | | | | | | 3,550,000 | | | | | | — | | | | | | 2,074,336 | | | | | | 5,586,992 | | | | | | 25,910,556 | |
| | | — | | | | | | — | | | | | | — | | | | | | — | | | | | | 23,426,960 | | | | | | — | |
| | | — | | | | | | — | | | | | | 142,895 | | | | | | — | | | | | | — | | | | | | — | |
| | | 134,800 | | | | | | 89,613 | | | | | | 22,515 | | | | | | 99,501 | | | | | | 120,971 | | | | | | 162,960 | |
| | | 80,045,439 | | | | | | 6,476,998 | | | | | | 8,276,052 | | | | | | 22,088,183 | | | | | | 59,919,518 | | | | | | 76,340,384 | |
| | | | | | | | | | | | | | | | | | | | | | | | | | | | | | | | | | |
| | | | | | | | | | | | | | | | | | | | | | | | | | | | | | | | | | |
| | | 363,368,002 | | | | | | 758,467,071 | | | | | | 372,152,996 | | | | | | 1,150,572,784 | | | | | | 662,412,038 | | | | | | 1,299,476,559 | |
| | | (183,897 | ) | | | | | 74,417 | | | | | | (97,786 | ) | | | | | 5,306,143 | | | | | | (1,415,467 | ) | | | | | (5,091 | ) |
| | | (9,054,235 | ) | | | | | (30,606,557 | ) | | | | | (17,053,762 | ) | | | | | (32,915,463 | ) | | | | | (6,275,788 | ) | | | | | 42,635 | |
| | | 3,408,478 | | | | | | 1,852,491 | | | | | | 873,658 | | | | | | (1,315,240 | ) | | | | | 961,934 | | | | | | 385,685 | |
| | | | $357,538,348 | | | | | $ | 729,787,422 | | | | | $ | 355,875,106 | | | | | $ | 1,121,648,224 | | | | | $ | 655,682,717 | | | | | $ | 1,299,899,788 | |
| | | | | | | | | | | | | | | | | | | | | | | | | | | | | | | | | | | |
| | | | $119,888,510 | | | | | $ | 10,933,749 | | | | | $ | 79,231,080 | | | | | $ | 121,259,667 | | | | | $ | 12,379,630 | | | | | $ | 25,239 | |
| | | | — | | | | | | — | | | | | | — | | | | | | — | | | | | | — | | | | | | 25,299 | |
| | | | 6,766,500 | | | | | | — | | | | | | 7,886,605 | | | | | | 24,092,884 | | | | | | 1,049,525 | | | | | | — | |
| | | | 140,692,203 | | | | | | 717,959,261 | | | | | | 225,693,587 | | | | | | 921,699,325 | | | | | | 640,385,454 | | | | | | 1,298,897,503 | |
| | | | 46,889,066 | | | | | | 98,588 | | | | | | — | | | | | | 24,508,013 | | | | | | — | | | | | | — | |
| | | | 4,155,053 | | | | | | 785,573 | | | | | | 15,538,136 | | | | | | 28,454,263 | | | | | | 1,817,766 | | | | | | — | |
| | | | 20,890,739 | | | | | | — | | | | | | 23,887,963 | | | | | | — | | | | | | 39,951 | | | | | | — | |
| | | | — | | | | | | — | | | | | | — | | | | | | — | | | | | | — | | | | | | 951,747 | |
| | | | 18,256,277 | | | | | | 10,251 | | | | | | 3,637,735 | | | | | | 1,634,072 | | | | | | 10,391 | | | | | | — | |
| | | | $357,538,348 | | | | | $ | 729,787,422 | | | | | $ | 355,875,106 | | | | | $ | 1,121,648,224 | | | | | $ | 655,682,717 | | | | | $ | 1,299,899,788 | |
| | | | | | | | | | | | | | | | | | | | | | | | | | | | | | | | | | | |
| | | | 8,152,559 | | | | | | 1,252,988 | | | | | | 7,634,268 | | | | | | 12,217,319 | | | | | | 1,244,602 | | | | | | 2,518 | |
| | | | — | | | | | | — | | | | | | — | | | | | | — | | | | | | — | | | | | | 2,524 | |
| | | | 460,143 | | | | | | — | | | | | | 770,524 | | | | | | 2,443,401 | | | | | | 105,531 | | | | | | — | |
| | | | 9,582,439 | | | | | | 82,313,652 | | | | | | 21,497,137 | | | | | | 93,140,161 | | | | | | 64,284,042 | | | | | | 129,604,885 | |
| | | | 3,197,117 | | | | | | 11,249 | | | | | | — | | | | | | 2,480,239 | | | | | | — | | | | | | — | |
| | | | 282,740 | | | | | | 90,313 | | | | | | 1,488,476 | | | | | | 2,865,140 | | | | | | 182,555 | | | | | | — | |
| | | | 1,422,314 | | | | | | — | | | | | | 2,309,065 | | | | | | — | | | | | | 4,012 | | | | | | — | |
| | | | — | | | | | | — | | | | | | — | | | | | | — | | | | | | — | | | | | | 94,928 | |
| | | | 1,243,748 | | | | | | 1,175 | | | | | | 346,646 | | | | | | 165,151 | | | | | | 1,043 | | | | | | — | |
| | | | | | | | | | | | | | | | | | | | | | | | | | | | | | | | | | | |
| | | | $14.71 | | | | | | $8.73 | | | | | | $10.38 | | | | | | $9.93 | | | | | | $9.95 | | | | | | $10.02 | |
| | | | — | | | | | | — | | | | | | — | | | | | | — | | | | | | — | | | | | | 10.02 | |
| | | | 14.71 | | | | | | — | | | | | | 10.24 | | | | | | 9.86 | | | | | | 9.95 | | | | | | — | |
| | | | 14.68 | | | | | | 8.72 | | | | | | 10.50 | | | | | | 9.90 | | | | | | 9.96 | | | | | | 10.02 | |
| | | | 14.67 | | | | | | 8.76 | | | | | | — | | | | | | 9.88 | | | | | | — | | | | | | — | |
| | | | 14.70 | | | | | | 8.70 | | | | | | 10.44 | | | | | | 9.93 | | | | | | 9.96 | | | | | | — | |
| | | | 14.69 | | | | | | — | | | | | | 10.35 | | | | | | — | | | | | | 9.96 | | | | | | — | |
| | | | — | | | | | | — | | | | | | — | | | | | | — | | | | | | — | | | | | | 10.03 | |
| | | | 14.68 | | | | | | 8.72 | | | | | | 10.49 | | | | | | 9.89 | | | | | | 9.96 | | | | | | — | |
| | |
| The accompanying notes are an integral part of these financial statements. | | 97 |
GOLDMAN SACHS SHORT DURATION AND GOVERNMENT FIXED INCOME FUNDS
Statements of Operations
For the Six Months Ended September 30, 2017 (Unaudited)
| | | | | | |
| | | | | Enhanced
Income Fund | |
| | Investment income: | | | | |
| | Interest (net of foreign withholding taxes of $0, $0, $0, $0, $0, $6,362 and $7,395) | | $ | 4,634,550 | |
| | Dividends — affiliated issuers | | | 110,017 | |
| | Total investment income | | | 4,744,567 | |
| | | | | | |
| | Expenses: | | | | |
| | Management fees | | | 666,787 | |
| | Transfer Agency fees(a) | | | 123,615 | |
| | Custody, accounting and administrative services | | | 66,904 | |
| | Professional fees | | | 56,203 | |
| | Distribution and Service fees(a) | | | 43,847 | |
| | Registration fees | | | 36,139 | |
| | Printing and mailing costs | | | 11,353 | |
| | Trustee fees | | | 9,369 | |
| | Service Share fees — Service Plan | | | — | |
| | Service Share fees — Shareholder Administration Plan | | | — | |
| | Administration Shares fees | | | 206 | |
| | Preferred Shares fees | | | — | |
| | Other | | | 11,032 | |
| | Total expenses | | | 1,025,455 | |
| | Less — expense reductions | | | (41,174 | ) |
| | Net expenses | | | 984,281 | |
| | NET INVESTMENT INCOME | | | 3,760,286 | |
| | | | | | |
| | Realized and unrealized gain (loss): | | | | |
| | Net realized gain (loss) from: | | | | |
| | Investments — unaffiliated issuers | | | 115,730 | |
| | Purchased options | | | — | |
| | Futures contracts | | | (577,775 | ) |
| | Swap contracts | | | — | |
| | Forward foreign currency exchange contracts | | | — | |
| | Foreign currency transactions | | | — | |
| | Net change in unrealized gain on: | | | | |
| | Investments — unaffiliated issuers | | | 7,196 | |
| | Purchased options | | | — | |
| | Futures contracts | | | 545,368 | |
| | Swap contracts | | | — | |
| | Forward foreign currency exchange contracts | | | — | |
| | Foreign currency translation | | | — | |
| | Net realized and unrealized gain (loss) | | | 90,519 | |
| | NET INCREASE IN NET ASSETS RESULTING FROM OPERATIONS | | $ | 3,850,805 | |
| | (a) | | Class specific Distribution and Service and Transfer Agency fees were as follows: |
| | | | | | | | | | | | | | | | | | | | | | | | | | | | | | | | | | | | | | | | | | | | | | | | |
| | | Distribution and Service
Fees | | | Transfer Agency Fees | |
Fund | | Class A | | | Class C | | | Class R | | | Class A | | | Preferred | | | Class C | | | Institutional | | | Administration | | | Service | | | Investor | | | Class R | | | Class R6 | |
Enhanced Income | | $ | 43,847 | | | $ | — | | | $ | — | | | $ | 22,800 | | | $ | — | | | $ | — | | | $ | 99,127 | | | $ | 33 | | | $ | — | | | $ | 1,653 | | | $ | — | | | $ | 2 | |
Government Income | | | 158,863 | | | | 37,393 | | | | 51,980 | | | | 82,609 | | | | — | | | | 4,861 | | | | 26,695 | | | | — | | | | 10,102 | | | | 2,811 | | | | 13,515 | | | | 2,167 | |
High Quality Floating Rate | | | 14,056 | | | | — | | | | — | | | | 7,309 | | | | — | | | | — | | | | 120,240 | | | | — | | | | 83 | | | | 530 | | | | — | | | | 2 | |
Inflation Protected Securities | | | 101,091 | | | | 36,983 | | | | 53,572 | | | | 52,567 | | | | — | | | | 4,808 | | | | 42,952 | | | | — | | | | — | | | | 9,165 | | | | 13,928 | | | | 245 | |
Short
Duration Government | | | 164,555 | | | | 129,660 | | | | — | | | | 85,569 | | | | — | | | | 16,856 | | | | 191,326 | | | | — | | | | 5,159 | | | | 16,834 | | | | — | | | | 310 | |
Short Duration Income | | | 16,911 | | | | 4,126 | | | | 95 | | | | 8,794 | | | | — | | | | 536 | | | | 121,866 | | | | — | | | | — | | | | 1,098 | | | | 25 | | | | 2 | |
Short-Term Conservative Income | | | 31 | | | | — | | | | — | | | | 16 | | | | 5 | | | | — | | | | 123,942 | | | | 161 | | | | — | | | | — | | | | — | | | | — | |
| | |
| 98 | | The accompanying notes are an integral part of these financial statements. |
GOLDMAN SACHS SHORT DURATION AND GOVERNMENT FIXED INCOME FUNDS
| | | | | | | | | | | | | | | | | | | | | | | | | | | | | | | | | | |
| | | Government
Income Fund | | | | | High Quality
Floating Rate
Fund | | | | | Inflation Protected
Securities Fund | | | | | Short Duration
Government Fund | | | | | Short Duration
Income Fund | | | | | Short-Term
Conservative
Income Fund | |
| | | | | | | | | | | | | | | | | | | | | | | | | | | | | | | | | | |
| | $ | 3,565,159 | | | | | $ | 5,426,312 | | | | | $ | 3,135,765 | | | | | $ | 12,151,212 | | | | | $ | 7,957,026 | | | | | $ | 4,706,936 | |
| | | 49,232 | | | | | | — | | | | | | 34,729 | | | | | | 118,035 | | | | | | 24,721 | | | | | | 70,512 | |
| | | 3,614,391 | | | | | | 5,426,312 | | | | | | 3,170,494 | | | | | | 12,269,247 | | | | | | 7,981,747 | | | | | | 4,777,448 | |
| | | | | | | | | | | | | | | | | | | | | | | | | | | | | | | | | | |
| | | | | | | | | | | | | | | | | | | | | | | | | | | | | | | | | | |
| | | 971,097 | | | | | | 1,111,794 | | | | | | 517,738 | | | | | | 2,762,452 | | | | | | 1,250,844 | | | | | | 775,704 | |
| | | 142,760 | | | | | | 128,164 | | | | | | 123,665 | | | | | | 316,054 | | | | | | 132,321 | | | | | | 124,124 | |
| | | 84,183 | | | | | | 73,303 | | | | | | 37,724 | | | | | | 116,068 | | | | | | 134,231 | | | | | | 42,294 | |
| | | 55,222 | | | | | | 57,384 | | | | | | 56,478 | | | | | | 56,404 | | | | | | 55,458 | | | | | | 122,715 | |
| | | 248,236 | | | | | | 14,056 | | | | | | 191,646 | | | | | | 294,215 | | | | | | 21,132 | | | | | | 31 | |
| | | 44,231 | | | | | | 39,928 | | | | | | 37,093 | | | | | | 45,371 | | | | | | 45,670 | | | | | | 44,866 | |
| | | 37,814 | | | | | | 10,114 | | | | | | 14,052 | | | | | | 35,140 | | | | | | 10,224 | | | | | | 14,137 | |
| | | 9,230 | | | | | | 9,312 | | | | | | 9,178 | | | | | | 10,209 | | | | | | 9,445 | | | | | | 9,087 | |
| | | 63,138 | | | | | | 513 | | | | | | — | | | | | | 32,247 | | | | | | — | | | | | | — | |
| | | 63,138 | | | | | | 513 | | | | | | — | | | | | | 32,247 | | | | | | — | | | | | | — | |
| | | — | | | | | | — | | | | | | — | | | | | | — | | | | | | — | | | | | | 1,005 | |
| | | — | | | | | | — | | | | | | — | | | | | | — | | | | | | — | | | | | | 13 | |
| | | 6,181 | | | | | | 10,046 | | | | | | 4,927 | | | | | | 21,778 | | | | | | 14,362 | | | | | | 5,270 | |
| | | 1,725,230 | | | | | | 1,455,127 | | | | | | 992,501 | | | | | | 3,722,185 | | | | | | 1,673,687 | | | | | | 1,139,246 | |
| | | (251,048 | ) | | | | | (317,715 | ) | | | | | (166,324 | ) | | | | | (522,231 | ) | | | | | (228,911 | ) | | | | | (643,012 | ) |
| | | 1,474,182 | | | | | | 1,137,412 | | | | | | 826,177 | | | | | | 3,199,954 | | | | | | 1,444,776 | | | | | | 496,234 | |
| | | 2,140,209 | | | | | | 4,288,900 | | | | | | 2,344,317 | | | | | | 9,069,293 | | | | | | 6,536,971 | | | | | | 4,281,214 | |
| | | | | | | | | | | | | | | | | | | | | | | | | | | | | | | | | | |
| | | | | | | | | | | | | | | | | | | | | | | | | | | | | | | | | | |
| | | | | | | | | | | | | | | | | | | | | | | | | | | | | | | | | | |
| | | 2,047,819 | | | | | | 235,701 | | | | | | (505,132 | ) | | | | | (2,638,065 | ) | | | | | 3,259,290 | | | | | | 27,826 | |
| | | — | | | | | | — | | | | | | — | | | | | | — | | | | | | 1,573 | | | | | | — | |
| | | (17,817 | ) | | | | | (406,296 | ) | | | | | (737,062 | ) | | | | | (2,071,793 | ) | | | | | 1,313,834 | | | | | | — | |
| | | 622,819 | | | | | | (1,745 | ) | | | | | (250,870 | ) | | | | | 2,093,323 | | | | | | (2,716,457 | ) | | | | | — | |
| | | — | | | | | | — | | | | | | — | | | | | | — | | | | | | (2,762,369 | ) | | | | | — | |
| | | — | | | | | | — | | | | | | — | | | | | | — | | | | | | 6,210 | | | | | | — | |
| | | | | | | | | | | | | | | | | | | | | | | | | | | | | | | | | | |
| | | 966,646 | | | | | | 562,905 | | | | | | 253,920 | | | | | | 3,807,673 | | | | | | (951,702 | ) | | | | | 271,592 | |
| | | 9,151 | | | | | | — | | | | | | 4,631 | | | | | | — | | | | | | (6,254 | ) | | | | | — | |
| | | (160,023 | ) | | | | | 169,772 | | | | | | (33,937 | ) | | | | | (2,553,865 | ) | | | | | (1,947,655 | ) | | | | | — | |
| | | (724,986 | ) | | | | | 16,732 | | | | | | (162,031 | ) | | | | | (2,519,822 | ) | | | | | 729,521 | | | | | | — | |
| | | — | | | | | | — | | | | | | — | | | | | | — | | | | | | 2,311,294 | | | | | | — | |
| | | — | | | | | | — | | | | | | (156 | ) | | | | | — | | | | | | (3,901 | ) | | | | | — | |
| | | 2,743,609 | | | | | | 577,069 | | | | | | (1,430,637 | ) | | | | | (3,882,549 | ) | | | | | (766,616 | ) | | | | | 299,418 | |
| | $ | 4,883,818 | | | | | $ | 4,865,969 | | | | | $ | 913,680 | | | | | $ | 5,186,744 | | | | | $ | 5,770,355 | | | | | $ | 4,580,632 | |
| | |
| The accompanying notes are an integral part of these financial statements. | | 99 |
GOLDMAN SACHS SHORT DURATION AND GOVERNMENT FIXED INCOME FUNDS
Statements of Changes in Net Assets
| | | | | | | | | | |
| | | | | Enhanced Income Fund | |
| | | | | For the
Six Months Ended
September 30, 2017
(Unaudited) | | | For the Fiscal
Year Ended
March 31, 2017 | |
| | From operations: | |
| | Net investment income | | $ | 3,760,286 | | | $ | 6,211,111 | |
| | Net realized gain (loss) | | | (462,045 | ) | | | 1,312,117 | |
| | Net change in unrealized gain (loss) | | | 552,564 | | | | 340,236 | |
| | Net increase (decrease) in net assets resulting from operations | | | 3,850,805 | | | | 7,863,464 | |
| | | | | | | | | | |
| | Distributions to shareholders: | | | | | | | | |
| | From net investment income | | | | | | | | |
| | Class A Shares | | | (190,841 | ) | | | (298,543 | ) |
| | Class C Shares | | | — | | | | — | |
| | Institutional Shares | | | (3,512,173 | ) | | | (5,793,103 | ) |
| | Service Shares | | | — | | | | — | |
| | Investor Shares(a) | | | (16,662 | ) | | | (11,590 | ) |
| | Class R Shares | | | — | | | | — | |
| | Administration Shares | | | (967 | ) | | | (1,470 | ) |
| | Class R6 Shares | | | (74 | ) | | | (122 | ) |
| | Total distributions to shareholders | | | (3,720,717 | ) | | | (6,104,828 | ) |
| | | | | | | | | | |
| | From share transactions: | | | | | | | | |
| | Proceeds from sales of shares | | | 201,824,257 | | | | 266,330,865 | |
| | Reinvestment of distributions | | | 3,659,368 | | | | 5,955,028 | |
| | Cost of shares redeemed | | | (52,013,126 | ) | | | (259,822,389 | ) |
| | Net increase (decrease) in net assets resulting from share transactions | | | 153,470,499 | | | | 12,463,504 | |
| | TOTAL INCREASE (DECREASE) | | | 153,600,587 | | | | 14,222,140 | |
| | | | | | | | | | |
| | Net assets: | | | | | | | | |
| | Beginning of period | | | 473,659,329 | | | | 459,437,189 | |
| | End of period | | $ | 627,259,916 | | | $ | 473,659,329 | |
| | Undistributed (distributions in excess of) net investment income | | $ | 741,394 | | | $ | 701,825 | |
| | (a) | | Effective August 15, 2017, Class IR Shares changed its name to Investor Shares. |
| | |
| 100 | | The accompanying notes are an integral part of these financial statements. |
GOLDMAN SACHS SHORT DURATION AND GOVERNMENT FIXED INCOME FUNDS
| | | | | | | | | | | | | | | | | | | | | | | | | | | | | | | | | | |
| | | Government Income Fund | | | | | High Quality Floating Rate Fund | | | | | Inflation Protected Securities Fund | |
| | | For the
Six Months Ended
September 30, 2017
(Unaudited) | | | | | For the Fiscal
Year Ended
March 31, 2017 | | | | | For the
Six Months Ended
September 30, 2017
(Unaudited) | | | | | For the Fiscal
Year Ended
March 31, 2017 | | | | | For the
Six Months Ended
September 30, 2017
(Unaudited) | | | | | For the Fiscal
Year Ended
March 31, 2017 | |
| | | | | | | | | | | | | | | | | | | | | | | | | | | | | | | | | | |
| | $ | 2,140,209 | | | | | $ | 4,532,104 | | | | | $ | 4,288,900 | | | | | $ | 4,056,178 | | | | | $ | 2,344,317 | | | | | $ | 4,597,051 | |
| | | 2,652,821 | | | | | | 888,822 | | | | | | (172,340 | ) | | | | | 1,070,072 | | | | | | (1,493,064 | ) | | | | | 3,387,672 | |
| | | 90,788 | | | | | | (8,693,491 | ) | | | | | 749,409 | | | | | | 2,830,388 | | | | | | 62,427 | | | | | | (4,583,645 | ) |
| | | 4,883,818 | | | | | | (3,272,565 | ) | | | | | 4,865,969 | | | | | | 7,956,638 | | | | | | 913,680 | | | | | | 3,401,078 | |
| | | | | | | | | | | | | | | | | | | | | | | | | | | | | | | | | | |
| | | | | | | | | | | | | | | | | | | | | | | | | | | | | | | | | | |
| | | | | | | | | | | | | | | | | | | | | | | | | | | | | | | | | | |
| | | (1,093,613 | ) | | | | | (2,624,173 | ) | | | | | (58,611 | ) | | | | | (77,161 | ) | | | | | (637,247 | ) | | | | | (798,356 | ) |
| | | (36,467 | ) | | | | | (102,778 | ) | | | | | — | | | | | | — | | | | | | (42,082 | ) | | | | | (46,497 | ) |
| | | (1,370,927 | ) | | | | | (2,891,507 | ) | | | | | (4,174,050 | ) | | | | | (3,905,711 | ) | | | | | (2,007,771 | ) | | | | | (2,487,297 | ) |
| | | (394,359 | ) | | | | | (890,874 | ) | | | | | (1,769 | ) | | | | | (2,647 | ) | | | | | — | | | | | | — | |
| | | (42,619 | ) | | | | | (96,204 | ) | | | | | (5,234 | ) | | | | | (5,876 | ) | | | | | (122,547 | ) | | | | | (114,254 | ) |
| | | (152,545 | ) | | | | | (316,631 | ) | | | | | — | | | | | | — | | | | | | (162,842 | ) | | | | | (141,367 | ) |
| | | — | | | | | | — | | | | | | — | | | | | | — | | | | | | — | | | | | | — | |
| | | (190,146 | ) | | | | | (181,351 | ) | | | | | (71 | ) | | | | | (105 | ) | | | | | (15,169 | ) | | | | | (4,547 | ) |
| | | (3,280,676 | ) | | | | | (7,103,518 | ) | | | | | (4,239,735 | ) | | | | | (3,991,500 | ) | | | | | (2,987,658 | ) | | | | | (3,592,318 | ) |
| | | | | | | | | | | | | | | | | | | | | | | | | | | | | | | | | | |
| | | | | | | | | | | | | | | | | | | | | | | | | | | | | | | | | | |
| | | 45,354,081 | | | | | | 125,365,326 | | | | | | 394,421,643 | | | | | | 193,936,987 | | | | | | 83,215,100 | | | | | | 220,328,520 | |
| | | 2,579,426 | | | | | | 5,619,596 | | | | | | 4,190,378 | | | | | | 3,937,516 | | | | | | 1,958,393 | | | | | | 2,384,801 | |
| | | (61,063,992 | ) | | | | | (151,957,914 | ) | | | | | (110,906,220 | ) | | | | | (133,227,466 | ) | | | | | (46,241,039 | ) | | | | | (82,161,368 | ) |
| | | (13,130,485 | ) | | | | | (20,972,992 | ) | | | | | 287,705,801 | | | | | | 64,647,037 | | | | | | 38,932,454 | | | | | | 140,551,953 | |
| | | (11,527,343 | ) | | | | | (31,349,075 | ) | | | | | 288,332,035 | | | | | | 68,612,175 | | | | | | 36,858,476 | | | | | | 140,360,713 | |
| | | | | | | | | | | | | | | | | | | | | | | | | | | | | | | | | | |
| | | | | | | | | | | | | | | | | | | | | | | | | | | | | | | | | | |
| | | 369,065,691 | | | | | | 400,414,766 | | | | | | 441,455,387 | | | | | | 372,843,212 | | | | | | 319,016,630 | | | | | | 178,655,917 | |
| | $ | 357,538,348 | | | | | $ | 369,065,691 | | | | | $ | 729,787,422 | | | | | $ | 441,455,387 | | | | | $ | 355,875,106 | | | | | $ | 319,016,630 | |
| | $ | (183,897 | ) | | | | $ | 956,570 | | | | | $ | 74,417 | | | | | $ | 25,252 | | | | | $ | (97,786 | ) | | | | $ | 545,555 | |
| | |
| The accompanying notes are an integral part of these financial statements. | | 101 |
GOLDMAN SACHS SHORT DURATION AND GOVERNMENT FIXED INCOME FUNDS
Statements of Changes in Net Assets
| | | | | | | | | | |
| | | | | Short Duration Government Fund | |
| | | | | For the
Six Months Ended
September 30, 2017
(Unaudited) | | | For the Fiscal
Year Ended
March 31, 2017 | |
| | From operations: | |
| | Net investment income | | $ | 9,069,293 | | | $ | 18,591,343 | |
| | Net realized gain (loss) | | | (2,616,535 | ) | | | 3,945,527 | |
| | Net change in unrealized gain (loss) | | | (1,266,014 | ) | | | (12,536,624 | ) |
| | Net increase (decrease) in net assets resulting from operations | | | 5,186,744 | | | | 10,000,246 | |
| | | | | | | | | | |
| | Distributions to shareholders: | | | | | | | | |
| | From net investment income | | | | | | | | |
| | Class A Shares | | | (1,184,298 | ) | | | (2,489,825 | ) |
| | Class C Shares | | | (181,751 | ) | | | (368,618 | ) |
| | Institutional Shares | | | (10,215,330 | ) | | | (20,132,363 | ) |
| | Service Shares | | | (211,287 | ) | | | (394,193 | ) |
| | Investor Shares(a) | | | (263,422 | ) | | | (315,882 | ) |
| | Class R Shares | | | — | | | | — | |
| | Administration Shares | | | — | | | | — | |
| | R6 Shares | | | (30,532 | ) | | | (1,437,852 | ) |
| | Preferred Shares | | | — | | | | — | |
| | From net realized gains | | | | | | | | |
| | Class A Shares | | | — | | | | — | |
| | Institutional Shares | | | — | | | | — | |
| | Administration Shares | | | — | | | | — | |
| | Preferred Shares | | | — | | | | — | |
| | Total distributions to shareholders | | | (12,086,620 | ) | | | (25,138,733 | ) |
| | | | | | | | | | |
| | From share transactions: | | | | | | | | |
| | Proceeds from sales of shares | | | 196,678,073 | | | | 460,646,254 | |
| | Reinvestment of distributions | | | 11,391,695 | | | | 23,844,333 | |
| | Cost of shares redeemed | | | (416,282,223 | ) | | | (552,135,202 | ) |
| | Net increase (decrease) in net assets resulting from share transactions | | | (208,212,455 | ) | | | (67,644,615 | ) |
| | TOTAL INCREASE (DECREASE) | | | (215,112,331 | ) | | | (82,783,102 | ) |
| | | | | | | | | | |
| | Net assets: | | | | | | | | |
| | Beginning of period | | | 1,336,760,555 | | | | 1,419,543,657 | |
| | End of period | | $ | 1,121,648,224 | | | $ | 1,336,760,555 | |
| | Undistributed (distributions in excess of) net investment income | | $ | 5,306,143 | | | $ | 8,323,470 | |
| | (a) | | Effective August 15, 2017, Class IR Shares changed its name to Investor Shares. |
| | (b) | | Commenced operations on October 31, 2016. |
| | |
| 102 | | The accompanying notes are an integral part of these financial statements. |
GOLDMAN SACHS SHORT DURATION AND GOVERNMENT FIXED INCOME FUNDS
| | | | | | | | | | | | | | | | | | | | | | |
| | | Short Duration Income Fund | | | | | Short-Term Conservative Income Fund | |
| | | For the
Six Months Ended
September 30, 2017
(Unaudited) | | | | | For the Fiscal
Year Ended
March 31, 2017 | | | | | For the
Six Months Ended
September 30, 2017
(Unaudited) | | | | | For the Fiscal
Year Ended
March 31, 2017 | |
| | | | | | | | | | | | | | | | | | | | | | |
| | $ | 6,536,971 | | | | | $ | 9,335,927 | | | | | $ | 4,281,214 | | | | | $ | 649,695 | |
| | | (897,919 | ) | | | | | (274,049 | ) | | | | | 27,826 | | | | | | 15,312 | |
| | | 131,303 | | | | | | 1,486,172 | | | | | | 271,592 | | | | | | 116,411 | |
| | | 5,770,355 | | | | | | 10,548,050 | | | | | | 4,580,632 | | | | | | 781,418 | |
| | | | | | | | | | | | | | | | | | | | | | |
| | | | | | | | | | | | | | | | | | | | | | |
| | | | | | | | | | | | | | | | | | | | | | |
| | | (130,171 | ) | | | | | (148,787 | ) | | | | | (126 | ) | | | | | (78 | )(b) |
| | | (6,438 | ) | | | | | (14,655 | ) | | | | | — | | | | | | — | |
| | | (6,952,997 | ) | | | | | (10,601,067 | ) | | | | | (4,281,782 | ) | | | | | (644,616 | ) |
| | | — | | | | | | — | | | | | | — | | | | | | — | |
| | | (18,349 | ) | | | | | (17,935 | ) | | | | | — | | | | | | — | |
| | | (324 | ) | | | | | (447 | ) | | | | | — | | | | | | — | |
| | | — | | | | | | — | | | | | | (4,496 | ) | | | | | (4,798 | ) |
| | | (118 | ) | | | | | (219 | ) | | | | | — | | | | | | — | |
| | | — | | | | | | — | | | | | | (159 | ) | | | | | (105 | )(b) |
| | | | | | | | | | | | | | | | | | | | | | |
| | | — | | | | | | — | | | | | | — | | | | | | (1 | )(b) |
| | | — | | | | | | — | | | | | | — | | | | | | (1,561 | ) |
| | | — | | | | | | — | | | | | | — | | | | | | (1 | ) |
| | | — | | | | | | — | | | | | | — | | | | | | (1 | )(b) |
| | | (7,108,397 | ) | | | | | (10,783,110 | ) | | | | | (4,286,563 | ) | | | | | (651,161 | ) |
| | | | | | | | | | | | | | | | | | | | | | |
| | | | | | | | | | | | | | | | | | | | | | |
| | | 178,607,266 | | | | | | 329,612,674 | | | | | | 1,162,126,748 | | | | | | 311,967,536 | |
| | | 7,107,885 | | | | | | 10,765,521 | | | | | | 4,107,319 | | | | | | 645,623 | |
| | | (101,224,793 | ) | | | | | (166,248,641 | ) | | | | | (132,500,662 | ) | | | | | (61,978,061 | ) |
| | | 84,490,358 | | | | | | 174,129,554 | | | | | | 1,033,733,405 | | | | | | 250,635,098 | |
| | | 83,152,316 | | | | | | 173,894,494 | | | | | | 1,034,027,474 | | | | | | 250,765,355 | |
| | | | | | | | | | | | | | | | | | | | | | |
| | | | | | | | | | | | | | | | | | | | | | |
| | | 572,530,401 | | | | | | 398,635,907 | | | | | | 265,872,314 | | | | | | 15,106,959 | |
| | $ | 655,682,717 | | | | | $ | 572,530,401 | | | | | $ | 1,299,899,788 | | | | | $ | 265,872,314 | |
| | $ | (1,415,467 | ) | | | | $ | (844,041 | ) | | | | $ | (5,091 | ) | | | | $ | 258 | |
| | |
| The accompanying notes are an integral part of these financial statements. | | 103 |
GOLDMAN SACHS ENHANCED INCOME FUND
Financial Highlights
Selected Data for a Share Outstanding Throughout Each Period
| | | | | | | | | | | | | | | | | | | | | | |
| | | | | | | | From
Investment Operations | | | | |
| | | Year - Share Class | | Net asset
value,
beginning
of period | | | Net
investment
income(a) | | | Net realized
and unrealized
gain (loss) | | | Total from
investment
operations | | | Distributions to shareholders from net investment income | |
| | FOR THE SIX MONTHS ENDED SEPTEMBER 30, (UNAUDITED) | |
| | 2017 - A | | $ | 9.44 | | | $ | 0.05 | | | $ | — | (d) | | $ | 0.05 | | | $ | (0.05 | ) |
| | 2017 - Institutional | | | 9.43 | | | | 0.07 | | | | — | (d) | | | 0.07 | | | | (0.07 | ) |
| | 2017 - Administration | | | 9.46 | | | | 0.06 | | | | — | (d) | | | 0.06 | | | | (0.06 | ) |
| | 2017 - Investor(g) | | | 9.42 | | | | 0.06 | | | | — | (d) | | | 0.06 | | | | (0.06 | ) |
| | 2017 - R6 | | | 9.43 | | | | 0.07 | | | | — | (d) | | | 0.07 | | | | (0.07 | ) |
| | | | | | | | | | | | | | | | | | | | | | |
| | FOR THE FISCAL YEARS ENDED MARCH 31, | |
| | 2017 - A | | | 9.41 | | | | 0.08 | | | | 0.03 | | | | 0.11 | | | | (0.08 | ) |
| | 2017 - Institutional | | | 9.40 | | | | 0.11 | | | | 0.03 | | | | 0.14 | | | | (0.11 | ) |
| | 2017 - Administration | | | 9.43 | | | | 0.09 | | | | 0.03 | | | | 0.12 | | | | (0.09 | ) |
| | 2017 - Investor(g) | | | 9.39 | | | | 0.11 | | | | 0.02 | | | | 0.13 | | | | (0.10 | ) |
| | 2017 - R6 | | | 9.40 | | | | 0.12 | | | | 0.02 | | | | 0.14 | | | | (0.11 | ) |
| | 2016 - A | | | 9.42 | | | | 0.04 | | | | (0.01 | ) | | | 0.03 | | | | (0.04 | ) |
| | 2016 - Institutional | | | 9.41 | | | | 0.07 | | | | (0.01 | ) | | | 0.06 | | | | (0.07 | ) |
| | 2016 - Administration | | | 9.44 | | | | 0.05 | | | | (0.01 | ) | | | 0.04 | | | | (0.05 | ) |
| | 2016 - Investor(g) | | | 9.41 | | | | 0.06 | | | | (0.02 | ) | | | 0.04 | | | | (0.06 | ) |
| | 2016 - R6 (commenced July 31, 2015) | | | 9.39 | | | | 0.05 | | | | — | (d) | | | 0.05 | | | | (0.04 | ) |
| | 2015 - A | | | 9.47 | | | | 0.01 | | | | (0.05 | ) | | | (0.04 | ) | | | (0.01 | ) |
| | 2015 - Institutional | | | 9.46 | | | | 0.04 | | | | (0.05 | ) | | | (0.01 | ) | | | (0.04 | ) |
| | 2015 - Administration | | | 9.49 | | | | 0.01 | | | | (0.05 | ) | | | (0.04 | ) | | | (0.01 | ) |
| | 2015 - Investor(g) | | | 9.45 | | | | 0.03 | | | | (0.04 | ) | | | (0.01 | ) | | | (0.03 | ) |
| | 2014 - A | | | 9.49 | | | | 0.03 | | | | (0.02 | ) | | | 0.01 | | | | (0.03 | ) |
| | 2014 - Institutional | | | 9.48 | | | | 0.06 | | | | (0.02 | ) | | | 0.04 | | | | (0.06 | ) |
| | 2014 - Administration | | | 9.51 | | | | 0.04 | | | | (0.02 | ) | | | 0.02 | | | | (0.04 | ) |
| | 2014 - Investor(g) | | | 9.48 | | | | 0.06 | | | | (0.04 | ) | | | 0.02 | | | | (0.05 | ) |
| | 2013 - A | | | 9.49 | | | | 0.07 | | | | — | (d) | | | 0.07 | | | | (0.07 | ) |
| | 2013 - Institutional | | | 9.47 | | | | 0.10 | | | | 0.01 | | | | 0.11 | | | | (0.10 | ) |
| | 2013 - Administration | | | 9.51 | | | | 0.08 | | | | (0.01 | ) | | | 0.07 | | | | (0.07 | ) |
| | 2013 - Investor(g) | | | 9.47 | | | | 0.09 | | | | 0.01 | | | | 0.10 | | | | (0.09 | ) |
| | (a) | | Calculated based on the average shares outstanding methodology. |
| | (b) | | Assumes investment at the NAV at the beginning of the period, reinvestment of all dividends and distributions, a complete redemption of the investment at the NAV at the end of the period and no sales or redemption charges. Total returns would be reduced if a sales or redemption charge was taken into account. Returns do not reflect the impact of taxes to shareholder relating to Fund distributions or the redemption of Fund shares. Total returns for periods less than one full year are not annualized. |
| | (c) | | The Fund’s portfolio turnover rate is calculated in accordance with regulatory requirements, without regard to transactions involving short term investments and certain derivatives. If such transactions were included, the Fund’s portfolio turnover rate may be higher. |
| | (d) | | Amount is less than $0.005 per share. |
| | (g) | | Effective August 15, 2017, Class IR Shares changed its name to Investor Shares. |
| | |
| 104 | | The accompanying notes are an integral part of these financial statements. |
GOLDMAN SACHS ENHANCED INCOME FUND
| | | | | | | | | | | | | | | | | | | | | | | | | | | | | | | | | | | | | | | | |
| | | | | | | | | | | | | | | | | | | | | | | | | | | | | | | | | | |
| | | Net asset
value, end
of period | | | | | Total
return(b) | | | | | Net assets,
end of
period
(in 000s) | | | | | Ratio of
net expenses
to average
net assets | | | | | Ratio of
total expenses
to average
net assets | | | | | Ratio of
net investment
income
to average
net assets | | | | | Portfolio
turnover
rate(c) | |
| | | | | | | | | | | | | | | | | | | | | | | | | | | | | | | | | | | | | | | | |
| | $ | 9.44 | | | | | | 0.55 | % | | | | $ | 34,679 | | | | | | 0.69 | %(e) | | | | | 0.70 | %(e) | | | | | 1.10 | %(e) | | | | | 32 | % |
| | | 9.43 | | | | | | 0.72 | | | | | | 588,540 | | | | | | 0.35 | (e) | | | | | 0.36 | (e) | | | | | 1.43 | (e) | | | | | 32 | |
| | | 9.46 | | | | | | 0.59 | | | | | | 157 | | | | | | 0.60 | (e) | | | | | 0.61 | (e) | | | | | 1.19 | (e) | | | | | 32 | |
| | | 9.42 | | | | | | 0.67 | | | | | | 3,874 | | | | | | 0.43 | (e) | | | | | 0.45 | (e) | | | | | 1.32 | (e) | | | | | 32 | |
| | | 9.43 | | | | | | 0.73 | | | | | | 10 | | | | | | 0.34 | (e) | | | | | 0.35 | (e) | | | | | 1.45 | (e) | | | | | 32 | |
| | | | | | | | | | | | | | | | | | | | | | | | | | | | | | | | | | | | | | | | |
| | | 9.44 | | | | | | 1.19 | | | | | | 35,560 | | | | | | 0.69 | | | | | | 0.71 | | | | | | 0.88 | | | | | | 189 | |
| | | 9.43 | | | | | | 1.53 | | | | | | 435,915 | | | | | | 0.35 | | | | | | 0.37 | | | | | | 1.22 | | | | | | 189 | |
| | | 9.46 | | | | | | 1.28 | | | | | | 162 | | | | | | 0.60 | | | | | | 0.62 | | | | | | 0.97 | | | | | | 189 | |
| | | 9.42 | | | | | | 1.44 | | | | | | 2,012 | | | | | | 0.44 | | | | | | 0.45 | | | | | | 1.14 | | | | | | 189 | |
| | | 9.43 | | | | | | 1.55 | | | | | | 10 | | | | | | 0.34 | | | | | | 0.36 | | | | | | 1.23 | | | | | | 189 | |
| | | 9.41 | | | | | | 0.29 | | | | | | 35,378 | | | | | | 0.69 | | | | | | 0.71 | | | | | | 0.42 | | | | | | 60 | |
| | | 9.40 | | | | | | 0.63 | | | | | | 423,278 | | | | | | 0.35 | | | | | | 0.36 | | | | | | 0.76 | | | | | | 60 | |
| | | 9.43 | | | | | | 0.38 | | | | | | 147 | | | | | | 0.60 | | | | | | 0.61 | | | | | | 0.50 | | | | | | 60 | |
| | | 9.39 | | | | | | 0.43 | | | | | | 623 | | | | | | 0.44 | | | | | | 0.46 | | | | | | 0.66 | | | | | | 60 | |
| | | 9.40 | | | | | | 0.58 | | | | | | 10 | | | | | | 0.35 | (e) | | | | | 0.37 | (e) | | | | | 0.74 | (e) | | | | | 60 | |
| | | 9.42 | | | | | | (0.47 | ) | | | | | 35,556 | | | | | | 0.69 | | | | | | 0.71 | | | | | | 0.06 | | | | | | 39 | |
| | | 9.41 | | | | | | (0.13 | ) | | | | | 457,826 | | | | | | 0.35 | | | | | | 0.37 | | | | | | 0.40 | | | | | | 39 | |
| | | 9.44 | | | | | | (0.38 | ) | | | | | 176 | | | | | | 0.60 | | | | | | 0.62 | | | | | | 0.15 | | | | | | 39 | |
| | | 9.41 | | | | | | (0.12 | ) | | | | | 437 | | | | | | 0.44 | | | | | | 0.46 | | | | | | 0.31 | | | | | | 39 | |
| | | 9.47 | | | | | | 0.10 | | | | | | 46,289 | | | | | | 0.69 | | | | | | 0.73 | | | | | | 0.33 | | | | | | 40 | |
| | | 9.46 | | | | | | 0.44 | | | | | | 512,656 | | | | | | 0.36 | | | | | | 0.38 | | | | | | 0.60 | | | | | | 40 | |
| | | 9.49 | | | | | | 0.19 | | | | | | 198 | | | | | | 0.61 | | | | | | 0.64 | | | | | | 0.42 | | | | | | 40 | |
| | | 9.45 | | | | | | 0.25 | | | | | | 583 | | | | | | 0.45 | | | | | | 0.48 | | | | | | 0.64 | | | | | | 40 | |
| | | 9.49 | | | | | | 0.69 | | | | | | 50,859 | | | | | | 0.68 | | | | | | 0.70 | | | | | | 0.70 | | | | | | 98 | |
| | | 9.48 | | | | | | 1.14 | | | | | | 295,940 | | | | | | 0.34 | | | | | | 0.36 | | | | | | 1.04 | | | | | | 98 | |
| | | 9.51 | | | | | | 0.79 | | | | | | 220 | | | | | | 0.59 | | | | | | 0.61 | | | | | | 0.83 | | | | | | 98 | |
| | | 9.48 | | | | | | 1.05 | | | | | | 1,345 | | | | | | 0.43 | | | | | | 0.45 | | | | | | 0.96 | | | | | | 98 | |
| | |
| The accompanying notes are an integral part of these financial statements. | | 105 |
GOLDMAN SACHS GOVERNMENT INCOME FUND
Financial Highlights
Selected Data for a Share Outstanding Throughout Each Period
| | | | | | | | | | | | | | | | | | | | | | | | | | | | | | |
| | | | | | From
Investment Operations | | | Distributions
to shareholders | |
| | | Year - Share Class | | Net asset
value,
beginning
of period | | | Net
investment
income
(loss)(a) | | | Net realized
and unrealized
gain (loss) | | | Total from
investment
operations | | | From net
investment
income | | | From net
realized
gains | | | Total
distributions | |
| | FOR THE SIX MONTHS ENDED SEPTEMBER 30, (UNAUDITED) | | | | | | | | | | | | | |
| | 2017 - A | | $ | 14.64 | | | $ | 0.08 | | | $ | 0.12 | | | $ | 0.20 | | | $ | (0.13 | ) | | $ | — | | | $ | (0.13 | ) |
| | 2017 - C | | | 14.64 | | | | 0.03 | | | | 0.11 | | | | 0.14 | | | | (0.07 | ) | | | — | | | | (0.07 | ) |
| | 2017 - Institutional | | | 14.62 | | | | 0.11 | | | | 0.10 | | | | 0.21 | | | | (0.15 | ) | | | — | | | | (0.15 | ) |
| | 2017 - Service | | | 14.60 | | | | 0.07 | | | | 0.11 | | | | 0.18 | | | | (0.11 | ) | | | — | | | | (0.11 | ) |
| | 2017 - Investor(e) | | | 14.63 | | | | 0.10 | | | | 0.12 | | | | 0.22 | | | | (0.15 | ) | | | — | | | | (0.15 | ) |
| | 2017 - R | | | 14.62 | | | | 0.06 | | | | 0.12 | | | | 0.18 | | | | (0.11 | ) | | | — | | | | (0.11 | ) |
| | 2017 - R6 | | | 14.61 | | | | 0.11 | | | | 0.11 | | | | 0.22 | | | | (0.15 | ) | | | — | | | | (0.15 | ) |
| | | | | | | | | | | | | | | | | | | | | | | | | | | | | | |
| | FOR THE FISCAL YEARS ENDED MARCH 31, | | | | | | | | | |
| | 2017 - A | | | 15.03 | | | | 0.16 | | | | (0.29 | ) | | | (0.13 | ) | | | (0.26 | ) | | | — | | | | (0.26 | ) |
| | 2017 - C | | | 15.03 | | | | 0.05 | | | | (0.29 | ) | | | (0.24 | ) | | | (0.15 | ) | | | — | | | | (0.15 | ) |
| | 2017 - Institutional | | | 15.01 | | | | 0.21 | | | | (0.29 | ) | | | (0.08 | ) | | | (0.31 | ) | | | — | | | | (0.31 | ) |
| | 2017 - Service | | | 14.99 | | | | 0.14 | | | | (0.30 | ) | | | (0.16 | ) | | | (0.23 | ) | | | — | | | | (0.23 | ) |
| | 2017 - Investor(e) | | | 15.02 | | | | 0.20 | | | | (0.29 | ) | | | (0.09 | ) | | | (0.30 | ) | | | — | | | | (0.30 | ) |
| | 2017 - R | | | 15.02 | | | | 0.12 | | | | (0.30 | ) | | | (0.18 | ) | | | (0.22 | ) | | | — | | | | (0.22 | ) |
| | 2017 - R6 | | | 15.01 | | | | 0.20 | | | | (0.29 | ) | | | (0.09 | ) | | | (0.31 | ) | | | — | | | | (0.31 | ) |
| | 2016 - A | | | 15.02 | | | | 0.19 | | | | 0.06 | | | | 0.25 | | | | (0.24 | ) | | | — | | | | (0.24 | ) |
| | 2016 - C | | | 15.02 | | | | 0.08 | | | | 0.06 | | | | 0.14 | | | | (0.13 | ) | | | — | | | | (0.13 | ) |
| | 2016 - Institutional | | | 15.00 | | | | 0.24 | | | | 0.06 | | | | 0.30 | | | | (0.29 | ) | | | — | | | | (0.29 | ) |
| | 2016 - Service | | | 14.98 | | | | 0.17 | | | | 0.05 | | | | 0.22 | | | | (0.21 | ) | | | — | | | | (0.21 | ) |
| | 2016 - Investor(e) | | | 15.01 | | | | 0.23 | | | | 0.05 | | | | 0.28 | | | | (0.27 | ) | | | — | | | | (0.27 | ) |
| | 2016 - R | | | 15.00 | | | | 0.16 | | | | 0.06 | | | | 0.22 | | | | (0.20 | ) | | | — | | | | (0.20 | ) |
| | 2016 - R6 (Commenced July 31, 2015) | | | 14.83 | | | | 0.16 | | | | 0.21 | | | | 0.37 | | | | (0.19 | ) | | | — | | | | (0.19 | ) |
| | 2015 - A | | | 14.67 | | | | 0.17 | | | | 0.39 | | | | 0.56 | | | | (0.21 | ) | | | — | | | | (0.21 | ) |
| | 2015 - C | | | 14.67 | | | | 0.06 | | | | 0.38 | | | | 0.44 | | | | (0.09 | ) | | | — | | | | (0.09 | ) |
| | 2015 - Institutional | | | 14.64 | | | | 0.22 | | | | 0.40 | | | | 0.62 | | | | (0.26 | ) | | | — | | | | (0.26 | ) |
| | 2015 - Service | | | 14.63 | | | | 0.15 | | | | 0.38 | | | | 0.53 | | | | (0.18 | ) | | | — | | | | (0.18 | ) |
| | 2015 - Investor(e) | | | 14.66 | | | | 0.21 | | | | 0.38 | | | | 0.59 | | | | (0.24 | ) | | | — | | | | (0.24 | ) |
| | 2015 - R | | | 14.65 | | | | 0.13 | | | | 0.39 | | | | 0.52 | | | | (0.17 | ) | | | — | | | | (0.17 | ) |
| | 2014 - A | | | 15.00 | | | | 0.12 | | | | (0.25 | ) | | | (0.13 | ) | | | (0.16 | ) | | | (0.04 | ) | | | (0.20 | ) |
| | 2014 - C | | | 15.00 | | | | 0.02 | | | | (0.25 | ) | | | (0.23 | ) | | | (0.06 | ) | | | (0.04 | ) | | | (0.10 | ) |
| | 2014 - Institutional | | | 14.97 | | | | 0.17 | | | | (0.25 | ) | | | (0.08 | ) | | | (0.21 | ) | | | (0.04 | ) | | | (0.25 | ) |
| | 2014 - Service | | | 14.96 | | | | 0.10 | | | | (0.25 | ) | | | (0.15 | ) | | | (0.14 | ) | | | (0.04 | ) | | | (0.18 | ) |
| | 2014 - Investor(e) | | | 14.99 | | | | 0.18 | | | | (0.27 | ) | | | (0.09 | ) | | | (0.20 | ) | | | (0.04 | ) | | | (0.24 | ) |
| | 2014 - R | | | 14.98 | | | | 0.09 | | | | (0.25 | ) | | | (0.16 | ) | | | (0.13 | ) | | | (0.04 | ) | | | (0.17 | ) |
| | 2013 - A | | | 15.37 | | | | 0.11 | | | | 0.24 | | | | 0.35 | | | | (0.17 | ) | | | (0.55 | ) | | | (0.72 | ) |
| | 2013 - C | | | 15.37 | | | | (0.01 | ) | | | 0.24 | | | | 0.23 | | | | (0.05 | ) | | | (0.55 | ) | | | (0.60 | ) |
| | 2013 - Institutional | | | 15.34 | | | | 0.15 | | | | 0.25 | | | | 0.40 | | | | (0.22 | ) | | | (0.55 | ) | | | (0.77 | ) |
| | 2013 - Service | | | 15.33 | | | | 0.08 | | | | 0.24 | | | | 0.32 | | | | (0.14 | ) | | | (0.55 | ) | | | (0.69 | ) |
| | 2013 - Investor(e) | | | 15.36 | | | | 0.14 | | | | 0.25 | | | | 0.39 | | | | (0.21 | ) | | | (0.55 | ) | | | (0.76 | ) |
| | 2013 - R | | | 15.35 | | | | 0.06 | | | | 0.25 | | | | 0.31 | | | | (0.13 | ) | | | (0.55 | ) | | | (0.68 | ) |
| | (a) | | Calculated based on the average shares outstanding methodology. |
| | (b) | | Assumes investment at the NAV at the beginning of the period, reinvestment of all dividends and distributions, a complete redemption of the investment at the NAV at the end of the period and no sales or redemption charges. Total returns would be reduced if a sales or redemption charge was taken into account. Returns do not reflect the impact of taxes to shareholder relating to Fund distributions or the redemption of Fund shares. Total returns for periods less than one full year are not annualized. |
| | (c) | | The Fund’s portfolio turnover rate is calculated in accordance with regulatory requirements, without regard to transactions involving short term investments and certain derivatives. If such transactions were included, the Fund’s portfolio turnover rate may be higher. |
| | (e) | | Effective August 15, 2017, Class IR Shares changed its name to Investor Shares. |
| | |
| 106 | | The accompanying notes are an integral part of these financial statements. |
GOLDMAN SACHS GOVERNMENT INCOME FUND
| | | | | | | | | | | | | | | | | | | | | | | | | | | | | | | | | | | | | | | | |
| | | | | | | | | | | | | | | | | | | | | | | | | | | | | | | | | | |
| | | Net asset
value, end
of period | | | | | Total
return(b) | | | | | Net assets,
end of
period
(in 000s) | | | | | Ratio of
net expenses
to average
net assets | | | | | Ratio of
total expenses
to average
net assets | | | | | Ratio of
net investment
income (loss)
to average
net assets | | | | | Portfolio
turnover
rate(c) | |
| | | | | | | | | | | | | | | | | | | | | | | | | | | | | | | | | | | | | | | | |
| | $ | 14.71 | | | | | | 1.35 | % | | | | $ | 119,889 | | | | | | 0.91 | %(d) | | | | | 1.05 | %(d) | | | | | 1.09 | %(d) | | | | | 213 | % |
| | | 14.71 | | | | | | 0.97 | | | | | | 6,767 | | | | | | 1.66 | (d) | | | | | 1.80 | (d) | | | | | 0.34 | (d) | | | | | 213 | |
| | | 14.68 | | | | | | 1.45 | | | | | | 140,692 | | | | | | 0.57 | (d) | | | | | 0.71 | (d) | | | | | 1.43 | (d) | | | | | 213 | |
| | | 14.67 | | | | | | 1.27 | | | | | | 46,889 | | | | | | 1.07 | (d) | | | | | 1.21 | (d) | | | | | 0.93 | (d) | | | | | 213 | |
| | | 14.70 | | | | | | 1.47 | | | | | | 4,155 | | | | | | 0.66 | (d) | | | | | 0.80 | (d) | | | | | 1.34 | (d) | | | | | 213 | |
| | | 14.69 | | | | | | 1.22 | | | | | | 20,891 | | | | | | 1.16 | (d) | | | | | 1.30 | (d) | | | | | 0.84 | (d) | | | | | 213 | |
| | | 14.68 | | | | | | 1.53 | | | | | | 18,256 | | | | | | 0.55 | (d) | | | | | 0.69 | (d) | | | | | 1.44 | (d) | | | | | 213 | |
| | | | | | | | | | | | | | | | | | | | | | | | | | | | | | | | | | | | | | | | |
| | | | | | | | | | | | | | | | | | | | | | | | | | | | | | | | | | | | | | | | |
| | | 14.64 | | | | | | (0.89 | ) | | | | | 134,630 | | | | | | 0.91 | | | | | | 1.06 | | | | | | 1.08 | | | | | | 441 | |
| | | 14.64 | | | | | | (1.63 | ) | | | | | 8,066 | | | | | | 1.66 | | | | | | 1.81 | | | | | | 0.33 | | | | | | 441 | |
| | | 14.62 | | | | | | (0.56 | ) | | | | | 129,442 | | | | | | 0.57 | | | | | | 0.72 | | | | | | 1.42 | | | | | | 441 | |
| | | 14.60 | | | | | | (1.06 | ) | | | | | 53,711 | | | | | | 1.07 | | | | | | 1.22 | | | | | | 0.92 | | | | | | 441 | |
| | | 14.63 | | | | | | (0.64 | ) | | | | | 4,558 | | | | | | 0.66 | | | | | | 0.81 | | | | | | 1.33 | | | | | | 441 | |
| | | 14.62 | | | | | | (1.14 | ) | | | | | 21,045 | | | | | | 1.16 | | | | | | 1.31 | | | | | | 0.83 | | | | | | 441 | |
| | | 14.61 | | | | | | (0.60 | ) | | | | | 17,614 | | | | | | 0.55 | | | | | | 0.69 | | | | | | 1.35 | | | | | | 441 | |
| | | 15.03 | | | | | | 1.66 | | | | | | 159,880 | | | | | | 0.90 | | | | | | 1.05 | | | | | | 1.31 | | | | | | 590 | |
| | | 15.03 | | | | | | 0.91 | | | | | | 11,743 | | | | | | 1.66 | | | | | | 1.80 | | | | | | 0.56 | | | | | | 590 | |
| | | 15.01 | | | | | | 2.01 | | | | | | 147,394 | | | | | | 0.57 | | | | | | 0.71 | | | | | | 1.64 | | | | | | 590 | |
| | | 14.99 | | | | | | 1.50 | | | | | | 54,940 | | | | | | 1.06 | | | | | | 1.21 | | | | | | 1.15 | | | | | | 590 | |
| | | 15.02 | | | | | | 1.92 | | | | | | 4,676 | | | | | | 0.66 | | | | | | 0.80 | | | | | | 1.55 | | | | | | 590 | |
| | | 15.02 | | | | | | 1.41 | | | | | | 21,688 | | | | | | 1.15 | | | | | | 1.30 | | | | | | 1.06 | | | | | | 590 | |
| | | 15.01 | | | | | | 2.52 | | | | | | 93 | | | | | | 0.55 | (d) | | | | | 0.70 | (d) | | | | | 1.59 | (d) | | | | | 590 | |
| | | 15.02 | | | | | | 3.80 | | | | | | 182,381 | | | | | | 0.91 | | | | | | 1.05 | | | | | | 1.16 | | | | | | 471 | |
| | | 15.02 | | | | | | 3.03 | | | | | | 12,918 | | | | | | 1.66 | | | | | | 1.80 | | | | | | 0.41 | | | | | | 471 | |
| | | 15.00 | | | | | | 4.23 | | | | | | 186,519 | | | | | | 0.58 | | | | | | 0.71 | | | | | | 1.50 | | | | | | 471 | |
| | | 14.98 | | | | | | 3.64 | | | | | | 51,176 | | | | | | 1.07 | | | | | | 1.21 | | | | | | 1.00 | | | | | | 471 | |
| | | 15.01 | | | | | | 4.06 | | | | | | 3,875 | | | | | | 0.66 | | | | | | 0.80 | | | | | | 1.41 | | | | | | 471 | |
| | | 15.00 | | | | | | 3.55 | | | | | | 23,184 | | | | | | 1.16 | | | | | | 1.30 | | | | | | 0.90 | | | | | | 471 | |
| | | 14.67 | | | | | | (0.83 | ) | | | | | 194,179 | | | | | | 0.92 | | | | | | 1.02 | | | | | | 0.83 | | | | | | 655 | |
| | | 14.67 | | | | | | (1.53 | ) | | | | | 15,202 | | | | | | 1.62 | | | | | | 1.78 | | | | | | 0.12 | | | | | | 655 | |
| | | 14.64 | | | | | | (0.50 | ) | | | | | 197,289 | | | | | | 0.58 | | | | | | 0.69 | | | | | | 1.19 | | | | | | 655 | |
| | | 14.63 | | | | | | (1.00 | ) | | | | | 53,172 | | | | | | 1.08 | | | | | | 1.18 | | | | | | 0.66 | | | | | | 655 | |
| | | 14.66 | | | | | | (0.58 | ) | | | | | 4,157 | | | | | | 0.67 | | | | | | 0.78 | | | | | | 1.25 | | | | | | 655 | |
| | | 14.65 | | | | | | (1.08 | ) | | | | | 20,743 | | | | | | 1.17 | | | | | | 1.28 | | | | | | 0.62 | | | | | | 655 | |
| | | 15.00 | | | | | | 2.26 | | | | | | 285,955 | | | | | | 0.91 | | | | | | 1.00 | | | | | | 0.69 | | | | | | 943 | |
| | | 15.00 | | | | | | 1.50 | | | | | | 25,655 | | | | | | 1.66 | | | | | | 1.75 | | | | | | (0.06 | ) | | | | | 943 | |
| | | 14.97 | | | | | | 2.61 | | | | | | 346,782 | | | | | | 0.57 | | | | | | 0.66 | | | | | | 0.97 | | | | | | 943 | |
| | | 14.96 | | | | | | 2.07 | | | | | | 79,620 | | | | | | 1.07 | | | | | | 1.16 | | | | | | 0.51 | | | | | | 943 | |
| | | 14.99 | | | | | | 2.51 | | | | | | 1,509 | | | | | | 0.67 | | | | | | 0.75 | | | | | | 0.93 | | | | | | 943 | |
| | | 14.98 | | | | | | 2.00 | | | | | | 21,907 | | | | | | 1.16 | | | | | | 1.25 | | | | | | 0.41 | | | | | | 943 | |
| | |
| The accompanying notes are an integral part of these financial statements. | | 107 |
GOLDMAN SACHS HIGH QUALITY FLOATING RATE FUND
Financial Highlights
Selected Data for a Share Outstanding Throughout Each Period
| | | | | | | | | | | | | | | | | | | | | | |
| | | | | | | | From
Investment Operations | | | | |
| | | Year - Share Class | | Net asset
value,
beginning
of period | | | Net
investment
income(a) | | | Net realized
and unrealized
gain (loss) | | | Total from
investment
operations | | | Distributions to shareholders from net
investment
income | |
| | FOR THE SIX MONTHS ENDED SEPTEMBER 30, (UNAUDITED) | |
| | 2017 - A | | $ | 8.72 | | | $ | 0.05 | | | $ | 0.01 | | | $ | 0.06 | | | $ | (0.05 | ) |
| | 2017 - Institutional | | | 8.71 | | | | 0.06 | | | | 0.01 | | | | 0.07 | | | | (0.06 | ) |
| | 2017 - Service | | | 8.76 | | | | 0.04 | | | | — | (e) | | | 0.04 | | | | (0.04 | ) |
| | 2017 - Investor(f) | | | 8.69 | | | | 0.06 | | | | 0.01 | | | | 0.07 | | | | (0.06 | ) |
| | 2017 - R6 | | | 8.72 | | | | 0.06 | | | | — | (e) | | | 0.06 | | | | (0.06 | ) |
| | | | | | | | | | | | | | | | | | | | | | |
| | FOR THE FISCAL YEARS ENDED MARCH 31, | |
| | 2017 - A | | | 8.63 | | | | 0.07 | | | | 0.08 | | | | 0.15 | | | | (0.06 | ) |
| | 2017 - Institutional | | | 8.63 | | | | 0.09 | | | | 0.08 | | | | 0.17 | | | | (0.09 | ) |
| | 2017 - Service | | | 8.67 | | | | 0.05 | | | | 0.09 | | | | 0.14 | | | | (0.05 | ) |
| | 2017 - Investor(f) | | | 8.61 | | | | 0.08 | | | | 0.08 | | | | 0.16 | | | | (0.08 | ) |
| | 2017 - R6 | | | 8.63 | | | | 0.09 | | | | 0.09 | | | | 0.18 | | | | (0.09 | ) |
| | 2016 - A | | | 8.72 | | | | 0.02 | | | | (0.09 | ) | | | (0.07 | ) | | | (0.02 | ) |
| | 2016 - Institutional | | | 8.72 | | | | 0.05 | | | | (0.09 | ) | | | (0.04 | ) | | | (0.05 | ) |
| | 2016 - Service | | | 8.76 | | | | 0.01 | | | | (0.09 | ) | | | (0.08 | ) | | | (0.01 | ) |
| | 2016 - Investor(f) | | | 8.70 | | | | 0.04 | | | | (0.09 | ) | | | (0.05 | ) | | | (0.04 | ) |
| | 2016 - R6 (commenced July 31, 2015) | | | 8.69 | | | | 0.03 | | | | (0.06 | ) | | | (0.03 | ) | | | (0.03 | ) |
| | 2015 - A | | | 8.76 | | | | 0.01 | | | | (0.04 | ) | | | (0.03 | ) | | | (0.01 | ) |
| | 2015 - Institutional | | | 8.77 | | | | 0.03 | | | | (0.05 | ) | | | (0.02 | ) | | | (0.03 | ) |
| | 2015 - Service | | | 8.81 | | | | — | (e) | | | (0.05 | ) | | | (0.05 | ) | | | — | (e) |
| | 2015 - Investor(f) | | | 8.75 | | | | 0.03 | | | | (0.05 | ) | | | (0.02 | ) | | | (0.03 | ) |
| | 2014 - A | | | 8.78 | | | | 0.02 | | | | (0.02 | ) | | | — | | | | (0.02 | ) |
| | 2014 - Institutional | | | 8.78 | | | | 0.04 | | | | — | (e) | | | 0.04 | | | | (0.05 | ) |
| | 2014 - Service | | | 8.83 | | | | — | (e) | | | (0.01 | ) | | | (0.01 | ) | | | (0.01 | ) |
| | 2014 - Investor(f) | | | 8.77 | | | | 0.04 | | | | (0.02 | ) | | | 0.02 | | | | (0.04 | ) |
| | 2013 - A | | | 8.77 | | | | 0.04 | | | | — | (e) | | | 0.04 | | | | (0.03 | ) |
| | 2013 - Institutional | | | 8.77 | | | | 0.07 | | | | — | (e) | | | 0.07 | | | | (0.06 | ) |
| | 2013 - Service | | | 8.81 | | | | 0.03 | | | | 0.01 | | | | 0.04 | | | | (0.02 | ) |
| | 2013 - Investor(f) | | | 8.76 | | | | 0.05 | | | | 0.01 | | | | 0.06 | | | | (0.05 | ) |
| | (a) | | Calculated based on the average shares outstanding methodology. |
| | (b) | | Assumes investment at the NAV at the beginning of the period, reinvestment of all dividends and distributions, a complete redemption of the investment at the NAV at the end of the period and no sales or redemption charges. Total returns would be reduced if a sales or redemption charge was taken into account. Returns do not reflect the impact of taxes to shareholder relating to Fund distributions or the redemption of Fund shares. Total returns for periods less than one full year are not annualized. |
| | (c) | | The Fund’s portfolio turnover rate is calculated in accordance with regulatory requirements, without regard to transactions involving short term investments and certain derivatives. If such transactions were included, the Fund’s portfolio turnover rate may be higher. |
| | (e) | | Amount is less than $0.005 per share. |
| | (f) | | Effective August 15, 2017, Class IR Shares changed its name to Investor Shares. |
| | |
| 108 | | The accompanying notes are an integral part of these financial statements. |
GOLDMAN SACHS HIGH QUALITY FLOATING RATE FUND
| | | | | | | | | | | | | | | | | | | | | | | | | | | | | | | | | | | | | | | | |
| | | | | | | | | | | | | | | | | | | | | | | | | | | | | | | | | | |
| | | Net asset
value, end
of period | | | | | Total
return(b) | | | | | Net assets,
end of
period
(in 000s) | | | | | Ratio of
net expenses
to average
net assets | | | | | Ratio of
total expenses
to average
net assets | | | | | Ratio of
net investment
income
to average
net assets | | | | | Portfolio
turnover
rate(c) | |
| | | | | | | | | | | | | | | | | | | | | | | | | | | | | | | | | | | | | | | | |
| | $ | 8.73 | | | | | | 0.64 | % | | | | $ | 10,934 | | | | | | 0.71 | %(d) | | | | | 0.82 | %(d) | | | | | 1.06 | %(d) | | | | | 27 | % |
| | | 8.72 | | | | | | 0.81 | | | | | | 717,959 | | | | | | 0.36 | (d) | | | | | 0.47 | (d) | | | | | 1.40 | (d) | | | | | 27 | |
| | | 8.76 | | | | | | 0.44 | | | | | | 99 | | | | | | 0.87 | (d) | | | | | 0.99 | (d) | | | | | 0.90 | (d) | | | | | 27 | |
| | | 8.70 | | | | | | 0.77 | | | | | | 786 | | | | | | 0.45 | (d) | | | | | 0.57 | (d) | | | | | 1.31 | (d) | | | | | 27 | |
| | | 8.72 | | | | | | 0.70 | | | | | | 10 | | | | | | 0.36 | (d) | | | | | 0.45 | (d) | | | | | 1.40 | (d) | | | | | 27 | |
| | | | | | | | | | | | | | | | | | | | | | | | | | | | | | | | | | | | | | | | |
| | | 8.72 | | | | | | 1.79 | | | | | | 11,303 | | | | | | 0.65 | | | | | | 0.89 | | | | | | 0.76 | | | | | | 59 | |
| | | 8.71 | | | | | | 1.97 | | | | | | 429,019 | | | | | | 0.36 | | | | | | 0.55 | | | | | | 1.05 | | | | | | 59 | |
| | | 8.76 | | | | | | 1.58 | | | | | | 491 | | | | | | 0.86 | | | | | | 1.05 | | | | | | 0.55 | | | | | | 59 | |
| | | 8.69 | | | | | | 1.87 | | | | | | 632 | | | | | | 0.44 | | | | | | 0.62 | | | | | | 0.91 | | | | | | 59 | |
| | | 8.72 | | | | | | 2.11 | | | | | | 10 | | | | | | 0.36 | | | | | | 0.53 | | | | | | 1.05 | | | | | | 59 | |
| | | 8.63 | | | | | | (0.80 | ) | | | | | 10,680 | | | | | | 0.70 | | | | | | 0.88 | | | | | | 0.22 | | | | | | 71 | |
| | | 8.63 | | | | | | (0.47 | ) | | | | | 360,939 | | | | | | 0.36 | | | | | | 0.54 | | | | | | 0.56 | | | | | | 71 | |
| | | 8.67 | | | | | | (0.93 | ) | | | | | 551 | | | | | | 0.84 | | | | | | 1.04 | | | | | | 0.11 | | | | | | 71 | |
| | | 8.61 | | | | | | (0.56 | ) | | | | | 663 | | | | | | 0.45 | | | | | | 0.63 | | | | | | 0.47 | | | | | | 71 | |
| | | 8.63 | | | | | | (0.32 | ) | | | | | 10 | | | | | | 0.36 | (d) | | | | | 0.53 | (d) | | | | | 0.55 | (d) | | | | | 71 | |
| | | 8.72 | | | | | | (0.36 | ) | | | | | 18,565 | | | | | | 0.66 | | | | | | 0.90 | | | | | | 0.12 | | | | | | 64 | |
| | | 8.72 | | | | | | (0.19 | ) | | | | | 503,652 | | | | | | 0.36 | | | | | | 0.56 | | | | | | 0.38 | | | | | | 64 | |
| | | 8.76 | | | | | | (0.53 | ) | | | | | 145 | | | | | | 0.73 | | | | | | 1.07 | | | | | | 0.05 | | | | | | 64 | |
| | | 8.70 | | | | | | (0.28 | ) | | | | | 996 | | | | | | 0.45 | | | | | | 0.65 | | | | | | 0.32 | | | | | | 64 | |
| | | 8.76 | | | | | | (0.01 | ) | | | | | 43,550 | | | | | | 0.72 | | | | | | 0.95 | | | | | | 0.20 | | | | | | 130 | |
| | | 8.77 | | | | | | 0.45 | | | | | | 378,958 | | | | | | 0.38 | | | | | | 0.59 | | | | | | 0.50 | | | | | | 130 | |
| | | 8.81 | | | | | | (0.01 | ) | | | | | 255 | | | | | | 0.85 | | | | | | 1.10 | | | | | | 0.05 | | | | | | 130 | |
| | | 8.75 | | | | | | 0.24 | | | | | | 1,570 | | | | | | 0.47 | | | | | | 0.69 | | | | | | 0.43 | | | | | | 130 | |
| | | 8.78 | | | | | | 0.44 | | | | | | 47,438 | | | | | | 0.74 | | | | | | 0.96 | | | | | | 0.44 | | | | | | 286 | |
| | | 8.78 | | | | | | 0.78 | | | | | | 158,132 | | | | | | 0.40 | | | | | | 0.62 | | | | | | 0.79 | | | | | | 286 | |
| | | 8.83 | | | | | | 0.41 | | | | | | 160 | | | | | | 0.89 | | | | | | 1.12 | | | | | | 0.38 | | | | | | 286 | |
| | | 8.77 | | | | | | 0.69 | | | | | | 1,018 | | | | | | 0.49 | | | | | | 0.71 | | | | | | 0.63 | | | | | | 286 | |
| | |
| The accompanying notes are an integral part of these financial statements. | | 109 |
GOLDMAN SACHS INFLATION PROTECTED SECURITIES FUND
Financial Highlights
Selected Data for a Share Outstanding Throughout Each Period
| | | | | | | | | | | | | | | | | | | | | | | | | | | | | | | | | | |
| | | | | | | | From
Investment Operations | | | Distributions
to shareholders | |
| | | Year - Share Class | |
Net asset
value,
beginning
of period | | | Net
investment
income
(loss)(a) | | | Net realized
and unrealized
gain (loss) | | | Total from
investment
operations | | | From net
investment
income | | | From net
realized
gains | | | From
capital | | | Total
distributions | |
| | FOR THE SIX MONTHS ENDED SEPTEMBER 30, (UNAUDITED) | |
| | 2017 - A | | $ | 10.44 | | | $ | 0.06 | | | $ | (0.04 | ) | | $ | 0.02 | | | $ | (0.08 | ) | | $ | — | | | $ | — | | | $ | (0.08 | ) |
| | 2017 - C | | | 10.31 | | | | 0.02 | | | | (0.04 | ) | | | (0.02 | ) | | | (0.05 | ) | | | — | | | | — | | | | (0.05 | ) |
| | 2017 - Institutional | | | 10.56 | | | | 0.08 | | | | (0.04 | ) | | | 0.04 | | | | (0.10 | ) | | | — | | | | — | | | | (0.10 | ) |
| | 2017 - Investor(e) | | | 10.50 | | | | 0.07 | | | | (0.04 | ) | | | 0.03 | | | | (0.09 | ) | | | — | | | | — | | | | (0.09 | ) |
| | 2017 - R | | | 10.41 | | | | 0.04 | | | | (0.03 | ) | | | 0.01 | | | | (0.07 | ) | | | — | | | | — | | | | (0.07 | ) |
| | 2017 - R6 | | | 10.55 | | | | 0.05 | | | | (0.01 | ) | | | 0.04 | | | | (0.10 | ) | | | — | | | | — | | | | (0.10 | ) |
| | | | | | | | | | | | | | | | | | | | | | | | | | | | | | | | | | |
| | FOR THE FISCAL YEARS ENDED MARCH 31, | |
| | 2017 - A | | | 10.44 | | | | 0.18 | | | | (0.04 | ) | | | 0.14 | | | | (0.14 | ) | | | — | | | | — | | | | (0.14 | ) |
| | 2017 - C | | | 10.32 | | | | 0.11 | | | | (0.05 | ) | | | 0.06 | | | | (0.07 | ) | | | — | | | | — | | | | (0.07 | ) |
| | 2017 - Institutional | | | 10.55 | | | | 0.22 | | | | (0.04 | ) | | | 0.18 | | | | (0.17 | ) | | | — | | | | — | | | | (0.17 | ) |
| | 2017 - Investor(e) | | | 10.49 | | | | 0.20 | | | | (0.03 | ) | | | 0.17 | | | | (0.16 | ) | | | — | | | | — | | | | (0.16 | ) |
| | 2017 - R | | | 10.41 | | | | 0.15 | | | | (0.04 | ) | | | 0.11 | | | | (0.11 | ) | | | — | | | | — | | | | (0.11 | ) |
| | 2017 - R6 | | | 10.55 | | | | 0.21 | | | | (0.04 | ) | | | 0.17 | | | | (0.17 | ) | | | — | | | | — | | | | (0.17 | ) |
| | 2016 - A | | | 10.39 | | | | 0.10 | | | | 0.01 | | | | 0.11 | | | | (0.03 | ) | | | — | | | | (0.03 | ) | | | (0.06 | ) |
| | 2016 - C | | | 10.31 | | | | 0.04 | | | | — | | | | 0.04 | | | | (0.02 | ) | | | — | | | | (0.01 | ) | | | (0.03 | ) |
| | 2016 - Institutional | | | 10.48 | | | | 0.09 | | | | 0.06 | | | | 0.15 | | | | (0.05 | ) | | | — | | | | (0.03 | ) | | | (0.08 | ) |
| | 2016 - Investor(e) | | | 10.43 | | | | 0.12 | | | | 0.01 | | | | 0.13 | | | | (0.04 | ) | | | — | | | | (0.03 | ) | | | (0.07 | ) |
| | 2016 - R | | | 10.38 | | | | 0.04 | | | | 0.04 | | | | 0.08 | | | | (0.03 | ) | | | — | | | | (0.02 | ) | | | (0.05 | ) |
| | 2016 - R6 (commenced July 31, 2015) | | | 10.36 | | | | (0.03 | ) | | | 0.27 | | | | 0.24 | | | | (0.03 | ) | | | — | | | | (0.02 | ) | | | (0.05 | ) |
| | 2015 - A | | | 10.29 | | | | (0.05 | ) | | | 0.27 | | | | 0.22 | | | | (0.12 | ) | | | — | | | | — | | | | (0.12 | ) |
| | 2015 - C | | | 10.27 | | | | (0.10 | ) | | | 0.23 | | | | 0.13 | | | | (0.09 | ) | | | — | | | | — | | | | (0.09 | ) |
| | 2015 - Institutional | | | 10.36 | | | | 0.03 | | | | 0.22 | | | | 0.25 | | | | (0.13 | ) | | | — | | | | — | | | | (0.13 | ) |
| | 2015 - Investor(e) | | | 10.32 | | | | (0.04 | ) | | | 0.28 | | | | 0.24 | | | | (0.13 | ) | | | — | | | | — | | | | (0.13 | ) |
| | 2015 - R | | | 10.30 | | | | (0.12 | ) | | | 0.31 | | | | 0.19 | | | | (0.11 | ) | | | — | | | | — | | | | (0.11 | ) |
| | 2014 - A | | | 11.24 | | | | 0.09 | | | | (0.83 | ) | | | (0.74 | ) | | | (0.02 | ) | | | (0.16 | ) | | | (0.03 | ) | | | (0.21 | ) |
| | 2014 - C | | | 11.28 | | | | — | (f) | | | (0.82 | ) | | | (0.82 | ) | | | — | | | | (0.16 | ) | | | (0.03 | ) | | | (0.19 | ) |
| | 2014 - Institutional | | | 11.28 | | | | 0.13 | | | | (0.83 | ) | | | (0.70 | ) | | | (0.03 | ) | | | (0.16 | ) | | | (0.03 | ) | | | (0.22 | ) |
| | 2014 - Investor(e) | | | 11.25 | | | | 0.11 | | | | (0.83 | ) | | | (0.72 | ) | | | (0.02 | ) | | | (0.16 | ) | | | (0.03 | ) | | | (0.21 | ) |
| | 2014 - R | | | 11.27 | | | | 0.01 | | | | (0.78 | ) | | | (0.77 | ) | | | (0.01 | ) | | | (0.16 | ) | | | (0.03 | ) | | | (0.20 | ) |
| | 2013 - A | | | 11.16 | | | | 0.04 | | | | 0.56 | | | | 0.60 | | | | (0.16 | ) | | | (0.36 | ) | | | — | | | | (0.52 | ) |
| | 2013 - C | | | 11.20 | | | | (0.03 | ) | | | 0.55 | | | | 0.52 | | | | (0.08 | ) | | | (0.36 | ) | | | — | | | | (0.44 | ) |
| | 2013 - Institutional | | | 11.20 | | | | 0.06 | | | | 0.58 | | | | 0.64 | | | | (0.20 | ) | | | (0.36 | ) | | | — | | | | (0.56 | ) |
| | 2013 - Investor(e) | | | 11.17 | | | | 0.03 | | | | 0.60 | | | | 0.63 | | | | (0.19 | ) | | | (0.36 | ) | | | — | | | | (0.55 | ) |
| | 2013 - R | | | 11.19 | | | | — | (f) | | | 0.57 | | | | 0.57 | | | | (0.13 | ) | | | (0.36 | ) | | | — | | | | (0.49 | ) |
| | (a) | | Calculated based on the average shares outstanding methodology. |
| | (b) | | Assumes investment at the NAV at the beginning of the period, reinvestment of all dividends and distributions, a complete redemption of the investment at the NAV at the end of the period and no sales or redemption charges. Total returns would be reduced if a sales or redemption charge was taken into account. Returns do not reflect the impact of taxes to shareholder relating to Fund distributions or the redemption of Fund shares. Total returns for periods less than one full year are not annualized. |
| | (c) | | The Fund’s portfolio turnover rate is calculated in accordance with regulatory requirements, without regard to transactions involving short term investments and certain derivatives. If such transactions were included, the Fund’s portfolio turnover rate may be higher. |
| | (e) | | Effective August 15, 2017, Class IR Shares changed its name to Investor Shares. |
| | (f) | | Amount is less than $0.005 per share. |
| | |
| 110 | | The accompanying notes are an integral part of these financial statements. |
GOLDMAN SACHS INFLATION PROTECTED SECURITIES FUND
| | | | | | | | | | | | | | | | | | | | | | | | | | | | | | | | | | | | | | | | |
| | | | | | | | | | | | | | | | | | | | | | | | | | | | | | | | | | |
| | | Net asset
value, end
of period | | | | | Total
return(b) | | | | | Net assets,
end of
period
(in 000s) | | | | | Ratio of
net expenses
to average
net assets | | | | | Ratio of
total expenses
to average
net assets | | | | | Ratio of
net investment
income (loss)
to average
net assets | | | | | Portfolio
turnover
rate(c) | |
| | | | | | | | | | | | | | | | | | | | | | | | | | | | | | | | | | | | | | | | |
| | $ | 10.38 | | | | | | 0.20 | % | | | | $ | 79,231 | | | | | | 0.68 | %(d) | | | | | 0.78 | %(d) | | | | | 1.22 | %(d) | | | | | 72 | % |
| | | 10.24 | | | | | | (0.16 | ) | | | | | 7,887 | | | | | | 1.43 | (d) | | | | | 1.53 | (d) | | | | | 0.38 | (d) | | | | | 72 | |
| | | 10.50 | | | | | | 0.36 | | | | | | 225,694 | | | | | | 0.34 | (d) | | | | | 0.44 | (d) | | | | | 1.53 | (d) | | | | | 72 | |
| | | 10.44 | | | | | | 0.32 | | | | | | 15,538 | | | | | | 0.43 | (d) | | | | | 0.53 | (d) | | | | | 1.37 | (d) | | | | | 72 | |
| | | 10.35 | | | | | | 0.12 | | | | | | 23,888 | | | | | | 0.93 | (d) | | | | | 1.03 | (d) | | | | | 0.86 | (d) | | | | | 72 | |
| | | 10.49 | | | | | | 0.37 | | | | | | 3,638 | | | | | | 0.33 | (d) | | | | | 0.41 | (d) | | | | | 0.89 | (d) | | | | | 72 | |
| | | | | | | | | | | | | | | | | | | | | | | | | | | | | | | | | | | | | | | | |
| | | 10.44 | | | | | | 1.32 | | | | | | 78,713 | | | | | | 0.68 | | | | | | 0.84 | | | | | | 1.69 | | | | | | 189 | |
| | | 10.31 | | | | | | 0.59 | | | | | | 6,512 | | | | | | 1.43 | | | | | | 1.60 | | | | | | 1.06 | | | | | | 189 | |
| | | 10.56 | | | | | | 1.70 | | | | | | 202,452 | | | | | | 0.34 | | | | | | 0.50 | | | | | | 2.11 | | | | | | 189 | |
| | | 10.50 | | | | | | 1.64 | | | | | | 12,523 | | | | | | 0.43 | | | | | | 0.59 | | | | | | 1.87 | | | | | | 189 | |
| | | 10.41 | | | | | | 1.07 | | | | | | 18,094 | | | | | | 0.93 | | | | | | 1.09 | | | | | | 1.45 | | | | | | 189 | |
| | | 10.55 | | | | | | 1.62 | | | | | | 723 | | | | | | 0.32 | | | | | | 0.47 | | | | | | 2.00 | | | | | | 189 | |
| | | 10.44 | | | | | | 1.09 | | | | | | 39,525 | | | | | | 0.70 | | | | | | 0.89 | | | | | | 1.02 | | | | | | 171 | |
| | | 10.32 | | | | | | 0.39 | | | | | | 6,420 | | | | | | 1.45 | | | | | | 1.64 | | | | | | 0.37 | | | | | | 171 | |
| | | 10.55 | | | | | | 1.42 | | | | | | 119,876 | | | | | | 0.35 | | | | | | 0.56 | | | | | | 0.85 | | | | | | 171 | |
| | | 10.49 | | | | | | 1.29 | | | | | | 2,697 | | | | | | 0.45 | | | | | | 0.64 | | | | | | 1.18 | | | | | | 171 | |
| | | 10.41 | | | | | | 0.79 | | | | | | 10,128 | | | | | | 0.95 | | | | | | 1.15 | | | | | | 0.42 | | | | | | 171 | |
| | | 10.55 | | | | | | 2.37 | | | | | | 10 | | | | | | 0.34 | (d) | | | | | 0.60 | (d) | | | | | (0.44 | )(d) | | | | | 171 | |
| | | 10.39 | | | | | | 2.09 | | | | | | 38,976 | | | | | | 0.69 | | | | | | 0.96 | | | | | | (0.47 | ) | | | | | 161 | |
| | | 10.31 | | | | | | 1.25 | | | | | | 8,161 | | | | | | 1.44 | | | | | | 1.71 | | | | | | (1.00 | ) | | | | | 161 | |
| | | 10.48 | | | | | | 2.40 | | | | | | 72,940 | | | | | | 0.35 | | | | | | 0.62 | | | | | | 0.29 | | | | | | 161 | |
| | | 10.43 | | | | | | 2.27 | | | | | | 2,526 | | | | | | 0.45 | | | | | | 0.71 | | | | | | (0.42 | ) | | | | | 161 | |
| | | 10.38 | | | | | | 1.81 | | | | | | 7,085 | | | | | | 0.95 | | | | | | 1.22 | | | | | | (1.19 | ) | | | | | 161 | |
| | | 10.29 | | | | | | (6.60 | ) | | | | | 37,940 | | | | | | 0.63 | | | | | | 0.84 | | | | | | 0.88 | | | | | | 262 | |
| | | 10.27 | | | | | | (7.29 | ) | | | | | 10,173 | | | | | | 1.38 | | | | | | 1.59 | | | | | | (0.01 | ) | | | | | 262 | |
| | | 10.36 | | | | | | (6.22 | ) | | | | | 91,483 | | | | | | 0.29 | | | | | | 0.50 | | | | | | 1.19 | | | | | | 262 | |
| | | 10.32 | | | | | | (6.35 | ) | | | | | 2,021 | | | | | | 0.38 | | | | | | 0.59 | | | | | | 1.03 | | | | | | 262 | |
| | | 10.30 | | | | | | (6.82 | ) | | | | | 4,707 | | | | | | 0.88 | | | | | | 1.10 | | | | | | 0.10 | | | | | | 262 | |
| | | 11.24 | | | | | | 5.37 | | | | | | 73,665 | | | | | | 0.62 | | | | | | 0.81 | | | | | | 0.39 | | | | | | 230 | |
| | | 11.28 | | | | | | 4.57 | | | | | | 19,203 | | | | | | 1.38 | | | | | | 1.56 | | | | | | (0.29 | ) | | | | | 230 | |
| | | 11.28 | | | | | | 5.71 | | | | | | 276,216 | | | | | | 0.28 | | | | | | 0.46 | | | | | | 0.53 | | | | | | 230 | |
| | | 11.25 | | | | | | 5.63 | | | | | | 3,617 | | | | | | 0.37 | | | | | | 0.55 | | | | | | 0.24 | | | | | | 230 | |
| | | 11.27 | | | | | | 5.10 | | | | | | 2,023 | | | | | | 0.87 | | | | | | 1.05 | | | | | | 0.02 | | | | | | 230 | |
| | |
| The accompanying notes are an integral part of these financial statements. | | 111 |
GOLDMAN SACHS SHORT DURATION GOVERNMENT FUND
Financial Highlights
Selected Data for a Share Outstanding Throughout Each Period
| | | | | | | | | | | | | | | | | | | | | | | | | | | | | | |
| | | | | | From
Investment Operations | | | Distributions
to shareholders | |
| | | Year - Share Class | | Net asset
value,
beginning
of period | | | Net
investment
income(a) | | | Net realized
and unrealized
gain (loss) | | | Total from
investment
operations | | | From net
investment
income | | | From net
realized
gains | | | Total
distributions | |
| | FOR THE SIX MONTHS ENDED SEPTEMBER 30, (UNAUDITED) | |
| | 2017 - A | | $ | 9.99 | | | $ | 0.06 | | | $ | (0.03 | ) | | $ | 0.03 | | | $ | (0.09 | ) | | $ | — | | | $ | (0.09 | ) |
| | 2017 - C | | | 9.92 | | | | 0.04 | | | | (0.03 | ) | | | 0.01 | | | | (0.07 | ) | | | — | | | | (0.07 | ) |
| | 2017 - Institutional | | | 9.96 | | | | 0.08 | | | | (0.03 | ) | | | 0.05 | | | | (0.11 | ) | | | — | | | | (0.11 | ) |
| | 2017 - Service | | | 9.94 | | | | 0.06 | | | | (0.04 | ) | | | 0.02 | | | | (0.08 | ) | | | — | | | | (0.08 | ) |
| | 2017 - Investor(e) | | | 9.99 | | | | 0.08 | | | | (0.04 | ) | | | 0.04 | | | | (0.10 | ) | | | — | | | | (0.10 | ) |
| | 2017 - R6 | | | 9.96 | | | | 0.10 | | | | (0.06 | ) | | | 0.04 | | | | (0.11 | ) | | | — | | | | (0.11 | ) |
| | FOR THE FISCAL YEARS ENDED MARCH 31, | |
| | 2017 - A | | | 10.10 | | | | 0.11 | | | | (0.06 | ) | | | 0.05 | | | | (0.16 | ) | | | — | | | | (0.16 | ) |
| | 2017 - C | | | 10.03 | | | | 0.07 | | | | (0.06 | ) | | | 0.01 | | | | (0.12 | ) | | | — | | | | (0.12 | ) |
| | 2017 - Institutional | | | 10.07 | | | | 0.14 | | | | (0.06 | ) | | | 0.08 | | | | (0.19 | ) | | | — | | | | (0.19 | ) |
| | 2017 - Service | | | 10.05 | | | | 0.09 | | | | (0.06 | ) | | | 0.03 | | | | (0.14 | ) | | | — | | | | (0.14 | ) |
| | 2017 - Investor(e) | | | 10.10 | | | | 0.14 | | | | (0.07 | ) | | | 0.07 | | | | (0.18 | ) | | | — | | | | (0.18 | ) |
| | 2017 - R6 | | | 10.07 | | | | 0.14 | | | | (0.06 | ) | | | 0.08 | | | | (0.19 | ) | | | — | | | | (0.19 | ) |
| | 2016 - A | | | 10.12 | | | | 0.05 | | | | (0.01 | ) | | | 0.04 | | | | (0.06 | ) | | | — | | | | (0.06 | ) |
| | 2016 - C | | | 10.06 | | | | 0.02 | | | | (0.02 | ) | | | — | (f) | | | (0.03 | ) | | | — | | | | (0.03 | ) |
| | 2016 - Institutional | | | 10.09 | | | | 0.09 | | | | (0.01 | ) | | | 0.08 | | | | (0.10 | ) | | | — | | | | (0.10 | ) |
| | 2016 - Service | | | 10.08 | | | | 0.04 | | | | (0.02 | ) | | | 0.02 | | | | (0.05 | ) | | | — | | | | (0.05 | ) |
| | 2016 - Investor(e) | | | 10.13 | | | | 0.08 | | | | (0.02 | ) | | | 0.06 | | | | (0.09 | ) | | | — | | | | (0.09 | ) |
| | 2016 - R6 (commenced July 31, 2015) | | | 10.09 | | | | 0.06 | | | | (0.02 | ) | | | 0.04 | | | | (0.06 | ) | | | — | | | | (0.06 | ) |
| | 2015 - A | | | 10.17 | | | | 0.07 | | | | (0.04 | ) | | | 0.03 | | | | (0.08 | ) | | | — | | | | (0.08 | ) |
| | 2015 - C | | | 10.11 | | | | 0.03 | | | | (0.04 | ) | | | (0.01 | ) | | | (0.04 | ) | | | — | | | | (0.04 | ) |
| | 2015 - Institutional | | | 10.14 | | | | 0.10 | | | | (0.03 | ) | | | 0.07 | | | | (0.12 | ) | | | — | | | | (0.12 | ) |
| | 2015 - Service | | | 10.13 | | | | 0.05 | | | | (0.03 | ) | | | 0.02 | | | | (0.07 | ) | | | — | | | | (0.07 | ) |
| | 2015 - Investor(e) | | | 10.18 | | | | 0.09 | | | | (0.03 | ) | | | 0.06 | | | | (0.11 | ) | | | — | | | | (0.11 | ) |
| | 2014 - A | | | 10.24 | | | | 0.07 | | | | (0.06 | ) | | | 0.01 | | | | (0.08 | ) | | | — | | | | (0.08 | ) |
| | 2014 - C | | | 10.17 | | | | 0.03 | | | | (0.05 | ) | | | (0.02 | ) | | | (0.04 | ) | | | — | | | | (0.04 | ) |
| | 2014 - Institutional | | | 10.21 | | | | 0.10 | | | | (0.06 | ) | | | 0.04 | | | | (0.11 | ) | | | — | | | | (0.11 | ) |
| | 2014 - Service | | | 10.20 | | | | 0.05 | | | | (0.06 | ) | | | (0.01 | ) | | | (0.06 | ) | | | — | | | | (0.06 | ) |
| | 2014 - Investor(e) | | | 10.25 | | | | 0.09 | | | | (0.05 | ) | | | 0.04 | | | | (0.11 | ) | | | — | | | | (0.11 | ) |
| | 2013 - A | | | 10.30 | | | | 0.04 | | | | (0.01 | ) | | | 0.03 | | | | (0.06 | ) | | | (0.03 | ) | | | (0.09 | ) |
| | 2013 - C | | | 10.23 | | | | 0.01 | | | | (0.02 | ) | | | (0.01 | ) | | | (0.02 | ) | | | (0.03 | ) | | | (0.05 | ) |
| | 2013 - Institutional | | | 10.27 | | | | 0.08 | | | | (0.01 | ) | | | 0.07 | | | | (0.10 | ) | | | (0.03 | ) | | | (0.13 | ) |
| | 2013 - Service | | | 10.25 | | | | 0.03 | | | | — | (f) | | | 0.03 | | | | (0.05 | ) | | | (0.03 | ) | | | (0.08 | ) |
| | 2013 - Investor(e) | | | 10.30 | | | | 0.07 | | | | — | (f) | | | 0.07 | | | | (0.09 | ) | | | (0.03 | ) | | | (0.12 | ) |
| | (a) | | Calculated based on the average shares outstanding methodology. |
| | (b) | | Assumes investment at the NAV at the beginning of the period, reinvestment of all dividends and distributions, a complete redemption of the investment at the NAV at the end of the period and no sales or redemption charges. Total returns would be reduced if a sales or redemption charge was taken into account. Returns do not reflect the impact of taxes to shareholder relating to Fund distributions or the redemption of Fund shares. Total returns for periods less than one full year are not annualized. |
| | (c) | | The Fund’s portfolio turnover rate is calculated in accordance with regulatory requirements, without regard to transactions involving short term investments and certain derivatives. If such transactions were included, the Fund’s portfolio turnover rate may be higher. |
| | (e) | | Effective August 15, 2017, Class IR Shares changed its name to Investor Shares. |
| | (f) | | Amount is less than $0.005 per share. |
| | |
| 112 | | The accompanying notes are an integral part of these financial statements. |
GOLDMAN SACHS SHORT DURATION GOVERNMENT FUND
| | | | | | | | | | | | | | | | | | | | | | | | | | | | | | | | | | | | | | | | |
| | | | | | | | | | | | | | | | | | | | | | | | | | | | | | | | | | |
| | | Net asset
value, end
of period | | | | | Total
return(b) | | | | | Net assets,
end of
period
(in 000s) | | | | | Ratio of
net expenses
to average
net assets | | | | | Ratio of
total expenses
to average
net assets | | | | | Ratio of
net investment
income
to average
net assets | | | | | Portfolio
turnover
rate(c) | |
| | | | | | | | | | | | | | | | | | | | | | | | | | | | | | | | | | | | | | | | |
| | $ | 9.93 | | | | | | 0.30 | % | | | | $ | 121,260 | | | | | | 0.82 | %(d) | | | | | 0.90 | %(d) | | | | | 1.28 | %(d) | | | | | 42 | % |
| | | 9.86 | | | | | | 0.09 | | | | | | 24,093 | | | | | | 1.22 | (d) | | | | | 1.65 | (d) | | | | | 0.88 | (d) | | | | | 42 | |
| | | 9.90 | | | | | | 0.47 | | | | | | 921,699 | | | | | | 0.48 | (d) | | | | | 0.56 | (d) | | | | | 1.62 | (d) | | | | | 42 | |
| | | 9.88 | | | | | | 0.21 | | | | | | 24,508 | | | | | | 0.98 | (d) | | | | | 1.06 | (d) | | | | | 1.12 | (d) | | | | | 42 | |
| | | 9.93 | | | | | | 0.42 | | | | | | 28,454 | | | | | | 0.57 | (d) | | | | | 0.65 | (d) | | | | | 1.54 | (d) | | | | | 42 | |
| | | 9.89 | | | | | | 0.37 | | | | | | 1,634 | | | | | | 0.46 | (d) | | | | | 0.55 | (d) | | | | | 1.92 | (d) | | | | | 42 | |
| | | | | | | | | | | | | | | | | | | | | | | | | | | | | | | | | | | | | | | | |
| | | 9.99 | | | | | | 0.46 | | | | | | 138,612 | | | | | | 0.82 | | | | | | 0.92 | | | | | | 1.08 | | | | | | 173 | |
| | �� | 9.92 | | | | | | 0.06 | | | | | | 28,292 | | | | | | 1.22 | | | | | | 1.67 | | | | | | 0.68 | | | | | | 173 | |
| | | 9.96 | | | | | | 0.80 | | | | | | 1,045,066 | | | | | | 0.47 | | | | | | 0.58 | | | | | | 1.42 | | | | | | 173 | |
| | | 9.94 | | | | | | 0.30 | | | | | | 26,697 | | | | | | 0.97 | | | | | | 1.08 | | | | | | 0.93 | | | | | | 173 | |
| | | 9.99 | | | | | | 0.72 | | | | | | 24,378 | | | | | | 0.56 | | | | | | 0.67 | | | | | | 1.36 | | | | | | 173 | |
| | | 9.96 | | | | | | 0.82 | | | | | | 73,716 | | | | | | 0.45 | | | | | | 0.56 | | | | | | 1.44 | | | | | | 173 | |
| | | 10.10 | | | | | | 0.44 | | | | | | 173,879 | | | | | | 0.81 | | | | | | 0.91 | | | | | | 0.52 | | | | | | 227 | |
| | | 10.03 | | | | | | (0.02 | ) | | | | | 33,934 | | | | | | 1.17 | | | | | | 1.66 | | | | | | 0.17 | | | | | | 227 | |
| | | 10.07 | | | | | | 0.78 | | | | | | 1,089,297 | | | | | | 0.47 | | | | | | 0.57 | | | | | | 0.86 | | | | | | 227 | |
| | | 10.05 | | | | | | 0.18 | | | | | | 30,608 | | | | | | 0.97 | | | | | | 1.07 | | | | | | 0.37 | | | | | | 227 | |
| | | 10.07 | | | | | | 0.42 | | | | | | 73,976 | | | | | | 0.45 | (d) | | | | | 0.55 | (d) | | | | | 0.84 | (d) | | | | | 227 | |
| | | 10.10 | | | | | | 0.59 | | | | | | 17,850 | | | | | | 0.56 | | | | | | 0.66 | | | | | | 0.77 | | | | | | 227 | |
| | | 10.12 | | | | | | 0.33 | | | | | | 220,814 | | | | | | 0.82 | | | | | | 0.91 | | | | | | 0.67 | | | | | | 185 | |
| | | 10.06 | | | | | | (0.07 | ) | | | | | 36,722 | | | | | | 1.22 | | | | | | 1.67 | | | | | | 0.27 | | | | | | 185 | |
| | | 10.09 | | | | | | 0.67 | | | | | | 1,003,694 | | | | | | 0.48 | | | | | | 0.57 | | | | | | 1.00 | | | | | | 185 | |
| | | 10.08 | | | | | | 0.17 | | | | | | 33,015 | | | | | | 0.98 | | | | | | 1.08 | | | | | | 0.51 | | | | | | 185 | |
| | | 10.13 | | | | | | 0.58 | | | | | | 13,505 | | | | | | 0.57 | | | | | | 0.66 | | | | | | 0.91 | | | | | | 185 | |
| | | 10.17 | | | | | | 0.10 | | | | | | 277,312 | | | | | | 0.82 | | | | | | 0.91 | | | | | | 0.65 | | | | | | 211 | |
| | | 10.11 | | | | | | (0.20 | ) | | | | | 48,324 | | | | | | 1.22 | | | | | | 1.66 | | | | | | 0.26 | | | | | | 211 | |
| | | 10.14 | | | | | | 0.44 | | | | | | 1,043,676 | | | | | | 0.48 | | | | | | 0.57 | | | | | | 1.00 | | | | | | 211 | |
| | | 10.13 | | | | | | (0.06 | ) | | | | | 38,818 | | | | | | 0.98 | | | | | | 1.07 | | | | | | 0.49 | | | | | | 211 | |
| | | 10.18 | | | | | | 0.35 | | | | | | 18,018 | | | | | | 0.57 | | | | | | 0.66 | | | | | | 0.91 | | | | | | 211 | |
| | | 10.24 | | | | | | 0.32 | | | | | | 471,348 | | | | | | 0.81 | | | | | | 0.89 | | | | | | 0.42 | | | | | | 640 | |
| | | 10.17 | | | | | | (0.06 | ) | | | | | 69,496 | | | | | | 1.19 | | | | | | 1.64 | | | | | | 0.05 | | | | | | 640 | |
| | | 10.21 | | | | | | 0.66 | | | | | | 1,133,613 | | | | | | 0.47 | | | | | | 0.55 | | | | | | 0.77 | | | | | | 640 | |
| | | 10.20 | | | | | | 0.26 | | | | | | 53,464 | | | | | | 0.97 | | | | | | 1.05 | | | | | | 0.27 | | | | | | 640 | |
| | | 10.25 | | | | | | 0.67 | | | | | | 24,501 | | | | | | 0.56 | | | | | | 0.64 | | | | | | 0.68 | | | | | | 640 | |
| | |
| The accompanying notes are an integral part of these financial statements. | | 113 |
GOLDMAN SACHS SHORT DURATION INCOME FUND
Financial Highlights
Selected Data for a Share Outstanding Throughout Each Period
| | | | | | | | | | | | | | | | | | | | | | | | | | | | | | |
| | | | | | From
Investment Operations | | | Distributions
to shareholders | |
| | | Year - Share Class | | Net asset
value,
beginning
of period | | | Net
investment
income(a) | | | Net realized
and unrealized
gain (loss) | | | Total from
investment
operations | | | From net
investment
income | | | From net
realized
gains | | | Total
distributions | |
| | FOR THE SIX MONTHS ENDED SEPTEMBER 30, (UNAUDITED) | |
| | 2017 - A | | $ | 9.96 | | | $ | 0.09 | | | $ | — | (d) | | $ | 0.09 | | | $ | (0.10 | ) | | $ | — | | | $ | (0.10 | ) |
| | 2017 - C | | | 9.96 | | | | 0.07 | | | | — | (d) | | | 0.07 | | | | (0.08 | ) | | | — | | | | (0.08 | ) |
| | 2017 - Institutional | | | 9.98 | | | | 0.10 | | | | (0.01 | ) | | | 0.09 | | | | (0.11 | ) | | | — | | | | (0.11 | ) |
| | 2017 - Investor(f) | | | 9.98 | | | | 0.10 | | | | (0.01 | ) | | | 0.09 | | | | (0.11 | ) | | | — | | | | (0.11 | ) |
| | 2017 - R | | | 9.98 | | | | 0.07 | | | | — | (d) | | | 0.07 | | | | (0.09 | ) | | | — | | | | (0.09 | ) |
| | 2017 - R6 | | | 9.98 | | | | 0.10 | | | | (0.01 | ) | | | 0.09 | | | | (0.11 | ) | | | — | | | | (0.11 | ) |
| | | | | | | | | | | | | | | | | | | | | | | | | | | | | | |
| | FOR THE FISCAL YEARS ENDED MARCH 31, | |
| | 2017 - A | | | 9.96 | | | | 0.16 | | | | 0.02 | | | | 0.18 | | | | (0.18 | ) | | | — | | | | (0.18 | ) |
| | 2017 - C | | | 9.96 | | | | 0.12 | | | | 0.03 | | | | 0.15 | | | | (0.15 | ) | | | — | | | | (0.15 | ) |
| | 2017 - Institutional | | | 9.98 | | | | 0.19 | | | | 0.03 | | | | 0.22 | | | | (0.22 | ) | | | — | | | | (0.22 | ) |
| | 2017 - Investor(f) | | | 9.97 | | | | 0.18 | | | | 0.04 | | | | 0.22 | | | | (0.21 | ) | | | — | | | | (0.21 | ) |
| | 2017 - R | | | 9.98 | | | | 0.13 | | | | 0.03 | | | | 0.16 | | | | (0.16 | ) | | | — | | | | (0.16 | ) |
| | 2017 - R6 | | | 9.97 | | | | 0.19 | | | | 0.04 | | | | 0.23 | | | | (0.22 | ) | | | — | | | | (0.22 | ) |
| | 2016 - A | | | 10.10 | | | | 0.16 | | | | (0.10 | ) | | | 0.06 | | | | (0.20 | ) | | | — | | | | (0.20 | ) |
| | 2016 - C | | | 10.10 | | | | 0.12 | | | | (0.10 | ) | | | 0.02 | | | | (0.16 | ) | | | — | | | | (0.16 | ) |
| | 2016 - Institutional | | | 10.11 | | | | 0.19 | | | | (0.08 | ) | | | 0.11 | | | | (0.24 | ) | | | — | | | | (0.24 | ) |
| | 2016 - Investor(f) | | | 10.11 | | | | 0.18 | | | | (0.09 | ) | | | 0.09 | | | | (0.23 | ) | | | — | | | | (0.23 | ) |
| | 2016 - R | | | 10.11 | | | | 0.13 | | | | (0.08 | ) | | | 0.05 | | | | (0.18 | ) | | | — | | | | (0.18 | ) |
| | 2016 - R6 (commenced July 31, 2015) | | | 10.07 | | | | 0.13 | | | | (0.07 | ) | | | 0.06 | | | | (0.16 | ) | | | — | | | | (0.16 | ) |
| | 2015 - A | | | 10.17 | | | | 0.10 | | | | (0.04 | ) | | | 0.06 | | | | (0.13 | ) | | | — | | | | (0.13 | ) |
| | 2015 - C | | | 10.17 | | | | 0.06 | | | | (0.04 | ) | | | 0.02 | | | | (0.09 | ) | | | — | | | | (0.09 | ) |
| | 2015 - Institutional | | | 10.18 | | | | 0.13 | | | | (0.03 | ) | | | 0.10 | | | | (0.17 | ) | | | — | | | | (0.17 | ) |
| | 2015 - Investor(f) | | | 10.18 | | | | 0.13 | | | | (0.04 | ) | | | 0.09 | | | | (0.16 | ) | | | — | | | | (0.16 | ) |
| | 2015 - R | | | 10.18 | | | | 0.08 | | | | (0.04 | ) | | | 0.04 | | | | (0.11 | ) | | | — | | | | (0.11 | ) |
| | 2014 - A | | | 10.17 | | | | 0.12 | | | | 0.01 | | | | 0.13 | | | | (0.13 | ) | | | — | (d) | | | (0.13 | ) |
| | 2014 - C | | | 10.17 | | | | 0.08 | | | | 0.01 | | | | 0.09 | | | | (0.09 | ) | | | — | (d) | | | (0.09 | ) |
| | 2014 - Institutional | | | 10.18 | | | | 0.15 | | | | 0.01 | | | | 0.16 | | | | (0.16 | ) | | | — | (d) | | | (0.16 | ) |
| | 2014 - Investor(f) | | | 10.18 | | | | 0.15 | | | | — | (d) | | | 0.15 | | | | (0.15 | ) | | | — | (d) | | | (0.15 | ) |
| | 2014 - R | | | 10.18 | | | | 0.09 | | | | 0.01 | | | | 0.10 | | | | (0.10 | ) | | | — | (d) | | | (0.10 | ) |
| | 2013 - A | | | 9.96 | | | | 0.11 | | | | 0.26 | | | | 0.37 | | | | (0.13 | ) | | | (0.03 | ) | | | (0.16 | ) |
| | 2013 - C | | | 9.97 | | | | 0.08 | | | | 0.24 | | | | 0.32 | | | | (0.09 | ) | | | (0.03 | ) | | | (0.12 | ) |
| | 2013 - Institutional | | | 9.97 | | | | 0.14 | | | | 0.26 | | | | 0.40 | | | | (0.16 | ) | | | (0.03 | ) | | | (0.19 | ) |
| | 2013 - Investor(f) | | | 9.97 | | | | 0.13 | | | | 0.26 | | | | 0.39 | | | | (0.15 | ) | | | (0.03 | ) | | | (0.18 | ) |
| | 2013 - R | | | 9.97 | | | | 0.08 | | | | 0.26 | | | | 0.34 | | | | (0.10 | ) | | | (0.03 | ) | | | (0.13 | ) |
| | (a) | | Calculated based on the average shares outstanding methodology. |
| | (b) | | Assumes investment at the NAV at the beginning of the period, reinvestment of all dividends and distributions, a complete redemption of the investment at the NAV at the end of the period and no sales or redemption charges. Total returns would be reduced if a sales or redemption charge was taken into account. Returns do not reflect the impact of taxes to shareholder relating to Fund distributions or the redemption of Fund shares. Total returns for periods less than one full year are not annualized. |
| | (c) | | The Fund’s portfolio turnover rate is calculated in accordance with regulatory requirements, without regard to transactions involving short term investments and certain derivatives. If such transactions were included, the Fund’s portfolio turnover rate may be higher. |
| | (d) | | Amount is less than $0.005 per share. |
| | (f) | | Effective August 15, 2017, Class IR Shares changed its name to Investor Shares. |
| | |
| 114 | | The accompanying notes are an integral part of these financial statements. |
GOLDMAN SACHS SHORT DURATION INCOME FUND
| | | | | | | | | | | | | | | | | | | | | | | | | | | | | | | | | | | | | | | | |
| | | | | | | | | | | | | | | | | | | | | | | | | | | | | | | | | | |
| | | | | | | | | | | | | | | | | | | | | | | | | | | | | | | | | | |
| | | Net asset
value, end
of period | | | | | Total
return(b) | | | | | Net assets,
end of
period
(in 000s) | | | | | Ratio of
net expenses
to average
net assets | | | | | Ratio of
total expenses
to average
net assets | | | | | Ratio of
net investment
income
to average
net assets | | | | | Portfolio
turnover
rate(c) | |
| | | | | | | | | | | | | | | | | | | | | | | | | | | | | | | | | | | | | | | | |
| | $ | 9.95 | | | | | | 0.88 | % | | | | $ | 12,380 | | | | | | 0.79 | %(e) | | | | | 0.87 | %(e) | | | | | 1.71 | %(e) | | | | | 61 | % |
| | | 9.95 | | | | | | 0.58 | | | | | | 1,050 | | | | | | 1.20 | (e) | | | | | 1.62 | (e) | | | | | 1.33 | (e) | | | | | 61 | |
| | | 9.96 | | | | | | 0.95 | | | | | | 640,385 | | | | | | 0.45 | (e) | | | | | 0.53 | (e) | | | | | 2.06 | (e) | | | | | 61 | |
| | | 9.96 | | | | | | 0.91 | | | | | | 1,818 | | | | | | 0.54 | (e) | | | | | 0.62 | (e) | | | | | 1.96 | (e) | | | | | 61 | |
| | | 9.96 | | | | | | 0.66 | | | | | | 40 | | | | | | 1.04 | (e) | | | | | 1.11 | (e) | | | | | 1.48 | (e) | | | | | 61 | |
| | | 9.96 | | | | | | 0.94 | | | | | | 10 | | | | | | 0.45 | (e) | | | | | 0.55 | (e) | | | | | 2.09 | (e) | | | | | 61 | |
| | | | | | | | | | | | | | | | | | | | | | | | | | | | | | | | | | | | | | | | |
| | | 9.96 | | | | | | 1.86 | | | | | | 9,259 | | | | | | 0.79 | | | | | | 0.90 | | | | | | 1.56 | | | | | | 165 | |
| | | 9.96 | | | | | | 1.46 | | | | | | 954 | | | | | | 1.19 | | | | | | 1.66 | | | | | | 1.16 | | | | | | 165 | |
| | | 9.98 | | | | | | 2.21 | | | | | | 560,818 | | | | | | 0.45 | | | | | | 0.56 | | | | | | 1.90 | | | | | | 165 | |
| | | 9.98 | | | | | | 2.22 | | | | | | 1,457 | | | | | | 0.54 | | | | | | 0.65 | | | | | | 1.84 | | | | | | 165 | |
| | | 9.98 | | | | | | 1.62 | | | | | | 32 | | | | | | 1.04 | | | | | | 1.14 | | | | | | 1.32 | | | | | | 165 | |
| | | 9.98 | | | | | | 2.30 | | | | | | 10 | | | | | | 0.45 | | | | | | 0.59 | | | | | | 1.91 | | | | | | 165 | |
| | | 9.96 | | | | | | 0.62 | | | | | | 7,001 | | | | | | 0.80 | | | | | | 0.94 | | | | | | 1.57 | | | | | | 161 | |
| | | 9.96 | | | | | | 0.22 | | | | | | 886 | | | | | | 1.20 | | | | | | 1.69 | | | | | | 1.17 | | | | | | 161 | |
| | | 9.98 | | | | | | 1.07 | | | | | | 390,351 | | | | | | 0.45 | | | | | | 0.60 | | | | | | 1.91 | | | | | | 161 | |
| | | 9.97 | | | | | | 0.87 | | | | | | 363 | | | | | | 0.54 | | | | | | 0.69 | | | | | | 1.81 | | | | | | 161 | |
| | | 9.98 | | | | | | 0.46 | | | | | | 25 | | | | | | 1.04 | | | | | | 1.19 | | | | | | 1.33 | | | | | | 161 | |
| | | 9.97 | | | | | | 0.65 | | | | | | 10 | | | | | | 0.48 | (e) | | | | | 0.63 | (e) | | | | | 1.90 | (e) | | | | | 161 | |
| | | 10.10 | | | | | | 0.60 | | | | | | 3,986 | | | | | | 0.79 | | | | | | 0.99 | | | | | | 0.95 | | | | | | 139 | |
| | | 10.10 | | | | | | 0.21 | | | | | | 864 | | | | | | 1.18 | | | | | | 1.74 | | | | | | 0.57 | | | | | | 139 | |
| | | 10.11 | | | | | | 0.94 | | | | | | 289,892 | | | | | | 0.45 | | | | | | 0.64 | | | | | | 1.29 | | | | | | 139 | |
| | | 10.11 | | | | | | 0.85 | | | | | | 289 | | | | | | 0.55 | | | | | | 0.74 | | | | | | 1.25 | | | | | | 139 | |
| | | 10.11 | | | | | | 0.37 | | | | | | 10 | | | | | | 1.01 | | | | | | 1.22 | | | | | | 0.76 | | | | | | 139 | |
| | | 10.17 | | | | | | 1.28 | | | | | | 2,327 | | | | | | 0.80 | | | | | | 1.19 | | | | | | 1.16 | | | | | | 157 | |
| | | 10.17 | | | | | | 0.87 | | | | | | 564 | | | | | | 1.20 | | | | | | 1.93 | | | | | | 0.77 | | | | | | 157 | |
| | | 10.18 | | | | | | 1.62 | | | | | | 166,129 | | | | | | 0.46 | | | | | | 0.84 | | | | | | 1.50 | | | | | | 157 | |
| | | 10.18 | | | | | | 1.53 | | | | | | 206 | | | | | | 0.55 | | | | | | 0.93 | | | | | | 1.43 | | | | | | 157 | |
| | | 10.18 | | | | | | 1.02 | | | | | | 10 | | | | | | 1.03 | | | | | | 1.44 | | | | | | 0.91 | | | | | | 157 | |
| | | 10.17 | | | | | | 3.69 | | | | | | 870 | | | | | | 0.79 | | | | | | 1.89 | | | | | | 1.05 | | | | | | 707 | |
| | | 10.17 | | | | | | 3.19 | | | | | | 174 | | | | | | 1.17 | | | | | | 1.83 | | | | | | 0.75 | | | | | | 707 | |
| | | 10.18 | | | | | | 4.04 | | | | | | 78,696 | | | | | | 0.45 | | | | | | 1.67 | | | | | | 1.42 | | | | | | 707 | |
| | | 10.18 | | | | | | 3.94 | | | | | | 152 | | | | | | 0.54 | | | | | | 1.51 | | | | | | 1.32 | | | | | | 707 | |
| | | 10.18 | | | | | | 3.40 | | | | | | 10 | | | | | | 1.06 | | | | | | 2.74 | | | | | | 0.77 | | | | | | 707 | |
| | |
| The accompanying notes are an integral part of these financial statements. | | 115 |
GOLDMAN SACHS SHORT-TERM CONSERVATIVE INCOME FUND
Financial Highlights
Selected Data for a Share Outstanding Throughout Each Period
| | | | | | | | | | | | | | | | | | | | | | | | | | | | | | |
| | | | | | | | From
Investment Operations | | | Distributions
to shareholders | |
| | | Year - Share Class | | Net asset
value,
beginning
of period | | | Net
investment
income(a) | | | Net realized
and unrealized
gain | | | Total from
investment
operations | | | From net
investment
income | | | From net
realized
gains | | | Total
distributions | |
| | FOR THE SIX MONTHS ENDED SEPTEMBER 30, (UNAUDITED) | |
| | 2017 - A | | $ | 10.02 | | | $ | 0.05 | | | $ | — | (d) | | $ | 0.05 | | | $ | (0.05 | ) | | $ | — | | | $ | (0.05 | ) |
| | 2017 - Institutional | | | 10.02 | | | | 0.07 | | | | — | (d) | | | 0.07 | | | | (0.07 | ) | | | — | | | | (0.07 | ) |
| | 2017 - Administration | | | 10.02 | | | | 0.06 | | | | 0.01 | | | | 0.07 | | | | (0.06 | ) | | | — | | | | (0.06 | ) |
| | 2017 - Preferred | | | 10.02 | | | | 0.06 | | | | — | (d) | | | 0.06 | | | | (0.06 | ) | | | — | | | | (0.06 | ) |
| | | | | | | | | | | | | | | | | | | | | | | | | | | | | | |
| | FOR THE FISCAL YEARS ENDED MARCH 31, | |
| | 2017 - A (commenced October 31, 2016) | | | 10.01 | | | | 0.03 | | | | 0.01 | | | | 0.04 | | | | (0.03 | ) | | | — | (f) | | | (0.03 | ) |
| | 2017 - Institutional | | | 10.00 | | | | 0.11 | | | | 0.01 | | | | 0.12 | | | | (0.10 | ) | | | — | (f) | | | (0.10 | ) |
| | 2017 - Administration | | | 10.00 | | | | 0.06 | | | | 0.04 | | | | 0.10 | | | | (0.08 | ) | | | — | (f) | | | (0.08 | ) |
| | 2017 - Preferred (commenced October 31, 2016) | | | 10.01 | | | | 0.04 | | | | 0.01 | | | | 0.05 | | | | (0.04 | ) | | | — | (f) | | | (0.04 | ) |
| | 2016 - Institutional | | | 10.00 | | | | 0.06 | | | | — | (d) | | | 0.06 | | | | (0.06 | ) | | | — | (f) | | | (0.06 | ) |
| | 2016 - Administration | | | 10.00 | | | | 0.04 | | | | — | (d) | | | 0.04 | | | | (0.04 | ) | | | — | (f) | | | (0.04 | ) |
| | 2015 - Institutional | | | 10.00 | | | | 0.03 | | | | 0.01 | | | | 0.04 | | | | (0.04 | ) | | | — | | | | (0.04 | ) |
| | 2015 - Administration | | | 10.00 | | | | 0.01 | | | | — | (d) | | | 0.01 | | | | (0.01 | ) | | | — | | | | (0.01 | ) |
| | 2014 - Institutional | | | 10.00 | | | | — | (d) | | | — | (d) | | | — | | | | — | | | | — | | | | — | |
| | 2014 - Administration | | | 10.00 | | | | — | (d) | | | — | (d) | | | — | | | | — | | | | — | | | | — | |
| | (a) | | Calculated based on the average shares outstanding methodology. |
| | (b) | | Assumes investment at the NAV at the beginning of the period, reinvestment of all dividends and distributions, a complete redemption of the investment at the NAV at the end of the period and no sales or redemption charges. Total returns would be reduced if a sales or redemption charge was taken into account. Returns do not reflect the impact of taxes to shareholder relating to Fund distributions or the redemption of Fund shares. Total returns for periods less than one full year are not annualized. |
| | (c) | | The Fund’s portfolio turnover rate is calculated in accordance with regulatory requirements, without regard to transactions involving short term investments and certain derivatives. If such transactions were included, the Fund’s portfolio turnover rate may be higher. |
| | (d) | | Amount is less than $0.005 per share. |
| | (f) | | Rounds to less than $0.01 per share. |
| | |
| 116 | | The accompanying notes are an integral part of these financial statements. |
GOLDMAN SACHS SHORT-TERM CONSERVATIVE INCOME FUND
| | | | | | | | | | | | | | | | | | | | | | | | | | | | | | | | | | | | | | | | |
| | | | | | | | | | | | | | | | | | | | | | | | | | | | | | | | | | |
| | | Net asset
value, end
of period | | | | | Total
return(b) | | | | | Net assets,
end of
period
(in 000s) | | | | | Ratio of
net expenses
to average
net assets | | | | | Ratio of
total expenses
to average
net assets | | | | | Ratio of
net investment
income (loss)
to average
net assets | | | | | Portfolio
turnover
rate(c) | |
| | | | | | | | | | | | | | | | | | | | | | | | | | | | | | | | | | | | | | | | |
| | $ | 10.02 | | | | | | 0.50 | % | | | | $ | 25 | | | | | | 0.52 | %(e) | | | | | 0.71 | %(e) | | | | | 0.99 | %(e) | | | | | 18 | % |
| | | 10.02 | | | | | | 0.68 | | | | | | 1,298,898 | | | | | | 0.16 | (e) | | | | | 0.37 | (e) | | | | | 1.38 | (e) | | | | | 18 | |
| | | 10.03 | | | | | | 0.66 | | | | | | 952 | | | | | | 0.41 | (e) | | | | | 0.62 | (e) | | | | | 1.12 | (e) | | | | | 18 | |
| | | 10.02 | | | | | | 0.63 | | | | | | 25 | | | | | | 0.27 | (e) | | | | | 0.48 | (e) | | | | | 1.22 | (e) | | | | | 18 | |
| | | | | | | | | | | | | | | | | | | | | | | | | | | | | | | | | | | | | | | | |
| | | | | | | | | | | | | | | | | | | | | | | | | | | | | | | | | | | | | | | | |
| | | 10.02 | | | | | | 0.42 | | | | | | 25 | | | | | | 0.51 | (e) | | | | | 1.33 | (e) | | | | | 0.75 | (e) | | | | | 46 | |
| | | 10.02 | | | | | | 1.22 | | | | | | 265,690 | | | | | | 0.15 | | | | | | 1.20 | | | | | | 1.08 | | | | | | 46 | |
| | | 10.02 | | | | | | 0.97 | | | | | | 132 | | | | | | 0.41 | | | | | | 1.49 | | | | | | 0.60 | | | | | | 46 | |
| | | 10.02 | | | | | | 0.52 | | | | | | 25 | | | | | | 0.27 | (e) | | | | | 1.11 | (e) | | | | | 0.95 | (e) | | | | | 46 | |
| | | 10.00 | | | | | | 0.61 | | | | | | 15,082 | | | | | | 0.19 | | | | | | 2.10 | | | | | | 0.63 | | | | | | 39 | |
| | | 10.00 | | | | | | 0.37 | | | | | | 25 | | | | | | 0.43 | | | | | | 2.44 | | | | | | 0.35 | | | | | | 39 | |
| | | 10.00 | | | | | | 0.36 | | | | | | 100,009 | | | | | | 0.19 | | | | | | 4.62 | | | | | | 0.35 | | | | | | 40 | |
| | | 10.00 | | | | | | 0.10 | | | | | | 25 | | | | | | 0.42 | | | | | | 4.87 | | | | | | 0.12 | | | | | | 40 | |
| | | 10.00 | | | | | | — | | | | | | 9,976 | | | | | | 0.19 | (e) | | | | | 4.30 | (e) | | | | | 0.10 | (e) | | | | | — | |
| | | 10.00 | | | | | | — | | | | | | 25 | | | | | | 0.44 | (e) | | | | | 4.55 | (e) | | | | | (0.15 | )(e) | | | | | — | |
| | |
| The accompanying notes are an integral part of these financial statements. | | 117 |
GOLDMAN SACHS SHORT DURATION AND GOVERNMENT FIXED INCOME FUNDS
Notes to Financial Statements
September 30, 2017 (Unaudited)
Goldman Sachs Trust (the “Trust”) is a Delaware statutory trust registered under the Investment Company Act of 1940, as amended (the “Act”), as an open-end management investment company. The following table lists those series of the Trust that are included in this report (collectively, the “Funds” or individually a “Fund”), along with their corresponding share classes and respective diversification status under the Act:
| | | | |
| Fund | | Share Classes Offered | | Diversified/
Non-diversified |
Enhanced Income | | A, Institutional, Administration, Investor and R6 | | Diversified |
Government Income | | A, C, Institutional, Service, Investor, R and R6 | | Diversified |
High Quality Floating Rate | | A, Institutional, Service, Investor and R6 | | Diversified |
Inflation Protected Securities | | A, C, Institutional, Investor, R and R6 | | Diversified |
Short Duration Government | | A, C, Institutional, Service, Investor and R6 | | Diversified |
Short Duration Income | | A, C, Institutional, Investor, R and R6 | | Diversified |
Short-Term Conservative Income | | A, Institutional, Administration and Preferred | | Diversified |
Class A Shares of the Enhanced Income, Government Income, High Quality Floating Rate, Inflation Protected Securities, Short Duration Government, Short Duration Income and Short-Term Conservative Income Funds are sold with a front-end sales charge of up to 1.50%, 3.75%, 1.50%, 3.75%, 1.50%, 1.50% and 1.50%, respectively. Class C Shares are sold with a contingent deferred sales charge (“CDSC”) of 1.00% (0.65% for Short Duration Government and Short Duration Income Funds), which is imposed on redemptions made within 12 months of purchase. Institutional, Administration, Preferred, Service, Investor, Class R and Class R6 Shares are not subject to a sales charge. Previously, Investor Shares were known as Class IR Shares.
Goldman Sachs Asset Management, L.P. (“GSAM”), an affiliate of Goldman Sachs & Co. LLC (formerly, Goldman, Sachs & Co.) (“Goldman Sachs”), serves as investment adviser to the Funds pursuant to management agreements (the “Agreements”) with the Trust.
|
| 2. SIGNIFICANT ACCOUNTING POLICIES |
The financial statements have been prepared in accordance with accounting principles generally accepted in the United States of America (“GAAP”) and require management to make estimates and assumptions that may affect the reported amounts and disclosures. Actual results may differ from those estimates and assumptions.
A. Investment Valuation — The Funds’ valuation policy is to value investments at fair value.
B. Investment Income and Investments — Investment income includes interest income, dividend income, and securities lending income. Interest income is accrued daily and adjusted for amortization of premiums and accretion of discounts. Dividend income is recognized on ex-dividend date or, for certain foreign securities, as soon as such information is obtained subsequent to the ex-dividend date. Investment transactions are reflected on trade date. Realized gains and losses are calculated using identified cost. Investment transactions are recorded on the following business day for daily net asset value (“NAV”) calculations. The Funds may file withholding tax reclaims in certain jurisdictions to recover a portion of amounts previously withheld. Any foreign capital gains tax is accrued daily based upon the net unrealized gains, and is payable upon sale of such investments. Distributions received from the Funds’ investments in U.S. real estate investment trusts (“REITs”) may be characterized as ordinary income, net capital gain or a return of capital. A return of capital is recorded by the Funds as a reduction to the cost basis of the REIT. For derivative contracts, realized gains and losses are recorded upon settlement of the contract. Upfront payments, if any, are made or received upon entering into a swap agreement and are reflected in the Statements of Assets and Liabilities. Upfront payments are recognized
118
GOLDMAN SACHS SHORT DURATION AND GOVERNMENT FIXED INCOME FUNDS
|
| 2. SIGNIFICANT ACCOUNTING POLICIES (continued) |
over the contract’s term/event as realized gains or losses, with the exception of forward starting interest rate swaps whose realized gains or losses are recognized from the effective start date. For securities with paydown provisions, principal payments received are treated as a proportionate reduction to the cost basis of the securities, and excess or shortfall amounts are recorded as income. For treasury inflation protected securities (“TIPS”), adjustments to principal due to inflation/deflation are reflected as increases/decreases to interest income with a corresponding adjustment to cost.
C. Class Allocations and Expenses — Investment income, realized and unrealized gain (loss), if any, and non-class specific expenses of each Fund are allocated daily based upon the proportion of net assets of each class. Non-class specific expenses directly incurred by a Fund are charged to that Fund, while such expenses incurred by the Trust are allocated across the applicable Funds on a straight-line and/or pro-rata basis depending upon the nature of the expenses. Class specific expenses, where applicable, are borne by the respective share classes and include Distribution and Service, Transfer Agency and Service and Shareholder Administration fees.
D. Federal Taxes and Distributions to Shareholders — It is each Fund’s policy to comply with the requirements of the Internal Revenue Code of 1986, as amended (the “Code”), applicable to regulated investment companies (mutual funds) and to distribute each year substantially all of its investment company taxable income and capital gains to its shareholders. Accordingly, the Funds are not required to make any provisions for the payment of federal income tax. Distributions to shareholders are recorded on the ex-dividend date. Income and capital gains distributions, if any, are declared and paid according to the following schedule:
| | | | | | | | |
| | | Investment Income Dividends | | | | Capital Gains Distributions |
| Fund | | Declared | | Paid | | | | Declared and Paid |
Enhanced Income | | Daily | | Monthly | | | | Annually |
High Quality Floating Rate | | Daily | | Monthly | | | | Annually |
Short Duration Government | | Daily | | Monthly | | | | Annually |
Inflation Protected Securities | | Quarterly | | Quarterly | | | | Annually |
Government Income | | Daily | | Monthly | | | | Annually |
Short Duration Income | | Daily | | Monthly | | | | Annually |
Short-Term Conservative Income | | Daily | | Monthly | | | | Annually |
Net capital losses, if any, are carried forward to future fiscal years and may be used to the extent allowed by the Code to offset any future capital gains. Losses that are carried forward will retain their character as either short-term or long-term capital losses. Utilization of capital loss carryforwards will reduce the requirement of future capital gains distributions.
The characterization of distributions to shareholders for financial reporting purposes is determined in accordance with federal income tax rules, which may differ from GAAP. The source of each Fund’s distributions may be shown in the accompanying financial statements as either from net investment income, net realized gain or capital. Certain components of the Funds’ net assets on the Statements of Assets and Liabilities reflect permanent GAAP/tax differences based on the appropriate tax character.
E. Foreign Currency Translation — The accounting records and reporting currency of the Funds are maintained in U.S. dollars. Assets and liabilities denominated in foreign currencies are translated into U.S. dollars using the current exchange rates at the close of each business day. The effect of changes in foreign currency exchange rates on investments is included within net realized and unrealized gain (loss) on investments. Changes in the value of other assets and liabilities as a result of fluctuations in foreign exchange rates are included in the Statements of Operations within net change in unrealized gain (loss) on foreign currency translations. Transactions denominated in foreign currencies are translated into U.S. dollars on the date the transaction occurred, the effects of which are included within net realized gain (loss) on foreign currency transactions.
119
GOLDMAN SACHS SHORT DURATION AND GOVERNMENT FIXED INCOME FUNDS
Notes to Financial Statements (continued)
September 30, 2017 (Unaudited)
|
| 3. INVESTMENTS AND FAIR VALUE MEASUREMENTS |
U.S. GAAP defines the fair value of a financial instrument as the amount that would be received to sell an asset or paid to transfer a liability in an orderly transaction between market participants at the measurement date (i.e., the exit price); the Funds’ policy is to use the market approach. GAAP establishes a fair value hierarchy that prioritizes the inputs to valuation techniques used to measure fair value. The hierarchy gives the highest priority to unadjusted quoted prices in active markets for identical assets or liabilities (Level 1 measurements) and the lowest priority to unobservable inputs (Level 3 measurements). The levels used for classifying investments are not necessarily an indication of the risk associated with investing in these investments. The three levels of the fair value hierarchy are described below:
Level 1 — Unadjusted quoted prices in active markets that are accessible at the measurement date for identical, unrestricted assets or liabilities;
Level 2 — Quoted prices in markets that are not active or financial instruments for which significant inputs are observable (including, but not limited to, quoted prices for similar investments, interest rates, foreign exchange rates, volatility and credit spreads), either directly or indirectly;
Level 3 — Prices or valuations that require significant unobservable inputs (including GSAM’s assumptions in determining fair value measurement).
Changes in valuation techniques may result in transfers into or out of an assigned level within the hierarchy. In accordance with the Funds’ policy, transfers between different levels of the fair value hierarchy resulting from such changes are deemed to have occurred as of the beginning of the reporting period.
The Board of Trustees (“Trustees”) has approved Valuation Procedures that govern the valuation of the investments held by the Funds, including investments for which market quotations are not readily available. The Trustees have delegated to GSAM day-to-day responsibility for implementing and maintaining internal controls and procedures related to the valuation of the Funds’ portfolio investments. To assess the continuing appropriateness of pricing sources and methodologies, GSAM regularly performs price verification procedures and issues challenges as necessary to third party pricing vendors or brokers, and any differences are reviewed in accordance with the Valuation Procedures.
A. Level 1 and Level 2 Fair Value Investments — The valuation techniques and significant inputs used in determining the fair values for investments classified as Level 1 and Level 2 are as follows:
Money Market Funds — Investments in the Goldman Sachs Financial Square Government Fund (“Underlying Fund”) are valued at the NAV of the Institutional Share class on the day of valuation. These investments are generally classified as Level 1 of the fair value hierarchy. For information regarding an Underlying Fund’s accounting policies and investment holdings, please see the Underlying Fund’s shareholder report.
Debt Securities — Debt securities for which market quotations are readily available are valued daily on the basis of quotations supplied by dealers or an independent pricing service approved by the Trustees. The pricing services may use valuation models or matrix pricing, which consider: (i) yield or price with respect to bonds that are considered comparable in characteristics such as rating, interest rate and maturity date or (ii) quotations from securities dealers to determine current value. With the exception of treasury securities of G8 countries, which are generally classified as Level 1, these investments are generally classified as Level 2 of the fair value hierarchy.
i. Inverse Floaters — The interest rate on inverse floating rate securities (“inverse floaters”) resets in the opposite direction from the market rate of interest to which the inverse floaters are indexed. An inverse floater may be considered to be leveraged to the extent that its interest rate varies by a magnitude that exceeds the magnitude of the change in the index rate of interest. The higher the degree of leverage of an inverse floater, the greater the volatility of its market value
ii. Mortgage-Backed and Asset-Backed Securities — Mortgage-backed securities represent direct or indirect participations in, or are collateralized by and payable from, mortgage loans secured by residential and/or commercial real estate property. Asset-backed securities include securities whose principal and interest payments are collateralized by pools of other assets or receivables. The value of certain mortgage-backed and asset-backed securities (including adjustable rate
120
GOLDMAN SACHS SHORT DURATION AND GOVERNMENT FIXED INCOME FUNDS
|
| 3. INVESTMENTS AND FAIR VALUE MEASUREMENTS (continued) |
mortgage loans) may be particularly sensitive to changes in prevailing interest rates. The value of these securities may also fluctuate in response to the market’s perception of the creditworthiness of the issuers.
Asset-backed securities may present credit risks that are not presented by mortgage-backed securities because they generally do not have the benefit of a security interest in collateral that is comparable to mortgage assets. Some asset-backed securities may only have a subordinated claim on collateral.
Stripped mortgage-backed securities are usually structured with two different classes: one that receives substantially all interest payments (interest-only, or “IO” and/or high coupon rate with relatively low principal amount, or “IOette”), and the other that receives substantially all principal payments (principal-only, or “PO”) from a pool of mortgage loans. Little to no principal will be received at the maturity of an IO; as a result, periodic adjustments are recorded to reduce the cost of the security until maturity. These adjustments are included in interest income.
iii. Mortgage Dollar Rolls — Mortgage dollar rolls are transactions whereby a Fund sells mortgage-backed-securities and simultaneously contracts with the same counterparty to repurchase similar securities on a specified future date. During the settlement period, a Fund will not be entitled to accrue interest and receive principal payments on the securities sold. The Funds account for mortgage dollar roll transactions as purchases and sales and realize gains and losses on these transactions
iv. Structured Notes — The values of structured notes are based on the price movements of a reference security or index. Upon termination, a Fund will receive a payment from the issuer based on the value of the referenced instrument (notional amount multiplied by price of the referenced instrument) and record a realized gain or loss.
v. Treasury Inflation Protected Securities — TIPS are treasury securities in which the principal amount is adjusted daily to keep pace with inflation, as measured by the U.S. Consumer Pricing Index for Urban Consumers. The repayment of the original bond principal upon maturity is guaranteed by the full faith and credit of the U.S. Government.
vi. When-Issued Securities and Forward Commitments — When-issued securities, including TBA (“To Be Announced”) securities, are securities that are authorized but not yet issued in the market and purchased in order to secure what is considered to be an advantageous price or yield to a Fund. A forward commitment involves entering into a contract to purchase or sell securities, typically on an extended settlement basis, for a fixed price at a future date. The purchase of securities on a when-issued or forward commitment basis involves a risk of loss if the value of the security to be purchased declines before the settlement date. Conversely, the sale of securities on a forward commitment basis involves the risk that the value of the securities sold may increase before the settlement date. Although a Fund will generally purchase securities on a when-issued or forward commitment basis with the intention of acquiring the securities for its portfolio, the Fund may dispose of when-issued securities or forward commitments prior to settlement, which may result in a realized gain or loss.
vii. Commercial Paper — Commercial paper normally represents short-term unsecured promissory notes issued in bearer form by banks or bank holding companies, corporations, finance companies and other issuers. Commercial paper consists of direct U.S. dollar-denominated obligations of domestic or foreign issuers. Asset-backed commercial paper is issued by a special purpose entity that is organized to issue the commercial paper and to purchase trade receivables or other financial assets.
Derivative Contracts — A derivative is an instrument whose value is derived from underlying assets, indices, reference rates or a combination of these factors. A Fund enters into derivative transactions to hedge against changes in interest rates, securities prices, and/or currency exchange rates, to increase total return, or to gain access to certain markets or attain exposure to other underliers.
Exchange-traded derivatives, including futures and options contracts, are valued at the last sale or settlement price and typically fall within Level 1 of the fair value hierarchy. Over-the-counter (“OTC”) and centrally cleared derivatives are valued using market transactions and other market evidence, including market-based inputs to models, calibration to market-clearing transactions, broker or dealer quotations, or other alternative pricing sources. Where models are used, the selection of a particular model to value OTC and centrally cleared derivatives depends upon the contractual terms of, and specific risks inherent in, the instrument, as well as the availability of pricing information in the market. Valuation models require a variety of inputs, including contractual terms, market prices, yield curves, credit curves, measures of volatility, voluntary and involuntary
121
GOLDMAN SACHS SHORT DURATION AND GOVERNMENT FIXED INCOME FUNDS
Notes to Financial Statements (continued)
September 30, 2017 (Unaudited)
|
| 3. INVESTMENTS AND FAIR VALUE MEASUREMENTS (continued) |
prepayment rates, loss severity rates and correlations of such inputs. For OTC and centrally cleared derivatives that trade in liquid markets, model inputs can generally be verified and model selection does not involve significant management judgment. OTC and centrally cleared derivatives are classified within Level 2 of the fair value hierarchy when significant inputs are corroborated by market evidence.
i. Forward Contracts — A forward contract is a contract between two parties to buy or sell an asset at a specified price on a future date. A forward contract settlement can occur on a cash or delivery basis. Forward contracts are marked-to-market daily using independent vendor prices, and the change in value, if any, is recorded as an unrealized gain or loss. Cash and certain investments may be used to collateralize forward contracts.
A forward foreign currency exchange contract is a forward contract in which a Fund agrees to receive or deliver a fixed quantity of one currency for another, at a pre-determined price at a future date. All forward foreign currency exchange contracts are marked-to-market daily at the applicable forward rate. Non-deliverable forward foreign currency exchange contracts are settled with the counterparty in cash without the delivery of foreign currency.
ii. Futures Contracts — Futures contracts are contracts to buy or sell a standardized quantity of a specified commodity or security and are valued based on exchanged settlement prices or independent market quotes. Futures contracts are valued at the last settlement price, or in the absence of a sale, the last bid price for long positions and at the last ask price for short positions, at the end of each day on the board of trade or exchange upon which they are traded. Upon entering into a futures contract, a Fund deposits cash or securities in an account on behalf of the broker in an amount sufficient to meet the initial margin requirement. Subsequent payments are made or received by a Fund equal to the daily change in the contract value and are recorded as variation margin receivable or payable with a corresponding offset to unrealized gains or losses. For financial reporting purposes, cash collateral that has been pledged to cover obligations of a Fund and cash collateral received, if any, is reported separately on the Statement of Assets and Liabilities as receivables/payables for collateral on certain derivatives contracts. Non-cash collateral pledged by a Fund, if any, is noted in the Schedule of Investments.
iii. Option Contracts — When a Fund writes call or put options, an amount equal to the premium received is recorded as a liability and is subsequently marked-to-market to reflect the current value of the option written. Swaptions are options on interest rate swap contracts.
Upon the purchase of a call option or a put option by a Fund, the premium paid is recorded as an investment and subsequently marked-to-market to reflect the current value of the option. Certain options may be purchased with premiums to be determined on a future date. The premiums for these options are based upon implied volatility parameters at specified terms.
iv. Swap Contracts — Bilateral swap contracts are agreements in which a Fund and a counterparty agree to exchange periodic payments on a specified notional amount or make a net payment upon termination. Bilateral swap transactions are privately negotiated in the OTC market and payments are settled through direct payments between a Fund and the counterparty. By contrast, certain swap transactions are subject to mandatory central clearing. These swaps are executed through a derivatives clearing member (“DCM”), acting in an agency capacity, and submitted to a central counterparty (“CCP”) (“centrally cleared swaps”), in which case all payments are settled with the CCP through the DCM. Swaps are marked-to-market daily using pricing vendor quotations, counterparty or clearinghouse prices or model prices, and the change in value, if any, is recorded as an unrealized gain or loss. Upon entering into a swap contract, a Fund is required to satisfy an initial margin requirement by delivering cash or securities to the counterparty (or in some cases, segregated in a triparty account on behalf of the counterparty), which can be adjusted by any mark-to-market gains or losses pursuant to bilateral or centrally cleared arrangements. For centrally cleared swaps the daily change in valuation, if any, is recorded as a receivable or payable for variation margin.
An interest rate swap is an agreement that obligates two parties to exchange a series of cash flows at specified intervals, based upon or calculated by reference to changes in interest rates on a specified notional principal amount. The payment flows are usually netted against each other, with the difference being paid by one party to the other.
122
GOLDMAN SACHS SHORT DURATION AND GOVERNMENT FIXED INCOME FUNDS
|
| 3. INVESTMENTS AND FAIR VALUE MEASUREMENTS (continued) |
A credit default swap is an agreement that involves one party (the buyer of protection) making a stream of payments to another party (the seller of protection) in exchange for the right to receive protection on a reference security or obligation, including a group of assets or exposure to the performance of an index. A Fund’s investment in credit default swaps may involve greater risks than if the Fund had invested in the referenced obligation directly. Credit events are contract specific but may include bankruptcy, failure to pay, restructuring and obligation acceleration. If a Fund buys protection through a credit default swap and no credit event occurs, its payments are limited to the periodic payments previously made to the counterparty. Upon the occurrence of a specified credit event, a Fund, as a buyer of credit protection, is entitled to receive an amount equal to the notional amount of the swap and deliver to the seller the defaulted reference obligation in a physically settled trade. A Fund may also receive a net settlement amount in the form of cash or securities equal to the notional amount of the swap reduced by the recovery value of the reference obligation in a cash settled trade.
As a seller of protection, a Fund generally receives a payment stream throughout the term of the swap, provided that there is no credit event. In addition, if a Fund sells protection through a credit default swap, a Fund could suffer a loss because the value of the referenced obligation and the premium payments received may be less than the notional amount of the swap paid to the buyer of protection. Upon the occurrence of a specified credit event, a Fund, as a seller of credit protection, may be required to take possession of the defaulted reference obligation and pay the buyer an amount equal to the notional amount of the swap in a physically settled trade. A Fund may also pay a net settlement amount in the form of cash or securities equal to the notional amount of the swap reduced by the recovery value of the reference obligation in a cash settled trade. Recovery values are at times established through the credit event auction process in which market participants are ensured that a transparent price has been set for the defaulted security or obligation. In addition, a Fund is entitled to a return of any assets, which have been pledged as collateral to the counterparty upon settlement.
The maximum potential amount of future payments (undiscounted) that a Fund as seller of protection could be required to make under a credit default swap would be an amount equal to the notional amount of the agreement. These potential amounts would be partially offset by any recovery values of the respective referenced obligations or net amounts received from a settlement of a credit default swap for the same reference security or obligation where a Fund bought credit protection.
Repurchase Agreements — Repurchase agreements involve the purchase of securities subject to the seller’s agreement to repurchase the securities at a mutually agreed upon date and price, under the terms of a Master Repurchase Agreement (“MRA”). During the term of a repurchase agreement, the value of the underlying securities held as collateral on behalf of a Fund, including accrued interest, is required to exceed the value of the repurchase agreement, including accrued interest. The gross value of repurchase agreements is included in the Statement of Assets and Liabilities for financial reporting purposes. The underlying securities for all repurchase agreements are held at the Funds’ custodian or designated sub-custodians under tri-party repurchase agreements.
An MRA governs transactions between a Fund and select counterparties. An MRA contains provisions for, among other things, initiation of the transaction, income payments, events of default and maintenance of securities for repurchase agreements. An MRA also permits offsetting with collateral to create one single net payment in the event of default or similar events, including the bankruptcy or insolvency of a counterparty.
If the seller defaults, a Fund could suffer a loss to the extent that the proceeds from the sale of the underlying securities and other collateral held by the Fund are less than the repurchase price and the Fund’s costs associated with delay and enforcement of the repurchase agreement. In addition, in the event of default or insolvency of the seller, a court could determine that a Fund’s interest in the collateral is not enforceable, resulting in additional losses to the Fund.
Pursuant to exemptive relief granted by the Securities and Exchange Commission (“SEC”) and terms and conditions contained therein, the Funds, together with other funds of the Trust and registered investment companies having management agreements with GSAM or its affiliates, may transfer uninvested cash into joint accounts, the daily aggregate balance of which is invested in one or more repurchase agreements. Under these joint accounts, the Funds maintain pro-rata credit exposure to the underlying repurchase agreements’ counterparties. With the exception of certain transaction fees, the Funds are not subject to any expenses in relation to these investments.
123
GOLDMAN SACHS SHORT DURATION AND GOVERNMENT FIXED INCOME FUNDS
Notes to Financial Statements (continued)
September 30, 2017 (Unaudited)
|
| 3. INVESTMENTS AND FAIR VALUE MEASUREMENTS (continued) |
B. Level 3 Fair Value Investments — To the extent that significant inputs to valuation models and other alternative pricing sources are unobservable, or if quotations are not readily available, or if GSAM believes that such quotations do not accurately reflect fair value, the fair value of the Funds’ investments may be determined under Valuation Procedures approved by the Trustees. GSAM, consistent with its procedures and applicable regulatory guidance, may make an adjustment to the most recent valuation prices of either domestic or foreign securities in light of significant events to reflect what it believes to be the fair value of the securities at the time of determining a Fund’s NAV. Significant events which could affect a large number of securities in a particular market may include, but are not limited to: significant fluctuations in U.S. or foreign markets; market dislocations; market disruptions; or unscheduled market closings. Significant events which could also affect a single issuer may include, but are not limited to: corporate actions such as reorganizations, mergers and buy-outs; ratings downgrades; and bankruptcies.
To the extent investments are valued using single source broker quotations obtained directly from the broker or passed through from third party pricing vendors, such investments are classified as Level 3 investments.
GSAM did not develop the unobservable inputs (examples include but are not limited to single source broker quotations, third party pricing, etc.) for the valuation of Level 3 Assets and Liabilities.
C. Fair Value Hierarchy — The following is a summary of the Funds’ investments and derivatives classified in the fair value hierarchy as of September 30, 2017:
| | | | | | | | | | | | |
|
| ENHANCED INCOME | |
| | | |
| Investment Type | | Level 1 | | | Level 2 | | | Level 3 | |
| Assets | | | | | | | | | | | | |
Fixed Income | | | | | | | | | | | | |
Corporate Obligations | | $ | — | | | $ | 293,301,818 | | | $ | — | |
Mortgage-Backed Obligations | | | — | | | | 6,540,064 | | | | — | |
Asset-Backed Securities | | | — | | | | 96,517,973 | | | | — | |
Municipal Debt Obligation | | | — | | | | 957,656 | | | | — | |
U.S. Treasury Obligations | | | 65,725,307 | | | | — | | | | — | |
Investment Company | | | 68,129,485 | | | | — | | | | — | |
Short-term Investments | | | — | | | | 83,303,715 | | | | — | |
| Total | | $ | 133,854,792 | | | $ | 480,621,226 | | | $ | — | |
| | | |
| Derivative Type | | | | | | | | | |
| Assets(a) | | | | | | | | | | | | |
Futures Contracts | | $ | 1,484,596 | | | $ | — | | | $ | — | |
| Liabilities(a) | | | | | | | | | | | | |
Futures Contracts | | $ | (31,998 | ) | | $ | — | | | $ | — | |
124
GOLDMAN SACHS SHORT DURATION AND GOVERNMENT FIXED INCOME FUNDS
|
| 3. INVESTMENTS AND FAIR VALUE MEASUREMENTS (continued) |
| | | | | | | | | | | | |
| | | |
| GOVERNMENT INCOME | | | | | | | | | | | | |
| | | |
| Investment Type | | Level 1 | | | Level 2 | | | Level 3 | |
| Assets | | | | | | | | | | | | |
Fixed Income | | | | | | | | | | | | |
Corporate Obligations | | $ | — | | | $ | 3,473,438 | | | $ | — | |
Mortgage-Backed Obligations | | | — | | | | 148,583,060 | | | | — | |
U.S. Treasury Obligations and/or Other U.S. Government Agencies | | | 145,568,745 | | | | 35,593,438 | | | | — | |
Asset-Backed Securities | | | — | | | | 39,140,203 | | | | — | |
Municipal Debt Obligations | | | — | | | | 7,015,317 | | | | — | |
Investment Company | | | 20,262,525 | | | | — | | | | — | |
| Total | | $ | 165,831,270 | | | $ | 233,805,456 | | | $ | — | |
| Liabilities | | | | | | | | | | | | |
Fixed Income | | | | | | | | | | | | |
Mortgage-Backed Obligations — Forward Sales Contracts | | $ | — | | | $ | (17,591,485 | ) | | $ | — | |
| | | |
| Derivative Type | | | | | | | | | |
| Assets | | | | | | | | | | | | |
Options Purchased | | $ | 32,163 | | | $ | — | | | $ | — | |
Futures Contracts(a) | | | 199,215 | | | | — | | | | — | |
Interest Rate Swap Contracts(a) | | | — | | | | 1,309,880 | | | | — | |
| Total | | $ | 231,378 | | | $ | 1,309,880 | | | $ | — | |
| Liabilities(a) | | | | | | | | | | | | |
Futures Contracts | | $ | (371,146 | ) | | $ | — | | | $ | — | |
Interest Rate Swap Contracts | | | — | | | | (32,209 | ) | | | — | |
| Total | | $ | (371,146 | ) | | $ | (32,209 | ) | | $ | — | |
| | | |
| HIGH QUALITY FLOATING RATE | | | | | | | | | | | | |
| | | |
| Investment Type | | Level 1 | | | Level 2 | | | Level 3 | |
| Assets | | | | | | | | | | | | |
Fixed Income | | | | | | | | | | | | |
Corporate Obligations | | $ | — | | | $ | 799,742 | | | $ | — | |
Mortgage-Backed Obligations | | | — | | | | 335,471,527 | | | | — | |
U.S. Treasury Obligations and/or Other U.S. Government Agencies | | | 18,974,441 | | | | 4,089,440 | | | | — | |
Asset-Backed Securities | | | — | | | | 319,868,006 | | | | — | |
Municipal Debt Obligations | | | — | | | | 17,970,056 | | | | — | |
Short-term Investments | | | — | | | | 27,100,000 | | | | — | |
| Total | | $ | 18,974,441 | | | $ | 705,298,771 | | | $ | — | |
125
GOLDMAN SACHS SHORT DURATION AND GOVERNMENT FIXED INCOME FUNDS
Notes to Financial Statements (continued)
September 30, 2017 (Unaudited)
|
| 3. INVESTMENTS AND FAIR VALUE MEASUREMENTS (continued) |
| | | | | | | | | | | | |
| | | |
| HIGH QUALITY FLOATING RATE (continued) | | | | | | | | | | | | |
| | | |
| Derivative Type | | Level 1 | | | Level 2 | | | Level 3 | |
| Assets(a) | | | | | | | | | | | | |
Futures Contracts | | $ | 547,844 | | | $ | — | | | $ | — | |
| Liabilities(a) | | | | | | | | | | | | |
Futures Contracts | | $ | (373,322 | ) | | $ | — | | | $ | — | |
| | | |
| INFLATION PROTECTED SECURITIES | | | | | | | | | | | | |
| | | |
| Investment Type | | Level 1 | | | Level 2 | | | Level 3 | |
| Assets | | | | | | | | | | | | |
Fixed Income | | | | | | | | | | | | |
U.S. Treasury Obligations | | $ | 342,331,466 | | | $ | — | | | $ | — | |
Investment Company | | | 5,846,883 | | | | — | | | | — | |
| Total | | $ | 348,178,349 | | | $ | — | | | $ | — | |
| | | |
| Derivative Type | | | | | | | | | |
| Assets | | | | | | | | | | | | |
Options Purchased | | $ | 16,275 | | | $ | — | | | $ | — | |
Futures Contracts(a) | | | 1,019,484 | | | | — | | | | — | |
Interest Rate Swap Contracts(a) | | | — | | | | 1,524,372 | | | | — | |
| Total | | $ | 1,035,759 | | | $ | 1,524,372 | | | $ | — | |
| Liabilities(a) | | | | | | | | | | | | |
Futures Contracts | | $ | (919,196 | ) | | $ | — | | | $ | — | |
Interest Rate Swap Contracts | | | — | | | | (1,364,488 | ) | | | — | |
| Total | | $ | (919,196 | ) | | $ | (1,364,488 | ) | | $ | — | |
| | | |
| SHORT DURATION GOVERNMENT | | | | | | | | | | | | |
| | | |
| Investment Type | | Level 1 | | | Level 2 | | | Level 3 | |
| Assets | | | | | | | | | | | | |
Fixed Income | | | | | | | | | | | | |
Corporate Obligations | | $ | — | | | $ | 11,237,595 | | | $ | — | |
Mortgage-Backed Obligations | | | — | | | | 486,683,811 | | | | — | |
U.S. Treasury Obligations and/or Other U.S. Government Agencies | | | 506,890,943 | | | | 59,234,761 | | | | — | |
Asset-Backed Securities | | | — | | | | 1,368,430 | | | | — | |
Investment Company | | | 34,770,975 | | | | — | | | | — | |
| Total | | $ | 541,661,918 | | | $ | 558,524,597 | | | $ | — | |
126
GOLDMAN SACHS SHORT DURATION AND GOVERNMENT FIXED INCOME FUNDS
|
| 3. INVESTMENTS AND FAIR VALUE MEASUREMENTS (continued) |
| | | | | | | | | | | | |
| | | |
| SHORT DURATION GOVERNMENT (continued) | | | | | | | | | | | | |
| | | |
| Derivative Type | | Level 1 | | | Level 2 | | | Level 3 | |
| Assets(a) | | | | | | | | | | | | |
Futures Contracts | | $ | 3,538,493 | | | $ | — | | | $ | — | |
Interest Rate Swap Contracts | | | — | | | | 4,167,873 | | | | — | |
| Total | | $ | 3,538,493 | | | $ | 4,167,873 | | | $ | — | |
| Liabilities(a) | | | | | | | | | | | | |
Futures Contracts | | $ | (2,395,657 | ) | | $ | — | | | $ | — | |
Interest Rate Swap Contracts | | | — | | | | (72,666 | ) | | | — | |
| Total | | $ | (2,395,657 | ) | | $ | (72,666 | ) | | $ | — | |
| | | |
| SHORT DURATION INCOME | | | | | | | | | | | | |
| | | |
| Investment Type | | Level 1 | | | Level 2 | | | Level 3 | |
| Assets | | | | | | | | | | | | |
Fixed Income | | | | | | | | | | | | |
Corporate Obligations | | $ | — | | | $ | 333,473,655 | | | $ | — | |
Mortgage-Backed Obligations | | | — | | | | 76,267,665 | | | | 738,091 | |
U.S. Treasury Obligations and/or Other U.S. Government Agencies | | | 26,576,354 | | | | 2,689,591 | | | | — | |
Asset-Backed Securities | | | — | | | | 155,240,222 | | | | — | |
Foreign Debt Obligations | | | — | | | | 10,644,000 | | | | — | |
Structured Notes | | | — | | | | 3,969,869 | | | | — | |
Municipal Debt Obligations | | | — | | | | 16,804,120 | | | | — | |
Investment Company | | | 6,812,687 | | | | — | | | | — | |
Short-term Investments | | | — | | | | 7,686,360 | | | | — | |
| Total | | $ | 33,389,041 | | | $ | 606,775,482 | | | $ | 738,091 | |
| | | |
| Derivative Type | | | | | | | | | |
| Assets | |
Options Purchased | | $ | 59,675 | | | $ | 296 | | | $ | — | |
Forward Foreign Currency Exchange Contracts(a) | | | — | | | | 1,551,123 | | | | — | |
Futures Contracts(a) | | | 354,479 | | | | — | | | | — | |
Interest Rate Swap Contracts(a) | | | — | | | | 1,672,270 | | | | — | |
| Total | | $ | 414,154 | | | $ | 3,223,689 | | | $ | — | |
| Liabilities(a) | |
Forward Foreign Currency Exchange Contracts | | $ | — | | | $ | (2,000,366 | ) | | $ | — | |
Futures Contracts | | | (1,437,830 | ) | | | — | | | | — | |
Interest Rate Swap Contracts | | | — | | | | (567,118 | ) | | | — | |
Credit Default Swap Contracts | | | — | | | | (211,481 | ) | | | — | |
| Total | | $ | (1,437,830 | ) | | $ | (2,778,965 | ) | | $ | — | |
127
GOLDMAN SACHS SHORT DURATION AND GOVERNMENT FIXED INCOME FUNDS
Notes to Financial Statements (continued)
September 30, 2017 (Unaudited)
|
| 3. INVESTMENTS AND FAIR VALUE MEASUREMENTS (continued) |
| | | | | | | | | | | | |
| | | |
| SHORT-TERM CONSERVATIVE INCOME | | | | | | | | | | | | |
| | | |
| Investment Type | | Level 1 | | | Level 2 | | | Level 3 | |
| Assets | | | | | | | | | | | | |
Fixed Income | | | | | | | | | | | | |
Corporate Obligations | | $ | — | | | $ | 532,293,968 | | | $ | — | |
Mortgage-Backed Obligations | | | — | | | | 8,001,112 | | | | — | |
Investment Company | | | 40,930,813 | | | | — | | | | — | |
Short-term Investments | | | — | | | | 782,394,063 | | | | — | |
| Total | | $ | 40,930,813 | | | $ | 1,322,689,143 | | | $ | — | |
| (a) | | Amount shown represents unrealized gain (loss) at period end. |
For further information regarding security characteristics, see the Schedules of Investments.
|
| 4. INVESTMENTS IN DERIVATIVES |
The following tables set forth, by certain risk types, the gross value of derivative contracts as of September 30, 2017. These instruments were used as part of the Funds’ investment strategies and to obtain and/or manage exposure related to the risks below. The values in the tables below exclude the effects of cash collateral received or posted pursuant to these derivative contracts, and therefore are not representative of the Funds’ net exposure.
| | | | | | | | | | | | |
| | | |
| Enhanced Income | | | | | | | | | | |
| Risk | | Statements of Assets
and Liabilities | | Assets | | | Statements of Assets
and Liabilities | | Liabilities | |
Interest rate | | Variation margin on futures contracts | | $ | 1,484,596 | (a) | | Variation margin on futures contracts | | $ | (31,998) | (a) |
| | | |
| Government Income | | | | | | | | | | |
| Risk | | Statements of Assets
and Liabilities | | Assets | | | Statements of Assets
and Liabilities | | Liabilities | |
Interest rate | | Receivable for unrealized gain on swap contracts; Variation margin on futures contracts | | $ | 1,509,095 | (a) | | Payable for unrealized loss on swap contracts; Variation margin on futures contracts | | $ | (403,355) | (a) |
Interest Rate | | Purchased Options at value | | | 32,163 | | | — | | | — | |
| Total | | $ | 1,541,258 | | | | | $ | (403,355) | |
| | | |
| High Quality Floating Rate | | | | | | | | | | |
| Risk | | Statements of Assets
and Liabilities | | Assets | | | Statements of Assets
and Liabilities | | Liabilities | |
Interest rate | | Variation margin on futures contracts | | $ | 547,844 | (a) | | Variation margin on futures contracts | | $ | (373,322) | (a) |
128
GOLDMAN SACHS SHORT DURATION AND GOVERNMENT FIXED INCOME FUNDS
|
| 4. INVESTMENTS IN DERIVATIVES (continued) |
| | | | | | | | | | | | |
| | | |
| Inflation Protected Securities | | | | | | | | | | |
| Risk | | Statements of Assets
and Liabilities | | Assets | | | Statements of Assets
and Liabilities | | Liabilities | |
Interest rate | | Receivable for unrealized gain on swap contracts; Variation margin on futures contracts | | $ | 2,543,860 | (a) | | Payable for unrealized loss on swap contracts; Variation margin on futures contracts | | $ | (2,283,684) | (a) |
Currency | | Purchased Options at value | | $ | 16,275 | | | — | | | — | |
| Total | | $ | 2,560,135 | | | | | $ | (2,283,684) | |
| | | |
| Short Duration Government | | | | | | | | | | |
| Risk | | Statements of Assets
and Liabilities | | Assets | | | Statements of Assets
and Liabilities | | Liabilities | |
Interest rate | | Receivable for unrealized gain on swap contracts; Variation margin on futures contracts | | $ | 7,706,367 | (a) | | Payable for unrealized loss on swap contracts; Variation margin on futures contracts | | $ | (2,468,323) | (a) |
| Total | | $ | 7,706,367 | | | | | $ | (2,468,323) | |
| | | |
| Short Duration Income Fund | | | | | | | | | | |
| Risk | | Statements of Assets
and Liabilities | | Assets | | | Statements of Assets
and Liabilities | | Liabilities | |
Interest rate | | Variation margin on futures contracts | | $ | 2,026,749 | (a) | | Variation margin on futures contracts | | $ | (2,004,948) | (a) |
Credit | | — | | | — | | | Payable for unrealized loss on swap contracts | | | (211,481) | |
Currency | | Receivable for unrealized gain on forward foreign currency exchange contracts; Options Purchased | | | 1,611,094 | (a) | | Payable for unrealized loss on forward foreign currency exchange contracts | | | (2,000,366) | |
| Total | | | | | $3,637,843 | | | | | | (4,216,795) | |
| (a) | | Includes unrealized gain (loss) on futures contracts and centrally cleared swaps described in the Additional Investment Information sections of the Schedules of Investments. Only current day’s variation margin is reported within the Statements of Assets and Liabilities. |
The following tables set forth, by certain risk types, the Funds’ gains (losses) related to these derivatives and their indicative volumes for the six months ended September 30, 2017. These gains (losses) should be considered in the context that these derivative contracts may have been executed to create investment opportunities and/or economically hedge certain investments, and accordingly, certain gains (losses) on such derivative contracts may offset certain (losses) gains attributable to investments. These gains (losses) are included in “Net realized gain (loss)” or “Net change in unrealized gain (loss)” on the Statements of Operations:
| | | | | | | | | | | | | | |
| | | |
| Enhanced Income | | | | | | | | | | | | |
| Risk | | Statements of Operations | | Net Realized
Gain (Loss) | | | Net
Change in
Unrealized
Gain (Loss) | | | Average
Number of
Contracts(a) | |
| Interest rate | | Net realized gain (loss) from futures contracts/Net change in unrealized gain (loss) on futures contracts | | $ | (577,775 | ) | | $ | 545,368 | | | | 1,545 | |
129
GOLDMAN SACHS SHORT DURATION AND GOVERNMENT FIXED INCOME FUNDS
Notes to Financial Statements (continued)
September 30, 2017 (Unaudited)
|
| 4. INVESTMENTS IN DERIVATIVES (continued) |
| | | | | | | | | | | | | | |
| | | |
| Government Income | | | | | | | | | | | | |
| Risk | | Statements of Operations | | Net Realized
Gain (Loss) | | | Net Change in
Unrealized
Gain (Loss) | | | Average
Number of
Contracts(a) | |
| Interest rate | | Net realized gain (loss) from futures contracts and swap contract/Net change in unrealized gain (loss) on futures contracts and swap contracts | | $ | 605,002 | | | $ | (875,858 | ) | | | 448 | |
| | | |
| High Quality Floating Rate | | | | | | | | | | | | |
| Risk | | Statements of Operations | | Net Realized
Gain (Loss) | | | Net Change in
Unrealized
Gain (Loss) | | | Average
Number of
Contracts(a) | |
| Interest rate | | Net realized gain (loss) from futures contracts and swap contracts /Net change in unrealized gain (loss) on futures contracts and swap contracts | | $ | 408,041 | | | $ | 186,504 | | | | 661 | |
| | | |
| Inflation Protected Securities | | | | | | | | | | | | |
| Risk | | Statements of Operations | | Net Realized
Gain (Loss) | | | Net Change in
Unrealized
Gain (Loss) | | | Average
Number of
Contracts(a) | |
| Interest rate | | Net realized gain (loss) from purchased options, futures contracts, swap contracts; Net change in unrealized gain (loss) on purchased options, futures contracts, swap contracts, | | $ | (987,934 | ) | | $ | (191,337 | ) | | | 1,648 | |
| | | |
| Short Duration Government | | | | | | | | | | | | |
| Risk | | Statements of Operations | | Net Realized
Gain (Loss) | | | Net Change in
Unrealized
Gain (Loss) | | | Average
Number of
Contracts(a) | |
| Interest rate | | Net realized gain (loss) from futures contracts and swap contracts /Net change in unrealized gain (loss) on futures contracts and swap contracts | | $ | 21,530 | | | $ | (5,073,687 | ) | | | 9,617 | |
| | | |
| Short Duration Income | | | | | | | | | | | | |
| Risk | | Statements of Operations | | Net
Realized
Gain (Loss) | | | Net Change in
Unrealized
Gain (Loss) | | | Average
Number of
Contracts(a) | |
| Interest rate | | Net realized gain (loss) from futures contracts and swap contracts /Net change in unrealized gain (loss) on futures contracts and swap contracts | | $ | (1,034,170 | ) | | $ | (978,814 | ) | | | 2,300 | |
| Credit | | Net realized gain (loss) from swap contracts /Net change in unrealized gain (loss) on swap contracts | | | (366,880 | ) | | | (245,574 | ) | | | 2 | |
| Currency | | Net realized gain (loss) from forward foreign currency exchange contracts/Net change in unrealized gain (loss) on forward foreign currency exchange contracts | | | (2,762,369 | ) | | | 2,311,294 | | | | 845 | |
| | | $ | (4,163,419 | ) | | $ | 1,086,906 | | | | 3,147 | |
| (a) | | Average number of contracts is based on the average of month end balances for the fiscal period ended September 30, 2017. |
In order to better define its contractual rights and to secure rights that will help a Fund mitigate its counterparty risk, a Fund may enter into an International Swaps and Derivatives Association, Inc. Master Agreement (“ISDA Master Agreement”) or similar agreement with its derivatives counterparties. An ISDA Master Agreement is a bilateral agreement between a Fund and a counterparty that governs OTC derivatives (including forward foreign currency exchange contracts, and certain options and swaps), and typically contains, among other things, collateral posting terms and netting provisions in the event of a default and/or termination event. The provisions of the ISDA Master Agreement typically permit a single net payment in the event of a default (close-out netting) or similar event, including the bankruptcy or insolvency of the counterparty.
130
GOLDMAN SACHS SHORT DURATION AND GOVERNMENT FIXED INCOME FUNDS
|
| 4. INVESTMENTS IN DERIVATIVES (continued) |
Collateral and margin requirements differ between exchange traded derivatives and OTC derivatives. Margin requirements are established by the broker or clearing house for exchange-traded and centrally cleared derivatives (financial futures contracts, options and centrally cleared swaps) pursuant to governing agreements for those instrument types. Brokers can ask for margin in excess of the minimum in certain circumstances. Collateral terms are contract-specific for OTC derivatives. For derivatives traded under an ISDA Master Agreement, the collateral requirements are typically calculated by netting the marked to market amount for each transaction under such agreement and comparing that amount to the value of any collateral currently pledged by a Fund and the counterparty. Additionally, a Fund may be required to post initial margin to the counterparty, the terms of which would be outlined in the confirmation of the OTC transaction.
For financial reporting purposes, cash collateral that has been pledged to cover obligations of a Fund and cash collateral received from the counterparty, if any, is reported separately on the Statements of Assets and Liabilities as receivables/payables for collateral on certain derivative contracts. Non-cash collateral pledged by a Fund, if any, is noted in the Schedules of Investments. Generally, the amount of collateral due from or to a counterparty must exceed a minimum transfer amount threshold before a transfer is required to be made. To the extent amounts due to a Fund from its counterparties are not fully collateralized, contractually or otherwise, the Fund bears the risk of loss from counterparty nonperformance. A Fund attempts to mitigate counterparty risk by only entering into agreements with counterparties that the Investment Adviser believes to be of good standing and by monitoring the financial stability of those counterparties.
Additionally, the netting of assets and liabilities and the offsetting of collateral pledged or received are based on contractual netting/set-off provisions in the ISDA Master Agreement or similar agreements. However, in the event of a default or insolvency of a counterparty, a court could determine that such rights are not enforceable due to the restrictions or prohibitions against the right of setoff that may be imposed in accordance with a particular jurisdiction’s bankruptcy or insolvency laws.
|
| 5. AGREEMENTS AND AFFILIATED TRANSACTIONS |
A. Management Agreement — Under the Agreement, GSAM manages the Funds, subject to the general supervision of the Trustees.
As compensation for the services rendered pursuant to the Agreement, the assumption of the expenses related thereto and administration of the Funds’ business affairs, including providing facilities, GSAM is entitled to a management fee, accrued daily and paid monthly, equal to an annual percentage rate of each Fund’s average daily net assets.
For the six months ended September 30, 2017, contractual and effective net management fees with GSAM were at the following rates:
| | | | | | | | | | | | | | | | | | | | | | | | | | | | | | |
| | | | | Contractual Management Rate | | | Effective Net
Management
Rate | |
| Fund | | | | First
$1 billion | | | Next
$1 billion | | | Next
$3 billion | | | Next
$3 billion | | | Over
$8 billion | | | Effective
Rate | | |
Enhanced Income | | | | | 0.25 | % | | | 0.23 | % | | | 0.22 | % | | | 0.22 | % | | | 0.22 | % | | | 0.25 | % | | | 0.24 | %# |
Government Income | | | | | 0.53 | | | | 0.48 | | | | 0.45 | | | | 0.44 | | | | 0.44 | | | | 0.54 | | | | 0.53 | # |
High Quality Floating Rate | | | | | 0.31 | | | | 0.28 | | | | 0.27 | | | | 0.26 | | | | 0.25 | | | | 0.36 | | | | 0.31 | # |
Inflation Protected Securities | | | | | 0.26 | | | | 0.23 | | | | 0.22 | | | | 0.22 | | | | 0.21 | | | | 0.30 | | | | 0.26 | # |
Short Duration Government | | | | | 0.44 | | | | 0.40 | | | | 0.38 | | | | 0.37 | | | | 0.36 | | | | 0.47 | | | | 0.43 | # |
Short Duration Income | | | | | 0.40 | | | | 0.36 | | | | 0.34 | | | | 0.33 | | | | 0.32 | | | | 0.40 | | | | 0.40 | |
Short-Term Conservative Income | | | | | 0.25 | | | | 0.25 | | | | 0.25 | | | | 0.25 | | | | 0.25 | | | | 0.25 | | | | 0.14 | #* |
| # | | GSAM agreed to waive a portion of its management fee rates, set forth in the Funds’ most recent prospectuses. In addition, the Effective Net Management Rate includes the impact of management fee waivers of affiliated underlying funds, if any. These waivers will be effective through at least July 28, 2018, and prior to such date GSAM may not terminate the arrangements without the approval of the Trustees. |
| * | | From July 28, 2017 through October 31, 2017, the Investment Adviser agreed to waive a portion of its management fee in order to achieve an effective net management fee rate of 0.15% as an annual percentage rate for the Fund’s average daily net assets. Upon the expiration of this arrangement, the Investment Adviser has agreed to waive a portion of its management fee in order to achieve an effective net management fee rate of 0.19% as an annual percentage rate for the Fund’s average daily net assets. This arrangement will remain in effect through at least July 28, 2018. |
131
GOLDMAN SACHS SHORT DURATION AND GOVERNMENT FIXED INCOME FUNDS
Notes to Financial Statements (continued)
September 30, 2017 (Unaudited)
|
| 5. AGREEMENTS AND AFFILIATED TRANSACTIONS (continued) |
Prior to July 28, 2017, the Government Income Fund’s management fee rate was 0.54% on the first $1 billion of average daily net assets, 0.49% on the next $1 billion of average daily net assets, 0.46% on the next $3 billion of average daily net assets, 0.45% on the next $3 billion of average daily net assets, and 0.44% on amounts over $8 billion of average daily net assets. Prior to July 28, 2017, the High Quality Floating Rate Fund’s management fee rate was 0.40% on the first $1 billion of average daily net assets, 0.36% on the next $1 billion of average daily net assets, 0.34% on the next $6 billion of average daily net assets, and 0.33% on amounts over $8 billion of average daily net assets. Prior to July 28, 2017, the Inflation Protected Securities Fund’s management fee rate was 0.33% on the first $1 billion of average daily net assets, 0.30% on the next $1 billion of average daily net assets, 0.28% on the next $6 billion of average daily net assets, and 0.27% on amounts over $8 billion of average daily net assets. Prior to July 28, 2017, the Short Duration Government Fund’s management fee rate was 0.50% on the first $1 billion of average daily net assets, 0.45% on the next $1 billion of average daily net assets, 0.43% on the next $3 billion of average daily net assets, 0.42% on the next $3 billion of average daily net assets, and 0.41% on amounts over $8 billion of average daily net assets.
The Funds invest in Institutional Shares of the Goldman Sachs Financial Square Government Fund, which is an affiliated Underlying Fund. GSAM has agreed to waive a portion of its management fee payable by the Funds in an amount equal to the management fee it earns as an investment adviser to the affiliated Underlying Funds in which the Funds invest. For the six months ended September 30, 2017, the management fee waived by GSAM was for each Fund as follows:
| | | | | | |
| Fund | | | | Management Fee
Waived | |
Enhanced Income | | | | $ | 20,871 | |
Government Income | | | | | 9,695 | |
Inflation Protected Securities | | | | | 6,521 | |
Short Duration Government | | | | | 23,102 | |
Short Duration Income | | | | | 5,245 | |
Short-Term Conservative Income | | | | | 13,691 | |
B. Distribution and/or Service (12b-1) Plans — The Trust, on behalf of Class A and Class R Shares of each applicable Fund, has adopted Distribution and Service Plans subject to Rule 12b-1 under the Act. Under the Distribution and Service Plans, Goldman Sachs, which serves as distributor (the “Distributor”), is entitled to a fee accrued daily and paid monthly for distribution services and personal and account maintenance services, which may then be paid by Goldman Sachs to authorized dealers. These fees are equal to an annual percentage rate of the average daily net assets attributable to Class A or Class R Shares of the Funds, as applicable, as set forth below.
The Trust, on behalf of Class C Shares of each applicable Fund, has adopted a Distribution Plan subject to Rule 12b-1 under the Act. Under the Distribution Plan, Goldman Sachs as Distributor is entitled to a fee accrued daily and paid monthly for distribution services, which may then be paid by Goldman Sachs to authorized dealers. These fees are equal to an annual percentage rate of the average daily net assets attributable to Class C Shares of the Funds, as set forth below.
The Trust, on behalf of Service Shares of each applicable Fund, has adopted a Service Plan subject to Rule 12b-1 under the Act to allow Service Shares to compensate service organizations (including Goldman Sachs) for providing personal and account maintenance services to their customers who are beneficial owners of such shares. The Service Plan provides for compensation to
132
GOLDMAN SACHS SHORT DURATION AND GOVERNMENT FIXED INCOME FUNDS
|
| 5. AGREEMENTS AND AFFILIATED TRANSACTIONS (continued) |
the service organizations equal to an annual percentage rate of the average daily net assets attributable to Services Shares of the Funds as set forth below.
| | | | | | | | | | | | | | | | |
| | | Distribution and Service Plan Rates | |
| | | Class A* | | | Class C | | | Class R* | | | Service | |
Distribution Plan | | | 0.25 | % | | | 0.75 | % | | | 0.50 | % | | | — | |
Service Plan | | | — | | | | — | | | | — | | | | 0.25 | % |
| * | | With respect to Class A and Class R Shares, the Distributor at its discretion may use compensation for distribution services paid under the Distribution Plan to compensate service organizations for personal and account maintenance services and expenses as long as such total compensation does not exceed the maximum capon “service fees” imposed by the Financial Industry Regulatory Authority. |
Goldman Sachs has agreed to waive a portion of the distribution and service fees applicable to the Short Duration Government Fund’s and Short Duration Income Fund’s Class C Shares in an amount equal to 0.35% of the average daily net assets attributable to Class C Shares of the respective Funds. These arrangements will remain in place through July 28, 2018, for Short Duration Government and Short Duration Income Funds. Prior to such date Goldman Sachs may not terminate the arrangement without the approval of the Trustees.
C. Distribution Agreement — Goldman Sachs, as Distributor of the shares of the Funds pursuant to a Distribution Agreement, may retain a portion of the Class A Shares’ front end sales charge and Class C Shares’ CDSC. For the six months ended September 30, 2017, Goldman Sachs advised that it retained the following amounts:
| | | | | | | | | | |
| | | | | Front End
Sales Charge | | | Contingent
Deferred Sales
Charge | |
| Fund | | | | Class A | | | Class C | |
Enhanced Income | | | | $ | 31 | | | | N/A | |
Government Income | | | | | 2,808 | | | $ | 56 | |
High Quality Floating Rate | | | | | 225 | | | | N/A | |
Inflation Protected Securities | | | | | 512 | | | | — | |
Short Duration Government | | | | | 1,225 | | | | — | |
Short Duration Income | | | | | 137 | | | | — | |
Short-Term Conservative Income | | | | | — | | | | N/A | |
D. Administration, Service and/or Shareholder Administration Plans — The Trust, on behalf of each applicable Fund, has adopted Administration, Service and/or Shareholder Administration Plans to allow Administration, Preferred, Class C and Service Shares, as applicable, to compensate service organizations (including Goldman Sachs) for providing varying levels of account administration and/or personal and account maintenance services to their customers who are beneficial owners of such shares. The Administration, Service and Shareholder Administration Plans each provide for compensation to the service organizations equal to an annual percentage rate of 0.25%, 0.10%, 0.25% and 0.25% of the average daily net assets attributable to Administration, Preferred, Class C or Service Shares of the Funds, as applicable.
E. Transfer Agency Agreement — Goldman Sachs also serves as the transfer agent of the Funds for a fee pursuant to the Transfer Agency Agreement. The fees charged for such transfer agency services are accrued daily and paid monthly at annual rates as follows: 0.13% of the average daily net assets of Class A, Class C, Investor and Class R Shares; 0.03% of the average daily net assets of Class R6 Shares; and 0.04% of the average daily net assets of Institutional and Service Shares.
133
GOLDMAN SACHS SHORT DURATION AND GOVERNMENT FIXED INCOME FUNDS
Notes to Financial Statements (continued)
September 30, 2017 (Unaudited)
|
| 5. AGREEMENTS AND AFFILIATED TRANSACTIONS (continued) |
Goldman Sachs has agreed to waive a portion of its transfer agency fee equal to 0.03% as an annual percentage rate of the average daily net assets attributable to Institutional, Administration and Preferred Shares of the Short-Term Conservative Income Fund. This arrangement will remain in effect through at least July 28, 2018, and prior to such date, the Investment Adviser may not terminate the arrangement without the approval of the Board of Trustees.
F. Other Expense Agreements and Affiliated Transactions — GSAM has agreed to limit certain “Other Expenses” of the Funds (excluding acquired fund fees and expenses, transfer agency fees and expenses, service fees and shareholder administration fees (as applicable), administration fees (as applicable), taxes, interest, brokerage fees, expenses of shareholder meetings, litigation, and indemnification and extraordinary expenses) to the extent such expenses exceed, on an annual basis, a percentage rate of the average daily net assets of each Fund. Such Other Expense reimbursements, if any, are accrued daily and paid monthly. In addition, the Funds are not obligated to reimburse GSAM for prior fiscal year expense reimbursements, if any. The Other Expense limitations as an annual percentage rate of average daily net assets for Enhanced Income, Government Income, High Quality Floating Rate, Inflation Protected Securities, Short Duration Government, Short Duration Income and Short-Term Conservative Income Funds are 0.064%, 0.004%, 0.014%, 0.044%, 0.004%, 0.014% and 0.004%, respectively. These Other Expense limitations will remain in place through at least July 28, 2018, and prior to such date GSAM may not terminate the arrangements without the approval of the Trustees. In addition, the Funds have entered into certain offset arrangements with the transfer agent, which may result in a reduction of the Funds’ expenses and are received irrespective of the application of the “Other Expense” limitations described above.
For the six months ended September 30, 2017, these expense reductions, including any fee waivers and Other Expense reimbursements, were as follows:
| | | | | | | | | | | | | | | | | | | | |
| Fund | | Management
Fee Waiver | | | Class C
Distribution &
Service Fees | | | Transfer Agency
Fee Waiver | | | Other
Expense
Reimbursements | | | Total
Expense
Reductions | |
Enhanced Income | | $ | 20,871 | | | $ | — | | | | N/A | | | $ | 20,303 | | | $ | 41,174 | |
Government Income | | | 21,426 | | | | — | | | | N/A | | | | 229,622 | | | | 251,048 | |
High Quality Floating Rate | | | 160,588 | | | | — | | | | N/A | | | | 157,127 | | | | 317,715 | |
Inflation Protected Securities | | | 81,757 | | | | — | | | | N/A | | | | 84,567 | | | | 166,324 | |
Short Duration Government | | | 215,254 | | | | 45,381 | | | | N/A | | | | 261,596 | | | | 522,231 | |
Short Duration Income | | | 5,245 | | | | — | | | | N/A | | | | 223,666 | | | | 228,911 | |
Short-Term Conservative Income | | | 323,972 | | | | | | | $ | 93,081 | | | | 225,959 | | | | 643,012 | |
G. Line of Credit Facility — As of September 30, 2017, the Funds participated in a $1,100,000,000 committed, unsecured revolving line of credit facility (the “facility”) together with other funds of the Trust and certain registered investment companies having management agreements with GSAM or its affiliates. This facility is to be used for temporary emergency purposes, or to allow for an orderly liquidation of securities to meet redemption requests. The interest rate on borrowings is based on the federal funds rate. The facility also requires a fee to be paid by the Funds based on the amount of the commitment that has not been utilized. For the six months ended September 30, 2017, the Funds did not have any borrowings under the facility.
H. Other Transactions with Affiliates — For the six months ended September 30, 2017, Goldman Sachs earned $3,957, $3,451, $3,543, $8,215, $26,843 and $25,225 in brokerage commissions from portfolio transactions, including futures transactions executed with Goldman Sachs as the Futures Commission Merchant, on behalf of the Enhanced Income, Government Income, High Quality Floating Rate, Inflation Protected Securities, Short Duration Government and Short Duration Income Funds respectively.
134
GOLDMAN SACHS SHORT DURATION AND GOVERNMENT FIXED INCOME FUNDS
|
| 5. AGREEMENTS AND AFFILIATED TRANSACTIONS (continued) |
As of September 30, 2017, The Goldman Sachs Group, Inc. was the beneficial owner of 5% or more of outstanding Class A, Class R and Class R6 Shares of the following Funds:
| | | | | | | | | | | | | | | | | | |
| Fund | | | | Class A | | | Class R | | | Class R6 | | | Preferred | |
Enhanced Income | | | | | — | % | | | — | % | | | 100 | % | | | — | % |
High Quality Floating Rate | | | | | — | | | | — | | | | 100 | | | | — | |
Short Duration Income | | | | | — | | | | 27 | | | | 100 | | | | — | |
Short-Term Conservative Income | | | | | 100 | | | | — | | | | — | | | | 100 | |
The table below shows the transactions in and earnings from investments in the Goldman Sachs Financial Square Government Fund for the six months ended September 30, 2017:
| | | | | | | | | | | | | | | | | | | | | | | | | | |
| Fund | | | | Beginning value
as of March 31,
2017 | | | Purchases
at Cost | | | Proceeds
from Sales | | | Ending Value
September 30,
2017 | | | Shares as of
September 30,
2017 | | | Dividend Income
from Affiliated
Investment Companies | |
Enhanced Income | | | | | 1,138 | | | $ | 315,892,853 | | | $ | (247,764,506 | ) | | $ | 68,129,485 | | | | 68,129,485 | | | $ | 110,017 | |
Government Income | | | | | 6,774,554 | | | | 68,814,543 | | | | (55,326,572 | ) | | | 20,262,525 | | | | 20,262,525 | | | | 49,232 | |
Inflation Protected Securities | | | | | 12,583,961 | | | | 64,479,565 | | | | (71,216,643 | ) | | | 5,846,883 | | | | 5,846,883 | | | | 34,729 | |
Short Duration Government | | | | | 55,325 | | | | 399,528,777 | | | | (364,813,127 | ) | | | 34,770,975 | | | | 34,770,975 | | | | 118,035 | |
Short Duration Income | | | | | 9,001 | | | | 210,766,142 | | | | (203,962,456 | ) | | | 6,812,687 | | | | 6,812,687 | | | | 24,721 | |
Short-Term Conservative Income | | | | | 20,184,970 | | | | 758,476,749 | | | | (737,730,906 | ) | | | 40,930,813 | | | | 40,930,813 | | | | 70,512 | |
|
| 6. PORTFOLIO SECURITIES TRANSACTIONS |
The cost of purchases and proceeds from sales and maturities of long-term securities for the six months ended September 30, 2017 were:
| | | | | | | | | | | | | | | | | | |
| Fund | | | | Purchases of U.S. Government and Agency Obligations | | | Purchases (Excluding U.S. Government and Agency Obligations) | | | Sales and Maturities of U.S. Government and Agency Obligations | | | Sales and Maturities (Excluding U.S. Government and Agency Obligations) | |
Enhanced Income | | | | $ | 49,844,520 | | | $ | 112,650,083 | | | $ | 57,754,258 | | | $ | 73,755,194 | |
Government Income | | | | | 109,970,549 | | | | 676,889,390 | | | | 110,646,253 | | | | 680,610,361 | |
High Quality Floating Rate | | | | | 3,716,650 | | | | 473,696,626 | | | | 8,406,818 | | | | 141,619,560 | |
Inflation Protected Securities | | | | | 271,092,022 | | | | — | | | | 233,690,365 | | | | — | |
Short Duration Government | | | | | 192,250,173 | | | | 278,370,113 | | | | 427,295,712 | | | | 326,140,647 | |
Short Duration Income | | | | | 151,805,901 | | | | 301,711,452 | | | | 181,490,540 | | | | 165,907,073 | |
Short-Term Conservative Income | | | | | — | | | | 421,695,393 | | | | — | | | | 37,062,360 | |
135
GOLDMAN SACHS SHORT DURATION AND GOVERNMENT FIXED INCOME FUNDS
Notes to Financial Statements (continued)
September 30, 2017 (Unaudited)
As of the Funds’ most recent Fiscal Year end, March 31, 2017, the Funds’ capital loss carryforwards and certain timing differences on a tax basis were as follows:
| | | | | | | | | | | | | | | | | | | | | | | | | | | | |
| | | Enhanced
Income | | | Government
Income | | | High Quality
Floating Rate | | | Inflation
Protected
Securities | | | Short
Duration
Government | | | Short
Duration
Income | | | Short-Term
Conservative
Income Fund | |
Capital loss carryforwards: | | | | | | | | | | | | | | | | | | | | | | | | | | | | |
Expiring 2018 | | $ | (1,658,767 | ) | | $ | — | | | $ | (21,924,176 | ) | | $ | — | | | $ | — | | | $ | — | | | $ | — | |
Expiring 2019 | | | (9,056,394 | ) | | | — | | | | (2,415,726 | ) | | | — | | | | — | | | | — | | | | — | |
Perpetual Short-Term | | | (2,734,357 | ) | | | — | | | | (3,563,835 | ) | | | — | | | | (16,424,692 | ) | | | (2,792,172 | ) | | | — | |
Perpetual Long-Term | | | (2,134,556 | ) | | | (2,911,095 | ) | | | (2,442,499 | ) | | | (10,058,885 | ) | | | (8,018,304 | ) | | | (960,476 | ) | | | — | |
Total capital loss carryforwards | | $ | (15,584,074 | ) | | $ | (2,911,095 | ) | | $ | (30,346,236 | ) | | $ | (10,058,885 | ) | | $ | (24,442,996 | ) | | $ | (3,752,648 | ) | | $ | — | |
Timing differences | | | | | | | | | | | | | | | | | | | | | | | | | | | | |
(Income Distributions Payable, Qualified Late Year Loss Deferral/Post October Loss Deferral and Straddle Loss Deferrals) | | $ | (315,920 | ) | | $ | (8,951,901 | ) | | $ | (89,115 | ) | | $ | (5,112,812 | ) | | $ | (2,280,647 | ) | | $ | (4,275,709 | ) | | $ | (630 | ) |
As of September 30, 2017, the Funds’ aggregate security unrealized gains and losses based on cost for U.S. federal income tax purposes were as follows:
| | | | | | | | | | | | | | | | | | | | | | | | | | | | |
| | | Enhanced
Income | | | Government
Income | | | High Quality
Floating Rate | | | Inflation
Protected
Securities | | | Short
Duration
Government | | | Short Duration
Income | | | Short-Term
Conservative
Income Fund | |
Tax Cost | | $ | 614,519,893 | | | $ | 399,605,465 | | | $ | 722,882,864 | | | $ | 347,824,272 | | | $ | 1,100,045,670 | | | $ | 639,373,785 | | | $ | 1,363,234,833 | |
Gross unrealized gain | | $ | 1,061,936 | | | $ | 5,147,759 | | | $ | 2,283,709 | | | $ | 1,140,895 | | | $ | 11,401,647 | | | $ | 4,245,457 | | | $ | 618,776 | |
Gross unrealized loss | | | (1,135,811 | ) | | | (5,116,498 | ) | | | (893,360 | ) | | | (786,818 | ) | | | (11,260,802 | ) | | | (2,716,628 | ) | | | (233,653 | ) |
Net unrealized gains (losses) | | $ | (73,875 | ) | | $ | 31,261 | | | $ | 1,390,349 | | | $ | 354,077 | | | $ | 140,845 | | | $ | 1,528,829 | | | $ | 385,123 | |
The difference between GAAP-basis and tax basis unrealized gains (losses) is attributable primarily to wash sales, net mark to market gains (losses) on regulated futures contracts and foreign currency contracts, and differences in the tax treatment of inflation protected securities, swap transactions, premium amortization and the accretion of market discount.
In order to present certain components of the Funds’ capital accounts on a tax-basis, certain reclassifications have been recorded to the Funds’ accounts. These reclassifications have no impact on the net asset value of the Funds and result primarily from difference in the tax treatment of swaps, return of capital, paydown gains and losses, inflation protected securities, foreign currency transactions, and premium/discount.
The Funds’ risks include, but are not limited to, the following:
Derivatives Risk — The Funds’ use of derivatives may result in loss. Derivative instruments, which may pose risks in addition to and greater than those associated with investing directly in securities, currencies or other instruments, may be illiquid or less liquid, volatile, difficult to price and leveraged so that small changes in the value of the underlying instruments may produce disproportionate losses to the Funds. Derivatives are also subject to counterparty risk, which is the risk that the other party in the transaction will not fulfill its contractual obligation. The use of derivatives is a highly specialized activity that involves investment techniques and risks different from those associated with investments in more traditional securities and instruments. Losses from
136
GOLDMAN SACHS SHORT DURATION AND GOVERNMENT FIXED INCOME FUNDS
|
| 8. OTHER RISKS (continued) |
derivatives can also result from a lack of correlation between changes in the value of derivative instruments and the portfolio assets (if any) being hedged.
Foreign Countries Risk — Investing in foreign markets may involve special risks and considerations not typically associated with investing in the United States. Foreign securities may be subject to risk of loss because of more or less foreign government regulation, less public information and less economic, political and social stability in the countries in which the Funds invest. The imposition of exchange controls, confiscations, trade restrictions (including tariffs) and other government restrictions by the United States or other governments, or from problems in share registration, settlement or custody, may also result in losses. Foreign risk also involves the risk of negative foreign currency rate fluctuations, which may cause the value of securities denominated in such foreign currency (or other instruments through which the Funds have exposure to foreign currencies) to decline in value. Currency exchange rates may fluctuate significantly over short periods of time. To the extent that the Funds also invest in securities of issuers located in emerging markets, these risks may be more pronounced.
Interest Rate Risk — When interest rates increase, fixed income securities or instruments held by the Funds will generally decline in value. Long-term fixed income securities or instruments will normally have more price volatility because of this risk than short-term fixed income securities or instruments. The risks associated with increasing rates are heightened given that interest rates are near historic lows, but may be expected to increase in the future with unpredictable effects on the markets and the Funds’ investments. Fluctuations in interest rates may also affect the liquidity of fixed income securities and instruments held by the Funds.
Large Shareholder Transactions Risk — A Fund may experience adverse effects when certain large shareholders, such as other funds, institutional investors (including those trading by use of non-discretionary mathematical formulas), financial intermediaries (who may make investment decisions on behalf of underlying clients and/or include a Fund in their investment model), individuals, accounts and Goldman Sachs affiliates, purchase or redeem large amounts of shares of a Fund. Such large shareholder redemptions may cause a Fund to sell portfolio securities at times when it would not otherwise do so, which may negatively impact a Fund’s NAV and liquidity. These transactions may also accelerate the realization of taxable income to shareholders if such sales of investments resulted in gains, and may also increase transaction costs. In addition, a large redemption could result in a Fund’s current expenses being allocated over a smaller asset base, leading to an increase in the Fund’s expense ratio. Similarly, large Fund share purchases may adversely affect a Fund’s performance to the extent that the Fund is delayed in investing new cash and is required to maintain a larger cash position than it ordinarily would.
Liquidity Risk — A Fund may make investments that are illiquid or that may become less liquid in response to market developments or adverse investor perceptions. Illiquid investments may be more difficult to value. Liquidity risk may also refer to the risk that a Fund will not be able to pay redemption proceeds within the allowable time period because of unusual market conditions, an unusually high volume of redemption requests, or other reasons. To meet redemption requests, a Fund may be forced to sell investments at an unfavorable time and/or under unfavorable conditions. Liquidity risk may be the result of, among other things, the reduced number and capacity of traditional market participants to make a market in fixed income securities or the lack of an active market. The potential for liquidity risk may be magnified by a rising interest rate environment or other circumstances where investor redemptions from fixed income mutual funds may be higher than normal, potentially causing increased supply in the market due to selling activity.
Market and Credit Risks — In the normal course of business, the Funds trade financial instruments and enter into financial transactions where risk of potential loss exists due to changes in the market (market risk). Additionally, the Funds may also be exposed to credit risk in the event that an issuer or guarantor fails to perform or that an institution or entity with which the Funds have unsettled or open transactions defaults.
State/Territory Specific Risk — A Fund’s investments in municipal obligations of issuers located in a particular state or U.S. territory may be adversely affected by political, economic and regulatory developments within that state or U.S. territory. Such developments may affect the financial condition of a state’s or territory’s political subdivisions, agencies, instrumentalities and public authorities and heighten the risks associated with investing in bonds issued by such parties, which could, in turn, adversely affect a Fund’s income, NAV, liquidity, and/or ability to preserve or realize capital appreciation.
137
GOLDMAN SACHS SHORT DURATION AND GOVERNMENT FIXED INCOME FUNDS
Notes to Financial Statements (continued)
September 30, 2017 (Unaudited)
Under the Trust’s organizational documents, its Trustees, officers, employees and agents are indemnified, to the extent permitted by the Act and state law, against certain liabilities that may arise out of performance of their duties to the Funds. Additionally, in the course of business, the Funds enter into contracts that contain a variety of indemnification clauses. The Funds’s maximum exposure under these arrangements is unknown, as this would involve future claims that may be made against the Funds that have not yet occurred. However, GSAM believes the risk of loss under these arrangements to be remote.
Subsequent events after the Statements of Assets and Liabilities date have been evaluated and GSAM has concluded that there is no impact requiring adjustment or disclosure in the financial statements.
138
GOLDMAN SACHS SHORT DURATION AND GOVERNMENT FIXED INCOME FUNDS
|
| 11. SUMMARY OF SHARE TRANSACTIONS |
| | | | | | | | | | | | | | | | |
| | | Enhanced Income Fund | |
| | | | |
| | | For the Six Months Ended
September 30, 2017
(Unaudited) | | | For the Fiscal Year Ended
March 31, 2017
| |
| | | | |
| | | Shares | | | Dollars | | | Shares | | | Dollars | |
| | | | |
| Class A Shares | |
Shares sold | | | 345,914 | | | $ | 3,263,268 | | | | 1,857,539 | | | $ | 17,507,617 | |
Reinvestment of distributions | | | 19,539 | | | | 184,312 | | | | 30,009 | | | | 282,967 | |
Shares redeemed | | | (459,239 | ) | | | (4,331,340 | ) | | | (1,881,726 | ) | | | (17,737,553 | ) |
| | | | (93,786 | ) | | | (883,760 | ) | | | 5,822 | | | | 53,031 | |
| Institutional Shares | |
Shares sold | | | 20,784,461 | | | | 195,873,354 | | | | 26,269,317 | | | | 247,264,987 | |
Reinvestment of distributions | | | 366,890 | | | | 3,457,410 | | | | 600,804 | | | | 5,658,892 | |
Shares redeemed | | | (4,968,522 | ) | | | (46,831,628 | ) | | | (25,689,052 | ) | | | (241,913,887 | ) |
| | | | 16,182,829 | | | | 152,499,136 | | | | 1,181,069 | | | | 11,009,992 | |
| Investor Shares | |
Shares sold | | | 284,675 | | | | 2,681,350 | | | | 164,095 | | | | 1,544,944 | |
Reinvestment of distributions | | | 1,764 | | | | 16,605 | | | | 1,230 | | | | 11,577 | |
Shares redeemed | | | (88,920 | ) | | | (837,584 | ) | | | (18,125 | ) | | | (170,657 | ) |
| | | | 197,519 | | | | 1,860,371 | | | | 147,200 | | | | 1,385,864 | |
| Administration Shares | |
Shares sold | | | 665 | | | | 6,285 | | | | 1,409 | | | | 13,317 | |
Reinvestment of distributions | | | 102 | | | | 967 | | | | 156 | | | | 1,470 | |
Shares redeemed | | | (1,329 | ) | | | (12,574 | ) | | | (31 | ) | | | (292 | ) |
| | | | (562 | ) | | | (5,322 | ) | | | 1,534 | | | | 14,495 | |
| Class R6 Shares | |
Reinvestment of distributions | | | 8 | | | | 74 | | | | 13 | | | | 122 | |
| | | | 8 | | | | 74 | | | | 13 | | | | 122 | |
NET INCREASE | | | 16,286,008 | | | $ | 153,470,499 | | | | 1,335,638 | | | $ | 12,463,504 | |
139
GOLDMAN SACHS SHORT DURATION AND GOVERNMENT FIXED INCOME FUNDS
Notes to Financial Statements (continued)
September 30, 2017 (Unaudited)
|
| 11. SUMMARY OF SHARE TRANSACTIONS (continued) |
| | | | | | | | | | | | | | | | |
| | | Government Income Fund | |
| | | | |
| | | For the Six Months Ended
September 30, 2017
(Unaudited) | | | For the Fiscal Year Ended
March 31, 2017
| |
| | | | |
| | | Shares | | | Dollars | | | Shares | | | Dollars | |
| | | | |
| Class A Shares | |
Shares sold | | | 706,107 | | | $ | 10,400,398 | | | | 2,339,231 | | | $ | 34,861,561 | |
Reinvestment of distributions | | | 60,425 | | | | 889,832 | | | | 147,912 | | | | 2,206,362 | |
Shares redeemed | | | (1,808,823 | ) | | | (26,625,859 | ) | | | (3,927,352 | ) | | | (58,319,497 | ) |
| | | | (1,042,291 | ) | | | (15,335,629 | ) | | | (1,440,209 | ) | | | (21,251,574 | ) |
| Class C Shares | |
Shares sold | | | 47,860 | | | | 705,580 | | | | 128,304 | | | | 1,918,650 | |
Reinvestment of distributions | | | 1,902 | | | | 28,000 | | | | 5,134 | | | | 76,594 | |
Shares redeemed | | | (140,477 | ) | | | (2,069,068 | ) | | | (363,745 | ) | | | (5,402,702 | ) |
| | | | (90,715 | ) | | | (1,335,488 | ) | | | (230,307 | ) | | | (3,407,458 | ) |
| Institutional Shares | |
Shares sold | | | 1,725,401 | | | | 25,378,531 | | | | 2,859,730 | | | | 42,444,540 | |
Reinvestment of distributions | | | 76,138 | | | | 1,119,598 | | | | 145,993 | | | | 2,173,070 | |
Shares redeemed | | | (1,073,590 | ) | | | (15,790,134 | ) | | | (3,970,697 | ) | | | (59,161,539 | ) |
| | | | 727,949 | | | | 10,707,995 | | | | (964,974 | ) | | | (14,543,929 | ) |
| Service Shares | |
Shares sold | | | 139,275 | | | | 2,046,626 | | | | 1,063,072 | | | | 15,891,144 | |
Reinvestment of distributions | | | 22,057 | | | | 323,920 | | | | 49,547 | | | | 736,597 | |
Shares redeemed | | | (642,412 | ) | | | (9,435,748 | ) | | | (1,098,798 | ) | | | (16,323,408 | ) |
| | | | (481,080 | ) | | | (7,065,202 | ) | | | 13,821 | | | | 304,333 | |
| Investor Shares | |
Shares sold | | | 16,553 | | | | 243,677 | | | | 174,833 | | | | 2,588,434 | |
Reinvestment of distributions | | | 2,865 | | | | 42,163 | | | | 6,455 | | | | 96,202 | |
Shares redeemed | | | (48,162 | ) | | | (708,849 | ) | | | (181,072 | ) | | | (2,674,055 | ) |
| | | | (28,744 | ) | | | (423,009 | ) | | | 216 | | | | 10,581 | |
| Class R Shares | |
Shares sold | | | 135,816 | | | | 1,998,425 | | | | 415,366 | | | | 6,180,039 | |
Reinvestment of distributions | | | 9,488 | | | | 139,538 | | | | 19,670 | | | | 292,887 | |
Shares redeemed | | | (162,027 | ) | | | (2,381,691 | ) | | | (440,427 | ) | | | (6,574,699 | ) |
| | | | (16,723 | ) | | | (243,728 | ) | | | (5,391 | ) | | | (101,773 | ) |
| Class R6 Shares | |
Shares sold | | | 311,717 | | | | 4,580,844 | | | | 1,434,687 | | | | 21,480,958 | |
Reinvestment of distributions | | | 2,474 | | | | 36,375 | | | | 2,564 | | | | 37,884 | |
Shares redeemed | | | (275,640 | ) | | | (4,052,643 | ) | | | (238,272 | ) | | | (3,502,014 | ) |
| | | | 38,551 | | | | 564,576 | | | | 1,198,979 | | | | 18,016,828 | |
NET DECREASE | | | (893,053 | ) | | $ | (13,130,485 | ) | | | (1,427,865 | ) | | $ | (20,972,992 | ) |
140
GOLDMAN SACHS SHORT DURATION AND GOVERNMENT FIXED INCOME FUNDS
|
| 11. SUMMARY OF SHARE TRANSACTIONS (continued) |
| | | | | | | | | | | | | | | | |
| | | High Quality Floating Rate Fund | |
| | | | |
| | | For the Six Months Ended
September 30, 2017
(Unaudited) | | | For the Fiscal Year Ended
March 31, 2017
| |
| | | | |
| | | Shares | | | Dollars | | | Shares | | | Dollars | |
| | | | |
| Class A Shares | |
Shares sold | | | 171,524 | | | $ | 1,495,750 | | | | 490,063 | | | $ | 4,255,096 | |
Reinvestment of distributions | | | 6,669 | | | | 58,169 | | | | 8,740 | | | | 75,835 | |
Shares redeemed | | | (221,586 | ) | | | (1,932,045 | ) | | | (439,772 | ) | | | (3,814,544 | ) |
| | | | (43,393 | ) | | | (378,126 | ) | | | 59,031 | | | | 516,387 | |
| Institutional Shares | |
Shares sold | | | 45,037,531 | | | | 392,465,275 | | | | 21,389,109 | | | | 185,639,848 | |
Reinvestment of distributions | | | 473,287 | | | | 4,125,778 | | | | 444,341 | | | | 3,853,445 | |
Shares redeemed | | | (12,425,432 | ) | | | (108,267,294 | ) | | | (14,439,282 | ) | | | (125,261,719 | ) |
| | | | 33,085,386 | | | | 288,323,759 | | | | 7,394,168 | | | | 64,231,574 | |
| Service Shares | |
Shares sold | | | 1,493 | | | | 13,152 | | | | 4,536 | | | | 39,548 | |
Reinvestment of distributions | | | 130 | | | | 1,135 | | | | 259 | | | | 2,261 | |
Shares redeemed | | | (46,433 | ) | | | (406,756 | ) | | | (12,282 | ) | | | (106,672 | ) |
| | | | (44,810 | ) | | | (392,469 | ) | | | (7,487 | ) | | | (64,863 | ) |
| Investor Shares | |
Shares sold | | | 51,488 | | | | 447,466 | | | | 461,146 | | | | 4,002,495 | |
Reinvestment of distributions | | | 601 | | | | 5,225 | | | | 678 | | | | 5,870 | |
Shares redeemed | | | (34,536 | ) | | | (300,125 | ) | | | (466,081 | ) | | | (4,044,531 | ) |
| | | | 17,553 | | | | 152,566 | | | | (4,257 | ) | | | (36,166 | ) |
| Class R6 Shares | |
Reinvestment of distributions | | | 8 | | | | 71 | | | | 12 | | | | 105 | |
| | | | 8 | | | | 71 | | | | 12 | | | | 105 | |
NET INCREASE | | | 33,014,744 | | | $ | 287,705,801 | | | | 7,441,467 | | | $ | 64,647,037 | |
141
GOLDMAN SACHS SHORT DURATION AND GOVERNMENT FIXED INCOME FUNDS
Notes to Financial Statements (continued)
September 30, 2017 (Unaudited)
|
| 11. SUMMARY OF SHARE TRANSACTIONS (continued) |
| | | | | | | | | | | | | | | | |
| | | Inflation Protected Securities Fund | |
| | | | |
| | | For the Six Months Ended
September 30, 2017
(Unaudited) | | | For the Fiscal Year Ended
March 31, 2017
| |
| | | | |
| | | Shares | | | Dollars | | | Shares | | | Dollars | |
| | | | |
| Class A Shares | |
Shares sold | | | 1,647,598 | | | $ | 17,168,030 | | | | 6,137,720 | | | $ | 64,356,868 | |
Reinvestment of distributions | | | 26,598 | | | | 275,146 | | | | 36,119 | | | | 380,915 | |
Shares redeemed | | | (1,578,589 | ) | | | (16,404,387 | ) | | | (2,422,621 | ) | | | (25,249,121 | ) |
| | | | 95,607 | | | | 1,038,789 | | | | 3,751,218 | | | | 39,488,662 | |
| Class C Shares | |
Shares sold | | | 216,137 | | | | 2,223,733 | | | | 194,145 | | | | 2,007,153 | |
Reinvestment of distributions | | | 2,915 | | | | 29,708 | | | | 3,883 | | | | 40,607 | |
Shares redeemed | | | (80,239 | ) | | | (824,773 | ) | | | (188,610 | ) | | | (1,944,434 | ) |
| | | | 138,813 | | | | 1,428,668 | | | | 9,418 | | | | 103,326 | |
| Institutional Shares | |
Shares sold | | | 4,425,209 | | | | 46,659,455 | | | | 12,155,834 | | | | 128,368,047 | |
Reinvestment of distributions | | | 135,356 | | | | 1,417,350 | | | | 163,111 | | | | 1,734,872 | |
Shares redeemed | | | (2,234,980 | ) | | | (23,538,788 | ) | | | (4,512,429 | ) | | | (47,748,255 | ) |
| | | | 2,325,585 | | | | 24,538,017 | | | | 7,806,516 | | | | 82,354,664 | |
| Investor Shares | |
Shares sold | | | 464,058 | | | | 4,848,698 | | | | 1,077,076 | | | | 11,326,781 | |
Reinvestment of distributions | | | 11,770 | | | | 122,548 | | | | 10,811 | | | | 114,254 | |
Shares redeemed | | | (179,975 | ) | | | (1,884,267 | ) | | | (152,305 | ) | | | (1,597,337 | ) |
| | | | 295,853 | | | | 3,086,979 | | | | 935,582 | | | | 9,843,698 | |
| Class R Shares | |
Shares sold | | | 860,494 | | | | 8,927,427 | | | | 1,264,559 | | | | 13,253,493 | |
Reinvestment of distributions | | | 10,058 | | | | 103,690 | | | | 10,417 | | | | 109,601 | |
Shares redeemed | | | (299,127 | ) | | | (3,104,225 | ) | | | (510,408 | ) | | | (5,315,894 | ) |
| | | | 571,425 | | | | 5,926,892 | | | | 764,568 | | | | 8,047,200 | |
| Class R6 Shares | |
Shares sold | | | 323,088 | | | | 3,387,757 | | | | 95,852 | | | | 1,016,183 | |
Reinvestment of distributions | | | 950 | | | | 9,951 | | | | 429 | | | | 4,547 | |
Shares redeemed | | | (45,881 | ) | | | (484,599 | ) | | | (28,762 | ) | | | (306,327 | ) |
| | | | 278,157 | | | | 2,913,109 | | | | 67,519 | | | | 714,403 | |
NET INCREASE | | | 3,705,440 | | | $ | 38,932,454 | | | | 13,334,821 | | | $ | 140,551,953 | |
142
GOLDMAN SACHS SHORT DURATION AND GOVERNMENT FIXED INCOME FUNDS
|
| 11. SUMMARY OF SHARE TRANSACTIONS (continued) |
| | | | | | | | | | | | | | | | |
| | | Short Duration Government Fund | |
| | | | |
| | | For the Six Months Ended
September 30, 2017
(Unaudited) | | | For the Fiscal Year Ended
March 31, 2017
| |
| | | | |
| | | Shares | | | Dollars | | | Shares | | | Dollars | |
| | | | |
| Class A Shares | |
Shares sold | | | 1,382,517 | | | $ | 13,771,929 | | | | 5,483,263 | | | $ | 55,000,242 | |
Reinvestment of distributions | | | 107,852 | | | | 1,074,526 | | | | 221,921 | | | | 2,227,866 | |
Shares redeemed | | | (3,152,280 | ) | | | (31,395,272 | ) | | | (9,045,563 | ) | | | (90,708,076 | ) |
| | | | (1,661,911 | ) | | | (16,548,817 | ) | | | (3,340,379 | ) | | | (33,479,968 | ) |
| Class C Shares | |
Shares sold | | | 128,299 | | | | 1,270,538 | | | | 547,584 | | | | 5,458,642 | |
Reinvestment of distributions | | | 14,597 | | | | 144,431 | | | | 28,591 | | | | 285,188 | |
Shares redeemed | | | (551,081 | ) | | | (5,458,253 | ) | | | (1,107,353 | ) | | | (11,032,410 | ) |
| | | | (408,185 | ) | | | (4,043,284 | ) | | | (531,178 | ) | | | (5,288,580 | ) |
| Institutional Shares | |
Shares sold | | | 16,793,745 | | | | 166,810,845 | | | | 36,016,772 | | | | 359,978,903 | |
Reinvestment of distributions | | | 977,434 | | | | 9,708,722 | | | | 1,924,227 | | | | 19,255,534 | |
Shares redeemed | | | (29,589,362 | ) | | | (294,245,004 | ) | | | (41,184,025 | ) | | | (411,807,517 | ) |
| | | | (11,818,183 | ) | | | (117,725,437 | ) | | | (3,243,026 | ) | | | (32,573,080 | ) |
| Service Shares | |
Shares sold | | | 154,281 | | | | 1,530,000 | | | | 250,520 | | | | 2,497,637 | |
Reinvestment of distributions | | | 17,162 | | | | 170,156 | | | | 32,302 | | | | 322,839 | |
Shares redeemed | | | (376,479 | ) | | | (3,734,111 | ) | | | (642,450 | ) | | | (6,421,284 | ) |
| | | | (205,036 | ) | | | (2,033,955 | ) | | | (359,628 | ) | | | (3,600,808 | ) |
| Investor Shares | |
Shares sold | | | 1,323,760 | | | | 13,190,559 | | | | 1,621,351 | | | | 16,234,155 | |
Reinvestment of distributions | | | 26,431 | | | | 263,328 | | | | 31,377 | | | | 315,054 | |
Shares redeemed | | | (924,652 | ) | | | (9,214,480 | ) | | | (979,649 | ) | | | (9,843,710 | ) |
| | | | 425,539 | | | | 4,239,407 | | | | 673,079 | | | | 6,705,499 | |
| Class R6 Shares | |
Shares sold | | | 10,215 | | | | 104,202 | | | | 2,145,703 | | | | 21,476,675 | |
Reinvestment of distributions | | | 3,072 | | | | 30,532 | | | | 143,712 | | | | 1,437,852 | |
Shares redeemed | | | (7,252,539 | ) | | | (72,235,103 | ) | | | (2,234,523 | ) | | | (22,322,205 | ) |
| | | | (7,239,252 | ) | | | (72,100,369 | ) | | | 54,892 | | | | 592,322 | |
NET DECREASE | | | (20,907,028 | ) | | $ | (208,212,455 | ) | | | (6,746,240 | ) | | $ | (67,644,615 | ) |
143
GOLDMAN SACHS SHORT DURATION AND GOVERNMENT FIXED INCOME FUNDS
Notes to Financial Statements (continued)
September 30, 2017 (Unaudited)
|
| 11. SUMMARY OF SHARE TRANSACTIONS (continued) |
| | | | | | | | | | | | | | | | |
| | | Short Duration Income Fund | |
| | | | |
| | | For the Six Months Ended
September 30, 2017
(Unaudited) | | | For the Fiscal Year Ended
March 31, 2017
| |
| | | | |
| | | Shares | | | Dollars | | | Shares | | | Dollars | |
| | | | |
| Class A Shares | | | | | | | | | | | | | | | | |
Shares sold | | | 831,732 | | | $ | 8,312,682 | | | | 636,155 | | | $ | 6,378,842 | |
Reinvestment of distributions | | | 13,046 | | | | 130,142 | | | | 14,882 | | | | 148,449 | |
Shares redeemed | | | (529,542 | ) | | | (5,277,024 | ) | | | (424,568 | ) | | | (4,243,009 | ) |
| | | | 315,236 | | | | 3,165,800 | | | | 226,469 | | | | 2,284,282 | |
| Class C Shares | | | | | | | | | | | | | | | | |
Shares sold | | | 45,355 | | | | 452,763 | | | | 65,996 | | | | 659,046 | |
Reinvestment of distributions | | | 644 | | | | 6,419 | | | | 1,461 | | | | 14,584 | |
Shares redeemed | | | (36,243 | ) | | | (361,497 | ) | | | (60,659 | ) | | | (604,754 | ) |
| | | | 9,756 | | | | 97,685 | | | | 6,798 | | | | 68,876 | |
| Institutional Shares | | | | | | | | | | | | | | | | |
Shares sold | | | 16,804,030 | | | | 167,991,722 | | | | 32,159,975 | | | | 321,271,093 | |
Reinvestment of distributions | | | 695,915 | | | | 6,952,533 | | | | 1,058,544 | | | | 10,584,047 | |
Shares redeemed | | | (9,413,716 | ) | | | (94,091,678 | ) | | | (16,149,802 | ) | | | (161,182,576 | ) |
| | | | 8,086,229 | | | | 80,852,577 | | | | 17,068,717 | | | | 170,672,564 | |
| Investor Shares | | | | | | | | | | | | | | | | |
Shares sold | | | 184,112 | | | | 1,840,930 | | | | 129,767 | | | | 1,296,666 | |
Reinvestment of distributions | | | 1,837 | | | | 18,349 | | | | 1,780 | | | | 17,768 | |
Shares redeemed | | | (149,419 | ) | | | (1,492,762 | ) | | | (21,875 | ) | | | (218,302 | ) |
| | | | 36,530 | | | | 366,517 | | | | 109,672 | | | | 1,096,132 | |
| Class R Shares | | | | | | | | | | | | | | | | |
Shares sold | | | 918 | | | | 9,169 | | | | 705 | | | | 7,034 | |
Reinvestment of distributions | | | 32 | | | | 324 | | | | 45 | | | | 447 | |
Shares redeemed | | | (183 | ) | | | (1,832 | ) | | | — | | | | — | |
| | | | 767 | | | | 7,661 | | | | 750 | | | | 7,481 | |
| Class R6 Shares | | | | | | | | | | | | | | | | |
Reinvestment of distributions | | | 12 | | | | 118 | | | | 22 | | | | 219 | |
| | | | 12 | | | | 118 | | | | 22 | | | | 219 | |
NET INCREASE | | | 8,448,530 | | | $ | 84,490,358 | | | | 17,412,428 | | | $ | 174,129,554 | |
144
GOLDMAN SACHS SHORT DURATION AND GOVERNMENT FIXED INCOME FUNDS
|
| 11. SUMMARY OF SHARE TRANSACTIONS (continued) |
| | | | | | | | | | | | | | | | |
| | | Short-Term Conservative Income Fund | |
| | | | |
| | | For the Six Months Ended
September 30, 2017
(Unaudited) | | | For the Fiscal Year Ended
March 31, 2017
| |
| | | | |
| | | Shares | | | Dollars | | | Shares | | | Dollars | |
| | | | |
| Class A Shares(a) | | | | | | | | | | | | | | | | |
Shares sold | | | — | | | $ | — | | | | 2,497 | | | $ | 25,000 | |
Reinvestment of distributions | | | 13 | | | | 126 | | | | 8 | | | | 78 | |
| | | | 13 | | | | 126 | | | | 2,505 | | | | 25,078 | |
| Preferred Shares(a) | | | | | | | | | | | | | | | | |
Shares sold | | | — | | | | — | | | | 2,498 | | | | 25,005 | |
Reinvestment of distributions | | | 16 | | | | 159 | | | | 11 | | | | 105 | |
Shares redeemed | | | — | | | | — | | | | (1 | ) | | | (5 | ) |
| | | | 16 | | | | 159 | | | | 2,508 | | | | 25,105 | |
| Institutional Shares | | | | | | | | | | | | | | | | |
Shares sold | | | 115,899,407 | | | | 1,161,312,054 | | | | 30,537,052 | | | | 305,812,237 | |
Reinvestment of distributions | | | 409,435 | | | | 4,102,538 | | | | 63,974 | | | | 640,640 | |
Shares redeemed | | | (13,223,619 | ) | | | (132,500,662 | ) | | | (5,590,179 | ) | | | (55,974,235 | ) |
| | | | 103,085,223 | | | | 1,032,913,930 | | | | 25,010,847 | | | | 250,478,642 | |
| Administration Shares | | | | | | | | | | | | | | | | |
Shares sold | | | 81,302 | | | | 814,694 | | | | 610,512 | | | | 6,105,296 | |
Reinvestment of distributions | | | 448 | | | | 4,496 | | | | 480 | | | | 4,798 | |
Shares redeemed | | | — | | | | — | | | | (600,326 | ) | | | (6,003,821 | ) |
| | | | 81,750 | | | | 819,190 | | | | 10,666 | | | | 106,273 | |
NET INCREASE | | | 103,167,002 | | | $ | 1,033,733,405 | | | | 25,026,526 | | | $ | 250,635,098 | |
| (a) | | Commenced operations on October 31, 2016. |
145
GOLDMAN SACHS SHORT DURATION AND GOVERNMENT FIXED INCOME FUNDS
Fund Expenses — Six Month Period Ended September 30, 2017 (Unaudited)
As a shareholder of Class A, Class C, Institutional, Administration, Service, Investor, Class R or Class R6 Shares of a Fund, you incur two types of costs: (1) transaction costs, including sales charges on purchase payments (with respect to Class A Shares), contingent deferred sales charges on redemptions (with respect to Class C Shares), and (2) ongoing costs, including management fees; distribution and/or service (12b-1) fees (with respect to Class A, Class C, and Class R and Service Shares); and other Fund expenses. This Example is intended to help you understand your ongoing costs (in dollars) of investing in Class A, Class C, Institutional, Administration, Service, Investor, Class R or Class R6 Shares of the Funds and to compare these costs with the ongoing costs of investing in other mutual funds.
The Example is based on an investment of $1,000 invested at the beginning of the period and held for the entire period from April 1, 2017 through September 30, 2017, which represents a period of 183 days of a 365-day year.
Actual Expenses — The first line under each share class in the table below provides information about actual account values and actual expenses. You may use the information in this line, together with the amount you invested, to estimate the expenses that you paid over the period. Simply divide your account value by $1,000 (for example, an $8,600 account value divided by $1,000=8.6), then multiply the result by the number in the first line under the heading entitled “Expenses Paid” to estimate the expenses you paid on your account during this period.
Hypothetical Example for Comparison Purposes — The second line under each share class in the table below provides information about hypothetical account values and hypothetical expenses based on the Funds’ actual net expense ratios and an assumed rate of return of 5% per year before expenses, which is not the Funds’ actual return. The hypothetical account values and expenses may not be used to estimate the actual ending account balance or expenses you paid for the period. You may use this information to compare the ongoing costs of investing in the Funds and other funds. To do so, compare this 5% hypothetical example with the 5% hypothetical examples that appear in the shareholder reports of the other funds.
Please note that the expenses shown in the table are meant to highlight your ongoing costs only and do not reflect any transactional costs, such as sales charges, redemption fees, or exchange fees. Therefore, the second line of the table is useful in comparing ongoing costs only, and will not help you determine the relative total costs of owning different funds. In addition, if these transactional costs were included, your costs would have been higher.
| | | | | | | | | | | | | | | | | | | | | | | | | | | | | | | | | | | | | | | | | | | | | | | | |
| | | Enhanced Income Fund | | | Government Income Fund | | | High Quality Floating Rate Fund | | | Inflation Protected Securities Fund | |
| Share Class | | Beginning
Account
Value
4/1/17 | | | Ending
Account
Value
9/30/17 | | | Expenses
Paid for the
6 months ended
9/30/17* | | | Beginning
Account
Value
4/1/17 | | | Ending
Account
Value
9/30/17 | | | Expenses
Paid for the
6 months ended
9/30/17* | | | Beginning
Account
Value
4/1/17 | | | Ending
Account
Value
9/30/17 | | | Expenses
Paid for the
6 months ended
9/30/17* | | | Beginning
Account
Value
4/1/17 | | | Ending
Account
Value
9/30/17 | | | Expenses
Paid for the
6 months ended
9/30/17* | |
| Class A | | | | | | | | | | | | | | | | | | | | | | | | | | | | | | | | | | | | | | | | | | | | | | | | |
Actual | | $ | 1,000.00 | | | $ | 1,005.50 | | | $ | 3.47 | | | $ | 1,000.00 | | | $ | 1,013.50 | | | $ | 4.59 | | | $ | 1,000.00 | | | $ | 1,006.40 | | | $ | 3.57 | | | $ | 1,000.00 | | | $ | 1,002.00 | | | $ | 3.41 | |
Hypothetical 5% return | | | 1,000.00 | | | | 1,021.61 | + | | | 3.50 | | | | 1,000.00 | | | | 1,020.51 | + | | | 4.61 | | | | 1,000.00 | | | | 1,021.51 | + | | | 3.60 | | | | 1,000.00 | | | | 1,021.66 | + | | | 3.45 | |
| Preferred | | | | | | | | | | | | | | | | | | | | | | | | | | | | | | | | | | | | | | | | | | | | | | | | |
Actual | | | N/A | | | | N/A | | | | N/A | | | | N/A | | | | N/A | | | | N/A | | | | N/A | | | | N/A | | | | N/A | | | | N/A | | | | N/A | | | | N/A | |
Hypothetical 5% return | | | N/A | | | | N/A | | | | N/A | | | | N/A | | | | N/A | | | | N/A | | | | N/A | | | | N/A | | | | N/A | | | | N/A | | | | N/A | | | | N/A | |
| Class C | | | | | | | | | | | | | | | | | | | | | | | | | | | | | | | | | | | | | | | | | | | | | | | | |
Actual | | | N/A | | | | N/A | | | | — | | | | 1,000.00 | | | | 1,009.70 | | | | 8.36 | | | | N/A | | | | N/A | | | | — | | | | 1,000.00 | | | | 998.40 | | | | 7.16 | |
Hypothetical 5% return | | | N/A | | | | N/A | + | | | N/A | | | | 1,000.00 | | | | 1,016.75 | + | | | 8.39 | | | | N/A | | | | N/A | + | | | N/A | | | | 1,000.00 | | | | 1,017.90 | + | | | 7.23 | |
| Institutional | | | | | | | | | | | | | | | | | | | | | | | | | | | | | | | | | | | | | | | | | | | | | | | | |
Actual | | | 1,000.00 | | | | 1,007.20 | | | | 1.76 | | | | 1,000.00 | | | | 1,014.50 | | | | 2.88 | | | | 1,000.00 | | | | 1,008.10 | | | | 1.81 | | | | 1,000.00 | | | | 1,003.60 | | | | 1.71 | |
Hypothetical 5% return | | | 1,000.00 | | | | 1,023.31 | + | | | 1.78 | | | | 1,000.00 | | | | 1,022.21 | + | | | 2.89 | | | | 1,000.00 | | | | 1,023.26 | + | | | 1.83 | | | | 1,000.00 | | | | 1,023.36 | + | | | 1.72 | |
| Service | | | | | | | | | | | | | | | | | | | | | | | | | | | | | | | | | | | | | | | | | | | | | | | | |
Actual | | | N/A | | | | N/A | | | | — | | | | 1,000.00 | | | | 1,012.70 | | | | 5.40 | | | | 1,000.00 | | | | 1,004.40 | | | | 4.37 | | | | N/A | | | | N/A | | | | — | |
Hypothetical 5% return | | | N/A | | | | N/A | + | | | N/A | | | | 1,000.00 | | | | 1,019.70 | + | | | 5.42 | | | | 1,000.00 | | | | 1,020.71 | + | | | 4.41 | | | | N/A | | | | N/A | + | | | N/A | |
| Investor | | | | | | | | | | | | | | | | | | | | | | | | | | | | | | | | | | | | | | | | | | | | | | | | |
Actual | | | 1,000.00 | | | | 1,006.70 | | | | 2.16 | | | | 1,000.00 | | | | 1,014.70 | | | | 3.33 | | | | 1,000.00 | | | | 1,007.70 | | | | 2.26 | | | | 1,000.00 | | | | 1,003.20 | | | | 2.16 | |
Hypothetical 5% return | | | 1,000.00 | | | | 1,022.91 | + | | | 2.18 | | | | 1,000.00 | | | | 1,021.76 | + | | | 3.35 | | | | 1,000.00 | | | | 1,022.81 | + | | | 2.28 | | | | 1,000.00 | | | | 1,022.91 | + | | | 2.18 | |
| Class R | | | | | | | | | | | | | | | | | | | | | | | | | | | | | | | | | | | | | | | | | | | | | | | | |
Actual | | | N/A | | | | N/A | | | | — | | | | 1,000.00 | | | | 1,012.20 | | | | 5.85 | | | | N/A | | | | N/A | | | | — | | | | 1,000.00 | | | | 1,001.20 | | | | 4.67 | |
Hypothetical 5% return | | | N/A | | | | N/A | + | | | N/A | | | | 1,000.00 | | | | 1,019.25 | + | | | 5.87 | | | | N/A | | | | N/A | + | | | N/A | | | | 1,000.00 | | | | 1,020.41 | + | | | 4.71 | |
| Administration | | | | | | | | | | | | | | | | | | | | | | | | | | | | | | | | | | | | | | | | | | | | | | | | |
Actual | | | 1,000.00 | | | | 1,005.90 | | | | 3.02 | | | | N/A | | | | N/A | | | | — | | | | N/A | | | | N/A | | | | — | | | | N/A | | | | N/A | | | | — | |
Hypothetical 5% return | | | 1,000.00 | | | | 1,022.06 | + | | | 3.04 | | | | N/A | | | | N/A | | | | N/A | | | | N/A | | | | N/A | | | | N/A | | | | N/A | | | | N/A | | | | N/A | |
| Class R6 | | | | | | | | | | | | | | | | | | | | | | | | | | | | | | | | | | | | | | | | | | | | | | | | |
Actual | | | 1,000.00 | | | | 1,007.30 | | | | 1.71 | | | | 1,000.00 | | | | 1,015.30 | | | | 2.78 | | | | 1,000.00 | | | | 1,007.00 | | | | 1.81 | | | | 1,000.00 | | | | 1,003.70 | | | | 1.66 | |
Hypothethical 5% return | | | 1,000.00 | | | | 1,023.36 | + | | | 1.72 | | | | 1,000.00 | | | | 1,022.31 | + | | | 2.79 | | | | 1,000.00 | | | | 1,023.26 | + | | | 1.83 | | | | 1,000.00 | | | | 1,023.41 | + | | | 1.67 | |
146
GOLDMAN SACHS SHORT DURATION AND GOVERNMENT FIXED INCOME FUNDS
Fund Expenses — Six Month Period Ended September 30, 2017 (Unaudited) (continued)
| | | | | | | | | | | | | | | | | | | | | | | | | | | | | | | | | | | | |
| | | Short Duration Government Fund | | | Short Duration Income Fund | | | Short-Term Conservative Income Fund | |
| Share Class | | Beginning
Account
Value
4/1/17 | | | Ending
Account
Value
9/30/17 | | | Expenses
Paid for the
6 months ended
9/30/17* | | | Beginning
Account
Value
4/1/17 | | | Ending
Account
Value
9/30/17 | | | Expenses
Paid for the
6 months ended
9/30/17* | | | Beginning
Account
Value
4/1/17 | | | Ending
Account
Value
9/30/17 | | | Expenses
Paid for the
6 months ended
9/30/17* | |
| Class A | | | | | | | | | | | | | | | | | | | | | | | | | | | | | | | | | | | | |
Actual | | $ | 1,000.00 | | | $ | 1,003.00 | | | $ | 4.12 | | | $ | 1,000.00 | | | $ | 1,008.80 | | | $ | 3.98 | | | $ | 1,000.00 | | | $ | 1,005.00 | | | $ | 2.61 | |
Hypothetical 5% return | | | 1,000.00 | | | | 1,020.96 | + | | | 4.15 | | | | 1,000.00 | | | | 1,021.11 | + | | | 4.00 | | | | 1,000.00 | | | | 1,022.46 | + | | | 2.64 | |
| Preferred | | | | | | | | | | | | | | | | | | | | | | | | | | | | | | | | | | | | |
Actual | | | N/A | | | | N/A | | | | N/A | | | | N/A | | | | N/A | | | | N/A | | | | 1,000.00 | | | | 1,006.30 | | | | 1.36 | |
Hypothetical 5% return | | | N/A | | | | N/A | | | | N/A | | | | N/A | | | | N/A | | | | N/A | | | | 1,000.00 | | | | 1,023.71 | + | | | 1.37 | |
| Class C | | | | | | | | | | | | | | | | | | | | | | | | | | | | | | | | | | | | |
Actual | | | 1,000.00 | | | | 1,000.90 | | | | 6.12 | | | | 1,000.00 | | | | 1,005.80 | | | | 6.03 | | | | N/A | | | | N/A | | | | — | |
Hypothetical 5% return | | | 1,000.00 | | | | 1,018.95 | + | | | 6.17 | | | | 1,000.00 | | | | 1,019.05 | + | | | 6.07 | | | | N/A | | | | N/A | + | | | N/A | |
| Institutional | | | | | | | | | | | | | | | | | | | | | | | | | | | | | | | | | | | | |
Actual | | | 1,000.00 | | | | 1,004.70 | | | | 2.41 | | | | 1,000.00 | | | | 1,009.50 | | | | 2.27 | | | | 1,000.00 | | | | 1,006.80 | | | | 0.80 | |
Hypothetical 5% return | | | 1,000.00 | | | | 1,022.66 | + | | | 2.43 | | | | 1,000.00 | | | | 1,022.81 | + | | | 2.28 | | | | 1,000.00 | | | | 1,024.27 | + | | | 0.81 | |
| Service | | | | | | | | | | | | | | | | | | | | | | | | | | | | | | | | | | | | |
Actual | | | 1,000.00 | | | | 1,002.10 | | | | 4.92 | | | | N/A | | | | N/A | | | | — | | | | N/A | | | | N/A | | | | — | |
Hypothetical 5% return | | | 1,000.00 | | | | 1,020.15 | + | | | 4.96 | | | | N/A | | | | N/A | + | | | N/A | | | | N/A | | | | N/A | + | | | N/A | |
| Investor | | | | | | | | | | | | | | | | | | | | | | | | | | | | | | | | | | | | |
Actual | | | 1,000.00 | | | | 1,004.20 | | | | 2.86 | | | | 1,000.00 | | | | 1,009.10 | | | | 2.72 | | | | N/A | | | | N/A | | | | — | |
Hypothetical 5% return | | | 1,000.00 | | | | 1,022.21 | + | | | 2.89 | | | | 1,000.00 | | | | 1,022.36 | + | | | 2.74 | | | | N/A | | | | N/A | + | | | N/A | |
| Class R | | | | | | | | | | | | | | | | | | | | | | | | | | | | | | | | | | | | |
Actual | | | N/A | | | | N/A | | | | — | | | | 1,000.00 | | | | 1,006.60 | | | | 5.23 | | | | N/A | | | | N/A | | | | — | |
Hypothetical 5% return | | | N/A | | | | N/A | + | | | N/A | | | | 1,000.00 | | | | 1,019.85 | + | | | 5.27 | | | | N/A | | | | N/A | + | | | N/A | |
| Administration | | | | | | | | | | | | | | | | | | | | | | | | | | | | | | | | | | | | |
Actual | | | N/A | | | | N/A | | | | — | | | | N/A | | | | N/A | | | | — | | | | 1,000.00 | | | | 1,006.60 | | | | 0.80 | |
Hypothetical 5% return | | | N/A | | | | N/A | | | | N/A | | | | N/A | | | | N/A | | | | N/A | | | | 1,000.00 | | | | 1,024.27 | + | | | 0.81 | |
| Class R6 | | | | | | | | | | | | | | | | | | | | | | | | | | | | | | | | | | | | |
Actual | | | 1,000.00 | | | | 1,003.70 | | | | 2.31 | | | | 1,000.00 | | | | 1,009.40 | | | | 2.27 | | | | N/A | | | | N/A | | | | — | |
Hypothethical 5% return | | | 1,000.00 | | | | 1,022.76 | + | | | 2.33 | | | | 1,000.00 | | | | 1,022.81 | + | | | 2.28 | | | | N/A | | | | N/A | | | | N/A | |
| | * | | Expenses for each share class are calculated using each Fund’s annualized net expense ratio for each class, which represents the ongoing expenses as a percentage of net assets for the six months ended September 30, 2017. Expenses are calculated by multiplying the annualized net expense ratio by the average account value for the period; then multiplying the result by the number of days in the most recent fiscal half year; and then dividing that result by the number of days in the fiscal year. The annualized net expense ratios for the period were as follows: | |
| | | | | | | | | | | | | | | | | | | | | | | | | | | | | | | | | | | | |
| Fund | | Class A | | | Preferred | | | Class C | | | Institutional | | | Service | | | Investor | | | Class R | | | Administration | | | Class R6 | |
Enhanced Income+ | | | 0.69 | % | | | N/A | | | | N/A | | | | 0.35 | % | | | N/A | | | | 0.43 | % | | | N/A | | | | 0.60 | % | | | 0.34 | % |
Government Income+ | | | 0.91 | | | | N/A | | | | 1.66 | % | | | 0.57 | | | | 1.07 | % | | | 0.66 | | | | 1.16 | % | | | N/A | | | | 0.55 | |
High Quality Floating Rate+ | | | 0.71 | | | | N/A | | | | N/A | | | | 0.36 | | | | 0.87 | | | | 0.45 | | | | N/A | | | | N/A | | | | 0.36 | |
Inflation Protected Securities+ | | | 0.68 | | | | N/A | | | | 1.43 | | | | 0.34 | | | | N/A | | | | 0.43 | | | | 0.93 | | | | N/A | | | | 0.33 | |
Short Duration Government+ | | | 0.82 | | | | N/A | | | | 1.22 | | | | 0.48 | | | | 0.98 | | | | 0.57 | | | | N/A | | | | N/A | | | | 0.46 | |
Short Duration Income+ | | | 0.79 | | | | N/A | | | | 1.20 | | | | 0.45 | | | | N/A | | | | 0.54 | | | | 1.04 | | | | N/A | | | | 0.45 | |
Short-Term Conservative Income+ | | | 0.52 | | | | 0.27 | % | | | N/A | | | | 0.16 | | | | N/A | | | | N/A | | | | N/A | | | | 0.16 | | | | N/A | |
| + | | Hypothetical expenses are based on each Fund’s actual annualized net expense ratios and an assumed rate of return of 5% per year before expenses. |
147
GOLDMAN SACHS SHORT DURATION AND GOVERNMENT FIXED INCOME FUNDS
Statement Regarding Basis for Approval of Management Agreements (Unaudited)
Background
The Goldman Sachs Enhanced Income Fund, Goldman Sachs Government Income Fund, Goldman Sachs High Quality Floating Rate Fund, Goldman Sachs Inflation Protected Securities Fund, Goldman Sachs Short Duration Government Fund, Goldman Sachs Short Duration Income Fund, and Goldman Sachs Short-Term Conservative Income Fund (the “Funds”) are investment portfolios of Goldman Sachs Trust (the “Trust”). The Board of Trustees oversees the management of the Trust and reviews the investment performance and expenses of the Funds at regularly scheduled meetings held throughout the year. In addition, the Board of Trustees determines annually whether to approve the continuance of the Trust’s investment management agreements (the “Management Agreements”) with Goldman Sachs Asset Management, L.P. (the “Investment Adviser”) on behalf of the Funds.
The Management Agreements were most recently approved for continuation until June 30, 2018 by the Board of Trustees, including those Trustees who are not parties to the Management Agreements or “interested persons” (as defined in the Investment Company Act of 1940, as amended) of any party thereto (the “Independent Trustees”), at a meeting held on June 14-15, 2017 (the “Annual Meeting”).
The review process undertaken by the Trustees spans the course of the year and culminates with the Annual Meeting. To assist the Trustees in their deliberations, the Trustees have established a Contract Review Committee (the “Committee”), comprised of the Independent Trustees. The Committee held four meetings over the course of the year since the Management Agreements were last approved. At those Committee meetings, regularly scheduled Board or other committee meetings, and/or the Annual Meeting, matters relevant to the renewal of the Management Agreements were considered by the Board, or the Independent Trustees, as applicable. With respect to each Fund, such matters included:
| | (a) | | the nature and quality of the advisory, administrative, and other services provided to the Fund by the Investment Adviser and its affiliates, including information about: |
| | (i) | | the structure, staff, and capabilities of the Investment Adviser and its portfolio management teams; |
| | (ii) | | the groups within the Investment Adviser and its affiliates that support the portfolio management teams or provide other types of necessary services, including fund services groups (e.g., accounting and financial reporting, tax, shareholder services, and operations); controls and risk management groups (e.g., legal, compliance, valuation oversight, credit risk management, internal audit, compliance testing, market risk analysis, finance, and central funding); sales and distribution support groups, and others (e.g., information technology and training); |
| | (iii) | | trends in employee headcount; |
| | (iv) | | the Investment Adviser’s financial resources and ability to hire and retain talented personnel and strengthen its operations; and |
| | (v) | | the parent company’s support of the Investment Adviser and its mutual fund business, as expressed by the firm’s senior management; |
| | (b) | | information on the investment performance of the Fund, including comparisons to the performance of similar mutual funds, as provided by a third-party mutual fund data provider engaged as part of the contract review process (the “Outside Data Provider”), a benchmark performance index, and (in the case of the Enhanced Income Fund and Short Duration Government Fund) a composite of accounts with comparable investment strategies managed by the Investment Adviser; and information on general investment outlooks in the markets in which the Fund invests; |
| | (c) | | information provided by the Investment Adviser indicating the Investment Adviser’s views on whether the Fund’s peer group and/or benchmark index had high, medium, or low relevance given the Fund’s particular investment strategy; |
| | (d) | | the terms of the Management Agreement and other agreements with affiliated service providers entered into by the Trust on behalf of the Fund; |
| | (e) | | fee and expense information for the Fund, including: |
| | (i) | | the relative management fee and expense levels of the Fund as compared to those of comparable funds managed by other advisers, as provided by the Outside Data Provider; |
| | (ii) | | the Fund’s expense trends over time; and |
| | (iii) | | to the extent the Investment Adviser manages other types of accounts (such as bank collective trusts, private wealth management accounts, institutional separate accounts, sub-advised mutual funds, and non-U.S. funds) having investment objectives and policies similar to those of the Fund, comparative information on the advisory fees charged and services provided to those accounts by the Investment Adviser; |
| | (f) | | with respect to the extensive investment performance and expense comparison data provided by the Outside Data Provider, its processes in producing that data for the Fund; |
| | (g) | | the undertakings of the Investment Adviser and its affiliates to implement fee waivers and/or expense limitations; |
148
GOLDMAN SACHS SHORT DURATION AND GOVERNMENT FIXED INCOME FUNDS
Statement Regarding Basis for Approval of Management Agreements (Unaudited) (continued)
| | (h) | | information relating to the profitability of the Management Agreement and the transfer agency and distribution and service arrangements of the Fund to the Investment Adviser and its affiliates; |
| | (i) | | whether the Fund’s existing management fee schedule adequately addressed any economies of scale; |
| | (j) | | a summary of the “fall-out” benefits derived by the Investment Adviser and its affiliates from their relationships with the Fund, including the fees received by the Investment Adviser’s affiliates from the Fund for transfer agency, portfolio trading, distribution and other services; |
| | (k) | | a summary of potential benefits derived by the Fund as a result of its relationship with the Investment Adviser; |
| | (l) | | information regarding portfolio trading and how the Investment Adviser carries out its duty to seek best execution; |
| | (m) | | portfolio manager ownership of Fund shares; the manner in which portfolio manager compensation is determined; and the number and types of accounts managed by the portfolio managers; |
| | (n) | | the nature and quality of the services provided to the Fund by its unaffiliated service providers, and the Investment Adviser’s general oversight and evaluation (including reports on due diligence) of those service providers as part of the administrative services provided under the Management Agreement; and |
| | (o) | | the Investment Adviser’s processes and policies addressing various types of potential conflicts of interest; its approach to risk management; the annual review of the effectiveness of the Fund’s compliance program; and periodic compliance reports. |
The Trustees also received an overview of the Funds’ distribution arrangements. They received information regarding the Funds’ assets, share purchase and redemption activity, and payment of distribution, service, and shareholder administration fees, as applicable. Information was also provided to the Trustees relating to revenue sharing payments made by and services provided by the Investment Adviser and its affiliates to intermediaries that promote the sale, distribution, and/or servicing of Fund shares. The Independent Trustees also discussed the broad range of other investment choices that are available to Fund investors, including the availability of comparable funds managed by other advisers.
The presentations made at the Board and Committee meetings and at the Annual Meeting encompassed the Funds and other mutual funds for which the Board of Trustees has responsibility. In evaluating the Management Agreements at the Annual Meeting, the Trustees relied upon their knowledge, resulting from their meetings and other interactions throughout the year, of the Investment Adviser and its affiliates, their services, and the Funds. In conjunction with these meetings, the Trustees received written materials and oral presentations on the topics covered, and the Investment Adviser addressed the questions and concerns of the Trustees, including concerns regarding the investment performance of certain of the funds they oversee. The Independent Trustees were advised by their independent legal counsel regarding their responsibilities and other regulatory requirements related to the approval and continuation of mutual fund investment management agreements under applicable law. In addition, the Investment Adviser and its affiliates provided the Independent Trustees with a written response to a formal request for information sent on behalf of the Independent Trustees by their independent legal counsel. During the course of their deliberations, the Independent Trustees met in executive sessions with their independent legal counsel, without representatives of the Investment Adviser or its affiliates present.
Nature, Extent, and Quality of the Services Provided Under the Management Agreements
As part of their review, the Trustees considered the nature, extent, and quality of the services provided to the Funds by the Investment Adviser. In this regard, the Trustees considered both the investment advisory services and non-advisory services that are provided by the Investment Adviser and its affiliates. The Trustees noted the transition in the leadership and changes in personnel of various of the Investment Adviser’s portfolio management teams that had occurred in recent periods, and the ongoing recruitment efforts aimed at bringing high quality investment talent to the Investment Adviser. They also noted the Investment Adviser’s commitment to maintaining high quality systems and expending substantial resources to respond to ongoing changes to the regulatory and control environment in which the Funds and their service providers operate, as well as the efforts of the Investment Adviser and its affiliates to combat cyber security risks. The Trustees concluded that the Investment Adviser continued to commit substantial financial and operational resources to the Funds and expressed confidence that the Investment Adviser would continue to do so in the future. The Trustees also recognized that the Investment Adviser had made significant commitments to address regulatory compliance requirements applicable to the Funds and the Investment Adviser and its affiliates.
Investment Performance
The Trustees also considered the investment performance of the Funds. In this regard, they compared the investment performance of each Fund to its peers using rankings and (except with respect to the Short-Term Conservative Income Fund) ratings compiled by the Outside Data Provider as of December 31, 2016, and updated performance information prepared by the Investment Adviser using the peer groups identified by the Outside Data Provider as of March 31, 2017. The information on each
149
GOLDMAN SACHS SHORT DURATION AND GOVERNMENT FIXED INCOME FUNDS
Statement Regarding Basis for Approval of Management Agreements (Unaudited) (continued)
Fund’s investment performance was provided for the one-, three-, five-, and ten-year periods ending on the applicable dates, to the extent that each Fund had been in existence for those periods. The Trustees also reviewed each Fund’s investment performance relative to its performance benchmark. As part of this review, they considered the investment performance trends of the Funds over time, and reviewed the investment performance of each Fund in light of its investment objective and policies and market conditions. The Trustees also received information comparing the Enhanced Income Fund’s and Short Duration Government Fund’s performance to that of composites of accounts with comparable investment strategies managed by the Investment Adviser.
In addition, the Trustees considered materials prepared and presentations made by the Investment Adviser’s senior management and portfolio management personnel in which Fund performance was assessed. The Trustees also considered the Investment Adviser’s periodic reports with respect to the Funds’ risk profiles, and how the Investment Adviser’s approach to risk monitoring and management influences portfolio management.
The Trustees noted that the Enhanced Income Fund’s Institutional Shares had placed in the second quartile of the Fund’s peer group for the one- and ten-year periods and in the third quartile for the three- and five-year periods, and had outperformed the Fund’s benchmark index for the one-, three-, five-, and ten-year periods ended March 31, 2017. They observed that the Government Income Fund’s Institutional Shares had placed in the second quartile of the Fund’s peer group for the one-, three-, five-, and ten-year periods, and had outperformed the Fund’s benchmark index for the one-year period and underperformed for the three-, five-, and ten-year periods ended March 31, 2017. The Trustees noted that the High Quality Floating Rate Fund’s Institutional Shares had placed in the first quartile of the Fund’s peer group for the one-year period, in the third quartile for the three-year period, and in the fourth quartile for the five- and ten-year periods, and had outperformed the Fund’s benchmark index for the one-, three-, five-, and ten-year periods ended March 31, 2017. They observed that the Inflation Protected Securities Fund’s Institutional Shares had placed in the top half of the Fund’s peer group for the one-, three-, and five-year periods, and had outperformed the Fund’s benchmark index for the one-year period and underperformed for the three- and five-year periods ended March 31, 2017. The Trustees noted that the Short Duration Government Fund’s Institutional Shares had placed in the top half of the Fund’s peer group and had outperformed the Fund’s benchmark index for the one-, three-, five-, and ten-year periods ended March 31, 2017. They also considered that the Short Duration Government Fund had experienced certain portfolio management changes in 2016. The Trustees observed that the Short Duration Income Fund’s Institutional Shares had placed in the top half of the Fund’s peer group for the one- , three-, and five-year periods, and had outperformed the Fund’s benchmark index for the one- and five-year periods and underperformed for the three-year period ended March 31, 2017. They noted that the Short-Term Conservative Income Fund’s Institutional Shares had placed in the second quartile of the Fund’s peer group for the three-year period and in the third quartile for the one-year period, and had outperformed the Fund’s benchmark index for the one- and three-year periods ended March 31, 2017. The Trustees considered that the Short-Term Conservative Income Fund had certain significant differences from its peer group that caused the peer group to be an imperfect basis for performance comparison. They also noted changes to the Short-Term Conservative Income Fund’s name and investment objective in August 2016.
Costs of Services Provided and Competitive Information
The Trustees considered the contractual terms of the Management Agreements and the fee rates payable by each Fund thereunder. In this regard, the Trustees considered information on the services rendered by the Investment Adviser to the Funds, which included both advisory and administrative services that were directed to the needs and operations of the Funds as registered mutual funds.
In particular, the Trustees reviewed analyses prepared by the Outside Data Provider regarding the expense rankings of the Funds. The analyses provided a comparison of each Fund’s management fee and breakpoints (with the exception of the Short-Term Conservative Income Fund, which does not have breakpoints) to those of a relevant peer group and category universe; an expense analysis which compared each Fund’s overall net and gross expenses to a peer group and a category universe; and data comparing each Fund’s net expenses to the peer and category medians. The analyses also compared each Fund’s transfer agency, custody, and distribution fees, other expenses and fee waivers/reimbursements to those of the peer group and category medians. The Trustees concluded that the comparisons provided by the Outside Data Provider were useful in evaluating the reasonableness of the management fees and total expenses paid by the Funds.
With respect to the Government Income Fund, High Quality Floating Rate Fund, Inflation Protected Securities Fund, and Short Duration Government Fund, the Trustees noted that the management fee breakpoint schedules were being reduced at all asset levels. In addition, the Trustees considered the Investment Adviser’s undertakings to implement fee waivers and/or expense limitations. The Trustees also noted that certain changes were being made to existing fee waiver or expense limitation arrangements of the Short-Term Conservative Income Fund that would have the effect of increasing total Fund expenses, with such changes taking effect in connection with the Fund’s next annual registration statement update. They also considered, to the extent that the Investment Adviser manages other types of accounts having investment objectives and policies similar to those of the
150
GOLDMAN SACHS SHORT DURATION AND GOVERNMENT FIXED INCOME FUNDS
Statement Regarding Basis for Approval of Management Agreements (Unaudited) (continued)
Funds, comparative fee information for services provided by the Investment Adviser to those accounts, and information that indicated that services provided to the Funds differed in various significant respects from the services provided to other types of accounts which, in many cases, operated under less stringent legal and regulatory structures, required fewer services from the Investment Adviser to a smaller number of client contact points, and were less time-intensive.
In addition, the Trustees noted that shareholders are able to redeem their Fund shares at any time if shareholders believe that the Fund fees and expenses are too high or if they are dissatisfied with the performance of the Fund.
Profitability
The Trustees reviewed each Fund’s contribution to the Investment Adviser’s revenues and pre-tax profit margins. In this regard the Trustees noted that they had received, among other things, profitability analyses and summaries, revenue and expense schedules by Fund and by function (i.e., investment management, transfer agency and distribution and service), and information on the Investment Adviser’s expense allocation methodology. They observed that the profitability and expense figures are substantially similar to those used by the Investment Adviser for many internal purposes, including compensation decisions among various business groups, and are thus subject to a vigorous internal debate about how certain revenue and expenses should be allocated. The Trustees also noted that the internal audit group within the Goldman Sachs organization had audited the expense allocation methodology and that the internal audit group was satisfied with the reasonableness, consistency, and accuracy of the Investment Adviser’s expense allocation methodology and profitability analysis calculations. Profitability data for each Fund was provided for 2016 and 2015, and the Trustees considered this information in relation to the Investment Adviser’s overall profitability.
Economies of Scale
The Trustees considered the information that had been provided regarding the Investment Adviser’s profitability. The Trustees also considered the breakpoints in the fee rate payable under the Management Agreements for each of the Funds (other than the Short-Term Conservative Income Fund) at the following annual percentage rates of the average daily net assets of the Funds:
| | | | | | | | | | | | | | | | | | | | | | | | |
Average Daily
Net Assets | | Enhanced
Income Fund | | | Government
Income Fund | | | High
Quality
Floating
Rate
Fund | | | Inflation
Protected
Securities
Fund | | | Short
Duration
Government
Fund | | | Short
Duration
Income Fund | |
| First $1 billion | | | 0.25 | % | | | 0.53 | % | | | 0.31 | % | | | 0.26 | % | | | 0.44 | % | | | 0.40 | % |
| Next $1 billion | | | 0.23 | | | | 0.48 | | | | 0.28 | | | | 0.23 | | | | 0.40 | | | | 0.36 | |
| Next $3 billion | | | 0.22 | | | | 0.45 | | | | 0.27 | | | | 0.22 | | | | 0.38 | | | | 0.34 | |
| Next $3 billion | | | 0.22 | | | | 0.44 | | | | 0.26 | | | | 0.22 | | | | 0.37 | | | | 0.33 | |
| Over $8 billion | | | 0.22 | | | | 0.44 | | | | 0.25 | | | | 0.21 | | | | 0.36 | | | | 0.32 | |
The Trustees noted that the breakpoints were designed to share potential economies of scale, if any, with the Funds and their shareholders as assets under management reach those asset levels. The Trustees considered the amounts of assets in the Funds; the Funds’ recent share purchase and redemption activity; the information provided by the Investment Adviser relating to the costs of the services provided by the Investment Adviser and its affiliates and their realized profits; information comparing fee rates charged by the Investment Adviser with fee rates charged to other funds in the peer groups; and the Investment Adviser’s undertakings to waive a portion of its management fees (with respect to each Fund other than the Enhanced Income Fund and Short Duration Income Fund) and to limit certain expenses of the Funds that exceed specified levels, as well as Goldman Sachs & Co. LLC’s (“Goldman Sachs”) undertaking to waive a portion of the distribution and service fees paid by the Short Duration Government Fund’s and Short Duration Income Fund’s Class C Shares. Upon reviewing these matters at the Annual Meeting, the Trustees concluded that the fee breakpoints represented a means of assuring that benefits of scalability, if any, would be passed along to shareholders at the specified asset levels. They also noted that the Investment Adviser had passed along savings to shareholders of the Short Duration Government Fund, which had asset levels above at least the first breakpoint during the prior fiscal year.
With respect to the Short-Term Conservative Income Fund, the Trustees noted that the Fund does not have management fee breakpoints. They considered the asset levels in the Fund; the Fund’s recent purchase and redemption activity; the information provided by the Investment Adviser relating to the costs of the services provided by the Investment Adviser and its affiliates and their realized profits; information comparing the contractual fee rates charged by the Investment Adviser with fee rates charged to
151
GOLDMAN SACHS SHORT DURATION AND GOVERNMENT FIXED INCOME FUNDS
Statement Regarding Basis for Approval of Management Agreements (Unaudited) (continued)
other funds in the peer group; and the Investment Adviser’s undertaking to limit certain expenses of the Fund and to waive certain fees that exceed specified levels.
Other Benefits to the Investment Adviser and Its Affiliates
The Trustees also considered the other benefits derived by the Investment Adviser and its affiliates from their relationships with the Funds as stated above, including: (a) transfer agency fees received by Goldman Sachs; (b) futures commissions earned by Goldman Sachs for executing futures transactions on behalf of the Funds; (c) trading efficiencies resulting from aggregation of orders of the Funds with those for other funds or accounts managed by the Investment Adviser; (d) the Investment Adviser’s ability to leverage the infrastructure designed to service the Funds on behalf of its other clients; (e) the Investment Adviser’s ability to cross-market other products and services to Fund shareholders; (f) Goldman Sachs’ retention of certain fees as Fund Distributor; (g) the Investment Adviser’s ability to negotiate better pricing with custodians on behalf of its other clients, as a result of the relationship with the Funds; and (h) the possibility that the working relationship between the Investment Adviser and the Funds’ third-party service providers may cause those service providers to be more likely to do business with other areas of Goldman Sachs. In the course of considering the foregoing, the Independent Trustees requested and received further information quantifying certain of these fall-out benefits.
Other Benefits to the Funds and Their Shareholders
The Trustees also noted that the Funds receive certain potential benefits as a result of their relationship with the Investment Adviser, including: (a) trading efficiencies resulting from aggregation of orders of the Funds with those of other funds or accounts managed by the Investment Adviser; (b) enhanced servicing from vendors because of the volume of business generated by the Investment Adviser and its affiliates; (c) enhanced servicing from broker-dealers because of the volume of business generated by the Investment Adviser and its affiliates; (d) the Investment Adviser’s ability to negotiate favorable terms with derivatives counterparties on behalf of the Funds as a result of the size and reputation of the Goldman Sachs organization; (e) the Investment Adviser’s knowledge and experience gained from managing other accounts and products; (f) the Investment Adviser’s ability to hire and retain qualified personnel to provide services to the Funds because of the reputation of the Goldman Sachs organization; (g) the Funds’ access, through the Investment Adviser, to certain firmwide resources (e.g., proprietary risk management systems and databases), subject to certain restrictions; and (h) the Funds’ access to certain affiliated distribution channels. In addition, the Trustees noted the competitive nature of the mutual fund marketplace, and considered that many of the Funds’ shareholders invested in the Funds in part because of the Funds’ relationship with the Investment Adviser and that those shareholders have a general expectation that the relationship will continue.
Conclusion
In connection with their consideration of the Management Agreements, the Trustees gave weight to each of the factors described above, but did not identify any particular factor as controlling their decision. After deliberation and consideration of all of the information provided, including the factors described above, the Trustees concluded, in the exercise of their business judgment, that the management fees paid by each of the Funds were reasonable in light of the services provided to it by the Investment Adviser, the Investment Adviser’s costs and each Fund’s current and reasonably foreseeable asset levels. The Trustees unanimously concluded that the Investment Adviser’s continued management likely would benefit each Fund and its shareholders and that the Management Agreements should be approved and continued with respect to each Fund until June 30, 2018.
152
FUNDS PROFILE
Goldman Sachs Funds
Goldman Sachs is a premier financial services firm, known since 1869 for creating thoughtful and customized investment solutions in complex global markets.
Today, the Investment Management Division of Goldman Sachs serves a diverse set of clients worldwide, including private institutions, public entities and individuals. With approximately $1.25 trillion in assets under supervision as of September 30, 2017, Goldman Sachs Asset Management (“GSAM”) has portfolio management teams located around the world and our investment professionals bring firsthand knowledge of local markets to every investment decision. Assets under supervision includes assets under management and other client assets for which Goldman Sachs does not have full discretion. GSAM leverages the resources of Goldman Sachs & Co. LLC subject to legal, internal and regulatory restrictions.
Money Market
Financial Square FundsSM
| ∎ | | Financial Square Treasury Solutions Fund1 |
| ∎ | | Financial Square Government Fund1 |
| ∎ | | Financial Square Money Market Fund2 |
| ∎ | | Financial Square Prime Obligations Fund2 |
| ∎ | | Financial Square Treasury Instruments Fund1 |
| ∎ | | Financial Square Treasury Obligations Fund1 |
| ∎ | | Financial Square Federal Instruments Fund1 |
| ∎ | | Financial Square Tax-Exempt Money Market Fund2 |
Investor FundsSM
| ∎ | | Investor Money Market Fund3 |
| ∎ | | Investor Tax-Exempt Money Market Fund3 |
Fixed Income
Short Duration and Government
| ∎ | | High Quality Floating Rate Fund |
| ∎ | | Short-Term Conservative Income Fund |
| ∎ | | Short Duration Government Fund |
| ∎ | | Short Duration Income Fund |
| ∎ | | Inflation Protected Securities Fund |
Multi-Sector
Municipal and Tax-Free
| ∎ | | High Yield Municipal Fund |
| ∎ | | Dynamic Municipal Income Fund |
| ∎ | | Short Duration Tax- Free Fund |
Single Sector
| ∎ | | Investment Grade Credit Fund |
| ∎ | | High Yield Floating Rate Fund |
| ∎ | | Emerging Markets Debt Fund |
| ∎ | | Local Emerging Markets Debt Fund |
| ∎ | | Dynamic Emerging Markets Debt Fund |
Fixed Income Alternatives
| ∎ | | Long Short Credit Strategies Fund |
Fundamental Equity
| ∎ | | Small/Mid Cap Value Fund |
| ∎ | | Small/Mid Cap Growth Fund |
| ∎ | | Concentrated Growth Fund7 |
| ∎ | | Technology Opportunities Fund |
| ∎ | | Growth Opportunities Fund |
| ∎ | | Rising Dividend Growth Fund |
Tax-Advantaged Equity
| ∎ | | U.S. Tax-Managed Equity Fund |
| ∎ | | International Tax-Managed Equity Fund |
| ∎ | | U.S. Equity Dividend and Premium Fund |
| ∎ | | International Equity Dividend and Premium Fund |
Equity Insights
| ∎ | | Small Cap Equity Insights Fund |
| ∎ | | U.S. Equity Insights Fund |
| ∎ | | Small Cap Growth Insights Fund |
| ∎ | | Large Cap Growth Insights Fund |
| ∎ | | Large Cap Value Insights Fund |
| ∎ | | Small Cap Value Insights Fund |
| ∎ | | International Small Cap Insights Fund |
| ∎ | | International Equity Insights Fund |
| ∎ | | Emerging Markets Equity Insights Fund |
Fundamental Equity International
| ∎ | | Strategic International Equity Fund |
| ∎ | | Focused International Equity Fund |
| ∎ | | Emerging Markets Equity Fund |
Select Satellite
| ∎ | | Real Estate Securities Fund |
| ∎ | | International Real Estate Securities Fund |
| ∎ | | Commodity Strategy Fund |
| ∎ | | Global Real Estate Securities Fund |
| ∎ | | Alternative Premia Fund9 |
| ∎ | | Absolute Return Tracker Fund |
| ∎ | | Managed Futures Strategy Fund |
| ∎ | | MLP Energy Infrastructure Fund |
| ∎ | | Multi-Manager Alternatives Fund |
| ∎ | | Absolute Return Multi-Asset Fund |
| ∎ | | Global Infrastructure Fund |
Total Portfolio Solutions
| ∎ | | Global Managed Beta Fund |
| ∎ | | Multi-Manager Non-Core Fixed Income Fund |
| ∎ | | Multi-Manager U.S. Dynamic Equity Fund |
| ∎ | | Multi-Manager Global Equity Fund |
| ∎ | | Multi-Manager International Equity Fund |
| ∎ | | Tactical Tilt Overlay Fund |
| ∎ | | Balanced Strategy Portfolio |
| ∎ | | Multi-Manager U.S. Small Cap Equity Fund |
| ∎ | | Multi-Manager Real Assets Strategy Fund |
| ∎ | | Growth and Income Strategy Portfolio |
| ∎ | | Growth Strategy Portfolio |
| ∎ | | Equity Growth Strategy Portfolio |
| ∎ | | Satellite Strategies Portfolio |
| ∎ | | Enhanced Dividend Global Equity Portfolio |
| ∎ | | Tax-Advantaged Global Equity Portfolio |
| ∎ | | Strategic Factor Allocation Fund |
| ∎ | | Target Date 2020 Portfolio |
| ∎ | | Target Date 2025 Portfolio |
| ∎ | | Target Date 2030 Portfolio |
| ∎ | | Target Date 2035 Portfolio |
| ∎ | | Target Date 2040 Portfolio |
| ∎ | | Target Date 2045 Portfolio |
| ∎ | | Target Date 2050 Portfolio |
| ∎ | | Target Date 2055 Portfolio |
| ∎ | | GQG Partners International Opportunities Fund |
| 1 | | You could lose money by investing in the Fund. Although the Fund seeks to preserve the value of your investment at $1.00 per share, it cannot guarantee it will do so. An investment in the Fund is not a deposit of a bank and is not insured or guaranteed by the Federal Deposit Insurance Corporation or any other government agency. The Fund’s sponsor has no legal obligation to provide financial support to the Fund, and you should not expect that the sponsor will provide financial support to the Fund at any time. |
| 2 | | You could lose money by investing in the Fund. Because the share price of the Fund will fluctuate, when you sell your shares they may be worth more or less than what you originally paid for them. The Fund may impose a fee upon sale of your shares or may temporarily suspend your ability to sell shares if the Fund’s liquidity falls below required minimums because of market conditions or other factors. An investment in the Fund is not a deposit of a bank and is not insured or guaranteed by the Federal Deposit Insurance Corporation or any other government agency. The Fund’s sponsor has no legal obligation to provide financial support to the Fund, and you should not expect that the sponsor will provide financial support to the Fund at any time. |
| 3 | | You could lose money by investing in the Fund. Although the Fund seeks to preserve the value of your investment at $1.00 per share, it cannot guarantee it will do so. The Fund may impose a fee upon sale of your shares or may temporarily suspend your ability to sell shares if the Fund’s liquidity falls below required minimums because of market conditions or other factors. An investment in the Fund is not a deposit of a bank and is not insured or guaranteed by the Federal Deposit Insurance Corporation or any other government agency. The Fund’s sponsor has no legal obligation to provide financial support to the Fund, and you should not expect that the sponsor will provide financial support to the Fund at any time. |
| 4 | | Effective on June 20, 2017, the Goldman Sachs Fixed Income Macro Strategies Fund was renamed the Goldman Sachs Strategic Macro Fund. |
| 5 | | Effective on June 20, 2017, the Goldman Sachs Growth and Income Fund was renamed the Goldman Sachs Equity Income Fund. |
| 6 | | Effective after the close of business on August 31, 2017, the Goldman Sachs Flexible Cap Growth Fund was renamed the Goldman Sachs Flexible Cap Fund. |
| 7 | | Effective on July 28, 2017, the Goldman Sachs Focused Growth Fund was reorganized with and into the Goldman Sachs Concentrated Growth Fund. |
| 8 | | Effective after the close of business on October 31, 2017, the Goldman Sachs Dynamic U.S. Equity Fund was renamed the Goldman Sachs Blue Chip Fund. |
| 9 | | Effective after the close of business on October 30, 2017, the Goldman Sachs Dynamic Allocation Fund was renamed the Goldman Sachs Alternative Premia Fund. Financial Square FundsSM and Investor FundsSM are registered service marks of Goldman Sachs & Co. LLC. |
| * | | This list covers open-end funds only. Please visit our website at www.GSAMFUNDS.com to learn about our closed-end funds and exchange-traded funds. |
| | |
TRUSTEES Ashok N. Bakhru, Chairman Kathryn A. Cassidy Diana M. Daniels Herbert J. Markley James A. McNamara Jessica Palmer Roy W. Templin Gregory G. Weaver | | OFFICERS James A. McNamara, President Scott M. McHugh, Treasurer, Senior Vice President and Principal Financial Officer Joseph F. DiMaria, Assistant Treasurer and Principal Accounting Officer Caroline L. Kraus, Secretary |
| |
GOLDMAN SACHS & CO. LLC Distributor and Transfer Agent | | GOLDMAN SACHS ASSET MANAGEMENT, L.P. Investment Adviser |
Visit our website at www.GSAMFUNDS.com to obtain the most recent month-end returns.
Goldman Sachs Asset Management, L.P., 200 West Street, New York, New York 10282
The reports concerning the Funds included in this shareholder report may contain certain forward-looking statements about the factors that may affect the performance of the Funds in the future. These statements are based on Fund management’s predictions and expectations concerning certain future events and their expected impact on the Funds, such as performance of the economy as a whole and of specific industry sectors, changes in the levels of interest rates, the impact of developing world events, and other factors that may influence the future performance of the Funds. Management believes these forward-looking statements to be reasonable, although they are inherently uncertain and difficult to predict. Actual events may cause adjustments in portfolio management strategies from those currently expected to be employed.
A description of the policies and procedures that the Funds use to determine how to vote proxies relating to portfolio securities and information regarding how a Fund voted proxies relating to portfolio securities during the most recent 12-month period ended June 30 is available (i) without charge, upon request by calling 1-800-526-7384 (for Retail Shareholders) or 1-800-621-2550 (for Institutional Shareholders); and (ii) on the Securities and Exchange Commission web site at http://www.sec.gov.
The Funds file their complete schedule of portfolio holdings with the Securities and Exchange Commission (“SEC”) for the first and third quarters of each fiscal year on Form N-Qs. The Funds’ Form N-Qs are available on the SEC’s web site at http://www.sec.gov within 60 days after the Funds’ first and third fiscal quarters. The Funds’ Form N-Qs may be reviewed and copied at the SEC’s Public Reference Room in Washington, D.C., and information on the operation of the Public Reference Room may also be obtained by calling 1-800-SEC-0330. Forms N-Q may be obtained upon request and without charge by calling 1-800-526-7384 (for Retail Shareholders) or 1-800-621-2550 (for Institutional Shareholders).
Goldman Sachs & Co. LLC (“Goldman Sachs”) does not provide legal, tax or accounting advice. Any statement contained in this communication (including any attachments) concerning U.S. tax matters was not intended or written to be used, and cannot be used, for the purpose of avoiding penalties under the Internal Revenue Code, and was written to support the promotion or marketing of the transaction(s) or matter(s) addressed. Clients of Goldman Sachs should obtain their own independent tax advice based on their particular circumstances.
Fund holdings and allocations shown are as of September 30, 2017 and may not be representative of future investments. Fund holdings should not be relied on in making investment decisions and should not be construed as research or investment advice regarding particular securities. Current and future holdings are subject to risk.
The portfolio risk management process includes an effort to monitor and manage risk, but does not imply low risk.
Economic and market forecasts presented herein reflect our judgment as of the date of this presentation and are subject to change without notice. These forecasts do not take into account the specific investment objectives, restrictions, tax and financial situation or other needs of any specific client. Actual data will vary and may not be reflected here. These forecasts are subject to high levels of uncertainty that may affect actual performance. Accordingly, these forecasts should be viewed as merely representative of a broad range of possible outcomes. These forecasts are estimated, based on assumptions, and are subject to significant revision and may change materially as economic and market conditions change. Goldman Sachs has no obligation to provide updates or changes to these forecasts. Case studies and examples are for illustrative purposes only.
THIS MATERIAL IS FOR INFORMATIONAL PURPOSES ONLY AND IS PROVIDED SOLELY ON THE BASIS THAT IT WILL NOT CONSTITUTE INVESTMENT OR OTHER ADVICE OR A RECOMMENDATION RELATING TO ANY PERSON’S OR PLAN’S INVESTMENT OR OTHER DECISIONS, AND GOLDMAN SACHS IS NOT A FIDUCIARY OR ADVISOR WITH RESPECT TO ANY PERSON OR PLAN BY REASON OF PROVIDING THE MATERIAL OR CONTENT HEREIN INCLUDING UNDER THE EMPLOYEE RETIREMENT INCOME SECURITY ACT OF 1974 OR DEPARTMENT OF LABOR REGULATIONS. PLAN SPONSORS AND OTHER FIDUCIARIES SHOULD CONSIDER THEIR OWN CIRCUMSTANCES IN ASSESSING ANY POTENTIAL COURSE OF ACTION.
This material is not authorized for distribution to prospective investors unless preceded or accompanied by a current Prospectus or summary prospectus, if applicable. Investors should consider a Fund’s objective, risks, and charges and expenses, and read the summary prospectus, if available, and/or the Prospectus carefully before investing or sending money. The summary prospectus, if available, and the Prospectus contain this and other information about a Fund and may be obtained from your authorized dealer or from Goldman Sachs & Co. LLC by calling (retail – 1-800-526-7384) (institutional – 1-800-621-2550).
Goldman Sachs is the distributor of the Goldman Sachs Funds.
© 2017 Goldman Sachs. All rights reserved. 112185-TMPL-11/2017-654499 SDFISAR-17/19K
Goldman Sachs Funds

| | | | |
| | |
| Semi-Annual Report | | | | September 30, 2017 |
| | |
| | | | Single Sector Fixed Income Funds |
| | | | Dynamic Emerging Markets Debt |
| | | | Emerging Markets Debt |
| | | | High Yield |
| | | | High Yield Floating Rate |
| | | | Investment Grade Credit |
| | | | Local Emerging Markets Debt |
| | | | U.S. Mortgages |

Goldman Sachs Single Sector Fixed Income Funds
| ∎ | | DYNAMIC EMERGING MARKETS DEBT |
| ∎ | | HIGH YIELD FLOATING RATE |
| ∎ | | INVESTMENT GRADE CREDIT |
| ∎ | | LOCAL EMERGING MARKETS DEBT |
| | | | |
| | | |
| NOT FDIC-INSURED | | May Lose Value | | No Bank Guarantee |
GOLDMAN SACHS SINGLE SECTOR FIXED INCOME FUNDS
What Differentiates the Goldman Sachs Asset Management Fixed Income Investment Process?
At Goldman Sachs Asset Management, L.P. (“GSAM”), the goal of our fixed income investment process is to provide consistent, strong performance by actively managing our portfolios within a research-intensive, risk-managed framework.
A key element of our fixed income investment philosophy is to evaluate the broadest global opportunity set to capture relative value across sectors and instruments. Our globally integrated investment process involves managing dynamically along the risk/return spectrum, as we continue to develop value-added strategies through:

| ∎ | | Assess relative value among securities and sectors |
| ∎ | | Leverage the vast resources of GSAM in selecting securities for each portfolio |

| ∎ | | Team approach to decision making |
| ∎ | | Manage risk by avoiding significant sector and interest rate bets |
| ∎ | | Careful management of yield curve strategies — while closely managing portfolio duration |

Fixed Income portfolios that:
| | ∎ | | Include domestic and global investment options, income opportunities, and access to areas of specialization such as high yield | |
| | ∎ | | Capitalize on GSAM’s industry-renowned credit research capabilities | |
| | ∎ | | Use a risk-managed framework to seek total return, recognizing the importance of investors’ capital accumulation goals as well as their need for income | |
The portfolio risk management process includes an effort to monitor and manage risk, but does not imply low risk.
1
MARKET REVIEW
Goldman Sachs Single Sector Fixed Income Funds
Market Review
During the six months ended September 30, 2017 (the “Reporting Period”), the performance of the global fixed income markets was primarily driven by geopolitical events, improving economic growth around the world and changing market expectations about central monetary policy.
When the Reporting Period began with the second quarter of 2017, spread, or non-government bond, sectors generally recorded positive returns, though with mixed results relative to U.S. Treasury securities. Political developments led to temporary bouts of volatility early in the quarter, driving weakness in Brazilian, U.S. and U.K. fixed income assets as well as a credit rating downgrade of South Africa’s sovereign debt. Political risks receded in May 2017 on the centrist candidate’s victory in the French presidential election, which was supportive of French and European peripheral bonds broadly. On the economic front, U.S. core inflation weakened for the third consecutive month in May 2017, casting uncertainty over the pace of Federal Reserve (“Fed”) monetary tightening. Nonetheless, comments included in minutes from the Fed’s May and June 2017 policy meetings suggested an announcement about how and when the Fed would begin reducing the size of its balance sheet would be made sooner than the markets had previously anticipated. In Europe, economic data continued to surprise to the upside. At its June 2017 policy meeting, the European Central Bank (“ECB”) provided an optimistic assessment of the risks to growth, but revised downward its medium-term inflation forecasts. The ECB, Bank of Japan (“BoJ”) and Bank of England (“BoE”) left their respective monetary policies unchanged during the second calendar quarter, while the Fed raised interest rates for the second time in 2017 and the fourth time in a decade at its June 2017 policy meeting. As the quarter came to an end, a string of comments from global central bankers triggered a hawkish market reaction. (Hawkish suggests higher interest rates; opposite of dovish.) Global interest rates rose as the market anticipated a faster than expected pace of monetary policy tightening by the BoE, ECB and Bank of Canada (“BoC”). During the second quarter of 2017, the U.S. dollar weakened versus many global currencies.
During the third quarter of 2017, spread sectors broadly advanced, outperforming U.S. Treasury securities. The Fed kept its monetary policy unchanged but unveiled its plans for balance sheet normalization. (Balance sheet normalization refers to the steps the Fed will take to reverse quantitative easing and remove the substantial monetary accommodation it has provided to the economy since the financial crisis began in 2007.) This prompted a hawkish market reaction, with the U.S. dollar appreciating and yields on U.S. government bonds rising. However, the U.S. Treasury yield curve, or spectrum of maturities, only steepened modestly due to geopolitical uncertainty and mixed U.S. economic data, including weak inflation readings. (A steepening yield curve is one wherein the differential in yields between longer-term and shorter-term maturities widens.) The central banks of other developed countries also set the stage for less accommodative monetary policy. The BoE noted “a majority” of its policymakers were in favor of tightening policy “over the coming months,” while the BoC surprised the markets with two consecutive rate hikes. The market’s expectations for a BoE rate hike in November 2017, along with a constructive tone for Brexit negotiations, also drove the British pound higher versus the U.S. dollar. (Brexit refers to the U.K.’s efforts to exit the European Union.) Overall, the U.S. dollar continued to weaken relative to many global currencies during the third calendar quarter.
For the Reporting Period as a whole, spread sectors outperformed U.S. Treasury securities, led by high yield corporate bonds, sovereign emerging markets debt and investment grade
2
MARKET REVIEW
corporate bonds. Commercial mortgage-backed securities, agency securities, asset-backed securities and mortgage-backed securities also outperformed U.S. Treasuries, albeit to a lesser extent. The U.S. Treasury yield curve flattened slightly during the Reporting Period, as yields on shorter-term maturities generally rose and yields on intermediate- and longer-term maturities fell. The yield on the bellwether 10-year U.S. Treasury declined approximately seven basis points to end the Reporting Period at 2.33% . (A basis point is 1/100th of a percent. A flattening yield curve is one wherein the differential in yields between longer-term and shorter-term maturities narrows.)
Looking Ahead
At the end of the Reporting Period, we believed global economic growth remained strong, with broad-based expansion in all corners of the world. Business investment appeared to be improving, in our view, with the drag from commodity-oriented countries fading and global trade buoyant despite protectionist rhetoric following the 2016 U.S. elections. We also note that forward-looking activity indicators, including purchasing managers’ surveys, pointed to further momentum, particularly within developed markets.
Regarding the U.S., we believe economic growth is supported by a healthy labor market and robust consumption as well as by revived proposals for fiscal stimulus toward the end of the Reporting Period. In the Eurozone, economic growth surprised to the upside, driven by consumption and trade, though we expect some moderation in the near term due to the strength of the euro. In the longer term, we expect spillover effects from Brexit. However, during the Reporting Period, the supportive global economic growth environment boosted trade and appeared to be cushioning the impact of Brexit negotiations on both the U.K. and the European Union. In Japan, economic growth surprised to the upside and consumer sentiment remained healthy despite stagnant wage growth. As for China, we expect an ongoing focus on deleveraging but think there will be little tolerance if the country’s Gross Domestic Product drops below 6.4% given policymakers’ commitment to doubling incomes and growth from their 2010 levels by the year 2020.
The expansion in global economic growth during the Reporting Period had not yet been reflected in inflation data, which remained below central bank targets in key markets. In our opinion, low inflation has been due in part to structural trends, such as increased migration, lower productivity and lower inflation expectations. We expect inflation to gradually trend higher should labor markets tighten further and output gaps diminish. (The output gap is an economic measure of the difference between the actual output of an economy and its potential output.)
As for central bank policy, the job-rich recovery has resulted in a shift in tone. In our view, the Fed’s plans to normalize its balance sheet marks the beginning of an era of less monetary accommodation. Also, by the end of 2017, we expect the ECB to communicate its plans to reduce asset purchases through its quantitative easing program with tapered purchases likely to continue, we believe, through 2018. In the U.K., we see scope for a BoE rate hike in November 2017 given policymakers’ recent communications. Meanwhile, the BoC has commenced a rate hiking cycle, though we expect the trajectory for its future rate hikes to be shallower than in the U.S.
Overall, at the end of the Reporting Period, we believed the macro backdrop of solid economic growth, subdued inflation and contained volatility was supportive for riskier asset classes. We saw opportunities in high-yielding emerging market currencies versus the U.S. dollar. That
3
MARKET REVIEW
said, proposed U.S. tax reform could be inflationary and require more monetary tightening than currently expected. This would likely be supportive for the U.S. dollar, particularly if we see more hawkish leadership at the Fed.
Among spread sectors, we remained cautious about corporate bonds at the end of the Reporting Period, given that the U.S. is in the late stage of the credit cycle and because of extended valuations, in our view. When the Reporting Period concluded, corporate credit spreads (yield differentials versus duration-equivalent U.S. Treasury securities) were near historically tight levels. We think this makes corporate credit vulnerable to a sharp pick up in volatility, which could arise from several catalysts, including an unwinding of global central bank quantitative easing programs, an inflation surprise that leads to a more hawkish monetary policy outlook than the market had previously priced in, increasing geopolitical tensions and/or missteps by central bank policymakers, particularly in China. Overall, at the end of the Reporting Period, we continued to see value in Federal Family Education Loan Program (“FFELP”) student loan asset backed securities, which we believe offer attractive yields along with strong credit protection. We also had a positive view of collateralized loan obligations and residential mortgage-backed securities. Within residential mortgage-backed securities, we favored legacy non-agency mortgage backed securities (in general, those issued before the 2008-2009 financial crisis), which should continue to benefit, in our opinion, from low supply and improving collateral performance.
4
PORTFOLIO RESULTS
Goldman Sachs Dynamic Emerging Markets Debt Fund
Investment Objective
The Fund seeks a high level of total return consisting of income and capital appreciation.
Portfolio Management Discussion and Analysis
Below, the Goldman Sachs Global Fixed Income Investment Management Team discusses the Goldman Sachs Dynamic Emerging Markets Debt Fund’s (the “Fund”) performance and positioning for the six-month period ended September 30, 2017 (the “Reporting Period”).
| Q | | How did the Fund perform during the Reporting Period? |
| A | | During the Reporting Period, the Fund’s Class A, C, Institutional, Investor (formerly Class IR Shares) and R Shares generated cumulative total returns, without sales charges, of 5.66%, 5.38%, 5.95%, 5.91% and 5.63%, respectively. These returns compare to the 5.91% cumulative total return of the Fund’s benchmark, the Dynamic Emerging Markets Debt Fund Composite Index (the “Index”), which is comprised 50% of the J.P. Morgan Government Bond Index — Emerging Markets (GBI-EMSM) Global Diversified Index (Gross, USD, Unhedged), 25% of the J.P. Morgan Emerging Markets Bond Index (EMBISM) Global Diversified Index (Gross, USD, Unhedged) and 25% of the J.P. Morgan Corporate Emerging Markets Bond Index (CEMBISM) Broad Diversified Index (Gross, USD, Unhedged), during the same time period. The components of the Fund’s blended benchmark, the J.P. Morgan GBI-EMSM Global Diversified Index, J.P. Morgan EMBISM Global Diversified Index and J.P. Morgan CEMBISM Broad Diversified Index, generated cumulative total returns of 7.30%, 4.93% and 4.13%, respectively, during the Reporting Period. |
| Q | | What economic and market factors most influenced emerging markets debt as a whole during the Reporting Period? |
| A | | Emerging markets debt overall produced solid gains during the Reporting Period, supported by ongoing momentum in global economic growth, investors’ expectations for a gradual U.S. interest rate hiking cycle, little progress on U.S. protectionist policies and steady investment inflows. |
| | | During the Reporting Period, external emerging markets debt, as represented by the J.P. Morgan EMBISM Global Diversified Index, returned 4.93%. Sovereign spreads (that is, the difference in yields between external emerging markets debt and U.S. Treasuries) tightened by approximately 50 basis points and closed the Reporting Period 423 basis points wider than U.S. Treasury securities. (A basis point is 1/100th of a percentage point.) The top performing emerging external debt markets in the Index (in U.S. dollar terms1) were Mozambique (+15.56%), Ghana (+13.22%) and Ukraine (+12.99%). The weakest performing countries were Venezuela (-7.15%), Bolivia (-0.49%) and Lebanon (+0.67%). |
| | | Local emerging markets debt, as represented by the J.P. Morgan GBI-EMSM Global Diversified Index, posted a return of 7.30%, with approximately 2.56% due to changes in local interest rates and approximately 4.74% due to currency appreciation against the U.S. dollar. Among countries, on a total return basis, the top performers in the Index (in U.S. dollar terms) during the Reporting Period were Peru (+11.15%), Indonesia (+11.01%) and Brazil (+8.85%). The weakest performing countries were Turkey (-4.53%), China (-2.29%) and Chile (-0.18%). |
| | | Corporate emerging markets debt, as represented by the J.P. Morgan CEMBISM Broad Diversified Index, returned 4.13%. Corporate spreads (that is, the difference in yields between corporate emerging markets debt and U.S. Treasuries) tightened by approximately 20 basis points and closed the Reporting Period 276 basis points wider than U.S. Treasury securities. In terms of issuance, the emerging markets corporate bond sector saw approximately $356 billion of gross new issuance between January 1, 2017 and the end of the Reporting Period, with a forecast for the calendar year of approximately $440 billion.2 Meanwhile, J.P. Morgan reports that the global emerging markets corporate default rate was 1.4% for the period between January 1, 2017 and |
| | 1 | | All regional and market returns are in U.S. dollar terms (unless otherwise specified), are based on country-specific stock market indices and reflect the reinvestment of any dividends if applicable. |
5
PORTFOLIO RESULTS
| | September 30, 2017. For the 2017 calendar year, J.P. Morgan estimates the global emerging markets corporate default rate will be approximately 2.2%, an improvement over 5.1% in 2016, as corporate fundamentals continue to recover, led by commodity-related credits and Latin American issuers. |
| Q | | What key factors were responsible for the Fund’s performance during the Reporting Period? |
| A | | During the Reporting Period, the Fund was hurt by issue selection overall of emerging markets corporate bonds and emerging markets external debt. The Fund benefited from our active currency management (accomplished through the use of forward foreign currency exchange contracts as well as bonds denominated in local currencies). Issue selection among local emerging markets bonds also contributed positively to the Fund’s relative returns during the Reporting Period. |
| Q | | Which segments of emerging markets debt most significantly affected Fund performance? |
| A | | The Fund’s short position in the euro, through which we funded long positions in various other currencies, detracted from relative performance during the Reporting Period. The euro strengthened amid strong economic activity and the European Central Bank’s planned tapering of quantitative easing measures. The Fund was also hampered by an underweight compared to the Index in Chinese external bonds (accomplished via credit default swaps). We implemented the underweight to hedge against any sharp downturn in China’s business cycle, which could be a headwind for the emerging markets overall. In addition, an overweight in the quasi-sovereign bonds of state-owned oil and natural gas company Petroleos de Venezuela, S.A. (“PDVSA”) dampened relative returns. The Fund was overweight PDVSA because we think the company offers significant long-term value. |
| | | On the positive side, the Fund was helped by long positions in the Czech koruna and Polish zloty (implemented through the use of forward foreign currency exchange contracts). The Fund’s long exposures to Central Eastern European currencies are based on our view that economic activity is improving in Europe, which should support Eastern European economies through trade linkages. A long position in the Mexican peso also added to the Fund’s results. We adopted the position because we believe the Mexican peso is undervalued, and we expect a turnaround in Mexico’s economy driven by a pickup in U.S. economic growth. |
| Q | | Did the Fund’s duration and yield curve positioning strategy help or hurt its results during the Reporting Period? |
| A | | The Fund’s U.S. duration and yield curve positioning did not have a meaningful impact on relative returns during the Reporting Period. Duration is a measure of the Fund’s sensitivity to changes in interest rates. Yield curve indicates a spectrum of maturities. |
| Q | | How did the Fund use derivatives and similar instruments during the Reporting Period? |
| A | | The Fund invested in U.S. Treasury futures, Eurodollar futures, forward foreign currency exchange contracts, interest rate swaps, cross currency swaps, credit default swaps, total return swaps, structured notes and non-deliverable currency forwards. U.S. Treasury futures were used to manage U.S. interest rate duration. Eurodollar futures were used to express our views on the direction of interest rates and to facilitate specific duration and yield curve strategies. Eurodollar futures are contracts that have underlying assets linked to time deposits denominated in U.S. dollars at banks outside the U.S. Forward foreign currency exchange contracts were used for hedging purposes or to express a positive view on a given currency. Interest rate swaps were used to express our views on the direction of a country’s interest rates. Cross-currency swaps were employed to express relative value views on given currencies as well as our views on the direction of a country’s interest rates. Credit default swaps were used to implement specific credit-related investment strategies. Total return swaps and structured notes were used in place of buying a local currency denominated bond when a particular market was otherwise inaccessible or as a more efficient means of gaining access to a local market. Non-deliverable currency forwards were used to gain exposure to a particular country and also to take advantage of relative value opportunities. Derivatives may be used in combination with cash securities to implement our views in the Fund. |
| | | During the Reporting Period, we employed forward foreign currency exchange contracts to take long positions in the Czech koruna, Polish zloty and Mexican peso, which contributed positively to the Fund’s returns. The use of forward foreign currency exchange contracts to assume short positions in the euro and Singaporean dollar and to take a long position in the Argentinian peso detracted from performance. The Fund’s use of interest rate swaps to gain exposure to Brazilian and Czech Republic local interest rates had a positive impact on results, while its use of interest rate swaps to express our views on Polish local interest rates had |
6
PORTFOLIO RESULTS
| | a negative impact. In addition, we utilized credit default swaps to gain exposure to Chinese external debt, which detracted from performance. |
| Q | | Were there any notable changes in the Fund’s weightings during the Reporting Period? |
| A | | During the Reporting Period, we increased the Fund’s overweight positions relative to the Index in South African local interest rates and external bonds. The South African central bank kept its policy rate unchanged at 6.75% during September 2017, contrary to consensus expectations for a rate cut, and we think lower than expected inflation data may warrant monetary policy easing. South Africa’s economic data are improving, in our view, with the country’s current account deficit shrinking, inflation ticking lower and commodity prices stabilizing. In addition, uncertainty surrounding internal politics eased toward the end of the Reporting Period as the South African president survived a no-confidence vote. Also during the Reporting Period, we shifted the Fund from an overweight to an underweight position in Czech Republic local interest rates. We think its central bank has ample room to raise rates given the country’s negative output gap, above target inflation and undervalued currency. (A negative output gap occurs when a country’s output is less than what its economy could produce at full capacity.) However, the market had priced in a less aggressive view of rate hikes, giving us the opportunity to move the Fund to an underweight position. Finally, we reduced the Fund’s underweight in China’s external bonds during the Reporting Period. China’s pace of economic deceleration appears to have moderated; its Gross Domestic Product (“GDP”) growth has met market expectations; and the People’s Bank of China has been focusing on deleveraging and containing debt growth. However, as mentioned previously, we remain mindful of any sharp downturn in the Chinese business cycle, which could be a headwind for the emerging markets overall. |
| Q | | How was the Fund positioned relative to its benchmark index at the end of the Reporting Period? |
| A | | Within external emerging markets debt at the end of the Reporting Period, the Fund’s key overweight positions relative to the Index were in Indonesia, South Africa and Bulgaria. Its largest underweight positions were in China, Peru and Philippines. Within local emerging markets debt, the Fund’s top overweights were South Africa, Russia and Mexico, and its top underweights were the Czech Republic, Europe broadly and Turkey. Within corporate emerging markets debt, the Fund maintained a slight overweight relative to the Index in the consumer beverage sector at the end of the Reporting Period. It was underweight financials on concerns over limited disclosure about the quality of assets on company balance sheets, funding risks in certain instances when banks rely on the wholesale funding markets, and macro risks. In addition, we have found that the performance of banking emerging markets corporate bonds tends to be highly correlated with the performance of sovereign government debt. At the end of the Reporting Period, we continued to favor defensive non-cyclicals, such as bottlers and high yield telecommunications issues, that, in our view, often have spreads comparable with riskier cyclical names. Regionally, valuations looked attractive to us in Latin American corporate emerging markets debt, but we recognize a higher potential for volatility. Political developments are likely to be a factor in the future performance of Brazil’s corporate bonds, and the outlook for the country remained uncertain at the end of the Reporting Period, in our opinion. |
| Q | | What is the Fund’s tactical view and strategy for the months ahead? |
| A | | At the end of the Reporting Period, we continued to view emerging markets debt broadly as offering a high quality source of yield. That said, prices appeared to have reached fair value, driven mostly by low volatility, the maturity of the asset class overall, moderate global economic growth and the market’s expectations for monetary policy normalization by developed markets’ central banks. |
| | | Nevertheless, at the end of the Reporting Period, we believe valuations were less stretched than they were during the 2013 taper tantrum. (Taper tantrum refers to the way markets reacted when the Federal Reserve (the “Fed”) suggested it might begin tapering its quantitative easing program.) Emerging markets economies have seen significant improvement in their fundamentals, and, in our view, they are better positioned to withstand any negative impact from normalization in developed markets’ central bank monetary policies. South Africa, Turkey, Indonesia, India and Brazil — the five countries that in 2013 depended most on foreign investment to support their growth — generally have narrower account deficits and better foreign reserve coverage than they did in 2013. A recovery in oil prices due to oil production cuts is also providing support for commodity exporters. |
| | | Furthermore, while emerging markets debt has been sensitive in the past to risks associated with U.S. interest rates and deteriorating global trade, we find it hard to envisage a near-term decoupling of the asset class from strengthening |
7
PORTFOLIO RESULTS
| | U.S. and global economic growth, which are the main drivers of the Fed’s current interest rate hiking cycle. Overall, at the end of the Reporting Period, we anticipated higher U.S. interest rates, wherein Fed policymakers will likely have to balance their interest rate targets with planned balance sheet reductions. We note that the Fed factors in the possible impact of its policy decisions on global financial conditions. If the Fed continues to clearly communicate its intentions, emerging markets debt overall should be able to adjust to future interest rate increases, we believe. |
| | | In this environment, we think identifying investments that offer attractive risk-adjusted returns remains paramount. At the end of the Reporting Period, we favored countries with prudent fiscal management (where currencies have adjusted for lower oil prices) and/or idiosyncratic opportunities where valuations offer a strong potential risk/reward profile, in our view. We plan to closely monitor the evolution of U.S. foreign trade and fiscal policy. In addition, we remain vigilant about any sharp downturn in the Chinese business cycle. At the end of the Reporting Period, we continued to have a constructive view on Indonesia, which could benefit, in our view, from fiscal improvements due to a reduction in a fuel subsidy. The country has a modest debt to GDP ratio of 27%, and approximately 40% of its outstanding debt is denominated in foreign currency and is long-term debt. We believe this helps to minimize refinancing risk. We also remained positive at the end of the Reporting Period about several countries in the Central American and Caribbean region, including Dominican Republic, Costa Rica and Guatemala. Elsewhere, at the end of the Reporting Period, we were cautious on Poland, where the Fund held an underweight position based on valuations and because we see potential for fiscal slippage in 2017. (Fiscal slippage means that a government’s planned annual budget does not match actual spending because of something that affects the tax dollars collected.) Additionally, we planned to maintain the Fund’s underweight positions compared to the Index in small Asian economies, such as Malaysia and the Philippines, at the end of the Reporting Period. |
|
| |
In October 2017, the Board of Trustees of the Goldman Sachs Trust approved certain changes to the Goldman Sachs Dynamic Emerging Markets Debt Fund’s (the “Fund”) name, investment objective and principal investment strategy. After the close of business on December 26, 2017, the Fund will be renamed the Goldman Sachs Total Emerging Markets Income Fund. At the same time, the Fund will have a new investment objective, which will be to seek current income. As a secondary objective, the Fund will seek capital appreciation. With regard to its principal investment strategy, the Fund will continue to invest in emerging markets debt and the currencies of issuers in emerging markets countries. However, after the close of business on December 26, 2017, the Fund will also invest in equity investments. In connection with the change in the Fund’s principal investment strategy, Raymond Chan will become a portfolio manager of the Fund, joining Samuel Finkelstein. |
8
FUND BASICS
Dynamic Emerging Markets Debt Fund
as of September 30, 2017
| | | | | | | | | | | | | | | | | | | | | | | | | | | | | | |
| | PERFORMANCE REVIEW | |
| | | April 1, 2017–
September 30,
2017 | | Fund
Total
Return
(based
on NAV)1 | | | Dynamic
Emerging
Markets
Debt Fund
Composite
Index2 | | | J.P. Morgan
GBI-EMSM
Global
Diversified
Index3 | | | J.P. Morgan
EMBISM
Global
Diversified
Index4 | | | J.P. Morgan
CEMBISM
Broad
Diversified
Index5 | | | 30-Day
Standardized
Subsidized
Yield6 | | | 30-Day
Standardized
Unsubsidized
Yield6 | |
| | Class A | | | 5.66 | % | | | 5.91 | % | | | 7.30 | % | | | 4.93 | % | | | 4.13 | % | | | 4.27 | % | | | 2.56 | % |
| | Class C | | | 5.38 | | | | 5.91 | | | | 7.30 | | | | 4.93 | | | | 4.13 | | | | 3.70 | | | | 1.93 | |
| | Institutional | | | 5.95 | | | | 5.91 | | | | 7.30 | | | | 4.93 | | | | 4.13 | | | | 4.81 | | | | 3.02 | |
| | Investor | | | 5.91 | | | | 5.91 | | | | 7.30 | | | | 4.93 | | | | 4.13 | | | | 4.72 | | | | 2.93 | |
| | | Class R | | | 5.63 | | | | 5.91 | | | | 7.30 | | | | 4.93 | | | | 4.13 | | | | 4.18 | | | | 2.42 | |
| | 1 | | The net asset value (“NAV”) represents the net assets of the class of the Fund (ex-dividend) divided by the total number of shares of the class outstanding. The Fund’s performance assumes the reinvestment of dividends and other distributions. The Fund’s performance does not reflect the deduction of any applicable sales charges. |
| | 2 | | The Dynamic Emerging Markets Debt Fund Composite Index is comprised of the J.P. Morgan GBI-EMSM Global Diversified Index (50%), the J.P. Morgan EMBISM Global Diversified Index (25%), and the J.P. Morgan CEMBISM Broad Diversified Index (25%). The index figures do not reflect any deduction for fees, expenses or taxes. It is not possible to invest directly in an index. |
| | 3 | | The J.P. Morgan GBI-EMSM Global Diversified Index (with dividends reinvested) is an unmanaged index of debt instruments of 14 emerging countries. The index figures do not reflect any deduction for fees, expenses or taxes. It is not possible to invest directly in an index. |
| | 4 | | The J.P. Morgan EMBISM Global Diversified Index is an unmanaged index of debt instruments of 50 emerging countries. The index figures do not reflect any deduction for fees, expenses or taxes. It is not possible to invest directly in an index. |
| | 5 | | The J.P. Morgan CEMBISM Broad Diversified Index tracks total returns of U.S. dollar-denominated debt instruments issued by corporate entities in emerging markets countries. The index figures do not reflect any deduction for fees, expenses or taxes. It is not possible to invest directly in an index. |
| | 6 | | The method of calculation of the 30-Day Standardized Subsidized Yield is mandated by the Securities and Exchange Commission and is determined by dividing the net investment income per share earned during the last 30 days of the period by the maximum public offering price (“POP”) per share on the last day of the period. This number is then annualized. The 30-Day Standardized Subsidized Yield reflects fee waivers and/or expense reimbursements recorded by the Fund during the period. Without waivers and/or reimbursements, yields would be reduced. This yield does not necessarily reflect income actually earned and distributed by the Fund and, therefore, may not be correlated with the dividends or other distributions paid to shareholders. The 30-Day Standardized Unsubsidized Yield does not adjust for any fee waivers and/or expense reimbursements in effect. If the Fund does not incur any fee waivers and/or expense reimbursements during the period, the 30-Day Standardized Subsidized Yield and 30-Day Standardized Unsubsidized Yield will be identical. |
The returns set forth in the table above represent past performance. Past performance does not guarantee future results. The Fund’s investment return and principal value will fluctuate so that an investor’s shares, when redeemed, may be worth more or less than their original cost. Current performance may be lower or higher than the performance quoted above. Please visit our web site at www.GSAMFUNDS.com to obtain the most recent month-end returns. Performance reflects applicable fee waivers and/or expense limitations in effect during the periods shown. In their absence, performance would be reduced. Returns do not reflect the deduction of taxes that a shareholder would pay on Fund distributions or the redemption of Fund shares.
9
FUND BASICS
| | | | | | | | | | | | | | |
| | STANDARDIZED TOTAL RETURNS7 | |
| | | For the period ended 9/30/17 | | One Year | | | Since Inception | | | Inception Date | |
| | Class A | | | 2.03 | % | | | 0.21 | % | | | 5/31/13 | |
| | Class C | | | 5.08 | | | | 0.61 | | | | 5/31/13 | |
| | Institutional | | | 7.03 | | | | 1.67 | | | | 5/31/13 | |
| | Investor | | | 7.06 | | | | 1.55 | | | | 5/31/13 | |
| | | Class R | | | 6.51 | | | | 1.10 | | | | 5/31/13 | |
| | 7 | | The Standardized Total Returns are average annual total returns or cumulative total returns (only if the performance period is one year or less) as of the most recent calendar quarter-end. They assume reinvestment of all distributions at NAV. These returns reflect a maximum initial sales charge of 4.50% for Class A Shares and the assumed contingent deferred sales charge for Class C Shares (1% if redeemed within 12 months of purchase). Because Institutional, Investor and Class R Shares do not involve a sales charge, such a charge is not applied to their Standardized Total Returns. The Fund will charge a 2% redemption fee on the redemption of shares (including by exchange) held for 30 calendar days or less. The performance figures do not reflect the deduction of the redemption fee. If reflected, the redemption fee would reduce the performance quoted. |
The returns set forth in the table above represent past performance. Past performance does not guarantee future results. The Fund’s investment return and principal value will fluctuate so that an investor’s shares, when redeemed, may be worth more or less than their original cost. Current performance may be lower or higher than the performance quoted above. Please visit our web site at www.GSAMFUNDS.com to obtain the most recent month-end returns. Performance reflects applicable fee waivers and/or expense limitations in effect during the periods shown. In their absence, performance would be reduced. Returns do not reflect the deduction of taxes that a shareholder would pay on Fund distributions or the redemption of Fund shares.
10
FUND BASICS
| | | | | | | | | | |
| | EXPENSE RATIOS8 | |
| | | | | Net Expense Ratio
(Current) | | | Gross Expense Ratio
(Before Waivers) | |
| | Class A | | | 1.20 | % | | | 2.34 | % |
| | Class C | | | 1.96 | | | | 3.09 | |
| | Institutional | | | 0.86 | | | | 2.00 | |
| | Investor | | | 0.96 | | | | 2.09 | |
| | | Class R | | | 1.45 | | | | 2.59 | |
| | 8 | | The expense ratios of the Fund, both current (net of applicable fee waivers and/or expense limitations) and before waivers (gross of applicable fee waivers and/or expense limitations) are as set forth above according to the most recent publicly available Prospectus for the Fund and may differ from the expense ratios disclosed in the Financial Highlights in this report. Pursuant to a contractual arrangement, the Fund’s waivers and/or expense limitations will remain in place through at least July 28, 2018, and prior to such date the Investment Adviser may not terminate the arrangements without the approval of the Fund’s Board of Trustees. If these arrangements are discontinued in the future, the expense ratios may change without shareholder approval. |
| | | | | | | | | | |
| | TOP TEN COUNTRY ALLOCATION9 | |
| | | | | Percentage of Net Assets | |
| | | | | as of 9/30/17 | | | as of 3/31/17 | |
| | South Africa | | | 7.8 | % | | | 4.9 | % |
| | Mexico | | | 7.1 | | | | 3.5 | |
| | Indonesia | | | 6.5 | | | | 6.2 | |
| | Colombia | | | 5.8 | | | | 3.9 | |
| | Russia | | | 5.6 | | | | 5.1 | |
| | Argentina | | | 5.5 | | | | 4.7 | |
| | Peru | | | 5.3 | | | | 4.6 | |
| | United States | | | 4.4 | | | | 2.8 | |
| | Turkey | | | 4.3 | | | | 4.2 | |
| | Brazil | | | 3.7 | | | | 8.1 | |
| | | Other | | | 37.4 | | | | 39.1 | |
| | 9 | | The percentage shown for each investment category reflects the value of investments in that country as a percentage of net assets. The table does not include investment companies of 2.7% as of 9/30/17 and 2.8% as of 3/31/17. Figures in the above graph may not sum to 100% due to the exclusion of other assets and liabilities. The table depicts the Fund’s investments but may not represent the Fund’s market exposure due to the exclusion of certain derivatives, if any, as listed in the Additional Investment Information section of the Schedule of Investments. |
11
PORTFOLIO RESULTS
Goldman Sachs Emerging Markets Debt Fund
Investment Objective
The Fund seeks a high level of total return consisting of income and capital appreciation.
Portfolio Management Discussion and Analysis
Below, the Goldman Sachs Global Fixed Income Investment Management Team discusses the Goldman Sachs Emerging Markets Debt Fund’s (the “Fund”) performance and positioning for the six-month period ended September 30, 2017 (the “Reporting Period”).
| | 1 | | All regional and market returns are in U.S. dollar terms (unless otherwise specified), are based on country-specific stock market indices and reflect the reinvestment of any dividends if applicable. |
| Q | | How did the Fund perform during the Reporting Period? |
| A | | During the Reporting Period, the Fund’s Class A, C, Institutional, Investor (formerly Class IR Shares) and R6 Shares generated cumulative total returns, without sales charges, of 4.65%, 4.26%, 4.82%, 4.78% and 4.83%, respectively. These returns compare to the 4.93% cumulative total return of the Fund’s benchmark, the J.P. Morgan Emerging Markets Bond Index (EMBISM) Global Diversified Index (Gross, USD, Unhedged) (the “Index”), during the same time period. |
| Q | | What economic and market factors most influenced emerging markets debt as a whole during the Reporting Period? |
| A | | External emerging markets debt overall generated positive returns during the Reporting Period, supported by ongoing momentum in global economic growth, investors’ expectations for a gradual U.S. interest rate hiking cycle, little progress on U.S. protectionist policies and steady investment inflows. |
| | | During the Reporting Period, external emerging markets debt, as represented by the Index, returned 4.93%. Sovereign spreads (that is, the difference in yields between external emerging markets debt and U.S. Treasuries) tightened by approximately 50 basis points and closed the Reporting Period 423 basis points wider than U.S. Treasury securities. (A basis point is 1/100th of a percentage point.) The top performing emerging external debt markets in the Index (in U.S. dollar terms1) were Mozambique (+15.56%), Ghana (+13.22%) and Ukraine (+12.99%). The weakest performing countries were Venezuela (-7.15%), Bolivia (-0.49%) and Lebanon (+0.67%). |
| Q | | What key factors were responsible for the Fund’s performance during the Reporting Period? |
| A | | During the Reporting Period, sector positioning within external emerging markets debt detracted from the Fund’s performance versus the Index. The Fund was also hampered by issue selection among emerging markets corporate bonds, although this was offset somewhat by sector positioning, which contributed positively. The Fund benefited from our active currency management (accomplished through the use of forward foreign currency exchange contracts as well as bonds denominated in local currencies). Issue selection of external emerging markets bonds and local emerging markets bonds also added to results. |
| Q | | Which segments of emerging markets debt most significantly affected Fund performance? |
| A | | The Fund was hurt during the Reporting Period by its short position in the euro, through which we funded long positions in various other currencies. The euro strengthened amid strong economic activity and the European Central Bank’s planned tapering of quantitative easing measures. The Fund was also hindered by an underweight compared to the Index in Chinese external bonds (accomplished via credit default swaps). We implemented the underweight to hedge against any sharp downturn in China’s business cycle, which could be a headwind for the emerging markets overall. Additionally, an overweight in the quasi-sovereign bonds of state-owned oil and natural gas company Petroleos de Venezuela, S.A. (“PDVSA”) detracted from relative performance. The Fund was overweight PDVSA because we think the company offers significant long-term value. |
| | | On the positive side, the Fund benefited from its long positions in the Czech koruna and Polish zloty (implemented through the use of forward foreign currency exchange contracts). The Fund has long exposure to Central Eastern |
12
PORTFOLIO RESULTS
| | European currencies as we think economic activity is improving in Europe, which should support Eastern European economies through trade linkages. An overweight relative to the Index in Argentinian external bonds also bolstered the Fund’s performance. Argentinian assets rallied since the country’s midterm primaries in August 2017 and were also supported by a positive political environment under the current president, a business-friendly leader who is in favor of reforms. At the end of the Reporting Period, we had a constructive outlook for Argentina’s economic growth, which we believe should help reduce both the country’s fiscal imbalance and the possibility of a funding crisis. |
| Q | | Did the Fund’s duration and yield curve positioning strategy help or hurt its results during the Reporting Period? |
A The Fund’s U.S. duration strategy and yield curve positioning did not have a meaningful impact on relative performance. Duration is a measure of the Fund’s sensitivity to changes in interest rates. Yield curve is a spectrum of maturities.
| Q | | How did the Fund use derivatives and similar instruments during the Reporting Period? |
| A | | The Fund invested in U.S. Treasury futures, Eurodollar futures, forward foreign currency exchange contracts, interest rate swaps, credit default swaps and structured notes. U.S. Treasury futures were used to manage U.S. interest rate duration. Eurodollar futures were used to express our views on the direction of interest rates and to facilitate specific duration and yield curve strategies. Eurodollar futures are contracts that have underlying assets linked to time deposits denominated in U.S. dollars at banks outside the U.S. Forward foreign currency exchange contracts were used for hedging purposes or to express a positive view on a given currency. Interest rate swaps were used to express our views on the direction of a country’s interest rates. Credit default swaps and structured notes were used in place of buying a local currency denominated bond when a particular market was otherwise inaccessible or as a more efficient means of gaining access to a local market. Derivatives may be used in combination with cash securities to implement our views in the Fund. |
| | | During the Reporting Period, the use of U.S. Treasury futures to manage U.S. interest rate duration detracted from the Fund’s performance. The use of forward foreign currency exchange contracts to take long positions in the Czech koruna, Polish zloty and Mexican peso contributed positively to the Fund’s returns. The use of forward foreign currency exchange contracts to assume short positions in the euro and U.S. dollar and to take a long position in the South African rand detracted from performance. The Fund’s use of interest rate swaps to gain exposure to Argentinian and Egyptian local interest rates had a positive impact on results, while its use of interest rate swaps to express our views on Brazilian local interest rates had a negative impact. In addition, during the Reporting Period, we utilized credit default swaps to gain exposure to Chinese external debt, which detracted from performance. |
| Q | | Were there any notable changes in the Fund’s weightings during the Reporting Period? |
| A | | During the Reporting Period, we increased the Fund’s overweights relative to the Index in South African and Turkish external debt. In our view, South Africa’s economic data are improving, with the country’s current account deficit shrinking, inflation ticking lower and commodity prices stabilizing. In addition, uncertainty surrounding internal politics eased toward the end of the Reporting Period as the South African president survived a no-confidence vote. Regarding Turkey, we believe fundamentals are strong with a decline in the debt to Gross Domestic Product (“GDP”) ratio, improvement in the current account deficit and stable international reserves. Turkey’s economic growth was robust — approximately 5% in the first quarter of 2017, exceeding market expectations. Near the end of the Reporting Period, political uncertainty lessened as Turkey’s president declared victory in a constitutional referendum. Additionally, during the Reporting Period, we reduced the size of the Fund’s overweight in Brazilian local interest rates, as the country’s central bank made four rate cuts, which brought its key policy interest rate down to 8.25% from 12.25%. Still, the Fund remained overweight because we expect the country’s central bank to continue its easing cycle given that Brazil’s output gap is large and inflation has dropped significantly and is below the central bank’s target. (The output gap is an economic measure of the difference between the actual output of an economy and its potential output.) Also, during the Reporting Period, we decreased the size of the Fund’s underweight compared to the Index in Chinese external bonds. China’s pace of economic deceleration appears to have moderated; its GDP growth has met market expectations; and the People’s Bank of China has been focusing on deleveraging and containing debt growth. The Fund maintains an underweight in Chinese external bonds because we remain mindful of the impact of a sharp downturn in the Chinese business cycle. |
13
PORTFOLIO RESULTS
| Q | | How was the Fund positioned relative to its benchmark index at the end of the Reporting Period? |
| A | | At the end of the Reporting Period, the Fund was overweight relative to the Index in Indonesian, Argentinian and Turkish external bonds. It was underweight the external bonds of Chile, Peru and Philippines. The Fund held overweight positions in Mexican, South African and Brazilian local interest rates. Additionally, it was overweight in European local interest rates broadly as well as in Polish and Chinese local interest rates. In terms of currencies, the Fund had long positions in the Czech koruna, Polish zloty and Mexican peso. It had short positions in the U.S. dollar, euro and Hong Kong dollar at the end of the Reporting Period. |
| Q | | What is the Fund’s tactical view and strategy for the months ahead? |
| A | | At the end of the Reporting Period, we continued to view emerging markets debt broadly as offering a high quality source of yield. That said, prices appeared to have reached fair value, driven mostly by low volatility, the maturity of the asset class overall, moderate global growth and the market’s expectations for monetary policy normalization by developed markets central banks. |
| | | Nevertheless, at the end of the Reporting Period, we believe valuations were less stretched than they were during the 2013 taper tantrum. (Taper tantrum refers to the way markets reacted when the Federal Reserve (the “Fed”) suggested it might begin tapering its quantitative easing program.) Emerging markets economies have seen significant improvement in their fundamentals, and, in our view, they are better positioned to withstand any negative impact from normalization in developed markets’ central bank monetary policies. South Africa, Turkey, Indonesia, India and Brazil — the five countries that in 2013 depended most on foreign investment to support their growth — generally have narrower account deficits and better foreign reserve coverage than they did in 2013. A recovery in oil prices due to oil production cuts is also providing support for commodity exporters. |
| | | Furthermore, while emerging markets debt has been sensitive in the past to risks associated with U.S. interest rates and deteriorating global trade, we find it hard to envisage a near-term decoupling of the asset class from strengthening U.S. and global economic growth, which are the main drivers of the Fed’s current interest rate hiking cycle. Overall, at the end of the Reporting Period, we anticipated higher U.S. interest rates, wherein Fed policymakers will likely have to balance their interest rate targets with planned balance sheet reductions. We note that the Fed factors in the possible impact of its policy decisions on global financial conditions. If the Fed continues to clearly communicate its intentions, emerging markets debt overall should be able to adjust to future interest rate increases, we believe. |
| | | In this environment, we think identifying investments that offer attractive risk-adjusted returns remains paramount. At the end of the Reporting Period, we favored countries with prudent fiscal management (where currencies have adjusted for lower oil prices) and/or idiosyncratic opportunities where valuations offer a strong potential risk/reward profile, in our view. We plan to closely monitor the evolution of U.S. foreign trade and fiscal policy. In addition, we remain vigilant about any sharp downturn in the Chinese business cycle that could be a headwind for emerging markets countries. At the end of the Reporting Period, we continued to have a constructive view on Indonesia, which could benefit, in our view, from fiscal improvements due to a reduction in a fuel subsidy. The country has a modest debt to GDP ratio of 27%, and approximately 40% of its outstanding debt is denominated in foreign currency and is long-term debt. We believe this helps to minimize refinancing risk. We also remained positive at the end of the Reporting Period about several countries in the Central American and Caribbean region, including Dominican Republic, Costa Rica and Guatemala. Elsewhere, at the end of the Reporting Period, we were cautious on Poland, where the Fund held an underweight position based on valuations and because we see potential for fiscal slippage in 2017. (Fiscal slippage means that a government’s planned annual budget does not match actual spending because of something that affects the tax dollars collected.) Additionally, we planned to maintain the Fund’s underweight positions compared to the Index in small Asian economies, such as Malaysia and the Philippines, at the end of the Reporting Period. |
14
FUND BASICS
Emerging Markets Debt Fund
as of September 30, 2017
| | | | | | | | | | | | | | | | | | |
| | PERFORMANCE REVIEW | |
| | | April 1, 2017– September 30, 2017 | | Fund Total Return
(based on NAV)1 | | | J.P. Morgan
EMBISM Global
Diversified Index2 | | | 30-Day
Standardized
Subsidized Yield3 | | | 30-Day
Standardized
Unsubsidized Yield3 | |
| | Class A | | | 4.65 | % | | | 4.93 | % | | | 4.29 | % | | | 4.27 | % |
| | Class C | | | 4.26 | | | | 4.93 | | | | 3.73 | | | | 3.71 | |
| | Institutional | | | 4.82 | | | | 4.93 | | | | 4.84 | | | | 4.81 | |
| | Investor | | | 4.78 | | | | 4.93 | | | | 4.75 | | | | 4.72 | |
| | | Class R6 | | | 4.83 | | | | 4.93 | | | | 4.85 | | | | 4.83 | |
| | 1 | | The net asset value (“NAV”) represents the net assets of the class of the Fund (ex-dividend) divided by the total number of shares of the class outstanding. The Fund’s performance assumes the reinvestment of dividends and other distributions. The Fund’s performance does not reflect the deduction of any applicable sales charges. |
| | 2 | | The J.P. Morgan Emerging Markets Bond Index (EMBISM) Global Diversified Index (Gross, USD, Unhedged) is an unmanaged index of debt instruments of 50 emerging countries. The Index figures do not reflect any deduction for fees, expenses or taxes. It is not possible to invest directly in an index. |
| | 3 | | The method of calculation of the 30-Day Standardized Subsidized Yield is mandated by the Securities and Exchange Commission and is determined by dividing the net investment income per share earned during the last 30 days of the period by the maximum public offering price (“POP”) per share on the last day of the period. This number is then annualized. The 30-Day Standardized Subsidized Yield reflects fee waivers and/or expense reimbursements recorded by the Fund during the period. Without waivers and/or reimbursements, yields would be reduced. This yield does not necessarily reflect income actually earned and distributed by the Fund and, therefore, may not be correlated with the dividends or other distributions paid to shareholders. The 30-Day Standardized Unsubsidized Yield does not adjust for any fee waivers and/or expense reimbursements in effect. If the Fund does not incur any fee waivers and/or expense reimbursements during the period, the 30-Day Standardized Subsidized Yield and 30-Day Standardized Unsubsidized Yield will be identical. |
The returns set forth in the table above represent past performance. Past performance does not guarantee future results. The Fund’s investment return and principal value will fluctuate so that an investor’s shares, when redeemed, may be worth more or less than their original cost. Current performance may be lower or higher than the performance quoted above. Please visit our web site at www.GSAMFUNDS.com to obtain the most recent month-end returns. Performance reflects applicable fee waivers and/or expense limitations in effect during the periods shown. In their absence, performance would be reduced. Returns do not reflect the deduction of taxes that a shareholder would pay on Fund distributions or the redemption of Fund shares.
15
FUND BASICS
| | | | | | | | | | | | | | | | | | | | | | |
| | STANDARDIZED TOTAL RETURNS4 | |
| | | For the period ended 9/30/17 | | One Year | | | Five Years | | | Ten Years | | | Since Inception | | | Inception Date | |
| | Class A | | | -0.78 | % | | | 3.37 | % | | | 6.56 | % | | | 8.43 | % | | | 8/29/03 | |
| | Class C | | | 2.11 | | | | 3.54 | | | | 6.27 | | | | 6.39 | | | | 9/29/06 | |
| | Institutional | | | 4.27 | | | | 4.68 | | | | 7.41 | | | | 9.16 | | | | 8/29/03 | |
| | Investor | | | 4.17 | | | | 4.58 | | | | N/A | | | | 6.59 | | | | 7/30/10 | |
| | | Class R6 | | | 4.29 | | | | N/A | | | | N/A | | | | 8.55 | | | | 7/31/15 | |
| | 4 | | The Standardized Total Returns are average annual total returns or cumulative total returns (only if the performance period is one year or less) as of the most recent calendar quarter-end. They assume reinvestment of all distributions at NAV. These returns reflect a maximum initial sales charge of 4.5% for Class A Shares and the assumed contingent deferred sales charge for Class C Shares (1% if redeemed within 12 months of purchase). Because Institutional, Investor and Class R6 Shares do not involve a sales charge, such a charge is not applied to their Standardized Total Returns. The Fund will charge a 2% redemption fee on the redemption of shares (including by exchange) held for 30 calendar days or less. The performance figures do not reflect the deduction of the redemption fee. If reflected, the redemption fee would reduce the performance quoted. |
The returns set forth in the table above represent past performance. Past performance does not guarantee future results. The Fund’s investment return and principal value will fluctuate so that an investor’s shares, when redeemed, may be worth more or less than their original cost. Current performance may be lower or higher than the performance quoted above. Please visit our web site at www.GSAMFUNDS.com to obtain the most recent month-end returns. Performance reflects applicable fee waivers and/or expense limitations in effect during the periods shown. In their absence, performance would be reduced. Returns do not reflect the deduction of taxes that a shareholder would pay on Fund distributions or the redemption of Fund shares.
| | | | | | | | | | |
| | EXPENSE RATIOS5 | |
| | | | | Net Expense Ratio
(Current) | | | Gross Expense Ratio
(Before Waivers) | |
| | Class A | | | 1.20 | % | | | 1.24 | % |
| | Class C | | | 1.95 | | | | 1.99 | |
| | Institutional | | | 0.86 | | | | 0.90 | |
| | Investor | | | 0.95 | | | | 0.99 | |
| | | Class R6 | | | 0.85 | | | | 0.89 | |
| | 5 | | The expense ratios of the Fund, both current (net of applicable fee waivers and/or expense limitations) and before waivers (gross of applicable fee waivers and/or expense limitations) are as set forth above according to the most recent publicly available Prospectus for the Fund and may differ from the expense ratios disclosed in the Financial Highlights in this report. Pursuant to a contractual arrangement, the Fund’s waivers and/or expense limitations will remain in place through at least July 28, 2018, and prior to such date the Investment Adviser may not terminate the arrangements without the approval of the Fund’s Board of Trustees. If these arrangements are discontinued in the future, the expense ratios may change without shareholder approval. |
16
FUND BASICS
| | | | | | | | | | |
| | TOP TEN COUNTRY ALLOCATION6 | |
| | | | | Percentage of Net Assets | |
| | | | | as of 9/30/17 | | | as of 3/31/17 | |
| | Indonesia | | | 8.7 | % | | | 10.0 | % |
| | Argentina | | | 7.5 | | | | 6.0 | |
| | Turkey | | | 7.0 | | | | 5.5 | |
| | South Africa | | | 5.0 | | | | 0.5 | |
| | Mexico | | | 4.4 | | | | 6.8 | |
| | Dominican Republic | | | 4.1 | | | | 4.5 | |
| | Venezuela | | | 4.0 | | | | 1.3 | |
| | United States | | | 3.8 | | | | 4.6 | |
| | Colombia | | | 3.4 | | | | 3.9 | |
| | Ecuador | | | 3.1 | | | | 2.8 | |
| | | Other | | | 42.0 | | | | 47.5 | |
| | 6 | | The percentage shown for each investment category reflects the value of investments in that country as a percentage of net assets. The table does not include investment companies of 2.6% as of 9/30/17 and 0.4% as of 3/31/17. Figures in the above graph may not sum to 100% due to the exclusion of other assets and liabilities. The table depicts the Fund’s investments but may not represent the Fund’s market exposure due to the exclusion of certain derivatives, if any, as listed in the Additional Investment Information section of the Schedule of Investments. |
17
PORTFOLIO RESULTS
Goldman Sachs High Yield Fund
Investment Objective
The Fund seeks a high level of current income and may also consider the potential for capital appreciation.
Portfolio Management Discussion and Analysis
Below, the Goldman Sachs High Yield Fixed Income Investment Management Team discusses the Goldman Sachs High Yield Fund’s (the “Fund”) performance and positioning for the six-month period ended September 30, 2017 (the “Reporting Period”).
| Q | | How did the Fund perform during the Reporting Period? |
| A | | During the Reporting Period, the Fund’s Class A, C, Institutional, Service, Investor (formerly Class IR Shares), R and R6 Shares generated cumulative total returns, without sales charges, of 3.00%, 2.63%, 3.19%, 2.93%, 3.14%, 2.89% and 3.19%, respectively. These returns compare to the 4.19% cumulative total return of the Fund’s benchmark, the Bloomberg Barclays U.S. High-Yield 2% Issuer Capped Bond Index (the “Index”), during the same time period. |
| Q | | What economic and market factors most influenced the high yield corporate bond market as a whole during the Reporting Period? |
| A | | During the second quarter of 2017, when the Reporting Period began, high yield corporate bonds generated positive returns, with reports of strong first calendar quarter corporate earnings and light primary market issuance supporting the asset class during April and May 2017. In June, a decline in commodity prices and increased interest rate volatility weighed on investor sentiment. During the third quarter of 2017, high yield corporate bonds produced additional gains. A sharp climb in crude oil prices and a strong earnings season led to price appreciation during July 2017, while a positive macro environment and optimism about the Republican leadership’s proposal for U.S. tax reform lifted high yield corporate bond prices in September. Performance in August 2017 was relatively flat. |
| | | For the Reporting Period overall, the high yield corporate bond market recorded a positive return, with lower quality C-rated and D-rated credits generally outperforming higher quality B-rated credits. Option adjusted spreads narrowed approximately 36 basis points, ending the Reporting Period at 347 basis points. (The option adjusted spread is a measurement tool for evaluating price differences between similar products with different embedded options. A basis point is 1/100th of a percentage point.) High yield corporate bonds outperformed high yield loans, as represented by the Credit Suisse Leveraged Loan Index. |
| | | In terms of issuance, approximately $157 billion of new high yield corporate bonds were priced during the Reporting Period, with refinancing the primary use of the proceeds. With regard to demand, high yield corporate bond mutual funds experienced approximately $8.8 billion of investment outflows during the Reporting Period.1 The default rate for high yield corporate bonds declined during the Reporting Period and remained below the historical average. The 12-month par-weighted default high yield corporate bond rate through September 30, 2017 was 1.07%.2 |
| Q | | What key factors were responsible for the Fund’s performance during the Reporting Period? |
| A | | During the Reporting Period, the Fund was hurt by its overall credit quality positioning relative to the Index. Its duration and yield curve positioning also detracted from performance. Duration is a measure of a portfolio’s sensitivity to changes in interest rates. Yield curve indicates a spectrum of maturities. On the positive side, the Fund benefited from its sector positioning and our individual issue selection. |
| Q | | Which segments within high yield most significantly affected Fund performance? |
| A | | The Fund’s higher credit quality bias detracted from its relative performance during the Reporting Period. More specifically, the Fund was hampered by its underweight relative to the Index in higher quality BB-rated credits as well as by select holdings of lower-rated credits. These |
| | 1 | | Source: J.P. Morgan, Bloomberg, Lipper FMI. |
18
PORTFOLIO RESULTS
| | results were offset somewhat by an underweight in B-rated credits, which added value. The Fund’s performance was also limited by its exposure to high yield loans. Its cash holdings and modestly short market beta positioning (that is, the Fund’s broad underweight relative to the Index in riskier securities) further dampened relative results as high yield corporate bonds and other riskier asset classes posted gains during the Reporting Period. |
| | | In terms of sector positioning, the Fund’s overweight position compared to the Index in metals and mining added to returns. Underweights in retailing (food and drug as well as apparel) and consumer products further bolstered performance. Conversely, overweight positions in media (particularly cable and satellite television), energy and non-cellular communications detracted from results. The Fund’s underweight relative to the Index in transportation also hurt relative returns. |
| | | From an individual issue selection perspective, the Fund benefited from overweight positions in U.S.-based Sprint, Italy-based Telecom Italia and Jamaica-based Digicel — all telecommunications companies. Additionally, an overweight in Canada-based Valeant Pharmaceuticals contributed positively. The Fund was hampered by overweight positions in energy companies Whiting Petroleum, Linn Energy and Berry Petroleum. Windstream, a provider of voice and data network communications, also detracted from performance. |
| Q | | Did the Fund’s duration and yield curve positioning strategy help or hurt its results during the Reporting Period? |
| A | | During the Reporting Period, the Fund’s overall duration and yield curve positioning detracted from relative performance. In particular, the Fund’s short duration position compared to that of the Index was a drag on results. The Fund’s duration strategy is primarily implemented via interest rate swaps and/ or futures. |
| Q | | How did the Fund use derivatives and similar instruments during the Reporting Period? |
| A | | To hedge against currency risk (that is, the risk that certain currencies might fluctuate in value), the Fund employed forward foreign currency exchange contracts during the Reporting Period. Additionally, a specialized index of credit default swaps (“CDX”) was used to manage the beta of the Fund on an active basis. It was also used as a cost-efficient instrument to help manage the Fund’s cash position. We employ CDX contracts as a way to gain credit exposure by being short credit risk, when the Fund experiences significant cash inflows. The Fund used U.S. Treasury futures and Eurodollar futures to facilitate specific duration and yield curve strategies. Eurodollar futures are contracts that have underlying assets linked to time deposits denominated in U.S. dollars at banks outside the U.S. Derivatives may be used in combination with cash securities to implement our views in the Fund. Overall, the use of derivatives had a negative impact on the Fund’s performance during the Reporting Period. |
| Q | | Were there any notable changes in the Fund’s weightings during the Reporting Period? |
| A | | During the Reporting Period, we shifted the Fund from long market beta positioning to modestly short market beta positioning. From a sector perspective, we moderated the Fund’s overweight positions relative to the Index in both cellular and non-cellular telecommunications. We reduced the Fund’s energy holdings and, based on our evaluation of potential risks, took a neutral position in the sector. In addition, we moved the Fund from an overweight to a neutral position in non-cable media, and we increased its overweight position in the cable media sector. We also increased the Fund’s allocations to the electric utilities and gaming and lodging sectors so that it was neutral and overweight, respectively, compared to the Index by the end of the Reporting Period. |
| Q | | How was the Fund positioned relative to its benchmark index at the end of the Reporting Period? |
| A | | At the end of the Reporting Period, the Fund maintained an overweight in the telecommunications sector broadly. In our view, non-cyclical demand and positive secular trends in data and bandwidth demand are likely to benefit cable and wireless companies. Also, potential regulatory reform could support merger and acquisition activity, which we believe would capture synergies and improve the structure of the telecommunications sector. The Fund was underweight the consumer non-cyclical sector at the end of the Reporting Period. Within the sector, it was underweight consumer products because of what we consider their poor relative value, and it was underweight supermarkets because of the increasing threat of online and big box retailers. In the consumer cyclicals sector, the Fund’s positioning reflected a meaningful underweight in retail and apparel, which we view as structurally challenged, as well as an overweight in gaming and lodging, which has continued to benefit from growing U.S. consumer spending on leisure-related experiences. Meanwhile, the Fund held a neutral position in |
19
PORTFOLIO RESULTS
| | the energy sector, though it had an up-in-quality bias, an overweight in the oil field services industry and underweights in the exploration and production and refining industries. At the end of the Reporting Period, the Fund remained underweight B-rated securities that have a maturity of four to seven years, as this segment of the market has a large number of callable bonds that tend to be more sensitive to interest rate movements and are susceptible to extension risk, in our view. Extension risk, which is mainly the result of rising interest rates, is the risk an issuer could exercise its right to pay principal later than expected. |
| Q | | What is the Fund’s tactical view and strategy for the months ahead? |
| A | | High yield corporate bonds posted strong gains from the beginning of 2017 through the end of the Reporting Period. These results were supported, in our view, by solid global economic growth, with major economies expanding and experiencing upside data surprises, stable or improving corporate fundamentals, reduced risk of a sudden withdrawal of central bank support, low volatility, a continued decline in default rates, and a global search for yield. At the end of the Reporting Period, we remained fairly positive about the health of most companies as well as the economic cycle, and we did not see a catalyst that would drive spreads significantly wider in the near term. However, we planned to remain cautious and maintain the Fund’s modestly short market beta positioning because of what we consider unattractive valuations; spreads near their narrowest level in multiple years, which we believe leaves little room for further tightening; and the length of the current U.S. credit cycle. In addition, yields on high yield corporate bonds were below historical averages at the end of the Reporting Period, suggesting to us that investors are taking on more risk for lesser compensation. Given that the asset class experienced a bout of selling pressure during the summer of 2017 due to supply conditions, we believe investors may have concerns about the possibility of another selloff, especially given how much high yield corporate bonds have appreciated since the beginning of 2016. At the end of the Reporting Period, we believed meaningful overweights and underweights on both an industry and single-name basis as well as individual security selection — rather than risk exposure — were key to potentially outperforming the Index in the near term. |
20
FUND BASICS
High Yield Fund
as of September 30, 2017
| | | | | | | | | | | | | | | | | | |
| | PERFORMANCE REVIEW | |
| | | April 1, 2017–
September 30, 2017 | | Fund Total Return
(based on NAV)1 | | | Bloomberg
Barclays
U.S. High-Yield 2%
Issuer Capped
Bond Index2 | | | 30-Day
Standardized
Subsidized Yield3 | | | 30-Day
Standardized
Unsubsidized Yield3 | |
| | Class A | | | 3.00 | % | | | 4.19 | % | | | 3.92 | % | | | 3.88 | % |
| | Class C | | | 2.63 | | | | 4.19 | | | | 3.36 | | | | 3.32 | |
| | Institutional | | | 3.19 | | | | 4.19 | | | | 4.42 | | | | 4.41 | |
| | Service | | | 2.93 | | | | 4.19 | | | | 3.92 | | | | 3.91 | |
| | Investor | | | 3.14 | | | | 4.19 | | | | 4.36 | | | | 4.32 | |
| | Class R | | | 2.89 | | | | 4.19 | | | | 3.86 | | | | 3.82 | |
| | | Class R6 | | | 3.19 | | | | 4.19 | | | | 4.42 | | | | 4.41 | |
| | 1 | | The net asset value (“NAV”) represents the net assets of the class of the Fund (ex-dividend) divided by the total number of shares of the class outstanding. The Fund’s performance assumes the reinvestment of dividends and other distributions. The Fund’s performance does not reflect the deduction of any applicable sales charges. |
| | 2 | | The Bloomberg Barclays U.S. High-Yield 2% Issuer Capped Bond Index, an unmanaged index, covers the universe of U.S. dollar denominated, non-convertible, fixed rate, non-investment grade debt. Index holdings must have at least one year to final maturity, at least $150 million par amount outstanding, and be publicly issued with a rating of Ba1 or lower. The Index figures do not reflect any deduction for fees, expenses or taxes. It is not possible to invest directly in an index. |
| | 3 | | The method of calculation of the 30-Day Standardized Subsidized Yield is mandated by the Securities and Exchange Commission and is determined by dividing the net investment income per share earned during the last 30 days of the period by the maximum public offering price (“POP”) per share on the last day of the period. This number is then annualized. The 30-Day Standardized Subsidized Yield reflects fee waivers and/or expense reimbursements recorded by the Fund during the period. Without waivers and/or reimbursements, yields would be reduced. This yield does not necessarily reflect income actually earned and distributed by the Fund and, therefore, may not be correlated with the dividends or other distributions paid to shareholders. The 30-Day Standardized Unsubsidized Yield does not adjust for any fee waivers and/or expense reimbursements in effect. If the Fund does not incur any fee waivers and/or expense reimbursements during the period, the 30-Day Standardized Subsidized Yield and 30-Day Standardized Unsubsidized Yield will be identical. |
The returns set forth in the table above represent past performance. Past performance does not guarantee future results. The Fund’s investment return and principal value will fluctuate so that an investor’s shares, when redeemed, may be worth more or less than their original cost. Current performance may be lower or higher than the performance quoted above. Please visit our web site at www.GSAMFUNDS.com to obtain the most recent month-end returns. Performance reflects applicable fee waivers and/or expense limitations in effect during the periods shown. In their absence, performance would be reduced. Returns do not reflect the deduction of taxes that a shareholder would pay on Fund distributions or the redemption of Fund shares.
21
FUND BASICS
| | | | | | | | | | | | | | | | | | | | |
| | STANDARDIZED TOTAL RETURNS4 |
| | | For the period ended 9/30/17 | | One Year | | | Five Years | | | Ten Years | | | Since Inception | | | Inception Date |
| | Class A | | | 2.90 | % | | | 4.18 | % | | | 5.43 | % | | | 6.07 | % | | 8/1/97 |
| | Class C | | | 5.86 | | | | 4.33 | | | | 5.12 | | | | 5.54 | | | 8/15/97 |
| | Institutional | | | 8.06 | | | | 5.46 | | | | 6.26 | | | | 6.69 | | | 8/1/97 |
| | Service | | | 7.53 | | | | 4.94 | | | | 5.74 | | | | 6.16 | | | 8/1/97 |
| | Investor | | | 7.96 | | | | 5.37 | | | | N/A | | | | 6.50 | | | 11/30/07 |
| | Class R | | | 7.44 | | | | 4.84 | | | | N/A | | | | 5.94 | | | 11/30/07 |
| | | Class R6 | | | 8.07 | | | | N/A | | | | N/A | | | | 5.63 | | | 7/31/15 |
| | 4 | | The Standardized Total Returns are average annual total returns or cumulative total returns (only if the performance period is one year or less) as of the most recent calendar quarter-end. They assume reinvestment of all distributions at NAV. These returns reflect a maximum initial sales charge of 4.5% for Class A Shares and the assumed contingent deferred sales charge for Class C Shares (1% if redeemed within 12 months of purchase). Because Institutional, Service, Investor, Class R and Class R6 Shares do not involve a sales charge, such a charge is not applied to their Standardized Total Returns. The Fund will charge a 2% redemption fee on the redemption of shares (including by exchange) held for 60 calendar days or less. The performance figures do not reflect the deduction of the redemption fee. If reflected, the redemption fee would reduce the performance quoted. |
The returns set forth in the table above represent past performance. Past performance does not guarantee future results. The Fund’s investment return and principal value will fluctuate so that an investor’s shares, when redeemed, may be worth more or less than their original cost. Current performance may be lower or higher than the performance quoted above. Please visit our web site at www.GSAMFUNDS.com to obtain the most recent month-end returns. Performance reflects applicable fee waivers and/or expense limitations in effect during the periods shown. In their absence, performance would be reduced. Returns do not reflect the deduction of taxes that a shareholder would pay on Fund distributions or the redemption of Fund shares.
| | | | | | | | | | |
| | EXPENSE RATIOS5 | |
| | | | | Net Expense Ratio
(Current) | | | Gross Expense Ratio
(Before Waivers) | |
| | Class A | | | 1.05 | % | | | 1.08 | % |
| | Class C | | | 1.80 | | | | 1.83 | |
| | Institutional | | | 0.74 | | | | 0.74 | |
| | Service | | | 1.24 | | | | 1.24 | |
| | Investor | | | 0.80 | | | | 0.83 | |
| | Class R | | | 1.30 | | | | 1.33 | |
| | | Class R6 | | | 0.73 | | | | 0.73 | |
| | 5 | | The expense ratios of the Fund, both current (net of applicable fee waivers and/or expense limitations) and before waivers (gross of applicable fee waivers and/or expense limitations) are as set forth above according to the most recent publicly available Prospectus for the Fund and may differ from the expense ratios disclosed in the Financial Highlights in this report. Pursuant to a contractual arrangement, the Fund’s waivers and/or expense limitations will remain in place through at least July 28, 2018, and prior to such date the Investment Adviser may not terminate the arrangements without the approval of the Fund’s Board of Trustees. If these arrangements are discontinued in the future, the expense ratios may change without shareholder approval. |
22
FUND BASICS
| | | | | | | | |
| | TOP TEN ISSUERS AS OF 9/30/176 |
| | | Company | | % of Net Assets | | | Line of Business |
| | MGM Resorts International (BB-/Ba3) | | | 1.6 | % | | Gaming |
| | Goldman Sachs TreasuryAccess 0-1 Year | | | 1.4 | | | Exchange Traded Funds |
| | ETF (NR/NR) | | | | | | |
| | Sprint Corp. (B/B3) | | | 0.9 | | | Telecommunication Services |
| | HCA, Inc. (BBB-/Ba1) | | | 0.8 | | | Healthcare Providers & Services |
| | CCO Holdings LLC/CCO Holdings | | | 0.7 | | | Media |
| | Capital Corp. (BB/B1) | | | | | | |
| | Dynegy, Inc. (B+/B3) | | | 0.7 | | | Electrical |
| | Telecom Italia Capital SA (BB+/Ba1) | | | 0.7 | | | Telecommunication Services |
| | CSC Holdings LLC (BB/Ba1) | | | 0.7 | | | Media |
| | Western Digital Corp. (BB+/Ba2) | | | 0.6 | | | Computers |
| | | Sirius XM Radio, Inc. | | | 0.6 | | | Media |
| | 6 | | The top 10 issuers may not be representative of the Fund’s future investments. |
| | | | | | | | | | |
| | TOP TEN INDUSTRY ALLOCATION7 | |
| | | | | Percentage of Net Assets | |
| | | | | as of 9/30/17 | | | as of 3/31/17 | |
| | Media | | | 12.2 | % | | | 9.9 | % |
| | Telecommunication Services | | | 11.1 | | | | 14.1 | |
| | Oil Field Services | | | 8.3 | | | | 11.2 | |
| | Banks | | | 8.0 | | | | 5.2 | |
| | Healthcare Providers & Services | | | 4.8 | | | | 8.6 | |
| | Pipelines | | | 4.0 | | | | 0.5 | |
| | Mining | | | 3.1 | | | | 4.2 | |
| | Gaming | | | 3.1 | | | | 4.5 | |
| | Commercial Services | | | 2.7 | | | | 0.0 | |
| | Real Estate Investment Trust | | | 2.7 | | | | 0.3 | |
| | | Other | | | 40.2 | | | | 38.4 | |
| | 7 | | The percentage shown for each investment category reflects the value of investments in that category as a percentage of net assets. Figures in the above graph may not sum to 100% due to the exclusion of other assets and liabilities. The above table depicts the Fund’s investments but may not represent the Fund’s market exposure due to the exclusion of certain derivatives, if any, as listed in the Additional Investment Information section of the Schedule of Investments. |
23
PORTFOLIO RESULTS
Goldman Sachs High Yield Floating Rate Fund
Investment Objective
The Fund seeks a high level of current income.
Portfolio Management Discussion and Analysis
Below, the Goldman Sachs High Yield Fixed Income Investment Management Team discusses the Goldman Sachs High Yield Floating Rate Fund’s (the “Fund”) performance and positioning for the six-month period ended September 30, 2017 (the “Reporting Period”).
| Q | | How did the Fund perform during the Reporting Period? |
| A | | During the Reporting Period, the Fund’s Class A, C, Institutional, Investor (formerly Class IR Shares) and R Shares generated cumulative total returns, without sales charges, of 1.49%, 1.11%, 1.76%, 1.61% and 1.37%, respectively. These returns compare to the 1.82% cumulative total return of the Credit Suisse Leveraged Loan Index (the “Index”) during the same time period. |
| Q | | What economic and market factors most influenced the high yield floating rate loan market as a whole during the Reporting Period? |
| A | | The high yield loan market advanced during the second quarter of 2017 when the Reporting Period began. Reports of strong first calendar quarter corporate earnings and light primary market issuance supported the asset class during April and May 2017. In June, a decline in commodity prices and a pickup in interest rate volatility dampened investor sentiment. During the third quarter of 2017, high yield loans extended their gains. A sharp climb in crude oil prices and a strong earnings season drove price appreciation in July 2017, while a positive macro environment and optimism about the Republican leadership’s proposal for U.S. tax reform underpinned high yield loan prices during September. Performance in August 2017 was relatively flat. |
| | | For the Reporting Period overall, high yield loans generated positive returns. B-rated loans outperformed BB-rated loans, followed at some distance by CCC-rated loans. High yield loan spreads (or yield differentials versus duration-equivalent U.S. Treasury securities) narrowed by 13 basis points, ending the Reporting Period at 432 basis points.1 (A basis point is 1/100th of a percentage point.) |
| | | In terms of issuance, approximately $401 billion in new high yield loans were brought to market during the Reporting Period. As for demand, high yield loan mutual funds saw investment inflows of approximately $3.4 billion during the Reporting Period.2 |
| | | The default rate for high yield loans remained below the historical average during the Reporting Period. Defaults were dominated by energy companies and metals and mining issuers. The trailing 12-month default rate through September 30, 2017 was 1.32%.2 |
| Q | | What key factors were responsible for the Fund’s performance during the Reporting Period? |
| A | | During the Reporting Period, the Fund’s overall credit quality positioning relative to the Index detracted from returns. Sector positioning and issue selection within the high yield loan market also hampered performance. |
| Q | | Which segments of the high yield floating rate loan market significantly affected Fund performance during the Reporting Period? |
| A | | The Fund’s overweight compared to the Index in CC-rated high yield loans detracted from performance during the Reporting Period. This was offset somewhat by the Fund’s underweight in BB-rated high yield loans; although BB-rated loans lagged the Index, they underperformed to a lesser degree than CC-rated loans. The Fund also benefited from its |
24
PORTFOLIO RESULTS
| | positioning in non-rated loans. An overweight in high yield loans issued by Canadian-domiciled companies hampered returns, but overweight positions in the high yield loans of European- and U.K.-domiciled companies bolstered results. The Fund’s cash holdings were a drag on performance, as high yield loans posted gains and spreads tightened. |
| | | In terms of sector positioning, the Fund’s overweight positions compared to the Index in non-cable media, food and drug retail, and energy hurt returns. An underweight in gaming and lodging also dampened performance. On the positive side, the Fund benefited from its underweight positions in the retail and apparel, consumer products and transportation sectors. |
| | | As for individual issue selection, the Fund was hindered by overweights in Catalina Marketing, a provider of digital media solutions; PetSmart, a retailer specializing in pet food and supplies; and Getty Images, a stock photo agency. Conversely, the Fund was helped by overweight positions in Intelsat, a communications satellite services provider, and U.S. Renal Care, which operates dialysis facilities. In addition, an underweight in oil and gas company Fieldwood Energy contributed positively to returns during the Reporting Period. |
| Q | | Were there any notable changes in the Fund’s weightings during the Reporting Period? |
| A | | During the Reporting Period, we shifted the Fund to overweight positions relative to the Index in the energy, metals and mining, and capital goods sectors. We moved the Fund to underweight positions in the health care and auto sectors. |
| Q | | Did the Fund’s duration and yield curve positioning strategy help or hurt its results during the Reporting Period? |
| A | | The Fund does not use duration or yield curve positioning as active management strategies within its investment process. |
| Q | | How did the Fund use derivatives and similar instruments during the Reporting Period? |
| A | | To hedge against currency risk (that is, the risk that certain currencies might fluctuate in value), the Fund employed forward foreign currency exchange contracts during the Reporting Period. The Fund also employed interest rate swaps and U.S. Treasury futures as cost-efficient instruments to provide us with greater precision and versatility in the management of duration. Interest rate swaps were only utilized in the Fund for the purpose of hedging duration, as the Fund does not take active duration and yield curve positions. Additionally, a specialized index of credit default swaps (“CDX”) and standardized total return swap contracts on the Markit iBoxx USD Liquid Leveraged Loan Index (“iBoxx”) were used to manage the beta of the Fund on an active basis. CDX and/or iBoxx were also utilized as cost-efficient instruments to help manage the Fund’s cash position. We employ CDX and/or iBoxx contracts in order to gain credit exposure by being short credit protection, when the Fund experiences significant cash inflows. Derivatives may be used in combination with cash securities to implement our views in the Fund. Overall, the use of derivatives had a negative impact on the Fund’s performance during the Reporting Period. |
| Q | | How was the Fund positioned relative to its benchmark index at the end of the Reporting Period? |
| A | | At the end of the Reporting Period, the Fund was overweight relative to the Index in the technology, media and telecommunications sectors, with particular focus on non-cable media names and cellular telecommunications companies. The Fund was positioned selectively within the energy sector. It maintained overweights in food and drug retailers and in packaging companies. At the end of the Reporting Period, the Fund had underweight positions compared to the Index in the gaming and lodging, auto and retail sectors. |
| Q | | What is the Fund’s tactical view and strategy for the months ahead? |
| A | | At the end of the Reporting Period, global central banks were less hawkish in their tone than they had been earlier in the Reporting Period. Global economic growth and financial conditions looked healthy; volatility remained low; and interest rates were relatively stable. (Hawkish suggests higher interest rates; opposite of dovish.) That said, the Fund held a short market beta position (a broad underweight relative to the Index in riskier securities) at the end of the Reporting Period, as valuations were tight and yields were at multi-year lows; the U.S. credit cycle was in what we consider its late stages; and we saw continued uncertainty surrounding Fed policy and planned balance sheet reductions. In addition, commodity price volatility remained a source of concern, given it had a negative impact on the performance of high yield loans during the summer of 2017. |
| | | In our view, the operating backdrop for corporate credit overall was favorable at the end of the Reporting Period, despite the U.S. being in the late stages of the credit cycle. We plan to maintain our focus on individual issue selection. |
25
PORTFOLIO RESULTS
| | | In non-cable media, we expect to emphasize companies with what we consider fundamentally superior market positioning. In leisure and restaurants, we intend to concentrate on select companies with relatively few capital assets compared to its operations. The Fund is likely to remain underweight in the gaming and lodging sector because we believe business cycle risk has increased. We expect to maintain the Fund’s underweights in the auto and retail sectors, which we generally consider stressed, with select idiosyncratic holdings based on valuations. In addition, at end of the Reporting Period, we emphasized a combination of up-in-quality positioning in the Fund, complemented by idiosyncratic situations where we believed a lack of liquidity presented opportunity. Because of structural issues in the asset class, we continue to manage the Fund’s liquidity risk overall. |
|
| |
Effective October 27, 2017, after the end of the Reporting Period, Michael Chang no longer served as a portfolio manager of the Fund. By design, all investment decisions for the Fund are performed within a co-lead or team structure, with multiple subject matter experts. This strategic decision making has been the cornerstone of our approach and ensures continuity in the Fund. The portfolio managers for the Fund are Michael Goldstein and Jean Joseph. |
26
FUND BASICS
High Yield Floating Rate Fund
as of September 30, 2017
| | | | | | | | | | | | | | | | | | |
| | PERFORMANCE REVIEW | |
| | | April 1, 2017– September 30, 2017 | | Fund Total Return
(based on NAV)1 | | | Credit Suisse
Leveraged Loan
Index2 | | | 30-Day
Standardized
Subsidized Yield3 | | | 30-Day
Standardized
Unsubsidized Yield3 | |
| | Class A | | | 1.49 | % | | | 1.82 | % | | | 3.61 | % | | | 3.60 | % |
| | Class C | | | 1.11 | | | | 1.82 | | | | 2.95 | | | | 2.93 | |
| | Institutional | | | 1.76 | | | | 1.82 | | | | 4.03 | | | | 4.02 | |
| | Investor | | | 1.61 | | | | 1.82 | | | | 3.94 | | | | 3.93 | |
| | | Class R | | | 1.37 | | | | 1.82 | | | | 3.47 | | | | 3.46 | |
| | 1 | | The net asset value (“NAV”) represents the net assets of the class of the Fund (ex-dividend) divided by the total number of shares of the class outstanding. The Fund’s performance assumes the reinvestment of dividends and other distributions. The Fund’s performance does not reflect the deduction of any applicable sales charges. |
| | 2 | | The Credit Suisse Leveraged Loan Index is an unmanaged index designed to mirror the investable universe of the U.S. dollar denominated leveraged loan market. The index figures do not reflect any deduction for fees, expenses or taxes. It is not possible to invest directly in an index. |
| | 3 | | The method of calculation of the 30-Day Standardized Subsidized Yield is mandated by the Securities and Exchange Commission and is determined by dividing the net investment income per share earned during the last 30 days of the period by the maximum public offering price (“POP”) per share on the last day of the period. This number is then annualized. The 30-Day Standardized Subsidized Yield reflects fee waivers and/or expense reimbursements recorded by the Fund during the period. Without waivers and/or reimbursements, yields would be reduced. This yield does not necessarily reflect income actually earned and distributed by the Fund and, therefore, may not be correlated with the dividends or other distributions paid to shareholders. The 30-Day Standardized Unsubsidized Yield does not adjust for any fee waivers and/or expense reimbursements in effect. If the Fund does not incur any fee waivers and/or expense reimbursements during the period, the 30-Day Standardized Subsidized Yield and 30-Day Standardized Unsubsidized Yield will be identical. |
| | | | | | | | | | | | | | | | | | |
| | STANDARDIZED TOTAL RETURNS4 | |
| | | For the period ended 9/30/17 | | One Year | | | Five Years | | | Since Inception | | | Inception Date | |
| | Class A | | | 1.06 | % | | | 2.64 | % | | | 2.80 | % | | | 3/31/11 | |
| | Class C | | | 1.54 | | | | 2.34 | | | | 2.39 | | | | 3/31/11 | |
| | Institutional | | | 3.69 | | | | 3.46 | | | | 3.53 | | | | 3/31/11 | |
| | Investor | | | 3.49 | | | | 3.37 | | | | 3.43 | | | | 3/31/11 | |
| | | Class R | | | 3.09 | | | | 2.86 | | | | 2.91 | | | | 3/31/11 | |
| | 4 | | The Standardized Total Returns are average annual total returns or cumulative total returns (only if the performance period is one year or less) as of the most recent calendar quarter-end. They assume reinvestment of all distributions at NAV. These returns reflect a maximum initial sales charge of 2.25% for Class A Shares and the assumed contingent deferred sales charge for Class C Shares (1% if redeemed within 12 months of purchase). Because Institutional, Investor and Class R Shares do not involve a sales charge, such a charge is not applied to their Standardized Total Returns. |
The returns set forth in the tables above represent past performance. Past performance does not guarantee future results. The Fund’s investment return and principal value will fluctuate so that an investor’s shares, when redeemed, may be worth more or less than their original cost. Current performance may be lower or higher than the performance quoted above. Please visit our web site at www.GSAMFUNDS.com to obtain the most recent month-end returns. Performance reflects applicable fee waivers and/or expense limitations in effect during the periods shown. In their absence, performance would be reduced. Returns do not reflect the deduction of taxes that a shareholder would pay on Fund distributions or the redemption of Fund shares.
27
FUND BASICS
| | | | | | | | | | |
| | EXPENSE RATIOS5 | |
| | | | | Net Expense Ratio
(Current) | | | Gross Expense Ratio
(Before Waivers) | |
| | Class A | | | 0.97 | % | | | 0.99 | % |
| | Class C | | | 1.72 | | | | 1.74 | |
| | Institutional | | | 0.63 | | | | 0.65 | |
| | Investor | | | 0.72 | | | | 0.74 | |
| | | Class R | | | 1.22 | | | | 1.24 | |
| | 5 | | The expense ratios of the Fund, both current (net of applicable fee waivers and/or expense limitations) and before waivers (gross of applicable fee waivers and/or expense limitations) are as set forth above according to the most recent publicly available Prospectus for the Fund and may differ from the expense ratios disclosed in the Financial Highlights in this report. Pursuant to a contractual arrangement, the Fund’s waivers and/or expense limitations will remain in place through at least July 28, 2018, and prior to such date the Investment Adviser may not terminate the arrangements without the approval of the Fund’s Board of Trustees. If these arrangements are discontinued in the future, the expense ratios may change without shareholder approval. |
| | | | | | | | | | |
| | TOP TEN INDUSTRY ALLOCATION6 | |
| | | | | Percentage of Net Assets | |
| | | | | as of 9/30/17 | | | as of 3/31/17 | |
| | Health Care – Services | | | 7.6 | % | | | 6.4 | % |
| | Technology – Software/Services | | | 5.5 | | | | 4.6 | |
| | Wireless Telecommunications | | | 4.9 | | | | 4.2 | |
| | Media – Non Cable | | | 4.3 | | | | 5.3 | |
| | Services Cyclical – Consumer Services | | | 4.2 | | | | 2.5 | |
| | Media – Broadcasting & Radio | | | 4.1 | | | | 4.2 | |
| | Food & Beverages | | | 3.4 | | | | 3.2 | |
| | Energy | | | 3.3 | | | | 3.9 | |
| | Services Cyclical – Business Services | | | 3.2 | | | | 2.4 | |
| | Media – Cable | | | 3.0 | | | | 4.3 | |
| | | Other | | | 58.1 | | | | 63.4 | |
| | 6 | | The percentage shown for each investment category reflects the value of investments in that category as a percentage of net assets. Figures in the above graph may not sum to 100% due to the exclusion of other assets and liabilities. The table depicts the Fund’s investments but may not represent the Fund’s market exposure due to the exclusion of certain derivatives, if any, as listed in the Additional Investment Information section of the Schedule of Investments. |
28
PORTFOLIO RESULTS
Goldman Sachs Investment Grade Credit Fund
Investment Objective
The Fund seeks a high level of total return consisting of capital appreciation and income that exceeds the total return of the Bloomberg Barclays U.S. Credit Index.
Portfolio Management Discussion and Analysis
Below, the Goldman Sachs U.S. Fixed Income Investment Management Team discusses the Goldman Sachs Investment Grade Credit Fund’s (the “Fund”) performance and positioning for the six-month period ended September 30, 2017 (the “Reporting Period”).
| Q | | How did the Fund perform during the Reporting Period? |
| A | | During the Reporting Period, the Fund’s Class A, Institutional, Investor (formerly Class IR Shares), Separate Account Institutional and R6 Shares generated cumulative total returns, without sales charges, of 3.80%, 3.98%, 3.93%, 3.98% and 3.98%, respectively. These returns compare to the 3.73% cumulative total return of the Fund’s benchmark, the Bloomberg Barclays U.S. Credit Index (the “Index”), during the same time period. |
| Q | | What economic and market factors most influenced the investment grade credit market as a whole during the Reporting Period? |
| A | | Investment grade corporate bonds outperformed U.S. Treasury securities during the Reporting Period overall. |
| | | In the second quarter of 2017, when the Reporting Period began, investment grade credit spreads, or the difference in yields between corporate bonds and duration-equivalent U.S. Treasury securities, tightened by 11 basis points to end the quarter at 109 basis points. (A basis point is 1/100th of a percentage point.) Investment grade corporate bonds were generally supported by reports of solid first quarter 2017 corporate earnings and ongoing improvements in global economic growth. However, a decline in crude oil prices weighed on energy-related credits. During the second calendar quarter, European investment grade corporate bonds outperformed U.K. investment grade bonds, which outpaced U.S. investment grade corporate bonds. During the third quarter of 2017, investment grade credit spreads tightened seven basis points to end the quarter at 102 basis points. A positive macro backdrop, stabilizing corporate fundamentals and a low volatility environment bolstered investment grade corporate bonds. U.S. investment grade corporate bonds outperformed both European and U.K. investment grade corporate bonds during the third calendar quarter. |
| | | Issuance moderated during the Reporting Period overall. U.S. new issuance was approximately $335 billion in the second quarter of 2017 versus $448 billion in the first calendar quarter, while European new issuance was approximately €148 billion versus €176 billion. In the third quarter of 2017, U.S. new issuance was approximately $360 billion, and European new issuance was approximately €96 billion. European new issuance includes U.K. new issuance.1 |
| Q | | What key factors were responsible for the Fund’s performance during the Reporting Period? |
| A | | During the Reporting Period, the Fund benefited from our cross-sector strategy. In our cross-sector strategy, we invest Fund assets across a variety of fixed income sectors, including some that may not be included in the Index. Individual issue selection in corporate credit also contributed positively. Conversely, the Fund’s duration positioning detracted from relative returns during the Reporting Period. Duration is a measure of the Fund’s sensitivity to changes in interest rates. |
| Q | | Which segments of investment grade credit most significantly affected Fund performance? |
| A | | Overweight positions relative to the Index in high yield corporate bonds and emerging markets sovereign debt added to the Fund’s performance. These gains were partially offset by underweight positions in emerging markets corporate debt and U.S. government agency debentures, which detracted. |
29
PORTFOLIO RESULTS
| | | Individual issue selection within corporate credit enhanced relative returns. The Fund benefited from our preference for intermediate-term maturities and from an underweight in higher credit quality issues. Among investment grade corporate bonds, the Fund was helped by its holdings in the industrial, financial and utility sectors. These results were offset slightly by our decision to overweight pipeline names and underweight pharmaceutical companies, which dampened results. Within government/swaps, individual issue selection of government and agency debt added further to returns. |
| Q | | Did the Fund’s duration and yield curve positioning strategy help or hurt its results during the Reporting Period? |
| A | | During the Reporting Period, our duration positioning strategy detracted from relative returns, driven by the Fund’s short duration position relative to that of the Index. Short-term yields rose in response to interest rate hikes by the Fed, but intermediate- and long-term yields fell due to political uncertainty, increased geopolitical risks and fewer positive economic surprises. In addition, soft inflation data during the first nine months of 2017 weighed on market expectations for further Fed rate hikes. The Fund’s duration strategy is primarily implemented via interest rate swaps and/or futures. Derivatives are used in combination with cash securities to implement our views in the Fund. During the Reporting Period, the Fund’s yield curve positioning strategy did not have a meaningful impact on performance. Yield curve indicates a spectrum of maturities. |
| Q | | How did the Fund use derivatives and similar instruments during the Reporting Period? |
| A | | As market conditions warranted during the Reporting Period, the Fund used U.S. Treasury futures and Eurodollar futures to hedge interest rate exposure and facilitate specific duration and yield curve strategies. Eurodollar futures are contracts that have underlying assets linked to time deposits denominated in U.S. dollars at banks outside the U.S. Interest rate swaps were used to express our views on the direction of a country’s interest rates. The Fund employed interest rate swaps and swaptions (options on interest rate swap contracts) to hedge interest rate exposure and express an outright term structure view (term structure, most often depicted as a yield curve, refers to the term structure of interest rates, which is the relationship between the yield to maturity and the time to maturity for pure discount bonds). In addition, the Fund used credit default swaps to implement specific credit-related investment strategies and hedge corporate spread duration (the price sensitivity of a corporate bond to a 100 basis point change in its spread over the London Interbank Offered Rate (“LIBOR”)). It utilized forward foreign currency exchange contracts to hedge currency exposure. Overall, the use of these derivatives had a positive impact on the Fund’s performance during the Reporting Period. |
| Q | | Were there any notable changes in the Fund’s weightings during the Reporting Period? |
| A | | Throughout the Reporting Period, we maintained a neutral position compared to the Index in investment grade corporate bonds. We increased the Fund’s modest exposure to high yield corporate bonds, which are not components of the Index. |
| Q | | How was the Fund positioned relative to its benchmark index at the end of the Reporting Period? |
| A | | Relative to the Index, the Fund was overweight at the end of the Reporting Period in the technology, pharmaceuticals, banking and insurance, and pipeline sectors. It was underweight compared to the Index in the telecommunications and media sectors. It was overweight emerging markets sovereign debt and underweight emerging markets corporate debt at the end of the Reporting Period. |
| Q | | What is the Fund’s tactical view and strategy for the months ahead? |
| A | | At the end of the Reporting Period, the Fund was overweight corporate credit overall, with a neutral position in investment grade corporate bonds and a modest exposure to high yield corporate bonds. In our view, broad-based global economic growth, modest inflation, low volatility, improvement in corporate fundamentals and gradual monetary policy normalization in major economies has created a supportive backdrop for corporate bonds broadly. That said, we believe the U.S. is at a mature stage in the credit cycle, and we consider valuations extended, with credit spreads near their tightest levels in historical terms. At the end of the Reporting Period, this informed our cautious views at the sector level, and we were focusing instead on idiosyncratic security selection as a driver of potential returns. |
30
PORTFOLIO RESULTS
| | | Although tax reform was still under discussion in Washington, D.C. at the end of the Reporting Period, we believed it could potentially impact credit spreads. For example, the proposed repatriation of overseas cash and the partial elimination of net interest deductibility could result in reduced debt issuance in sectors with large overseas cash holdings, such as technology and pharmaceuticals. We saw potential value in banks and insurance companies, which we think can benefit from higher interest rates and a steeper U.S. Treasury yield curve. (A steeper yield curve is one wherein the difference in yields between longer-term and shorter-term maturities widens.) In addition, we had a constructive view on pipeline companies, specifically those with improving credit quality and low exposure to crude oil prices. We expect to maintain the Fund’s underweight in the telecommunications sector due to potential mergers and acquisitions activity, which would, in our view, be unfavorable for credit metrics. The Fund was also underweight the media sector at the end of the Reporting Period because of revenue weakness amid increased consolidation and shifting consumer preferences. |
31
FUND BASICS
Investment Grade Credit Fund
as of September 30, 2017
| | | | | | | | | | | | | | | | | | |
| | PERFORMANCE REVIEW | |
| | | April 1, 2017– September 30, 2017 | | Fund Total Return
(based on NAV)1 | | | Bloomberg
Barclays U.S.
Credit Index2 | | | 30-Day
Standardized
Subsidized Yield3 | | | 30-Day
Standardized
Unsubsidized Yield3 | |
| | Class A | | | 3.80 | % | | | 3.73 | % | | | 2.37 | % | | | 2.30 | % |
| | Institutional | | | 3.98 | | | | 3.73 | | | | 2.81 | | | | 2.73 | |
| | Investor | | | 3.93 | | | | 3.73 | | | | 2.71 | | | | 2.64 | |
| | Separate Account | | | 3.98 | | | | 3.73 | | | | 2.80 | | | | 2.73 | |
| | | Institutional Class R6 | | | 3.98 | | | | 3.73 | | | | 2.84 | | | | 2.74 | |
| | 1 | | The net asset value (“NAV”) represents the net assets of the class of the Fund (ex-dividend) divided by the total number of shares of the class outstanding. The Fund’s performance assumes the reinvestment of dividends and other distributions. The Fund’s performance does not reflect the deduction of any applicable sales charges. |
| | 2 | | The Bloomberg Barclays U.S. Credit Index is an unmanaged index which is unbundled into pure corporates (industrial, utility, and finance, including both U.S. and non-U.S. corporations) and non-corporates (sovereign, supranational, foreign agencies, and foreign local governments). The index figures do not reflect any deduction for fees, expenses or taxes. It is not possible to invest directly in an index. |
| | 3 | | The method of calculation of the 30-Day Standardized Subsidized Yield is mandated by the Securities and Exchange Commission and is determined by dividing the net investment income per share earned during the last 30 days of the period by the maximum public offering price (“POP”) per share on the last day of the period. This number is then annualized. The 30-Day Standardized Subsidized Yield reflects fee waivers and/or expense reimbursements recorded by the Fund during the period. Without waivers and/or reimbursements, yields would be reduced. This yield does not necessarily reflect income actually earned and distributed by the Fund and, therefore, may not be correlated with the dividends or other distributions paid to shareholders. The 30-Day Standardized Unsubsidized Yield does not adjust for any fee waivers and/or expense reimbursements in effect. If the Fund does not incur any fee waivers and/or expense reimbursements during the period, the 30-Day Standardized Subsidized Yield and 30-Day Standardized Unsubsidized Yield will be identical. |
The returns set forth in the table above represent past performance. Past performance does not guarantee future results. The Fund’s investment return and principal value will fluctuate so that an investor’s shares, when redeemed, may be worth more or less than their original cost. Current performance may be lower or higher than the performance quoted above. Please visit our web site at www.GSAMFUNDS.com to obtain the most recent month-end returns. Performance reflects applicable fee waivers and/or expense limitations in effect during the periods shown. In their absence, performance would be reduced. Returns do not reflect the deduction of taxes that a shareholder would pay on Fund distributions or the redemption of Fund shares.
32
FUND BASICS
| | | | | | | | | | | | | | | | | | | | |
| | STANDARDIZED TOTAL RETURNS4 |
| | | For the period ended 9/30/17 | | One Year | | | Five Years | | | Ten Years | | | Since
Inception | | | Inception
Date |
| | Class A | | | -2.13 | % | | | 2.24 | % | | | 4.21 | % | | | 4.17 | % | | 11/3/03 |
| | Institutional | | | 2.08 | | | | 3.35 | | | | 4.95 | | | | 4.83 | | | 11/3/03 |
| | Investor | | | 1.99 | | | | 3.28 | | | | N/A | | | | 4.48 | | | 7/29/11 |
| | Separate Account Institutional | | | 2.08 | | | | 3.38 | | | | 4.98 | | | | 4.86 | | | 11/3/03 |
| | | Class R6 | | | 2.09 | | | | N/A | | | | N/A | | | | 4.39 | | | 7/31/15 |
| | 4 | | The Standardized Total Returns are average annual total returns or cumulative total returns (only if the performance period is one year or less) as of the most recent calendar quarter-end. They assume reinvestment of all distributions at NAV. These returns reflect a maximum initial sales charge of 3.75% for Class A Shares. Prior to July 29, 2009, the maximum initial sales charge applicable to Class A Shares was 4.5%, which is not reflected in the average annual total return figures shown. Because Institutional, Investor, Separate Account Institutional and Class R6 Shares do not involve a sales charge, such a charge is not applied to their Standardized Total Returns. |
The returns set forth in the table above represent past performance. Past performance does not guarantee future results. The Fund’s investment return and principal value will fluctuate so that an investor’s shares, when redeemed, may be worth more or less than their original cost. Current performance may be lower or higher than the performance quoted above. Please visit our web site at www.GSAMFUNDS.com to obtain the most recent month-end returns. Performance reflects applicable fee waivers and/or expense limitations in effect during the periods shown. In their absence, performance would be reduced. Returns do not reflect the deduction of taxes that a shareholder would pay on Fund distributions or the redemption of Fund shares.
| | | | | | | | | | |
| | EXPENSE RATIOS5 | |
| | | | | Net Expense Ratio
(Current) | | | Gross Expense Ratio
(Before Waivers) | |
| | Class A | | | 0.73 | % | | | 0.81 | % |
| | Institutional | | | 0.39 | | | | 0.47 | |
| | Investor | | | 0.48 | | | | 0.56 | |
| | Separate Account Institutional | | | 0.39 | | | | 0.47 | |
| | | Class R6 | | | 0.38 | | | | 0.46 | |
| | 5 | | The expense ratios of the Fund, both current (net of applicable fee waivers and/or expense limitations) and before waivers (gross of applicable fee waivers and/or expense limitations) are as set forth above according to the most recent publicly available Prospectus for the Fund and may differ from the expense ratios disclosed in the Financial Highlights in this report. Pursuant to a contractual arrangement, the Fund’s waivers and/or expense limitations will remain in place through at least July 28, 2018, and prior to such date the Investment Adviser may not terminate the arrangements without the approval of the Fund’s Board of Trustees. If these arrangements are discontinued in the future, the expense ratios may change without shareholder approval. |
33
FUND BASICS
|
| FUND COMPOSITION6 |
| Percentage of Net Assets |
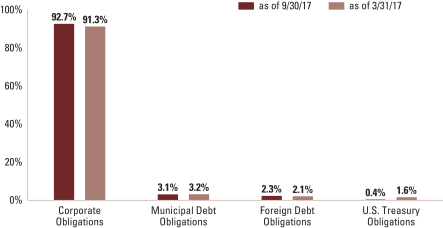
| | 6 | | The percentage shown for each investment category reflects the value of investments in that category as a percentage of net assets. Figures in the graph may not sum to 100% due to the exclusion of other assets and liabilities. The graph depicts the Fund’s investments but may not represent the Fund’s market exposure due to the exclusion of certain derivatives, if any, as listed in the Additional Investment Information section of the Schedule of Investments. |
| | | | | | | | | | |
| | TOP TEN INDUSTRY ALLOCATION7 | |
| | | | | Percentage of Net Assets | |
| | | | | as of 9/30/17 | | | as of 3/31/17 | |
| | Banks | | | 18.2 | % | | | 14.9 | % |
| | Telecommunication Services | | | 9.8 | | | | 9.7 | |
| | Pipelines | | | 6.3 | | | | 5.7 | |
| | Oil Field Services | | | 6.2 | | | | 0.0 | |
| | Electrical | | | 5.9 | | | | 6.0 | |
| | Healthcare Providers & Services | | | 5.3 | | | | 2.4 | |
| | Real Estate Investment Trust | | | 5.2 | | | | 6.0 | |
| | Insurance | | | 4.5 | | | | 2.0 | |
| | Pharmaceuticals | | | 3.6 | | | | 4.3 | |
| | Beverages | | | 3.5 | | | | 5.8 | |
| | | Other | | | 30.0 | | | | 42.8 | |
| | 7 | | The percentage shown for each investment category reflects the value of investments in that category as a percentage of net assets. Figures in the above graph may not sum to 100% due to the exclusion of other assets and liabilities. The table depicts the Fund’s investments but may not represent the Fund’s market exposure due to the exclusion of certain derivatives, if any, as listed in the Additional Investment Information section of the Schedule of Investments. |
34
PORTFOLIO RESULTS
Goldman Sachs Local Emerging Markets Debt Fund
Investment Objective
The Fund seeks a high level of total return consisting of income and capital appreciation.
Portfolio Management Discussion and Analysis
Below, the Goldman Sachs Global Fixed Income Investment Management Team discusses the Goldman Sachs Local Emerging Markets Debt Fund’s (the “Fund”) performance and positioning for the six-month period ended September 30, 2017 (the “Reporting Period”).
| Q | | How did the Fund perform during the Reporting Period? |
| A | | During the Reporting Period, the Fund’s Class A, C, Institutional and Investor (formerly Class IR Shares) Shares generated cumulative total returns, without sales charges, of 7.27%, 6.88%, 7.45% and 7.42%, respectively. These returns compare to the 7.30% cumulative total return of the Fund’s benchmark, the J.P. Morgan Government Bond Index — Emerging Markets (GBI-EMSM) Global Diversified Index (Gross, USD, Unhedged) (the “Index”), during the same time period. |
| Q | | What economic and market factors most influenced local emerging markets debt as a whole during the Reporting Period? |
| A | | During the Reporting Period, local emerging markets debt recorded strong gains, supported by ongoing momentum in global economic growth, investors’ expectations for a gradual U.S. interest rate hiking cycle, little progress on U.S. protectionist policies and steady investment inflows. |
| | | Local emerging markets debt, as represented by the Index, posted a return of 7.30%, with approximately 2.56% due to changes in local interest rates and approximately 4.74% due to currency appreciation against the U.S. dollar. Among countries, on a total return basis, the top performers in the Index (in U.S. dollar terms1) during the Reporting Period were Peru (+11.15%), Indonesia (+11.01%) and Brazil (+8.85%). The weakest performing countries were Turkey (-4.53%), China (-2.29%) and Chile (-0.18%). |
| Q | | What key factors were responsible for the Fund’s performance during the Reporting Period? |
| A | | During the Reporting Period, the Fund benefited from its active currency positioning through which the Fund takes positions in local currencies (accomplished through the use of forward foreign currency exchange contracts as well as bonds denominated in local currencies). Individual issue selection among local emerging markets bonds added to relative returns. However, the Fund was hurt by certain positions in emerging markets currencies, external emerging markets bonds and local emerging markets debt. Our U.S. duration strategy also detracted modestly from relative results. Duration is a measure of the Fund’s sensitivity to changes in interest rates. |
| Q | | Which segments of local emerging markets debt most significantly affected Fund performance? |
| A | | Within our currency selection, the Fund was helped by its long positions in the Czech koruna and Polish zloty (accomplished through the use of forward foreign currency exchange contracts). We consider the Czech koruna and Polish zloty proxies for broad European economic growth. In addition, a long position in the Mexican peso and an overweight relative to the Index in Mexican local interest rates contributed positively to relative performance. The Fund’s long position in the Mexican peso was based on our view that the currency was undervalued and also because we expect a turnaround in Mexico’s economy driven by a pickup in U.S. economic growth. The overweight in Mexican local interest rates was due to its central bank signaling a pause in its rate hiking cycle and saying it considers recent policy |
| | 1 | | All regional and market returns are in U.S. dollar terms (unless otherwise specified), are based on country-specific stock market indices and reflect the reinvestment of any dividends if applicable. |
35
PORTFOLIO RESULTS
| | actions sufficient to bring inflation close to its target during 2018. Also during the Reporting Period, an underweight in Czech Republic local interest rates bolstered the Fund’s returns. A broad overweight in corporate emerging markets debt added modestly to relative performance. |
| | | Conversely, the Fund was hurt by its short position in the euro (accomplished through the use of forward foreign currency exchange contracts), which we used to fund some of the Fund’s long positions in various other European currencies. The euro strengthened amid strong economic activity and the European Central Bank’s planned tapering of quantitative easing measures. An underweight position in Chinese external debt (implemented via credit default swaps) was a drag on performance amid positive economic data. We remained concerned about the high levels of debt in China. In terms of local interest rates, overweight positions in Brazil and Hong Kong detracted most from relative returns. Brazilian local bonds experienced bouts of volatility during the Reporting Period due primarily to political turmoil. |
| Q | | Did the Fund’s duration and yield curve positioning strategy help or hurt its results during the Reporting Period? |
| A | | During the Reporting Period, the Fund’s U.S. duration positioning strategy detracted modestly from performance. More specifically, the Fund was hurt by its short duration position on the U.S. Treasury yield curve. The Fund’s U.S. yield curve positioning did not have a meaningful impact on relative performance during the Reporting Period. Yield curve indicates a spectrum of maturities. |
| Q | | How did the Fund use derivatives and similar instruments during the Reporting Period? |
| A | | The Fund invested in U.S. Treasury futures, Eurodollar futures, forward foreign currency exchange contracts, interest rate swaps, credit default swaps, total return swaps, cross-currency swaps, non-deliverable currency forwards and structured notes. U.S. Treasury futures were used to manage U.S. interest rate duration. Eurodollar futures were used to express our views on the direction of interest rates and to facilitate specific duration and yield curve strategies. Eurodollar futures are contracts that have underlying assets linked to time deposits denominated in U.S. dollars at banks outside the U.S. Forward foreign currency exchange contracts were used for hedging purposes or to express a positive view on a given currency. Interest rate swaps were used to express our views on the direction of a country’s interest rates. Credit default swaps were used to implement specific credit-related investment strategies. Total return swaps were used in place of buying a local currency denominated bond when a particular market was otherwise inaccessible or as a more efficient means of gaining access to a local market. Cross-currency swaps were employed to express relative value views on given currencies as well as our views on the direction of a country’s interest rates. Non-deliverable currency forwards were used to gain exposure to a particular country and also to take advantage of relative value opportunities. Structured notes were used in place of buying a local currency denominated bond when a particular market was otherwise inaccessible or as a more efficient means of gaining access to a local market. Derivatives may be used in combination with cash securities to implement our views in the Fund. |
| | | During the Reporting Period, we used forward foreign currency exchange contracts to take long positions in the Czech koruna, Polish zloty and Mexican peso, which had a positive impact on the Fund’s performance. The use of forward foreign currency exchange contracts to take a short position in the euro had a negative impact on returns. In addition, during the Reporting Period, credit default swaps were employed to gain exposure to Chinese external debt, which detracted from returns during the Reporting Period. The use of other derivatives and similar instruments did not have a material impact on performance. |
| Q | | Were there any notable changes in the Fund’s weightings during the Reporting Period? |
| A | | During the Reporting Period, we increased exposure to South African, Russian and Mexican local interest rates, such that they became the Fund’s largest overweight positions compared to the Index. The central bank in South Africa kept its policy rate unchanged at 6.75% during September 2017, contrary to consensus expectations for a rate cut, and we think lower than expected inflation data may warrant monetary policy easing. In Russia, we believe its central bank has scope to ease interest rates given currently tight monetary and fiscal policies. As mentioned previously, Mexico’s central bank has signaled a pause in its rate hiking cycle and said it considers recent policy actions sufficient to bring inflation close to target during 2018. |
| Q | | How was the Fund positioned relative to its benchmark index at the end of the Reporting Period? |
| A | | Within local interest rates, the Fund’s largest overweight positions compared to the Index were in South Africa, Russia and Mexico at the end of the Reporting Period. Its largest underweight positions were in the Czech Republic, Poland |
36
PORTFOLIO RESULTS
| | and Turkey. Broadly speaking, the Fund was underweight versus the Index in local interest rates, and we were deploying capital into other pockets of the emerging markets where we saw value, such as external sovereign and quasi-sovereign government bonds as well as select emerging markets corporate bonds. Within external debt, the Fund was underweight China (accomplished through credit default swaps) at the end of the Reporting Period. On the margin, we continued to take active currency risk in a handful of countries, including the Czech Republic, Poland and Argentina. |
| Q | | What is the Fund’s tactical view and strategy for the months ahead? |
| A | | At the end of the Reporting Period, we continued to view emerging markets debt broadly as offering a high quality source of yield. That said, prices appeared to have reached fair value, driven mostly by low volatility, maturity of the asset class overall, moderate global economic growth and market expectations for monetary policy normalization by developed markets’ central banks. |
| | | Nevertheless, at the end of the Reporting Period, we believe valuations were less stretched than they were during the 2013 taper tantrum. (Taper tantrum refers to the way markets reacted when the Federal Reserve (the “Fed”) suggested it might begin tapering its quantitative easing program.) Emerging markets economies have seen significant improvement in their fundamentals, and, in our view, they are better positioned to withstand any negative impact from normalization in developed markets’ central bank monetary policies. South Africa, Turkey, Indonesia, India and Brazil — the five countries that in 2013 depended most on foreign investment to support their growth — generally have narrower account deficits and better foreign reserve coverage than they did in 2013. A recovery in oil prices due to oil production cuts is also providing support for commodity exporters. |
| | | Furthermore, while emerging markets debt has been sensitive in the past to risks associated with U.S. interest rates and deteriorating global trade, we find it hard to envisage a near-term decoupling of the asset class from strengthening U.S. and global economic growth, which are the main drivers of the Fed’s current interest rate hiking cycle. Overall, at the end of the Reporting Period, we anticipated higher U.S. interest rates wherein Fed policymakers will likely have to balance their interest rate targets with planned balance sheet reductions. We note that the Fed factors in the possible impact of its policy decisions on global financial conditions. If the Fed continues to clearly communicate its intentions, emerging markets debt overall should be able to adjust to future interest rate increases, we believe. |
| | | In this environment, we think identifying investments that offer attractive risk-adjusted returns remains paramount. At the end of the Reporting Period, we favored countries with prudent fiscal management (where currencies have adjusted for lower oil prices) and/or idiosyncratic opportunities where valuations offer a strong potential risk/reward profile, in our view. We plan to closely monitor the evolution of U.S. foreign trade and fiscal policy. In addition, we remain vigilant about any sharp downturn in the Chinese business cycle. |
37
FUND BASICS
Local Emerging Markets Debt Fund
as of September 30, 2017
| | | | | | | | | | | | | | | | | | |
| | PERFORMANCE REVIEW | |
| | | April 1, 2017–
September 30, 2017 | | Fund Total Return
(based on NAV)1 | | | J.P. Morgan
GBI-EMSM Global
Diversified Index2 | | | 30-Day
Standardized
Subsidized Yield3 | | | 30-Day
Standardized
Unsubsidized Yield3 | |
| | Class A | | | 7.27 | % | | | 7.30 | % | | | 5.24 | % | | | 5.04 | % |
| | Class C | | | 6.88 | | | | 7.30 | | | | 4.73 | | | | 4.52 | |
| | Institutional | | | 7.45 | | | | 7.30 | | | | 5.80 | | | | 5.63 | |
| | | Investor | | | 7.42 | | | | 7.30 | | | | 5.75 | | | | 5.54 | |
| | 1 | | The net asset value (“NAV”) represents the net assets of the class of the Fund (ex-dividend) divided by the total number of shares of the class outstanding. The Fund’s performance assumes the reinvestment of dividends and other distributions. The Fund’s performance does not reflect the deduction of any applicable sales charges. |
| | 2 | | The J.P. Morgan Government Bond Index — Emerging Markets (GBI-EMSM) Global Diversified Index (Gross, USD, Unhedged) is an unmanaged index of debt instruments of 14 emerging countries. The Index figures do not reflect any deduction for fees, expenses or taxes. It is not possible to invest directly in an index. |
| | 3 | | The method of calculation of the 30-Day Standardized Subsidized Yield is mandated by the Securities and Exchange Commission and is determined by dividing the net investment income per share earned during the last 30 days of the period by the maximum public offering price (“POP”) per share on the last day of the period. This number is then annualized. The 30-Day Standardized Subsidized Yield reflects fee waivers and/or expense reimbursements recorded by the Fund during the period. Without waivers and/or reimbursements, yields would be reduced. This yield does not necessarily reflect income actually earned and distributed by the Fund and, therefore, may not be correlated with the dividends or other distributions paid to shareholders. The 30-Day Standardized Unsubsidized Yield does not adjust for any fee waivers and/or expense reimbursements in effect. If the Fund does not incur any fee waivers and/or expense reimbursements during the period, the 30-Day Standardized Subsidized Yield and 30-Day Standardized Unsubsidized Yield will be identical. |
| | | | | | | | | | | | | | | | | | |
| | STANDARDIZED TOTAL RETURNS4 | |
| | | For the period ended 9/30/17 | | One Year | | | Five Year | | | Since Inception | | | Inception Date | |
| | Class A | | | 3.24 | % | | | -2.82 | % | | | 0.81 | % | | | 2/15/08 | |
| | Class C | | | 5.97 | | | | -2.70 | | | | 0.52 | | | | 2/15/08 | |
| | Institutional | | | 7.98 | | | | -1.65 | | | | 1.60 | | | | 2/15/08 | |
| | | Investor | | | 8.09 | | | | -1.73 | | | | 0.93 | | | | 7/30/10 | |
| | 4 | | The Standardized Total Returns are average annual total returns or cumulative total returns (only if the performance period is one year or less) as of the most recent calendar quarter-end. They assume reinvestment of all distributions at NAV. These returns reflect a maximum initial sales charge of 4.5% for Class A Shares and the assumed contingent deferred sales charge for Class C Shares (1% if redeemed within 12 months of purchase). Because Institutional and Investor Shares do not involve a sales charge, such a charge is not applied to their Standardized Total Returns. The Fund will charge a 2% redemption fee on the redemption of shares (including by exchange) held for 30 calendar days or less. The performance figures do not reflect the deduction of the redemption fee. If reflected, the redemption fee would reduce the performance quoted. |
The returns set forth in the tables above represent past performance. Past performance does not guarantee future results. The Fund’s investment return and principal value will fluctuate so that an investor’s shares, when redeemed, may be worth more or less than their original cost. Current performance may be lower or higher than the performance quoted above. Please visit our web site at www.GSAMFUNDS.com to obtain the most recent month-end returns. Performance reflects applicable fee waivers and/or expense limitations in effect during the periods shown. In their absence, performance would be reduced. Returns do not reflect the deduction of taxes that a shareholder would pay on Fund distributions or the redemption of Fund shares.
38
FUND BASICS
| | | | | | | | | | |
| | EXPENSE RATIOS5 | |
| | | | | Net Expense Ratio
(Current) | | | Gross Expense Ratio
(Before Waivers) | |
| | Class A | | | 1.22 | % | | | 1.36 | % |
| | Class C | | | 1.97 | | | | 2.11 | |
| | Institutional | | | 0.92 | | | | 1.02 | |
| | | Investor | | | 0.97 | | | | 1.11 | |
| | 5 | | The expense ratios of the Fund, both current (net of applicable fee waivers and/or expense limitations) and before waivers (gross of applicable fee waivers and/or expense limitations) are as set forth above according to the most recent publicly available Prospectus for the Fund and may differ from the expense ratios disclosed in the Financial Highlights in this report. Pursuant to a contractual arrangement, the Fund’s waivers and/or expense limitations will remain in place through at least July 28, 2018, and prior to such date the Investment Adviser may not terminate the arrangements without the approval of the Fund’s Board of Trustees. If these arrangements are discontinued in the future, the expense ratios may change without shareholder approval. |
| | | | | | | | | | |
| | TOP TEN COUNTRY ALLOCATION6 | |
| | | | | Percentage of Net Assets | |
| | | | | as of 9/30/17 | | | as of 3/31/17 | |
| | South Africa | | | 10.5 | % | | | 5.9 | % |
| | Brazil | | | 9.4 | | | | 11.6 | |
| | Russia | | | 7.7 | | | | 4.9 | |
| | Indonesia | | | 7.5 | | | | 8.3 | |
| | Colombia | | | 7.5 | | | | 10.1 | |
| | Argentina | | | 5.6 | | | | 3.9 | |
| | Poland | | | 5.6 | | | | 10.0 | |
| | Thailand | | | 5.4 | | | | 4.8 | |
| | Hungary | | | 5.1 | | | | 3.9 | |
| | Malaysia | | | 4.8 | | | | 4.5 | |
| | | Other | | | 19.9 | | | | 20.1 | |
| | 6 | | The percentage shown for each investment category reflects the value of investments in that country as a percentage of net assets. The table does not include investment companies of 4.9% as of 9/30/17 and 1.9% as of 3/31/17. Figures in the above graph may not sum to 100% due to the exclusion of other assets and liabilities. The table depicts the Fund’s investments but may not represent the Fund’s market exposure due to the exclusion of certain derivatives, if any, as listed in the Additional Investment Information section of the Schedule of Investments. |
39
PORTFOLIO RESULTS
Goldman Sachs U.S. Mortgages Fund
Investment Objective
The Fund seeks a high level of total return consisting of income and capital appreciation.
Portfolio Management Discussion and Analysis
Below, the Goldman Sachs U.S. Fixed Income Investment Management Team discusses the Goldman Sachs U.S. Mortgages Fund’s (the “Fund”) performance and positioning for the six-month period ended September 30, 2017 (the “Reporting Period”).
| Q | | How did the Fund perform during the Reporting Period? |
| A | | During the Reporting Period, the Fund’s Class A, Institutional, Investor (formerly Class IR Shares), Separate Account Institutional and R6 Shares generated cumulative total returns, without sales charges, of 1.33%, 1.50%, 1.46%, 1.50% and 1.51%, respectively. These returns compare to the 1.84% cumulative total return of the Fund’s benchmark, the Bloomberg Barclays U.S. Securitized Bond Index (the “Index”), during the same time period. |
| Q | | What economic and market factors most influenced the U.S. mortgage markets as a whole during the Reporting Period? |
| A | | During the second quarter of 2017 when the Reporting Period began, agency mortgage-backed securities slightly underperformed duration-equivalent U.S. Treasury securities. The Federal Reserve (the “Fed”) signaled it would begin reducing its holdings of agency mortgage-backed securities and U.S. Treasury securities later in 2017. The Fed’s action was expected to increase the market’s supply of agency mortgage-backed securities, leading to their underperformance. During the third quarter of 2017, agency mortgage-backed securities outperformed duration-equivalent U.S. Treasury securities due to low volatility and a sell-off in the U.S. Treasury market. Firm demand, particularly from real estate investment trusts, also supported agency mortgage-backed securities. At its September 2017 policy meeting, the Fed formally announced its intention to decrease the reinvestment of the principal payments on its holdings of agency mortgage-backed securities and U.S. Treasuries. Investor reaction was relatively muted given how much guidance it had received from the Fed earlier in 2017. At the end of the Reporting Period, most observers expected the Fed’s holdings of agency mortgage-backed securities to decline by up to $12 billion by the end of the calendar year and by a further $160 billion in 2018. For the Reporting Period overall, agency mortgage-backed securities generated positive returns. |
| Q | | What key factors were responsible for the Fund’s performance during the Reporting Period? |
| A | | During the Reporting Period, our duration strategy detracted from the Fund’s relative returns. The duration strategy is implemented via bonds as well as interest rate swaps and/ or futures. Duration is a measure of the Fund’s sensitivity to changes in interest rates. In addition, the Fund was hampered by our cross-sector strategy. In our cross-sector strategy, we invest Fund assets across a variety of fixed income sectors, including some that may not be included in the Fund’s benchmark. Individual issue selection overall also detracted from relative results. |
| Q | | Which segments of the U.S. mortgage-backed securities sector most significantly affected Fund performance? |
| A | | The Fund’s underweight position relative to the Index in agency mortgage-backed securities detracted from performance during the Reporting Period. Most of the underperformance occurred during September 2017 when strong demand for agency mortgage-backed securities drove spreads (yield differentials versus duration-equivalent U.S. Treasuries) tighter. The Fund was also hurt by its underweight in commercial mortgage-backed securities (“CMBS”), as CMBS benefited from low volatility and a generally positive environment for spread, or non-government bond, sectors. In addition, an overweight in higher-coupon agency mortgage-backed securities dampened relative returns amid lower mortgage interest rates, a flatter yield curve and subdued interest rate volatility. (A flatter yield curve is one wherein the differential in yields between longer-term and shorter-term maturities narrows. Yield curve |
40
PORTFOLIO RESULTS
| | is a spectrum of maturities.) Offsetting these results somewhat was the Fund’s overweight positions in asset-backed securities (“ABS”), specifically Federal Family Education Loan Program (“FFELP”) student loan ABS, and collateralized loan obligations (“CLOs”), which contributed positively. |
| | | Individual issue selection in the government/swaps sector detracted from relative performance. The Fund was also hindered by selection of mortgage-backed securities and CMBS within the securitized sector. This was largely offset by individual issue selection of ABS and, to a lesser extent, CLOs, which boosted relative results. |
| Q | | Did the Fund’s duration and yield curve positioning strategy help or hurt its results during the Reporting Period? |
| A | | The Fund’s duration strategy detracted from performance during the Reporting Period. For most of the Reporting Period, the Fund held a short duration position on the U.S. Treasury yield curve, which hurt results during the third quarter of 2017 when the front, or short-term, end of the curve rose in anticipation of further Fed rate hikes. In contrast, longer-term yields fell. The 10-year U.S. Treasury yield dropped by approximately 20 basis points from July through August 2017 before retracing most of that decline during September. (A basis point is 1/100th of a percentage point.) Low government bond yields in developed markets outside of the U.S. as well as geopolitical tensions helped keep longer-term U.S. Treasury yields anchored overall. During the Reporting Period, the Fund’s yield curve positioning strategy did not have a meaningful impact on performance. |
| Q | | How did the Fund use derivatives and similar instruments during the Reporting Period? |
| A | | The Fund used U.S. Treasury and Eurodollar futures to hedge interest rate exposure and to facilitate specific duration and yield curve strategies. Eurodollar futures are contracts that have underlying assets linked to time deposits denominated in U.S. dollars at banks outside the U.S. Interest rate swaps were used to hedge interest rate exposure and express a relative term structure view. (Term structure, most often depicted as a yield curve, refers to the term structure of interest rates, which is the relationship between the yield to the maturity and the time to maturity for pure discount bonds.) The Fund used mortgage-backed securities forward agreements (known as “TBAs”) to efficiently manage certain of its mortgage-backed securities positions. It used interest only and inverse interest-only securities to manage the Fund’s exposure to agency mortgage-backed securities. The Fund utilized swaptions to hedge volatility and yield curve risks in the Fund and/or to express tactical views on rate markets. The Fund also employed index total return swaps to efficiently manage the Fund’s mortgage-backed securities exposure. Additionally, a specialized index of credit default swaps (“CMBX”) was used to manage the CMBS beta of the Fund on an active basis and to hedge the Fund’s CMBS exposure. The use of these derivatives and similar instruments had a negative impact on the Fund’s performance during the Reporting Period. |
| Q | | Were there any notable changes in the Fund’s weightings during the Reporting Period? |
| A | | During the Reporting Period, we increased the Fund’s underweight position in agency mortgage-backed securities. |
| Q | | How was the Fund positioned relative to its benchmark index at the end of the Reporting Period? |
| A | | At the end of the Reporting Period, the Fund was underweight relative to the Index in agency pass-through mortgage securities. (Pass-through mortgage securities consist of a pool of residential mortgage loans, where homeowners’ monthly payments of principal, interest and prepayments pass from the mortgage servicer through a government agency or investment bank to investors.) The Fund was also underweight CMBS given that we think the U.S. is in the late stage of the credit cycle. In addition, at the end of the Reporting Period, the Fund was overweight CLOs because we believe they offered an attractive yield pick-up versus other segments of the mortgage-backed securities sector. Lastly, the Fund was overweight ABS. More specifically, it held positions in FFELP student loan ABS, which are not represented in the Index, because of what we consider their strong credit protection and attractive yields. (Credit protection in this context means the issuer assumes the risk of loss in the event of a default or other credit event.) |
| Q | | What is the Fund’s tactical view and strategy for the months ahead? |
| A | | At the end of the Reporting Period, we expected agency mortgage-backed securities’ spreads to widen as the Fed tapers the reinvestment of principal payments on its holdings of agency mortgage-backed securities. In our view, the impact may be muted through the end of 2017 but is likely to be greater in 2018. In addition, we believe there is potential for increased interest rate volatility as the Fed reduces the overall size of its balance sheet. We also believe that in 2018, the combination of Fed tapering and a strong U.S. housing market could boost the net supply of agency mortgage-backed |
41
PORTFOLIO RESULTS
| | securities to more than $400 billion, the highest level since 2008. |
| | | Within agency mortgage-backed securities at the end of the Reporting Period, we maintained the Fund’s underweight in securities lower in the coupon stack (i.e., securities with different coupons) and its overweight in securities higher in the coupon stack, specifically Ginnie Mae (Government National Mortgage Association or “GNMA”) mortgage-backed securities. As for FFELP student loan ABS, at the end of the Reporting Period, we believed they continued to offer attractive spreads with strong credit protection and therefore considered them among the more compelling investment opportunities in the securitized sector at the end of the Reporting Period. We also maintained a positive view of CLOs and residential mortgage-backed securities, particularly legacy non-agency mortgage-backed securities (in general, those issued before the 2008-2009 financial crisis) given that they continued to benefit from low supply and improving collateral performance. At the end of the Reporting Period, we planned to maintain the Fund’s underweight in CMBS because of headwinds from negative retail sector data as well as late credit cycle dynamics. |
42
FUND BASICS
U.S. Mortgages Fund
as of September 30, 2017
| | | | | | | | | | | | | | | | | | |
| | PERFORMANCE REVIEW | |
| | | April 1, 2017–
September 30, 2017 | | Fund Total Return
(based on NAV)1 | | | Bloomberg
Barclays U.S.
Securitized
Bond Index2 | | | 30-Day
Standardized
Subsidized Yield3 | | | 30-Day
Standardized
Unsubsidized Yield3 | |
| | Class A | | | 1.33 | % | | | 1.84 | % | | | 0.88 | % | | | 0.80 | % |
| | Institutional | | | 1.50 | | | | 1.84 | | | | 1.26 | | | | 1.18 | |
| | Investor | | | 1.46 | | | | 1.84 | | | | 1.16 | | | | 1.08 | |
| | Separate Account Institutional | | | 1.50 | | | | 1.84 | | | | 1.26 | | | | 1.18 | |
| | | Class R6 | | | 1.51 | | | | 1.84 | | | | 1.27 | | | | 1.18 | |
| | 1 | | The net asset value (“NAV”) represents the net assets of the class of the Fund (ex-dividend) divided by the total number of shares of the class outstanding. The Fund’s performance assumes the reinvestment of dividends and other distributions. The Fund’s performance does not reflect the deduction of any applicable sales charges. |
| | 2 | | The Bloomberg Barclays U.S. Securitized Bond Index is an unmanaged composite of asset-backed securities, collateralized mortgage-backed securities and fixed rate mortgage-backed securities. The index figures do not reflect any deduction for fees, expenses or taxes. It is not possible to invest directly in an index. |
| | 3 | | The method of calculation of the 30-Day Standardized Subsidized Yield is mandated by the Securities and Exchange Commission and is determined by dividing the net investment income per share earned during the last 30 days of the period by the maximum public offering price (“POP”) per share on the last day of the period. This number is then annualized. The 30-Day Standardized Subsidized Yield reflects fee waivers and/or expense reimbursements recorded by the Fund during the period. Without waivers and/or reimbursements, yields would be reduced. This yield does not necessarily reflect income actually earned and distributed by the Fund and, therefore, may not be correlated with the dividends or other distributions paid to shareholders. The 30-Day Standardized Unsubsidized Yield does not adjust for any fee waivers and/or expense reimbursements in effect. If the Fund does not incur any fee waivers and/or expense reimbursements during the period, the 30-Day Standardized Subsidized Yield and 30-Day Standardized Unsubsidized Yield will be identical. |
The returns set forth in the table above represent past performance. Past performance does not guarantee future results. The Fund’s investment return and principal value will fluctuate so that an investor’s shares, when redeemed, may be worth more or less than their original cost. Current performance may be lower or higher than the performance quoted above. Please visit our web site at www.GSAMFUNDS.com to obtain the most recent month-end returns. Performance reflects applicable fee waivers and/or expense limitations in effect during the periods shown. In their absence, performance would be reduced. Returns do not reflect the deduction of taxes that a shareholder would pay on Fund distributions or the redemption of Fund shares.
43
FUND BASICS
| | | | | | | | | | | | | | | | | | | | | | |
| | STANDARDIZED TOTAL RETURNS4 | |
| | | For the period ended 9/30/17 | | One Year | | | Five Years | | | Ten Years | | | Since Inception | | | Inception Date | |
| | Class A | | | -3.96 | % | | | 1.08 | % | | | 3.15 | % | | | 3.41 | % | | | 11/3/03 | |
| | Institutional | | | 0.05 | | | | 2.18 | | | | 3.90 | | | | 4.08 | | | | 11/3/03 | |
| | Investor | | | -0.05 | | | | 2.10 | | | | N/A | | | | 2.87 | | | | 7/29/11 | |
| | Separate Account Institutional | | | 0.14 | | | | 2.20 | | | | 3.90 | | | | 4.09 | | | | 11/3/03 | |
| | | Class R6 | | | 0.16 | | | | N/A | | | | N/A | | | | 1.94 | | | | 7/31/15 | |
| | 4 | | The Standardized Total Returns are average annual total returns or cumulative total returns (only if the performance period is one year or less) as of the most recent calendar quarter-end. They assume reinvestment of all distributions at NAV. These returns reflect a maximum initial sales charge of 3.75% for Class A Shares. Prior to July 29, 2009, the maximum initial sales charge applicable to Class A Shares was 4.5%, which is not reflected in the average annual return figures shown. Because Institutional, Investor, Separate Account Institutional and Class R6 Shares do not involve a sales charge, such a charge is not applied to their Standardized Total Returns. |
The returns set forth in the table above represent past performance. Past performance does not guarantee future results. The Fund’s investment return and principal value will fluctuate so that an investor’s shares, when redeemed, may be worth more or less than their original cost. Current performance may be lower or higher than the performance quoted above. Please visit our web site at www.GSAMFUNDS.com to obtain the most recent month-end returns. Performance reflects applicable fee waivers and/or expense limitations in effect during the periods shown. In their absence, performance would be reduced. Returns do not reflect the deduction of taxes that a shareholder would pay on Fund distributions or the redemption of Fund shares.
| | | | | | | | | | |
| | EXPENSE RATIOS5 | |
| | | | | Net Expense Ratio
(Current) | | | Gross Expense Ratio
(Before Waivers) | |
| | Class A | | | 0.79 | % | | | 0.90 | % |
| | Institutional | | | 0.45 | | | | 0.56 | |
| | Investor | | | 0.54 | | | | 0.65 | |
| | Separate Account Institutional | | | 0.45 | | | | 0.56 | |
| | | Class R6 | | | 0.44 | | | | 0.55 | |
| | 5 | | The expense ratios of the Fund, both current (net of applicable fee waivers and/or expense limitations) and before waivers (gross of applicable fee waivers and/or expense limitations) are as set forth above according to the most recent publicly available Prospectus for the Fund and may differ from the expense ratios disclosed in the Financial Highlights in this report. Pursuant to a contractual arrangement, the Fund’s waivers and/or expense limitations will remain in place through at least July 28, 2018, and prior to such date the Investment Adviser may not terminate the arrangements without the approval of the Fund’s Board of Trustees. If these arrangements are discontinued in the future, the expense ratios may change without shareholder approval. |
44
FUND BASICS
|
| FUND COMPOSITION6 |
| Percentage of Net Assets |
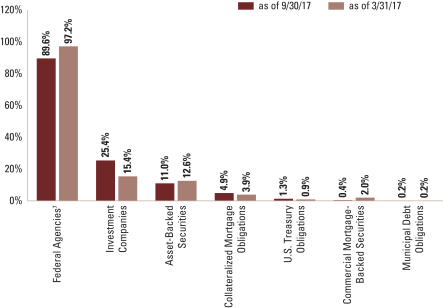
| | 6�� | | The percentage shown for each investment category reflects the value of investments in that category as a percentage of net assets. Figures in the graph may not sum to 100% due to the exclusion of other assets and liabilities. The graph depicts the Fund’s investments but may not represent the Fund’s market exposure due to the exclusion of certain derivatives, if any, as listed in the Additional Investment Information section of the Schedule of Investments. |
| | 7 | | “Federal Agencies” are mortgage-backed securities guaranteed by the Government National Mortgage Association (“GNMA”), Federal National Mortgage Association (“FNMA”) and Federal Home Loan Mortgage Corp. (“FHLMC”). GNMA instruments are backed by the full faith and credit of the U.S. Government. |
45
INDEX DEFINITIONS
Index Definitions
The Markit iBoxx USD Liquid Leveraged Loan Index is composed of approximately 100 of the most liquid, tradable leveraged loans.
CDX is an index based on a basket of North American single-name high yield credit default swaps.
46
GOLDMAN SACHS DYNAMIC EMERGING MARKETS DEBT FUND
Schedule of Investments
September 30, 2017 (Unaudited)
| | | | | | | | | | | | | | |
Principal
Amount | | | Interest
Rate | | | Maturity
Date | | | Value | |
| Sovereign Debt Obligations – 53.9% | |
| Argentina – 3.8% | |
| City of Buenos Aires Argentina (NR/B3) (Argentina Deposit
Rates + 3.250%)(e) |
|
| ARS | 2,070,000 | | | | 23.770 | % | | | 03/29/24 | | | $ | 117,153 | |
| Provincia de Buenos Aires (NR/B3) (Argentina Deposit
Rates + 3.830%)(e) |
|
| | 580,000 | | | | 24.500 | | | | 05/31/22 | | | | 33,632 | |
| Republic of Argentina (NR/NR) (Argentina Deposit Rates +
2.000%)(e) |
|
| | 7,475,000 | | | | 26.250 | | | | 06/21/20 | | | | 453,772 | |
| | 360,000 | | | | 22.548 | | | | 04/03/22 | | | | 20,535 | |
| | Republic of Argentina (NR/B3) | |
| | 70,000 | | | | 15.500 | | | | 10/17/26 | | | | 4,300 | |
| | Republic of Argentina (B/NR) | |
| | (Argentina Deposit Rates + 2.500%)(e) | |
| | 50,000 | | | | 22.710 | | | | 03/11/19 | | | | 2,909 | |
| | (Argentina Deposit Rates + 3.250%)(e) | |
| | 25,000 | | | | 23.338 | | | | 03/01/20 | | | | 1,482 | |
| EUR | 27,522 | | | | 7.820 | | | | 12/31/33 | | | | 35,903 | |
| | Republic of Argentina (B/B3) | |
| $ | 50,000 | | | | 6.875 | | | | 01/26/27 | | | | 54,025 | |
| EUR | 27,522 | | | | 7.820 | | | | 12/31/33 | | | | 36,269 | |
| | 10,000 | | | | 2.260 | (a) | | | 12/31/38 | | | | 8,067 | |
| $ | 190,000 | | | | 2.500 | (a) | | | 12/31/38 | | | | 134,425 | |
| | | | | | | | | | | | | | |
| | | | | | | | | | | | | 902,472 | |
| | |
| Brazil – 2.9% | |
| | Brazil Letras do Tesouro Nacional (NR/NR)(b) | |
| BRL | 59,000 | | | | 0.000 | | | | 10/01/19 | | | | 16,002 | |
| | Brazil Notas do Tesouro Nacional (BB/Ba2) | |
| | 403,000 | | | | 10.000 | | | | 01/01/25 | | | | 130,578 | |
| | 1,476,000 | | | | 10.000 | | | | 01/01/27 | | | | 474,766 | |
| | 195,459 | | | | 6.000 | | | | 08/15/50 | | | | 69,461 | |
| | | | | | | | | | | | | | |
| | | | | | | | | | | | | 690,807 | |
| | |
| Bulgaria – 0.5% | |
| | Republic of Bulgaria (BB+/Baa2) | |
| EUR | 100,000 | | | | 3.125 | | | | 03/26/35 | | | | 126,463 | |
| | |
| Chile – 1.4% | |
| | Bonos de la Tesoreria de la Republica en Pesos (NR/NR) | |
| CLP | 25,000,000 | | | | 5.000 | | | | 03/01/35 | | | | 39,638 | |
| | Bonos de la Tesoreria de la Republica en Pesos (NR/Aa3) | |
| | 65,000,000 | | | | 4.500 | | | | 03/01/21 | | | | 104,222 | |
| | 35,000,000 | | | | 4.500 | | | | 03/01/26 | | | | 55,093 | |
| | Republic of Chile (A+/Aa3) | |
| | 83,500,000 | | | | 5.500 | | | | 08/05/20 | | | | 138,169 | |
| | | | | | | | | | | | | | |
| | | | | | | | | | | | | 337,122 | |
| | |
| Colombia – 4.6% | |
| | Republic of Colombia (NR/NR) | |
| COP | 149,600,000 | | | | 7.000 | | | | 06/30/32 | | | | 50,920 | |
| | Republic of Colombia (NR/Baa2)(c) | |
| | 192,000,000 | | | | 4.375 | | | | 03/21/23 | | | | 61,823 | |
| | Republic of Colombia (BBB/Baa2) | |
| | 212,000,000 | | | | 7.750 | | | | 04/14/21 | | | | 77,361 | |
| $ | 200,000 | | | | 3.875 | (c) | | | 04/25/27 | | | | 203,100 | |
| | |
| Sovereign Debt Obligations – (continued) | |
| Colombia – (continued) | |
| | Republic of Colombia (BBB+/Baa2) | |
| COP | 63,700,000 | | | | 5.000 | | | | 11/21/18 | | | | 21,672 | |
| | 959,415,912 | | | | 3.500 | | | | 03/10/21 | | | | 336,346 | |
| | 241,200,000 | | | | 10.000 | | | | 07/24/24 | | | | 98,528 | |
| | 641,600,000 | | | | 7.500 | | | | 08/26/26 | | | | 231,968 | |
| | | | | | | | | | | | | | |
| | | | | | | | | | | | | 1,081,718 | |
| | |
| Dominican Republic – 0.7% | |
| | Dominican Republic (NR/NR) | |
| DOP | 400,000 | | | | 11.375 | | | | 07/06/29 | | | | 8,718 | |
| | Dominican Republic (BB-/Ba3) | |
| $ | 100,000 | | | | 6.850 | | | | 01/27/45 | | | | 111,500 | |
| | Dominican Republic Central Bank Notes (NR/NR)(d) | |
| DOP | 1,910,000 | | | | 11.000 | | | | 09/15/23 | | | | 41,170 | |
| | | | | | | | | | | | | | |
| | | | | | | | | | | | | 161,388 | |
| | |
| Ecuador – 0.8% | |
| | Ecuador Government International Bond (B-/NR) | |
| $ | 200,000 | | | | 7.950 | | | | 06/20/24 | | | | 197,000 | |
| | |
| El Salvador – 0.5% | |
| | El Salvador Government International Bond (CCC+/Caa1) | |
| | 20,000 | | | | 7.750 | | | | 01/24/23 | | | | 21,450 | |
| | 71,000 | | | | 5.875 | | | | 01/30/25 | | | | 69,491 | |
| | 30,000 | | | | 6.375 | | | | 01/18/27 | | | | 29,625 | |
| | | | | | | | | | | | | | |
| | | | | | | | | | | | | 120,566 | |
| | |
| Guatemala – 0.9% | |
| | Republic of Guatemala (BB/Ba1) | |
| | 200,000 | | | | 5.750 | | | | 06/06/22 | | | | 217,750 | |
| | |
| Hungary – 1.9% | |
| | Hungary Government Bond (NR/NR) | |
| HUF | 32,640,000 | | | | 2.750 | | | | 12/22/26 | | | | 126,181 | |
| | Hungary Government Bond (BBB-/NR) | |
| | 71,450,000 | | | | 3.000 | | | | 06/26/24 | | | | 289,301 | |
| | 4,350,000 | | | | 5.500 | | | | 06/24/25 | | | | 20,261 | |
| | | | | | | | | | | | | | |
| | | | | | | | | | | | | 435,743 | |
| | |
| Indonesia – 2.1% | |
| | Perusahaan Penerbit SBSN (BBB-/Baa3) | |
| $ | 210,000 | | | | 4.325 | | | | 05/28/25 | | | | 220,414 | |
| | Republic of Indonesia (BBB-/Baa3) | |
| | 200,000 | | | | 6.750 | | | | 01/15/44 | | | | 267,448 | |
| | | | | | | | | | | | | | |
| | | | | | | | | | | | | 487,862 | |
| | |
| Malaysia – 1.8% | |
| | Malaysia Government Bond (NR/NR) | |
| MYR | 410,000 | | | | 4.245 | | | | 09/30/30 | | | | 94,716 | |
| | Malaysia Government Bond (NR/A3) | |
| | 50,000 | | | | 3.580 | | | | 09/28/18 | | | | 11,888 | |
| | 10,000 | | | | 3.759 | | | | 03/15/19 | | | | 2,388 | |
| | 50,000 | | | | 5.734 | | | | 07/30/19 | | | | 12,353 | |
| | Malaysia Government Bond (NR/A3) | |
| | 40,000 | | | | 4.378 | | | | 11/29/19 | | | | 9,673 | |
| | Malaysia Government Bond (NR/A3) | |
| | 160,000 | | | | 3.418 | | | | 08/15/22 | | | | 37,429 | |
| | 150,000 | | | | 3.480 | | | | 03/15/23 | | | | 34,985 | |
| | |
| | |
| The accompanying notes are an integral part of these financial statements. | | 47 |
GOLDMAN SACHS DYNAMIC EMERGING MARKETS DEBT FUND
Schedule of Investments (continued)
September 30, 2017 (Unaudited)
| | | | | | | | | | | | | | |
Principal
Amount | | | Interest
Rate | | | Maturity
Date | | | Value | |
| Sovereign Debt Obligations – (continued) | |
| Malaysia – (continued) | |
| | Malaysia Government Bond (NR/A3) (continued) | |
| MYR | 120,000 | | | | 3.800 | % | | | 08/17/23 | | | $ | 28,342 | |
| | 150,000 | | | | 3.955 | | | | 09/15/25 | | | | 35,551 | |
| | 320,000 | | | | 4.498 | | | | 04/15/30 | | | | 76,895 | |
| | 80,000 | | | | 4.254 | | | | 05/31/35 | | | | 18,348 | |
| | Malaysia Government Investment Issue (NR/NR) | |
| | 20,000 | | | | 3.872 | | | | 08/30/18 | | | | 4,766 | |
| | 110,000 | | | | 4.045 | | | | 08/15/24 | | | | 26,072 | |
| | 70,000 | | | | 4.786 | | | | 10/31/35 | | | | 16,681 | |
| | | | | | | | | | | | | | |
| | | | | | | | | | | | | 410,087 | |
| | |
| Mexico – 5.0% | |
| | United Mexican States (NR/A3) | |
| MXN | 86,100 | | | | 8.000 | | | | 11/07/47 | | | | 5,152 | |
| | United Mexican States (A/A3) | |
| | 21,260,100 | | | | 6.500 | | | | 06/09/22 | | | | 1,156,301 | |
| | | | | | | | | | | | | | |
| | | | | | | | | | | | | 1,161,453 | |
| | |
| Nigeria – 0.5% | |
| | Republic of Nigeria (B/(P)B1) | |
| $ | 110,000 | | | | 5.625 | | | | 06/27/22 | | | | 112,612 | |
| | |
| Panama – 0.1% | |
| | Panama Notas del Tesoro (BBB/NR) | |
| | 30,000 | | | | 4.875 | | | | 02/05/21 | | | | 32,509 | |
| | |
| Paraguay(d) – 0.9% | |
| | Republic of Paraguay (BB/Ba1) | |
| | 200,000 | | | | 5.000 | | | | 04/15/26 | | | | 213,750 | |
| | |
| Peru – 2.3% | |
| | Republic of Peru (NR/NR) | |
| PEN | 15,000 | | | | 5.200 | | | | 09/12/23 | | | | 4,779 | |
| | 91,000 | | | | 6.714 | | | | 02/12/55 | | | | 29,155 | |
| | Republic of Peru (NR/A3) | |
| | 420,000 | | | | 6.150 | (d) | | | 08/12/32 | | | | 134,914 | |
| | 403,000 | | | | 6.850 | | | | 02/12/42 | | | | 133,254 | |
| | Republic of Peru (A-/A3) | |
| | 171,000 | | | | 5.700 | | | | 08/12/24 | | | | 55,640 | |
| | 231,000 | | | | 6.950 | | | | 08/12/31 | | | | 79,501 | |
| | 272,000 | | | | 6.900 | | | | 08/12/37 | | | | 92,100 | |
| | | | | | | | | | | | | | |
| | | | | | | | | | | | | 529,343 | |
| | |
| Poland – 1.5% | |
| | Poland Government Bond (A-/A2) | |
| PLN | 1,370,000 | | | | 2.500 | | | | 07/25/27 | | | | 348,455 | |
| | |
| Romania – 1.0% | |
| | Republic of Romania (NR/NR) | |
| RON | 280,000 | | | | 5.850 | | | | 04/26/23 | | | | 81,574 | |
| | 160,000 | | | | 3.250 | | | | 04/29/24 | | | | 40,317 | |
| | 30,000 | | | | 4.750 | | | | 02/24/25 | | | | 8,197 | |
| | 240,000 | | | | 5.800 | | | | 07/26/27 | | | | 69,965 | |
| | Republic of Romania (BBB-/Baa3) | |
| EUR | 20,000 | | | | 3.875 | | | | 10/29/35 | | | | 25,027 | |
| | | | | | | | | | | | | | |
| | | | 225,080 | |
| | |
| Sovereign Debt Obligations – (continued) | |
| Russia – 5.6% | |
| | Russian Federation Bond (NR/NR) | |
| RUB | 10,470,000 | | | | 7.750 | | | | 09/16/26 | | | | 185,000 | |
| | 29,260,000 | | | | 8.500 | | | | 09/17/31 | | | | 547,837 | |
| | 20,390,000 | | | | 7.700 | | | | 03/23/33 | | | | 353,619 | |
| | Russian Federation Bond (BB+/Ba1) | |
| $ | 200,000 | | | | 4.875 | | | | 09/16/23 | | | | 217,800 | |
| | | | | | | | | | | | | | |
| | | | | | | | | | | | | 1,304,256 | |
| | |
| South Africa – 7.8% | |
| | Republic of South Africa (NR/Baa3) | |
| | 200,000 | | | | 4.850 | | | | 09/27/27 | | | | 198,000 | |
| | Republic of South Africa (BB+/Baa3) | |
| | 220,000 | | | | 4.300 | | | | 10/12/28 | | | | 207,075 | |
| | Republic of South Africa (BBB-/Baa3) | |
| ZAR | 400,000 | | | | 8.000 | | | | 01/31/30 | | | | 27,128 | |
| | 5,700,000 | | | | 8.250 | | | | 03/31/32 | | | | 384,840 | |
| | 3,938,000 | | | | 8.875 | | | | 02/28/35 | | | | 274,829 | |
| | 970,000 | | | | 6.250 | | | | 03/31/36 | | | | 51,619 | |
| | 8,450,000 | | | | 8.500 | | | | 01/31/37 | | | | 561,874 | |
| | 1,680,000 | | | | 9.000 | | | | 01/31/40 | | | | 115,436 | |
| | 120,000 | | | | 8.750 | | | | 01/31/44 | | | | 8,007 | |
| | 60,000 | | | | 8.750 | | | | 02/28/48 | | | | 4,008 | |
| | | | | | | | | | | | | | |
| | | | | | | | | | | | | 1,832,816 | |
| | |
| Sri Lanka(d) – 0.9% | |
| | Republic of Sri Lanka (B+/B1) | |
| $ | 200,000 | | | | 6.825 | | | | 07/18/26 | | | | 219,368 | |
| | |
| Thailand – 3.3% | |
| | Thailand Government Bond (NR/Baa1) | |
| THB | 10,120,380 | | | | 1.250 | | | | 03/12/28 | | | | 291,879 | |
| | Thailand Government Bond (A-/Baa1) | |
| | 6,726,195 | | | | 1.200 | | | | 07/14/21 | | | | 199,972 | |
| | 2,100,000 | | | | 3.625 | | | | 06/16/23 | | | | 68,874 | |
| | 6,400,000 | | | | 3.650 | | | | 06/20/31 | | | | 212,268 | |
| | | | | | | | | | | | | | |
| | | | | | | | | | | | | 772,993 | |
| | |
| Turkey – 2.6% | |
| | Republic of Turkey (NR/NR) | |
| TRY | 380,000 | | | | 10.600 | | | | 02/11/26 | | | | 105,747 | |
| | Republic of Turkey (NR/Ba1) | |
| | 300,000 | | | | 11.000 | | | | 03/02/22 | | | | 84,684 | |
| EUR | 100,000 | | | | 3.250 | | | | 06/14/25 | | | | 118,338 | |
| $ | 40,000 | | | | 7.375 | | | | 02/05/25 | | | | 46,450 | |
| | 110,000 | | | | 6.875 | | | | 03/17/36 | | | | 124,025 | |
| | Turkey Government Bond (NR/NR) | |
| TRY | 260,000 | | | | 8.000 | | | | 03/12/25 | | | | 62,775 | |
| | 200,000 | | | | 10.500 | | | | 08/11/27 | | | | 55,457 | |
| | | | | | | | | | | | | | |
| | | | | | | | | | | | | 597,476 | |
| | |
| Ukraine – 0.4% | |
| | Ukraine Government Bond (B-/Caa2) | |
| $ | 100,000 | | | | 7.750 | | | | 09/01/25 | | | | 103,450 | |
| | |
| Uruguay – 0.1% | |
| | Republic of Uruguay (NR/NR)(d) | |
| UYU | 450,000 | | | | 8.500 | | | | 03/15/28 | | | | 16,006 | |
| | |
| | |
| 48 | | The accompanying notes are an integral part of these financial statements. |
GOLDMAN SACHS DYNAMIC EMERGING MARKETS DEBT FUND
| | | | | | | | | | | | | | |
Principal
Amount | | | Interest
Rate | | | Maturity
Date | | | Value | |
| Sovereign Debt Obligations – (continued) | |
| Uruguay – (continued) | |
| | Republic of Uruguay (BBB/Baa2) | |
| UYU | 429,190 | | | | 4.375 | % | | | 12/15/28 | | | $ | 16,970 | |
| | | | | | | | | | | | | | |
| | | | | | | | | | | | | 32,976 | |
| | |
| | TOTAL SOVEREIGN DEBT OBLIGATIONS | |
| | (Cost $12,060,692) | | | | | | | | | | | $ | 12,655,515 | |
| | |
| | | | | | | | | | | | | | |
| Corporate Obligations – 32.3% | |
| Argentina – 1.7% | |
| | Arcor SAIC (NR/B1)(c)(d) | |
| $ | 80,000 | | | | 6.000 | % | | | 07/06/23 | | | $ | 85,700 | |
| | Banco Macro SA (NR/B3)(d) | |
| ARS | 1,000,000 | | | | 17.500 | | | | 05/08/22 | | | | 54,890 | |
| | Cablevision SA (NR/B3)(c) | |
| $ | 70,000 | | | | 6.500 | (d) | | | 06/15/21 | | | | 74,638 | |
| | 80,000 | | | | 6.500 | | | | 06/15/21 | | | | 85,300 | |
| | IRSA Propiedades Comerciales SA (B/NR)(c)(d) | |
| | 10,000 | | | | 8.750 | | | | 03/23/23 | | | | 11,225 | |
| | YPF SA (NR/B3) | |
| | 85,000 | | | | 8.875 | | | | 12/19/18 | | | | 90,737 | |
| | | | | | | | | | | | | | |
| | | | | | | | | | | | | 402,490 | |
| | |
| Brazil(c)(e) – 0.8% | |
| | Banco do Brasil SA (B-/NR) (10 year CMT + 4.398%) | |
| | 200,000 | | | | 6.250 | | | | 10/29/49 | | | | 177,750 | |
| | |
| Canada – 0.5% | |
| | First Quantum Minerals Ltd. (B-/B3)(c)(d) | |
| | 50,000 | | | | 7.000 | | | | 02/15/21 | | | | 51,375 | |
| | Harvest Operations Corp. (CCC+/Caa2) | |
| | 70,000 | | | | 6.875 | | | | 10/01/17 | | | | 70,000 | |
| | | | | | | | | | | | | | |
| | | | | | | | | | | | | 121,375 | |
| | |
| Chile – 0.9% | |
| | Sociedad Quimica y Minera de Chile SA (BBB/Baa1) | |
| | 200,000 | | | | 3.625 | | | | 04/03/23 | | | | 201,500 | |
| | |
| China(c) – 0.9% | |
| | China Evergrande Group (B-/B3) | |
| $ | 200,000 | | | | 8.750 | | | | 06/28/25 | | | | 202,772 | |
| | |
| Colombia – 1.2% | |
| | Banco de Bogota SA (BBB-/Baa2)(d) | |
| | 200,000 | | | | 4.375 | | | | 08/03/27 | | | | 201,300 | |
| | Colombia Telecomunicaciones SA ESP (B+/NR)(e) | |
| | 71,000 | | | | 8.500 | | | | 03/30/49 | | | | 75,349 | |
| | | | | | | | | | | | | | |
| | | | | | | | | | | | | 276,649 | |
| | |
| Dominican Republic(c)(d) – 0.9% | |
| | Aeropuertos Dominicanos Siglo XXI SA (BB-/Ba3) | |
| | 200,000 | | | | 6.750 | | | | 03/30/29 | | | | 215,500 | |
| | |
| Guatemala(d) – 1.1% | |
| | Agromercantil Senior Trust (BB/NR) | |
| | 100,000 | | | | 6.250 | | | | 04/10/19 | | | | 103,912 | |
| | Central American Bottling Corp. (BB/Ba2)(c) | |
| | 150,000 | | | | 5.750 | | | | 01/31/27 | | | | 158,625 | |
| | | | | | | | | | | | | | |
| 262,537 | |
| | |
| Corporate Obligations – (continued) | |
| Ireland – 1.6% | |
| Credit Bank of Moscow Via CBOM Finance PLC (NR/NR)
(5 year USD Swap + 5.416%)(c)(e) |
|
| 200,000 | | | | 7.500 | | | | 10/05/27 | | | | 169,300 | |
| | Phosagro OAO via Phosagro Bond Funding DAC (BBB-/Ba1)(d) | |
| | 200,000 | | | | 3.950 | | | | 11/03/21 | | | | 203,000 | |
| | | | | | | | | | | | | | |
| | 372,300 | |
| | |
| Israel(d) – 0.3% | |
| | Delek & Avner Tamar Bond Ltd. (BBB-/Baa3) | |
| | 80,000 | | | | 3.839 | | | | 12/30/18 | | | | 81,400 | |
| | |
| Japan(c)(d)(f) – 1.1% | |
| | Universal Entertainment Corp. (NR/NR) | |
| | 252,909 | | | | 8.500 | | | | 08/24/20 | | | | 260,345 | |
| | |
| Kazakhstan – 0.8% | |
| | KazMunayGas National Co. JSC (BB/Baa3) | |
| | 190,000 | | | | 9.125 | | | | 07/02/18 | | | | 198,740 | |
| | |
| Luxembourg – 3.6% | |
| | Altice Financing SA (BB-/B1)(c)(d) | |
| EUR | 100,000 | | | | 5.250 | | | | 02/15/23 | | | | 124,268 | |
| | Gazprom OAO Via Gaz Capital SA (BB+/Ba1)(g) | |
| $ | 100,000 | | | | 9.250 | | | | 04/23/19 | | | | 109,250 | |
| | Millicom International Cellular SA (NR/Ba2)(c)(d) | |
| | 200,000 | | | | 5.125 | | | | 01/15/28 | | | | 202,200 | |
| | Severstal OAO Via Steel Capital SA (BBB-/Ba1) | |
| | 100,000 | | | | 6.700 | | | | 10/25/17 | | | | 100,300 | |
| | Wind Acquisition Finance SA (BB/Ba3)(c)(d) | |
| EUR | 110,000 | | | | 4.000 | | | | 07/15/20 | | | | 131,439 | |
| | Wind Acquisition Finance SA (B/B3)(c) | |
| | 140,000 | | | | 7.000 | | | | 04/23/21 | | | | 172,020 | |
| | | | | | | | | | | | | | |
| | | | | | | | | | | | | 839,477 | |
| | |
| Mauritius(c)(d) – 0.8% | | | | | | | | | | |
| | Greenko Investment Co. (B+/NR) | |
| $ | 200,000 | | | | 4.875 | | | | 08/16/23 | | | | 197,916 | |
| | |
| Mexico – 2.1% | | | | | | | | | | |
| | Gruma SAB de CV (BBB/NR)(c) | |
| | 200,000 | | | | 4.875 | | | | 12/01/24 | | | | 216,750 | |
| | Petroleos Mexicanos (BBB+/Baa3) | |
| | 10,000 | | | | 3.500 | | | | 07/23/20 | | | | 10,210 | |
| | 80,000 | | | | 6.375 | | | | 02/04/21 | | | | 87,420 | |
| | 10,000 | | | | 5.375 | (d) | | | 03/13/22 | | | | 10,669 | |
| | 120,000 | | | | 6.875 | | | | 08/04/26 | | | | 136,488 | |
| | 10,000 | | | | 6.500 | (d) | | | 03/13/27 | | | | 11,082 | |
| | 20,000 | | | | 6.750 | (d) | | | 09/21/47 | | | | 21,288 | |
| | | | | | | | | | | | | | |
| | | | | | | | | | | | | 493,907 | |
| | |
| Mongolia(c) – 0.6% | |
| | Energy Resources LLC (NR/NR) | |
| | 124,111 | | | | 8.000 | | | | 09/30/22 | | | | 124,569 | |
| | 45,135 | | | | 0.000 | (f)(h) | | | 10/01/99 | | | | 22,342 | |
| | | | | | | | | | | | | | |
| | | | | | | | | | | | | 146,911 | |
| | |
| Netherlands – 2.3% | |
| | Digi Communications NV (BB-/B1)(c)(d) | |
| EUR | 100,000 | | | | 5.000 | | | | 10/15/23 | | | | 125,538 | |
| | |
| | |
| The accompanying notes are an integral part of these financial statements. | | 49 |
GOLDMAN SACHS DYNAMIC EMERGING MARKETS DEBT FUND
Schedule of Investments (continued)
September 30, 2017 (Unaudited)
| | | | | | | | | | | | | | |
Principal
Amount | | | Interest
Rate | | | Maturity
Date | | | Value | |
| Corporate Obligations – (continued) | |
| Netherlands – (continued) | |
| | Metinvest BV (NR/NR)(f) | |
| $ | 70,072 | | | | 9.373 | % | | | 12/31/21 | | | $ | 70,773 | |
| | Petrobras Global Finance BV (BB-/B1) | |
| | 20,000 | | | | 6.125 | | | | 01/17/22 | | | | 21,471 | |
| | 251,000 | | | | 5.999 | (d) | | | 01/27/28 | | | | 251,000 | |
| | Teva Pharmaceutical Finance Netherlands III BV (BBB-/Baa3) | |
| | 20,000 | | | | 2.800 | | | | 07/21/23 | | | | 19,076 | |
| | 60,000 | | | | 3.150 | | | | 10/01/26 | | | | 55,302 | |
| | | | | | | | | | | | | | |
| | | | | | | | | | | | | 543,160 | |
| | |
| Paraguay – 1.6% | |
| | Banco Regional SAECA (BB/Ba1)(d) | |
| | 150,000 | | | | 8.125 | | | | 01/24/19 | | | | 158,248 | |
| | Telefonica Celular del Paraguay SA (NR/Ba3)(c) | |
| | 200,000 | | | | 6.750 | | | | 12/13/22 | | | | 208,000 | |
| | | | | | | | | | | | | | |
| | | | | | | | | | | | | 366,248 | |
| | |
| Peru – 3.0% | |
| | Abengoa Transmision Sur SA (BBB/NR)(d) | |
| | 199,240 | | | | 6.875 | | | | 04/30/43 | | | | 218,842 | |
| | Corp. Lindley SA (BBB/NR) | |
| | 290,000 | | | | 6.750 | | | | 11/23/21 | | | | 322,171 | |
| | 150,000 | | | | 4.625 | | | | 04/12/23 | | | | 154,549 | |
| | | | | | | | | | | | | | |
| | | | | | | | | | | | | 695,562 | |
| | |
| Qatar – 1.2% | |
| | Ras Laffan Liquefied Natural Gas Co. Ltd. III (A/A1) | |
| | 250,000 | | | | 6.332 | | | | 09/30/27 | | | | 288,750 | |
| | |
| Singapore(c)(d) – 0.9% | |
| | Geo Coal International Pte Ltd. (B/B2) | |
| | 200,000 | | | | 8.000 | | | | 10/04/22 | | | | 200,000 | |
| | |
| Turkey – 1.7% | |
| | Anadolu Efes Biracilik Ve Malt Sanayii AS (BBB-/Baa3) | |
| | 200,000 | | | | 3.375 | | | | 11/01/22 | | | | 195,500 | |
| | Global Liman Isletmeleri (NR/B1)(c) | |
| | 200,000 | | | | 8.125 | | | | 11/14/21 | | | | 207,250 | |
| | | | | | | | | | | | | | |
| | | | | | | | | | | | | 402,750 | |
| | |
| United States(c) – 1.7% | |
| | CEMEX Finance LLC (BB/NR) | |
| EUR | 120,000 | | | | 4.625 | | | | 06/15/24 | | | | 154,061 | |
| | Digicel Ltd. (NR/B1)(d) | |
| $ | 240,000 | | | | 6.000 | | | | 04/15/21 | | | | 235,173 | |
| | | | | | | | | | | | | | |
| | | | | | | | | | 389,234 | |
| | |
| Venezuela – 1.0% | |
| | Petroleos de Venezuela SA (NR/NR) | |
| | 390,000 | | | | 6.000 | | | | 10/28/22 | | | | 111,540 | |
| | Petroleos de Venezuela SA (CCC-/NR) | |
| | 300,000 | | | | 6.000 | | | | 05/16/24 | | | | 91,200 | |
| | 70,000 | | | | 6.000 | | | | 11/15/26 | | | | 21,245 | |
| | 30,000 | | | | 5.375 | | | | 04/12/27 | | | | 9,000 | |
| | | | | | | | | | | | | | |
| | | | | | | | | | | | | 232,985 | |
| | |
| | TOTAL CORPORATE OBLIGATIONS | |
| | (Cost $7,335,263) | | | | | | | | | | | $ | 7,570,258 | |
| | |
Shares | | | Description | | | | | | Value | |
| Common Stock(h) – 0.0% | |
| Mongolia | |
| | 103,055 | | |
| Mongolian Mining
Corp. |
| | | | |
| | (Cost $2,992) | | | $ | 2,680 | |
| | |
| | | | | | | | | | | | | | |
Principal
Amount | | | Interest
Rate | | | Maturity
Date | | | Value | |
| Structured Notes – 6.6% | |
| Egypt – 2.2% | | | | | | | | | | |
| | Arab Republic of Egypt (Issuer Citibank NA) (NR/NR) | |
| $ | 5,000,000 | | | | 0.000 | %(b) | | | 02/08/18 | | | $ | 266,173 | |
| | 5,000,000 | | | | 0.000 | (b)(d) | | | 05/10/18 | | | | 254,297 | |
| | | | | | | | | | | | | | |
| | | | | | | | | | | | | 520,470 | |
| | |
| Indonesia(d) – 4.4% | | | | | | | | | | |
| Republic of Indonesia (Issuer JPMorgan Chase Bank NA)
(NR/NR) |
|
| IDR | 2,848,000,000 | | | | 7.000 | | | | 05/17/22 | | | | 217,913 | |
| | 2,498,000,000 | | | | 9.000 | | | | 03/19/29 | | | | 215,415 | |
| | Republic of Indonesia (Issuer Standard Chartered Bank) (NR/NR) | |
| | 1,770,000,000 | | | | 8.375 | | | | 03/19/24 | | | | 144,390 | |
| | 2,136,000,000 | | | | 9.000 | | | | 03/19/29 | | | | 184,198 | |
| | 3,000,000,000 | | | | 8.750 | | | | 05/19/31 | | | | 256,255 | |
| | | | | | | | | | | | | | |
| | 1,018,171 | |
| | |
| | TOTAL STRUCTURED NOTES | |
| | (Cost $1,413,549) | | | | | | | | | | | $ | 1,538,641 | |
| | |
| | | | | | | | | | | | | | |
| Municipal Debt Obligations(c)(h) – 0.6% | |
| Puerto Rico – 0.6% | |
| Puerto Rico Commonwealth Aqueduct & Sewer Authority RB
(Senior Lien) Series 2008 A (CC/Ca) |
|
| $ | 5,000 | | | | 6.000 | % | | | 07/01/44 | | | $ | 3,763 | |
| Puerto Rico Commonwealth Aqueduct & Sewer Authority RB
(Senior Lien) Series 2012 A (CC/Ca) |
|
| | 5,000 | | | | 5.125 | | | | 07/01/37 | | | | 3,575 | |
| | 5,000 | | | | 5.250 | | | | 07/01/42 | | | | 3,575 | |
| Puerto Rico Commonwealth Aqueduct & Sewer Authority RB
(Senior Lien) Series 2012 D (CC/Ca) |
|
| | 5,000 | | | | 5.000 | | | | 07/01/33 | | | | 3,575 | |
| Puerto Rico Commonwealth GO Bonds Refunding for Public
Improvement Series 2008 A (D/Ca) |
|
| | 20,000 | | | | 5.500 | | | | 07/01/32 | | | | 9,225 | |
| Puerto Rico Commonwealth GO Bonds Refunding for Public
Improvement Series 2011 E (D/Ca) |
|
| | 70,000 | | | | 5.625 | | | | 07/01/32 | | | | 32,375 | |
| Puerto Rico Commonwealth GO Bonds Refunding for Public
Improvement Series 2012 A (D/Ca) |
|
| | 15,000 | | | | 5.500 | | | | 07/01/26 | | | | 7,013 | |
| | 20,000 | | | | 5.500 | | | | 07/01/39 | | | | 9,350 | |
| | 25,000 | | | | 5.000 | | | | 07/01/41 | | | | 11,344 | |
| | Puerto Rico Commonwealth GO Bonds Series 2008 A (D/Ca) | |
| | 15,000 | | | | 5.375 | | | | 07/01/33 | | | | 6,900 | |
| | |
| | |
| 50 | | The accompanying notes are an integral part of these financial statements. |
GOLDMAN SACHS DYNAMIC EMERGING MARKETS DEBT FUND
| | | | | | | | | | | | | | |
Principal
Amount | | | Interest
Rate | | | Maturity
Date | | | Value | |
| Municipal Debt Obligations(c)(h) – (continued) | |
| Puerto Rico – (continued) | |
| Puerto Rico Sales Tax Financing Corp. Sales Tax RB
SubSeries 2010 A (D/Ca) |
|
| $ | 15,000 | | | | 5.500 | % | | | 08/01/37 | | | $ | 3,113 | |
| | 55,000 | | | | 5.375 | | | | 08/01/39 | | | | 11,412 | |
| | 35,000 | | | | 5.500 | | | | 08/01/42 | | | | 7,262 | |
| Puerto Rico Sales Tax Financing Corp. Sales Tax RB
SubSeries 2010 C (D/Ca) |
|
| | 5,000 | | | | 5.000 | | | | 08/01/35 | | | | 1,038 | |
| | 10,000 | | | | 6.000 | | | | 08/01/39 | | | | 2,075 | |
| | 20,000 | | | | 5.250 | | | | 08/01/41 | | | | 4,150 | |
| Puerto Rico Sales Tax Financing Corp. Sales Tax RB
SubSeries 2011 A-1 (D/Ca) |
|
| | 75,000 | | | | 5.000 | | | | 08/01/43 | | | | 15,562 | |
| Puerto Rico Sales Tax Financing Corp. Sales Tax RB Unrefunded
SubSeries 2009 A (D/Ca) |
|
| | 45,000 | | | | 5.500 | | | | 08/01/28 | | | | 9,337 | |
| | 35,000 | | | | 6.125 | | | | 08/01/29 | | | | 7,262 | |
| | |
| | TOTAL MUNICIPAL DEBT OBLIGATIONS | |
| | (Cost $324,179) | | | | | | | $ | 151,906 | |
| | |
| | | | | | | | |
| Shares | | | Distribution
Rate | | Value | |
| Investment Company(i) – 2.7% | |
| Goldman Sachs Financial Square Government Fund –
Institutional Shares |
|
| | 624,792 | | | 0.927% | | $ | 624,792 | |
| | (Cost $624,792) | | | | |
| | |
| | TOTAL INVESTMENTS – 96.1% | |
| | (Cost $21,761,467) | | $ | 22,543,792 | |
| | |
| OTHER ASSETS IN EXCESS OF
LIABILITIES – 3.9% | | | 925,388 | |
| | |
| | NET ASSETS – 100.0% | | $ | 23,469,180 | |
| | |
| | |
| The percentage shown for each investment category reflects the value of investments in that category as a percentage of net assets. |
(a) | | Coupon changes periodically based upon a predetermined schedule. Interest rate disclosed is that which is in effect on September 30, 2017. |
(b) | | Issued with a zero coupon. Income is recognized through the accretion of discount. |
(c) | | Security with “Call” features with resetting interest rates. Maturity dates disclosed are the final maturity dates. |
(d) | | Exempt from registration under Rule 144A of the Securities Act of 1933. Such securities may be deemed liquid by the investment adviser and may be resold, normally to qualified institutional buyers in transactions exempt from registration. Total market value of Rule 144A securities amounts to $5,287,249, which represents approximately 22.5% of net assets as of September 30, 2017. |
(e) | | Variable rate security. Interest rate disclosed is that which is in effect on September 30, 2017. |
(f) | | Pay-in-kind securities. |
| | |
(g) | | Security with “Put” features and resetting interest rates. Maturity dates disclosed are the puttable dates. Interest rate disclosed is that which is in effect at September 30, 2017. |
(h) | | Security is currently in default and/or non-income producing. |
(i) | | Represents an Affiliated Issuer. |
Security ratings disclosed, if any, are obtained from by Standard & Poor’s /Moody’s Investor Service and are unaudited. A brief description of the ratings is available in the Fund’s Statement of Additional Information.
| | |
|
Currency Abbreviations: |
ARS | | —Argentine Peso |
BRL | | —Brazilian Real |
CLP | | —Chilean Peso |
CNH | | —Chinese Yuan Renminbi Offshore |
CNY | | —Chinese Yuan Renminbi |
COP | | —Colombian Peso |
CZK | | —Czech Koruna |
DOP | | —Dominican Peso |
EGP | | —Egyptian Pound |
EUR | | —Euro |
HKD | | —Hong Kong Dollar |
HUF | | —Hungarian Forint |
IDR | | —Indonesian Rupiah |
INR | | —Indian Rupee |
KRW | | —South Korean Won |
MXN | | —Mexican Peso |
MYR | | —Malaysian Ringgit |
PEN | | —Peruvian Nuevo Sol |
PHP | | —Philippine Peso |
PLN | | —Polish Zloty |
RON | | —New Romanian Leu |
RUB | | —Russian Ruble |
SGD | | —Singapore Dollar |
THB | | —Thai Baht |
TRY | | —Turkish Lira |
TWD | | —Taiwan Dollar |
USD | | —U.S. Dollar |
UYU | | —Uruguayan Peso |
ZAR | | —South African Rand |
| | |
Investment Abbreviations: |
CMT | | —Constant Maturity Treasury Indexes |
EURO | | —Euro Offered Rate |
GO | | —General Obligation |
LLC | | —Limited Liability Company |
NR | | —Not Rated |
PLC | | —Public Limited Company |
PRIBOR | | —Prague Interbank Offered Rate |
RB | | —Revenue Bond |
TIIE | | —La Tasa de Interbank Equilibrium Interest Rate |
|
| | |
| The accompanying notes are an integral part of these financial statements. | | 51 |
GOLDMAN SACHS DYNAMIC EMERGING MARKETS DEBT FUND
Schedule of Investments (continued)
September 30, 2017 (Unaudited)
|
| ADDITIONAL INVESTMENT INFORMATION |
FORWARD FOREIGN CURRENCY EXCHANGE CONTRACTS — At September 30, 2017, the Fund had the following forward foreign currency exchange contracts:
FORWARD FOREIGN CURRENCY EXCHANGE CONTRACTS WITH UNREALIZED GAIN
| | | | | | | | | | | | | | | | | | | | | | | | |
| Counterparty | | Currency
Purchased | | | Currency
Sold | | | Current
Value | | | Settlement
Date | | | Unrealized
Gain | |
Morgan Stanley & Co. International PLC | | ARS | | | 844,162 | | | USD | | | 48,000 | | | $ | 48,624 | | | | 10/05/17 | | | $ | 625 | |
| | ARS | | | 1,396,299 | | | USD | | | 79,122 | | | | 80,196 | | | | 10/10/17 | | | | 1,075 | |
| | ARS | | | 400,248 | | | USD | | | 22,911 | | | | 22,975 | | | | 10/11/17 | | | | 64 | |
| | ARS | | | 203,896 | | | USD | | | 11,661 | | | | 11,697 | | | | 10/12/17 | | | | 36 | |
| | ARS | | | 980,199 | | | USD | | | 55,810 | | | | 55,817 | | | | 10/25/17 | | | | 6 | |
| | ARS | | | 757,833 | | | USD | | | 42,335 | | | | 43,032 | | | | 10/30/17 | | | | 697 | |
| | ARS | | | 800,308 | | | USD | | | 44,895 | | | | 45,394 | | | | 11/02/17 | | | | 499 | |
| | ARS | | | 983,710 | | | USD | | | 55,420 | | | | 55,614 | | | | 11/08/17 | | | | 193 | |
| | ARS | | | 305,520 | | | USD | | | 17,183 | | | | 17,225 | | | | 11/13/17 | | | | 42 | |
| | ARS | | | 699,067 | | | USD | | | 39,229 | | | | 39,328 | | | | 11/17/17 | | | | 99 | |
| | BRL | | | 2,381,846 | | | USD | | | 747,282 | | | | 751,711 | | | | 10/03/17 | | | | 4,430 | |
| | BRL | | | 3,986,622 | | | USD | | | 1,243,518 | | | | 1,252,774 | | | | 11/03/17 | | | | 9,256 | |
| | CNH | | | 1,575,301 | | | USD | | | 235,245 | | | | 235,850 | | | | 12/20/17 | | | | 606 | |
| | CZK | | | 4,536,705 | | | EUR | | | 170,346 | | | | 206,406 | | | | 10/03/17 | | | | 5,041 | |
| | CZK | | | 2,937,066 | | | EUR | | | 110,000 | | | | 133,886 | | | | 11/09/17 | | | | 3,599 | |
| | CZK | | | 9,123,512 | | | EUR | | | 341,054 | | | | 416,169 | | | | 11/21/17 | | | | 11,951 | |
| | CZK | | | 6,939,742 | | | EUR | | | 264,138 | | | | 316,573 | | | | 11/22/17 | | | | 3,500 | |
| | CZK | | | 50,348,850 | | | EUR | | | 1,935,200 | | | | 2,303,070 | | | | 12/20/17 | | | | 5,292 | |
| | CZK | | | 15,890,628 | | | EUR | | | 595,797 | | | | 727,838 | | | | 01/03/18 | | | | 19,819 | |
| | EGP | | | 584,151 | | | USD | | | 30,584 | | | | 32,564 | | | | 11/29/17 | | | | 1,980 | |
| | EGP | | | 525,087 | | | USD | | | 25,614 | | | | 28,837 | | | | 01/24/18 | | | | 3,223 | |
| | EUR | | | 52,000 | | | HUF | | | 16,122,954 | | | | 61,743 | | | | 12/20/17 | | | | 356 | |
| | EUR | | | 73,249 | | | PLN | | | 314,596 | | | | 86,972 | | | | 12/20/17 | | | | 738 | |
| | EUR | | | 61,167 | | | USD | | | 72,383 | | | | 72,628 | | | | 12/20/17 | | | | 245 | |
| | HKD | | | 1,291,989 | | | USD | | | 165,365 | | | | 165,406 | | | | 10/03/17 | | | | 41 | |
| | HKD | | | 1,230,307 | | | USD | | | 158,000 | | | | 158,133 | | | | 03/27/18 | | | | 133 | |
| | IDR | | | 1,700,932,895 | | | USD | | | 125,112 | | | | 125,926 | | | | 11/02/17 | | | | 815 | |
| | IDR | | | 2,480,030,556 | | | USD | | | 181,687 | | | | 182,626 | | | | 12/20/17 | | | | 939 | |
| | INR | | | 2,430,833 | | | USD | | | 37,000 | | | | 37,032 | | | | 11/03/17 | | | | 32 | |
| | KRW | | | 66,123,608 | | | USD | | | 57,750 | | | | 57,754 | | | | 10/12/17 | | | | 4 | |
| | PHP | | | 5,094,612 | | | USD | | | 99,430 | | | | 100,070 | | | | 10/10/17 | | | | 640 | |
| | PHP | | | 3,118,262 | | | USD | | | 61,059 | | | | 61,212 | | | | 10/19/17 | | | | 154 | |
| | PHP | | | 12,442,523 | | | USD | | | 242,592 | | | | 243,799 | | | | 11/14/17 | | | | 1,207 | |
| | PLN | | | 225,255 | | | EUR | | | 52,000 | | | | 61,745 | | | | 12/20/17 | | | | 2 | |
| | PLN | | | 167,347 | | | HUF | | | 12,001,573 | | | | 45,872 | | | | 12/20/17 | | | | 177 | |
| | RUB | | | 8,953,924 | | | USD | | | 147,974 | | | | 154,948 | | | | 10/13/17 | | | | 6,974 | |
| | RUB | | | 20,274,692 | | | USD | | | 345,000 | | | | 347,015 | | | | 12/14/17 | | | | 2,015 | |
| | SGD | | | 33,921 | | | USD | | | 25,000 | | | | 25,030 | | | | 12/20/17 | | | | 30 | |
| | TRY | | | 447,345 | | | USD | | | 122,117 | | | | 122,620 | | | | 12/20/17 | | | | 503 | |
| | TWD | | | 3,642,914 | | | USD | | | 119,319 | | | | 119,989 | | | | 10/20/17 | | | | 670 | |
| | TWD | | | 2,345,397 | | | USD | | | 77,165 | | | | 77,275 | | | | 10/26/17 | | | | 110 | |
| | USD | | | 48,655 | | | ARS | | | 844,162 | | | | 48,624 | | | | 10/05/17 | | | | 31 | |
| | USD | | | 184,000 | | | BRL | | | 579,793 | | | | 182,983 | | | | 10/03/17 | | | | 1,017 | |
| | USD | | | 29,383 | | | BRL | | | 93,422 | | | | 29,357 | | | | 11/03/17 | | | | 25 | |
| | USD | | | 61,000 | | | CLP | | | 37,690,253 | | | | 58,874 | | | | 10/12/17 | | | | 2,126 | |
| | USD | | | 61,315 | | | CLP | | | 38,369,633 | | | | 59,930 | | | | 10/16/17 | | | | 1,385 | |
| | USD | | | 117,700 | | | CLP | | | 74,227,350 | | | | 115,855 | | | | 11/16/17 | | | | 1,845 | |
| | USD | | | 407,037 | | | CNH | | | 2,704,790 | | | | 404,956 | | | | 12/20/17 | | | | 2,082 | |
| | |
| 52 | | The accompanying notes are an integral part of these financial statements. |
GOLDMAN SACHS DYNAMIC EMERGING MARKETS DEBT FUND
|
| ADDITIONAL INVESTMENT INFORMATION (continued) |
FORWARD FOREIGN CURRENCY EXCHANGE CONTRACTS WITH UNREALIZED GAIN (continued)
| | | | | | | | | | | | | | | | | | | | | | | | |
| Counterparty | | Currency
Purchased | | | Currency
Sold | | | Current
Value | | | Settlement
Date | | | Unrealized
Gain | |
Morgan Stanley & Co. International PLC (continued) | | USD | | | 61,000 | | | COP | | | 178,340,210 | | | $ | 60,524 | | | | 10/25/17 | | | $ | 476 | |
| | USD | | | 163,860 | | | EUR | | | 136,280 | | | | 161,813 | | | | 12/20/17 | | | | 2,047 | |
| | USD | | | 268,733 | | | HKD | | | 2,082,034 | | | | 266,551 | | | | 10/03/17 | | | | 2,182 | |
| | USD | | | 312,169 | | | HKD | | | 2,424,684 | | | | 310,476 | | | | 10/10/17 | | | | 1,693 | |
| | USD | | | 719,239 | | | HKD | | | 5,564,064 | | | | 715,153 | | | | 03/27/18 | | | | 4,086 | |
| | USD | | | 239,000 | | | HKD | | | 1,851,333 | | | | 238,133 | | | | 05/11/18 | | | | 867 | |
| | USD | | | 307,000 | | | HKD | | | 2,381,747 | | | | 306,891 | | | | 09/19/18 | | | | 109 | |
| | USD | | | 139,343 | | | IDR | | | 1,842,817,183 | | | | 136,697 | | | | 10/10/17 | | | | 2,646 | |
| | USD | | | 260,603 | | | IDR | | | 3,492,778,572 | | | | 258,954 | | | | 10/16/17 | | | | 1,651 | |
| | USD | | | 184,000 | | | IDR | | | 2,445,032,480 | | | | 181,242 | | | | 10/18/17 | | | | 2,758 | |
| | USD | | | 59,790 | | | INR | | | 3,907,294 | | | | 59,752 | | | | 10/05/17 | | | | 38 | |
| | USD | | | 132,639 | | | INR | | | 8,494,576 | | | | 129,795 | | | | 10/10/17 | | | | 2,844 | |
| | USD | | | 506,553 | | | INR | | | 32,543,497 | | | | 496,728 | | | | 10/18/17 | | | | 9,824 | |
| | USD | | | 121,928 | | | INR | | | 7,919,723 | | | | 120,771 | | | | 10/25/17 | | | | 1,157 | |
| | USD | | | 186,221 | | | KRW | | | 212,385,132 | | | | 185,451 | | | | 10/02/17 | | | | 770 | |
| | USD | | | 390,771 | | | KRW | | | 446,037,577 | | | | 389,576 | | | | 10/10/17 | | | | 1,194 | |
| | USD | | | 243,950 | | | KRW | | | 275,884,901 | | | | 240,966 | | | | 10/12/17 | | | | 2,984 | |
| | USD | | | 85,399 | | | KRW | | | 96,775,559 | | | | 84,533 | | | | 10/25/17 | | | | 866 | |
| | USD | | | 52,467 | | | KRW | | | 59,169,054 | | | | 51,698 | | | | 11/22/17 | | | | 769 | |
| | USD | | | 542,786 | | | MXN | | | 9,799,272 | | | | 531,184 | | | | 12/20/17 | | | | 11,602 | |
| | USD | | | 72,348 | | | PEN | | | 233,821 | | | | 71,601 | | | | 10/10/17 | | | | 747 | |
| | USD | | | 32,505 | | | PEN | | | 106,000 | | | | 32,361 | | | | 12/14/17 | | | | 144 | |
| | USD | | | 54,112 | | | PHP | | | 2,752,047 | | | | 54,057 | | | | 10/10/17 | | | | 55 | |
| | USD | | | 123,000 | | | PHP | | | 6,242,826 | | | | 122,490 | | | | 10/26/17 | | | | 510 | |
| | USD | | | 25,000 | | | PHP | | | 1,272,360 | | | | 24,954 | | | | 11/02/17 | | | | 46 | |
| | USD | | | 167,097 | | | RUB | | | 9,706,912 | | | | 166,140 | | | | 12/14/17 | | | | 956 | |
| | USD | | | 361,797 | | | SGD | | | 486,038 | | | | 358,642 | | | | 12/20/17 | | | | 3,155 | |
| | USD | | | 61,000 | | | THB | | | 2,032,677 | | | | 60,954 | | | | 10/11/17 | | | | 46 | |
| | USD | | | 456,844 | | | TRY | | | 1,640,769 | | | | 449,745 | | | | 12/20/17 | | | | 7,099 | |
| | USD | | | 156,273 | | | TWD | | | 4,667,970 | | | | 153,855 | | | | 10/02/17 | | | | 2,418 | |
| | USD | | | 25,000 | | | TWD | | | 749,625 | | | | 24,690 | | | | 10/19/17 | | | | 310 | |
| | USD | | | 1,175,828 | | | TWD | | | 35,407,452 | | | | 1,166,233 | | | | 10/20/17 | | | | 9,595 | |
| | USD | | | 327,008 | | | TWD | | | 9,852,296 | | | | 324,558 | | | | 10/23/17 | | | | 2,449 | |
| | USD | | | 200,279 | | | TWD | | | 6,049,436 | | | | 199,313 | | | | 10/26/17 | | | | 967 | |
| | USD | | | 28,365 | | | TWD | | | 859,769 | | | | 28,333 | | | | 10/31/17 | | | | 32 | |
| | USD | | | 243,772 | | | ZAR | | | 3,318,947 | | | | 241,965 | | | | 12/20/17 | | | | 1,807 | |
| | | ZAR | | | 2,515,701 | | | USD | | | 183,000 | | | | 183,405 | | | | 12/20/17 | | | | 405 | |
| TOTAL | | | | | | | | | | | | | | | | | | | | | | $ | 177,633 | |
FORWARD FOREIGN CURRENCY EXCHANGE CONTRACTS WITH UNREALIZED LOSS
| | | | | | | | | | | | | | | | | | | | | | | | |
| Counterparty | | Currency
Purchased | | | Currency
Sold | | | Current
Value | | | Settlement
Date | | | Unrealized
Loss | |
Morgan Stanley & Co. International PLC | | ARS | | | 844,162 | | | USD | | | 47,923 | | | $ | 47,855 | | | | 11/03/17 | | | $ | (68 | ) |
| | ARS | | | 250,620 | | | USD | | | 14,058 | | | | 14,046 | | | | 11/24/17 | | | | (12 | ) |
| | BRL | | | 1,989,100 | | | USD | | | 633,755 | | | | 627,761 | | | | 10/03/17 | | | | (5,994 | ) |
| | BRL | | | 62,109 | | | USD | | | 19,743 | | | | 19,518 | | | | 11/03/17 | | | | (225 | ) |
| | CNH | | | 2,350,828 | | | USD | | | 355,000 | | | | 351,961 | | | | 12/20/17 | | | | (3,039 | ) |
| | CNY | | | 777,340 | | | USD | | | 117,845 | | | | 116,758 | | | | 10/26/17 | | | | (1,087 | ) |
| | CNY | | | 854,352 | | | USD | | | 128,910 | | | | 127,867 | | | | 12/14/17 | | | | (1,043 | ) |
| | |
| The accompanying notes are an integral part of these financial statements. | | 53 |
GOLDMAN SACHS DYNAMIC EMERGING MARKETS DEBT FUND
Schedule of Investments (continued)
September 30, 2017 (Unaudited)
|
| ADDITIONAL INVESTMENT INFORMATION (continued) |
FORWARD FOREIGN CURRENCY EXCHANGE CONTRACTS WITH UNREALIZED LOSS (continued)
| | | | | | | | | | | | | | | | | | | | | | | | |
| Counterparty | | Currency
Purchased | | | Currency
Sold | | | Current
Value | | | Settlement
Date | | | Unrealized
Loss | |
Morgan Stanley & Co. International PLC (continued) | | COP | | | 109,454,396 | | | USD | | | 37,630 | | | $ | 37,146 | | | | 10/25/17 | | | $ | (484 | ) |
| | EUR | | | 174,355 | | | CZK | | | 4,536,705 | | | | 206,103 | | | | 10/03/17 | | | | (303 | ) |
| | EUR | | | 311,234 | | | CZK | | | 8,337,644 | | | | 368,875 | | | | 11/21/17 | | | | (11,446 | ) |
| | EUR | | | 311,804 | | | CZK | | | 8,337,644 | | | | 370,536 | | | | 01/03/18 | | | | (11,354 | ) |
| | EUR | | | 121,521 | | | USD | | | 145,863 | | | | 144,289 | | | | 12/20/17 | | | | (1,574 | ) |
| | HKD | | | 790,046 | | | USD | | | 101,152 | | | | 101,145 | | | | 10/03/17 | | | | (7 | ) |
| | HUF | | | 16,196,544 | | | EUR | | | 52,000 | | | | 61,667 | | | | 12/20/17 | | | | (76 | ) |
| | HUF | | | 101,944,274 | | | USD | | | 399,629 | | | | 388,144 | | | | 12/20/17 | | | | (11,485 | ) |
| | IDR | | | 2,480,030,556 | | | USD | | | 185,349 | | | | 184,046 | | | | 10/05/17 | | | | (1,303 | ) |
| | IDR | | | 2,541,806,540 | | | USD | | | 190,494 | | | | 188,547 | | | | 10/10/17 | | | | (1,947 | ) |
| | IDR | | | 2,182,889,484 | | | USD | | | 162,619 | | | | 161,838 | | | | 10/16/17 | | | | (781 | ) |
| | IDR | | | 1,386,885,648 | | | USD | | | 103,974 | | | | 102,734 | | | | 10/26/17 | | | | (1,241 | ) |
| | IDR | | | 1,645,515,260 | | | USD | | | 122,000 | | | | 121,849 | | | | 10/31/17 | | | | (151 | ) |
| | IDR | | | 16,482,774,000 | | | USD | | | 1,223,665 | | | | 1,218,470 | | | | 11/16/17 | | | | (5,195 | ) |
| | INR | | | 3,907,294 | | | USD | | | 61,000 | | | | 59,752 | | | | 10/05/17 | | | | (1,248 | ) |
| | INR | | | 13,282,611 | | | USD | | | 206,627 | | | | 202,955 | | | | 10/10/17 | | | | (3,672 | ) |
| | INR | | | 45,647,186 | | | USD | | | 707,658 | | | | 696,737 | | | | 10/18/17 | | | | (10,921 | ) |
| | INR | | | 24,348,756 | | | USD | | | 373,849 | | | | 371,303 | | | | 10/25/17 | | | | (2,546 | ) |
| | INR | | | 24,588,649 | | | USD | | | 377,374 | | | | 374,912 | | | | 10/26/17 | | | | (2,462 | ) |
| | INR | | | 3,907,294 | | | USD | | | 59,567 | | | | 59,525 | | | | 11/03/17 | | | | (42 | ) |
| | KRW | | | 212,385,132 | | | USD | | | 188,947 | | | | 185,451 | | | | 10/02/17 | | | | (3,497 | ) |
| | KRW | | | 446,037,577 | | | USD | | | 395,703 | | | | 389,576 | | | | 10/10/17 | | | | (6,127 | ) |
| | KRW | | | 209,761,293 | | | USD | | | 185,639 | | | | 183,211 | | | | 10/12/17 | | | | (2,428 | ) |
| | KRW | | | 100,251,514 | | | USD | | | 87,955 | | | | 87,565 | | | | 10/18/17 | | | | (390 | ) |
| | KRW | | | 347,263,063 | | | USD | | | 305,920 | | | | 303,332 | | | | 10/25/17 | | | | (2,589 | ) |
| | KRW | | | 548,436,946 | | | USD | | | 480,307 | | | | 479,191 | | | | 11/22/17 | | | | (1,116 | ) |
| | MXN | | | 16,845,721 | | | USD | | | 933,098 | | | | 913,146 | | | | 12/20/17 | | | | (19,949 | ) |
| | MYR | | | 1,183,000 | | | USD | | | 281,868 | | | | 279,865 | | | | 12/08/17 | | | | (2,003 | ) |
| | PEN | | | 198,082 | | | USD | | | 61,000 | | | | 60,667 | | | | 10/05/17 | | | | (333 | ) |
| | PEN | | | 395,250 | | | USD | | | 122,000 | | | | 121,033 | | | | 10/10/17 | | | | (967 | ) |
| | PLN | | | 6,001,471 | | | EUR | | | 1,404,950 | | | | 1,645,075 | | | | 12/20/17 | | | | (23,105 | ) |
| | PLN | | | 2,365,887 | | | USD | | | 665,304 | | | | 648,518 | | | | 12/20/17 | | | | (16,786 | ) |
| | RON | | | 700,925 | | | USD | | | 182,248 | | | | 180,263 | | | | 12/20/17 | | | | (1,985 | ) |
| | RUB | | | 44,694,023 | | | USD | | | 767,279 | | | | 764,968 | | | | 12/14/17 | | | | (2,312 | ) |
| | SGD | | | 427,002 | | | USD | | | 317,374 | | | | 315,080 | | | | 12/20/17 | | | | (2,295 | ) |
| | THB | | | 2,017,148 | | | USD | | | 61,000 | | | | 60,488 | | | | 10/11/17 | | | | (512 | ) |
| | THB | | | 2,438,309 | | | USD | | | 73,401 | | | | 73,126 | | | | 10/19/17 | | | | (275 | ) |
| | TRY | | | 3,760,020 | | | USD | | | 1,063,356 | | | | 1,030,645 | | | | 12/20/17 | | | | (32,711 | ) |
| | TWD | | | 6,102,447 | | | USD | | | 203,212 | | | | 201,135 | | | | 10/02/17 | | | | (2,076 | ) |
| | TWD | | | 1,830,915 | | | USD | | | 61,000 | | | | 60,299 | | | | 10/05/17 | | | | (701 | ) |
| | TWD | | | 24,986,591 | | | USD | | | 826,178 | | | | 822,997 | | | | 10/20/17 | | | | (3,182 | ) |
| | TWD | | | 2,909,804 | | | USD | | | 96,681 | | | | 95,856 | | | | 10/23/17 | | | | (826 | ) |
| | TWD | | | 5,183,748 | | | USD | | | 171,272 | | | | 170,790 | | | | 10/26/17 | | | | (481 | ) |
| | USD | | | 131,541 | | | ARS | | | 2,360,233 | | | | 135,560 | | | | 10/10/17 | | | | (4,018 | ) |
| | USD | | | 1,187,332 | | | BRL | | | 3,791,152 | | | | 1,196,489 | | | | 10/03/17 | | | | (9,157 | ) |
| | USD | | | 61,000 | | | BRL | | | 195,384 | | | | 61,398 | | | | 11/03/17 | | | | (398 | ) |
| | USD | | | 27,052 | | | CNH | | | 181,180 | | | | 27,126 | | | | 12/20/17 | | | | (74 | ) |
| | USD | | | 149,121 | | | CNY | | | 996,455 | | | | 149,495 | | | | 11/10/17 | | | | (374 | ) |
| | USD | | | 49,000 | | | COP | | | 144,691,953 | | | | 49,071 | | | | 10/31/17 | | | | (71 | ) |
| | USD | | | 691,358 | | | CZK | | | 17,024,700 | | | | 776,071 | | | | 11/09/17 | | | | (84,712 | ) |
| | USD | | | 69,233 | | | EUR | | | 58,429 | | | | 69,377 | | | | 12/20/17 | | | | (143 | ) |
| | |
| 54 | | The accompanying notes are an integral part of these financial statements. |
GOLDMAN SACHS DYNAMIC EMERGING MARKETS DEBT FUND
|
| ADDITIONAL INVESTMENT INFORMATION (continued) |
FORWARD FOREIGN CURRENCY EXCHANGE CONTRACTS WITH UNREALIZED LOSS (continued)
| | | | | | | | | | | | | | | | | | | | | | | | |
| Counterparty | | Currency
Purchased | | | Currency
Sold | | | Current
Value | | | Settlement
Date | | | Unrealized
Loss | |
Morgan Stanley & Co. International PLC (continued) | | USD | | | 183,366 | | | IDR | | | 2,480,030,556 | | | $ | 184,046 | | | | 10/05/17 | | | $ | (679 | ) |
| | USD | | | 719,525 | | | IDR | | | 9,713,585,000 | | | | 720,036 | | | | 10/18/17 | | | | (511 | ) |
| | USD | | | 62,000 | | | INR | | | 4,070,641 | | | | 62,066 | | | | 10/26/17 | | | | (66 | ) |
| | USD | | | 150,242 | | | INR | | | 9,917,960 | | | | 151,093 | | | | 11/03/17 | | | | (853 | ) |
| | USD | | | 321,421 | | | KRW | | | 369,048,558 | | | | 322,407 | | | | 11/10/17 | | | | (986 | ) |
| | USD | | | 57,773 | | | KRW | | | 66,123,608 | | | | 57,775 | | | | 11/22/17 | | | | (2 | ) |
| | USD | | | 61,000 | | | PHP | | | 3,123,911 | | | | 61,323 | | | | 10/19/17 | | | | (323 | ) |
| | USD | | | 61,000 | | | PHP | | | 3,117,436 | | | | 61,192 | | | | 10/20/17 | | | | (192 | ) |
| | USD | | | 61,000 | | | PHP | | | 3,117,926 | | | | 61,176 | | | | 10/26/17 | | | | (176 | ) |
| | USD | | | 14,898 | | | RON | | | 58,094 | | | | 14,941 | | | | 12/20/17 | | | | (43 | ) |
| | USD | | | 36,103 | | | RUB | | | 2,189,874 | | | | 37,907 | | | | 10/12/17 | | | | (1,805 | ) |
| | USD | | | 284,683 | | | RUB | | | 17,431,259 | | | | 301,649 | | | | 10/13/17 | | | | (16,966 | ) |
| | USD | | | 419,558 | | | RUB | | | 24,704,468 | | | | 422,834 | | | | 12/14/17 | | | | (3,276 | ) |
| | USD | | | 296,999 | | | SGD | | | 404,485 | | | | 298,464 | | | | 12/20/17 | | | | (1,465 | ) |
| | USD | | | 59,927 | | | TRY | | | 219,068 | | | | 60,048 | | | | 12/20/17 | | | | (121 | ) |
| | USD | | | 47,280 | | | TWD | | | 1,434,478 | | | | 47,280 | | | | 10/02/17 | | | | — | |
| | USD | | | 60,168 | | | TWD | | | 1,830,915 | | | | 60,299 | | | | 10/05/17 | | | | (131 | ) |
| | USD | | | 374,969 | | | TWD | | | 11,450,440 | | | | 377,149 | | | | 10/20/17 | | | | (2,180 | ) |
| | USD | | | 121,783 | | | TWD | | | 3,705,048 | | | | 122,095 | | | | 10/31/17 | | | | (313 | ) |
| | | ZAR | | | 4,792,605 | | | USD | | | 357,955 | | | | 349,401 | | | | 12/20/17 | | | | (8,554 | ) |
| TOTAL | | | | | | | | | | | | | | | | | | | | | | $ | (343,941 | ) |
FUTURES CONTRACTS — At September 30, 2017, the Fund had the following futures contracts:
| | | | | | | | | | | | | | | | |
| Description | | Number of
Contracts | | | Expiration
Date | | | Notional
Amount | | | Unrealized
Appreciation/
(Depreciation) | |
Long positions: | | | | | | | | | | | | | | | | |
Ultra Long U.S. Treasury Bonds | | | 2 | | | | 12/19/17 | | | $ | 330,250 | | | $ | (7,606 | ) |
Ultra 10 Year U.S. Treasury Notes | | | 2 | | | | 12/19/17 | | | | 268,656 | | | | (3,164 | ) |
2 Year U.S. Treasury Notes | | | 1 | | | | 12/29/17 | | | | 215,703 | | | | (656 | ) |
5 Year U.S. Treasury Notes | | | 4 | | | | 12/29/17 | | | | 470,000 | | | | (1,678 | ) |
20 Year U.S. Treasury Bonds | | | 2 | | | | 12/19/17 | | | | 305,625 | | | | (4,848 | ) |
| Total | | | $ | (17,952 | ) |
Short position contracts: | | | | | | | | | | | | | | | | |
Eurodollars | | | (5 | ) | | | 12/17/18 | | | | (1,226,688 | ) | | | (406 | ) |
10 Year U.S. Treasury Notes | | | (5 | ) | | | 12/19/17 | | | | (626,562 | ) | | | 5,478 | |
| Total | | | $ | 5,072 | |
| Total futures contracts | | | $ | (12,880 | ) |
| | |
| The accompanying notes are an integral part of these financial statements. | | 55 |
GOLDMAN SACHS DYNAMIC EMERGING MARKETS DEBT FUND
Schedule of Investments (continued)
September 30, 2017 (Unaudited)
|
| ADDITIONAL INVESTMENT INFORMATION (continued) |
SWAP CONTRACTS – At September 30, 2017, the Fund had the following swap contracts:
OVER THE COUNTER INTEREST RATE SWAP CONTRACTS
| | | | | | | | | | | | | | | | | | | | | | | | |
Payments Made by the
Fund | | Payments
Received
by the Fund | | | Counterparty | | | Termination
Date | | | Notional
Amount | | | Unrealized
Appreciation/
(Depreciation)* | |
1M BID Avg(a) | | | 11.910% | | | | BoA Securities LLC | | | | 01/04/21 | | | | BRL | | | | 460 | | | $ | 11,031 | |
Mexico IB TIIE 28D(b) | | | 6.930 | | | | BoA Securities LLC | | | | 03/03/26 | | | | MXN | | | | 680 | | | | (191 | ) |
5.110%(c) | | | Colombia IBR Overnight IB | | | | CS International (London) | | | | 04/15/19 | | | | COP | | | | 95,320 | | | | (143 | ) |
5.180(b) | | | Mexico IB TIIE 28D | | | | Deutsche Bank AG | | | | 09/25/18 | | | | MXN | | | | 990 | | | | 1,127 | |
12.340(d) | | | 1M BID Avg | | | | Deutsche Bank AG | | | | 01/02/25 | | | | | | | | 150 | | | | (4,134 | ) |
Mexico IB TIIE 28D(b) | | | 9.625 | | | | Deutsche Bank AG | | | | 02/15/29 | | | | MXN | | | | 3,740 | (e) | | | 11,784 | |
5.190(c) | | | Colombia IBR Overnight IB | | | | JPMorgan Securities, Inc. | | | | 04/22/19 | | | | COP | | | | 67,690 | | | | (159 | ) |
11.742(a) | | | 1M BID Avg | | | | MS & Co. Int. PLC | | | | 01/04/21 | | | | BRL | | | | 660 | | | | (15,013 | ) |
| TOTAL | | | | | | | | | | | | | | | | | | | | | | $ | 4,302 | |
| | * | | There are no upfront payments on the swap contracts, therefore the unrealized gain (loss) on the swap contracts is equal to their market value. |
| | (a) | | Payments made at maturity. |
| | (b) | | Payments made monthly. |
| | (c) | | Payments made quarterly |
| | (d) | | Payments made annually. |
| | (e) | | Represents forward starting interest rate swaps whose effective dates of commencement of accruals and cash flows occur subsequent to September 30, 2017. |
CENTRALLY CLEARED INTEREST RATE SWAP CONTRACTS
| | | | | | | | | | | | | | | | | | | | | | |
Payments Made by the
Fund | | Payments
Received
by Fund | | Termination
Date | | | Notional
Amount | | | Value | | | Upfront
Premium
(Received)
Paid | | | Unrealized
Appreciation/
(Depreciation) | |
0.815%(a) | | 6M EURO(b) | | | 08/23/19 | | | CZK | 9,230 | | | $ | 1,222 | | | $ | 2 | | | $ | 1,220 | |
0.817(a) | | 6M EURO(b) | | | 08/25/19 | | | | 8,810 | | | | 1,191 | | | | 2 | | | | 1,189 | |
0.000(a) | | 6M EURO(b) | | | 12/20/19 | | | EUR | 190 | (c) | | | (575 | ) | | | (715 | ) | | | 140 | |
5.500(d) | | Mexico IB TIIE 28D | | | 03/09/22 | | | MXN | 1,450 | | | | 4,065 | | | | 2,886 | | | | 1,179 | |
1.038(a) | | 6M PRIBOR(b) | | | 09/20/22 | | | CZK | 7,770 | | | | 5,698 | | | | (2,451 | ) | | | 8,149 | |
1.218(a) | | 6M EURO(b) | | | 12/20/22 | | | | 13,460 | (c) | | | 6,224 | | | | (765 | ) | | | 6,989 | |
0.500(a) | | 6M EURO(b) | | | 12/20/24 | | | EUR | 90 | (c) | | | 650 | | | | (206 | ) | | | 856 | |
5.660(d) | | Mexico IB TIIE 28D | | | 01/24/25 | | | | MXN 1,060 | | | | 4,481 | | | | 1 | | | | 4,480 | |
Mexico IB TIIE 28D(d) | | 7.500% | | | 06/09/27 | | | MXN | 12,590 | | | | 21,760 | | | | (13,670 | ) | | | 35,430 | |
Mexico IB TIIE 28D(d) | | 7.050 | | | 12/08/27 | | | | 2,850 | (c) | | | (427 | ) | | | 153 | | | | (580 | ) |
1.000(a) | | 6M EURO(b) | | | 12/20/27 | | | EUR | 120 | (c) | | | (578 | ) | | | (1,733 | ) | | | 1,155 | |
1.450(a) | | 6M EURO(b) | | | 12/20/27 | | | CZK | 1,460 | (c) | | | 1,244 | | | | 1 | | | | 1,243 | |
1.500(a) | | 6M EURO(b) | | | 12/20/37 | | | EUR | 70 | (c) | | | 325 | | | | (1,596 | ) | | | 1,921 | |
| TOTAL | | | $ | 45,280 | | | $ | (18,091 | ) | | $ | 63,371 | |
| | (a) | | Payments made annually. |
| | (b) | | Payments made semi-annually. |
| | (c) | | Represents forward starting interest rate swaps whose effective dates of commencement of accruals and cash flows occur subsequent to September 30, 2017. |
| | (d) | | Payments made monthly. |
| | |
| 56 | | The accompanying notes are an integral part of these financial statements. |
GOLDMAN SACHS DYNAMIC EMERGING MARKETS DEBT FUND
|
| ADDITIONAL INVESTMENT INFORMATION (continued) |
OVER THE COUNTER CREDIT DEFAULT SWAP CONTRACTS
| | | | | | | | | | | | | | | | | | | | | | | | | | | | | | | | |
| Reference Obligation/ Index(a) | | Financing Rate
Received/(Paid)
by the Fund | | | Credit
Spread at
September 30,
2017(b) | | | Counterparty | | | Termination
Date | | | Notional
Amount | | | Value | | | Upfront
Premiums
(Received)
Paid | | | Unrealized
Appreciation/
Depreciation | |
Protection Purchased: | | | | | | | | | | | | | | | | | | | | | | | | | | | | | | | | |
People’s Republic of China 4.250% 10/28/17 | | | (1.000 | )% | | | 0.207 | % | |
| BoA Securities
LLC |
| | | 06/20/19 | | | $ | 30,000 | | | $ | (417 | ) | | $ | (61 | ) | | $ | (356 | ) |
| | | (1.000 | ) | | | 0.379 | | | | | | | | 12/20/20 | | | | 200,000 | | | | (3,978 | ) | | | 1,184 | | | | (5,162 | ) |
Republic of Turkey, 11.875%, 01/15/30 | | | (1.000 | ) | | | 1.511 | | | | | | | | 12/20/21 | | | | 10,000 | | | | 202 | | | | 679 | | | | (477 | ) |
People’s Republic of China 4.250% 10/28/17 | | | (1.000 | ) | | | 0.191 | | |
| Barclays Bank
PLC |
| | | 03/20/19 | | | | 30,000 | | | | (366 | ) | | | (39 | ) | | | (327 | ) |
| | | (1.000 | ) | | | 0.442 | | | | | | | | 06/20/21 | | | | 150,000 | | | | (3,071 | ) | | | 539 | | | | (3,610 | ) |
People’s Republic of China 4.250% 10/28/17 | | | (1.000 | ) | | | 0.191 | | | | Citibank NA | | | | 03/20/19 | | | | 480,000 | | | | (5,846 | ) | | | (637 | ) | | | (5,209 | ) |
| | | (1.000 | ) | | | 0.207 | | | | | | | | 06/20/19 | | | | 850,000 | | | | (11,817 | ) | | | (2,202 | ) | | | (9,615 | ) |
| | | (1.000 | ) | | | 0.379 | | | | | | | | 12/20/20 | | | | 1,550,000 | | | | (30,824 | ) | | | 7,708 | | | | (38,532 | ) |
| | | (1.000 | ) | | | 0.442 | | | | | | | | 06/20/21 | | | | 570,000 | | | | (11,664 | ) | | | 3,326 | | | | (14,990 | ) |
People’s Republic of China 4.250% 10/28/17 | | | (1.000 | ) | | | 0.442 | | |
| Deutsche
Bank AG |
| | | 06/20/21 | | | | 80,000 | | | | (1,637 | ) | | | 226 | | | | (1,863 | ) |
Republic of Turkey, 11.875%, 01/15/30 | | | (1.000 | ) | | | 1.511 | | | | | | | | 12/20/21 | | | | 50,000 | | | | 1,008 | | | | 3,376 | | | | (2,368 | ) |
People’s Republic of China 4.250% 10/28/17 | | | (1.000 | ) | | | 0.191 | | |
| JPMorgan
Securities, Inc. |
| | | 03/20/19 | | | | 30,000 | | | | (365 | ) | | | (32 | ) | | | (333 | ) |
| | | (1.000 | ) | | | 0.207 | | | | | | | | 06/20/19 | | | | 170,000 | | | | (2,364 | ) | | | (338 | ) | | | (2,026 | ) |
| | | (1.000 | ) | | | 0.379 | | | | | | | | 12/20/20 | | | | 360,000 | | | | (7,159 | ) | | | 2,534 | | | | (9,693 | ) |
| | | (1.000 | ) | | | 0.442 | | | | | | | | 06/20/21 | | | | 300,000 | | | | (6,140 | ) | | | 936 | | | | (7,076 | ) |
Republic of Turkey, 11.875%, 01/15/30 | | | (1.000 | ) | | | 1.511 | | |
| MS & Co. Int.
PLC |
| | | 12/20/21 | | | | 30,000 | | | | 604 | | | | 1,981 | | | | (1,377 | ) |
| TOTAL | | | $ | (83,834 | ) | | $ | 19,180 | | | $ | (103,014 | ) |
Protection Sold: | | | | | | | | | | | | | | | | | | | | | | | | | |
Republic of Colombia, 10.375%, 01/28/33 | | | 1.000 | | | | 0.454 | | |
| Barclays Bank
PLC |
| | | 12/20/19 | | | | 300,000 | | | | 3,694 | | | | (5,530 | ) | | | 9,224 | |
Republic of Chile,
3.875%, 08/05/20 | | | 1.000 | | | | 0.332 | | | | Citibank NA | | | | 12/20/20 | | | | 20,000 | | | | 429 | | | | (187 | ) | | | 616 | |
| TOTAL | | | $ | 4,123 | | | $ | (5,717 | ) | | $ | 9,840 | |
| TOTAL | | | $ | (79,711 | ) | | $ | 13,463 | | | $ | (93,174 | ) |
| | (a) | | Payments made quarterly. |
| | (b) | | Credit spread on the referenced obligation, together with the term of the swap contract, are indicators of payment/performance risk. The likelihood of a credit event occurring which would require a fund or its counterparty to make a payment or otherwise be required to perform under the swap contract is generally greater as the credit spread and the term of the swap contract increase. |
| | |
| The accompanying notes are an integral part of these financial statements. | | 57 |
GOLDMAN SACHS DYNAMIC EMERGING MARKETS DEBT FUND
Schedule of Investments (continued)
September 30, 2017 (Unaudited)
|
| ADDITIONAL INVESTMENT INFORMATION (continued) |
PURCHASED OPTIONS CONTRACTS — At September 30, 2017, the Fund had the following purchased options:
PURCHASED OPTIONS ON FUTURES CONTRACTS
| | | | | | | | | | | | | | | | | | | | | | | | | | | | | | |
| Description | | Counterparty | | Exercise
Price | | | Expiration
Date | | | Number of
Contracts | | | Notional Amount | | | Market
Value | | | Premiums
Paid (Received) | | | Unrealized
Appreciation/ (Depreciation) | |
Purchased option contracts: | | | | | | | | | | | | | | | | | | | | | | | | | | | | | | |
Puts | | | | | | | | | | | | | | | | | | | | | | | | | | | | | | |
| Eurodollar Futures | | MS & Co. Int. PLC | | $ | 98.00 | | | | 06/15/18 | | | | 5 | | | $ | 12,500 | | | $ | 1,938 | | | $ | 1,387 | | | $ | 551 | |
| | |
|
Abbreviations: |
1M BID Avg | | —1 month Brazilian Interbank Deposit Average |
BoA Securities LLC | | —Bank of America Securities LLC |
CS International (London) | | —Credit Suisse International (London) |
Mexico IB TIIE 28D | | —Mexico Interbank TIIE 28 Days |
MS & Co. Int. PLC | | —Morgan Stanley & Co. International PLC |
|
| | |
| 58 | | The accompanying notes are an integral part of these financial statements. |
GOLDMAN SACHS EMERGING MARKETS DEBT FUND
Schedule of Investments
September 30, 2017 (Unaudited)
| | | | | | | | | | | | | | |
Principal
Amount | | | Interest
Rate | | | Maturity
Date | | | Value | |
| Sovereign Debt Obligations – 65.5% | |
| Angola – 0.4% | |
| | Republic of Angola (NR/B1) | |
| $ | 8,260,000 | | | | 9.500 | % | | | 11/12/25 | | | $ | 8,838,200 | |
| | |
| Argentina – 7.2% | |
| City of Buenos Aires Argentina (NR/B3) (Argentina Deposit
Rates + 3.250%)(a) |
|
| ARS | 87,700,000 | | | | 24.702 | | | | 03/29/24 | | | | 4,963,435 | |
| | Province of Santa Fe (NR/B3) | |
| $ | 2,670,000 | | | | 7.000 | (b) | | | 03/23/23 | | | | 2,843,550 | |
| | 1,850,000 | | | | 7.000 | | | | 03/23/23 | | | | 1,970,250 | |
| Provincia de Buenos Aires (NR/B3) (Argentina Deposit
Rates + 3.830%)(a) |
|
| ARS | 32,930,000 | | | | 25.330 | | | | 05/31/22 | | | | 1,909,489 | |
| | Provincia de Buenos Aires (B/B3)(c) | |
| EUR | 270,000 | | | | 3.000 | | | | 05/01/20 | | | | 318,922 | |
| | Provincia de Cordoba (B/B3) | |
| $ | 2,090,000 | | | | 7.450 | | | | 09/01/24 | | | | 2,267,650 | |
| | Provincia de la Rioja (B/NR)(b) | |
| | 5,880,000 | | | | 9.750 | | | | 02/24/25 | | | | 6,203,400 | |
| | Republic of Argentina (NR/NR) | |
| ARS | 360,165,000 | | | | 26.250 | | | | 06/21/20 | | | | 21,863,934 | |
| | (Argentina Deposit Rates + 2.000%)(a) | |
| | 14,780,000 | | | | 23.450 | | | | 04/03/22 | | | | 843,085 | |
| | Republic of Argentina (NR/B3) | |
| | 800,000 | | | | 16.000 | | | | 10/17/23 | | | | 48,000 | |
| | 90,000 | | | | 15.500 | | | | 10/17/26 | | | | 5,529 | |
| | Republic of Argentina (B/NR) | |
| | (Argentina Deposit Rates + 3.000%) | |
| | 5,025,000 | | | | 23.662 | (a) | | | 10/09/17 | | | | 289,083 | |
| | (Argentina Deposit Rates + 2.750%) | |
| | 29,500,000 | | | | 24.112 | (a) | | | 03/01/18 | | | | 1,698,026 | |
| | (Argentina Deposit Rates + 2.500%) | |
| | 2,875,000 | | | | 23.913 | (a) | | | 03/11/19 | | | | 167,253 | |
| | (Argentina Deposit Rates + 3.250%) | |
| | 6,175,000 | | | | 24.605 | (a) | | | 03/01/20 | | | | 365,960 | |
| EUR | 13,417,011 | | | | 7.820 | | | | 12/31/33 | | | | 17,502,793 | |
| $ | 5,005,276 | | | | 8.280 | | | | 12/31/33 | | | | 5,668,475 | |
| | 8,700,000 | | | | 7.125 | (b) | | | 06/28/99 | | | | 8,682,600 | |
| | Republic of Argentina (B/B3) | |
| | 4,890,000 | | | | 6.875 | | | | 04/22/21 | | | | 5,325,210 | |
| | 18,520,000 | | | | 7.500 | | | | 04/22/26 | | | | 20,816,480 | |
| EUR | 4,410,000 | | | | 5.000 | | | | 01/15/27 | | | | 5,153,544 | |
| $ | 18,300,000 | | | | 6.875 | | | | 01/26/27 | | | | 19,773,150 | |
| EUR | 2,559,553 | | | | 7.820 | | | | 12/31/33 | | | | 3,373,027 | |
| $ | 17,700,000 | | | | 7.125 | | | | 07/06/36 | | | | 18,585,000 | |
| EUR | 2,710,000 | | | | 2.260 | (c) | | | 12/31/38 | | | | 2,186,013 | |
| $ | 20,180,000 | | | | 2.500 | (c) | | | 12/31/38 | | | | 14,277,350 | |
| | | | | | | | | | | | | | |
| | | | | | | | | | | | | 167,101,208 | |
| | |
| Azerbaijan(b) – 0.1% | |
| | Republic of Azerbaijan (NR/Ba2) | |
| | 2,670,000 | | | | 3.500 | | | | 09/01/32 | | | | 2,322,900 | |
| | |
| Bahrain – 0.5% | |
| | Kingdom of Bahrain (NR/NR)(b) | |
| | 7,770,000 | | | | 6.750 | | | | 09/20/29 | | | | 7,711,725 | |
| | |
| Sovereign Debt Obligations – (continued) | |
| Bahrain – (continued) | |
| | Kingdom of Bahrain (BB-/NR) | |
| 2,840,000 | | | | 7.000 | (b) | | | 10/12/28 | | | | 2,896,800 | |
| | 1,030,000 | | | | 6.000 | | | | 09/19/44 | | | | 880,650 | |
| | | | | | | | | | | | | | |
| | | | | | | | | | | | | 11,489,175 | |
| | |
| Belize(b)(c) – 0.1% | |
| | Government of Belize (B-/B3) | |
| | 2,446,500 | | | | 4.938 | | | | 02/20/34 | | | | 1,590,225 | |
| | |
| Bermuda(b)(d) – 0.2% | |
| | Bermuda Government Bond (A+/A2) | |
| | 4,600,000 | | | | 3.717 | | | | 01/25/27 | | | | 4,642,849 | |
| | |
| Brazil – 0.6% | |
| | Brazil Letras do Tesouro Nacional (BB/NR)(e) | |
| BRL | 7,196,000 | | | | 0.000 | | | | 01/01/18 | | | | 2,232,667 | |
| | Brazil Notas do Tesouro Nacional (BB/Ba2) | |
| | 25,518,000 | | | | 10.000 | | | | 01/01/27 | | | | 8,208,048 | |
| | 7,397,359 | | | | 6.000 | | | | 08/15/40 | | | | 2,613,190 | |
| | 87,205 | | | | 6.000 | | | | 08/15/50 | | | | 30,990 | |
| | | | | | | | | | | | | | |
| | | | | | | | | | | | | 13,084,895 | |
| | |
| Bulgaria – 1.3% | |
| | Republic of Bulgaria (NR/NR) | |
| EUR | 5,360,000 | | | | 1.875 | | | | 03/21/23 | | | | 6,825,947 | |
| | Republic of Bulgaria (BB+/Baa2) | |
| | 3,860,000 | | | | 2.950 | | | | 09/03/24 | | | | 5,189,429 | |
| | 3,500,000 | | | | 3.000 | | | | 03/21/28 | | | | 4,664,074 | |
| | 10,686,000 | | | | 3.125 | | | | 03/26/35 | | | | 13,513,873 | |
| | | | | | | | | | | | | | |
| | | | | | | | | | | | | 30,193,323 | |
| | |
| Chile – 0.5% | |
| | Republic of Chile (A+/NR) | |
| $ | 9,550,000 | | | | 3.860 | | | | 06/21/47 | | | | 9,717,125 | |
| | Republic of Chile (A+/Aa3) | |
| | 3,110,000 | | | | 3.125 | | | | 01/21/26 | | | | 3,198,635 | |
| | | | | | | | | | | | | | |
| | | | | | | | | | | | | 12,915,760 | |
| | |
| Colombia – 2.7% | |
| | Republic of Colombia (BBB/Baa2) | |
| | 9,380,000 | | | | 2.625 | (d) | | | 03/15/23 | | | | 9,220,540 | |
| | 9,400,000 | | | | 4.000 | (d) | | | 02/26/24 | | | | 9,808,900 | |
| $ | 3,340,000 | | | | 4.500 | (d)(f) | | | 01/28/26 | | | | 3,570,460 | |
| EUR | 350,000 | | | | 3.875 | (d) | | | 03/22/26 | | | | 475,715 | |
| $ | 670,000 | | | | 3.875 | (d) | | | 04/25/27 | | | | 680,385 | |
| | 3,900,000 | | | | 6.125 | | | | 01/18/41 | | | | 4,590,300 | |
| | 32,610,000 | | | | 5.000 | (d) | | | 06/15/45 | | | | 33,555,690 | |
| | | | | | | | | | | | | | |
| | | | | | | | | | | | | 61,901,990 | |
| | |
| Costa Rica – 1.3% | |
| | Republic of Costa Rica (BB-/Ba2) | |
| | 390,000 | | | | 9.995 | | | | 08/01/20 | | | | 454,350 | |
| | 3,500,000 | | | | 5.625 | (b) | | | 04/30/43 | | | | 3,202,500 | |
| | 2,190,000 | | | | 5.625 | | | | 04/30/43 | | | | 2,003,850 | |
| | 12,430,000 | | | | 7.158 | (b) | | | 03/12/45 | | | | 13,393,325 | |
| | 9,520,000 | | | | 7.158 | | | | 03/12/45 | | | | 10,257,800 | |
| | | | | | | | | | | | | | |
| | | | | | | | | | | | | 29,311,825 | |
| | |
| | |
| The accompanying notes are an integral part of these financial statements. | | 59 |
GOLDMAN SACHS EMERGING MARKETS DEBT FUND
Schedule of Investments (continued)
September 30, 2017 (Unaudited)
| | | | | | | | | | | | | | |
Principal
Amount | | | Interest
Rate | | | Maturity
Date | | | Value | |
| Sovereign Debt Obligations – (continued) | |
| Croatia – 0.2% | |
| | Republic of Croatia (BB/Ba2) | |
| EUR | 1,157,000 | | | | 3.875 | % | | | 05/30/22 | | | $ | 1,540,100 | |
| $ | 280,000 | | | | 5.500 | | | | 04/04/23 | | | | 310,520 | |
| EUR | 2,160,000 | | | | 3.000 | | | | 03/20/27 | | | | 2,676,721 | |
| | | | | | | | | | | | | | |
| | | | | | | | | | | | | 4,527,341 | |
| | |
| Dominican Republic – 3.8% | |
| | Dominican Republic (NR/NR) | |
| DOP | 20,700,000 | | | | 16.000 | | | | 07/10/20 | | | | 501,656 | |
| | 13,900,000 | | | | 11.500 | | | | 05/10/24 | | | | 309,362 | |
| | 8,900,000 | | | | 18.500 | (b) | | | 02/04/28 | | | | 264,187 | |
| | 134,200,000 | | | | 11.375 | | | | 07/06/29 | | | | 2,925,075 | |
| | Dominican Republic (BB-/Ba3) | |
| $ | 338,823 | | | | 9.040 | | | | 01/23/18 | | | | 343,905 | |
| | 1,532,000 | | | | 7.500 | | | | 05/06/21 | | | | 1,698,605 | |
| | 1,250,000 | | | | 6.600 | | | | 01/28/24 | | | | 1,400,000 | |
| | 12,530,000 | | | | 5.875 | | | | 04/18/24 | | | | 13,563,725 | |
| | 14,342,000 | | | | 5.500 | | | | 01/27/25 | | | | 15,130,810 | |
| | 1,860,000 | | | | 6.875 | (b) | | | 01/29/26 | | | | 2,120,400 | |
| | 4,140,000 | | | | 6.875 | | | | 01/29/26 | | | | 4,719,600 | |
| | 5,730,000 | | | | 5.950 | | | | 01/25/27 | | | | 6,145,425 | |
| | 1,550,000 | | | | 5.950 | (b) | | | 01/25/27 | | | | 1,662,375 | |
| | 1,500,000 | | | | 8.625 | | | | 04/20/27 | | | | 1,809,375 | |
| | 5,550,000 | | | | 7.450 | (b) | | | 04/30/44 | | | | 6,597,563 | |
| | 4,376,000 | | | | 7.450 | | | | 04/30/44 | | | | 5,201,970 | |
| | 15,860,000 | | | | 6.850 | (b) | | | 01/27/45 | | | | 17,683,900 | |
| | 6,599,000 | | | | 6.850 | | | | 01/27/45 | | | | 7,357,885 | |
| | | | | | | | | | | | | | |
| | | | | | | | | | | | | 89,435,818 | |
| | |
| Ecuador – 3.0% | |
| | Ecuador Government International Bond (B-/NR) | |
| | 12,520,000 | | | | 10.750 | | | | 03/28/22 | | | | 13,928,500 | |
| | 16,924,000 | | | | 7.950 | | | | 06/20/24 | | | | 16,670,140 | |
| | 12,740,000 | | | | 9.650 | (b) | | | 12/13/26 | | | | 13,377,000 | |
| | Republic of Ecuador (B-/NR) | |
| | 7,740,000 | | | | 9.650 | | | | 12/13/26 | | | | 8,127,000 | |
| | 16,260,000 | | | | 9.625 | (b) | | | 06/02/27 | | | | 16,991,700 | |
| | | | | | | | | | | | | | |
| | | | | | | | | | | | | 69,094,340 | |
| | |
| El Salvador – 1.3% | |
| | El Salvador Government International Bond (CCC/Caa1) | |
| | 1,550,000 | | | | 7.375 | | | | 12/01/19 | | | | 1,604,250 | |
| | 5,340,000 | | | | 7.750 | (g) | | | 01/24/23 | | | | 5,727,150 | |
| | 5,039,000 | | | | 5.875 | | | | 01/30/25 | | | | 4,931,921 | |
| | 3,900,000 | | | | 6.375 | | | | 01/18/27 | | | | 3,851,250 | |
| | 5,660,000 | | | | 8.625 | (b) | | | 02/28/29 | | | | 6,339,200 | |
| | 5,400,000 | | | | 7.650 | | | | 06/15/35 | | | | 5,548,500 | |
| | Republic of El Salvador (CCC+/Caa1) | |
| | 2,870,000 | | | | 8.250 | | | | 04/10/32 | | | | 3,131,888 | |
| | 330,000 | | | | 7.625 | | | | 02/01/41 | | | | 336,600 | |
| | | | | | | | | | | | | | |
| | | | | | | | | | | | | 31,470,759 | |
| | |
| Gabon – 0.1% | |
| | Republic of Gabon (NR/NR) | |
| | 2,910,000 | | | | 6.375 | | | | 12/12/24 | | | | 2,837,250 | |
| | |
| Sovereign Debt Obligations – (continued) | |
| Ghana – 0.4% | |
| | Republic of Ghana (NR/B1) | |
| 5,990,000 | | | | 10.750 | | | | 10/14/30 | | | | 7,794,487 | |
| | Republic of Ghana (B-/B3) | |
| | 1,330,000 | | | | 7.875 | | | | 08/07/23 | | | | 1,408,138 | |
| | Republic of Ghana (B-/B3) | |
| | 640,000 | | | | 8.125 | | | | 01/18/26 | | | | 679,200 | |
| | | | | | | | | | | | | | |
| | | | | | | | | | | | | 9,881,825 | |
| | |
| Guatemala – 2.0% | |
| | Republic of Guatemala (BB/Ba1) | |
| | 5,740,000 | | | | 5.750 | | | | 06/06/22 | | | | 6,249,425 | |
| | 3,300,000 | | | | 5.750 | (b) | | | 06/06/22 | | | | 3,592,875 | |
| | 6,440,000 | | | | 4.500 | (b) | | | 05/03/26 | | | | 6,472,200 | |
| | 7,730,000 | | | | 4.500 | | | | 05/03/26 | | | | 7,768,650 | |
| | 11,300,000 | | | | 4.375 | (b) | | | 06/05/27 | | | | 11,144,625 | |
| | 750,000 | | | | 4.375 | | | | 06/05/27 | | | | 739,688 | |
| | 10,350,000 | | | | 4.875 | | | | 02/13/28 | | | | 10,569,937 | |
| | | | | | | | | | | | | | |
| | | | | | | | | | | | | 46,537,400 | |
| | |
| Honduras – 0.8% | |
| | Republic of Honduras (BB-/B1) | |
| | 8,410,000 | | | | 8.750 | (b) | | | 12/16/20 | | | | 9,587,400 | |
| | 6,018,000 | | | | 8.750 | | | | 12/16/20 | | | | 6,860,520 | |
| | 1,310,000 | | | | 7.500 | (b) | | | 03/15/24 | | | | 1,488,487 | |
| | 200,000 | | | | 7.500 | | | | 03/15/24 | | | | 227,250 | |
| | | | | | | | | | | | | | |
| | | | | | | | | | | | | 18,163,657 | |
| | |
| Hungary – 2.2% | |
| | Hungary Government Bond (BBB-/Baa3) | |
| EUR | 7,270,000 | | | | 5.750 | | | | 06/11/18 | | | | 8,936,112 | |
| $ | 28,770,000 | | | | 6.250 | | | | 01/29/20 | | | | 31,359,300 | |
| | 3,680,000 | | | | 6.375 | | | | 03/29/21 | | | | 4,149,200 | |
| | 2,950,000 | | | | 5.750 | | | | 11/22/23 | | | | 3,418,313 | |
| | MFB Magyar Fejlesztesi Bank Zrt (NR/Baa3)(b)(h) | |
| | 2,510,000 | | | | 6.250 | | | | 10/21/20 | | | | 2,773,550 | |
| | | | | | | | | | | | | | |
| | | | | | | | | | | | | 50,636,475 | |
| | |
| Indonesia – 8.7% | |
| | Perusahaan Penerbit SBSN (NR/Baa3) | |
| | 2,550,000 | | | | 3.400 | (b) | | | 03/29/22 | | | | 2,596,435 | |
| | 3,190,000 | | | | 4.350 | | | | 09/10/24 | | | | 3,376,711 | |
| | 25,210,000 | | | | 4.150 | (b) | | | 03/29/27 | | | | 25,993,023 | |
| | 1,440,000 | | | | 4.150 | | | | 03/29/27 | | | | 1,484,726 | |
| | Perusahaan Penerbit SBSN (BBB-/Baa3) | |
| | 360,000 | | | | 3.300 | | | | 11/21/22 | | | | 365,627 | |
| | 6,720,000 | | | | 4.325 | (b) | | | 05/28/25 | | | | 7,053,245 | |
| | 8,259,000 | | | | 4.325 | | | | 05/28/25 | | | | 8,668,564 | |
| | 1,130,000 | | | | 4.550 | (b) | | | 03/29/26 | | | | 1,200,173 | |
| | 15,550,000 | | | | 4.550 | | | | 03/29/26 | | | | 16,515,655 | |
| | Republic of Indonesia (NR/Baa3) | |
| | 5,850,000 | | | | 4.350 | (b) | | | 01/08/27 | | | | 6,207,493 | |
| | 8,740,000 | | | | 5.250 | | | | 01/08/47 | | | | 9,837,132 | |
| | 850,000 | | | | 5.250 | (b) | | | 01/08/47 | | | | 956,701 | |
| | |
| | |
| 60 | | The accompanying notes are an integral part of these financial statements. |
GOLDMAN SACHS EMERGING MARKETS DEBT FUND
| | | | | | | | | | | | | | |
Principal
Amount | | | Interest
Rate | | | Maturity
Date | | | Value | |
| Sovereign Debt Obligations – (continued) | |
| Indonesia – (continued) | |
| | Republic of Indonesia (BBB-/Baa3) | |
| $ | 8,785,000 | | | | 5.875 | % | | | 03/13/20 | | | $ | 9,551,843 | |
| EUR | 3,760,000 | | | | 2.625 | (b) | | | 06/14/23 | | | | 4,727,247 | |
| $ | 610,000 | | | | 5.375 | | | | 10/17/23 | | | | 686,708 | |
| | 24,054,000 | | | | 5.875 | | | | 01/15/24 | | | | 27,574,303 | |
| | 13,070,000 | | | | 4.125 | | | | 01/15/25 | | | | 13,714,743 | |
| EUR | 11,110,000 | | | | 3.375 | | | | 07/30/25 | | | | 14,476,832 | |
| $ | 15,380,000 | | | | 4.750 | (b) | | | 01/08/26 | | | | 16,768,968 | |
| EUR | 2,430,000 | | | | 3.750 | (b) | | | 06/14/28 | | | | 3,205,890 | |
| | 9,760,000 | | | | 3.750 | | | | 06/14/28 | | | | 12,876,332 | |
| $ | 330,000 | | | | 6.625 | | | | 02/17/37 | | | | 420,278 | |
| | 7,949,000 | | | | 5.250 | | | | 01/17/42 | | | | 8,859,478 | |
| | 1,340,000 | | | | 4.625 | | | | 04/15/43 | | | | 1,383,872 | |
| | 1,560,000 | | | | 6.750 | | | | 01/15/44 | | | | 2,086,094 | |
| | 1,510,000 | | | | 5.125 | | | | 01/15/45 | | | | 1,668,595 | |
| | 552,000 | | | | 5.950 | | | | 01/08/46 | | | | 678,380 | |
| | | | | | | | | | | | | | |
| | | | | | | | | | | | | 202,935,048 | |
| | |
| Ivory Coast – 0.4% | |
| | Republic of Ivory Coast (NR/Ba3) | |
| EUR | 3,870,000 | | | | 5.125 | (b) | | | 06/15/25 | | | | 4,722,608 | |
| $ | 5,300,000 | | | | 6.375 | | | | 03/03/28 | | | | 5,459,000 | |
| | | | | | | | | | | | | | |
| | | | | | | | | | | | | 10,181,608 | |
| | |
| Kenya – 1.1% | |
| | Republic of Kenya (B+/NR) | |
| | 720,000 | | | | 6.875 | (b) | | | 06/24/24 | | | | 735,300 | |
| | 23,911,000 | | | | 6.875 | | | | 06/24/24 | | | | 24,419,109 | |
| | | | | | | | | | | | | | |
| | | | | | | | | | | | | 25,154,409 | |
| | |
| Kuwait – 0.1% | |
| | Republic of Kuwait (AA/NR) | |
| | 910,000 | | | | 3.500 | | | | 03/20/27 | | | | 935,480 | |
| | 1,540,000 | | | | 3.500 | (b) | | | 03/20/27 | | | | 1,583,120 | |
| | | | | | | | | | | | | | |
| | | | | | | | | | | | | 2,518,600 | |
| | |
| Macedonia – 0.9% | |
| | Republic of Macedonia (BB-/NR) | |
| EUR | 4,530,000 | | | | 4.875 | (b) | | | 12/01/20 | | | | 5,818,763 | |
| | 216,000 | | | | 3.975 | | | | 07/24/21 | | | | 270,608 | |
| | 5,640,000 | | | | 5.625 | (b) | | | 07/26/23 | | | | 7,469,528 | |
| | 4,830,000 | | | | 5.625 | | | | 07/26/23 | | | | 6,396,777 | |
| | | | | | | | | | | | | | |
| | | | | | | | | | | | | 19,955,676 | |
| | |
| Mexico – 0.4% | |
| | United Mexican States (BBB+/A3) | |
| $ | 2,118,000 | | | | 4.750 | | | | 03/08/44 | | | | 2,184,717 | |
| | 4,280,000 | | | | 4.350 | | | | 01/15/47 | | | | 4,160,160 | |
| | 2,332,000 | | | | 5.750 | | | | 10/12/49 | | | | 2,506,900 | |
| | | | | | | | | | | | | | |
| | | | | | | | | | | | | 8,851,777 | |
| | |
| Mongolia – 0.4% | |
| | Republic of Mongolia (B-/Caa1) | |
| | 1,010,000 | | | | 10.875 | (b) | | | 04/06/21 | | | | 1,171,408 | |
| | 6,139,000 | | | | 5.125 | | | | 12/05/22 | | | | 5,951,392 | |
| | 1,730,000 | | | | 8.750 | | | | 03/09/24 | | | | 1,938,483 | |
| | | | | | | | | | | | | | |
| | | | | | | | | | | | | 9,061,283 | |
| | |
| Sovereign Debt Obligations – (continued) | |
| Montenegro(b) – 0.1% | |
| | Republic of Montenegro (B+/B1) | |
| EUR | 1,360,000 | | | | 3.875 | | | | 03/18/20 | | | | 1,649,578 | |
| | |
| Nigeria – 1.0% | |
| | Republic of Nigeria (B/NR) | |
| $ | 493,000 | | | | 6.750 | | | | 01/28/21 | | | | 522,580 | |
| | 4,770,000 | | | | 6.375 | | | | 07/12/23 | | | | 4,984,650 | |
| | Republic of Nigeria (B/(P)B1) | |
| | 2,560,000 | | | | 5.625 | | | | 06/27/22 | | | | 2,620,800 | |
| | Republic of Nigeria (B/B1) | |
| | 12,490,000 | | | | 7.875 | | | | 02/16/32 | | | | 13,614,100 | |
| | 2,260,000 | | | | 7.875 | (b) | | | 02/16/32 | | | | 2,463,400 | |
| | | | | | | | | | | | | | |
| | | | | | | | | | | | | 24,205,530 | |
| | |
| Panama – 0.0% | |
| | Panama Notas del Tesoro (BBB/NR) | |
| | 920,000 | | | | 4.875 | | | | 02/05/21 | | | | 996,935 | |
| | |
| Paraguay – 1.8% | |
| | Republic of Paraguay (BB/Ba1) | |
| | 12,098,000 | | | | 4.625 | | | | 01/25/23 | | | | 12,763,390 | |
| | 3,930,000 | | | | 5.000 | (b) | | | 04/15/26 | | | | 4,200,187 | |
| | 3,445,000 | | | | 5.000 | | | | 04/15/26 | | | | 3,681,844 | |
| | 12,720,000 | | | | 4.700 | (b) | | | 03/27/27 | | | | 13,228,800 | |
| | 6,500,000 | | | | 6.100 | | | | 08/11/44 | | | | 7,296,250 | |
| | | | | | | | | | | | | | |
| | | | | | | | | | | | | 41,170,471 | |
| | |
| Peru – 0.1% | |
| | Corp Financiera de Desarrollo SA (BBB/NR) | |
| | 2,478,000 | | | | 4.750 | | | | 02/08/22 | | | | 2,648,363 | |
| | |
| Romania – 0.9% | |
| | Republic of Romania (BBB-/Baa3) | |
| | 4,090,000 | | | | 6.750 | | | | 02/07/22 | | | | 4,732,130 | |
| | 1,850,000 | | | | 4.375 | | | | 08/22/23 | | | | 1,981,813 | |
| EUR | 2,280,000 | | | | 3.875 | | | | 10/29/35 | | | | 2,853,048 | |
| | 9,740,000 | | | | 3.875 | (b) | | | 10/29/35 | | | | 12,188,023 | |
| | | | | | | | | | | | | | |
| | | | | | | | | | | | | 21,755,014 | |
| | |
| Russia – 2.4% | |
| | Russian Federation Bond (NR/NR) | |
| $ | 27,000,000 | | | | 4.750 | | | | 05/27/26 | | | | 28,620,000 | |
| | 12,000,000 | | | | 4.250 | (b) | | | 06/23/27 | | | | 12,204,000 | |
| | 10,600,000 | | | | 5.250 | (b) | | | 06/23/47 | | | | 10,849,100 | |
| | Russian Federation Bond (BB+/Ba1) | |
| | 800,000 | | | | 4.500 | (b) | | | 04/04/22 | | | | 853,600 | |
| | 2,000,000 | | | | 4.875 | (b) | | | 09/16/23 | | | | 2,178,000 | |
| | 200,000 | | | | 4.875 | | | | 09/16/23 | | | | 217,800 | |
| | | | | | | | | | | | | | |
| | | | | | | | | | | | | 54,922,500 | |
| | |
| Russia – 0.5% | |
| | Republic of Egypt (NR/B3) | |
| | 4,760,000 | | | | 6.125 | | | | 01/31/22 | | | | 4,932,550 | |
| | 5,860,000 | | | | 8.500 | | | | 01/31/47 | | | | 6,542,690 | |
| | | | | | | | | | | | | | |
| | | | | | | | | | | | | 11,475,240 | |
| | |
| | |
| The accompanying notes are an integral part of these financial statements. | | 61 |
GOLDMAN SACHS EMERGING MARKETS DEBT FUND
Schedule of Investments (continued)
September 30, 2017 (Unaudited)
| | | | | | | | | | | | | | |
Principal
Amount | | | Interest
Rate | | | Maturity
Date | | | Value | |
| Sovereign Debt Obligations – (continued) | |
| South Africa – 4.8% | |
| | Republic of South Africa (NR/Baa3) | |
| $ | 15,660,000 | | | | 4.850 | % | | | 09/27/27 | | | $ | 15,503,400 | |
| | 27,780,000 | | | | 5.650 | | | | 09/27/47 | | | | 27,571,650 | |
| | Republic of South Africa (BB+/Baa3) | |
| | 2,700,000 | | | | 4.665 | | | | 01/17/24 | | | | 2,764,125 | |
| | Republic of South Africa (BB+/Baa3) | |
| | 29,125,000 | | | | 5.875 | | | | 09/16/25 | | | | 31,491,406 | |
| | 2,071,000 | | | | 4.875 | | | | 04/14/26 | | | | 2,091,710 | |
| | 7,060,000 | | | | 4.300 | | | | 10/12/28 | | | | 6,645,225 | |
| | Republic of South Africa (BBB-/Baa3) | |
| ZAR | 80,030,000 | | | | 7.000 | | | | 02/28/31 | | | | 4,922,907 | |
| | 154,090,000 | | | | 8.250 | | | | 03/31/32 | | | | 10,403,504 | |
| | 28,560,000 | | | | 8.875 | | | | 02/28/35 | | | | 1,993,176 | |
| | 33,380,000 | | | | 8.500 | | | | 01/31/37 | | | | 2,219,569 | |
| | 16,040,000 | | | | 6.500 | | | | 02/28/41 | | | | 839,790 | |
| | 15,730,000 | | | | 8.750 | | | | 01/31/44 | | | | 1,049,575 | |
| | 50,097,000 | | | | 8.750 | | | | 02/28/48 | | | | 3,346,667 | |
| | | | | | | | | | | | | | |
| | | | | | | | | | | | | 110,842,704 | |
| | |
| Sri Lanka – 2.1% | |
| | Republic of Sri Lanka (B+/B1) | |
| $ | 1,180,000 | | | | 6.000 | (b) | | | 01/14/19 | | | | 1,217,241 | |
| | 360,000 | | | | 6.000 | | | | 01/14/19 | | | | 371,362 | |
| | 1,260,000 | | | | 6.250 | | | | 10/04/20 | | | | 1,342,240 | |
| | 1,222,000 | | | | 6.250 | (b) | | | 10/04/20 | | | | 1,301,760 | |
| | 7,814,000 | | | | 6.250 | | | | 07/27/21 | | | | 8,406,770 | |
| | 7,300,000 | | | | 5.750 | (b) | | | 01/18/22 | | | | 7,713,253 | |
| | 5,700,000 | | | | 6.125 | | | | 06/03/25 | | | | 6,027,750 | |
| | 7,600,000 | | | | 6.850 | (b) | | | 11/03/25 | | | | 8,344,116 | |
| | 12,460,000 | | | | 6.850 | | | | 11/03/25 | | | | 13,679,958 | |
| | 200,000 | | | | 6.825 | | | | 07/18/26 | | | | 219,368 | |
| | | | | | | | | | | | | | |
| | | | | | | | | | | | | 48,623,818 | |
| | |
| Suriname – 0.6% | |
| | Republic of Suriname (B/B1) | |
| | 6,370,000 | | | | 9.250 | (b) | | | 10/26/26 | | | | 6,855,713 | |
| | 7,486,000 | | | | 9.250 | | | | 10/26/26 | | | | 8,056,807 | |
| | | | | | | | | | | | | | |
| | | | | | | | | | | | | 14,912,520 | |
| | |
| Tajikistan(b) – 0.2% | |
| | Republic of Tajikistan (B-/B3) | |
| | 3,880,000 | | | | 7.125 | | | | 09/14/27 | | | | 3,841,200 | |
| | |
| Tunisia – 0.0% | |
| | Banque Centrale de Tunisie International Bond (NR/B1) | |
| EUR | 610,000 | | | | 5.625 | | | | 02/17/24 | | | | 744,390 | |
| | |
| Turkey – 5.6% | |
| | Republic of Turkey (NR/Ba1) | |
| $ | 2,990,000 | | | | 3.250 | | | | 03/23/23 | | | | 2,844,237 | |
| | 21,863,000 | | | | 5.750 | | | | 03/22/24 | | | | 23,229,437 | |
| EUR | 8,370,000 | | | | 3.250 | | | | 06/14/25 | | | | 9,904,872 | |
| $ | 4,346,000 | | | | 4.250 | | | | 04/14/26 | | | | 4,172,160 | |
| | 5,050,000 | | | | 4.875 | | | | 10/09/26 | | | | 5,012,125 | |
| | 5,521,000 | | | | 6.000 | | | | 03/25/27 | | | | 5,928,174 | |
| | 15,650,000 | | | | 4.875 | | | | 04/16/43 | | | | 13,889,375 | |
| | 14,870,000 | | | | 5.750 | | | | 05/11/47 | | | | 14,609,775 | |
| | |
| Sovereign Debt Obligations – (continued) | |
| Turkey – (continued) | |
| | Republic of Turkey (NR/Ba1) (continued) | |
| 6,700,000 | | | | 7.000 | | | | 06/05/20 | | | | 7,319,750 | |
| | 18,866,000 | | | | 6.250 | | | | 09/26/22 | | | | 20,705,435 | |
| | 10,539,000 | | | | 7.375 | | | | 02/05/25 | | | | 12,238,414 | |
| | 3,100,000 | | | | 6.875 | | | | 03/17/36 | | | | 3,495,250 | |
| | 450,000 | | | | 6.750 | | | | 05/30/40 | | | | 499,500 | |
| | 6,550,000 | | | | 6.000 | | | | 01/14/41 | | | | 6,730,125 | |
| | | | | | | | | | | | | | |
| | | | | | | | | | | | | 130,578,629 | |
| | |
| Ukraine – 1.9% | |
| | Ukraine Government Bond (NR/NR)(b) | |
| | 4,310,000 | | | | 7.375 | | | | 09/25/32 | | | | 4,200,095 | |
| | Ukraine Government Bond (B-/Caa2) | |
| | 1,440,000 | | | | 7.750 | | | | 09/01/21 | | | | 1,528,560 | |
| | 2,260,000 | | | | 7.750 | | | | 09/01/22 | | | | 2,394,470 | |
| | 6,200,000 | | | | 7.750 | | | | 09/01/23 | | | | 6,510,000 | |
| | 12,930,000 | | | | 7.750 | | | | 09/01/24 | | | | 13,498,920 | |
| | 5,960,000 | | | | 7.750 | | | | 09/01/25 | | | | 6,165,620 | |
| | 4,950,000 | | | | 7.750 | | | | 09/01/26 | | | | 5,083,650 | |
| | 4,560,000 | | | | 7.750 | | | | 09/01/27 | | | | 4,674,000 | |
| | | | | | | | | | | | | | |
| | | | | | | | | | | | | 44,055,315 | |
| | |
| United Arab Emirates – 0.8% | |
| | Abu Dhabi Government International Bond (AA/NR) | |
| | 8,910,000 | | | | 2.125 | | | | 05/03/21 | | | | 8,896,635 | |
| | 9,110,000 | | | | 3.125 | | | | 05/03/26 | | | | 9,269,425 | |
| | | | | | | | | | | | | | |
| | | | | | | | | | | | | 18,166,060 | |
| | |
| Venezuela – 0.5% | |
| | Republic of Venezuela (CCC-/Caa3) | |
| | 410,000 | | | | 6.000 | | | | 12/09/20 | | | | 157,850 | |
| | 16,771,600 | | | | 8.250 | | | | 10/13/24 | | | | 5,702,344 | |
| | 9,850,000 | | | | 7.650 | | | | 04/21/25 | | | | 3,324,375 | |
| | 10,034,000 | | | | 9.250 | | | | 05/07/28 | | | | 3,436,645 | |
| | 80,000 | | | | 9.375 | | | | 01/13/34 | | | | 28,000 | |
| | | | | | | | | | | | | | |
| | | | | | | | | | | | | 12,649,214 | |
| | |
| Vietnam – 0.4% | |
| | Debt and Asset Trading Corp. (NR/NR)(d) | |
| | 1,960,000 | | | | 1.000 | | | | 10/10/25 | | | | 1,347,765 | |
| | Socialist Republic of Vietnam (BB-/B1)(b) | |
| | 7,980,000 | | | | 6.750 | | | | 01/29/20 | | | | 8,715,277 | |
| | | | | | | | | | | | | | |
| | | | | | | | | | | | | 10,063,042 | |
| | |
| Zambia – 1.1% | |
| | Republic of Zambia (B/NR) | |
| | 1,722,000 | | | | 5.375 | | | | 09/20/22 | | | | 1,640,205 | |
| | 10,680,000 | | | | 8.500 | | | | 04/14/24 | | | | 11,387,550 | |
| | 570,000 | | | | 8.970 | (b) | | | 07/30/27 | | | | 618,450 | |
| | 10,070,000 | | | | 8.970 | | | | 07/30/27 | | | | 10,925,950 | |
| | | | | | | | | | | | | | |
| | | | | | | | | | | | | 24,572,155 | |
| | |
| | TOTAL SOVEREIGN DEBT OBLIGATIONS | | | | | |
| | (Cost $1,463,132,993) | | | $ | 1,522,508,294 | |
| | |
| | | | | | | | | | | | | | |
| | |
| 62 | | The accompanying notes are an integral part of these financial statements. |
GOLDMAN SACHS EMERGING MARKETS DEBT FUND
| | | | | | | | | | | | | | |
Principal
Amount | | | Interest
Rate | | | Maturity
Date | | | Value | |
| Corporate Obligations – 24.3% | |
| Argentina – 0.3% | |
| | Cablevision SA (NR/B3)(d) | |
| $ | 1,600,000 | | | | 6.500 | % (b) | | | 06/15/21 | | | $ | 1,706,000 | |
| | 1,210,000 | | | | 6.500 | | | | 06/15/21 | | | | 1,290,162 | |
| | YPF SA (NR/B3) | |
| | 2,780,000 | | | | 8.875 | | | | 12/19/18 | | | | 2,967,650 | |
| | | | | | | | | | | | | | |
| | | | | | | | | | | | | 5,963,812 | |
| | |
| Brazil – 0.7% | |
| | Banco do Brasil SA (B-/B2) (10 year CMT + 6.362%)(a)(d) | |
| | 8,360,000 | | | | 9.000 | | | | 06/29/49 | | | | 8,936,840 | |
| | Banco do Brasil SA (B-/NR) (10 year CMT + 4.398%)(a)(d) | |
| | 6,550,000 | | | | 6.250 | | | | 10/29/49 | | | | 5,821,313 | |
| | Brazil Minas SPE via State of Minas Gerais (BB/NR)(h) | |
| | 597,000 | | | | 5.333 | | | | 02/15/28 | | | | 605,955 | |
| | Independencia International Ltd. (NR/NR)(b)(i)(j) | |
| | 1,277,436 | | | | 12.000 | | | | 12/30/16 | | | | — | |
| | | | | | | | | | | | | | |
| | | | | | | | | | | | | 15,364,108 | |
| | |
| Chile – 0.9% | |
| | Embotelladora Andina SA (BBB/NR)(b) | |
| | 980,000 | | | | 5.000 | | | | 10/01/23 | | | | 1,081,675 | |
| | Engie Energia Chile SA (BBB/NR) | |
| | 430,000 | | | | 5.625 | | | | 01/15/21 | | | | 470,308 | |
| | 1,270,000 | | | | 5.625 | (b) | | | 01/15/21 | | | | 1,389,049 | |
| | GNL Quintero SA (BBB/Baa2) | |
| | 5,920,000 | | | | 4.634 | (b) | | | 07/31/29 | | | | 6,167,471 | |
| | 740,000 | | | | 4.634 | | | | 07/31/29 | | | | 770,934 | |
| | Itau CorpBanca (BBB+/A3) | |
| | 4,071,000 | | | | 3.875 | (b) | | | 09/22/19 | | | | 4,197,201 | |
| | 690,000 | | | | 3.875 | | | | 09/22/19 | | | | 711,390 | |
| | Sociedad Quimica y Minera de Chile SA (BBB/Baa1) | |
| | 793,000 | | | | 3.625 | | | | 04/03/23 | | | | 798,947 | |
| | 3,991,000 | | | | 4.375 | (b)(d) | | | 01/28/25 | | | | 4,125,517 | |
| | 290,000 | | | | 4.375 | (d) | | | 01/28/25 | | | | 299,774 | |
| | | | | | | | | | | | | | |
| | | | | | | | | | | | | 20,012,266 | |
| | |
| China(d) – 0.5% | |
| | China Evergrande Group (NR/B3) | |
| | 7,620,000 | | | | 8.250 | | | | 03/23/22 | | | | 7,884,528 | |
| | China Evergrande Group (B-/B3) | |
| | 2,890,000 | | | | 8.750 | | | | 06/28/25 | | | | 2,930,063 | |
| | | | | | | | | | | | | | |
| | | | | | | | | | | | | 10,814,591 | |
| | |
| Colombia(b) – 0.7% | |
| | Banco de Bogota SA (NR/Ba2) | |
| | 13,770,000 | | | | 6.250 | | | | 05/12/26 | | | | 15,036,840 | |
| | Banco de Bogota SA (NR/NR) | |
| | 1,370,000 | | | | 4.375 | | | | 08/03/27 | | | | 1,378,905 | |
| | | | | | | | | | | | | | |
| | | | | | | | | | | | | 16,415,745 | |
| | |
| Costa Rica – 0.4% | |
| | Banco de Costa Rica (NR/Ba2)(h) | |
| | 4,870,000 | | | | 5.250 | (b) | | | 08/12/18 | | | | 4,949,137 | |
| | 1,010,000 | | | | 5.250 | | | | 08/12/18 | | | | 1,026,413 | |
| | |
| Corporate Obligations – (continued) | |
| Costa Rica – (continued) | |
| | Banco Nacional de Costa Rica (NR/Ba2) | |
| 3,000,000 | | | | 4.875 | (b) | | | 11/01/18 | | | | 3,045,000 | |
| | 380,000 | | | | 4.875 | | | | 11/01/18 | | | | 385,700 | |
| | 1,030,000 | | | | 6.250 | (b) | | | 11/01/23 | | | | 1,088,195 | |
| | | | | | | | | | | | | | |
| | | | | | | | | | | | | 10,494,445 | |
| | |
| Dominican Republic(b)(d) – 0.3% | |
| | Aeropuertos Dominicanos Siglo XXI SA (NR/Ba3) | |
| | 6,150,000 | | | | 6.750 | | | | 03/30/29 | | | | 6,626,625 | |
| | |
| Ecuador(a)(h) – 0.1% | |
| EP PetroEcuador via Noble Sovereign Funding I Ltd. (B-/NR)
(3M USD LIBOR + 5.630%) |
|
| | 1,795,789 | | | | 6.961 | | | | 09/24/19 | | | | 1,804,768 | |
| | |
| Guatemala(b)(d) – 0.1% | |
| | Central American Bottling Corp. (BB/Ba2) | |
| | 3,210,000 | | | | 5.750 | | | | 01/31/27 | | | | 3,394,575 | |
| | |
| Ireland – 0.1% | |
| | Phosagro OAO via Phosagro Bond Funding DAC (NR/Ba1) | |
| | 2,250,000 | | | | 4.204 | (b) | | | 02/13/18 | | | | 2,262,375 | |
| | 240,000 | | | | 4.204 | | | | 02/13/18 | | | | 241,320 | |
| | | | | | | | | | | | | | |
| | | | | | | | | | | | | 2,503,695 | |
| | |
| Israel(b) – 0.0% | |
| | Delek & Avner Tamar Bond Ltd. (BBB-/Baa3) | |
| | 960,000 | | | | 3.839 | | | | 12/30/18 | | | | 976,800 | |
| | |
| Ivory Coast – 0.9% | |
| | Agromercantil Senior Trust (BB/NR)(b) | |
| | 3,420,000 | | | | 6.250 | | | | 04/10/19 | | | | 3,553,776 | |
| | Brazil Minas SPE via State of Minas Gerais (BB/NR)(b)(h) | |
| | 12,200,000 | | | | 5.333 | | | | 02/15/28 | | | | 12,383,000 | |
| | Comcel Trust via Comunicaciones Celulares SA (NR/Ba1)(d) | |
| | 4,390,000 | | | | 6.875 | | | | 02/06/24 | | | | 4,664,375 | |
| | Comunicaciones Celulares SA (NR/Ba1)(b)(d) | |
| | 810,000 | | | | 6.875 | | | | 02/06/24 | | | | 860,625 | |
| | | | | | | | | | | | | | |
| | | | | | | | | | | | | 21,461,776 | |
| | |
| Jamaica(d) – 0.5% | |
| | Digicel Ltd. (NR/B1) | |
| | 3,860,000 | | | | 6.000 | (b) | | | 04/15/21 | | | | 3,782,376 | |
| | 2,560,000 | | | | 6.000 | | | | 04/15/21 | | | | 2,508,518 | |
| | 4,500,000 | | | | 6.750 | (b) | | | 03/01/23 | | | | 4,415,625 | |
| | 1,700,000 | | | | 6.750 | | | | 03/01/23 | | | | 1,668,125 | |
| | | | | | | | | | | | | | |
| | | | | | | | | | | | | 12,374,644 | |
| | |
| Japan(d) – 0.7% | |
| SoftBank Group Corp. (B+/Ba3) (5 year USD ICE
Swap + 4.226%)(a) |
|
| | 11,250,000 | | | | 6.000 | | | | 12/31/99 | | | | 11,362,500 | |
| | Universal Entertainment Corp. (NR/NR)(b)(k) | |
| | 4,208,406 | | | | 8.500 | | | | 08/24/20 | | | | 4,332,133 | |
| | | | | | | | | | | | | | |
| | | | | | | | | | | | | 15,694,633 | |
| | |
| | |
| The accompanying notes are an integral part of these financial statements. | | 63 |
GOLDMAN SACHS EMERGING MARKETS DEBT FUND
Schedule of Investments (continued)
September 30, 2017 (Unaudited)
| | | | | | | | | | | | | | |
Principal
Amount | | | Interest
Rate | | | Maturity
Date | | | Value | |
| Corporate Obligations – (continued) | |
| Kazakhstan – 0.5% | |
| | KazMunayGas National Co. JSC (BB/Baa3) | |
| $ | 11,640,000 | | | | 9.125 | % | | | 07/02/18 | | | $ | 12,175,440 | |
| | |
| Luxembourg – 2.1% | |
| | Altice Financing SA (BB-/B1)(b)(d) | |
| | 400,000 | | | | 6.500 | | | | 01/15/22 | | | | 416,000 | |
| | 1,160,000 | | | | 6.625 | | | | 02/15/23 | | | | 1,229,600 | |
| | 1,700,000 | | | | 7.500 | | | | 05/15/26 | | | | 1,870,000 | |
| | Gazprom OAO Via Gaz Capital SA (BB+/Ba1) | |
| | 6,400,000 | | | | 9.250 | (g) | | | 04/23/19 | | | | 6,992,000 | |
| | 2,640,000 | | | | 7.288 | | | | 08/16/37 | | | | 3,214,200 | |
| | Millicom International Cellular SA (NR/Ba2)(b)(d) | |
| | 1,070,000 | | | | 5.125 | | | | 01/15/28 | | | | 1,081,770 | |
| Sberbank of Russia Via SB Capital SA (NR/NR) (5 year CMT +
4.023%)(a)(d) |
|
| | 4,490,000 | | | | 5.500 | | | | 02/26/24 | | | | 4,585,413 | |
| | Severstal OAO Via Steel Capital SA (BBB-/Ba1) | |
| | 3,300,000 | | | | 6.700 | | | | 10/25/17 | | | | 3,309,900 | |
| | Tupy Overseas SA (BB-/NR)(d) | |
| | 2,220,000 | | | | 6.625 | (b) | | | 07/17/24 | | | | 2,332,132 | |
| | 219,000 | | | | 6.625 | | | | 07/17/24 | | | | 230,062 | |
| | Wind Acquisition Finance SA (BB/Ba3)(d) | |
| EUR | 150,000 | | | | 4.000 | | | | 07/15/20 | | | | 179,235 | |
| | Wind Acquisition Finance SA (B/B3)(d) | |
| | 4,810,000 | | | | 7.000 | | | | 04/23/21 | | | | 5,910,121 | |
| $ | 7,250,000 | | | | 7.375 | (b) | | | 04/23/21 | | | | 7,503,750 | |
| | 9,744,000 | | | | 7.375 | | | | 04/23/21 | | | | 10,085,040 | |
| | | | | | | | | | | | | | |
| | | | | | | | | | | | | 48,939,223 | |
| | |
| Mauritius – 0.6% | |
| | Greenko Investment Co. (B+/NR)(d) | |
| | 200,000 | | | | 4.875 | | | | 08/16/23 | | | | 197,915 | |
| | 4,260,000 | | | | 4.875 | (b) | | | 08/16/23 | | | | 4,215,605 | |
| | MTN Mauritius Investment Ltd. (BB+/Ba1) | |
| | 283,000 | | | | 6.500 | | | | 10/13/26 | | | | 303,164 | |
| | 2,040,000 | | | | 6.500 | (b) | | | 10/13/26 | | | | 2,185,350 | |
| | Neerg Energy Ltd. (NR/Ba3)(d) | |
| | 3,650,000 | | | | 6.000 | | | | 02/13/22 | | | | 3,750,375 | |
| | 3,440,000 | | | | 6.000 | (b) | | | 02/13/22 | | | | 3,534,600 | |
| | | | | | | | | | | | | | |
| | | | | | | | | | | | | 14,187,009 | |
| | |
| Mexico – 4.0% | |
| | America Movil SAB de CV (A-/A3) | |
| MXN | 19,010,000 | | | | 6.000 | | | | 06/09/19 | | | | 1,015,292 | |
| Banco Mercantil del Norte SA (BB/Ba2)
(5 year CMT + 5.035%)(a)(b)(d) |
|
| $ | 2,110,000 | | | | 6.875 | | | | 12/31/99 | | | | 2,239,237 | |
| | (10 year CMT + 5.353%) | |
| | 3,870,000 | | | | 7.625 | | | | 12/31/99 | | | | 4,227,975 | |
| | Cemex SAB de CV (BB/NR)(b)(d) | |
| EUR | 1,300,000 | | | | 4.750 | | | | 01/11/22 | | | | 1,586,690 | |
| | Corporacion Geo SA (NR/NR)(i) | |
| $ | 277,766 | | | | 8.000 | | | | 04/13/21 | | | | — | |
| | Gruma SAB de CV (BBB/NR)(b)(d)(j) | |
| | 2,220,000 | | | | 4.875 | | | | 12/01/24 | | | | 2,405,925 | |
| | |
| Corporate Obligations – (continued) | |
| Mexico – (continued) | |
| | Petroleos Mexicanos (BBB+/Baa3) | |
| 3,170,000 | | | | 5.500 | | | | 02/04/19 | | | | 3,300,762 | |
| | 1,630,000 | | | | 3.500 | | | | 07/23/20 | | | | 1,664,230 | |
| | 7,349,000 | | | | 6.375 | | | | 02/04/21 | | | | 8,030,620 | |
| | 35,000 | | | | 4.875 | | | | 01/24/22 | | | | 36,706 | |
| | 2,610,000 | | | | 5.375 | (b) | | | 03/13/22 | | | | 2,784,609 | |
| | 290,000 | | | | 3.500 | | | | 01/30/23 | | | | 285,824 | |
| EUR | 14,940,000 | | | | 5.125 | | | | 03/15/23 | | | | 20,217,942 | |
| $ | 7,549,000 | | | | 6.875 | | | | 08/04/26 | | | | 8,586,233 | |
| | 14,960,000 | | | | 6.500 | (b) | | | 03/13/27 | | | | 16,579,121 | |
| EUR | 7,660,000 | | | | 4.875 | | | | 02/21/28 | | | | 9,732,359 | |
| $ | 2,046,000 | | | | 5.500 | | | | 06/27/44 | | | | 1,902,780 | |
| | 610,000 | | | | 6.375 | | | | 01/23/45 | | | | 621,590 | |
| | 30,000 | | | | 5.625 | | | | 01/23/46 | | | | 28,005 | |
| | 3,697,000 | | | | 6.750 | | | | 09/21/47 | | | | 3,935,087 | |
| | 4,190,000 | | | | 6.750 | (b) | | | 09/21/47 | | | | 4,459,836 | |
| | | | | | | | | | | | | | |
| | | | | | | | | | | | | 93,640,823 | |
| | |
| Netherlands – 3.0% | |
| | Greenko Dutch BV (NR/Ba2)(b)(d) | |
| | 1,670,000 | | | | 4.875 | | | | 07/24/22 | | | | 1,692,962 | |
| | 6,890,000 | | | | 5.250 | | | | 07/24/24 | | | | 7,001,962 | |
| | GTH Finance BV (BB/Ba2)(d) | |
| | 610,000 | | | | 7.250 | | | | 04/26/23 | | | | 692,350 | |
| | Listrindo Capital BV (BB/Ba2)(b)(d) | |
| | 1,720,000 | | | | 4.950 | | | | 09/14/26 | | | | 1,745,800 | |
| | Lukoil International Finance BV (BBB/Ba1) | |
| | 1,480,000 | | | | 3.416 | | | | 04/24/18 | | | | 1,488,140 | |
| | 1,650,000 | | | | 6.125 | | | | 11/09/20 | | | | 1,798,500 | |
| | 620,000 | | | | 4.563 | | | | 04/24/23 | | | | 644,800 | |
| | Metinvest BV (NR/NR)(k) | |
| | 3,745,896 | | | | 9.373 | | | | 12/31/21 | | | | 3,783,355 | |
| | Minejesa Capital BV (NR/Baa3)(b) | |
| | 3,070,000 | | | | 4.625 | | | | 08/10/30 | | | | 3,206,953 | |
| | Petrobras Global Finance BV (BB-/B1) | |
| | 13,800,000 | | | | 6.125 | | | | 01/17/22 | | | | 14,815,059 | |
| | 2,858,000 | | | | 5.299 | (b) | | | 01/27/25 | | | | 2,859,715 | |
| | 23,720,000 | | | | 5.999 | (b) | | | 01/27/28 | | | | 23,720,000 | |
| | Teva Pharmaceutical Finance Netherlands III BV (BBB-/Baa3) | |
| | 4,490,000 | | | | 1.400 | | | | 07/20/18 | | | | 4,473,228 | |
| | 980,000 | | | | 1.700 | | | | 07/19/19 | | | | 965,835 | |
| | | | | | | | | | | | | | |
| | | | | | | | | | | | | 68,888,659 | |
| | |
| Panama(b) – 0.0% | |
| | Autoridad del Canal de Panama (A-/A2) | |
| | 380,000 | | | | 4.950 | | | | 07/29/35 | | | | 425,437 | |
| | |
| Paraguay – 0.4% | | | | | | | | | | |
| | Banco Regional SAECA (BB/Ba1) | |
| | 4,670,000 | | | | 8.125 | (b) | | | 01/24/19 | | | | 4,926,801 | |
| | 905,000 | | | | 8.125 | | | | 01/24/19 | | | | 954,765 | |
| | Telefonica Celular del Paraguay SA (NR/Ba3)(d) | |
| | 2,700,000 | | | | 6.750 | | | | 12/13/22 | | | | 2,808,000 | |
| | | | | | | | | | | | | | |
| | | | | | | | | | | | | 8,689,566 | |
| | |
| | |
| 64 | | The accompanying notes are an integral part of these financial statements. |
GOLDMAN SACHS EMERGING MARKETS DEBT FUND
| | | | | | | | | | | | | | |
Principal
Amount | | | Interest
Rate | | | Maturity
Date | | | Value | |
| Corporate Obligations – (continued) | |
| Peru – 0.5% | |
| | Abengoa Transmision Sur SA (BBB/NR)(b) | |
| $ | 5,140,392 | | | | 6.875 | % | | | 04/30/43 | | | $ | 5,646,129 | |
| | Corp Lindley S.A. (BBB/NR)(b) | |
| | 1,630,000 | | | | 6.750 | | | | 11/23/21 | | | | 1,810,824 | |
| | 120,000 | | | | 4.625 | | | | 04/12/23 | | | | 123,639 | |
| | Corp. Lindley SA (BBB/NR) | |
| | 3,560,000 | | | | 6.750 | | | | 11/23/21 | | | | 3,954,929 | |
| | | | | | | | | | | | | | |
| | | | | | | | | | | | | 11,535,521 | |
| | |
| Singapore – 0.1% | |
| | China Resources Cement Holdings Ltd. (NR/WR) | |
| | 1,240,000 | | | | 2.125 | | | | 10/05/17 | | | | 1,239,978 | |
| | |
| South Africa – 0.2% | |
| | ZAR Sovereign Capital Fund Propriety Ltd. (BB+/Baa3) | |
| | 5,440,000 | | | | 3.903 | | | | 06/24/20 | | | | 5,548,800 | |
| | |
| Turkey – 1.4% | |
| | Hazine Mustesarligi Varlik Kiralama AS (NR/Ba1) | |
| | 208,000 | | | | 2.803 | | | | 03/26/18 | | | | 208,178 | |
| | 10,280,000 | | | | 5.004 | | | | 04/06/23 | | | | 10,562,700 | |
| | 18,880,000 | | | | 5.004 | (b) | | | 04/06/23 | | | | 19,399,200 | |
| | TC Ziraat Bankasi AS (NR/Ba1) | |
| | 200,000 | | | | 5.125 | | | | 05/03/22 | | | | 203,500 | |
| | 2,370,000 | | | | 5.125 | (b) | | | 09/29/23 | | | | 2,372,962 | |
| | | | | | | | | | | | | | |
| | | | | | | | | | | | | 32,746,540 | |
| | |
| United Arab Emirates – 0.4% | |
| | Aabar Investments PJSC | |
| EUR | 100,000 | | | | 1.000 | | | | 03/27/22 | | | | 99,427 | |
| | Dolphin Energy Ltd. (NR/A2) | |
| $ | 210,070 | | | | 5.888 | | | | 06/15/19 | | | | 217,423 | |
| | 3,580,000 | | | | 5.500 | | | | 12/15/21 | | | | 3,933,525 | |
| | Ruwais Power Co. PJSC (A-/A3)(b) | |
| | 3,700,000 | | | | 6.000 | | | | 08/31/36 | | | | 4,347,500 | |
| | | | | | | | | | | | | | |
| | | | | | | | | | | | | 8,597,875 | |
| | |
| United States – 1.4% | |
| | Arab Republic of Egypt (Issuer Citibank NA) (NR/NR)(b)(e) | |
| EGP | 73,400,000 | | | | 0.000 | | | | 11/02/17 | | | | 4,092,642 | |
| | 18,500,000 | | | | 0.000 | | | | 05/03/18 | | | | 946,770 | |
| Arab Republic of Egypt (Issuer JPMorgan Chase Bank NA)
(NR/NR)(b)(e) |
|
| | 65,650,000 | | | | 0.000 | | | | 02/15/18 | | | | 3,482,165 | |
| | 44,350,000 | | | | 0.000 | | | | 05/17/18 | | | | 2,254,488 | |
| | Brazil Loan Trust 1 (BB/NR)(b)(h) | |
| $ | 8,244,188 | | | | 5.477 | | | | 07/24/23 | | | | 8,697,619 | |
| | CEMEX Finance LLC (BB/NR)(d) | |
| EUR | 3,950,000 | | | | 4.625 | | | | 06/15/24 | | | | 5,071,165 | |
| | Citigroup Global Markets Holdings, Inc. (NR/NR)(b)(e) | |
| EGP | 68,475,000 | | | | 0.000 | | | | 01/25/18 | | | | 3,667,467 | |
| Eastern and Southern African Trade and Development Bank
(NR/Ba1) |
|
| $ | 3,990,000 | | | | 5.375 | | | | 03/14/22 | | | | 4,078,776 | |
| | MHP SA (B/NR) | |
| | 1,420,000 | | | | 8.250 | | | | 04/02/20 | | | | 1,533,600 | |
| | |
| Corporate Obligations – (continued) | |
| United States – (continued) | |
| | The Bank of New York Mellon SA (NR/NR)(i)(j) | |
| 400,000 | | | | 9.625 | | | | 05/02/21 | | | | — | |
| | 520,000 | | | | 9.625 | | | | 05/03/21 | | | | — | |
| | | | | | | | | | | | | | |
| | | | | | | | | | | | | 33,824,692 | |
| | |
| Venezuela – 3.5% | |
| | Petroleos de Venezuela SA (NR/NR) | |
| | 145,930,000 | | | | 6.000 | | | | 10/28/22 | | | | 41,735,980 | |
| | Petroleos de Venezuela SA (CCC-/NR) | |
| | 82,650,000 | | | | 6.000 | | | | 05/16/24 | | | | 25,125,600 | |
| | 26,757,934 | | | | 6.000 | | | | 11/15/26 | | | | 8,121,033 | |
| | 17,520,000 | | | | 5.375 | | | | 04/12/27 | | | | 5,256,000 | |
| | 2,180,000 | | | | 5.500 | | | | 04/12/37 | | | | 659,450 | |
| | | | | | | | | | | | | | |
| | | | | | | | | | | | | 80,898,063 | |
| | |
| | TOTAL CORPORATE OBLIGATIONS | |
| | (Cost $ 559,791,665) | | | $ | 565,240,109 | |
| | |
| | | | | | | | | | | | | | |
Principal
Amount | | | Interest
Rate | | | Maturity
Date | | | Value | |
| Structured Notes – 1.0% | |
| Russia – 0.2% | |
| | Republic of Egypt (Issuer Citibank NA) (NR/NR) | |
| $ | 55,475,000 | | | | 1.000 | % | | | 02/08/18 | | | $ | 2,953,188 | |
| | 13,200,000 | | | | 0.000 | (e) | | | 03/08/18 | | | | 694,492 | |
| | | | | | | | | | | | | | |
| | | | | | | | | | | | | 3,647,680 | |
| | |
| United Kingdom(b)(e) – 0.2% | |
| | Arab Republic of Egypt (Issuer HSBC Bank PLC) (NR/NR) | |
| | 81,400,000 | | | | 0.000 | | | | 06/07/18 | | | | 4,109,247 | |
| | |
| United States(e) – 0.6% | |
| | Arab Republic of Egypt (Issuer Citibank NA) (NR/NR) | |
| EGP | 73,350,000 | | | | 0.000 | | | | 11/09/17 | | | | 4,075,102 | |
| | 146,650,000 | | | | 0.000 | (b) | | | 05/10/18 | | | | 7,458,544 | |
| Arab Republic of Egypt (Issuer JPMorgan Chase Bank NA)
(NR/NR)(b)(e) |
|
| | 52,300,000 | | | | 0.000 | | | | 07/26/18 | | | | 2,577,812 | |
| | | | | | | | | | | | | | |
| | | | | 14,111,458 | |
| | |
| | TOTAL STRUCTURED NOTES | | | | | |
| | (Cost $ 21,429,505) | | | $ | 21,868,385 | |
| | |
| | |
| Municipal Debt Obligations(j) – 0.5% | |
| Puerto Rico – 0.5% | |
| Puerto Rico Commonwealth Aqueduct & Sewer Authority RB
(Senior Lien) Series 2008 A (CC/Caa3)(d) |
|
| $ | 975,000 | | | | 6.000 | % | | | 07/01/44 | | | $ | 733,687 | |
| Puerto Rico Commonwealth Aqueduct & Sewer Authority RB
(Senior Lien) Series 2012 A (CC/Caa3)(d) |
|
| | 305,000 | | | | 5.125 | | | | 07/01/37 | | | | 218,075 | |
| | 640,000 | | | | 5.250 | | | | 07/01/42 | | | | 457,600 | |
| | 80,000 | | | | 6.000 | | | | 07/01/47 | | | | 59,000 | |
| | |
| | |
| The accompanying notes are an integral part of these financial statements. | | 65 |
GOLDMAN SACHS EMERGING MARKETS DEBT FUND
Schedule of Investments (continued)
September 30, 2017 (Unaudited)
| | | | | | | | | | | | | | |
Principal
Amount | | | Interest
Rate | | | Maturity
Date | | | Value | |
| Municipal Debt Obligations(j) – (continued) | |
| Puerto Rico – (continued) | |
| Puerto Rico Commonwealth Aqueduct & Sewer Authority RB
(Senior Lien) Series 2012 D (CC/Caa3)(d) |
|
| $ | 305,000 | | | | 5.000 | % | | | 07/01/33 | | | $ | 218,075 | |
| Puerto Rico Commonwealth GO Bonds Public Improvement
Series 2006 A (D/Caa3)(d) |
|
| | 105,000 | | | | 5.250 | | | | 07/01/26 | | | | 48,956 | |
| Puerto Rico Commonwealth GO Bonds Refunding for Public
Improvement Series 2008 A (D/Caa3)(d) |
|
| | 135,000 | | | | 5.500 | | | | 07/01/32 | | | | 62,269 | |
| Puerto Rico Commonwealth GO Bonds Refunding for Public
Improvement Series 2009 B (D/Caa3)(d) |
|
| | 135,000 | | | | 6.000 | | | | 07/01/39 | | | | 63,113 | |
| Puerto Rico Commonwealth GO Bonds Refunding for Public
Improvement Series 2012 A (D/Caa3) |
|
| | 110,000 | | | | 4.000 | | | | 07/01/21 | | | | 49,090 | |
| | 140,000 | | | | 4.500 | (d) | | | 07/01/26 | | | | 63,875 | |
| | 1,210,000 | | | | 5.500 | (d) | | | 07/01/26 | | | | 565,675 | |
| | 390,000 | | | | 5.000 | (d) | | | 07/01/41 | | | | 176,963 | |
| Puerto Rico Commonwealth GO Bonds Refunding Public
Improvement Series 2009 B (D/Caa3)(d) |
|
| | 1,385,000 | | | | 5.750 | | | | 07/01/38 | | | | 633,637 | |
| | Puerto Rico Commonwealth GO Bonds Series 2008 A (D/Caa3)(d) | |
| | 1,315,000 | | | | 5.375 | | | | 07/01/33 | | | | 604,900 | |
| | Puerto Rico Commonwealth GO Bonds Series 2014 A (D/Caa3)(d) | |
| | 3,205,000 | | | | 8.000 | | | | 07/01/35 | | | | 1,554,425 | |
| Puerto Rico Sales Tax Financing Corp. Sales Tax RB
SubSeries 2009 A (D/Ca)(d) |
|
| | 4,600,000 | | | | 5.500 | | | | 08/01/22 | | | | 954,500 | |
| | 4,210,000 | | | | 5.250 | | | | 08/01/27 | | | | 873,575 | |
| | 2,035,000 | | | | 6.750 | | | | 08/01/32 | | | | 427,350 | |
| | 3,005,000 | | | | 5.750 | | | | 08/01/37 | | | | 623,537 | |
| | 2,370,000 | | | | 6.000 | | | | 08/01/42 | | | | 491,775 | |
| Puerto Rico Sales Tax Financing Corp. Sales Tax RB
SubSeries 2010 A (D/Ca)(d) |
|
| | 40,000 | | | | 4.500 | | | | 08/01/21 | | | | 8,301 | |
| | 4,005,000 | | | | 5.500 | | | | 08/01/37 | | | | 831,037 | |
| | 490,000 | | | | 5.375 | | | | 08/01/39 | | | | 101,675 | |
| | 310,000 | | | | 5.500 | | | | 08/01/42 | | | | 64,325 | |
| Puerto Rico Sales Tax Financing Corp. Sales Tax RB
SubSeries 2010 C (D/Ca)(d) |
|
| | 70,000 | | | | 5.000 | | | | 08/01/35 | | | | 14,525 | |
| | 25,000 | | | | 5.375 | | | | 08/01/36 | | | | 5,188 | |
| | 25,000 | | | | 5.375 | | | | 08/01/38 | | | | 5,188 | |
| | 1,620,000 | | | | 5.500 | | | | 08/01/40 | | | | 336,150 | |
| | 1,955,000 | | | | 5.250 | | | | 08/01/41 | | | | 405,662 | |
| Puerto Rico Sales Tax Financing Corp. Sales Tax RB
SubSeries 2011 A-1 (D/Ca)(d) |
|
| | 780,000 | | | | 5.000 | | | | 08/01/43 | | | | 161,850 | |
| | 450,000 | | | | 5.250 | | | | 08/01/43 | | | | 93,375 | |
| | |
| | TOTAL MUNICIPAL DEBT OBLIGATIONS | |
| | (Cost $25,187,400) | | | $ | 10,907,353 | |
| | |
| | | | | | | | | | | | | | |
| U.S. Treasury Obligations – 1.7% | |
| | United States Treasury Bonds(l) | |
| $ | 1,600,000 | | | | 2.875 | | | | 08/15/45 | | | $ | 1,608,160 | |
| | 10,440,000 | | | | 2.875 | | | | 11/15/46 | | | | 10,478,628 | |
| | United States Treasury Notes | |
| | 1,900,000 | | | | 1.125 | (l) | | | 07/31/21 | | | | 1,853,849 | |
| | 1,540,000 | | | | 2.250 | (l) | | | 01/31/24 | | | | 1,553,691 | |
| | 23,980,000 | | | | 2.000 | | | | 09/30/24 | | | | 23,921,729 | |
| | |
| | TOTAL U.S. TREASURY OBLIGATIONS | |
| | (Cost $39,244,399) | | | $ | 39,416,057 | |
| | |
| | | | | | | | | | |
| Shares | | | Distribution
Rate | | | Value | |
| Investment Company(m) – 2.6% | |
| Goldman Sachs Financial Square Government Fund –
Institutional Shares |
|
| | 61,042,705 | | | | 0.927 | % | | $ | 61,042,705 | |
| | (Cost $61,042,705) | |
| | |
| | TOTAL INVESTMENTS – 95.6% | |
| | (Cost $ 2,169,828,667) | | | $ | 2,220,982,903 | |
| | |
| | | | | | | | | | | | | | |
Principal
Amount | | | Interest Rate (Paid)
Received | | | Maturity
Date | | | Value | |
| Reverse Repurchase Agreement – 0.1% | |
| | Citigroup Reverse Repurchase Agreement (NR/NR) | |
| $ | (3,240,000 | ) | | | (0.500 | )% | | | 06/05/18 | | | $ | (3,240,000 | ) |
| | |
| OTHER ASSETS IN EXCESS OF
OTHER LIABILITIES – 4.5% |
| | | 105,610,401 | |
| | |
| | NET ASSETS – 100.0% | | | $ | 2,323,353,304 | |
| | |
| | |
| 66 | | The accompanying notes are an integral part of these financial statements. |
GOLDMAN SACHS EMERGING MARKETS DEBT FUND
| | |
| The percentage shown for each investment category reflects the value of investments in that category as a percentage of net assets. |
(a) | | Variable rate security. Interest rate or distribution rate disclosed is that which is in effect on September 30, 2017. |
(b) | | Exempt from registration under Rule 144A of the Securities Act of 1933. Such securities may be deemed liquid by the investment adviser and may be resold, normally to qualified institutional buyers in transactions exempt from registration. Total market value of Rule 144A securities amounts to $608,388,769, which represents approximately 26.2% of net assets as of September 30, 2017. |
(c) | | Coupon changes periodically based upon a predetermined schedule. Interest rate disclosed is that which is in effect on September 30, 2017. |
(d) | | Security with “Call” features with resetting interest rates. Maturity dates disclosed are the final maturity dates. |
(e) | | Issued with a zero coupon. Income is recognized through the accretion of discount. |
(f) | | All or a portion of the security was pledged as collateral against open reverse repurchase agreements. As of September 30, 2017, the value of securities pledged amounted to $3,207,000. |
(g) | | Security with “Put” features and resetting interest rates. Maturity dates disclosed are the puttable dates. Interest rate disclosed is that which is in effect at September 30, 2017. |
(h) | | Guaranteed by a foreign government until maturity. Total market value of these securities amounts to $32,240,442, which represents approximately 1.4% of net assets as of September 30, 2017. |
(i) | | Significant unobservable inputs were used in the valuation of this portfolio security; i.e. Level 3. |
(j) | | Security is currently in default and/or non-income producing. |
(k) | | Pay-in-kind securities. |
(l) | | A portion of this security is segragated as collateral for initial margin requirement on futures transactions. |
(m) | | Represents an Affiliated Issuer. |
Security ratings disclosed, if any, are obtained from by Standard & Poor’s/Moody’s Investor Service and are unaudited. A brief description of the ratings is available in the Fund’s Statement of Additional Information.
| | |
|
Currency Abbreviations: |
ARS | | —Argentine Peso |
BRL | | —Brazilian Real |
CLP | | —Chilean Peso |
CNH | | —Chinese Yuan Renminbi Offshore |
CNY | | —Chinese Yuan Renminbi |
COP | | —Colombian Peso |
CZK | | —Czech Koruna |
DOP | | —Dominican Peso |
EGP | | —Egyptian Pound |
EUR | | —Euro |
HKD | | —Hong Kong Dollar |
HUF | | —Hungarian Forint |
IDR | | —Indonesian Rupiah |
INR | | —Indian Rupee |
KRW | | —South Korean Won |
MXN | | —Mexican Peso |
PEN | | —Peruvian Nuevo Sol |
PHP | | —Philippine Peso |
PLN | | —Polish Zloty |
RUB | | —Russian Ruble |
SGD | | —Singapore Dollar |
THB | | —Thai Baht |
TRY | | —Turkish Lira |
TWD | | —Taiwan Dollar |
USD | | —U.S. Dollar |
ZAR | | —South African Rand |
| | |
Investment Abbreviations: |
CMT | | —Constant Maturity Treasury Indexes |
EURO | | —Euro Offered Rate |
GO | | —General Obligation |
KWCDC | | —South Korean Won Certificate of Deposit |
LIBOR | | —London Interbank Offered Rate |
LLC | | —Limited Liability Company |
MTN | | —Medium Term Note |
NR | | —Not Rated |
PLC | | —Public Limited Company |
RB | | —Revenue Bond |
TIIE | | —La Tasa de Interbank Equilibrium Interest Rate |
WIBOR | | —Warsaw Interbank Offered Rate |
|
|
| ADDITIONAL INVESTMENT INFORMATION |
FORWARD FOREIGN CURRENCY EXCHANGE CONTRACTS — At September 30, 2017, the Fund had the following forward foreign currency exchange contracts:
FORWARD FOREIGN CURRENCY EXCHANGE CONTRACTS WITH UNREALIZED GAIN
| | | | | | | | | | | | | | | | | | | | | | | | |
| Counterparty | | Currency
Purchased | | | Currency
Sold | | | Current
Value | | | Settlement
Date | | | Unrealized
Gain | |
Morgan Stanley & Co. International PLC | | ARS | | | 24,465,143 | | | USD | | | 1,400,409 | | | $ | 1,404,348 | | | | 10/11/17 | | | $ | 3,938 | |
| | ARS | | | 12,178,146 | | | USD | | | 696,491 | | | | 698,649 | | | | 10/12/17 | | | | 2,156 | |
| | ARS | | | 64,636,787 | | | USD | | | 3,642,433 | | | | 3,684,897 | | | | 10/23/17 | | | | 42,465 | |
| | ARS | | | 60,955,065 | | | USD | | | 3,470,652 | | | | 3,471,047 | | | | 10/25/17 | | | | 395 | |
| | ARS | | | 47,479,464 | | | USD | | | 2,652,357 | | | | 2,696,012 | | | | 10/30/17 | | | | 43,654 | |
| | ARS | | | 50,354,078 | | | USD | | | 2,824,715 | | | | 2,856,105 | | | | 11/02/17 | | | | 31,390 | |
| | ARS | | | 61,489,943 | | | USD | | | 3,464,222 | | | | 3,476,299 | | | | 11/08/17 | | | | 12,077 | |
| | ARS | | | 18,674,920 | | | USD | | | 1,050,333 | | | | 1,052,899 | | | | 11/13/17 | | | | 2,566 | |
| | ARS | | | 43,417,727 | | | USD | | | 2,436,461 | | | | 2,442,583 | | | | 11/17/17 | | | | 6,122 | |
| | BRL | | | 46,889,053 | | | USD | | | 14,730,947 | | | | 14,798,202 | | | | 10/03/17 | | | | 67,255 | |
| | BRL | | | 121,886,522 | | | USD | | | 38,020,138 | | | | 38,302,176 | | | | 11/03/17 | | | | 282,038 | |
| | CNH | | | 98,662,115 | | | USD | | | 14,733,551 | | | | 14,771,473 | | | | 12/20/17 | | | | 37,921 | |
| | |
| The accompanying notes are an integral part of these financial statements. | | 67 |
GOLDMAN SACHS EMERGING MARKETS DEBT FUND
Schedule of Investments (continued)
September 30, 2017 (Unaudited)
|
| ADDITIONAL INVESTMENT INFORMATION (continued) |
FORWARD FOREIGN CURRENCY EXCHANGE CONTRACTS WITH UNREALIZED GAIN (continued)
| | | | | | | | | | | | | | | | | | | | | | | | |
| Counterparty | | Currency
Purchased | | | Currency
Sold | | | Current
Value | | | Settlement
Date | | | Unrealized
Gain | |
Morgan Stanley & Co. International PLC (continued) | | CZK | | | 341,190,975 | | | EUR | | | 12,802,888 | | | $ | 15,523,140 | | | | 10/03/17 | | | $ | 388,934 | |
| | CZK | | | 166,104,433 | | | EUR | | | 6,221,000 | | | | 7,571,867 | | | | 11/09/17 | | | | 203,536 | |
| | CZK | | | 220,727,861 | | | EUR | | | 8,251,275 | | | | 10,068,485 | | | | 11/21/17 | | | | 289,067 | |
| | CZK | | | 409,520,800 | | | EUR | | | 15,665,597 | | | | 18,681,282 | | | | 11/22/17 | | | | 113,397 | |
| | CZK | | | 1,467,276,747 | | | EUR | | | 56,393,615 | | | | 67,116,529 | | | | 12/20/17 | | | | 157,044 | |
| | CZK | | | 341,556,358 | | | EUR | | | 12,804,522 | | | | 15,644,293 | | | | 01/03/18 | | | | 427,917 | |
| | EUR | | | 3,207,000 | | | HUF | | | 994,352,190 | | | | 3,807,861 | | | | 12/20/17 | | | | 21,956 | |
| | EUR | | | 4,566,469 | | | PLN | | | 19,612,366 | | | | 5,422,039 | | | | 12/20/17 | | | | 46,053 | |
| | EUR | | | 16,133,176 | | | USD | | | 19,023,273 | | | | 19,080,322 | | | | 10/12/17 | | | | 57,049 | |
| | HKD | | | 80,098,044 | | | USD | | | 10,251,946 | | | | 10,254,479 | | | | 10/03/17 | | | | 2,533 | |
| | HKD | | | 85,506,357 | | | USD | | | 10,981,000 | | | | 10,990,211 | | | | 03/27/18 | | | | 9,211 | |
| | IDR | | | 106,421,375,197 | | | USD | | | 7,827,708 | | | | 7,878,766 | | | | 11/02/17 | | | | 51,058 | |
| | IDR | | | 153,265,035,009 | | | USD | | | 11,228,208 | | | | 11,286,224 | | | | 12/20/17 | | | | 58,016 | |
| | INR | | | 151,894,238 | | | USD | | | 2,312,000 | | | | 2,314,015 | | | | 11/03/17 | | | | 2,015 | |
| | KRW | | | 3,738,865,303 | | | USD | | | 3,265,385 | | | | 3,265,620 | | | | 10/12/17 | | | | 236 | |
| | KRW | | | 825,863,592 | | | USD | | | 721,253 | | | | 721,384 | | | | 10/25/17 | | | | 131 | |
| | PHP | | | 316,162,598 | | | USD | | | 6,170,480 | | | | 6,210,173 | | | | 10/10/17 | | | | 39,693 | |
| | PHP | | | 193,799,954 | | | USD | | | 3,794,791 | | | | 3,804,345 | | | | 10/19/17 | | | | 9,555 | |
| | PHP | | | 575,932,263 | | | USD | | | 11,228,939 | | | | 11,284,824 | | | | 11/14/17 | | | | 55,885 | |
| | PLN | | | 14,143,386 | | | EUR | | | 3,265,000 | | | | 3,876,872 | | | | 12/20/17 | | | | 145 | |
| | PLN | | | 10,411,588 | | | HUF | | | 746,683,498 | | | | 2,853,942 | | | | 12/20/17 | | | | 11,013 | |
| | RUB | | | 1,263,922,013 | | | USD | | | 21,507,000 | | | | 21,632,894 | | | | 12/14/17 | | | | 125,894 | |
| | SGD | | | 2,092,247 | | | USD | | | 1,542,000 | | | | 1,543,843 | | | | 12/20/17 | | | | 1,843 | |
| | TRY | | | 28,095,979 | | | USD | | | 7,669,686 | | | | 7,701,284 | | | | 12/20/17 | | | | 31,598 | |
| | TWD | | | 209,964,335 | | | USD | | | 6,877,087 | | | | 6,915,707 | | | | 10/20/17 | | | | 38,621 | |
| | TWD | | | 146,567,907 | | | USD | | | 4,822,200 | | | | 4,829,017 | | | | 10/26/17 | | | | 6,817 | |
| | USD | | | 15,262,000 | | | BRL | | | 47,986,264 | | | | 15,144,481 | | | | 10/03/17 | | | | 117,519 | |
| | USD | | | 1,812,327 | | | BRL | | | 5,764,105 | | | | 1,811,339 | | | | 11/03/17 | | | | 988 | |
| | USD | | | 3,813,000 | | | CLP | | | 2,355,949,749 | | | | 3,680,130 | | | | 10/12/17 | | | | 132,870 | |
| | USD | | | 3,794,577 | | | CLP | | | 2,374,585,342 | | | | 3,708,887 | | | | 10/16/17 | | | | 85,689 | |
| | USD | | | 25,215,236 | | | CNH | | | 167,578,795 | | | | 25,089,525 | | | | 12/20/17 | | | | 125,711 | |
| | USD | | | 1,797,533 | | | CNY | | | 11,981,274 | | | | 1,797,515 | | | | 11/10/17 | | | | 18 | |
| | USD | | | 3,822,000 | | | COP | | | 11,174,037,420 | | | | 3,792,186 | | | | 10/25/17 | | | | 29,814 | |
| | USD | | | 13,450,043 | | | EUR | | | 11,221,431 | | | | 13,271,318 | | | | 10/12/17 | | | | 178,724 | |
| | USD | | | 59,113,328 | | | EUR | | | 49,220,499 | | | | 58,442,419 | | | | 12/20/17 | | | | 670,909 | |
| | USD | | | 13,950,645 | | | HKD | | | 108,084,016 | | | | 13,837,358 | | | | 10/03/17 | | | | 113,287 | |
| | USD | | | 15,064,741 | | | HKD | | | 116,930,426 | | | | 14,972,726 | | | | 10/10/17 | | | | 92,015 | |
| | USD | | | 49,870,661 | | | HKD | | | 386,198,111 | | | | 49,638,400 | | | | 03/27/18 | | | | 232,261 | |
| | USD | | | 13,641,000 | | | HKD | | | 105,665,437 | | | | 13,591,527 | | | | 05/11/18 | | | | 49,473 | |
| | USD | | | 19,105,000 | | | HKD | | | 148,219,191 | | | | 19,098,196 | | | | 09/19/18 | | | | 6,804 | |
| | USD | | | 8,622,161 | | | IDR | | | 114,028,799,553 | | | | 8,458,469 | | | | 10/10/17 | | | | 163,693 | |
| | USD | | | 1,262,803 | | | IDR | | | 16,970,804,700 | | | | 1,258,209 | | | | 10/16/17 | | | | 4,594 | |
| | USD | | | 11,465,000 | | | IDR | | | 152,349,442,300 | | | | 11,293,164 | | | | 10/18/17 | | | | 171,836 | |
| | USD | | | 3,721,699 | | | INR | | | 243,213,038 | | | | 3,719,341 | | | | 10/05/17 | | | | 2,358 | |
| | USD | | | 8,697,877 | | | INR | | | 557,038,158 | | | | 8,511,405 | | | | 10/10/17 | | | | 186,472 | |
| | USD | | | 29,598,542 | | | INR | | | 1,901,764,112 | | | | 29,027,631 | | | | 10/18/17 | | | | 570,911 | |
| | USD | | | 7,573,807 | | | INR | | | 491,947,808 | | | | 7,501,889 | | | | 10/25/17 | | | | 71,918 | |
| | USD | | | 12,183,234 | | | KRW | | | 13,894,977,979 | | | | 12,132,854 | | | | 10/02/17 | | | | 50,379 | |
| | USD | | | 23,546,303 | | | KRW | | | 26,874,419,011 | | | | 23,472,534 | | | | 10/10/17 | | | | 73,769 | |
| | USD | | | 14,982,281 | | | KRW | | | 16,943,571,199 | | | | 14,798,946 | | | | 10/12/17 | | | | 183,335 | |
| | USD | | | 5,308,253 | | | KRW | | | 6,015,370,134 | | | | 5,254,366 | | | | 10/25/17 | | | | 53,887 | |
| | |
| 68 | | The accompanying notes are an integral part of these financial statements. |
GOLDMAN SACHS EMERGING MARKETS DEBT FUND
|
| ADDITIONAL INVESTMENT INFORMATION (continued) |
FORWARD FOREIGN CURRENCY EXCHANGE CONTRACTS WITH UNREALIZED GAIN (continued)
| | | | | | | | | | | | | | | | | | | | | | | | |
| Counterparty | | Currency
Purchased | | | Currency
Sold | | | Current
Value | | | Settlement
Date | | | Unrealized
Gain | |
Morgan Stanley & Co. International PLC (continued) | | USD | | | 1,882,963 | | | KRW | | | 2,155,220,666 | | | $ | 1,882,837 | | | | 11/10/17 | | | $ | 126 | |
| | USD | | | 30,658,129 | | | MXN | | | 549,070,536 | | | | 30,120,881 | | | | 10/06/17 | | | | 537,248 | |
| | USD | | | 30,521,781 | | | MXN | | | 551,061,939 | | | | 29,871,119 | | | | 12/20/17 | | | | 650,660 | |
| | USD | | | 3,382,424 | | | PHP | | | 172,025,463 | | | | 3,378,982 | | | | 10/10/17 | | | | 3,442 | |
| | USD | | | 7,659,000 | | | PHP | | | 388,727,882 | | | | 7,627,187 | | | | 10/26/17 | | | | 31,813 | |
| | USD | | | 1,542,000 | | | PHP | | | 78,479,165 | | | | 1,539,169 | | | | 11/02/17 | | | | 2,831 | |
| | USD | | | 14,249,947 | | | RUB | | | 829,068,469 | | | | 14,190,076 | | | | 12/14/17 | | | | 59,870 | |
| | USD | | | 19,661,480 | | | SGD | | | 26,419,886 | | | | 19,494,905 | | | | 12/20/17 | | | | 166,575 | |
| | USD | | | 3,847,000 | | | THB | | | 128,191,927 | | | | 3,844,104 | | | | 10/11/17 | | | | 2,896 | |
| | USD | | | 31,316,188 | | | TRY | | | 112,543,919 | | | | 30,848,996 | | | | 12/20/17 | | | | 467,192 | |
| | USD | | | 10,140,988 | | | TWD | | | 302,911,982 | | | | 9,983,915 | | | | 10/02/17 | | | | 157,073 | |
| | USD | | | 1,531,000 | | | TWD | | | 45,907,035 | | | | 1,511,990 | | | | 10/19/17 | | | | 19,010 | |
| | USD | | | 58,835,252 | | | TWD | | | 1,774,262,056 | | | | 58,439,817 | | | | 10/20/17 | | | | 395,434 | |
| | USD | | | 20,394,404 | | | TWD | | | 614,462,868 | | | | 20,241,892 | | | | 10/23/17 | | | | 152,512 | |
| | USD | | | 10,639,453 | | | TWD | | | 321,364,682 | | | | 10,588,099 | | | | 10/26/17 | | | | 51,354 | |
| | USD | | | 1,865,036 | | | TWD | | | 56,531,107 | | | | 1,862,916 | | | | 10/31/17 | | | | 2,120 | |
| | USD | | | 25,390,894 | | | ZAR | | | 341,449,125 | | | | 25,036,415 | | | | 11/14/17 | | | | 354,479 | |
| | USD | | | 1,795,863 | | | ZAR | | | 24,611,066 | | | | 1,794,250 | | | | 12/20/17 | | | | 1,613 | |
| | | ZAR | | | 158,858,237 | | | USD | | | 11,540,000 | | | | 11,581,430 | | | | 12/20/17 | | | | 41,430 | |
| TOTAL | | | | | | | | | | | $ | 9,148,106 | |
FORWARD FOREIGN CURRENCY EXCHANGE CONTRACTS WITH UNREALIZED LOSS
| | | | | | | | | | | | | | | | | | | | | | | | |
| Counterparty | | Currency
Purchased | | | Currency
Sold | | | Current
Value | | | Settlement
Date | | | Unrealized
Loss | |
Morgan Stanley & Co. International PLC | | BRL | | | 114,599,178 | | | USD | | | 36,530,886 | | | $ | 36,167,540 | | | | 10/03/17 | | | $ | (363,347 | ) |
| | BRL | | | 75,911 | | | USD | | | 24,130 | | | | 23,855 | | | | 11/03/17 | | | | (275 | ) |
| | CNH | | | 146,825,867 | | | USD | | | 22,172,000 | | | | 21,982,444 | | | | 12/20/17 | | | | (189,556 | ) |
| | CNY | | | 51,040,422 | | | USD | | | 7,737,778 | | | | 7,666,402 | | | | 10/26/17 | | | | (71,376 | ) |
| | CNY | | | 41,349,579 | | | USD | | | 6,239,092 | | | | 6,188,605 | | | | 12/14/17 | | | | (50,486 | ) |
| | COP | | | 19,590,805,512 | | | USD | | | 6,735,244 | | | | 6,648,624 | | | | 10/25/17 | | | | (86,620 | ) |
| | EUR | | | 13,112,643 | | | CZK | | | 341,190,975 | | | | 15,500,366 | | | | 10/03/17 | | | | (22,774 | ) |
| | EUR | | | 1,029,633 | | | USD | | | 1,225,809 | | | | 1,217,722 | | | | 10/12/17 | | | | (8,087 | ) |
| | HKD | | | 27,985,971 | | | USD | | | 3,583,122 | | | | 3,582,878 | | | | 10/03/17 | | | | (243 | ) |
| | HUF | | | 1,020,382,272 | | | EUR | | | 3,276,000 | | | | 3,885,012 | | | | 12/20/17 | | | | (4,776 | ) |
| | HUF | | | 4,960,156,326 | | | USD | | | 19,532,019 | | | | 18,885,343 | | | | 12/20/17 | | | | (646,676 | ) |
| | IDR | | | 153,265,035,009 | | | USD | | | 11,454,508 | | | | 11,373,968 | | | | 10/05/17 | | | | (80,540 | ) |
| | IDR | | | 157,845,898,662 | | | USD | | | 11,829,653 | | | | 11,708,749 | | | | 10/10/17 | | | | (120,904 | ) |
| | IDR | | | 185,707,263,895 | | | USD | | | 13,844,595 | | | | 13,768,265 | | | | 10/16/17 | | | | (76,329 | ) |
| | IDR | | | 86,178,591,873 | | | USD | | | 6,460,779 | | | | 6,383,692 | | | | 10/26/17 | | | | (77,087 | ) |
| | IDR | | | 103,761,876,190 | | | USD | | | 7,693,000 | | | | 7,683,504 | | | | 10/31/17 | | | | (9,496 | ) |
| | IDR | | | 129,914,612,569 | | | USD | | | 9,644,737 | | | | 9,603,789 | | | | 11/16/17 | | | | (40,949 | ) |
| | INR | | | 243,213,038 | | | USD | | | 3,797,000 | | | | 3,719,341 | | | | 10/05/17 | | | | (77,659 | ) |
| | INR | | | 1,190,843,376 | | | USD | | | 18,514,768 | | | | 18,195,791 | | | | 10/10/17 | | | | (318,976 | ) |
| | INR | | | 2,292,416,675 | | | USD | | | 35,560,965 | | | | 34,990,366 | | | | 10/18/17 | | | | (570,598 | ) |
| | INR | | | 1,550,216,347 | | | USD | | | 23,801,879 | | | | 23,639,807 | | | | 10/25/17 | | | | (162,071 | ) |
| | INR | | | 1,561,271,944 | | | USD | | | 23,961,731 | | | | 23,805,241 | | | | 10/26/17 | | | | (156,490 | ) |
| | INR | | | 243,213,038 | | | USD | | | 3,707,798 | | | | 3,705,200 | | | | 11/03/17 | | | | (2,598 | ) |
| | KRW | | | 13,894,977,979 | | | USD | | | 12,361,601 | | | | 12,132,855 | | | | 10/02/17 | | | | (228,747 | ) |
| | |
| The accompanying notes are an integral part of these financial statements. | | 69 |
GOLDMAN SACHS EMERGING MARKETS DEBT FUND
Schedule of Investments (continued)
September 30, 2017 (Unaudited)
|
| ADDITIONAL INVESTMENT INFORMATION (continued) |
FORWARD FOREIGN CURRENCY EXCHANGE CONTRACTS WITH UNREALIZED LOSS (continued)
| | | | | | | | | | | | | | | | | | | | | | | | |
| Counterparty | | Currency
Purchased | | | Currency
Sold | | | Current
Value | | | Settlement
Date | | | Unrealized
Loss | |
Morgan Stanley & Co. International PLC (continued) | | KRW | | | 26,874,419,011 | | | USD | | | 23,841,326 | | | $ | 23,472,534 | | | | 10/10/17 | | | $ | (368,791 | ) |
| | KRW | | | 13,204,705,896 | | | USD | | | 11,685,786 | | | | 11,533,326 | | | | 10/12/17 | | | | (152,461 | ) |
| | KRW | | | 22,152,746,482 | | | USD | | | 19,511,312 | | | | 19,350,206 | | | | 10/25/17 | | | | (161,106 | ) |
| | KRW | | | 36,825,938,232 | | | USD | | | 32,285,954 | | | | 32,176,255 | | | | 11/22/17 | | | | (109,699 | ) |
| | MXN | | | 357,155,598 | | | USD | | | 19,998,522 | | | | 19,592,822 | | | | 10/06/17 | | | | (405,699 | ) |
| | MXN | | | 1,250,952,490 | | | USD | | | 69,371,335 | | | | 67,809,716 | | | | 12/20/17 | | | | (1,561,621 | ) |
| | PEN | | | 12,251,852 | | | USD | | | 3,773,000 | | | | 3,752,391 | | | | 10/05/17 | | | | (20,609 | ) |
| | PEN | | | 24,667,460 | | | USD | | | 7,614,000 | | | | 7,553,690 | | | | 10/10/17 | | | | (60,310 | ) |
| | PEN | | | 24,258,078 | | | USD | | | 7,436,566 | | | | 7,405,856 | | | | 12/14/17 | | | | (30,710 | ) |
| | PLN | | | 263,970,751 | | | EUR | | | 61,788,346 | | | | 72,357,560 | | | | 12/20/17 | | | | (1,007,409 | ) |
| | PLN | | | 100,636,472 | | | USD | | | 28,299,674 | | | | 27,585,668 | | | | 12/20/17 | | | | (714,006 | ) |
| | RUB | | | 3,299,139,725 | | | USD | | | 56,639,241 | | | | 56,467,043 | | | | 12/14/17 | | | | (172,198 | ) |
| | SGD | | | 27,126,387 | | | USD | | | 20,161,731 | | | | 20,016,225 | | | | 12/20/17 | | | | (145,507 | ) |
| | THB | | | 126,088,284 | | | USD | | | 3,813,000 | | | | 3,781,022 | | | | 10/11/17 | | | | (31,978 | ) |
| | TRY | | | 104,761,115 | | | USD | | | 29,529,703 | | | | 28,715,678 | | | | 12/20/17 | | | | (814,024 | ) |
| | TWD | | | 399,589,119 | | | USD | | | 13,294,820 | | | | 13,170,373 | | | | 10/02/17 | | | | (124,447 | ) |
| | TWD | | | 113,576,760 | | | USD | | | 3,784,000 | | | | 3,740,507 | | | | 10/05/17 | | | | (43,493 | ) |
| | TWD | | | 682,962,714 | | | USD | | | 22,585,767 | | | | 22,495,107 | | | | 10/20/17 | | | | (90,660 | ) |
| | TWD | | | 187,658,986 | | | USD | | | 6,235,050 | | | | 6,181,940 | | | | 10/23/17 | | | | (53,110 | ) |
| | TWD | | | 336,888,348 | | | USD | | | 11,131,040 | | | | 11,099,562 | | | | 10/26/17 | | | | (31,477 | ) |
| | USD | | | 35,549,565 | | | BRL | | | 113,501,966 | | | | 35,821,260 | | | | 10/03/17 | | | | (271,695 | ) |
| | USD | | | 1,687,455 | | | CNH | | | 11,301,731 | | | | 1,692,070 | | | | 12/20/17 | | | | (4,615 | ) |
| | USD | | | 8,101,659 | | | CNY | | | 54,167,289 | | | | 8,126,556 | | | | 11/10/17 | | | | (24,897 | ) |
| | USD | | | 3,077,000 | | | COP | | | 9,086,064,069 | | | | 3,081,468 | | | | 10/31/17 | | | | (4,468 | ) |
| | USD | | | 193,441,992 | | | EUR | | | 164,101,331 | | | | 194,078,729 | | | | 10/12/17 | | | | (636,737 | ) |
| | USD | | | 11,331,980 | | | IDR | | | 153,265,035,009 | | | | 11,373,968 | | | | 10/05/17 | | | | (41,988 | ) |
| | USD | | | 9,972,864 | | | INR | | | 658,350,853 | | | | 10,029,568 | | | | 11/03/17 | | | | (56,704 | ) |
| | USD | | | 18,872,659 | | | KRW | | | 21,675,547,504 | | | | 18,936,121 | | | | 11/10/17 | | | | (63,462 | ) |
| | USD | | | 3,266,697 | | | KRW | | | 3,738,865,303 | | | | 3,266,792 | | | | 11/22/17 | | | | (95 | ) |
| | USD | | | 3,832,000 | | | PHP | | | 196,243,043 | | | | 3,852,304 | | | | 10/19/17 | | | | (20,304 | ) |
| | USD | | | 3,829,000 | | | PHP | | | 195,682,960 | | | | 3,841,047 | | | | 10/20/17 | | | | (12,047 | ) |
| | USD | | | 3,847,000 | | | PHP | | | 196,633,788 | | | | 3,858,130 | | | | 10/26/17 | | | | (11,130 | ) |
| | USD | | | 22,988,422 | | | RUB | | | 1,354,037,026 | | | | 23,175,274 | | | | 12/14/17 | | | | (186,852 | ) |
| | USD | | | 19,201,912 | | | SGD | | | 26,151,252 | | | | 19,296,684 | | | | 12/20/17 | | | | (94,772 | ) |
| | USD | | | 2,308,000 | | | TRY | | | 8,421,177 | | | | 2,308,297 | | | | 12/20/17 | | | | (297 | ) |
| | USD | | | 3,186,458 | | | TWD | | | 96,677,137 | | | | 3,186,458 | | | | 10/02/17 | | | | — | |
| | USD | | | 3,732,394 | | | TWD | | | 113,576,760 | | | | 3,740,507 | | | | 10/05/17 | | | | (8,113 | ) |
| | USD | | | 9,159,082 | | | TWD | | | 279,690,883 | | | | 9,212,328 | | | | 10/20/17 | | | | (53,246 | ) |
| | USD | | | 8,101,659 | | | TWD | | | 246,480,020 | | | | 8,122,457 | | | | 10/31/17 | | | | (20,798 | ) |
| | | ZAR | | | 547,953,304 | | | USD | | | 41,347,763 | | | | 39,948,091 | | | | 12/20/17 | | | | (1,399,671 | ) |
| TOTAL | | | | | | | | | | | $ | (12,377,866 | ) |
| | |
| 70 | | The accompanying notes are an integral part of these financial statements. |
GOLDMAN SACHS EMERGING MARKETS DEBT FUND
|
| ADDITIONAL INVESTMENT INFORMATION (continued) |
FUTURES CONTRACTS — At September 30, 2017, the Fund had the following futures contracts:
| | | | | | | | | | | | | | |
| Description | | Number of
Contracts | | | Expiration
Date | | Notional
Amount | | | Unrealized
Appreciation/
(Depreciation) | |
Long position contracts: | | | | | | | | | | | | | | |
Ultra Long U.S. Treasury Bonds | | | 424 | | | 12/19/17 | | $ | 70,013,000 | | | $ | (1,204,894 | ) |
2 Year U.S. Treasury Notes | | | 707 | | | 12/29/17 | | | 152,502,110 | | | | (291,490 | ) |
5 Year U.S. Treasury Notes | | | 1,566 | | | 12/29/17 | | | 184,005,000 | | | | (845,222 | ) |
20 Year U.S. Treasury Bonds | | | 526 | | | 12/19/17 | | | 80,379,375 | | | | (1,392,736 | ) |
| Total | | | | | | | | | | | | $ | (3,734,342 | ) |
Short position contracts: | | | | | | | | | | | | | | |
Eurodollars | | | (467 | ) | | 12/17/18 | | | (114,572,613 | ) | | | (41,595 | ) |
10 Year U.S. Treasury Notes | | | (643 | ) | | 12/19/17 | | | (80,575,937 | ) | | | 370,589 | |
| Total | | | | | | | | | | | | $ | 328,994 | |
| TOTAL | | | $ | (3,405,348 | ) |
SWAP CONTRACTS — At September 30, 2017, the Fund had the following swap contracts:
OVER THE COUNTER INTEREST RATE SWAP CONTRACTS
| | | | | | | | | | | | | | | | | | |
Payments Made by the
Fund | | Payments
Received by
the Fund | | | Counterparty | | Termination
Date | | | Notional
Amount | | | Unrealized
Appreciation/
(Depreciation)* | |
3M KWCDC(a) | | | 2.239 | % | | MS & Co. Int. PLC | | | 10/06/17 | | | KRW | 18,832,760 | | | $ | 37,187 | |
| | | 2.250 | | | MS & Co. Int. PLC | | | 10/13/17 | | | | 767,460 | | | | 1,457 | |
| | | 2.245 | | | MS & Co. Int. PLC | | | 10/14/17 | | | | 3,709,820 | | | | 7,153 | |
| | | 2.250 | | | MS & Co. Int. PLC | | | 10/14/17 | | | | 3,709,830 | | | | 7,195 | |
| | | 2.240 | | | MS & Co. Int. PLC | | | 10/14/17 | | | | 4,044,740 | | | | 7,752 | |
| | | 2.060 | | | MS & Co. Int. PLC | | | 11/04/17 | | | | 7,739,660 | | | | 11,719 | |
1M BID Avg(b) | | | 14.460 | | | MS & Co. Int. PLC | | | 01/02/18 | | | BRL | 8,360 | | | | 109,828 | |
5.180%(b) | | | Mexico IB TIIE 28D | | | MS & Co. Int. PLC | | | 09/25/18 | | | MXN | 60,090 | | | | 68,422 | |
1M BID Avg(c) | | | 9.115 | | | MS & Co. Int. PLC | | | 01/02/20 | | | BRL | 46,940 | | | | 260,499 | |
11.743(c) | | | 1M BID Avg | | | MS & Co. Int. PLC | | | 01/04/21 | | | | 21,500 | | | | (489,054 | ) |
10.950(b) | | | 1M BID Avg | | | MS & Co. Int. PLC | | | 01/04/21 | | | | 59,390 | | | | (1,034,373 | ) |
Mexico IB TIIE 28D(b) | | | 6.930 | | | MS & Co. Int. PLC | | | 03/03/26 | | | MXN | 14,640 | | | | (4,106 | ) |
| TOTAL | | | | | | | | | | | | | | | | $ | (1,016,321 | ) |
| | * | | There are no upfront payments on the swap contracts, therefore the unrealized gain (loss) on the swap contracts is equal to their value. |
| | (a) | | Payments made quarterly. |
| | (b) | | Payments made monthly. |
| | (c) | | Payments made at maturity. |
| | |
| The accompanying notes are an integral part of these financial statements. | | 71 |
GOLDMAN SACHS EMERGING MARKETS DEBT FUND
Schedule of Investments (continued)
September 30, 2017 (Unaudited)
|
| ADDITIONAL INVESTMENT INFORMATION (continued) |
CENTRALLY CLEARED INTEREST RATE SWAP CONTRACTS
| | | | | | | | | | | | | | | | | | | | | | | | |
| Payments Made by the Fund | | Payments
Received
by Fund | | Termination
Date | | | Notional
Amount(a) | | | Value | | | Upfront
Premium
(Received)
Paid | | | Unrealized
Appreciation/
(Depreciation) | |
0.000%(b) | | 6M EURO(c) | | | 12/20/19 | | | EUR | | $ | 4,400 | | | $ | (13,313 | ) | | $ | (16,556 | ) | | $ | 3,243 | |
0.250(b) | | 6M EURO(c) | | | 12/20/20 | | | | | | 14,640 | | | | (126,842 | ) | | | (159,017 | ) | | | 32,175 | |
Mexico IB TIIE 28D(c) | | 6.750% | | | 12/14/22 | | | MXN | | | 1,324,450 | | | | (106,444 | ) | | | (41,133 | ) | | | (65,311 | ) |
0.250(b) | | 6M EURO(c) | | | 12/20/22 | | | EUR | | | 32,250 | | | | 106,821 | | | | 14,735 | | | | 92,086 | |
2.450(b) | | 6M WIBOR(c) | | | 12/20/22 | | | PLN | | | 69,000 | | | | 61,741 | | | | (137,662 | ) | | | 199,403 | |
0.500(b) | | 6M EURO(c) | | | 12/20/24 | | | EUR | | | 36,040 | | | | 259,970 | | | | (92,581 | ) | | | 352,551 | |
1.000(b) | | 6M EURO(c) | | | 12/20/27 | | | | | | 43,770 | | | | (210,869 | ) | | | (742,169 | ) | | | 531,300 | |
1.500(b) | | 6M EURO(c) | | | 12/20/37 | | | | | | 14,970 | | | | 69,450 | | | | (307,589 | ) | | | 377,039 | |
1.500(b) | | 6M EURO(c) | | | 12/20/47 | | | | | | 160 | | | | 5,326 | | | | (738 | ) | | | 6,064 | |
| TOTAL | | | | | | | | | | | | | | $ | 45,840 | | | $ | (1,482,710 | ) | | $ | 1,528,550 | |
| | (a) | | Represents forward starting interest rate swaps whose effective dates of commencement of accruals and cash flows occur subsequent to September 30, 2017. |
| | (b) | | Payments made annually. |
| | (c) | | Payments made semi-annually. |
| | (d) | | Payments made monthly. |
OVER THE COUNTER CREDIT DEFAULT SWAP CONTRACTS
| | | | | | | | | | | | | | | | | | | | | | | | | | | | |
| Reference Obligation/ Index(a) | | Financing Rate
Received
(Paid) by the Fund | | Credit Spread at
September 30,
2017(b) | | | Counterparty | | Termination
Date | | | Notional
Amount | | | Value | | | Upfront
Premiums
(Received)
Paid | | | Unrealized
Appreciation/
(Depreciation) | |
Protection Purchased: | | | | | | | | | | | | | | | | | | | | | | | | | | | | |
People’s Republic of China, 4.250% 10/28/17 | | (1.000)% | | | 0.191 | % | | BoA Securities LLC | | | 03/20/19 | | | $ | 1,100 | | | $ | (13,400 | ) | | $ | (610 | ) | | $ | (12,790 | )�� |
People’s Republic of China, 4.250% 10/28/17 | | (1.000) | | | 0.240 | | | BoA Securities LLC | | | 06/20/19 | | | | 2,680 | | | | (37,265 | ) | | | (5,659 | ) | | | (31,606 | ) |
People’s Republic of China, 7.500% 10/28/17 | | (1.000) | | | 0.447 | | | BoA Securities LLC | | | 12/20/20 | | | | 9,500 | | | | (188,914 | ) | | | 54,080 | | | | (242,994 | ) |
People’s Republic of China, 7.500% 10/28/17 | | (1.000) | | | 0.637 | | | BoA Securities LLC | | | 06/20/21 | | | | 8,370 | | | | (171,287 | ) | | | 73,019 | | | | (244,306 | ) |
| People’s Republic of China, 7.500% 10/28/17 | | (1.000) | | | 1.759 | | | BoA Securities LLC | | | 06/20/21 | | | | 4,300 | | | | (87,997 | ) | | | 29,775 | | | | (117,772 | ) |
| Republic of Turkey, 11.875%, 01/15/30 | | (1.000) | | | 0.191 | | | BoA Securities LLC | | | 12/20/21 | | | | 3,640 | | | | 73,369 | | | | 247,092 | | | | (173,723 | ) |
| People’s Republic of China, 4.250% 10/28/17 | | (1.000) | | | 0.212 | | | Barclays Bank PLC | | | 03/20/19 | | | | 4,140 | | | | (50,430 | ) | | | (4,750 | ) | | | (45,680 | ) |
| People’s Republic of China, 4.250% 10/28/17 | | (1.000) | | | 0.241 | | | Barclays Bank PLC | | | 09/20/19 | | | | 3,350 | | | | (50,896 | ) | | | (19,168 | ) | | | (31,728 | ) |
| People’s Republic of China, 7.500% 10/28/17 | | (1.000) | | | 0.511 | | | Barclays Bank PLC | | | 03/20/19 | | | | 8,490 | | | | (103,422 | ) | | | (41,597 | ) | | | (61,825 | ) |
| People’s Republic of China, 7.500% 10/28/17 | | (1.000) | | | 0.617 | | | Barclays Bank PLC | | | 06/20/21 | | | | 7,030 | | | | (143,866 | ) | | | 28,452 | | | | (172,318 | ) |
| People’s Republic of China, 7.500% 10/28/17 | | (1.000) | | | 0.570 | | | Barclays Bank PLC | | | 12/20/21 | | | | 17,730 | | | | (372,960 | ) | | | (26,579 | ) | | | (346,381 | ) |
| People’s Republic of China, 7.500% 10/28/17 | | (1.000) | | | 1.702 | | | Barclays Bank PLC | | | 6/20/22 | | | | 18,480 | | | | (364,275 | ) | | | (163,530 | ) | | | (200,745 | ) |
Republic of South Africa, 5.500%, 03/09/20 | | (1.000) | | | 0.212 | | | Barclays Bank PLC | | | 06/20/22 | | | | 1,800 | | | | 55,370 | | | | 67,925 | | | | (12,555 | ) |
| People’s Republic of China, 4.250% 10/28/17 | | (1.000) | | | 0.240 | | | Citibank NA | | | 03/20/19 | | | | 31,240 | | | | (380,552 | ) | | | (42,410 | ) | | | (338,142 | ) |
| | |
| 72 | | The accompanying notes are an integral part of these financial statements. |
GOLDMAN SACHS EMERGING MARKETS DEBT FUND
|
| ADDITIONAL INVESTMENT INFORMATION (continued) |
OVER THE COUNTER CREDIT DEFAULT SWAP CONTRACTS (continued)
| | | | | | | | | | | | | | | | | | | | | | | | | | | | |
| Reference Obligation/ Index(a) | | Financing Rate
Received/(Paid)
by the Fund | | Credit Spread at
September 30,
2017(b) | | | Counterparty | | Termination
Date | | | Notional
Amount | | | Value | | | Upfront
Premiums
(Received)
Paid | | | Unrealized
Appreciation/
(Depreciation) | |
| People’s Republic of China, 4.250% 10/28/17 | | (1.000)% | | | 0.447 | % | | Citibank NA | | | 06/20/19 | | | $ | 21,330 | | | $ | (296,597 | ) | | $ | (25,625 | ) | | $ | (270,972 | ) |
| People’s Republic of China, 7.500% 10/28/17 | | (1.000) | | | 0.637 | | | Citibank NA | | | 12/20/20 | | | | 20,690 | | | | (411,436 | ) | | | 139,662 | | | | (551,098 | ) |
| People’s Republic of China, 7.500% 10/28/17 | | (1.000) | | | 1.511 | | | Citibank NA | | | 06/20/21 | | | | 67,670 | | | | (1,384,832 | ) | | | 348,165 | | | | (1,732,997 | ) |
| People’s Republic of China, 7.500% 10/28/17 | | (1.000) | | | 0.700 | | | Citibank NA | | | 06/20/21 | | | | 12,100 | | | | (247,621 | ) | | | 40,636 | | | | (288,257 | ) |
| People’s Republic of China, 7.500% 10/28/17 | | (1.000) | | | 1.702 | | | Citibank NA | | | 6/20/22 | | | | 9,400 | | | | (185,292 | ) | | | (134,032 | ) | | | (51,260 | ) |
Republic of Turkey, 11.875%, 01/15/30 | | (1.000) | | | 0.379 | | | Citibank NA | | | 12/20/21 | | | | 690 | | | | 13,908 | | | | 46,267 | | | | (32,359 | ) |
Republic of South Africa, 4.300%, 10/12/28 | | (1.000) | | | 0.511 | | | Citibank NA | | | 6/20/22 | | | | 920 | | | | 28,301 | | | | 37,641 | | | | (9,340 | ) |
| People’s Republic of China, 7.500% 10/28/17 | | (1.000) | | | 0.490 | | | Deutsche Bank AG | | | 12/20/20 | | | | 5,280 | | | | (104,996 | ) | | | 31,245 | | | | (136,241 | ) |
| People’s Republic of China, 7.500% 10/28/17 | | (1.000) | | | 1.759 | | | Deutsche Bank AG | | | 06/20/21 | | | | 28,030 | | | | (573,619 | ) | | | 81,075 | | | | (654,694 | ) |
| People’s Republic of China, 7.500% 10/28/17 | | (1.000) | | | 1.702 | | | Deutsche Bank AG | | | 12/20/21 | | | | 15,570 | | | | (327,523 | ) | | | 48,946 | | | | (376,469 | ) |
Republic of Turkey, 11.875%, 01/15/30 | | (1.000) | | | 1.702 | | | Deutsche Bank AG | | | 12/20/21 | | | | 2,460 | | | | 49,585 | | | | 166,112 | | | | (116,527 | ) |
Republic of South Africa, 4.300%, 10/12/28 | | (1.000) | | | 0.212 | | | Deutsche Bank AG | | | 06/20/22 | | | | 2,470 | | | | 75,980 | | | | 98,450 | | | | (22,470 | ) |
Republic of South Africa, 5.500%, 03/09/20 | | (1.000) | | | 0.240 | | | Deutsche Bank AG | | | 06/20/22 | | | | 2,480 | | | | 76,288 | | | | 102,176 | | | | (25,888 | ) |
| People’s Republic of China, 4.250% 10/28/17 | | (1.000) | | | 0.550 | | | JPMorgan Securities, Inc. | | | 03/20/19 | | | | 10,100 | | | | (123,033 | ) | | | (18,293 | ) | | | (104,740 | ) |
| People’s Republic of China, 4.250% 10/28/17 | | (1.000) | | | 0.511 | | | JPMorgan Securities, Inc. | | | 06/20/19 | | | | 2,690 | | | | (37,405 | ) | | | (5,263 | ) | | | (32,142 | ) |
| People’s Republic of China, 7.500% 10/28/17 | | (1.000) | | | 0.490 | | | JPMorgan Securities, Inc. | | | 12/20/20 | | | | 18,200 | | | | (361,918 | ) | | | 86,522 | | | | (448,440 | ) |
| People’s Republic of China, 7.500% 10/28/17 | | (1.000) | | | 0.700 | | | JPMorgan Securities, Inc. | | | 06/20/21 | | | | 21,650 | | | | (443,054 | ) | | | 56,770 | | | | (499,824 | ) |
| People’s Republic of China, 7.500% 10/28/17 | | (1.000) | | | 1.702 | | | JPMorgan Securities, Inc. | | | 12/20/21 | | | | 1,650 | | | | (34,708 | ) | | | 5,238 | | | | (39,946 | ) |
| People’s Republic of China, 7.500% 10/28/17 | | (1.000) | | | 1.759 | | | JPMorgan Securities, Inc. | | | 06/20/22 | | | | 14,680 | | | | (289,359 | ) | | | (206,320 | ) | | | (83,039 | ) |
| Republic of South Africa, 5.500%, 03/09/20 | | (1.000) | | | 0.442 | | | JPMorgan Securities, Inc. | | | 06/20/22 | | | | 1,910 | | | | 58,754 | | | | 72,329 | | | | (13,575 | ) |
Republic of Turkey, 11.875%, 01/15/30 | | (1.000) | | | 1.511 | | | MS & Co. Int. PLC | | | 12/20/21 | | | | 1,430 | | | | 28,824 | | | | 94,438 | | | | (65,614 | ) |
People’s Republic of China, 7.500%, 10/28/27 | | (1.000) | | | 1.511 | | | UBS AG (London) | | | 06/20/21 | | | | 18,520 | | | | (379,002 | ) | | | 63,589 | | | | (442,591 | ) |
| | |
| The accompanying notes are an integral part of these financial statements. | | 73 |
GOLDMAN SACHS EMERGING MARKETS DEBT FUND
Schedule of Investments (continued)
September 30, 2017 (Unaudited)
|
| ADDITIONAL INVESTMENT INFORMATION (continued) |
OVER THE COUNTER CREDIT DEFAULT SWAP CONTRACTS (continued)
| | | | | | | | | | | | | | | | | | | | | | | | | | | | |
Reference Obligation/
Index(a) | | Financing Rate
Received/(Paid)
by the Fund | | Credit Spread at
September 30,
2017(b) | | | Counterparty | | Termination
Date | | | Notional
Amount | | | Value | | | Upfront
Premiums
(Received)
Paid | | | Unrealized
Appreciation/
(Depreciation) | |
| | | | | | | | |
Protection Sold: | | | | | | | | | | | | | | | | | | | | | | | | | | | | |
Republic of Colombia, 10.375%, 01/28/33 | | 1.000% | | | 0.661 | % | | Barclays Bank PLC | | | 12/20/19 | | | $ | 5,720 | | | $ | 70,448 | | | $ | (105,433 | ) | | $ | 175,881 | |
Republic of Chile, 3.875%, 08/05/20 | | 1.000 | | | 0.441 | | | Citibank NA | | | 12/20/20 | | | | 11,510 | | | | 246,517 | | | | (101,162 | ) | | | 347,679 | |
| TOTAL | | | $ | (6,388,315 | ) | | $ | 1,119,173 | | | $ | (7,507,488 | ) |
| | (a) | | Payments made quarterly. |
| | (b) | | Credit spread on the referenced obligation, together with the term of the swap contract, are indicators of payment/performance risk. The likelihood of a credit event occurring which would require a fund or its counterparty to make a payment or otherwise be required to perform under the swap contract is generally greater as the credit spread and the term of the swap contract increase. |
CENTRALLY CLEARED CREDIT DEFAULT SWAP CONTRACT
| | | | | | | | | | | | | | | | | | | | | | | | | | |
| Referenced Obligation/Index | | Financing Rate
Received/(Paid)
by the Fund(a) | | Credit
Spread
at September 30,
2017(b) | | | Termination
Date | | | Notional
Amount | | | Value | | | Upfront
Premiums
(Received)
Paid | | | Unrealized
Appreciation/
(Depreciation) | |
Protection Purchased: | | | | | | | | | | | | | | | | | | | | | | | | | | |
CDX.EM Index 28 | | (1.000)% | | | 1.853 | % | | | 12/20/22 | | | $ | 7,410 | | | $ | 296,754 | | | $ | 306,769 | | | $ | (10,015 | ) |
| | (a) | | Payments made quarterly. |
| | (b) | | Credit spread on the referenced obligation, together with the term of the swap contract, are indicators of payment/performance risk. The likelihood of a credit event occurring which would require a fund or its counterparty to make a payment or otherwise be required to perform under the swap contract is generally greater as the credit spread and the term of the swap contract increase. |
OPTIONS CONTRACTS — At September 30, 2017, the Fund had following options contracts:
PURCHASED OPTIONS ON FUTURES CONTRACTS
| | | | | | | | | | | | | | | | | | | | | | | | |
| Description | | Counterparty | | Strike
Price | | Expiration
Date | | Number of
Contracts | | Notional Amount | | | Market Value | | | Premiums
Paid (Received) | | | Unrealized
Appreciation/ (Depreciation) | |
Purchased Options Contracts: | | | | | | | | | | | | | | | | | | | | | | |
Puts: | | | | | | | | | | | | | | | | | |
| Eurodollar Futures | | MS & Co. LLC | | $98.00 | | 06/15/18 | | 533 | | $ | 1,332,500 | | | $ | 206,538 | | | $ | 147,774 | | | $ | 58,763 | |
| | |
|
Abbreviations: |
1M BID Avg | | —1 month Brazilian Interbank Deposit Average |
BoA Securities LLC | | —Bank of America Securities LLC |
CDX.EM Index 28 | | —CDX Emerging Markets Index 28 |
Mexico IB TIIE 28D | | —Mexico Interbank TIIE 28 Days |
MS & Co. Int. PLC | | —Morgan Stanley & Co. International PLC |
|
| | |
| 74 | | The accompanying notes are an integral part of these financial statements. |
GOLDMAN SACHS HIGH YIELD FUND
Schedule of Investments
September 30, 2017 (Unaudited)
| | | | | | | | | | | | | | |
Principal
Amount | | | Interest
Rate | | | Maturity
Date | | | Value | |
| Bank Loans(a) – 3.3% | |
| Consumer Cyclical Services – 0.2% | |
| | Asurion LLC (B+/Ba3)(1 mo. LIBOR + 3.000%) | |
| $ | 7,462,500 | | | | 4.235 | % | | | 11/03/23 | | | $ | 7,492,574 | |
| | |
| Diversified Manufacturing – 0.2% | |
| | Cortes NP Acquisition Corp. (B+/Ba3) (1 mo. LIBOR + 4.000%) | |
| | 5,588,308 | | | | 5.239 | | | | 11/30/23 | | | | 5,627,873 | |
| | |
| Energy(b) – 0.3% | |
| American Energy – Marcellus LLC (D/Ca)
(1 mo. LIBOR + 4.250%) |
|
| | 11,500,055 | | | | 5.485 | | | | 08/04/20 | | | | 8,502,911 | |
| American Energy – Marcellus LLC (D/C)
(1 mo. LIBOR + 7.500%) |
|
| | 3,275,000 | | | | 8.736 | | | | 08/04/21 | | | | 206,063 | |
| | | | | | | | | | | | | | |
| | | | | | | | | | | | | 8,708,974 | |
| | |
| Energy – Exploration & Production(b)(c) – 0.0% | |
| | Blue Ridge Mountain Resources, Inc. (NR/NR) (PIK + 7.000%) | |
| | 1,068,267 | | | | 8.312 | | | | 05/06/19 | | | | 1,068,267 | |
| | |
| Entertainment & Leisure – 0.2% | |
| | Intrawest Resorts Holdings, Inc. (B/B2) (1 mo. LIBOR + 3.250%) | |
| | 6,961,176 | | | | 4.485 | | | | 07/31/24 | | | | 6,991,666 | |
| | |
| Environmental – 0.1% | |
| | Wrangler Buyer Corp. (B/B1) | |
| | 1,525,000 | | | | 3.000 | | | | 09/20/24 | | | | 1,531,985 | |
| | |
| Food & Beverages(b) – 0.3% | |
| | Shearer’s Foods, Inc. (CCC+/Caa2) (3 mo. LIBOR + 6.750%) | |
| | 12,250,000 | | | | 8.083 | | | | 06/30/22 | | | | 11,576,250 | |
| | |
| Health Care – Services – 0.2% | |
| MPH Acquisition Holdings LLC (B+/B1)
(3 mo. LIBOR + 3.000%) |
|
| | 3,579,426 | | | | 4.333 | | | | 06/07/23 | | | | 3,605,162 | |
| | Team Health Holdings, Inc. (NR/NR) (1 mo. LIBOR + 2.750%) | |
| | 4,751,125 | | | | 3.985 | | | | 02/06/24 | | | | 4,659,096 | |
| | | | | | | | | | | | | | |
| | | | | | | | | | | | | 8,264,258 | |
| | |
| Media – Non Cable – 0.3% | |
| | Getty Images, Inc. (CCC/B3) (3 mo. LIBOR + 3.500%) | |
| | 13,195,151 | | | | 4.833 | | | | 10/18/19 | | | | 11,386,360 | |
| | |
| Noncaptive – Financial – 0.3% | |
| Avolon TLB Borrower 1 (Luxembourg) S.a.r.l. (BBB-/Ba1)
(1 mo. LIBOR + 2.750%) |
|
| | 8,628,375 | | | | 3.986 | | | | 04/03/22 | | | | 8,644,510 | |
| | |
| Pharmaceuticals – 0.2% | |
| | Alphabet Holding Co., Inc. (B/B1) | |
| | 6,175,000 | | | | 4.500 | | | | 09/26/24 | | | | 6,097,812 | |
| | |
| Pipelines – 0.2% | |
| | BCP Raptor LLC (B+/B3)(1 Week LIBOR + 4.250%) | |
| | 5,586,000 | | | | 5.522 | | | | 06/24/24 | | | | 5,622,644 | |
| | |
| Retailers – 0.3% | |
| | PetSmart, Inc. (B/Ba3) (1 mo. LIBOR + 3.000%) | |
| | 10,897,130 | | | | 4.240 | | | | 03/11/22 | | | | 9,189,877 | |
| | |
| Bank Loans(a) – (continued) | |
| Retailers – (continued) | |
| True Religion Apparel, Inc. (NR/WR)
(3 mo. LIBOR + 4.875%)(b)(c) |
|
| 8,250,750 | | | | 6.022 | | | | 07/30/19 | | | | 2,103,941 | |
| | 6,825,000 | | | | 11.000 | | | | 01/30/20 | | | | 395,850 | |
| | | | | | | | | | | | | | |
| | | | | | | | | | | | | 11,689,668 | |
| | |
| Services Cyclical – Business Services – 0.5% | |
| | First Data Corp. (BB/Ba3) (1 mo. LIBOR + 2.250%) | |
| | 18,700,000 | | | | 3.487 | | | | 07/08/22 | | | | 18,725,993 | |
| | |
| | TOTAL BANK LOANS | |
| | (Cost $132,784,403) | | | | | | | $ | 113,428,834 | |
| | |
| | | | | | | | | | | | | | |
| Corporate Obligations – 89.8% | |
| Aerospace & Defense – 0.7% | |
| | Arconic, Inc. (BBB-/Ba2) | |
| $ | 5,400,000 | | | | 6.150 | % | | | 08/15/20 | | | $ | 5,898,119 | |
| | 4,050,000 | | | | 6.750 | | | | 01/15/28 | | | | 4,713,188 | |
| | 6,350,000 | | | | 5.950 | | | | 02/01/37 | | | | 6,733,774 | |
| | TransDigm, Inc. (B-/B3)(d) | |
| | 5,000,000 | | | | 6.500 | | | | 05/15/25 | | | | 5,143,750 | |
| | 3,300,000 | | | | 6.375 | | | | 06/15/26 | | | | 3,382,500 | |
| | | | | | | | | | | | | | |
| | | | | | | | | | | | | 25,871,331 | |
| | |
| Automotive – 1.1% | |
| | American Axle & Manufacturing, Inc. (B/B2)(d)(e)(l) | |
| | 15,000,000 | | | | 6.250 | | | | 04/01/25 | | | | 15,281,250 | |
| | CB Lear Corp. (NR/NR)(b)(c) | |
| | 6,750,000 | | | | 8.500 | | | | 12/01/13 | | | | — | |
| | Cooper-Standard Automotive, Inc. (B+/B2)(d)(e) | |
| | 10,000,000 | | | | 5.625 | | | | 11/15/26 | | | | 10,212,500 | |
| | Delphi Jersey Holdings PLC (BB/B1)(e) | |
| | 8,650,000 | | | | 5.000 | | | | 10/01/25 | | | | 8,778,721 | |
| | General Motors Liquidation Co. (NR/NR)(b)(c) | |
| | 7,125,000 | | | | 7.125 | | | | 07/15/13 | | | | — | |
| | 2,000,000 | | | | 7.700 | | | | 04/15/16 | | | | — | |
| | 1,000,000 | | | | 8.800 | | | | 03/01/49 | | | | — | |
| | 14,500,000 | | | | 8.375 | | | | 07/15/49 | | | | — | |
| | The Goodyear Tire & Rubber Co. (BB/Ba3)(d) | |
| | 5,000,000 | | | | 5.000 | | | | 05/31/26 | | | | 5,212,500 | |
| | | | | | | | | | | | | | |
| | | | | | | | | | | | | 39,484,971 | |
| | |
| Banks – 3.7% | |
| Bank of America Corp. (BB+/Ba2)
(3M USD LIBOR + 3.705%)(d)(j) |
|
| | 7,000,000 | | | | 6.250 | | | | 09/29/49 | | | | 7,717,500 | |
| | |
| | 1,830,000 | | | | 8.125 | | | | 12/29/49 | | | | 1,878,038 | |
| | (3M USD LIBOR + 3.630%)(d)(j) | |
| | 7,000,000 | | | | 8.000 | | | | 12/31/49 | | | | 7,105,000 | |
| | Barclays PLC (B+/Ba2) (5 year USD Swap + 6.772%)(d)(j) | |
| | 8,250,000 | | | | 7.875 | | | | 12/29/49 | | | | 8,975,752 | |
| | CIT Group, Inc. (BB+/Ba2) | |
| | 2,000,000 | | | | 5.500 | (e) | | | 02/15/19 | | | | 2,087,500 | |
| | 9,500,000 | | | | 5.000 | | | | 08/15/22 | | | | 10,260,000 | |
| | |
| | |
| The accompanying notes are an integral part of these financial statements. | | 75 |
GOLDMAN SACHS HIGH YIELD FUND
Schedule of Investments (continued)
September 30, 2017 (Unaudited)
| | | | | | | | | | | | | | |
Principal
Amount | | | Interest
Rate | | | Maturity
Date | | | Value | |
| Corporate Obligations – (continued) | |
| Banks – (continued) | |
| Citigroup, Inc. (BB+/Ba2)
(3M USD LIBOR + 4.230%)(d)(j) |
|
| $ | 8,000,000 | | | | 5.900 | % | | | 12/29/49 | | | $ | 8,590,000 | |
| | (3M USD LIBOR + 3.423%)(d)(j) | |
| | 5,000,000 | | | | 6.300 | | | | 12/29/49 | | | | 5,412,500 | |
| Credit Suisse Group AG (BB/NR) (5 year USD
Swap + 4.598%)(d)(e)(j) |
|
| | 10,000,000 | | | | 7.500 | | | | 12/29/49 | | | | 11,300,000 | |
| | Deutsche Bank AG (BB+/Ba2) | |
| | 10,000,000 | | | | 4.500 | | | | 04/01/25 | | | | 10,021,150 | |
| | Intesa Sanpaolo SpA (BB/Ba1)(e) | |
| | 2,500,000 | | | | 5.017 | | | | 06/26/24 | | | | 2,543,750 | |
| | 6,500,000 | | | | 5.710 | | | | 01/15/26 | | | | 6,857,500 | |
| Royal Bank of Scotland Group PLC (B/Ba3)
(5 year USD Swap + 5.800%)(d)(j) |
|
| | 12,000,000 | | | | 7.500 | | | | 12/29/49 | | | | 12,585,000 | |
| Royal Bank of Scotland Group PLC (B+/Ba3)
(3M USD LIBOR + 2.320%)(d)(j) |
|
| | 4,800,000 | | | | 3.655 | | | | 12/31/49 | | | | 4,596,000 | |
| | UBS Group AG (BB+/NR) (5 year USD Swap + 4.590%)(j) | |
| | 10,000,000 | | | | 6.875 | | | | 12/29/49 | | | | 10,845,100 | |
| | UniCredit SpA (BB/Ba1) (5 year USD ICE Swap + 3.703%)(d)(e)(j) | |
| | 9,300,000 | | | | 5.861 | | | | 06/19/32 | | | | 9,705,071 | |
| | Westpac Banking Corp. (BB+/Baa2)(d) | |
| | 6,025,000 | | | | 5.000 | | | | 09/21/99 | | | | 6,018,487 | |
| | | | | | | | | | | | | | |
| | | | | | | | | | | | | 126,498,348 | |
| | |
| Biotechnology(d)(e)(f) – 0.2% | |
| | Sterigenics-Nordion Topco LLC (CCC+/Caa2) | |
| | 7,000,000 | | | | 8.125 | | | | 11/01/21 | | | | 7,140,000 | |
| | |
| Building Materials(d) – 2.1% | |
| | Atrium Windows & Doors, Inc. (B-/Caa1)(e) | |
| | 10,450,000 | | | | 7.750 | | | | 05/01/19 | | | | 10,554,500 | |
| | BMC East LLC (BB-/B2)(e) | |
| | 6,150,000 | | | | 5.500 | | | | 10/01/24 | | | | 6,411,375 | |
| | Cemex SAB de CV (BB/NR)(e) | |
| | 5,000,000 | | | | 7.750 | | | | 04/16/26 | | | | 5,745,000 | |
| | Masonite International Corp. (BB/Ba3)(e) | |
| | 7,950,000 | | | | 5.625 | | | | 03/15/23 | | | | 8,347,500 | |
| | Standard Industries, Inc. (BBB-/Ba2)(e) | |
| | 7,000,000 | | | | 5.375 | | | | 11/15/24 | | | | 7,385,000 | |
| | 9,600,000 | | | | 5.000 | | | | 02/15/27 | | | | 10,008,000 | |
| Summit Materials LLC/Summit Materials Finance
Corp. (BB-/B3) |
|
| | 11,450,000 | | | | 6.125 | | | | 07/15/23 | | | | 12,022,500 | |
| Summit Materials LLC/Summit Materials Finance
Corp. (BB-/B3)(e) |
|
| | 1,700,000 | | | | 5.125 | | | | 06/01/25 | | | | 1,748,875 | |
| | USG Corp. (BB+/Ba2)(e) | |
| | 9,100,000 | | | | 4.875 | | | | 06/01/27 | | | | 9,498,125 | |
| | | | | | | | | | | | | | |
| | | | | | | | | | | | | 71,720,875 | |
| | |
| Capital Goods – 0.0% | |
| | LyondellBasell Industries NV (NR/NR)(k) | |
| EUR | 2,250,000 | | | | 1.000 | | | | 08/15/15 | | | | 19,945 | |
| | |
| Corporate Obligations – (continued) | |
| Chemicals – 1.7% | |
| | Kraton Polymers LLC/Kraton Polymers Capital Corp. (B-/B3)(d)(e) | |
| $ | 3,450,000 | | | | 7.000 | | | | 04/15/25 | | | | 3,700,125 | |
| | Momentive Performance Materials, Inc. (NR/NR)(b)(c) | |
| | 3,110,000 | | | | 8.875 | | | | 10/15/20 | | | | — | |
| | Nell AF SARL (NR/NR)(c) | |
| | 10,625,000 | | | | 8.375 | | | | 12/30/49 | | | | 26,563 | |
| | PQ Corp. (BB+/B2)(d)(e) | |
| | 5,850,000 | | | | 6.750 | | | | 11/15/22 | | | | 6,318,000 | |
| | SPCM SA (BB+/Ba2)(d)(e) | |
| | 4,950,000 | | | | 4.875 | | | | 09/15/25 | | | | 5,123,250 | |
| | Valvoline, Inc. (BB+/Ba3)(d)(e) | |
| | 4,150,000 | | | | 5.500 | | | | 07/15/24 | | | | 4,419,750 | |
| | 9,000,000 | | | | 4.375 | | | | 08/15/25 | | | | 9,135,000 | |
| | Versum Materials, Inc. (BB/Ba3)(d)(e) | |
| | 14,000,000 | | | | 5.500 | | | | 09/30/24 | | | | 14,840,000 | |
| | WR Grace & Co-Conn (BB+/Ba3)(e) | |
| | 2,400,000 | | | | 5.125 | | | | 10/01/21 | | | | 2,604,000 | |
| | 12,200,000 | | | | 5.625 | | | | 10/01/24 | | | | 13,420,000 | |
| | | | | | | | | | | | | | |
| | | | | | | | | | | | | 59,586,688 | |
| | |
| Commercial Services(d) – 2.4% | |
| Avis Budget Car Rental LLC/Avis Budget Finance,
Inc. (BB-/B1)(e)(l) |
|
| | 7,350,000 | | | | 5.250 | | | | 03/15/25 | | | | 7,340,812 | |
| | Nielsen Finance LLC/Nielsen Finance Co. (BB+/B1)(e) | |
| | 9,350,000 | | | | 5.000 | | | | 04/15/22 | | | | 9,677,250 | |
| | Southern Graphics, Inc. (CCC+/Caa1)(e) | |
| | 11,000,000 | | | | 8.375 | | | | 10/15/20 | | | | 11,206,250 | |
| | Team Health Holdings, Inc. (CCC+/Caa1)(e)(l) | |
| | 14,000,000 | | | | 6.375 | | | | 02/01/25 | | | | 13,265,000 | |
| | The Hertz Corp. (B-/B3) | |
| | 3,700,000 | | | | 5.875 | | | | 10/15/20 | | | | 3,653,750 | |
| | 1,750,000 | | | | 7.375 | (l) | | | 01/15/21 | | | | 1,754,375 | |
| | The Hertz Corp. (BB-/B1)(e)(l) | |
| | 6,650,000 | | | | 7.625 | | | | 06/01/22 | | | | 6,849,500 | |
| | United Rentals North America, Inc. (BB+/Ba1) | |
| | 3,300,000 | | | | 4.625 | | | | 07/15/23 | | | | 3,440,250 | |
| | United Rentals North America, Inc. (BB-/Ba3) | |
| | 12,200,000 | | | | 4.625 | | | | 10/15/25 | | | | 12,337,250 | |
| | 6,000,000 | | | | 5.875 | | | | 09/15/26 | | | | 6,517,500 | |
| | WEX, Inc. (BB-/Ba3)(e) | |
| | 7,000,000 | | | | 4.750 | | | | 02/01/23 | | | | 7,175,000 | |
| | | | | | | | | | | | | | |
| | | | | | | | | | | | | 83,216,937 | |
| | |
| Computers(d) – 1.3% | |
| | Dell International LLC/EMC Corp. (BB/Ba2)(e) | |
| | 4,000,000 | | | | 5.875 | | | | 06/15/21 | | | | 4,180,000 | |
| | Dell International LLC/EMC Corp. (BBB-/Baa3)(e) | |
| | 8,000,000 | | | | 5.450 | | | | 06/15/23 | | | | 8,755,196 | |
| | NCR Corp. (BB/B1) | |
| | 9,700,000 | | | | 5.000 | | | | 07/15/22 | | | | 9,942,500 | |
| | Western Digital Corp. (BB+/Ba2) | |
| | 19,100,000 | | | | 10.500 | | | | 04/01/24 | | | | 22,442,500 | |
| | | | | | | | | | | | | | |
| | | | | | | | | | | | | 45,320,196 | |
| | |
| | |
| 76 | | The accompanying notes are an integral part of these financial statements. |
GOLDMAN SACHS HIGH YIELD FUND
| | | | | | | | | | | | | | |
Principal
Amount | | | Interest
Rate | | | Maturity
Date | | | Value | |
| Corporate Obligations – (continued) | |
| Distribution & Wholesale(d)(e) – 0.5% | |
| | H&E Equipment Services, Inc. (BB-/B2) | |
| $ | 6,650,000 | | | | 5.625 | % | | | 09/01/25 | | | $ | 7,015,750 | |
| | Performance Food Group, Inc. (BB-/B2) | |
| | 11,000,000 | | | | 5.500 | | | | 06/01/24 | | | | 11,385,000 | |
| | | | | | | | | | | | | | |
| | | | | | | | | | | | | 18,400,750 | |
| | |
| Diversified Financial Services – 2.6% | |
| | Abe Investment Holdings, Inc./Getty Images, Inc. (CC/Caa3)(d)(e) | |
| | 2,950,000 | | | | 7.000 | | | | 10/15/20 | | | | 1,858,500 | |
| | Ally Financial, Inc. (BB+/NR) | |
| | 2,600,000 | | | | 3.600 | | | | 05/21/18 | | | | 2,619,500 | |
| | Ally Financial, Inc. (BB+/Ba3) | |
| | 8,000,000 | | | | 3.750 | | | | 11/18/19 | | | | 8,170,000 | |
| | Ally Financial, Inc. (BB+/NR) | |
| | 2,000,000 | | | | 4.250 | | | | 04/15/21 | | | | 2,072,500 | |
| | 8,450,000 | | | | 4.125 | | | | 02/13/22 | | | | 8,714,062 | |
| | Ally Financial, Inc. (BB+/Ba3) | |
| | 700,000 | | | | 5.125 | | | | 09/30/24 | | | | 756,875 | |
| | 10,000,000 | | | | 8.000 | | | | 11/01/31 | | | | 12,900,000 | |
| | Intelsat Connect Finance SA (CCC-/Ca)(d)(e) | |
| | 10,000,000 | | | | 12.500 | | | | 04/01/22 | | | | 9,750,000 | |
| | Jefferies LoanCore LLC/JLC Finance Corp. (B/B1)(d)(e) | |
| | 5,000,000 | | | | 6.875 | | | | 06/01/20 | | | | 5,175,000 | |
| | Nationstar Mortgage LLC/Nationstar Capital Corp. (B+/B2)(d) | |
| | 5,000,000 | | | | 7.875 | | | | 10/01/20 | | | | 5,112,500 | |
| | Navient Corp. (B+/Ba3) | |
| | 12,000,000 | | | | 5.500 | | | | 01/15/19 | | | | 12,419,412 | |
| | 6,000,000 | | | | 5.875 | | | | 03/25/21 | | | | 6,291,348 | |
| | 2,850,000 | | | | 6.625 | | | | 07/26/21 | | | | 3,055,052 | |
| | 10,000,000 | | | | 6.125 | | | | 03/25/24 | | | | 10,302,170 | |
| | | | | | | | | | | | | | |
| | | | | | | | | | | | | 89,196,919 | |
| | |
| Electrical – 1.9% | |
| | Calpine Corp. (B/B2)(d) | |
| | 5,000,000 | | | | 5.375 | | | | 01/15/23 | | | | 4,856,250 | |
| | 5,000,000 | | | | 5.500 | | | | 02/01/24 | | | | 4,737,500 | |
| | 6,100,000 | | | | 5.750 | | | | 01/15/25 | | | | 5,749,250 | |
| | Calpine Corp. (BB/Ba2)(d)(e) | |
| | 10,550,000 | | | | 5.250 | | | | 06/01/26 | | | | 10,497,250 | |
| | Dynegy, Inc. (B+/B3)(d) | |
| | 22,400,000 | | | | 7.375 | | | | 11/01/22 | | | | 23,352,000 | |
| | 5,850,000 | | | | 7.625 | | | | 11/01/24 | | | | 6,062,063 | |
| | NRG Energy, Inc. (BB-/B1) | |
| | 6,414,000 | | | | 7.625 | | | | 01/15/18 | | | | 6,526,245 | |
| | 5,200,000 | | | | 6.250 | (d) | | | 07/15/22 | | | | 5,447,000 | |
| | | | | | | | | | | | | | |
| | | | | | | | | | | | | 67,227,558 | |
| | |
| Electrical Components & Equipment(d) – 0.2% | |
| | WESCO Distribution, Inc. (BB-/B1) | |
| | 8,000,000 | | | | 5.375 | | | | 12/15/21 | | | | 8,250,000 | |
| | |
| Energy – Exploration & Production(b)(c) – 0.0% | |
| | Berry Petroleum Co. LLC (NR/NR) | |
| | 2,050,000 | | | | 6.750 | | | | 11/01/20 | | | | — | |
| | 28,160,000 | | | | 6.375 | | | | 09/15/22 | | | | — | |
| | | | | | | | | | | | | | |
| | | | | | | | | | | | | — | |
| | |
| Corporate Obligations – (continued) | |
| Engineering & Construction(d) – 0.5% | |
| | AECOM (BB/Ba3) | |
| 9,000,000 | | | | 5.875 | | | | 10/15/24 | | | | 9,956,250 | |
| | 6,900,000 | | | | 5.125 | | | | 03/15/27 | | | | 7,115,625 | |
| | | | | | | | | | | | | | |
| | | | | | | | | | | | | 17,071,875 | |
| | |
| Entertainment – 1.9% | |
| | Cinemark USA, Inc. (BB/B2)(d) | |
| | 5,850,000 | | | | 4.875 | | | | 06/01/23 | | | | 5,908,500 | |
| | GLP Capital LP/GLP Financing II, Inc. (BB+/Ba1) | |
| | 9,000,000 | | | | 5.375 | | | | 04/15/26 | | | | 9,832,500 | |
| | Lions Gate Entertainment Corp. (B-/B2)(d)(e) | |
| | 5,000,000 | | | | 5.875 | | | | 11/01/24 | | | | 5,237,500 | |
| | Mohegan Gaming & Entertainment (B-/B3)(d)(e)(l) | |
| | 16,000,000 | | | | 7.875 | | | | 10/15/24 | | | | 17,000,000 | |
| | New Cotai LLC/New Cotai Capital Corp. (NR/NR)(d)(e)(f) | |
| | 2,636,814 | | | | 10.625 | | | | 05/01/19 | | | | 2,460,752 | |
| Rivers Pittsburgh Borrower LP/Rivers Pittsburgh Finance Corp.
(B/B2)(d)(e) |
|
| | 10,000,000 | | | | 6.125 | | | | 08/15/21 | | | | 10,087,500 | |
| | Scientific Games International, Inc. (B-/Caa1)(d) | |
| | 12,150,000 | | | | 10.000 | | | | 12/01/22 | | | | 13,425,750 | |
| | | | | | | | | | | | | | |
| | | | | | | | | | | | | 63,952,502 | |
| | |
| Environmental(d)(e) – 0.6% | |
| | CD&R Waterworks Merger Sub LLC (B-/Caa1) | |
| | 17,300,000 | | | | 6.125 | | | | 08/15/25 | | | | 17,754,125 | |
| | Wrangler Buyer Corp. (NR/Caa1) | |
| | 3,150,000 | | | | 6.000 | | | | 10/01/25 | | | | 3,205,125 | |
| | | | | | | | | | | | | | |
| | | | | | | | | | | | | 20,959,250 | |
| | |
| Food & Drug Retailing(d)(e) – 0.9% | |
| | Chobani LLC/Chobani Finance Corp., Inc. (CCC+/Caa2) | |
| | 9,150,000 | | | | 7.500 | | | | 04/15/25 | | | | 9,950,625 | |
| | Post Holdings, Inc. (B/B3) | |
| | 6,600,000 | | | | 5.000 | | | | 08/15/26 | | | | 6,583,500 | |
| | 6,300,000 | | | | 5.750 | | | | 03/01/27 | | | | 6,489,000 | |
| | Shearer’s Foods LLC/Chip Finance Corp. (B/B3) | |
| | 6,957,000 | | | | 9.000 | | | | 11/01/19 | | | | 7,148,318 | |
| | | | | | | | | | | | | | |
| | | | | | | | | | | | | 30,171,443 | |
| | |
| Gaming – 3.1% | |
| Caesars Entertainment Resort Properties LLC/Caesars
Entertainment Resort Prope (B/Caa1)(d) |
|
| | 12,825,000 | | | | 11.000 | | | | 10/01/21 | | | | 13,642,594 | |
| | MGM Resorts International (BB-/Ba3) | |
| | 25,020,000 | | | | 8.625 | | | | 02/01/19 | | | | 27,021,600 | |
| | 19,050,000 | | | | 6.750 | | | | 10/01/20 | | | | 20,978,812 | |
| | 25,450,000 | | | | 6.625 | | | | 12/15/21 | | | | 28,631,250 | |
| | 13,000,000 | | | | 7.750 | | | | 03/15/22 | | | | 15,210,000 | |
| | | | | | | | | | | | | | |
| | | | | | | | | | | | | 105,484,256 | |
| | |
| Gas(d) – 0.2% | |
| | AmeriGas Partners LP/AmeriGas Finance Corp. (NR/Ba3) | |
| | 7,000,000 | | | | 5.750 | | | | 05/20/27 | | | | 7,157,500 | |
| | |
| Hardware(d) – 0.2% | | | | | | | |
| | CDW LLC/CDW Finance Corp. (BB-/Ba3) | |
| | 7,100,000 | | | | 5.000 | | | | 09/01/25 | | | | 7,472,750 | |
| | |
| | |
| The accompanying notes are an integral part of these financial statements. | | 77 |
GOLDMAN SACHS HIGH YIELD FUND
Schedule of Investments (continued)
September 30, 2017 (Unaudited)
| | | | | | | | | | | | | | |
Principal
Amount | | | Interest
Rate | | | Maturity
Date | | | Value | |
| Corporate Obligations – (continued) | |
| Healthcare Providers & Services – 4.8% | |
| | Acadia Healthcare Co., Inc. (B/B3)(d) | |
| $ | 8,350,000 | | | | 5.625 | % | | | 02/15/23 | | | $ | 8,757,062 | |
| | Centene Corp. (BB+/Ba2)(d) | |
| | 6,550,000 | | | | 6.125 | | | | 02/15/24 | | | | 7,074,000 | |
| | 1,930,000 | | | | 4.750 | | | | 01/15/25 | | | | 2,002,375 | |
| | CHS/Community Health Systems, Inc. (CCC/Caa2)(d) | |
| | 8,650,000 | | | | 8.000 | | | | 11/15/19 | | | | 8,433,750 | |
| | 13,500,000 | | | | 7.125 | (l) | | | 07/15/20 | | | | 12,183,750 | |
| | HCA, Inc. (BBB-/Ba1) | |
| | 25,000,000 | | | | 6.500 | | | | 02/15/20 | | | | 27,218,750 | |
| | HCA, Inc. (B+/B1) | |
| | 10,000,000 | | | | 7.500 | | | | 02/15/22 | | | | 11,475,000 | |
| | HCA, Inc. (BBB-/Ba1) | |
| | 18,000,000 | | | | 5.000 | | | | 03/15/24 | | | | 19,170,000 | |
| | HCA, Inc. (B+/B1) | |
| | 11,100,000 | | | | 5.375 | | | | 02/01/25 | | | | 11,710,500 | |
| | HCA, Inc. (BBB-/Ba1) | |
| | 15,000,000 | | | | 5.250 | | | | 04/15/25 | | | | 16,218,750 | |
| | MPH Acquisition Holdings LLC (B-/Caa1)(d)(e) | |
| | 5,900,000 | | | | 7.125 | | | | 06/01/24 | | | | 6,335,125 | |
| | Tenet Healthcare Corp. (B-/Ba3)(d)(e) | |
| | 5,000,000 | | | | 7.500 | | | | 01/01/22 | | | | 5,287,500 | |
| | Tenet Healthcare Corp. (CCC+/Caa1) | |
| | 6,050,000 | | | | 8.125 | | | | 04/01/22 | | | | 6,155,875 | |
| | 5,950,000 | | | | 6.750 | (l) | | | 06/15/23 | | | | 5,712,000 | |
| | Tenet Healthcare Corp. (B-/Ba3)(d)(e) | |
| | 14,000,000 | | | | 5.125 | | | | 05/01/25 | | | | 13,825,000 | |
| | Tenet Healthcare Corp. (CCC+/Caa1)(d)(e)(l) | |
| | 6,450,000 | | | | 7.000 | | | | 08/01/25 | | | | 6,030,750 | |
| | | | | | | | | | | | | | |
| | | | | | | | | | | | | 167,590,187 | |
| | |
| Home Builders – 2.4% | |
| | Beazer Homes USA, Inc. (NR/B3)(d) | |
| | 7,150,000 | | | | 8.750 | | | | 03/15/22 | | | | 7,900,750 | |
| | Beazer Homes USA, Inc. (B-/B3)(d) | |
| | 10,350,000 | | | | 7.250 | | | | 02/01/23 | | | | 10,751,063 | |
| | 6,400,000 | | | | 5.875 | (e) | | | 10/15/27 | | | | 6,392,000 | |
| | Brookfield Residential Properties, Inc. (B+/B1)(d)(e) | |
| | 2,900,000 | | | | 6.500 | | | | 12/15/20 | | | | 2,983,375 | |
| | 5,000,000 | | | | 6.125 | | | | 07/01/22 | | | | 5,229,000 | |
| | 6,500,000 | | | | 6.375 | | | | 05/15/25 | | | | 6,877,650 | |
| | Lennar Corp. (BB+/Ba1)(d) | |
| | 8,000,000 | | | | 4.750 | | | | 11/15/22 | | | | 8,460,000 | |
| | Shea Homes LP/Shea Homes Funding Corp. (BB-/B1)(d)(e) | |
| | 1,550,000 | | | | 5.875 | | | | 04/01/23 | | | | 1,588,750 | |
| | Toll Brothers Finance Corp. (BB+/Ba1)(d) | |
| | 9,000,000 | | | | 4.375 | | | | 04/15/23 | | | | 9,419,247 | |
| | TRI Pointe Group, Inc./TRI Pointe Homes, Inc. (BB-/Ba3) | |
| | 8,000,000 | | | | 5.875 | | | | 06/15/24 | | | | 8,560,000 | |
| | William Lyon Homes, Inc. (B-/B3)(d) | |
| | 400,000 | | | | 7.000 | | | | 08/15/22 | | | | 414,000 | |
| | 12,500,000 | | | | 5.875 | | | | 01/31/25 | | | | 12,812,500 | |
| | | | | | | | | | | | | | |
| | | | | | | | | | | | | 81,388,335 | |
| | |
| Household Products(d) – 0.2% | |
| | Spectrum Brands, Inc. (BB-/B2) | |
| | 5,000,000 | | | | 6.625 | | | | 11/15/22 | | | | 5,200,000 | |
| | |
| Corporate Obligations – (continued) | |
| Insurance(d)(e) – 0.4% | |
| | Fidelity & Guaranty Life Holdings, Inc. (BB-/Ba2) | |
| 5,000,000 | | | | 6.375 | | | | 04/01/21 | | | | 5,143,750 | |
| | USIS Merger Sub, Inc. (CCC+/Caa2) | |
| | 9,400,000 | | | | 6.875 | | | | 05/01/25 | | | | 9,552,750 | |
| | | | | | | | | | | | | | |
| | | | | | | | | | | | | 14,696,500 | |
| | |
| Internet – 0.9% | |
| | Symantec Corp. (BB+/Baa3)(d)(e) | |
| | 20,000,000 | | | | 5.000 | | | | 04/15/25 | | | | 20,896,860 | |
| | VeriSign, Inc. (BB+/Ba1)(d) | |
| | 5,000,000 | | | | 5.250 | | | | 04/01/25 | | | | 5,406,250 | |
| | 5,600,000 | | | | 4.750 | | | | 07/15/27 | | | | 5,768,000 | |
| | | | | | | | | | | | | | |
| | | | | | | | | | | | | 32,071,110 | |
| | |
| Iron/Steel – 1.7% | |
| | AK Steel Corp. (B-/B3)(d) | |
| | 4,000,000 | | | | 7.625 | | | | 10/01/21 | | | | 4,160,000 | |
| | AK Steel Corp. (BB-/B1)(d) | |
| | 6,950,000 | | | | 7.500 | | | | 07/15/23 | | | | 7,540,750 | |
| | AK Steel Corp. (B-/B3)(d) | |
| | 1,700,000 | | | | 6.375 | | | | 10/15/25 | | | | 1,678,750 | |
| | ArcelorMittal (BB+/Ba1) | |
| | 550,000 | | | | 5.125 | | | | 06/01/20 | | | | 587,125 | |
| | 800,000 | | | | 6.250 | | | | 08/05/20 | | | | 871,000 | |
| | 5,850,000 | | | | 6.000 | | | | 03/01/21 | | | | 6,420,375 | |
| | Cleveland-Cliffs, Inc. (CCC+/Caa1) | |
| | 3,887,000 | | | | 5.900 | | | | 03/15/20 | | | | 3,848,130 | |
| | 5,000,000 | | | | 4.800 | | | | 10/01/20 | | | | 4,818,750 | |
| | Cleveland-Cliffs, Inc. (B/B2)(d)(e) | |
| | 7,600,000 | | | | 5.750 | | | | 03/01/25 | | | | 7,277,000 | |
| | Commercial Metals Co. (BB+/Ba2)(d) | |
| | 3,890,000 | | | | 4.875 | | | | 05/15/23 | | | | 4,050,462 | |
| | 3,775,000 | | | | 5.375 | | | | 07/15/27 | | | | 3,954,313 | |
| | Steel Dynamics, Inc. (BB+/Ba1)(d) | |
| | 5,000,000 | | | | 5.125 | | | | 10/01/21 | | | | 5,137,500 | |
| | 5,000,000 | | | | 5.250 | | | | 04/15/23 | | | | 5,200,000 | |
| | 3,900,000 | | | | 4.125 | (e) | | | 09/15/25 | | | | 3,904,875 | |
| | | | | | | | | | | | | | |
| | | | | | | | | | | | | 59,449,030 | |
| | |
| Machinery – Construction & Mining(d) – 0.2% | |
| | Oshkosh Corp. (BB+/Ba3) | |
| | 5,150,000 | | | | 5.375 | | | | 03/01/25 | | | | 5,407,500 | |
| | |
| Machinery-Diversified(d)(e) – 0.3% | |
| | Shape Technologies Group, Inc. (B/B2) | |
| | 11,350,000 | | | | 7.625 | | | | 02/01/20 | | | | 11,718,875 | |
| | |
| Media – 11.8% | |
| | Altice Financing SA (BB-/B1)(d)(e) | |
| | 7,700,000 | | | | 6.500 | | | | 01/15/22 | | | | 8,008,000 | |
| | 19,000,000 | | | | 6.625 | | | | 02/15/23 | | | | 20,140,000 | |
| | 20,000,000 | | | | 7.500 | | | | 05/15/26 | | | | 22,000,000 | |
| | Altice Finco SA (B-/B3)(d)(e) | |
| | 7,000,000 | | | | 8.125 | | | | 01/15/24 | | | | 7,542,500 | |
| | Altice US Finance I Corp. (BB/Ba3)(d)(e) | |
| | 19,000,000 | | | | 5.500 | | | | 05/15/26 | | | | 19,997,500 | |
| | |
| | |
| 78 | | The accompanying notes are an integral part of these financial statements. |
GOLDMAN SACHS HIGH YIELD FUND
| | | | | | | | | | | | | | |
Principal
Amount | | | Interest
Rate | | | Maturity
Date | | | Value | |
| Corporate Obligations – (continued) | |
| Media – (continued) | |
| | AMC Networks, Inc. (BB/Ba3)(d) | |
| $ | 5,000,000 | | | | 5.000 | % | | | 04/01/24 | | | $ | 5,150,000 | |
| | 8,872,000 | | | | 4.750 | | | | 08/01/25 | | | | 8,927,450 | |
| | CCO Holdings LLC/CCO Holdings Capital Corp. (BB/B1)(d) | |
| | 2,000,000 | | | | 5.750 | | | | 09/01/23 | | | | 2,072,500 | |
| | 18,900,000 | | | | 5.875 | (e) | | | 04/01/24 | | | | 20,010,375 | |
| | 23,250,000 | | | | 5.750 | (e) | | | 02/15/26 | | | | 24,383,437 | |
| | 3,555,000 | | | | 5.500 | (e) | | | 05/01/26 | | | | 3,674,981 | |
| | 7,500,000 | | | | 5.875 | (e) | | | 05/01/27 | | | | 7,893,750 | |
| | 12,290,000 | | | | 5.000 | (e) | | | 02/01/28 | | | | 12,290,000 | |
| Cequel Communications Holdings I LLC/Cequel Capital Corp.
(B/Caa1)(d)(e) |
|
| | 5,250,000 | | | | 7.750 | | | | 07/15/25 | | | | 5,801,250 | |
| | Clear Channel Worldwide Holdings, Inc. (B-/Caa1)(d) | |
| | 8,150,000 | | | | 7.625 | | | | 03/15/20 | | | | 8,068,500 | |
| | CSC Holdings LLC (B/B2) | |
| | 6,400,000 | | | | 7.875 | | | | 02/15/18 | | | | 6,536,000 | |
| | 7,600,000 | | | | 8.625 | | | | 02/15/19 | | | | 8,236,500 | |
| | 10,150,000 | | | | 10.125 | (d)(e) | | | 01/15/23 | | | | 11,697,875 | |
| | 2,650,000 | | | | 5.250 | | | | 06/01/24 | | | | 2,673,188 | |
| | CSC Holdings LLC (BB/Ba1)(d)(e) | |
| | 22,100,000 | | | | 5.500 | | | | 04/15/27 | | | | 22,984,000 | |
| | DISH DBS Corp. (B+/Ba3) | |
| | 12,600,000 | | | | 7.875 | | | | 09/01/19 | | | | 13,749,750 | |
| | 3,050,000 | | | | 6.750 | | | | 06/01/21 | | | | 3,343,563 | |
| | 6,440,000 | | | | 5.875 | | | | 07/15/22 | | | | 6,842,500 | |
| | 14,000,000 | | | | 5.875 | | | | 11/15/24 | | | | 14,630,000 | |
| | 2,700,000 | | | | 7.750 | | | | 07/01/26 | | | | 3,094,875 | |
| | iHeartCommunications, Inc. (CC/Caa1)(d) | |
| | 8,150,000 | | | | 9.000 | | | | 12/15/19 | | | | 6,173,625 | |
| | iHeartCommunications, Inc. (C/Ca)(d)(f) | |
| | 4,270,434 | | | | 14.000 | | | | 02/01/21 | | | | 576,509 | |
| | iHeartCommunications, Inc. (CC/Caa1)(d) | |
| | 7,250,000 | | | | 9.000 | | | | 03/01/21 | | | | 5,120,312 | |
| | Nexstar Broadcasting, Inc. (B+/B3)(d)(e) | |
| | 10,000,000 | | | | 5.625 | | | | 08/01/24 | | | | 10,375,000 | |
| | SFR Group SA (B+/B1)(d)(e) | |
| | 15,000,000 | | | | 6.000 | | | | 05/15/22 | | | | 15,656,250 | |
| | 10,000,000 | | | | 7.375 | | | | 05/01/26 | | | | 10,800,000 | |
| | Sirius XM Radio, Inc. (BB/Ba3)(d)(e) | |
| | 4,450,000 | | | | 3.875 | | | | 08/01/22 | | | | 4,550,125 | |
| | 7,000,000 | | | | 6.000 | | | | 07/15/24 | | | | 7,533,750 | |
| | 20,840,000 | | | | 5.000 | | | | 08/01/27 | | | | 21,282,850 | |
| | Tribune Media Co. (BB-/B3)(d) | |
| | 8,000,000 | | | | 5.875 | | | | 07/15/22 | | | | 8,340,000 | |
| | Univision Communications, Inc. (BB-/B2)(d)(e) | |
| | 18,950,000 | | | | 5.125 | | | | 05/15/23 | | | | 19,305,312 | |
| | UPCB Finance IV Ltd. (BB/Ba3)(d)(e) | |
| | 10,000,000 | | | | 5.375 | | | | 01/15/25 | | | | 10,375,000 | |
| | Videotron Ltd. (BB/Ba2) | |
| | 5,000,000 | | | | 5.000 | | | | 07/15/22 | | | | 5,400,000 | |
| | 700,000 | | | | 5.375 | (d)(e) | | | 06/15/24 | | | | 759,500 | |
| | Virgin Media Secured Finance PLC (BB-/Ba3)(d)(e) | |
| | 12,000,000 | | | | 5.500 | | | | 08/15/26 | | | | 12,645,000 | |
| | | | | | | | | | | | | | |
| | | | | | | | | | | | | 408,641,727 | |
| | |
| Corporate Obligations – (continued) | |
| Media – Cable(b)(c) – 0.0% | |
| | Adelphia Communications Corp. (NR/NR) | |
| 2,000,000 | | | | 10.250 | | | | 06/15/49 | | | | — | |
| | |
| Media – Internet – 0.2% | |
| | Netflix, Inc. (B+/B1) | | | | | | | | | |
| | 5,000,000 | | | | 5.500 | | | | 02/15/22 | | | | 5,450,000 | |
| | |
| Metal Fabricate/Hardware(d) – 0.8% | |
| | Novelis Corp. (B/B2)(e) | |
| | 4,800,000 | | | | 6.250 | | | | 08/15/24 | | | | 4,980,000 | |
| | 6,600,000 | | | | 5.875 | | | | 09/30/26 | | | | 6,682,500 | |
| | Park-Ohio Industries, Inc. (B/B3) | |
| | 14,900,000 | | | | 6.625 | | | | 04/15/27 | | | | 15,924,375 | |
| | | | | | | | | | | | | | |
| | | | | | | | | | | | | 27,586,875 | |
| | |
| Mining – 3.1% | |
| | Anglo American Capital PLC (BBB-/Baa3)(e) | |
| | 3,950,000 | | | | 9.375 | | | | 04/08/19 | | | | 4,369,687 | |
| | Constellium NV (B+/B2)(d)(e) | |
| | 1,850,000 | | | | 7.875 | | | | 04/01/21 | | | | 1,961,000 | |
| | Constellium NV (CCC+/Caa1)(d)(e) | |
| | 400,000 | | | | 8.000 | | | | 01/15/23 | | | | 424,000 | |
| | 6,650,000 | | | | 5.750 | | | | 05/15/24 | | | | 6,641,687 | |
| | 4,650,000 | | | | 6.625 | | | | 03/01/25 | | | | 4,783,687 | |
| | First Quantum Minerals Ltd. (B-/B3)(d)(e) | |
| | 5,950,000 | | | | 7.250 | | | | 04/01/23 | | | | 6,143,375 | |
| | 2,300,000 | | | | 7.500 | | | | 04/01/25 | | | | 2,357,500 | |
| | FMG Resources (August 2006) Pty Ltd. (BBB-/Baa3)(d)(e) | |
| | 10,000,000 | | | | 9.750 | | | | 03/01/22 | | | | 11,237,500 | |
| | Freeport-McMoRan, Inc. (BB-/B1)(d) | |
| | 17,650,000 | | | | 3.550 | | | | 03/01/22 | | | | 17,385,250 | |
| | 15,500,000 | | | | 3.875 | | | | 03/15/23 | | | | 15,248,125 | |
| | Hudbay Minerals, Inc. (B+/B3)(d)(e) | |
| | 6,094,000 | | | | 7.250 | | | | 01/15/23 | | | | 6,459,640 | |
| | HudBay Minerals, Inc. (B+/B3)(d)(e) | |
| | 5,656,000 | | | | 7.625 | | | | 01/15/25 | | | | 6,122,620 | |
| | New Gold, Inc. (B/B3)(d)(e) | |
| | 9,000,000 | | | | 6.250 | | | | 11/15/22 | | | | 9,337,500 | |
| | Teck Resources Ltd. (BB/Ba3)(d) | |
| | 2,250,000 | | | | 3.750 | | | | 02/01/23 | | | | 2,280,938 | |
| | 3,700,000 | | | | 6.000 | | | | 08/15/40 | | | | 4,000,625 | |
| | 4,300,000 | | | | 5.200 | | | | 03/01/42 | | | | 4,278,500 | |
| | 3,150,000 | | | | 5.400 | | | | 02/01/43 | | | | 3,138,188 | |
| | | | | | | | | | | | | | |
| | | | | | | | | | | | | 106,169,822 | |
| | |
| Miscellaneous Manufacturing(e) – 0.9% | |
| | Bombardier, Inc. (B-/B3) | |
| | 10,450,000 | | | | 8.750 | | | | 12/01/21 | | | | 11,207,625 | |
| | 1,050,000 | | | | 6.000 | (d) | | | 10/15/22 | | | | 1,018,500 | |
| | 4,700,000 | | | | 7.500 | (d) | | | 03/15/25 | | | | 4,694,125 | |
| | Gates Global LLC (B/Caa2)(d) | |
| | 13,300,000 | | | | 6.000 | | | | 07/15/22 | | | | 13,632,500 | |
| | | | | | | | | | | | | | |
| | | | | | | | | | | | | 30,552,750 | |
| | |
| Noncaptive – Financial(d) – 0.2% | |
| | Icahn Enterprises LP/Icahn Enterprises Finance Corp. (BB+/Ba3) | |
| | 5,850,000 | | | | 6.250 | | | | 02/01/22 | | | | 6,084,000 | |
| | |
| | |
| The accompanying notes are an integral part of these financial statements. | | 79 |
GOLDMAN SACHS HIGH YIELD FUND
Schedule of Investments (continued)
September 30, 2017 (Unaudited)
| | | | | | | | | | | | | | |
Principal
Amount | | | Interest
Rate | | | Maturity
Date | | | Value | |
| Corporate Obligations – (continued) | |
| Oil Field Services – 8.3% | |
| | Antero Resources Corp. (BB/Ba3)(d) | |
| $ | 7,700,000 | | | | 5.375 | % | | | 11/01/21 | | | $ | 7,882,875 | |
| | 6,800,000 | | | | 5.125 | | | | 12/01/22 | | | | 6,936,000 | |
| | 4,150,000 | | | | 5.625 | | | | 06/01/23 | | | | 4,321,187 | |
| | 7,300,000 | | | | 5.000 | | | | 03/01/25 | | | | 7,409,500 | |
| | California Resources Corp. (CCC+/Caa3)(d)(e) | |
| | 3,500,000 | | | | 8.000 | | | | 12/15/22 | | | | 2,275,000 | |
| | California Resources Corp. (CCC-/Ca)(d) | |
| | 7,223,000 | | | | 6.000 | | | | 11/15/24 | | | | 3,250,350 | |
| | Chesapeake Energy Corp. (CCC/Caa2) | |
| | 5,000,000 | | | | 6.625 | | | | 08/15/20 | | | | 5,143,750 | |
| | 743,000 | | | | 6.125 | | | | 02/15/21 | | | | 748,573 | |
| | 1,800,000 | | | | 5.375 | (d) | | | 06/15/21 | | | | 1,725,750 | |
| | 4,850,000 | | | | 5.750 | | | | 03/15/23 | | | | 4,486,250 | |
| | Continental Resources, Inc. (BB+/Ba3)(d) | |
| | 5,000,000 | | | | 5.000 | | | | 09/15/22 | | | | 5,068,750 | |
| | 8,650,000 | | | | 4.500 | | | | 04/15/23 | | | | 8,671,625 | |
| | Denbury Resources, Inc. (B/B3)(d)(e) | |
| | 3,700,000 | | | | 9.000 | | | | 05/15/21 | | | | 3,598,250 | |
| | Ensco PLC (BB/B1)(d) | |
| | 1,950,000 | | | | 4.500 | | | | 10/01/24 | | | | 1,623,375 | |
| | 10,000,000 | | | | 5.750 | | | | 10/01/44 | | | | 7,200,000 | |
| | Exterran Energy Solutions LP/EES Finance Corp. (B+/B3)(d)(e) | |
| | 550,000 | | | | 8.125 | | | | 05/01/25 | | | | 569,250 | |
| | Gulfport Energy Corp. (B+/B2)(d) | |
| | 3,300,000 | | | | 6.000 | | | | 10/15/24 | | | | 3,324,750 | |
| | 6,900,000 | | | | 6.375 | | | | 05/15/25 | | | | 6,986,250 | |
| | Halcon Resources Corp. (B+/Caa1)(d)(e) | |
| | 3,550,000 | | | | 12.000 | | | | 02/15/22 | | | | 4,277,750 | |
| | Halcon Resources Corp. (B-/Caa1)(d)(e) | |
| | 7,500,000 | | | | 6.750 | | | | 02/15/25 | | | | 7,762,500 | |
| Jones Energy Holdings LLC/Jones Energy Finance Corp.
(NR/Caa2)(d) |
|
| | 3,600,000 | | | | 6.750 | | | | 04/01/22 | | | | 2,970,000 | |
| | Laredo Petroleum, Inc. (B/B3)(d) | |
| | 5,000,000 | | | | 5.625 | | | | 01/15/22 | | | | 5,043,750 | |
| | 6,350,000 | | | | 7.375 | | | | 05/01/22 | | | | 6,572,250 | |
| | 5,150,000 | | | | 6.250 | | | | 03/15/23 | | | | 5,330,250 | |
| | MEG Energy Corp. (BB-/Caa2)(d)(e) | |
| | 6,350,000 | | | | 6.375 | | | | 01/30/23 | | | | 5,524,500 | |
| | 6,000,000 | | | | 7.000 | | | | 03/31/24 | | | | 5,160,000 | |
| | Nabors Industries, Inc. (BBB-/Ba3)(e) | |
| | 5,000,000 | | | | 0.750 | | | | 01/15/24 | | | | 4,065,625 | |
| | Noble Holding International Ltd. (BB-/B2) | |
| | 738,000 | | | | 4.900 | | | | 08/01/20 | | | | 718,628 | |
| | 7,350,000 | | | | 7.750 | (d)(l) | | | 01/15/24 | | | | 6,541,500 | |
| | 3,000,000 | | | | 6.950 | (d) | | | 04/01/25 | | | | 2,568,750 | |
| | Oasis Petroleum, Inc. (BB-/B3)(d) | |
| | 3,500,000 | | | | 6.500 | | | | 11/01/21 | | | | 3,570,000 | |
| | 7,125,000 | | | | 6.875 | (l) | | | 03/15/22 | | | | 7,249,687 | |
| | Precision Drilling Corp. (BB/B3)(d) | |
| | 3,600,000 | | | | 7.750 | | | | 12/15/23 | | | | 3,676,500 | |
| | Range Resources Corp. (BB+/B1)(d) | |
| | 2,000,000 | | | | 5.000 | (e) | | | 08/15/22 | | | | 1,995,000 | |
| | 6,950,000 | | | | 4.875 | | | | 05/15/25 | | | | 6,845,750 | |
| | |
| Corporate Obligations – (continued) | |
| Oil Field Services – (continued) | |
| | Rice Energy, Inc. (BB-/B3)(d) | |
| 1,100,000 | | | | 6.250 | | | | 05/01/22 | | | | 1,152,250 | |
| | 6,900,000 | | | | 7.250 | | | | 05/01/23 | | | | 7,434,750 | |
| | Rowan Cos., Inc. (B+/B2)(d) | |
| | 4,100,000 | | | | 4.875 | | | | 06/01/22 | | | | 3,833,500 | |
| | 3,000,000 | | | | 4.750 | | | | 01/15/24 | | | | 2,610,000 | |
| | 2,650,000 | | | | 7.375 | | | | 06/15/25 | | | | 2,597,000 | |
| | 4,550,000 | | | | 5.400 | | | | 12/01/42 | | | | 3,458,000 | |
| | Seven Generations Energy Ltd. (B+/Ba3)(d)(e) | |
| | 7,400,000 | | | | 6.875 | | | | 06/30/23 | | | | 7,825,500 | |
| | SM Energy Co. (NR/NR) | |
| | 3,650,000 | | | | 1.500 | | | | 07/01/21 | | | | 3,415,936 | |
| | SM Energy Co. (B+/B2)(d) | |
| | 8,000,000 | | | | 6.500 | | | | 11/15/21 | | | | 8,080,000 | |
| | 5,750,000 | | | | 6.750 | | | | 09/15/26 | | | | 5,764,375 | |
| | Sunoco LP/Sunoco Finance Corp. (B+/B1)(d) | |
| | 7,000,000 | | | | 5.500 | | | | 08/01/20 | | | | 7,210,000 | |
| | 3,850,000 | | | | 6.250 | | | | 04/15/21 | | | | 4,032,875 | |
| | 4,800,000 | | | | 6.375 | | | | 04/01/23 | | | | 5,100,000 | |
| | Transocean, Inc. (B+/Caa1) | |
| | 4,000,000 | | | | 5.050 | (d) | | | 10/15/22 | | | | 3,930,000 | |
| | 15,000,000 | | | | 7.500 | (l) | | | 04/15/31 | | | | 13,650,000 | |
| | Trinidad Drilling Ltd. (BB-/Caa1)(d)(e) | |
| | 9,300,000 | | | | 6.625 | | | | 02/15/25 | | | | 8,707,125 | |
| | Weatherford International Ltd. (B/Caa1) | |
| | 1,650,000 | | | | 7.750 | (d)�� | | | 06/15/21 | | | | 1,716,000 | |
| | 3,000,000 | | | | 4.500 | (d)(l) | | | 04/15/22 | | | | 2,782,500 | |
| | 3,000,000 | | | | 8.250 | (d) | | | 06/15/23 | | | | 3,090,000 | |
| | 13,150,000 | | | | 6.500 | | | | 08/01/36 | | | | 11,276,125 | |
| | Whiting Petroleum Corp. (BB-/B3)(d) | |
| | 9,500,000 | | | | 5.000 | | | | 03/15/19 | | | | 9,523,750 | |
| | WPX Energy, Inc. (B+/B3)(d) | |
| | 7,000,000 | | | | 8.250 | | | | 08/01/23 | | | | 7,848,750 | |
| | | | | | | | | | | | | | |
| | | | | | | | | | | | | 286,132,361 | |
| | |
| Packaging – 1.3% | |
| | ARD Finance SA (B-/Caa2)(d)(f) | |
| EUR | 7,000,000 | | | | 6.625 | | | | 09/15/23 | | | | 8,833,405 | |
| $ | 9,550,000 | | | | 7.125 | | | | 09/15/23 | | | | 10,218,500 | |
| Ardagh Packaging Finance PLC/Ardagh Holdings USA, Inc.
(B/B3)(d)(e) |
|
| | 5,772,000 | | | | 7.250 | | | | 05/15/24 | | | | 6,327,555 | |
| | 7,850,000 | | | | 6.000 | | | | 02/15/25 | | | | 8,321,000 | |
| | Multi-Color Corp. (B+/B2)(d)(e) | |
| | 3,150,000 | | | | 4.875 | | | | 11/01/25 | | | | 3,189,375 | |
| Reynolds Group Issuer, Inc./Reynolds Group Issuer LLC/
Reynolds Group Issuer Lu (B+/B1)(d)(e) |
|
| | 9,350,000 | | | | 5.125 | | | | 07/15/23 | | | | 9,724,000 | |
| | Smurfit-Stone Container Corp. (NR/NR)(b)(c) | |
| | 8,500,000 | | | | 8.000 | | | | 03/15/17 | | | | — | |
| | Stone Container Finance Co. of Canada II (NR/WR)(b)(c)(d) | |
| | 2,250,000 | | | | 7.375 | | | | 07/15/14 | | | | — | |
| | | | | | | | | | | | | | |
| | | | | | | | | | | | | 46,613,835 | |
| | |
| | |
| 80 | | The accompanying notes are an integral part of these financial statements. |
GOLDMAN SACHS HIGH YIELD FUND
| | | | | | | | | | | | | | |
Principal
Amount | | | Interest
Rate | | | Maturity
Date | | | Value | |
| Corporate Obligations – (continued) | |
| Paper(b)(c) – 0.0% | |
| | Jefferson Smurfit Corp. (NR/NR) | |
| $ | 1,750,000 | | | | 0.750 | % | | | 06/01/13 | | | $ | — | |
| | 6,000,000 | | | | 8.250 | | | | 10/01/49 | | | | — | |
| | | | | | | | | | | | | | |
| | | | | | | | | | | | | — | |
| | |
| Pharmaceuticals(d)(e) – 2.1% | |
| | Endo Dac/Endo Finance LLC/Endo Finco, Inc. (CCC+/B3) | |
| | 11,800,000 | | | | 6.000 | | | | 07/15/23 | | | | 9,735,000 | |
| | Valeant Pharmaceuticals International, Inc. (B-/Caa1) | |
| | 18,650,000 | | | | 5.375 | | | | 03/15/20 | | | | 18,603,375 | |
| | 6,900,000 | | | | 6.375 | | | | 10/15/20 | | | | 6,917,250 | |
| | 2,800,000 | | | | 7.500 | | | | 07/15/21 | | | | 2,793,000 | |
| | 7,300,000 | | | | 6.750 | | | | 08/15/21 | | | | 7,172,250 | |
| | 5,000,000 | | | | 7.250 | | | | 07/15/22 | | | | 4,887,500 | |
| | 400,000 | | | | 5.500 | | | | 03/01/23 | | | | 351,000 | |
| | 16,200,000 | | | | 5.875 | | | | 05/15/23 | | | | 14,296,500 | |
| | Valeant Pharmaceuticals International, Inc. (BB-/Ba3) | |
| | 6,700,000 | | | | 7.000 | | | | 03/15/24 | | | | 7,152,250 | |
| | | | | | | | | | | | | | |
| | | | | | | | | | | | | 71,908,125 | |
| | |
| Pipelines – 3.8% | |
| | Cheniere Corpus Christi Holdings LLC (BB-/Ba3)(d)(e) | |
| | 11,400,000 | | | | 5.125 | | | | 06/30/27 | | | | 11,742,000 | |
| | Cheniere Energy Partners LP (BB/Ba2)(d)(e) | |
| | 18,515,000 | | | | 5.250 | | | | 10/01/25 | | | | 18,931,587 | |
| | DCP Midstream Operating LP (BB/Ba2) | |
| | 2,100,000 | | | | 2.500 | (d) | | | 12/01/17 | | | | 2,100,000 | |
| | 6,650,000 | | | | 9.750 | (e) | | | 03/15/19 | | | | 7,281,750 | |
| | 600,000 | | | | 5.350 | (e) | | | 03/15/20 | | | | 627,000 | |
| | 950,000 | | | | 6.750 | (e) | | | 09/15/37 | | | | 1,016,500 | |
| | 10,692,000 | | | | 5.600 | (d) | | | 04/01/44 | | | | 10,023,750 | |
| | Energy Transfer Equity LP (BB-/Ba2) | |
| | 4,000,000 | | | | 7.500 | | | | 10/15/20 | | | | 4,510,000 | |
| | 6,900,000 | | | | 5.875 | (d) | | | 01/15/24 | | | | 7,452,000 | |
| | 450,000 | | | | 5.500 | (d) | | | 06/01/27 | | | | 473,625 | |
| | Genesis Energy LP/Genesis Energy Finance Corp. (BB-/B1)(d) | |
| | 3,611,000 | | | | 6.000 | | | | 05/15/23 | | | | 3,583,918 | |
| | 11,100,000 | | | | 6.500 | | | | 10/01/25 | | | | 10,961,250 | |
| | NGPL PipeCo LLC (BB+/Ba1)(d)(e) | |
| | 1,310,000 | | | | 4.375 | | | | 08/15/22 | | | | 1,359,125 | |
| | 4,390,000 | | | | 4.875 | | | | 08/15/27 | | | | 4,598,525 | |
| Summit Midstream Holdings LLC/Summit Midstream Finance
Corp. (B+/B2)(d) |
|
| | 11,850,000 | | | | 5.750 | | | | 04/15/25 | | | | 12,057,375 | |
| Targa Resources Partners LP/Targa Resources Partners Finance
Corp. (BB-/Ba3)(d) |
|
| | 5,000,000 | | | | 5.250 | | | | 05/01/23 | | | | 5,125,000 | |
| | 6,000,000 | | | | 4.250 | | | | 11/15/23 | | | | 5,947,500 | |
| | 4,500,000 | | | | 5.375 | | | | 02/01/27 | | | | 4,691,250 | |
| | The Williams Cos., Inc. (BB+/Ba2) | |
| | 2,000,000 | | | | 7.875 | | | | 09/01/21 | | | | 2,340,000 | |
| | 3,650,000 | | | | 7.500 | | | | 01/15/31 | | | | 4,386,439 | |
| | 9,600,000 | | | | 7.750 | | | | 06/15/31 | | | | 11,688,000 | |
| | 2,000,000 | | | | 5.750 | (d) | | | 06/24/44 | | | | 2,115,000 | |
| | | | | | | | | | | | | | |
| | | | | | | | | | | | | 133,011,594 | |
| | |
| Corporate Obligations – (continued) | |
| Real Estate Investment Trust(d) – 2.7% | |
| | DuPont Fabros Technology LP (BBB/Baa2) | |
| 10,000,000 | | | | 5.625 | | | | 06/15/23 | | | | 10,650,000 | |
| | Equinix, Inc. (BB+/B1) | |
| | 11,050,000 | | | | 5.750 | | | | 01/01/25 | | | | 11,920,187 | |
| | 4,600,000 | | | | 5.875 | | | | 01/15/26 | | | | 5,048,500 | |
| | 12,745,000 | | | | 5.375 | | | | 05/15/27 | | | | 13,828,325 | |
| | iStar, Inc. (BB-/B1) | |
| | 6,680,000 | | | | 4.625 | | | | 09/15/20 | | | | 6,821,950 | |
| | 5,000,000 | | | | 6.000 | | | | 04/01/22 | | | | 5,168,750 | |
| MGM Growth Properties Operating Partnership LP/MGP Finance
Co-Issuer, Inc. (BB-/B1) |
|
| | 8,700,000 | | | | 5.625 | | | | 05/01/24 | | | | 9,417,750 | |
| | 5,000,000 | | | | 4.500 | | | | 09/01/26 | | | | 5,075,000 | |
| MGM Growth Properties Operating Partnership LP/MGP Finance
Co-Issuer, Inc. (BB-/Ba3)(e) |
|
| | 4,275,000 | | | | 4.500 | | | | 01/15/28 | | | | 4,307,063 | |
| | MPT Operating Partnership LP/MPT Finance Corp. (BBB-/Ba1) | |
| | 1,000,000 | | | | 6.375 | | | | 03/01/24 | | | | 1,078,750 | |
| | 2,950,000 | | | | 5.250 | | | | 08/01/26 | | | | 3,045,875 | |
| | 15,200,000 | | | | 5.000 | | | | 10/15/27 | | | | 15,580,000 | |
| | | | | | | | | | | | | | |
| | | | | | | | | | | | | 91,942,150 | |
| | |
| Retailing – 2.3% | |
| | 1011778 BC ULC/New Red Finance, Inc. (NR/B3)(d)(e) | |
| | 12,550,000 | | | | 5.000 | | | | 10/15/25 | | | | 12,738,250 | |
| | JC Penney Corp., Inc. (B/B3) | |
| | 2,850,000 | | | | 6.375 | | | | 10/15/36 | | | | 2,023,500 | |
| | 9,350,000 | | | | 7.400 | (g) | | | 04/01/37 | | | | 7,059,250 | |
| KFC Holding Co./Pizza Hut Holdings LLC/Taco Bell of America
LLC (BB/B1)(d)(e) |
|
| | 4,490,000 | | | | 5.000 | | | | 06/01/24 | | | | 4,725,725 | |
| | 10,640,000 | | | | 5.250 | | | | 06/01/26 | | | | 11,251,800 | |
| | New Red Finance, Inc. (B+/Ba3)(d)(e) | |
| | 11,500,000 | | | | 4.250 | | | | 05/15/24 | | | | 11,543,125 | |
| | PetSmart, Inc. (CCC+/B3)(d)(e) | |
| | 8,000,000 | | | | 7.125 | | | | 03/15/23 | | | | 6,260,000 | |
| | Rite Aid Corp. (B-/B3)(d)(e) | |
| | 18,700,000 | | | | 6.125 | | | | 04/01/23 | | | | 18,185,750 | |
| | Yum! Brands, Inc. (B+/B2)(d) | |
| | 7,476,000 | | | | 5.350 | | | | 11/01/43 | | | | 7,055,475 | |
| | | | | | | | | | | | | | |
| | | | | | | | | | | | | 80,842,875 | |
| | |
| Semiconductors – 1.1% | |
| | Advanced Micro Devices, Inc. (B-/Caa1) | |
| | 3,000,000 | | | | 7.500 | | | | 08/15/22 | | | | 3,386,250 | |
| | 6,700,000 | | | | 7.000 | (d) | | | 07/01/24 | | | | 7,102,000 | |
| | Micron Technology, Inc. (BB/Ba3)(d)(e) | |
| | 12,000,000 | | | | 5.250 | | | | 08/01/23 | | | | 12,540,000 | |
| | Micron Technology, Inc. (BBB-/Baa2)(d) | |
| | 4,000,000 | | | | 7.500 | | | | 09/15/23 | | | | 4,445,000 | |
| | Qorvo, Inc. (BB+/Ba1)(d) | |
| | 3,750,000 | | | | 6.750 | | | | 12/01/23 | | | | 4,078,125 | |
| | 4,300,000 | | | | 7.000 | | | | 12/01/25 | | | | 4,891,250 | |
| | | | | | | | | | | | | | |
| | | | | | | | | | | | | 36,442,625 | |
| | |
| | |
| The accompanying notes are an integral part of these financial statements. | | 81 |
GOLDMAN SACHS HIGH YIELD FUND
Schedule of Investments (continued)
September 30, 2017 (Unaudited)
| | | | | | | | | | | | | | |
Principal
Amount | | | Interest
Rate | | | Maturity
Date | | | Value | |
| Corporate Obligations – (continued) | |
| Software – 2.5% | |
| | BMC Software Finance, Inc. (CCC+/Caa1)(d)(e) | |
| $ | 16,250,000 | | | | 8.125 | % | | | 07/15/21 | | | $ | 16,717,187 | |
| Change Healthcare Holdings LLC/Change Healthcare Finance,
Inc. (B-/B3)(d)(e) |
|
| | 14,500,000 | | | | 5.750 | | | | 03/01/25 | | | | 14,790,000 | |
| | CURO Financial Technologies Corp. (B-/Caa1)(d)(e) | |
| | 7,700,000 | | | | 12.000 | | | | 03/01/22 | | | | 8,277,500 | |
| | First Data Corp. (BB/Ba3)(d)(e) | |
| | 10,350,000 | | | | 5.000 | | | | 01/15/24 | | | | 10,751,063 | |
| | Infor US, Inc. (CCC+/Caa1) | |
| EUR | 5,000,000 | | | | 5.750 | | | | 05/15/22 | | | | 6,172,947 | |
| $ | 10,450,000 | | | | 6.500 | (d) | | | 05/15/22 | | | | 10,815,750 | |
| | Nuance Communications, Inc. (BB-/Ba3)(d)(e) | |
| | 4,286,000 | | | | 5.375 | | | | 08/15/20 | | | | 4,350,290 | |
| | 5,000,000 | | | | 5.625 | | | | 12/15/26 | | | | 5,300,000 | |
| | Open Text Corp. (BB+/Ba2)(d)(e) | |
| | 7,000,000 | | | | 5.875 | | | | 06/01/26 | | | | 7,665,000 | |
| | | | | | | | | | | | | | |
| | | | | | | | | | | | | 84,839,737 | |
| | |
| Telecommunication Services – 11.1% | |
| | Alcatel-Lucent USA, Inc. (NR/WR) | |
| | 16,195,000 | | | | 6.450 | | | | 03/15/29 | | | | 18,340,837 | |
| | Anixter, Inc. (BB/Ba3) | |
| | 6,500,000 | | | | 5.500 | | | | 03/01/23 | | | | 7,068,750 | |
| | CenturyLink, Inc. (BB/Ba3) | |
| | 9,350,000 | | | | 6.450 | | | | 06/15/21 | | | | 9,770,750 | |
| | 5,680,000 | | | | 6.875 | | | | 01/15/28 | | | | 5,474,100 | |
| | 6,000,000 | | | | 7.600 | | | | 09/15/39 | | | | 5,310,000 | |
| | Cincinnati Bell, Inc. (B-/B3)(d)(e) | |
| | 7,000,000 | | | | 7.000 | | | | 07/15/24 | | | | 6,860,000 | |
| | Digicel Group Ltd. (NR/Caa1)(d)(e) | |
| | 11,800,000 | | | | 8.250 | | | | 09/30/20 | | | | 11,527,184 | |
| | 5,000,000 | | | | 7.125 | | | | 04/01/22 | | | | 4,543,750 | |
| | Digicel Ltd. (NR/B1)(d)(e) | |
| | 19,000,000 | | | | 6.750 | | | | 03/01/23 | | | | 18,643,750 | |
| | Frontier Communications Corp. (B/B2) | |
| | 5,322,000 | | | | 8.500 | (l) | | | 04/15/20 | | | | 5,162,340 | |
| | 5,100,000 | | | | 6.250 | (d) | | | 09/15/21 | | | | 4,182,000 | |
| | 4,300,000 | | | | 7.625 | | | | 04/15/24 | | | | 3,278,750 | |
| | 5,750,000 | | | | 11.000 | (d) | | | 09/15/25 | | | | 4,858,750 | |
| | Intelsat Jackson Holdings SA (CCC+/Caa2)(d) | |
| | 7,750,000 | | | | 7.500 | | | | 04/01/21 | | | | 7,343,125 | |
| | 10,950,000 | | | | 9.750 | (e) | | | 07/15/25 | | | | 11,114,250 | |
| | Intelsat Luxembourg SA (CCC-/Ca)(d) | |
| | 8,450,000 | | | | 7.750 | | | | 06/01/21 | | | | 5,450,250 | |
| | Level 3 Financing, Inc. (BB-/B1)(d) | |
| | 6,500,000 | | | | 5.375 | | | | 05/01/25 | | | | 6,695,000 | |
| | 10,800,000 | | | | 5.250 | | | | 03/15/26 | | | | 11,043,000 | |
| | Nokia OYJ (BB+/Ba1) | |
| | 6,585,000 | | | | 4.375 | | | | 06/12/27 | | | | 6,778,006 | |
| | SoftBank Group Corp. (BB+/Ba1)(e) | |
| | 1,650,000 | | | | 4.500 | | | | 04/15/20 | | | | 1,697,438 | |
| | Sprint Capital Corp. (B/B3) | |
| | 6,600,000 | | | | 8.750 | | | | 03/15/32 | | | | 8,431,500 | |
| | Sprint Communications, Inc. (B+/B1)(e) | |
| | 7,000,000 | | | | 9.000 | | | | 11/15/18 | | | | 7,516,250 | |
| | |
| Corporate Obligations – (continued) | |
| Telecommunication Services – (continued) | |
| | Sprint Communications, Inc. (B/B3) | |
| 17,150,000 | | | | 7.000 | | | | 08/15/20 | | | | 18,736,375 | |
| | 14,700,000 | | | | 11.500 | | | | 11/15/21 | | | | 18,669,000 | |
| | Sprint Corp. (B/B3) | |
| | 12,750,000 | | | | 7.250 | | | | 09/15/21 | | | | 14,120,625 | |
| | 28,200,000 | | | | 7.875 | | | | 09/15/23 | | | | 32,712,000 | |
| | 3,700,000 | | | | 7.625 | (d) | | | 02/15/25 | | | | 4,255,000 | |
| | T-Mobile USA, Inc. (BB/Ba3)(d) | |
| | 5,000,000 | | | | 4.000 | | | | 04/15/22 | | | | 5,175,000 | |
| | 8,800,000 | | | | 6.625 | | | | 04/01/23 | | | | 9,262,000 | |
| | 3,450,000 | | | | 6.500 | | | | 01/15/26 | | | | 3,803,625 | |
| | 3,600,000 | | | | 5.375 | | | | 04/15/27 | | | | 3,870,000 | |
| | Telecom Italia Capital SA (BB+/Ba1) | |
| | 450,000 | | | | 6.375 | | | | 11/15/33 | | | | 515,813 | |
| | 1,550,000 | | | | 6.000 | | | | 09/30/34 | | | | 1,705,000 | |
| | 16,150,000 | | | | 7.200 | | | | 07/18/36 | | | | 19,945,250 | |
| | 18,250,000 | | | | 7.721 | | | | 06/04/38 | | | | 23,314,375 | |
| | Telecom Italia SpA (BB+/Ba1)(e) | |
| | 17,250,000 | | | | 5.303 | | | | 05/30/24 | | | | 18,673,125 | |
| | Wind Acquisition Finance SA (BB/Ba3)(d)(e) | |
| | 250,000 | | | | 6.500 | | | | 04/30/20 | | | | 258,750 | |
| | Wind Acquisition Finance SA (B/B3)(d)(e) | |
| | 16,050,000 | | | | 7.375 | | | | 04/23/21 | | | | 16,611,750 | |
| | Windstream Corp. (B/B2)(d) | |
| | 3,250,000 | | | | 7.500 | | | | 06/01/22 | | | | 2,340,000 | |
| | Windstream Services LLC (B/B2)(d) | |
| | 19,550,000 | | | | 7.750 | | | | 10/15/20 | | | | 15,640,000 | |
| | 5,550,000 | | | | 7.750 | | | | 10/01/21 | | | | 4,037,625 | |
| | | | | | | | | | | | | | |
| | | | | | | | | | | | | 384,735,093 | |
| | |
| Transportation(d)(e) – 0.1% | |
| Neovia Logistics Services LLC/SPL Logistics Finance Corp.
(CCC+/Caa1) |
|
| | 5,150,000 | | | | 8.875 | | | | 08/01/20 | | | | 4,326,000 | |
| | |
| Trucking & Leasing(e) – 0.8% | |
| | DAE Funding LLC (BB/Ba3)(d) | |
| | 8,400,000 | | | | 4.000 | | | | 08/01/20 | | | | 8,536,500 | |
| | Park Aerospace Holdings Ltd. (BB/Ba3) | |
| | 2,750,000 | | | | 3.625 | (d) | | | 03/15/21 | | | | 2,756,875 | |
| | 8,250,000 | | | | 5.250 | | | | 08/15/22 | | | | 8,572,905 | |
| | 6,800,000 | | | | 4.500 | (d) | | | 03/15/23 | | | | 6,783,000 | |
| | | | | | | | | | | | | | |
| | | | | | | | | | | | | 26,649,280 | |
| | |
| | TOTAL CORPORATE OBLIGATIONS | |
| | (Cost $2,978,159,111) | | | $ | 3,103,654,480 | |
| | |
| | | | | | | | |
| Shares | | |
Description | | Value | |
| Common Stocks – 1.0% | |
| Capital Markets – 0.0% | |
| | 28,148 | | | Motors Liquidation Co. | | $ | 280,073 | |
| | |
| Health Care Services(b)(c) – 0.0% | |
| | 3,874 | | | CB Paracelsus Healthcare | | | — | |
| | |
| | |
| 82 | | The accompanying notes are an integral part of these financial statements. |
GOLDMAN SACHS HIGH YIELD FUND
| | | | | | | | |
| Shares | | |
Description | | Value | |
| Common Stocks – (continued) | |
| Media – 0.0%(b)(c) | |
| | 21 | | | New Cotai Class B Shares | | $ | — | |
| | |
| Oil, Gas & Consumable Fuels – 1.0% | |
| | 10 | | | Nycomed(b)(c) | | | — | |
| | 1,185,421 | | | Berry Petroleum Corp.(c)(h) | | | 10,520,611 | |
| | 13,494 | | | Berry Pete Corp.(c)(h) | | | 150,971 | |
| | 670,713 | | | Blue Ridge Mountain Resources, Inc.(c)(h) | | | 6,572,987 | |
| | 124,461 | | | Chaparral Energy, Inc. | | | 2,436,363 | |
| | 416,437 | | | Chaparral Energy, Inc. Class A(c) | | | 9,369,833 | |
| | 700,185 | | | Whiting Petroleum Corp.(c) | | | 3,823,010 | |
| | | | | | | | |
| | | | | | | 32,873,775 | |
| | |
| Paper & Forest Products(b)(c) – 0.0% | |
| | 2,500 | | | Port Townsend Holdings Co., Inc. | | | — | |
| | |
| Pharmaceuticals(b)(c) – 0.0% | |
| | 40 | | | Dawn Holdings, Inc. | | | — | |
| | |
| | TOTAL COMMON STOCKS | | | | |
| | (Cost $45,271,564) | | $ | 33,153,848 | |
| | |
| | | | | | | | |
| Shares | | | Rate | | Value | |
| | Preferred Stocks – 0.4% | |
| Energy – Exploration & Production(h) – 0.3% | |
| | Berry Petroleum Corp. | |
| | 1,067,392 | | | 0.000% | | $ | 11,941,982 | |
| | |
| Media – Broadcasting & Radio(f)(g) – 0.1% | |
| | Spanish Broadcasting System, Inc. | |
| | 3,014 | | | 10.750 | | | 2,109,800 | |
| | |
| | TOTAL PREFERRED STOCKS – 0.4% | |
| | (Cost $13,716,254) | | $ | 14,051,782 | |
| | |
| | | | | | |
| Units | | Expiration
Date | | Value | |
| Warrant(b)(c) – 0.0% | |
Lender Process Services, Inc. (NR/NR) | |
| 14,274 | | 12/31/20 | | $ | — | |
| (Cost $21,898,892) | |
| |
| | | | | | |
| Shares | | Distribution
Rate | | Value | |
| Exchange Traded Fund(i) – 1.4% | |
| Exchange Traded Funds – 1.4% | |
Goldman Sachs TreasuryAccess 0-1 Year ETF (NR/NR) | |
| 499,800 | | 0.921% | | $ | 50,054,970 | |
| (Cost $50,026,376) | |
| |
| Investment Company(i) – 4.3% | |
Goldman Sachs Financial Square Government Fund – Institutional Shares | |
| 146,952,453 | | 0.927 | | $ | 146,952,453 | |
| (Cost $146,952,453) | |
| |
| TOTAL INVESTMENTS — 100.2% | |
| (Cost $3,388,809,053) | | $ | 3,461,296,367 | |
| |
| | | | | | | | | | | | | | |
Principal
Amount | | | Interest Rate
(Paid) Received | | | Maturity
Date | | | Value | |
| Reverse Repurchase Agreements – (2.2)% | |
| | Barclays Reverse Repurchase Agreement (NR/NR) | |
| $ | (2,970,000 | ) | | | (0.250 | )% | | | 06/14/18 | | | $ | (2,970,000 | ) |
| | (4,122,813 | ) | | | (1.250 | ) | | | 06/18/18 | | | | (4,122,813 | ) |
| | (526,875 | ) | | | (0.000 | ) | | | 07/13/18 | | | | (526,875 | ) |
| | (1,844,600 | ) | | | (0.250 | ) | | | 07/19/18 | | | | (1,844,600 | ) |
| | (7,169,850 | ) | | | (0.500 | ) | | | 07/19/18 | | | | (7,169,850 | ) |
| | (741,125 | ) | | | (0.500 | ) | | | 07/26/18 | | | | (741,125 | ) |
| | (3,649,125 | ) | | | (0.250 | ) | | | 08/10/18 | | | | (3,649,125 | ) |
| | (1,611,000 | ) | | | (0.750 | ) | | | 08/16/18 | | | | (1,611,000 | ) |
| | (3,320,625 | ) | | | (1.250 | ) | | | 08/16/18 | | | | (3,320,625 | ) |
| | (1,839,612 | ) | | | (1.000 | ) | | | 09/01/18 | | | | (1,839,612 | ) |
| | (1,557,600 | ) | | | (1.750 | ) | | | 09/11/18 | | | | (1,557,600 | ) |
| | (1,223,250 | ) | | | (2.000 | ) | | | 09/21/18 | | | | (1,223,250 | ) |
| | (970,000 | ) | | | (0.750 | ) | | | 09/29/18 | | | | (970,000 | ) |
| | (3,663,000 | ) | | | (0.500 | ) | | | 05/22/19 | | | | (3,663,000 | ) |
| | (3,672,250 | ) | | | (0.500 | ) | | | 05/23/19 | | | | (3,672,250 | ) |
| | (1,500,000 | ) | | | (0.250 | ) | | | 06/26/19 | | | | (1,500,000 | ) |
| | Citigroup Reverse Repurchase Agreement (NR/NR) | |
| | (5,325,000 | ) | | | (0.010 | ) | | | 07/12/18 | | | | (5,325,000 | ) |
| | (800,000 | ) | | | (0.750 | ) | | | 09/18/18 | | | | (800,000 | ) |
| | (1,762,250 | ) | | | (0.750 | ) | | | 05/09/19 | | | | (1,762,250 | ) |
| | First Boston Reverse Repurchase Agreement (NR/NR) | |
| | (1,804,687 | ) | | | (1.000 | ) | | | 05/12/18 | | | | (1,804,687 | ) |
| | (1,236,000 | ) | | | (1.500 | ) | | | 06/05/18 | | | | (1,236,000 | ) |
| | (1,846,250 | ) | | | (0.500 | ) | | | 09/11/18 | | | | (1,846,250 | ) |
| | (1,844,063 | ) | | | (0.500 | ) | | | 10/03/18 | | | | (1,844,063 | ) |
| | Nomura Reverse Repurchase Agreement (NR/NR) | |
| | (1,688,750 | ) | | | (3.500 | ) | | | 08/09/18 | | | | (1,688,750 | ) |
| | (2,483,590 | ) | | | (0.250 | ) | | | 08/23/18 | | | | (2,483,590 | ) |
| | (12,403,125 | ) | | | (1.000 | ) | | | 09/28/18 | | | | (12,403,125 | ) |
| | (4,826,250 | ) | | | (0.750 | ) | | | 09/29/18 | | | | (4,826,250 | ) |
| | |
| | TOTAL REVERSE REPURCHASE AGREEMENTS | |
| | (Cost $(76,401,690)) | | | $ | (76,401,690 | ) |
| | |
| OTHER ASSETS IN EXCESS OF
OTHER LIABILITIES – 2.0% |
| | | 74,576,628 | |
| | |
| | NET ASSETS – 100.0% | | | $ | 3,455,528,039 | |
| | |
| | |
| The accompanying notes are an integral part of these financial statements. | | 83 |
GOLDMAN SACHS HIGH YIELD FUND
Schedule of Investments (continued)
September 30, 2017 (Unaudited)
| | |
| The percentage shown for each investment category reflects the value of investments in that category as a percentage of net assets. |
(a) | | Bank Loans often require prepayments from excess cash flows or permit the borrower to repay at its election. The degree to which borrowers repay, whether as a contractual requirement or at their election, cannot be predicted with accuracy. As a result, the actual remaining maturity may be substantially less than the stated maturities shown. The stated interest rate represents the weighted average interest rate of all contracts within the bank loan facility on September 30, 2017. Bank Loans typically have rates of interest which are predetermined either daily, monthly, quarterly or semi-annually by reference to a base lending rate, plus a premium. These base lending rates are primarily the London-Interbank Offered Rate (“LIBOR”), and secondarily the prime rate offered by one or more major United States banks (the “Prime Rate”) and the certificate of deposit (“CD”) rate or other base lending rates used by commercial lenders. |
(b) | | Significant unobservable inputs were used in the valuation of this portfolio security; i.e. Level 3. |
(c) | | Security is currently in default and/or non-income producing. |
(d) | | Security with “Call” features with resetting interest rates. Maturity dates disclosed are the final maturity dates. |
(e) | | Exempt from registration under Rule 144A of the Securities Act of 1933. Such securities may be deemed liquid by the investment adviser and may be resold, normally to qualified institutional buyers in transactions exempt from registration. Total market value of Rule 144A securities amounts to $1,382,742,962, which represents approximately 40.0% of net assets as of September 30, 2017. |
(f) | | Pay-in-kind securities. |
(g) | | Security with “Put” features and resetting interest rates. Maturity dates disclosed are the puttable dates. Interest rate disclosed is that which is in effect at September 30, 2017. |
| | |
(h) | | Restricted securities are not registered under the Securities Act of 1933 and are subject to legal restrictions on resale. These securities generally may be resold in transactions exempt from registration or to the public if the securities are subsequently registered and the registration statement is effective. Disposal of these securities may involve time consuming negotiations and prompt sale at an acceptable price may be difficult. Total market value of restricted securities amounts to $22,613,564, which represents approximately 0.7% of net assets as of September 30, 2017. |
| | | | | | | | | | |
| | | Restricted Security | | Acquisition Date | | | Cost | |
| | Berry Petroleum Corp.
(Preferred Stocks) | | | 05/06/16 – 08/18/16 | | | $ | 10,673,910 | |
| | Berry Petroleum Corp.
(Common Stocks) | | | 03/01/17 | | | | 13,632,342 | |
| | Berry Pete Corp.
(Common Stocks) | | | 02/27/17 | | | | 134,940 | |
| | Blue Ridge Mountain Resources
(Common Stock) | | | 02/27/17 – 03/03/2017 | | | | 6,692,580 | |
| | |
(i) | | Represents an Affiliated Issuer. |
(j) | | Variable rate security. Interest rate or distribution rate disclosed is that which is in effect on September 30, 2017. |
(k) | | Actual maturity date is August 15, 2115. |
(l) | | All or a portion of the security was pledged as collateral against open reverse repurchase agreements. As of September 30, 2017, the value of securities pledged amounted to $75,898,444. |
| | |
|
Currency Abbreviations: |
EUR | | —Euro |
USD | | —U.S. Dollar |
| | |
Investment Abbreviations: |
ETF | | —Exchange Traded Fund |
LIBOR | | —London Interbank Offered Rate |
LLC | | —Limited Liability Company |
LP | | —Limited Partnership |
PLC | | —Public Limited Company |
WR | | —Withdrawn Rating |
|
|
| ADDITIONAL INVESTMENT INFORMATION |
FORWARD FOREIGN CURRENCY EXCHANGE CONTRACTS WITH UNREALIZED GAIN — At September 30, 2017, the Fund had the following forward foreign currency exchange contracts:
| | | | | | | | | | | | | | | | | | | | |
| Counterparty | | Currency
Purchased | | | Currency
Sold | | Settlement
Date | | | Unrealized
Gain | |
JPMorgan Securities, Inc. | | | USD | | | | 14,923,784 | | | EUR | | 14,857,230 | | | 10/04/17 | | | $ | 66,554 | |
| | |
| 84 | | The accompanying notes are an integral part of these financial statements. |
GOLDMAN SACHS HIGH YIELD FUND
|
| ADDITIONAL INVESTMENT INFORMATION (continued) |
FUTURES CONTRACTS — At September 30, 2017, the Fund had the following futures contracts:
| | | | | | | | | | | | | | |
| Description | | Number of
Contracts | | | Expiration
Date | | Notional
Amount | | | Unrealized
Appreciation/
(Depreciation) | |
Long position contracts: | | | | | | | | | | | | | | |
5 Year U.S. Treasury Notes | | | 401 | | | 12/29/17 | | $ | 47,117,500 | | | $ | (48,498 | ) |
Ultra Long U.S. Treasury Bonds | | | 45 | | | 12/19/17 | | | 7,430,625 | | | | (131,852 | ) |
2 Year U.S. Treasury Notes | | | 481 | | | 12/29/17 | | | 103,753,204 | | | | (291,207 | ) |
5 Year German Euro-Bobl | | | 6 | | | 12/07/17 | | | 930,250 | | | | (2,740 | ) |
| Total | | | | | | | | | | | | $ | (474,297 | ) |
Short position contracts: | | | | | | | | | | | | | | |
Eurodollars | | | (466 | ) | | 12/17/18 | | | (114,327,275 | ) | | | (42,660 | ) |
10 Year U.S. Treasury Notes | | | (978 | ) | | 12/19/17 | | | (122,555,625 | ) | | | 1,324,898 | |
20 Year U.S. Treasury Bonds | | | (184 | ) | | 12/19/17 | | | (28,117,500 | ) | | | 390,120 | |
| Total | | | | | | | | | | | | $ | 1,672,358 | |
| TOTAL | | | $ | 1,198,061 | |
SWAP CONTRACTS — At September 30, 2017, the Fund had the following swap contracts:
CENTRALLY CLEARED CREDIT DEFAULT SWAP CONTRACTS
| | | | | | | | | | | | | | | | | | | | | | | | | | |
| Referenced Obligation/Index | | Financing Rate
Received/
(Paid)
by the Fund(a) | | Credit
Spread at
September 30,
2017(b) | | | Termination
Date | | | Notional
Amount
(000s) | | | Value | | | Upfront
Premiums
(Received) Paid | | | Unrealized
Appreciation/
(Depreciation) | |
Protection Purchased: | | | | | | | | | | | | | | | | | | | | | | | | | | |
| CDX.NA.HY Index 28 | | (5.000)% | | | 3.135 | % | | | 06/20/22 | | | $ | 38,950 | | | $ | (3,059,027 | ) | | $ | (2,930,485 | ) | | $ | (128,542 | ) |
| CDX.EM Index 27 | | (1.000) | | | 1.723 | | | | 06/20/22 | | | | 32,640 | | | | 1,013,972 | | | | 1,260,830 | | | | (246,858 | ) |
| CDX.EM Index 28 | | (1.000) | | | 1.853 | | | | 12/20/22 | | | | 30,960 | | | | 1,239,868 | | | | 1,292,820 | | | | (52,952 | ) |
CDX.NA.HY Index 29 | | (5.000) | | | 3.253 | | | | 12/20/22 | | | | 11,050 | | | | (880,946 | ) | | | (813,659 | ) | | | (67,287 | ) |
| TOTAL | | | | | | | $ | (1,686,133 | ) | | $ | (1,190,494 | ) | | $ | (495,639 | ) |
| | (a) | | Payments made quarterly. |
| | (b) | | Credit spread on the referenced obligation, together with the term of the swap contract, are indicators of payment/performance risk. The likelihood of a credit event occurring which would require a fund or its counterparty to make a payment or otherwise be required to perform under the swap contract is generally greater as the credit spread and the term of the swap contract increase. |
PURCHASED OPTIONS CONTRACTS — At September 30, 2017, the Fund had the following purchased options:
PURCHASED OPTIONS ON FUTURES CONTRACTS
| | | | | | | | | | | | | | | | | | | | | | | | |
| Description | | Counterparty | | Exercise
Price | | Expiration
Date | | Number of
Contracts | | Notional Amount | | | Market
Value | | | Premiums
Paid (Received) | | | Unrealized
Appreciation/ (Depreciation) | |
Purchased Options Contracts: | | | | | | | | | | | | | | | | | | | | | | | | |
Puts: | | | | | | | | | | | | | | | | | |
| Eurodollar Futures | | MS & Co. LLC | | $98.00 | | 06/15/18 | | 401 | | $ | 1,002,500 | | | $ | 155,387 | | | $ | 111,177 | | | $ | 44,210 | |
| | |
|
Abbreviation: |
CDX.EM Index 27 | | —CDX Emerging Markets Index 27 |
CDX.EM Index 28 | | —CDX Emerging Markets Index 28 |
CDX.NA.HY Index 28 | | —CDX North America High Yield Index 28 |
CDX.NA.HY Index 29 | | —CDX North America High Yield Index 29 |
MS & Co. LLC | | —Morgan Stanley & Co.LLC |
|
| | |
| The accompanying notes are an integral part of these financial statements. | | 85 |
GOLDMAN SACHS HIGH YIELD FLOATING RATE FUND
Schedule of Investments
September 30, 2017 (Unaudited)
| | | | | | | | | | | | | | |
Principal
Amount | | | Interest
Rate | | | Maturity
Date | | | Value | |
| Bank Loans(a) – 79.9% | |
| Aerospace – 0.8% | |
| | Accudyne Industries LLC (NR/NR) (2 mo. LIBOR + 3.750%) | |
| $ | 1,405,000 | | | | 5.013 | % | | | 08/02/24 | | | $ | 1,407,726 | |
| | Transdigm, Inc. (B+/Ba2) | |
| | (3 mo. LIBOR + 3.000%) | |
| | 7,904,182 | | | | 3.845 | | | | 06/04/21 | | | | 7,920,939 | |
| | (1 mo. LIBOR + 3.000%) | |
| | 4,784,947 | | | | 4.152 | | | | 05/14/22 | | | | 4,794,756 | |
| | (3 mo. LIBOR + 3.000%) | |
| | 5,420,113 | | | | 4.235 | | | | 06/09/23 | | | | 5,433,121 | |
| | TransDigm, Inc. (B+/Ba2) (3 mo. LIBOR + 3.000%) | |
| | 14,818,768 | | | | 4.235 | | | | 08/22/24 | | | | 14,835,513 | |
| | | | | | | | | | | | | | |
| | | | | 34,392,055 | |
| | |
| Airlines – 0.9% | |
| | Air Canada (NR/NR) (3 mo. LIBOR + 2.250%) | |
| | 10,150,000 | | | | 3.568 | | | | 10/06/23 | | | | 10,191,209 | |
| | Delta Air Lines, Inc. (BBB-/Baa2) (1 mo. LIBOR + 2.500%) | |
| | 14,712,950 | | | | 3.737 | | | | 10/18/18 | | | | 14,760,179 | |
| | Delta Air Lines, Inc. (NR/NR) (1 mo. LIBOR + 2.500%) | |
| | 736,875 | | | | 3.735 | | | | 08/24/22 | | | | 740,714 | |
| | United Airlines, Inc. (NR/NR) (3 mo. LIBOR + 2.250%) | |
| | 10,473,684 | | | | 3.561 | | | | 04/01/24 | | | | 10,504,267 | |
| | | | | | | | | | | | | | |
| | | | | 36,196,369 | |
| | |
| Auto Components – 0.4% | | | | | | | |
| | USI, Inc. (B/B2) (3 mo. LIBOR + 3.000%) | |
| | 15,700,000 | | | | 4.314 | | | | 05/16/24 | | | | 15,641,125 | |
| | |
| Automotive – Distributor – 0.2% | |
| American Axle & Manufacturing, Inc. (BB/Ba2)
(1 mo. LIBOR + 2.250%) |
|
| | 8,912,188 | | | | 3.490 | | | | 04/06/24 | | | | 8,884,381 | |
| | |
| Automotive – Parts – 0.8% | | | | | | | |
| CS Intermediate Holdco 2 LLC (BBB-/Ba1)
(3 mo. LIBOR + 2.250%) |
|
| | 4,701,199 | | | | 3.583 | | | | 11/02/23 | | | | 4,716,854 | |
| | Gates Global LLC (B+/B2) (3 mo. LIBOR + 3.250%) | |
| | 20,806,479 | | | | 4.583 | | | | 04/01/24 | | | | 20,884,504 | |
| | Jason, Inc. (B/B3)(b)(3 mo. LIBOR + 4.500%) | |
| | 8,674,289 | | | | 5.833 | | | | 06/30/21 | | | | 8,153,831 | |
| | | | | | | | | | | | | | |
| | | | | 33,755,189 | |
| | |
| Beverages – 0.1% | | | | | | | |
| | Refresco Group BV (NR/NR) | |
| | 4,200,000 | | | | 2.750 | | | | 09/26/24 | | | | 4,210,500 | |
| | |
| Building Materials – 1.3% | | | | | | | |
| American Builders & Contractors Supply Co., Inc. (BB+/B1)
(1 mo. LIBOR + 2.500%) |
|
| | 28,895,293 | | | | 3.735 | | | | 10/31/23 | | | | 28,993,248 | |
| Associated Asphalt Partners LLC (B/Caa1)
(1 mo. LIBOR + 5.250%) |
|
| | 4,264,313 | | | | 6.485 | | | | 04/05/24 | | | | 4,179,026 | |
| | Atkore International, Inc. (B+/B2) (3 mo. LIBOR + 3.000%) | |
| | 22,790,161 | | | | 4.340 | | | | 12/22/23 | | | | 22,904,112 | |
| | | | | | | | | | | | | | |
| | | | | 56,076,386 | |
| | |
| Bank Loans(a) – (continued) | |
| Building Products – 0.8% | |
| | CPG International, Inc. (B/B2) (3 mo. LIBOR + 3.750%) | |
| $ | 3,847,612 | | | | 5.083 | % | | | 05/03/24 | | | $ | 3,871,659 | |
| | Jeld-Wen, Inc. (BB-/B1) (3 mo. LIBOR + 3.000%) | |
| | 27,805,126 | | | | 4.333 | | | | 07/01/22 | | | | 28,007,825 | |
| | Mannington Mills, Inc. (BB-/B1) (1 mo. LIBOR + 3.750%) | |
| | 3,295,097 | | | | 4.750 | | | | 10/01/21 | | | | 3,293,054 | |
| | | | | | | | | | | | | | |
| | | | | 35,172,538 | |
| | |
| Capital Goods – Others – 0.3% | |
| Avis Budget Car Rental LLC (BBB-/Baa3)
(3 mo. LIBOR + 2.000%) |
|
| | 12,406,250 | | | | 3.340 | | | | 03/15/22 | | | | 12,328,711 | |
| | Columbus McKinnon Corp. (NR/NR) (3 mo. LIBOR + 3.000%) | |
| | 2,663,886 | | | | 4.333 | | | | 01/31/24 | | | | 2,670,546 | |
| | | | | | | | | | | | | | |
| | | | | 14,999,257 | |
| | |
| Chemicals – 2.7% | |
| | Alpha 3 BV (B+/B1) (3 mo. LIBOR + 3.000%) | |
| | 14,122,106 | | | | 4.333 | | | | 01/31/24 | | | | 14,157,412 | |
| | Ashland, Inc. (BB+/Ba1) (1 mo. LIBOR + 2.000%) | |
| | 5,885,250 | | | | 3.319 | | | | 05/17/24 | | | | 5,905,848 | |
| Axalta Coating Systems US Holdings, Inc. (BBB-/Ba1)
(3 mo. LIBOR + 2.000%) |
|
| | 29,319,129 | | | | 3.333 | | | | 06/01/24 | | | | 29,450,478 | |
| Emerald Performance Materials LLC (B/B1)
(1 mo. LIBOR + 3.500%) |
|
| | 7,228,436 | | | | 6.000 | | | | 08/01/21 | | | | 7,264,578 | |
| Emerald Performance Materials LLC (B-/Caa1) (1 mo. LIBOR +
7.750%) |
|
| | 6,350,000 | | | | 8.985 | | | | 08/01/22 | | | | 6,332,157 | |
| | The Chemours Co. (BB+/Ba1) (1 mo. LIBOR + 2.500%) | |
| | 5,894,605 | | | | 3.740 | | | | 05/12/22 | | | | 5,924,078 | |
| | Univar, Inc. (BB/B2) (1 mo. LIBOR + 2.750%) | |
| | 29,062,863 | | | | 3.985 | | | | 07/01/22 | | | | 29,153,830 | |
| | Versum Materials, Inc. (BB+/Ba1) (3 mo. LIBOR + 2.500%) | |
| | 14,503,500 | | | | 3.833 | | | | 09/29/23 | | | | 14,521,629 | |
| | | | | | | | | | | | | | |
| | | | | 112,710,010 | |
| | |
| Construction & Engineering – 0.1% | |
| | Pike Corp. (NR/NR) (3 mo. LIBOR + 3.500%) | |
| | 2,917,688 | | | | 4.740 | | | | 09/20/24 | | | | 2,952,350 | |
| | |
| Construction Machinery – 0.4% | |
| | Clark Equipment Co. (BB-/B1) (3 mo. LIBOR + 2.750%) | |
| | 8,283,375 | | | | 4.083 | | | | 05/18/24 | | | | 8,326,863 | |
| | Milacron LLC (B/B2) (1 mo. LIBOR + 3.000%) | |
| | 9,472,735 | | | | 4.235 | | | | 09/28/23 | | | | 9,508,257 | |
| | | | | | | | | | | | | | |
| | | | | 17,835,120 | |
| | |
| Construction Materials – 0.1% | |
| | Forterra Finance LLC (B-/B3) | |
| | 4,917,781 | | | | 4.000 | | | | 10/25/23 | | | | 4,158,279 | |
| | |
| Consumer Cyclical Services – Business – 1.1% | |
| | Colorado Buyer, Inc. (B+/Ba3) (3 mo. LIBOR + 3.000%) | |
| | 8,628,375 | | | | 4.310 | | | | 05/01/24 | | | | 8,657,107 | |
| | Colorado Buyer, Inc. (NR/NR) (3 mo. LIBOR + 7.250%) | |
| | 2,875,000 | | | | 8.570 | | | | 05/01/25 | | | | 2,913,324 | |
| | Sabre GLBL, Inc. (BB-/Ba2) (1 mo. LIBOR + 2.250%) | |
| | 19,799,370 | | | | 3.485 | | | | 02/22/24 | | | | 19,884,706 | |
| | |
| | |
| 86 | | The accompanying notes are an integral part of these financial statements. |
GOLDMAN SACHS HIGH YIELD FLOATING RATE FUND
| | | | | | | | | | | | | | |
Principal
Amount | | | Interest
Rate | | | Maturity
Date | | | Value | |
| Bank Loans(a) – (continued) | |
| Consumer Cyclical Services – Business – (continued) | |
| | Tempo Acquisition LLC (B/B1) (1 mo. LIBOR + 3.000%) | |
| $ | 14,975,000 | | | | 4.235 | % | | | 05/01/24 | | | $ | 14,978,145 | |
| | | | | | | | | | | | | | |
| | | | | | | | | | | | | 46,433,282 | |
| | |
| Consumer Products – Household & Leisure – 1.7% | |
| Bombardier Recreational Products, Inc. (BB/Ba3)
(1 mo. LIBOR + 3.000%) |
|
| | 15,371,184 | | | | 4.240 | | | | 06/30/23 | | | | 15,423,292 | |
| | Coty, Inc. (BB+/Ba1) (1 mo. LIBOR + 2.500%) | |
| | 4,186,463 | | | | 3.035 | | | | 10/27/22 | | | | 4,165,530 | |
| | Galleria Co. (BB+/Ba1) (1 mo. LIBOR + 3.000%) | |
| | 8,500,000 | | | | 4.250 | | | | 09/29/23 | | | | 8,468,125 | |
| | Prestige Brands, Inc. (BB-/B1) (1 mo. LIBOR + 2.750%) | |
| | 11,342,659 | | | | 3.985 | | | | 01/26/24 | | | | 11,387,236 | |
| | Renfro Corp. (B/B3) (3 mo. LIBOR + 4.500%)(b) | |
| | 21,831,838 | | | | 5.750 | | | | 01/30/19 | | | | 21,668,099 | |
| | Spectrum Brands, Inc. (BB+/Ba1) (3 mo. LIBOR + 2.000%) | |
| | 9,134,648 | | | | 3.312 | | | | 06/23/22 | | | | 9,182,879 | |
| | | | | | | | | | | | | | |
| | | | | | | | | | | | | 70,295,161 | |
| | |
| Consumer Products – Industrial – 0.2% | |
| | Southwire Co. (BB+/Ba2) (1 mo. LIBOR + 2.500%) | |
| | 8,737,801 | | | | 4.750 | | | | 02/10/21 | | | | 8,759,646 | |
| | |
| Containers & Packaging – 1.2% | |
| | Anchor Glass Container Corp. (B/B1) (3 mo. LIBOR + 2.750%) | |
| | 1,584,424 | | | | 4.067 | | | | 12/07/23 | | | | 1,589,795 | |
| Berry Plastics Group, Inc. (BB/Ba3)
(1 mo. LIBOR + 2.250%) |
|
| | 14,195,775 | | | | 3.485 | | | | 02/08/20 | | | | 14,237,653 | |
| | (1 mo. LIBOR + 2.250%) | |
| | 17,435,295 | | | | 3.485 | | | | 01/06/21 | | | | 17,483,242 | |
| | (1 mo. LIBOR + 2.250%) | |
| | 2,528,626 | | | | 3.485 | | | | 10/01/22 | | | | 2,534,947 | |
| | (1 mo. LIBOR + 2.250%) | |
| | 920,375 | | | | 3.485 | | | | 01/19/24 | | | | 920,890 | |
| | BWAY Holding Co. (B-/B2) (1 mo. LIBOR + 3.250%) | |
| | 12,468,750 | | | | 6.500 | | | | 04/03/24 | | | | 12,497,678 | |
| | | | | | | | | | | | | | |
| | | | | | | | | | | | | 49,264,205 | |
| | |
| Diversified Manufacturing – 1.6% | |
| | Cortes NP Acquisition Corp. (B+/Ba3) (1 mo. LIBOR + 4.000%) | |
| | 5,515,733 | | | | 5.239 | | | | 11/30/23 | | | | 5,554,784 | |
| | CPM Holdings, Inc. (B/B1) (1 mo. LIBOR + 4.250%) | |
| | 7,165,340 | | | | 5.485 | | | | 04/11/22 | | | | 7,231,047 | |
| Crosby US Acquisition Corp. (B-/Caa1)
(3 mo. LIBOR + 3.000%) |
|
| | 21,986,827 | | | | 4.315 | | | | 11/23/20 | | | | 20,282,848 | |
| | Dynacast International LLC (B/B1) (3 mo. LIBOR + 3.250%) | |
| | 3,420,917 | | | | 4.583 | | | | 01/28/22 | | | | 3,435,901 | |
| | |
| | Rexnord LLC (BB-/B1) (3 mo. LIBOR + 2.750%) | |
| | 29,206,874 | | | | 3.750 | | | | 08/21/23 | | | | 29,305,301 | |
| | | | | | | | | | | | | | |
| | | | | | | | | | | | | 65,809,881 | |
| | |
| Electrical(k) – 0.2% | | | | | | | |
| | Techem GmbH (NR/NR) | |
| | EUR7,975,000 | | | | 0.000 | | | | 07/31/24 | | | | 9,471,653 | |
| | |
| Bank Loans(a) – (continued) | |
| Energy – 3.3% | | | | | | | |
| American Energy – Marcellus LLC (D/Ca)
(1 mo. LIBOR + 4.250%)(b) |
|
| $ | 12,798,830 | | | | 5.485 | | | | 08/04/20 | | | | 9,463,199 | |
| American Energy – Marcellus LLC (D/C)
(1 mo. LIBOR + 7.500%)(b) |
|
| | 34,190,000 | | | | 8.724 | | | | 08/04/21 | | | | 2,151,235 | |
| Blue Ridge Mountain Resources, Inc. (NR/NR)
(PIK + 7.000%)(b)(c) |
|
| | 2,049,014 | | | | 8.312 | | | | 05/06/19 | | | | 2,049,014 | |
| | Chesapeake Energy Corp. (B+/B3) (3 mo. LIBOR + 7.500%) | |
| | 14,465,000 | | | | 8.814 | | | | 08/23/21 | | | | 15,572,440 | |
| | CITGO Holding, Inc. (B-/Caa1) (3 mo. LIBOR + 8.500%) | |
| | 3,591,276 | | | | 9.796 | | | | 05/12/18 | | | | 3,618,498 | |
| | FTS International, Inc. (CCC+/Caa2) (1 mo. LIBOR + 4.750%) | |
| | 9,900,000 | | | | 5.985 | | | | 04/16/21 | | | | 9,237,987 | |
| | Jonah Energy LLC (B/B3) (3 mo. LIBOR + 6.500%) | |
| | 9,250,000 | | | | 9.750 | | | | 05/12/21 | | | | 9,226,875 | |
| | MEG Energy Corp. (BB+/Ba3) (3 mo. LIBOR + 3.500%) | |
| | 61,352,071 | | | | 4.833 | | | | 12/31/23 | | | | 61,064,330 | |
| | Murray Energy Corp. (B-/B2) (3 mo. LIBOR + 7.250%) | |
| | 23,046,942 | | | | 8.583 | | | | 04/16/20 | | | | 21,078,502 | |
| | Peabody Energy Corp. (B+/Ba3) (1 mo. LIBOR + 3.500%) | |
| | 7,839,671 | | | | 4.739 | | | | 03/31/22 | | | | 7,874,009 | |
| | | | | | | | | | | | | | |
| | | | | | | | | | | | | 141,336,089 | |
| | |
| Entertainment – 0.7% | | | | | | | |
| | AMC Entertainment, Inc. (BB/Ba1) (1 mo. LIBOR + 2.250%) | |
| | 4,657,250 | | | | 3.484 | | | | 12/15/23 | | | | 4,633,964 | |
| | Cedar Fair LP (BBB-/Ba1) (1 mo. LIBOR + 2.250%) | |
| | 2,254,000 | | | | 3.485 | | | | 04/13/24 | | | | 2,265,270 | |
| Lions Gate Entertainment Corp. (NR/NR) (1 mo.
LIBOR + 3.000%) |
|
| | 5,781,250 | | | | 4.235 | | | | 12/08/23 | | | | 5,824,609 | |
| | NEP/NCP Holdco, Inc. (NR/NR) (1 mo. LIBOR + 7.000%) | |
| | 15,038,306 | | | | 8.231 | | | | 01/23/23 | | | | 15,113,497 | |
| | | | | | | | | | | | | | |
| | | | | | | | | | | | | 27,837,340 | |
| | |
| Environmental – 0.7% | | | | | | | |
| | EnergySolutions LLC (B/B3) (3 mo. LIBOR + 4.750%) | |
| | 25,612,079 | | | | 6.090 | | | | 05/29/20 | | | | 25,996,260 | |
| | Wrangler Buyer Corp. (B/B1) | |
| | 3,700,000 | | | | 3.000 | | | | 09/20/24 | | | | 3,716,946 | |
| | | | | | | | | | | | | | |
| | | | | 29,713,206 | |
| | |
| Finance – 2.4% | |
| | Avolon TLB Borrower 1 (Luxembourg) S.a.r.l. (BBB-/Ba1) | |
| | (1 mo. LIBOR + 2.250%) | |
| | 3,740,625 | | | | 3.486 | | | | 09/20/20 | | | | 3,752,782 | |
| | |
| Avolon TLB Borrower 1 (Luxembourg) S.a.r.l.
(BBB-/Ba1) (continued) |
|
| | (1 mo. LIBOR + 2.750%) | |
| | 55,012,125 | | | | 3.486 | | | | 04/03/22 | | | | 55,114,998 | |
| | CeramTec Acquisition Corp. (B/Ba3) | |
| | (3 mo. LIBOR + 2.750%) | |
| | 618,537 | | | | 4.067 | | | | 08/30/20 | | | | 620,083 | |
| | |
| | |
| The accompanying notes are an integral part of these financial statements. | | 87 |
GOLDMAN SACHS HIGH YIELD FLOATING RATE FUND
Schedule of Investments (continued)
September 30, 2017 (Unaudited)
| | | | | | | | | | | | | | |
Principal
Amount | | | Interest
Rate | | | Maturity
Date | | | Value | |
| Bank Loans(a) – (continued) | |
| Finance – (continued) | |
| | CeramTec Acquisition Corp. (B/Ba3) (continued) | |
| | (3 mo. LIBOR + 2.750%) | |
| $ | 1,510,219 | | | | 4.067 | % | | | 08/30/20 | | | $ | 1,513,994 | |
| | (3 mo. LIBOR + 2.750%) | |
| | 4,979,599 | | | | 4.067 | | | | 08/30/20 | | | | 4,992,048 | |
| Fortress Investment Group LLC (NR/NR)
(1 mo. LIBOR + 2.750%) |
|
| | 6,550,000 | | | | 2.750 | | | | 06/14/22 | | | | 6,610,849 | |
| | LBM Borrower LLC (B+/B3) (1 mo. LIBOR + 4.500%) | |
| | 14,197,595 | | | | 5.735 | | | | 08/19/22 | | | | 14,291,441 | |
| | SBA Senior Finance II LLC (BB/B1) (1 mo. LIBOR + 2.250%) | |
| | 15,939,441 | | | | 3.250 | | | | 03/24/21 | | | | 15,975,305 | |
| | | | | | | | | | | | | | |
| | | | | | | | | | | | | 102,871,500 | |
| | |
| Financial Co. – Non Captive – 0.5% | |
| Victory Capital Management, Inc. (NR/NR)
(3 mo. LIBOR + 5.250%) |
|
| | 20,983,858 | | | | 6.583 | | | | 10/29/21 | | | | 21,324,846 | |
| | |
| Food & Beverages – 3.4% | |
| American Seafoods Group LLC (NR/NR)
(1 mo. LIBOR + 3.250%) |
|
| | 4,075,000 | | | | 4.570 | | | | 08/21/23 | | | | 4,080,094 | |
| | Blue Buffalo Co. Ltd. (BB+/Ba2) (1 mo. LIBOR + 2.000%) | |
| | 1,183,731 | | | | 3.235 | | | | 05/27/24 | | | | 1,190,396 | |
| Candy Intermediate Holdings, Inc. (B-/B3)
(1 mo. LIBOR + 4.500%) |
|
| | 24,906,212 | | | | 5.735 | | | | 06/15/23 | | | | 24,376,955 | |
| | Dole Food Co., Inc. (NR/NR) (PRIME + 1.750%) | |
| | 5,714,063 | | | | 4.014 | | | | 04/06/24 | | | | 5,727,433 | |
| | High Liner Foods, Inc. (B+/B2) (3 mo. LIBOR + 3.250%) | |
| | 8,590,614 | | | | 4.583 | | | | 04/24/21 | | | | 8,601,352 | |
| | Shearer’s Foods, Inc. (B/B3) | |
| | (3 mo. LIBOR + 3.937%) | |
| | 16,814,949 | | | | 5.270 | | | | 06/30/21 | | | | 16,772,912 | |
| | (3 mo. LIBOR + 4.250%) | |
| | 1,961,419 | | | | 5.583 | | | | 06/30/21 | | | | 1,958,967 | |
| | Shearer’s Foods, Inc. (CCC+/Caa2) (3 mo. LIBOR + 6.750%)(b) | |
| | 21,250,000 | | | | 8.083 | | | | 06/30/22 | | | | 20,081,250 | |
| | US Foods, Inc. (BB/B1) (1 mo. LIBOR + 2.750%) | |
| | 59,478,588 | | | | 3.985 | | | | 06/27/23 | | | | 59,815,237 | |
| | | | | | | | | | | | | | |
| | | | | | | | | | | | | 142,604,596 | |
| | |
| Food & Drug Retailers – 2.5% | |
| | BJ’s Wholesale Club, Inc. (B-/B3) (1 mo. LIBOR + 3.750%) | |
| | 67,655,438 | | | | 4.982 | | | | 02/03/24 | | | | 64,755,726 | |
| | BJ’s Wholesale Club, Inc. (CCC/Caa2) (1 mo. LIBOR + 7.500%) | |
| | 27,925,000 | | | | 8.732 | | | | 02/03/25 | | | | 26,626,488 | |
| | Rite Aid Corp. (BB-/B2) | |
| | (1 mo. LIBOR + 4.750%) | |
| | 7,590,000 | | | | 5.990 | | | | 08/21/20 | | | | 7,640,625 | |
| | (1 mo. LIBOR + 3.875%) | |
| | 7,195,000 | | | | 5.115 | | | | 06/21/21 | | | | 7,218,959 | |
| | | | | | | | | | | | | | |
| | | | | | | | | | | | | 106,241,798 | |
| | |
| Bank Loans(a) – (continued) | |
| Food & Staples Retailing – 0.2% | |
| | Albertsons LLC (BB/Ba2) | |
| | (1 mo. LIBOR + 2.750%) | |
| 5,512,720 | | | | 3.985 | | | | 08/25/21 | | | | 5,310,293 | |
| | (3 mo. LIBOR + 3.000%) | |
| | 1,982,531 | | | | 4.330 | | | | 12/21/22 | | | | 1,908,543 | |
| | | | | | | | | | | | | | |
| | | | | | | | | | | | | 7,218,836 | |
| | |
| Gaming – 1.1% | |
| | Aristocrat Leisure Ltd. (NR/NR) | |
| | 2,050,000 | | | | 2.000 | | | | 09/19/24 | | | | 2,052,050 | |
| | Caesars Entertainment Operating Co., Inc. (NR/NR)(c) | |
| | 6,890,990 | | | | 1.500 | | | | 03/01/22 | | | | 8,833,422 | |
| | 3,000,000 | | | | 1.500 | | | | 03/31/22 | | | | 3,000,630 | |
| Caesars Entertainment Resort Properties LLC (BB/B1) (1 mo.
LIBOR + 3.500%) |
|
| | 11,901,350 | | | | 4.735 | | | | 10/11/20 | | | | 11,916,226 | |
| | CityCenter Holdings LLC (BB-/B1) (1 mo. LIBOR + 2.500%) | |
| | 6,134,625 | | | | 3.735 | | | | 04/18/24 | | | | 6,158,428 | |
| | Eldorado Resorts LLC (NR/NR) (3 mo. LIBOR + 2.250%) | |
| | 8,518,535 | | | | 3.563 | | | | 04/17/24 | | | | 8,507,887 | |
| | Seminole Tribe of Florida (NR/NR) (3 mo. LIBOR + 2.000%) | |
| | 7,100,000 | | | | 3.456 | | | | 07/06/24 | | | | 7,131,098 | |
| | | | | | | | | | | | | | |
| | | | | | | | | | | | | 47,599,741 | |
| | |
| Health Care – 0.4% | |
| | Community Health Systems, Inc. (B+/Ba3) | |
| | (3 mo. LIBOR + 2.750%) | |
| | 4,668,308 | | | | 4.067 | | | | 12/31/19 | | | | 4,638,664 | |
| | (3 mo. LIBOR + 3.000%) | |
| | 14,647,128 | | | | 3.445 | | | | 01/27/21 | | | | 14,541,522 | |
| | | | | | | | | | | | | | |
| | | | | | | | | | | | | 19,180,186 | |
| | |
| Health Care – Pharmaceuticals – 2.3% | |
| Grifols Worldwide Operations USA, Inc. (BB/Ba2)
(3 mo. LIBOR + 2.250%) |
|
| | 33,676,882 | | | | 5.500 | | | | 01/31/25 | | | | 33,728,071 | |
| Valeant Pharmaceuticals International, Inc. (BB-/Ba3)
(1 mo. LIBOR + 4.750%) |
|
| | 64,813,759 | | | | 5.570 | | | | 04/01/22 | | | | 65,954,481 | |
| | | | | | | | | | | | | | |
| | | | | | | | | | | | | 99,682,552 | |
| | |
| Health Care – Services – 7.6% | |
| 21st Century Oncology Holdings, Inc. (NR/NR)(b)
(3 mo. LIBOR + 7.500%) |
|
| | 1,130,796 | | | | 6.103 | | | | 11/24/17 | | | | 1,136,450 | |
| 21st Century Oncology Holdings, Inc. (D/WR)
(3 mo. LIBOR + 6.125%) |
|
| | 12,526,875 | | | | 7.425 | | | | 04/30/22 | | | | 11,768,999 | |
| | Air Medical Group Holdings, Inc. (B/B1) | |
| | (1 mo. LIBOR + 3.250%) | |
| | 16,392,532 | | | | 4.485 | | | | 04/28/22 | | | | 16,265,490 | |
| | (1 mo. LIBOR + 4.000%) | |
| $ | 35,276,425 | | | | 5.237 | | | | 04/28/22 | | | | 35,223,511 | |
| | Air Methods Corp. (B+/B1) (3 mo. LIBOR + 3.500%) | |
| | 10,547,392 | | | | 4.833 | | | | 04/21/24 | | | | 10,397,935 | |
| | American Renal Holdings, Inc. (NR/NR) (1 mo. LIBOR + 3.250%) | |
| | 11,496 ,188 | | | | 4.485 | | | | 06/14/24 | | | | 11,420,773 | |
| | |
| | |
| 88 | | The accompanying notes are an integral part of these financial statements. |
GOLDMAN SACHS HIGH YIELD FLOATING RATE FUND
| | | | | | | | | | | | | | |
Principal
Amount | | | Interest
Rate | | | Maturity
Date | | | Value | |
| Bank Loans(a) – (continued) | |
| Health Care – Services – (continued) | |
| Change Healthcare Holdings, Inc. (B+/Ba3)
(1 mo. LIBOR + 2.750%) |
|
| $ | 33,687,550 | | | | 3.985 | % | | | 03/01/24 | | | $ | 33,763,347 | |
| | ExamWorks Group, Inc. (NR/NR) (1 mo. LIBOR + 3.250%) | |
| | 3,885,824 | | | | 4.485 | | | | 07/27/23 | | | | 3,904,281 | |
| | HCA, Inc. (NR/NR) | |
| | (1 mo. LIBOR + 2.000%) | |
| | 7,931,358 | | | | 3.235 | | | | 03/17/23 | | | | 7,955,152 | |
| | (1 mo. LIBOR + 2.250%) | |
| | 9,895,275 | | | | 3.485 | | | | 02/15/24 | | | | 9,941,189 | |
| | MPH Acquisition Holdings LLC (B+/B1) (3 mo. LIBOR + 3.000%) | |
| | 40,725,512 | | | | 4.333 | | | | 06/07/23 | | | | 41,018,328 | |
| | Press Ganey Holdings, Inc. (B/B2) (1 mo. LIBOR + 3.250%) | |
| | 5,806,125 | | | | 4.485 | | | | 10/21/23 | | | | 5,831,556 | |
| Sedgwick Claims Management Services, Inc. (B+/B1)
(1 mo. LIBOR + 2.750%) |
|
| | 15,482,160 | | | | 3.985 | | | | 03/01/21 | | | | 15,497,642 | |
| | Sedgwick Claims Management Services, Inc. (CCC+/Caa2) | |
| | (1 mo. LIBOR + 5.750%) | |
| | 13,600,758 | | | | 6.985 | | | | 02/28/22 | | | | 13,702,763 | |
| | (3 mo. LIBOR + 5.750%) | |
| | 12,850,000 | | | | 7.067 | | | | 02/28/22 | | | | 12,946,375 | |
| Sterigenics-Nordion Holdings LLC (B/B1)
(1 Week LIBOR + 3.000%) |
|
| | 20,152,284 | | | | 4.235 | | | | 05/15/22 | | | | 20,152,284 | |
| | Team Health Holdings, Inc. (NR/NR) (1 mo. LIBOR + 2.750%) | |
| | 20,422,375 | | | | 3.985 | | | | 02/06/24 | | | | 20,026,794 | |
| | U.S. Renal Care, Inc. (B/B2) (3 mo. LIBOR + 4.250%) | |
| | 48,808,605 | | | | 5.583 | | | | 12/31/22 | | | | 47,197,921 | |
| | U.S. Renal Care, Inc. (CCC+/Caa2) (3 mo. LIBOR + 8.000%) | |
| | 4,025,000 | | | | 9.333 | | | | 12/31/23 | | | | 3,909,281 | |
| | | | | | | | | | | | | | |
| | | | | | | | | | | | | 322,060,071 | |
| | |
| Lodging – 0.8% | |
| | Four Seasons Holdings, Inc. (BB/B1) (1 mo. LIBOR + 2.500%) | |
| | 7,979,446 | | | | 3.500 | | | | 11/30/23 | | | | 8,031,791 | |
| Hilton Worldwide Finance LLC (BBB-/Ba1)
(1 mo. LIBOR + 2.000%) |
|
| | 7,947,082 | | | | 3.215 | | | | 10/25/23 | | | | 7,978,393 | |
| La Quinta Intermediate Holding LLC (BB/B1)
(3 mo. LIBOR + 2.750%) |
|
| | 16,350,148 | | | | 4.054 | | | | 04/14/21 | | | | 16,391,023 | |
| | | | | | | | | | | | | | |
| | | | | | | | | | | | | 32,401,207 | |
| | |
| Machinery-Diversified – 0.2% | |
| | Gardner Denver, Inc. (NR/NR) (3 mo. LIBOR + 2.750%) | |
| | 4,409,728 | | | | 4.083 | | | | 07/30/24 | | | | 4,413,609 | |
| | Hayward Industries, Inc. (B/B3) (1 mo. LIBOR + 3.500%) | |
| | 3,000,000 | | | | 4.735 | | | | 08/05/24 | | | | 3,017,490 | |
| | | | | | | | | | | | | | |
| | | | | | | | | | | | | 7,431,099 | |
| | |
| Media – Broadcasting & Radio – 4.1% | |
| | Atlantic Broadband Finance LLC (NR/NR) | |
| | 12,750,000 | | | | 2.750 | | | | 08/11/24 | | | | 12,664,320 | |
| | Cable One, Inc. (NR/NR) (3 mo. LIBOR + 2.250%)(b) | |
| | 4,987,500 | | | | 3.570 | | | | 05/01/24 | | | | 5,012,438 | |
| | |
| Bank Loans(a) – (continued) | |
| Media – Broadcasting & Radio – (continued) | |
| Communications Sales & Leasing, Inc. (B+/B1)
(1 mo. LIBOR + 3.000%) |
|
| 7,908,794 | | | | 4.235 | | | | 10/24/22 | | | | 7,307,725 | |
| | Entercom Radio LLC (BB-/B1) (1 mo. LIBOR + 3.500%) | |
| | 6,870,000 | | | | 4.731 | | | | 11/01/23 | | | | 6,878,588 | |
| | Getty Images, Inc. (CCC/B3) (3 mo. LIBOR + 3.500%) | |
| | 72,566,578 | | | | 4.833 | | | | 10/18/19 | | | | 62,619,151 | |
| | iHeart Communications, Inc. (CC/Caa1) | |
| | (3 mo. LIBOR + 6.750%) | |
| | 9,525,000 | | | | 8.083 | | | | 01/30/19 | | | | 7,339,203 | |
| | (3 mo. LIBOR + 7.500%) | |
| | 22,272,038 | | | | 8.833 | | | | 07/30/19 | | | | 17,160,605 | |
| | MH Sub I LLC (NR/NR) (3 mo. LIBOR + 3.750%) | |
| | 19,350,000 | | | | 4.820 | | | | 09/13/24 | | | | 19,220,936 | |
| | Nexstar Broadcasting, Inc. (BB+/Ba3) (1 mo. LIBOR + 2.500%) | |
| | 11,769,560 | | | | 3.737 | | | | 01/17/24 | | | | 11,796,865 | |
| | Sesac Holdco II LLC (B+/B2) (1 mo. LIBOR + 3.250%) | |
| | 1,467,625 | | | | 4.507 | | | | 02/23/24 | | | | 1,452,949 | |
| | Tribune Media Co. (BB+/Ba3) | |
| | (1 mo. LIBOR + 3.000%) | |
| | 952,474 | | | | 4.235 | | | | 12/27/20 | | | | 953,369 | |
| | (1 mo. LIBOR + 3.000%) | |
| | 11,871,374 | | | | 4.235 | | | | 01/27/24 | | | | 11,882,533 | |
| Univision Communications, Inc. (BB-/B2) (1 mo.
LIBOR + 2.750%) |
|
| | 10,518,128 | | | | 3.985 | | | | 03/15/24 | | | | 10,419,573 | |
| | | | | | | | | | | | | | |
| | | | | | | | | | | | | 174,708,255 | |
| | |
| Media – Cable – 3.0% | |
| | Altice Financing SA (BB-/B1) (3 mo. LIBOR + 2.750%) | |
| | 5,015,938 | | | | 4.054 | | | | 07/15/25 | | | | 5,019,098 | |
| | Charter Communications Operating LLC (BBB-/Ba1) | |
| | (1 mo. LIBOR + 2.000%) | |
| | 28,944,044 | | | | 3.240 | | | | 07/01/20 | | | | 29,030,008 | |
| | (1 mo. LIBOR + 2.000%) | |
| | 14,281,029 | | | | 3.240 | | | | 01/03/21 | | | | 14,314,733 | |
| | (1 mo. LIBOR + 2.000%) | |
| | 3,801,767 | | | | 3.240 | | | | 01/15/22 | | | | 3,810,815 | |
| | (1 mo. LIBOR + 2.250%) | |
| | 7,979,794 | | | | 3.476 | | | | 01/15/24 | | | | 8,009,718 | |
| | Charter NEX US Holdings, Inc. (B/B2) (1 mo. LIBOR + 3.250%) | |
| | 2,992,500 | | | | 4.485 | | | | 05/16/24 | | | | 2,999,981 | |
| | CSC Holdings LLC (BB/Ba1) (1 mo. LIBOR + 2.250%) | |
| | 13,961,104 | | | | 5.250 | | | | 07/17/25 | | | | 13,871,334 | |
| | Numericable Group SA (B+/B1) (3 mo. LIBOR + 2.750%) | |
| | 5,785,500 | | | | 4.061 | | | | 07/31/25 | | | | 5,755,126 | |
| | Numericable U.S. LLC (B+/B1) (3 mo. LIBOR + 3.250%) | |
| | 1,521,168 | | | | 4.561 | | | | 01/14/25 | | | | 1,525,184 | |
| | UPC Financing Partnership (BB/Ba3) (1 mo. LIBOR + 2.750%) | |
| | 1,442,849 | | | | 3.984 | | | | 04/15/25 | | | | 1,446,687 | |
| Virgin Media Investment Holdings Ltd. (BB-/Ba3) (1 mo.
LIBOR + 2.750%) |
|
| | 24,950,000 | | | | 3.984 | | | | 01/31/25 | | | | 25,034,331 | |
| Wave Division Holdings LLC (BB-/Ba3)
(2 mo. LIBOR + 2.750%) |
|
| | 8,099,465 | | | | 3.990 | | | | 10/15/19 | | | | 8,099,465 | |
| | |
| | |
| The accompanying notes are an integral part of these financial statements. | | 89 |
GOLDMAN SACHS HIGH YIELD FLOATING RATE FUND
Schedule of Investments (continued)
September 30, 2017 (Unaudited)
| | | | | | | | | | | | | | |
Principal
Amount | | | Interest
Rate | | | Maturity
Date | | | Value | |
| Bank Loans(a) – (continued) | |
| Media – Cable – (continued) | |
| | Ziggo Secured Finance BV (BB-/Ba3) (1 mo. LIBOR + 2.500%) | |
| $ | 9,525,000 | | | | 3.734 | % | | | 04/15/25 | | | $ | 9,516,713 | |
| | | | | | | | | | | | | | |
| | | | | 128,433,193 | |
| | |
| Media – Non Cable – 4.3% | |
| Advantage Sales & Marketing, Inc. (B/B1)
(1 mo. LIBOR + 3.250%) |
|
| | 15,498,479 | | | | 4.485 | | | | 07/23/21 | | | | 14,558,961 | |
| Advantage Sales & Marketing, Inc. (CCC+/Caa1)
(1 mo. LIBOR + 6.500%) |
|
| | 4,203,226 | | | | 7.735 | | | | 07/25/22 | | | | 3,759,786 | |
| Cengage Learning Acquisitions, Inc. (B+/B2)
(1 mo. LIBOR + 4.250%) |
|
| | 10,387,430 | | | | 5.485 | | | | 06/07/23 | | | | 9,554,566 | |
| | Checkout Holding Corp. (B-/B1) (1 mo. LIBOR + 3.500%) | |
| | 37,174,320 | | | | 4.500 | | | | 04/09/21 | | | | 31,117,880 | |
| | Checkout Holding Corp. (CCC-/Caa1) (1 mo. LIBOR + 6.750%) | |
| | 23,600,000 | | | | 7.985 | | | | 04/11/22 | | | | 13,599,500 | |
| | EMI Music Publishing Ltd. (BB-/Ba3) (1 mo. LIBOR + 2.500%) | |
| | 7,631,982 | | | | 3.731 | | | | 08/21/23 | | | | 7,644,804 | |
| McGraw-Hill Global Education Holdings LLC (B+/Ba3) (1 mo.
LIBOR + 4.000%) |
|
| | 19,157,507 | | | | 5.235 | | | | 05/04/22 | | | | 18,791,407 | |
| | Mission Broadcasting, Inc. (BB+/Ba3) (1 mo. LIBOR + 2.500%) | |
| | 1,454,974 | | | | 3.737 | | | | 01/17/24 | | | | 1,458,350 | |
| | NEP/NCP Holdco, Inc. (B+/B1) | |
| | (1 mo. LIBOR + 3.250%) | |
| | 31,584,356 | | | | 4.476 | | | | 07/21/22 | | | | 31,492,129 | |
| | (EURIBOR + 3.000%) | |
| EUR | 5,885,499 | | | | 3.750 | | | | 11/17/23 | | | | 7,008,245 | |
| | Nielsen Finance LLC (BBB-/Ba1) (1 mo. LIBOR + 2.000%) | |
| $ | 10,469,511 | | | | 3.235 | | | | 10/04/23 | | | | 10,479,352 | |
| | Renaissance Learning, Inc. (B-/B2) (3 mo. LIBOR + 3.750%) | |
| | 15,439,961 | | | | 5.083 | | | | 04/09/21 | | | | 15,531,674 | |
| Renaissance Learning, Inc. (CCC/Caa2)
(3 mo. LIBOR + 7.000%) |
|
| | 9,423,236 | | | | 8.333 | | | | 04/11/22 | | | | 9,493,910 | |
| | WMG Acquisition Corp. (B+/Ba3) (1 mo. LIBOR + 2.500%) | |
| | 6,087,047 | | | | 3.737 | | | | 11/01/23 | | | | 6,097,516 | |
| | | | | | | | | | | | | | |
| | | | | 180,588,080 | |
| | |
| Metals & Mining – 0.8% | |
| Global Brass & Copper, Inc. (NR/NR)
(1 mo. LIBOR + 3.250%)(b) |
|
| | 7,950,174 | | | | 4.500 | | | | 07/18/23 | | | | 8,029,676 | |
| | Hi Crush Partners LP (B/Caa1) (3 mo. LIBOR + 3.750%) | |
| | 24,958,598 | | | | 5.083 | | | | 04/28/21 | | | | 24,417,745 | |
| | | | | | | | | | | | | | |
| | | | | 32,447,421 | |
| | |
| Packaging – 0.8% | |
| Consolidated Container Co. LLC (B+/B3)
(1 mo. LIBOR + 3.500%) |
|
| | 2,950,000 | | | | 4.735 | | | | 05/22/24 | | | | 2,965,989 | |
| | |
| Reynolds Group Holdings, Inc. (B+/B1)
(1 mo. LIBOR + 2.750%) |
|
| | 17,717,994 | | | | 4.235 | | | | 02/05/23 | | | | 17,781,779 | |
| | |
| Bank Loans(a) – (continued) | |
| Packaging – (continued) | |
| SIG Combibloc U.S. Acquisition, Inc. (NR/NR)
(1 mo. LIBOR + 3.000%) |
|
| 15,157,089 | | | | 4.250 | | | | 03/13/22 | | | | 15,184,523 | |
| | | | | | | | | | | | | | |
| | | | | 35,932,291 | |
| | |
| Paper – 0.1% | |
| | Flex Acquisition Co., Inc. (B/B1) (3 mo. LIBOR + 3.000%) | |
| | 4,713,188 | | | | 4.299 | | | | 12/29/23 | | | | 4,723,509 | |
| | |
| Pharmaceuticals – 0.8% | |
| | Alphabet Holding Co., Inc. (B/B1) | |
| | 22,700,000 | | | | 4.500 | | | | 09/26/24 | | | | 22,416,250 | |
| | The Nature’s Bounty Co. (NR/NR) | |
| | 11,300,000 | | | | 8.750 | | | | 09/26/25 | | | | 11,130,500 | |
| | | | | | | | | | | | | | |
| | | | | 33,546,750 | |
| | |
| Pipelines – 0.3% | |
| | BCP Raptor LLC (B+/B3) (1 Week LIBOR + 4.250%) | |
| | 10,698,188 | | | | 5.447 | | | | 06/24/24 | | | | 10,768,368 | |
| | |
| Real Estate – 0.8% | |
| MGM Growth Properties LLC (BB+/Ba3)
(1 mo. LIBOR + 2.250%) |
|
| | 23,504,161 | | | | 3.245 | | | | 04/25/23 | | | | 23,571,853 | |
| | Realogy Corp. (BB+/Ba1) (1 mo. LIBOR + 2.250%) | |
| | 12,052,105 | | | | 3.485 | | | | 07/20/22 | | | | 12,097,300 | |
| | | | | | | | | | | | | | |
| | | | | 35,669,153 | |
| | |
| Restaurants – 2.4% | |
| 1011778 B.C. Unlimited Liability Co. (B+/Ba3)
(3 mo. LIBOR + 2.250%) |
|
| | 75,186,939 | | | | 3.250 | | | | 02/16/24 | | | | 75,055,362 | |
| | Intrawest Resorts Holdings, Inc. (B/B2) (1 mo. LIBOR + 3.250%) | |
| | 16,832,353 | | | | 4.567 | | | | 07/31/24 | | | | 16,906,079 | |
| | NPC International, Inc. (B/B1) (3 mo. LIBOR + 3.500%) | |
| | 10,324,125 | | | | 4.738 | | | | 04/19/24 | | | | 10,427,366 | |
| | | | | | | | | | | | | | |
| | | | | 102,388,807 | |
| | |
| Retailers – 2.2% | |
| | Academy Ltd. (CCC+/B3) (3 mo. LIBOR + 4.000%) | |
| | 17,917,712 | | | | 5.235 | | | | 07/01/22 | | | | 12,072,238 | |
| | American Apparel (USA) LLC (NR/NR)(b)(c) | |
| | 3,746,635 | | | | 0.000 | | | | 11/30/17 | | | | 3,746,635 | |
| | 1,578,192 | | | | 0.000 | | | | 11/30/17 | | | | 1,578,192 | |
| | 5,979,743 | | | | 0.000 | | | | 02/05/20 | | | | 1,016,556 | |
| | Dollar Tree, Inc. (BBB-/Baa3) (1 mo. LIBOR + 1.500%) | |
| | 2,218,515 | | | | 2.750 | | | | 07/06/20 | | | | 2,218,515 | |
| | Michaels Stores, Inc. (BB+/Ba2) (1 mo. LIBOR + 2.750%) | |
| | 10,183,424 | | | | 3.984 | | | | 01/30/23 | | | | 10,172,528 | |
| | |
| Neiman Marcus Group Ltd., Inc. (CCC/Caa1)
(1 mo. LIBOR + 3.250%) |
|
| | 18,462,610 | | | | 4.481 | | | | 10/25/20 | | | | 13,710,334 | |
| | PetSmart, Inc. (B/Ba3) (1 mo. LIBOR + 3.000%) | |
| | 30,865,455 | | | | 4.240 | | | | 03/11/22 | | | | 26,029,764 | |
| | Staples, Inc. (NR/NR) | |
| | 12,625,000 | | | | 5.000 | | | | 09/12/24 | | | | 12,564,147 | |
| | The Men’s Wearhouse, Inc. (B+/Ba3) (3 mo. LIBOR + 3.500%) | |
| | 4,225,000 | | | | 4.813 | | | | 06/18/21 | | | | 4,112,784 | |
| | |
| | |
| 90 | | The accompanying notes are an integral part of these financial statements. |
GOLDMAN SACHS HIGH YIELD FLOATING RATE FUND
| | | | | | | | | | | | | | |
Principal
Amount | | | Interest
Rate | | | Maturity
Date | | | Value | |
| Bank Loans(a) – (continued) | |
| Retailers – (continued) | |
| | True Religion Apparel, Inc. (NR/WR)(b) | |
| | (3 mo. LIBOR + 4.875%) | |
| $ | 16,646,250 | | | | 6.171 | % | | | 07/30/19 | | | $ | 4,244,794 | |
| | 7,650,000 | | | | 11.000 | (c) | | | 01/30/20 | | | | 443,700 | |
| | | | | | | | | | | | | | |
| | | | | 91,910,187 | |
| | |
| Semiconductors & Semiconductor Equipment – 0.1% | |
| | MKS Instruments, Inc. (BBB-/Ba1) (1 Week LIBOR + 2.250%) | |
| | 5,232,076 | | | | 3.476 | | | | 05/01/23 | | | | 5,269,119 | |
| | |
| Services Cyclical – Business Services – 3.2% | |
| | Acosta Holdco, Inc. (B-/B2) (1 mo. LIBOR + 3.250%) | |
| | 11,017,891 | | | | 4.485 | | | | 09/26/21 | | | | 9,719,873 | |
| EVO Payments International LLC (NR/NR)
(1 mo. LIBOR + 5.000%) |
|
| | 17,457,275 | | | | 6.240 | | | | 12/22/23 | | | | 17,653,669 | |
| | First Data Corp. (BB/Ba3) | |
| | (1 mo. LIBOR + 2.250%) | |
| | 2,819,792 | | | | 3.487 | | | | 07/08/22 | | | | 2,823,711 | |
| | (1 mo. LIBOR + 2.500%) | |
| | 33,816,084 | | | | 3.737 | | | | 04/26/24 | | | | 33,918,885 | |
| | Global Payments, Inc. (BBB-/Ba2) (1 mo. LIBOR + 2.000%) | |
| | 12,324,996 | | | | 3.235 | | | | 04/21/23 | | | | 12,349,153 | |
| | Koosharem LLC (CCC+/Caa1) (3 mo. LIBOR + 6.500%) | |
| | 6,746,088 | | | | 7.833 | | | | 05/16/20 | | | | 6,408,784 | |
| | Vantiv LLC (NR/NR) | |
| | 4,147,315 | | | | 3.500 | | | | 10/14/23 | | | | 4,144,205 | |
| | 14,777,685 | | | | 3.697 | | | | 10/14/23 | | | | 14,777,685 | |
| | 9,575,000 | | | | 3.737 | | | | 10/14/23 | | | | 9,579,022 | |
| | Vantiv LLC (BBB-/NR) (1 mo. LIBOR + 2.500%) | |
| | 22,370,064 | | | | 3.826 | | | | 10/14/23 | | | | 22,380,869 | |
| | | | | | | | | | | | | | |
| | | | | 133,755,856 | |
| | |
| Services Cyclical – Consumer Services – 4.2% | |
| Advanced Disposal Services, Inc. (BB/B1)
(1 Week LIBOR + 2.750%) |
|
| | 48,260,056 | | | | 3.500 | | | | 11/10/23 | | | | 48,541,412 | |
| | Ascend Learning LLC (B+/B2) (1 mo. LIBOR + 3.250%) | |
| | 13,550,000 | | | | 4.485 | | | | 07/12/24 | | | | 13,604,200 | |
| | Asurion LLC (B+/Ba3) | |
| | (1 mo. LIBOR + 2.750%) | |
| | 25,833,272 | | | | 3.985 | | | | 08/04/22 | | | | 25,897,855 | |
| | (1 mo. LIBOR + 3.000%) | |
| | 2,422,076 | | | | 4.235 | | | | 11/03/23 | | | | 2,431,837 | |
| Bright Horizons Family Solutions, Inc. (NR/NR)
(PRIME + 1.250%) |
|
| | 32,602,274 | | | | 3.485 | | | | 11/07/23 | | | | 32,708,231 | |
| | Casella Waste Systems, Inc. (B+/B1) (PRIME + 1.750%) | |
| | 4,342,188 | | | | 6.000 | | | | 10/17/23 | | | | 4,353,043 | |
| | Parexel International Corp. (NR/NR) | |
| | 5,500,000 | | | | 3.000 | | | | 08/07/24 | | | | 5,537,840 | |
| | Spin Holdco, Inc. (NR/NR) (2 mo. LIBOR + 3.750%) | |
| | 24,993,391 | | | | 5.014 | | | | 11/14/22 | | | | 25,099,612 | |
| Weight Watchers International, Inc. (B-/B2)
(3 mo. LIBOR + 3.250%) |
|
| | 19,483,391 | | | | 4.490 | | | | 04/02/20 | | | | 19,215,495 | |
| | | | | | | | | | | | | | |
| | | | | 177,389,525 | |
| | |
| Bank Loans(a) – (continued) | |
| Services Cyclical – Rental Equipment – 0.3% | |
| | BakerCorp International, Inc. (B-/B2) | |
| 15,380,000 | | | | 4.250 | | | | 02/07/20 | | | | 14,780,180 | |
| | |
| Technology – Software/Services – 5.5% | |
| | Almonde, Inc. (NR/NR) (3 mo. LIBOR + 3.500%) | |
| | 15,300,000 | | | | 4.817 | | | | 06/13/24 | | | | 15,362,883 | |
| | Almonde, Inc. (CCC+/Caa2) (3 mo. LIBOR + 7.250%) | |
| | 3,825,000 | | | | 8.567 | | | | 06/13/25 | | | | 3,886,468 | |
| | Ancestry.com Operations, Inc. (B/B1) (1 mo. LIBOR + 3.250%) | |
| | 8,910,000 | | | | 4.490 | | | | 10/19/23 | | | | 8,960,163 | |
| | Aspect Software, Inc. (NR/NR) (1 mo. LIBOR + 10.000%) | |
| | 4,503,758 | | | | 11.235 | | | | 05/25/20 | | | | 4,430,572 | |
| | Avast Software BV (BB-/Ba3) (3 mo. LIBOR + 3.250%) | |
| | 5,295,469 | | | | 4.583 | | | | 09/29/23 | | | | 5,313,685 | |
| | BMC Software Finance, Inc. (B+/Ba3) (EURIBOR + 4.500%) | |
| EUR | 5,003,212 | | | | 4.500 | | | | 09/10/22 | | | | 5,942,037 | |
| | BMC Software Finance, Inc. (B+/B1) (1 mo. LIBOR + 4.000%) | |
| $ | 41,276,471 | | | | 5.235 | | | | 09/10/22 | | | | 41,467,581 | |
| | Cavium, Inc. (BB/Ba3) (PRIME + 1.250%)(b) | |
| | 4,776,698 | | | | 3.484 | | | | 08/16/22 | | | | 4,788,640 | |
| | CCC Information Services, Inc. (B/B2) (1 mo. LIBOR + 3.000%) | |
| | 6,109,688 | | | | 4.240 | | | | 04/27/24 | | | | 6,097,468 | |
| CCC Information Services, Inc. (CCC/Caa2)
(1 mo. LIBOR + 6.750%) |
|
| | 2,675,000 | | | | 7.985 | | | | 04/27/25 | | | | 2,748,563 | |
| Electrical Components International, Inc. (B/B1)
(3 mo. LIBOR + 4.750%) |
|
| | 11,707,787 | | | | 6.085 | | | | 05/28/21 | | | | 11,773,702 | |
| | Equinix, Inc. (NR/NR) (EURIBOR + 2.500%) | |
| EUR | 2,636,750 | | | | 2.500 | | | | 01/05/24 | | | | 3,125,912 | |
| | Infor (US), Inc. (B/B1) (3 mo. LIBOR + 2.750%) | |
| $ | 38,638,925 | | | | 4.083 | | | | 02/01/22 | | | | 38,530,350 | |
| | MA FinanceCo. LLC (NR/NR) | |
| | (3 mo. LIBOR + 2.500%) | |
| | 7,009,713 | | | | 3.811 | | | | 11/19/21 | | | | 7,000,951 | |
| | (1 mo. LIBOR + 2.750%) | |
| | 3,875,796 | | | | 3.987 | | | | 06/21/24 | | | | 3,880,640 | |
| | Micron Technology, Inc. (BBB-/Baa2) (1 mo. LIBOR + 2.500%) | |
| | 27,157,484 | | | | 3.740 | | | | 04/26/22 | | | | 27,329,390 | |
| | Seattle Spinco, Inc. (NR/NR) (1 mo. LIBOR + 2.750%) | |
| | 26,174,204 | | | | 3.987 | | | | 06/21/24 | | | | 26,206,922 | |
| | SS&C Technologies, Inc. (BB+/Ba2) | |
| | (1 mo. LIBOR + 2.250%) | |
| | 10,595,504 | | | | 3.232 | | | | 07/08/22 | | | | 10,639,687 | |
| | (1 mo. LIBOR + 2.250%) | |
| | 560,376 | | | | 3.485 | | | | 07/08/22 | | | | 562,713 | |
| | |
| | Western Digital Corp. (BBB-/Ba1) (1 mo. LIBOR + 2.750%) | |
| | 3,487,744 | | | | 3.985 | | | | 04/29/23 | | | | 3,506,055 | |
| | | | | | | | | | | | | | |
| | | | | | | | | | | | | 231,554,382 | |
| | |
| Trading Companies & Distributors – 0.3% | |
| | HD Supply Waterworks Ltd. (NR/NR) (6 mo. LIBOR + 3.000%) | |
| | 10,500,000 | | | | 4.455 | | | | 08/01/24 | | | | 10,513,125 | |
| | HD Supply, Inc. (NR/NR) (3 mo. LIBOR + 2.250%) | |
| | 1,578,030 | | | | 3.583 | | | | 08/13/21 | | | | 1,583,458 | |
| | | | | | | | | | | | | | |
| | | | | | | | | | | | | 12,096,583 | |
| | |
| | |
| The accompanying notes are an integral part of these financial statements. | | 91 |
GOLDMAN SACHS HIGH YIELD FLOATING RATE FUND
Schedule of Investments (continued)
September 30, 2017 (Unaudited)
| | | | | | | | | | | | | | |
Principal
Amount | | | Interest
Rate | | | Maturity
Date | | | Value | |
| Bank Loans(a) – (continued) | |
| Utilities – Electric – 0.7% | |
| | AES Corp. (BBB-/Ba1) (3 mo. LIBOR + 2.000%) | |
| $ | 7,487,375 | | | | 3.317 | % | | | 05/24/22 | | | $ | 7,490,520 | |
| Calpine Corp. (BB/Ba2)
(PRIME + 0.750%) |
|
| | 10,572,182 | | | | 5.000 | | | | 11/30/17 | | | | 10,580,957 | |
| | (3 mo. LIBOR + 2.750%) | |
| | 10,353,883 | | | | 4.090 | | | | 01/15/24 | | | | 10,328,516 | |
| | | | | | | | | | | | | | |
| | | | | | | | | | | | | 28,399,993 | |
| | |
| Wireless Telecommunications – 4.8% | |
| | CenturyLink, Inc. (BBB-/Ba3) | |
| | 28,381,000 | | | | 2.750 | | | | 01/31/25 | | | | 27,486,998 | |
| | Cincinnati Bell, Inc. (NR/NR) | |
| | 9,325,000 | | | | 4.750 | | | | 08/17/24 | | | | 9,394,937 | |
| Consolidated Communications, Inc. (BB-/Ba3)
(1 mo. LIBOR + 3.000%) |
|
| | 8,789,170 | | | | 4.240 | | | | 10/04/23 | | | | 8,542,546 | |
| Digicel International Finance Ltd. (NR/Ba2)
(3 mo. LIBOR + 3.750%) |
|
| | 22,600,000 | | | | 5.070 | | | | 05/28/24 | | | | 22,656,500 | |
| | GCI Holdings, Inc. (NR/NR) (1 mo. LIBOR + 2.250%) | |
| | 8,267,481 | | | | 3.485 | | | | 02/02/22 | | | | 8,283,024 | |
| | Intelsat Jackson Holdings SA (B/B1) (3 mo. LIBOR + 2.750%) | |
| | 101,795,848 | | | | 4.071 | | | | 06/30/19 | | | | 101,424,293 | |
| | LTS Buyer LLC (B/B1) (1 mo. LIBOR + 3.250%) | |
| | 4,625,367 | | | | 4.485 | | | | 04/13/20 | | | | 4,628,281 | |
| | Sprint Communications, Inc. (BB-/Ba2) (1 mo. LIBOR + 2.500%) | |
| | 22,984,500 | | | | 3.750 | | | | 02/02/24 | | | | 22,998,980 | |
| | | | | | | | | | | | | | |
| | | | | | | | | | | | | 205,415,559 | |
| | |
| Wirelines Telecommunications – 0.2% | |
| | Avaya, Inc. (NR/WR) (1 mo. LIBOR + 7.500%) | |
| | 1,618,677 | | | | 8.735 | | | | 01/24/18 | | | | 1,630,235 | |
| | Level 3 Financing, Inc. (BBB-/Ba1) (1 mo. LIBOR + 2.250%) | |
| | 5,000,000 | | | | 3.486 | | | | 02/22/24 | | | | 4,996,100 | |
| | | | | | | | | | | | | | |
| | | | | | | | | | | | | 6,626,335 | |
| | |
| | TOTAL BANK LOANS | | | | | |
| | (Cost $3,478,222,363) | | | $ | 3,380,924,000 | |
| | |
| | | | | | | | | | | | | | |
| Corporate Obligations – 13.0% | |
| Airlines – 0.7% | |
| | Air Canada 2013-1 Class C Pass Through Trust (BB/Ba2)(d) | |
| $ | 7,681,000 | | | | 6.625 | % | | | 05/15/18 | | | $ | 7,879,170 | |
| Air Canada Pass Through Trust Series 2013-1, Class B
(BBB/Baa3)(d) |
|
| | 12,721,333 | | | | 5.375 | | | | 11/15/22 | | | | 13,408,285 | |
| | Continental Airlines 2012-3 Class C Pass Through Trust (NR/Ba1) | |
| | 4,825,000 | | | | 6.125 | % | | | 04/29/18 | | | | 4,908,434 | |
| | United Airlines 2014-1 Class B Pass Through Trust (BBB-/NR) | |
| | 305,771 | | | | 4.750 | | | | 10/11/23 | | | | 318,461 | |
| | United Continental Holdings, Inc. (BB-/Ba3) | |
| | 4,513,000 | | | | 6.375 | | | | 06/01/18 | | | | 4,620,486 | |
| | | | | | | | | | | | | | |
| | | | | | | | | | | | | 31,134,836 | |
| | |
| Corporate Obligations – (continued) | |
| Automotive(d)(e)(f) – 0.2% | |
| | IHO Verwaltungs GmbH (BB-/Ba1) | |
| 6,700,000 | | | | 4.500 | | | | 09/15/23 | | | | 6,808,875 | |
| | |
| Commercial Services(d)(e) – 0.2% | |
| | Nielsen Finance LLC/Nielsen Finance Co. (BB+/B1) | |
| | 7,800,000 | | | | 5.000 | | | | 04/15/22 | | | | 8,073,000 | |
| | |
| Consumer Cyclical Services – Business(b)(c) – 0.0% | |
| | Escrow Ambassadors Group, Inc. (NR/NR) | |
| | 9,986,469 | | | | 13.000 | | | | 04/15/20 | | | | — | |
| | |
| Distribution & Wholesale(d)(e) – 0.2% | |
| | Performance Food Group, Inc. (BB-/B2) | |
| | 9,800,000 | | | | 5.500 | | | | 06/01/24 | | | | 10,143,000 | |
| | |
| Diversified Financial Services – 0.8% | |
| | Abe Investment Holdings, Inc./Getty Images, Inc. (CCC/B3)(d)(e) | |
| | 11,300,000 | | | | 10.500 | | | | 10/16/20 | | | | 10,904,500 | |
| | Ally Financial, Inc. (BB+/Ba3) | |
| | 7,525,000 | | | | 3.750 | | | | 11/18/19 | | | | 7,684,906 | |
| | International Lease Finance Corp. (BBB-/Baa2)(d) | |
| | 1,000,000 | | | | 7.125 | | | | 09/01/18 | | | | 1,047,046 | |
| | International Lease Finance Corp. (BBB-/Baa3) | |
| | 7,500,000 | | | | 5.875 | | | | 04/01/19 | | | | 7,900,490 | |
| | Navient Corp. (B+/Ba3) | |
| | 4,550,000 | | | | 6.625 | | | | 07/26/21 | | | | 4,877,363 | |
| | | | | | | | | | | | | | |
| | | | | | | | | | | | | 32,414,305 | |
| | |
| Electrical(d)(e) – 0.1% | |
| | Calpine Corp. (BB/Ba2) | |
| | 4,350,000 | | | | 5.250 | | | | 06/01/26 | | | | 4,328,250 | |
| | |
| Entertainment(d)(e) – 0.6% | |
| | Scientific Games International, Inc. (B+/Ba3) | |
| | 22,075,000 | | | | 7.000 | | | | 01/01/22 | | | | 23,399,500 | |
| | |
| Food & Drug Retailing(d)(e) – 0.0% | |
| | Shearer’s Foods LLC/Chip Finance Corp. (B/B3) | |
| | 900,000 | | | | 9.000 | | | | 11/01/19 | | | | 924,750 | |
| | |
| Gaming(c)(e) – 0.4% | |
| | Caesars Entertainment Operating Co., Inc. (NR/WR) | |
| | 14,605,821 | | | | 9.000 | % | | | 02/15/20 | | | | 19,060,597 | |
| | |
| Healthcare Providers & Services – 1.8% | |
| | CHS/Community Health Systems, Inc. (CCC/Caa2)(e) | |
| | 5,500,000 | | | | 8.000 | | | | 11/15/19 | | | | 5,362,500 | |
| | CHS/Community Health Systems, Inc. (B+/Ba3)(e) | |
| | 3,800,000 | | | | 6.250 | | | | 03/31/23 | | | | 3,752,500 | |
| | HCA, Inc. (BBB-/Ba1) | |
| | 10,000,000 | | | | 3.750 | | | | 03/15/19 | | | | 10,212,500 | |
| | 12,900,000 | | | | 5.000 | | | | 03/15/24 | | | | 13,738,500 | |
| | 13,225,000 | | | | 5.250 | | | | 04/15/25 | | | | 14,299,531 | |
| | 16,775,000 | | | | 5.250 | (e) | | | 06/15/26 | | | | 18,075,062 | |
| | Tenet Healthcare Corp. (B-/Ba3)(d)(e) | |
| | 2,975,000 | | | | 7.500 | | | | 01/01/22 | | | | 3,146,063 | |
| | 9,650,000 | | | | 5.125 | | | | 05/01/25 | | | | 9,529,375 | |
| | | | | | | | | | | | | | |
| | | | | 78,116,031 | |
| | |
| | |
| 92 | | The accompanying notes are an integral part of these financial statements. |
GOLDMAN SACHS HIGH YIELD FLOATING RATE FUND
| | | | | | | | | | | | | | |
Principal
Amount | | | Interest
Rate | | | Maturity
Date | | | Value | |
| Corporate Obligations – (continued) | |
| Machinery-Diversified(e) – 0.3% | |
| | Welbilt, Inc. (B/Caa1) | |
| $ | 12,175,000 | | | | 9.500 | % | | | 02/15/24 | | | $ | 13,970,813 | |
| | |
| Media – 1.7% | |
| | Altice Financing SA (BB-/B1)(d)(e) | |
| | 8,075,000 | | | | 7.500 | | | | 05/15/26 | | | | 8,882,500 | |
| | DISH DBS Corp. (B+/Ba3) | |
| | 5,000,000 | | | | 7.750 | | | | 07/01/26 | | | | 5,731,250 | |
| | Nexstar Broadcasting, Inc. (B+/B3)(d)(e) | |
| | 2,500,000 | | | | 5.625 | | | | 08/01/24 | | | | 2,593,750 | |
| | SFR Group SA (B+/B1)(d)(e) | |
| | 16,300,000 | | | | 6.250 | | | | 05/15/24 | | | | 17,115,000 | |
| | Tribune Media Co. (BB-/B3)(e) | |
| | 3,125,000 | | | | 5.875 | | | | 07/15/22 | | | | 3,257,812 | |
| | Univision Communications, Inc. (BB-/B2)(e) | |
| | 13,339,000 | | | | 6.750 | (d) | | | 09/15/22 | | | | 13,822,539 | |
| | 2,032,000 | | | | 6.750 | | | | 09/15/22 | | | | 2,105,660 | |
| | Virgin Media Secured Finance PLC (BB-/Ba3)(d)(e) | |
| | 16,300,000 | | | | 5.500 | | | | 08/15/26 | | | | 17,176,125 | |
| | | | | | | | | | | | | | |
| | | | | 70,684,636 | |
| | |
| Oil Field Services(e) – 1.2% | |
| | Antero Resources Corp. (BB/Ba3) | |
| | 8,075,000 | | | | 5.625 | | | | 06/01/23 | | | | 8,408,094 | |
| | Exterran Energy Solutions LP/EES Finance Corp. (B+/B3)(d) | |
| | 9,850,000 | | | | 8.125 | | | | 05/01/25 | | | | 10,194,750 | |
| | FTS International, Inc. (B+/B1) (3M USD LIBOR + 7.500%)(d)(g) | |
| | 18,900,000 | | | | 8.820 | | | | 06/15/20 | | | | 19,207,125 | |
| | Noble Holding International Ltd. (BB-/B2)(j) | |
| | 11,000,000 | | | | 7.750 | | | | 01/15/24 | | | | 9,790,000 | |
| | SM Energy Co. (B+/B2) | |
| | 2,400,000 | | | | 6.750 | | | | 09/15/26 | | | | 2,406,000 | |
| | | | | | | | | | | | | | |
| | | | | 50,005,969 | |
| | |
| Packaging(e) – 0.8% | |
| Ardagh Packaging Finance PLC/Ardagh Holdings USA, Inc.
(BB/Ba3)(d) |
|
| $ | 8,200,000 | | | | 4.250 | % | | | 09/15/22 | | | $ | 8,405,000 | |
| | 3,000,000 | | | | 4.625 | | | | 05/15/23 | | | | 3,082,500 | |
| | Berry Global, Inc. (B+/B3) | |
| | 13,300,000 | | | | 5.500 | | | | 05/15/22 | | | | 13,832,000 | |
| Reynolds Group Issuer, Inc./Reynolds Group Issuer LLC/
Reynolds Group Issuer Lu (B+/B1) (3M USD
LIBOR + 3.500%)(d) |
|
| | 4,800,000 | | | | 4.804 | (g) | | | 07/15/21 | | | | 4,896,000 | |
| | 2,000,000 | | | | 5.125 | | | | 07/15/23 | | | | 2,080,000 | |
| | | | | | | | | | | | | | |
| | | | | | | | | | | | | 32,295,500 | |
| | |
| Pharmaceuticals(d)(e) – 0.4% | |
| | Endo Dac/Endo Finance LLC/Endo Finco, Inc. (BB-/Ba2) | |
| | 10,000,000 | | | | 5.875 | | | | 10/15/24 | | | | 10,475,000 | |
| | Valeant Pharmaceuticals International, Inc. (BB-/Ba3) | |
| | 7,750,000 | | | | 7.000 | | | | 03/15/24 | | | | 8,273,125 | |
| | | | | | | | | | | | | | |
| | | | | | | | | | | | | 18,748,125 | |
| | |
| Corporate Obligations – (continued) | |
| Retailing(e) – 0.9% | |
| | New Red Finance, Inc. (B+/Ba3) | |
| 2,825,000 | | | | 4.625 | (d) | | | 01/15/22 | | | | 2,888,562 | |
| | 5,600,000 | | | | 4.625 | | | | 01/15/22 | | | | 5,726,000 | |
| | New Red Finance, Inc. (B-/B3)(d) | |
| | 3,967,000 | | | | 6.000 | | | | 04/01/22 | | | | 4,090,969 | |
| | New Red Finance, Inc. (B+/Ba3)(d) | |
| | 8,800,000 | | | | 4.250 | | | | 05/15/24 | | | | 8,833,000 | |
| | New Red Finance, Inc. (B-/B3)(d) | |
| | 10,550,000 | | | | 5.000 | | | | 10/15/25 | | | | 10,708,250 | |
| | PetSmart, Inc. (B/Ba3)(d) | |
| | 6,150,000 | | | | 5.875 | | | | 06/01/25 | | | | 5,365,875 | |
| | | | | | | | | | | | | | |
| | | | | | | | | | | | | 37,612,656 | |
| | |
| Software(d)(e) – 1.2% | |
| | CURO Financial Technologies Corp. (B-/Caa1) | |
| | 7,250,000 | | | | 12.000 | | | | 03/01/22 | | | | 7,793,750 | |
| | First Data Corp. (B/B3) | |
| | 9,500,000 | | | | 7.000 | | | | 12/01/23 | | | | 10,153,125 | |
| | 30,125,000 | | | | 5.750 | | | | 01/15/24 | | | | 31,555,938 | |
| | | | | | | | | | | | | | |
| | | | | | | | | | | | | 49,502,813 | |
| | |
| Telecommunication Services – 1.5% | |
| | Frontier Communications Corp. (B/B2) | |
| | 2,316,000 | | | | 8.500 | | | | 04/15/20 | | | | 2,246,520 | |
| | Intelsat Jackson Holdings SA (CCC+/Caa2)(e) | |
| | 9,560,000 | | | | 7.250 | | | | 10/15/20 | | | | 9,225,400 | |
| | Nokia OYJ (BB+/Ba1) | |
| | 1,950,000 | | | | 3.375 | | | | 06/12/22 | | | | 1,964,625 | |
| | Sprint Communications, Inc. (B+/B1)(d) | |
| | 8,075,000 | | | | 9.000 | | | | 11/15/18 | | | | 8,670,531 | |
| | Sprint Communications, Inc. (B/B3) | |
| | 16,250,000 | | | | 7.000 | | | | 08/15/20 | | | | 17,753,125 | |
| | Sprint Corp. (B/B3) | |
| | 3,650,000 | | | | 7.875 | | | | 09/15/23 | | | | 4,234,000 | |
| | |
| | Wind Acquisition Finance SA (BB/Ba3)(d)(e) | |
| | 19,550,000 | | | | 4.750 | | | | 07/15/20 | | | | 19,794,375 | |
| | | | | | | | | | | | | | |
| | | | | | | | | | | | | 63,888,576 | |
| | |
| | TOTAL CORPORATE OBLIGATIONS | |
| | (Cost $532,279,006) | | | $ | 551,112,232 | |
| | |
| | | | | | | | | | | | | | |
| Asset-Backed Securities(d)(g) – 0.8% | |
| Collateralized Loan Obligations – 0.8% | |
| Carlyle Global Market Strategies CLO Ltd. Series 2014-1A,
Class AR (AAA/Aaa) (3M USD LIBOR + 1.300%) |
|
| $ | 10,300,000 | | | | 2.458 | % | | | 04/17/25 | | | $ | 10,349,677 | |
| GoldenTree Loan Opportunities IX Ltd. Series 2014-9A,
Class AR (NR/Aaa) (3M USD LIBOR + 1.370%) |
|
| | 23,700,000 | | | | 2.540 | | | | 10/29/26 | | | | 23,743,703 | |
| | |
| | TOTAL ASSET-BACKED SECURITIES | |
| | (Cost $34,000,000) | | | $ | 34,093,380 | |
| | |
| | |
| The accompanying notes are an integral part of these financial statements. | | 93 |
GOLDMAN SACHS HIGH YIELD FLOATING RATE FUND
Schedule of Investments (continued)
September 30, 2017 (Unaudited)
| | | | | | | | |
| Shares | | | Description | | Value | |
| | Common Stocks(b)(c)(h) – 0.3% | |
| Oil, Gas & Consumable Fuels – 0.3% | |
| | 1,286,477 | | | Blue Ridge Mountain Resources, Inc. | | $ | 12,607,475 | |
| | |
| | Textiles, Apparel & Luxury Goods(b) – 0.0% | |
| | 449,607 | | | American Apparel, Inc. PI | | | — | |
| | |
| | TOTAL COMMON STOCKS | | | | |
| | (Cost $22,763,641) | | $ | 12,607,475 | |
| | |
| | | | | | | | |
| Shares | | | Distribution
Rate | | Value | |
| Exchange Traded Fund(i) – 0.7% | |
| Exchange Traded Funds – 0.7% | |
| | Goldman Sachs TreasuryAccess 0-1 Year ETF (NR/NR) | |
| | 315,762 | | | 0.921% | | $ | 31,623,564 | |
| | (Cost $31,596,982) | | | | |
| | |
| | | | | | | | |
| Investment Company(i) – 6.8% | |
| Goldman Sachs Financial Square Government Fund –
Institutional Shares |
|
| | 286,416,883 | | | 0.927% | | $ | 286,416,883 | |
| | (Cost $286,416,883) | | | | |
| | |
| | TOTAL INVESTMENTS – 101.5% | |
| | (Cost $4,385,278,875) | | $ | 4,296,777,534 | |
| | |
| | | | | | | | | | | | | | |
Principal
Amount | | | Interest Rate
(Paid) Received | | | Maturity
Date | | | Value | |
| Reverse Repurchase Agreements – (0.2)% | |
| | Barclays Reverse Repurchase Agreement (NR/NR) | |
| $ | (4,543,750 | ) | | | (1.750 | ) | | | 06/04/18 | | | $ | (4,543,750 | ) |
| | (792,500 | ) | | | (2.000 | ) | | | 08/01/18 | | | | (792,500 | ) |
| | (1,111,413 | ) | | | (1.750 | ) | | | 09/11/18 | | | | (1,111,413 | ) |
| | |
| | TOTAL REVERSE REPURCHASE AGREEMENTS | |
| | (Cost) $(6,447,663)) | | | $ | (6,447,663 | ) |
| | |
| OTHER LIABILITIES IN EXCESS OF
OTHER ASSETS – (1.3)% |
| | | (56,190,598 | ) |
| | |
| | NET ASSETS – 100.0% | | | $ | 4,234,139,273 | |
| | |
| | |
| The percentage shown for each investment category reflects the value of investments in that category as a percentage of net assets. |
(a) | | Bank Loans often require prepayments from excess cash flows or permit the borrower to repay at its election. The degree to which borrowers repay, whether as a contractual requirement or at their election, cannot be predicted with accuracy. As a result, the actual remaining maturity may be substantially less than the stated maturities shown. The stated interest rate represents the weighted average interest rate of all contracts within the bank loan facility on September 30, 2017. Bank Loans typically have rates of interest which are predetermined either daily, monthly, quarterly or semi-annually by reference to a base lending rate, plus a premium. These base lending rates are primarily the London-Interbank Offered Rate (“LIBOR”), and secondarily the prime rate offered by one or more major United States banks (the “Prime Rate”) and the certificate of deposit (“CD”) rate or other base lending rates used by commercial lenders. |
(b) | | Significant unobservable inputs were used in the valuation of this portfolio security; i.e. Level 3. |
(c) | | Security is currently in default and/or non-income producing. |
(d) | | Exempt from registration under Rule 144A of the Securities Act of 1933. Such securities may be deemed liquid by the investment adviser and may be resold, normally to qualified institutional buyers in transactions exempt from registration. Total market value of Rule 144A securities amounts to $369,742,983, which represents approximately 8.7% of net assets as of September 30, 2017. |
(e) | | Security with “Call” features with resetting interest rates. Maturity dates disclosed are the final maturity dates. |
(f) | | Pay-in-kind securities. |
(g) | | Variable rate security. Interest rate or distribution rate disclosed is that which is in effect on September 30, 2017. |
(h) | | Restricted securities are not registered under the Securities Act of 1933 and are subject to legal restrictions on resale. These securities generally may be resold in transactions exempt from registration or to the public if the securities are subsequently registered and the registration statement is effective. Disposal of these securities may involve time consuming negotiations and prompt sale at an acceptable price may be difficult. Total market value of restricted securities amounts to $12,607,475, which represents approximately 0.3% of net assets as of September 30, 2017. |
| | | | | | | | | | |
| | | Restricted Security | | Acquisition
Date | | | Cost | |
| | Blue Ridge Mountain Resources, Inc. (Common Stocks) | | | 05/06/16 – 08/18/16 | | | $ | 12,836,870 | |
| | American Apparel, Inc. PI (Common Stocks) | | | 04/01/13 – 02/05/16 | | | | 9,926,771 | |
| | |
(i) | | Represents an Affiliated Issuer. |
(j) | | All or a portion of the security was pledged as collateral against open reverse repurchase agreements. As of September 30, 2017, the value of securities pledged amounted to $6,559,300. |
(k) | | This loan will settle after September 30, 2017, at which time the interest rate will be determined. The loan settled on November 8, 2017 with a LIBOR rate of 3.000%. |
| | |
|
Currency Abbreviations: |
EUR | | —Euro |
USD | | —U.S. Dollar |
| | |
Investment Abbreviations: |
CLO | | —Collateralized Loan Obligation |
ETF | | —Exchange Traded Fund |
LIBOR | | —London Interbank Offered Rate |
LLC | | —Limited Liability Company |
LP | | —Limited Partnership |
PI | | —Private Investment |
PLC | | —Public Limited Company |
|
| | |
| 94 | | The accompanying notes are an integral part of these financial statements. |
GOLDMAN SACHS HIGH YIELD FLOATING RATE FUND
|
| ADDITIONAL INVESTMENT INFORMATION |
UNFUNDED LOAN COMMITMENTS — At September 30, 2017, the Fund had unfunded loan commitments which could be extended at the option of the borrowers, pursuant to the following loan agreements:
| | | | | | | | | | | | |
| Borrower | | Principal
Amount | | | Current
Value | | | Unrealized
Gain (Loss) | |
21st Century Oncology Holdings, Inc | | $ | 565,398 | | | $ | 568,226 | | | $ | 6,317 | |
FORWARD FOREIGN CURRENCY EXCHANGE CONTRACTS — At September 30, 2017, the Fund had the following forward foreign currency exchange contracts:
FORWARD FOREIGN CURRENCY EXCHANGE CONTRACTS WITH UNREALIZED GAIN
| | | | | | | | | | | | | | | | | | | | | | | | | | | | |
| Counterparty | | Currency
Purchased | | | Currency
Sold | | | Current
Value | | | Settlement
Date | | | Unrealized
Gain | |
Morgan Stanley & Co. International PLC | | | USD | | | | 15,242,016 | | | | EUR | | | | 12,835,890 | | | $ | 15,174,043 | | | | 10/04/17 | | | $ | 67,973 | |
FUTURES CONTRACTS — At September 30, 2017, the Fund had the following futures contracts:
| | | | | | | | | | | | | | |
| Description | | Number of
Contracts | | Expiration
Date | | | Notional
Amount | | | Unrealized
Appreciation/
(Depreciation) | |
Short position contracts: | | | | | | | | | | | | | | |
10 Year U.S. Treasury Notes | | (986) | | | 12/19/17 | | | $ | (123,558,125 | ) | | $ | 1,276,703 | |
5 Year U.S. Treasury Notes | | (370) | | | 12/29/17 | | | | (43,475,000 | ) | | | 286,162 | |
| TOTAL | | | $ | 1,562,865 | |
| | | | | | | | | | | | | | |
SWAP CONTRACTS — At September 30, 2017, the Fund had the following swap contracts:
CENTRALLY CLEARED INTEREST RATE SWAP CONTRACTS
| | | | | | | | | | | | | | | | | | | | | | | | |
| Payments Made by the Fund(a) | | Payments
Received
by Fund(b) | | | Termination
Date | | | Notional
Amount
(000s)(c) | | | Value | | | Upfront
Premium
(Received)
Paid | | | Unrealized
Appreciation/
(Depreciation) | |
2.250% | | | 3M LIBOR | | | | 12/20/22 | | | | $24,400 | | | $ | (233,156 | ) | | $ | (384,900 | ) | | $ | 151,744 | |
2.500 | | | 3M LIBOR | | | | 12/20/24 | | | | 26,000 | | | | (558,483 | ) | | | (773,586 | ) | | | 215,103 | |
| TOTAL | | | | | | | | | | | | | | $ | (791,639 | ) | | $ | (1,158,486 | ) | | $ | 366,847 | |
| | (a) | | Payments made semi-annually. |
| | (b) | | Payments made quarterly. |
| | (c) | | Represents forward starting interest rate swaps whose effective dates of commencement of accruals and cash flows occur subsequent to September 30, 2017. |
CENTRALLY CLEARED CREDIT DEFAULT SWAP CONTRACT
| | | | | | | | | | | | | | | | | | | | | | | | | | | | |
| Referenced Obligation/Index | | Financing Rate
Received/(Paid)
by the Fund(a) | | | Credit
Spread at
September 30,
2017(b) | | | Termination
Date | | | Notional
Amount
(000s) | | | Value | | | Upfront
Premiums
(Received)
Paid | | | Unrealized
Appreciation/
(Depreciation) | |
Protection Purchased: | | | | | | | | | | | | | | | | | | | | | | | | | | | | |
CDX.NA.IG Index 29 | | | (5.000 | )% | | | 3.253 | % | | | 12/20/22 | | | $ | 89,650 | | | $ | (7,146,350 | ) | | $ | (6,624,891 | ) | | $ | (521,459 | ) |
| | (a) | | Payments made quarterly. |
| | |
| The accompanying notes are an integral part of these financial statements. | | 95 |
GOLDMAN SACHS HIGH YIELD FLOATING RATE FUND
Schedule of Investments (continued)
September 30, 2017 (Unaudited)
|
| ADDITIONAL INVESTMENT INFORMATION (continued) |
| | (b) | | Credit spread on the referenced obligation, together with the term of the swap contract, are indicators of payment/performance risk. The likelihood of a credit event occurring which would require a fund or its counterparty to make a payment or otherwise be required to perform under the swap contract is generally greater as the credit spread and the term of the swap contract increase. |
OVER THE COUNTER TOTAL RETURN SWAP CONTRACTS ON COMMODITY INDICES
| | | | | | | | | | | | | | | | |
| Reference Obligation/ Index | | Financing
Rate
Paid
by the Fund(a) | | | Counterparty | | | Termination
Date | | Notional
Amount | | Unrealized
Appreciation/
(Depreciation)* | |
Markit iBoxx USD LLL TR Index | | | 3M LIBOR | | | | JPMorgan Securities, Inc. | | | 12/20/17 | | $231 | | $ | 100,493 | |
| | * | | There are no upfront payments on the swap contracts, therefore the unrealized gain (loss) on the swap contracts is equal to their value. |
| | (a) | | Payments made quarterly. |
PURCHASED OPTIONS CONTRACTS — At September 30, 2017, the Fund had the following purchased options:
PURCHASED OPTIONS ON FUTURES CONTRACTS
| | | | | | | | | | | | | | | | | | | | | | | | | | | | | | |
| Description | | Counterparty | | Exercise
Price | | | Expiration
Date | | | Number of
Contracts | | | Notional
Amount | | | Market
Value | | | Premiums
Paid (Received) | | | Unrealized
Appreciation/ (Depreciation) | |
Purchased Options Contracts: | | | | | | | | | | | | | | | | | | | | | | | | | | | | | | |
Puts: | | | | | | | | | | | | | | | | | | | | | | | | | | | | | | |
| Eurodollar Futures | | MS & Co. LLC | | $ | 98.00 | | | | 06/15/18 | | | | 48 | | | $ | 120,000 | | | $ | 18,600 | | | $ | 13,308 | | | $ | 5,292 | |
| | |
|
Abbreviation: |
CDX.NA.IG Index 29 | | —CDX North America Investment Grade Index 29 |
MS & Co. LLC | | —Morgan Stanley & Co. LLC |
Markit iBoxx USD LLL TR Index | | —Markit iBoxx USD Liquid Leveraged Loans Total Return Index |
|
| | |
| 96 | | The accompanying notes are an integral part of these financial statements. |
GOLDMAN SACHS INVESTMENT GRADE CREDIT FUND
Schedule of Investments
September 30, 2017 (Unaudited)
| | | | | | | | | | | | | | |
Principal
Amount | | | Interest
Rate | | | Maturity
Date | | | Value | |
| Corporate Obligations – 92.7% | |
| Aerospace/Defense(a) – 0.2% | |
| | Lockheed Martin Corp. | |
| $ | 850,000 | | | | 4.700 | % | | | 05/15/46 | | | $ | 950,752 | |
| | |
| Agriculture – 3.3% | | | | |
| | BAT Capital Corp.(a)(b) | |
| | 3,900,000 | | | | 3.222 | | | | 08/15/24 | | | | 3,909,609 | |
| | 3,750,000 | | | | 3.557 | | | | 08/15/27 | | | | 3,787,696 | |
| | 1,025,000 | | | | 4.390 | | | | 08/15/37 | | | | 1,051,865 | |
| | BAT International Finance PLC(b) | |
| | 2,400,000 | | | | 2.750 | | | | 06/15/20 | | | | 2,437,335 | |
| | Reynolds American, Inc. | |
| | 861,000 | | | | 3.250 | | | | 06/12/20 | | | | 884,791 | |
| | 1,375,000 | | | | 5.850 | (a) | | | 08/15/45 | | | | 1,682,451 | |
| | | | | | | | | | | | | | |
| | | | | 13,753,747 | |
| | |
| Automotive – 2.1% | | | | |
| | Ford Motor Credit Co. LLC | |
| | 4,325,000 | | | | 5.875 | | | | 08/02/21 | | | | 4,810,724 | |
| | General Motors Co. | |
| | 3,700,000 | | | | 3.500 | | | | 10/02/18 | | | | 3,760,077 | |
| | | | | | | | | | | | | | |
| | | | | 8,570,801 | |
| | |
| Banks – 18.2% | | | | |
| | Banco Santander SA | |
| | 600,000 | | | | 4.250 | | | | 04/11/27 | | | | 622,721 | |
| | Bank of America Corp. | |
| | 1,950,000 | | | | 5.000 | | | | 05/13/21 | | | | 2,121,789 | |
| | (3M USD LIBOR + 0.660%)(a)(c) | |
| | 1,300,000 | | | | 2.369 | | | | 07/21/21 | | | | 1,300,096 | |
| | 1,200,000 | | | | 4.125 | | | | 01/22/24 | | | | 1,276,637 | |
| | 5,500,000 | | | | 4.000 | | | | 04/01/24 | | | | 5,810,493 | |
| | 325,000 | | | | 6.110 | | | | 01/29/37 | | | | 406,360 | |
| | (3M USD LIBOR + 1.814%)(a)(c) | |
| | 575,000 | | | | 4.244 | | | | 04/24/38 | | | | 607,773 | |
| | 1,200,000 | | | | 4.875 | | | | 04/01/44 | | | | 1,369,664 | |
| | Barclays PLC | |
| | 850,000 | | | | 5.200 | | | | 05/12/26 | | | | 909,209 | |
| | 700,000 | | | | 4.950 | | | | 01/10/47 | | | | 765,004 | |
| | BNP Paribas SA(b) | |
| | 675,000 | | | | 4.375 | | | | 05/12/26 | | | | 704,828 | |
| | Citigroup, Inc. | |
| | 1,500,000 | | | | 5.375 | | | | 08/09/20 | | | | 1,635,500 | |
| | 850,000 | | | | 2.650 | | | | 10/26/20 | | | | 858,736 | |
| | 500,000 | | | | 3.875 | | | | 03/26/25 | | | | 511,592 | |
| | 800,000 | | | | 4.450 | | | | 09/29/27 | | | | 844,429 | |
| | 752,000 | | | | 4.650 | | | | 07/30/45 | | | | 832,510 | |
| | 425,000 | | | | 4.750 | | | | 05/18/46 | | | | 462,648 | |
| | Citizens Financial Group, Inc.(a) | |
| | 1,550,000 | | | | 2.375 | | | | 07/28/21 | | | | 1,540,185 | |
| | Compass Bank(a) | |
| | 1,025,000 | | | | 2.750 | | | | 09/29/19 | | | | 1,031,564 | |
| | Credit Agricole SA(b) | |
| | 650,000 | | | | 3.250 | | | | 10/04/24 | | | | 650,369 | |
| | 850,000 | | | | 4.125 | | | | 01/10/27 | | | | 888,419 | |
| | Credit Suisse Group AG(a)(b) | |
| | 1,400,000 | | | | 4.282 | | | | 01/09/28 | | | | 1,458,263 | |
| | |
| Corporate Obligations – (continued) | |
| Banks – (continued) | | | | |
| | Credit Suisse Group Funding Guernsey Ltd. | |
| 2,150,000 | | | | 3.125 | | | | 12/10/20 | | | | 2,193,136 | |
| | 400,000 | | | | 3.750 | | | | 03/26/25 | | | | 407,449 | |
| | Deutsche Bank AG | |
| | 450,000 | | | | 2.500 | | | | 02/13/19 | | | | 452,646 | |
| | HSBC Bank USA NA | |
| | 300,000 | | | | 7.000 | | | | 01/15/39 | | | | 428,887 | |
| | HSBC Holdings PLC | |
| | 1,600,000 | | | | 3.400 | | | | 03/08/21 | | | | 1,649,815 | |
| | (3M USD LIBOR + 1.055%)(a)(c) | |
| | 900,000 | | | | 3.262 | | | | 03/13/23 | | | | 918,608 | |
| | (3M USD LIBOR + 1.546%)(a)(c) | |
| | 925,000 | | | | 4.041 | | | | 03/13/28 | | | | 965,772 | |
| | 425,000 | | | | 6.500 | | | | 09/15/37 | | | | 564,297 | |
| | 425,000 | | | | 6.800 | | | | 06/01/38 | | | | 579,171 | |
| | ING Bank NV (5 year USD ICE Swap + 2.700%)(a)(c) | |
| | 3,075,000 | | | | 4.125 | | | | 11/21/23 | | | | 3,130,350 | |
| | ING Groep NV | |
| | 450,000 | | | | 3.150 | | | | 03/29/22 | | | | 458,562 | |
| | Intesa Sanpaolo SpA | |
| | 2,025,000 | | | | 3.875 | | | | 01/16/18 | | | | 2,036,180 | |
| | JPMorgan Chase & Co. | |
| | 3,700,000 | | | | 3.875 | | | | 09/10/24 | | | | 3,852,687 | |
| | 1,375,000 | | | | 3.625 | (a) | | | 12/01/27 | | | | 1,378,966 | |
| | (3M USD LIBOR + 3.800%)(a)(c) | |
| | 1,575,000 | | | | 5.300 | | | | 05/01/49 | | | | 1,641,937 | |
| | KBC Bank NV (5 year USD Swap + 7.097%)(a)(c) | |
| | 2,000,000 | | | | 8.000 | | | | 01/25/23 | | | | 2,033,832 | |
| | Mitsubishi UFJ Financial Group, Inc. | |
| | 1,400,000 | | | | 2.950 | | | | 03/01/21 | | | | 1,422,409 | |
| | 1,275,000 | | | | 3.850 | | | | 03/01/26 | | | | 1,326,434 | |
| | Mizuho Financial Group, Inc. | |
| | 2,000,000 | | | | 2.601 | | | | 09/11/22 | | | | 1,983,574 | |
| | Morgan Stanley, Inc. | |
| | 3,125,000 | | | | 3.700 | | | | 10/23/24 | | | | 3,237,418 | |
| | 2,950,000 | | | | 4.000 | | | | 07/23/25 | | | | 3,110,080 | |
| | (3M USD LIBOR + 1.455%)(a)(c) | |
| | 800,000 | | | | 3.971 | | | | 07/22/38 | | | | 804,567 | |
| | 500,000 | | | | 4.300 | | | | 01/27/45 | | | | 524,135 | |
| | Santander Holdings USA, Inc.(a) | |
| | 750,000 | | | | 4.500 | | | | 07/17/25 | | | | 781,425 | |
| | Santander UK PLC(b) | |
| | 1,150,000 | | | | 5.000 | | | | 11/07/23 | | | | 1,243,186 | |
| | The Toronto-Dominion Bank (5 year USD Swap + 2.205%)(a)(c) | |
| | 1,175,000 | | | | 3.625 | | | | 09/15/31 | | | | 1,169,993 | |
| | UBS Group Funding Switzerland AG(b) | |
| | 2,200,000 | | | | 3.000 | | | | 04/15/21 | | | | 2,230,288 | |
| | UniCredit SpA(b) | |
| | 3,725,000 | | | | 3.750 | | | | 04/12/22 | | | | 3,818,366 | |
| | 500,000 | | | | 4.625 | | | | 04/12/27 | | | | 524,522 | |
| | Wells Fargo & Co. | |
| | 850,000 | | | | 3.900 | | | | 05/01/45 | | | | 850,799 | |
| | Wells Fargo Bank NA | |
| | 799,000 | | | | 5.950 | | | | 08/26/36 | | | | 1,009,812 | |
| | |
| | |
| The accompanying notes are an integral part of these financial statements. | | 97 |
GOLDMAN SACHS INVESTMENT GRADE CREDIT FUND
Schedule of Investments (continued)
September 30, 2017 (Unaudited)
| | | | | | | | | | | | | | |
Principal
Amount | | | Interest
Rate | | | Maturity
Date | | | Value | |
| Corporate Obligations – (continued) | |
| Banks – (continued) | | | | |
| | Westpac Banking Corp. (5 year USD ICE Swap + 2.236%)(a)(c) | |
| $ | 1,275,000 | | | | 4.322 | % | | | 11/23/31 | | | $ | 1,309,946 | |
| | 475,000 | | | | 5.000 | | | | 09/21/99 | | | | 474,487 | |
| | | | | | | | | | | | | | |
| | | | | | | | | | | | | 75,122,525 | |
| | |
| Beverages – 3.5% | |
| | Anheuser-Busch InBev Finance, Inc.(a) | |
| | 8,175,000 | | | | 3.300 | | | | 02/01/23 | | | | 8,475,630 | |
| | 700,000 | | | | 4.900 | | | | 02/01/46 | | | | 790,697 | |
| | Anheuser-Busch InBev Worldwide, Inc. | |
| | 925,000 | | | | 4.950 | | | | 01/15/42 | | | | 1,047,559 | |
| | Beam Suntory, Inc.(a) | |
| | 1,575,000 | | | | 3.250 | | | | 05/15/22 | | | | 1,611,960 | |
| | Pernod Ricard SA(b) | |
| | 2,300,000 | | | | 4.450 | | | | 01/15/22 | | | | 2,460,675 | |
| | | | | | | | | | | | | | |
| | | | | | | | | | | | | 14,386,521 | |
| | |
| Biotechnology(a) – 0.8% | |
| | Celgene Corp. | |
| | 2,181,000 | | | | 3.625 | | | | 05/15/24 | | | | 2,272,134 | |
| | Gilead Sciences, Inc. | |
| | 700,000 | | | | 4.750 | | | | 03/01/46 | | | | 783,827 | |
| | 300,000 | | | | 4.150 | | | | 03/01/47 | | | | 307,328 | |
| | | | | | | | | | | | | | |
| | | | | | | | | | | | | 3,363,289 | |
| | |
| Chemicals(a) – 1.9% | |
| | Albemarle Corp. | |
| | 450,000 | | | | 4.150 | | | | 12/01/24 | | | | 476,064 | |
| | LYB International Finance BV | |
| | 375,000 | | | | 4.875 | | | | 03/15/44 | | | | 408,248 | |
| | LYB International Finance II BV | |
| | 1,225,000 | | | | 3.500 | | | | 03/02/27 | | | | 1,218,426 | |
| | Monsanto Co. | |
| | 350,000 | | | | 4.700 | | | | 07/15/64 | | | | 353,932 | |
| | The Mosaic Co. | |
| | 100,000 | | | | 5.625 | | | | 11/15/43 | | | | 102,082 | |
| | The Sherwin-Williams Co. | |
| | 325,000 | | | | 2.750 | | | | 06/01/22 | | | | 327,188 | |
| | 2,050,000 | | | | 3.125 | | | | 06/01/24 | | | | 2,060,302 | |
| | 2,075,000 | | | | 3.450 | | | | 06/01/27 | | | | 2,089,428 | |
| | Westlake Chemical Corp. | |
| | 550,000 | | | | 3.600 | | | | 08/15/26 | | | | 549,295 | |
| | | | | | | | | | | | | | |
| | | | | | | | | | | | | 7,584,965 | |
| | |
| Commercial Services – 0.3% | |
| | Ecolab, Inc. | |
| | 942,000 | | | | 5.500 | | | | 12/08/41 | | | | 1,158,967 | |
| | |
| Computers – 1.3% | |
| | Apple, Inc. | |
| | 975,000 | | | | 3.850 | | | | 05/04/43 | | | | 982,227 | |
| | Dell International LLC/EMC Corp.(b) | |
| | 1,100,000 | | | | 3.480 | | | | 06/01/19 | | | | 1,121,843 | |
| | 1,700,000 | | | | 5.450 | (a) | | | 06/15/23 | | | | 1,860,479 | |
| | Hewlett Packard Enterprise Co.(a) | |
| | 1,400,000 | | | | 4.900 | | | | 10/15/25 | | | | 1,481,015 | |
| | | | | | | | | | | | | | |
| | | | | | | | | | | | | 5,445,564 | |
| | |
| Corporate Obligations – (continued) | |
| Diversified Financial Services – 2.5% | |
| | AerCap Ireland Capital DAC/AerCap Global Aviation Trust | |
| 900,000 | | | | 4.625 | | | | 10/30/20 | | | | 957,774 | |
| | Air Lease Corp. | |
| | 1,250,000 | | | | 2.125 | | | | 01/15/20 | | | | 1,248,027 | |
| | Discover Financial Services(a) | |
| | 1,100,000 | | | | 3.750 | | | | 03/04/25 | | | | 1,104,319 | |
| | GE Capital International Funding Co. | |
| | 1,200,000 | | | | 4.418 | | | | 11/15/35 | | | | 1,304,877 | |
| | International Lease Finance Corp. | |
| | 375,000 | | | | 4.625 | | | | 04/15/21 | | | | 398,443 | |
| | KKR Group Finance Co. LLC(b) | |
| | 1,850,000 | | | | 6.375 | | | | 09/29/20 | | | | 2,062,076 | |
| | Synchrony Financial(a) | |
| | 2,675,000 | | | | 2.600 | | | | 01/15/19 | | | | 2,692,133 | |
| | The Charles Schwab Corp.(a) | |
| | 500,000 | | | | 3.200 | | | | 03/02/27 | | | | 502,993 | |
| | | | | | | | | | | | | | |
| | | | | | | | | | | | | 10,270,642 | |
| | |
| Electrical – 5.9% | |
| | Berkshire Hathaway Energy Co. | |
| | 1,300,000 | | | | 6.125 | | | | 04/01/36 | | | | 1,668,695 | |
| | CMS Energy Corp.(a) | |
| | 500,000 | | | | 4.875 | | | | 03/01/44 | | | | 557,687 | |
| | Dominion Energy, Inc.(a) | |
| | 1,450,000 | | | | 2.000 | | | | 08/15/21 | | | | 1,425,989 | |
| | 1,225,000 | | | | 3.900 | | | | 10/01/25 | | | | 1,276,835 | |
| | Duke Energy Corp.(a) | |
| | 500,000 | | | | 2.650 | | | | 09/01/26 | | | | 478,156 | |
| | 400,000 | | | | 4.800 | | | | 12/15/45 | | | | 445,371 | |
| | Emera US Finance LP(a) | |
| | 775,000 | | | | 2.700 | | | | 06/15/21 | | | | 779,175 | |
| | Entergy Corp.(a) | | | | | |
| | 875,000 | | | | 2.950 | | | | 09/01/26 | | | | 846,184 | |
| | Exelon Corp.(a) | |
| | 1,550,000 | | | | 2.850 | | | | 06/15/20 | | | | 1,580,813 | |
| | 1,125,000 | | | | 3.497 | | | | 06/01/22 | | | | 1,158,854 | |
| | 400,000 | | | | 4.450 | | | | 04/15/46 | | | | 418,889 | |
| | Florida Power & Light Co.(a) | |
| | 1,350,000 | | | | 5.250 | | | | 02/01/41 | | | | 1,652,964 | |
| | Pacific Gas & Electric Co.(a) | |
| | 1,000,000 | | | | 4.250 | | | | 03/15/46 | | | | 1,076,130 | |
| | PPL WEM Ltd./Western Power Distribution Ltd.(a)(b) | |
| | 1,750,000 | | | | 5.375 | | | | 05/01/21 | | | | 1,892,649 | |
| | Progress Energy, Inc. | |
| | 1,000,000 | | | | 7.000 | | | | 10/30/31 | | | | 1,348,952 | |
| | Public Service Electric & Gas Co.(a) | |
| | 1,525,000 | | | | 3.950 | | | | 05/01/42 | | | | 1,602,042 | |
| | Puget Sound Energy, Inc. (3M USD LIBOR + 2.530%)(a)(c) | |
| | 2,300,000 | | | | 6.974 | | | | 06/01/67 | | | | 2,242,500 | |
| | Ruwais Power Co. PJSC(b) | |
| | 670,000 | | | | 6.000 | | | | 08/31/36 | | | | 787,250 | |
| | Southern California Edison Co.(a) | |
| | 650,000 | | | | 4.050 | | | | 03/15/42 | | | | 681,534 | |
| | The Southern Co.(a) | |
| | 1,675,000 | | | | 2.350 | | | | 07/01/21 | | | | 1,665,683 | |
| | |
| | |
| 98 | | The accompanying notes are an integral part of these financial statements. |
GOLDMAN SACHS INVESTMENT GRADE CREDIT FUND
| | | | | | | | | | | | | | |
Principal
Amount | | | Interest
Rate | | | Maturity
Date | | | Value | |
| Corporate Obligations – (continued) | |
| Electrical – (continued) | |
| | Virginia Electric & Power Co.(a) | |
| $ | 705,000 | | | | 4.000 | % | | | 01/15/43 | | | $ | 726,593 | |
| | | | | | | | | | | | | | |
| | | | | | | | | | | | | 24,312,945 | |
| | |
| Food & Drug Retailing – 2.0% | |
| | Kraft Heinz Foods Co.(a) | |
| | 1,450,000 | | | | 4.375 | | | | 06/01/46 | | | | 1,431,778 | |
| | Smithfield Foods, Inc.(b) | |
| | 925,000 | | | | 2.700 | | | | 01/31/20 | | | | 927,848 | |
| | Sysco Corp.(a) | |
| | 1,650,000 | | | | 3.750 | | | | 10/01/25 | | | | 1,713,315 | |
| | The JM Smucker Co. | |
| | 1,450,000 | | | | 3.000 | | | | 03/15/22 | | | | 1,472,364 | |
| | Wm Wrigley Jr Co.(a)(b) | |
| | 2,650,000 | | | | 3.375 | | | | 10/21/20 | | | | 2,732,611 | |
| | | | | | | | | | | | | | |
| | | | | | | | | | | | | 8,277,916 | |
| | |
| Healthcare Providers & Services – 5.3% | |
| | Aetna, Inc.(a) | |
| | 1,000,000 | | | | 2.800 | | | | 06/15/23 | | | | 1,006,150 | |
| | Becton Dickinson & Co. | |
| | 3,425,000 | | | | 2.133 | | | | 06/06/19 | | | | 3,434,429 | |
| | 4,000,000 | | | | 2.404 | | | | 06/05/20 | | | | 4,014,034 | |
| | 3,800,000 | | | | 2.894 | (a) | | | 06/06/22 | | | | 3,812,364 | |
| | 1,925,000 | | | | 3.363 | (a) | | | 06/06/24 | | | | 1,942,960 | |
| | 900,000 | | | | 4.685 | (a) | | | 12/15/44 | | | | 951,371 | |
| | C.R. Bard, Inc.(a) | |
| | 3,200,000 | | | | 3.000 | | | | 05/15/26 | | | | 3,210,060 | |
| | Thermo Fisher Scientific, Inc.(a) | |
| | 1,100,000 | | | | 3.650 | | | | 12/15/25 | | | | 1,138,615 | |
| | UnitedHealth Group, Inc. | |
| | 1,125,000 | | | | 4.625 | | | | 07/15/35 | | | | 1,289,339 | |
| | 875,000 | | | | 4.750 | | | | 07/15/45 | | | | 1,010,499 | |
| | | | | | | | | | | | | | |
| | | | | | | | | | | | | 21,809,821 | |
| | |
| Insurance – 4.5% | |
| | AIA Group Ltd.(a)(b) | |
| | 2,125,000 | | | | 3.200 | | | | 03/11/25 | | | | 2,125,628 | |
| | American International Group, Inc. | |
| | 475,000 | | | | 3.750 | (a) | | | 07/10/25 | | | | 490,536 | |
| | 700,000 | | | | 6.250 | | | | 05/01/36 | | | | 894,730 | |
| | 1,425,000 | | | | 4.500 | (a) | | | 07/16/44 | | | | 1,487,182 | |
| | Arch Capital Finance LLC(a) | |
| | 400,000 | | | | 4.011 | | | | 12/15/26 | | | | 414,809 | |
| | Arch Capital Group Ltd. | |
| | 645,000 | | | | 7.350 | | | | 05/01/34 | | | | 858,641 | |
| | Brighthouse Financial, Inc.(a)(b) | |
| | 1,275,000 | | | | 3.700 | | | | 06/22/27 | | | | 1,251,891 | |
| | MetLife, Inc. | |
| | 2,275,000 | | | | 3.600 | | | | 04/10/24 | | | | 2,378,350 | |
| | 400,000 | | | | 4.050 | | | | 03/01/45 | | | | 406,612 | |
| | Reliance Standard Life Global Funding II(b) | |
| | 2,350,000 | | | | 2.500 | | | | 01/15/20 | | | | 2,360,810 | |
| | Teachers Insurance & Annuity Association of America(b) | |
| | 890,000 | | | | 4.900 | | | | 09/15/44 | | | | 1,005,152 | |
| | |
| Corporate Obligations – (continued) | |
| Insurance – (continued) | |
| | The Chubb Corp. (3M USD LIBOR + 2.250%)(a)(c) | |
| 868,000 | | | | 3.554 | | | | 03/29/67 | | | | 863,226 | |
| | The Hartford Financial Services Group, Inc. | |
| | 400,000 | | | | 5.950 | | | | 10/15/36 | | | | 500,597 | |
| | 376,000 | | | | 6.625 | | | | 03/30/40 | | | | 511,413 | |
| | 815,000 | | | | 6.100 | | | | 10/01/41 | | | | 1,053,288 | |
| | 200,000 | | | | 6.625 | | | | 04/15/42 | | | | 265,933 | |
| | The Northwestern Mutual Life Insurance Co.(a)(b) | |
| | 800,000 | | | | 3.850 | | | | 09/30/47 | | | | 790,938 | |
| | XLIT Ltd. | |
| | 998,000 | | | | 4.450 | | | | 03/31/25 | | | | 1,021,952 | |
| | | | | | | | | | | | | | |
| | | | | | | | | | | | | 18,681,688 | |
| | |
| Internet(a)(b) – 0.7% | |
| | Amazon.com, Inc. | |
| | 1,650,000 | | | | 3.875 | | | | 08/22/37 | | | | 1,679,166 | |
| | Expedia, Inc. | |
| | 1,050,000 | | | | 3.800 | | | | 02/15/28 | | | | 1,040,566 | |
| | | | | | | | | | | | | | |
| | | | | | | | | | | | | 2,719,732 | |
| | |
| Machinery-Diversified(a) – 0.3% | |
| | Roper Technologies, Inc. | |
| | 1,275,000 | | | | 3.800 | | | | 12/15/26 | | | | 1,312,435 | |
| | |
| Media – 3.2% | |
| | 21st Century Fox America, Inc. | |
| | 1,400,000 | | | | 6.150 | | | | 02/15/41 | | | | 1,749,924 | |
| Charter Communications Operating LLC/Charter Communications
Operating Capital(a) |
|
| | 1,175,000 | | | | 3.579 | | | | 07/23/20 | | | | 1,206,228 | |
| | 1,675,000 | | | | 4.464 | | | | 07/23/22 | | | | 1,772,194 | |
| | 2,750,000 | | | | 4.908 | | | | 07/23/25 | | | | 2,939,793 | |
| | 700,000 | | | | 6.384 | | | | 10/23/35 | | | | 818,737 | |
| | Comcast Corp. | |
| | 1,375,000 | | | | 4.250 | | | | 01/15/33 | | | | 1,478,560 | |
| | 900,000 | | | | 6.450 | | | | 03/15/37 | | | | 1,203,290 | |
| | Time Warner Cable LLC | |
| | 890,000 | | | | 6.750 | | | | 07/01/18 | | | | 922,217 | |
| | 500,000 | | | | 5.875 | (a) | | | 11/15/40 | | | | 548,682 | |
| | 300,000 | | | | 5.500 | (a) | | | 09/01/41 | | | | 311,498 | |
| | | | | | | | | | | | | | |
| | | | | | | | | | | | | 12,951,123 | |
| | |
| Mining(b) – 0.7% | |
| | Glencore Finance Canada Ltd. | |
| | 800,000 | | | | 4.950 | | | | 11/15/21 | | | | 863,928 | |
| | 825,000 | | | | 4.250 | | | | 10/25/22 | | | | 868,208 | |
| | Glencore Funding LLC | |
| | 940,000 | | | | 4.625 | | | | 04/29/24 | | | | 995,695 | |
| | | | | | | | | | | | | | |
| | | | | | | | | | | | | 2,727,831 | |
| | |
| Miscellaneous Manufacturing – 0.1% | |
| | General Electric Co. | |
| | 294,000 | | | | 5.875 | | | | 01/14/38 | | | | 384,726 | |
| | |
| | |
| The accompanying notes are an integral part of these financial statements. | | 99 |
GOLDMAN SACHS INVESTMENT GRADE CREDIT FUND
Schedule of Investments (continued)
September 30, 2017 (Unaudited)
| | | | | | | | | | | | | | |
Principal
Amount | | | Interest
Rate | | | Maturity
Date | | | Value | |
| Corporate Obligations – (continued) | |
| Oil Field Services – 6.2% | |
| | Anadarko Petroleum Corp. | |
| $ | 4,025,000 | | | | 8.700 | % | | | 03/15/19 | | | $ | 4,392,845 | |
| | 1,540,000 | | | | 3.450 | (a) | | | 07/15/24 | | | | 1,528,313 | |
| | 425,000 | | | | 5.550 | (a) | | | 03/15/26 | | | | 474,658 | |
| | 525,000 | | | | 6.450 | | | | 09/15/36 | | | | 621,073 | |
| | Apache Corp.(a) | |
| | 525,000 | | | | 2.625 | | | | 01/15/23 | | | | 514,584 | |
| | 1,070,000 | | | | 4.250 | | | | 01/15/44 | | | | 1,004,817 | |
| | BP Capital Markets PLC(a) | |
| | 1,025,000 | | | | 3.119 | | | | 05/04/26 | | | | 1,024,636 | |
| | Canadian Natural Resources Ltd.(a) | |
| | 275,000 | | | | 3.850 | | | | 06/01/27 | | | | 278,014 | |
| | ConocoPhillips Co.(a) | |
| | 660,000 | | | | 3.350 | | | | 11/15/24 | | | | 678,746 | |
| | 1,650,000 | | | | 4.950 | | | | 03/15/26 | | | | 1,859,917 | |
| | 725,000 | | | | 4.150 | | | | 11/15/34 | | | | 748,609 | |
| | Devon Energy Corp.(a) | |
| | 1,320,000 | | | | 3.250 | | | | 05/15/22 | | | | 1,335,617 | |
| | Dolphin Energy Ltd.(b) | |
| | 81,027 | | | | 5.888 | | | | 06/15/19 | | | | 83,863 | |
| | EQT Corp.(a) | |
| | 525,000 | | | | 3.000 | | | | 10/01/22 | | | | 526,224 | |
| | Halliburton Co.(a) | |
| | 1,400,000 | | | | 3.800 | | | | 11/15/25 | | | | 1,437,533 | |
| | 900,000 | | | | 5.000 | | | | 11/15/45 | | | | 987,123 | |
| | Petroleos Mexicanos | |
| | 170,000 | | | | 5.500 | | | | 02/04/19 | | | | 177,012 | |
| | 422,000 | | | | 6.375 | | | | 02/04/21 | | | | 461,140 | |
| EUR | 1,370,000 | | | | 5.125 | | | | 03/15/23 | | | | 1,853,988 | |
| $ | 1,722,000 | | | | 6.875 | | | | 08/04/26 | | | | 1,958,603 | |
| | 200,000 | | | | 6.500 | (b) | | | 03/13/27 | | | | 221,646 | |
| | 20,000 | | | | 5.500 | | | | 06/27/44 | | | | 18,600 | |
| | 180,000 | | | | 5.625 | | | | 01/23/46 | | | | 168,030 | |
| | 110,000 | | | | 6.750 | (b) | | | 09/21/47 | | | | 117,084 | |
| | Pioneer Natural Resources Co.(a) | |
| | 1,610,000 | | | | 3.450 | | | | 01/15/21 | | | | 1,646,183 | |
| | 575,000 | | | | 3.950 | | | | 07/15/22 | | | | 604,230 | |
| | Suncor Energy, Inc.(a) | |
| | 900,000 | | | | 3.600 | | | | 12/01/24 | | | | 928,518 | |
| | | | | | | | | | | | | | |
| | | | | | | | | | | | | 25,651,606 | |
| | |
| Pharmaceuticals – 3.6% | |
| | AbbVie, Inc.(a) | |
| | 2,500,000 | | | | 2.300 | | | | 05/14/21 | | | | 2,495,881 | |
| | Allergan Funding SCS(a) | |
| | 1,125,000 | | | | 4.550 | | | | 03/15/35 | | | | 1,200,276 | |
| | AmerisourceBergen Corp.(a) | |
| | 2,975,000 | | | | 3.250 | | | | 03/01/25 | | | | 3,004,867 | |
| | Forest Laboratories LLC(a)(b) | |
| | 550,000 | | | | 4.375 | | | | 02/01/19 | | | | 564,026 | |
| | 1,550,000 | | | | 5.000 | | | | 12/15/21 | | | | 1,693,996 | |
| | Mylan NV(a) | |
| | 2,800,000 | | | | 3.950 | | | | 06/15/26 | | | | 2,850,692 | |
| | 300,000 | | | | 5.250 | | | | 06/15/46 | | | | 325,425 | |
| | Shire Acquisitions Investments Ireland DAC(a) | |
| | 725,000 | | | | 3.200 | | | | 09/23/26 | | | | 714,718 | |
| | |
| Corporate Obligations – (continued) | |
| Pharmaceuticals – (continued) | |
| | Teva Pharmaceutical Finance Netherlands III BV | |
| 660,000 | | | | 2.200 | | | | 07/21/21 | | | | 635,450 | |
| | 1,275,000 | | | | 2.800 | | | | 07/21/23 | | | | 1,216,085 | |
| | 50,000 | | | | 3.150 | | | | 10/01/26 | | | | 46,085 | |
| | | | | | | | | | | | | | |
| | | | | | | | | | | | | 14,747,501 | |
| | |
| Pipelines – 6.3% | |
| | Enbridge, Inc.(a) | |
| | 750,000 | | | | 2.900 | | | | 07/15/22 | | | | 754,390 | |
| | 1,000,000 | | | | 3.500 | | | | 06/10/24 | | | | 1,015,481 | |
| | Energy Transfer LP(a) | |
| | 650,000 | | | | 4.650 | | | | 06/01/21 | | | | 690,835 | |
| | 1,540,000 | | | | 5.200 | | | | 02/01/22 | | | | 1,669,135 | |
| | 456,000 | | | | 5.150 | | | | 03/15/45 | | | | 445,474 | |
| | Enterprise Products Operating LLC | |
| | (3M USD LIBOR + 3.708%)(a)(c) | |
| | 600,000 | | | | 5.018 | | | | 08/01/66 | | | | 600,300 | |
| | (3M USD LIBOR + 2.778%)(a)(c) | |
| | 1,765,000 | | | | 4.093 | | | | 06/01/67 | | | | 1,713,092 | |
| | Kinder Morgan Energy Partners LP(a) | |
| | 1,500,000 | | | | 3.950 | | | | 09/01/22 | | | | 1,557,298 | |
| | 1,650,000 | | | | 5.400 | | | | 09/01/44 | | | | 1,715,370 | |
| | Kinder Morgan, Inc.(a) | |
| | 1,000,000 | | | | 3.050 | | | | 12/01/19 | | | | 1,018,083 | |
| | Magellan Midstream Partners LP(a) | |
| | 300,000 | | | | 4.200 | | | | 03/15/45 | | | | 287,063 | |
| | 400,000 | | | | 4.250 | | | | 09/15/46 | | | | 396,594 | |
| | Plains All American Pipeline LP/PAA Finance Corp.(a) | |
| | 400,000 | | | | 3.650 | | | | 06/01/22 | | | | 402,114 | |
| | 1,819,000 | | | | 4.650 | | | | 10/15/25 | | | | 1,873,245 | |
| | 530,000 | | | | 5.150 | | | | 06/01/42 | | | | 500,016 | |
| | 500,000 | | | | 4.700 | | | | 06/15/44 | | | | 452,456 | |
| | Sabine Pass Liquefaction LLC(a) | |
| | 1,875,000 | | | | 6.250 | | | | 03/15/22 | | | | 2,108,896 | |
| | 2,025,000 | | | | 5.625 | | | | 03/01/25 | | | | 2,235,094 | |
| | Valero Energy Partners LP(a) | |
| | 1,325,000 | | | | 4.375 | | | | 12/15/26 | | | | 1,367,360 | |
| | Western Gas Partners LP(a) | |
| | 775,000 | | | | 5.450 | | | | 04/01/44 | | | | 820,665 | |
| | Williams Partners LP | |
| | 3,630,000 | | | | 3.600 | (a) | | | 03/15/22 | | | | 3,750,496 | |
| | 150,000 | | | | 6.300 | | | | 04/15/40 | | | | 179,647 | |
| | 275,000 | | | | 4.900 | (a) | | | 01/15/45 | | | | 278,136 | |
| | 181,000 | | | | 5.100 | (a) | | | 09/15/45 | | | | 190,248 | |
| | | | | | | | | | | | | | |
| | | | | | | | | | | | | 26,021,488 | |
| | |
| Real Estate Investment Trust – 5.2% | |
| | American Campus Communities Operating Partnership LP(a) | |
| | 3,200,000 | | | | 4.125 | | | | 07/01/24 | | | | 3,351,573 | |
| | American Tower Corp. | |
| | 1,625,000 | | | | 3.300 | (a) | | | 02/15/21 | | | | 1,665,094 | |
| | 1,550,000 | | | | 5.000 | | | | 02/15/24 | | | | 1,710,062 | |
| | Crown Castle International Corp.(a) | |
| | 675,000 | | | | 2.250 | | | | 09/01/21 | | | | 665,687 | |
| | 450,000 | | | | 3.200 | | | | 09/01/24 | | | | 447,864 | |
| | 775,000 | | | | 3.650 | | | | 09/01/27 | | | | 774,574 | |
| | |
| | |
| 100 | | The accompanying notes are an integral part of these financial statements. |
GOLDMAN SACHS INVESTMENT GRADE CREDIT FUND
| | | | | | | | | | | | | | |
Principal
Amount | | | Interest
Rate | | | Maturity
Date | | | Value | |
| Corporate Obligations – (continued) | |
| Real Estate Investment Trust – (continued) | |
| | CubeSmart LP(a) | |
| $ | 1,625,000 | | | | 4.800 | % | | | 07/15/22 | | | $ | 1,762,490 | |
| | DDR Corp.(a) | |
| | 550,000 | | | | 3.500 | | | | 01/15/21 | | | | 558,155 | |
| | 440,000 | | | | 3.625 | | | | 02/01/25 | | | | 427,755 | |
| | 425,000 | | | | 4.250 | | | | 02/01/26 | | | | 426,258 | |
| | Digital Realty Trust LP(a) | |
| | 375,000 | | | | 3.700 | | | | 08/15/27 | | | | 378,519 | |
| | HCP, Inc.(a) | |
| | 1,975,000 | | | | 2.625 | | | | 02/01/20 | | | | 1,990,849 | |
| | Kilroy Realty LP | |
| | 1,125,000 | | | | 6.625 | | | | 06/01/20 | | | | 1,242,246 | |
| | MPT Operating Partnership LP/MPT Finance Corp.(a) | |
| | 510,000 | | | | 5.000 | | | | 10/15/27 | | | | 522,750 | |
| | National Retail Properties, Inc.(a) | |
| | 700,000 | | | | 3.600 | | | | 12/15/26 | | | | 693,084 | |
| | Select Income REIT(a) | |
| | 1,125,000 | | | | 3.600 | | | | 02/01/20 | | | | 1,141,351 | |
| | VEREIT Operating Partnership LP(a) | |
| | 1,225,000 | | | | 4.875 | | | | 06/01/26 | | | | 1,315,344 | |
| | WEA Finance LLC/Westfield UK & Europe Finance PLC(a)(b) | |
| | 2,150,000 | | | | 2.700 | | | | 09/17/19 | | | | 2,168,968 | |
| | | | | | | | | | | | | | |
| | | | | | | | | | | | | 21,242,623 | |
| | |
| Retailing – 0.5% | |
| | Alimentation Couche-Tard, Inc.(a)(b) | |
| | 725,000 | | | | 2.700 | | | | 07/26/22 | | | | 727,349 | |
| | 225,000 | | | | 3.550 | | | | 07/26/27 | | | | 226,896 | |
| | CVS Health Corp.(a) | |
| | 275,000 | | | | 5.125 | | | | 07/20/45 | | | | 316,265 | |
| | The Home Depot, Inc. | |
| | 400,000 | | | | 5.875 | | | | 12/16/36 | | | | 519,563 | |
| | Walgreens Boots Alliance, Inc.(a) | |
| | 375,000 | | | | 4.650 | | | | 06/01/46 | | | | 391,629 | |
| | | | | | | | | | | | | | |
| | | | | | | | | | | | | 2,181,702 | |
| | |
| Semiconductors – 1.9% | |
| | Broadcom Corp./Broadcom Cayman Finance Ltd.(a)(b) | |
| | 1,975,000 | | | | 3.000 | | | | 01/15/22 | | | | 2,007,947 | |
| | 2,175,000 | | | | 3.625 | | | | 01/15/24 | | | | 2,234,545 | |
| | NVIDIA Corp.(a) | |
| | 625,000 | | | | 3.200 | | | | 09/16/26 | | | | 621,749 | |
| | NXP BV/NXP Funding LLC(b) | |
| | 1,167,000 | | | | 4.125 | | | | 06/15/20 | | | | 1,218,057 | |
| | 1,700,000 | | | | 4.125 | | | | 06/01/21 | | | | 1,778,625 | |
| | | | | | | | | | | | | | |
| | | | | | | | | | | | | 7,860,923 | |
| | |
| Software(a) – 1.5% | |
| | Fidelity National Information Services, Inc. | |
| | 1,627,000 | | | | 4.500 | | | | 10/15/22 | | | | 1,757,854 | |
| | Fiserv, Inc. | |
| | 2,500,000 | | | | 2.700 | | | | 06/01/20 | | | | 2,528,907 | |
| | Microsoft Corp. | |
| | 275,000 | | | | 4.100 | | | | 02/06/37 | | | | 298,022 | |
| | Oracle Corp. | |
| | 1,400,000 | | | | 4.300 | | | | 07/08/34 | | | | 1,529,867 | |
| | | | | | | | | | | | | | |
| | | | | | | | | | | | | 6,114,650 | |
| | |
| Corporate Obligations – (continued) | |
| Telecommunication Services – 9.8% | |
| | AT&T, Inc.(a) | |
| 2,000,000 | | | | 4.600 | | | | 02/15/21 | | | | 2,124,598 | |
| | 350,000 | | | | 2.800 | | | | 02/17/21 | | | | 354,168 | |
| | 1,875,000 | | | | 3.000 | | �� | | 06/30/22 | | | | 1,893,256 | |
| | 3,547,000 | | | | 3.600 | | | | 02/17/23 | | | | 3,649,459 | |
| | 600,000 | | | | 3.950 | | | | 01/15/25 | | | | 616,271 | |
| | 4,750,000 | | | | 3.400 | | | | 05/15/25 | | | | 4,685,404 | |
| | 3,200,000 | | | | 3.900 | | | | 08/14/27 | | | | 3,206,229 | |
| | 300,000 | | | | 6.000 | | | | 08/15/40 | | | | 337,892 | |
| | Cisco Systems, Inc. | |
| | 300,000 | | | | 5.900 | | | | 02/15/39 | | | | 395,132 | |
| | Telefonica Emisiones SAU | |
| | 4,890,000 | | | | 5.462 | | | | 02/16/21 | | | | 5,359,824 | |
| | Verizon Communications, Inc. | |
| | 3,725,000 | | | | 2.946 | | | | 03/15/22 | | | | 3,788,117 | |
| | 4,675,000 | | | | 2.450 | (a) | | | 11/01/22 | | | | 4,639,349 | |
| | 6,675,000 | | | | 5.150 | | | | 09/15/23 | | | | 7,482,458 | |
| | 1,200,000 | | | | 3.500 | (a) | | | 11/01/24 | | | | 1,221,837 | |
| | 250,000 | | | | 4.125 | | | | 03/16/27 | | | | 260,853 | |
| | 325,000 | | | | 4.272 | | | | 01/15/36 | | | | 319,281 | |
| | 25,000 | | | | 4.125 | | | | 08/15/46 | | | | 22,727 | |
| | 75,000 | | | | 4.862 | | | | 08/21/46 | | | | 76,025 | |
| | | | | | | | | | | | | | |
| | | | | | | | | | | | | 40,432,880 | |
| | |
| Transportation – 0.2% | |
| | Burlington Northern Santa Fe LLC | |
| | 425,000 | | | | 6.150 | | | | 05/01/37 | | | | 550,761 | |
| | Norfolk Southern Corp.(a) | |
| | 200,000 | | | | 4.650 | | | | 01/15/46 | | | | 221,367 | |
| | | | | | | | | | | | | | |
| | | | | | | | | | | | | 772,128 | |
| | |
| Trucking & Leasing(b) – 0.7% | |
| | Penske Truck Leasing Co. LP/PTL Finance Corp. | |
| | 2,275,000 | | | | 3.375 | (a) | | | 02/01/22 | | | | 2,335,901 | |
| | 650,000 | | | | 4.875 | | | | 07/11/22 | | | | 707,829 | |
| | | | | | | | | | | | | | |
| | | | | | | | | | | | | 3,043,730 | |
| | |
| | TOTAL CORPORATE OBLIGATIONS | | | | | |
| | (Cost $372,977,710) | | | $ | 381,855,221 | |
| | |
| | | | | | | | | | | | | | |
| Foreign Debt Obligations – 2.3% | |
| Sovereign – 2.3% | |
| | Republic of Colombia | |
| $ | 1,221,000 | | | | 4.000 | %(a) | | | 02/26/24 | | | $ | 1,274,113 | |
| | 1,492,000 | | | | 6.125 | | | | 01/18/41 | | | | 1,756,084 | |
| | Republic of Indonesia | |
| | 200,000 | | | | 3.700 | (b) | | | 01/08/22 | | | | 207,580 | |
| | 387,000 | | | | 5.875 | | | | 01/15/24 | | | | 443,637 | |
| | 430,000 | | | | 4.125 | | | | 01/15/25 | | | | 451,212 | |
| EUR | 510,000 | | | | 3.375 | | | | 07/30/25 | | | | 664,553 | |
| $ | 350,000 | | | | 4.350 | (b) | | | 01/08/27 | | | | 371,389 | |
| EUR | 400,000 | | | | 3.750 | | | | 06/14/28 | | | | 527,719 | |
| $ | 470,000 | | | | 6.750 | | | | 01/15/44 | | | | 628,503 | |
| | |
| | |
| The accompanying notes are an integral part of these financial statements. | | 101 |
GOLDMAN SACHS INVESTMENT GRADE CREDIT FUND
Schedule of Investments (continued)
September 30, 2017 (Unaudited)
| | | | | | | | | | | | | | |
Principal
Amount | | | Interest
Rate | | | Maturity
Date | | | Value | |
| Foreign Debt Obligations – (continued) | |
| Sovereign – (continued) | |
| | United Mexican States | |
| $ | 1,810,000 | | | | 6.050 | % | | | 01/11/40 | | | $ | 2,172,905 | |
| | 410,000 | | | | 4.750 | | | | 03/08/44 | | | | 422,915 | |
| | 680,000 | | | | 5.750 | | | | 10/12/10 | (d) | | | 731,000 | |
| | |
| | TOTAL FOREIGN DEBT OBLIGATIONS | | | | | |
| | (Cost $8,606,990) | | | $ | 9,651,610 | |
| | |
| | |
| Municipal Debt Obligations(a) – 3.1% | |
| California – 2.0% | |
| | California State GO Bonds Build America Taxable Series 2009 | |
| $ | 455,000 | | | | 7.300 | % | | | 10/01/39 | | | $ | 668,841 | |
| | California State GO Bonds Build America Taxable Series 2010 | |
| | 2,320,000 | | | | 7.625 | | | | 03/01/40 | | | | 3,555,029 | |
| | California State University RB Build America Bonds Series 2010 | |
| | 2,825,000 | | | | 6.484 | | | | 11/01/41 | | | | 3,847,876 | |
| | | | | | | | | | | | | | |
| | | | | | | | | | | | | 8,071,746 | |
| | |
| Illinois – 1.0% | |
| Chicago Illinois Metropolitan Water Reclamation District GO
Bonds Build America Taxable Direct Payment Series 2009 |
|
| | 1,775,000 | | | | 5.720 | | | | 12/01/38 | | | | 2,246,529 | |
| | Illinois State GO Bonds Build America Series 2010 | |
| | 1,625,000 | | | | 6.630 | | | | 02/01/35 | | | | 1,821,592 | |
| | | | | | | | | | | | | | |
| | | | | | | | | | | | | 4,068,121 | |
| | |
| New Jersey – 0.1% | |
| New Jersey State Turnpike Authority RB Build America Bonds
Taxable Series 2009 F |
|
| | 350,000 | | | | 7.414 | | | | 01/01/40 | | | | 527,740 | |
| | |
| | TOTAL MUNICIPAL DEBT OBLIGATIONS | |
| | (Cost $9,459,039) | | | $ | 12,667,607 | |
| | |
| | | | | | | | | | | | | | |
| U.S. Treasury Obligations – 0.4% | |
| | United States Treasury Inflation Indexed Bonds | |
| $ | 835,752 | | | | 0.125 | % | | | 04/15/19 | | | $ | 839,120 | |
| | 209,062 | | | | 0.125 | | | | 04/15/20 | | | | 210,155 | |
| | 228,032 | | | | 2.500 | | | | 01/15/29 | | | | 275,463 | |
| | 395,491 | | | | 0.875 | | | | 02/15/47 | | | | 390,128 | |
| | |
| | TOTAL U.S. TREASURY OBLIGATIONS | |
| | (Cost $1,724,174) | | | $ | 1,714,866 | |
| | |
| | TOTAL INVESTMENTS – 98.5% | | | | | |
| | (Cost $392,767,913) | | | $ | 405,889,304 | |
| | |
| OTHER ASSETS IN EXCESS OF
LIABILITIES – 1.5% |
| | | 6,158,963 | |
| | |
| | NET ASSETS – 100.0% | | | $ | 412,048,267 | |
| | |
| | |
| The percentage shown for each investment category reflects the value of investments in that category as a percentage of net assets. |
(a) | | Security with “Call” features with resetting interest rates. Maturity dates disclosed are the final maturity dates. |
(b) | | Exempt from registration under Rule 144A of the Securities Act of 1933. Such securities may be deemed liquid by the investment adviser and may be resold, normally to qualified institutional buyers in transactions exempt from registration. Total market value of Rule 144A securities amounts to $66,197,860, which represents approximately 16.1% of net assets as of September 30, 2017. |
(c) | | Variable rate security. Interest rate disclosed is that which is in effect on September 20, 2017. |
(d) | | Actual maturity date is October 12, 2110. |
| | |
|
Currency Abbreviations: |
EUR | | —Euro |
USD | | —U.S. Dollar |
| | |
Investment Abbreviations: |
BP | | —British Pound Offered Rate |
GO | | —General Obligation |
LIBOR | | —London Interbank Offered Rate |
LLC | | —Limited Liability Company |
LP | | —Limited Partnership |
PLC | | —Public Limited Company |
RB | | —Revenue Bond |
REIT | | —Real Estate Investment Trust |
|
| | |
| 102 | | The accompanying notes are an integral part of these financial statements. |
GOLDMAN SACHS INVESTMENT GRADE CREDIT FUND
|
| ADDITIONAL INVESTMENT INFORMATION |
FORWARD FOREIGN CURRENCY EXCHANGE CONTRACTS — At September 30, 2017, the Fund had the following forward foreign currency exchange contracts:
FORWARD FOREIGN CURRENCY EXCHANGE CONTRACTS WITH UNREALIZED GAIN
| | | | | | | | | | | | | | | | | | | | | | | | |
| Counterparty | | Currency
Purchased | | | Currency
Sold | | Current
Value | | | Settlement
Date | | | Unrealized
Gain | |
Westpac Banking Corp. | | | USD | | | | 371,388 | | | EUR | | 314,000 | | $ | 371,360 | | | | 10/12/17 | | | $ | 27 | |
FORWARD FOREIGN CURRENCY EXCHANGE CONTRACTS WITH UNREALIZED LOSS
| | | | | | | | | | | | | | | | | | | | | | | | |
| Counterparty | | Currency
Purchased | | | Currency
Sold | | Current
Value | | | Settlement
Date | | | Unrealized
Loss | |
Westpac Banking Corp. | | | USD | | | | 2,724,901 | | | EUR | | 2,311,545 | | $ | 2,733,810 | | | | 10/12/17 | | | $ | (8,909 | ) |
FUTURES CONTRACTS — At September 30, 2017, the Fund had the following futures contracts:
| | | | | | | | | | | | | | | | |
| Description | | Number of
Contracts | | | Expiration
Date | | | Notional
Amount | | | Unrealized
Appreciation/
(Depreciation) | |
Long position contracts: | | | | | | | | | | | | | | | | |
20 Year U.S. Treasury Bonds | | | 58 | | | | 12/19/17 | | | $ | 8,863,125 | | | $ | (147,827 | ) |
Ultra Long U.S. Treasury Bonds | | | 106 | | | | 12/19/17 | | | | 17,503,250 | | | | (313,107 | ) |
2 Year U.S. Treasury Notes | | | 83 | | | | 12/29/17 | | | | 17,903,359 | | | | (50,267 | ) |
| Total | | | | | | | | | | | | | | $ | (511,201 | ) |
Short position contracts: | | | | | | | | | | | | | | | | |
Eurodollars | | | (53 | ) | | | 12/17/18 | | | $ | (13,002,888 | ) | | $ | (4,774 | ) |
10 Year U.S. Treasury Notes | | | (28 | ) | | | 12/19/17 | | | | (3,508,750 | ) | | | 24,589 | |
5 Year U.S. Treasury Notes | | | (296 | ) | | | 12/29/17 | | | | (34,780,000 | ) | | | 222,586 | |
Ultra 10 Year U.S. Treasury Notes | | | (28 | ) | | | 12/19/17 | | | | (3,761,187 | ) | | | 44,054 | |
| Total | | | | | | | | | | | | | | $ | 286,455 | |
| TOTAL | | | | | | | | | | | | | | $ | (224,746 | ) |
SWAP CONTRACTS — At September 30, 2017, the Fund had the following swap contracts:
CENTRALLY CLEARED INTEREST RATE SWAP CONTRACTS
| | | | | | | | | | | | | | | | | | | | | | |
| Payments Made by the Fund | | Payments
Received
by Fund | | Termination
Date | | | Notional
Amount
(000s)(a) | | | Value | | | Upfront
Premium
(Received) Paid | | | Unrealized
Appreciation/
(Depreciation) | |
2.143%(b) | | 3M LIBOR(c) | | | 07/03/23 | | | $ | 1,460 | | | $ | (63 | ) | | $ | (754 | ) | | $ | 691 | |
3M LIBOR(c) | | 2.065%(b) | | | 08/06/23 | | | | 3,880 | | | | (16,656 | ) | | | 1,398 | | | | (18,054 | ) |
3M LIBOR(c) | | 2.378(b) | | | 07/03/28 | | | | 4,100 | | | | (507 | ) | | | 66 | | | | (573 | ) |
2.346(b) | | 3M LIBOR(c) | | | 08/06/28 | | | | 2,190 | | | | 8,444 | | | | (2,267 | ) | | | 10,711 | |
2.560(b) | | 3M LIBOR(c) | | | 07/03/48 | | | | 1,720 | | | | 2,580 | | | | 62 | | | | 2,518 | |
| TOTAL | | | | | | | | | | | | $ | (6,202 | ) | | $ | (1,495 | ) | | $ | (4,707 | ) |
| | (a) | | Represents forward starting interest rate swaps whose effective dates of commencement of accruals and cash flows occur subsequent to September 30, 2017. |
| | (b) | | Payments made semi-annually. |
| | (c) | | Payments made quarterly. |
| | |
| The accompanying notes are an integral part of these financial statements. | | 103 |
GOLDMAN SACHS INVESTMENT GRADE CREDIT FUND
Schedule of Investments (continued)
September 30, 2017 (Unaudited)
|
| ADDITIONAL INVESTMENT INFORMATION (continued) |
CENTRALLY CLEARED CREDIT DEFAULT SWAP CONTRACT
| | | | | | | | | | | | | | | | | | | | | | | | | | | | |
| Referenced Obligation/Index | | Financing Rate
Received/(Paid)
by the Fund(a) | | | Credit
Spread at
September 30,
2017(b) | | | Termination
Date | | | Notional
Amount
(000s) | | | Value | | | Upfront
Premiums
(Received) Paid | | | Unrealized
Appreciation/
(Depreciation) | |
Protection Sold: | | | | | | | | | | | | | | | | | | | | | | | | | | | | |
| CDX.NA.IG Index 28 | | | 1.000 | % | | | 0.529 | % | | | 06/20/22 | | | $ | 22,675 | | | $ | 486,316 | | | $ | 446,615 | | | $ | 39,731 | |
| | (a) | | Payments made quarterly. |
| | (b) | | Credit spread on the referenced obligation, together with the term of the swap contract, are indicators of payment/performance risk. The likelihood of a credit event occurring which would require a fund or its counterparty to make a payment or otherwise be required to perform under the swap contract is generally greater as the credit spread and the term of the swap contract increase. |
PURCHASED OPTIONS CONTRACTS — At September 30, 2017, the Fund had the following purchased options:
PURCHASED OPTIONS ON FUTURES CONTRACTS
| | | | | | | | | | | | | | | | | | | | | | | | | | | | | | | | |
| Description | | Counterparty | | | Exercise
Price | | | Expiration
Date | | | Number of
Contracts | | | Notional
Amount | | | Value | | | Premiums
Paid (Received) | | | Unrealized
Appreciation/
(Depreciation) | |
Purchased option contracts | | | | | | | | | | | | | | | | | | | | | | | | | | | | | | | | |
Puts: | | | | | | | | | | | | | | | | | | | | | | | | | | | | | | | | |
| Eurodollar Futures | | | MS & Co. Int. PLC | | | | 98.00 | | | | 06/15/18 | | | | 48 | | | $ | 120,000 | | | $ | 18,600 | | | $ | 13,308 | | | $ | 5,292 | |
| | |
|
Abbreviation: |
CDX.NA.IG Index 28 | | —CDX North America Investment Grade Index 28 |
MS & Co. Int. PLC | | —Morgan Stanley & Co. International PLC |
|
| | |
| 104 | | The accompanying notes are an integral part of these financial statements. |
GOLDMAN SACHS LOCAL EMERGING MARKETS DEBT FUND
Schedule of Investments
September 30, 2017 (Unaudited)
| | | | | | | | | | | | | | |
Principal
Amount | | | Interest
Rate | | | Maturity
Date | | | Value | |
| Sovereign Debt Obligations – 73.6% | |
| Argentina – 4.3% | | | | | | | | | | |
| Provincia de Buenos Aires (NR/B3) (Argentina Deposit
Rates + 3.830%)(a) |
|
| ARS | 8,920,000 | | | | 24.500 | % | | | 05/31/22 | | | $ | 517,238 | |
| | Republic of Argentina (NR/NR) | |
| | 127,605,000 | | | | 26.250 | | | | 06/21/20 | | | | 7,746,303 | |
| | Republic of Argentina (NR/B3) | |
| | 7,240,000 | | | | 22.750 | | | | 03/05/18 | | | | 414,997 | |
| | 354,000 | | | | 18.200 | | | | 10/03/21 | | | | 21,053 | |
| | 14,800,000 | | | | 16.000 | | | | 10/17/23 | | | | 887,999 | |
| | 300,000 | | | | 15.500 | | | | 10/17/26 | | | | 18,430 | |
| | Republic of Argentina (B/NR) | |
| | (Argentina Deposit Rates + 2.500%)(a) | |
| | 750,000 | | | | 22.710 | | | | 03/11/19 | | | | 43,631 | |
| | (Argentina Deposit Rates + 3.250%)(a) | |
| | 225,000 | | | | 23.338 | | | | 03/01/20 | | | | 13,335 | |
| | Republic of Argentina (B/NR) | | | | | |
| $ | 1,040,000 | | | | 7.125 | (b)(c) | | | 06/28/17 | | | | 1,037,920 | |
| | Republic of Argentina (B/B3) | |
| EUR | 1,110,000 | | | | 5.000 | | | | 01/15/27 | | | | 1,297,150 | |
| | 60,000 | | | | 2.260 | (d) | | | 12/31/38 | | | | 48,399 | |
| $ | 180,000 | | | | 2.500 | (d) | | | 12/31/38 | | | | 127,350 | |
| | | | | | | | | | | | | | |
| | | | | | | | | | | | | 12,173,805 | |
| | |
| Brazil – 9.4% | |
| | Brazil Letras do Tesouro Nacional (NR/NR)(e) | |
| BRL | 1,166,000 | | | | 0.000 | | | | 10/01/19 | | | | 316,239 | |
| | Brazil Notas do Tesouro Nacional (BB/Ba2) | |
| | 7,889,000 | | | | 10.000 | | | | 01/01/23 | | | | 2,566,631 | |
| | 57,287,000 | | | | 10.000 | | | | 01/01/25 | | | | 18,561,810 | |
| | 11,049,000 | | | | 10.000 | | | | 01/01/27 | | | | 3,553,990 | |
| | 4,712,057 | | | | 6.000 | | | | 08/15/40 | | | | 1,664,581 | |
| | | | | | | | | | | | | | |
| | | | | | | | | | | | | 26,663,251 | |
| | |
| Chile – 3.0% | |
| | Bonos de la Tesoreria de la Republica en Pesos (NR/NR) | |
| CLP | 705,000,000 | | | | 4.500 | | | | 02/28/21 | | | | 1,130,078 | |
| | 610,000,000 | | | | 5.000 | | | | 03/01/35 | | | | 967,170 | |
| | Bonos de la Tesoreria de la Republica en Pesos (NR/Aa3) | |
| | 1,740,000,000 | | | | 4.500 | | | | 03/01/21 | | | | 2,789,931 | |
| | 705,000,000 | | | | 4.500 | | | | 03/01/26 | | | | 1,109,726 | |
| | Republic of Chile (A+/Aa3) | |
| | 1,504,000,000 | | | | 5.500 | | | | 08/05/20 | | | | 2,488,705 | |
| | | | | | | | | | | | | | |
| | | | | | | | | | | | | 8,485,610 | |
| | |
| Colombia – 6.9% | |
| | Republic of Colombia (NR/NR) | |
| COP | 1,170,940,680 | | | | 3.300 | | | | 03/17/27 | | | | 405,788 | |
| | 8,612,600,000 | | | | 7.000 | | | | 06/30/32 | | | | 2,931,513 | |
| | Republic of Colombia (NR/Baa2) | |
| | 1,851,000,000 | | | | 4.375 | (f) | | | 03/21/23 | | | | 596,018 | |
| | 45,326,736 | | | | 3.500 | | | | 05/07/25 | | | | 16,110 | |
| | Republic of Colombia (BBB+/Baa2) | |
| | 6,248,600,000 | | | | 5.000 | | | | 11/21/18 | | | | 2,125,866 | |
| | 6,995,426,256 | | | | 3.500 | | | | 03/10/21 | | | | 2,452,413 | |
| | 14,450,600,000 | | | | 7.000 | | | | 05/04/22 | | | | 5,101,135 | |
| | 11,536,700,000 | | | | 10.000 | | | | 07/24/24 | | | | 4,712,635 | |
| | 3,201,500,000 | | | | 7.500 | | | | 08/26/26 | | | | 1,157,488 | |
| | 100,000 | | | | 6.000 | | | | 04/28/28 | | | | 32 | |
| | | | | | | | | | | | | | |
| | | | | | | | | | | | | 19,498,998 | |
| | |
| Sovereign Debt Obligations – (continued) | |
| Dominican Republic – 0.7% | |
| | Dominican Republic (NR/NR) | |
| DOP | 39,400,000 | | | | 11.375 | | | | 07/06/29 | | | | 858,777 | |
| | Dominican Republic (BB-/Ba3)(c) | |
| $ | 1,100,000 | | | | 6.850 | | | | 01/27/45 | | | | 1,226,500 | |
| | | | | | | | | | | | | | |
| | | | | | | | | | | | | 2,085,277 | |
| | |
| Hungary – 5.1% | |
| | Hungary Government Bond (NR/NR) | |
| HUF | 569,690,000 | | | | 2.750 | | | | 12/22/26 | | | | 2,202,331 | |
| | Hungary Government Bond (BBB-/NR) | |
| | 1,360,780,000 | | | | 3.000 | | | | 06/26/24 | | | | 5,509,807 | |
| | 1,433,510,000 | | | | 5.500 | | | | 06/24/25 | | | | 6,676,743 | |
| | | | | | | | | | | | | | |
| | | | | | | | | | | | | 14,388,881 | |
| | |
| Malaysia – 4.8% | |
| | Malaysia Government Bond (NR/NR) | |
| MYR | 6,060,000 | | | | 3.743 | | | | 08/26/21 | | | | 1,434,819 | |
| | 5,660,000 | | | | 4.245 | | | | 09/30/30 | | | | 1,307,537 | |
| | Malaysia Government Bond (NR/A3) | |
| | 6,180,000 | | | | 3.580 | | | | 09/28/18 | | | | 1,469,325 | |
| | 2,470,000 | | | | 3.759 | | | | 03/15/19 | | | | 589,800 | |
| | 6,290,000 | | | | 5.734 | | | | 07/30/19 | | | | 1,553,993 | |
| | 5,560,000 | | | | 4.378 | | | | 11/29/19 | | | | 1,344,622 | |
| | 1,590,000 | | | | 3.480 | | | | 03/15/23 | | | | 370,840 | |
| | 1,230,000 | | | | 3.955 | | | | 09/15/25 | | | | 291,515 | |
| | 7,980,000 | | | | 4.498 | | | | 04/15/30 | | | | 1,917,568 | |
| | 3,250,000 | | | | 4.254 | | | | 05/31/35 | | | | 745,406 | |
| | 2,270,000 | | | | 4.736 | | | | 03/15/46 | | | | 528,799 | |
| | Malaysia Government Investment Issue (NR/NR) | |
| | 3,100,000 | | | | 3.872 | | | | 08/30/18 | | | | 738,785 | |
| | 2,440,000 | | | | 4.045 | | | | 08/15/24 | | | | 578,327 | |
| | 3,420,000 | | | | 4.786 | | | | 10/31/35 | | | | 814,970 | |
| | | | | | | | | | | | | | |
| | | | | | | | | | | | | 13,686,306 | |
| | |
| Mexico – 1.4% | |
| | United Mexican States (A/A3) | |
| MXN | 48,039,700 | | | | 10.000 | | | | 12/05/24 | | | | 3,120,176 | |
| | 16,479,400 | | | | 8.500 | | | | 05/31/29 | | | | 1,014,400 | |
| | 287,700 | | | | 7.750 | | | | 11/13/42 | | | | 16,726 | |
| | | | | | | | | | | | | | |
| | | | | | | | | | | | | 4,151,302 | |
| | |
| Peru – 3.7% | | | | | | | | | | |
| | Republic of Peru (NR/NR) | | | | | |
| PEN | 1,484,000 | | | | 6.714 | | | | 02/12/55 | | | | 475,453 | |
| | Republic of Peru (NR/A3) | | | | | |
| | 8,099,000 | | | | 6.350 | (c) | | | 08/12/28 | | | | 2,683,440 | |
| | 7,090,000 | | | | 6.150 | (c) | | | 08/12/32 | | | | 2,277,471 | |
| | 8,178,000 | | | | 6.850 | | | | 02/12/42 | | | | 2,704,101 | |
| | Republic of Peru (A-/A3) | | | | | |
| | 714,000 | | | | 5.700 | | | | 08/12/24 | | | | 232,322 | |
| | 911,000 | | | | 8.200 | | | | 08/12/26 | | | | 344,195 | |
| | 393,000 | | | | 6.950 | | | | 08/12/31 | | | | 135,255 | |
| | 5,192,000 | | | | 6.900 | | | | 08/12/37 | | | | 1,758,021 | |
| | | | | | | | | | | | | | |
| | | | | | | | | | | | | 10,610,258 | |
| | |
| | |
| The accompanying notes are an integral part of these financial statements. | | 105 |
GOLDMAN SACHS LOCAL EMERGING MARKETS DEBT FUND
Schedule of Investments (continued)
September 30, 2017 (Unaudited)
| | | | | | | | | | | | | | |
Principal
Amount | | | Interest
Rate | | | Maturity
Date | | | Value | |
| Sovereign Debt Obligations – (continued) | |
| Poland – 5.6% | | | | | | | | | | |
| | Poland Government Bond (A-/A2) | | | | | |
| PLN | 1,220,000 | | | | 5.750 | % | | | 10/25/21 | | | $ | 376,368 | |
| | 38,170,000 | | | | 2.250 | | | | 04/25/22 | | | | 10,282,155 | |
| | 14,960,000 | | | | 4.000 | | | | 10/25/23 | | | | 4,343,115 | |
| | 3,390,000 | | | | 2.500 | | | | 07/25/26 | | | | 872,871 | |
| | | | | | | | | | | | | | |
| | | | | | | | | | | | | 15,874,509 | |
| | |
| Romania – 1.8% | | | | | | | | | | |
| | Republic of Romania (NR/NR) | | | | | |
| RON | 4,500,000 | | | | 5.850 | | | | 04/26/23 | | | | 1,311,007 | |
| | 9,020,000 | | | | 3.250 | | | | 04/29/24 | | | | 2,272,886 | |
| | 1,520,000 | | | | 4.750 | | | | 02/24/25 | | | | 415,310 | |
| | 3,620,000 | | | | 5.800 | | | | 07/26/27 | | | | 1,055,303 | |
| | | | | | | | | | | | | | |
| | | | | | | | | | | | | 5,054,506 | |
| | |
| Russia – 7.7% | | | | | | | | | | |
| | Russian Federation Bond (NR/NR) | | | | | |
| RUB | 28,170,000 | | | | 7.100 | | | | 10/16/24 | | | | 477,537 | |
| | 198,040,000 | | | | 7.750 | | | | 09/16/26 | | | | 3,499,280 | |
| | 659,910,000 | | | | 8.500 | | | | 09/17/31 | | | | 12,355,542 | |
| | 277,320,000 | | | | 7.700 | | | | 03/23/33 | | | | 4,809,498 | |
| | Russian Federation Bond (BBB-/Ba1) | | | | | |
| | 37,220,000 | | | | 7.050 | | | | 01/19/28 | | | | 627,547 | |
| | | | | | | | | | | | | | |
| | | | | | | | | | | | | 21,769,404 | |
| | |
| South Africa – 9.4% | | | | | | | | | | |
| | Republic of South Africa (BBB-/Baa3) | | | | | |
| ZAR | 51,700,000 | | | | 8.000 | | | | 01/31/30 | | | | 3,506,326 | |
| | 69,360,000 | | | | 8.250 | | | | 03/31/32 | | | | 4,682,893 | |
| | 79,680,000 | | | | 8.875 | | | | 02/28/35 | | | | 5,560,795 | |
| | 9,940,000 | | | | 6.250 | | | | 03/31/36 | | | | 528,960 | |
| | 132,080,000 | | | | 8.500 | | | | 01/31/37 | | | | 8,782,524 | |
| | 12,040,000 | | | | 9.000 | | | | 01/31/40 | | | | 827,287 | |
| | 40,768,000 | | | | 8.750 | | | | 01/31/44 | | | | 2,720,221 | |
| | 200,000 | | | | 8.750 | | | | 02/28/48 | | | | 13,361 | |
| | | | | | | | | | | | | | |
| | | | | | | | | | | | | 26,622,367 | |
| | |
| Thailand – 5.4% | | | | | | | | | | |
| | Thailand Government Bond (NR/Baa1) | | | | | |
| THB | 30,420,000 | | | | 1.875 | | | | 06/17/22 | | | | 917,040 | |
| | 85,665,000 | | | | 3.580 | | | | 12/17/27 | | | | 2,820,930 | |
| | 210,725,168 | | | | 1.250 | | | | 03/12/28 | | | | 6,077,459 | |
| | 69,580,000 | | | | 3.775 | | | | 06/25/32 | | | | 2,322,292 | |
| | Thailand Government Bond (A-/Baa1) | | | | | |
| | 34,890,000 | | | | 3.850 | | | | 12/12/25 | | | | 1,166,782 | |
| | 63,580,000 | | | | 3.650 | | | | 06/20/31 | | | | 2,108,747 | |
| | | | | | | | | | | | | | |
| | | | | | | | | | | | | 15,413,250 | |
| | |
| Turkey – 4.1% | | | | | | | | | | |
| | Republic of Turkey (NR/NR) | | | | | |
| TRY | 8,300,000 | | | | 9.400 | | | | 07/08/20 | | | | 2,224,701 | |
| | 18,980,000 | | | | 10.600 | | | | 02/11/26 | | | | 5,281,767 | |
| | Republic of Turkey (NR/Ba1) | | | | | |
| | 7,210,000 | | | | 11.000 | | | | 03/02/22 | | | | 2,035,250 | |
| | Turkey Government Bond (NR/NR) | | | | | |
| | 3,760,000 | | | | 9.200 | | | | 09/22/21 | | | | 995,153 | |
| | 260,000 | | | | 8.000 | | | | 03/12/25 | | | | 62,775 | |
| | 3,990,000 | | | | 10.500 | | | | 08/11/27 | | | | 1,106,364 | |
| | | | | | | | | | | | | | |
| | | | | | | | | | | | | 11,706,010 | |
| | |
| Sovereign Debt Obligations – (continued) | |
| Uruguay – 0.3% | | | | | | | | | | |
| | Republic of Uruguay (NR/NR)(c) | | | | | |
| UYU | 11,125,000 | | | | 8.500 | | | | 03/15/28 | | | | 395,688 | |
| | Republic of Uruguay (BBB/Baa2) | | | | | |
| | 10,713,863 | | | | 4.375 | | | | 12/15/28 | | | | 423,628 | |
| | | | | | | | | | | | | | |
| | | | | | | | | | | | | 819,316 | |
| | |
| | TOTAL SOVEREIGN DEBT OBLIGATIONS | |
| | (Cost $201,772,955) | | | $ | 209,003,050 | |
| | |
| | |
| Corporate Obligations – 4.0% | |
| Argentina – 1.4% | | | | | | | | | | |
| | Banco Macro SA (NR/B3)(c) | | | | | |
| ARS | 21,350,000 | | | | 17.500 | % | | | 05/08/22 | | | $ | 1,171,904 | |
| City of Buenos Aires Argentina (NR/B3) (Argentina Deposit
Rates + 3.250%)(a) |
|
| | 46,190,000 | | | | 23.770 | | | | 03/29/24 | | | | 2,614,152 | |
| | | | | | | | | | | | | | |
| | | | | | | | | | | | | 3,786,056 | |
| | |
| South Africa – 1.1% | | | | | | | | | | |
| | Transnet Ltd. (BBB-/Baa3) | |
| ZAR | 48,000,000 | | | | 10.000 | | | | 03/30/29 | | | | 3,210,482 | |
| | |
| United States(c)(e) – 0.3% | |
| | Citigroup Global Markets Holdings, Inc. (NR/NR) | |
| EGP | 16,950,000 | | | | 0.000 | | | | 01/25/18 | | | | 907,829 | |
| | |
| Venezuela – 1.2% | |
| | Petroleos de Venezuela SA (NR/NR) | |
| $ | 10,130,000 | | | | 6.000 | | | | 10/28/22 | | | | 2,897,180 | |
| | Petroleos de Venezuela SA (CCC-/NR) | |
| | 430,000 | | | | 6.000 | | | | 05/16/24 | | | | 130,720 | |
| | 1,050,000 | | | | 6.000 | | | | 11/15/26 | | | | 318,675 | |
| | | | | | | | | | | | | | |
| | | | | | | | | | | | | 3,346,575 | |
| | |
| | TOTAL CORPORATE OBLIGATIONS | |
| | (Cost $14,101,640) | | | $ | 11,250,942 | |
| | |
| | |
| Structured Notes – 10.8% | |
| Colombia – 0.6% | | | | | | | | | | |
| | Republic of Columbia (Issuer Citigroup Funding, Inc.) (NR/NR) | |
| COP | 4,226,000,000 | | | | 11.000 | % | | | 07/25/24 | | | $ | 1,726,282 | |
| | |
| Egypt(e) – 2.7% | | | | | | | | | | |
| | Arab Republic of Egypt (Issuer Citibank NA) (NR/NR) | |
| EGP | 6,530,000 | | | | 0.000 | (c) | | | 11/02/17 | | | | 364,100 | |
| | 23,000,000 | | | | 0.000 | | | | 11/09/17 | | | | 1,277,810 | |
| | 23,100,000 | | | | 0.000 | | | | 02/08/18 | | | | 1,229,718 | |
| | 5,100,000 | | | | 0.000 | | | | 03/08/18 | | | | 268,326 | |
| | 45,950,000 | | | | 0.000 | (c) | | | 05/10/18 | | | | 2,336,994 | |
| | Arab Republic of Egypt (Issuer HSBC Bank PLC) (NR/NR)(c) | |
| | 25,100,000 | | | | 0.000 | | | | 06/07/18 | | | | 1,267,102 | |
| Arab Republic of Egypt (Issuer JPMorgan Chase Bank NA)
(NR/NR)(c) |
|
| | 12,650,000 | | | | 0.000 | | | | 02/15/18 | | | | 670,973 | |
| | 7,100,000 | | | | 0.000 | | | | 07/26/18 | | | | 349,952 | |
| | | | | | | | | | | | | | |
| | | | | | | | | | | | | 7,764,975 | |
| | |
| | |
| 106 | | The accompanying notes are an integral part of these financial statements. |
GOLDMAN SACHS LOCAL EMERGING MARKETS DEBT FUND
| | | | | | | | | | | | | | |
Principal
Amount | | | Interest
Rate | | | Maturity
Date | | | Value | |
| Structured Notes – (continued) | |
| Indonesia(c) – 7.5% | | | | | | | | | | |
| Republic of Indonesia (Issuer Deutsche Bank AG (London))
(NR/NR) |
|
| IDR | 15,500,000,000 | | | | 8.250 | % | | | 05/19/36 | | | $ | 1,266,157 | |
| Republic of Indonesia (Issuer JPMorgan Chase Bank NA)
(NR/NR) |
|
| | 30,566,000,000 | | | | 8.375 | | | | 03/15/24 | | | | 2,493,459 | |
| | 124,662,000,000 | | | | 6.625 | | | | 05/17/33 | | | | 8,735,605 | |
| | Republic of Indonesia (Issuer Standard Chartered Bank) (NR/NR) | |
| | 94,292,000,000 | | | | 9.000 | | | | 03/19/29 | | | | 8,131,276 | |
| | 8,000,000,000 | | | | 8.375 | | | | 03/17/34 | | | | 653,946 | |
| | | | | | | | | | | | | | |
| | | | | | | | | | | | | 21,280,443 | |
| | |
| | TOTAL STRUCTURED NOTES | |
| | (Cost $35,384,892) | | | $ | 30,771,700 | |
| | |
| | | | | | | | | | | | | | |
| Municipal Debt Obligations(f) – 0.4% | |
| Puerto Rico – 0.4% | |
| Puerto Rico Commonwealth Aqueduct & Sewer Authority RB
(Senior Lien) Series 2008 A (CC/Caa3) |
|
| $ | 70,000 | | | | 6.000 | % | | | 07/01/44 | | | $ | 52,675 | |
| Puerto Rico Commonwealth Aqueduct & Sewer Authority RB
(Senior Lien) Series 2012 A (CC/Caa3) |
|
| | 60,000 | | | | 5.750 | | | | 07/01/37 | | | | 43,500 | |
| Puerto Rico Commonwealth GO Bonds Refunding for Public
Improvement Series 2008 A (D/Caa3)(g) |
|
| | 70,000 | | | | 5.500 | | | | 07/01/32 | | | | 32,288 | |
| Puerto Rico Commonwealth GO Bonds Refunding for Public
Improvement Series 2009 B (D/Caa3)(g) |
|
| | 45,000 | | | | 5.875 | | | | 07/01/36 | | | | 21,038 | |
| | 170,000 | | | | 5.750 | | | | 07/01/38 | | | | 77,775 | |
| Puerto Rico Commonwealth GO Bonds Refunding for Public
Improvement Series 2011 A (D/Caa3)(g) |
|
| | 45,000 | | | | 6.000 | | | | 07/01/34 | | | | 20,138 | |
| Puerto Rico Commonwealth GO Bonds Refunding for Public
Improvement Series 2011 E (D/Caa3)(g) |
|
| | 40,000 | | | | 5.625 | | | | 07/01/32 | | | | 18,500 | |
| Puerto Rico Commonwealth GO Bonds Refunding for Public
Improvement Series 2012 A (D/Caa3)(g) |
|
| | 20,000 | | | | 5.500 | | | | 07/01/26 | | | | 9,350 | |
| Puerto Rico Commonwealth GO Bonds Unrefunded Balance for
Public Improvement Series 2001 A (D/Caa3)(g) |
|
| | 80,000 | | | | 5.125 | | | | 07/01/31 | | | | 37,400 | |
| Puerto Rico Commonwealth GO Bonds Unrefunded Balance for
Public Improvement Series 2004 A (D/Caa3)(g) |
|
| | 20,000 | | | | 5.000 | | | | 07/01/34 | | | | 9,225 | |
| Puerto Rico Commonwealth GO Bonds Unrefunded Balance for
Public Improvement Series 2006 A (D/Caa3)(g) |
|
| | 30,000 | | | | 5.250 | | | | 07/01/27 | | | | 13,950 | |
| Puerto Rico Sales Tax Financing Corp. Sales Tax RB Capital
Appreciation Series 2010 A (D/Ca)(e) |
|
| | 85,000 | | | | 0.000 | | | | 08/01/35 | | | | 5,390 | |
| Puerto Rico Sales Tax Financing Corp. Sales Tax RB Capital
Appreciation SubSeries 2010 C (D/Ca)(e) |
|
| | 215,000 | | | | 0.000 | | | | 08/01/37 | | | | 12,255 | |
| | 175,000 | | | | 0.000 | | | | 08/01/38 | | | | 9,345 | |
| Municipal Debt Obligations(e) – (continued) | |
| Puerto Rico – (continued) | |
| Puerto Rico Sales Tax Financing Corp. Sales Tax RB
SubSeries 2009 A (D/Ca)(g) |
|
| 90,000 | | | | 5.250 | | | | 08/01/27 | | | | 18,675 | |
| | 210,000 | | | | 5.750 | | | | 08/01/37 | | | | 43,575 | |
| | 60,000 | | | | 6.375 | | | | 08/01/39 | | | | 12,600 | |
| | 15,000 | | | | 6.500 | | | | 08/01/44 | | | | 3,150 | |
| Puerto Rico Sales Tax Financing Corp. Sales Tax RB
SubSeries 2010 A (D/Ca)(g) |
|
| | 475,000 | | | | 6.250 | | | | 08/01/33 | | | | 84,312 | |
| | 290,000 | | | | 5.500 | | | | 08/01/37 | | | | 60,175 | |
| | 540,000 | | | | 5.375 | | | | 08/01/39 | | | | 112,050 | |
| | 105,000 | | | | 5.500 | | | | 08/01/42 | | | | 21,788 | |
| Puerto Rico Sales Tax Financing Corp. Sales Tax RB
SubSeries 2010 C (D/Ca)(g) |
|
| | 240,000 | | | | 5.375 | | | | 08/01/38 | | | | 49,800 | |
| | 265,000 | | | | 5.250 | | | | 08/01/41 | | | | 54,987 | |
| Puerto Rico Sales Tax Financing Corp. Sales Tax RB
SubSeries 2011 A-1 (D/Ca)(g) |
|
| | 485,000 | | | | 5.000 | | | | 08/01/43 | | | | 100,637 | |
| | 175,000 | | | | 5.250 | | | | 08/01/43 | | | | 36,312 | |
| Puerto Rico Sales Tax Financing Corp. Sales Tax RB Unrefunded
SubSeries 2009 A (D/Ca)(g) |
|
| | 305,000 | | | | 5.500 | | | | 08/01/28 | | | | 63,287 | |
| | |
| | TOTAL MUNICIPAL DEBT OBLIGATIONS | |
| | (Cost $2,816,032) | | | $ | 1,024,177 | |
| | |
| | | | | | | | | | | | | | |
| U.S. Treasury Obligation(h) – 0.2% | |
| | United States Treasury Bond | |
| $ | 500,000 | | | | 3.625 | % | | | 08/15/43 | | | $ | 573,990 | |
| | (Cost $574,038) | |
| | |
| | | | | | | | |
| Shares | | Distribution
Rate | | | Value | |
| | | | | | | | |
| Investment Company(i) – 4.9% | |
Goldman Sachs Financial Square Government Fund – Institutional Shares | |
| 13,869,144 | | | 0.927 | % | | $ | 13,869,144 | |
| (Cost $13,869,144) | |
| |
| TOTAL INVESTMENTS BEFORE SHORT-TERM INVESTMENT | |
| (Cost $268,518,701) | | | $ | 266,493,003 | |
| |
| TOTAL INVESTMENTS – 93.9% | |
| (Cost $268,518,701) | | | $ | 266,493,003 | |
| |
OTHER ASSETS IN EXCESS OF
LIABILITIES – 6.1% | | | | 17,248,645 | |
| |
| NET ASSETS – 100.0% | | | $ | 283,741,648 | |
| |
| | |
| The percentage shown for each investment category reflects the value of investments in that category as a percentage of net assets. |
| | |
| The accompanying notes are an integral part of these financial statements. | | 107 |
GOLDMAN SACHS LOCAL EMERGING MARKETS DEBT FUND
Schedule of Investments (continued)
September 30, 2017 (Unaudited)
| | |
(a) | | Variable rate security. Interest rate or distribution rate disclosed is that which is in effect on September 20, 2017. |
(b) | | Actual maturity date is June 28, 2117. |
(c) | | Exempt from registration under Rule 144A of the Securities Act of 1933. Such securities may be deemed liquid by the investment adviser and may be resold, normally to qualified institutional buyers in transactions exempt from registration. Total market value of Rule 144A securities amounts to $35,970,316, which represents approximately 12.7% of net assets as of September 30, 2017. |
(d) | | Coupon changes periodically based upon a predetermined schedule. Interest rate disclosed is that which is in effect on September 30, 2017. |
(e) | | Issued with a zero coupon. Income is recognized through the accretion of discount. |
(f) | | Security with “Call” features with resetting interest rates. Maturity dates disclosed are the final maturity dates. |
(g) | | Security is currently in default and/or non-income producing. |
(h) | | All or a portion of security is segregated as collateral for initial margin requirement on futures transactions. |
(i) | | Represents an Affiliated Issuer. |
Security ratings disclosed, if any, are obtained from by Standard & Poor’s/Moody’s Investor Service and are unaudited. A brief description of the ratings is available in the Fund’s Statement of Additional Information.
| | |
|
Currency Abbreviations: |
ARS | | —Argentine Peso |
BRL | | —Brazilian Real |
CLP | | —Chilean Peso |
CNH | | —Chinese Yuan Renminbi Offshore |
CNY | | —Chinese Yuan Renminbi |
COP | | —Colombian Peso |
CZK | | —Czech Koruna |
DOP | | —Dominican Peso |
EGP | | —Egyptian Pound |
EUR | | —Euro |
HKD | | —Hong Kong Dollar |
HUF | | —Hungarian Forint |
IDR | | —Indonesian Rupiah |
INR | | —Indian Rupee |
KRW | | —South Korean Won |
MXN | | —Mexican Peso |
MYR | | —Malaysian Ringgit |
PEN | | —Peruvian Nuevo Sol |
PHP | | —Philippine Peso |
PLN | | —Polish Zloty |
RON | | —New Romanian Leu |
RUB | | —Russian Ruble |
SGD | | —Singapore Dollar |
THB | | —Thai Baht |
TRY | | —Turkish Lira |
TWD | | —Taiwan Dollar |
USD | | —U.S. Dollar |
UYU | | —Uruguayan Peso |
ZAR | | —South African Rand |
| | |
|
Investment Abbreviations: |
BUBOR | | —Budapest Interbank Offered Rate |
EURO | | —Euro Offered Rate |
GO | | —General Obligation |
LLC | | —Limited Liability Company |
MIBOR | | —Mumbai Interbank Offered Rate |
NR | | —Not Rated |
PLC | | —Public Limited Company |
PRIBOR | | —Prague Interbank Offered Rate |
RB | | —Revenue Bond |
SHIBOR | | —Shanghai Interbank Offered Rate |
TIIE | | —La Tasa de Interbank Equilibrium Interest Rate |
|
| | |
| 108 | | The accompanying notes are an integral part of these financial statements. |
GOLDMAN SACHS LOCAL EMERGING MARKETS DEBT FUND
|
| ADDITIONAL INVESTMENT INFORMATION |
FORWARD FOREIGN CURRENCY EXCHANGE CONTRACTS — At September 30, 2017, the Fund had the following forward foreign currency exchange contracts:
FORWARD FOREIGN CURRENCY EXCHANGE CONTRACTS WITH UNREALIZED GAIN
| | | | | | | | | | | | | | | | | | | | | | | | |
| Counterparty | | Currency
Purchased | | | Currency
Sold | | | Current
Value | | | Settlement
Date | | | Unrealized
Gain | |
Morgan Stanley & Co. International PLC | | ARS | | | 13,735,213 | | | USD | | | 781,000 | | | $ | 791,153 | | | | 10/05/17 | | | $ | 10,153 | |
| | ARS | | | 17,248,008 | | | USD | | | 977,363 | | | | 990,639 | | | | 10/10/17 | | | | 13,276 | |
| | ARS | | | 6,504,026 | | | USD | | | 372,297 | | | | 373,344 | | | | 10/11/17 | | | | 1,047 | |
| | ARS | | | 3,225,262 | | | USD | | | 184,459 | | | | 185,030 | | | | 10/12/17 | | | | 571 | |
| | ARS | | | 16,131,744 | | | USD | | | 918,507 | | | | 918,612 | | | | 10/25/17 | | | | 105 | |
| | ARS | | | 12,578,975 | | | USD | | | 702,703 | | | | 714,268 | | | | 10/30/17 | | | | 11,566 | |
| | ARS | | | 12,951,925 | | | USD | | | 726,565 | | | | 734,639 | | | | 11/02/17 | | | | 8,074 | |
| | ARS | | | 16,352,164 | | | USD | | | 921,249 | | | | 924,460 | | | | 11/08/17 | | | | 3,212 | |
| | ARS | | | 4,964,702 | | | USD | | | 279,230 | | | | 279,912 | | | | 11/13/17 | | | | 682 | |
| | ARS | | | 11,525,158 | | | USD | | | 646,754 | | | | 648,379 | | | | 11/17/17 | | | | 1,625 | |
| | BRL | | | 38,624,491 | | | USD | | | 12,118,808 | | | | 12,189,903 | | | | 10/03/17 | | | | 71,095 | |
| | BRL | | | 55,988,584 | | | USD | | | 17,464,179 | | | | 17,594,108 | | | | 11/03/17 | | | | 129,929 | |
| | CNH | | | 25,501,089 | | | USD | | | 3,808,152 | | | | 3,817,967 | | | | 12/20/17 | | | | 9,814 | |
| | CZK | | | 79,779,212 | | | EUR | | | 2,964,000 | | | | 3,629,709 | | | | 10/03/17 | | | | 125,985 | |
| | CZK | | | 53,534,703 | | | EUR | | | 2,005,000 | | | | 2,440,378 | | | | 11/09/17 | | | | 65,599 | |
| | CZK | | | 152,226,287 | | | EUR | | | 5,690,507 | | | | 6,943,790 | | | | 11/21/17 | | | | 199,398 | |
| | CZK | | | 120,709,195 | | | EUR | | | 4,595,308 | | | | 5,506,442 | | | | 11/22/17 | | | | 59,784 | |
| | CZK | | | 626,837,184 | | | EUR | | | 24,092,693 | | | | 28,672,940 | | | | 12/20/17 | | | | 66,257 | |
| | CZK | | | 154,952,588 | | | EUR | | | 5,809,897 | | | | 7,097,288 | | | | 01/03/18 | | | | 193,041 | |
| | EGP | | | 9,750,821 | | | USD | | | 510,514 | | | | 543,567 | | | | 11/29/17 | | | | 33,053 | |
| | EGP | | | 8,007,570 | | | USD | | | 390,613 | | | | 439,761 | | | | 01/24/18 | | | | 49,148 | |
| | EUR | | | 849,000 | | | HUF | | | 263,238,232 | | | | 1,008,068 | | | | 12/20/17 | | | | 5,812 | |
| | EUR | | | 1,208,217 | | | PLN | | | 5,189,127 | | | | 1,434,588 | | | | 12/20/17 | | | | 12,186 | |
| | IDR | | | 6,346,529,007 | | | USD | | | 469,939 | | | | 470,447 | | | | 10/18/17 | | | | 508 | |
| | IDR | | | 27,714,974,651 | | | USD | | | 2,038,545 | | | | 2,051,841 | | | | 11/02/17 | | | | 13,297 | |
| | IDR | | | 40,786,255,358 | | | USD | | | 2,988,004 | | | | 3,003,443 | | | | 12/20/17 | | | | 15,439 | |
| | INR | | | 39,090,429 | | | USD | | | 595,000 | | | | 595,518 | | | | 11/03/17 | | | | 518 | |
| | KRW | | | 1,164,347,984 | | | USD | | | 1,016,898 | | | | 1,016,971 | | | | 10/12/17 | | | | 73 | |
| | KRW | | | 214,788,973 | | | USD | | | 187,582 | | | | 187,616 | | | | 10/25/17 | | | | 34 | |
| | PHP | | | 84,101,290 | | | USD | | | 1,641,387 | | | | 1,651,946 | | | | 10/10/17 | | | | 10,559 | |
| | PHP | | | 51,110,653 | | | USD | | | 1,000,796 | | | | 1,003,316 | | | | 10/19/17 | | | | 2,520 | |
| | PHP | | | 220,991,082 | | | USD | | | 4,308,658 | | | | 4,330,102 | | | | 11/14/17 | | | | 21,444 | |
| | PLN | | | 3,682,045 | | | EUR | | | 850,000 | | | | 1,009,293 | | | | 12/20/17 | | | | 37 | |
| | PLN | | | 2,749,443 | | | HUF | | | 197,180,636 | | | | 753,655 | | | | 12/20/17 | | | | 2,908 | |
| | RUB | | | 332,973,851 | | | USD | | | 5,666,000 | | | | 5,699,076 | | | | 12/14/17 | | | | 33,076 | |
| | SGD | | | 538,665 | | | USD | | | 397,000 | | | | 397,475 | | | | 12/20/17 | | | | 475 | |
| | TRY | | | 7,312,714 | | | USD | | | 1,996,237 | | | | 2,004,461 | | | | 12/20/17 | | | | 8,224 | |
| | TWD | | | 59,430,685 | | | USD | | | 1,946,569 | | | | 1,957,500 | | | | 10/20/17 | | | | 10,932 | |
| | TWD | | | 38,611,134 | | | USD | | | 1,270,332 | | | | 1,272,132 | | | | 10/26/17 | | | | 1,801 | |
| | USD | | | 791,655 | | | ARS | | | 13,735,213 | | | | 791,153 | | | | 10/05/17 | | | | 502 | |
| | USD | | | 4,034,000 | | | BRL | | | 12,683,303 | | | | 4,002,855 | | | | 10/03/17 | | | | 31,145 | |
| | USD | | | 466,598 | | | BRL | | | 1,484,014 | | | | 466,343 | | | | 11/03/17 | | | | 254 | |
| | USD | | | 1,014,000 | | | CLP | | | 626,523,222 | | | | 978,666 | | | | 10/12/17 | | | | 35,334 | |
| | USD | | | 1,009,711 | | | CLP | | | 631,861,258 | | | | 986,910 | | | | 10/16/17 | | | | 22,801 | |
| | USD | | | 3,364,664 | | | CLP | | | 2,121,925,093 | | | | 3,311,925 | | | | 11/16/17 | | | | 52,738 | |
| | USD | | | 6,640,188 | | | CNH | | | 44,125,644 | | | | 6,606,394 | | | | 12/20/17 | | | | 33,796 | |
| | USD | | | 461,999 | | | CNY | | | 3,079,405 | | | | 461,994 | | | | 11/10/17 | | | | 5 | |
| | USD | | | 1,011,000 | | | COP | | | 2,955,769,710 | | | | 1,003,114 | | | | 10/25/17 | | | | 7,886 | |
| | USD | | | 5,417,312 | | | HKD | | | 41,971,166 | | | | 5,373,320 | | | | 10/03/17 | | | | 43,992 | |
| | |
| The accompanying notes are an integral part of these financial statements. | | 109 |
GOLDMAN SACHS LOCAL EMERGING MARKETS DEBT FUND
Schedule of Investments (continued)
September 30, 2017 (Unaudited)
|
| ADDITIONAL INVESTMENT INFORMATION (continued) |
FORWARD FOREIGN CURRENCY EXCHANGE CONTRACTS WITH UNREALIZED GAIN (continued)
| | | | | | | | | | | | | | | | | | | | | | | | |
| Counterparty | | Currency
Purchased | | | Currency
Sold | | | Current
Value | | | Settlement
Date | | | Unrealized
Gain | |
Morgan Stanley & Co. International PLC (continued) | | USD | | | 4,463,000 | | | HKD | | | 34,575,307 | | | $ | 4,427,304 | | | | 10/10/17 | | | $ | 35,696 | |
| | USD | | | 14,665,851 | | | HKD | | | 113,456,623 | | | | 14,582,684 | | | | 03/27/18 | | | | 83,166 | |
| | USD | | | 3,825,000 | | | HKD | | | 29,629,081 | | | | 3,811,127 | | | | 05/11/18 | | | | 13,873 | |
| | USD | | | 2,291,544 | | | IDR | | | 30,305,859,083 | | | | 2,248,038 | | | | 10/10/17 | | | | 43,505 | |
| | USD | | | 1,494,710 | | | IDR | | | 20,084,173,000 | | | | 1,489,033 | | | | 10/16/17 | | | | 5,677 | |
| | USD | | | 3,029,000 | | | IDR | | | 40,250,018,380 | | | | 2,983,602 | | | | 10/18/17 | | | | 45,398 | |
| | USD | | | 981,148 | | | INR | | | 64,118,054 | | | | 980,527 | | | | 10/05/17 | | | | 622 | |
| | USD | | | 1,877,595 | | | INR | | | 120,246,847 | | | | 1,837,342 | | | | 10/10/17 | | | | 40,253 | |
| | USD | | | 8,068,841 | | | INR | | | 518,441,617 | | | | 7,913,248 | | | | 10/18/17 | | | | 155,593 | |
| | USD | | | 2,010,226 | | | INR | | | 130,572,275 | | | | 1,991,144 | | | | 10/25/17 | | | | 19,082 | |
| | USD | | | 3,240,961 | | | KRW | | | 3,696,315,789 | | | | 3,227,559 | | | | 10/02/17 | | | | 13,402 | |
| | USD | | | 5,995,290 | | | KRW | | | 6,841,895,148 | | | | 5,975,817 | | | | 10/10/17 | | | | 19,473 | |
| | USD | | | 4,135,455 | | | KRW | | | 4,676,745,281 | | | | 4,084,788 | | | | 10/12/17 | | | | 50,668 | |
| | USD | | | 1,412,267 | | | KRW | | | 1,600,394,462 | | | | 1,397,929 | | | | 10/25/17 | | | | 14,337 | |
| | USD | | | 483,956 | | | KRW | | | 553,930,912 | | | | 483,923 | | | | 11/10/17 | | | | 32 | |
| | USD | | | 8,062,637 | | | MXN | | | 145,562,975 | | | | 7,890,455 | | | | 12/20/17 | | | | 172,181 | |
| | USD | | | 1,573,822 | | | PEN | | | 5,131,447 | | | | 1,566,602 | | | | 12/14/17 | | | | 7,220 | |
| | USD | | | 899,496 | | | PHP | | | 45,747,133 | | | | 898,581 | | | | 10/10/17 | | | | 915 | |
| | USD | | | 2,030,000 | | | PHP | | | 103,031,601 | | | | 2,021,571 | | | | 10/26/17 | | | | 8,429 | |
| | USD | | | 397,000 | | | PHP | | | 20,205,077 | | | | 396,271 | | | | 11/02/17 | | | | 729 | |
| | USD | | | 3,773,067 | | | RUB | | | 219,515,871 | | | | 3,757,165 | | | | 12/14/17 | | | | 15,902 | |
| | USD | | | 5,477,083 | | | SGD | | | 7,359,051 | | | | 5,430,153 | | | | 12/20/17 | | | | 46,930 | |
| | USD | | | 1,002,000 | | | THB | | | 33,389,215 | | | | 1,001,246 | | | | 10/11/17 | | | | 754 | |
| | USD | | | 355,392 | | | THB | | | 11,809,329 | | | | 354,166 | | | | 10/19/17 | | | | 1,226 | |
| | USD | | | 7,882,759 | | | TRY | | | 28,329,827 | | | | 7,765,382 | | | | 12/20/17 | | | | 117,377 | |
| | USD | | | 2,690,289 | | | TWD | | | 80,359,135 | | | | 2,648,621 | | | | 10/02/17 | | | | 41,669 | |
| | USD | | | 405,000 | | | TWD | | | 12,143,925 | | | | 399,971 | | | | 10/19/17 | | | | 5,029 | |
| | USD | | | 16,531,065 | | | TWD | | | 498,111,109 | | | | 16,406,553 | | | | 10/20/17 | | | | 124,512 | |
| | USD | | | 5,396,702 | | | TWD | | | 162,597,247 | | | | 5,356,347 | | | | 10/23/17 | | | | 40,355 | |
| | USD | | | 3,040,808 | | | TWD | | | 91,847,596 | | | | 3,026,130 | | | | 10/26/17 | | | | 14,677 | |
| | USD | | | 479,348 | | | TWD | | | 14,529,523 | | | | 478,803 | | | | 10/31/17 | | | | 545 | |
| | USD | | | 3,405,488 | | | ZAR | | | 46,542,402 | | | | 3,393,136 | | | | 12/20/17 | | | | 12,352 | |
| | | ZAR | | | 41,366,451 | | | USD | | | 3,005,000 | | | | 3,015,788 | | | | 12/20/17 | | | | 10,788 | |
| TOTAL | | | | | | | | $ | 2,584,077 | |
FORWARD FOREIGN CURRENCY EXCHANGE CONTRACTS WITH UNREALIZED LOSS
| | | | | | | | | | | | | | | | | | | | | | | | |
| Counterparty | | Currency
Purchased | | | Currency
Sold | | | Current
Value | | | Settlement
Date | | | Unrealized
Loss | |
Morgan Stanley & Co. International PLC | | ARS | | | 13,735,213 | | | USD | | | 779,745 | | | $ | 778,640 | | | | 11/03/17 | | | $ | (1,105 | ) |
| | BRL | | | 26,836,557 | | | USD | | | 8,554,386 | | | | 8,469,628 | | | | 10/03/17 | | | | (84,758 | ) |
| | CNH | | | 38,825,567 | | | USD | | | 5,863,000 | | | | 5,812,878 | | | | 12/20/17 | | | | (50,122 | ) |
| | CNY | | | 13,537,881 | | | USD | | | 2,052,353 | | | | 2,033,424 | | | | 10/26/17 | | | | (18,929 | ) |
| | CNY | | | 18,026,461 | | | USD | | | 2,719,949 | | | | 2,697,939 | | | | 12/14/17 | | | | (22,010 | ) |
| | COP | | | 1,446,254,637 | | | USD | | | 497,217 | | | | 490,822 | | | | 10/25/17 | | | | (6,395 | ) |
| | EUR | | | 3,066,073 | | | CZK | | | 79,779,212 | | | | 3,624,384 | | | | 10/03/17 | | | | (5,326 | ) |
| | EUR | | | 2,986,939 | | | CZK | | | 79,969,325 | | | | 3,540,123 | | | | 11/21/17 | | | | (107,672 | ) |
| | EUR | | | 3,897,000 | | | CZK | | | 104,229,162 | | | | 4,631,038 | | | | 01/03/18 | | | | (142,968 | ) |
| | EUR | | | 4,467,322 | | | USD | | | 5,362,171 | | | | 5,304,316 | | | | 12/20/17 | | | | (57,855 | ) |
| | HKD | | | 41,971,166 | | | USD | | | 5,395,347 | | | | 5,373,320 | | | | 10/03/17 | | | | (22,027 | ) |
| | |
| 110 | | The accompanying notes are an integral part of these financial statements. |
GOLDMAN SACHS LOCAL EMERGING MARKETS DEBT FUND
|
| ADDITIONAL INVESTMENT INFORMATION (continued) |
FORWARD FOREIGN CURRENCY EXCHANGE CONTRACTS WITH UNREALIZED LOSS (continued)
| | | | | | | | | | | | | | | | | | | | | | | | |
| Counterparty | | Currency
Purchased | | | Currency
Sold | | | Current
Value | | | Settlement
Date | | | Unrealized
Loss | |
Morgan Stanley & Co. International PLC (continued) | | HKD | | | 34,575,307 | | | USD | | | 4,444,013 | | | $ | 4,427,304 | | | | 10/10/17 | | | $ | (16,708 | ) |
| | HKD | | | 113,456,624 | | | USD | | | 14,620,887 | | | | 14,582,685 | | | | 03/27/18 | | | | (38,203 | ) |
| | HKD | | | 29,629,081 | | | USD | | | 3,820,002 | | | | 3,811,127 | | | | 05/11/18 | | | | (8,874 | ) |
| | HUF | | | 265,685,616 | | | EUR | | | 853,000 | | | | 1,011,574 | | | | 12/20/17 | | | | (1,244 | ) |
| | HUF | | | 1,006,310,186 | | | USD | | | 3,927,068 | | | | 3,831,434 | | | | 12/20/17 | | | | (95,633 | ) |
| | IDR | | | 40,786,255,358 | | | USD | | | 3,048,226 | | | | 3,026,793 | | | | 10/05/17 | | | | (21,433 | ) |
| | IDR | | | 41,938,119,870 | | | USD | | | 3,143,026 | | | | 3,110,901 | | | | 10/10/17 | | | | (32,124 | ) |
| | IDR | | | 49,659,387,381 | | | USD | | | 3,701,623 | | | | 3,681,728 | | | | 10/16/17 | | | | (19,894 | ) |
| | IDR | | | 22,810,322,076 | | | USD | | | 1,710,082 | | | | 1,689,678 | | | | 10/26/17 | | | | (20,404 | ) |
| | IDR | | | 27,016,123,490 | | | USD | | | 2,003,000 | | | | 2,000,527 | | | | 10/31/17 | | | | (2,473 | ) |
| | IDR | | | 115,616,441,000 | | | USD | | | 8,582,618 | | | | 8,546,813 | | | | 11/16/17 | | | | (35,805 | ) |
| | INR | | | 64,118,054 | | | USD | | | 1,001,000 | | | | 980,527 | | | | 10/05/17 | | | | (20,473 | ) |
| | INR | | | 263,472,111 | | | USD | | | 4,097,402 | | | | 4,025,789 | | | | 10/10/17 | | | | (71,613 | ) |
| | INR | | | 701,518,987 | | | USD | | | 10,877,611 | | | | 10,707,655 | | | | 10/18/17 | | | | (169,956 | ) |
| | INR | | | 411,583,758 | | | USD | | | 6,319,419 | | | | 6,276,389 | | | | 10/25/17 | | | | (43,030 | ) |
| | INR | | | 413,635,733 | | | USD | | | 6,348,301 | | | | 6,306,844 | | | | 10/26/17 | | | | (41,457 | ) |
| | INR | | | 64,118,054 | | | USD | | | 977,484 | | | | 976,799 | | | | 11/03/17 | | | | (685 | ) |
| | KRW | | | 3,696,315,789 | | | USD | | | 3,288,409 | | | | 3,227,559 | | | | 10/02/17 | | | | (60,851 | ) |
| | KRW | | | 6,841,895,148 | | | USD | | | 6,070,619 | | | | 5,975,818 | | | | 10/10/17 | | | | (94,801 | ) |
| | KRW | | | 3,512,397,297 | | | USD | | | 3,108,374 | | | | 3,067,817 | | | | 10/12/17 | | | | (40,557 | ) |
| | KRW | | | 5,865,683,837 | | | USD | | | 5,166,281 | | | | 5,123,616 | | | | 10/25/17 | | | | (42,665 | ) |
| | KRW | | | 9,827,318,060 | | | USD | | | 8,620,104 | | | | 8,586,510 | | | | 11/22/17 | | | | (33,594 | ) |
| | MXN | | | 711,248,233 | | | USD | | | 39,575,889 | | | | 38,554,254 | | | | 12/20/17 | | | | (1,021,635 | ) |
| | MYR | | | 15,837,346 | | | USD | | | 3,773,492 | | | | 3,746,681 | | | | 12/08/17 | | | | (26,811 | ) |
| | PEN | | | 3,240,750 | | | USD | | | 998,000 | | | | 992,549 | | | | 10/05/17 | | | | (5,451 | ) |
| | PEN | | | 7,927,897 | | | USD | | | 2,448,087 | | | | 2,427,687 | | | | 10/10/17 | | | | (20,400 | ) |
| | PLN | | | 93,987,062 | | | EUR | | | 22,002,131 | | | | 25,762,984 | | | | 12/20/17 | | | | (361,452 | ) |
| | PLN | | | 36,900,048 | | | USD | | | 10,376,550 | | | | 10,114,747 | | | | 12/20/17 | | | | (261,802 | ) |
| | RON | | | 13,677,543 | | | USD | | | 3,556,304 | | | | 3,517,567 | | | | 12/20/17 | | | | (38,737 | ) |
| | RUB | | | 1,057,752,403 | | | USD | | | 18,159,941 | | | | 18,104,158 | | | | 12/14/17 | | | | (55,781 | ) |
| | SGD | | | 7,185,064 | | | USD | | | 5,340,301 | | | | 5,301,769 | | | | 12/20/17 | | | | (38,532 | ) |
| �� | THB | | | 33,530,952 | | | USD | | | 1,014,000 | | | | 1,005,496 | | | | 10/11/17 | | | | (8,504 | ) |
| | THB | | | 202,709,412 | | | USD | | | 6,082,347 | | | | 6,079,333 | | | | 10/19/17 | | | | (3,014 | ) |
| | TRY | | | 65,247,216 | | | USD | | | 18,454,463 | | | | 17,884,671 | | | | 12/20/17 | | | | (569,791 | ) |
| | TWD | | | 106,297,943 | | | USD | | | 3,536,663 | | | | 3,503,558 | | | | 10/02/17 | | | | (33,105 | ) |
| | TWD | | | 30,015,000 | | | USD | | | 1,000,000 | | | | 988,506 | | | | 10/05/17 | | | | (11,494 | ) |
| | TWD | | | 199,790,672 | | | USD | | | 6,609,584 | | | | 6,580,611 | | | | 10/20/17 | | | | (28,973 | ) |
| | TWD | | | 49,728,263 | | | USD | | | 1,652,242 | | | | 1,638,169 | | | | 10/23/17 | | | | (14,074 | ) |
| | TWD | | | 88,890,825 | | | USD | | | 2,937,045 | | | | 2,928,713 | | | | 10/26/17 | | | | (8,332 | ) |
| | USD | | | 2,922,075 | | | ARS | | | 52,481,522 | | | | 3,014,274 | | | | 10/10/17 | | | | (92,200 | ) |
| | USD | | | 16,529,203 | | | BRL | | | 52,777,745 | | | | 16,656,675 | | | | 10/03/17 | | | | (127,472 | ) |
| | USD | | | 1,002,000 | | | BRL | | | 3,209,416 | | | | 1,008,541 | | | | 11/03/17 | | | | (6,541 | ) |
| | USD | | | 439,411 | | | CNH | | | 2,942,955 | | | | 440,613 | | | | 12/20/17 | | | | (1,202 | ) |
| | USD | | | 2,083,373 | | | CNY | | | 13,929,327 | | | | 2,089,775 | | | | 11/10/17 | | | | (6,402 | ) |
| | USD | | | 801,000 | | | COP | | | 2,365,270,497 | | | | 802,163 | | | | 10/31/17 | | | | (1,163 | ) |
| | USD | | | 3,015,620 | | | IDR | | | 40,786,255,358 | | | | 3,026,793 | | | | 10/05/17 | | | | (11,174 | ) |
| | USD | | | 1,019,000 | | | INR | | | 66,902,955 | | | | 1,020,092 | | | | 10/26/17 | | | | (1,092 | ) |
| | USD | | | 2,564,307 | | | INR | | | 169,280,790 | | | | 2,578,888 | | | | 11/03/17 | | | | (14,581 | ) |
| | USD | | | 4,887,373 | | | KRW | | | 5,613,219,461 | | | | 4,903,802 | | | | 11/10/17 | | | | (16,430 | ) |
| | USD | | | 1,017,307 | | | KRW | | | 1,164,347,984 | | | | 1,017,336 | | | | 11/22/17 | | | | (30 | ) |
| | USD | | | 650,000 | | | MYR | | | 2,747,875 | | | | 650,072 | | | | 12/08/17 | | | | (72 | ) |
| | |
| The accompanying notes are an integral part of these financial statements. | | 111 |
GOLDMAN SACHS LOCAL EMERGING MARKETS DEBT FUND
Schedule of Investments (continued)
September 30, 2017 (Unaudited)
|
| ADDITIONAL INVESTMENT INFORMATION (continued) |
FORWARD FOREIGN CURRENCY EXCHANGE CONTRACTS WITH UNREALIZED LOSS (continued)
| | | | | | | | | | | | | | | | | | | | | | | | |
| Counterparty | | Currency
Purchased | | | Currency
Sold | | | Current
Value | | | Settlement
Date | | | Unrealized
Loss | |
Morgan Stanley & Co. International PLC (continued) | | USD | | | 1,012,000 | | | PHP | | | 51,826,190 | | | $ | 1,017,362 | | | | 10/19/17 | | | $ | (5,362 | ) |
| | USD | | | 1,013,000 | | | PHP | | | 51,769,872 | | | | 1,016,187 | | | | 10/20/17 | | | | (3,187 | ) |
| | USD | | | 1,002,000 | | | PHP | | | 51,215,767 | | | | 1,004,899 | | | | 10/26/17 | | | | (2,899 | ) |
| | USD | | | 524,432 | | | RUB | | | 31,398,888 | | | | 543,523 | | | | 10/12/17 | | | | (19,091 | ) |
| | USD | | | 4,264,599 | | | RUB | | | 260,635,741 | | | | 4,510,312 | | | | 10/13/17 | | | | (245,712 | ) |
| | USD | | | 5,985,985 | | | RUB | | | 352,562,981 | | | | 6,034,358 | | | | 12/14/17 | | | | (48,374 | ) |
| | USD | | | 4,938,207 | | | SGD | | | 6,725,386 | | | | 4,962,578 | | | | 12/20/17 | | | | (24,371 | ) |
| | USD | | | 601,000 | | | TRY | | | 2,192,863 | | | | 601,077 | | | | 12/20/17 | | | | (77 | ) |
| | USD | | | 854,938 | | | TWD | | | 25,938,807 | | | | 854,938 | | | | 10/02/17 | | | | — | |
| | USD | | | 986,362 | | | TWD | | | 30,015,000 | | | | 988,506 | | | | 10/05/17 | | | | (2,144 | ) |
| | USD | | | 1,937,977 | | | TWD | | | 59,180,000 | | | | 1,949,243 | | | | 10/20/17 | | | | (11,266 | ) |
| | USD | | | 2,083,373 | | | TWD | | | 63,383,285 | | | | 2,088,721 | | | | 10/31/17 | | | | (5,348 | ) |
| | | ZAR | | | 87,046,843 | | | USD | | | 6,489,620 | | | | 6,346,079 | | | | 12/20/17 | | | | (143,542 | ) |
| TOTAL | | | | | | | | $ | (4,729,264 | ) |
FUTURES CONTRACTS — At September 30, 2017, the Fund had the following futures contracts:
| | | | | | | | | | | | | | | | |
| Description | | Number of
Contracts | | | Expiration
Date | | | Notional
Amount | | | Unrealized
Appreciation/
(Depreciation) | |
Long positions: | | | | | | | | | | | | | | | | |
10 Year U.S. Treasury Notes | | | 44 | | | | 12/19/17 | | | $ | 5,513,750 | | | $ | (54,243 | ) |
Ultra Long U.S. Treasury Bonds | | | 52 | | | | 12/19/17 | | | | 8,586,500 | | | | (151,981 | ) |
2 Year U.S. Treasury Notes | | | 44 | | | | 12/29/17 | | | | 9,490,938 | | | | (17,262 | ) |
| Total | | | | | | | | | | | | | | $ | (223,486 | ) |
Short position contracts: | | | | | | | | | | | | | | | | |
Eurodollars | | | (78 | ) | | | 12/17/18 | | | $ | (19,136,325 | ) | | $ | (6,968 | ) |
20 Year U.S. Treasury Bonds | | | (112 | ) | | | 12/19/17 | | | | (17,115,000 | ) | | | 242,133 | |
5 Year U.S. Treasury Notes | | | (108 | ) | | | 12/29/17 | | | | (12,690,000 | ) | | | 103,288 | |
| Total | | | | | | | | | | | | | | $ | 338,453 | |
| TOTAL FUTURES CONTRACTS | | | $ | 114,967 | |
| | |
| 112 | | The accompanying notes are an integral part of these financial statements. |
GOLDMAN SACHS LOCAL EMERGING MARKETS DEBT FUND
|
| ADDITIONAL INVESTMENT INFORMATION (continued) |
SWAP CONTRACTS — At September 30, 2017, the Fund had the following swap contracts:
OVER THE COUNTER INTEREST RATE SWAP CONTRACTS
| | | | | | | | | | | | | | | | | | | | | | | | | | | | |
| Payments Made by the Fund | | Payments
Received
by the
Fund | | Counterparty | | Termination
Date | | | Notional
Amount
(000s) | | | Value | | | Upfront
Payments
(Received)
Paid | | | Unrealized
Appreciation/
(Depreciation) | |
1M BID Avg(a) | | 11.59% | | BoA Securities LLC | | | 01/04/21 | | | | BRL | | | | 12,630 | | | $ | 266,112 | | | $ | — | | | $ | 266,112 | |
6.250%(b) | | 6M MIBOR | | BoA Securities LLC | | | 12/20/22 | | | | INR | | | | 116,970 | | | | 1,977 | | | | (4,458 | ) | | | 6,435 | |
3M SHIBOR(c) | | 2.800 | | Barclays Bank PLC | | | 12/21/21 | | | | CNY | | | | 8,590 | | | | (47,580 | ) | | | (1,779 | ) | | | (45,801 | ) |
Mexico IB TIIE 28D(d) | | 8.010 | | Barclays Bank PLC | | | 06/29/27 | | | | MXN | | | | 213,930 | (e) | | | 218,825 | | | | — | | | | 218,825 | |
1M BID Avg(d) | | 14.460 | | Citibank NA | | | 01/02/18 | | | | BRL | | | | 17,340 | | | | 227,801 | | | | — | | | | 227,801 | |
1M BID Avg(a) | | 12.645 | | Citibank NA | | | 01/02/19 | | | | | | | | 3,460 | | | | 63,051 | | | | — | | | | 63,051 | |
| | 9.853 | | Citibank NA | | | 01/02/20 | | | | | | | | 5,050 | | | | 46,867 | | | | — | | | | 46,867 | |
| | 10.010 | | Citibank NA | | | 01/02/20 | | | | | | | | 9,470 | | | | 97,481 | | | | — | | | | 97,481 | |
11.605(a) | | 1M BID Avg | | Citibank NA | | | 01/04/21 | | | | | | | | 11,180 | | | | (239,638 | ) | | | — | | | | (239,638 | ) |
1M BID Avg(d) | | 11.960 | | CS International (London) | | | 01/02/18 | | | | | | | | 17,400 | | | | (76,108 | ) | | | — | | | | (76,108 | ) |
| | 11.120 | | CS International (London) | | | 01/02/18 | | | | BRL | | | | 23,240 | | | | (263,048 | ) | | | — | | | | (263,048 | ) |
5.110(c) | | 3M COP | | CS International (London) | | | 04/15/19 | | | | COP | | | | 20,678,330 | | | | (31,119 | ) | | | — | | | | (31,119 | ) |
6.055(c) | | Colombia IBR Overnight IB | | CS International (London) | | | 05/02/24 | | | | | | | | 3,635,890 | | | | (29,740 | ) | | | — | | | | (29,740 | ) |
1M BID Avg(d) | | 11.150 | | Deutsche Bank AG | | | 01/02/18 | | | | BRL | | | | 9,840 | | | | (108,440 | ) | | | — | | | | (108,440 | ) |
10.950(d) | | 1M BID Avg | | Deutsche Bank AG | | | 01/04/21 | | | | | | | | 7,710 | | | | (134,282 | ) | | | — | | | | (134,282 | ) |
13.927(a) | | 1M BID Avg | | Deutsche Bank AG | | | 01/04/21 | | | | | | | | 11,360 | | | | (450,007 | ) | | | — | | | | (450,007 | ) |
1M BID Avg(a) | | 10.07 | | Deutsche Bank AG | | | 01/02/23 | | | | | | | | 273 | | | | 2,177 | | | | — | | | | 2,177 | |
13.855(a) | | 1M BID Avg | | Deutsche Bank AG | | | 01/02/23 | | | | | | | | 7,260 | | | | (321,136 | ) | | | — | | | | (321,136 | ) |
14.195(a) | | 1M BID Avg | | Deutsche Bank AG | | | 01/02/23 | | | | | | | | 7,350 | | | | (349,568 | ) | | | — | | | | (349,568 | ) |
13.602(a) | | 1M BID Avg | | Deutsche Bank AG | | | 01/02/23 | | | | | | | | 17,590 | | | | (733,759 | ) | | | — | | | | (733,759 | ) |
12.340(f) | | 1M BID Avg | | Deutsche Bank AG | | | 01/02/25 | | | | | | | | 22,680 | | | | (625,055 | ) | | | — | | | | (625,055 | ) |
5.190(c) | | 3M COP | | JPMorgan Securities, Inc. | | | 04/22/19 | | | | COP | | | | 10,159,090 | | | | (23,935 | ) | | | — | | | | (23,935 | ) |
1M BID Avg | | 10.260 | | JPMorgan Securities, Inc. | | | 01/02/20 | | | | BRL | | | | 8,110 | | | | 103,584 | | | | — | | | | 103,584 | |
1M BID Avg(a) | | 9.865 | | JPMorgan Securities, Inc. | | | 01/02/20 | | | | | | | | 8,350 | | | | 78,197 | | | | — | | | | 78,197 | |
1M BID Avg | | 11.870 | | JPMorgan Securities, Inc. | | | 01/02/20 | | | | | | | | 23,970 | (e) | | | 167,953 | | | | — | | | | 167,953 | |
1M BID Avg(a) | | 9.965 | | JPMorgan Securities, Inc. | | | 01/04/21 | | | | | | | | 12,990 | | | | 116,783 | | | | — | | | | 116,783 | |
3M SHIBOR(c) | | 3.600 | | JPMorgan Securities, Inc. | | | 03/15/22 | | | | CNY | | | | 16,810 | | | | (17,306 | ) | | | (5,280 | ) | | | (12,026 | ) |
6.250(b) | | 6M MIBOR | | JPMorgan Securities, Inc. | | | 12/20/22 | | | | INR | | | | 100,970 | | | | 1,706 | | | | (3,616 | ) | | | 5,322 | |
1M BID Avg(a) | | 12.610 | | MS & Co. Int. PLC | | | 01/02/19 | | | | BRL | | | | 1,330 | | | | 23,937 | | | | — | | | | 23,937 | |
| | 9.115 | | MS & Co. Int. PLC | | | 01/02/20 | | | | | | | | 9,920 | | | | 55,052 | | | | — | | | | 55,052 | |
| | 11.870 | | MS & Co. Int. PLC | | | 01/04/21 | | | | | | | | 5,670 | | | | 132,893 | | | | — | | | | 132,893 | |
| | 11.845 | | MS & Co. Int. PLC | | | 01/04/21 | | | | | | | | 8,510 | | | | 197,682 | | | | — | | | | 197,682 | |
11.742(a) | | 1M BID Avg | | MS & Co. Int. PLC | | | 01/04/21 | | | | | | | | 18,660 | | | | (424,453 | ) | | | — | | | | (424,453 | ) |
Mexico IB TIIE 28D(d) | | 5.630 | | MS & Co. Int. PLC | | | 06/17/21 | | | | MXN | | | | 135,000 | | | | (299,656 | ) | | | — | | | | (299,656 | ) |
Colombia IBR Overnight IB(c) | | 6.055 | | MS & Co. Int. PLC | | | 05/02/24 | | | | COP | | | | 3,635,890 | | | | 29,740 | | | | (4,604 | ) | | | 34,344 | |
| TOTAL | | | | | | | | | | | | | | | | | | $ | (2,343,012 | ) | | $ | (19,737 | ) | | $ | (2,323,275 | ) |
| | (a) | | Payments made at maturity. |
| | (b) | | Payments made semi-annually. |
| | (c) | | Payments made quarterly. |
| | (d) | | Payments made monthly. |
| | (e) | | Represents forward starting interest rate swaps whose effective dates of commencement of accruals and cash flows occur subsequent to September 30, 2017. |
| | (f) | | Payments made annually. |
| | |
| The accompanying notes are an integral part of these financial statements. | | 113 |
GOLDMAN SACHS LOCAL EMERGING MARKETS DEBT FUND
Schedule of Investments (continued)
September 30, 2017 (Unaudited)
|
| ADDITIONAL INVESTMENT INFORMATION (continued) |
CENTRALLY CLEARED INTEREST RATE SWAP CONTRACTS
| | | | | | | | | | | | | | | | | | | | | | | | | | |
| Payments Made by the Fund | | Payments
Received
by Fund | | Termination
Date | | | Notional
Amount
(000s)(a) | | | Value | | | Upfront
Premium
(Received)
Paid | | | Unrealized
Appreciation/
(Depreciation) | |
0.815%(b) | | 6M PRIBOR(c) | | | 08/23/19 | | | | CZK | | | | 107,290 | | | $ | 14,212 | | | $ | 24 | | | $ | 14,188 | |
0.817(b) | | 6M PRIBOR | | | 08/25/19 | | | | | | | | 128,000 | | | | 17,311 | | | | 29 | | | | 17,282 | |
Mexico IB TIIE 28D(d) | | 6.850% | | | 12/16/20 | | | | MXN | | | | 142,325 | | | | 10,681 | | | | 17,907 | | | | (7,226 | ) |
6M BUBOR(a) | | 1.380(b) | | | 09/21/21 | | | | HUF | | | | 1,871,420 | | | | (196,732 | ) | | | 55 | | | | (196,787 | ) |
0.367(a) | | 6M PRIBOR(b) | | | 12/21/21 | | | | CZK | | | | 214,900 | | | | 370,733 | | | | (67,507 | ) | | | 438,240 | |
Mexico IB TIIE 28D(d) | | 5.500 | | | 03/09/22 | | | | MXN | | | | 53,690 | | | | (150,551 | ) | | | (53,950 | ) | | | (96,601 | ) |
2.250(e) | | 3M SHIBOR | | | 06/21/22 | | | | HKD | | | | 26,540 | | | | (80,504 | ) | | | (25,457 | ) | | | (55,047 | ) |
Mexico IB TIIE 28D(d) | | 6.750 | | | 12/14/22 | | | | MXN | | | | 356,775 | | | | (28,673 | ) | | | 2,969 | | | | (31,642 | ) |
1.218(b) | | 6M PRIBOR(c) | | | 12/20/22 | | | | CZK | | | | 81,720 | | | | 37,789 | | | | (16,958 | ) | | | 54,747 | |
5.955(d) | | Mexico IB TIIE 28D | | | 11/20/24 | | | | MXN | | | | 54,290 | | | | 172,844 | | | | 20 | | | | 172,824 | |
Mexico IB TIIE 28D(d) | | 6.900 | | | 12/11/24 | | | | | | | | 231,400 | | | | (14,635 | ) | | | 7,118 | | | | (21,753 | ) |
0.500(b) | | 6M EURO(c) | | | 12/20/24 | | | | EUR | | | | 340 | | | | 2,452 | | | | (780 | ) | | | 3,232 | |
5.660(d) | | Mexico IB TIIE 28D | | | 01/24/25 | | | | MXN | | | | 20,280 | | | | 85,728 | | | | 15 | | | | 85,713 | |
0.550(b) | | 6M PRIBOR(c) | | | 06/21/26 | | | | CZK | | | | 18,980 | | | | 75,188 | | | | 11 | | | | 75,177 | |
7.500(d) | | Mexico IB TIIE 28D | | | 06/09/27 | | | | MXN | | | | 34,390 | | | | (59,435 | ) | | | (46,094 | ) | | | (13,341 | ) |
Mexico IB TIIE 28D(d) | | 7.050 | | | 12/08/27 | | | | | | | | 8,175 | | | | (1,224 | ) | | | 440 | | | | (1,664 | ) |
1.000(b) | | 6M EURO(c) | | | 12/20/27 | | | | EUR | | | | 460 | | | | (2,217 | ) | | | (8,033 | ) | | | 5,816 | |
| TOTAL | | | | | | | | | | | | | | | | $ | 252,967 | | | $ | (190,191 | ) | | $ | 443,158 | |
| | (a) | | Represents forward starting interest rate swaps whose effective dates of commencement of accruals and cash flows occur subsequent to September 30, 2017. |
| | (b) | | Payments made annually. |
| | (c) | | Payments made semi-annually. |
| | (d) | | Payments made monthly. |
| | (e) | | Payments made quarterly. |
| | (f) | | Payments made at maturity. |
| | |
| 114 | | The accompanying notes are an integral part of these financial statements. |
GOLDMAN SACHS LOCAL EMERGING MARKETS DEBT FUND
|
| ADDITIONAL INVESTMENT INFORMATION (continued) |
OVER THE COUNTER CREDIT DEFAULT SWAP CONTRACTS
| | | | | | | | | | | | | | | | | | | | | | | | | | | | | | | | |
| Reference Obligation/ Index | | Financing
Received/(Paid)
by the
Fund(a) | | | Credit Spread
at
September 30,
2017(b) | | | Counterparty | | | Termination
Date | | | Notional
Amount
(000s) | | | Value | | | Upfront
Premiums
(Received)
Paid | | | Unrealized
Appreciation/
(Depreciation) | |
Protection Purchased: | | | | | | | | | | | | | | | | | | | | | | | | | | | | | | | | |
People’s Republic of China, 4.250% 10/28/17 | | | (1.000 | )% | | | 0.207 | % | |
| BoA
Securities LLC |
| | | 06/20/19 | | | $ | 1,160 | | | $ | (16,130 | ) | | $ | (2,509 | ) | | $ | (13,621 | ) |
People’s Republic of China, 7.500%, 10/28/27 | | | (1.000 | ) | | | 0.379 | | |
| BoA
Securities LLC |
| | | 12/20/20 | | | | 4,100 | | | | (81,531 | ) | | | 20,661 | | | | (102,192 | ) |
People’s Republic of China, 7.500%, 10/28/27 | | | (1.000 | ) | | | 0.442 | | |
| BoA
Securities LLC |
| | | 06/20/21 | | | | 70 | | | | (1,432 | ) | | | 611 | | | | (2,043 | ) |
People’s Republic of China, 4.250% 10/28/17 | | | (1.000 | ) | | | 0.191 | | |
| Barclays Bank
PLC |
| | | 03/20/19 | | | | 3,170 | | | | (38,616 | ) | | | (3,560 | ) | | | (35,056 | ) |
People’s Republic of China, 7.500%, 10/28/27 | | | (1.000 | ) | | | 0.442 | | |
| Barclays Bank
PLC |
| | | 06/20/21 | | | | 2,750 | | | | (56,278 | ) | | | 9,061 | | | | (65,339 | ) |
People’s Republic of China, 4.250% 10/28/17 | | | (1.000 | ) | | | 0.191 | | | | Citibank NA | | | | 03/20/19 | | | | 22,180 | | | | (270,186 | ) | | | (37,213 | ) | | | (232,973 | ) |
People’s Republic of China, 4.250% 10/28/17 | | | (1.000 | ) | | | 0.207 | | | | Citibank NA | | | | 06/20/19 | | | | 44,310 | | | | (616,139 | ) | | | (91,237 | ) | | | (524,902 | ) |
People’s Republic of China, 7.500%, 10/28/27 | | | (1.000 | ) | | | 0.379 | | | | Citibank NA | | | | 12/20/20 | | | | 4,470 | | | | (88,888 | ) | | | 33,744 | | | | (122,632 | ) |
People’s Republic of China, 7.500%, 10/28/27 | | | (1.000 | ) | | | 0.442 | | | | Citibank NA | | | | 06/20/21 | | | | 3,810 | | | | (77,970 | ) | | | 29,752 | | | | (107,722 | ) |
People’s Republic of China, 7.500%, 10/28/27 | | | (1.000 | ) | | | 0.442 | | |
| Deutsche
Bank AG |
| | | 06/20/21 | | | | 940 | | | | (19,237 | ) | | | 2,653 | | | | (21,890 | ) |
People’s Republic of China, 4.250% 10/28/17 | | | (1.000 | ) | | | 0.207 | | |
| JPMorgan
Securities, Inc. |
| | | 06/20/19 | | | | 1,630 | | | | (22,665 | ) | | | (3,785 | ) | | | (18,880 | ) |
People’s Republic of China, 7.500%, 10/28/27 | | | (1.000 | ) | | | 0.379 | | |
| JPMorgan
Securities, Inc. |
| | | 12/20/20 | | | | 530 | | | | (10,539 | ) | | | 1,932 | | | | (12,471 | ) |
People’s Republic of China, 7.500%, 10/28/27 | | | (1.000 | ) | | | 0.442 | | |
| JPMorgan
Securities, Inc. |
| | | 06/20/21 | | | | 280 | | | | (5,730 | ) | | | 2,016 | | | | (7,746 | ) |
People’s Republic of China, 7.500%, 10/28/27 | | | (1.000 | ) | | | 0.442 | | |
| UBS AG
(London) |
| | | 06/20/21 | | | | 280 | | | | (5,730 | ) | | | 918 | | | | (6,648 | ) |
| TOTAL | | | $ | (1,311,071 | ) | | $ | (36,956 | ) | | $ | (1,274,115 | ) |
| | (a) | | Payments made quarterly. |
| | (b) | | Credit spread on the referenced obligation, together with the term of the swap contract, are indicators of payment/performance risk. The likelihood of a credit event occurring which would require a fund or its counterparty to make a payment or otherwise be required to perform under the swap contract is generally greater as the credit spread and the term of the swap contract increase. |
| | |
| The accompanying notes are an integral part of these financial statements. | | 115 |
GOLDMAN SACHS LOCAL EMERGING MARKETS DEBT FUND
Schedule of Investments (continued)
September 30, 2017 (Unaudited)
|
| ADDITIONAL INVESTMENT INFORMATION (continued) |
PURCHASED OPTIONS CONTRACTS — At September 30, 2017, the Fund had the following purchased options:
PURCHASED OPTIONS ON FUTURES CONTRACTS
| | | | | | | | | | | | | | | | | | | | | | | | | | | | | | |
| Description | | Counterparty | | Exercise
Price | | | Expiration
Date | | | Number of
Contracts | | | Notional Amount | | | Value | | | Premiums Paid
(Received) | | | Unrealized
Appreciation/ (Depreciation) | |
Purchased Options Contracts: | | | | | | | | | |
Puts: | | | | | | | | | | | | | | | | | | | | | | | | | | | | | | |
Eurodollar Futures | | MS & Co. Int. PLC | | $ | 98.00 | | | | 06/15/18 | | | | 61 | | | $ | 152,500 | | | $ | 23,638 | | | $ | 16,912 | | | $ | 6,726 | |
| | |
|
Abbreviation: |
1M BID Avg | | —1 month Brazilian Interbank Deposit Average |
BoA Securities LLC | | —Bank of America Securities LLC |
Colombia IBR Overnight IB | | —Colombia IBR Overnight Interbank |
CS International (London) | | —Credit Suisse International (London) |
Mexico IB TIIE 28D | | —Mexico Interbank TIIE 28 Days |
MS & Co. Int. PLC | | —Morgan Stanley & Co. International PLC |
|
| | |
| 116 | | The accompanying notes are an integral part of these financial statements. |
GOLDMAN SACHS U.S. MORTGAGES FUND
Schedule of Investments
September 30, 2017 (Unaudited)
| | | | | | | | | | | | | | |
Principal
Amount | | | Interest
Rate | | | Maturity
Date | | | Value | |
| Mortgage-Backed Obligations – 94.9% | |
| Collateralized Mortgage Obligations – 4.9% | |
| Interest Only(a) – 1.9% | |
| CS First Boston Mortgage Securities Corp. Series 2003-19,
Class 1A2 |
|
| $ | 260 | | | | 5.250 | % | | | 07/25/33 | | | $ | 1 | |
| FHLMC REMIC Series 3852, Class SW
(-1x1M LIBOR + 6.000%)(e) |
|
| | 656,040 | | | | 4.773 | | | | 05/15/41 | | | | 104,367 | |
| FHLMC REMIC Series 4273, Class PS
(-1x1M LIBOR + 6.100%)(e) |
|
| | 333,558 | | | | 4.866 | | | | 11/15/43 | | | | 54,769 | |
| FHLMC REMIC Series 4286, Class SN
(-1x1M LIBOR + 6.000%)(e) |
|
| | 4,637,033 | | | | 4.766 | | | | 12/15/43 | | | | 772,060 | |
| FHLMC REMIC Series 4314, Class SE
(-1x1M LIBOR + 6.050%)(e) |
|
| | 439,507 | | | | 4.816 | | | | 03/15/44 | | | | 76,435 | |
| FHLMC REMIC Series 4320, Class SD
(-1x1M LIBOR + 6.100%)(e) |
|
| | 248,004 | | | | 4.866 | | | | 07/15/39 | | | | 38,801 | |
| FHLMC REMIC Series 4326, Class GS
(-1x1M LIBOR + 6.050%)(e) |
|
| | 555,165 | | | | 4.816 | | | | 04/15/44 | | | | 95,870 | |
| | FHLMC REMIC Series 4456, Class IO(e) | |
| | 306,047 | | | | 4.500 | | | | 10/15/44 | | | | 59,930 | |
| FHLMC REMIC Series 4583, Class ST
(-1x1M LIBOR + 6.000%)(e) |
|
| | 1,917,092 | | | | 4.766 | | | | 05/15/46 | | | | 365,741 | |
| | FHLMC STRIPS Series 304, Class C45(e) | |
| | 385,986 | | | | 3.000 | | | | 12/15/27 | | | | 35,533 | |
| FNMA REMIC Series 2007-36, Class SN
(-1x1M LIBOR + 6.770%)(e) |
|
| | 572,044 | | | | 5.533 | | | | 04/25/37 | | | | 105,385 | |
| FNMA REMIC Series 2008-17, Class SI
(-1x1M LIBOR + 6.300%)(e) |
|
| | 739,370 | | | | 5.063 | | | | 03/25/38 | | | | 121,507 | |
| FNMA REMIC Series 2010-126, Class LS
(-1x1M LIBOR + 5.000%)(e) |
|
| | 861,003 | | | | 3.768 | | | | 11/25/40 | | | | 129,406 | |
| FNMA REMIC Series 2011-124, Class SC
(-1x1M LIBOR + 6.550%)(e) |
|
| | 471,512 | | | | 5.316 | | | | 12/25/41 | | | | 86,974 | |
| | FNMA REMIC Series 2012-146, Class IO(e) | |
| | 2,398,971 | | | | 3.500 | | | | 01/25/43 | | | | 455,140 | |
| FNMA REMIC Series 2012-88, Class SB
(-1x1M LIBOR + 6.670%)(e) |
|
| | 544,310 | | | | 5.436 | | | | 07/25/42 | | | | 101,269 | |
| FNMA REMIC Series 2013-121, Class SA
(-1x1M LIBOR + 6.100%)(e) |
|
| | 502,237 | | | | 4.866 | | | | 12/25/43 | | | | 79,679 | |
| FNMA REMIC Series 2013-96, Class SW
(-1x1M LIBOR + 6.100%)(e) |
|
| | 270,562 | | | | 4.866 | | | | 09/25/43 | | | | 43,640 | |
| FNMA REMIC Series 2014-87, Class MS
(-1x1M LIBOR + 6.250%)(e) |
|
| | 147,368 | | | | 5.016 | | | | 01/25/45 | | | | 24,160 | |
| | |
| Mortgage-Backed Obligations – (continued) | |
| Interest Only(a) – (continued) | |
| FNMA REMIC Series 2015-20, Class ES
(-1x1M LIBOR + 6.150%)(e) |
|
| $ | 741,190 | | | | 4.916 | % | | | 04/25/45 | | | $ | 150,969 | |
| FNMA REMIC Series 2015-28, Class PS
(-1x1M LIBOR + 5.600%)(e) |
|
| | 1,713,048 | | | | 4.366 | | | | 08/25/44 | | | | 254,289 | |
| FNMA REMIC Series 2015-79, Class SA
(-1x1M LIBOR + 6.250%)(e) |
|
| | 572,401 | | | | 5.016 | | | | 11/25/45 | | | | 95,993 | |
| FNMA REMIC Series 2015-81, Class SA
(-1x1M LIBOR + 5.700%)(e) |
|
| | 1,798,428 | | | | 4.466 | | | | 11/25/45 | | | | 256,529 | |
| FNMA REMIC Series 2015-82, Class MS
(-1x1M LIBOR + 5.700%)(e) |
|
| | 497,429 | | | | 4.466 | | | | 11/25/45 | | | | 72,056 | |
| | FNMA REMIC Series 2016-3, Class IP | |
| | 1,067,859 | | | | 4.000 | | | | 02/25/46 | | | | 215,768 | |
| GNMA REMIC Series 2010-1, Class SD
(-1x1M LIBOR + 5.790%)(e) |
|
| | 21,429 | | | | 4.554 | | | | 01/20/40 | | | | 3,396 | |
| GNMA REMIC Series 2010-101, Class S
(-1x1M LIBOR + 6.000%)(e) |
|
| | 1,366,805 | | | | 4.764 | | | | 08/20/40 | | | | 220,966 | |
| GNMA REMIC Series 2010-20, Class SE
(-1x1M LIBOR + 6.250%)(e) |
|
| | 546,118 | | | | 5.014 | | | | 02/20/40 | | | | 91,708 | |
| GNMA REMIC Series 2010-31, Class SA
(-1x1M LIBOR + 5.750%)(e) |
|
| | 336,607 | | | | 4.514 | | | | 03/20/40 | | | | 49,669 | |
| GNMA REMIC Series 2010-85, Class SN
(-1x1M LIBOR + 5.940%)(e) |
|
| | 53,518 | | | | 4.704 | | | | 07/20/40 | | | | 9,801 | |
| GNMA REMIC Series 2010-98, Class QS
(-1x1M LIBOR + 6.600%)(e) |
|
| | 165,842 | | | | 5.364 | | | | 01/20/40 | | | | 21,641 | |
| GNMA REMIC Series 2011-17, Class SA
(-1x1M LIBOR + 6.100%)(e) |
|
| | 207,611 | | | | 4.864 | | | | 09/20/40 | | | | 29,718 | |
| GNMA REMIC Series 2011-61, Class CS
(-1x1M LIBOR + 6.680%)(e) |
|
| | 71,330 | | | | 5.444 | | | | 12/20/35 | | | | 2,610 | |
| GNMA REMIC Series 2013-113, Class SD
(-1x1M LIBOR + 6.700%)(e) |
|
| | 241,781 | | | | 5.466 | | | | 08/16/43 | | | | 42,926 | |
| GNMA REMIC Series 2013-124, Class CS
(-1x1M LIBOR + 6.050%)(e) |
|
| | 1,945,369 | | | | 4.814 | | | | 08/20/43 | | | | 333,501 | |
| GNMA REMIC Series 2013-134, Class DS
(-1x1M LIBOR + 6.100%)(e) |
|
| | 125,632 | | | | 4.864 | | | | 09/20/43 | | | | 20,282 | |
| GNMA REMIC Series 2013-152, Class SJ
(-1x1M LIBOR + 6.150%)(e) |
|
| | 685,804 | | | | 4.914 | | | | 05/20/41 | | | | 113,112 | |
| | GNMA REMIC Series 2014-11, Class KI | |
| | 346,946 | | | | 4.500 | | | | 12/20/42 | | | | 42,814 | |
| | |
| | |
| The accompanying notes are an integral part of these financial statements. | | 117 |
GOLDMAN SACHS U.S. MORTGAGES FUND
Schedule of Investments (continued)
September 30, 2017 (Unaudited)
| | | | | | | | | | | | | | |
Principal
Amount | | | Interest
Rate | | | Maturity
Date | | | Value | |
| Mortgage-Backed Obligations – (continued) | |
| Interest Only(a) – (continued) | |
| GNMA REMIC Series 2014-117, Class SJ
(-1x1M LIBOR + 5.600%)(e) |
|
| $ | 5,606,720 | | | | 4.364 | % | | | 08/20/44 | | | $ | 842,966 | |
| GNMA REMIC Series 2014-132, Class SL
(-1x1M LIBOR + 6.100%)(e) |
|
| | 945,905 | | | | 4.864 | | | | 10/20/43 | | | | 137,791 | |
| GNMA REMIC Series 2014-133, Class BS
(-1x1M LIBOR + 5.600%)(e) |
|
| | 430,906 | | | | 4.364 | | | | 09/20/44 | | | | 60,607 | |
| GNMA REMIC Series 2014-158, Class SA
(-1x1M LIBOR + 5.600%)(e) |
|
| | 2,585,228 | | | | 4.366 | | | | 10/16/44 | | | | 383,541 | |
| | GNMA REMIC Series 2014-188, Class IB(e) | |
| | 1,625,637 | | | | 4.000 | | | | 12/20/44 | | | | 239,192 | |
| GNMA REMIC Series 2014-41, Class SA
(-1x1M LIBOR + 6.100%)(e) |
|
| | 142,017 | | | | 4.864 | | | | 03/20/44 | | | | 23,480 | |
| GNMA REMIC Series 2015-110, Class MS
(-1x1M LIBOR + 5.710%)(e) |
|
| | 1,832,825 | | | | 4.474 | | | | 08/20/45 | | | | 266,355 | |
| | GNMA REMIC Series 2015-111, Class IM(e) | |
| | 1,014,718 | | | | 4.000 | | | | 08/20/45 | | | | 160,023 | |
| GNMA REMIC Series 2015-111, Class SM
(-1x1M LIBOR + 6.200%)(e) |
|
| | 565,606 | | | | 4.964 | | | | 08/20/45 | | | | 93,282 | |
| GNMA REMIC Series 2015-112, Class SB
(-1x1M LIBOR + 5.740%)(e) |
|
| | 543,059 | | | | 4.504 | | | | 08/20/45 | | | | 79,247 | |
| GNMA REMIC Series 2015-119, Class SN
(-1x1M LIBOR + 6.250%)(e) |
|
| | 1,187,646 | | | | 5.014 | | | | 08/20/45 | | | | 201,356 | |
| GNMA REMIC Series 2015-126, Class HS
(-1x1M LIBOR + 6.200%)(e) |
|
| | 1,092,010 | | | | 4.964 | | | | 09/20/45 | | | | 177,846 | |
| | GNMA REMIC Series 2015-129, Class IC(e) | |
| | 628,649 | | | | 4.500 | | | | 09/16/45 | | | | 112,410 | |
| GNMA REMIC Series 2015-168, Class SD
(-1x1M LIBOR + 6.200%)(e) |
|
| | 290,485 | | | | 4.964 | | | | 11/20/45 | | | | 47,199 | |
| GNMA REMIC Series 2015-57, Class AS
(-1x1M LIBOR + 5.600%)(e) |
|
| | 3,287,099 | | | | 4.364 | | | | 04/20/45 | | | | 462,239 | |
| GNMA REMIC Series 2015-64, Class SG
(-1x1M LIBOR + 5.600%)(e) |
|
| | 1,483,102 | | | | 4.364 | | | | 05/20/45 | | | | 249,290 | |
| | GNMA REMIC Series 2015-72, Class JI | |
| | 141,940 | | | | 3.500 | | | | 05/20/45 | | | | 18,692 | |
| | GNMA REMIC Series 2015-83, Class PI | |
| | 235,268 | | | | 3.500 | | | | 06/20/45 | | | | 31,686 | |
| | GNMA REMIC Series 2015-90, Class PI | |
| | 187,880 | | | | 3.500 | | | | 04/20/45 | | | | 24,245 | |
| GNMA REMIC Series 2016-1, Class ST
(-1x1M LIBOR + 6.200%)(e) |
|
| | 572,557 | | | | 4.964 | | | | 01/20/46 | | | | 93,705 | |
| | GNMA REMIC Series 2016-138, Class DI | |
| | 352,018 | | | | 4.000 | | | | 10/20/46 | | | | 57,605 | |
| | |
| Mortgage-Backed Obligations – (continued) | |
| Interest Only(a) – (continued) | |
| | GNMA REMIC Series 2016-27, Class IA | |
| 1,302,157 | | | | 4.000 | | | | 06/20/45 | | | | 180,696 | |
| GNMA REMIC Series 2016-4, Class SM
(-1x1M LIBOR + 5.650%)(e) |
|
| | 798,729 | | | | 4.414 | | | | 01/20/46 | | | | 110,809 | |
| GNMA REMIC Series 2016-6, Class SB
(-1x1M LIBOR + 5.650%)(e) |
|
| | 657,983 | | | | 4.414 | | | | 01/20/46 | | | | 93,050 | |
| | GNMA REMIC Series 2017-38, Class AI | |
| | 1,739,134 | | | | 4.000 | | | | 03/20/46 | | | | 247,153 | |
| Master Adjustable Rate Mortgages Trust Series 2003-2,
Class 3AX |
|
| | 11,617 | | | | 0.123 | | | | 08/25/33 | | | | 67 | |
| Master Adjustable Rate Mortgages Trust Series 2003-2,
Class 4AX |
|
| | 1,452 | | | | 0.320 | | | | 07/25/33 | | | | 26 | |
| | | | | | | | | | | | | | |
| | | | | | | | | | | | | 9,172,973 | |
| | |
| | Regular Floater – 1.7% | |
| Countrywide Alternative Loan Trust Series 2005-38, Class A1
(12M MTA + 1.500%)(e) |
|
| | 107,595 | | | | 2.330 | | | | 09/25/35 | | | | 105,489 | |
| FHLMC REMIC Series 4103, Class BF
(1M LIBOR + 0.350%)(e) |
|
| | 1,021,989 | | | | 1.577 | | | | 12/15/38 | | | | 1,022,947 | |
| FNMA REMIC Series 2011-63, Class FG
(1M LIBOR + 0.450%)(e) |
|
| | 151,660 | | | | 1.684 | | | | 07/25/41 | | | | 152,446 | |
| Harborview Mortgage Loan Trust Series 2005-16, Class 2A1A
(1M USD LIBOR + 0.240%)(e) |
|
| | 158,224 | | | | 1.711 | | | | 01/19/36 | | | | 108,052 | |
| Impac CMB Trust Series 2004-08, Class 1A
(1M USD LIBOR + 0.720%)(e) |
|
| | 44,768 | | | | 1.954 | | | | 10/25/34 | | | | 40,459 | |
| Mortgage Repurchase Agreement Financing Trust Series 2016-1,
Class A2 (1M USD LIBOR + 0.950%)(b)(e) |
|
| | 1,150,000 | | | | 2.181 | | | | 04/10/19 | | | | 1,150,024 | |
| Mortgage Repurchase Agreement Financing Trust Series 2017-1,
Class A1 (1M USD LIBOR + 0.850%)(b)(e) |
|
| | 450,000 | | | | 2.081 | | | | 07/10/19 | | | | 450,116 | |
| Mortgage Repurchase Agreement Financing Trust Series 2017-2,
Class A1(b) |
|
| | 4,850,000 | | | | 1.781 | | | | 08/12/19 | | | | 4,850,393 | |
| Station Place Securitization Trust Series 2015-2, Class A
(1M USD LIBOR + 1.050%)(b)(e) |
|
| | 372,333 | | | | 2.279 | | | | 05/15/18 | | | | 372,333 | |
| | | | | | | | | | | | | | |
| | | | | | | | | | | | | 8,252,259 | |
| | |
| | Sequential Fixed Rate – 0.8% | |
| | FHLMC REMIC Series 2042, Class N | |
| | 65,351 | | | | 6.500 | | | | 03/15/28 | | | | 71,151 | |
| | FHLMC REMIC Series 3748, Class D | |
| | 584,060 | | | | 4.000 | | | | 11/15/39 | | | | 611,084 | |
| | FNMA REMIC Series 2000-16, Class ZG | |
| | 195,005 | | | | 8.500 | | | | 06/25/30 | | | | 234,227 | |
| | FNMA REMIC Series 2005-59, Class KZ | |
| | 1,045,056 | | | | 5.500 | | | | 07/25/35 | | | | 1,165,016 | |
| | |
| | |
| 118 | | The accompanying notes are an integral part of these financial statements. |
GOLDMAN SACHS U.S. MORTGAGES FUND
| | | | | | | | | | | | | | |
Principal
Amount | | | Interest
Rate | | | Maturity
Date | | | Value | |
| Mortgage-Backed Obligations – (continued) | |
| Sequential Fixed Rate – (continued) | |
| | FNMA REMIC Series 2011-52, Class GB | |
| $ | 639,129 | | | | 5.000 | % | | | 06/25/41 | | | $ | 701,309 | |
| | FNMA REMIC Series 2011-99, Class DB | |
| | 699,217 | | | | 5.000 | | | | 10/25/41 | | | | 766,475 | |
| | FNMA REMIC Series 2012-111, Class B | |
| | 105,049 | | | | 7.000 | | | | 10/25/42 | | | | 120,836 | |
| | FNMA REMIC Series 2012-153, Class B | |
| | 413,350 | | | | 7.000 | | | | 07/25/42 | | | | 479,586 | |
| | GNMA REMIC Series 2017-139, Class IB(c) | |
| | 3,550,000 | | | | 4.500 | | | | 09/20/47 | | | | 580,231 | |
| | GNMA REMIC Series 2017-139, Class IM(c) | |
| | 2,375,000 | | | | 4.500 | | | | 09/20/47 | | | | 377,563 | |
| | | | | | | | | | | | | | |
| | | | | | | | | | | | | 5,107,478 | |
| | |
| Sequential Floating Rate – 0.5% | |
| | Bear Stearns ALT-A Trust Series 2005-5, Class 21A1 | |
| | 551,387 | | | | 3.385 | | | | 07/25/35 | | | | 558,218 | |
| Morgan Stanley Mortgage Loan Trust Series 2004-8AR,
Class 4A1 |
|
| | 408,456 | | | | 3.418 | | | | 10/25/34 | | | | 417,750 | |
| New Residential Mortgage Loan Trust Series 2015-1A,
Class A1(b) |
|
| | 388,073 | | | | 3.750 | | | | 05/28/52 | | | | 398,576 | |
| | | | | | | | | | | | | | |
| | | | | | | | | | | | | 1,374,544 | |
| | |
| TOTAL COLLATERALIZED
MORTGAGE OBLIGATIONS |
| | $ | 23,907,254 | |
| | |
| Commercial Mortgage-Backed Securities – 0.4% | |
| Sequential Floating Rate – 0.4% | |
| WF-RBS Commercial Mortgage Trust Series 2011-C2,
Class A4(b) |
|
| $ | 1,300,000 | | | | 4.869 | % | | | 02/15/44 | | | $ | 1,397,071 | |
| Citigroup Commercial Mortgage Trust Series 2008-C7,
Class A1A |
|
| | 395,832 | | | | 6.141 | | | | 12/10/49 | | | | 395,680 | |
| | Adjustable Rate Mortgage Trust Series 2004-5, Class 2A1 | |
| | 105,678 | | | | 3.493 | | | | 04/25/35 | | | | 107,264 | |
| | |
| TOTAL COMMERCIAL MORTGAGE-
BACKED SECURITIES |
| | $ | 1,900,015 | |
| | |
| Federal Agencies – 89.6% | |
| Adjustable Rate FHLMC – 0.1%(e) | |
| | (1 year CMT + 2.250%) | |
| $ | 49,664 | | | | 3.03 | % | | | 04/01/33 | | | $ | 52,356 | |
| | (1 year CMT + 2.228%) | |
| | 27,472 | | | | 2.786 | | | | 09/01/33 | | | | 28,973 | |
| | (1 year CMT + 2.107%) | |
| | 14,632 | | | | 2.62 | | | | 10/01/34 | | | | 15,469 | |
| | (1 year CMT + 2.250%) | |
| | 21,270 | | | | 2.844 | | | | 11/01/34 | | | | 22,499 | |
| | (1 year CMT + 2.250%) | |
| | 21,309 | | | | 3.088 | | | | 02/01/35 | | | | 22,514 | |
| | (1 year CMT + 2.250%) | |
| | 73,547 | | | | 3.033 | | | | 06/01/35 | | | | 77,672 | |
| | | | | | | | | | | | | | |
| | | | | | | | | | | | | 219,483 | |
| | |
| Mortgage-Backed Obligations – (continued) | |
| Adjustable Rate FNMA – 0.2%(e) | |
| | (COF + 1.250%) | |
| 2,195 | | | | 1.895 | | | | 07/01/22 | | | | 2,203 | |
| | (COF + 1.250%) | |
| | 10,502 | | | | 1.907 | | | | 07/01/27 | | | | 10,571 | |
| | (COF + 1.250%) | |
| | 11,625 | | | | 1.907 | | | | 11/01/27 | | | | 11,700 | |
| | (COF + 1.250%) | |
| | 5,525 | | | | 1.907 | | | | 01/01/31 | | | | 5,571 | |
| | (COF + 1.250%) | |
| | 7,190 | | | | 1.907 | | | | 06/01/32 | | | | 7,252 | |
| | (COF + 1.250%) | |
| | 7,325 | | | | 1.895 | | | | 08/01/32 | | | | 7,388 | |
| | (COF + 1.250%) | |
| | 24,329 | | | | 1.895 | | | | 05/01/33 | | | | 24,526 | |
| | (6M USD LIBOR + 1.414%) | |
| | 8,443 | | | | 2.809 | | | | 06/01/33 | | | | 8,708 | |
| | (1 year CMT + 2.250%) | |
| | 129,106 | | | | 3.25 | | | | 06/01/33 | | | | 135,851 | |
| | (1 year CMT + 2.210%) | |
| | 7,006 | | | | 3.146 | | | | 07/01/33 | | | | 7,376 | |
| | (COF + 1.250%) | |
| | 118,059 | | | | 1.898 | | | | 08/01/33 | | | | 118,969 | |
| | (6M USD LIBOR + 2.250%) | |
| | 454 | | | | 3.625 | | | | 09/01/33 | | | | 481 | |
| | (12M USD LIBOR + 1.641%) | |
| | 57,277 | | | | 3.17 | | | | 12/01/33 | | | | 60,128 | |
| | (6M USD LIBOR + 1.824%) | |
| | 891 | | | | 3.199 | | | | 12/01/33 | | | | 941 | |
| | (1 year CMT + 2.289%) | |
| | 1,887 | | | | 3.136 | | | | 04/01/34 | | | | 1,992 | |
| | (1 year CMT + 2.530%) | |
| | 191,426 | | | | 3.587 | | | | 08/01/34 | | | | 200,437 | |
| | (12M USD LIBOR + 1.670%) | |
| | 28,751 | | | | 3.18 | | | | 11/01/34 | | | | 30,229 | |
| | (1 year CMT + 2.196%) | |
| | 37,677 | | | | 2.88 | | | | 02/01/35 | | | | 39,758 | |
| | (12M USD LIBOR + 1.623%) | |
| | 51,595 | | | | 3.286 | | | | 03/01/35 | | | | 54,192 | |
| | (12M USD LIBOR + 1.810%) | |
| | 28,226 | | | | 3.56 | | | | 04/01/35 | | | | 29,737 | |
| | (12M USD LIBOR + 1.924%) | |
| | 42,014 | | | | 3.641 | | | | 05/01/35 | | | | 43,745 | |
| | (COF + 1.250%) | |
| | 4,725 | | | | 1.907 | | | | 11/01/35 | | | | 4,762 | |
| | (COF + 1.250%) | |
| | 29,823 | | | | 1.907 | | | | 12/01/37 | | | | 30,030 | |
| | (COF + 1.250%) | |
| | 17,551 | | | | 1.907 | | | | 01/01/38 | | | | 17,670 | |
| | (COF + 1.250%) | |
| | 14,685 | | | | 1.907 | | | | 11/01/40 | | | | 14,806 | |
| | | | | | | | | | | | | | |
| | | | | | | | | | | | | 869,023 | |
| | |
| Adjustable Rate GNMA (1 year CMT + 1.500%)(e) – 0.2% | |
| | 16,983 | | | | 2.625 | | | | 06/20/23 | | | | 17,199 | |
| | 8,419 | | | | 2.125 | | | | 07/20/23 | | | | 8,535 | |
| | 8,135 | | | | 2.125 | | | | 08/20/23 | | | | 8,248 | |
| | |
| | |
| The accompanying notes are an integral part of these financial statements. | | 119 |
GOLDMAN SACHS U.S. MORTGAGES FUND
Schedule of Investments (continued)
September 30, 2017 (Unaudited)
| | | | | | | | | | | | | | |
Principal
Amount | | | Interest
Rate | | | Maturity
Date | | | Value | |
| Mortgage-Backed Obligations – (continued) | |
| Adjustable Rate GNMA (1 year CMT + 1.500%)(e) – (continued) | |
| $ | 21,468 | | | | 2.125 | % | | | 09/20/23 | | | $ | 21,770 | |
| | 6,887 | | | | 2.375 | | | | 03/20/24 | | | | 6,979 | |
| | 59,941 | | | | 2.625 | | | | 04/20/24 | | | | 60,800 | |
| | 6,674 | | | | 2.625 | | | | 05/20/24 | | | | 6,771 | |
| | 59,175 | | | | 2.625 | | | | 06/20/24 | | | | 60,044 | |
| | 35,374 | | | | 2.125 | | | | 07/20/24 | | | | 35,927 | |
| | 48,529 | | | | 2.125 | | | | 08/20/24 | | | | 49,295 | |
| | 15,157 | | | | 2.125 | | | | 09/20/24 | | | | 15,398 | |
| | 19,327 | | | | 2.250 | | | | 11/20/24 | | | | 19,617 | |
| | 7,690 | | | | 2.250 | | | | 12/20/24 | | | | 7,807 | |
| | 13,394 | | | | 2.500 | | | | 12/20/24 | | | | 13,610 | |
| | 13,364 | | | | 2.375 | | | | 01/20/25 | | | | 13,562 | |
| | 7,553 | | | | 2.375 | | | | 02/20/25 | | | | 7,666 | |
| | 26,521 | | | | 2.625 | | | | 05/20/25 | | | | 26,951 | |
| | 21,979 | | | | 2.125 | | | | 07/20/25 | | | | 22,360 | |
| | 9,563 | | | | 2.375 | | | | 02/20/26 | | | | 9,726 | |
| | 517 | | | | 2.125 | | | | 07/20/26 | | | | 527 | |
| | 25,323 | | | | 2.375 | | | | 01/20/27 | | | | 25,775 | |
| | 9,390 | | | | 2.375 | | | | 02/20/27 | | | | 9,559 | |
| | 72,212 | | | | 2.625 | | | | 04/20/27 | | | | 73,595 | |
| | 7,279 | | | | 2.625 | | | | 05/20/27 | | | | 7,419 | |
| | 9,592 | | | | 2.625 | | | | 06/20/27 | | | | 9,784 | |
| | 3,748 | | | | 2.250 | | | | 11/20/27 | | | | 3,824 | |
| | 11,481 | | | | 2.250 | | | | 12/20/27 | | | | 11,707 | |
| | 25,331 | | | | 2.375 | | | | 01/20/28 | | | | 25,818 | |
| | 9,139 | | | | 2.375 | | | | 02/20/28 | | | | 9,316 | |
| | 10,292 | | | | 2.375 | | | | 03/20/28 | | | | 10,492 | |
| | 39,590 | | | | 2.125 | | | | 07/20/29 | | | | 40,493 | |
| | 25,255 | | | | 2.125 | | | | 08/20/29 | | | | 25,834 | |
| | 4,850 | | | | 2.125 | | | | 09/20/29 | | | | 4,961 | |
| | 22,106 | | | | 2.250 | | | | 10/20/29 | | | | 22,582 | |
| | 28,805 | | | | 2.250 | | | | 11/20/29 | | | | 29,438 | |
| | 6,267 | | | | 2.250 | | | | 12/20/29 | | | | 6,409 | |
| | 8,657 | | | | 2.375 | | | | 01/20/30 | | | | 8,844 | |
| | 3,971 | | | | 2.375 | | | | 02/20/30 | | | | 4,057 | |
| | 22,871 | | | | 2.375 | | | | 03/20/30 | | | | 23,368 | |
| | 26,436 | | | | 2.625 | | | | 04/20/30 | | | | 27,038 | |
| | 68,301 | | | | 2.625 | | | | 05/20/30 | | | | 69,866 | |
| | 6,659 | | | | 2.625 | | | | 06/20/30 | | | | 6,817 | |
| | 65,577 | | | | 2.125 | | | | 07/20/30 | | | | 67,143 | |
| | 9,846 | | | | 2.125 | | | | 09/20/30 | | | | 10,083 | |
| | 20,372 | | | | 2.250 | | | | 10/20/30 | | | | 20,840 | |
| | | | | | | | | | | | | | |
| | | | | | | | | | | | | 967,854 | |
| | |
| FHLMC – 9.0% | |
| | 613 | | | | 5.000 | | | | 10/01/17 | | | | 615 | |
| | 1,200 | | | | 5.000 | | | | 11/01/17 | | | | 1,229 | |
| | 1,499 | | | | 5.000 | | | | 12/01/17 | | | | 1,537 | |
| | 3,067 | | | | 5.000 | | | | 01/01/18 | | | | 3,127 | |
| | 7,454 | | | | 5.000 | | | | 02/01/18 | | | | 7,569 | |
| | 8,543 | | | | 5.000 | | | | 03/01/18 | | | | 8,700 | |
| | 10,126 | | | | 5.000 | | | | 04/01/18 | | | | 10,280 | |
| | 861 | | | | 4.500 | | | | 05/01/18 | | | | 880 | |
| | 8,781 | | | | 5.000 | | | | 05/01/18 | | | | 8,980 | |
| | 2,825 | | | | 5.000 | | | | 06/01/18 | | | | 2,872 | |
| | 3,109 | | | | 5.000 | | | | 07/01/18 | | | | 3,141 | |
| | |
| Mortgage-Backed Obligations – (continued) | |
| FHLMC – (continued) | |
| 944 | | | | 5.000 | | | | 08/01/18 | | | | 962 | |
| | 952 | | | | 5.000 | | | | 09/01/18 | | | | 970 | |
| | 5,752 | | | | 5.000 | | | | 10/01/18 | | | | 5,869 | |
| | 5,965 | | | | 5.000 | | | | 11/01/18 | | | | 6,073 | |
| | 3,506 | | | | 5.000 | | | | 12/01/18 | | | | 3,593 | |
| | 410 | | | | 5.000 | | | | 01/01/19 | | | | 421 | |
| | 195 | | | | 5.000 | | | | 02/01/19 | | | | 199 | |
| | 32,460 | | | | 5.500 | | | | 04/01/20 | | | | 33,340 | |
| | 182,473 | | | | 4.500 | | | | 08/01/23 | | | | 195,540 | |
| | 31,054 | | | | 7.000 | | | | 04/01/31 | | | | 34,064 | |
| | 473,915 | | | | 7.000 | | | | 09/01/31 | | | | 524,206 | |
| | 226,080 | | | | 7.000 | | | | 04/01/32 | | | | 265,510 | |
| | 319,757 | | | | 7.000 | | | | 05/01/32 | | | | 374,758 | |
| | 15,177 | | | | 4.500 | | | | 07/01/33 | | | | 16,386 | |
| | 382,719 | | | | 4.500 | | | | 08/01/33 | | | | 413,185 | |
| | 776,032 | | | | 4.500 | | | | 09/01/33 | | | | 837,802 | |
| | 75,292 | | | | 4.500 | | | | 10/01/33 | | | | 81,286 | |
| | 96,574 | | | | 5.000 | | | | 10/01/33 | | | | 105,680 | |
| | 11,580 | | | | 5.500 | | | | 12/01/33 | | | | 13,131 | |
| | 146,632 | | | | 5.500 | | | | 04/01/35 | | | | 163,570 | |
| | 4,715 | | | | 5.000 | | | | 07/01/35 | | | | 5,160 | |
| | 3,187 | | | | 4.500 | | | | 08/01/35 | | | | 3,428 | |
| | 13,362 | | | | 4.500 | | | | 09/01/35 | | | | 14,370 | |
| | 5,743 | | | | 4.500 | | | | 10/01/35 | | | | 6,165 | |
| | 111,074 | | | | 5.000 | | | | 12/01/35 | | | | 123,086 | |
| | 63,498 | | | | 5.500 | | | | 01/01/36 | | | | 71,250 | |
| | 194 | | | | 5.500 | | | | 02/01/36 | | | | 218 | |
| | 2,145 | | | | 5.000 | | | | 02/01/37 | | | | 2,377 | |
| | 32,212 | | | | 6.000 | | | | 08/01/37 | | | | 36,600 | |
| | 29,718 | | | | 6.000 | | | | 09/01/37 | | | | 33,773 | |
| | 12,963 | | | | 6.000 | | | | 10/01/37 | | | | 14,726 | |
| | 88,538 | | | | 6.000 | | | | 11/01/37 | | | | 100,596 | |
| | 94,189 | | | | 6.000 | | | | 12/01/37 | | | | 107,031 | |
| | 43,781 | | | | 4.500 | | | | 01/01/38 | | | | 47,123 | |
| | 3,270 | | | | 5.500 | | | | 01/01/38 | | | | 3,626 | |
| | 92,760 | | | | 6.000 | | | | 01/01/38 | | | | 105,441 | |
| | 25,634 | | | | 6.000 | | | | 02/01/38 | | | | 29,132 | |
| | 5,584 | | | | 6.000 | | | | 03/01/38 | | | | 6,350 | |
| | 29,529 | | | | 6.000 | | | | 04/01/38 | | | | 33,579 | |
| | 12,159 | | | | 6.000 | | | | 05/01/38 | | | | 13,830 | |
| | 1,760 | | | | 4.500 | | | | 06/01/38 | | | | 1,888 | |
| | 25,532 | | | | 6.000 | | | | 06/01/38 | | | | 29,028 | |
| | 18,665 | | | | 6.000 | | | | 07/01/38 | | | | 21,229 | |
| | 14,004 | | | | 6.000 | | | | 08/01/38 | | | | 15,887 | |
| | 68,803 | | | | 4.500 | | | | 09/01/38 | | | | 74,353 | |
| | 95,719 | | | | 6.000 | | | | 09/01/38 | | | | 108,729 | |
| | 21,507 | | | | 6.000 | | | | 10/01/38 | | | | 24,439 | |
| | 2,023 | | | | 6.000 | | | | 11/01/38 | | | | 2,292 | |
| | 1,464 | | | | 6.000 | | | | 12/01/38 | | | | 1,661 | |
| | 400 | | | | 4.500 | | | | 01/01/39 | | | | 429 | |
| | 76,771 | | | | 6.000 | | | | 01/01/39 | | | | 86,950 | |
| | 38,304 | | | | 4.500 | | | | 02/01/39 | | | | 41,213 | |
| | 9,309 | | | | 6.000 | | | | 02/01/39 | | | | 10,552 | |
| | 390,273 | | | | 7.000 | | | | 02/01/39 | | | | 454,293 | |
| | 14,528 | | | | 4.500 | | | | 03/01/39 | | | | 15,660 | |
| | 6,067 | | | | 6.000 | | | | 03/01/39 | | | | 6,871 | �� |
| | |
| | |
| 120 | | The accompanying notes are an integral part of these financial statements. |
GOLDMAN SACHS U.S. MORTGAGES FUND
| | | | | | | | | | | | | | |
Principal
Amount | | | Interest
Rate | | | Maturity
Date | | | Value | |
| Mortgage-Backed Obligations – (continued) | |
| FHLMC – (continued) | |
| $ | 4,002 | | | | 4.500 | % | | | 04/01/39 | | | $ | 4,314 | |
| | 2,769 | | | | 6.000 | | | | 04/01/39 | | | | 3,137 | |
| | 119,524 | | | | 4.500 | | | | 05/01/39 | | | | 128,838 | |
| | 279,307 | | | | 5.000 | | | | 05/01/39 | | | | 304,411 | |
| | 333,665 | | | | 4.500 | | | | 06/01/39 | | | | 359,663 | |
| | 8,713 | | | | 4.500 | | | | 07/01/39 | | | | 9,392 | |
| | 585,995 | | | | 5.000 | | | | 07/01/39 | | | | 642,214 | |
| | 8,628 | | | | 4.500 | | | | 08/01/39 | | | | 9,300 | |
| | 18,161 | | | | 4.500 | | | | 09/01/39 | | | | 19,576 | |
| | 4,330 | | | | 4.500 | | | | 10/01/39 | | | | 4,667 | |
| | 2,954 | | | | 4.500 | | | | 11/01/39 | | | | 3,185 | |
| | 9,789 | | | | 4.500 | | | | 12/01/39 | | | | 10,552 | |
| | 11,588 | | | | 4.500 | | | | 01/01/40 | | | | 12,491 | |
| | 7,712 | | | | 4.500 | | | | 04/01/40 | | | | 8,298 | |
| | 36,910 | | | | 6.000 | | | | 04/01/40 | | | | 41,889 | |
| | 12,837 | | | | 4.500 | | | | 05/01/40 | | | | 13,813 | |
| | 74,216 | | | | 6.000 | | | | 05/01/40 | | | | 84,277 | |
| | 24,059 | | | | 4.000 | | | | 06/01/40 | | | | 25,503 | |
| | 17,001 | | | | 4.500 | | | | 06/01/40 | | | | 18,292 | |
| | 12,326 | | | | 4.500 | | | | 07/01/40 | | | | 13,263 | |
| | 2,628 | | | | 4.500 | | | | 08/01/40 | | | | 2,828 | |
| | 27,533 | | | | 5.000 | | | | 08/01/40 | | | | 29,977 | |
| | 26,288 | | | | 5.000 | | | | 10/01/40 | | | | 28,938 | |
| | 255,971 | | | | 4.000 | | | | 02/01/41 | | | | 271,017 | |
| | 73,744 | | | | 4.500 | | | | 02/01/41 | | | | 79,419 | |
| | 12,807 | | | | 4.500 | | | | 03/01/41 | | | | 13,800 | |
| | 30,485 | | | | 4.500 | | | | 04/01/41 | | | | 32,850 | |
| | 30,228 | | | | 4.500 | | | | 05/01/41 | | | | 32,573 | |
| | 57,930 | | | | 4.500 | | | | 06/01/41 | | | | 62,424 | |
| | 3,351 | | | | 5.000 | | | | 06/01/41 | | | | 3,671 | |
| | 149,632 | | | | 4.500 | | | | 08/01/41 | | | | 161,239 | |
| | 159,642 | | | | 4.500 | | | | 09/01/41 | | | | 171,772 | |
| | 101,172 | | | | 4.000 | | | | 10/01/41 | | | | 107,973 | |
| | 18,814 | | | | 4.000 | | | | 11/01/41 | | | | 19,946 | |
| | 9,266 | | | | 4.500 | | | | 12/01/41 | | | | 9,984 | |
| | 983,835 | | | | 4.000 | | | | 03/01/42 | | | | 1,042,598 | |
| | 114,534 | | | | 4.500 | | | | 03/01/42 | | | | 123,419 | |
| | 58,566 | | | | 3.000 | | | | 05/01/42 | | | | 59,097 | |
| | 548,527 | | | | 3.500 | | | | 06/01/42 | | | | 569,167 | |
| | 1,249,960 | | | | 4.500 | | | | 06/01/42 | | | | 1,352,154 | |
| | 153,676 | | | | 3.000 | | | | 08/01/42 | | | | 155,242 | |
| | 189,212 | | | | 3.500 | | | | 08/01/42 | | | | 195,776 | |
| | 66,444 | | | | 3.000 | | | | 10/01/42 | | | | 67,142 | |
| | 389,793 | | | | 3.500 | | | | 10/01/42 | | | | 403,314 | |
| | 824,784 | | | | 3.000 | | | | 11/01/42 | | | | 834,256 | |
| | 285,555 | | | | 3.500 | | | | 11/01/42 | | | | 295,461 | |
| | 1,419,070 | | | | 3.000 | | | | 12/01/42 | | | | 1,435,368 | |
| | 2,561,049 | | | | 3.000 | | | | 01/01/43 | | | | 2,590,321 | |
| | 231,896 | | | | 3.000 | | | | 02/01/43 | | | | 234,088 | |
| | 3,344,586 | | | | 3.500 | | | | 04/01/43 | | | | 3,468,963 | |
| | 3,470,260 | | | | 3.500 | | | | 08/01/43 | | | | 3,594,797 | |
| | 1,499,765 | | | | 4.000 | | | | 08/01/43 | | | | 1,597,308 | |
| | 928,816 | | | | 4.000 | | | | 01/01/44 | | | | 983,418 | |
| | 954,029 | | | | 3.500 | | | | 02/01/44 | | | | 987,122 | |
| | 713,626 | | | | 3.500 | | | | 06/01/44 | | | | 741,167 | |
| | 25,344 | | | | 4.000 | | | | 11/01/44 | | | | 27,088 | |
| | |
| Mortgage-Backed Obligations – (continued) | |
| FHLMC – (continued) | |
| 113,880 | | | | 3.500 | | | | 02/01/45 | | | | 118,506 | |
| | 165,065 | | | | 3.500 | | | | 03/01/45 | | | | 171,719 | |
| | 933,769 | | | | 3.500 | | | | 06/01/45 | | | | 969,806 | |
| | 739,466 | | | | 3.500 | | | | 10/01/45 | | | | 767,774 | |
| | 7,181,840 | | | | 3.500 | | | | 03/01/46 | | | | 7,448,058 | |
| | 705,700 | | | | 3.500 | | | | 05/01/46 | | | | 731,502 | |
| | 4,950,980 | | | | 4.000 | | | | 04/01/47 | | | | 5,259,836 | |
| | | | | | | | | | | | | | |
| | | | | | | | | | | | | 43,748,763 | |
| | |
| FNMA – 46.1% | |
| | 71 | | | | 5.500 | | | | 01/01/18 | | | | 71 | |
| | 23 | | | | 5.500 | | | | 02/01/18 | | | | 24 | |
| | 8,588 | | | | 5.000 | | | | 03/01/18 | | | | 8,630 | |
| | 694 | | | | 5.500 | | | | 04/01/18 | | | | 699 | |
| | 307 | | | | 5.500 | | | | 05/01/18 | | | | 309 | |
| | 18,800 | | | | 5.000 | | | | 06/01/18 | | | | 18,968 | |
| | 1,067 | | | | 5.000 | | | | 09/01/18 | | | | 1,079 | |
| | 3 | | | | 7.000 | | | | 11/01/18 | | | | 3 | |
| | 207 | | | | 5.500 | | | | 02/01/19 | | | | 209 | |
| | 1,919 | | | | 5.500 | | | | 04/01/19 | | | | 1,942 | |
| | 208 | | | | 5.500 | | | | 05/01/19 | | | | 212 | |
| | 2,666 | | | | 5.500 | | | | 07/01/19 | | | | 2,718 | |
| | 10,421 | | | | 5.500 | | | | 08/01/19 | | | | 10,709 | |
| | 4,948 | | | | 5.500 | | | | 09/01/19 | | | | 5,093 | |
| | 8,786 | | | | 5.500 | | | | 10/01/19 | | | | 9,033 | |
| | 4,230 | | | | 5.500 | | | | 11/01/19 | | | | 4,366 | |
| | 2,851 | | | | 5.500 | | | | 12/01/19 | | | | 2,923 | |
| | 11,351 | | | | 5.500 | | | | 02/01/20 | | | | 11,662 | |
| | 29,889 | | | | 4.500 | | | | 03/01/20 | | | | 30,567 | |
| | 5,908 | | | | 5.500 | | | | 01/01/21 | | | | 6,127 | |
| | 10,455 | | | | 7.000 | | | | 09/01/21 | | | | 10,996 | |
| | 43,887 | | | | 7.000 | | | | 06/01/22 | | | | 47,374 | |
| | 17,282 | | | | 7.000 | | | | 07/01/22 | | | | 18,296 | |
| | 1,450 | | | | 4.500 | | | | 04/01/23 | | | | 1,523 | |
| | 397 | | | | 7.000 | | | | 01/01/29 | | | | 397 | |
| | 1,637 | | | | 7.000 | | | | 09/01/29 | | | | 1,682 | |
| | 4,917 | | | | 7.000 | | | | 08/01/31 | | | | 5,388 | |
| | 519 | | | | 7.000 | | | | 03/01/32 | | | | 602 | |
| | 1,329 | | | | 7.000 | | | | 04/01/32 | | | | 1,442 | |
| | 2,505 | | | | 7.000 | | | | 06/01/32 | | | | 2,552 | |
| | 323 | | | | 7.000 | | | | 07/01/32 | | | | 326 | |
| | 42,705 | | | | 6.000 | | | | 01/01/33 | | | | 48,808 | |
| | 1,858 | | | | 6.000 | | | | 02/01/33 | | | | 2,103 | |
| | 576 | | | | 5.500 | | | | 07/01/33 | | | | 641 | |
| | 16,468 | | | | 5.000 | | | | 08/01/33 | | | | 18,112 | |
| | 4,928 | | | | 5.500 | | | | 09/01/33 | | | | 5,498 | |
| | 16,768 | | | | 5.500 | | | | 02/01/34 | | | | 18,722 | |
| | 4,713 | | | | 5.500 | | | | 03/01/34 | | | | 5,263 | |
| | 8,419 | | | | 5.000 | | | | 04/01/34 | | | | 9,249 | |
| | 8,334 | | | | 5.500 | | | | 04/01/34 | | | | 9,301 | |
| | 30 | | | | 5.500 | | | | 06/01/34 | | | | 34 | |
| | 26,215 | | | | 5.500 | | | | 07/01/34 | | | | 29,260 | |
| | 5,142 | | | | 5.500 | | | | 08/01/34 | | | | 5,775 | |
| | 18,193 | | | | 5.500 | | | | 10/01/34 | | | | 20,309 | |
| | 3,465 | | | | 5.500 | | | | 11/01/34 | | | | 3,875 | |
| | 128,383 | | | | 5.500 | | | | 12/01/34 | | | | 143,479 | |
| | 134,208 | | | | 6.000 | | | | 04/01/35 | | | | 151,920 | |
| | |
| | |
| The accompanying notes are an integral part of these financial statements. | | 121 |
GOLDMAN SACHS U.S. MORTGAGES FUND
Schedule of Investments (continued)
September 30, 2017 (Unaudited)
| | | | | | | | | | | | | | |
Principal
Amount | | | Interest
Rate | | | Maturity
Date | | | Value | |
| Mortgage-Backed Obligations – (continued) | |
| FNMA – (continued) | |
| $ | 10,338 | | | | 5.500 | % | | | 05/01/35 | | | $ | 11,509 | |
| | 4,283 | | | | 5.500 | | | | 06/01/35 | | | | 4,786 | |
| | 5,280 | | | | 5.000 | | | | 07/01/35 | | | | 5,838 | |
| | 9,111 | | | | 5.500 | | | | 07/01/35 | | | | 10,192 | |
| | 4,996 | | | | 5.500 | | | | 08/01/35 | | | | 5,580 | |
| | 7,379 | | | | 5.500 | | | | 09/01/35 | | | | 8,267 | |
| | 226,057 | | | | 5.000 | | | | 10/01/35 | | | | 248,717 | |
| | 2,501 | | | | 5.500 | | | | 10/01/35 | | | | 2,781 | |
| | 75,960 | | | | 6.000 | | | | 10/01/35 | | | | 86,896 | |
| | 2,227 | | | | 5.500 | | | | 12/01/35 | | | | 2,503 | |
| | 1,881 | | | | 6.000 | | | | 12/01/35 | | | | 2,151 | |
| | 373,857 | | | | 5.000 | | | | 01/01/36 | | | | 411,332 | |
| | 93 | | | | 5.500 | | | | 02/01/36 | | | | 103 | |
| | 11,644 | | | | 5.500 | | | | 04/01/36 | | | | 12,973 | |
| | 2,299 | | | | 6.000 | | | | 04/01/36 | | | | 2,615 | |
| | 302,657 | | | | 4.500 | | | | 07/01/36 | | | | 326,633 | |
| | 22,118 | | | | 5.500 | | | | 07/01/36 | | | | 24,595 | |
| | 30,959 | | | | 4.500 | | | | 12/01/36 | | | | 33,402 | |
| | 2,590 | | | | 5.500 | | | | 02/01/37 | | | | 2,903 | |
| | 12,203 | | | | 5.500 | | | | 04/01/37 | | | | 13,730 | |
| | 58,267 | | | | 6.000 | | | | 04/01/37 | | | | 65,904 | |
| | 58,495 | | | | 5.000 | | | | 06/01/37 | | | | 64,861 | |
| | 176 | | | | 5.500 | | | | 06/01/37 | | | | 197 | |
| | 2,778 | | | | 5.500 | | | | 07/01/37 | | | | 3,114 | |
| | 353,992 | | | | 5.500 | | | | 08/01/37 | | | | 393,570 | |
| | 96,193 | | | | 6.500 | | | | 10/01/37 | | | | 112,784 | |
| | 40,959 | | | | 6.000 | | | | 11/01/37 | | | | 46,659 | |
| | 179 | | | | 5.500 | | | | 12/01/37 | | | | 201 | |
| | 357 | | | | 5.500 | | | | 02/01/38 | | | | 403 | |
| | 4,230 | | | | 5.500 | | | | 03/01/38 | | | | 4,742 | |
| | 62,512 | | | | 5.000 | | | | 04/01/38 | | | | 68,642 | |
| | 18,538 | | | | 5.500 | | | | 04/01/38 | | | | 20,847 | |
| | 4,443 | | | | 5.500 | | | | 05/01/38 | | | | 5,000 | |
| | 1,585 | | | | 5.500 | | | | 06/01/38 | | | | 1,777 | |
| | 802 | | | | 5.500 | | | | 07/01/38 | | | | 899 | |
| | 2,080 | | | | 5.500 | | | | 08/01/38 | | | | 2,332 | |
| | 1,868 | | | | 5.500 | | | | 09/01/38 | | | | 2,094 | |
| | 65,164 | | | | 6.000 | | | | 09/01/38 | | | | 74,333 | |
| | 14,755 | | | | 5.500 | | | | 12/01/38 | | | | 16,416 | |
| | 561,386 | | | | 5.000 | | | | 01/01/39 | | | | 623,391 | |
| | 113,211 | | | | 6.000 | | | | 01/01/39 | | | | 129,242 | |
| | 229,398 | | | | 6.500 | | | | 01/01/39 | | | | 269,253 | |
| | 331,943 | | | | 4.500 | | | | 02/01/39 | | | | 358,270 | |
| | 5,156 | | | | 5.500 | | | | 02/01/39 | | | | 5,805 | |
| | 6,628 | | | | 4.500 | | | | 03/01/39 | | | | 7,228 | |
| | 254,208 | | | | 7.000 | | | | 03/01/39 | | | | 294,561 | |
| | 10,022 | | | | 4.500 | | | | 05/01/39 | | | | 10,928 | |
| | 7,368 | | | | 5.500 | | | | 06/01/39 | | | | 8,259 | |
| | 7,135 | | | | 4.500 | | | | 07/01/39 | | | | 7,780 | |
| | 6,282 | | | | 4.000 | | | | 08/01/39 | | | | 6,658 | |
| | 16,769 | | | | 4.500 | | | | 09/01/39 | | | | 18,099 | |
| | 22,239 | | | | 4.500 | | | | 10/01/39 | | | | 24,003 | |
| | 6,294 | | | | 5.500 | | | | 11/01/39 | | | | 7,058 | |
| | 54,302 | | | | 4.500 | | | | 02/01/40 | | | | 59,231 | |
| | 8,638 | | | | 4.500 | | | | 03/01/40 | | | | 9,323 | |
| | 14,933 | | | | 3.500 | | | | 04/01/40 | | | | 15,487 | |
| | |
| Mortgage-Backed Obligations – (continued) | |
| FNMA – (continued) | |
| 122,400 | | | | 4.500 | | | | 04/01/40 | | | | 131,865 | |
| | 44,381 | | | | 4.500 | | | | 06/01/40 | | | | 48,424 | |
| | 412,977 | | | | 5.000 | | | | 06/01/40 | | | | 451,469 | |
| | 30,297 | | | | 5.000 | | | | 07/01/40 | | | | 33,121 | |
| | 8,669 | | | | 4.500 | | | | 09/01/40 | | | | 9,461 | |
| | 19,743 | | | | 3.500 | | | | 12/01/40 | | | | 20,476 | |
| | 7,696 | | | | 4.500 | | | | 12/01/40 | | | | 8,291 | |
| | 135,200 | | | | 4.500 | | | | 01/01/41 | | | | 146,079 | |
| | 36,535 | | | | 4.500 | | | | 04/01/41 | | | | 39,452 | |
| | 61,223 | | | | 4.500 | | | | 06/01/41 | | | | 66,047 | |
| | 49,952 | | | | 4.500 | | | | 07/01/41 | | | | 53,910 | |
| | 236,693 | | | | 4.500 | | | | 08/01/41 | | | | 255,549 | |
| | 229,733 | | | | 4.500 | | | | 09/01/41 | | | | 248,213 | |
| | 203,423 | | | | 3.500 | | | | 10/01/41 | | | | 211,035 | |
| | 183,832 | | | | 4.500 | | | | 10/01/41 | | | | 198,395 | |
| | 106,960 | | | | 3.500 | | | | 11/01/41 | | | | 110,900 | |
| | 156,366 | | | | 4.500 | | | | 11/01/41 | | | | 168,753 | |
| | 199,177 | | | | 3.500 | | | | 12/01/41 | | | | 206,382 | |
| | 81,804 | | | | 4.500 | | | | 12/01/41 | | | | 88,249 | |
| | 187,535 | | | | 3.500 | | | | 01/01/42 | | | | 194,729 | |
| | 102,596 | | | | 4.500 | | | | 01/01/42 | | | | 110,682 | |
| | 376,162 | | | | 3.500 | | | | 02/01/42 | | | | 389,708 | |
| | 446,844 | | | | 3.500 | | | | 03/01/42 | | | | 462,929 | |
| | 879,769 | | | | 4.000 | | | | 03/01/42 | | | | 932,200 | |
| | 20,910 | | | | 4.500 | | | | 03/01/42 | | | | 22,560 | |
| | 85,322 | | | | 3.500 | | | | 04/01/42 | | | | 88,404 | |
| | 160,243 | | | | 4.000 | | | | 04/01/42 | | | | 169,793 | |
| | 32,977 | | | | 4.500 | | | | 04/01/42 | | | | 35,489 | |
| | 33,973 | | | | 3.500 | | | | 05/01/42 | | | | 35,195 | |
| | 608,912 | | | | 3.500 | | | | 06/01/42 | | | | 631,023 | |
| | 553,791 | | | | 3.500 | | | | 07/01/42 | | | | 573,466 | |
| | 517,752 | | | | 3.500 | | | | 08/01/42 | | | | 536,095 | |
| | 121,213 | | | | 3.000 | | | | 09/01/42 | | | | 122,349 | |
| | 439,522 | | | | 3.500 | | | | 09/01/42 | | | | 455,228 | |
| | 454,930 | | | | 3.500 | | | | 10/01/42 | | | | 472,076 | |
| | 33,607 | | | | 3.500 | | | | 11/01/42 | | | | 34,765 | |
| | 749,660 | | | | 4.500 | | | | 11/01/42 | | | | 816,778 | |
| | 700,482 | | | | 3.000 | | | | 12/01/42 | | | | 707,190 | |
| | 1,193,222 | | | | 3.500 | | | | 12/01/42 | | | | 1,236,567 | |
| | 154,884 | | | | 3.000 | | | | 01/01/43 | | | | 156,722 | |
| | 17,308 | | | | 3.500 | | | | 01/01/43 | | | | 17,905 | |
| | 58,897 | | | | 3.000 | | | | 02/01/43 | | | | 59,596 | |
| | 930,872 | | | | 3.500 | | | | 02/01/43 | | | | 964,757 | |
| | 1,445,901 | | | | 3.000 | | | | 03/01/43 | | | | 1,463,521 | |
| | 1,905,636 | | | | 3.500 | | | | 03/01/43 | | | | 1,976,180 | |
| | 1,581,505 | | | | 3.000 | | | | 04/01/43 | | | | 1,600,779 | |
| | 2,081,329 | | | | 3.500 | | | | 04/01/43 | | | | 2,155,447 | |
| | 647,861 | | | | 2.500 | | | | 05/01/43 | | | | 632,133 | |
| | 1,941,133 | | | | 3.000 | | | | 05/01/43 | | | | 1,964,790 | |
| | 1,189,068 | | | | 3.500 | | | | 05/01/43 | | | | 1,232,007 | |
| | 64,587 | | | | 3.000 | | | | 06/01/43 | | | | 65,375 | |
| | 1,276,770 | | | | 3.500 | | | | 06/01/43 | | | | 1,324,447 | |
| | 585,735 | | | | 3.000 | | | | 07/01/43 | | | | 592,874 | |
| | 10,226,674 | | | | 3.500 | | | | 07/01/43 | | | | 10,592,029 | |
| | 3,583,523 | | | | 3.500 | | | | 08/01/43 | | | | 3,711,743 | |
| | 70,088 | | | | 3.500 | | | | 09/01/43 | | | | 72,842 | |
| | 213,352 | | | | 3.500 | | | | 11/01/43 | | | | 221,032 | |
| | |
| | |
| 122 | | The accompanying notes are an integral part of these financial statements. |
GOLDMAN SACHS U.S. MORTGAGES FUND
| | | | | | | | | | | | | | |
Principal
Amount | | | Interest
Rate | | | Maturity
Date | | | Value | |
| Mortgage-Backed Obligations – (continued) | |
| FNMA – (continued) | |
| $ | 1,003,464 | | | | 3.500 | % | | | 01/01/44 | | | $ | 1,038,891 | |
| | 69,771 | | | | 3.500 | | | | 08/01/44 | | | | 72,082 | |
| | 156,121 | | | | 3.500 | | | | 09/01/44 | | | | 161,812 | |
| | 179,717 | | | | 3.500 | | | | 10/01/44 | | | | 187,621 | |
| | 74,334 | | | | 4.000 | | | | 10/01/44 | | | | 78,477 | |
| | 27,949 | | | | 3.500 | | | | 12/01/44 | | | | 28,938 | |
| | 77,582 | | | | 5.000 | | | | 12/01/44 | | | | 85,057 | |
| | 47,370 | | | | 3.500 | | | | 01/01/45 | | | | 49,299 | |
| | 347,157 | | | | 3.500 | | | | 02/01/45 | | | | 360,746 | |
| | 740,663 | | | | 4.000 | | | | 02/01/45 | | | | 785,536 | |
| | 319,159 | | | | 3.500 | | | | 03/01/45 | | | | 331,676 | |
| | 586,894 | | | | 4.000 | | | | 03/01/45 | | | | 623,644 | |
| | 465,334 | | | | 3.500 | | | | 04/01/45 | | | | 483,184 | |
| | 294,748 | | | | 4.000 | | | | 04/01/45 | | | | 313,389 | |
| | 3,052,500 | | | | 4.500 | | | | 04/01/45 | | | | 3,341,057 | |
| | 1,261,651 | | | | 3.500 | | | | 05/01/45 | | | | 1,316,356 | |
| | 357,939 | | | | 4.500 | | | | 05/01/45 | | | | 391,832 | |
| | 119,712 | | | | 3.500 | | | | 06/01/45 | | | | 124,304 | |
| | 68,766 | | | | 3.500 | | | | 07/01/45 | | | | 71,403 | |
| | 45,603 | | | | 3.500 | | | | 09/01/45 | | | | 47,360 | |
| | 117,969 | | | | 3.500 | | | | 10/01/45 | | | | 122,457 | |
| | 83,299 | | | | 3.500 | | | | 11/01/45 | | | | 86,468 | |
| | 987,807 | | | | 4.000 | | | | 11/01/45 | | | | 1,041,191 | |
| | 43,475 | | | | 3.500 | | | | 12/01/45 | | | | 45,130 | |
| | 126,183 | | | | 3.500 | | | | 01/01/46 | | | | 130,984 | |
| | 1,020,159 | | | | 3.500 | | | | 03/01/46 | | | | 1,064,074 | |
| | 158,774 | | | | 3.500 | | | | 04/01/46 | | | | 165,510 | |
| | 1,086,513 | | | | 3.500 | | | | 05/01/46 | | | | 1,125,475 | |
| | 1,923,858 | | | | 3.500 | | | | 06/01/56 | | | | 1,981,548 | |
| | 5,191,762 | | | | 3.500 | | | | 07/01/56 | | | | 5,344,676 | |
| | 6,720,492 | | | | 4.000 | | | | 07/01/56 | | | | 7,115,993 | |
| | 12,459,963 | | | | 3.500 | | | | 08/01/56 | | | | 12,828,017 | |
| | 5,914,689 | | | | 3.500 | | | | 10/01/56 | | | | 6,105,933 | |
| | 38,000,000 | | | | 3.000 | | | | TBA-30yr | (d) | | | 38,118,750 | |
| | 7,000,000 | | | | 3.500 | | | | TBA-30yr | (d) | | | 7,216,016 | |
| | 74,000,000 | | | | 4.000 | | | | TBA-30yr | (d) | | | 77,902,346 | |
| | 8,000,000 | | | | 4.500 | | | | TBA-30yr | (d) | | | 8,586,250 | |
| | 1,000,000 | | | | 5.000 | | | | TBA-30yr | (d) | | | 1,091,094 | |
| | | | | | | | | | | | | | |
| | | | | | | | | | | | | 223,927,180 | |
| | |
| GNMA – 34.0% | |
| | 24,741 | | | | 5.500 | | | | 07/15/20 | | | | 25,429 | |
| | 6,095 | | | | 6.000 | | | | 04/15/26 | | | | 6,870 | |
| | 206 | | | | 6.500 | | | | 01/15/32 | | | | 227 | |
| | 1,105 | | | | 6.500 | | | | 02/15/32 | | | | 1,220 | |
| | 496,101 | | | | 5.500 | | | | 04/15/33 | | | | 551,888 | |
| | 5,816 | | | | 5.000 | | | | 11/15/33 | | | | 6,415 | |
| | 1,247 | | | | 6.500 | | | | 08/15/34 | | | | 1,417 | |
| | 1,377 | | | | 6.500 | | | | 02/15/36 | | | | 1,590 | |
| | 3,377 | | | | 6.500 | | | | 03/15/36 | | | | 3,902 | |
| | 4,520 | | | | 6.500 | | | | 04/15/36 | | | | 5,112 | |
| | 14,954 | | | | 6.500 | | | | 05/15/36 | | | | 17,277 | |
| | 8,504 | | | | 6.500 | | | | 06/15/36 | | | | 9,826 | |
| | 55,125 | | | | 6.500 | | | | 07/15/36 | | | | 62,996 | |
| | 50,753 | | | | 6.500 | | | | 08/15/36 | | | | 58,266 | |
| | 88,091 | | | | 6.500 | | | | 09/15/36 | | | | 101,148 | |
| | |
| Mortgage-Backed Obligations – (continued) | |
| GNMA – (continued) | |
| 37,771 | | | | 6.500 | | | | 10/15/36 | | | | 43,548 | |
| | 54,908 | | | | 6.500 | | | | 11/15/36 | | | | 62,809 | |
| | 24,281 | | | | 6.500 | | | | 12/15/36 | | | | 27,881 | |
| | 12,584 | | | | 6.500 | | | | 01/15/37 | | | | 14,566 | |
| | 2,300 | | | | 6.500 | | | | 03/15/37 | | | | 2,660 | |
| | 5,725 | | | | 6.500 | | | | 04/15/37 | | | | 6,631 | |
| | 3,854 | | | | 6.500 | | | | 05/15/37 | | | | 4,254 | |
| | 2,878 | | | | 6.500 | | | | 08/15/37 | | | | 3,330 | |
| | 15,343 | | | | 6.500 | | | | 09/15/37 | | | | 17,677 | |
| | 14,477 | | | | 6.500 | | | | 10/15/37 | | | | 17,110 | |
| | 8,878 | | | | 6.500 | | | | 11/15/37 | | | | 10,150 | |
| | 4,988 | | | | 6.500 | | | | 05/15/38 | | | | 5,761 | |
| | 3,282 | | | | 6.500 | | | | 11/15/38 | | | | 3,791 | |
| | 3,067 | | | | 6.500 | | | | 02/15/39 | | | | 3,541 | |
| | 127,509 | | | | 4.500 | | | | 12/20/39 | | | | 138,168 | |
| | 503,577 | | | | 5.000 | | | | 01/20/40 | | | | 543,340 | |
| | 34,315 | | | | 4.500 | | | | 02/20/40 | | | | 37,183 | |
| | 576,239 | | | | 4.500 | | | | 05/15/40 | | | | 618,772 | |
| | 95,943 | | | | 4.500 | | | | 05/20/40 | | | | 103,963 | |
| | 363,069 | | | | 5.000 | | | | 07/15/40 | | | | 399,024 | |
| | 175,889 | | | | 3.500 | | | | 09/15/42 | | | | 183,934 | |
| | 12,349,050 | | | | 4.000 | | | | 10/20/43 | | | | 13,105,429 | |
| | 425,322 | | | | 3.500 | | | | 02/15/45 | | | | 442,966 | |
| | 134,151 | | | | 4.000 | | | | 05/20/45 | | | | 142,242 | |
| | 105,535 | | | | 4.000 | | | | 07/20/45 | | | | 111,900 | |
| | 5,044,786 | | | | 4.000 | | | | 08/20/45 | | | | 5,344,320 | |
| | 2,965,719 | | | | 4.500 | | | | 08/20/45 | | | | 3,180,850 | |
| | 6,091,395 | | | | 4.000 | | | | 09/20/45 | | | | 6,453,071 | |
| | 8,347,422 | | | | 4.000 | | | | 10/20/45 | | | | 8,843,051 | |
| | 772,981 | | | | 4.500 | | | | 10/20/45 | | | | 829,052 | |
| | 2,466,756 | | | | 4.000 | | | | 11/20/45 | | | | 2,613,220 | |
| | 3,951,144 | | | | 4.000 | | | | 01/20/46 | | | | 4,180,804 | |
| | 7,194,524 | | | | 4.000 | | | | 02/20/46 | | | | 7,612,706 | |
| | 8,922,596 | | | | 4.000 | | | | 03/20/46 | | | | 9,441,222 | |
| | 2,424,551 | | | | 4.500 | | | | 03/20/46 | | | | 2,602,699 | |
| | 1,975,076 | | | | 4.000 | | | | 04/20/46 | | | | 2,089,877 | |
| | 263,910 | | | | 4.000 | | | | 05/20/46 | | | | 279,250 | |
| | 113,627 | | | | 4.500 | | | | 06/20/46 | | | | 122,295 | |
| | 45,905 | | | | 4.500 | | | | 07/20/46 | | | | 49,407 | |
| | 41,742 | | | | 4.500 | | | | 08/20/46 | | | | 44,927 | |
| | 16,666,738 | | | | 4.000 | | | | 05/20/47 | | | | 17,586,012 | |
| | 24,624,718 | | | | 4.000 | | | | 06/20/47 | | | | 26,089,478 | |
| | 6,963,389 | | | | 4.000 | | | | 07/20/47 | | | | 7,344,896 | |
| | 997,785 | | | | 4.000 | | | | 08/20/47 | | | | 1,055,002 | |
| | 6,000,000 | | | | 4.000 | | | | 09/20/47 | | | | 6,328,726 | |
| | 16,000,000 | | | | 3.000 | | | | TBA-30yr | (d) | | | 16,223,750 | |
| | 19,000,000 | | | | 4.000 | | | | TBA-30yr | (d) | | | 19,990,820 | |
| | | | | | | | | | | | | | |
| | | | | | | | | | | | $ | 165,209,648 | |
| | |
| | TOTAL FEDERAL AGENCIES | | | $ | 434,941,951 | |
| | |
| TOTAL MORTGAGE-BACKED
OBLIGATIONS (Cost $460,814,075) |
| | $ | 460,749,220 | |
| | |
| | |
| The accompanying notes are an integral part of these financial statements. | | 123 |
GOLDMAN SACHS U.S. MORTGAGES FUND
Schedule of Investments (continued)
September 30, 2017 (Unaudited)
| | | | | | | | | | | | | | |
Principal
Amount | | | Interest
Rate | | | Maturity
Date | | | Value | |
| Asset-Backed Securities(e) – 11.0% | |
| Collateralized Loan Obligations(b) – 4.7% | |
| Cedar Funding V CLO Ltd. Series 2016-5A, Class A1
(3M USD LIBOR + 1.610%) |
|
| $ | 2,600,000 | | | | 2.768 | % | | | 07/17/28 | | | $ | 2,622,095 | |
| Cent CLO Ltd. Series 2014-22A, Class A1R
(3M USD LIBOR + 1.410%) |
|
| | 1,750,000 | | | | 2.589 | | | | 11/07/26 | | | | 1,753,717 | |
| Cutwater Ltd. Series 2014-1A, Class A1AR
(3M USD LIBOR + 1.250%) |
|
| | 1,400,000 | | | | 2.469 | | | | 07/15/26 | | | | 1,402,775 | |
| Halcyon Loan Advisors Funding Ltd. Series 2015-2A, Class A
(3M USD LIBOR + 1.390%) |
|
| | 1,450,000 | | | | 2.546 | | | | 07/25/27 | | | | 1,448,138 | |
| Madison Park Funding XII Ltd. Series 2014-12A, Class AR
(3M USD LIBOR + 1.260%) |
|
| | 1,550,000 | | | | 2.416 | | | | 07/20/26 | | | | 1,559,624 | |
| Mountain View CLO Ltd. Series 2014-1A, Class AR
(3M USD LIBOR + 1.240%) |
|
| | 2,000,000 | | | | 2.398 | | | | 10/15/26 | | | | 2,004,986 | |
| OCP CLO Ltd. Series 2014-5A, Class A1
(3M USD LIBOR + 1.000%) |
|
| | 1,600,000 | | | | 2.167 | | | | 04/26/26 | | | | 1,603,278 | |
| OFSI Fund VI Ltd. Series 2014-6A, Class A1
(3M USD LIBOR + 1.030%) |
|
| | 2,100,000 | | | | 2.188 | | | | 03/20/25 | | | | 2,085,128 | |
| Parallel Ltd. Series 2015-1A, Class A
(3M USD LIBOR + 1.450%) |
|
| | 1,050,000 | | | | 2.606 | | | | 07/20/27 | | | | 1,050,365 | |
| Shackleton CLO Ltd. Series 2014-5A, Class AR
(3M USD LIBOR + 1.140%) |
|
| | 1,600,000 | | | | 2.319 | | | | 05/07/26 | | | | 1,602,309 | |
| Thacher Park CLO Ltd. Series 2014-1A, Class AR
(3M USD LIBOR + 1.160%) |
|
| | 2,450,000 | | | | 2.153 | | | | 10/20/26 | | | | 2,461,958 | |
| Trinitas CLO III Ltd. Series 2015-3A, Class A2
(3M USD LIBOR + 1.510%) |
|
| | 1,800,000 | | | | 2.668 | | | | 07/15/27 | | | | 1,801,377 | |
| Z Capital Credit Partners CLO Ltd. Series 2015-1A, Class A1
(3M USD LIBOR + 1.330%) |
|
| | 1,292,110 | | | | 2.634 | | | | 07/16/27 | | | | 1,295,550 | |
| | | | | | | | | | | | | | |
| | | | | 22,691,300 | |
| | |
| Home Equity – 0.0% | |
| Countrywide Home Equity Loan Trust Series 2004-O, Class 1A
(1M USD LIBOR + 0.280%) |
|
| | 60,010 | | | | 1.507 | | | | 02/15/34 | | | | 54,573 | |
| | |
| Student Loan – 6.3% | |
| Brazos Education Loan Authority, Inc. Series 2012-1, Class A1
(1M USD LIBOR + 0.700%) |
|
| | 456,096 | | | | 1.934 | | | | 12/26/35 | | | | 456,096 | |
| ECMC Group Student Loan Trust Series 2017-1A, Class A
(1M USD LIBOR + 1.200%)(b) |
|
| | 3,827,017 | | | | 2.434 | | | | 12/27/66 | | | | 3,830,389 | |
| Education Loan Asset-Backed Trust I Series 2013-1, Class A1
(1M USD LIBOR + 0.800%)(b) |
|
| | 820,490 | | | | 2.034 | | | | 06/25/26 | | | | 821,345 | |
| | |
| Asset-Backed Securities(e) – (continued) | |
| Student Loan – (continued) | |
| Goal Capital Funding Trust Series 2007-1, Class A3
(3M USD LIBOR + 0.090%) |
|
| 35,645 | | | | 1.386 | | | | 09/25/28 | | | | 35,630 | |
| Goal Capital Funding Trust Series 2010-1, Class A
(3M USD LIBOR + 0.700%)(b) |
|
| | 2,006,768 | | | | 1.889 | | | | 08/25/48 | | | | 1,989,410 | |
| Higher Education Funding I Series 2014-1, Class A
(3M USD LIBOR + 1.050%)(b) |
|
| | 1,454,597 | | | | 2.239 | | | | 05/25/34 | | | | 1,448,774 | |
| Illinois Student Assistance Commission Series 2010-1, Class A3
(3M USD LIBOR + 0.900%) |
|
| | 1,000,000 | | | | 2.056 | | | | 07/25/45 | | | | 1,003,259 | |
| Montana Higher Education Student Assistance Corp.
Series 2012-1, Class A3 (1M USD LIBOR + 1.050%) |
|
| | 950,000 | | | | 2.281 | | | | 07/20/43 | | | | 949,075 | |
| Nelnet Student Loan Trust Series 2006-1, Class A6
(3M USD LIBOR + 0.450%)(b) |
|
| | 1,700,000 | | | | 1.636 | | | | 08/23/36 | | | | 1,654,972 | |
| Nelnet Student Loan Trust Series 2006-2, Class A5
(3M USD LIBOR + 0.100%) |
|
| | 1,238,936 | | | | 1.256 | | | | 01/25/30 | | | | 1,237,307 | |
| North Carolina State Education Assistance Authority
Series 2010-1, Class A1 (3M USD LIBOR + 0.900%) |
|
| | 669,095 | | | | 2.056 | | | | 07/25/41 | | | | 666,740 | |
| Panhandle-Plains Higher Education Authority, Inc. Series 2011-1,
Class A3 (3M USD LIBOR + 0.950%) |
|
| | 700,000 | | | | 2.098 | | | | 10/01/37 | | | | 702,430 | |
| Panhandle-Plains Higher Education Authority, Inc. Series 2011-2,
Class A3 (3M USD LIBOR + 0.850%) |
|
| | 1,100,000 | | | | 1.998 | | | | 07/01/32 | | | | 1,089,792 | |
| PHEAA Student Loan Trust Series 2016-1A, Class A
(1M USD LIBOR + 1.150%)(b) |
|
| | 1,297,239 | | | | 2.384 | | | | 09/25/65 | | | | 1,320,285 | |
| PHEAA Student Loan Trust Series 2016-2A, Class A
(1M USD LIBOR + 0.950%)(b) |
|
| | 1,537,363 | | | | 2.184 | | | | 11/25/65 | | | | 1,541,154 | |
| SLM Student Loan Trust Series 2004-8A, Class A6
(3M USD LIBOR + 0.630%)(b) |
|
| | 800,000 | | | | 1.786 | | | | 01/25/40 | | | | 800,235 | |
| SLM Student Loan Trust Series 2005-5, Class A4
(3M USD LIBOR + 0.140%) |
|
| | 5,300,000 | | | | 1.296 | | | | 10/25/28 | | | | 5,273,788 | |
| SLM Student Loan Trust Series 2005-5, Class A5(3M USD
LIBOR + 0.750%) |
|
| | 350,000 | | | | 1.906 | | | | 10/25/40 | | | | 345,074 | |
| SLM Student Loan Trust Series 2006-2, Class A5(3M USD
LIBOR + 0.110%) |
|
| | 778,730 | | | | 1.266 | | | | 07/25/25 | | | | 778,691 | |
| SLM Student Loan Trust Series 2014-2, Class A2(1M USD
LIBOR + 0.350%) |
|
| | 156,832 | | | | 1.584 | | | | 10/25/21 | | | | 156,949 | |
| South Carolina Student Loan Corp. Series 2010-1, Class A3(3M
USD LIBOR + 1.050%) |
|
| | 1,850,000 | | | | 2.206 | | | | 10/27/36 | | | | 1,874,547 | |
| | |
| | |
| 124 | | The accompanying notes are an integral part of these financial statements. |
GOLDMAN SACHS U.S. MORTGAGES FUND
| | | | | | | | | | | | | | |
Principal
Amount | | | Interest
Rate | | | Maturity
Date | | | Value | |
| Asset-Backed Securities(e) – (continued) | |
| Student Loan – (continued) | |
| Utah State Board of Regents Series 2016-1, Class A(1M USD
LIBOR + 0.750%) |
|
| $ | 2,895,600 | | | | 1.984 | % | | | 09/25/56 | | | $ | 2,896,007 | |
| | | | | | | | | | | | | | |
| | | | | 30,871,949 | |
| | |
| TOTAL ASSET-BACKED SECURITIES
(Cost $53,218,351) |
| | $ | 53,617,822 | |
| | |
| | | | | | | | | | | | | | |
| Municipal Debt Obligation(c) – 0.2% | |
| New Hampshire – 0.2% | |
| New Hampshire Higher Education Loan Corp. Series 2011-1,
Class A3 |
|
| $ | 1,150,000 | | | | 2.164 | % | | | 10/25/37 | | | $ | 1,124,861 | |
| | (Cost $1,139,813) | |
| | |
| | | | | | | | | | | | | | |
| U.S. Treasury Obligations – 1.3% | |
| | United States Treasury Bonds | |
| | 3,900,000 | | | | 2.875 | % | | | 11/15/46 | | | $ | 3,914,430 | |
| | United States Treasury Notes | |
| | 2,490,000 | | | | 2.000 | | | | 09/30/24 | | | | 2,483,950 | |
| | |
| TOTAL U.S. TREASURY
OBLIGATIONS (Cost $6,476,173) |
| | $ | 6,398,380 | |
| | |
| | | | | | | | |
| Shares | | Distribution
Rate | | | Value | |
| Investment Company(f) – 25.4% | |
Goldman Sachs Financial Square Government Fund – Institutional Shares | |
| 123,356,139 | | | 0.927 | % | | $ | 123,356,139 | |
| (Cost $123,356,139) | |
| |
| TOTAL INVESTMENTS – 132.8% | |
| (Cost $645,004,551) | | | $ | 645,246,422 | |
| |
OTHER LIABILITIES IN EXCESS OF
OTHER ASSETS – (32.8)% | | | | (159,524,917 | ) |
| |
| NET ASSETS – 100.0% | | | $ | 485,721,505 | |
| |
| | |
| | The percentage shown for each investment category reflects the value of investments in that category as a percentage of net assets. |
(a) | | Security with a notional or nominal principal amount. The actual effective yield of this security is different than the stated interest rate. |
(b) | | Exempt from registration under Rule 144A of the Securities Act of 1933. Such securities may be deemed liquid by the investment adviser and may be resold, normally to qualified institutional buyers in transactions exempt from registration. Total market value of Rule 144A securities amounts to $44,716,377, which represents approximately 9.2% of net assets as of September 30, 2017. |
(c) | | Security with “Call” features with resetting interest rates. Maturity dates disclosed are the final maturity dates. |
(d) | | TBA (To Be Announced) Securities are purchased on a forward commitment basis with an approximate principal amount and no defined maturity date. The actual principal and maturity date will be determined upon settlement when the specific mortgage pools are assigned. Total market value of TBA securities (excluding forward sales contracts, if any) amounts to $169,129,026 which represents approximately 34.8% of net assets as of September 30, 2017. |
(e) | | Variable rate security. Interest rate or distribution rate disclosed is that which is in effect on September 30, 2017. |
(f) | | Represents an Affiliated Issuer. |
| | |
Currency Abbreviations: |
USD | | —U.S. Dollar |
| | |
Investment Abbreviations: |
CLO | | —Collateralized Loan Obligation |
CMT | | —Constant Maturity Treasury Indexes |
COF | | —Cost of Funds |
FHLMC | | —Federal Home Loan Mortgage Corp. |
FNMA | | —Federal National Mortgage Association |
GNMA | | —Government National Mortgage Association |
LIBOR | | —London Interbank Offered Rate |
LLC | | —Limited Liability Company |
OTC | | —Over the Counter |
PI | | —Private Investment |
PLC | | —Public Limited Company |
REMIC | | —Real Estate Mortgage Investment Conduit |
STRIPS | | —Separate Trading of Registered Interest and Principal of Securities |
|
|
| ADDITIONAL INVESTMENT INFORMATION |
FORWARD SALES CONTRACTS — At September 30, 2017, the Fund had the following forward sales contracts:
| | | | | | | | | | | | | | | | | | | | |
| Description | | Interest
Rate | | | Maturity
Date(a) | | | Settlement
Date | | | Principal
Amount | | | Value | |
GNMA (Proceeds Receivable: $(18,952,656)) | | | 4.000 | % | | | TBA-30yr | | | | 10/23/17 | | | $ | (18,000,000 | ) | | $ | (18,953,438 | ) |
| | (a) | | TBA (To Be Announced) Securities are purchased or sold on a forward commitment basis with an approximate principal amount and no defined maturity date. The actual principal and maturity date will be determined upon settlement when the specific mortgage pools are assigned. |
| | |
| The accompanying notes are an integral part of these financial statements. | | 125 |
GOLDMAN SACHS U.S. MORTGAGES FUND
Schedule of Investments (continued)
September 30, 2017 (Unaudited)
|
| ADDITIONAL INVESTMENT INFORMATION (continued) |
FUTURES CONTRACTS — At September 30, 2017, the Fund had the following futures contracts:
| | | | | | | | | | | | | | | | |
| Description | | Number of
Contracts | | | Expiration
Date | | | Notional
Amount | | | Unrealized
Appreciation/
(Depreciation) | |
Long position contracts: | | | | | | | | | | | | | | | | |
10 Year U.S. Treasury Notes | | | 295 | | | | 12/19/17 | | | $ | 36,967,187 | | | $ | (343,288 | ) |
20 Year U.S. Treasury Bonds | | | 59 | | | | 12/19/17 | | | | 9,015,938 | | | | (163,689 | ) |
Ultra 10 Year U.S. Treasury Notes | | | 64 | | | | 12/19/17 | | | | 8,597,000 | | | | (107,112 | ) |
| Total | | | $ | (614,089 | ) |
Short position contracts: | | | | | | | | | | | | | | | | |
Eurodollars | | | (57 | ) | | | 12/17/18 | | | $ | (13,984,238 | ) | | $ | (5,121 | ) |
5 Year U.S. Treasury Notes | | | (48 | ) | | | 12/29/17 | | | | (5,640,000 | ) | | | 53,416 | |
Ultra Long U.S. Treasury Bonds | | | (33 | ) | | | 12/19/17 | | | | (5,449,125 | ) | | | 78,123 | |
2 Year U.S. Treasury Notes | | | (41 | ) | | | 12/29/17 | | | | (8,843,828 | ) | | | 25,054 | |
| Total | | | $ | 151,472 | |
| TOTAL | | | $ | (462,617 | ) |
SWAP CONTRACTS — At September 30, 2017, the Fund had the following swap contracts:
CENTRALLY CLEARED INTEREST RATE SWAP CONTRACTS
| | | | | | | | | | | | | | | | | | | | | | | | |
Payments
Made by
the Fund | | Payments
Received
by Fund | | | Termination
Date | | | Notional
Amount
(000s)(c) | | | Value | | | Upfront
Premium
(Received) Paid | | | Unrealized
Appreciation/
(Depreciation) | |
| 2.143%(a) | | | 3M LIBOR(b) | | | | 07/03/23 | | | $ | 1,360 | | | $ | (59 | ) | | $ | (465 | ) | | $ | 406 | |
| 3M LIBOR(b) | | | 2.065%(a) | | | | 08/06/23 | | | | 4,480 | | | | (19,232 | ) | | | 2,164 | | | | (21,396 | ) |
| 3M LIBOR(b) | | | 2.378(a) | | | | 07/03/28 | | | | 5,110 | | | | (632 | ) | | | 82 | | | | (714 | ) |
| 2.346(a) | | | 3M LIBOR(b) | | | | 08/06/28 | | | | 2,530 | | | | 9,756 | | | | (2,596 | ) | | | 12,352 | |
| 2.560(a) | | | 3M LIBOR(b) | | | | 07/03/48 | | | | 2,090 | | | | 3,135 | | | | 75 | | | | 3,060 | |
| TOTAL | | | | | | | | | | | | | | $ | (7,032 | ) | | $ | (740 | ) | | $ | (6,292 | ) |
| | (a) | | Payments made semi-annually. |
| | (b) | | Payments made quarterly. |
| | (c) | | Represents forward starting interest rate swaps whose effective dates of commencement of accruals and cash flows occur subsequent to September 30, 2017. |
OVER THE COUNTER CREDIT DEFAULT SWAP CONTRACTS
| | | | | | | | | | | | | | | | | | | | | | | | | | | | | | | | |
| Referenced Obligation | | Rates (paid)
received by
Fund(a) | | | Credit
Spread at
September 30,
2017(b) | | | Counterparty | | | Notional
Amount
(000s) | | | Termination
Date | | | Value | | | Upfront
Payments
made (received) | | | Unrealized
Gain (Loss) | |
| Protection Purchased: | | | | | | | | | | | | | | | | | | | | | | | | | | | | | | | | |
| Markit CMBX Series 10 | | | (0.500)% | | | | 0.629 | % | |
| CS International
(London) |
| | $ | 9,000 | | | | 11/17/59 | | | $ | 93,027 | | | $ | 273,320 | | | $ | (180,793 | ) |
| | (a) | | Payments made monthly. |
| | (b) | | Credit spread on the referenced obligation, together with the term of the swap contract, are indicators of payment/performance risk. The likelihood of a credit event occurring which would require a fund or its counterparty to make a payment or otherwise be required to perform under the swap contract is generally greater as the credit spread and the term of the swap contract increase. |
| | |
| 126 | | The accompanying notes are an integral part of these financial statements. |
GOLDMAN SACHS U.S. MORTGAGES FUND
|
| ADDITIONAL INVESTMENT INFORMATION (continued) |
PURCHASED OPTIONS CONTRACTS — At September 30, 2017, the Fund had the following purchased options:
PURCHASED OPTIONS ON FUTURES CONTRACTS
| | | | | | | | | | | | | | | | | | | | | | | | | | | | | | |
| Description | | Counterparty | | Exercise
Price | | | Expiration
Date | | | Number of
Contracts | | | Notional
Amount | | | Market Value | | | Premiums
Paid (Received)
by Fund | | | Unrealized
Appreciation/ (Depreciation) | |
Purchased Options Contracts: | | | | | | | | | | | | | | | | | | | | | | | | | | | | | | |
Put: | | | | | | | | | | | | | | | | | | | | | | | | | | | | | | |
Eurodollar Futures | | MS & Co. Int. PLC | | $ | 98.00 | | | | 06/15/18 | | | | 56 | | | $ | 140,000 | | | $ | 21,700 | | | $ | 15,526 | | | $ | 6,174 | |
PURCHASED OPTIONS ON INTEREST RATE SWAPTIONS
| | | | | | | | | | | | | | | | | | | | | | | | | | | | | | |
| Description | | Counterparty | | Exercise
Rate | | | Expiration
Date | | | Number of
Contracts | | | Notional
Amount | | | Market Value | | | Premiums
Paid (Received)
by Fund | | | Unrealized
Appreciation/ (Depreciation) | |
Purchased Options Contracts: | | | | | | | | | | | | | | | | | | | | | | | | | | | | | | |
Calls: | | | | | | | | | | | | | | | | | | | | | | | | | | | | | | |
1Y IRS | | Citibank NA | | | 2.273 | % | | | 01/22/18 | | | | 9,900,000 | | | $ | 9,900,000 | | | $ | 145,667 | | | $ | 161,123 | | | $ | (15,456 | ) |
1Y IRS | | JPMorgan Securities, Inc. | | | 2.048 | | | | 01/24/18 | | | | 6,400,000 | | | | 6,400,000 | | | | 184,188 | | | | 120,640 | | | | 63,548 | |
1Y IRS | | Citibank NA | | | 2.539 | | | | 01/24/18 | | | | 6,400,000 | | | | 6,400,000 | | | | 33,491 | | | | 122,880 | | | | (89,389 | ) |
5Y IRS | | BoA Securities LLC | | | 2.018 | | | | 01/29/18 | | | | 17,300,000 | | | | 17,300,000 | | | | 130,615 | | | | 141,860 | | | | (11,245 | ) |
Puts: | | | | | | | | | | | | | | | | | | | | | | | | | | | | | | |
1Y IRS | | Citibank NA | | | 2.273 | | | | 01/22/18 | | | | 9,900,000 | | | | 9,900,000 | | | | 98,831 | | | | 161,123 | | | | (62,292 | ) |
1Y IRS | | JPMorgan Securities, Inc. | | | 2.048 | | | | 01/24/18 | | | | 6,400,000 | | | | 6,400,000 | | | | 25,202 | | | | 120,640 | | | | (95,438 | ) |
1Y IRS | | Citibank NA | | | 2.539 | | | | 01/24/18 | | | | 6,400,000 | | | | 6,400,000 | | | | 154,779 | | | | 122,880 | | | | 31,899 | |
5Y IRS | | BoA Securities LLC | | | 2.018 | | | | 01/29/18 | | | | 17,300,000 | | | | 17,300,000 | | | | 88,332 | | | | 141,860 | | | | (53,528 | ) |
| Total purchased options contracts on interest rate swaptions | | | | | | | $ | 861,105 | | | $ | 1,093,006 | | | $ | (231,901 | ) |
| | |
|
Abbreviations: |
CS International (London) | | —Credit Suisse International (London) |
BoA Securities LLC | | —Bank of America Securities LLC |
MS & Co. Int. PLC | | —Morgan Stanley & Co. International PLC |
|
| | |
| The accompanying notes are an integral part of these financial statements. | | 127 |
GOLDMAN SACHS SINGLE SECTOR FIXED INCOME FUNDS
Statements of Assets and Liabilities
September 30, 2017 (Unaudited)
| | | | | | |
| | | | | Dynamic Emerging
Markets Debt Fund | |
| | Assets: | |
| | Investments of unaffiliated issuers, at value (cost $21,136,675, $2,108,785,962, $3,191,830,224, $4,067,265,010, $392,767,913, $254,649,557 and $521,648,412) | | $ | 21,919,000 | |
| | Investments of affiliated issuers, at value (cost $624,792, $61,042,705, $196,978,829, $318,013,865, $0, $13,869,144 and $123,356,139) | | | 624,792 | |
| | Purchased options, at value (cost $1,387, $147,774, $111,177, $13,308, $16,912 and $1,108,532) | | | 1,938 | |
| | Cash | | | 283,048 | |
| | Foreign currencies, at value (cost $158,771, $901,054, $17,375, $61,755, $15,890, $4,240,012 and $0, respectively) | | | 159,404 | |
| | Unrealized gain on swap contracts | | | 33,782 | |
| | Unrealized gain on forward foreign currency exchange contracts | | | 177,633 | |
| | Variation margin on futures contracts | | | 1,583 | |
| | Variation margin on swap contracts | | | 1,196 | |
| | Unrealized gain on unfunded loan commitment | | | — | |
| | Receivables: | | | | |
| | Collateral on certain derivative contracts(a) | | | 1,051,127 | |
| | Investments sold | | | 677,507 | |
| | Interest | | | 383,505 | |
| | Reimbursement from investment adviser | | | 33,536 | |
| | Upfront payments made on swap contracts | | | 22,489 | |
| | Fund shares sold | | | 511 | |
| | Investments sold on an extended-settlement basis | | | — | |
| | Due from broker | | | — | |
| | Other assets | | | 2,397 | |
| | Total assets | | | 25,373,448 | |
| | | | | | |
| | Liabilities: | | | | |
| | Reverse repurchase agreement, at value | | | — | |
| | Unrealized loss on swap contracts | | | 122,654 | |
| | Unrealized loss on forward foreign currency exchange contracts | | | 343,941 | |
| | Forward sale contracts, at value (proceeds received $0, $0, $0, $0, $0, $0 and $18,952,656, respectively) | | | — | |
| | Variation margin on swap contracts | | | — | |
| | Payables: | | | | |
| | Investments purchased | | | 1,056,625 | |
| | Investments purchased on an extended — settlement basis | | | 197,584 | |
| | Fund shares redeemed | | | 23,583 | |
| | Management fees | | | 15,137 | |
| | Distributions payable | | | 12,625 | |
| | Upfront payments received on swap contracts | | | 9,026 | |
| | Distribution and Service fees and Transfer Agency fees | | | 1,077 | |
| | Collateral on certain derivative contracts(b) | | | — | |
| | Accrued expenses and other liabilities | | | 122,016 | |
| | Total liabilities | | | 1,904,268 | |
| | | | | | |
| | Net Assets: | | | | |
| | Paid-in capital | | | 23,398,746 | |
| | Undistributed (distributions in excess of) net investment income | | | (1,268,006 | ) |
| | Accumulated net realized gain (loss) | | | 765,342 | |
| | Net unrealized gain (loss) | | | 573,098 | |
| | | NET ASSETS | | $ | 23,469,180 | |
| | | Net Assets: | | | | |
| | | Class A | | $ | 755,546 | |
| | | Class C | | | 145,717 | |
| | | Institutional | | | 22,337,720 | |
| | | Service | | | — | |
| | | Separate Account Institutional | | | — | |
| | | Investor | | | 202,892 | |
| | | Class R | | | 27,305 | |
| | | Class R6 | | | — | |
| | | Total Net Assets | | $ | 23,469,180 | |
| | | Shares Outstanding $0.001 par value (unlimited number of shares authorized): | | | | |
| | | Class A | | | 86,274 | |
| | | Class C | | | 16,584 | |
| | | Institutional | | | 2,544,730 | |
| | | Service | | | — | |
| | | Separate Account Institutional | | | — | |
| | | Investor | | | 23,138 | |
| | | Class R | | | 3,107 | |
| | | Class R6 | | | — | |
| | | Net asset value, offering and redemption price per share:(c) | | | | |
| | | Class A | | | $8.76 | |
| | | Class C | | | 8.79 | |
| | | Institutional | | | 8.78 | |
| | | Service | | | — | |
| | | Separate Account Institutional | | | — | |
| | | Investor | | | 8.77 | |
| | | Class R | | | 8.79 | |
| | | Class R6 | | | — | |
| | (a) | | Segregated for initial margin and/or collateral on transactions as follows: |
| | | | | | | | | | | | | | | | |
| Fund | | Forwards | | | Futures | | | Swaps | | | TBA | |
Dynamic Emerging Markets Debt Fund | | $ | 960,000 | | | $ | 13,290 | | | $ | 77,837 | | | | — | |
Emerging Markets Debt Fund | | | 42,980,000 | | | | 952,532 | | | | 13,285,628 | | | | — | |
High Yield Fund | | | — | | | | 1,452,929 | | | | 3,338,249 | | | | — | |
High Yield Floating Rate Fund | | | — | | | | 1,501,666 | | | | 4,412,242 | | | | 220,000 | |
Investment Grade Credit Fund | | | — | | | | 595,000 | | | | 536,727 | | | | — | |
Local Emerging Markets Debt Fund | | | 12,910,000 | | | | 277,008 | | | | 4,909,255 | | | | — | |
U.S. Mortgages Fund | | | — | | | | 560,000 | | | | 160,119 | | | | 590,000 | |
| | (b) | | Includes segregated cash of $1,010,000 and $1,380,000 for the Local Emerging Markets Debt Fund and the U.S. Mortgages Fund related to initial margin and/or collateral on swap transactions. Also includes segregated cash for initial margin and/or collateral on TBA transactions of $530,000 for the U.S. Mortgages Fund. |
| | (c) | | Maximum public offering price per share for Class A Shares of Dynamic Emerging Markets Debt, Emerging Markets Debt, High Yield, High Yield Floating Rate, Investment Grade Credit, Local Emerging Markets Debt and U.S. Mortgages Funds is $9.17, $13.62, $6.91, $9.91, $9.63, $6.97 and $10.88, respectively. At redemption, Class C Shares may be subject to a contingent deferred sales charge, assessed on the amount equal to the lesser of the current net asset value (“NAV”) or the original purchase price of the shares. |
| | (d) | | Net asset value may not recalculate due to rounding of fractional shares. |
| | |
| 128 | | The accompanying notes are an integral part of these financial statements. |
GOLDMAN SACHS SINGLE SECTOR FIXED INCOME FUNDS
| | | | | | | | | | | | | | | | | | | | | | | | | | | | | | | | | | |
| | | Emerging Markets
Debt Fund | | | | | High Yield Fund | | | | | High Yield Floating Rate Fund | | | | | Investment Grade Credit Fund | | | | | Local Emerging Markets Debt Fund | | | | | U.S. Mortgages Fund | |
| | | | | | | | | | | | | | | | | | | | | | | | | | | | | | | | | | |
| | $ | 2,159,940,198 | | | | | $ | 3,264,288,944 | | | | | $ | 3,978,737,087 | | | | | $ | 405,889,304 | | | | | $ | 252,623,859 | | | | | $ | 521,890,283 | |
| | | 61,042,705 | | | | | | 197,007,423 | | | | | | 318,040,447 | | | | | | — | | | | | | 13,869,144 | | | | | | 123,356,139 | |
| | | 206,538 | | | | | | 155,388 | | | | | | — | | | | | | 18,600 | | | | | | 23,638 | | | | | | 882,805 | |
| | | 30,439,732 | | | | | | 49,865,590 | | | | | | 71,996,071 | | | | | | 2,839,980 | | | | | | 4,285,043 | | | | | | 7,228,840 | |
| | | 881,466 | | | | | | 18,258 | | | | | | 61,785 | | | | | | 13,739 | | | | | | 4,234,164 | | | | | | — | |
| | | 1,034,772 | | | | | | — | | | | | | 100,493 | | | | | | — | | | | | | 1,844,496 | | | | | | — | |
| | | 9,148,106 | | | | | | 66,554 | | | | | | 67,973 | | | | | | 27 | | | | | | 2,584,077 | | | | | | — | |
| | | 29,135 | | | | | | 197 | | | | | | 146,417 | | | | | | 99,250 | | | | | | 25,418 | | | | | | 91 | |
| | | — | | | | | | — | | | | | | 144,320 | | | | | | — | | | | | | 224,146 | | | | | | — | |
| | | — | | | | | | — | | | | | | 6,317 | | | | | | — | | | | | | — | | | | | | — | |
| | | | | | | | | | | | | | | | | | | | | | | | | | | | | | | | | | |
| | | 57,218,160 | | | | | | 4,791,178 | | | | | | 6,133,908 | | | | | | 1,131,727 | | | | | | 18,096,263 | | | | | | 1,310,119 | |
| | | 87,094,665 | | | | | | 30,958,129 | | | | | | 13,436,322 | | | | | | 6,166,049 | | | | | | 9,788,465 | | | | | | 6,996,852 | |
| | | 35,668,554 | | | | | | 52,448,839 | | | | | | 23,058,017 | | | | | | 3,785,350 | | | | | | 4,708,379 | | | | | | 1,302,437 | |
| | | 40,129 | | | | | | — | | | | | | — | | | | | | 26,232 | | | | | | 37,010 | | | | | | 17,526 | |
| | | 2,019,604 | | | | | | — | | | | | | — | | | | | | — | | | | | | 101,348 | | | | | | 273,320 | |
| | | 9,384,735 | | | | | | 3,182,564 | | | | | | 10,345,369 | | | | | | 66,483 | | | | | | 68,221 | | | | | | 873,294 | |
| | | 10,591,122 | | | | | | 6,575,806 | | | | | | 35,538,265 | | | | | | — | | | | | | — | | | | | | 94,052,312 | |
| | | — | | | | | | 293,162 | | | | | | 144,025 | | | | | | — | | | | | | — | | | | | | — | |
| | | 10,456 | | | | | | 7,798 | | | | | | 4,319 | | | | | | 515 | | | | | | 543 | | | | | | 446 | |
| | | 2,464,750,077 | | | | | | 3,609,659,830 | | | | | | 4,457,961,135 | | | | | | 420,037,256 | | | | | | 312,514,214 | | | | | | 758,184,464 | |
| | | | | | | | | | | | | | | | | | | | | | | | | | | | | | | | | | |
| | | | | | | | | | | | | | | | | | | | | | | | | | | | | | | | | | |
| | | 3,240,000 | | | | | | 76,401,690 | | | | | | 6,447,663 | | | | | | — | | | | | | — | | | | | | — | |
| | | 9,558,581 | | | | | | — | | | | | | — | | | | | | — | | | | | | 5,441,886 | | | | | | 180,793 | |
| | | 12,377,866 | | | | | | — | | | | | | — | | | | | | 8,909 | | | | | | 4,729,264 | | | | | | — | |
| | | — | | | | | | — | | | | | | — | | | | | | — | | | | | | — | | | | | | 18,953,438 | |
| | | 116,699 | | | | | | 136,269 | | | | | | — | | | | | | 159 | | | | | | — | | | | | | 13,285 | |
| | | | | | | | | | | | | | | | | | | | | | | | | | | | | | | | | | |
| | | 93,036,787 | | | | | | 36,448,867 | | | | | | 17,743,990 | | | | | | 6,302,555 | | | | | | 13,965,552 | | | | | | 9,342,814 | |
| | | 13,044,941 | | | | | | 31,229,282 | | | | | | 189,175,669 | | | | | | 1,171,246 | | | | | | — | | | | | | 241,172,271 | |
| | | 5,758,948 | | | | | | 6,391,231 | | | | | | 7,914,064 | | | | | | 240,901 | | | | | | 258,527 | | | | | | 629,680 | |
| | | 1,483,829 | | | | | | 1,872,109 | | | | | | 1,819,038 | | | | | | 115,077 | | | | | | 186,903 | | | | | | 120,195 | |
| | | 1,680,729 | | | | | | 1,021,247 | | | | | | 59,725 | | | | | | 52,727 | | | | | | 8,841 | | | | | | 36,244 | |
| | | 900,431 | | | | | | — | | | | | | 265,438 | | | | | | — | | | | | | 2,868,107 | | | | | | — | |
| | | 143,799 | | | | | | 209,064 | | | | | | 142,075 | | | | | | 16,971 | | | | | | 16,864 | | | | | | 40,692 | |
| | | — | | | | | | — | | | | | | — | | | | | | — | | | | | | 1,010,000 | | | | | | 1,910,000 | |
| | | 54,163 | | | | | | 422,032 | | | | | | 254,200 | | | | | | 80,444 | | | | | | 286,622 | | | | | | 63,547 | |
| | | 141,396,773 | | | | | | 154,131,791 | | | | | | 223,821,862 | | | | | | 7,988,989 | | | | | | 28,772,566 | | | | | | 272,462,959 | |
| | | | | | | | | | | | | | | | | | | | | | | | | | | | | | | | | | |
| | | | | | | | | | | | | | | | | | | | | | | | | | | | | | | | | | |
| | | 2,321,316,871 | | | | | | 3,741,241,819 | | | | | | 4,424,083,538 | | | | | | 401,304,117 | | | | | | 504,411,061 | | | | | | 491,452,013 | |
| | | (2,023,888 | ) | | | | | 306,816 | | | | | | 1,122,520 | | | | | | 798,153 | | | | | | (58,694,048 | ) | | | | | (2,014,293 | ) |
| | | (33,597,071 | ) | | | | | (359,325,505 | ) | | | | | (104,100,673 | ) | | | | | (2,981,770 | ) | | | | | (154,726,305 | ) | | | | | (3,081,876 | ) |
| | | 37,657,392 | | | | | | 73,304,909 | | | | | | (86,966,112 | ) | | | | | 12,927,767 | | | | | | (7,249,060 | ) | | | | | (634,339 | ) |
| | | $ | 2,323,353,304 | | | | | $ | 3,455,528,039 | | | | | $ | 4,234,139,273 | | | | | $ | 412,048,267 | | | | | $ | 283,741,648 | | | | | $ | 485,721,505 | |
| | | | | | | | | | | | | | | | | | | | | | | | | | | | | | | | | | | |
| | | $ | 102,284,658 | | | | | $ | 205,032,426 | | | | | $ | 4,548,704 | | | | | $ | 11,115,648 | | | | | $ | 6,875,771 | | | | | $ | 49,646,393 | |
| | | | 34,031,637 | | | | | | 40,041,547 | | | | | | 2,446,767 | | | | | | — | | | | | | 6,135,554 | | | | | | — | |
| | | | 2,012,241,688 | | | | | | 3,150,758,230 | | | | | | 4,223,686,950 | | | | | | 169,772,325 | | | | | | 263,923,791 | | | | | | 65,401,891 | |
| | | | — | | | | | | 12,216,457 | | | | | | — | | | | | | — | | | | | | — | | | | | | — | |
| | | | — | | | | | | — | | | | | | — | | | | | | 226,852,081 | | | | | | — | | | | | | 216,356,234 | |
| | | | 135,773,396 | | | | | | 32,263,291 | | | | | | 3,444,800 | | | | | | 4,291,332 | | | | | | 6,806,532 | | | | | | 150,352,094 | |
| | | | — | | | | | | 14,820,344 | | | | | | 12,052 | | | | | | — | | | | | | — | | | | | | — | |
| | | | 39,021,925 | | | | | | 395,744 | | | | | | — | | | | | | 16,881 | | | | | | — | | | | | | 3,964,893 | |
| | | $ | 2,323,353,304 | | | | | $ | 3,455,528,039 | | | | | $ | 4,234,139,273 | | | | | $ | 412,048,267 | | | | | $ | 283,741,648 | | | | | $ | 485,721,505 | |
| | | | | | | | | | | | | | | | | | | | | | | | | | | | | | | | | | | |
| | | | 7,862,387 | | | | | | 31,070,142 | | | | | | 469,546 | | | | | | 1,199,070 | | | | | | 1,032,798 | | | | | | 4,742,411 | |
| | | | 2,617,184 | | | | | | 6,063,124 | | | | | | 252,531 | | | | | | — | | | | | | 922,721 | | | | | | — | |
| | | | 154,490,089 | | | | | | 476,305,238 | | | | | | 435,562,874 | | | | | | 18,307,068 | | | | | | 39,738,745 | | | | | | 6,232,265 | |
| | | | — | | | | | | 1,853,378 | | | | | | — | | | | | | — | | | | | | — | | | | | | — | |
| | | | — | | | | | | — | | | | | | — | | | | | | 24,457,268 | | | | | | — | | | | | | 20,664,458 | |
| | | | 10,424,402 | | | | | | 4,880,445 | | | | | | 355,138 | | | | | | 462,662 | | | | | | 1,024,848 | | | | | | 14,326,358 | |
| | | | — | | | | | | 2,247,550 | | | | | | 1,243 | | | | | | — | | | | | | — | | | | | | — | |
| | | | 2,995,954 | | | | | | 59,751 | | | | | | — | | | | | | 1,820 | | | | | | — | | | | | | 377,691 | |
| | | | | | | | | | | | | | | | | | | | | | | | | | | | | | | | | | | |
| | | | $13.01 | | | | | | $6.60 | | | | | | $9.69 | | | | | | $9.27 | | | | | | $6.66 | | | | | | $10.47 | |
| | | | 13.00 | | | | | | 6.60 | | | | | | 9.69 | | | | | | — | | | | | | 6.65 | | | | | | — | |
| | | | 13.03 | | | | | | 6.61 | | | | | | 9.70 | | | | | | 9.27 | | | | | | 6.64 | | | | | | 10.49 | |
| | | | — | | | | | | 6.59 | | | | | | — | | | | | | — | | | | | | — | | | | | | — | |
| | | | — | | | | | | — | | | | | | — | | | | | | 9.28 | | | | | | — | | | | | | 10.47 | |
| | | | 13.02 | | | | | | 6.61 | | | | | | 9.70 | | | | | | 9.28 | | | | | | 6.64 | | | | | | 10.49 | |
| | | | — | | | | | | 6.59 | | | | | | 9.69 | (d) | | | | | — | | | | | | — | | | | | | — | |
| | | | 13.02 | | | | | | 6.62 | | | | | | — | | | | | | 9.28 | | | | | | — | | | | | | 10.50 | |
| | |
| The accompanying notes are an integral part of these financial statements. | | 129 |
GOLDMAN SACHS SINGLE SECTOR FIXED INCOME FUNDS
Statements of Operations
For the Six Months Ended September 30, 2017 (Unaudited)
| | | | | | |
| | | | | Dynamic Emerging
Markets Debt Fund | |
| | Investment income: | | | | |
| | Interest | | $ | 664,889 | |
| | Dividends — affiliated issuers | | | 3,630 | |
| | Dividends — unaffiliated issuers | | | — | |
| | Total investment income | | | 668,519 | |
| | | | | | |
| | Expenses: | | | | |
| | Management fees | | | 96,854 | |
| | Custody, accounting and administrative services | | | 96,442 | |
| | Professional fees | | | 64,930 | |
| | Registration fees | | | 32,748 | |
| | Trustee fees | | | 8,878 | |
| | Printing and mailing costs | | | 5,949 | |
| | Transfer Agency fees(a) | | | 4,842 | |
| | Distribution and Service fees(a) | | | 1,332 | |
| | Service and Shareholder Administration Plan fees(a) | | | — | |
| | Other | | | 4,715 | |
| | Total expenses | | | 316,690 | |
| | Less — expense reductions | | | (215,942 | ) |
| | Net expenses | | | 100,748 | |
| | NET INVESTMENT INCOME | | | 567,771 | |
| | | | | | |
| | Realized and unrealized gain (loss): | | | | |
| | Net realized gain (loss) from: | | | | |
| | Investments — unaffiliated issuers | | | 400,077 | |
| | Futures contracts | | | 26,216 | |
| | Swap contracts | | | (2,513 | ) |
| | Forward foreign currency exchange contracts | | | 435,290 | |
| | Foreign currency transactions | | | (4,808 | ) |
| | Net change in unrealized gain (loss) on: | | | | |
| | Investments (including the effects of the net change in the foreign capital gains tax liability of $358 and $2,694 for the Dynamic Emerging Markets Debt and Local Emerging Markets Debt Funds, respectively) | | | 100,132 | |
| | Investments — affiliated issuers | | | — | |
| | Purchased options | | | 551 | |
| | Futures contracts | | | (14,732 | ) |
| | Unfunded Loan Commitments | | | — | |
| | Swap contracts | | | 19,669 | |
| | Forward foreign currency exchange contracts | | | (249,862 | ) |
| | Foreign currency translation | | | (4,181 | ) |
| | Net realized and unrealized gain (loss) | | | 705,839 | |
| | NET INCREASE IN NET ASSETS RESULTING FROM OPERATIONS | | $ | 1,273,610 | |
| | (a) | | Class specific Distribution and Service fee, Transfer Agency fees, Service Plan and Shareholder Administration Plan were as follows: |
| | | | | | | | | | | | | | | | | | | | | | | | | | | | | | | | | | | | | | | | | | | | | | | | | | | | |
| | | Distribution and Service Fees | | | Transfer Agency Fees | | | Service Plan
Fees | | | Shareholder
Administration
Plan Fees | |
Fund | | Class A | | | Class C | | | Class R | | | Class A | | | Class C | | | Institutional | | | Service | | | Separate Account
Institutional Shares | | | Investor | | | Class R | | | Class R6 | | | Service | | | Service | |
Dynamic Emerging Markets Debt Fund | | $ | 529 | | | $ | 737 | | | $ | 66 | | | $ | 275 | | | $ | 96 | | | $ | 4,327 | | | $ | — | | | $ | — | | | $ | 127 | | | $ | 17 | | | $ | — | | | $ | — | | | $ | — | |
Emerging Markets Debt Fund | | | 123,476 | | | | 170,399 | | | | — | | | | 64,207 | | | | 22,152 | | | | 371,217 | | | | — | | | | — | | | | 70,846 | | | | — | | | | 3,655 | | | | — | | | | — | |
High Yield Fund | | | 276,211 | | | | 214,392 | | | | 36,737 | | | | 143,630 | | | | 27,871 | | | | 637,532 | | | | 2,390 | | | | — | | | | 21,216 | | | | 9,552 | | | | 7,993 | | | | 14,938 | | | | 14,938 | |
High Yield Floating Rate Fund | | | 6,942 | | | | 12,969 | | | | 29 | | | | 3,610 | | | | 1,686 | | | | 831,141 | | | | — | | | | — | | | | 2,573 | | | | 7 | | | | — | | | | — | | | | — | |
Investment Grade Credit Fund | | | 30,867 | | | | — | | | | — | | | | 16,051 | | | | — | | | | 30,013 | | | | — | | | | 47,402 | | | | 2,630 | | | | — | | | | 2 | | | | — | | | | — | |
Local Emerging Markets Debt Fund | | | 10,715 | | | | 30,996 | | | | — | | | | 5,572 | | | | 4,030 | | | | 54,771 | | | | — | | | | — | | | | 3,962 | | | | — | | | | — | | | | — | | | | — | |
U.S. Mortgages Fund | | | 59,528 | | | | — | | | | — | | | | 30,954 | | | | — | | | | 12,822 | | | | — | | | | 44,298 | | | | 89,986 | | | | — | | | | 426 | | | | — | | | | — | |
| | |
| 130 | | The accompanying notes are an integral part of these financial statements. |
GOLDMAN SACHS SINGLE SECTOR FIXED INCOME FUNDS
| | | | | | | | | | | | | | | | | | | | | | | | | | | | | | | | | | |
| | | Emerging Markets
Debt Fund | | | | | High Yield Fund | | | | | High Yield
Floating Rate Fund | | | | | Investment Grade
Credit Fund | | | | | Local Emerging
Markets Debt Fund | | | | | U.S. Mortgages
Fund | |
| | | | | | | | | | | | | | | | | | | | | | | | | | | | | | | | | | |
| | $ | 65,506,198 | | | | | $ | 109,286,611 | | | | | $ | 97,305,559 | | | | | $ | 7,408,320 | | | | | $ | 9,516,511 | | | | | $ | 4,874,466 | |
| | | 125,303 | | | | | | 724,504 | | | | | | 1,722,308 | | | | | | 4,411 | | | | | | 61,826 | | | | | | 339,060 | |
| | | — | | | | | | 403,954 | | | | | | — | | | | | | — | | | | | | — | | | | | | — | |
| | | 65,631,501 | | | | | | 110,415,069 | | | | | | 99,027,867 | | | | | | 7,412,731 | | | | | | 9,578,337 | | | | | | 5,213,526 | |
| | | | | | | | | | | | | | | | | | | | | | | | | | | | | | | | | | |
| | | | | | | | | | | | | | | | | | | | | | | | | | | | | | | | | | |
| | | 8,462,705 | | | | | | 12,012,541 | | | | | | 11,229,582 | | | | | | 787,493 | | | | | | 1,275,668 | | | | | | 899,081 | |
| | | 218,091 | | | | | | 132,947 | | | | | | 465,110 | | | | | | 52,145 | | | | | | 231,831 | | | | | | 112,852 | |
| | | 65,780 | | | | | | 79,880 | | | | | | 75,004 | | | | | | 56,891 | | | | | | 64,201 | | | | | | 55,906 | |
| | | 77,573 | | | | | | 72,942 | | | | | | 48,919 | | | | | | 34,369 | | | | | | 27,593 | | | | | | 68,327 | |
| | | 10,754 | | | | | | 12,780 | | | | | | 12,927 | | | | | | 9,305 | | | | | | 9,241 | | | | | | 9,326 | |
| | | 82,698 | | | | | | 65,316 | | | | | | 17,415 | | | | | | 7,809 | | | | | | 34,022 | | | | | | 12,236 | |
| | | 532,077 | | | | | | 850,184 | | | | | | 839,017 | | | | | | 96,098 | | | | | | 68,335 | | | | | | 178,486 | |
| | | 293,875 | | | | | | 527,340 | | | | | | 19,940 | | | | | | 30,867 | | | | | | 41,711 | | | | | | 59,528 | |
| | | — | | | | | | 29,876 | | | | | | — | | | | | | — | | | | | | — | | | | | | — | |
| | | 80,576 | | | | | | 64,361 | | | | | | 102,685 | | | | | | 9,201 | | | | | | 28,599 | | | | | | 9,375 | |
| | | 9,824,129 | | | | | | 13,848,167 | | | | | | 12,810,599 | | | | | | 1,084,178 | | | | | | 1,781,201 | | | | | | 1,405,117 | |
| | | (113,441 | ) | | | | | (159,284 | ) | | | | | (361,442 | ) | | | | | (242,953 | ) | | | | | (383,562 | ) | | | | | (249,206 | ) |
| | | 9,710,688 | | | | | | 13,688,883 | | | | | | 12,449,157 | | | | | | 841,225 | | | | | | 1,397,639 | | | | | | 1,155,911 | |
| | | 55,920,813 | | | | | | 96,726,186 | | | | | | 86,578,710 | | | | | | 6,571,506 | | | | | | 8,180,698 | | | | | | 4,057,615 | |
| | | | | | | | | | | | | | | | | | | | | | | | | | | | | | | | | | |
| | | | | | | | | | | | | | | | | | | | | | | | | | | | | | | | | | |
| | | | | | | | | | | | | | | | | | | | | | | | | | | | | | | | | | |
| | | 7,482,181 | | | | | | (3,911,893 | ) | | | | | (2,238,350 | ) | | | | | 1,727,466 | | | | | | (15,844,410 | ) | | | | | 2,249,427 | |
| | | 7,978,245 | | | | | | (4,080,480 | ) | | | | | (1,367,368 | ) | | | | | 904,284 | | | | | | (359,983 | ) | | | | | 1,272,048 | |
| | | (348,361 | ) | | | | | (1,360,608 | ) | | | | | (3,248,227 | ) | | | | | 197,038 | | | | | | (4,957,326 | ) | | | | | (28,000 | ) |
| | | (12,046,822 | ) | | | | | (2,048,349 | ) | | | | | (1,696,613 | ) | | | | | (284,258 | ) | | | | | 5,583,975 | | | | | | — | |
| | | 2,265,017 | | | | | | 232,035 | | | | | | (109,086 | ) | | | | | 42,874 | | | | | | 347,809 | | | | | | — | |
| | | | | | | | | | | | | | | | | | | | | | | | | | | | | | | | | | |
| |
|
47,359,291 |
| | | | | 26,037,102 | | | | | | (9,880,249 | ) | | | | | 7,298,155 | | | | | | 22,124,002 | | | | | | 227,411 | |
| | | — | | | | | | 37,494 | | | | | | 25,358 | | | | | | — | | | | | | — | | | | | | — | |
| | | 58,763 | | | | | | 44,211 | | | | | | — | | | | | | 5,292 | | | | | | 6,726 | | | | | | (225,726 | ) |
| | | (3,496,370 | ) | | | | | 1,344,020 | | | | | | 1,627,968 | | | | | | (211,330 | ) | | | | | 100,379 | | | | | | (349,822 | ) |
| | | — | | | | | | — | | | | | | 6,317 | | | | | | — | | | | | | — | | | | | | — | |
| | | (2,683,433 | ) | | | | | 335,870 | | | | | | 952,391 | | | | | | 28,332 | | | | | | 8,708,966 | | | | | | (181,096 | ) |
| | | (3,418,206 | ) | | | | | 283,557 | | | | | | 154,937 | | | | | | (2,016 | ) | | | | | (3,503,115 | ) | | | | | — | |
| | | 19,418 | | | | | | 3,349 | | | | | | 36,800 | | | | | | 2,775 | | | | | | (7,483 | ) | | | | | — | |
| | | 43,169,723 | | | | | | 16,916,308 | | | | | | (15,736,122 | ) | | | | | 9,708,612 | | | | | | 12,199,540 | | | | | | 2,964,242 | |
| | $ | 99,090,536 | | | | | $ | 113,642,494 | | | | | $ | 70,842,588 | | | | | $ | 16,280,118 | | | | | $ | 20,380,238 | | | | | $ | 7,021,857 | |
| | |
| The accompanying notes are an integral part of these financial statements. | | 131 |
GOLDMAN SACHS SINGLE SECTOR FIXED INCOME FUNDS
Statements of Changes in Net Assets
| | | | | | | | | | |
| | | | | Dynamic Emerging Markets Debt Fund | |
| | | | | For the Six Months Ended
September 30, 2017 (Unaudited) | | | For the Fiscal
Year Ended
March 31, 2017 | |
| | From operations: | |
| | Net investment income | | $ | 567,771 | | | $ | 1,896,982 | |
| | Net realized gain (loss) | | | 854,262 | | | | (348,403 | ) |
| | Net change in unrealized gain (loss) | | | (148,423 | ) | | | 1,153,705 | |
| | Net increase in net assets resulting from operations | | | 1,273,610 | | | | 2,702,284 | |
| | | | | | | | | | |
| | Distributions to shareholders: | | | | | | | | |
| | From net investment income | | | | | | | | |
| | Class A Shares | | | (9,747 | ) | | | (6,829 | ) |
| | Class C Shares | | | (2,796 | ) | | | (1,368 | ) |
| | Institutional Shares | | | (528,442 | ) | | | (998,362 | ) |
| | Service Shares | | | — | | | | — | |
| | Investor Shares | | | (4,693 | ) | | | (2,350 | ) |
| | Class R Shares | | | (562 | ) | | | (565 | ) |
| | Class R6 Shares | | | — | | | | — | |
| | From net realized gains | | | | | | | | |
| | Class A Shares | | | — | | | | (3,353 | ) |
| | Class C Shares | | | — | | | | (672 | ) |
| | Institutional Shares | | | — | | | | (490,266 | ) |
| | Investor Shares | | | — | | | | (1,154 | ) |
| | Class R Shares | | | — | | | | (278 | ) |
| | Class R6 Shares | | | — | | | | — | |
| | Return of capital | | | | | | | | |
| | Class A Shares | | | — | | | | (2,445 | ) |
| | Class C Shares | | | — | | | | (490 | ) |
| | Institutional Shares | | | — | | | | (357,522 | ) |
| | Investor Shares | | | — | | | | (842 | ) |
| | Class R Shares | | | — | | | | (202 | ) |
| | Class R6 Shares | | | — | | | | — | |
| | Total distributions to shareholders | | | (546,240 | ) | | | (1,866,698 | ) |
| | | | | | | | | | |
| | From share transactions: | | | | | | | | |
| | Proceeds from sales of shares | | | 3,003,770 | | | | 10,762,897 | |
| | Reinvestment of distributions | | | 468,110 | | | | 780,988 | |
| | Cost of shares redeemed | | | (2,782,595 | )(a) | | | (29,922,497 | )(a) |
| | Net increase (decrease) in net assets resulting from share transactions | | | 689,285 | | | | (18,378,612 | ) |
| | TOTAL INCREASE (DECREASE) | | | 1,416,655 | | | | (17,543,026 | ) |
| | | | | | | | | | |
| | Net assets: | | | | | | | | |
| | Beginning of period | | | 22,052,525 | | | | 39,595,551 | |
| | End of period | | $ | 23,469,180 | | | $ | 22,052,525 | |
| | Undistributed (distributions in excess of) net investment income | | $ | (1,268,006 | ) | | $ | (1,289,537 | ) |
| | (a) | | Net of $0 and $71, $16,120 and $41,830 and $47,555 and $451,200 of redemption fees for Dynamic Emerging Markets Debt, Emerging Markets Debt and High Yield Funds, respectively, for the six months ended September 30, 2017 and the fiscal year ended March 31, 2017, respectively. |
| | |
| 132 | | The accompanying notes are an integral part of these financial statements. |
GOLDMAN SACHS SINGLE SECTOR FIXED INCOME FUNDS
| | | | | | | | | | | | | | | | | | | | | | | | | | | | | | | | | | |
| | | Emerging Markets Debt Fund | | | | | High Yield Fund | | | | | High Yield Floating Rate Fund | |
| | | For the
Six Months Ended
September 30, 2017
(Unaudited) | | | | | For the Fiscal
Year Ended
March 31, 2017 | | | | | For the Six Months Ended
September 30, 2017
(Unaudited) | | | | | For the Fiscal
Year Ended
March 31, 2017 | | | | | For the Six Months Ended
September 30, 2017
(Unaudited) | | | | | For the Fiscal
Year Ended
March 31, 2017 | |
| | | | | | | | | | | | | | | | | | | | | | | | | | | | | | | | | | |
| | $ | 55,920,813 | | | | | $ | 74,861,724 | | | | | $ | 96,726,186 | | | | | $ | 215,331,726 | | | | | $ | 86,578,710 | | | | | $ | 140,925,266 | |
| | | 5,330,260 | | | | | | (1,057,513 | ) | | | | | (11,169,295 | ) | | | | | (2,549,799 | ) | | | | | (8,659,644 | ) | | | | | (21,348,489 | ) |
| | | 37,839,463 | | | | | | 34,530,984 | | | | | | 28,085,603 | | | | | | 326,577,888 | | | | | | (7,076,478 | ) | | | | | 108,384,890 | |
| | | 99,090,536 | | | | | | 108,335,195 | | | | | | 113,642,494 | | | | | | 539,359,815 | | | | | | 70,842,588 | | | | | | 227,961,667 | |
| | | | | | | | | | | | | | | | | | | | | | | | | | | | | | | | | | |
| | | | | | | | | | | | | | | | | | | | | | | | | | | | | | | | | | |
| | | | | | | | | | | | | | | | | | | | | | | | | | | | | | | | | | |
| | | (2,357,779 | ) | | | | | (5,945,499 | ) | | | | | (5,577,511 | ) | | | | | (17,291,548 | ) | | | | | (104,876 | ) | | | | | (289,856 | ) |
| | | (684,665 | ) | | | | | (1,155,112 | ) | | | | | (921,859 | ) | | | | | (2,337,108 | ) | | | | | (39,210 | ) | | | | | (63,279 | ) |
| | | (47,535,934 | ) | | | | | (63,502,070 | ) | | | | | (85,696,168 | ) | | | | | (183,075,976 | ) | | | | | (85,315,242 | ) | | | | | (137,722,950 | ) |
| | | — | | | | | | — | | | | | | (290,967 | ) | | | | | (702,583 | ) | | | | | — | | | | | | — | |
| | | (2,749,372 | ) | | | | | (1,808,624 | ) | | | | | (863,830 | ) | | | | | (733,895 | ) | | | | | (79,253 | ) | | | | | (67,935 | ) |
| | | — | | | | | | — | | | | | | (351,956 | ) | | | | | (760,850 | ) | | | | | (212 | ) | | | | | (409 | ) |
| | | (792,878 | ) | | | | | (431,204 | ) | | | | | (2,166,474 | ) | | | | | (9,773,930 | ) | | | | | — | | | | | | — | |
| | | | | | | | | | | | | | | | | | | | | | | | | | | | | | | | | | |
| | | — | | | | | | — | | | | | | — | | | | | | — | | | | | | — | | | | | | — | |
| | | — | | | | | | — | | | | | | — | | | | | | — | | | | | | — | | | | | | — | |
| | | — | | | | | | — | | | | | | — | | | | | | — | | | | | | — | | | | | | — | |
| | | — | | | | | | — | | | | | | — | | | | | | — | | | | | | — | | | | | | — | |
| | | — | | | | | | — | | | | | | — | | | | | | — | | | | | | — | | | | | | — | |
| | | — | | | | | | — | | | | | | — | | | | | | — | | | | | | — | | | | | | — | |
| | | | | | | | | | | | | | | | | | | | | | | | | | | | | | | | | | |
| | | — | | | | | | — | | | | | | — | | | | | | — | | | | | | — | | | | | | (5,685 | ) |
| | | — | | | | | | — | | | | | | — | | | | | | — | | | | | | — | | | | | | (1,241 | ) |
| | | — | | | | | | — | | | | | | — | | | | | | — | | | | | | — | | | | | | (2,701,236 | ) |
| | | — | | | | | | — | | | | | | — | | | | | | — | | | | | | — | | | | | | (1,332 | ) |
| | | — | | | | | | — | | | | | | — | | | | | | — | | | | | | — | | | | | | (8 | ) |
| | | — | | | | | | — | | | | | | — | | | | | | — | | | | | | — | | | | | | — | |
| | | (54,120,628 | ) | | | | | (72,842,509 | ) | | | | | (95,868,765 | ) | | | | | (214,675,890 | ) | | | | | (85,538,793 | ) | | | | | (140,853,931 | ) |
| | | | | | | | | | | | | | | | | | | | | | | | | | | | | | | | | | |
| | | | | | | | | | | | | | | | | | | | | | | | | | | | | | | | | | |
| | | 632,493,334 | | | | | | 1,426,968,672 | | | | | | 256,665,887 | | | | | | 1,209,892,889 | | | | | | 617,952,211 | | | | | | 1,308,793,468 | |
| | | 45,159,149 | | | | | | 60,658,744 | | | | | | 89,159,447 | | | | | | 201,824,053 | | | | | | 85,170,667 | | | | | | 140,018,791 | |
| | | (305,711,822 | )(a) | | | | | (666,845,522 | )(a) | | | | | (860,001,949 | )(a) | | | | | (1,600,986,057 | )(a) | | | | | (364,788,405 | ) | | | | | (852,846,363 | ) |
| | | 371,940,661 | | | | | | 820,781,894 | | | | | | (514,176,615 | ) | | | | | (189,269,115 | ) | | | | | 338,334,473 | | | | | | 595,965,896 | |
| | | 416,910,569 | | | | | | 856,274,580 | | | | | | (496,402,886 | ) | | | | | 135,414,810 | | | | | | 323,638,268 | | | | | | 683,073,632 | |
| | | | | | | | | | | | | | | | | | | | | | | | | | | | | | | | | | |
| | | | | | | | | | | | | | | | | | | | | | | | | | | | | | | | | | |
| | | 1,906,442,735 | | | | | | 1,050,168,155 | | | | | | 3,951,930,925 | | | | | | 3,816,516,115 | | | | | | 3,910,501,005 | | | | | | 3,227,427,373 | |
| | $ | 2,323,353,304 | | | | | $ | 1,906,442,735 | | | | | $ | 3,455,528,039 | | | | | $ | 3,951,930,925 | | | | | $ | 4,234,139,273 | | | | | $ | 3,910,501,005 | |
| | $ | (2,023,888 | ) | | | | $ | (3,824,073 | ) | | | | $ | 306,816 | | | | | $ | (550,605 | ) | | | | $ | 1,122,520 | | | | | $ | 82,603 | |
| | |
| The accompanying notes are an integral part of these financial statements. | | 133 |
GOLDMAN SACHS SINGLE SECTOR FIXED INCOME FUNDS
Statements of Changes in Net Assets (continued)
| | | | | | | | | | |
| | | | | Investment Grade Credit Fund | |
| | | | | For the
Six Months Ended
September 30, 2017
(Unaudited) | | | For the Fiscal
Year Ended
March 31, 2017 | |
| | From operations: | |
| | Net investment income | | $ | 6,571,506 | | | $ | 13,538,543 | |
| | Net realized gain (loss) | | | 2,587,404 | | | | 1,874,383 | |
| | Net change in unrealized gain (loss) | | | 7,121,208 | | | | (2,171,997 | ) |
| | Net increase in net assets resulting from operations | | | 16,280,118 | | | | 13,240,929 | |
| | | | | | | | | | |
| | Distributions to shareholders: | | | | | | | | |
| | From net investment income | | | | | | | | |
| | Class A Shares | | | (358,314 | ) | | | (885,653 | ) |
| | Class C Shares | | | — | | | | — | |
| | Institutional Shares | | | (2,417,656 | ) | | | (4,691,089 | ) |
| | Investor Shares | | | (63,504 | ) | | | (58,731 | ) |
| | Separate Account Institutional Shares | | | (3,825,338 | ) | | | (7,943,476 | ) |
| | Class R6 Shares | | | (203 | ) | | | (359 | ) |
| | Return of capital | | | | | | | | |
| | Class A Shares | | | — | | | | — | |
| | Class C Shares | | | — | | | | — | |
| | Institutional Shares | | | — | | | | — | |
| | Investor Shares | | | — | | | | — | |
| | Separate Account Institutional Shares | | | — | | | | — | |
| | Class R6 Shares | | | — | | | | — | |
| | Total distributions to shareholders | | | (6,665,015 | ) | | | (13,579,308 | ) |
| �� | | | | | | | | | |
| | From share transactions: | | | | | | | | |
| | Proceeds from sales of shares | | | 59,436,513 | | | | 97,497,438 | |
| | Reinvestment of distributions | | | 6,308,163 | | | | 12,582,273 | |
| | Cost of shares redeemed | | | (92,088,775 | ) | | | (106,006,267 | ) |
| | Net increase (decrease) in net assets resulting from share transactions | | | (26,344,099 | ) | | | 4,073,444 | |
| | TOTAL INCREASE (DECREASE) | | | (16,728,996 | ) | | | 3,735,065 | |
| | | | | | | | | | |
| | Net assets: | | | | | | | | |
| | Beginning of period | | | 428,777,263 | | | | 425,042,198 | |
| | End of period | | $ | 412,048,267 | | | $ | 428,777,263 | |
| | Undistributed (distributions in excess of) net investment income | | $ | 798,153 | | | $ | 891,662 | |
| | (a) | | Net of $584 and $33,657 of redemption fees for Local Emerging Markets Debt Fund for the six months ended September 30, 2017 and the fiscal year ended March 31, 2017, respectively. |
| | |
| 134 | | The accompanying notes are an integral part of these financial statements. |
GOLDMAN SACHS SINGLE SECTOR FIXED INCOME FUNDS
| | | | | | | | | | | | | | | | | | | | | | |
| | | Local Emerging Markets Debt Fund | | | | | U.S. Mortgages Fund | |
| | | For the
Six Months Ended
September 30, 2017
(Unaudited) | | | | | For the Fiscal
Year Ended
March 31, 2017 | | | | | For the Six Months Ended
September 30, 2017
(Unaudited) | | | | | For the Fiscal
Year Ended
March 31, 2017 | |
| | | | | | | | | | | | | | | | | | | | | | |
| | $ | 8,180,698 | | | | | $ | 25,729,792 | | | | | $ | 4,057,615 | | | | | $ | 4,909,412 | |
| | | (15,229,935 | ) | | | | | (126,344,062 | ) | | | | | 3,493,475 | | | | | | (1,459,621 | ) |
| | | 27,429,475 | | | | | | 121,796,602 | | | | | | (529,233 | ) | | | | | (2,240,654 | ) |
| | | 20,380,238 | | | | | | 21,182,332 | | | | | | 7,021,857 | | | | | | 1,209,137 | |
| | | | | | | | | | | | | | | | | | | | | | |
| | | | | | | | | | | | | | | | | | | | | | |
| | | | | | | | | | | | | | | | | | | | | | |
| | | (249,203 | ) | | | | | — | | | | | | (535,553 | ) | | | | | (1,115,141 | ) |
| | | (156,331 | ) | | | | | — | | | | | | — | | | | | | — | |
| | | (8,333,061 | ) | | | | | — | | | | | | (830,528 | ) | | | | | (1,594,439 | ) |
| | | (183,979 | ) | | | | | — | | | | | | (1,724,777 | ) | | | | | (667,660 | ) |
| | | — | | | | | | — | | | | | | (2,877,061 | ) | | | | | (5,623,517 | ) |
| | | — | | | | | | — | | | | | | (46,099 | ) | | | | | (6,500 | ) |
| | | | | | | | | | | | | | | | | | | | | | |
| | | — | | | | | | (5,885,487 | ) | | | | | — | | | | | | — | |
| | | — | | | | | | (303,807 | ) | | | | | — | | | | | | — | |
| | | — | | | | | | (21,519,212 | ) | | | | | — | | | | | | — | |
| | | — | | | | | | (667,879 | ) | | | | | — | | | | | | — | |
| | | — | | | | | | — | | | | | | — | | | | | | — | |
| | | — | | | | | | — | | | | | | — | | | | | | — | |
| | | (8,922,574 | ) | | | | | (28,376,385 | ) | | | | | (6,014,018 | ) | | | | | (9,007,257 | ) |
| | | | | | | | | | | | | | | | | | | | | | |
| | | | | | | | | | | | | | | | | | | | | | |
| | | 34,927,750 | | | | | | 177,347,686 | | | | | | 78,844,440 | | | | | | 271,623,976 | |
| | | 8,793,888 | | | | | | 28,088,048 | | | | | | 5,713,948 | | | | | | 8,031,798 | |
| | | (126,635,269 | )(a) | | | | | (403,185,901 | )(a) | | | | | (73,386,388 | ) | | | | | (112,659,420 | ) |
| | | (82,913,631 | ) | | | | | (197,750,167 | ) | | | | | 11,172,000 | | | | | | 166,996,354 | |
| | | (71,455,967 | ) | | | | | (204,944,220 | ) | | | | | 12,179,839 | | | | | | 159,198,234 | |
| | | | | | | | | | | | | | | | | | | | | | |
| | | | | | | | | | | | | | | | | | | | | | |
| | | 355,197,615 | | | | | | 560,141,835 | | | | | | 473,541,666 | | | | | | 314,343,432 | |
| | $ | 283,741,648 | | | | | $ | 355,197,615 | | | | | $ | 485,721,505 | | | | | $ | 473,541,666 | |
| | $ | (58,694,048 | ) | | | | $ | (57,952,172 | ) | | | | $ | (2,014,293 | ) | | | | $ | (57,890 | ) |
| | |
| The accompanying notes are an integral part of these financial statements. | | 135 |
GOLDMAN SACHS DYNAMIC EMERGING MARKETS DEBT FUND
Financial Highlights
Selected Data for a Share Outstanding Throughout Each Period
| | | | | | | | | | | | | | | | | | | | | | | | | | | | | | | | | | |
| | | | | | From
Investment Operations | | | Distributions
to shareholders | |
| | | Year - Share Class | | Net asset
value,
beginning
of period | | | Net
investment
income(a) | | | Net realized
and unrealized
gain (loss) | | | Total from
investment
operations | | | From net
investment
income | | | From net
realized
gains | | | From
capital | | | Total
distributions | |
| | FOR THE SIX MONTHS ENDED SEPTEMBER 30, (UNAUDITED) | | | | | |
| | 2017 - A | | $ | 8.48 | | | $ | 0.21 | | | $ | 0.27 | | | $ | 0.48 | | | $ | (0.20 | ) | | $ | — | | | $ | — | | | $ | (0.20 | ) |
| | 2017 - C | | | 8.50 | | | | 0.17 | | | | 0.28 | | | | 0.45 | | | | (0.16 | ) | | | — | | | | — | | | | (0.16 | ) |
| | 2017 - Institutional | | | 8.49 | | | | 0.22 | | | | 0.28 | | | | 0.50 | | | | (0.21 | ) | | | — | | | | — | | | | (0.21 | ) |
| | 2017 - Investor(e) | | | 8.48 | | | | 0.22 | | | | 0.28 | | | | 0.50 | | | | (0.21 | ) | | | — | | | | — | | | | (0.21 | ) |
| | 2017 - R | | | 8.50 | | | | 0.19 | | | | 0.29 | | | | 0.48 | | | | (0.19 | ) | | | — | | | | — | | | | (0.19 | ) |
| | | | | | | | | | | | | | | | | | | | | | | | | | | | | | | | | | |
| | FOR THE FISCAL YEARS ENDED MARCH 31, | | | | | |
| | 2017 - A | | | 8.24 | | | | 0.40 | | | | 0.23 | | | | 0.63 | | | | (0.22 | ) | | | (0.10 | ) | | | (0.07 | ) | | | (0.39 | ) |
| | 2017 - C | | | 8.26 | | | | 0.32 | | | | 0.24 | | | | 0.56 | | | | (0.18 | ) | | | (0.08 | ) | | | (0.06 | ) | | | (0.32 | ) |
| | 2017 - Institutional | | | 8.27 | | | | 0.43 | | | | 0.21 | | | | 0.64 | | | | (0.23 | ) | | | (0.11 | ) | | | (0.08 | ) | | | (0.42 | ) |
| | 2017 - Investor(e) | | | 8.25 | | | | 0.40 | | | | 0.24 | | | | 0.64 | | | | (0.24 | ) | | | (0.10 | ) | | | (0.07 | ) | | | (0.41 | ) |
| | 2017 - R | | | 8.26 | | | | 0.37 | | | | 0.24 | | | | 0.61 | | | | (0.20 | ) | | | (0.10 | ) | | | (0.07 | ) | | | (0.37 | ) |
| | 2016 - A | | | 8.59 | | | | 0.36 | | | | (0.36 | ) | | | — | | | | (0.01 | ) | | | — | | | | (0.34 | ) | | | (0.35 | ) |
| | 2016 - C | | | 8.61 | | | | 0.30 | | | | (0.36 | ) | | | (0.06 | ) | | | (0.01 | ) | | | — | | | | (0.28 | ) | | | (0.29 | ) |
| | 2016 - Institutional | | | 8.62 | | | | 0.40 | | | | (0.37 | ) | | | 0.03 | | | | (0.01 | ) | | | — | | | | (0.37 | ) | | | (0.38 | ) |
| | 2016 - Investor(e) | | | 8.60 | | | | 0.39 | | | | (0.37 | ) | | | 0.02 | | | | (0.01 | ) | | | — | | | | (0.36 | ) | | | (0.37 | ) |
| | 2016 - R | | | 8.62 | | | | 0.34 | | | | (0.37 | ) | | | (0.03 | ) | | | (0.01 | ) | | | — | | | | (0.32 | ) | | | (0.33 | ) |
| | 2015 - A | | | 9.45 | | | | 0.37 | | | | (0.86 | ) | | | (0.49 | ) | | | (0.34 | ) | | | — | | | | (0.03 | ) | | | (0.37 | ) |
| | 2015 - C | | | 9.46 | | | | 0.32 | | | | (0.87 | ) | | | (0.55 | ) | | | (0.27 | ) | | | — | | | | (0.03 | ) | | | (0.30 | ) |
| | 2015 - Institutional | | | 9.46 | | | | 0.42 | | | | (0.86 | ) | | | (0.44 | ) | | | (0.37 | ) | | | — | | | | (0.03 | ) | | | (0.40 | ) |
| | 2015 - Investor(e) | | | 9.44 | | | | 0.41 | | | | (0.86 | ) | | | (0.45 | ) | | | (0.36 | ) | | | — | | | | (0.03 | ) | | | (0.39 | ) |
| | 2015 - R | | | 9.46 | | | | 0.36 | | | | (0.85 | ) | | | (0.49 | ) | | | (0.32 | ) | | | — | | | | (0.03 | ) | | | (0.35 | ) |
| | 2014 - A (Commenced May 31, 2013) | | | 10.00 | | | | 0.31 | | | | (0.52 | ) | | | (0.21 | ) | | | (0.23 | ) | | | — | | | | (0.11 | ) | | | (0.34 | ) |
| | 2014 - C (Commenced May 31, 2013) | | | 10.00 | | | | 0.25 | | | | (0.51 | ) | | | (0.26 | ) | | | (0.17 | ) | | | — | | | | (0.11 | ) | | | (0.28 | ) |
| | 2014 - Institutional (Commenced May 31, 2013) | | | 10.00 | | | | 0.32 | | | | (0.50 | ) | | | (0.18 | ) | | | (0.25 | ) | | | — | | | | (0.11 | ) | | | (0.36 | ) |
| | 2014 - Investor(e) (Commenced May 31, 2013) | | | 10.00 | | | | 0.31 | | | | (0.52 | ) | | | (0.21 | ) | | | (0.24 | ) | | | — | | | | (0.11 | ) | | | (0.35 | ) |
| | 2014 - R (Commenced May 31, 2013) | | | 10.00 | | | | 0.27 | | | | (0.49 | ) | | | (0.22 | ) | | | (0.21 | ) | | | — | | | | (0.11 | ) | | | (0.32 | ) |
| | (a) | | Calculated based on the average shares outstanding methodology. |
| | (b) | | Assumes investment at the NAV at the beginning of the period, reinvestment of all dividends and distributions, a complete redemption of the investment at the NAV at the end of the period and no sales or redemption charges. Total returns would be reduced if a sales or redemption charge was taken into account. Returns do not reflect the impact of taxes to shareholder relating to Fund distributions or the redemption of Fund shares. Total returns for periods less than one full year are not annualized. |
| | (c) | | The Fund’s portfolio turnover rate is calculated in accordance with regulatory requirements, without regard to transactions involving short term investments and certain derivatives. If such transactions were included, the Fund’s portfolio turnover rate may be higher. |
| | (e) | | Effective before the opening of business on August 15, 2017, Class IR Shares were designated as Investor Shares. |
| | |
| 136 | | The accompanying notes are an integral part of these financial statements. |
GOLDMAN SACHS DYNAMIC EMERGING MARKETS DEBT FUND
| | | | | | | | | | | | | | | | | | | | | | | | | | | | | | | | | | | | | | | | |
| | | | | | | | | | | | | | | | | | | | | | | | | | | | | | | | | | �� |
| | | Net asset
value, end
of period | | | | | Total
return(b) | | | | | Net assets,
end of
period
(in 000s) | | | | | Ratio of
net expenses
to average
net assets | | | | | Ratio of
total expenses
to average
net assets | | | | | Ratio of
net investment
income
to average
net assets | | | | | Portfolio
turnover
rate(c) | |
| | | | | | | | | | | | | | | | | | | | | | | | | | | | | | | | | | | | | | | | |
| | $ | 8.76 | | | | | | 5.66 | % | | | | $ | 756 | | | | | | 1.22 | %(d) | | | | | 3.10 | %(d) | | | | | 4.81 | %(d) | | | | | 50 | % |
| | | 8.79 | | | | | | 5.38 | | | | | | 146 | | | | | | 1.97 | (d) | | | | | 3.90 | (d) | | | | | 3.98 | (d) | | | | | 50 | |
| | | 8.78 | | | | | | 5.95 | | | | | | 22,338 | | | | | | 0.88 | (d) | | | | | 2.81 | (d) | | | | | 5.07 | (d) | | | | | 50 | |
| | | 8.77 | | | | | | 5.91 | | | | | | 203 | | | | | | 0.97 | (d) | | | | | 2.89 | (d) | | | | | 5.00 | (d) | | | | | 50 | |
| | | 8.79 | | | | | | 5.63 | | | | | | 27 | | | | | | 1.47 | (d) | | | | | 3.39 | (d) | | | | | 4.47 | (d) | | | | | 50 | |
| | | | | | | | | | | | | | | | | | | | | | | | | | | | | | | | | | | | | | | | |
| | | | | | | | | | | | | | | | | | | | | | | | | | | | | | | | | | | | | | | | |
| | | 8.48 | | | | | | 7.76 | | | | | | 286 | | | | | | 1.23 | | | | | | 2.47 | | | | | | 4.78 | | | | | | 142 | |
| | | 8.50 | | | | | | 6.95 | | | | | | 151 | | | | | | 1.98 | | | | | | 3.45 | | | | | | 3.85 | | | | | | 142 | |
| | | 8.49 | | | | | | 8.00 | | | | | | 21,411 | | | | | | 0.90 | | | | | | 2.06 | | | | | | 5.10 | | | | | | 142 | |
| | | 8.48 | | | | | | 8.04 | | | | | | 180 | | | | | | 0.98 | | | | | | 2.35 | | | | | | 4.81 | | | | | | 142 | |
| | | 8.50 | | | | | | 7.50 | | | | | | 25 | | | | | | 1.48 | | | | | | 2.72 | | | | | | 4.47 | | | | | | 142 | |
| | | 8.24 | | | | | | 0.15 | | | | | | 512 | | | | | | 1.23 | | | | | | 2.98 | | | | | | 4.40 | | | | | | 98 | |
| | | 8.26 | | | | | | (0.70 | ) | | | | | 40 | | | | | | 1.99 | | | | | | 3.79 | | | | | | 3.65 | | | | | | 98 | |
| | | 8.27 | | | | | | 0.39 | | | | | | 38,990 | | | | | | 0.89 | | | | | | 2.45 | | | | | | 4.89 | | | | | | 98 | |
| | | 8.25 | | | | | | 0.29 | | | | | | 31 | | | | | | 0.98 | | | | | | 2.63 | | | | | | 4.75 | | | | | | 98 | |
| | | 8.26 | | | | | | (0.20 | ) | | | | | 23 | | | | | | 1.48 | | | | | | 3.18 | | | | | | 4.20 | | | | | | 98 | |
| | | 8.59 | | | | | | (5.43 | ) | | | | | 665 | | | | | | 1.24 | | | | | | 3.45 | | | | | | 4.13 | | | | | | 179 | |
| | | 8.61 | | | | | | (5.91 | ) | | | | | 62 | | | | | | 1.99 | | | | | | 3.66 | | | | | | 3.37 | | | | | | 179 | |
| | | 8.62 | | | | | | (4.87 | ) | | | | | 15,571 | | | | | | 0.90 | | | | | | 2.57 | | | | | | 4.47 | | | | | | 179 | |
| | | 8.60 | | | | | | (4.98 | ) | | | | | 23 | | | | | | 1.00 | | | | | | 2.77 | | | | | | 4.37 | | | | | | 179 | |
| | | 8.62 | | | | | | (5.44 | ) | | | | | 23 | | | | | | 1.49 | | | | | | 3.27 | | | | | | 3.87 | | | | | | 179 | |
| | | 9.45 | | | | | | (2.03 | ) | | | | | 99 | | | | | | 1.27 | (d) | | | | | 3.67 | (d) | | | | | 3.97 | (d) | | | | | 140 | |
| | | 9.46 | | | | | | (2.52 | ) | | | | | 59 | | | | | | 2.01 | (d) | | | | | 5.31 | (d) | | | | | 3.27 | (d) | | | | | 140 | |
| | | 9.46 | | | | | | (1.67 | ) | | | | | 24,119 | | | | | | 0.93 | (d) | | | | | 4.21 | (d) | | | | | 4.17 | (d) | | | | | 140 | |
| | | 9.44 | | | | | | (1.98 | ) | | | | | 24 | | | | | | 1.03 | (d) | | | | | 4.19 | (d) | | | | | 4.00 | (d) | | | | | 140 | |
| | | 9.46 | | | | | | (2.14 | ) | | | | | 24 | | | | | | 1.52 | (d) | | | | | 5.22 | (d) | | | | | 3.50 | (d) | | | | | 140 | |
| | |
| The accompanying notes are an integral part of these financial statements. | | 137 |
GOLDMAN SACHS EMERGING MARKETS DEBT FUND
Financial Highlights
Selected Data for a Share Outstanding Throughout Each Period
| | | | | | | | | | | | | | | | | | | | | | | | | | | | | | | | | | |
| | | | | | From
Investment Operations | | | Distributions
to shareholders | |
| | | Year - Share Class | | Net asset
value,
beginning
of period | | | Net
investment
income(a) | | | Net realized
and unrealized
gain (loss) | | | Total from
investment
operations | | | From net
investment
income | | | From net
realized
gains | | | From
capital | | | Total
distributions | |
| | FOR THE SIX MONTHS ENDED SEPTEMBER 30, (UNAUDITED) | | | | | |
| | 2017 - A | | $ | 12.73 | | | $ | 0.32 | | | $ | 0.27 | | | $ | 0.59 | | | $ | (0.31 | ) | | $ | — | | | $ | — | | | $ | (0.31 | ) |
| | 2017 - C | | | 12.72 | | | | 0.27 | | | | 0.27 | | | | 0.54 | | | | (0.26 | ) | | | — | | | | — | | | | (0.26 | ) |
| | 2017 - Institutional | | | 12.74 | | | | 0.34 | | | | 0.28 | | | | 0.62 | | | | (0.33 | ) | | | — | | | | — | | | | (0.33 | ) |
| | 2017 - Investor(e) | | | 12.74 | | | | 0.34 | | | | 0.26 | | | | 0.60 | | | | (0.32 | ) | | | — | | | | — | | | | (0.32 | ) |
| | 2017 - R6 | | | 12.74 | | | | 0.34 | | | | 0.27 | | | | 0.61 | | | | (0.33 | ) | | | — | | | | — | | | | (0.33 | ) |
| | | | | | | | | | | | | | | | | | | | | | | | | | | | | | | | | | |
| | FOR THE FISCAL YEARS ENDED MARCH 31, | | | | | |
| | 2017 - A | | | 12.25 | | | | 0.60 | | | | 0.46 | | | | 1.06 | | | | (0.58 | ) | | | — | | | | — | | | | (0.58 | ) |
| | 2017 - C | | | 12.24 | | | | 0.50 | | | | 0.47 | | | | 0.97 | | | | (0.49 | ) | | | — | | | | — | | | | (0.49 | ) |
| | 2017 - Institutional | | | 12.26 | | | | 0.63 | | | | 0.47 | | | | 1.10 | | | | (0.62 | ) | | | — | | | | — | | | | (0.62 | ) |
| | 2017 - Investor(e) | | | 12.26 | | | | 0.61 | | | | 0.48 | | | | 1.09 | | | | (0.61 | ) | | | — | | | | — | | | | (0.61 | ) |
| | 2017 - R6 | | | 12.26 | | | | 0.60 | | | | 0.51 | | | | 1.11 | | | | (0.63 | ) | | | — | | | | — | | | | (0.63 | ) |
| | 2016 - A | | | 12.33 | | | | 0.61 | | | | (0.09 | ) | | | 0.52 | | | | (0.60 | ) | | | — | | | | — | | | | (0.60 | ) |
| | 2016 - C | | | 12.33 | | | | 0.51 | | | | (0.09 | ) | | | 0.42 | | | | (0.51 | ) | | | — | | | | — | | | | (0.51 | ) |
| | 2016 - Institutional | | | 12.35 | | | | 0.64 | | | | (0.08 | ) | | | 0.56 | | | | (0.65 | ) | | | — | | | | — | | | | (0.65 | ) |
| | 2016 - Investor(e) | | | 12.35 | | | | 0.64 | | | | (0.09 | ) | | | 0.55 | | | | (0.64 | ) | | | — | | | | — | | | | (0.64 | ) |
| | 2016 - R6 (Commenced July 31, 2015) | | | 12.18 | | | | 0.46 | | | | 0.06 | | | | 0.52 | | | | (0.44 | ) | | | — | | | | — | | | | (0.44 | ) |
| | 2015 - A | | | 12.40 | | | | 0.52 | | | | (0.07 | ) | | | 0.45 | | | | (0.52 | ) | | | — | | | | — | | | | (0.52 | ) |
| | 2015 - C | | | 12.39 | | | | 0.43 | | | | (0.07 | ) | | | 0.36 | | | | (0.42 | ) | | | — | | | | — | | | | (0.42 | ) |
| | 2015 - Institutional | | | 12.41 | | | | 0.57 | | | | (0.07 | ) | | | 0.50 | | | | (0.56 | ) | | | — | | | | — | | | | (0.56 | ) |
| | 2015 - Investor(e) | | | 12.41 | | | | 0.56 | | | | (0.07 | ) | | | 0.49 | | | | (0.55 | ) | | | — | | | | — | | | | (0.55 | ) |
| | 2014 - A | | | 13.28 | | | | 0.55 | | | | (0.70 | ) | | | (0.15 | ) | | | (0.50 | ) | | | (0.20 | ) | | | (0.03 | ) | | | (0.73 | ) |
| | 2014 - C | | | 13.27 | | | | 0.46 | | | | (0.70 | ) | | | (0.24 | ) | | | (0.41 | ) | | | (0.20 | ) | | | (0.03 | ) | | | (0.64 | ) |
| | 2014 - Institutional | | | 13.29 | | | | 0.59 | | | | (0.69 | ) | | | (0.10 | ) | | | (0.55 | ) | | | (0.20 | ) | | | (0.03 | ) | | | (0.78 | ) |
| | 2014 - Investor(e) | | | 13.29 | | | | 0.58 | | | | (0.69 | ) | | | (0.11 | ) | | | (0.54 | ) | | | (0.20 | ) | | | (0.03 | ) | | | (0.77 | ) |
| | 2013 - A | | | 12.95 | | | | 0.61 | | | | 0.76 | | | | 1.37 | | | | (0.65 | ) | | | (0.39 | ) | | | — | | | | (1.04 | ) |
| | 2013 - C | | | 12.94 | | | | 0.50 | | | | 0.77 | | | | 1.27 | | | | (0.55 | ) | | | (0.39 | ) | | | — | | | | (0.94 | ) |
| | 2013 - Institutional | | | 12.96 | | | | 0.65 | | | | 0.77 | | | | 1.42 | | | | (0.70 | ) | | | (0.39 | ) | | | — | | | | (1.09 | ) |
| | 2013 - Investor(e) | | | 12.96 | | | | 0.64 | | | | 0.77 | | | | 1.41 | | | | (0.69 | ) | | | (0.39 | ) | | | — | | | | (1.08 | ) |
| | (a) | | Calculated based on the average shares outstanding methodology. |
| | (b) | | Assumes investment at the NAV at the beginning of the period, reinvestment of all dividends and distributions, a complete redemption of the investment at the NAV at the end of the period and no sales or redemption charges. Total returns would be reduced if a sales or redemption charge was taken into account. Returns do not reflect the impact of taxes to shareholder relating to Fund distributions or the redemption of Fund shares. Total returns for periods less than one full year are not annualized. |
| | (c) | | The Fund’s portfolio turnover rate is calculated in accordance with regulatory requirements, without regard to transactions involving short term investments and certain derivatives. If such transactions were included, the Fund’s portfolio turnover rate may be higher. |
| | (e) | | Effective before the opening of business on August 15, 2017, Class IR Shares were designated as Investor Shares. |
| | |
| 138 | | The accompanying notes are an integral part of these financial statements. |
GOLDMAN SACHS EMERGING MARKETS DEBT FUND
| | | | | | | | | | | | | | | | | | | | | | | | | | | | | | | | | | | | | | | | |
| | | | | | | | | | | | | | | | | | | | | | | | | | | | | | | | | | |
| | | Net asset
value, end
of period | | | | | Total
return(b) | | | | | Net assets,
end of
period
(in 000s) | | | | | Ratio of
net expenses
to average
net assets | | | | | Ratio of
total expenses
to average
net assets | | | | | Ratio of
net investment
income
to average
net assets | | | | | Portfolio
turnover
rate(c) | |
| | | | | | | | | | | | | | | | | | | | | | | | | | | | | | | | | | | | | | | | |
| | $ | 13.01 | | | | | | 4.65 | % | | | | $ | 102,285 | | | | | | 1.22 | %(d) | | | | | 1.23 | %(d) | | | | | 4.94 | %(d) | | | | | 43 | % |
| | | 13.00 | | | | | | 4.26 | | | | | | 34,032 | | | | | | 1.96 | (d) | | | | | 1.97 | (d) | | | | | 4.18 | (d) | | | | | 43 | |
| | | 13.03 | | | | | | 4.82 | | | | | | 2,012,242 | | | | | | 0.87 | (d) | | | | | 0.89 | (d) | | | | | 5.29 | (d) | | | | | 43 | |
| | | 13.02 | | | | | | 4.78 | | | | | | 135,773 | | | | | | 0.96 | (d) | | | | | 0.97 | (d) | | | | | 5.21 | (d) | | | | | 43 | |
| | | 13.02 | | | | | | 4.83 | | | | | | 39,022 | | | | | | 0.86 | (d) | | | | | 0.87 | (d) | | | | | 5.31 | (d) | | | | | 43 | |
| | | | | | | | | | | | | | | | | | | | | | | | | | | | | | | | | | | | | | | | |
| | | | | | | | | | | | | | | | | | | | | | | | | | | | | | | | | | | | | | | | |
| | | 12.73 | | | | | | 8.79 | | | | | | 103,548 | | | | | | 1.23 | | | | | | 1.24 | | | | | | 4.73 | | | | | | 89 | |
| | | 12.72 | | | | | | 7.98 | | | | | | 32,597 | | | | | | 1.98 | | | | | | 1.99 | | | | | | 3.94 | | | | | | 89 | |
| | | 12.74 | | | | | | 9.15 | | | | | | 1,656,148 | | | | | | 0.89 | | | | | | 0.90 | | | | | | 4.95 | | | | | | 89 | |
| | | 12.74 | | | | | | 9.05 | | | | | | 85,556 | | | | | | 0.98 | | | | | | 0.99 | | | | | | 4.79 | | | | | | 89 | |
| | | 12.74 | | | | | | 9.17 | | | | | | 28,593 | | | | | | 0.87 | | | | | | 0.88 | | | | | | 4.76 | | | | | | 89 | |
| | | 12.25 | | | | | | 4.43 | | | | | | 109,830 | | | | | | 1.23 | | | | | | 1.27 | | | | | | 5.02 | | | | | | 99 | |
| | | 12.24 | | | | | | 3.57 | | | | | | 27,645 | | | | | | 1.98 | | | | | | 2.02 | | | | | | 4.26 | | | | | | 99 | |
| | | 12.26 | | | | | | 4.70 | | | | | | 895,309 | | | | | | 0.89 | | | | | | 0.93 | | | | | | 5.30 | | | | | | 99 | |
| | | 12.26 | | | | | | 4.60 | | | | | | 16,927 | | | | | | 0.98 | | | | | | 1.02 | | | | | | 5.26 | | | | | | 99 | |
| | | 12.26 | | | | | | 4.41 | | | | | | 458 | | | | | | 0.87 | (d) | | | | | 0.92 | (d) | | | | | 5.84 | (d) | | | | | 99 | |
| | | 12.33 | | | | | | 3.60 | | | | | | 94,832 | | | | | | 1.24 | | | | | | 1.25 | | | | | | 4.17 | | | | | | 113 | |
| | | 12.33 | | | | | | 2.92 | | | | | | 30,935 | | | | | | 1.99 | | | | | | 2.00 | | | | | | 3.42 | | | | | | 113 | |
| | | 12.35 | | | | | | 4.04 | | | | | | 1,566,532 | | | | | | 0.90 | | | | | | 0.91 | | | | | | 4.52 | | | | | | 113 | |
| | | 12.35 | | | | | | 3.94 | | | | | | 14,423 | | | | | | 0.99 | | | | | | 1.00 | | | | | | 4.41 | | | | | | 113 | |
| | | 12.40 | | | | | | (0.88 | ) | | | | | 100,723 | | | | | | 1.25 | | | | | | 1.26 | | | | | | 4.38 | | | | | | 121 | |
| | | 12.39 | | | | | | (1.63 | ) | | | | | 32,020 | | | | | | 2.00 | | | | | | 2.01 | | | | | | 3.65 | | | | | | 121 | |
| | | 12.41 | | | | | | (0.54 | ) | | | | | 1,296,153 | | | | | | 0.91 | | | | | | 0.92 | | | | | | 4.76 | | | | | | 121 | |
| | | 12.41 | | | | | | (0.63 | ) | | | | | 16,552 | | | | | | 1.00 | | | | | | 1.01 | | | | | | 4.65 | | | | | | 121 | |
| | | 13.28 | | | | | | 10.64 | | | | | | 211,379 | | | | | | 1.23 | | | | | | 1.26 | | | | | | 4.48 | | | | | | 97 | |
| | | 13.27 | | | | | | 9.82 | | | | | | 49,527 | | | | | | 1.98 | | | | | | 2.01 | | | | | | 3.73 | | | | | | 97 | |
| | | 13.29 | | | | | | 11.04 | | | | | | 1,329,643 | | | | | | 0.89 | | | | | | 0.92 | | | | | | 4.83 | | | | | | 97 | |
| | | 13.29 | | | | | | 10.91 | | | | | | 23,970 | | | | | | 0.97 | | | | | | 1.01 | | | | | | 4.69 | | | | | | 97 | |
| | |
| The accompanying notes are an integral part of these financial statements. | | 139 |
GOLDMAN SACHS HIGH YIELD FUND
Financial Highlights
Selected Data for a Share Outstanding Throughout Each Period
| | | | | | | | | | | | | | | | | | | | | | | | | | | | | | | | | | |
| | | | | | From
Investment Operations | | | Distributions
to shareholders | |
| | | Year - Share Class | | Net asset
value,
beginning
of period | | | Net
investment
income(a) | | | Net realized
and unrealized
gain (loss) | | | Total from
investment
operations | | | From net
investment
income | | | From net
realized
gains | | | From
capital | | | Total
distributions | |
| | FOR THE SIX MONTHS ENDED SEPTEMBER 30, (UNAUDITED) | |
| | 2017 - A | | $ | 6.57 | | | $ | 0.17 | | | $ | 0.03 | | | $ | 0.20 | | | $ | (0.17 | ) | | $ | — | | | $ | — | | | $ | (0.17 | ) |
| | 2017 - C | | | 6.57 | | | | 0.14 | | | | 0.03 | | | | 0.17 | | | | (0.14 | ) | | | — | | | | — | | | | (0.14 | ) |
| | 2017 - Institutional | | | 6.58 | | | | 0.18 | | | | 0.03 | | | | 0.21 | | | | (0.18 | ) | | | — | | | | — | | | | (0.18 | ) |
| | 2017 - Service | | | 6.56 | | | | 0.16 | | | | 0.03 | | | | 0.19 | | | | (0.16 | ) | | | — | | | | — | | | | (0.16 | ) |
| | 2017 - Investor(f) | | | 6.58 | | | | 0.18 | | | | 0.02 | | | | 0.20 | | | | (0.17 | ) | | | — | | | | — | | | | (0.17 | ) |
| | 2017 - R | | | 6.56 | | | | 0.16 | | | | 0.03 | | | | 0.19 | | | | (0.16 | ) | | | — | | | | — | | | | (0.16 | ) |
| | 2017 - R6 | | | 6.59 | | | | 0.18 | | | | 0.03 | | | | 0.21 | | | | (0.18 | ) | | | — | | | | — | | | | (0.18 | ) |
| | FOR THE FISCAL YEARS ENDED MARCH 31, | |
| | 2017 - A | | | 6.02 | | | | 0.34 | | | | 0.55 | | | | 0.89 | | | | (0.34 | ) | | | — | | | | — | | | | (0.34 | ) |
| | 2017 - C | | | 6.03 | | | | 0.29 | | | | 0.54 | | | | 0.83 | | | | (0.29 | ) | | | — | | | | — | | | | (0.29 | ) |
| | 2017 - Institutional | | | 6.04 | | | | 0.36 | | | | 0.54 | | | | 0.90 | | | | (0.36 | ) | | | — | | | | — | | | | (0.36 | ) |
| | 2017 - Service | | | 6.02 | | | | 0.33 | | | | 0.54 | | | | 0.87 | | | | (0.33 | ) | | | — | | | | — | | | | (0.33 | ) |
| | 2017 - Investor(f) | | | 6.03 | | | | 0.36 | | | | 0.55 | | | | 0.91 | | | | (0.36 | ) | | | — | | | | — | | | | (0.36 | ) |
| | 2017 - R | | | 6.02 | | | | 0.32 | | | | 0.54 | | | | 0.86 | | | | (0.32 | ) | | | — | | | | — | | | | (0.32 | ) |
| | 2017 - R6 | | | 6.05 | | | | 0.36 | | | | 0.54 | | | | 0.90 | | | | (0.36 | ) | | | — | | | | — | | | | (0.36 | ) |
| | 2016 - A | | | 6.80 | | | | 0.35 | | | | (0.77 | ) | | | (0.42 | ) | | | (0.34 | ) | | | — | | | | (0.02 | ) | | | (0.36 | ) |
| | 2016 - C | | | 6.81 | | | | 0.30 | | | | (0.77 | ) | | | (0.47 | ) | | | (0.30 | ) | | | — | | | | (0.01 | ) | | | (0.31 | ) |
| | 2016 - Institutional | | | 6.82 | | | | 0.38 | | | | (0.78 | ) | | | (0.40 | ) | | | (0.36 | ) | | | — | | | | (0.02 | ) | | | (0.38 | ) |
| | 2016 - Service | | | 6.79 | | | | 0.34 | | | | (0.76 | ) | | | (0.42 | ) | | | (0.33 | ) | | | — | | | | (0.02 | ) | | | (0.35 | ) |
| | 2016 - Investor(f) | | | 6.81 | | | | 0.37 | | | | (0.78 | ) | | | (0.41 | ) | | | (0.35 | ) | | | — | | | | (0.02 | ) | | | (0.37 | ) |
| | 2016 - R | | | 6.80 | | | | 0.34 | | | | (0.78 | ) | | | (0.44 | ) | | | (0.33 | ) | | | — | | | | (0.01 | ) | | | (0.34 | ) |
| | 2016 - R6 (Commenced July 31, 2015) | | | 6.65 | | | | 0.24 | | | | (0.59 | ) | | | (0.35 | ) | | | (0.24 | ) | | | — | | | | (0.01 | ) | | | (0.25 | ) |
| | 2015 - A | | | 7.23 | | | | 0.37 | | | | (0.28 | ) | | | 0.09 | | | | (0.38 | ) | | | (0.14 | ) | | | — | (e) | | | (0.52 | ) |
| | 2015 - C | | | 7.24 | | | | 0.32 | | | | (0.29 | ) | | | 0.03 | | | | (0.32 | ) | | | (0.14 | ) | | | — | (e) | | | (0.46 | ) |
| | 2015 - Institutional | | | 7.25 | | | | 0.40 | | | | (0.29 | ) | | | 0.11 | | | | (0.40 | ) | | | (0.14 | ) | | | — | (e) | | | (0.54 | ) |
| | 2015 - Service | | | 7.23 | | | | 0.36 | | | | (0.30 | ) | | | 0.06 | | | | (0.36 | ) | | | (0.14 | ) | | | — | (e) | | | (0.50 | ) |
| | 2015 - Investor(f) | | | 7.25 | | | | 0.39 | | | | (0.30 | ) | | | 0.09 | | | | (0.39 | ) | | | (0.14 | ) | | | — | (e) | | | (0.53 | ) |
| | 2015 - R | | | 7.23 | | | | 0.35 | | | | (0.28 | ) | | | 0.07 | | | | (0.36 | ) | | | (0.14 | ) | | | — | (e) | | | (0.50 | ) |
| | 2014 - A | | | 7.40 | | | | 0.43 | | | | 0.09 | | | | 0.52 | | | | (0.43 | ) | | | (0.26 | ) | | | — | | | | (0.69 | ) |
| | 2014 - C | | | 7.41 | | | | 0.38 | | | | 0.08 | | | | 0.46 | | | | (0.37 | ) | | | (0.26 | ) | | | — | | | | (0.63 | ) |
| | 2014 - Institutional | | | 7.42 | | | | 0.46 | | | | 0.08 | | | | 0.54 | | | | (0.45 | ) | | | (0.26 | ) | | | — | | | | (0.71 | ) |
| | 2014 - Service | | | 7.40 | | | | 0.42 | | | | 0.09 | | | | 0.51 | | | | (0.42 | ) | | | (0.26 | ) | | | — | | | | (0.68 | ) |
| | 2014 - Investor(f) | | | 7.41 | | | | 0.45 | | | | 0.10 | | | | 0.55 | | | | (0.45 | ) | | | (0.26 | ) | | | — | | | | (0.71 | ) |
| | 2014 - R | | | 7.40 | | | | 0.41 | | | | 0.09 | | | | 0.50 | | | | (0.41 | ) | | | (0.26 | ) | | | — | | | | (0.67 | ) |
| | 2013 - A | | | 7.12 | | | | 0.45 | | | | 0.42 | | | | 0.87 | | | | (0.46 | ) | | | (0.13 | ) | | | — | | | | (0.59 | ) |
| | 2013 - C | | | 7.13 | | | | 0.40 | | | | 0.42 | | | | 0.82 | | | | (0.41 | ) | | | (0.13 | ) | | | — | | | | (0.54 | ) |
| | 2013 - Institutional | | | 7.14 | | | | 0.48 | | | | 0.42 | | | | 0.90 | | | | (0.49 | ) | | | (0.13 | ) | | | — | | | | (0.62 | ) |
| | 2013 - Service | | | 7.11 | | | | 0.44 | | | | 0.43 | | | | 0.87 | | | | (0.45 | ) | | | (0.13 | ) | | | — | | | | (0.58 | ) |
| | 2013 - Investor(f) | | | 7.13 | | | | 0.47 | | | | 0.42 | | | | 0.89 | | | | (0.48 | ) | | | (0.13 | ) | | | — | | | | (0.61 | ) |
| | 2013 - R | | | 7.12 | | | | 0.44 | | | | 0.41 | | | | 0.85 | | | | (0.44 | ) | | | (0.13 | ) | | | — | | | | (0.57 | ) |
| | (a) | | Calculated based on the average shares outstanding methodology. |
| | (b) | | Assumes investment at the NAV at the beginning of the period, reinvestment of all dividends and distributions, a complete redemption of the investment at the NAV at the end of the period and no sales or redemption charges. Total returns would be reduced if a sales or redemption charge was taken into account. Returns do not reflect the impact of taxes to shareholder relating to Fund distributions or the redemption of Fund shares. Total returns for periods less than one full year are not annualized. |
| | (c) | | The Fund’s portfolio turnover rate is calculated in accordance with regulatory requirements, without regard to transactions involving short term investments and certain derivatives. If such transactions were included, the Fund’s portfolio turnover rate may be higher. |
| | (e) | | Amount is less than $0.005 per share. |
| | (f) | | Effective before the opening of business on August 15, 2017, Class IR Shares were designated as Investor Shares. |
| | |
| 140 | | The accompanying notes are an integral part of these financial statements. |
GOLDMAN SACHS HIGH YIELD FUND
| | | | | | | | | | | | | | | | | | | | | | | | | | | | | | | | | | | | | | | | |
| | | | | | | | | | | | | | | | | | | | | | | | | | | | | | | | | | |
| | | Net asset
value, end
of period | | | | | Total
return(b) | | | | | Net assets,
end of
period
(in 000s) | | | | | Ratio of
net expenses
to average
net assets | | | | | Ratio of
total expenses
to average
net assets | | | | | Ratio of
net investment
income
to average
net assets | | | | | Portfolio
turnover
rate(c) | |
| | | | | | | | | | | | | | | | | | | | | | | | | | | | | | | | | | | | | | | | |
| | $ | 6.60 | | | | | | 3.00 | % | | | | $ | 205,032 | | | | | | 1.05 | %(d) | | | | | 1.07 | %(d) | | | | | 5.12 | %(d) | | | | | 34 | % |
| | | 6.60 | | | | | | 2.63 | | | | | | 40,042 | | | | | | 1.80 | (d) | | | | | 1.82 | (d) | | | | | 4.37 | (d) | | | | | 34 | |
| | | 6.61 | | | | | | 3.19 | | | | | | 3,150,758 | | | | | | 0.73 | (d) | | | | | 0.73 | (d) | | | | | 5.45 | (d) | | | | | 34 | |
| | | 6.59 | | | | | | 2.93 | | | | | | 12,216 | | | | | | 1.22 | (d) | | | | | 1.23 | (d) | | | | | 4.94 | (d) | | | | | 34 | |
| | | 6.61 | | | | | | 3.14 | | | | | | 32,263 | | | | | | 0.80 | (d) | | | | | 0.82 | (d) | | | | | 5.37 | (d) | | | | | 34 | |
| | | 6.59 | | | | | | 2.89 | | | | | | 14,820 | | | | | | 1.30 | (d) | | | | | 1.32 | (d) | | | | | 4.86 | (d) | | | | | 34 | |
| | | 6.62 | | | | | | 3.19 | | | | | | 396 | | | | | | 0.70 | (d) | | | | | 0.71 | (d) | | | | | 5.53 | (d) | | | | | 34 | |
| | | | | | | | | | | | | | | | | | | | | | | | | | | | | | | | | | | | | | | | |
| | | 6.57 | | | | | | 15.06 | | | | | | 232,572 | | | | | | 1.07 | | | | | | 1.07 | | | | | | 5.34 | | | | | | 93 | |
| | | 6.57 | | | | | | 14.02 | | | | | | 46,396 | | | | | | 1.82 | | | | | | 1.82 | | | | | | 4.59 | | | | | | 93 | |
| | | 6.58 | | | | | | 15.24 | | | | | | 3,410,302 | | | | | | 0.73 | | | | | | 0.73 | | | | | | 5.67 | | | | | | 93 | |
| | | 6.56 | | | | | | 14.70 | | | | | | 12,089 | | | | | | 1.23 | | | | | | 1.23 | | | | | | 5.17 | | | | | | 93 | |
| | | 6.58 | | | | | | 15.33 | | | | | | 33,482 | | | | | | 0.82 | | | | | | 0.82 | | | | | | 5.64 | | | | | | 93 | |
| | | 6.56 | | | | | | 14.60 | | | | | | 14,817 | | | | | | 1.32 | | | | | | 1.32 | | | | | | 5.08 | | | | | | 93 | |
| | | 6.59 | | | | | | 15.25 | | | | | | 202,273 | | | | | | 0.71 | | | | | | 0.71 | | | | | | 5.69 | | | | | | 93 | |
| | | 6.02 | | | | | | (6.33 | ) | | | | | 340,534 | | | | | | 1.05 | | | | | | 1.06 | | | | | | 5.49 | | | | | | 46 | |
| | | 6.03 | | | | | | (7.01 | ) | | | | | 51,973 | | | | | | 1.80 | | | | | | 1.81 | | | | | | 4.76 | | | | | | 46 | |
| | | 6.04 | | | | | | (5.98 | ) | | | | | 3,221,934 | | | | | | 0.71 | | | | | | 0.72 | | | | | | 5.84 | | | | | | 46 | |
| | | 6.02 | | | | | | (6.35 | ) | | | | | 14,710 | | | | | | 1.21 | | | | | | 1.22 | | | | | | 5.35 | | | | | | 46 | |
| | | 6.03 | | | | | | (6.08 | ) | | | | | 9,302 | | | | | | 0.80 | | | | | | 0.81 | | | | | | 5.76 | | | | | | 46 | |
| | | 6.02 | | | | | | (6.57 | ) | | | | | 15,296 | | | | | | 1.30 | | | | | | 1.31 | | | | | | 5.26 | | | | | | 46 | |
| | | 6.05 | | | | | | (5.29 | ) | | | | | 162,768 | | | | | | 0.70 | (d) | | | | | 0.71 | (d) | | | | | 6.02 | (d) | | | | | 46 | |
| | | 6.80 | | | | | | 1.21 | | | | | | 483,328 | | | | | | 1.06 | | | | | | 1.06 | | | | | | 5.30 | | | | | | 55 | |
| | | 6.81 | | | | | | 0.46 | | | | | | 71,577 | | | | | | 1.81 | | | | | | 1.81 | | | | | | 4.54 | | | | | | 55 | |
| | | 6.82 | | | | | | 1.56 | | | | | | 4,975,618 | | | | | | 0.72 | | | | | | 0.72 | | | | | | 5.62 | | | | | | 55 | |
| | | 6.79 | | | | | | 0.90 | | | | | | 17,506 | | | | | | 1.22 | | | | | | 1.22 | | | | | | 5.12 | | | | | | 55 | |
| | | 6.81 | | | | | | 1.32 | | | | | | 13,971 | | | | | | 0.81 | | | | | | 0.81 | | | | | | 5.54 | | | | | | 55 | |
| | | 6.80 | | | | | | 0.95 | | | | | | 17,417 | | | | | | 1.31 | | | | | | 1.31 | | | | | | 5.03 | | | | | | 55 | |
| | | 7.23 | | | | | | 7.41 | | | | | | 549,354 | | | | | | 1.05 | | | | | | 1.05 | | | | | | 5.95 | | | | | | 48 | |
| | | 7.24 | | | | | | 6.61 | | | | | | 88,607 | | | | | | 1.81 | | | | | | 1.81 | | | | | | 5.21 | | | | | | 48 | |
| | | 7.25 | | | | | | 7.77 | | | | | | 4,436,484 | | | | | | 0.72 | | | | | | 0.72 | | | | | | 6.30 | | | | | | 48 | |
| | | 7.23 | | | | | | 7.24 | | | | | | 17,066 | | | | | | 1.22 | | | | | | 1.22 | | | | | | 5.79 | | | | | | 48 | |
| | | 7.25 | | | | | | 7.68 | | | | | | 15,142 | | | | | | 0.81 | | | | | | 0.81 | | | | | | 6.22 | | | | | | 48 | |
| | | 7.23 | | | | | | 7.14 | | | | | | 18,075 | | | | | | 1.31 | | | | | | 1.31 | | | | | | 5.70 | | | | | | 48 | |
| | | 7.40 | | | | | | 12.67 | | | | | | 576,060 | | | | | | 1.05 | | | | | | 1.05 | | | | | | 6.27 | | | | | | 68 | |
| | | 7.41 | | | | | | 11.83 | | | | | | 106,063 | | | | | | 1.80 | | | | | | 1.80 | | | | | | 5.52 | | | | | | 68 | |
| | | 7.42 | | | | | | 13.03 | | | | | | 5,167,948 | | | | | | 0.71 | | | | | | 0.71 | | | | | | 6.61 | | | | | | 68 | |
| | | 7.40 | | | | | | 12.65 | | | | | | 17,512 | | | | | | 1.21 | | | | | | 1.21 | | | | | | 6.11 | | | | | | 68 | |
| | | 7.41 | | | | | | 13.09 | | | | | | 19,711 | | | | | | 0.80 | | | | | | 0.80 | | | | | | 6.55 | | | | | | 68 | |
| | | 7.40 | | | | | | 12.39 | | | | | | 18,565 | | | | | | 1.30 | | | | | | 1.30 | | | | | | 6.01 | | | | | | 68 | |
| | |
| The accompanying notes are an integral part of these financial statements. | | 141 |
GOLDMAN SACHS HIGH YIELD FLOATING RATE FUND
Financial Highlights
Selected Data for a Share Outstanding Throughout Each Period
| | | | | | | | | | | | | | | | | | | | | | | | | | | | | | | | | | |
| | | | | | From
Investment Operations | | | Distributions
to shareholders | |
| | | Year - Share Class | | Net asset
value,
beginning
of period | | | Net
investment
income(a) | | | Net realized
and unrealized
gain (loss) | | | Total from
investment
operations | | | From net
investment
income | | | From net
realized
gains | | | From
capital | | | Total
distributions | |
| | FOR THE SIX MONTHS ENDED SEPTEMBER 30, (UNAUDITED) | |
| | 2017 - A | | $ | 9.72 | | | $ | 0.19 | | | $ | (0.04 | ) | | $ | 0.15 | | | $ | (0.18 | ) | | $ | — | | | $ | — | | | $ | (0.18 | ) |
| | 2017 - C | | | 9.72 | | | | 0.15 | | | | (0.03 | ) | | | 0.12 | | | | (0.15 | ) | | | — | | | | — | | | | (0.15 | ) |
| | 2017 - Institutional | | | 9.73 | | | | 0.20 | | | | (0.03 | ) | | | 0.17 | | | | (0.20 | ) | | | — | | | | — | | | | (0.20 | ) |
| | 2017 - Investor(f) | | | 9.73 | | | | 0.20 | | | | (0.03 | ) | | | 0.17 | | | | (0.20 | ) | | | — | | | | — | | | | (0.20 | ) |
| | 2017 - R | | | 9.73 | | | | 0.17 | | | | (0.04 | ) | | | 0.13 | | | | (0.17 | ) | | | — | | | | — | | | | (0.17 | ) |
| | | | | | | | | | | | | | | | | | | | | | | | | | | | | | | | | | |
| | FOR THE FISCAL YEARS ENDED MARCH 31, | |
| | 2017 - A | | | 9.46 | | | | 0.37 | | | | 0.26 | | | | 0.63 | | | | (0.36 | ) | | | — | | | | (0.01 | ) | | | (0.37 | ) |
| | 2017 - C | | | 9.46 | | | | 0.30 | | | | 0.26 | | | | 0.56 | | | | (0.29 | ) | | | — | | | | (0.01 | ) | | | (0.30 | ) |
| | 2017 - Institutional | | | 9.47 | | | | 0.40 | | | | 0.27 | | | | 0.67 | | | | (0.40 | ) | | | — | | | | (0.01 | ) | | | (0.41 | ) |
| | 2017 - Investor(f) | | | 9.48 | | | | 0.39 | | | | 0.26 | | | | 0.65 | | | | (0.39 | ) | | | — | | | | (0.01 | ) | | | (0.40 | ) |
| | 2017 - R | | | 9.46 | | | | 0.35 | | | | 0.27 | | | | 0.62 | | | | (0.34 | ) | | | — | | | | (0.01 | ) | | | (0.35 | ) |
| | 2016 - A | | | 9.92 | | | | 0.37 | | | | (0.46 | ) | | | (0.09 | ) | | | (0.37 | ) | | | — | | | | — | | | | (0.37 | ) |
| | 2016 - C | | | 9.92 | | | | 0.30 | | | | (0.46 | ) | | | (0.16 | ) | | | (0.30 | ) | | | — | | | | — | | | | (0.30 | ) |
| | 2016 - Institutional | | | 9.93 | | | | 0.40 | | | | (0.46 | ) | | | (0.06 | ) | | | (0.40 | ) | | | — | | | | — | | | | (0.40 | ) |
| | 2016 - Investor(f) | | | 9.94 | | | | 0.39 | | | | (0.45 | ) | | | (0.06 | ) | | | (0.40 | ) | | | — | | | | — | | | | (0.40 | ) |
| | 2016 - R | | | 9.92 | | | | 0.35 | | | | (0.46 | ) | | | (0.11 | ) | | | (0.35 | ) | | | — | | | | — | | | | (0.35 | ) |
| | 2015 - A | | | 10.07 | | | | 0.34 | | | | (0.14 | ) | | | 0.20 | | | | (0.35 | ) | | | — | (e) | | | — | | | | (0.35 | ) |
| | 2015 - C | | | 10.08 | | | | 0.27 | | | | (0.15 | ) | | | 0.12 | | | | (0.28 | ) | | | — | (e) | | | — | | | | (0.28 | ) |
| | 2015 - Institutional | | | 10.09 | | | | 0.38 | | | | (0.16 | ) | | | 0.22 | | | | (0.38 | ) | | | — | (e) | | | — | | | | (0.38 | ) |
| | 2015 - Investor(f) | | | 10.09 | | | | 0.37 | | | | (0.14 | ) | | | 0.23 | | | | (0.38 | ) | | | — | (e) | | | — | | | | (0.38 | ) |
| | 2015 - R | | | 10.08 | | | | 0.32 | | | | (0.15 | ) | | | 0.17 | | | | (0.33 | ) | | | — | (e) | | | — | | | | (0.33 | ) |
| | 2014 - A | | | 10.11 | | | | 0.33 | | | | (0.02 | ) | | | 0.31 | | | | (0.33 | ) | | | (0.02 | ) | | | — | | | | (0.35 | ) |
| | 2014 - C | | | 10.12 | | | | 0.26 | | | | (0.03 | ) | | | 0.23 | | | | (0.25 | ) | | | (0.02 | ) | | | — | | | | (0.27 | ) |
| | 2014 - Institutional | | | 10.13 | | | | 0.37 | | | | (0.03 | ) | | | 0.34 | | | | (0.36 | ) | | | (0.02 | ) | | | — | | | | (0.38 | ) |
| | 2014 - Investor(f) | | | 10.13 | | | | 0.36 | | | | (0.03 | ) | | | 0.33 | | | | (0.35 | ) | | | (0.02 | ) | | | — | | | | (0.37 | ) |
| | 2014 - R | | | 10.12 | | | | 0.31 | | | | (0.03 | ) | | | 0.28 | | | | (0.30 | ) | | | (0.02 | ) | | | — | | | | (0.32 | ) |
| | 2013 - A | | | 9.91 | | | | 0.37 | | | | 0.20 | | | | 0.57 | | | | (0.36 | ) | | | — | | | | (0.01 | ) | | | (0.37 | ) |
| | 2013 - C | | | 9.90 | | | | 0.29 | | | | 0.23 | | | | 0.52 | | | | (0.29 | ) | | | — | | | | (0.01 | ) | | | (0.30 | ) |
| | 2013 - Institutional | | | 9.91 | | | | 0.40 | | | | 0.23 | | | | 0.63 | | | | (0.40 | ) | | | — | | | | (0.01 | ) | | | (0.41 | ) |
| | 2013 - Investor(f) | | | 9.91 | | | | 0.40 | | | | 0.22 | | | | 0.62 | | | | (0.39 | ) | | | — | | | | (0.01 | ) | | | (0.40 | ) |
| | 2013 - R | | | 9.91 | | | | 0.35 | | | | 0.21 | | | | 0.56 | | | | (0.34 | ) | | | — | | | | (0.01 | ) | | | (0.35 | ) |
| | (a) | | Calculated based on the average shares outstanding methodology. |
| | (b) | | Assumes investment at the NAV at the beginning of the period, reinvestment of all dividends and distributions, a complete redemption of the investment at the NAV at the end of the period and no sales or redemption charges. Total returns would be reduced if a sales or redemption charge was taken into account. Returns do not reflect the impact of taxes to shareholder relating to Fund distributions or the redemption of Fund shares. Total returns for periods less than one full year are not annualized. |
| | (c) | | The Fund’s portfolio turnover rate is calculated in accordance with regulatory requirements, without regard to transactions involving short term investments and certain derivatives. If such transactions were included, the Fund’s portfolio turnover rate may be higher. |
| | (e) | | Amount is less than $0.005 per share. |
| | (f) | | Effective before the opening of business on August 15, 2017, Class IR Shares were designated as Investor Shares. |
| | |
| 142 | | The accompanying notes are an integral part of these financial statements. |
GOLDMAN SACHS HIGH YIELD FLOATING RATE FUND
| | | | | | | | | | | | | | | | | | | | | | | | | | | | | | | | | | | | | | | | |
| | | | | | | | | | | | | | | | | | | | | | | | | | | | | | | | | | |
| | | Net asset
value, end
of period | | | | | Total
return(b) | | | | | Net assets,
end of
period
(in 000s) | | | | | Ratio of
net expenses
to average
net assets | | | | | Ratio of
total expenses
to average
net assets | | | | | Ratio of
net investment
income
to average
net assets | | | | | Portfolio
turnover
rate(c) | |
| | | | | | | | | | | | | | | | | | | | | | | | | | | | | | | | | | | | | | | | |
| | $ | 9.69 | | | | | | 1.49 | % | | | | $ | 4,549 | | | | | | 0.94 | %(d) | | | | | 0.96 | %(d) | | | | | 3.83 | %(d) | | | | | 14 | % |
| | | 9.69 | | | | | | 1.11 | | | | | | 2,447 | | | | | | 1.69 | (d) | | | | | 1.70 | (d) | | | | | 3.07 | (d) | | | | | 14 | |
| | | 9.70 | | | | | | 1.76 | | | | | | 4,223,687 | | | | | | 0.60 | (d) | | | | | 0.61 | (d) | | | | | 4.15 | (d) | | | | | 14 | |
| | | 9.70 | | | | | | 1.61 | | | | | | 3,445 | | | | | | 0.68 | (d) | | | | | 0.70 | (d) | | | | | 4.05 | (d) | | | | | 14 | |
| | | 9.69 | | | | | | 1.37 | | | | | | 12 | | | | | | 1.16 | (d) | | | | | 1.18 | (d) | | | | | 3.58 | (d) | | | | | 14 | |
| | | | | | | | | | | | | | | | | | | | | | | | | | | | | | | | | | | | | | | | |
| | | | | | | | | | | | | | | | | | | | | | | | | | | | | | | | | | | | | | | | |
| | | 9.72 | | | | | | 6.87 | | | | | | 7,030 | | | | | | 0.95 | | | | | | 0.96 | | | | | | 3.83 | | | | | | 55 | |
| | | 9.72 | | | | | | 6.07 | | | | | | 2,610 | | | | | | 1.70 | | | | | | 1.71 | | | | | | 3.06 | | | | | | 55 | |
| | | 9.73 | | | | | | 7.12 | | | | | | 3,896,724 | | | | | | 0.61 | | | | | | 0.62 | | | | | | 4.16 | | | | | | 55 | |
| | | 9.73 | | | | | | 7.02 | | | | | | 4,125 | | | | | | 0.70 | | | | | | 0.71 | | | | | | 4.00 | | | | | | 55 | |
| | | 9.73 | | | | | | 6.61 | | | | | | 12 | | | | | | 1.19 | | | | | | 1.20 | | | | | | 3.59 | | | | | | 55 | |
| | | 9.46 | | | | | | (0.89 | ) | | | | | 6,668 | | | | | | 0.95 | | | | | | 0.96 | | | | | | 3.80 | | | | | | 42 | |
| | | 9.46 | | | | | | (1.63 | ) | | | | | 1,760 | | | | | | 1.70 | | | | | | 1.72 | | | | | | 3.09 | | | | | | 42 | |
| | | 9.47 | | | | | | (0.55 | ) | | | | | 3,217,752 | | | | | | 0.61 | | | | | | 0.63 | | | | | | 4.17 | | | | | | 42 | |
| | | 9.48 | | | | | | (0.64 | ) | | | | | 1,237 | | | | | | 0.70 | | | | | | 0.72 | | | | | | 4.10 | | | | | | 42 | |
| | | 9.46 | | | | | | (1.13 | ) | | | | | 11 | | | | | | 1.19 | | | | | | 1.20 | | | | | | 3.60 | | | | | | 42 | |
| | | 9.92 | | | | | | 2.01 | | | | | | 6,193 | | | | | | 0.94 | | | | | | 0.95 | | | | | | 3.38 | | | | | | 55 | |
| | | 9.92 | | | | | | 1.15 | | | | | | 1,936 | | | | | | 1.69 | | | | | | 1.70 | | | | | | 2.71 | | | | | | 55 | |
| | | 9.93 | | | | | | 2.26 | | | | | | 4,087,016 | | | | | | 0.60 | | | | | | 0.61 | | | | | | 3.81 | | | | | | 55 | |
| | | 9.94 | | | | | | 2.27 | | | | | | 811 | | | | | | 0.70 | | | | | | 0.71 | | | | | | 3.72 | | | | | | 55 | |
| | | 9.92 | | | | | | 1.67 | | | | | | 11 | | | | | | 1.16 | | | | | | 1.17 | | | | | | 3.23 | | | | | | 55 | |
| | | 10.07 | | | | | | 3.09 | | | | | | 24,741 | | | | | | 0.96 | | | | | | 0.97 | | | | | | 3.28 | | | | | | 44 | |
| | | 10.08 | | | | | | 2.33 | | | | | | 2,465 | | | | | | 1.72 | | | | | | 1.73 | | | | | | 2.58 | | | | | | 44 | |
| | | 10.09 | | | | | | 3.45 | | | | | | 4,171,873 | | | | | | 0.63 | | | | | | 0.63 | | | | | | 3.65 | | | | | | 44 | |
| | | 10.09 | | | | | | 3.36 | | | | | | 1,631 | | | | | | 0.72 | | | | | | 0.73 | | | | | | 3.59 | | | | | | 44 | |
| | | 10.08 | | | | | | 2.83 | | | | | | 11 | | | | | | 1.21 | | | | | | 1.22 | | | | | | 3.08 | | | | | | 44 | |
| | | 10.11 | | | | | | 5.89 | | | | | | 8,367 | | | | | | 1.04 | | | | | | 1.04 | | | | | | 3.69 | | | | | | 72 | |
| | | 10.12 | | | | | | 5.31 | | | | | | 1,648 | | | | | | 1.79 | | | | | | 1.79 | | | | | | 2.93 | | | | | | 72 | |
| | | 10.13 | | | | | | 6.47 | | | | | | 1,710,411 | | | | | | 0.70 | | | | | | 0.70 | | | | | | 3.99 | | | | | | 72 | |
| | | 10.13 | | | | | | 6.36 | | | | | | 4,116 | | | | | | 0.80 | | | | | | 0.80 | | | | | | 4.00 | | | | | | 72 | |
| | | 10.12 | | | | | | 5.73 | | | | | | 11 | | | | | | 1.28 | | | | | | 1.29 | | | | | | 3.47 | | | | | | 72 | |
| | |
| The accompanying notes are an integral part of these financial statements. | | 143 |
GOLDMAN SACHS INVESTMENT GRADE CREDIT FUND
Financial Highlights
Selected Data for a Share Outstanding Throughout Each Period
| | | | | | | | | | | | | | | | | | | | | | | | | | | | | | |
| | | | | | From
Investment Operations | | | Distributions
to shareholders | |
| | | Year - Share Class | | Net asset
value,
beginning
of period | | | Net
investment
income(a) | | | Net realized
and unrealized
gain (loss) | | | Total from
investment
operations | | | From net
investment
income | | | From net
realized
gains | | | Total
distributions | |
| | FOR THE SIX MONTHS ENDED SEPTEMBER 30, (UNAUDITED) | |
2017 - A | | | | $ | 9.06 | | | $ | 0.13 | | | $ | 0.21 | | | $ | 0.34 | | | $ | (0.13 | ) | | $ | — | | | $ | (0.13 | ) |
2017 - Institutional | | | | | 9.06 | | | | 0.15 | | | | 0.21 | | | | 0.36 | | | | (0.15 | ) | | | — | | | | (0.15 | ) |
| | 2017 - Separate Account Institutional | | | 9.07 | | | | 0.15 | | | | 0.21 | | | | 0.36 | | | | (0.15 | ) | | | — | | | | (0.15 | ) |
2017 - Investor(e) | | | | | 9.07 | | | | 0.14 | | | | 0.21 | | | | 0.35 | | | | (0.14 | ) | | | — | | | | (0.14 | ) |
| | 2017 - R6 | | | 9.07 | | | | 0.15 | | | | 0.21 | | | | 0.36 | | | | (0.15 | ) | | | — | | | | (0.15 | ) |
| | | | | | | | | | | | | | | | | | | | | | | | | | | | | | |
| | FOR THE FISCAL YEARS ENDED MARCH 31, | |
2017 - A | | | | | 9.08 | | | | 0.27 | | | | (0.02 | ) | | | 0.25 | | | | (0.27 | ) | | | — | | | | (0.27 | ) |
2017 - Institutional | | | | | 9.08 | | | | 0.30 | (e) | | | (0.02 | ) | | | 0.28 | | | | (0.30 | ) | | | — | | | | (0.30 | ) |
| | 2017 - Separate Account Institutional | | | 9.09 | | | | 0.30 | (e) | | | (0.02 | ) | | | 0.28 | | | | (0.30 | ) | | | — | | | | (0.30 | ) |
2017 - Investor(e) | | | | | 9.09 | | | | 0.29 | | | | (0.02 | ) | | | 0.27 | | | | (0.29 | ) | | | — | | | | (0.29 | ) |
2017 - R6 | | | | | 9.08 | | | | 0.30 | | | | (0.01 | ) | | | 0.29 | | | | (0.30 | ) | | | — | | | | (0.30 | ) |
2016 - A | | | | | 9.47 | | | | 0.30 | | | | (0.36 | ) | | | (0.06 | ) | | | (0.29 | ) | | | (0.04 | ) | | | (0.33 | ) |
2016 - Institutional | | | | | 9.48 | | | | 0.33 | | | | (0.37 | ) | | | (0.04 | ) | | | (0.32 | ) | | | (0.04 | ) | | | (0.36 | ) |
| | 2016 - Separate Account Institutional | | | 9.48 | | | | 0.33 | | | | (0.36 | ) | | | (0.03 | ) | | | (0.32 | ) | | | (0.04 | ) | | | (0.36 | ) |
2016 - Investor(e) | | | | | 9.48 | | | | 0.32 | | | | (0.35 | ) | | | (0.03 | ) | | | (0.32 | ) | | | (0.04 | ) | | | (0.36 | ) |
2016 - R6 (Commenced July 31, 2015) | | | | | 9.13 | | | | 0.22 | | | | (0.02 | ) | | | 0.20 | | | | (0.21 | ) | | | (0.04 | ) | | | (0.25 | ) |
2015 - A | | | | | 9.39 | | | | 0.29 | | | | 0.26 | | | | 0.55 | | | | (0.29 | ) | | | (0.18 | ) | | | (0.47 | ) |
2015 - Institutional | | | | | 9.39 | | | | 0.32 | | | | 0.27 | | | | 0.59 | | | | (0.32 | ) | | | (0.18 | ) | | | (0.50 | ) |
| | 2015 - Separate Account Institutional | | | 9.39 | | | | 0.32 | | | | 0.27 | | | | 0.59 | | | | (0.32 | ) | | | (0.18 | ) | | | (0.50 | ) |
2015 - Investor(e) | | | | | 9.39 | | | | 0.31 | | | | 0.27 | | | | 0.58 | | | | (0.31 | ) | | | (0.18 | ) | | | (0.49 | ) |
2014 - A | | | | | 9.71 | | | | 0.30 | | | | (0.18 | ) | | | 0.12 | | | | (0.30 | ) | | | (0.14 | ) | | | (0.44 | ) |
2014 - Institutional | | | | | 9.71 | | | | 0.34 | | | | (0.18 | ) | | | 0.16 | | | | (0.34 | ) | | | (0.14 | ) | | | (0.48 | ) |
| | 2014 - Separate Account Institutional | | | 9.71 | | | | 0.33 | | | | (0.17 | ) | | | 0.16 | | | | (0.34 | ) | | | (0.14 | ) | | | (0.48 | ) |
2014 - Investor(e) | | | | | 9.71 | | | | 0.32 | | | | (0.17 | ) | | | 0.15 | | | | (0.33 | ) | | | (0.14 | ) | | | (0.47 | ) |
2013 - A | | | | | 9.53 | | | | 0.31 | | | | 0.51 | | | | 0.82 | | | | (0.31 | ) | | | (0.33 | ) | | | (0.64 | ) |
2013 - Institutional | | | | | 9.53 | | | | 0.34 | | | | 0.52 | | | | 0.86 | | | | (0.35 | ) | | | (0.33 | ) | | | (0.68 | ) |
| | 2013 - Separate Account Institutional | | | 9.53 | | | | 0.34 | | | | 0.52 | | | | 0.86 | | | | (0.35 | ) | | | (0.33 | ) | | | (0.68 | ) |
2013 - Investor(e) | | | | | 9.53 | | | | 0.34 | | | | 0.51 | | | | 0.85 | | | | (0.34 | ) | | | (0.33 | ) | | | (0.67 | ) |
| | (a) | | Calculated based on the average shares outstanding methodology. |
| | (b) | | Assumes investment at the NAV at the beginning of the period, reinvestment of all dividends and distributions, a complete redemption of the investment at the NAV at the end of the period and no sales or redemption charges. Total returns would be reduced if a sales or redemption charge was taken into account. Returns do not reflect the impact of taxes to shareholder relating to Fund distributions or the redemption of Fund shares. Total returns for periods less than one full year are not annualized. |
| | (c) | | The Fund’s portfolio turnover rate is calculated in accordance with regulatory requirements, without regard to transactions involving short term investments and certain derivatives. If such transactions were included, the Fund’s portfolio turnover rate may be higher. |
| | (e) | | Effective before the opening of business on August 15, 2017, Class IR Shares were designated as Investor Shares. |
| | |
| 144 | | The accompanying notes are an integral part of these financial statements. |
GOLDMAN SACHS INVESTMENT GRADE CREDIT FUND
| | | | | | | | | | | | | | | | | | | | | | | | | | | | | | | | | | | | | | | | |
| | | | | | | | | | | | | | | | | | | | | | | | | | | | | | | | | | |
| | | Net asset
value, end
of period | | | | | Total
return(b) | | | | | Net assets,
end of
period
(in 000s) | | | | | Ratio of
net expenses
to average
net assets | | | | | Ratio of
total expenses
to average
net assets | | | | | Ratio of
net investment
income
to average
net assets | | | | | Portfolio
turnover
rate(c) | |
| | | | | | | | | | | | | | | | | | | | | | | | | | | | | | | | | | | | | | | | |
| | $ | 9.27 | | | | | | 3.80 | % | | | | $ | 11,116 | | | | | | 0.72 | %(d) | | | | | 0.85 | %(d) | | | | | 2.86 | %(d) | | | | | 33 | % |
| | | 9.27 | | | | | | 3.98 | | | | | | 169,772 | | | | | | 0.38 | (d) | | | | | 0.50 | (d) | | | | | 3.18 | (d) | | | | | 33 | |
| | | 9.28 | | | | | | 3.98 | | | | | | 226,852 | | | | | | 0.38 | (d) | | | | | 0.50 | (d) | | | | | 3.18 | (d) | | | | | 33 | |
| | | 9.28 | | | | | | 3.93 | | | | | | 4,291 | | | | | | 0.47 | (d) | | | | | 0.59 | (d) | | | | | 3.09 | (d) | | | | | 33 | |
| | | 9.28 | | | | | | 3.98 | | | | | | 17 | | | | | | 0.37 | (d) | | | | | 0.49 | (d) | | | | | 3.19 | (d) | | | | | 33 | |
| | | | | | | | | | | | | | | | | | | | | | | | | | | | | | | | | | | | | | | | |
| | | | | | | | | | | | | | | | | | | | | | | | | | | | | | | | | | | | | | | | |
| | | 9.06 | | | | | | 2.75 | | | | | | 32,514 | | | | | | 0.72 | | | | | | 0.87 | | | | | | 2.93 | | | | | | 63 | |
| | | 9.06 | | | | | | 3.10 | | | | | | 142,218 | | | | | | 0.38 | | | | | | 0.53 | | | | | | 3.28 | | | | | | 63 | |
| | | 9.07 | | | | | | 3.10 | | | | | | 249,971 | | | | | | 0.38 | | | | | | 0.53 | | | | | | 3.28 | | | | | | 63 | |
| | | 9.07 | | | | | | 3.01 | | | | | | 4,062 | | | | | | 0.47 | | | | | | 0.61 | | | | | | 3.18 | | | | | | 63 | |
| | | 9.07 | | | | | | 3.23 | | | | | | 12 | | | | | | 0.38 | | | | | | 0.51 | | | | | | 3.28 | | | | | | 63 | |
| | | 9.08 | | | | | | (0.53 | ) | | | | | 28,037 | | | | | | 0.72 | | | | | | 0.86 | | | | | | 3.28 | | | | | | 79 | |
| | | 9.08 | | | | | | (0.29 | ) | | | | | 156,202 | | | | | | 0.38 | | | | | | 0.52 | | | | | | 3.62 | | | | | | 79 | |
| | | 9.09 | | | | | | (0.18 | ) | | | | | 239,713 | | | | | | 0.38 | | | | | | 0.52 | | | | | | 3.62 | | | | | | 79 | |
| | | 9.09 | | | | | | (0.27 | ) | | | | | 1,080 | | | | | | 0.47 | | | | | | 0.61 | | | | | | 3.53 | | | | | | 79 | |
| | | 9.08 | | | | | | 2.28 | | | | | | 10 | | | | | | 0.38 | (d) | | | | | 0.53 | (d) | | | | | 3.61 | (d) | | | | | 79 | |
| | | 9.47 | | | | | | 5.94 | | | | | | 29,522 | | | | | | 0.72 | | | | | | 0.86 | | | | | | 3.07 | | | | | | 84 | |
| | | 9.48 | | | | | | 6.41 | | | | | | 177,283 | | | | | | 0.38 | | | | | | 0.52 | | | | | | 3.41 | | | | | | 84 | |
| | | 9.48 | | | | | | 6.41 | | | | | | 259,668 | | | | | | 0.38 | | | | | | 0.52 | | | | | | 3.40 | | | | | | 84 | |
| | | 9.48 | | | | | | 6.32 | | | | | | 1,075 | | | | | | 0.47 | | | | | | 0.61 | | | | | | 3.31 | | | | | | 84 | |
| | | 9.39 | | | | | | 1.41 | | | | | | 24,839 | | | | | | 0.72 | | | | | | 0.85 | | | | | | 3.22 | | | | | | 86 | |
| | | 9.39 | | | | | | 1.76 | | | | | | 165,755 | | | | | | 0.38 | | | | | | 0.51 | | | | | | 3.57 | | | | | | 86 | |
| | | 9.39 | | | | | | 1.76 | | | | | | 286,845 | | | | | | 0.38 | | | | | | 0.51 | | | | | | 3.56 | | | | | | 86 | |
| | | 9.39 | | | | | | 1.66 | | | | | | 552 | | | | | | 0.47 | | | | | | 0.60 | | | | | | 3.37 | | | | | | 86 | |
| | | 9.71 | | | | | | 8.73 | | | | | | 30,216 | | | | | | 0.71 | | | | | | 0.84 | | | | | | 3.17 | | | | | | 162 | |
| | | 9.71 | | | | | | 9.09 | | | | | | 274,095 | | | | | | 0.37 | | | | | | 0.50 | | | | | | 3.51 | | | | | | 162 | |
| | | 9.71 | | | | | | 9.09 | | | | | | 289,032 | | | | | | 0.37 | | | | | | 0.50 | | | | | | 3.51 | | | | | | 162 | |
| | | 9.71 | | | | | | 8.99 | | | | | | 723 | | | | | | 0.47 | | | | | | 0.59 | | | | | | 3.46 | | | | | | 162 | |
| | |
| The accompanying notes are an integral part of these financial statements. | | 145 |
GOLDMAN SACHS LOCAL EMERGING MARKETS DEBT FUND
Financial Highlights
Selected Data for a Share Outstanding Throughout Each Period
| | | | | | | | | | | | | | | | | | | | | | | | | | | | | | | | | | |
| | | | | | | | From
Investment Operations | | | Distributions
to shareholders | |
| | | Year - Share Class | | Net asset
value,
beginning
of period | | | Net
investment
income(a) | | | Net realized
and unrealized
gain (loss) | | | Total from
investment
operations | | | From net
investment
income | | | From net
realized
gains | | | From
capital | | | Total
distributions | |
| | FOR THE SIX MONTHS ENDED SEPTEMBER 30, (UNAUDITED) | |
| | 2017 - A | | $ | 6.38 | | | $ | 0.17 | | | $ | 0.30 | | | $ | 0.47 | | | $ | (0.19 | ) | | $ | — | | | $ | — | | | $ | (0.19 | ) |
| | 2017 - C | | | 6.38 | | | | 0.15 | | | | 0.29 | | | | 0.44 | | | | (0.17 | ) | | | — | | | | — | | | | (0.17 | ) |
| | 2017 - Institutional | | | 6.37 | | | | 0.18 | | | | 0.29 | | | | 0.47 | | | | (0.20 | ) | | | — | | | | — | | | | (0.20 | ) |
| | 2017 - Investor(e) | | | 6.37 | | | | 0.18 | | | | 0.29 | | | | 0.47 | | | | (0.20 | ) | | | — | | | | — | | | | (0.20 | ) |
| | | | | | | | | | | | | | | | | | | | | | | | | | | | | | | | | | |
| | FOR THE FISCAL YEARS ENDED MARCH 31, | |
| | 2017 - A | | | 6.36 | | | | 0.33 | | | | 0.04 | | | | 0.37 | | | | — | | | | — | | | | (0.35 | ) | | | (0.35 | ) |
| | 2017 - C | | | 6.37 | | | | 0.27 | | | | 0.04 | | | | 0.31 | | | | — | | | | — | | | | (0.30 | ) | | | (0.30 | ) |
| | 2017 - Institutional | | | 6.36 | | | | 0.34 | | | | 0.04 | | | | 0.38 | | | | — | | | | — | | | | (0.37 | ) | | | (0.37 | ) |
| | 2017 - Investor(e) | | | 6.35 | | | | 0.33 | | | | 0.06 | | | | 0.39 | | | | — | | | | — | | | | (0.37 | ) | | | (0.37 | ) |
| | 2016 - A | | | 6.96 | | | | 0.34 | | | | (0.60 | ) | | | (0.26 | ) | | | — | | | | — | | | | (0.34 | ) | | | (0.34 | ) |
| | 2016 - C | | | 6.98 | | | | 0.29 | | | | (0.61 | ) | | | (0.32 | ) | | | — | | | | — | | | | (0.29 | ) | | | (0.29 | ) |
| | 2016 - Institutional | | | 6.97 | | | | 0.37 | | | | (0.62 | ) | | | (0.25 | ) | | | — | | | | — | | | | (0.36 | ) | | | (0.36 | ) |
| | 2016 - Investor(e) | | | 6.96 | | | | 0.34 | | | | (0.59 | ) | | | (0.25 | ) | | | — | | | | — | | | | (0.36 | ) | | | (0.36 | ) |
| | 2015 - A | | | 8.43 | | | | 0.37 | | | | (1.41 | ) | | | (1.04 | ) | | | — | | | | — | | | | (0.43 | ) | | | (0.43 | ) |
| | 2015 - C | | | 8.44 | | | | 0.33 | | | | (1.42 | ) | | | (1.09 | ) | | | — | | | | — | | | | (0.37 | ) | | | (0.37 | ) |
| | 2015 - Institutional | | | 8.43 | | | | 0.41 | | | | (1.41 | ) | | | (1.00 | ) | | | — | | | | — | | | | (0.46 | ) | | | (0.46 | ) |
| | 2015 - Investor(e) | | | 8.43 | | | | 0.41 | | | | (1.43 | ) | | | (1.02 | ) | | | — | | | | — | | | | (0.45 | ) | | | (0.45 | ) |
| | 2014 - A | | | 9.71 | | | | 0.40 | | | | (1.27 | ) | | | (0.87 | ) | | | (0.03 | ) | | | (0.13 | ) | | | (0.25 | ) | | | (0.41 | ) |
| | 2014 - C | | | 9.72 | | | | 0.34 | | | | (1.28 | ) | | | (0.94 | ) | | | — | | | | (0.13 | ) | | | (0.21 | ) | | | (0.34 | ) |
| | 2014 - Institutional | | | 9.71 | | | | 0.43 | | | | (1.27 | ) | | | (0.84 | ) | | | (0.06 | ) | | | (0.13 | ) | | | (0.25 | ) | | | (0.44 | ) |
| | 2014 - Investor(e) | | | 9.71 | | | | 0.42 | | | | (1.27 | ) | | | (0.85 | ) | | | (0.05 | ) | | | (0.13 | ) | | | (0.25 | ) | | | (0.43 | ) |
| | 2013 - A | | | 9.38 | | | | 0.45 | | | | 0.38 | | | | 0.83 | | | | (0.46 | ) | | | (0.04 | ) | | | — | | | | (0.50 | ) |
| | 2013 - C | | | 9.40 | | | | 0.38 | | | | 0.37 | | | | 0.75 | | | | (0.39 | ) | | | (0.04 | ) | | | — | | | | (0.43 | ) |
| | 2013 - Institutional | | | 9.38 | | | | 0.48 | | | | 0.38 | | | | 0.86 | | | | (0.49 | ) | | | (0.04 | ) | | | — | | | | (0.53 | ) |
| | 2013 - Investor(e) | | | 9.38 | | | | 0.47 | | | | 0.38 | | | | 0.85 | | | | (0.48 | ) | | | (0.04 | ) | | | — | | | | (0.52 | ) |
| | (a) | | Calculated based on the average shares outstanding methodology. |
| | (b) | | Assumes investment at the NAV at the beginning of the period, reinvestment of all dividends and distributions, a complete redemption of the investment at the NAV at the end of the period and no sales or redemption charges. Total returns would be reduced if a sales or redemption charge was taken into account. Returns do not reflect the impact of taxes to shareholder relating to Fund distributions or the redemption of Fund shares. Total returns for periods less than one full year are not annualized. |
| | (c) | | The Fund’s portfolio turnover rate is calculated in accordance with regulatory requirements, without regard to transactions involving short term investments and certain derivatives. If such transactions were included, the Fund’s portfolio turnover rate may be higher. |
| | (e) | | Effective before the opening of business on August 15, 2017, Class IR Shares were designated as Investor Shares. |
| | |
| 146 | | The accompanying notes are an integral part of these financial statements. |
GOLDMAN SACHS LOCAL EMERGING MARKETS DEBT FUND
| | | | | | | | | | | | | | | | | | | | | | | | | | | | | | | | | | | | | | | | |
| | | | | | | | | | | | | | | | | | | | | | | | | | | | | | | | | | |
| | | Net asset
value, end
of period | | | | | Total
return(b) | | | | | Net assets,
end of
period
(in 000s) | | | | | Ratio of
net expenses
to average
net assets | | | | | Ratio of
total expenses
to average
net assets | | | | | Ratio of
net investment
income
to average
net assets | | | | | Portfolio
turnover
rate(c) | |
| | | | | | | | | | | | | | | | | | | | | | | | | | | | | | | | | | | | | | | | |
| | $ | 6.66 | | | | | | 7.27 | % | | | | $ | 6,876 | | | | | | 1.22 | %(d) | | | | | 1.52 | %(d) | | | | | 5.25 | %(d) | | | | | 47 | % |
| | | 6.65 | | | | | | 6.88 | | | | | | 6,136 | | | | | | 1.97 | (d) | | | | | 2.26 | (d) | | | | | 4.56 | (d) | | | | | 47 | |
| | | 6.64 | | | | | | 7.45 | | | | | | 263,924 | | | | | | 0.92 | (d) | | | | | 1.17 | (d) | | | | | 5.58 | (d) | | | | | 47 | |
| | | 6.64 | | | | | | 7.42 | | | | | | 6,807 | | | | | | 0.97 | (d) | | | | | 1.26 | (d) | | | | | 5.57 | (d) | | | | | 47 | |
| | | | | | | | | | | | | | | | | | | | | | | | | | | | | | | | | | | | | | | | |
| | | | | | | | | | | | | | | | | | | | | | | | | | | | | | | | | | | | | | | | |
| | | 6.38 | | | | | | 6.21 | | | | | | 11,295 | | | | | | 1.24 | | | | | | 1.48 | | | | | | 5.17 | | | | | | 111 | |
| | | 6.38 | | | | | | 5.08 | | | | | | 6,202 | | | | | | 1.98 | | | | | | 2.21 | | | | | | 4.27 | | | | | | 111 | |
| | | 6.37 | | | | | | 6.20 | | | | | | 332,212 | | | | | | 0.91 | | | | | | 1.12 | | | | | | 5.35 | | | | | | 111 | |
| | | 6.37 | | | | | | 6.30 | | | | | | 5,489 | | | | | | 0.98 | | | | | | 1.21 | | | | | | 5.28 | | | | | | 111 | |
| | | 6.36 | | | | | | (3.54 | ) | | | | | 140,623 | | | | | | 1.25 | | | | | | 1.40 | | | | | | 5.31 | | | | | | 100 | |
| | | 6.37 | | | | | | (4.38 | ) | | | | | 6,574 | | | | | | 2.00 | | | | | | 2.15 | | | | | | 4.58 | | | | | | 100 | |
| | | 6.36 | | | | | | (3.35 | ) | | | | | 403,203 | | | | | | 0.91 | | | | | | 1.06 | | | | | | 5.67 | | | | | | 100 | |
| | | 6.35 | | | | | | (3.45 | ) | | | | | 9,741 | | | | | | 0.99 | | | | | | 1.14 | | | | | | 5.55 | | | | | | 100 | |
| | | 6.96 | | | | | | (12.92 | ) | | | | | 140,301 | | | | | | 1.25 | | | | | | 1.36 | | | | | | 4.76 | | | | | | 145 | |
| | | 6.98 | | | | | | (13.43 | ) | | | | | 9,734 | | | | | | 2.01 | | | | | | 2.14 | | | | | | 4.04 | | | | | | 145 | |
| | | 6.97 | | | | | | (12.50 | ) | | | | | 1,234,553 | | | | | | 0.92 | | | | | | 1.05 | | | | | | 5.11 | | | | | | 145 | |
| | | 6.96 | | | | | | (12.70 | ) | | | | | 3,386 | | | | | | 1.01 | | | | | | 1.14 | | | | | | 5.06 | | | | | | 145 | |
| | | 8.43 | | | | | | (9.01 | ) | | | | | 96,925 | | | | | | 1.25 | | | | | | 1.36 | | | | | | 4.55 | | | | | | 146 | |
| | | 8.44 | | | | | | (9.68 | ) | | | | | 17,641 | | | | | | 2.01 | | | | | | 2.12 | | | | | | 3.80 | | | | | | 146 | |
| | | 8.43 | | | | | | (8.70 | ) | | | | | 1,797,975 | | | | | | 0.92 | | | | | | 1.02 | | | | | | 4.88 | | | | | | 146 | |
| | | 8.43 | | | | | | (8.78 | ) | | | | | 7,518 | | | | | | 1.01 | | | | | | 1.11 | | | | | | 4.73 | | | | | | 146 | |
| | | 9.71 | | | | | | 9.07 | | | | | | 190,480 | | | | | | 1.26 | | | | | | 1.38 | | | | | | 4.78 | | | | | | 115 | |
| | | 9.72 | | | | | | 8.14 | | | | | | 32,071 | | | | | | 2.00 | | | | | | 2.13 | | | | | | 3.98 | | | | | | 115 | |
| | | 9.71 | | | | | | 9.46 | | | | | | 3,252,343 | | | | | | 0.91 | | | | | | 1.04 | | | | | | 5.05 | | | | | | 115 | |
| | | 9.71 | | | | | | 9.34 | | | | | | 20,878 | | | | | | 1.00 | | | | | | 1.12 | | | | | | 4.91 | | | | | | 115 | |
| | |
| The accompanying notes are an integral part of these financial statements. | | 147 |
GOLDMAN SACHS U.S. MORTGAGES FUND
Financial Highlights
Selected Data for a Share Outstanding Throughout Each Period
| | | | | | | | | | | | | | | | | | | | | | | | | | | | | | | | | | |
| | | | | | | | From
Investment Operations | | | Distributions
to shareholders | |
| | | Year - Share Class | | Net asset
value,
beginning
of period | | | Net
investment
income(a) | | | Net realized
and unrealized
gain (loss) | | | Total from
investment
operations | | | From net
investment
income | | | From net
realized
gains | | | From
capital | | | Total
distributions | |
| | FOR THE SIX MONTHS ENDED SEPTEMBER 30, (UNAUDITED) | |
| | 2017 - A | | $ | 10.45 | | | $ | 0.07 | | | $ | 0.07 | | | $ | 0.14 | | | $ | (0.12 | ) | | $ | — | | | $ | — | | | $ | (0.12 | ) |
| | 2017 - Institutional | | | 10.47 | | | | 0.09 | | | | 0.07 | | | | 0.16 | | | | (0.14 | ) | | | — | | | | — | | | | (0.14 | ) |
| | 2017 - Separate Account Institutional | | | 10.45 | | | | 0.09 | | | | 0.07 | | | | 0.16 | | | | (0.14 | ) | | | — | | | | — | | | | (0.14 | ) |
| | 2017 - Investor(f) | | | 10.47 | | | | 0.09 | | | | 0.06 | | | | 0.15 | | | | (0.13 | ) | | | — | | | | — | | | | (0.13 | ) |
| | 2017 - R6 | | | 10.48 | | | | 0.09 | | | | 0.07 | | | | 0.16 | | | | (0.14 | ) | | | — | | | | — | | | | (0.14 | ) |
| | | | | | | | | | | | | | | | | | | | | | | | | | | | | | | | | | |
| | FOR THE FISCAL YEARS ENDED MARCH 31, | |
| | 2017 - A | | | 10.68 | | | | 0.12 | | | | (0.11 | ) | | | 0.01 | | | | (0.24 | ) | | | — | | | | — | | | | (0.24 | ) |
| | 2017 - Institutional | | | 10.71 | | | | 0.15 | | | | (0.11 | ) | | | 0.04 | | | | (0.28 | ) | | | — | | | | — | | | | (0.28 | ) |
| | 2017 - Separate Account Institutional | | | 10.69 | | | | 0.15 | | | | (0.11 | ) | | | 0.04 | | | | (0.28 | ) | | | — | | | | — | | | | (0.28 | ) |
| | 2017 - Investor(f) | | | 10.71 | | | | 0.13 | | | | (0.10 | ) | | | 0.03 | | | | (0.27 | ) | | | — | | | | — | | | | (0.27 | ) |
| | 2017 - R6 | | | 10.71 | | | | 0.19 | | | | (0.14 | ) | | | 0.05 | | | | (0.28 | ) | | | — | | | | — | | | | (0.28 | ) |
| | 2016 - A | | | 10.74 | | | | 0.17 | | | | 0.03 | | | | 0.20 | | | | (0.26 | ) | | | — | | | | — | (e) | | | (0.26 | ) |
| | 2016 - Institutional | | | 10.77 | | | | 0.20 | | | | 0.04 | | | | 0.24 | | | | (0.30 | ) | | | — | | | | — | (e) | | | (0.30 | ) |
| | 2016 - Separate Account Institutional | | | 10.75 | | | | 0.20 | | | | 0.04 | | | | 0.24 | | | | (0.30 | ) | | | — | | | | — | (e) | | | (0.30 | ) |
| | 2016 - Investor(f) | | | 10.77 | | | | 0.17 | | | | 0.06 | | | | 0.23 | | | | (0.29 | ) | | | — | | | | — | (e) | | | (0.29 | ) |
| | 2016 - R6 (Commenced July 31, 2015) | | | 10.67 | | | | 0.13 | | | | 0.11 | | | | 0.24 | | | | (0.20 | ) | | | — | | | | — | (e) | | | (0.20 | ) |
| | 2015 - A | | | 10.45 | | | | 0.17 | | | | 0.35 | | | | 0.52 | | | | (0.23 | ) | | | — | | | | — | | | | (0.23 | ) |
| | 2015 - Institutional | | | 10.47 | | | | 0.19 | | | | 0.38 | | | | 0.57 | | | | (0.27 | ) | | | — | | | | — | | | | (0.27 | ) |
| | 2015 - Separate Account Institutional | | | 10.45 | | | | 0.20 | | | | 0.37 | | | | 0.57 | | | | (0.27 | ) | | | — | | | | — | | | | (0.27 | ) |
| | 2015 - Investor(f) | | | 10.48 | | | | 0.18 | | | | 0.37 | | | | 0.55 | | | | (0.26 | ) | | | — | | | | — | | | | (0.26 | ) |
| | 2014 - A | | | 10.60 | | | | 0.13 | | | | (0.06 | ) | | | 0.07 | | | | (0.22 | ) | | | — | | | | — | | | | (0.22 | ) |
| | 2014 - Institutional | | | 10.62 | | | | 0.18 | | | | (0.08 | ) | | | 0.10 | | | | (0.25 | ) | | | — | | | | — | | | | (0.25 | ) |
| | 2014 - Separate Account Institutional | | | 10.60 | | | | 0.16 | | | | (0.06 | ) | | | 0.10 | | | | (0.25 | ) | | | — | | | | — | | | | (0.25 | ) |
| | 2014 - Investor(f) | | | 10.63 | | | | 0.20 | | | | (0.11 | ) | | | 0.09 | | | | (0.24 | ) | | | — | | | | — | | | | (0.24 | ) |
| | 2013 - A | | | 10.58 | | | | 0.12 | | | | 0.31 | | | | 0.43 | | | | (0.22 | ) | | | (0.19 | ) | | | — | | | | (0.41 | ) |
| | 2013 - Institutional | | | 10.60 | | | | 0.16 | | | | 0.30 | | | | 0.46 | | | | (0.25 | ) | | | (0.19 | ) | | | — | | | | (0.44 | ) |
| | 2013 - Separate Account Institutional | | | 10.58 | | | | 0.16 | | | | 0.30 | | | | 0.46 | | | | (0.25 | ) | | | (0.19 | ) | | | — | | | | (0.44 | ) |
| | 2013 - Investor(f) | | | 10.60 | | | | 0.17 | | | | 0.31 | | | | 0.48 | | | | (0.26 | ) | | | (0.19 | ) | | | — | | | | (0.45 | ) |
| | (a) | | Calculated based on the average shares outstanding methodology. |
| | (b) | | Assumes investment at the NAV at the beginning of the period, reinvestment of all dividends and distributions, a complete redemption of the investment at the NAV at the end of the period and no sales or redemption charges. Total returns would be reduced if a sales or redemption charge was taken into account. Returns do not reflect the impact of taxes to shareholder relating to Fund distributions or the redemption of Fund shares. Total returns for periods less than one full year are not annualized. |
| | (c) | | The Fund’s portfolio turnover rate is calculated in accordance with regulatory requirements, without regard to transactions involving short term investments and certain derivatives. If such transactions were included, the Fund’s portfolio turnover rate may be higher. |
| | (e) | | Amount is less than $0.005 per share. |
| | (f) | | Effective before the opening of business on August 15, 2017, Class IR Shares were designated as Investor Shares. |
| | |
| 148 | | The accompanying notes are an integral part of these financial statements. |
GOLDMAN SACHS U.S. MORTGAGES FUND
| | | | | | | | | | | | | | | | | | | | | | | | | | | | | | | | | | | | | | | | |
| | | | | | | | | | | | | | | | | | | | | | | | | | | | | | | | | | |
| | | Net asset
value, end
of period | | | | | Total
return(b) | | | | | Net assets,
end of
period
(in 000s) | | | | | Ratio of
net expenses
to average
net assets | | | | | Ratio of
total expenses
to average
net assets | | | | | Ratio of
net investment
income to average net assets | | | | | Portfolio
turnover
rate(c) | |
| | | | | | | | | | | | | | | | | | | | | | | | | | | | | | | | | | | | | | | | |
| | $ | 10.47 | | | | | | 1.33 | % | | | | $ | 49,646 | | | | | | 0.77 | %(d) | | | | | 0.87 | %(d) | | | | | 1.42 | %(d) | | | | | 753 | % |
| | | 10.49 | | | | | | 1.50 | | | | | | 65,402 | | | | | | 0.43 | (d) | | | | | 0.53 | (d) | | | | | 1.77 | (d) | | | | | 753 | |
| | | 10.47 | | | | | | 1.50 | | | | | | 216,356 | | | | | | 0.43 | (d) | | | | | 0.53 | (d) | | | | | 1.77 | (d) | | | | | 753 | |
| | | 10.49 | | | | | | 1.46 | | | | | | 150,352 | | | | | | 0.52 | (d) | | | | | 0.62 | (d) | | | | | 1.68 | (d) | | | | | 753 | |
| | | 10.50 | | | | | | 1.51 | | | | | | 3,965 | | | | | | 0.41 | (d) | | | | | 0.51 | (d) | | | | | 1.78 | (d) | | | | | 753 | |
| | | | | | | | | | | | | | | | | | | | | | | | | | | | | | | | | | | | | | | | |
| | | | | | | | | | | | | | | | | | | | | | | | | | | | | | | | | | | | | | | | |
| | | 10.45 | | | | | | 0.10 | | | | | | 47,235 | | | | | | 0.77 | | | | | | 0.93 | | | | | | 1.10 | | | | | | 863 | |
| | | 10.47 | | | | | | 0.35 | | | | | | 63,035 | | | | | | 0.43 | | | | | | 0.59 | | | | | | 1.45 | | | | | | 863 | |
| | | 10.45 | | | | | | 0.35 | | | | | | 217,648 | | | | | | 0.43 | | | | | | 0.59 | | | | | | 1.45 | | | | | | 863 | |
| | | 10.47 | | | | | | 0.25 | | | | | | 143,018 | | | | | | 0.50 | | | | | | 0.62 | | | | | | 1.26 | | | | | | 863 | |
| | | 10.48 | | | | | | 0.46 | | | | | | 2,606 | | | | | | 0.41 | | | | | | 0.53 | | | | | | 1.79 | | | | | | 863 | |
| | | 10.68 | | | | | | 1.89 | | | | | | 36,465 | | | | | | 0.75 | | | | | | 0.96 | | | | | | 1.58 | | | | | | 956 | |
| | | 10.71 | | | | | | 2.23 | | | | | | 60,513 | | | | | | 0.41 | | | | | | 0.62 | | | | | | 1.89 | | | | | | 956 | |
| | | 10.69 | | | | | | 2.23 | | | | | | 210,773 | | | | | | 0.41 | | | | | | 0.62 | | | | | | 1.91 | | | | | | 956 | |
| | | 10.71 | | | | | | 2.14 | | | | | | 6,582 | | | | | | 0.51 | | | | | | 0.71 | | | | | | 1.63 | | | | | | 956 | |
| | | 10.71 | | | | | | 2.24 | | | | | | 10 | | | | | | 0.44 | (d) | | | | | 0.64 | (d) | | | | | 1.77 | (d) | | | | | 956 | |
| | | 10.74 | | | | | | 5.01 | | | | | | 31,690 | | | | | | 0.71 | | | | | | 0.95 | | | | | | 1.60 | | | | | | 1,367 | |
| | | 10.77 | | | | | | 5.46 | | | | | | 45,891 | | | | | | 0.37 | | | | | | 0.62 | | | | | | 1.82 | | | | | | 1,367 | |
| | | 10.75 | | | | | | 5.46 | | | | | | 195,609 | | | | | | 0.37 | | | | | | 0.63 | | | | | | 1.86 | | | | | | 1,367 | |
| | | 10.77 | | | | | | 5.26 | | | | | | 1,768 | | | | | | 0.46 | | | | | | 0.71 | | | | | | 1.68 | | | | | | 1,367 | |
| | | 10.45 | | | | | | 0.64 | | | | | | 3,850 | | | | | | 0.72 | | | | | | 0.96 | | | | | | 1.22 | | | | | | 1,399 | |
| | | 10.47 | | | | | | 0.99 | | | | | | 11,692 | | | | | | 0.38 | | | | | | 0.63 | | | | | | 1.71 | | | | | | 1,399 | |
| | | 10.45 | | | | | | 0.98 | | | | | | 211,306 | | | | | | 0.38 | | | | | | 0.62 | | | | | | 1.58 | | | | | | 1,399 | |
| | | 10.48 | | | | | | 0.88 | | | | | | 16 | | | | | | 0.49 | | | | | | 0.73 | | | | | | 1.91 | | | | | | 1,399 | |
| | | 10.60 | | | | | | 4.07 | | | | | | 4,488 | | | | | | 0.71 | | | | | | 0.91 | | | | | | 1.13 | | | | | | 1,617 | |
| | | 10.62 | | | | | | 4.42 | | | | | | 13,664 | | | | | | 0.37 | | | | | | 0.56 | | | | | | 1.47 | | | | | | 1,617 | |
| | | 10.60 | | | | | | 4.42 | | | | | | 295,322 | | | | | | 0.37 | | | | | | 0.56 | | | | | | 1.49 | | | | | | 1,617 | |
| | | 10.63 | | | | | | 4.61 | | | | | | 1 | | | | | | 0.30 | | | | | | 0.49 | | | | | | 1.57 | | | | | | 1,617 | |
| | |
| The accompanying notes are an integral part of these financial statements. | | 149 |
GOLDMAN SACHS SINGLE SECTOR FIXED INCOME FUNDS
Notes to Financial Statements
September 30, 2017 (Unaudited)
Goldman Sachs Trust (the “Trust”) is a Delaware statutory trust registered under the Investment Company Act of 1940, as amended (the “Act”), as an open-end management investment company. The following table lists those series of the Trust that are included in this report (collectively, the “Funds” or individually a “Fund”), along with their corresponding share classes and respective diversification status under the Act:
| | | | |
| Fund | | Share Classes Offered | | Diversified/
Non-diversified |
Dynamic Emerging Markets Debt | | A, C, Institutional, Investor and R | | Non-diversified |
Emerging Markets Debt | | A, C, Institutional, Investor and R6 | | Non-diversified |
High Yield | | A, C, Institutional, Service, Investor, R and R6 | | Diversified |
High Yield Floating Rate | | A, C, Institutional, Investor and R | | Diversified |
Local Emerging Markets Debt | | A, C, Institutional and Investor | | Non-diversified |
Investment Grade Credit, U.S. Mortgages | | A, Institutional, Investor, Separate Account Institutional and R6 | | Diversified |
Class A Shares of the Dynamic Emerging Markets Debt, Emerging Markets Debt, High Yield, High Yield Floating Rate, Investment Grade Credit, Local Emerging Markets Debt and U.S. Mortgages Funds are sold with a front-end sales charge of up to 4.50%, 4.50%, 4.50%, 2.25%, 3.75%, 4.50% and 3.75%, respectively. Class C Shares are sold with a contingent deferred sales charge (“CDSC”) of 1.00%, which is imposed on redemptions made within 12 months of purchase. Institutional, Service, Separate Account Institutional, Class Investor, Class R and Class R6 Shares are not subject to a sales charge. Previously, Investor Shares were known as Class IR Shares.
Goldman Sachs Asset Management, L.P. (“GSAM”), an affiliate of Goldman Sachs & Co. LLC (formerly Goldman, Sachs & Co.) (“Goldman Sachs”), serves as investment adviser to the Funds pursuant to a management agreement (the “Agreement”) with the Trust.
|
| 2. SIGNIFICANT ACCOUNTING POLICIES |
The financial statements have been prepared in accordance with accounting principles generally accepted in the United States of America (“GAAP”) and require management to make estimates and assumptions that may affect the reported amounts and disclosures. Actual results may differ from those estimates and assumptions.
A. Investment Valuation — The Funds’ valuation policy is to value investments at fair value.
B. Investment Income and Investments — Investment income includes interest income, dividend income, and securities lending income. Interest income is accrued daily and adjusted for amortization of premiums and accretion of discounts. Dividend income is recognized on ex-dividend date or, for certain foreign securities, as soon as such information is obtained subsequent to the ex-dividend date. Investment transactions are reflected on trade date. Realized gains and losses are calculated using identified cost. Investment transactions are recorded on the following business day for daily net asset value (“NAV”) calculations. Investment income is recorded net of any foreign withholding taxes, less any amounts reclaimable. The Funds may file withholding tax reclaims in certain jurisdictions to recover a portion of amounts previously withheld. Any foreign capital gains tax is accrued daily based upon net unrealized gains, and is payable upon sale of such investments. Distributions received from the Funds’ investments in U.S. real estate investment trusts (“REITs”) may be characterized as ordinary income, net capital gain or a return of capital. A return of capital is recorded by the Funds as a reduction to the cost basis of the REIT.
150
GOLDMAN SACHS SINGLE SECTOR FIXED INCOME FUNDS
|
| 2. SIGNIFICANT ACCOUNTING POLICIES (continued) |
For derivative contracts, realized gains and losses are recorded upon settlement of the contract. Upfront payments, if any, are made or received upon entering into a swap agreement and are reflected in the Statements of Assets and Liabilities. Upfront payments are recognized over the contract’s term/event as realized gains or losses, with the exception of forward starting interest rate swaps whose realized gains or losses are recognized from the effective start date. For securities with paydown provisions, principal payments received are treated as a proportionate reduction to the cost basis of the securities, and excess or shortfall amounts are recorded as income. For treasury inflation protected securities (“TIPS”), adjustments to principal due to inflation/deflation are reflected as increases/decreases to interest income with a corresponding adjustment to cost.
C. Class Allocations and Expenses — Investment income, realized and unrealized gain (loss), and non-class specific expenses of each Fund are allocated daily based upon the proportion of net assets of each class. Non-class specific expenses directly incurred by a Fund are charged to that Fund, while such expenses incurred by the Trust are allocated across the applicable Funds on a straight-line and/or pro-rata basis depending upon the nature of the expenses. Class specific expenses, where applicable, are borne by the respective share classes and include Distribution and Service, Transfer Agency and Service and Shareholder Administration fees.
D. Redemption Fees — A 2% redemption fee will be imposed on the redemption of shares (including by exchange) held for 60 calendar days or less with respect to the High Yield Fund and 30 calendar days or less with respect to the Dynamic Emerging Markets Debt, Emerging Markets Debt and Local Emerging Markets Debt Funds. For this purpose, the Funds use a first-in first-out method so that shares held longest will be treated as being redeemed first and shares held shortest will be treated as being redeemed last. Redemption fees are reimbursed to a Fund and are reflected as a reduction in share redemptions. Redemption fees are credited to Paid-in Capital and are allocated to each share class of a Fund on a pro-rata basis.
E. Federal Taxes and Distributions to Shareholders — It is each Fund’s policy to comply with the requirements of the Internal Revenue Code of 1986, as amended (the “Code”), applicable to regulated investment companies (mutual funds) and to distribute each year substantially all of its investment company taxable income and capital gains to its shareholders. Accordingly, each Fund is not required to make any provisions for the payment of federal income tax. Distributions to shareholders are recorded on the ex-dividend date. Income dividends, if any, are declared daily and paid monthly, and capital gains distributions, if any, are declared and paid annually.
Net capital losses, if any, are carried forward to future fiscal years and may be used to the extent allowed by the Code to offset any future capital gains. Losses that are carried forward will retain their character as either short-term or long-term capital losses. Utilization of capital loss carryforwards will reduce the requirement of future capital gains distributions.
The characterization of distributions to shareholders for financial reporting purposes is determined in accordance with federal income tax rules, which may differ from GAAP. The source of each Fund’s distributions may be shown in the accompanying financial statements as either from net investment income, net realized gain or capital. Certain components of the Funds’ net assets on the Statements of Assets and Liabilities reflect permanent GAAP/tax differences based on the appropriate tax character.
F. Foreign Currency Translation — The accounting records and reporting currency of the Funds are maintained in U.S. dollars. Assets and liabilities denominated in foreign currencies are translated into U.S. dollars using the current exchange rates at the close of each business day. The effect of changes in foreign currency exchange rates on investments is included within net realized and unrealized gain (loss) on investments. Changes in the value of other assets and liabilities as a result of fluctuations in foreign exchange rates are included in the Statements of Operations within net change in unrealized gain (loss) on foreign currency translations. Transactions denominated in foreign currencies are translated into U.S. dollars on the date the transaction occurred, the effects of which are included within net realized gain (loss) on foreign currency transactions.
|
| 3. INVESTMENTS AND FAIR VALUE MEASUREMENTS |
U.S. GAAP defines the fair value of a financial instrument as the amount that would be received to sell an asset or paid to transfer a liability in an orderly transaction between market participants at the measurement date (i.e., the exit price); the Fund’s policy is to use the market approach. GAAP establishes a fair value hierarchy that prioritizes the inputs to valuation techniques used to
151
GOLDMAN SACHS SINGLE SECTOR FIXED INCOME FUNDS
Notes to Financial Statements (continued)
September 30, 2017 (Unaudited)
|
| 3. INVESTMENTS AND FAIR VALUE MEASUREMENTS (continued) |
measure fair value. The hierarchy gives the highest priority to unadjusted quoted prices in active markets for identical assets or liabilities (Level 1 measurements) and the lowest priority to unobservable inputs (Level 3 measurements). The levels used for classifying investments are not necessarily an indication of the risk associated with investing in these investments. The three levels of the fair value hierarchy are described below:
Level 1 — Unadjusted quoted prices in active markets that are accessible at the measurement date for identical, unrestricted assets or liabilities;
Level 2 — Quoted prices in markets that are not active or financial instruments for which significant inputs are observable (including, but not limited to, quoted prices for similar investments, interest rates, foreign exchange rates, volatility and credit spreads), either directly or indirectly;
Level 3 — Prices or valuations that require significant unobservable inputs (including GSAM’s assumptions in determining fair value measurement).
Changes in valuation techniques may result in transfers into or out of an assigned level within the hierarchy. In accordance with the Funds’ policy, transfers between different levels of the fair value hierarchy resulting from such changes are deemed to have occurred as of the beginning of the reporting period.
The Board of Trustees (“Trustees”) has approved Valuation Procedures that govern the valuation of the portfolio investments held by the Funds, including investments for which market quotations are not readily available. The Trustees have delegated to GSAM day-to-day responsibility for implementing and maintaining internal controls and procedures related to the valuation of the Funds’ investments. To assess the continuing appropriateness of pricing sources and methodologies, GSAM regularly performs price verification procedures and issues challenges as necessary to third party pricing vendors or brokers, and any differences are reviewed in accordance with the Valuation Procedures.
A. Level 1 and Level 2 Fair Value Investments — The valuation techniques and significant inputs used in determining the fair values for investments classified as Level 1 and Level 2 are as follows:
Equity Securities — Equity securities traded on a United States (“U.S.”) securities exchange or the NASDAQ system, or those located on certain foreign exchanges, including but not limited to the Americas, are valued daily at their last sale price or official closing price on the principal exchange or system on which they are traded. If there is no sale or official closing price or such price is believed by GSAM to not represent fair value, equity securities are valued at the last bid price for long positions and at the last ask price for short positions. To the extent these investments are actively traded, they are classified as Level 1 of the fair value hierarchy, otherwise they are generally classified as Level 2.
Unlisted equity securities for which market quotations are available are valued at the last sale price on the valuation date, or if no sale occurs, at the last bid price. Securities traded on certain foreign securities exchanges are valued daily at fair value determined by an independent fair value service (if available) under Valuation Procedures approved by the Trustees and consistent with applicable regulatory guidance. The independent fair value service takes into account multiple factors including, but not limited to, movements in the securities markets, certain depositary receipts, futures contracts and foreign currency exchange rates that have occurred subsequent to the close of the foreign securities exchange. These investments are generally classified as Level 2 of the fair value hierarchy.
Private Investments — Private investments may include, but are not limited to, investments in private equity or debt instruments. The investment manager estimates the fair value of private investments based upon various factors, including, but not limited to, transactions in similar instruments, completed or pending third-party transactions in underlying investments or comparable entities, subsequent rounds of financing, recapitalizations, and other transactions across the capital structure, offerings in equity or debt capital markets, and changes in current and projected financial ratios or cash flows.
Underlying Funds (including Money Market Funds) — Underlying Funds (“Underlying Funds”) include other investment companies and exchange-traded funds (“ETFs”). Investments in the Underlying Funds (except ETFs) are valued at the NAV per share of the Institutional Share class on the day of valuation. ETFs are valued daily at the last sale price or official closing price on the principal exchange or system on which the investment is traded. Because the Funds invest in Underlying Funds that fluctuate in
152
GOLDMAN SACHS SINGLE SECTOR FIXED INCOME FUNDS
|
| 3. INVESTMENTS AND FAIR VALUE MEASUREMENTS (continued) |
value, the Funds’ shares will correspondingly fluctuate in value. To the extent these investments are actively traded, they are classified as Level 1 of the fair value hierarchy, otherwise they are generally classified as Level 2. For information regarding an Underlying Fund’s accounting policies and investment holdings, please see the Underlying Fund’s shareholder report.
Debt Securities — Debt securities for which market quotations are readily available are valued daily on the basis of quotations supplied by dealers or an independent pricing service approved by the Trustees. The pricing services may use valuation models or matrix pricing, which consider: (i) yield or price with respect to bonds that are considered comparable in characteristics such as rating, interest rate and maturity date or (ii) quotations from securities dealers to determine current value. With the exception of treasury securities of G8 countries, which are generally classified as Level 1, these investments are generally classified as Level 2 of the fair value hierarchy.
i. Bank Loans — Bank loans (“Loans”) are interests in amounts owed by corporate, governmental, or other borrowers to lenders or lending syndicates. Loans are arranged through private negotiations between the borrower and one or more financial institutions (“Lenders”). A Fund’s investments in Loans are in the form of either participations in Loans (“Participations”) or assignments of all or a portion of Loans from third parties (“Assignments”). With respect to Participations, a Fund has the right to receive payments of principal, interest and any fees to which it is entitled from the Lender selling the Participations and only upon receipt by the Lender of the payments from the borrower. A Fund generally has no right to enforce compliance by the borrower with the terms of the loan agreement with respect to Participations. Conversely, assignments result in a Fund having a direct contractual relationship with the borrower, and the Fund may be permitted to enforce compliance by the borrower with the terms of the loan agreement.
The High Yield and High Yield Floating Rate Funds may also enter into certain credit arrangements, all or a portion of which may be unfunded. Unfunded loan commitments represent the remaining obligation of a Fund to the borrower. A Fund is obligated to fund these commitments at the borrower’s discretion. A Fund may receive a commitment fee based on the undrawn portion of the underlying line of credit of a Loan. All Loans and unfunded loan commitments involve interest rate risk, liquidity risk and credit risk, including the potential default or insolvency of the borrower. Loans, including unfunded loan commitments, are marked to market daily using pricing vendor quotations and the change in value, if any, is recorded as an unrealized gain or loss.
The Fund may also enter into certain credit arrangements, all or a portion of which may be unfunded. Unfunded loan commitments represent the remaining obligation of a Fund to the borrower. A Fund is obligated to fund these commitments at the borrower’s discretion. A Fund may receive a commitment fee based on the undrawn portion of the underlying line of credit of a Loan. All Loans and unfunded loan commitments involve interest rate risk, liquidity risk and credit risk, including the potential default or insolvency of the borrower. Loans, including unfunded loan commitments, are marked to market daily using pricing vendor quotations and the change in value, if any, is recorded as an unrealized gain or loss.
ii. Inverse Floaters — The interest rate on inverse floating rate securities (“inverse floaters”) resets in the opposite direction from the market rate of interest to which the inverse floaters are indexed. An inverse floater may be considered to be leveraged to the extent that its interest rate varies by a magnitude that exceeds the magnitude of the change in the index rate of interest. The higher the degree of leverage of an inverse floater, the greater the volatility of its market value.
iii. Mortgage-Backed and Asset-Backed Securities — Mortgage-backed securities represent direct or indirect participations in, or are collateralized by and payable from, mortgage loans secured by residential and/or commercial real estate property. Asset-backed securities include securities whose principal and interest payments are collateralized by pools of other assets or receivables. The value of certain mortgage-backed and asset-backed securities (including adjustable rate mortgage loans) may be particularly sensitive to changes in prevailing interest rates. The value of these securities may also fluctuate in response to the market’s perception of the creditworthiness of the issuers.
Asset-backed securities may present credit risks that are not presented by mortgage-backed securities because they generally do not have the benefit of a security interest in collateral that is comparable to mortgage assets. Some asset-backed securities may only have a subordinated claim on collateral.
153
GOLDMAN SACHS SINGLE SECTOR FIXED INCOME FUNDS
Notes to Financial Statements (continued)
September 30, 2017 (Unaudited)
|
| 3. INVESTMENTS AND FAIR VALUE MEASUREMENTS (continued) |
Stripped mortgage-backed securities are usually structured with two different classes: one that receives substantially all interest payments (interest-only, or “IO” and/or high coupon rate with relatively low principal amount, or “IOette”), and the other that receives substantially all principal payments (principal-only, or “PO”) from a pool of mortgage loans. Little to no principal will be received at the maturity of an IO; as a result, periodic adjustments are recorded to reduce the cost of the security until maturity. These adjustments are included in interest income.
iv. Mortgage Dollar Rolls — Mortgage dollar rolls are transactions whereby a Fund sells mortgage-backed-securities and simultaneously contracts with the same counterparty to repurchase similar securities on a specified future date. During the settlement period, a Fund will not be entitled to accrue interest and receive principal payments on the securities sold. The Funds account for mortgage dollar roll transactions as purchases and sales and realize gains and losses on these transactions.
v. Structured Notes — The values of structured notes are based on the price movements of a reference security or index. Upon termination, a Fund will receive a payment from the issuer based on the value of the referenced instrument (notional amount multiplied by price of the referenced instrument) and record a realized gain or loss.
vi. Treasury Inflation Protected Securities — TIPS are treasury securities in which the principal amount is adjusted daily to keep pace with inflation, as measured by the U.S. Consumer Pricing Index for Urban Consumers. The repayment of the original bond principal upon maturity is guaranteed by the full faith and credit of the U.S. Government.
vii. When-Issued Securities and Forward Commitments — When-issued securities, including TBA (“To Be Announced”) securities, are securities that are authorized but not yet issued in the market and purchased in order to secure what is considered to be an advantageous price or yield to a Fund. A forward commitment involves entering into a contract to purchase or sell securities, typically on an extended settlement basis, for a fixed price at a future date. The purchase of securities on a when-issued or forward commitment basis involves a risk of loss if the value of the security to be purchased declines before the settlement date. Conversely, the sale of securities on a forward commitment basis involves the risk that the value of the securities sold may increase before the settlement date. Although a Fund will generally purchase securities on a when-issued or forward commitment basis with the intention of acquiring the securities for its portfolio, the Fund may dispose of when-issued securities or forward commitments prior to settlement, which may result in a realized gain or loss.
Derivative Contracts — A derivative is an instrument whose value is derived from underlying assets, indices, reference rates or a combination of these factors. A Fund enters into derivative transactions to hedge against changes in interest rates, securities prices, and/or currency exchange rates, to increase total return, or to gain access to certain markets or attain exposure to other underliers.
Exchange-traded derivatives, including futures and options contracts, are valued at the last sale or settlement price and typically fall within Level 1 of the fair value hierarchy. Over-the-counter (“OTC”) and centrally cleared derivatives are valued using market transactions and other market evidence, including market-based inputs to models, calibration to market-clearing transactions, broker or dealer quotations, or other alternative pricing sources. Where models are used, the selection of a particular model to value OTC and centrally cleared derivatives depends upon the contractual terms of, and specific risks inherent in, the instrument, as well as the availability of pricing information in the market. Valuation models require a variety of inputs, including contractual terms, market prices, yield curves, credit curves, measures of volatility, voluntary and involuntary prepayment rates, loss severity rates and correlations of such inputs. For OTC and centrally cleared derivatives that trade in liquid markets, model inputs can generally be verified and model selection does not involve significant management judgment. OTC and centrally cleared derivatives are classified within Level 2 of the fair value hierarchy when significant inputs are corroborated by market evidence.
i. Forward Contracts — A forward contract is a contract between two parties to buy or sell an asset at a specified price on a future date. A forward contract settlement can occur on a cash or delivery basis. Forward contracts are marked-to-market daily using independent vendor prices, and the change in value, if any, is recorded as an unrealized gain or loss. Cash and certain investments may be used to collateralize forward contracts.
A forward foreign currency exchange contract is a forward contract in which a Fund agrees to receive or deliver a fixed quantity of one currency for another, at a pre-determined price at a future date. All forward foreign currency exchange
154
GOLDMAN SACHS SINGLE SECTOR FIXED INCOME FUNDS
|
| 3. INVESTMENTS AND FAIR VALUE MEASUREMENTS (continued) |
contracts are marked-to-market daily at the applicable forward rate. Non-deliverable forward foreign currency exchange contracts are settled with the counterparty in cash without the delivery of foreign currency.
ii. Futures Contracts — Futures contracts are contracts to buy or sell a standardized quantity of a specified commodity or security and are valued based on exchanged settlement prices or independent market quotes. Futures contracts are valued at the last settlement price, or in the absence of a sale, the last bid price for long positions and at the last ask price for short positions, at the end of each day on the board of trade or exchange upon which they are traded. Upon entering into a futures contract, a Fund deposits cash or securities in an account on behalf of the broker in an amount sufficient to meet the initial margin requirement. Subsequent payments are made or received by a Fund equal to the daily change in the contract value and are recorded as variation margin receivable or payable with a corresponding offset to unrealized gains or losses. For financial reporting purposes, cash collateral that has been pledged to cover obligations of a Fund and cash collateral received, if any is reported separately on the Statements of Assets and Liabilities as receivables/payables for collateral on certain derivatives contracts. Non-cash collateral pledged by a Fund, if any, is noted in the Schedules of Investments.
iii. Options — When a Fund writes call or put options, an amount equal to the premium received is recorded as a liability and is subsequently marked-to-market to reflect the current value of the option written. Swaptions are options on interest rate swap contracts.
Upon the purchase of a call option or a put option by a Fund, the premium paid is recorded as an investment and subsequently marked-to-market to reflect the current value of the option. Certain options may be purchased with premiums to be determined on a future date. The premiums for these options are based upon implied volatility parameters at specified terms.
iv. Swap Contracts — Bilateral swap contracts are agreements in which a Fund and a counterparty agree to exchange periodic payments on a specified notional amount or make a net payment upon termination. Bilateral swap transactions are privately negotiated in the OTC market and payments are settled through direct payments between a Fund and the counterparty. By contrast, certain swap transactions are subject to mandatory central clearing. These swaps are executed through a derivatives clearing member (“DCM”), acting in an agency capacity, and submitted to a central counterparty (“CCP”) (“centrally cleared swaps”), in which case all payments are settled with the CCP through the DCM. Swaps are marked-to-market daily using pricing vendor quotations, counterparty or clearinghouse prices or model prices, and the change in value, if any, is recorded as an unrealized gain or loss. Upon entering into a swap contract, a Fund is required to satisfy an initial margin requirement by delivering cash or securities to the counterparty (or in some cases, segregated in a triparty account on behalf of the counterparty), which can be adjusted by any mark-to-market gains or losses pursuant to bilateral or centrally cleared arrangements. For centrally cleared swaps the daily change in valuation, if any, is recorded as a receivable or payable for variation margin.
An interest rate swap is an agreement that obligates two parties to exchange a series of cash flows at specified intervals, based upon or calculated by reference to changes in interest rates on a specified notional principal amount. The payment flows are usually netted against each other, with the difference being paid by one party to the other.
A credit default swap is an agreement that involves one party (the buyer of protection) making a stream of payments to another party (the seller of protection) in exchange for the right to receive protection on a reference security or obligation, including a group of assets or exposure to the performance of an index. A Fund’s investment in credit default swaps may involve greater risks than if the Fund had invested in the referenced obligation directly. Credit events are contract specific but may include bankruptcy, failure to pay, restructuring and obligation acceleration. If a Fund buys protection through a credit default swap and no credit event occurs, its payments are limited to the periodic payments previously made to the counterparty. Upon the occurrence of a specified credit event, a Fund, as a buyer of credit protection, is entitled to receive an amount equal to the notional amount of the swap and deliver to the seller the defaulted reference obligation in a physically settled trade. A Fund may also receive a net settlement amount in the form of cash or securities equal to the notional amount of the swap reduced by the recovery value of the reference obligation in a cash settled trade.
155
GOLDMAN SACHS SINGLE SECTOR FIXED INCOME FUNDS
Notes to Financial Statements (continued)
September 30, 2017 (Unaudited)
|
| 3. INVESTMENTS AND FAIR VALUE MEASUREMENTS (continued) |
As a seller of protection, a Fund generally receives a payment stream throughout the term of the swap, provided that there is no credit event. In addition, if a Fund sells protection through a credit default swap, a Fund could suffer a loss because the value of the referenced obligation and the premium payments received may be less than the notional amount of the swap paid to the buyer of protection. Upon the occurrence of a specified credit event, a Fund, as a seller of credit protection, may be required to take possession of the defaulted reference obligation and pay the buyer an amount equal to the notional amount of the swap in a physically settled trade. A Fund may also pay a net settlement amount in the form of cash or securities equal to the notional amount of the swap reduced by the recovery value of the reference obligation in a cash settled trade. Recovery values are at times established through the credit event auction process in which market participants are ensured that a transparent price has been set for the defaulted security or obligation. In addition, a Fund is entitled to a return of any assets, which have been pledged as collateral to the counterparty upon settlement.
The maximum potential amount of future payments (undiscounted) that a Fund as seller of protection could be required to make under a credit default swap would be an amount equal to the notional amount of the agreement. These potential amounts would be partially offset by any recovery values of the respective referenced obligations or net amounts received from a settlement of a credit default swap for the same reference security or obligation where a Fund bought credit protection.
A cross currency swap is an agreement which a Fund may enter into to gain or mitigate exposure to currency risk. A cross currency swap is an agreement to exchange cash flows on a notional amount of two or more currencies based on the relative value differential among them. Such swaps may involve initial and final exchanges that correspond to the agreed upon notional amount. Cross currency swaps usually involve the delivery of the entire principal value of one designated currency in exchange for another designated currency. Therefore, the entire principal value of a cross currency swap is subject to risk that the other party to the swap will default on its contractual delivery obligations. If there is a default by the counterparty, the Fund may have contractual remedies pursuant to the agreements related to the transactions.
A total return swap is an agreement that gives the Fund the right to receive the appreciation in the value of a specified security, index or other instrument in return for a fee paid to the counterparty, which will typically be an agreed upon interest rate. If the underlying asset declines in value over the term of the swap, the Fund may also be required to pay the dollar value of that decline to the counterparty.
Secured Borrowings — Secured borrowings are valued at their contractual amounts, which approximate fair value, and are generally classified as Level 2 of the fair value hierarchy.
i. Reverse Repurchase Agreements — Reverse repurchase agreements involve the sale of securities held by a Fund subject to the Fund’s agreement to repurchase the securities at a mutually agreed upon date and price (including interest), under the terms of a Master Repurchase Agreement. The gross value of reverse repurchase agreements is included in the Statements of Assets and Liabilities for financial reporting purposes.
When a Fund enters into a reverse repurchase agreement, it is required to deliver securities as collateral to the counterparty that exceed the value of the reverse repurchase agreement. During the term of a reverse repurchase agreement, the value of the underlying securities pledged as collateral on behalf of a Fund, including accrued interest, is required to exceed the value of the reverse repurchase agreement, including accrued interest. If the value of those securities pledged as collateral, including accrued interest, becomes less than the value of the reverse repurchase agreement, including accrued interest, a Fund will be obligated to deliver additional collateral to the buyer.
If the buyer defaults on its commitment to sell back the securities, a Fund could suffer a loss to the extent that the amount borrowed is less than the replacement cost of similar securities and the Fund’s costs associated with delay and enforcement of the reverse repurchase agreement. In addition, in the event of default or insolvency of the buyer, a court could determine that a Fund’s interest in the amount borrowed is not enforceable, resulting in additional losses to a Fund.
B. Level 3 Fair Value Investments — To the extent that significant inputs to valuation models and other alternative pricing sources are unobservable, or if quotations are not readily available, or if GSAM believes that such quotations do not accurately reflect fair value, the fair value of a Fund’s investments may be determined under Valuation Procedures approved by the Trustees. GSAM, consistent with its procedures and applicable regulatory guidance, may make an adjustment to the most recent valuation
156
GOLDMAN SACHS SINGLE SECTOR FIXED INCOME FUNDS
|
| 3. INVESTMENTS AND FAIR VALUE MEASUREMENTS (continued) |
prices of either domestic or foreign securities in light of significant events to reflect what it believes to be the fair value of the securities at the time of determining a Fund’s NAV. Significant events which could affect a large number of securities in a particular market may include, but are not limited to: significant fluctuations in U.S. or foreign markets; market dislocations; market disruptions; or unscheduled market closings. Significant events which could also affect a single issuer may include, but are not limited to: corporate actions such as reorganizations, mergers and buy-outs; ratings downgrades; and bankruptcies.
To the extent investments are valued using single source broker quotations obtained directly from the broker or passed through from third party pricing vendors, such investments are classified as Level 3 investments. GSAM did not develop the unobservable inputs (examples include but are not limited to single source broker quotations, third party pricing, etc.) for the valuation of Level 3 Assets and Liabilities.
C. Fair Value Hierarchy — The following is a summary of the Funds’ investments and derivatives classified in the fair value hierarchy as of September 30, 2017:
| | | | | | | | | | | | |
| |
| DYNAMIC EMERGING MARKETS DEBT | | | | | |
| | | |
| Investment Type | | Level 1 | | | Level 2 | | | Level 3 | |
| Assets | |
Fixed Income | | | | | | | | | | | | |
Sovereign Debt Obligations | | $ | — | | | $ | 12,655,515 | | | $ | — | |
Corporate Obligations | | | — | | | | 7,570,258 | | | | — | |
Structured Notes | | | — | | | | 1,538,641 | | | | — | |
Municipal Debt Obligations | | | — | | | | 151,906 | | | | — | |
Common Stock and/or Other Equity Investments(b) | | | | | | | | | | | | |
Asia | | | 2,679 | | | | — | | | | — | |
Investment Company | | | 624,792 | | | | — | | | | — | |
| Total | | $ | 627,471 | | | $ | 21,916,320 | | | $ | — | |
| | | |
| Derivative Type | | | | | | | | | |
| Assets | | | | | | | | | | | | |
Options Purchased | | $ | 1,938 | | | $ | — | | | $ | — | |
Forward Foreign Currency Exchange Contracts(a) | | | — | | | | 177,633 | | | | — | |
Futures Contracts(a) | | | 5,478 | | | | — | | | | — | |
Interest Rate Swap Contracts(a) | | | — | | | | 87,893 | | | | — | |
Credit Default Swap Contracts(a) | | | — | | | | 9,840 | | | | — | |
| Total | | $ | 7,416 | | | $ | 275,366 | | | $ | — | |
| Liabilities(a) | | | | | | | | | | | | |
Forward Foreign Currency Exchange Contracts | | $ | — | | | $ | (343,941 | ) | | $ | — | |
Futures Contracts | | | (18,358 | ) | | | — | | | | — | |
Interest Rate Swap Contracts | | | — | | | | (20,220 | ) | | | — | |
Credit Default Swap Contracts | | | — | | | | (103,014 | ) | | | — | |
| Total | | $ | (18,358 | ) | | $ | (467,175 | ) | | $ | — | |
157
GOLDMAN SACHS SINGLE SECTOR FIXED INCOME FUNDS
Notes to Financial Statements (continued)
September 30, 2017 (Unaudited)
|
| 3. INVESTMENTS AND FAIR VALUE MEASUREMENTS (continued) |
| | | | | | | | | | | | |
| |
| EMERGING MARKETS DEBT | | | | | |
| | | |
| Investment Type | | Level 1 | | | Level 2 | | | Level 3 | |
| Assets | |
Fixed Income | | | | | | | | | | | | |
Sovereign Debt Obligations | | $ | — | | | $ | 1,522,508,294 | | | $ | — | |
Corporate Obligations | | | — | | | | 565,240,109 | | | | — | |
Structured Notes | | | — | | | | 21,868,385 | | | | — | |
Municipal Debt Obligations | | | — | | | | 10,907,353 | | | | — | |
U.S. Treasury Obligations | | | 39,416,057 | | | | — | | | | — | |
Investment Company | | | 61,042,705 | | | | — | | | | — | |
| Total | | $ | 100,458,762 | | | $ | 2,120,524,141 | | | $ | — | |
| Liabilities | |
Reverse Repurchase Agreements | | $ | — | | | $ | (3,240,000 | ) | | $ | — | |
| | | |
| Derivative Type | | | | | | | | | |
| Assets | | | | | | | | | | | | |
Options Purchased | | $ | 206,537 | | | $ | — | | | $ | — | |
Forward Foreign Currency Exchange Contracts(a) | | | — | | | | 9,148,106 | | | | — | |
Futures Contracts(a) | | | 370,589 | | | | — | | | | — | |
Interest Rate Swap Contracts(a) | | | — | | | | 2,105,073 | | | | — | |
Credit Default Swap Contracts(a) | | | — | | | | 523,560 | | | | — | |
| Total | | $ | 577,126 | | | $ | 11,776,739 | | | $ | — | |
| Liabilities(a) | | | | | | | | | | | | |
Forward Foreign Currency Exchange Contracts | | $ | — | | | $ | (12,377,866 | ) | | $ | — | |
Futures Contracts | | | (3,775,937 | ) | | | — | | | | — | |
Interest Rate Swap Contracts | | | — | | | | (1,592,844 | ) | | | — | |
Credit Default Swap Contracts | | | — | | | | (8,041,063 | ) | | | — | |
| Total | | $ | (3,775,937 | ) | | $ | (22,011,773 | ) | | $ | — | |
| |
| HIGH YIELD | | | | | |
| | | |
| Investment Type | | Level 1 | | | Level 2 | | | Level 3 | |
| Assets | |
Fixed Income | | | | | | | | | | | | |
Corporate Obligations | | $ | — | | | $ | 3,103,654,480 | | | $ | — | |
Bank Loans | | | — | | | | 89,575,552 | | | | 23,853,282 | |
Common Stock and/or Other Equity Investments(b) | | | | | | | | | | | | |
North America | | | 4,103,083 | | | | 43,102,547 | | | | — | |
Exchange Traded Fund | | | 50,054,970 | | | | — | | | | — | |
Investment Company | | | 146,952,453 | | | | — | | | | — | |
| Total | | $ | 201,110,506 | | | $ | 3,236,332,579 | | | $ | 23,853,282 | |
158
GOLDMAN SACHS SINGLE SECTOR FIXED INCOME FUNDS
|
| 3. INVESTMENTS AND FAIR VALUE MEASUREMENTS (continued) |
| | | | | | | | | | | | |
| |
| HIGH YIELD (continued) | | | | | |
| | | |
| Investment Type | | Level 1 | | | Level 2 | | | Level 3 | |
| Liabilities | | | | | | | | | | | | |
Reverse Repurchase Agreements | | $ | — | | | $ | (76,401,960 | ) | | $ | — | |
| | | |
| Derivative Type | | | | | | | | | |
| Assets | | | | | | | | | | | | |
Options Purchased | | $ | 155,387 | | | $ | — | | | $ | — | |
Forward Foreign Currency Exchange Contracts(a) | | | — | | | | 66,554 | | | | — | |
Futures Contracts(a) | | | 1,715,018 | | | | — | | | | — | |
| Total | | $ | 1,870,405 | | | $ | 66,554 | | | $ | — | |
| Liabilities(a) | | | | | | | | | | | | |
Futures Contracts | | $ | (516,957 | ) | | $ | — | | | $ | — | |
Credit Default Swap Contracts | | | — | | | | (495,639 | ) | | | — | |
| Total | | $ | (516,957 | ) | | $ | (495,639 | ) | | $ | — | |
| |
| HIGH YIELD FLOATING RATE | | | | | |
| | | |
| Investment Type | | Level 1 | | | Level 2 | | | Level 3 | |
| Assets | | | | | | | | | | | | |
Fixed Income | | | | | | | | | | | | |
Bank Loans | | $ | — | | | $ | 3,309,028,390 | | | $ | 71,895,610 | |
Corporate Obligations | | | — | | | | 551,112,232 | | | | — | |
Asset-Backed Securities | | | — | | | | 34,093,380 | | | | — | |
Unfunded Loan Commitments | | | — | | | | — | | | | 6,317 | |
Common Stock and/or Other Equity Investments(b) | | | | | | | | | | | | |
North America | | | — | | | | 12,607,475 | | | | — | |
Exchange Traded Fund | | | 31,623,564 | | | | — | | | | — | |
Investment Company | | | 286,416,883 | | | | — | | | | — | |
| Total | | $ | 318,040,447 | | | $ | 3,906,841,477 | | | $ | 71,901,927 | |
| | | |
| Liabilities | | | | | | | | | |
Reverse Repurchase Agreements | | $ | — | | | $ | (6,447,663 | ) | | $ | — | |
| | | |
| Derivative Type | | | | | | | | | |
| Assets(a) | | | | | | | | | | | | |
Forward Foreign Currency Exchange Contracts | | $ | — | | | $ | 67,973 | | | $ | — | |
Futures Contracts | | | 1,562,865 | | | | — | | | | — | |
Interest Rate Swap Contracts | | | — | | | | 366,847 | | | | — | |
Total Return Swap Contracts | | | — | | | | 100,493 | | | | — | |
| Total | | $ | 1,562,865 | | | $ | 535,313 | | | $ | — | |
| Liabilities(a) | | | | | | | | | | | | |
Credit Default Swap Contracts | | $ | — | | | $ | (521,459 | ) | | $ | — | |
159
GOLDMAN SACHS SINGLE SECTOR FIXED INCOME FUNDS
Notes to Financial Statements (continued)
September 30, 2017 (Unaudited)
|
| 3. INVESTMENTS AND FAIR VALUE MEASUREMENTS (continued) |
The following is a reconciliation of Level 3 investments for the period ended September 30, 2017:
| | | | |
| |
| | | Bank Loans | |
Beginning Balance as of April 1, 2017 | | $ | 120,508,791 | |
Realized gain (loss) | | | 2,554 | |
Net change in unrealized gain (loss) relating to instruments still held at reporting date | | | (1,178,964 | ) |
Purchases | | | 11,394,457 | |
Sales | | | (914,677 | ) |
Amortization | | | 309,559 | |
Transfers into Level 3 | | | 7,656,188 | |
Transfers out of Level 3 | | | (65,314,072 | ) |
| Ending Balance as of September 30, 2017 | | $ | 72,463,836 | |
Transfers of the above investments into or out of Level 3 can be attributed to changes in the availability of valid pricing sources or in the observability of significant inputs used to measure the fair value of those investments.
| | | | | | | | | | | | |
|
| INVESTMENT GRADE CREDIT | |
| | | |
| Investment Type | | Level 1 | | | Level 2 | | | Level 3 | |
| Assets | | | | | | | | | | | | |
Fixed Income | | | | | | | | | | | | |
Corporate Obligations | | $ | — | | | $ | 381,855,221 | | | $ | — | |
Foreign Debt Obligations | | | — | | | | 9,651,610 | | | | — | |
Municipal Debt Obligations | | | — | | | | 12,667,607 | | | | — | |
U.S. Treasury Obligations | | | 1,714,866 | | | | — | | | | — | |
| Total | | $ | 1,714,866 | | | $ | 404,174,438 | | | $ | — | |
| | | |
| Derivative Type | | | | | | | | | |
| Assets | | | | | | | | | | | | |
Options Purchased | | $ | 18,600 | | | $ | — | | | $ | — | |
Forward Foreign Currency Exchange Contracts(a) | | | — | | | | 27 | | | | — | |
Futures Contracts(a) | | | 291,229 | | | | — | | | | — | |
Interest Rate Swap Contracts(a) | | | — | | | | 13,920 | | | | — | |
Credit Default Swap Contracts(a) | | | — | | | | 39,731 | | | | — | |
| Total | | $ | 309,829 | | | $ | 53,678 | | | $ | — | |
| Liabilities | | | | | | | | | | | | |
Forward Foreign Currency Exchange Contracts | | $ | — | | | $ | (8,909 | ) | | $ | — | |
Futures Contracts | | | (515,975 | ) | | | — | | | | — | |
Interest Rate Swap Contracts | | | — | | | | (18,627 | ) | | | — | |
| Total | | $ | (515,975 | ) | | $ | (27,536 | ) | | $ | — | |
160
GOLDMAN SACHS SINGLE SECTOR FIXED INCOME FUNDS
|
| 3. INVESTMENTS AND FAIR VALUE MEASUREMENTS (continued) |
| | | | | | | | | | | | |
| | | |
| LOCAL EMERGING MARKETS DEBT | | | | | | | | | | | | |
| | | |
| Investment Type | | Level 1 | | | Level 2 | | | Level 3 | |
| Assets | | | | | | | | | | | | |
Fixed Income | | | | | | | | | | | | |
Sovereign Debt Obligations | | $ | — | | | $ | 209,003,050 | | | $ | — | |
Corporate Obligations | | | — | | | | 11,250,942 | | | | — | |
Structured Notes | | | — | | | | 30,771,700 | | | | — | |
Municipal Debt Obligations | | | — | | | | 1,024,177 | | | | — | |
U.S. Treasury Obligations | | | 573,990 | | | | — | | | | — | |
Investment Company | | | 13,869,144 | | | | — | | | | — | |
| Total | | $ | 14,443,134 | | | $ | 252,049,869 | | | $ | — | |
| |
| Derivative Type | | | | |
| Assets | |
Options Purchased | | $ | — | | | $ | 23,638 | | | $ | — | |
Forward Foreign Currency Exchange Contracts(a) | | | — | | | | 2,584,077 | | | | — | |
Futures Contracts(a) | | | 345,421 | | | | — | | | | — | |
Interest Rate Swap Contracts(a) | | | — | | | | 2,711,715 | | | | — | |
| Total | | $ | 345,421 | | | $ | 5,319,430 | | | $ | — | |
| Liabilities(a) | | | | | | | | | | | | |
Forward Foreign Currency Exchange Contracts | | $ | — | | | $ | (4,729,264 | ) | | $ | — | |
Futures Contracts | | | (230,454 | ) | | | — | | | | — | |
Interest Rate Swap Contracts | | | — | | | | (4,591,832 | ) | | | — | |
Credit Default Swap Contracts | | | — | | | | (1,274,115 | ) | | | — | |
| Total | | $ | (230,454 | ) | | $ | (10,595,211 | ) | | $ | — | |
| | | |
| U.S. MORTGAGES | | | | | | | | | | | | |
| | | |
| Investment Type | | Level 1 | | | Level 2 | | | Level 3 | |
| Assets | | | | | | | | | | | | |
Fixed Income | | | | | | | | | | | | |
Mortgage-Backed Obligations | | $ | — | | | $ | 460,749,220 | | | $ | — | |
Asset-Backed Securities | | | — | | | | 53,617,822 | | | | — | |
Municipal Debt Obligation | | | — | | | | 1,124,861 | | | | — | |
U.S. Treasury Obligations | | | 6,398,380 | | | | — | | | | — | |
Investment Company | | | 123,356,139 | | | | — | | | | — | |
| Total | | $ | 129,754,519 | | | $ | 515,491,903 | | | $ | — | |
| Liabilities | | | | | | | | | | | | |
Fixed Income | | | | | | | | | | | | |
Mortgage-Backed Obligations — Forward Sales Contracts | | $ | — | | | $ | (18,953,438 | ) | | $ | — | |
161
GOLDMAN SACHS SINGLE SECTOR FIXED INCOME FUNDS
Notes to Financial Statements (continued)
September 30, 2017 (Unaudited)
|
| 3. INVESTMENTS AND FAIR VALUE MEASUREMENTS (continued) |
| | | | | | | | | | | | |
| | | |
| U.S. MORTGAGES (continued) | | | | | | | | | | | | |
| | | |
Derivative Type | | Level 1 | | | Level 2 | | | Level 3 | |
| Assets | |
Options Purchased | | $ | 21,700 | | | $ | 861,105 | | | $ | — | |
Futures Contracts(a) | | | 156,593 | | | | — | | | | — | |
Interest Rate Swap Contracts(a) | | | — | | | | 15,818 | | | | — | |
| Total | | $ | 178,293 | | | $ | 876,923 | | | $ | — | |
| Liabilities(a) | | | | | | | | | | | | |
Futures Contracts | | $ | (619,210 | ) | | $ | — | | | $ | — | |
Interest Rate Swap Contracts | | | — | | | | (22,110 | ) | | | — | |
Credit Default Swap Contracts | | | — | | | | (180,793 | ) | | | — | |
| Total | | $ | (619,210 | ) | | $ | (202,903 | ) | | $ | — | |
| (a) | | Amount shown represents unrealized gain (loss) at period end. |
| (b) | | Amounts are disclosed by continent to highlight the impact of time zone differences between local market close and the calculation of net asset value. Security valuations are based on the principle exchange or system on which they are traded, which may differ from country of domicile. |
For further information regarding security characteristics, see the Schedules of Investments.
|
| 4. INVESTMENTS IN DERIVATIVES |
The following tables set forth, by certain risk types, the gross value of derivative contracts as of September 30, 2017. These instruments were used as part of the Funds’ investment strategies and to obtain and/or manage exposure related to the risks below. The values in the tables below exclude the effects of cash collateral received or posted pursuant to these derivative contracts, and therefore are not representative of the Funds’ net exposure.
| | | | | | | | | | | | |
| | | |
| Dynamic Emerging Markets Debt | | | | | | | | | | |
| Risk | | Statements of Assets
and Liabilities | | Assets | | | Statements of Assets
and Liabilities | | Liabilities | |
Interest rate | | Receivable for unrealized gain on swap contracts; Variation margin on futures and swap contracts | | $ | 95,309 | (a) | | Payable for unrealized loss on swap contracts | | $ | (38,578) | (a)(b) |
Credit | | Receivable for unrealized gain on swap contracts | | | 9,840 | | | Payable for unrealized loss on swap contracts | | | (103,014) | (b) |
Currency | | Receivable for unrealized gain on forward foreign currency exchange contracts | | | 177,633 | | | Payable for unrealized loss on swap contracts; Payable for unrealized loss on forward foreign currency exchange contracts | | | (343,941) | |
| Total | | | | $ | 282,782 | | | | | $ | (485,533) | |
162
GOLDMAN SACHS SINGLE SECTOR FIXED INCOME FUNDS
|
| 4. INVESTMENTS IN DERIVATIVES (continued) |
| | | | | | | | | | | | |
| | | |
| Emerging Markets Debt | | | | | | | | | | |
| Risk | | Statements of Assets
and Liabilities | | Assets | | | Statements of Assets
and Liabilities | | Liabilities | |
Interest rate | | Receivable for unrealized gain on swap contracts; Variation margin on futures and swap contracts | | $ | 3,205,760 | (a) | | Payable for unrealized loss on swap contracts; Variation margin on futures and swap contracts | | $ | (13,409,844) | (a) |
Currency | | Receivable for unrealized gain on swap contracts; Receivable for unrealized gain on forward foreign currency exchange contracts | | | 9,148,106 | | | Payable for unrealized loss on swap contracts; Payable for unrealized loss on forward foreign currency exchange contracts | | | (12,377,866) | |
| Total | | | | $ | 12,353,866 | | | | | $ | (25,787,710) | |
| | | |
| High Yield | | | | | | | | | | |
| Risk | | Statements of Assets
and Liabilities | | Assets | | | Statements of Assets
and Liabilities | | Liabilities | |
Interest rate | | Variation margin on futures contracts; Purchased options, at value | | $ | 1,870,405 | | | Variation margin on futures contracts | | $ | (516,957) | (a) |
Credit | | — | | | — | | | Payable for unrealized loss on swap contracts | |
| (495,639)
|
|
Currency | | Receivable for unrealized gain on forward foreign currency exchange contracts | | | 66,554 | | | Payable for unrealized loss on forward foreign currency exchange contracts | | | — | |
| Total | | | | $ | 1,936,959 | | | | | $ | (1,012,596) | |
| | | |
| High Yield Floating Rate | | | | | | | | | | |
| Risk | | Statements of Assets
and Liabilities | | Assets | | | Statements of Assets and
Liabilities | | Liabilities | |
Interest rate | | Variation margin on futures and swap contracts, Purchased options, at value | | $ | 1,948,312 | (a) | | — | | $ | — | |
Credit | | — | | | | | | Variation margin on swap contracts | | $ | (521,459) | |
Currency | | Receivable for unrealized gain on forward foreign currency exchange contracts | | | 67,973 | | | — | | | — | |
Equity | | Receivable for unrealized gain on swap contracts | | | 100,493 | | | — | | | — | |
| Total | | | | $ | 2,116,778 | | | | | $ | (521,459) | |
163
GOLDMAN SACHS SINGLE SECTOR FIXED INCOME FUNDS
Notes to Financial Statements (continued)
September 30, 2017 (Unaudited)
|
| 4. INVESTMENTS IN DERIVATIVES (continued) |
| | | | | | | | | | | | |
| | | |
| Investment Grade Credit | | | | | | | | | | |
| Risk | | Statements of Assets
and Liabilities | | Assets | | | Statements of Assets
and Liabilities | | Liabilities | |
Interest rate | | Variation margin on futures contracts | | $ | 309,829 | (a) | | Variation margin on futures and swap contracts | | $ | (515,976) | (a) |
Currency | | Receivable for unrealized gain on forward foreign currency exchange contracts | | | 27 | | | Payable for unrealized loss on forward foreign currency exchange contracts | | | (8,909) | |
| Total | | | | $
| 309,856
|
| | | | $ | (524,885) | |
| | | |
| Local Emerging Markets Debt | | | | | | | | | | |
| Risk | | Statements of Assets
and Liabilities | | Assets | | | Statements of Assets
and Liabilities | | Liabilities | |
Interest rate | | Receivable for unrealized gain on swap contracts; Variation margin on futures contracts | | $ | 2,649,367 | (a) | | Payable for unrealized loss on swap contracts; Variation margin on swap contracts | | $ | (5,087,465) | (a)(b) |
Credit | | Receivable for unrealized gain on swap contracts | | | — | | | Payable for unrealized loss on swap contracts | | | (1,846,510) | |
Currency | | Receivable for unrealized gain on forward foreign currency exchange contracts | | | 7,704,800 | | | Payable for unrealized loss on swap contracts and; Payable for unrealized loss on forward foreign currency exchange contracts | | | (13,910,874) | |
| Total | | | | $ | 10,354,167 | | | | | $ | (20,844,849) | |
| | | | | | | | | | | | |
| | | |
| U.S. Mortgages | | | | | | | | | | |
| Risk | | Statements of Assets
and Liabilities | | Assets | | | Statements of Assets
and Liabilities | | Liabilities | |
Interest rate | | Receivable for unrealized gain on swap contracts; Variation margin on futures contracts | | $ | 1,055,216 | (a) | | Payable for unrealized loss on swap contracts | | $ | (641,320) | (a)(b) |
Credit | | — | | | — | | | Payable for unrealized loss on swap contracts | | | (180,793) | |
| Total | | | | $ | 1,055,216 | | | | | $ | (822,113) | |
| (a) | | Includes unrealized gain (loss) on futures contracts and centrally cleared swaps described in the Additional Investment Information sections of the Schedules of Investments. Only the variation margin as of September 30, 2017 is reported within the Statements of Assets and Liabilities. |
| (b) | | Aggregate of amounts include $122,654, $9,633,807, $638,111, $5,441,886 and $180,793, for Dynamic Emerging Markets Debt, Emerging Markets Debt, High Yield Floating Rate, Local Emerging Markets Debt and U.S. Mortgages, which represent the payments to be made pursuant to bilateral agreements should counterparties exercise their “right to terminate” provisions based on, among others, the Funds’ performance, its failure to pay on its obligations or failure to pledge collateral. Such amounts do not include incremental charges directly associated with the close-out of the agreements. They also do not reflect the fair value of any assets pledged as collateral which, through the daily margining process, substantially offsets the aforementioned amounts and for which the Fund is entitled to a full return. |
164
GOLDMAN SACHS SINGLE SECTOR FIXED INCOME FUNDS
|
| 4. INVESTMENTS IN DERIVATIVES (continued) |
The following tables set forth, by certain risk types, the Funds’ gains (losses) related to these derivatives and their indicative volumes for the six months ended September 30, 2017. These gains (losses) should be considered in the context that these derivative contracts may have been executed to create investment opportunities and/or economically hedge certain investments, and accordingly, certain gains (losses) on such derivative contracts may offset certain (losses) gains attributable to investments. These gains (losses) are included in “Net realized gain (loss)” or “Net change in unrealized gain (loss)” on the Statements of Operations:
| | | | | | | | | | | | | | |
| | | |
| Dynamic Emerging Markets Debt | | | | | | | | | | | | |
| Risk | | Statements of Operations | | Net Realized
Gain (Loss) | | | Net Change in
Unrealized
Gain (Loss) | | | Average
Number of
Contracts(a) | |
| Interest rate | | Net realized gain (loss) from futures contracts and swap contracts/Net change in unrealized gain (loss) on purchased options, futures contracts and swap contracts | | $ | 79,804 | | | $ | (9,044 | ) | | | 16 | |
| Credit | | Net realized gain (loss) from swap contracts/Net change in unrealized gain (loss) on swap contracts | | | (56,101 | ) | | | 14,533 | | | | 71 | |
| Currency | | Net realized gain (loss) from forward foreign currency exchange contracts/Net change in unrealized gain (loss) on forward foreign currency exchange contracts | | | 435,290 | | | | (249,862 | ) | | | 417 | |
| Total | | $ | 458,993 | | | $ | (244,373 | ) | | | 504 | |
| | | |
| Emerging Markets Debt | | | | | | | | | | | | |
| Risk | | Statements of Operations | | Net Realized
Gain (Loss) | | | Net Change in
Unrealized
Gain (Loss) | | | Average
Number of
Contracts(a) | |
| Interest rate | | Net realized gain (loss) from futures contracts and swap contracts/Net change in unrealized gain (loss) on futures contracts and swap contracts | | $ | 1,857,649 | | | $ | (4,523,842 | ) | | | 2,787 | |
| Credit | | Net realized gain (loss) from swap contracts/Net change in unrealized gain (loss) on swap contracts | | | (2,206,011 | ) | | | (1,655,861 | ) | | | 131 | |
| Currency | | Net realized gain (loss) from swap contracts, forward foreign currency exchange contracts/Net change in unrealized gain (loss) on swap contracts and forward foreign currency exchange contracts | | | (12,046,822 | ) | | | (3,418,206 | ) | | | 376 | |
| Total | | $ | (12,395,184 | ) | | $ | (9,597,909 | ) | | | 3,294 | |
| | | |
| High Yield | | | | | | | | | | | | |
| Risk | | Statements of Operations | | Net Realized
Gain (Loss) | | | Net Change in
Unrealized
Gain (Loss) | | | Average
Number of
Contracts(a) | |
| Interest rate | | Net realized gain (loss) from futures contracts/Net change in unrealized gain (loss) on futures contracts | | $ | (4,076,945 | ) | | $ | 1,344,020 | | | | 2,573 | |
| Credit | | Net realized gain (loss) from swap contracts/Net change in unrealized gain (loss) on swap contracts | | | (1,825,033 | ) | | | 335,870 | | | | 2 | |
| Currency | | Net realized gain (loss) from forward foreign currency exchange contracts /Net change in unrealized gain (loss) on forward foreign currency exchange contracts | | | (2,048,349 | ) | | | 283,557 | | | | 2 | |
| Total | | $ | (7,950,327 | ) | | $ | 1,963,447 | | | | 2,577 | |
165
GOLDMAN SACHS SINGLE SECTOR FIXED INCOME FUNDS
Notes to Financial Statements (continued)
September 30, 2017 (Unaudited)
|
| 4. INVESTMENTS IN DERIVATIVES (continued) |
| | | | | | | | | | | | | | |
| | | |
| High Yield Floating Rate | | | | | | | | | | | | |
| Risk | | Statements of Operations | | Net Realized
Gain (Loss) | | | Net Change in
Unrealized
Gain (Loss) | | | Average
Number of
Contracts(a) | |
| Interest rate | | Net realized gain (loss) from futures contracts and swap contracts/Net change in unrealized gain (loss) on futures contracts and swap contracts | | $ | (2,814,119 | ) | | $ | 2,485,397 | | | | 1,131 | |
| Credit | | Net realized gain (loss) from swap contracts/Net change in unrealized gain (loss) on swap contracts | | | (809,439 | ) | | | (521,459 | ) | | | 1 | |
| Currency | | Net realized gain (loss) from forward foreign currency exchange contracts/Net change in unrealized gain (loss) on forward foreign currency exchange contracts | | | (1,805,699 | ) | | | 154,937 | | | | 3 | |
| Equity | | Net realized gain (loss) from swap contracts/Net change in unrealized gain (loss) on swap contracts | | | (991,153 | ) | | | 616,421 | | | | 5 | |
| Total | | $ | (6,420,410 | ) | | $ | 2,735,296 | | | | 1,140 | |
| | |
| Investment Grade Credit | | | | | | | | | |
| Risk | | Statements of Operations | | Net Realized
Gain (Loss) | | | Net Change in
Unrealized
Gain (Loss) | | | Average
Number of
Contracts(a) | |
| Interest rate | | Net realized gain (loss) from futures contracts and swap contracts /Net change in unrealized gain (loss) on futures contracts and swap contracts | | $ | 907,130 | | | $ | (222,975 | ) | | | 767 | |
| Currency | | Net realized gain (loss) from forward foreign currency exchange contracts /Net change in unrealized gain (loss) on forward foreign currency exchange contracts | | | (284,258 | ) | | | (8,882 | ) | | | 8 | |
| Total | | $ | 622,872 | | | $ | (231,857 | ) | | | 775 | |
| | | |
| Local Emerging Markets Debt | | | | | | | | | | | | |
| Risk | | Statements of Operations | | Net Realized
Gain (Loss) | | | Net Change in
Unrealized
Gain (Loss) | | | Average
Number of
Contracts(a) | |
| Interest rate | | Net realized gain (loss) from futures contracts and swap contracts /Net change in unrealized gain (loss) on futures contracts, and swap contracts | | $ | 401,055 | | | $ | 672,948 | | | | 570 | |
| Credit | | Net realized gain (loss) from swap contracts/Net change in unrealized gain (loss) on swap contracts | | | (7,797,204 | ) | | | 870,436 | | | | 54 | |
| Currency | | Net realized gain (loss) from forward foreign currency exchange contracts/Net change in unrealized gain (loss) on swap contracts and forward foreign currency exchange contracts | | | 7,309,710 | | | | 4,060,887 | | | | 445 | |
| Total | | $ | (86,439 | ) | | $ | 5,604,271 | | | | 1,069 | |
166
GOLDMAN SACHS SINGLE SECTOR FIXED INCOME FUNDS
|
| 4. INVESTMENTS IN DERIVATIVES (continued) |
| | | | | | | | | | | | | | |
| | |
| U.S. Mortgages | | | | | | | | | |
| Risk | | Statements of Operations | | Net Realized
Gain (Loss) | | | Net Change in
Unrealized
Gain (Loss) | | | Average
Number of
Contracts(a) | |
| Interest rate | | Net realized gain (loss) from purchased options, futures contracts/Net change in unrealized gain (loss) on futures contracts and purchased options | | $ | 1,270,299 | | | $ | (581,661 | ) | | | 928 | |
| Credit | | Net realized gain (loss) from swap contracts/Net change in unrealized gain (loss) on swap contracts | | | (26,251 | ) | | | (174,983 | ) | | | 1 | |
| Total | | $ | 1,244,048 | | | $ | (756,644 | ) | | | 929 | |
| (a) | | Average number of contracts is based on the average of month end balances for the fiscal year September 30, 2017. |
In order to better define its contractual rights and to secure rights that will help a Fund mitigate its counterparty risk, a Fund may enter into an International Swaps and Derivatives Association, Inc. Master Agreement (“ISDA Master Agreement”) or similar agreement with its derivatives counterparties. An ISDA Master Agreement is a bilateral agreement between a Fund and a counterparty that governs OTC derivatives (including forward foreign currency exchange contracts, and certain options and swaps), and typically contains, among other things, collateral posting terms and netting provisions in the event of a default and/or termination event. The provisions of the ISDA Master Agreement typically permit a single net payment in the event of a default (close-out netting) or similar event, including the bankruptcy or insolvency of the counterparty.
Collateral and margin requirements differ between exchange traded derivatives and OTC derivatives. Margin requirements are established by the broker or clearing house for exchange-traded and centrally cleared derivatives (financial futures contracts, options and centrally cleared swaps) pursuant to governing agreements for those instrument types. Brokers can ask for margin in excess of the minimum in certain circumstances. Collateral terms are contract-specific for OTC derivatives. For derivatives traded under an ISDA Master Agreement, the collateral requirements are typically calculated by netting the marked to market amount for each transaction under such agreement and comparing that amount to the value of any collateral currently pledged by a Fund and the counterparty. Additionally, a Fund may be required to post initial margin to the counterparty, the terms of which would be outlined in the confirmation of the OTC transaction.
For financial reporting purposes, cash collateral that has been pledged to cover obligations of a Fund and cash collateral received from the counterparty, if any, is reported separately on the Statements of Assets and Liabilities as receivables/payables for collateral on certain derivative contracts. Non-cash collateral pledged by a Fund, if any, is noted in the Schedules of Investments. Generally, the amount of collateral due from or to a counterparty must exceed a minimum transfer amount threshold before a transfer is required to be made. To the extent amounts due to a Fund from its counterparties are not fully collateralized, contractually or otherwise, the Fund bears the risk of loss from counterparty nonperformance. A Fund attempts to mitigate counterparty risk by only entering into agreements with counterparties that the Investment Adviser believes to be of good standing and by monitoring the financial stability of those counterparties.
Additionally, the netting of assets and liabilities and the offsetting of collateral pledged or received are based on contractual netting/set-off provisions in the ISDA Master Agreement or similar agreements. However, in the event of a default or insolvency of a counterparty, a court could determine that such rights are not enforceable due to the restrictions or prohibitions against the right of setoff that may be imposed in accordance with a particular jurisdiction’s bankruptcy or insolvency laws.
167
GOLDMAN SACHS SINGLE SECTOR FIXED INCOME FUNDS
Notes to Financial Statements (continued)
September 30, 2017 (Unaudited)
|
| 4. INVESTMENTS IN DERIVATIVES (continued) |
The following tables set forth the Funds’ net exposure for derivative instruments that are subject to enforceable master netting arrangements or similar agreements as of September 30, 2017:
| | | | | | | | | | | | | | | | | | | | | | | | | | | | | | | | | | | | | | | | |
| | | | | | |
| Dynamic Emerging Markets Debt | | | | | | | | | | | | | | | | | | | | | | | | | |
| | | Derivative Assets(1) | | | Derivative Liabilities(1) | | | | | | | | | | |
| Counterparty | | Options
Purchased | | | Swaps | | | Forward
Currency
Contracts | | | Total | | | Swaps | | | Forward
Currency
Contracts | | | Total | | | Net Derivative
Asset
(Liabilities) | | | Collateral
(Received)
Pledged(1) | | | Net
Amount(2) | |
Bank of America Securities LLC | | $ | — | | | $ | 11,031 | | | $ | — | | | $ | 11,031 | | | $ | (6,186 | ) | | $ | — | | | $ | (6,186 | ) | | $ | 4,845 | | | $ | — | | | $ | 4,845 | |
Barclays Bank PLC | | | — | | | | 9,224 | | | | — | | | | 9,224 | | | | (3,937 | ) | | | — | | | | (3,937 | ) | | | 5,287 | | | | — | | | | 5,287 | |
Citibank NA | | | — | | | | 616 | | | | — | | | | 616 | | | | (68,346 | ) | | | — | | | | (68,346 | ) | | | (67,730 | ) | | | — | | | | (67,730 | ) |
Credit Suisse International (London) | | | — | | | | — | | | | — | | | | — | | | | (143 | ) | | | — | | | | (143 | ) | | | (143 | ) | | | — | | | | (143 | ) |
Deutsche Bank AG | | | — | | | | 12,911 | | | | — | | | | 12,911 | | | | (8,365 | ) | | | — | | | | (8,365 | ) | | | 4,546 | | | | — | | | | 4,546 | |
JPMorgan Securities, Inc. | | | — | | | | — | | | | — | | | | — | | | | (19,287 | ) | | | — | | | | (19,287 | ) | | | (19,287 | ) | | | — | | | | (19,287 | ) |
Morgan Stanley & Co. International PLC | | | 1,938 | | | | — | | | | 177,633 | | | | 179,571 | | | | (16,390 | ) | | | (343,941 | ) | | | (360,331 | ) | | | (180,760 | ) | | | 180,760 | | | | — | |
Total | | $ | 1,938 | | | $ | 33,782 | | | $ | 177,633 | | | $ | 213,353 | | | $ | (122,654 | ) | | $ | (343,941 | ) | | $ | (466,595 | ) | | $ | (253,242 | ) | | $ | 180,760 | | | $ | (72,482 | ) |
| | | | | | |
| Emerging Markets Debt | | | | | | | | | | | | | | | | | | | | | | | | | |
| | | Derivative Assets(1) | | | Derivative Liabilities(1) | | | | | | | | | | |
| Counterparty | | Options
Purchased | | | Swaps | | | Forward
Currency
Contracts | | | Total | | | Swaps | | | Forward
Currency
Contracts | | | Total | | | Net Derivative
Asset
(Liabilities) | | | Collateral
(Received)
Pledged(1) | | | Net
Amount(2) | |
Bank of America Securities LLC | | $ | — | | | $ | — | | | $ | — | | | $ | — | | | $ | (823,191 | ) | | $ | — | | | $ | (823,191 | ) | | $ | (823,191 | ) | | $ | 440,240 | | | $ | (382,591 | ) |
Barclays Bank PLC | | | — | | | | 175,881 | | | | — | | | | 175,881 | | | | (871,232 | ) | | | — | | | | (871,232 | ) | | | (695,351 | ) | | | 695,351 | | | | — | |
Citibank NA | | | — | | | | 347,679 | | | | — | | | | 347,679 | | | | (3,274,425 | ) | | | — | | | | (3,274,425 | ) | | | (2,926,746 | ) | | | 350,000 | | | | (2,576,746 | ) |
Deutsche Bank AG | | | — | | | | — | | | | — | | | | — | | | | (1,332,289 | ) | | | — | | | | (1,332,289 | ) | | | (1,332,289 | ) | | | 1,332,289 | | | | — | |
JPMorgan Securities, Inc. | | | — | | | | — | | | | — | | | | — | | | | (1,221,706 | ) | | | — | | | | (1,221,706 | ) | | | (1,221,706 | ) | | | 1,000,000 | | | | (221,706 | ) |
Morgan Stanley & Co. International PLC | | | 206,537 | | | | 511,212 | | | | 9,148,106 | | | | 9,865,855 | | | | (1,593,147 | ) | | | (12,377,866 | ) | | | (13,971,013 | ) | | | (4,105,158 | ) | | | 4,105,158 | | | | — | |
UBS AG (London) | | | — | | | | — | | | | — | | | | — | | | | (442,591 | ) | | | — | | | | (442,591 | ) | | | (442,591 | ) | | | 400,000 | | | | (42,591 | ) |
Total | | $ | 206,537 | | | $ | 1,034,772 | | | $ | 9,148,106 | | | $ | 10,389,415 | | | $ | (9,558,581 | ) | | $ | (12,377,866 | ) | | $ | (21,936,447 | ) | | $ | (11,547,032 | ) | | $ | 8,323,038 | | | $ | (3,223,634 | ) |
168
GOLDMAN SACHS SINGLE SECTOR FIXED INCOME FUNDS
|
| 4. INVESTMENTS IN DERIVATIVES (continued) |
| | | | | | | | | | | | | | | | | | | | | | | | | | | | | | | | | | | | | | | | |
| | | | | | |
| Local Emerging Markets Debt | | | | | | | | | | | | | | | | | | | | | | | | | |
| | | Derivative Assets(1) | | | Derivative Liabilities(1) | | | | | | | | | | |
| Counterparty | | Options
Purchased | | | Swaps | | | Forward
Currency
Contracts | | | Total | | | Swaps | | | Forward
Currency
Contracts | | | Total | | | Net Derivative
Asset
(Liabilities) | | | Collateral
(Received)
Pledged(1) | | | Net
Amount(2) | |
Bank of America Securities LLC | | $ | — | | | $ | 272,547 | | | $ | — | | | $ | 272,547 | | | $ | (117,856 | ) | | $ | — | | | $ | (117,856 | ) | | $ | 154,691 | | | $ | — | | | $ | 154,691 | |
Barclays Bank PLC | | | — | | | | 218,825 | | | | — | | | | 218,825 | | | | (146,196 | ) | | | — | | | | (146,196 | ) | | | 72,629 | | | | — | | | | 72,629 | |
Citibank NA | | | — | | | | 435,200 | | | | — | | | | 435,200 | | | | (1,227,867 | ) | | | — | | | | (1,227,867 | ) | | | (792,667 | ) | | | — | | | | (792,667 | ) |
Credit Suisse International (London) | | | — | | | | — | | | | — | | | | — | | | | (400,015 | ) | | | — | | | | (400,015 | ) | | | (400,015 | ) | | | 360,000 | | | | (40,015 | ) |
Deutsche Bank AG | | | — | | | | 2,177 | | | | — | | | | 2,177 | | | | (2,744,137 | ) | | | — | | | | (2,744,137 | ) | | | (2,741,960 | ) | | | 2,570,000 | | | | (171,960 | ) |
JPMorgan Securities, Inc. | | | — | | | | 471,839 | | | | — | | | | 471,839 | | | | (75,058 | ) | | | — | | | | (75,058 | ) | | | 396,781 | | | | (270,000 | ) | | | 126,781 | |
Morgan Stanley & Co. International PLC | | | 23,638 | | | | 443,908 | | | | 2,584,077 | | | | 3,051,623 | | | | (724,109 | ) | | | (4,729,264 | ) | | | (5,453,373 | ) | | | (2,401,750 | ) | | | 2,401,750 | | | | — | |
UBS AG (London) | | | — | | | | — | | | | — | | | | — | | | | (6,648 | ) | | | — | | | | (6,648 | ) | | | (6,648 | ) | | | — | | | | (6,648 | ) |
Total | | $ | 23,638 | | | $ | 1,844,496 | | | $ | 2,584,077 | | | $ | 4,452,211 | | | $ | (5,441,886 | ) | | $ | (4,729,264 | ) | | $ | (10,171,150 | ) | | $ | (5,718,939 | ) | | $ | 5,061,750 | | | $ | (657,189 | ) |
| (1) | | Gross amounts available for offset but not netted in the Statements of Assets and Liabilities. |
| (2) | | Net amount represents the net amount due (to) from counterparty in the event of a default based on the contractual set-off rights under the agreement. Net amount excludes any over-collateralized amounts. |
|
| 5. AGREEMENTS AND AFFILIATED TRANSACTIONS |
A. Management Agreement — Under the Agreement, GSAM manages the Funds, subject to the general supervision of the Trustees.
As compensation for the services rendered pursuant to the Agreement, the assumption of the expenses related thereto and administration of the Funds’ business affairs, including providing facilities, GSAM is entitled to a management fee, accrued daily and paid monthly, equal to an annual percentage rate of each Fund’s average daily net assets. For the six months ended September 30, 2017 , contractual and effective net management fees with GSAM were at the following rates:
| | | | | | | | | | | | | | | | | | | | | | | | | | | | | | |
Fund Name | | | | Contractual Management Rate | | | Effective Net
Management
Rate^ | |
| | | First
$1 billion | | | Next
$1 billion | | | Next
$3 billion | | | Next
$3 billion | | | Over
$8 billion | | | Effective
Rate | | |
Dynamic Emerging Markets Debt Fund | | | | | 0.80 | % | | | 0.80 | % | | | 0.72 | % | | | 0.68 | % | | | 0.67 | % | | | 0.86 | %* | | | 0.80 | % |
Emerging Markets Debt Fund | | | | | 0.80 | | | | 0.80 | | | | 0.72 | | | | 0.68 | | | | 0.67 | | | | 0.80 | | | | 0.80 | |
High Yield Fund | | | | | 0.70 | | | | 0.70 | | | | 0.63 | | | | 0.60 | | | | 0.59 | | | | 0.67 | | | | 0.67 | |
High Yield Floating Rate Fund | | | | | 0.60 | | | | 0.54 | | | | 0.51 | | | | 0.50 | | | | 0.49 | | | | 0.54 | | | | 0.52 | |
Investment Grade Credit Fund | | | | | 0.34 | | | | 0.31 | | | | 0.29 | | | | 0.28 | | | | 0.28 | | | | 0.38 | * | | | 0.34 | |
Local Emerging Markets Debt Fund | | | | | 0.80 | | | | 0.80 | | | | 0.72 | | | | 0.68 | | | | 0.67 | | | | 0.87 | * | | | 0.80 | |
U.S. Mortgages Fund | | | | | 0.34 | | | | 0.31 | | | | 0.29 | | | | 0.28 | | | | 0.28 | | | | 0.38 | * | | | 0.34 | |
| ^ | | Effective Net Management Rate includes the impact of management fee waivers of affiliated underlying funds, if any. |
| * | | Effective July 28, 2017, GSAM reduced the contractual management fee across all breakpoints for Dynamic Emerging Markets Debt Fund, Investment Grade Credit Fund, Local Emerging Markets Debt Fund and U.S. Mortgages Fund. Prior to July 28, 2017, the Effective Rates were 0.90%, 0.40%, 0.90% and 0.40%, respectively. |
169
GOLDMAN SACHS SINGLE SECTOR FIXED INCOME FUNDS
Notes to Financial Statements (continued)
September 30, 2017 (Unaudited)
|
| 5. AGREEMENTS AND AFFILIATED TRANSACTIONS (continued) |
The Funds invest in Institutional Shares of the Goldman Sachs Financial Square Government Fund, which is an affiliated Underlying Fund. GSAM has agreed to waive a portion of its management fee payable by the Funds in an amount equal to the management fee it earns as an investment adviser to any of the affiliated Underlying Funds in which the Funds invest. For the six months ended September 30, 2017, the management fee waived by GSAM was for each Fund as follows:
| | | | | | |
| Fund | | | | Management
Fee Waived | |
Dynamic Emerging Markets Debt | | | | $ | 760 | |
Emerging Markets Debt | | | | | 25,180 | |
High Yield | | | | | 143,505 | |
High Yield Floating Rate | | | | | 361,442 | |
Investment Grade Credit | | | | | 966 | |
Local Emerging Markets Debt | | | | | 12,296 | |
U.S. Mortgages | | | | | 66,989 | |
B. Distribution and/or Service (12b-1) Plans — The Trust, on behalf of Class A and Class R Shares of each applicable Fund, has adopted Distribution and Service Plans subject to Rule 12b-1 under the Act. Under the Distribution and Service Plans, Goldman Sachs, which serves as distributor (the “Distributor”), is entitled to a fee accrued daily and paid monthly for distribution services and personal and account maintenance services, which may then be paid by Goldman Sachs to authorized dealers. These fees are equal to an annual percentage rate of the average daily net assets attributable to Class A or Class R Shares of the Funds, as applicable.
The Trust, on behalf of Class C Shares of each applicable Fund, has adopted a Distribution Plan subject to Rule 12b-1 under the Act. Under the Distribution Plan, Goldman Sachs as Distributor is entitled to a fee accrued daily and paid monthly for distribution services, which may then be paid by Goldman Sachs to authorized dealers. These fees are equal to an annual percentage rate of the average daily net assets attributable to Class C Shares of the Funds.
The Trust, on behalf of Service Shares of each applicable Fund, has adopted a Service Plan subject to Rule 12b-1 under the Act to allow Service Shares to compensate service organizations (including Goldman Sachs) for providing personal and account maintenance services to their customers who are beneficial owners of such shares. The Service Plan provides for compensation to the service organizations equal to an annual percentage rate of the average daily net assets attributable to Services Shares of the Funds.
| | | | | | | | | | | | | | | | |
| | | Distribution and Service Plan Rates | |
| | | Class A* | | | Class C | | | Class R* | | | Service
Shares | |
Distribution Plan | | | 0.25 | % | | | 0.75 | % | | | 0.50 | % | | | — | % |
Service Plan | | | — | | | | 0.25 | | | | — | | | | 0.25 | |
| * | | With respect to Class A and Class R Shares, the Distributor at its discretion may use compensation for distribution services paid under the Distribution Plan to compensate service organizations for personal and account maintenance services and expenses as long as such total compensation does not exceed the maximum capon “service fees” imposed by the Financial Industry Regulatory Authority. |
170
GOLDMAN SACHS SINGLE SECTOR FIXED INCOME FUNDS
|
| 5. AGREEMENTS AND AFFILIATED TRANSACTIONS (continued) |
C. Distribution Agreement — Goldman Sachs, as Distributor of the shares of the Funds pursuant to a Distribution Agreement, may retain a portion of the Class A Shares’ front end sales charge and Class C Shares’ CDSC. During the six months ended September 30, 2017, Goldman Sachs advised that it retained the following amounts:
| | | | | | |
| | | | | Front End
Sales Charge | |
| Fund | | | | Class A | |
Dynamic Emerging Markets Debt | | | | $ | 5 | |
Emerging Markets Debt | | | | | 8,841 | |
High Yield | | | | | 7,446 | |
High Yield Floating Rate | | | | | 401 | |
Investment Grade Credit | | | | | 1,066 | |
Local Emerging Markets Debt | | | | | 579 | |
U.S. Mortgages | | | | | 35 | |
During the six months ended September 30, 2017, Goldman Sachs did not retain any portion of Class C Shares’ CDSC.
D. Service and/or Shareholder Administration Plan — The Trust, on behalf of each applicable Fund, has adopted Service and/or Shareholder Administration Plans to allow Class C and Service Shares, respectively, to compensate service organizations (including Goldman Sachs) for providing varying levels of personal and account maintenance and/or shareholder administration services to their customers who are beneficial owners of such shares. The Service and/or Shareholder Administration Plans each provide for compensation to the service organizations equal to an annual percentage rate of 0.25% the average daily net assets attributable to Class C or Service Shares of the Funds, respectively and as applicable.
E. Transfer Agency Agreement — Goldman Sachs also serves as the transfer agent of the Funds for a fee pursuant to the Transfer Agency Agreement. The fees charged for such transfer agency services are accrued daily and paid monthly at annual rates as follows: 0.13% of the average daily net assets of Class A, Class C, Investor and Class R Shares; 0.03% of the average daily net assets of Class R6 Shares; and 0.04% of the average daily net assets of Institutional, Separate Account Institutional and Service Shares. Prior to July 28, 2017, the annual rate for Class R6 Shares was 0.02%.
Goldman Sachs has agreed to waive a portion of the transfer agency fees equal to 0.04% of the average daily net assets attributable to Class A, Class C and Investor Shares of the Local Emerging Markets Debt Fund and 0.03% of the average daily net assets attributable to Class A, Class C, Investor and Class R Shares of the High Yield Fund through at least July 28, 2018. Prior to such date, Goldman Sachs may not terminate the arrangement without approval of the Board of Trustees.
F. Other Expense Agreements and Affiliated Transactions — GSAM has agreed to limit certain “Other Expenses” of the Funds (excluding acquired fund fees and expenses, transfer agency fees and expenses, service fees and shareholder administration fees (as applicable), taxes, interest, brokerage fees, expenses of shareholder meetings, litigation and indemnification, and extraordinary expenses) to the extent such expenses exceed, on an annual basis, a percentage rate of the average daily net assets of each Fund. Such Other Expense reimbursements, if any, are accrued daily and paid monthly. In addition, the Funds are not obligated to reimburse GSAM for prior fiscal year expense reimbursements, if any. The Other Expense limitations as an annual percentage rate of average daily net assets for the Dynamic Emerging Markets Debt, Emerging Markets Debt, High Yield, High Yield Floating Rate, Investment Grade Credit, Local Emerging Markets Debt and U.S. Mortgages Funds, are 0.024%, 0.024%, 0.024%, 0.104%, 0.004%, 0.074% and 0.074%, respectively. These Other Expense limitations will remain in place through at least July 28, 2018, and prior to such date GSAM may not terminate the arrangements without the approval of the Trustees. In addition, the Funds have entered into certain offset arrangements with the custodian and the transfer agent, which may result in a reduction of the Funds’ expenses and are received irrespective of the application of the “Other Expense” limitations described above.
171
GOLDMAN SACHS SINGLE SECTOR FIXED INCOME FUNDS
Notes to Financial Statements (continued)
September 30, 2017 (Unaudited)
|
| 5. AGREEMENTS AND AFFILIATED TRANSACTIONS (continued) |
For the six months ended September 30, 2017, these expense reductions, including any fee waivers and Other Expense reimbursements, were as follows:
| | | | | | | | | | | | | | | | | | |
| Fund Name | | | | Management
Fee Waiver | | | Transfer Agency
Fee Waiver | | | Other Expense
Reimbursements | | | Total
Expense
Reductions | |
Dynamic Emerging Markets Debt | | | | | 7,922 | | | | — | | | | 208,020 | | | | 215,942 | |
Emerging Markets Debt | | | | | 25,180 | | | | — | | | | 88,261 | | | | 113,441 | |
High Yield | | | | | 143,505 | | | | 15,779 | | | | — | | | | 159,284 | |
High Yield Floating Rate | | | | | 361,442 | | | | — | | | | — | | | | 361,442 | |
Investment Grade Credit | | | | | 81,551 | | | | — | | | | 161,402 | | | | 242,953 | |
Local Emerging Markets Debt | | | | | 109,070 | | | | 4,173 | | | | 270,319 | | | | 383,562 | |
U.S. Mortgages | | | | | 158,189 | | | | — | | | | 91,017 | | | | 249,206 | |
G. Line of Credit Facility — As of September 30, 2017, the Funds participated in a $1,100,000,000 committed, unsecured revolving line of credit facility (the “facility”) together with other funds of the Trust and certain registered investment companies having management agreements with GSAM or its affiliates. This facility is to be used for temporary emergency purposes, or to allow for an orderly liquidation of securities to meet redemption requests. The interest rate on borrowings is based on the federal funds rate. The facility also requires a fee to be paid by the Funds based on the amount of the commitment that has not been utilized. For the six months ended September 30, 2017, the Funds did not have any borrowings under the facility.
H. Other Transactions with Affiliates — For the six months ended September 30, 2017 , Goldman Sachs earned $38,716, $4,999 and $6,179, in brokerage commissions from portfolio transactions, including futures transactions executed with Goldman Sachs as the Futures Commission Merchant, on behalf of the Goldman Sachs Emerging Markets Debt, Investment Grade Credit, and Local Emerging Markets Debt Funds, respectively.
The Funds may purchase securities from, or sell securities to, an affiliated fund provided the affiliation is solely due to having a common investment adviser, common officers, or common trustees. For the six months ended September 30, 2017, the purchase and sale transactions and related net realized gain (loss) for the Funds with an affiliated fund in compliance with Rule 17a-7 under the Act were as follows:
| | | | | | | | | | | | |
| | | | | Purchases
at cost | | Proceeds
from Sales | | | Net realized
gain (loss) | |
High Yield | | | | $— | | $ | 1,040,000 | | | $ | 40,000 | |
As of September 30, 2017, the following Fund of Funds Portfolios were the beneficial owners of 5% or more of total outstanding shares of the following Fund:
| | | | | | | | | | | | | | |
| Fund | | | | Goldman Sachs Balanced Strategies
Portfolio | | | Goldman Sachs Growth and
Income Portfolio | | | Goldman Sachs Satellite Strategies Portfolio | |
Local Emerging Markets Debt | | | | | 5 | % | | | 6 | % | | | 11 | % |
172
GOLDMAN SACHS SINGLE SECTOR FIXED INCOME FUNDS
|
| 5. AGREEMENTS AND AFFILIATED TRANSACTIONS (continued) |
As of September 30, 2017 The Goldman Sachs Group, Inc. was the beneficial owner of 5% or more of outstanding Class C, Institutional, Investor, Class R and Class R6 Shares of the following funds:
| | | | | | | | | | | | | | | | | | | | | | |
| Fund Name | | | | Class C | | | Institutional | | | Investor | | | Class R | | | Class R6 | |
Dynamic Emerging Markets Debt | | | | | 7 | | | | 12 | | | | 13 | | | | 96 | | | | — | |
High Yield Floating Rate | | | | | — | | | | — | | | | — | | | | 100 | | | | — | |
Investment Grade Credit | | | | | — | | | | — | | | | — | | | | — | | | | 65 | |
The table below shows the transactions in and earnings from investments in the Underlying Funds for the six months ended September 30, 2017:
| | | | | | | | | | | | | | | | | | | | | | | | | | | | | | |
| Fund | | Affiliated Underlying Fund | | Beginning
Value as of
March 31,
2017 | | | Purchases
at cost | | | Proceeds
from sales | | | Change in
Unrealized
Appreciation/
Depreciation) | | | Ending
Value as of
September 30,
2017 | | | Shares as of
September 30,
2017 | | | Dividend
Income
from
Affiliated
Investment
Companies | |
| Dynamic Emerging Markets Debt | | Goldman Sachs Financial Square Government Fund — Institutional Shares | | | 627,342 | | | | 8,137,142 | | | | (8,139,692 | ) | | | — | | | | 624,792 | | | | 624,792 | | | | 3,630 | |
| Emerging Markets Debt | | Goldman Sachs Financial Square Government Fund — Institutional Shares | | | 7,523,665 | | | | 670,690,605 | | | | (617,171,565 | ) | | | — | | | | 61,042,705 | | | | 61,042,705 | | | | 125,303 | |
| High Yield | | Goldman Sachs Financial Square Government Fund — Institutional Shares | | | 70,091,823 | | | | 842,279,871 | | | | (765,419,241 | ) | | | — | | | | 146,952,453 | | | | 146,952,453 | | | | 620,517 | |
| | | Goldman Sachs Treasury Access 0-1 Year ETF | | | 25,007,500 | | | | 25,009,976 | | | | — | | | | 37,494 | | | | 50,054,970 | | | | 499,800 | | | | 103,987 | |
| High Yield Floating Rate | | Goldman Sachs Financial Square Government Fund — Institutional Shares | | | 534,169,308 | | | | 593,095,209 | | | | (840,847,634 | ) | | | — | | | | 286,416,883 | | | | 286,416,883 | | | | 1,652,111 | |
| | | Goldman Sachs Treasury Access 0-1 Year ETF | | | 17,514,953 | | | | 14,083,253 | | | | — | | | | 25,358 | | | | 31,623,564 | | | | 315,762 | | | | 70,197 | |
| Investment Grade Credit | | Goldman Sachs Financial Square Government Fund — Institutional Shares | | | 6,187,441 | | | | 40,027,453 | | | | (46,214,894 | ) | | | — | | | | — | | | | — | | | | 4,411 | |
| Local Emerging Markets Debt | | Goldman Sachs Financial Square Government Fund — Institutional Shares | | | 6,602,954 | | | | 166,539,155 | | | | (159,272,965 | ) | | | — | | | | 13,869,144 | | | | 13,869,144 | | | | 61,826 | |
| U.S. Mortgages | | Goldman Sachs Financial Square Government Fund — Institutional Shares | | | 72,983,478 | | | | 245,900,129 | | | | (195,527,468 | ) | | | — | | | | 123,356,139 | | | | 123,356,139 | | | | 339,060 | |
173
GOLDMAN SACHS SINGLE SECTOR FIXED INCOME FUNDS
Notes to Financial Statements (continued)
September 30, 2017 (Unaudited)
|
| 6. PORTFOLIO SECURITIES TRANSACTIONS |
The cost of purchases and proceeds from sales and maturities of long-term securities for the six months ended September 30, 2017, were:
| | | | | | | | | | | | | | | | | | |
| Fund | | | | Purchases of
U.S. Government and
Agency Obligations | | | Purchases (Excluding
U.S. Government and
Agency Obligations) | | | Sales and
Maturities of
U.S. Government and
Agency Obligations | | | Sales and
Maturities (Excluding
U.S. Government and
Agency Obligations) | |
Dynamic Emerging Markets Debt | | | | $ | 2,670,059 | | | $ | 9,724,656 | | | $ | 2,670,193 | | | $ | 7,009,834 | |
Emerging Markets Debt | | | | | 256,599,169 | | | | 916,452,883 | | | | 273,205,767 | | | | 567,371,349 | |
High Yield | | | | | — | | | | 1,155,935,892 | | | | — | | | | 1,641,351,953 | |
High Yield Floating Rate | | | | | — | | | | 1,021,396,503 | | | | — | | | | 548,499,527 | |
Investment Grade Credit | | | | | 11,258,219 | | | | 124,286,516 | | | | 16,273,539 | | | | 142,844,570 | |
Local Emerging Markets Debt | | | | | 21,915,949 | | | | 110,577,106 | | | | 21,921,858 | | | | 171,793,676 | |
U.S. Mortgages | | | | | 3,707,635,898 | | | | 8,300,000 | | | | 3,688,340,972 | | | | 19,159,610 | |
The table below summarizes the reverse repurchase agreement activity for the period ended September 30, 2017:
| | | | | | | | | | | | | | |
| Fund | | | | Average amount of
borrowings | | | Weighted average
interest rate
(Paid) Received | | | Number of days
outstanding during
the period | |
Emerging Markets Debt | | | | $ | 6,826,881 | | | | 0.227 | % | | | 183 | |
High Yield | | | | | 60,728,352 | | | | 0.638 | % | | | 183 | |
High Yield Floating Rate | | | | | 8,786,267 | | | | 2.315 | % | | | 122 | |
The following table sets forth the Emerging Markets Debt, High Yield and High Yield Floating Rate Funds’ different types of investments pledged as collateral and the remaining contractual maturities of the reverse repurchase agreements as of September 30, 2017:
| | | | | | | | | | | | | | | | | | | | |
| Emerging Markets Debt | |
| | | Remaining Contractual Maturity of the Agreements
As of September 30, 2017 | |
| | | Overnight and
Continuous | | | < 30 days | | | Between
30 & 90 days | | | > 90 days | | | Total | |
| Reverse Repurchase Agreements | | | | | | | | | | | | | | | | | | | | |
Sovereign Debt Obligations | | $ | — | | | $ | — | | | $ | — | | | $ | 3,240,000 | | | $ | 3,240,000 | |
| Total Borrowings | | $ | — | | | $ | — | | | $ | — | | | $ | 3,240,000 | | | $ | 3,240,000 | |
Gross amount of recognized liabilities for reverse repurchase agreements | | | | | | | | | | | | | | | | | | $ | 3,240,000 | |
174
GOLDMAN SACHS SINGLE SECTOR FIXED INCOME FUNDS
|
| 6. PORTFOLIO SECURITIES TRANSACTIONS (continued) |
| | | | | | | | | | | | | | | | | | | | |
|
| High Yield | |
| | | Remaining Contractual Maturity of the Agreements
As of September 30, 2017 | |
| | | Overnight and
Continuous | | | < 30 days | | | Between
30 & 90 days | | | > 90 days | | | Total | |
| Reverse Repurchase Agreements | | | | | | | | | | | | | | | | | | | | |
Corporate Obligations | | $ | — | | | $ | — | | | $ | — | | | $ | 76,401,960 | | | $ | 76,401,960 | |
| Total Borrowings | | $ | — | | | $ | — | | | $ | — | | | $ | 76,401,960 | | | $ | 76,401,960 | |
Gross amount of recognized liabilities for reverse repurchase agreements | | | | | | | | | | | | | | | | | | $ | 76,401,960 | |
|
| High Yield Floating Rate | |
| | | Remaining Contractual Maturity of the Agreements
As of September 30, 2017 | |
| | | Overnight and
Continuous | | | < 30 days | | | Between
30 & 90 days | | | > 90 days | | | Total | |
| Reverse Repurchase Agreements | | | | | | | | | | | | | | | | | | | | |
Corporate Obligations | | $ | — | | | $ | — | | | $ | — | | | $ | 6,447,663 | | | $ | 6,447,663 | |
| Total Borrowings | | $ | — | | | $ | — | | | $ | — | | | $ | 6,447,663 | | | $ | 6,447,663 | |
Gross amount of recognized liabilities for reverse repurchase agreements | | | | | | | | | | | | | | | | | | $ | 6,447,663 | |
As of the Funds’ most recent fiscal year end, March 31, 2017, the Funds’ capital loss carryforwards and certain timing differences, on a tax basis were as follows:
| | | | | | | | | | | | | | | | | | | | | | | | | | | | |
| | | Dynamic Emerging Markets Debt | | | Emerging Markets Debt | | | High Yield | | | High Yield Floating Rate | | | Investment Grade Credit | | | Local Emerging Markets Debt | | | U.S. Mortgages | |
Capital loss carryforwards: | | | | | | | | | | | | | | | | | | | | | | | | | | | | |
Perpetual Short-Term | | $ | — | | | $ | (8,366,346 | ) | | $ | (96,805,065 | ) | | $ | (31,451,966 | ) | | $ | (2,219,246 | ) | | $ | (99,873,395 | ) | | $ | (624,154 | ) |
Perpetual Long-Term | | | — | | | | (19,772,239 | ) | | | (249,534,619 | ) | | | (56,520,913 | ) | | | (2,558,184 | ) | | | (34,960,880 | ) | | | (860,066 | ) |
Total capital loss carryforwards | | $ | — | | | $ | (28,138,585 | ) | | $ | (346,339,684 | ) | | $ | (87,972,879 | ) | | $ | (4,777,430 | ) | | $ | (134,834,275 | ) | | $ | (1,484,220 | ) |
Timing differences (Qualified Late Year Loss Deferral/Post October Loss Deferral/Distribution Payable/Straddle Loss Deferral/Defaulted Bonds Tax Accrual) | | $ | (1,095,533 | ) | | $ | (16,317,296 | ) | | $ | (1,672,120 | ) | | $ | (6,928,513 | ) | | $ | (863,398 | ) | | $ | (52,455,817 | ) | | $ | (5,239,609 | ) |
175
GOLDMAN SACHS SINGLE SECTOR FIXED INCOME FUNDS
Notes to Financial Statements (continued)
September 30, 2017 (Unaudited)
|
| 7. TAX INFORMATION (continued) |
As of September 30, 2017, the Funds’ aggregate security unrealized gains and losses based on cost for U.S. federal income tax purposes were as follows:
| | | | | | | | | | | | | | | | | | | | | | | | | | | | |
| | | Dynamic Emerging Markets Debt | | | Emerging
Markets Debt | | | High Yield | | | High Yield
Floating Rate | | | Investment
Grade Credit | | | Local Emerging
Markets Debt | | | U.S. Mortgages | |
Tax Cost | | $ | 21,822,556 | | | $ | 2,173,006,462 | | | $ | 3,390,446,984 | | | $ | 4,386,965,813 | | | $ | 392,774,460 | | | $ | 272,347,512 | | | $ | 645,025,008 | |
Gross unrealized gain | | | 1,130,255 | | | | 93,159,425 | | | | 153,171,435 | | | | 35,721,298 | | | | 14,329,612 | | | | 11,065,461 | | | | 1,976,757 | |
Gross unrealized loss | | | (409,019 | ) | | | (45,182,984 | ) | | | (82,322,053 | ) | | | (125,341,351 | ) | | | (1,214,768 | ) | | | (16,919,970 | ) | | | (1,755,343 | ) |
Net unrealized gains (losses) | | $ | 721,236 | | | $ | 47,976,441 | | | $ | 70,849,382 | | | $ | (89,620,053 | ) | | $ | 13,114,844 | | | $ | (5,854,509 | ) | | $ | 221,414 | |
The difference between GAAP-basis and tax basis unrealized gains (losses) is attributable primarily to wash sales, net mark to market gains (losses) on regulated futures contracts and foreign currency contracts, differences to the tax treatment of inflation protected securities, swap transactions, material modification of debt securities, and foreign currency transactions.
GSAM has reviewed the Funds’ tax positions for all open tax years (the current and prior three years, as applicable) and has concluded that no provision for income tax is required in the Funds’ financial statements. Such open tax years remain subject to examination and adjustment by tax authorities.
The Funds’ risks include, but are not limited to, the following:
Derivatives Risk — The Funds’ use of derivatives may result in loss. Derivative instruments, which may pose risks in addition to and greater than those associated with investing directly in securities, currencies or other instruments, may be illiquid or less liquid, volatile, difficult to price and leveraged so that small changes in the value of the underlying instruments may produce disproportionate losses to the Funds. Derivatives are also subject to counterparty risk, which is the risk that the other party in the transaction will not fulfill its contractual obligation. The use of derivatives is a highly specialized activity that involves investment techniques and risks different from those associated with investments in more traditional securities and instruments. Losses from derivatives can also result from a lack of correlation between changes in the value of derivative instruments and the portfolio assets (if any) being hedged.
Foreign Custody Risk — If a Fund invests in foreign securities, the Fund may hold such securities and cash with foreign banks, agents, and securities depositories appointed by the Fund’s custodian (each a “Foreign Custodian”). Some foreign custodians may be recently organized or new to the foreign custody business. In some countries, Foreign Custodians may be subject to little or no regulatory oversight over, or independent evaluation of, their operations. Further, the laws of certain countries may place limitations on a Fund’s ability to recover its assets if a Foreign Custodian enters bankruptcy. Investments in emerging markets may be subject to even greater custody risks than investments in more developed markets. Custody services in emerging market countries are very often undeveloped and may be considerably less well regulated than in more developed countries, and thus may not afford the same level of investor protection as would apply in developed countries.
Foreign and Emerging Countries Risk — Investing in foreign markets may involve special risks and considerations not typically associated with investing in the United States. Foreign securities may be subject to risk of loss because of more or less foreign government regulation, less public information and less economic, political and social stability in the countries in which a Fund invests. The imposition of exchange controls (including repatriation restrictions), confiscations, trade restrictions (including tariffs) and other government restrictions by the United States or other governments, or from problems in share registration, settlement or custody, may also result in losses. Foreign risk also involves the risk of negative foreign currency rate fluctuations, which may cause the value of securities denominated in such foreign currency (or other instruments through which a Fund has exposure to foreign currencies) to decline in value. Currency exchange rates may fluctuate significantly over short periods of time. To the extent that a Fund also invests in securities of issuers located in emerging markets, these risks may be more pronounced.
176
GOLDMAN SACHS SINGLE SECTOR FIXED INCOME FUNDS
|
| 8. OTHER RISKS (continued) |
Geographic Risk — If a Fund focuses its investments in securities of issuers located in a particular country or geographic region, the Fund may be subjected, to a greater extent than if its investments were less focused, to the risks of volatile economic cycles and/or conditions and developments that may be particular to that country or region, such as: adverse securities markets; adverse exchange rates; adverse social, political, regulatory, economic, business, environmental or other developments; or natural disasters.
Interest Rate Risk — When interest rates increase, fixed income securities or instruments held by the Funds will generally decline in value. Long-term fixed income securities or instruments will normally have more price volatility because of this risk than short-term fixed income securities or instruments. The risks associated with increasing rates are heightened given that interest rates are near historic lows, but may be expected to increase in the future with unpredictable effects on the markets and the Funds’ investments. Fluctuations in interest rates may also affect the liquidity of fixed income securities and instruments held by the Funds.
Investments in Other Investment Companies Risk — As a shareholder of another investment company, including an exchange-traded fund (“ETF”), a Fund will indirectly bear its proportionate share of any net management fees and other expenses paid by such other investment companies, in addition to the fees and expenses regularly borne by the Fund. ETFs are subject to risks that do not apply to conventional mutual funds, including but not limited to the following: (i) the market price of the ETF’s shares may trade at a premium or a discount to their NAV; and (ii) an active trading market for an ETF’s shares may not develop or be maintained.
Large Shareholder Transactions Risk — A Fund may experience adverse effects when certain large shareholders, such as other funds, institutional investors (including those trading by use of non-discretionary mathematical formulas), financial intermediaries (who may make investment decisions on behalf of underlying clients and/or include a Fund in their investment model), individuals, accounts and Goldman Sachs affiliates, purchase or redeem large amounts of shares of a Fund. Such large shareholder redemptions may cause a Fund to sell portfolio securities at times when it would not otherwise do so, which may negatively impact a Fund’s NAV and liquidity. These transactions may also accelerate the realization of taxable income to shareholders if such sales of investments resulted in gains, and may also increase transaction costs. In addition, a large redemption could result in a Fund’s current expenses being allocated over a smaller asset base, leading to an increase in the Fund’s expense ratio. Similarly, large Fund share purchases may adversely affect a Fund’s performance to the extent that the Fund is delayed in investing new cash and is required to maintain a larger cash position than it ordinarily would.
Leverage Risk — Leverage creates exposure to potential gains and losses in excess of the initial amount invested. Borrowing and the use of derivatives may result in leverage and may make a Fund more volatile. When a Fund uses leverage, the sum of that Fund’s investment exposure may significantly exceed the amount of assets invested in the Fund, although these exposures may vary over time. Relatively small market movements may result in large changes in the value of a leveraged investment. A Fund will identify liquid assets on its books or otherwise cover transactions that may give rise to such risk, to the extent required by applicable law. The use of leverage may cause a Fund to liquidate portfolio positions to satisfy its obligations or to meet segregation requirements when it may not be advantageous to do so. The use of leverage by a Fund can substantially increase the adverse impact to which the Fund’s investment portfolio may be subject.
Liquidity Risk — A Fund may make investments that are illiquid or that may become less liquid in response to market developments or adverse investor perceptions. Illiquid investments may be more difficult to value. Liquidity risk may also refer to the risk that a Fund will not be able to pay redemption proceeds within the allowable time period because of unusual market conditions, an unusually high volume of redemption requests, or other reasons. To meet redemption requests, a Fund may be forced to sell investments at an unfavorable time and/or under unfavorable conditions. Liquidity risk may be the result of, among other things, the reduced number and capacity of traditional market participants to make a market in fixed income securities or the lack of an active market. The potential for liquidity risk may be magnified by a rising interest rate environment or other circumstances where investor redemptions from fixed income mutual funds may be higher than normal, potentially causing increased supply in the market due to selling activity.
Loan-Related Investments Risk — In addition to risks generally associated with debt investments, loan-related investments such as loan participations and assignments are subject to other risks. Although a loan obligation may be fully collateralized at the time of acquisition, the collateral may decline in value, be relatively illiquid, or lose all or substantially all of its value subsequent to
177
GOLDMAN SACHS SINGLE SECTOR FIXED INCOME FUNDS
Notes to Financial Statements (continued)
September 30, 2017 (Unaudited)
|
| 8. OTHER RISKS (continued) |
investment. Many loan investments are subject to legal or contractual restrictions on resale and may be relatively illiquid and difficult to value. There is less readily available, reliable information about most loan investments than is the case for many other types of securities. Substantial increases in interest rates may cause an increase in loan obligation defaults. With respect to loan participations, the Fund may not always have direct recourse against a borrower if the borrower fails to pay scheduled principal and/or interest; may be subject to greater delays, expenses and risks than if the Fund had purchased a direct obligation of the borrower; and may be regarded as the creditor of the agent lender (rather than the borrower), subjecting the Fund to the creditworthiness of that lender as well. Investors in loans, such as the Fund, may not be entitled to rely on the anti-fraud protections of the federal securities laws, although they may be entitled to certain contractual remedies. The market for loan obligations may be subject to irregular trading activity, wide bid/ask spreads and extended trade settlement periods. Because transactions in many loans are subject to extended trade settlement periods, the Fund may not receive the proceeds from the sale of a loan for a period after the sale. As a result, sale proceeds related to the sale of loans may not be available to make additional investments or to meet a Fund’s redemption obligations for a period after the sale of the loans, and, as a result, the Fund may have to sell other investments or engage in borrowing transactions, such as borrowing from its credit facility, if necessary to raise cash to meet its obligations.
Senior Loans hold the most senior position in the capital structure of a business entity, and are typically secured with specific collateral, but are nevertheless usually rated below investment grade. Because Second Lien Loans are subordinated or unsecured and thus lower in priority of payment to Senior Loans, they are subject to the additional risk that the cash flow of the borrower and property securing the loan or debt, if any, may be insufficient to meet scheduled payments after giving effect to the senior secured obligations of the borrower. Second Lien Loans generally have greater price volatility than Senior Loans and may be less liquid.
Market and Credit Risks — In the normal course of business, the Funds trade financial instruments and enter into financial transactions where risk of potential loss exists due to changes in the market (market risk). Additionally, the Funds may also be exposed to credit risk in the event that an issuer or guarantor fails to perform or that an institution or entity with which the Funds have unsettled or open transactions defaults.
Non-Diversification Risk — Each of the Dynamic Emerging Markets Debt Fund, Emerging Markets Debt Fund and Local Emerging Markets Debt Fund are non-diversified, meaning that they are permitted to invest a larger percentage of their assets in fewer issuers than diversified mutual funds. Thus, a Fund may be more susceptible to adverse developments affecting any single issuer held in its portfolio, and may be more susceptible to greater losses because of these developments.
Sector Risk — To the extent a Fund focuses its investments in securities of issuers in one or more sectors (such as the financial services or telecommunications sectors), the Fund will be subject, to a greater extent than if its investments were diversified across different sectors, to the risks of volatile economic cycles and/or conditions and developments.
Under the Trust’s organizational documents, its Trustees, officers, employees and agents are indemnified, to the extent permitted by the Act and state law, against certain liabilities that may arise out of performance of their duties to the Funds. Additionally, in the course of business, the Funds enter into contracts that contain a variety of indemnification clauses. The Funds’s maximum exposure under these arrangements is unknown, as this would involve future claims that may be made against the Funds that have not yet occurred. However, GSAM believes the risk of loss under these arrangements to be remote.
At a Board Meeting held on October 12th, the Board of Trustees approved a name change and repositioning of the Goldman Sachs Dynamic Emerging Markets Debt Fund. Effective December 26, 2017, the Fund will be renamed the Goldman Sachs Total Emerging Markets Income Fund and will change investment objectives. For additional information please refer to the prospectus supplement dated October 27, 2017.
Subsequent events after the Statements of Assets and Liabilities date have been evaluated and GSAM has concluded that there is no impact requiring adjustment or disclosure in the financial statements.
178
GOLDMAN SACHS SINGLE SECTOR FIXED INCOME FUNDS
|
| 12. SUMMARY OF SHARE TRANSACTIONS |
Share activity is as follows
| | | | | | | | | | | | | | | | |
| | | Dynamic Emerging Markets Debt Fund | |
| | | | |
| | | For the Six Months Ended
September 30, 2017
(Unaudited) | | | For the Fiscal Year Ended
March 31, 2017 | |
| | | | |
| | | Shares | | | Dollars | | | Shares | | | Dollars | |
| | | | |
| Class A Shares | | | | | | | | | | | | | | | | |
Shares sold | | | 54,593 | | | $ | 474,431 | | | | 26,020 | | | $ | 217,141 | |
Reinvestment of distributions | | | 1,119 | | | | 9,746 | | | | 1,491 | | | | 12,411 | |
Shares redeemed | | | (3,216 | ) | | | (28,094 | ) | | | (55,889 | ) | | | (463,642 | ) |
| | | | 52,496 | | | | 456,083 | | | | (28,378 | ) | | | (234,090 | ) |
| Class C Shares | | | | | | | | | | | | | | | | |
Shares sold | | | 570 | | | | 5,000 | | | | 13,404 | | | | 108,301 | |
Reinvestment of distributions | | | 321 | | | | 2,796 | | | | 303 | | | | 2,539 | |
Shares redeemed | | | (2,064 | ) | | | (17,904 | ) | | | (751 | ) | | | (6,159 | ) |
| | | | (1,173 | ) | | | (10,108 | ) | | | 12,956 | | | | 104,681 | |
| Institutional Shares | | | | | | | | | | | | | | | | |
Shares sold | | | 288,719 | | | | 2,506,236 | | | | 1,219,685 | | | | 10,260,246 | |
Reinvestment of distributions | | | 51,756 | | | | 450,313 | | | | 90,751 | | | | 760,594 | |
Shares redeemed | | | (317,028 | ) | | | (2,731,899 | ) | | | (3,506,501 | ) | | | (29,418,694 | ) |
| | | | 23,447 | | | | 224,650 | | | | (2,196,065 | ) | | | (18,397,854 | ) |
| Investor Shares | | | | | | | | | | | | | | | | |
Shares sold | | | 1,985 | | | | 17,036 | | | | 21,085 | | | | 177,209 | |
Reinvestment of distributions | | | 539 | | | | 4,693 | | | | 525 | | | | 4,374 | |
Shares redeemed | | | (548 | ) | | | (4,698 | ) | | | (4,160 | ) | | | (34,002 | ) |
| | | | 1,976 | | | | 17,031 | | | | 17,450 | | | | 147,581 | |
| Class R Shares | | | | | | | | | | | | | | | | |
Shares sold | | | 123 | | | | 1,067 | | | | — | | | | — | |
Reinvestment of distributions | | | 64 | | | | 562 | | | | 128 | | | | 1,070 | |
| | | | 187 | | | | 1,629 | | | | 128 | | | | 1,070 | |
NET INCREASE (DECREASE) | | | 76,933 | | | $ | 689,285 | | | | (2,193,909 | ) | | $ | (18,378,612 | ) |
179
GOLDMAN SACHS SINGLE SECTOR FIXED INCOME FUNDS
Notes to Financial Statements (continued)
September 30, 2017 (Unaudited)
|
| 12. SUMMARY OF SHARE TRANSACTIONS (continued) |
Share activity is as follows:
| | | | | | | | | | | | | | | | |
| | | Emerging Markets Debt Fund | |
| | | | |
| | | For the Six Months Ended
September 30, 2017
(Unaudited) | | | For the Fiscal Year Ended
March 31, 2017 | |
| | | | |
| | | Shares | | | Dollars | | | Shares | | | Dollars | |
| | | | |
| Class A Shares | | | | | | | | | | | | | | | | |
Shares sold | | | 2,709,400 | | | $ | 35,017,858 | | | | 7,846,256 | | | $ | 99,050,373 | |
Reinvestment of distributions | | | 173,871 | | | | 2,251,647 | | | | 459,953 | | | | 5,820,133 | |
Shares redeemed | | | (3,157,716 | ) | | | (40,708,459 | ) | | | (9,138,500 | ) | | | (114,848,907 | ) |
| | | | (274,445 | ) | | | (3,438,954 | ) | | | (832,291 | ) | | | (9,978,401 | ) |
| Class C Shares | | | | | | | | | | | | | | | | |
Shares sold | | | 363,712 | | | | 4,687,246 | | | | 834,776 | | | | 10,637,203 | |
Reinvestment of distributions | | | 47,970 | | | | 620,921 | | | | 80,259 | | | | 1,015,032 | |
Shares redeemed | | | (357,113 | ) | | | (4,613,212 | ) | | | (610,940 | ) | | | (7,755,798 | ) |
| | | | 54,569 | | | | 694,955 | | | | 304,095 | | | | 3,896,437 | |
| Institutional Shares | | | | | | | | | | | | | | | | |
Shares sold | | | 40,438,702 | | | | 523,163,377 | | | | 94,600,959 | | | | 1,205,005,663 | |
Reinvestment of distributions | | | 2,988,476 | | | | 38,754,631 | | | | 4,069,507 | | | | 51,594,642 | |
Shares redeemed | | | (18,918,667 | ) | | | (245,122,786 | ) | | | (41,707,693 | ) | | | (524,645,193 | ) |
| | | | 24,508,511 | | | | 316,795,222 | | | | 56,962,773 | | | | 731,955,112 | |
| Investor Shares | | | | | | | | | | | | | | | | |
Shares sold | | | 4,547,140 | | | | 58,932,480 | | | | 6,677,308 | | | | 84,538,542 | |
Reinvestment of distributions | | | 211,758 | | | | 2,746,575 | | | | 141,929 | | | | 1,797,732 | |
Shares redeemed | | | (1,049,690 | ) | | | (13,589,997 | ) | | | (1,484,524 | ) | | | (18,717,551 | ) |
| | | | 3,709,208 | | | | 48,089,058 | | | | 5,334,713 | | | | 67,618,723 | |
| Class R6 Shares | | | | | | | | | | | | | | | | |
Shares sold | | | 820,265 | | | | 10,692,373 | | | | 2,242,161 | | | | 27,736,891 | |
Reinvestment of distributions | | | 60,574 | | | | 785,375 | | | | 34,207 | | | | 431,205 | |
Shares redeemed | | | (129,238 | ) | | | (1,677,368 | ) | | | (69,360 | ) | | | (878,073 | ) |
| | | | 751,601 | | | | 9,800,380 | | | | 2,207,008 | | | | 27,290,023 | |
NET INCREASE | | | 28,749,444 | | | $ | 371,940,661 | | | | 63,976,298 | | | $ | 820,781,894 | |
180
GOLDMAN SACHS SINGLE SECTOR FIXED INCOME FUNDS
|
| 12. SUMMARY OF SHARE TRANSACTIONS (continued) |
Share activity is as follows:
| | | | | | | | | | | | | | | | |
| | | High Yield Fund | |
| | | | |
| | | For the Six Months Ended
September 30, 2017
(Unaudited) | | | For the Fiscal Year Ended
March 31, 2017 | |
| | | | |
| | | Shares | | | Dollars | | | Shares | | | Dollars | |
| | | | |
| Class A Shares | | | | | | | | | | | | | | | | |
Shares sold | | | 1,610,790 | | | $ | 10,614,324 | | | | 19,592,458 | | | $ | 126,612,863 | |
Reinvestment of distributions | | | 810,344 | | | | 5,344,318 | | | | 2,625,392 | | | | 16,790,902 | |
Shares redeemed | | | (6,762,656 | ) | | | (44,588,556 | ) | | | (43,363,372 | ) | | | (279,308,089 | ) |
| | | | (4,341,522 | ) | | | (28,629,914 | ) | | | (21,145,522 | ) | | | (135,904,324 | ) |
| Class C Shares | | | | | | | | | | | | | | | | |
Shares sold | | | 200,461 | | | | 1,320,830 | | | | 585,248 | | | | 3,725,250 | |
Reinvestment of distributions | | | 122,036 | | | | 805,030 | | | | 301,739 | | | | 1,931,627 | |
Shares redeemed | | | (1,318,260 | ) | | | (8,695,462 | ) | | | (2,450,930 | ) | | | (15,700,076 | ) |
| | | | (995,763 | ) | | | (6,569,602 | ) | | | (1,563,943 | ) | | | (10,043,199 | ) |
| Institutional Shares | | | | | | | | | | | | | | | | |
Shares sold | | | 35,909,529 | | | | 237,129,550 | | | | 154,525,466 | | | | 995,265,563 | |
Reinvestment of distributions | | | 12,039,034 | | | | 79,556,692 | | | | 26,691,708 | | | | 171,283,408 | |
Shares redeemed | | | (89,623,315 | ) | | | (590,883,332 | ) | | | (196,884,291 | ) | | | (1,252,351,895 | ) |
| | | | (41,674,752 | ) | | | (274,197,090 | ) | | | (15,667,117 | ) | | | (85,802,924 | ) |
| Service Shares | | | | | | | | | | | | | | | | |
Shares sold | | | 119,957 | | | | 788,349 | | | | 304,748 | | | | 1,944,152 | |
Reinvestment of distributions | | | 42,567 | | | | 280,303 | | | | 88,607 | | | | 566,754 | |
Shares redeemed | | | (151,950 | ) | | | (998,823 | ) | | | (995,699 | ) | | | (6,339,304 | ) |
| | | | 10,574 | | | | 69,829 | | | | (602,344 | ) | | | (3,828,398 | ) |
| Investor Shares | | | | | | | | | | | | | | | | |
Shares sold | | | 427,183 | | | | 2,816,613 | | | | 4,267,504 | | | | 27,990,353 | |
Reinvestment of distributions | | | 130,764 | | | | 863,696 | | | | 113,613 | | | | 733,724 | |
Shares redeemed | | | (766,509 | ) | | | (5,053,717 | ) | | | (833,891 | ) | | | (5,374,048 | ) |
| | | | (208,562 | ) | | | (1,373,408 | ) | | | 3,547,226 | | | | 23,350,029 | |
| Class R Shares | | | | | | | | | | | | | | | | |
Shares sold | | | 185,891 | | | | 1,223,071 | | | | 357,387 | | | | 2,279,552 | |
Reinvestment of distributions | | | 52,455 | | | | 345,499 | | | | 116,933 | | | | 747,506 | |
Shares redeemed | | | (248,562 | ) | | | (1,634,434 | ) | | | (758,033 | ) | | | (4,820,355 | ) |
| | | | (10,216 | ) | | | (65,864 | ) | | | (283,713 | ) | | | (1,793,297 | ) |
| Class R6 Shares | | | | | | | | | | | | | | | | |
Shares sold | | | 401,767 | | | | 2,773,150 | | | | 8,023,489 | | | | 52,075,156 | |
Reinvestment of distributions | | | 296,343 | | | | 1,963,909 | | | | 1,519,576 | | | | 9,770,132 | |
Shares redeemed | | | (31,311,590 | ) | | | (208,147,625 | ) | | | (5,785,080 | ) | | | (37,092,290 | ) |
| | | | (30,613,480 | ) | | | (203,410,566 | ) | | | 3,757,985 | | | | 24,752,998 | |
NET DECREASE | | | (77,833,721 | ) | | $ | (514,176,615 | ) | | | (31,957,428 | ) | | $ | (189,269,115 | ) |
181
GOLDMAN SACHS SINGLE SECTOR FIXED INCOME FUNDS
Notes to Financial Statements (continued)
September 30, 2017 (Unaudited)
|
| 12. SUMMARY OF SHARE TRANSACTIONS (continued) |
Share activity is as follows:
| | | | | | | | | | | | | | | | |
| | | High Yield Floating Rate Fund | |
| | | | |
| | | For the Six Months Ended
September 30, 2017
(Unaudited) | | | For the Fiscal Year Ended
March 31, 2017 | |
| | | | |
| | | Shares | | | Dollars | | | Shares | | | Dollars | |
| | | | |
| Class A Shares | | | | | | | | | | | | | | | | |
Shares sold | | | 24,682 | | | $ | 240,100 | | | | 387,742 | | | $ | 3,746,360 | |
Reinvestment of distributions | | | 9,452 | | | | 91,859 | | | | 27,737 | | | | 268,757 | |
Shares redeemed | | | (287,779 | ) | | | (2,799,058 | ) | | | (397,228 | ) | | | (3,860,254 | ) |
| | | | (253,645 | ) | | | (2,467,099 | ) | | | 18,251 | | | | 154,863 | |
| Class C Shares | | | | | | | | | | | | | | | | |
Shares sold | | | 24,674 | | | | 239,994 | | | | 107,350 | | | | 1,043,553 | |
Reinvestment of distributions | | | 4,029 | | | | 39,145 | | | | 6,629 | | | | 64,270 | |
Shares redeemed | | | (44,658 | ) | | | (434,063 | ) | | | (31,505 | ) | | | (305,452 | ) |
| | | | (15,955 | ) | | | (154,924 | ) | | | 82,474 | | | | 802,371 | |
| Institutional Shares | | | | | | | | | | | | | | | | |
Shares sold | | | 63,338,269 | | | | 616,465,417 | | | | 133,635,635 | | | | 1,297,544,491 | |
Reinvestment of distributions | | | 8,735,079 | | | | 84,960,198 | | | | 14,394,178 | | | | 139,616,112 | |
Shares redeemed | | | (36,989,850 | ) | | | (359,802,356 | ) | | | (87,415,863 | ) | | | (844,999,783 | ) |
| | | | 35,083,498 | | | | 341,623,259 | | | | 60,613,950 | | | | 592,160,820 | |
| Investor Shares | | | | | | | | | | | | | | | | |
Shares sold | | | 103,665 | | | | 1,006,700 | | | | 664,704 | | | | 6,459,064 | |
Reinvestment of distributions | | | 8,147 | | | | 79,253 | | | | 7,127 | | | | 69,235 | |
Shares redeemed | | | (180,438 | ) | | | (1,752,928 | ) | | | (378,620 | ) | | | (3,680,874 | ) |
| | | | (68,626 | ) | | | (666,975 | ) | | | 293,211 | | | | 2,847,425 | |
| Class R Shares | | | | | | | | | | | | | | | | |
Reinvestment of distributions | | | 21 | | | | 212 | | | | 45 | | | | 417 | |
| | | | 21 | | | | 212 | | | | 45 | | | | 417 | |
NET INCREASE | | | 34,745,293 | | | $ | 338,334,473 | | | | 61,007,931 | | | $ | 595,965,896 | |
182
GOLDMAN SACHS SINGLE SECTOR FIXED INCOME FUNDS
|
| 12. SUMMARY OF SHARE TRANSACTIONS (continued) |
Share activity is as follows:
| | | | | | | | | | | | | | | | |
| | | Investment Grade Credit Fund | |
| | | | |
| | | For the Six Months Ended
September 30, 2017
(Unaudited) | | | For the Fiscal Year Ended March 31, 2017 | |
| | | | |
| | | Shares | | | Dollars | | | Shares | | | Dollars | |
| | | | |
| Class A Shares | | | | | | | | | | | | | | | | |
Shares sold | | | 618,377 | | | $ | 5,708,483 | | | | 1,683,527 | | | $ | 15,296,601 | |
Reinvestment of distributions | | | 38,555 | | | | 355,174 | | | | 94,744 | | | | 869,976 | |
Shares redeemed | | | (3,046,468 | ) | | | (28,156,078 | ) | | | (1,277,225 | ) | | | (11,636,432 | ) |
| | | | (2,389,536 | ) | | | (22,092,421 | ) | | | 501,046 | | | | 4,530,145 | |
| Institutional Shares | | | | | | | | | | | | | | | | |
Shares sold | | | 4,289,877 | | | | 39,655,366 | | | | 3,982,845 | | | | 36,548,888 | |
Reinvestment of distributions | | | 261,720 | | | | 2,416,879 | | | | 510,257 | | | | 4,688,942 | |
Shares redeemed | | | (1,933,749 | ) | | | (17,767,746 | ) | | | (6,000,626 | ) | | | (55,253,448 | ) |
| | | | 2,617,848 | | | | 24,304,499 | | | | (1,507,524 | ) | | | (14,015,618 | ) |
| Investor Shares | | | | | | | | | | | | | | | | |
Shares sold | | | 71,309 | | | | 660,574 | | | | 377,992 | | | | 3,437,534 | |
Reinvestment of distributions | | | 6,877 | | | | 63,504 | | | | 6,402 | | | | 58,731 | |
Shares redeemed | | | (63,505 | ) | | | (584,998 | ) | | | (55,260 | ) | | | (502,134 | ) |
| | | | 14,681 | | | | 139,080 | | | | 329,134 | | | | 2,994,131 | |
| Separate Account Institutional Shares | | | | | | | | | | | | | | | | |
Shares sold | | | 1,459,322 | | | | 13,407,556 | | | | 4,628,455 | | | | 42,213,095 | |
Reinvestment of distributions | | | 376,157 | | | | 3,472,403 | | | | 757,873 | | | | 6,964,260 | |
Shares redeemed | | | (4,948,843 | ) | | | (45,579,953 | ) | | | (4,201,057 | ) | | | (38,614,253 | ) |
| | | | (3,113,364 | ) | | | (28,699,994 | ) | | | 1,185,271 | | | | 10,563,102 | |
| Class R6 Shares | | | | | | | | | | | | | | | | |
Shares sold | | | 489 | | | | 4,534 | | | | 143 | | | | 1,320 | |
Reinvestment of distributions | | | 22 | | | | 203 | | | | 40 | | | | 364 | |
| | | | 511 | | | | 4,737 | | | | 183 | | | | 1,684 | |
NET INCREASE (DECREASE) | | | (2,869,860 | ) | | $ | (26,344,099 | ) | | | 508,110 | | | $ | 4,073,444 | |
183
GOLDMAN SACHS SINGLE SECTOR FIXED INCOME FUNDS
Notes to Financial Statements (continued)
September 30, 2017 (Unaudited)
|
| 12. SUMMARY OF SHARE TRANSACTIONS (continued) |
Share activity is as follows:
| | | | | | | | | | | | | | | | |
| | | Local Emerging Markets Debt Fund | |
| | | | |
| | | For the Six Months Ended
September 30, 2017
(Unaudited) | | | For the Fiscal Year Ended
March 31, 2017 | |
| | | | |
| | | Shares | | | Dollars | | | Shares | | | Dollars | |
| | | | |
| Class A Shares | | | | | | | | | | | | | | | | |
Shares sold | | | 136,399 | | | $ | 882,012 | | | | 4,173,203 | | | $ | 26,246,105 | |
Reinvestment of distributions | | | 37,015 | | | | 242,509 | | | | 930,467 | | | | 5,874,622 | |
Shares redeemed | | | (910,410 | ) | | | (5,907,218 | ) | | | (25,454,242 | ) | | | (158,705,973 | ) |
| | | | (736,996 | ) | | | (4,782,697 | ) | | | (20,350,572 | ) | | | (126,585,246 | ) |
| Class C Shares | | | | | | | | | | | | | | | | |
Shares sold | | | 41,871 | | | | 274,283 | | | | 129,085 | | | | 826,599 | |
Reinvestment of distributions | | | 22,263 | | | | 146,117 | | | | 44,439 | | | | 280,743 | |
Shares redeemed | | | (114,121 | ) | | | (745,860 | ) | | | (233,455 | ) | | | (1,459,222 | ) |
| | | | (49,987 | ) | | | (325,460 | ) | | | (59,931 | ) | | | (351,880 | ) |
| Institutional Shares | | | | | | | | | | | | | | | | |
Shares sold | | | 4,840,917 | | | | 31,719,243 | | | | 21,691,572 | | | | 137,289,001 | |
Reinvestment of distributions | | | 1,256,276 | | | | 8,224,184 | | | | 3,374,511 | | | | 21,301,355 | |
Shares redeemed | | | (18,528,600 | ) | | | (118,814,389 | ) | | | (36,296,481 | ) | | | (225,306,563 | ) |
| | | | (12,431,407 | ) | | | (78,870,962 | ) | | | (11,230,398 | ) | | | (66,716,207 | ) |
| Investor Shares | | | | | | | | | | | | | | | | |
Shares sold | | | 314,485 | | | | 2,052,212 | | | | 2,072,286 | | | | 12,985,981 | |
Reinvestment of distributions | | | 27,622 | | | | 181,078 | | | | 100,468 | | | | 631,328 | |
Shares redeemed | | | (179,399 | ) | | | (1,167,802 | ) | | | (2,844,694 | ) | | | (17,714,143 | ) |
| | | | 162,708 | | | | 1,065,488 | | | | (671,940 | ) | | | (4,096,834 | ) |
NET DECREASE | | | (13,055,682 | ) | | $ | (82,913,631 | ) | | | (32,312,841 | ) | | $ | (197,750,167 | ) |
184
GOLDMAN SACHS SINGLE SECTOR FIXED INCOME FUNDS
|
| 12. SUMMARY OF SHARE TRANSACTIONS (continued) |
Share activity is as follows:
| | | | | | | | | | | | | | | | |
| | | U.S. Mortgages Fund | |
| | | | |
| | | For the Six Months Ended
September 30, 2017
(Unaudited) | | | For the Fiscal Year Ended
March 31, 2017 | |
| | | | |
| | | Shares | | | Dollars | | | Shares | | | Dollars | |
| | | | |
| Class A Shares | | | | | | | | | | | | | | | | |
Shares sold | | | 1,342,388 | | | $ | 14,076,863 | | | | 4,112,320 | | | $ | 43,843,373 | |
Reinvestment of distributions | | | 51,031 | | | | 534,965 | | | | 105,045 | | | | 1,113,290 | |
Shares redeemed | | | (1,173,095 | ) | | | (12,288,132 | ) | | | (3,108,178 | ) | | | (32,895,090 | ) |
| | | | 220,324 | | | | 2,323,696 | | | | 1,109,187 | | | | 12,061,573 | |
| Institutional Shares | | | | | | | | | | | | | | | | |
Shares sold | | | 877,127 | | | | 9,219,741 | | | | 3,109,654 | | | | 33,073,791 | |
Reinvestment of distributions | | | 75,849 | | | | 797,190 | | | | 142,513 | | | | 1,514,599 | |
Shares redeemed | | | (740,686 | ) | | | (7,784,336 | ) | | | (2,882,373 | ) | | | (30,654,642 | ) |
| | | | 212,290 | | | | 2,232,595 | | | | 369,794 | | | | 3,933,748 | |
| Investor Shares | | | | | | | | | | | | | | | | |
Shares sold | | | 3,631,710 | | | | 38,185,931 | | | | 14,150,134 | | | | 148,187,797 | |
Reinvestment of distributions | | | 164,097 | | | | 1,724,718 | | | | 63,316 | | | | 667,471 | |
Shares redeemed | | | (3,127,316 | ) | | | (32,853,707 | ) | | | (1,169,925 | ) | | | (12,292,656 | ) |
| | | | 668,491 | | | | 7,056,942 | | | | 13,043,525 | | | | 136,562,612 | |
| Separate Account Institutional Shares | | | | | | | | | | | | | | | | |
Shares sold | | | 1,465,019 | | | | 15,360,187 | | | | 4,129,317 | | | | 43,703,206 | |
Reinvestment of distributions | | | 249,062 | | | | 2,610,976 | | | | 446,179 | | | | 4,729,934 | |
Shares redeemed | | | (1,883,145 | ) | | | (19,766,149 | ) | | | (3,467,155 | ) | | | (36,585,579 | ) |
| | | | (169,064 | ) | | | (1,794,986 | ) | | | 1,108,341 | | | | 11,847,561 | |
Class R6 Shares | | | | | | | | | | | | | | | | |
Shares sold | | | 190,568 | | | | 2,001,718 | | | | 268,893 | | | | 2,815,809 | |
Reinvestment of distributions | | | 4,386 | | | | 46,099 | | | | 620 | | | | 6,504 | |
Shares redeemed | | | (66,006 | ) | | | (694,064 | ) | | | (21,724 | ) | | | (231,453 | ) |
| | | | 128,948 | | | | 1,353,753 | | | | 247,789 | | | | 2,590,860 | |
NET INCREASE | | | 1,060,989 | | | $ | 11,172,000 | | | | 15,878,636 | | | $ | 166,996,354 | |
185
GOLDMAN SACHS SINGLE SECTOR FIXED INCOME FUNDS
Fund Expenses — Six Month Period Ended September 30, 2017 (Unaudited)
As a shareholder of Class A, Class C, Institutional, Service, Separate Account Institutional, Investor, Class R and Class R6 Shares of a Fund, you incur two types of costs: (1) transaction costs, including sales charges on purchase payments (with respect to Class A Shares), contingent deferred sales charges on redemptions (with respect to Class C Shares), and (2) ongoing costs, including management fees; distribution and service (12b-1) fees (with respect to Class A, Class C and Class R Shares); and other Fund expenses. This Example is intended to help you understand your ongoing costs (in dollars) of investing in Class A, Class C, Institutional, Service, Separate Account Institutional, Investor, Class R or Class R6 Shares of the Funds and to compare these costs with the ongoing costs of investing in other mutual funds.
The Example is based on an investment of $1,000 invested at the beginning of the period and held for the entire period from April 1, 2017 through September 30, 2017, which represents a period of 183 out of 365 days.
Actual Expenses — The first line under each share class in the table below provides information about actual account values and actual expenses. You may use the information in this line, together with the amount you invested, to estimate the expenses that you paid over the period. Simply divide your account value by $1,000 (for example, an $8,600 account value divided by $1,000=8.6), then multiply the result by the number in the first line under the heading entitled “Expenses Paid” to estimate the expenses you paid on your account during this period.
Hypothetical Example for Comparison Purposes — The second line under each share class in the table below provides information about hypothetical account values and hypothetical expenses based on the Funds’ actual net expense ratios and an assumed rate of return of 5% per year before expenses, which is not the Funds’ actual return. The hypothetical account values and expenses may not be used to estimate the actual ending account balance or expenses you paid for the period. You may use this information to compare the ongoing costs of investing in the Funds and other funds. To do so, compare this 5% hypothetical example with the 5% hypothetical examples that appear in the shareholder reports of the other funds.
Please note that the expenses shown in the table are meant to highlight your ongoing costs only and do not reflect any transactional costs, such as sales charges, redemption fees, or exchange fees. Therefore, the second line of the table is useful in comparing ongoing costs only, and will not help you determine the relative total costs of owning different funds. In addition, if these transactional costs were included, your costs would have been higher.
| | | | | | | | | | | | | | | | | | | | | | | | | | | | | | | | | | | | | | | | | | | | | | | | |
| | | Dynamic Emerging Markets Debt Fund | | | Emerging Markets Debt Fund | | | High Yield Fund | | | High Yield Floating Rate Fund | |
| Share Class | | Beginning
Account
Value
4/1/17 | | | Ending
Account
Value
9/30/17 | | | Expenses
Paid for the
6 months ended
9/30/17* | | | Beginning
Account
Value
4/1/17 | | | Ending
Account
Value
9/30/17 | | | Expenses
Paid for the
6 months ended
9/30/17* | | | Beginning
Account
Value
4/1/17 | | | Ending
Account
Value
9/30/17 | | | Expenses
Paid for the
6 months ended
9/30/17* | | | Beginning
Account
Value
4/1/17 | | | Ending
Account
Value
9/30/17 | | | Expenses
Paid for the
6 months ended
9/30/17* | |
| Class A | | | | | | | | | | | | | | | | | | | | | | | | | | | | | | | | | | | | | | | | | | | | | | | | |
Actual | | $ | 1,000.00 | | | $ | 1,056.60 | | | $ | 6.29 | | | $ | 1,000.00 | | | $ | 1,046.50 | | | $ | 6.26 | | | $ | 1,000.00 | | | $ | 1,030.00 | | | $ | 5.34 | | | $ | 1,000.00 | | | $ | 1,014.90 | | | $ | 4.75 | |
Hypothetical 5% return | | | 1,000.00 | | | | 1,018.95 | + | | | 6.17 | | | | 1,000.00 | | | | 1,018.95 | + | | | 6.17 | | | | 1,000.00 | | | | 1,019.80 | + | | | 5.32 | | | | 1,000.00 | | | | 1,020.36 | + | | | 4.76 | |
| Class C | | | | | | | | | | | | | | | | | | | | | | | | | | | | | | | | | | | | | | | | | | | | | | | | |
Actual | | | 1,000.00 | | | | 1,053.80 | | | | 10.14 | | | | 1,000.00 | | | | 1,042.60 | | | | 10.04 | | | | 1,000.00 | | | | 1,026.30 | | | | 9.14 | | | | 1,000.00 | | | | 1,011.10 | | | | 8.52 | |
Hypothetical 5% return | | | 1,000.00 | | | | 1,015.19 | + | | | 9.95 | | | | 1,000.00 | | | | 1,015.24 | + | | | 9.90 | | | | 1,000.00 | | | | 1,016.04 | + | | | 9.10 | | | | 1,000.00 | | | | 1,016.59 | + | | | 8.54 | |
| Institutional | | | | | | | | | | | | | | | | | | | | | | | | | | | | | | | | | | | | | | | | | | | | | | | | |
Actual | | | 1,000.00 | | | | 1,059.50 | | | | 4.54 | | | | 1,000.00 | | | | 1,048.20 | | | | 4.47 | | | | 1,000.00 | | | | 1,031.90 | | | | 3.72 | | | | 1,000.00 | | | | 1,017.60 | | | | 3.03 | |
Hypothetical 5% return | | | 1,000.00 | | | | 1,020.66 | + | | | 4.46 | | | | 1,000.00 | | | | 1,020.71 | + | | | 4.41 | | | | 1,000.00 | | | | 1,021.41 | + | | | 3.70 | | | | 1,000.00 | | | | 1,022.06 | + | | | 3.04 | |
| Service | | | | | | | | | | | | | | | | | | | | | | | | | | | | | | | | | | | | | | | | | | | | | | | | |
Actual | | | N/A | | | | N/A | | | | N/A | | | | N/A | | | | N/A | | | | N/A | | | | 1,000.00 | | | | 1,029.30 | | | | 6.21 | | | | N/A | | | | N/A | | | | N/A | |
Hypothetical 5% return | | | N/A | | | | N/A | | | | N/A | | | | N/A | | | | N/A | | | | N/A | | | | 1,000.00 | | | | 1,018.95 | + | | | 6.17 | | | | N/A | | | | N/A | | | | N/A | |
| Investor | | | | | | | | | | | | | | | | | | | | | | | | | | | | | | | | | | | | | | | | | | | | | | | | |
Actual | | | 1,000.00 | | | | 1,059.10 | | | | 5.01 | | | | 1,000.00 | | | | 1,047.80 | | | | 4.93 | | | | 1,000.00 | | | | 1,031.40 | | | | 4.07 | | | | 1,000.00 | | | | 1,016.10 | | | | 3.44 | |
Hypothetical 5% return | | | 1,000.00 | | | | 1,020.20 | + | | | 4.91 | | | | 1,000.00 | | | | 1,020.25 | + | | | 4.86 | | | | 1,000.00 | | | | 1,021.06 | + | | | 4.05 | | | | 1,000.00 | | | | 1,021.66 | + | | | 3.45 | |
| Class R | | | | | | | | | | | | | | | | | | | | | | | | | | | | | | | | | | | | | | | | | | | | | | | | |
Actual | | | 1,000.00 | | | | 1,056.30 | | | | 7.58 | | | | N/A | | | | N/A | | | | N/A | | | | 1,000.00 | | | | 1,028.90 | | | | 6.61 | | | | 1,000.00 | | | | 1,013.70 | | | | 5.86 | |
Hypothetical 5% return | | | 1,000.00 | | | | 1,017.70 | + | | | 7.44 | | | | N/A | | | | N/A | | | | N/A | | | | 1,000.00 | | | | 1,018.55 | + | | | 6.58 | | | | 1,000.00 | | | | 1,019.25 | + | | | 5.87 | |
| Class R6 | | | | | | | | | | | | | | | | | | | | | | | | | | | | | | | | | | | | | | | | | | | | | | | | |
Actual | | | N/A | | | | N/A | | | | N/A | | | | 1,000.00 | | | | 1,048.30 | | | | 4.42 | | | | 1,000.00 | | | | 1,031.90 | | | | 3.57 | | | | N/A | | | | N/A | | | | N/A | |
Hypothetical 5% return | | | N/A | | | | N/A | | | | N/A | | | | 1,000.00 | | | | 1,020.76 | + | | | 4.36 | | | | 1,000.00 | | | | 1,021.56 | + | | | 3.55 | | | | N/A | | | | N/A | | | | N/A | |
186
GOLDMAN SACHS SINGLE SECTOR FIXED INCOME FUNDS
Fund Expenses — Six Month Period Ended September 30, 2017 (Unaudited) (continued)
| | | | | | | | | | | | | | | | | | | | | | | | | | | | | | | | | | | | |
| | | Investment Grade Credit Fund | | | Local Emerging Markets Debt Fund | | | U.S. Mortgages Fund | |
| Share Class | | Beginning
Account
Value
4/1/17 | | | Ending
Account
Value
9/30/17 | | | Expenses
Paid for the
6 months ended
9/30/17* | | | Beginning
Account
Value
4/1/17 | | | Ending
Account
Value
9/30/17 | | | Expenses
Paid for the
6 months ended
9/30/17* | | | Beginning
Account
Value
4/1/17 | | | Ending
Account
Value
9/30/17 | | | Expenses
Paid for the
6 months ended
9/30/17* | |
| Class A | | | | | | | | | | | | | | | | | | | | | | | | | | | | | | | | | | | | |
Actual | | $ | 1,000.00 | | | $ | 1,038.00 | | | $ | 3.68 | | | $ | 1,000.00 | | | $ | 1,072.70 | | | $ | 6.34 | | | $ | 1,000.00 | | | $ | 1,013.30 | | | $ | 3.89 | |
Hypothetical 5% return | | | 1,000.00 | | | | 1,021.46 | + | | | 3.65 | | | | 1,000.00 | | | | 1,018.95 | + | | | 6.17 | | | | 1,000.00 | | | | 1,021.21 | + | | | 3.90 | |
| Class C | | | | | | | | | | | | | | | | | | | | | | | | | | | | | | | | | | | | |
Actual | | | N/A | | | | N/A | | | | N/A | | | | 1,000.00 | | | | 1,068.80 | | | | 10.22 | | | | N/A | | | | N/A | | | | N/A | |
Hypothetical 5% return | | | N/A | | | | N/A | | | | N/A | | | | 1,000.00 | | | | 1,015.19 | + | | | 9.95 | | | | N/A | | | | N/A | + | | | N/A | |
| Institutional | | | | | | | | | | | | | | | | | | | | | | | | | | | | | | | | | | | | |
Actual | | | 1,000.00 | | | | 1,039.80 | | | | 1.94 | | | | 1,000.00 | | | | 1,074.50 | | | | 4.78 | | | | 1,000.00 | | | | 1,015.00 | | | | 2.17 | |
Hypothetical 5% return | | | 1,000.00 | | | | 1,023.16 | + | | | 1.93 | | | | 1,000.00 | | | | 1,020.46 | + | | | 4.66 | | | | 1,000.00 | | | | 1,022.91 | + | | | 2.18 | |
| Investor | | | | | | | | | | | | | | | | | | | | | | | | | | | | | | | | | | | | |
Actual | | | 1,000.00 | | | | 1,039.30 | | | | 2.40 | | | | 1,000.00 | | | | 1,074.20 | | | | 5.04 | | | | 1,000.00 | | | | 1,014.60 | | | | 2.63 | |
Hypothetical 5% return | | | 1,000.00 | | | | 1,022.71 | + | | | 2.38 | | | | 1,000.00 | | | | 1,020.20 | + | | | 4.91 | | | | 1,000.00 | | | | 1,022.46 | + | | | 2.64 | |
| Separate Account Institutional | | | | | | | | | | | | | | | | | | | | | | | | | | | | | | | | | | | | |
Actual | | | 1,000.00 | | | | 1,039.80 | | | | 1.94 | | | | N/A | | | | N/A | | | | N/A | | | | 1,000.00 | | | | 1,015.00 | | | | 2.17 | |
Hypothetical 5% return | | | 1,000.00 | | | | 1,023.16 | + | | | 1.93 | | | | N/A | | | | N/A | | | | N/A | | | | 1,000.00 | | | | 1,022.91 | + | | | 2.18 | |
| Class R6 | | | | | | | | | | | | | | | | | | | | | | | | | | | | | | | | | | | | |
Actual | | | 1,000.00 | | | | 1,039.80 | | | | 1.89 | | | | N/A | | | | N/A | | | | N/A | | | | 1,000.00 | | | | 1,015.10 | | | | 2.07 | |
Hypothetical 5% return | | | 1,000.00 | | | | 1,023.21 | + | | | 1.88 | | | | N/A | | | | N/A | | | | N/A | | | | 1,000.00 | | | | 1,023.01 | + | | | 2.08 | |
| * | | Expenses for each share class are calculated using each Fund’s annualized net expense ratio for each class, which represents the ongoing expenses as a percentage of net assets for the six months ended September 30, 2017. Expenses are calculated by multiplying the annualized net expense ratio by the average account value for the period; then multiplying the result by the number of days in the most recent fiscal half year; and then dividing that result by the number of days in the fiscal year. The annualized net expense ratios for the period were as follows: |
| | | | | | | | | | | | | | | | | | | | | | | | | | | | | | | | |
| Fund | | Class A | | | Class C | | | Institutional | | | Service | | | Separate
Account
Institutional | | | Investor | | | Class R | | | Class R6 | |
Dynamic Emerging Markets Debt+ | | | 1.22 | % | | | 1.97 | % | | | 0.88 | % | | | N/A | | | | N/A | | | | 0.97 | % | | | 1.47 | % | | | N/A | |
Emerging Markets Debt+ | | | 1.22 | | | | 1.96 | | | | 0.87 | | | | N/A | | | | N/A | | | | 0.96 | | | | N/A | | | | 0.86 | % |
High Yield+ | | | 1.05 | | | | 1.80 | | | | 0.73 | | | | 1.22 | % | | | N/A | | | | 0.80 | | | | 1.30 | �� | | | 0.73 | |
High Yield Floating Rate+ | | | 0.94 | | | | 1.69 | | | | 0.60 | | | | N/A | | | | N/A | | | | 0.68 | | | | 1.16 | | | | N/A | |
Investment Grade Credit+ | | | 0.72 | | | | N/A | | | | 0.38 | | | | N/A | | | | 0.38 | % | | | 0.47 | | | | N/A | | | | 0.37 | |
Local Emerging Markets Debt+ | | | 1.22 | | | | 1.97 | | | | 0.92 | | | | N/A | | | | N/A | | | | 0.97 | | | | N/A | | | | N/A | |
U.S. Mortgages+ | | | 0.77 | | | | N/A | | | | 0.43 | | | | N/A | | | | 0.43 | | | | 0.52 | | | | N/A | | | | 0.41 | |
| + | | Hypothetical expenses are based on each Fund’s actual annualized net expense ratios and an assumed rate of return of 5% per year before expenses. |
187
GOLDMAN SACHS SINGLE SECTOR FIXED INCOME FUNDS
Statement Regarding Basis for Approval of Management Agreement (Unaudited)
Background
The Goldman Sachs Dynamic Emerging Markets Debt Fund, Goldman Sachs Emerging Markets Debt Fund, Goldman Sachs High Yield Fund, Goldman Sachs High Yield Floating Rate Fund, Goldman Sachs Investment Grade Credit Fund, Goldman Sachs Local Emerging Markets Debt Fund, and Goldman Sachs U.S. Mortgages Fund (the “Funds”) are investment portfolios of Goldman Sachs Trust (the “Trust”). The Board of Trustees oversees the management of the Trust and reviews the investment performance and expenses of the Funds at regularly scheduled meetings held throughout the year. In addition, the Board of Trustees determines annually whether to approve the continuance of the Trust’s investment management agreement (the “Management Agreement”) with Goldman Sachs Asset Management, L.P. (the “Investment Adviser”) on behalf of the Funds.
The Management Agreement was most recently approved for continuation until June 30, 2018 by the Board of Trustees, including those Trustees who are not parties to the Management Agreement or “interested persons” (as defined in the Investment Company Act of 1940, as amended) of any party thereto (the “Independent Trustees”), at a meeting held on June 14-15, 2017 (the “Annual Meeting”).
The review process undertaken by the Trustees spans the course of the year and culminates with the Annual Meeting. To assist the Trustees in their deliberations, the Trustees have established a Contract Review Committee (the “Committee”), comprised of the Independent Trustees. The Committee held four meetings over the course of the year since the Management Agreement was last approved. At those Committee meetings, regularly scheduled Board or other committee meetings, and/or the Annual Meeting, matters relevant to the renewal of the Management Agreement were considered by the Board, or the Independent Trustees, as applicable. With respect to each Fund, such matters included:
| | (a) | | the nature and quality of the advisory, administrative, and other services provided to the Fund by the Investment Adviser and its affiliates, including information about: |
| | (i) | | the structure, staff, and capabilities of the Investment Adviser and its portfolio management teams; |
| | (ii) | | the groups within the Investment Adviser and its affiliates that support the portfolio management teams or provide other types of necessary services, including fund services groups (e.g., accounting and financial reporting, tax, shareholder services, and operations); controls and risk management groups (e.g., legal, compliance, valuation oversight, credit risk management, internal audit, compliance testing, market risk analysis, finance, and central funding); sales and distribution support groups, and others (e.g., information technology and training); |
| | (iii) | | trends in employee headcount; |
| | (iv) | | the Investment Adviser’s financial resources and ability to hire and retain talented personnel and strengthen its operations; and |
| | (v) | | the parent company’s support of the Investment Adviser and its mutual fund business, as expressed by the firm’s senior management; |
| | (b) | | information on the investment performance of the Fund, including comparisons to the performance of similar mutual funds, as provided by a third-party mutual fund data provider engaged as part of the contract review process (the “Outside Data Provider”), a benchmark performance index, and, (in the case of the High Yield and Local Emerging Markets Debt Funds), a composite of accounts with comparable investment strategies managed by the Investment Adviser; and information on general investment outlooks in the markets in which the Fund invests; |
| | (c) | | information provided by the Investment Adviser indicating the Investment Adviser’s views on whether the Fund’s peer group and/or benchmark index had high, medium, or low relevance given the Fund’s particular investment strategy; |
| | (d) | | the terms of the Management Agreement and other agreements with affiliated service providers entered into by the Trust on behalf of the Fund; |
| | (e) | | fee and expense information for the Fund, including: |
| | (i) | | the relative management fee and expense levels of the Fund as compared to those of comparable funds managed by other advisers, as provided by the Outside Data Provider; |
| | (ii) | | the Fund’s expense trends over time; and |
| | (iii) | | to the extent the Investment Adviser manages other types of accounts (such as bank collective trusts, private wealth management accounts, institutional separate accounts, sub-advised mutual funds, and non-U.S. funds) having investment objectives and policies similar to those of the Fund, comparative information on the advisory fees charged and services provided to those accounts by the Investment Adviser; |
| | (f) | | with respect to the extensive investment performance and expense comparison data provided by the Outside Data Provider, its processes in producing that data for the Fund; |
| | (g) | | the undertakings of the Investment Adviser and its affiliates to implement fee waivers and/or expense limitations; |
| | (h) | | information relating to the profitability of the Management Agreement and the transfer agency and distribution and service arrangements of the Fund to the Investment Adviser and its affiliates; |
188
GOLDMAN SACHS SINGLE SECTOR FIXED INCOME FUNDS
Statement Regarding Basis for Approval of Management Agreement (Unaudited) (continued)
| | (i) | | whether the Fund’s existing management fee schedule adequately addressed any economies of scale; |
| | (j) | | a summary of the “fall-out” benefits derived by the Investment Adviser and its affiliates from their relationships with the Fund, including the fees received by the Investment Adviser’s affiliates from the Fund for transfer agency, portfolio trading, distribution and other services; |
| | (k) | | a summary of potential benefits derived by the Fund as a result of its relationship with the Investment Adviser; |
| | (l) | | information regarding portfolio trading and how the Investment Adviser carries out its duty to seek best execution; |
| | (m) | | portfolio manager ownership of Fund shares; the manner in which portfolio manager compensation is determined; and the number and types of accounts managed by the portfolio managers; |
| | (n) | | the nature and quality of the services provided to the Fund by its unaffiliated service providers, and the Investment Adviser’s general oversight and evaluation (including reports on due diligence) of those service providers as part of the administrative services provided under the Management Agreement; and |
| | (o) | | the Investment Adviser’s processes and policies addressing various types of potential conflicts of interest; its approach to risk management; the annual review of the effectiveness of the Fund’s compliance program; and periodic compliance reports. |
The Trustees also received an overview of the Funds’ distribution arrangements. They received information regarding the Funds’ assets, share purchase and redemption activity, and payment of distribution, service, and shareholder administration fees, as applicable. Information was also provided to the Trustees relating to revenue sharing payments made by and services provided by the Investment Adviser and its affiliates to intermediaries that promote the sale, distribution, and/or servicing of Fund shares. The Independent Trustees also discussed the broad range of other investment choices that are available to Fund investors, including the availability of comparable funds managed by other advisers.
The presentations made at the Board and Committee meetings and at the Annual Meeting encompassed the Funds and other mutual funds for which the Board of Trustees has responsibility. In evaluating the Management Agreement at the Annual Meeting, the Trustees relied upon their knowledge, resulting from their meetings and other interactions throughout the year, of the Investment Adviser and its affiliates, their services, and the Funds. In conjunction with these meetings, the Trustees received written materials and oral presentations on the topics covered, and the Investment Adviser addressed the questions and concerns of the Trustees, including concerns regarding the investment performance of certain of the funds they oversee. The Independent Trustees were advised by their independent legal counsel regarding their responsibilities and other regulatory requirements related to the approval and continuation of mutual fund investment management agreements under applicable law. In addition, the Investment Adviser and its affiliates provided the Independent Trustees with a written response to a formal request for information sent on behalf of the Independent Trustees by their independent legal counsel. During the course of their deliberations, the Independent Trustees met in executive sessions with their independent legal counsel, without representatives of the Investment Adviser or its affiliates present.
Nature, Extent, and Quality of the Services Provided Under the Management Agreement
As part of their review, the Trustees considered the nature, extent, and quality of the services provided to the Funds by the Investment Adviser. In this regard, the Trustees considered both the investment advisory services and non-advisory services that are provided by the Investment Adviser and its affiliates. The Trustees noted the transition in the leadership and changes in personnel of various of the Investment Adviser’s portfolio management teams that had occurred in recent periods, and the ongoing recruitment efforts aimed at bringing high quality investment talent to the Investment Adviser. They also noted the Investment Adviser’s commitment to maintaining high quality systems and expending substantial resources to respond to ongoing changes to the regulatory and control environment in which the Funds and their service providers operate, as well as the efforts of the Investment Adviser and its affiliates to combat cyber security risks. The Trustees concluded that the Investment Adviser continued to commit substantial financial and operational resources to the Funds and expressed confidence that the Investment Adviser would continue to do so in the future. The Trustees also recognized that the Investment Adviser had made significant commitments to address regulatory compliance requirements applicable to the Funds and the Investment Adviser and its affiliates.
Investment Performance
The Trustees also considered the investment performance of the Funds. In this regard, they compared the investment performance of each Fund to its peers using rankings and ratings compiled by the Outside Data Provider as of December 31, 2016, and updated performance information prepared by the Investment Adviser using the peer group identified by the Outside Data Provider as of March 31, 2017. The information on each Fund’s investment performance was provided for the one-, three-, five-, and ten-year periods ending on the applicable dates, to the extent that each Fund had been in existence for those periods. The Trustees also reviewed each Fund’s investment performance relative to its performance benchmark. As part of this review, they
189
GOLDMAN SACHS SINGLE SECTOR FIXED INCOME FUNDS
Statement Regarding Basis for Approval of Management Agreement (Unaudited) (continued)
considered the investment performance trends of the Funds over time, and reviewed the investment performance of each Fund in light of its investment objective and policies and market conditions. The Trustees also received information comparing the High Yield and Local Emerging Markets Debt Funds’ performance to that of composites of accounts with comparable investment strategies managed by the Investment Adviser.
In addition, the Trustees considered materials prepared and presentations made by the Investment Adviser’s senior management and portfolio management personnel in which Fund performance was assessed. The Trustees also considered the Investment Adviser’s periodic reports with respect to the Funds’ risk profiles, and how the Investment Adviser’s approach to risk monitoring and management influences portfolio management.
The Trustees observed that the Dynamic Emerging Markets Debt Fund’s Institutional Shares had placed in the third quartile of the Fund’s peer group for the one-year period and in the fourth quartile for the three-year period, and had outperformed the Fund’s benchmark index for the one-year period and underperformed for the three-year period ended March 31, 2017. The Trustees noted that the Emerging Markets Debt Fund’s Institutional Shares had placed in the first quartile of the Fund’s peer group for the three-, five-, and ten-year periods and in the third quartile for the one-year period, and had outperformed the Fund’s benchmark index for the one- and ten-year periods and underperformed for the three- and five-year periods ended March 31, 2017. The Trustees observed that the High Yield Fund’s Institutional Shares had placed in the second quartile of the Fund’s peer group for the one-, five-, and ten-year periods and in the third quartile for the three-year period, and had underperformed the Fund’s benchmark index for the one-, three-, five-, and ten-year periods ended March 31, 2017. They observed that the High Yield Floating Rate Fund’s Institutional Shares had placed in the second quartile of the Fund’s peer group for the three-year period and in the third quartile for the one- and five-year periods, and had underperformed the Fund’s benchmark index for the one-, three-, and five-year periods ended March 31, 2017. The Trustees noted that the Investment Grade Credit Fund’s Institutional Shares had placed in the third quartile of the Fund’s peer group for the one-, three-, five-, and ten-year periods, and had outperformed the Fund’s benchmark index for the one- and five-year periods and underperformed for the three- and ten-year periods ended March 31, 2017. They also noted that the Investment Grade Credit Fund’s Institutional Shares had experienced certain portfolio management changes in the first half of 2017. The Trustees noted that the Local Emerging Markets Debt Fund’s Institutional Shares had placed in the third quartile of the Fund’s peer group for the one-, three-, and five-year periods, and had outperformed the Fund’s benchmark index for the one-year period and underperformed for the three- and five-year periods ended March 31, 2017. They noted that the U.S. Mortgages Fund’s Institutional Shares had placed in the first quartile of the Fund’s peer group for the one-, three-, five-, and ten-year periods, and had outperformed the Fund’s benchmark index for the one- and five-year periods, performed in-line for the three-year period, and underperformed for the ten-year period ended March 31, 2017.
Costs of Services Provided and Competitive Information
The Trustees considered the contractual terms of the Management Agreement and the fee rates payable by each Fund thereunder. In this regard, the Trustees considered information on the services rendered by the Investment Adviser to the Funds, which included both advisory and administrative services that were directed to the needs and operations of the Funds as registered mutual funds.
In particular, the Trustees reviewed analyses prepared by the Outside Data Provider regarding the expense rankings of the Funds. The analyses provided a comparison of each Fund’s management fee and breakpoints to those of a relevant peer group and category universe; an expense analysis which compared each Fund’s overall net and gross expenses to a peer group and a category universe; and data comparing each Fund’s net expenses to the peer and category medians. The analyses also compared each Fund’s transfer agency, custody, and distribution fees, other expenses and fee waivers/reimbursements to those of the peer group and category medians. The Trustees concluded that the comparisons provided by the Outside Data Provider were useful in evaluating the reasonableness of the management fees and total expenses paid by the Funds.
With respect to the Dynamic Emerging Markets Debt, Investment Grade Credit, Local Emerging Markets Debt, and U.S. Mortgages Funds, the Trustees noted that the management fee breakpoint schedules were being reduced at all asset levels. In addition, the Trustees considered the Investment Adviser’s undertakings to implement fee waivers and/or expense limitations. The Trustees also noted that certain changes were being made to existing fee waiver or expense limitation arrangements of the Dynamic Emerging Markets Debt, Emerging Markets Debt, and High Yield Funds that would have the effect of decreasing total Fund expenses, with such changes taking effect in connection with the Funds’ next annual registration statement update. They also considered, to the extent that the Investment Adviser manages other types of accounts having investment objectives and policies similar to those of the Funds, comparative fee information for services provided by the Investment Adviser to those accounts, and information that indicated that services provided to the Funds differed in various significant respects from the services provided to other types of accounts which, in many cases, operated under less stringent legal and regulatory structures, required fewer services from the Investment Adviser to a smaller number of client contact points, and were less time-intensive.
190
GOLDMAN SACHS SINGLE SECTOR FIXED INCOME FUNDS
Statement Regarding Basis for Approval of Management Agreement (Unaudited) (continued)
In addition, the Trustees noted that shareholders are able to redeem their Fund shares at any time if shareholders believe that the Fund fees and expenses are too high or if they are dissatisfied with the performance of the Fund.
Profitability
The Trustees reviewed each Fund’s contribution to the Investment Adviser’s revenues and pre-tax profit margins. In this regard the Trustees noted that they had received, among other things, profitability analyses and summaries, revenue and expense schedules by Fund and by function (i.e., investment management, transfer agency and distribution and service), and information on the Investment Adviser’s expense allocation methodology. They observed that the profitability and expense figures are substantially similar to those used by the Investment Adviser for many internal purposes, including compensation decisions among various business groups, and are thus subject to a vigorous internal debate about how certain revenue and expenses should be allocated. The Trustees also noted that the internal audit group within the Goldman Sachs organization had audited the expense allocation methodology and that the internal audit group was satisfied with the reasonableness, consistency, and accuracy of the Investment Adviser’s expense allocation methodology and profitability analysis calculations. Profitability data for each Fund was provided for 2016 and 2015, and the Trustees considered this information in relation to the Investment Adviser’s overall profitability.
Economies of Scale
The Trustees considered the information that had been provided regarding the Investment Adviser’s profitability. The Trustees also considered the breakpoints in the fee rate payable under the Management Agreement for each of the Funds at the following annual percentage rates of the average daily net assets of the Funds:
| | | | | | | | | | | | | | | | |
| | | Dynamic
Emerging
Markets Debt
Fund | | | Emerging
Markets Debt
Fund | | | High Yield
Fund | | | Local
Emerging
Markets Debt
Fund | |
| First $2 billion | | | 0.90 | % | | | 0.80 | % | | | 0.70 | % | | | 0.90 | % |
| Next $3 billion | | | 0.81 | | | | 0.72 | | | | 0.63 | | | | 0.81 | |
| Next $3 billion | | | 0.77 | | | | 0.68 | | | | 0.60 | | | | 0.77 | |
| Over $8 billion | | | 0.75 | | | | 0.67 | | | | 0.59 | | | | 0.75 | |
| | | | |
| | | High Yield
Floating Rate
Fund | | | Investment
Grade Credit
Fund | | | U.S.
Mortgages
Fund | | | | |
| First $1 billion | | | 0.60 | % | | | 0.40 | % | | | 0.40 | % | | | | |
| Next $1 billion | | | 0.54 | | | | 0.36 | | | | 0.36 | | | | | |
| Next $3 billion | | | 0.51 | | | | 0.34 | | | | 0.34 | | | | | |
| Next $3 billion | | | 0.50 | | | | 0.33 | | | | 0.33 | | | | | |
| Over $8 billion | | | 0.49 | | | | 0.32 | | | | 0.32 | | | | | |
191
GOLDMAN SACHS SINGLE SECTOR FIXED INCOME FUNDS
Statement Regarding Basis for Approval of Management Agreement (Unaudited) (continued)
The Trustees noted that the breakpoints were designed to share potential economies of scale, if any, with the Funds and their shareholders as assets under management reach those asset levels. The Trustees considered the amounts of assets in the Funds; the Funds’ recent share purchase and redemption activity; the information provided by the Investment Adviser relating to the costs of the services provided by the Investment Adviser and its affiliates and their realized profits; information comparing fee rates charged by the Investment Adviser with fee rates charged to other funds in the peer groups; and the Investment Adviser’s undertakings to waive a portion of its management fee (with respect to the Dynamic Emerging Markets Debt, Investment Grade Credit, Local Emerging Markets Debt, and U.S. Mortgages Funds) and to limit certain expenses of the Funds that exceed specified levels. Upon reviewing these matters at the Annual Meeting, the Trustees concluded that the fee breakpoints represented a means of assuring that benefits of scalability, if any, would be passed along to shareholders at the specified asset levels. They also noted that the Investment Adviser had passed along savings to shareholders of the High Yield and High Yield Floating Rate Funds, which each had asset levels above at least the first breakpoint during the prior fiscal year.
Other Benefits to the Investment Adviser and Its Affiliates
The Trustees also considered the other benefits derived by the Investment Adviser and its affiliates from their relationships with the Funds as stated above, including: (a) transfer agency fees received by Goldman Sachs & Co. LLC (“Goldman Sachs”); (b) futures commissions earned by Goldman Sachs for executing futures transactions on behalf of the Funds; (c) trading efficiencies resulting from aggregation of orders of the Funds with those for other funds or accounts managed by the Investment Adviser; (d) the Investment Adviser’s ability to leverage the infrastructure designed to service the Funds on behalf of its other clients; (e) the Investment Adviser’s ability to cross-market other products and services to Fund shareholders; (f) Goldman Sachs’ retention of certain fees as Fund Distributor; (g) the Investment Adviser’s ability to negotiate better pricing with custodians on behalf of its other clients, as a result of the relationship with the Funds; and (h) the possibility that the working relationship between the Investment Adviser and the Funds’ third-party service providers may cause those service providers to be more likely to do business with other areas of Goldman Sachs. In the course of considering the foregoing, the Independent Trustees requested and received further information quantifying certain of these fall-out benefits.
Other Benefits to the Funds and Their Shareholders
The Trustees also noted that the Funds receive certain potential benefits as a result of their relationship with the Investment Adviser, including: (a) trading efficiencies resulting from aggregation of orders of the Funds with those of other funds or accounts managed by the Investment Adviser; (b) enhanced servicing from vendors because of the volume of business generated by the Investment Adviser and its affiliates; (c) enhanced servicing from broker-dealers because of the volume of business generated by the Investment Adviser and its affiliates; (d) the Investment Adviser’s ability to negotiate favorable terms with derivatives counterparties on behalf of the Funds as a result of the size and reputation of the Goldman Sachs organization; (e) the Investment Adviser’s knowledge and experience gained from managing other accounts and products; (f) the Investment Adviser’s ability to hire and retain qualified personnel to provide services to the Funds because of the reputation of the Goldman Sachs organization; (g) the Funds’ access, through the Investment Adviser, to certain firmwide resources (e.g., proprietary risk management systems and databases), subject to certain restrictions; and (h) the Funds’ access to certain affiliated distribution channels. In addition, the Trustees noted the competitive nature of the mutual fund marketplace, and considered that many of the Funds’ shareholders invested in the Funds in part because of the Funds’ relationship with the Investment Adviser and that those shareholders have a general expectation that the relationship will continue.
Conclusion
In connection with their consideration of the Management Agreement, the Trustees gave weight to each of the factors described above, but did not identify any particular factor as controlling their decision. After deliberation and consideration of all of the information provided, including the factors described above, the Trustees concluded, in the exercise of their business judgment, that the management fees paid by each of the Funds were reasonable in light of the services provided to it by the Investment Adviser, the Investment Adviser’s costs and each Fund’s current and reasonably foreseeable asset levels. The Trustees unanimously concluded that the Investment Adviser’s continued management likely would benefit each Fund and its shareholders and that the Management Agreement should be approved and continued with respect to each Fund until June 30, 2018.
192
FUNDS PROFILE
Goldman Sachs Funds
Goldman Sachs is a premier financial services firm, known since 1869 for creating thoughtful and customized investment solutions in complex global markets.
Today, the Investment Management Division of Goldman Sachs serves a diverse set of clients worldwide, including private institutions, public entities and individuals. With approximately $1.25 trillion in assets under supervision as of September 30, 2017, Goldman Sachs Asset Management (“GSAM”) has portfolio management teams located around the world and our investment professionals bring firsthand knowledge of local markets to every investment decision. Assets under supervision includes assets under management and other client assets for which Goldman Sachs does not have full discretion. GSAM leverages the resources of Goldman Sachs & Co. LLC subject to legal, internal and regulatory restrictions.
Money Market
Financial Square FundsSM
| ∎ | | Financial Square Treasury Solutions Fund1 |
| ∎ | | Financial Square Government Fund1 |
| ∎ | | Financial Square Money Market Fund2 |
| ∎ | | Financial Square Prime Obligations Fund2 |
| ∎ | | Financial Square Treasury Instruments Fund1 |
| ∎ | | Financial Square Treasury Obligations Fund1 |
| ∎ | | Financial Square Federal Instruments Fund1 |
| ∎ | | Financial Square Tax-Exempt Money Market Fund2 |
Investor FundsSM
| ∎ | | Investor Money Market Fund3 |
| ∎ | | Investor Tax-Exempt Money Market Fund3 |
Fixed Income
Short Duration and Government
| ∎ | | High Quality Floating Rate Fund |
| ∎ | | Short-Term Conservative Income Fund |
| ∎ | | Short Duration Government Fund |
| ∎ | | Short Duration Income Fund |
| ∎ | | Inflation Protected Securities Fund |
Multi-Sector
Municipal and Tax-Free
| ∎ | | High Yield Municipal Fund |
| ∎ | | Dynamic Municipal Income Fund |
| ∎ | | Short Duration Tax-Free Fund |
Single Sector
| ∎ | | Investment Grade Credit Fund |
| ∎ | | High Yield Floating Rate Fund |
| ∎ | | Emerging Markets Debt Fund |
| ∎ | | Local Emerging Markets Debt Fund |
| ∎ | | Dynamic Emerging Markets Debt Fund |
Fixed Income Alternatives
| ∎ | | Long Short Credit Strategies Fund |
Fundamental Equity
| ∎ | | Small/Mid Cap Value Fund |
| ∎ | | Small/Mid Cap Growth Fund |
| ∎ | | Concentrated Growth Fund7 |
| ∎ | | Technology Opportunities Fund |
| ∎ | | Growth Opportunities Fund |
| ∎ | | Rising Dividend Growth Fund |
Tax-Advantaged Equity
| ∎ | | U.S. Tax-Managed Equity Fund |
| ∎ | | International Tax-Managed Equity Fund |
| ∎ | | U.S. Equity Dividend and Premium Fund |
| ∎ | | International Equity Dividend and Premium Fund |
Equity Insights
| ∎ | | Small Cap Equity Insights Fund |
| ∎ | | U.S. Equity Insights Fund |
| ∎ | | Small Cap Growth Insights Fund |
| ∎ | | Large Cap Growth Insights Fund |
| ∎ | | Large Cap Value Insights Fund |
| ∎ | | Small Cap Value Insights Fund |
| ∎ | | International Small Cap Insights Fund |
| ∎ | | International Equity Insights Fund |
| ∎ | | Emerging Markets Equity Insights Fund |
Fundamental Equity International
| ∎ | | Strategic International Equity Fund |
| ∎ | | Focused International Equity Fund |
| ∎ | | Emerging Markets Equity Fund |
Select Satellite
| ∎ | | Real Estate Securities Fund |
| ∎ | | International Real Estate Securities Fund |
| ∎ | | Commodity Strategy Fund |
| ∎ | | Global Real Estate Securities Fund |
| ∎ | | Alternative Premia Fund9 |
| ∎ | | Absolute Return Tracker Fund |
| ∎ | | Managed Futures Strategy Fund |
| ∎ | | MLP Energy Infrastructure Fund |
| ∎ | | Multi-Manager Alternatives Fund |
| ∎ | | Absolute Return Multi-Asset Fund |
| ∎ | | Global Infrastructure Fund |
Total Portfolio Solutions
| ∎ | | Global Managed Beta Fund |
| ∎ | | Multi-Manager Non-Core Fixed Income Fund |
| ∎ | | Multi-Manager U.S. Dynamic Equity Fund |
| ∎ | | Multi-Manager Global Equity Fund |
| ∎ | | Multi-Manager International Equity Fund |
| ∎ | | Tactical Tilt Overlay Fund |
| ∎ | | Balanced Strategy Portfolio |
| ∎ | | Multi-Manager U.S. Small Cap Equity Fund |
| ∎ | | Multi-Manager Real Assets Strategy Fund |
| ∎ | | Growth and Income Strategy Portfolio |
| ∎ | | Growth Strategy Portfolio |
| ∎ | | Equity Growth Strategy Portfolio |
| ∎ | | Satellite Strategies Portfolio |
| ∎ | | Enhanced Dividend Global Equity Portfolio |
| ∎ | | Tax-Advantaged Global Equity Portfolio |
| ∎ | | Strategic Factor Allocation Fund |
| ∎ | | Target Date 2020 Portfolio |
| ∎ | | Target Date 2025 Portfolio |
| ∎ | | Target Date 2030 Portfolio |
| ∎ | | Target Date 2035 Portfolio |
| ∎ | | Target Date 2040 Portfolio |
| ∎ | | Target Date 2045 Portfolio |
| ∎ | | Target Date 2050 Portfolio |
| ∎ | | Target Date 2055 Portfolio |
| ∎ | | GQG Partners International Opportunities Fund |
| 1 | | You could lose money by investing in the Fund. Although the Fund seeks to preserve the value of your investment at $1.00 per share, it cannot guarantee it will do so. An investment in the Fund is not a deposit of a bank and is not insured or guaranteed by the Federal Deposit Insurance Corporation or any other government agency. The Fund’s sponsor has no legal obligation to provide financial support to the Fund, and you should not expect that the sponsor will provide financial support to the Fund at any time. |
| 2 | | You could lose money by investing in the Fund. Because the share price of the Fund will fluctuate, when you sell your shares they may be worth more or less than what you originally paid for them. The Fund may impose a fee upon sale of your shares or may temporarily suspend your ability to sell shares if the Fund’s liquidity falls below required minimums because of market conditions or other factors. An investment in the Fund is not a deposit of a bank and is not insured or guaranteed by the Federal Deposit Insurance Corporation or any other government agency. The Fund’s sponsor has no legal obligation to provide financial support to the Fund, and you should not expect that the sponsor will provide financial support to the Fund at any time. |
| 3 | | You could lose money by investing in the Fund. Although the Fund seeks to preserve the value of your investment at $1.00 per share, it cannot guarantee it will do so. The Fund may impose a fee upon sale of your shares or may temporarily suspend your ability to sell shares if the Fund’s liquidity falls below required minimums because of market conditions or other factors. An investment in the Fund is not a deposit of a bank and is not insured or guaranteed by the Federal Deposit Insurance Corporation or any other government agency. The Fund’s sponsor has no legal obligation to provide financial support to the Fund, and you should not expect that the sponsor will provide financial support to the Fund at any time. |
| 4 | | Effective on June 20, 2017, the Goldman Sachs Fixed Income Macro Strategies Fund was renamed the Goldman Sachs Strategic Macro Fund. |
| 5 | | Effective on June 20, 2017, the Goldman Sachs Growth and Income Fund was renamed the Goldman Sachs Equity Income Fund. |
| 6 | | Effective after the close of business on August 31, 2017, the Goldman Sachs Flexible Cap Growth Fund was renamed the Goldman Sachs Flexible Cap Fund. |
| 7 | | Effective on July 28, 2017, the Goldman Sachs Focused Growth Fund was reorganized with and into the Goldman Sachs Concentrated Growth Fund. |
| 8 | | Effective after the close of business on October 31, 2017, the Goldman Sachs Dynamic U.S. Equity Fund was renamed the Goldman Sachs Blue Chip Fund. |
| 9 | | Effective after the close of business on October 30, 2017, the Goldman Sachs Dynamic Allocation Fund was renamed the Goldman Sachs Alternative Premia Fund. Financial Square FundsSM and Investor FundsSM are registered service marks of Goldman Sachs & Co. LLC. |
* This list covers open-end funds only. Please visit our website at www.GSAMFUNDS.com to learn about our closed-end funds and exchange-traded funds.
| | |
TRUSTEES Ashok N. Bakhru, Chairman Kathryn A. Cassidy Diana M. Daniels Herbert J. Markley James A. McNamara Jessica Palmer Roy W. Templin Gregory G. Weaver | | OFFICERS James A. McNamara, President Scott M. McHugh, Treasurer, Senior Vice President and Principal Financial Officer Joseph F. DiMaria, Assistant Treasurer and Principal Accounting Officer Caroline L. Kraus, Secretary |
| |
GOLDMAN SACHS & CO. LLC Distributor and Transfer Agent | | GOLDMAN SACHS ASSET MANAGEMENT, L.P. Investment Adviser |
Visit our web site at www.GSAMFUNDS.com to obtain the most recent month-end returns.
Goldman Sachs Asset Management, L.P., 200 West Street, New York, New York 10282
The reports concerning the Funds included in this shareholder report may contain certain forward-looking statements about the factors that may affect the performance of the Funds in the future. These statements are based on Fund management’s predictions and expectations concerning certain future events and their expected impact on the Funds, such as performance of the economy as a whole and of specific industry sectors, changes in the levels of interest rates, the impact of developing world events, and other factors that may influence the future performance of the Funds. Management believes these forward-looking statements to be reasonable, although they are inherently uncertain and difficult to predict. Actual events may cause adjustments in portfolio management strategies from those currently expected to be employed.
A description of the policies and procedures that the Funds use to determine how to vote proxies relating to portfolio securities and information regarding how a Fund voted proxies relating to portfolio securities during the most recent 12-month period ended June 30 is available (i) without charge, upon request by calling 1-800-526-7384 (for Retail Shareholders) or 1-800-621-2550 (for Institutional Shareholders); and (ii) on the Securities and Exchange Commission (“SEC”) web site at http://www.sec.gov.
The Funds file their complete schedule of portfolio holdings with the SEC for the first and third quarters of each fiscal year on Form N-Q. The Funds’ Forms N-Q are available on the SEC’s web site at http://www.sec.gov within 60 days after the Funds’ first and third fiscal quarters. The Funds’ Forms N-Q may be reviewed and copied at the SEC’s Public Reference Room in Washington, D.C. and information on the operation of the Public Reference Room may also be obtained by calling 1-800-SEC-0330. Forms N-Q may be obtained upon request and without charge by calling 1-800-526-7384 (for Retail Shareholders) or 1-800-621-2550 (for Institutional Shareholders).
Goldman Sachs & Co. LLC (‘‘Goldman Sachs’’) does not provide legal, tax or accounting advice. Any statement contained in this communication (including any attachments) concerning U.S. tax matters was not intended or written to be used, and cannot be used, for the purpose of avoiding penalties under the Internal Revenue Code, and was written to support the promotion or marketing of the transaction(s) or matter(s) addressed. Clients of Goldman Sachs should obtain their own independent tax advice based on their particular circumstances.
Economic and market forecasts presented herein reflect a series of assumptions and judgments as of the date of this presentation and are subject to change without notice. These forecasts do not take into account the specific investment objectives, restrictions, tax and financial situation or other needs of any specific client. Actual data will vary and may not be reflected here. These forecasts are subject to high levels of uncertainty that may affect actual performance. Accordingly, these forecasts should be viewed as merely representative of a broad range of possible outcomes. These forecasts are estimated, based on assumptions, and are subject to significant revision and may change materially as economic and market conditions change. Goldman Sachs has no obligation to provide updates or changes to these forecasts. Case studies and examples are for illustrative purposes only.
Fund holdings and allocations shown are as of September 30, 2017 and may not be representative of future investments. Fund holdings should not be relied on in making investment decisions and should not be construed as research or investment advice regarding particular securities. Current and future holdings are subject to risk. The Global Industry Classification Standard (GICS) was developed by and is the exclusive property and a service mark of Morgan Stanley Capital International Inc. (MSCI) and Standard & Poor’s, a division of The McGraw-Hill Companies, Inc. (S&P) and is licensed for use by Goldman Sachs. Neither MSCI, S&P nor any other party involved in making or compiling the GICS or any GICS classifications makes any express or implied warranties or representations with respect to such standard or classification (or the results to be obtained by the use thereof), and all such parties hereby expressly disclaim all warranties of originality, accuracy, completeness, merchantability or fitness for a particular purpose with respect to any of such standard or classification. Without limiting any of the foregoing, in no event shall MSCI, S&P, any of their affiliates or any third party involved in making or compiling the GICS or any GICS classifications have any liability for any direct, indirect, special, punitive, consequential or any other damages (including lost profits) even if notified of the possibility of such damages.
The portfolio risk management process includes an effort to monitor and manage risk, but does not imply low risk.
THIS MATERIAL IS FOR INFORMATIONAL PURPOSES ONLY AND IS PROVIDED SOLELY ON THE BASIS THAT IT WILL NOT CONSTITUTE INVESTMENT OR OTHER ADVICE OR A RECOMMENDATION RELATING TO ANY PERSON’S OR PLAN’S INVESTMENT OR OTHER DECISIONS, AND GOLDMAN SACHS IS NOT A FIDUCIARY OR ADVISOR WITH RESPECT TO ANY PERSON OR PLAN BY REASON OF PROVIDING THE MATERIAL OR CONTENT HEREIN INCLUDING UNDER THE EMPLOYEE RETIREMENT INCOME SECURITY ACT OF 1974 OR DEPARTMENT OF LABOR REGULATIONS. PLAN SPONSORS AND OTHER FIDUCIARIES SHOULD CONSIDER THEIR OWN CIRCUMSTANCES IN ASSESSING ANY POTENTIAL COURSE OF ACTION.
A summary prospectus, if available, or a Prospectus for the Fund containing more information may be obtained from your authorized dealer or from Goldman Sachs & Co. LLC by calling (retail – 1-800-526-7384) (institutional – 1-800-621-2550). Please consider a fund’s objectives, risks, and charges and expenses, and read the summary prospectus, if available, and the Prospectus carefully before investing. The summary prospectus, if available, and the Prospectus contains this and other information about the Fund.
© 2017 Goldman Sachs. All rights reserved. 111300-OTU-651528 SSFISAR-17/62.8K
(a) As of the end of the period covered by this report, the registrant has adopted a code of ethics that applies to the registrant’s principal executive officer, principal financial officer, principal accounting officer or controller, or persons performing similar functions, regardless of whether these individuals are employed by the registrant or a third party (the “Code of Ethics”).
(b) During the period covered by this report, no amendments were made to the provisions of the Code of Ethics.
(c) During the period covered by this report, the registrant did not grant any waivers, including an implicit waiver, from any provision of the Code of Ethics.
(d) A copy of the Code of Ethics is available as provided in Item 12(a)(1) of this report.
| ITEM 3. | AUDIT COMMITTEE FINANCIAL EXPERT. |
The registrant’s board of trustees has determined that the registrant has at least one “audit committee financial expert” (as defined in Item 3 of Form N-CSR) serving on its audit committee. Gregory G. Weaver is the “audit committee financial expert” and is “independent” (as each term is defined in Item 3 of Form N-CSR).
| ITEM 4. | PRINCIPAL ACCOUNTANT FEES AND SERVICES. |
The information required by this Item is only required in an annual report on this Form N-CSR.
| ITEM 5. | AUDIT COMMITTEE OF LISTED REGISTRANTS. |
| ITEM 6. | SCHEDULE OF INVESTMENTS. |
| | Schedule of Investments is included as part of the Report to Shareholders filed under Item 1. |
| ITEM 7. | DISCLOSURE OF PROXY VOTING POLICIES AND PROCEDURES FOR CLOSED-END MANAGEMENT INVESTMENT COMPANIES. |
| ITEM 8. | PORTFOLIO MANAGERS OF CLOSED-END MANAGEMENT INVESTMENT COMPANIES. |
| ITEM 9. | PURCHASES OF EQUITY SECURITIES BY CLOSED-END MANAGEMENT INVESTMENT COMPANY AND AFFILIATED PURCHASERS. |
| ITEM 10. | SUBMISSION OF MATTERS TO A VOTE OF SECURITY HOLDERS. |
| | There have been no material changes to the procedures by which shareholders may recommend nominees to the registrant’s board of trustees. |
| ITEM 11. | CONTROLS AND PROCEDURES. |
| | (a) | The registrant’s principal executive and principal financial officers, or persons performing similar functions have concluded that the registrant’s disclosure controls and procedures (as defined in Rule 30a-3(c) under the Investment Company Act of 1940, as amended (the “1940 Act”)) are effective as of a date within 90 days of the filing of this report that includes the disclosure required by this paragraph, based on the evaluation of these controls and procedures required by Rule 30a-3(b) under the 1940 Act and 15d-15(b) under the Securities Exchange Act of 1934, as amended. |
| | (b) | There were no changes in the registrant’s internal control over financial reporting (as defined in Rule 30a-3(d) under the 1940 Act) that occurred during the registrant’s second fiscal quarter of the period covered by this report that have materially affected, or are reasonably likely to materially affect, the registrant’s internal control over financial reporting. |
| | | | |
| (a)(1) | | Goldman Sachs Trust’s Code of Ethics for Principal Executive and Senior Financial Officers is incorporated by reference to Exhibit 12(a)(1) of the registrant’s Form N-CSR filed on July 8, 2015 for its International Equity Insights Funds. |
| | |
| (a)(2) | | Exhibit 99.CERT | | Certifications pursuant to Section 302 of the Sarbanes-Oxley Act of 2002 filed herewith. |
| | |
| (b) | | Exhibit 99.906CERT | | Certifications pursuant to Section 906 of the Sarbanes-Oxley Act of 2002 filed herewith. |
SIGNATURES
Pursuant to the requirements of the Securities Exchange Act of 1934 and the Investment Company Act of 1940, the registrant has duly caused this report to be signed on its behalf by the undersigned, thereunto duly authorized.
| | |
| | | Goldman Sachs Trust |
| |
| By: | | /s/ James A. McNamara |
| |
| | |
| | James A. McNamara |
| | President/Chief Executive Officer |
| | Goldman Sachs Trust |
| |
| Date: | | December 5, 2017 |
Pursuant to the requirements of the Securities Exchange Act of 1934 and the Investment Company Act of 1940, this report has been signed below by the following persons on behalf of the registrant and in the capacities and on the dates indicated.
| | |
| By: | | /s/ James A. McNamara |
| |
| | |
| | James A. McNamara |
| | President/Chief Executive Officer |
| | Goldman Sachs Trust |
| |
| Date: | | December 5, 2017 |
| |
| By: | | /s/ Scott McHugh |
| |
| | |
| | Scott McHugh |
| | Principal Financial Officer |
| | Goldman Sachs Trust |
| |
| Date: | | December 5, 2017 |