UNITED STATES
SECURITIES AND EXCHANGE COMMISSION
Washington, D.C. 20549
FORM N-CSR
CERTIFIED SHAREHOLDER REPORT OF REGISTERED
MANAGEMENT INVESTMENT COMPANIES
Investment Company Act file number 811-05349
Goldman Sachs Trust
(Exact name of registrant as specified in charter)
71 South Wacker Drive,
Chicago, Illinois 60606
(Address of principal executive offices) (Zip code)
Copies to:
| | |
Robert Griffith, Esq. Goldman Sachs & Co. LLC 200 West Street New York, NY 10282 | | Stephen H. Bier, Esq. Dechert LLP 1095 Avenue of the Americas New York, NY 10036 |
(Name and address of agents for service)
Registrant’s telephone number, including area code: (312) 655-4400
Date of fiscal year end: October 31
Date of reporting period: October 31, 2024
| ITEM 1. | REPORTS TO STOCKHOLDERS. |
The Annual Report to Shareholders for the Goldman Sachs Income Builder Fund and Goldman Sachs Rising Dividend Growth Fund is filed herewith.
Annual Shareholder Report
October 31, 2024
Goldman Sachs Income Builder Fund
This annual shareholder report contains important information about Goldman Sachs Income Builder Fund (the "Fund") for the period of November 1, 2023 to October 31, 2024. You can find additional information about the Fund at am.gs.com or dfinview.com/GoldmanSachs. You can also request this information by contacting us at 1-800-526-7384.
What were the Fund costs for the period?
Based on a hypothetical $10,000 investment.
| Class | Costs of a $10,000 investment | Costs paid as a percentage of a $10,000 investment |
|---|
| A | $87 | 0.79% |
How did the Fund perform and what affected its performance?
U.S. equity and fixed income markets were volatile but broadly generated gains as inflation eased and the Federal Reserve began cutting interest rates. Further boosting investor sentiment was optimism about an economic soft landing, favorable corporate earnings reports, improved equity market breadth and AI excitement.
Top Contributors to Performance:
The Fund benefited from its asset allocation positioning, with exposure to both U.S. equities and non-U.S. developed markets equities contributing positively. Exposure to MLP energy infrastructure securities and global infrastructure securities further added to returns. In fixed income, the Fund’s focus on high yield corporate bonds bolstered performance, as high yield corporate bonds broadly outpaced investment grade corporate bonds.
Within the equity sleeve, the Fund was aided by out-of-benchmark positions in Blackstone, a U.S. provider of investment and fund management services, and in Taiwan Semiconductor Manufacturing, a Taiwanese semiconductor foundry. An overweight in U.S. technology company Dell Technologies was also advantageous.
The fixed income sleeve was helped by its cross sector positioning, with investments in high yield corporate bonds, bank loans and investment grade corporate bonds adding to results. Exposure to lower quality credits also contributed positively. Within investment grade corporate bonds, an emphasis on intermediate-term maturities was positive as was selection among financial and industrial credits. The fixed income sleeve also benefited from our duration positioning strategy, as yields rose during the annual period.
Top Detractors from Performance:
The performance of the equity sleeve was hurt by its out-of-benchmark investments in Nestle, a Switzerland-based food and beverage company; Shell, a British oil and gas company; and Rio Tinto, a British-Australian metals and mining company.
Within the fixed income sleeve, individual issue selection among high yield industrial credits detracted slightly from returns.
Information Technology-SS & OW
Communication Service-SS & OW
Consumer Discretionary-SS & UW
The above represents sectors.
KEY
SS–Security Selection
OW–Overweight
UW–Underweight
Goldman Sachs Income Builder Fund
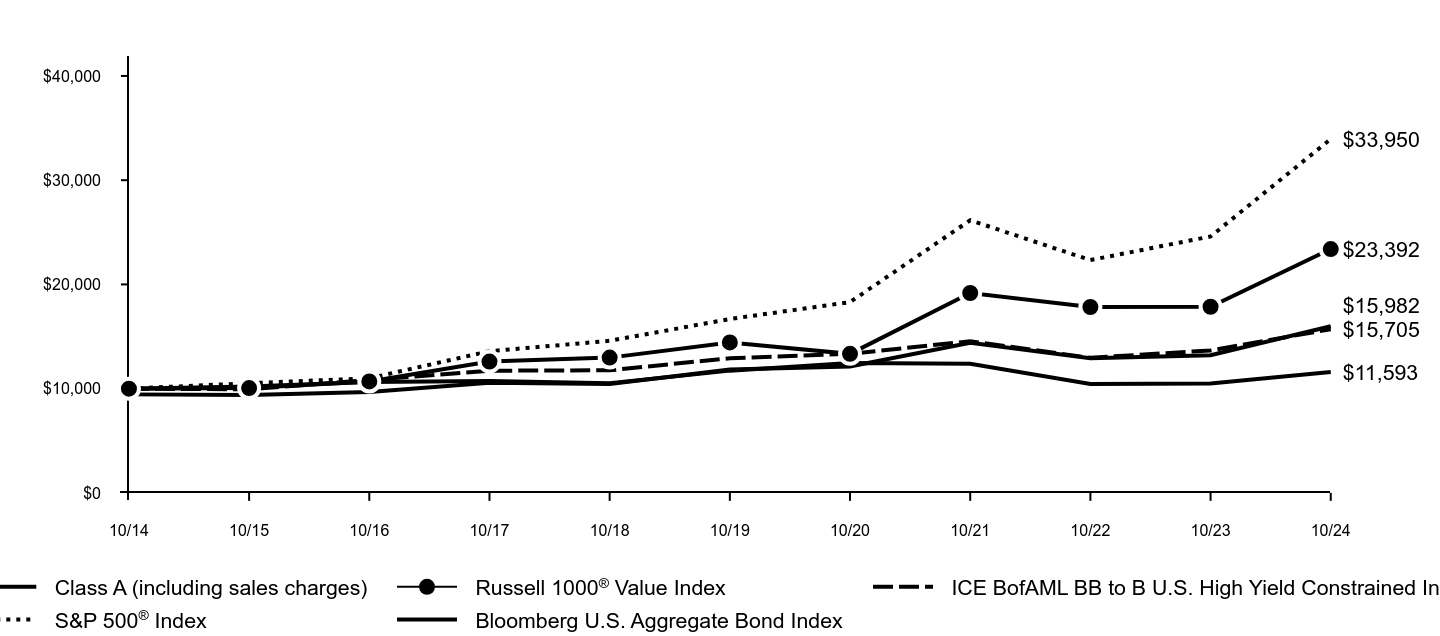
The following graph assumes an initial $10,000 investment in the Fund and compares the initial and subsequent account values at the end of each of the most recently completed 10 fiscal years of the Fund's share class (or less if the share class has been in operation for less than 10 years). The Fund's performance reflects applicable sales charges, if any. For comparative purposes, the performance of the Fund's benchmark and any additional performance benchmark(s) are also shown.
| Class A (including sales charges) | Russell 1000® Value Index | ICE BofAML BB to B U.S. High Yield Constrained Index | S&P 500® Index | Bloomberg U.S. Aggregate Bond Index |
|---|
| 10/14 | $9,450 | $10,000 | $10,000 | $10,000 | $10,000 |
| 10/15 | $9,384 | $10,053 | $9,940 | $10,520 | $10,196 |
| 10/16 | $9,669 | $10,693 | $10,827 | $10,994 | $10,642 |
| 10/17 | $10,560 | $12,595 | $11,721 | $13,593 | $10,737 |
| 10/18 | $10,451 | $12,977 | $11,760 | $14,591 | $10,517 |
| 10/19 | $11,845 | $14,432 | $12,918 | $16,681 | $11,728 |
| 10/20 | $12,117 | $13,340 | $13,343 | $18,301 | $12,454 |
| 10/21 | $14,408 | $19,178 | $14,551 | $26,155 | $12,394 |
| 10/22 | $12,918 | $17,836 | $12,960 | $22,334 | $10,451 |
| 10/23 | $13,215 | $17,860 | $13,664 | $24,599 | $10,488 |
| 10/24 | $15,982 | $23,392 | $15,705 | $33,950 | $11,593 |
Average Annual Total Returns (%)
| AATR | 1 Year | 5 Years | 10 Years |
|---|
| Class A excluding sales charges | 20.94% | 6.17% | 5.39% |
| Class A including sales charges | 14.30% | 4.97% | 4.80% |
Russell 1000® Value Index | 30.98% | 10.13% | 8.86% |
| ICE BofAML BB to B U.S. High Yield Constrained Index | 14.94% | 3.98% | 4.61% |
S&P 500® Index | 38.02% | 15.25% | 12.99% |
| Bloomberg U.S. Aggregate Bond Index | 10.55% | -0.23% | 1.49% |
Performance data quoted above represents past performance. Past performance does not guarantee future results.
The Fund’s investment return and principal value will fluctuate so that an investor’s shares, when redeemed, may be worth more or less than their original cost. Current performance may be lower or higher than the performance quoted above. Please visit our web site at: am.gs.com to obtain the most recent month-end returns. Performance reflects applicable fee waivers and/or expense limitations in effect during the periods shown and in their absence, performance would be reduced. The graph and table do not reflect the deduction of taxes that a shareholder would pay on Fund distributions or redemption of Fund shares. In accordance with changing regulatory requirements, the Fund is now required to compare its performance to a regulatory benchmark, which in this case is the Bloomberg U.S. Aggregate Bond Index.
Goldman Sachs Income Builder Fund
| Total Net Assets | $2,484,821,905 |
| # of Portfolio Holdings | 816 |
| Portfolio Turnover Rate | 30% |
| Total Net Advisory Fees Paid | $9,798,671 |
What did the Fund invest in?
The table below shows the investment makeup of the Fund, representing the percentage of total net assets of the Fund. Figures in the table below may not sum to 100% due to the exclusion of other assets and liabilities and may not represent the Fund’s market exposure due to the exclusion of certain derivatives, if any. These allocations may not be representative of the Fund’s future investments.
| Banks | 8.5% |
| Pipelines | 4.4% |
| Insurance | 3.4% |
| Software | 3.3% |
| Media | 3.1% |
| Oil Field Services | 3.1% |
| Pharmaceuticals | 2.8% |
| Diversified Financial Services | 2.7% |
| Oil, Gas & Consumable Fuels | 2.4% |
| Other | 64.1% |
Goldman Sachs Income Builder Fund
If you wish to view additional information about the Fund, including the documents and other information listed below, please visit dfinview.com/GoldmanSachs or call 1-800-526-7384.
prospectus
financial information
fund holdings
proxy voting information
Goldman Sachs & Co. LLC is the distributor of the Goldman Sachs Funds.
London Stock Exchange Group plc and its group undertakings (collectively, the “LSE Group”). © LSE Group 2024. FTSE Russell is a trading name of certain of the LSE Group companies. “FTSE®” “Russell®”, “FTSE Russell®”, is/are trade mark(s) of the relevant LSE Group companies and is/are used by any other LSE Group company under license. All rights in the FTSE Russell indexes or data vest in the relevant LSE Group company which owns the index or the data. Neither LSE Group nor its licensors accept any liability for any errors or omissions in the indexes or data and no party may rely on any indexes or data contained in this communication. No further distribution of data from the LSE Group is permitted without the relevant LSE Group company’s express written consent. The LSE Group does not promote, sponsor or endorse the content of this communication. ICE Data Indices, LLC (“ICE DATA”) is used with permission. ICE DATA, ITS AFFILIATES AND THEIR RESPECTIVE THIRD PARTY SUPPLIERS DISCLAIM ANY AND ALL WARRANTIES, REPRESENTATIONS, EXPRESS AND/OR IMPLIED INCLUDING ANY WARRANTIES OF MERCHANTABILITY OR FITNESS FOR A PARTICULAR PURPOSE OR USE, INCLUDING THE INDICES, INDEX DATA AND ANY DATA INCLUDED IN, RELATED TO, OR DERIVED THEREFROM. NEITHER ICE DATA, ITS AFFILIATES NOR THEIR RESPECTIVE THIRD PARTY SUPPLIERS SHALL BE SUBJECT TO ANY DAMAGES OR LIABILITY WITH RESPECT TO THE ADEQUACY, ACCURACY, TIMELINESS OR COMPLETENESS OF THE INDICES OR THE INDEX DATA OR ANY COMPONENT THEREOF, AND THE INDICES AND INDEX DATA AND ALL COMPONENTS THEREOF ARE PROVIDED ON AN “AS IS” BASIS AND YOUR USE IS AT YOUR OWN RISK. ICE DATA, ITS AFFILIATES AND THEIR RESPECTIVE THIRD PARTY SUPPLIERS DO NOT SPONSOR, ENDORSE, OR RECOMMEND GOLDMAN SACHS, OR ANY OF ITS PRODUCTS OR SERVICES.
Bloomberg Index Services Limited. BLOOMBERG® is a trademark and service mark of Bloomberg Finance LP. And its affiliates (collectively “Bloomberg”). Bloomberg or Bloomberg’s licensors own all proprietary rights in the Bloomberg Indices. Neither Bloomberg nor Bloomberg’s licensors approves or endorses this material, or guarantees the accuracy or completeness of any information herein, or makes any warranty, express or implied, as to the results to be obtained therefrom and, to the maximum extent allowed by law, neither shall have any liability or responsibility for injury or damages arising in connection therewith.
The Global Industry Classification Standard (GICS) was developed by and is the exclusive property and a service mark of Morgan Stanley Capital International Inc. (MSCI) and Standard & Poor’s, a division of The McGraw-Hill Companies, Inc. (S&P) and is licensed for use by Goldman Sachs. Neither MSCI, S&P nor any other party involved in making or compiling the GICS or any GICS classifications makes any express or implied warranties or representations with respect to such standard or classification (or the results to be obtained by the use thereof), and all such parties hereby expressly disclaim all warranties of originality, accuracy, completeness, merchantability or fitness for a particular purpose with respect to any of such standard or classification. Without limiting any of the foregoing, in no event shall MSCI, S&P, any of their affiliates or any third party involved in making or compiling the GICS or any GICS classifications have any liability for any direct, indirect, special, punitive, consequential or any other damages (including lost profits) even if notified of the possibility of such damages.
© 2024 Goldman Sachs. All rights reserved.
No Bank Guarantee
May Lose Value
Not FDIC Insured
Goldman Sachs Income Builder Fund
Annual Shareholder Report
October 31, 2024
Goldman Sachs Income Builder Fund
This annual shareholder report contains important information about Goldman Sachs Income Builder Fund (the "Fund") for the period of November 1, 2023 to October 31, 2024. You can find additional information about the Fund at am.gs.com or dfinview.com/GoldmanSachs. You can also request this information by contacting us at 1-800-526-7384.
What were the Fund costs for the period?
Based on a hypothetical $10,000 investment.
| Class | Costs of a $10,000 investment | Costs paid as a percentage of a $10,000 investment |
|---|
| C | $169 | 1.54% |
How did the Fund perform and what affected its performance?
U.S. equity and fixed income markets were volatile but broadly generated gains as inflation eased and the Federal Reserve began cutting interest rates. Further boosting investor sentiment was optimism about an economic soft landing, favorable corporate earnings reports, improved equity market breadth and AI excitement.
Top Contributors to Performance:
The Fund benefited from its asset allocation positioning, with exposure to both U.S. equities and non-U.S. developed markets equities contributing positively. Exposure to MLP energy infrastructure securities and global infrastructure securities further added to returns. In fixed income, the Fund’s focus on high yield corporate bonds bolstered performance, as high yield corporate bonds broadly outpaced investment grade corporate bonds.
Within the equity sleeve, the Fund was aided by out-of-benchmark positions in Blackstone, a U.S. provider of investment and fund management services, and in Taiwan Semiconductor Manufacturing, a Taiwanese semiconductor foundry. An overweight in U.S. technology company Dell Technologies was also advantageous.
The fixed income sleeve was helped by its cross sector positioning, with investments in high yield corporate bonds, bank loans and investment grade corporate bonds adding to results. Exposure to lower quality credits also contributed positively. Within investment grade corporate bonds, an emphasis on intermediate-term maturities was positive as was selection among financial and industrial credits. The fixed income sleeve also benefited from our duration positioning strategy, as yields rose during the annual period.
Top Detractors from Performance:
The performance of the equity sleeve was hurt by its out-of-benchmark investments in Nestle, a Switzerland-based food and beverage company; Shell, a British oil and gas company; and Rio Tinto, a British-Australian metals and mining company.
Within the fixed income sleeve, individual issue selection among high yield industrial credits detracted slightly from returns.
Information Technology-SS & OW
Communication Service-SS & OW
Consumer Discretionary-SS & UW
The above represents sectors.
KEY
SS–Security Selection
OW–Overweight
UW–Underweight
Goldman Sachs Income Builder Fund
The following graph assumes an initial $10,000 investment in the Fund and compares the initial and subsequent account values at the end of each of the most recently completed 10 fiscal years of the Fund's share class (or less if the share class has been in operation for less than 10 years). The Fund's performance reflects applicable sales charges, if any. For comparative purposes, the performance of the Fund's benchmark and any additional performance benchmark(s) are also shown.
| Class C (including sales charges) | Russell 1000® Value Index | ICE BofAML BB to B U.S. High Yield Constrained Index | S&P 500® Index | Bloomberg U.S. Aggregate Bond Index |
|---|
| 10/14 | $9,900 | $10,000 | $10,000 | $10,000 | $10,000 |
| 10/15 | $9,757 | $10,053 | $9,940 | $10,520 | $10,196 |
| 10/16 | $9,977 | $10,693 | $10,827 | $10,994 | $10,642 |
| 10/17 | $10,816 | $12,595 | $11,721 | $13,593 | $10,737 |
| 10/18 | $10,628 | $12,977 | $11,760 | $14,591 | $10,517 |
| 10/19 | $11,950 | $14,432 | $12,918 | $16,681 | $11,728 |
| 10/20 | $12,138 | $13,340 | $13,343 | $18,301 | $12,454 |
| 10/21 | $14,324 | $19,178 | $14,551 | $26,155 | $12,394 |
| 10/22 | $12,749 | $17,836 | $12,960 | $22,334 | $10,451 |
| 10/23 | $12,943 | $17,860 | $13,664 | $24,599 | $10,488 |
| 10/24 | $15,532 | $23,392 | $15,705 | $33,950 | $11,595 |
Average Annual Total Returns (%)
| AATR | 1 Year | 5 Years | 10 Years |
|---|
| Class C excluding sales charges | 20.00% | 5.38% | 4.60% |
| Class C including sales charges | 18.96% | 5.38% | 4.60% |
Russell 1000® Value Index | 30.98% | 10.13% | 8.86% |
| ICE BofAML BB to B U.S. High Yield Constrained Index | 14.94% | 3.98% | 4.61% |
S&P 500® Index | 38.02% | 15.25% | 12.99% |
| Bloomberg U.S. Aggregate Bond Index | 10.55% | -0.23% | 1.49% |
Performance data quoted above represents past performance. Past performance does not guarantee future results.
The Fund’s investment return and principal value will fluctuate so that an investor’s shares, when redeemed, may be worth more or less than their original cost. Current performance may be lower or higher than the performance quoted above. Please visit our web site at: am.gs.com to obtain the most recent month-end returns. Performance reflects applicable fee waivers and/or expense limitations in effect during the periods shown and in their absence, performance would be reduced. The graph and table do not reflect the deduction of taxes that a shareholder would pay on Fund distributions or redemption of Fund shares. In accordance with changing regulatory requirements, the Fund is now required to compare its performance to a regulatory benchmark, which in this case is the Bloomberg U.S. Aggregate Bond Index.
Goldman Sachs Income Builder Fund
| Total Net Assets | $2,484,821,905 |
| # of Portfolio Holdings | 816 |
| Portfolio Turnover Rate | 30% |
| Total Net Advisory Fees Paid | $9,798,671 |
What did the Fund invest in?
The table below shows the investment makeup of the Fund, representing the percentage of total net assets of the Fund. Figures in the table below may not sum to 100% due to the exclusion of other assets and liabilities and may not represent the Fund’s market exposure due to the exclusion of certain derivatives, if any. These allocations may not be representative of the Fund’s future investments.
| Banks | 8.5% |
| Pipelines | 4.4% |
| Insurance | 3.4% |
| Software | 3.3% |
| Media | 3.1% |
| Oil Field Services | 3.1% |
| Pharmaceuticals | 2.8% |
| Diversified Financial Services | 2.7% |
| Oil, Gas & Consumable Fuels | 2.4% |
| Other | 64.1% |
Goldman Sachs Income Builder Fund
If you wish to view additional information about the Fund, including the documents and other information listed below, please visit dfinview.com/GoldmanSachs or call 1-800-526-7384.
prospectus
financial information
fund holdings
proxy voting information
Goldman Sachs & Co. LLC is the distributor of the Goldman Sachs Funds.
London Stock Exchange Group plc and its group undertakings (collectively, the “LSE Group”). © LSE Group 2024. FTSE Russell is a trading name of certain of the LSE Group companies. “FTSE®” “Russell®”, “FTSE Russell®”, is/are trade mark(s) of the relevant LSE Group companies and is/are used by any other LSE Group company under license. All rights in the FTSE Russell indexes or data vest in the relevant LSE Group company which owns the index or the data. Neither LSE Group nor its licensors accept any liability for any errors or omissions in the indexes or data and no party may rely on any indexes or data contained in this communication. No further distribution of data from the LSE Group is permitted without the relevant LSE Group company’s express written consent. The LSE Group does not promote, sponsor or endorse the content of this communication. ICE Data Indices, LLC (“ICE DATA”) is used with permission. ICE DATA, ITS AFFILIATES AND THEIR RESPECTIVE THIRD PARTY SUPPLIERS DISCLAIM ANY AND ALL WARRANTIES, REPRESENTATIONS, EXPRESS AND/OR IMPLIED INCLUDING ANY WARRANTIES OF MERCHANTABILITY OR FITNESS FOR A PARTICULAR PURPOSE OR USE, INCLUDING THE INDICES, INDEX DATA AND ANY DATA INCLUDED IN, RELATED TO, OR DERIVED THEREFROM. NEITHER ICE DATA, ITS AFFILIATES NOR THEIR RESPECTIVE THIRD PARTY SUPPLIERS SHALL BE SUBJECT TO ANY DAMAGES OR LIABILITY WITH RESPECT TO THE ADEQUACY, ACCURACY, TIMELINESS OR COMPLETENESS OF THE INDICES OR THE INDEX DATA OR ANY COMPONENT THEREOF, AND THE INDICES AND INDEX DATA AND ALL COMPONENTS THEREOF ARE PROVIDED ON AN “AS IS” BASIS AND YOUR USE IS AT YOUR OWN RISK. ICE DATA, ITS AFFILIATES AND THEIR RESPECTIVE THIRD PARTY SUPPLIERS DO NOT SPONSOR, ENDORSE, OR RECOMMEND GOLDMAN SACHS, OR ANY OF ITS PRODUCTS OR SERVICES.
Bloomberg Index Services Limited. BLOOMBERG® is a trademark and service mark of Bloomberg Finance LP. And its affiliates (collectively “Bloomberg”). Bloomberg or Bloomberg’s licensors own all proprietary rights in the Bloomberg Indices. Neither Bloomberg nor Bloomberg’s licensors approves or endorses this material, or guarantees the accuracy or completeness of any information herein, or makes any warranty, express or implied, as to the results to be obtained therefrom and, to the maximum extent allowed by law, neither shall have any liability or responsibility for injury or damages arising in connection therewith.
The Global Industry Classification Standard (GICS) was developed by and is the exclusive property and a service mark of Morgan Stanley Capital International Inc. (MSCI) and Standard & Poor’s, a division of The McGraw-Hill Companies, Inc. (S&P) and is licensed for use by Goldman Sachs. Neither MSCI, S&P nor any other party involved in making or compiling the GICS or any GICS classifications makes any express or implied warranties or representations with respect to such standard or classification (or the results to be obtained by the use thereof), and all such parties hereby expressly disclaim all warranties of originality, accuracy, completeness, merchantability or fitness for a particular purpose with respect to any of such standard or classification. Without limiting any of the foregoing, in no event shall MSCI, S&P, any of their affiliates or any third party involved in making or compiling the GICS or any GICS classifications have any liability for any direct, indirect, special, punitive, consequential or any other damages (including lost profits) even if notified of the possibility of such damages.
© 2024 Goldman Sachs. All rights reserved.
No Bank Guarantee
May Lose Value
Not FDIC Insured
Goldman Sachs Income Builder Fund
Annual Shareholder Report
October 31, 2024
Goldman Sachs Income Builder Fund
This annual shareholder report contains important information about Goldman Sachs Income Builder Fund (the "Fund") for the period of November 1, 2023 to October 31, 2024. You can find additional information about the Fund at am.gs.com or dfinview.com/GoldmanSachs. You can also request this information by contacting us at 1-800-621-2550.
What were the Fund costs for the period?
Based on a hypothetical $10,000 investment.
| Class | Costs of a $10,000 investment | Costs paid as a percentage of a $10,000 investment |
|---|
| P | $50 | 0.45% |
How did the Fund perform and what affected its performance?
U.S. equity and fixed income markets were volatile but broadly generated gains as inflation eased and the Federal Reserve began cutting interest rates. Further boosting investor sentiment was optimism about an economic soft landing, favorable corporate earnings reports, improved equity market breadth and AI excitement.
Top Contributors to Performance:
The Fund benefited from its asset allocation positioning, with exposure to both U.S. equities and non-U.S. developed markets equities contributing positively. Exposure to MLP energy infrastructure securities and global infrastructure securities further added to returns. In fixed income, the Fund’s focus on high yield corporate bonds bolstered performance, as high yield corporate bonds broadly outpaced investment grade corporate bonds.
Within the equity sleeve, the Fund was aided by out-of-benchmark positions in Blackstone, a U.S. provider of investment and fund management services, and in Taiwan Semiconductor Manufacturing, a Taiwanese semiconductor foundry. An overweight in U.S. technology company Dell Technologies was also advantageous.
The fixed income sleeve was helped by its cross sector positioning, with investments in high yield corporate bonds, bank loans and investment grade corporate bonds adding to results. Exposure to lower quality credits also contributed positively. Within investment grade corporate bonds, an emphasis on intermediate-term maturities was positive as was selection among financial and industrial credits. The fixed income sleeve also benefited from our duration positioning strategy, as yields rose during the annual period.
Top Detractors from Performance:
The performance of the equity sleeve was hurt by its out-of-benchmark investments in Nestle, a Switzerland-based food and beverage company; Shell, a British oil and gas company; and Rio Tinto, a British-Australian metals and mining company.
Within the fixed income sleeve, individual issue selection among high yield industrial credits detracted slightly from returns.
Information Technology-SS & OW
Communication Service-SS & OW
Consumer Discretionary-SS & UW
The above represents sectors.
KEY
SS–Security Selection
OW–Overweight
UW–Underweight
Goldman Sachs Income Builder Fund
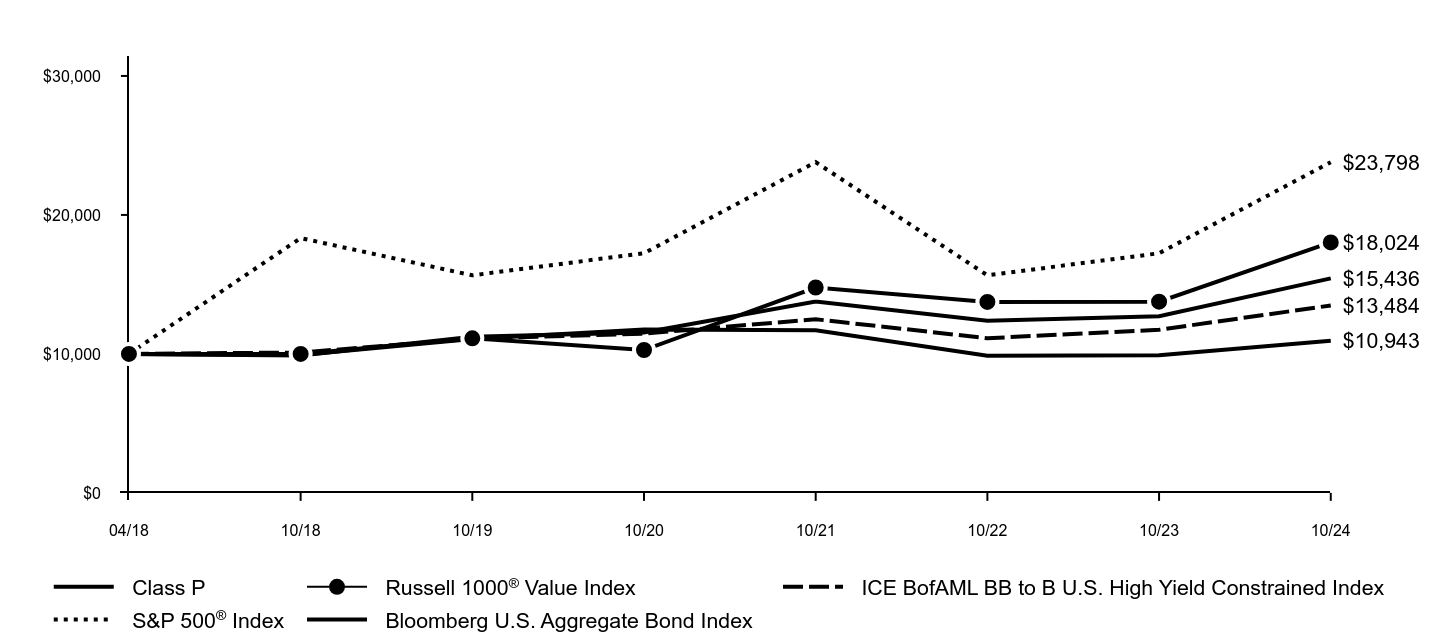
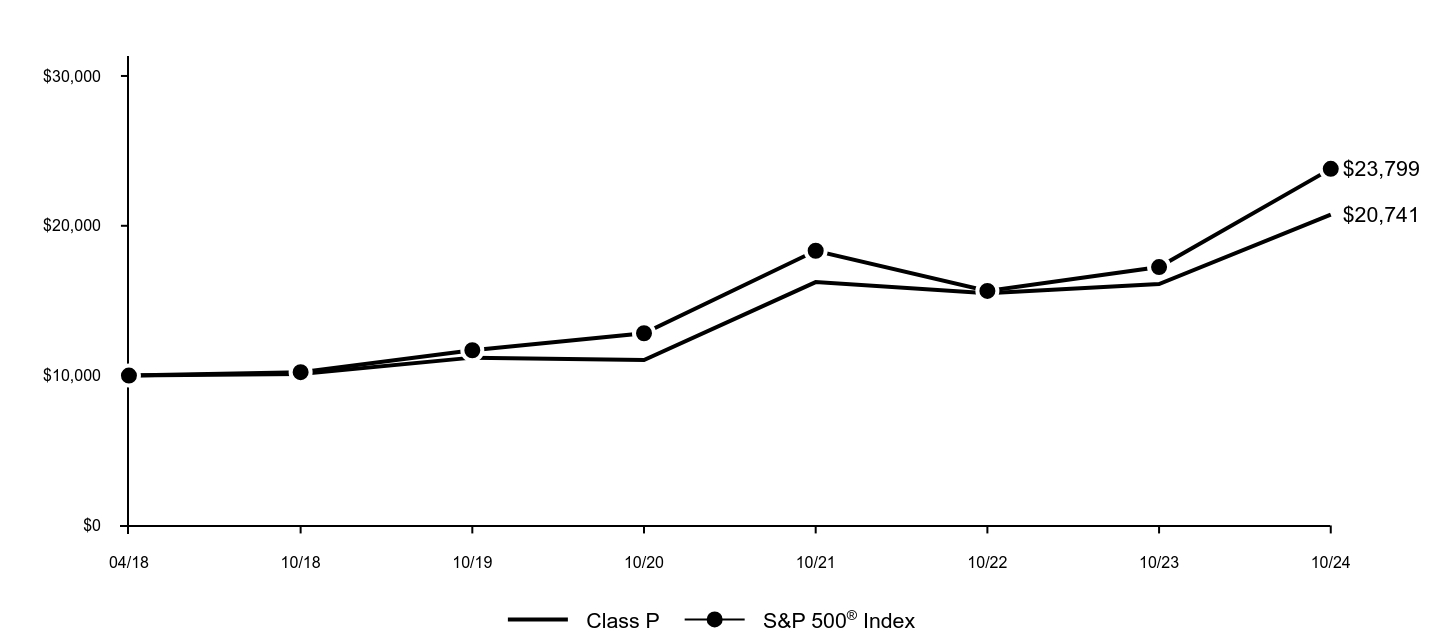
The following graph assumes an initial $10,000 investment in the Fund and compares the initial and subsequent account values at the end of each of the most recently completed 10 fiscal years of the Fund's share class (or less if the share class has been in operation for less than 10 years). The Fund's performance reflects applicable sales charges, if any. For comparative purposes, the performance of the Fund's benchmark and any additional performance benchmark(s) are also shown.
| Class P | Russell 1000® Value Index | ICE BofAML BB to B U.S. High Yield Constrained Index | S&P 500® Index | Bloomberg U.S. Aggregate Bond Index |
|---|
| 04/18 | $10,000 | $10,000 | $10,000 | $10,000 | $10,000 |
| 10/18 | $9,882 | $9,999 | $10,098 | $18,334 | $9,927 |
| 10/19 | $11,243 | $11,120 | $11,091 | $15,655 | $11,070 |
| 10/20 | $11,546 | $10,279 | $11,457 | $17,243 | $11,755 |
| 10/21 | $13,776 | $14,777 | $12,494 | $23,798 | $11,698 |
| 10/22 | $12,391 | $13,743 | $11,128 | $15,655 | $9,864 |
| 10/23 | $12,716 | $13,761 | $11,732 | $17,243 | $9,900 |
| 10/24 | $15,436 | $18,024 | $13,484 | $23,798 | $10,943 |
Average Annual Total Returns (%)
| AATR | 1 Year | 5 Years | Since Inception 4/16/18 |
|---|
| Class P | 21.39% | 6.54% | 6.85% |
Russell 1000® Value Index | 30.98% | 10.13% | 9.94% |
| ICE BofAML BB to B U.S. High Yield Constrained Index | 14.94% | 3.98% | 4.67% |
S&P 500® Index | 38.02% | 15.25% | 14.15% |
| Bloomberg U.S. Aggregate Bond Index | 10.55% | -0.23% | 1.38% |
Performance data quoted above represents past performance. Past performance does not guarantee future results.
The Fund’s investment return and principal value will fluctuate so that an investor’s shares, when redeemed, may be worth more or less than their original cost. Current performance may be lower or higher than the performance quoted above. Please visit our web site at: am.gs.com to obtain the most recent month-end returns. Performance reflects applicable fee waivers and/or expense limitations in effect during the periods shown and in their absence, performance would be reduced. The graph and table do not reflect the deduction of taxes that a shareholder would pay on Fund distributions or redemption of Fund shares. In accordance with changing regulatory requirements, the Fund is now required to compare its performance to a regulatory benchmark, which in this case is the Bloomberg U.S. Aggregate Bond Index.
Goldman Sachs Income Builder Fund
| Total Net Assets | $2,484,821,905 |
| # of Portfolio Holdings | 816 |
| Portfolio Turnover Rate | 30% |
| Total Net Advisory Fees Paid | $9,798,671 |
What did the Fund invest in?
The table below shows the investment makeup of the Fund, representing the percentage of total net assets of the Fund. Figures in the table below may not sum to 100% due to the exclusion of other assets and liabilities and may not represent the Fund’s market exposure due to the exclusion of certain derivatives, if any. These allocations may not be representative of the Fund’s future investments.
| Banks | 8.5% |
| Pipelines | 4.4% |
| Insurance | 3.4% |
| Software | 3.3% |
| Media | 3.1% |
| Oil Field Services | 3.1% |
| Pharmaceuticals | 2.8% |
| Diversified Financial Services | 2.7% |
| Oil, Gas & Consumable Fuels | 2.4% |
| Other | 64.1% |
Goldman Sachs Income Builder Fund
If you wish to view additional information about the Fund, including the documents and other information listed below, please visit dfinview.com/GoldmanSachs or call 1-800-621-2550.
prospectus
financial information
fund holdings
proxy voting information
Goldman Sachs & Co. LLC is the distributor of the Goldman Sachs Funds.
London Stock Exchange Group plc and its group undertakings (collectively, the “LSE Group”). © LSE Group 2024. FTSE Russell is a trading name of certain of the LSE Group companies. “FTSE®” “Russell®”, “FTSE Russell®”, is/are trade mark(s) of the relevant LSE Group companies and is/are used by any other LSE Group company under license. All rights in the FTSE Russell indexes or data vest in the relevant LSE Group company which owns the index or the data. Neither LSE Group nor its licensors accept any liability for any errors or omissions in the indexes or data and no party may rely on any indexes or data contained in this communication. No further distribution of data from the LSE Group is permitted without the relevant LSE Group company’s express written consent. The LSE Group does not promote, sponsor or endorse the content of this communication. ICE Data Indices, LLC (“ICE DATA”) is used with permission. ICE DATA, ITS AFFILIATES AND THEIR RESPECTIVE THIRD PARTY SUPPLIERS DISCLAIM ANY AND ALL WARRANTIES, REPRESENTATIONS, EXPRESS AND/OR IMPLIED INCLUDING ANY WARRANTIES OF MERCHANTABILITY OR FITNESS FOR A PARTICULAR PURPOSE OR USE, INCLUDING THE INDICES, INDEX DATA AND ANY DATA INCLUDED IN, RELATED TO, OR DERIVED THEREFROM. NEITHER ICE DATA, ITS AFFILIATES NOR THEIR RESPECTIVE THIRD PARTY SUPPLIERS SHALL BE SUBJECT TO ANY DAMAGES OR LIABILITY WITH RESPECT TO THE ADEQUACY, ACCURACY, TIMELINESS OR COMPLETENESS OF THE INDICES OR THE INDEX DATA OR ANY COMPONENT THEREOF, AND THE INDICES AND INDEX DATA AND ALL COMPONENTS THEREOF ARE PROVIDED ON AN “AS IS” BASIS AND YOUR USE IS AT YOUR OWN RISK. ICE DATA, ITS AFFILIATES AND THEIR RESPECTIVE THIRD PARTY SUPPLIERS DO NOT SPONSOR, ENDORSE, OR RECOMMEND GOLDMAN SACHS, OR ANY OF ITS PRODUCTS OR SERVICES.
Bloomberg Index Services Limited. BLOOMBERG® is a trademark and service mark of Bloomberg Finance LP. And its affiliates (collectively “Bloomberg”). Bloomberg or Bloomberg’s licensors own all proprietary rights in the Bloomberg Indices. Neither Bloomberg nor Bloomberg’s licensors approves or endorses this material, or guarantees the accuracy or completeness of any information herein, or makes any warranty, express or implied, as to the results to be obtained therefrom and, to the maximum extent allowed by law, neither shall have any liability or responsibility for injury or damages arising in connection therewith.
The Global Industry Classification Standard (GICS) was developed by and is the exclusive property and a service mark of Morgan Stanley Capital International Inc. (MSCI) and Standard & Poor’s, a division of The McGraw-Hill Companies, Inc. (S&P) and is licensed for use by Goldman Sachs. Neither MSCI, S&P nor any other party involved in making or compiling the GICS or any GICS classifications makes any express or implied warranties or representations with respect to such standard or classification (or the results to be obtained by the use thereof), and all such parties hereby expressly disclaim all warranties of originality, accuracy, completeness, merchantability or fitness for a particular purpose with respect to any of such standard or classification. Without limiting any of the foregoing, in no event shall MSCI, S&P, any of their affiliates or any third party involved in making or compiling the GICS or any GICS classifications have any liability for any direct, indirect, special, punitive, consequential or any other damages (including lost profits) even if notified of the possibility of such damages.
© 2024 Goldman Sachs. All rights reserved.
No Bank Guarantee
May Lose Value
Not FDIC Insured
Goldman Sachs Income Builder Fund
Annual Shareholder Report
October 31, 2024
Goldman Sachs Income Builder Fund
This annual shareholder report contains important information about Goldman Sachs Income Builder Fund (the "Fund") for the period of November 1, 2023 to October 31, 2024. You can find additional information about the Fund at am.gs.com or dfinview.com/GoldmanSachs. You can also request this information by contacting us at 1-800-621-2550.
What were the Fund costs for the period?
Based on a hypothetical $10,000 investment.
| Class | Costs of a $10,000 investment | Costs paid as a percentage of a $10,000 investment |
|---|
| R6 | $50 | 0.45% |
How did the Fund perform and what affected its performance?
U.S. equity and fixed income markets were volatile but broadly generated gains as inflation eased and the Federal Reserve began cutting interest rates. Further boosting investor sentiment was optimism about an economic soft landing, favorable corporate earnings reports, improved equity market breadth and AI excitement.
Top Contributors to Performance:
The Fund benefited from its asset allocation positioning, with exposure to both U.S. equities and non-U.S. developed markets equities contributing positively. Exposure to MLP energy infrastructure securities and global infrastructure securities further added to returns. In fixed income, the Fund’s focus on high yield corporate bonds bolstered performance, as high yield corporate bonds broadly outpaced investment grade corporate bonds.
Within the equity sleeve, the Fund was aided by out-of-benchmark positions in Blackstone, a U.S. provider of investment and fund management services, and in Taiwan Semiconductor Manufacturing, a Taiwanese semiconductor foundry. An overweight in U.S. technology company Dell Technologies was also advantageous.
The fixed income sleeve was helped by its cross sector positioning, with investments in high yield corporate bonds, bank loans and investment grade corporate bonds adding to results. Exposure to lower quality credits also contributed positively. Within investment grade corporate bonds, an emphasis on intermediate-term maturities was positive as was selection among financial and industrial credits. The fixed income sleeve also benefited from our duration positioning strategy, as yields rose during the annual period.
Top Detractors from Performance:
The performance of the equity sleeve was hurt by its out-of-benchmark investments in Nestle, a Switzerland-based food and beverage company; Shell, a British oil and gas company; and Rio Tinto, a British-Australian metals and mining company.
Within the fixed income sleeve, individual issue selection among high yield industrial credits detracted slightly from returns.
Information Technology-SS & OW
Communication Service-SS & OW
Consumer Discretionary-SS & UW
The above represents sectors.
KEY
SS–Security Selection
OW–Overweight
UW–Underweight
Goldman Sachs Income Builder Fund
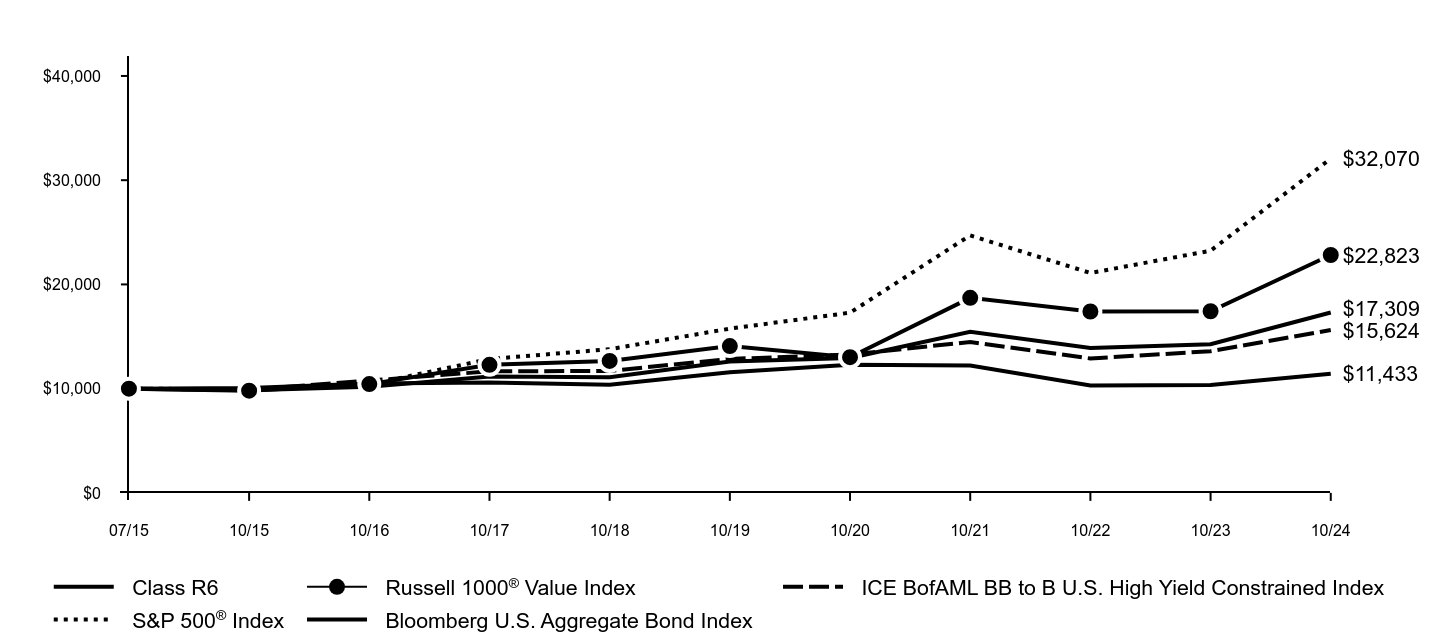
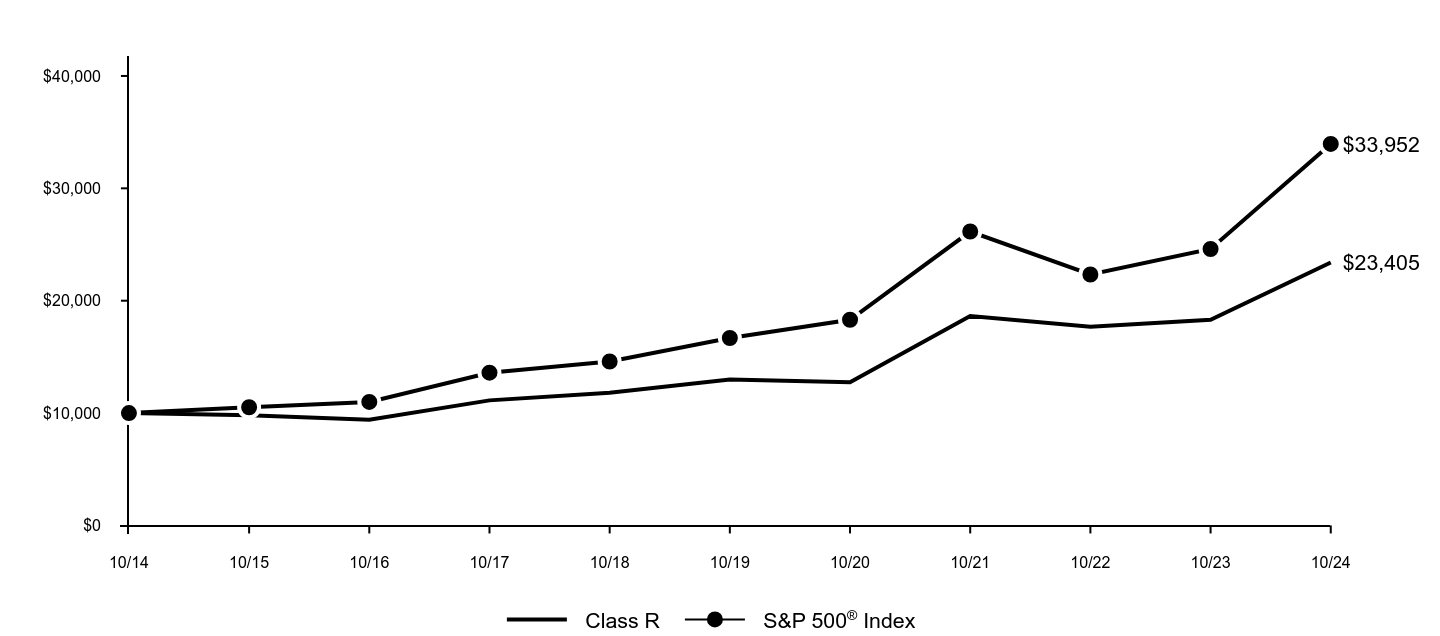
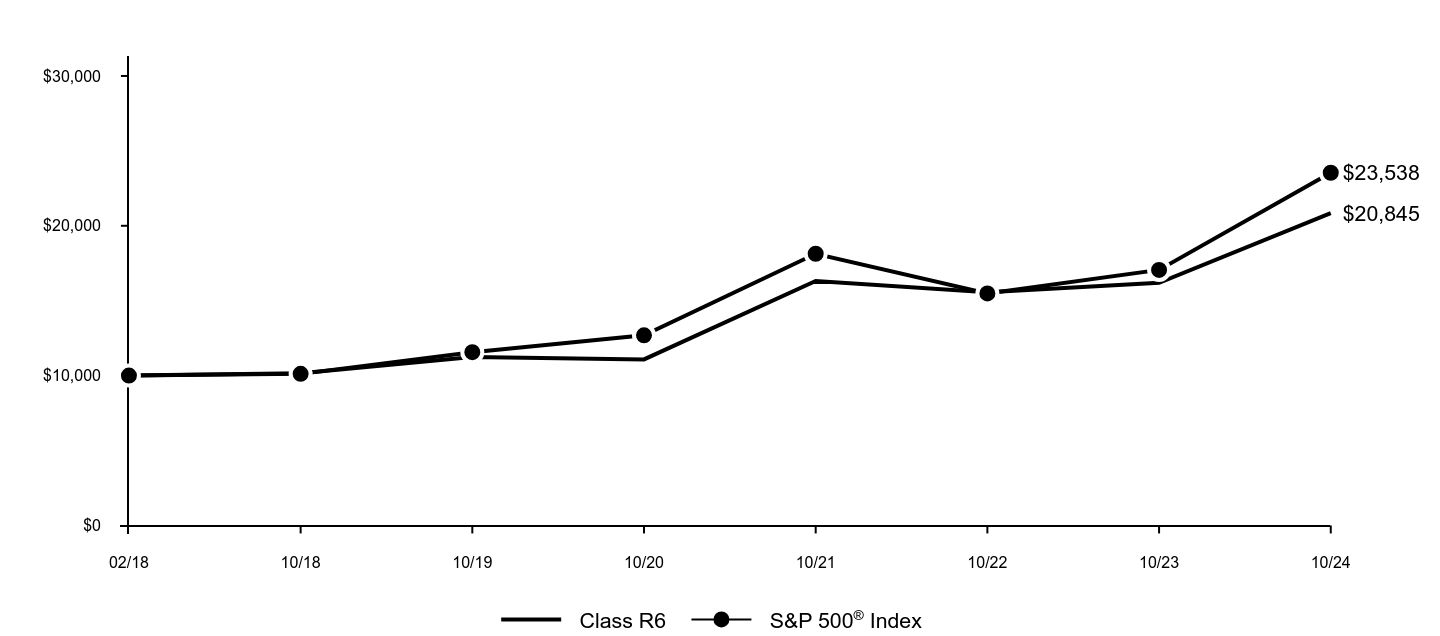
The following graph assumes an initial $10,000 investment in the Fund and compares the initial and subsequent account values at the end of each of the most recently completed 10 fiscal years of the Fund's share class (or less if the share class has been in operation for less than 10 years). The Fund's performance reflects applicable sales charges, if any. For comparative purposes, the performance of the Fund's benchmark and any additional performance benchmark(s) are also shown.
| Class R6 | Russell 1000® Value Index | ICE BofAML BB to B U.S. High Yield Constrained Index | S&P 500® Index | Bloomberg U.S. Aggregate Bond Index |
|---|
| 07/15 | $10,000 | $10,000 | $10,000 | $10,000 | $10,000 |
| 10/15 | $9,837 | $9,809 | $9,889 | $9,937 | $10,055 |
| 10/16 | $10,170 | $10,434 | $10,771 | $10,385 | $10,494 |
| 10/17 | $11,156 | $12,289 | $11,660 | $12,840 | $10,589 |
| 10/18 | $11,087 | $12,662 | $11,700 | $13,783 | $10,372 |
| 10/19 | $12,608 | $14,081 | $12,851 | $15,757 | $11,566 |
| 10/20 | $12,948 | $13,016 | $13,274 | $17,287 | $12,281 |
| 10/21 | $15,454 | $18,712 | $14,476 | $24,706 | $12,223 |
| 10/22 | $13,901 | $17,402 | $12,893 | $21,096 | $10,306 |
| 10/23 | $14,265 | $17,426 | $13,594 | $23,236 | $10,343 |
| 10/24 | $17,309 | $22,823 | $15,624 | $32,070 | $11,433 |
Average Annual Total Returns (%)
| AATR | 1 Year | 5 Years | Since Inception 7/31/15 |
|---|
| Class R6 | 21.34% | 6.54% | 6.10% |
Russell 1000® Value Index | 30.98% | 10.13% | 9.32% |
| ICE BofAML BB to B U.S. High Yield Constrained Index | 14.94% | 3.98% | 4.94% |
S&P 500® Index | 38.02% | 15.25% | 13.41% |
| Bloomberg U.S. Aggregate Bond Index | 10.55% | -0.23% | 1.46% |
Performance data quoted above represents past performance. Past performance does not guarantee future results.
The Fund’s investment return and principal value will fluctuate so that an investor’s shares, when redeemed, may be worth more or less than their original cost. Current performance may be lower or higher than the performance quoted above. Please visit our web site at: am.gs.com to obtain the most recent month-end returns. Performance reflects applicable fee waivers and/or expense limitations in effect during the periods shown and in their absence, performance would be reduced. The graph and table do not reflect the deduction of taxes that a shareholder would pay on Fund distributions or redemption of Fund shares. In accordance with changing regulatory requirements, the Fund is now required to compare its performance to a regulatory benchmark, which in this case is the Bloomberg U.S. Aggregate Bond Index.
Goldman Sachs Income Builder Fund
| Total Net Assets | $2,484,821,905 |
| # of Portfolio Holdings | 816 |
| Portfolio Turnover Rate | 30% |
| Total Net Advisory Fees Paid | $9,798,671 |
What did the Fund invest in?
The table below shows the investment makeup of the Fund, representing the percentage of total net assets of the Fund. Figures in the table below may not sum to 100% due to the exclusion of other assets and liabilities and may not represent the Fund’s market exposure due to the exclusion of certain derivatives, if any. These allocations may not be representative of the Fund’s future investments.
| Banks | 8.5% |
| Pipelines | 4.4% |
| Insurance | 3.4% |
| Software | 3.3% |
| Media | 3.1% |
| Oil Field Services | 3.1% |
| Pharmaceuticals | 2.8% |
| Diversified Financial Services | 2.7% |
| Oil, Gas & Consumable Fuels | 2.4% |
| Other | 64.1% |
Goldman Sachs Income Builder Fund
If you wish to view additional information about the Fund, including the documents and other information listed below, please visit dfinview.com/GoldmanSachs or call 1-800-621-2550.
prospectus
financial information
fund holdings
proxy voting information
Goldman Sachs & Co. LLC is the distributor of the Goldman Sachs Funds.
London Stock Exchange Group plc and its group undertakings (collectively, the “LSE Group”). © LSE Group 2024. FTSE Russell is a trading name of certain of the LSE Group companies. “FTSE®” “Russell®”, “FTSE Russell®”, is/are trade mark(s) of the relevant LSE Group companies and is/are used by any other LSE Group company under license. All rights in the FTSE Russell indexes or data vest in the relevant LSE Group company which owns the index or the data. Neither LSE Group nor its licensors accept any liability for any errors or omissions in the indexes or data and no party may rely on any indexes or data contained in this communication. No further distribution of data from the LSE Group is permitted without the relevant LSE Group company’s express written consent. The LSE Group does not promote, sponsor or endorse the content of this communication. ICE Data Indices, LLC (“ICE DATA”) is used with permission. ICE DATA, ITS AFFILIATES AND THEIR RESPECTIVE THIRD PARTY SUPPLIERS DISCLAIM ANY AND ALL WARRANTIES, REPRESENTATIONS, EXPRESS AND/OR IMPLIED INCLUDING ANY WARRANTIES OF MERCHANTABILITY OR FITNESS FOR A PARTICULAR PURPOSE OR USE, INCLUDING THE INDICES, INDEX DATA AND ANY DATA INCLUDED IN, RELATED TO, OR DERIVED THEREFROM. NEITHER ICE DATA, ITS AFFILIATES NOR THEIR RESPECTIVE THIRD PARTY SUPPLIERS SHALL BE SUBJECT TO ANY DAMAGES OR LIABILITY WITH RESPECT TO THE ADEQUACY, ACCURACY, TIMELINESS OR COMPLETENESS OF THE INDICES OR THE INDEX DATA OR ANY COMPONENT THEREOF, AND THE INDICES AND INDEX DATA AND ALL COMPONENTS THEREOF ARE PROVIDED ON AN “AS IS” BASIS AND YOUR USE IS AT YOUR OWN RISK. ICE DATA, ITS AFFILIATES AND THEIR RESPECTIVE THIRD PARTY SUPPLIERS DO NOT SPONSOR, ENDORSE, OR RECOMMEND GOLDMAN SACHS, OR ANY OF ITS PRODUCTS OR SERVICES.
Bloomberg Index Services Limited. BLOOMBERG® is a trademark and service mark of Bloomberg Finance LP. And its affiliates (collectively “Bloomberg”). Bloomberg or Bloomberg’s licensors own all proprietary rights in the Bloomberg Indices. Neither Bloomberg nor Bloomberg’s licensors approves or endorses this material, or guarantees the accuracy or completeness of any information herein, or makes any warranty, express or implied, as to the results to be obtained therefrom and, to the maximum extent allowed by law, neither shall have any liability or responsibility for injury or damages arising in connection therewith.
The Global Industry Classification Standard (GICS) was developed by and is the exclusive property and a service mark of Morgan Stanley Capital International Inc. (MSCI) and Standard & Poor’s, a division of The McGraw-Hill Companies, Inc. (S&P) and is licensed for use by Goldman Sachs. Neither MSCI, S&P nor any other party involved in making or compiling the GICS or any GICS classifications makes any express or implied warranties or representations with respect to such standard or classification (or the results to be obtained by the use thereof), and all such parties hereby expressly disclaim all warranties of originality, accuracy, completeness, merchantability or fitness for a particular purpose with respect to any of such standard or classification. Without limiting any of the foregoing, in no event shall MSCI, S&P, any of their affiliates or any third party involved in making or compiling the GICS or any GICS classifications have any liability for any direct, indirect, special, punitive, consequential or any other damages (including lost profits) even if notified of the possibility of such damages.
© 2024 Goldman Sachs. All rights reserved.
No Bank Guarantee
May Lose Value
Not FDIC Insured
Goldman Sachs Income Builder Fund
Annual Shareholder Report
October 31, 2024
Goldman Sachs Income Builder Fund
GSBIX: Institutional Class
This annual shareholder report contains important information about Goldman Sachs Income Builder Fund (the "Fund") for the period of November 1, 2023 to October 31, 2024. You can find additional information about the Fund at am.gs.com or dfinview.com/GoldmanSachs. You can also request this information by contacting us at 1-800-621-2550.
What were the Fund costs for the period?
Based on a hypothetical $10,000 investment.
| Class | Costs of a $10,000 investment | Costs paid as a percentage of a $10,000 investment |
|---|
| Institutional | $51 | 0.46% |
How did the Fund perform and what affected its performance?
U.S. equity and fixed income markets were volatile but broadly generated gains as inflation eased and the Federal Reserve began cutting interest rates. Further boosting investor sentiment was optimism about an economic soft landing, favorable corporate earnings reports, improved equity market breadth and AI excitement.
Top Contributors to Performance:
The Fund benefited from its asset allocation positioning, with exposure to both U.S. equities and non-U.S. developed markets equities contributing positively. Exposure to MLP energy infrastructure securities and global infrastructure securities further added to returns. In fixed income, the Fund’s focus on high yield corporate bonds bolstered performance, as high yield corporate bonds broadly outpaced investment grade corporate bonds.
Within the equity sleeve, the Fund was aided by out-of-benchmark positions in Blackstone, a U.S. provider of investment and fund management services, and in Taiwan Semiconductor Manufacturing, a Taiwanese semiconductor foundry. An overweight in U.S. technology company Dell Technologies was also advantageous.
The fixed income sleeve was helped by its cross sector positioning, with investments in high yield corporate bonds, bank loans and investment grade corporate bonds adding to results. Exposure to lower quality credits also contributed positively. Within investment grade corporate bonds, an emphasis on intermediate-term maturities was positive as was selection among financial and industrial credits. The fixed income sleeve also benefited from our duration positioning strategy, as yields rose during the annual period.
Top Detractors from Performance:
The performance of the equity sleeve was hurt by its out-of-benchmark investments in Nestle, a Switzerland-based food and beverage company; Shell, a British oil and gas company; and Rio Tinto, a British-Australian metals and mining company.
Within the fixed income sleeve, individual issue selection among high yield industrial credits detracted slightly from returns.
Information Technology-SS & OW
Communication Service-SS & OW
Consumer Discretionary-SS & UW
The above represents sectors.
KEY
SS–Security Selection
OW–Overweight
UW–Underweight
Goldman Sachs Income Builder Fund
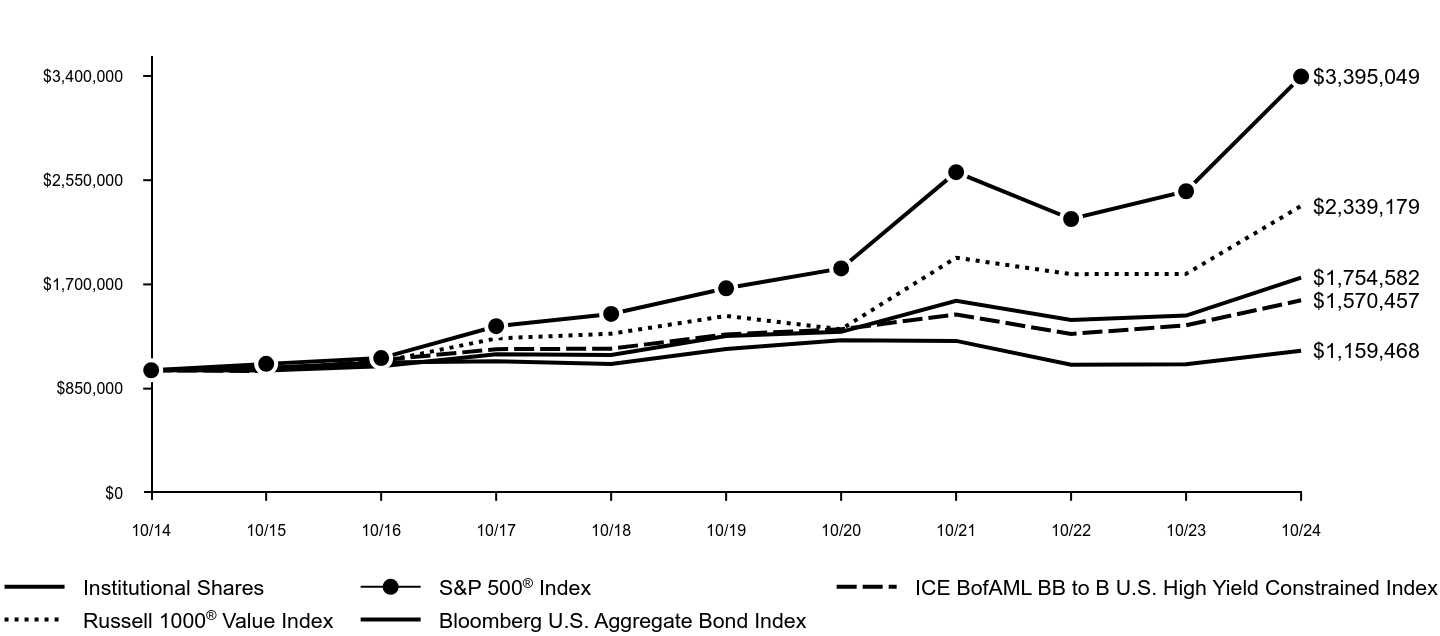
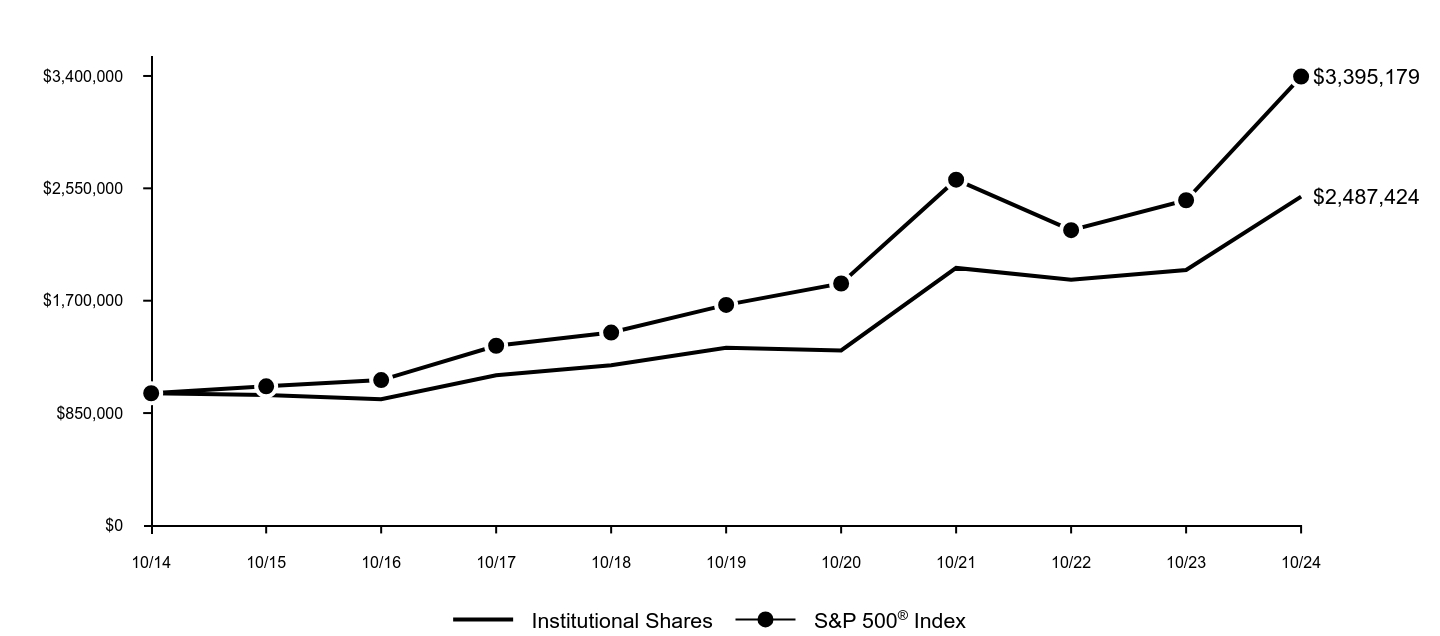
The following graph assumes an initial $1,000,000 investment in the Fund and compares the initial and subsequent account values at the end of each of the most recently completed 10 fiscal years of the Fund's share class (or less if the share class has been in operation for less than 10 years). The Fund's performance reflects applicable sales charges, if any. For comparative purposes, the performance of the Fund's benchmark and any additional performance benchmark(s) are also shown.
| Institutional Shares | S&P 500® Index | ICE BofAML BB to B U.S. High Yield Constrained Index | Russell 1000® Value Index | Bloomberg U.S. Aggregate Bond Index |
|---|
| 10/14 | $1,000,000 | $1,000,000 | $1,000,000 | $1,000,000 | $1,000,000 |
| 10/15 | $997,500 | $1,051,995 | $994,000 | $1,005,293 | $1,019,600 |
| 10/16 | $1,031,714 | $1,099,431 | $1,082,692 | $1,069,338 | $1,064,157 |
| 10/17 | $1,131,172 | $1,359,252 | $1,172,057 | $1,259,476 | $1,073,734 |
| 10/18 | $1,124,045 | $1,459,106 | $1,176,000 | $1,297,700 | $1,051,722 |
| 10/19 | $1,278,714 | $1,668,140 | $1,291,756 | $1,443,212 | $1,172,776 |
| 10/20 | $1,313,111 | $1,830,125 | $1,334,286 | $1,334,028 | $1,245,370 |
| 10/21 | $1,566,410 | $2,615,504 | $1,455,076 | $1,917,755 | $1,239,393 |
| 10/22 | $1,409,456 | $2,233,351 | $1,295,955 | $1,783,566 | $1,045,056 |
| 10/23 | $1,446,243 | $2,459,876 | $1,366,379 | $1,785,954 | $1,048,818 |
| 10/24 | $1,754,582 | $3,395,049 | $1,570,457 | $2,339,179 | $1,159,468 |
Average Annual Total Returns (%)
| AATR | 1 Year | 5 Years | 10 Years |
|---|
| Institutional Shares | 21.32% | 6.53% | 5.78% |
Russell 1000® Value Index | 30.98% | 10.13% | 8.86% |
| ICE BofAML BB to B U.S. High Yield Constrained Index | 14.94% | 3.98% | 4.61% |
S&P 500® Index | 38.02% | 15.25% | 12.99% |
| Bloomberg U.S. Aggregate Bond Index | 10.55% | -0.23% | 1.49% |
Performance data quoted above represents past performance. Past performance does not guarantee future results.
The Fund’s investment return and principal value will fluctuate so that an investor’s shares, when redeemed, may be worth more or less than their original cost. Current performance may be lower or higher than the performance quoted above. Please visit our web site at: am.gs.com to obtain the most recent month-end returns. Performance reflects applicable fee waivers and/or expense limitations in effect during the periods shown and in their absence, performance would be reduced. The graph and table do not reflect the deduction of taxes that a shareholder would pay on Fund distributions or redemption of Fund shares. In accordance with changing regulatory requirements, the Fund is now required to compare its performance to a regulatory benchmark, which in this case is the Bloomberg U.S. Aggregate Bond Index.
Goldman Sachs Income Builder Fund
| Total Net Assets | $2,484,821,905 |
| # of Portfolio Holdings | 816 |
| Portfolio Turnover Rate | 30% |
| Total Net Advisory Fees Paid | $9,798,671 |
What did the Fund invest in?
The table below shows the investment makeup of the Fund, representing the percentage of total net assets of the Fund. Figures in the table below may not sum to 100% due to the exclusion of other assets and liabilities and may not represent the Fund’s market exposure due to the exclusion of certain derivatives, if any. These allocations may not be representative of the Fund’s future investments.
| Banks | 8.5% |
| Pipelines | 4.4% |
| Insurance | 3.4% |
| Software | 3.3% |
| Media | 3.1% |
| Oil Field Services | 3.1% |
| Pharmaceuticals | 2.8% |
| Diversified Financial Services | 2.7% |
| Oil, Gas & Consumable Fuels | 2.4% |
| Other | 64.1% |
Goldman Sachs Income Builder Fund
If you wish to view additional information about the Fund, including the documents and other information listed below, please visit dfinview.com/GoldmanSachs or call 1-800-621-2550.
prospectus
financial information
fund holdings
proxy voting information
Goldman Sachs & Co. LLC is the distributor of the Goldman Sachs Funds.
London Stock Exchange Group plc and its group undertakings (collectively, the “LSE Group”). © LSE Group 2024. FTSE Russell is a trading name of certain of the LSE Group companies. “FTSE®” “Russell®”, “FTSE Russell®”, is/are trade mark(s) of the relevant LSE Group companies and is/are used by any other LSE Group company under license. All rights in the FTSE Russell indexes or data vest in the relevant LSE Group company which owns the index or the data. Neither LSE Group nor its licensors accept any liability for any errors or omissions in the indexes or data and no party may rely on any indexes or data contained in this communication. No further distribution of data from the LSE Group is permitted without the relevant LSE Group company’s express written consent. The LSE Group does not promote, sponsor or endorse the content of this communication. ICE Data Indices, LLC (“ICE DATA”) is used with permission. ICE DATA, ITS AFFILIATES AND THEIR RESPECTIVE THIRD PARTY SUPPLIERS DISCLAIM ANY AND ALL WARRANTIES, REPRESENTATIONS, EXPRESS AND/OR IMPLIED INCLUDING ANY WARRANTIES OF MERCHANTABILITY OR FITNESS FOR A PARTICULAR PURPOSE OR USE, INCLUDING THE INDICES, INDEX DATA AND ANY DATA INCLUDED IN, RELATED TO, OR DERIVED THEREFROM. NEITHER ICE DATA, ITS AFFILIATES NOR THEIR RESPECTIVE THIRD PARTY SUPPLIERS SHALL BE SUBJECT TO ANY DAMAGES OR LIABILITY WITH RESPECT TO THE ADEQUACY, ACCURACY, TIMELINESS OR COMPLETENESS OF THE INDICES OR THE INDEX DATA OR ANY COMPONENT THEREOF, AND THE INDICES AND INDEX DATA AND ALL COMPONENTS THEREOF ARE PROVIDED ON AN “AS IS” BASIS AND YOUR USE IS AT YOUR OWN RISK. ICE DATA, ITS AFFILIATES AND THEIR RESPECTIVE THIRD PARTY SUPPLIERS DO NOT SPONSOR, ENDORSE, OR RECOMMEND GOLDMAN SACHS, OR ANY OF ITS PRODUCTS OR SERVICES.
Bloomberg Index Services Limited. BLOOMBERG® is a trademark and service mark of Bloomberg Finance LP. And its affiliates (collectively “Bloomberg”). Bloomberg or Bloomberg’s licensors own all proprietary rights in the Bloomberg Indices. Neither Bloomberg nor Bloomberg’s licensors approves or endorses this material, or guarantees the accuracy or completeness of any information herein, or makes any warranty, express or implied, as to the results to be obtained therefrom and, to the maximum extent allowed by law, neither shall have any liability or responsibility for injury or damages arising in connection therewith.
The Global Industry Classification Standard (GICS) was developed by and is the exclusive property and a service mark of Morgan Stanley Capital International Inc. (MSCI) and Standard & Poor’s, a division of The McGraw-Hill Companies, Inc. (S&P) and is licensed for use by Goldman Sachs. Neither MSCI, S&P nor any other party involved in making or compiling the GICS or any GICS classifications makes any express or implied warranties or representations with respect to such standard or classification (or the results to be obtained by the use thereof), and all such parties hereby expressly disclaim all warranties of originality, accuracy, completeness, merchantability or fitness for a particular purpose with respect to any of such standard or classification. Without limiting any of the foregoing, in no event shall MSCI, S&P, any of their affiliates or any third party involved in making or compiling the GICS or any GICS classifications have any liability for any direct, indirect, special, punitive, consequential or any other damages (including lost profits) even if notified of the possibility of such damages.
© 2024 Goldman Sachs. All rights reserved.
No Bank Guarantee
May Lose Value
Not FDIC Insured
Goldman Sachs Income Builder Fund
Annual Shareholder Report
October 31, 2024
Goldman Sachs Income Builder Fund
This annual shareholder report contains important information about Goldman Sachs Income Builder Fund (the "Fund") for the period of November 1, 2023 to October 31, 2024. You can find additional information about the Fund at am.gs.com or dfinview.com/GoldmanSachs. You can also request this information by contacting us at 1-800-621-2550.
What were the Fund costs for the period?
Based on a hypothetical $10,000 investment.
| Class | Costs of a $10,000 investment | Costs paid as a percentage of a $10,000 investment |
|---|
| Investor | $60 | 0.54% |
How did the Fund perform and what affected its performance?
U.S. equity and fixed income markets were volatile but broadly generated gains as inflation eased and the Federal Reserve began cutting interest rates. Further boosting investor sentiment was optimism about an economic soft landing, favorable corporate earnings reports, improved equity market breadth and AI excitement.
Top Contributors to Performance:
The Fund benefited from its asset allocation positioning, with exposure to both U.S. equities and non-U.S. developed markets equities contributing positively. Exposure to MLP energy infrastructure securities and global infrastructure securities further added to returns. In fixed income, the Fund’s focus on high yield corporate bonds bolstered performance, as high yield corporate bonds broadly outpaced investment grade corporate bonds.
Within the equity sleeve, the Fund was aided by out-of-benchmark positions in Blackstone, a U.S. provider of investment and fund management services, and in Taiwan Semiconductor Manufacturing, a Taiwanese semiconductor foundry. An overweight in U.S. technology company Dell Technologies was also advantageous.
The fixed income sleeve was helped by its cross sector positioning, with investments in high yield corporate bonds, bank loans and investment grade corporate bonds adding to results. Exposure to lower quality credits also contributed positively. Within investment grade corporate bonds, an emphasis on intermediate-term maturities was positive as was selection among financial and industrial credits. The fixed income sleeve also benefited from our duration positioning strategy, as yields rose during the annual period.
Top Detractors from Performance:
The performance of the equity sleeve was hurt by its out-of-benchmark investments in Nestle, a Switzerland-based food and beverage company; Shell, a British oil and gas company; and Rio Tinto, a British-Australian metals and mining company.
Within the fixed income sleeve, individual issue selection among high yield industrial credits detracted slightly from returns.
Information Technology-SS & OW
Communication Service-SS & OW
Consumer Discretionary-SS & UW
The above represents sectors.
KEY
SS–Security Selection
OW–Overweight
UW–Underweight
Goldman Sachs Income Builder Fund
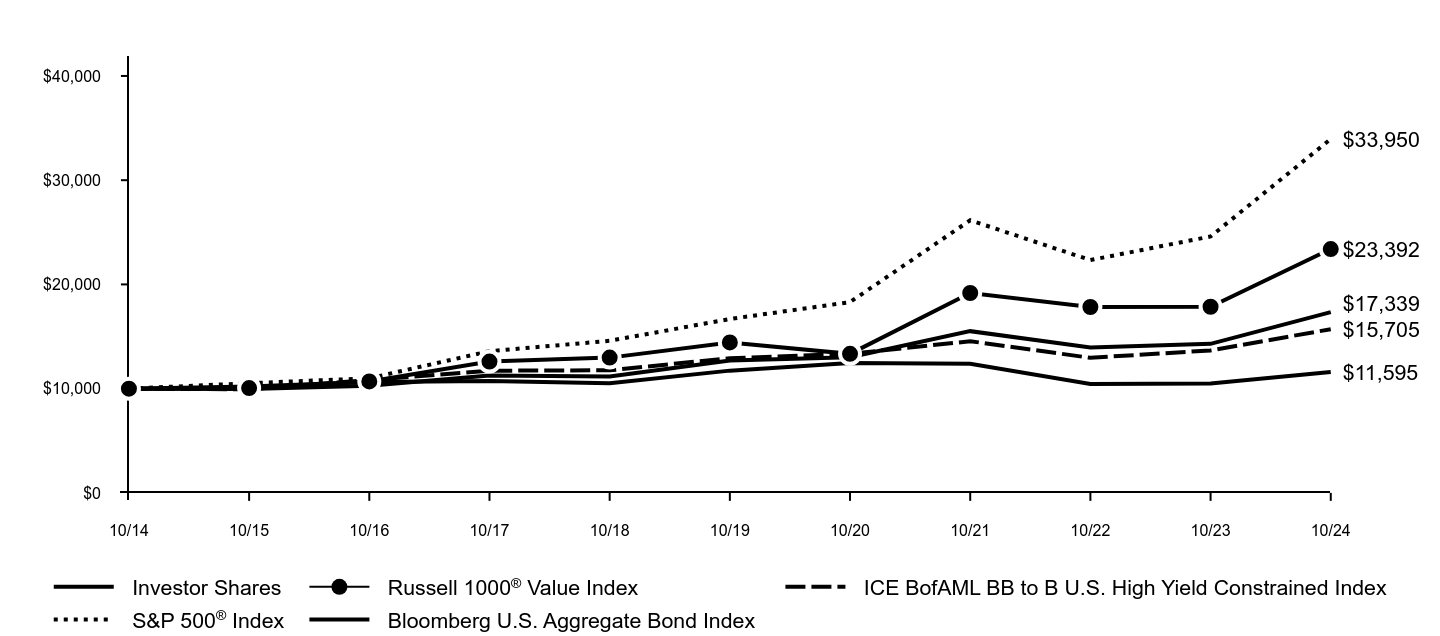
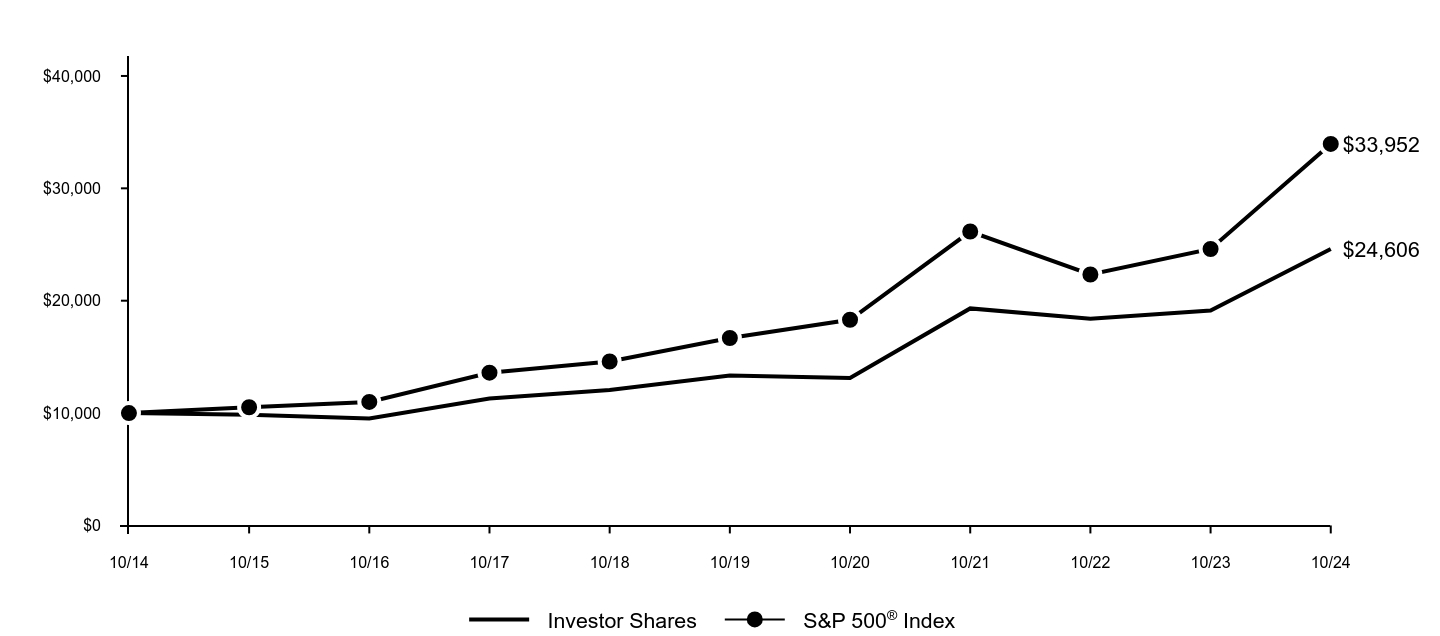
The following graph assumes an initial $10,000 investment in the Fund and compares the initial and subsequent account values at the end of each of the most recently completed 10 fiscal years of the Fund's share class (or less if the share class has been in operation for less than 10 years). The Fund's performance reflects applicable sales charges, if any. For comparative purposes, the performance of the Fund's benchmark and any additional performance benchmark(s) are also shown.
| Investor Shares | Russell 1000® Value Index | ICE BofAML BB to B U.S. High Yield Constrained Index | S&P 500® Index | Bloomberg U.S. Aggregate Bond Index |
|---|
| 10/14 | $10,000 | $10,000 | $10,000 | $10,000 | $10,000 |
| 10/15 | $9,955 | $10,053 | $9,940 | $10,520 | $10,196 |
| 10/16 | $10,283 | $10,693 | $10,827 | $10,994 | $10,642 |
| 10/17 | $11,260 | $12,595 | $11,721 | $13,593 | $10,737 |
| 10/18 | $11,174 | $12,977 | $11,760 | $14,591 | $10,517 |
| 10/19 | $12,692 | $14,432 | $12,918 | $16,681 | $11,728 |
| 10/20 | $13,015 | $13,340 | $13,343 | $18,301 | $12,454 |
| 10/21 | $15,516 | $19,178 | $14,551 | $26,155 | $12,394 |
| 10/22 | $13,950 | $17,836 | $12,960 | $22,334 | $10,451 |
| 10/23 | $14,298 | $17,860 | $13,664 | $24,599 | $10,488 |
| 10/24 | $17,339 | $23,392 | $15,705 | $33,950 | $11,595 |
Average Annual Total Returns (%)
| AATR | 1 Year | 5 Years | 10 Years |
|---|
| Investor Shares | 21.27% | 6.43% | 5.65% |
Russell 1000® Value Index | 30.98% | 10.13% | 8.86% |
| ICE BofAML BB to B U.S. High Yield Constrained Index | 14.94% | 3.98% | 4.61% |
S&P 500® Index | 38.02% | 15.25% | 12.99% |
| Bloomberg U.S. Aggregate Bond Index | 10.55% | -0.23% | 1.49% |
Performance data quoted above represents past performance. Past performance does not guarantee future results.
The Fund’s investment return and principal value will fluctuate so that an investor’s shares, when redeemed, may be worth more or less than their original cost. Current performance may be lower or higher than the performance quoted above. Please visit our web site at: am.gs.com to obtain the most recent month-end returns. Performance reflects applicable fee waivers and/or expense limitations in effect during the periods shown and in their absence, performance would be reduced. The graph and table do not reflect the deduction of taxes that a shareholder would pay on Fund distributions or redemption of Fund shares. In accordance with changing regulatory requirements, the Fund is now required to compare its performance to a regulatory benchmark, which in this case is the Bloomberg U.S. Aggregate Bond Index.
Goldman Sachs Income Builder Fund
| Total Net Assets | $2,484,821,905 |
| # of Portfolio Holdings | 816 |
| Portfolio Turnover Rate | 30% |
| Total Net Advisory Fees Paid | $9,798,671 |
What did the Fund invest in?
The table below shows the investment makeup of the Fund, representing the percentage of total net assets of the Fund. Figures in the table below may not sum to 100% due to the exclusion of other assets and liabilities and may not represent the Fund’s market exposure due to the exclusion of certain derivatives, if any. These allocations may not be representative of the Fund’s future investments.
| Banks | 8.5% |
| Pipelines | 4.4% |
| Insurance | 3.4% |
| Software | 3.3% |
| Media | 3.1% |
| Oil Field Services | 3.1% |
| Pharmaceuticals | 2.8% |
| Diversified Financial Services | 2.7% |
| Oil, Gas & Consumable Fuels | 2.4% |
| Other | 64.1% |
Goldman Sachs Income Builder Fund
If you wish to view additional information about the Fund, including the documents and other information listed below, please visit dfinview.com/GoldmanSachs or call 1-800-621-2550.
prospectus
financial information
fund holdings
proxy voting information
Goldman Sachs & Co. LLC is the distributor of the Goldman Sachs Funds.
London Stock Exchange Group plc and its group undertakings (collectively, the “LSE Group”). © LSE Group 2024. FTSE Russell is a trading name of certain of the LSE Group companies. “FTSE®” “Russell®”, “FTSE Russell®”, is/are trade mark(s) of the relevant LSE Group companies and is/are used by any other LSE Group company under license. All rights in the FTSE Russell indexes or data vest in the relevant LSE Group company which owns the index or the data. Neither LSE Group nor its licensors accept any liability for any errors or omissions in the indexes or data and no party may rely on any indexes or data contained in this communication. No further distribution of data from the LSE Group is permitted without the relevant LSE Group company’s express written consent. The LSE Group does not promote, sponsor or endorse the content of this communication. ICE Data Indices, LLC (“ICE DATA”) is used with permission. ICE DATA, ITS AFFILIATES AND THEIR RESPECTIVE THIRD PARTY SUPPLIERS DISCLAIM ANY AND ALL WARRANTIES, REPRESENTATIONS, EXPRESS AND/OR IMPLIED INCLUDING ANY WARRANTIES OF MERCHANTABILITY OR FITNESS FOR A PARTICULAR PURPOSE OR USE, INCLUDING THE INDICES, INDEX DATA AND ANY DATA INCLUDED IN, RELATED TO, OR DERIVED THEREFROM. NEITHER ICE DATA, ITS AFFILIATES NOR THEIR RESPECTIVE THIRD PARTY SUPPLIERS SHALL BE SUBJECT TO ANY DAMAGES OR LIABILITY WITH RESPECT TO THE ADEQUACY, ACCURACY, TIMELINESS OR COMPLETENESS OF THE INDICES OR THE INDEX DATA OR ANY COMPONENT THEREOF, AND THE INDICES AND INDEX DATA AND ALL COMPONENTS THEREOF ARE PROVIDED ON AN “AS IS” BASIS AND YOUR USE IS AT YOUR OWN RISK. ICE DATA, ITS AFFILIATES AND THEIR RESPECTIVE THIRD PARTY SUPPLIERS DO NOT SPONSOR, ENDORSE, OR RECOMMEND GOLDMAN SACHS, OR ANY OF ITS PRODUCTS OR SERVICES.
Bloomberg Index Services Limited. BLOOMBERG® is a trademark and service mark of Bloomberg Finance LP. And its affiliates (collectively “Bloomberg”). Bloomberg or Bloomberg’s licensors own all proprietary rights in the Bloomberg Indices. Neither Bloomberg nor Bloomberg’s licensors approves or endorses this material, or guarantees the accuracy or completeness of any information herein, or makes any warranty, express or implied, as to the results to be obtained therefrom and, to the maximum extent allowed by law, neither shall have any liability or responsibility for injury or damages arising in connection therewith.
The Global Industry Classification Standard (GICS) was developed by and is the exclusive property and a service mark of Morgan Stanley Capital International Inc. (MSCI) and Standard & Poor’s, a division of The McGraw-Hill Companies, Inc. (S&P) and is licensed for use by Goldman Sachs. Neither MSCI, S&P nor any other party involved in making or compiling the GICS or any GICS classifications makes any express or implied warranties or representations with respect to such standard or classification (or the results to be obtained by the use thereof), and all such parties hereby expressly disclaim all warranties of originality, accuracy, completeness, merchantability or fitness for a particular purpose with respect to any of such standard or classification. Without limiting any of the foregoing, in no event shall MSCI, S&P, any of their affiliates or any third party involved in making or compiling the GICS or any GICS classifications have any liability for any direct, indirect, special, punitive, consequential or any other damages (including lost profits) even if notified of the possibility of such damages.
© 2024 Goldman Sachs. All rights reserved.
No Bank Guarantee
May Lose Value
Not FDIC Insured
Goldman Sachs Income Builder Fund
Annual Shareholder Report
October 31, 2024
Goldman Sachs Rising Dividend Growth Fund
This annual shareholder report contains important information about Goldman Sachs Rising Dividend Growth Fund (the "Fund") for the period of November 1, 2023 to October 31, 2024. You can find additional information about the Fund at am.gs.com or dfinview.com/GoldmanSachs. You can also request this information by contacting us at 1-800-526-7384.
What were the Fund costs for the period?
Based on a hypothetical $10,000 investment.
| Class | Costs of a $10,000 investment | Costs paid as a percentage of a $10,000 investment |
|---|
| A | $115 | 1.01% |
How did the Fund perform and what affected its performance?
The broad U.S. equity market was volatile but strong amid a soft economic landing, disinflation, better market breadth, AI excitement and a Fed shift to monetary policy easing beginning September 2024. Energy-related equities lagged but performed well given supportive commodity prices and effective management teams.
Top Contributors to Performance:
Underweight positions in information technology giants Microsoft and Apple and overweights in materials science company Corning, high-tech connectors manufacturer Amphenol and financials company Discover Financial Services were the top individual contributors to the Fund’s performance relative to the S&P 500 ex-Energy Index.
Security selection contributed most positively to results within the Fund’s MLP & Infrastructure Sleeve relative to the Alerian MLP Index (MLP Index). Top individual contributors included out-of-MLP Index positions in Targa Resources Corp., a midstream provider of natural gas and natural gas liquids, and DT Midstream, Inc., an owner and operator of natural gas infrastructure. An underweight to USA Compression Partners LP, a natural gas compression services provider, also helped.
Top Detractors from Performance:
Stock selection detracted most from results within the dividend-paying growers portion of the Fund relative to the S&P 500 ex-Energy Index, especially within the information technology and communication services sectors.
Underweight positions in semiconductor company NVIDIA and social media platform operator Meta Platforms and overweights in health insurance company Humana, cosmetics seller Estee Lauder and athletic apparel retailer NIKE detracted most from the Fund’s results relative to the S&P 500 ex-Energy Index.
Underweight positions in midstream oil & gas company NuStar Energy L.P., petroleum and energy marketing company Global Partners LP and midstream oil & gas company Western Midstream Partners, LP detracted most from the Fund’s results relative to the MLP Index. NuStar Energy LP was removed from the MLP Index in May 2024 upon its acquisition by Sunoco.
Gathering & Processing–SS & OW
Natural Gas Pipeline Transportation–SS & OW
Hydrocarbon Production & Mining–OW
The above represents MLP Index sub-industries.
KEY
SS – Security Selection
OW - Overweight
Goldman Sachs Rising Dividend Growth Fund
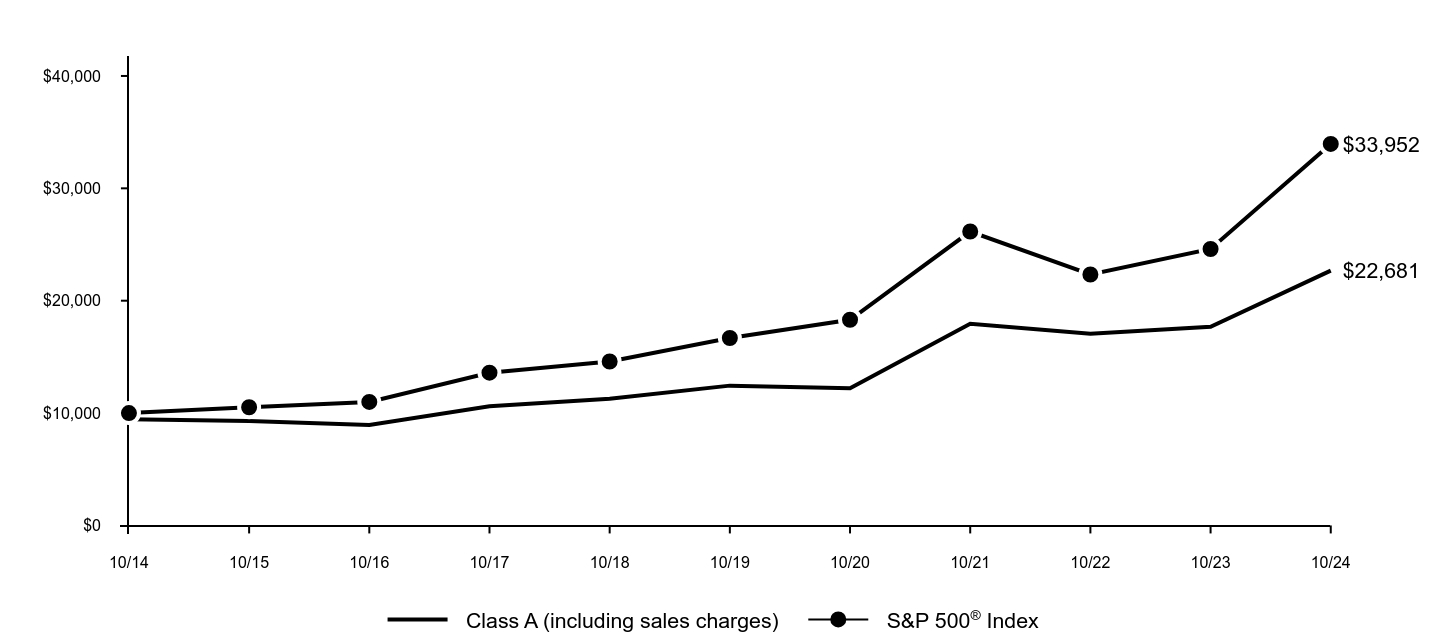
The following graph assumes an initial $10,000 investment in the Fund and compares the initial and subsequent account values at the end of each of the most recently completed 10 fiscal years of the Fund's share class (or less if the share class has been in operation for less than 10 years). The Fund's performance reflects applicable sales charges, if any. For comparative purposes, the performance of the Fund's benchmark and any additional performance benchmark(s) are also shown.
| Class A (including sales charges) | S&P 500® Index |
|---|
| 10/14 | $9,450 | $10,000 |
| 10/15 | $9,287 | $10,520 |
| 10/16 | $8,942 | $10,994 |
| 10/17 | $10,604 | $13,592 |
| 10/18 | $11,269 | $14,591 |
| 10/19 | $12,442 | $16,682 |
| 10/20 | $12,218 | $18,302 |
| 10/21 | $17,946 | $26,156 |
| 10/22 | $17,051 | $22,334 |
| 10/23 | $17,683 | $24,599 |
| 10/24 | $22,681 | $33,952 |
Average Annual Total Returns (%)
| AATR | 1 Year | 5 Years | 10 Years |
|---|
| Class A excluding sales charges | 28.26% | 12.74% | 9.14% |
| Class A including sales charges | 21.23% | 11.48% | 8.52% |
S&P 500® Index | 38.02% | 15.25% | 12.99% |
Performance data quoted above represents past performance. Past performance does not guarantee future results.
The Fund’s investment return and principal value will fluctuate so that an investor’s shares, when redeemed, may be worth more or less than their original cost. Current performance may be lower or higher than the performance quoted above. Please visit our web site at: am.gs.com to obtain the most recent month-end returns. Performance reflects applicable fee waivers and/or expense limitations in effect during the periods shown and in their absence, performance would be reduced. The graph and table do not reflect the deduction of taxes that a shareholder would pay on Fund distributions or redemption of Fund shares.
Goldman Sachs Rising Dividend Growth Fund
| Total Net Assets | $479,296,685 |
| # of Portfolio Holdings | 117 |
| Portfolio Turnover Rate | 42% |
| Total Net Advisory Fees Paid | $3,144,106 |
What did the Fund invest in?
The table below shows the investment makeup of the Fund, representing the percentage of total net assets of the Fund. Figures in the table below may not sum to 100% due to the exclusion of other assets and liabilities and may not represent the Fund’s market exposure due to the exclusion of certain derivatives, if any. These allocations may not be representative of the Fund’s future investments.
| Information Technology | 27.2% |
| Energy | 15.0% |
| Financials | 11.7% |
| Health Care | 9.8% |
| Consumer Discretionary | 8.5% |
| Industrials | 7.5% |
| Communication Services | 6.5% |
| Consumer Staples | 4.8% |
| Utilities | 2.3% |
| Other | 6.5% |
Goldman Sachs Rising Dividend Growth Fund
If you wish to view additional information about the Fund, including the documents and other information listed below, please visit dfinview.com/GoldmanSachs or call 1-800-526-7384.
prospectus
financial information
fund holdings
proxy voting information
Goldman Sachs & Co. LLC is the distributor of the Goldman Sachs Funds.
The S&P 500 (“Index”) is a product of S&P Dow Jones Indices LLC and/or its affiliates and has been licensed for use by Goldman Sachs. Copyright © 2024 S&P Dow Jones Indices LLC, a division of S&P Global, Inc., and/or its affiliates. All rights reserved. Redistribution or reproduction in whole or in part are prohibited without written permission of S&P Dow Jones Indices LLC. For more information on any of S&P Dow Jones Indices LLC’s indices please visit www.spdji.com. S&P® is a registered trademark of S&P Global and Dow Jones® is a registered trademark of Dow Jones Trademark Holdings LLC. Neither S&P Dow Jones Indices LLC, Dow Jones Trademark Holdings LLC, their affiliates nor their third party licensors make any representation or warranty, express or implied, as to the ability of any index to accurately represent the asset class or market sector that it purports to represent and neither S&P Dow Jones Indices LLC, Dow Jones Trademark Holdings LLC, their affiliates nor their third party licensors shall have any liability for any errors, omissions, or interruptions of any index or the data included therein.
The Global Industry Classification Standard (GICS) was developed by and is the exclusive property and a service mark of Morgan Stanley Capital International Inc. (MSCI) and Standard & Poor’s, a division of The McGraw-Hill Companies, Inc. (S&P) and is licensed for use by Goldman Sachs. Neither MSCI, S&P nor any other party involved in making or compiling the GICS or any GICS classifications makes any express or implied warranties or representations with respect to such standard or classification (or the results to be obtained by the use thereof), and all such parties hereby expressly disclaim all warranties of originality, accuracy, completeness, merchantability or fitness for a particular purpose with respect to any of such standard or classification. Without limiting any of the foregoing, in no event shall MSCI, S&P, any of their affiliates or any third party involved in making or compiling the GICS or any GICS classifications have any liability for any direct, indirect, special, punitive, consequential or any other damages (including lost profits) even if notified of the possibility of such damages.
© 2024 Goldman Sachs. All rights reserved.
No Bank Guarantee
May Lose Value
Not FDIC Insured
Goldman Sachs Rising Dividend Growth Fund
Annual Shareholder Report
October 31, 2024
Goldman Sachs Rising Dividend Growth Fund
This annual shareholder report contains important information about Goldman Sachs Rising Dividend Growth Fund (the "Fund") for the period of November 1, 2023 to October 31, 2024. You can find additional information about the Fund at am.gs.com or dfinview.com/GoldmanSachs. You can also request this information by contacting us at 1-800-526-7384.
What were the Fund costs for the period?
Based on a hypothetical $10,000 investment.
| Class | Costs of a $10,000 investment | Costs paid as a percentage of a $10,000 investment |
|---|
| C | $200 | 1.76% |
How did the Fund perform and what affected its performance?
The broad U.S. equity market was volatile but strong amid a soft economic landing, disinflation, better market breadth, AI excitement and a Fed shift to monetary policy easing beginning September 2024. Energy-related equities lagged but performed well given supportive commodity prices and effective management teams.
Top Contributors to Performance:
Underweight positions in information technology giants Microsoft and Apple and overweights in materials science company Corning, high-tech connectors manufacturer Amphenol and financials company Discover Financial Services were the top individual contributors to the Fund’s performance relative to the S&P 500 ex-Energy Index.
Security selection contributed most positively to results within the Fund’s MLP & Infrastructure Sleeve relative to the Alerian MLP Index (MLP Index). Top individual contributors included out-of-MLP Index positions in Targa Resources Corp., a midstream provider of natural gas and natural gas liquids, and DT Midstream, Inc., an owner and operator of natural gas infrastructure. An underweight to USA Compression Partners LP, a natural gas compression services provider, also helped.
Top Detractors from Performance:
Stock selection detracted most from results within the dividend-paying growers portion of the Fund relative to the S&P 500 ex-Energy Index, especially within the information technology and communication services sectors.
Underweight positions in semiconductor company NVIDIA and social media platform operator Meta Platforms and overweights in health insurance company Humana, cosmetics seller Estee Lauder and athletic apparel retailer NIKE detracted most from the Fund’s results relative to the S&P 500 ex-Energy Index.
Underweight positions in midstream oil & gas company NuStar Energy L.P., petroleum and energy marketing company Global Partners LP and midstream oil & gas company Western Midstream Partners, LP detracted most from the Fund’s results relative to the MLP Index. NuStar Energy LP was removed from the MLP Index in May 2024 upon its acquisition by Sunoco.
Gathering & Processing–SS & OW
Natural Gas Pipeline Transportation–SS & OW
Hydrocarbon Production & Mining–OW
The above represents MLP Index sub-industries.
KEY
SS – Security Selection
OW - Overweight
Goldman Sachs Rising Dividend Growth Fund
The following graph assumes an initial $10,000 investment in the Fund and compares the initial and subsequent account values at the end of each of the most recently completed 10 fiscal years of the Fund's share class (or less if the share class has been in operation for less than 10 years). The Fund's performance reflects applicable sales charges, if any. For comparative purposes, the performance of the Fund's benchmark and any additional performance benchmark(s) are also shown.
| Class C (including sales charges) | S&P 500® Index |
|---|
| 10/14 | $9,900 | $10,000 |
| 10/15 | $9,658 | $10,520 |
| 10/16 | $9,229 | $10,994 |
| 10/17 | $10,860 | $13,592 |
| 10/18 | $11,456 | $14,591 |
| 10/19 | $12,551 | $16,682 |
| 10/20 | $12,236 | $18,302 |
| 10/21 | $17,832 | $26,156 |
| 10/22 | $16,825 | $22,334 |
| 10/23 | $17,313 | $24,599 |
| 10/24 | $22,041 | $33,952 |
Average Annual Total Returns (%)
| AATR | 1 Year | 5 Years | 10 Years |
|---|
| Class C excluding sales charges | 27.31% | 11.91% | 8.32% |
| Class C including sales charges | 26.25% | 11.91% | 8.32% |
S&P 500® Index | 38.02% | 15.25% | 12.99% |
Performance data quoted above represents past performance. Past performance does not guarantee future results.
The Fund’s investment return and principal value will fluctuate so that an investor’s shares, when redeemed, may be worth more or less than their original cost. Current performance may be lower or higher than the performance quoted above. Please visit our web site at: am.gs.com to obtain the most recent month-end returns. Performance reflects applicable fee waivers and/or expense limitations in effect during the periods shown and in their absence, performance would be reduced. The graph and table do not reflect the deduction of taxes that a shareholder would pay on Fund distributions or redemption of Fund shares.
Goldman Sachs Rising Dividend Growth Fund
| Total Net Assets | $479,296,685 |
| # of Portfolio Holdings | 117 |
| Portfolio Turnover Rate | 42% |
| Total Net Advisory Fees Paid | $3,144,106 |
What did the Fund invest in?
The table below shows the investment makeup of the Fund, representing the percentage of total net assets of the Fund. Figures in the table below may not sum to 100% due to the exclusion of other assets and liabilities and may not represent the Fund’s market exposure due to the exclusion of certain derivatives, if any. These allocations may not be representative of the Fund’s future investments.
| Information Technology | 27.2% |
| Energy | 15.0% |
| Financials | 11.7% |
| Health Care | 9.8% |
| Consumer Discretionary | 8.5% |
| Industrials | 7.5% |
| Communication Services | 6.5% |
| Consumer Staples | 4.8% |
| Utilities | 2.3% |
| Other | 6.5% |
Goldman Sachs Rising Dividend Growth Fund
If you wish to view additional information about the Fund, including the documents and other information listed below, please visit dfinview.com/GoldmanSachs or call 1-800-526-7384.
prospectus
financial information
fund holdings
proxy voting information
Goldman Sachs & Co. LLC is the distributor of the Goldman Sachs Funds.
The S&P 500 (“Index”) is a product of S&P Dow Jones Indices LLC and/or its affiliates and has been licensed for use by Goldman Sachs. Copyright © 2024 S&P Dow Jones Indices LLC, a division of S&P Global, Inc., and/or its affiliates. All rights reserved. Redistribution or reproduction in whole or in part are prohibited without written permission of S&P Dow Jones Indices LLC. For more information on any of S&P Dow Jones Indices LLC’s indices please visit www.spdji.com. S&P® is a registered trademark of S&P Global and Dow Jones® is a registered trademark of Dow Jones Trademark Holdings LLC. Neither S&P Dow Jones Indices LLC, Dow Jones Trademark Holdings LLC, their affiliates nor their third party licensors make any representation or warranty, express or implied, as to the ability of any index to accurately represent the asset class or market sector that it purports to represent and neither S&P Dow Jones Indices LLC, Dow Jones Trademark Holdings LLC, their affiliates nor their third party licensors shall have any liability for any errors, omissions, or interruptions of any index or the data included therein.
The Global Industry Classification Standard (GICS) was developed by and is the exclusive property and a service mark of Morgan Stanley Capital International Inc. (MSCI) and Standard & Poor’s, a division of The McGraw-Hill Companies, Inc. (S&P) and is licensed for use by Goldman Sachs. Neither MSCI, S&P nor any other party involved in making or compiling the GICS or any GICS classifications makes any express or implied warranties or representations with respect to such standard or classification (or the results to be obtained by the use thereof), and all such parties hereby expressly disclaim all warranties of originality, accuracy, completeness, merchantability or fitness for a particular purpose with respect to any of such standard or classification. Without limiting any of the foregoing, in no event shall MSCI, S&P, any of their affiliates or any third party involved in making or compiling the GICS or any GICS classifications have any liability for any direct, indirect, special, punitive, consequential or any other damages (including lost profits) even if notified of the possibility of such damages.
© 2024 Goldman Sachs. All rights reserved.
No Bank Guarantee
May Lose Value
Not FDIC Insured
Goldman Sachs Rising Dividend Growth Fund
Annual Shareholder Report
October 31, 2024
Goldman Sachs Rising Dividend Growth Fund
This annual shareholder report contains important information about Goldman Sachs Rising Dividend Growth Fund (the "Fund") for the period of November 1, 2023 to October 31, 2024. You can find additional information about the Fund at am.gs.com or dfinview.com/GoldmanSachs. You can also request this information by contacting us at 1-800-621-2550.
What were the Fund costs for the period?
Based on a hypothetical $10,000 investment.
| Class | Costs of a $10,000 investment | Costs paid as a percentage of a $10,000 investment |
|---|
| P | $78 | 0.68% |
How did the Fund perform and what affected its performance?
The broad U.S. equity market was volatile but strong amid a soft economic landing, disinflation, better market breadth, AI excitement and a Fed shift to monetary policy easing beginning September 2024. Energy-related equities lagged but performed well given supportive commodity prices and effective management teams.
Top Contributors to Performance:
Underweight positions in information technology giants Microsoft and Apple and overweights in materials science company Corning, high-tech connectors manufacturer Amphenol and financials company Discover Financial Services were the top individual contributors to the Fund’s performance relative to the S&P 500 ex-Energy Index.
Security selection contributed most positively to results within the Fund’s MLP & Infrastructure Sleeve relative to the Alerian MLP Index (MLP Index). Top individual contributors included out-of-MLP Index positions in Targa Resources Corp., a midstream provider of natural gas and natural gas liquids, and DT Midstream, Inc., an owner and operator of natural gas infrastructure. An underweight to USA Compression Partners LP, a natural gas compression services provider, also helped.
Top Detractors from Performance:
Stock selection detracted most from results within the dividend-paying growers portion of the Fund relative to the S&P 500 ex-Energy Index, especially within the information technology and communication services sectors.
Underweight positions in semiconductor company NVIDIA and social media platform operator Meta Platforms and overweights in health insurance company Humana, cosmetics seller Estee Lauder and athletic apparel retailer NIKE detracted most from the Fund’s results relative to the S&P 500 ex-Energy Index.
Underweight positions in midstream oil & gas company NuStar Energy L.P., petroleum and energy marketing company Global Partners LP and midstream oil & gas company Western Midstream Partners, LP detracted most from the Fund’s results relative to the MLP Index. NuStar Energy LP was removed from the MLP Index in May 2024 upon its acquisition by Sunoco.
Gathering & Processing–SS & OW
Natural Gas Pipeline Transportation–SS & OW
Hydrocarbon Production & Mining–OW
The above represents MLP Index sub-industries.
KEY
SS – Security Selection
OW - Overweight
Goldman Sachs Rising Dividend Growth Fund
The following graph assumes an initial $10,000 investment in the Fund and compares the initial and subsequent account values at the end of each of the most recently completed 10 fiscal years of the Fund's share class (or less if the share class has been in operation for less than 10 years). The Fund's performance reflects applicable sales charges, if any. For comparative purposes, the performance of the Fund's benchmark and any additional performance benchmark(s) are also shown.
| Class P | S&P 500® Index |
|---|
| 04/18 | $10,000 | $10,000 |
| 10/18 | $10,103 | $10,228 |
| 10/19 | $11,200 | $11,694 |
| 10/20 | $11,036 | $12,829 |
| 10/21 | $16,241 | $18,334 |
| 10/22 | $15,491 | $15,655 |
| 10/23 | $16,113 | $17,243 |
| 10/24 | $20,741 | $23,799 |
Average Annual Total Returns (%)
| AATR | 1 Year | 5 Years | Since Inception 4/16/18 |
|---|
| Class P | 28.72% | 13.10% | 11.78% |
S&P 500® Index | 38.02% | 15.25% | 14.15% |
Performance data quoted above represents past performance. Past performance does not guarantee future results.
The Fund’s investment return and principal value will fluctuate so that an investor’s shares, when redeemed, may be worth more or less than their original cost. Current performance may be lower or higher than the performance quoted above. Please visit our web site at: am.gs.com to obtain the most recent month-end returns. Performance reflects applicable fee waivers and/or expense limitations in effect during the periods shown and in their absence, performance would be reduced. The graph and table do not reflect the deduction of taxes that a shareholder would pay on Fund distributions or redemption of Fund shares.
Goldman Sachs Rising Dividend Growth Fund
| Total Net Assets | $479,296,685 |
| # of Portfolio Holdings | 117 |
| Portfolio Turnover Rate | 42% |
| Total Net Advisory Fees Paid | $3,144,106 |
What did the Fund invest in?
The table below shows the investment makeup of the Fund, representing the percentage of total net assets of the Fund. Figures in the table below may not sum to 100% due to the exclusion of other assets and liabilities and may not represent the Fund’s market exposure due to the exclusion of certain derivatives, if any. These allocations may not be representative of the Fund’s future investments.
| Information Technology | 27.2% |
| Energy | 15.0% |
| Financials | 11.7% |
| Health Care | 9.8% |
| Consumer Discretionary | 8.5% |
| Industrials | 7.5% |
| Communication Services | 6.5% |
| Consumer Staples | 4.8% |
| Utilities | 2.3% |
| Other | 6.5% |
Goldman Sachs Rising Dividend Growth Fund
If you wish to view additional information about the Fund, including the documents and other information listed below, please visit dfinview.com/GoldmanSachs or call 1-800-621-2550.
prospectus
financial information
fund holdings
proxy voting information
Goldman Sachs & Co. LLC is the distributor of the Goldman Sachs Funds.
The S&P 500 (“Index”) is a product of S&P Dow Jones Indices LLC and/or its affiliates and has been licensed for use by Goldman Sachs. Copyright © 2024 S&P Dow Jones Indices LLC, a division of S&P Global, Inc., and/or its affiliates. All rights reserved. Redistribution or reproduction in whole or in part are prohibited without written permission of S&P Dow Jones Indices LLC. For more information on any of S&P Dow Jones Indices LLC’s indices please visit www.spdji.com. S&P® is a registered trademark of S&P Global and Dow Jones® is a registered trademark of Dow Jones Trademark Holdings LLC. Neither S&P Dow Jones Indices LLC, Dow Jones Trademark Holdings LLC, their affiliates nor their third party licensors make any representation or warranty, express or implied, as to the ability of any index to accurately represent the asset class or market sector that it purports to represent and neither S&P Dow Jones Indices LLC, Dow Jones Trademark Holdings LLC, their affiliates nor their third party licensors shall have any liability for any errors, omissions, or interruptions of any index or the data included therein.
The Global Industry Classification Standard (GICS) was developed by and is the exclusive property and a service mark of Morgan Stanley Capital International Inc. (MSCI) and Standard & Poor’s, a division of The McGraw-Hill Companies, Inc. (S&P) and is licensed for use by Goldman Sachs. Neither MSCI, S&P nor any other party involved in making or compiling the GICS or any GICS classifications makes any express or implied warranties or representations with respect to such standard or classification (or the results to be obtained by the use thereof), and all such parties hereby expressly disclaim all warranties of originality, accuracy, completeness, merchantability or fitness for a particular purpose with respect to any of such standard or classification. Without limiting any of the foregoing, in no event shall MSCI, S&P, any of their affiliates or any third party involved in making or compiling the GICS or any GICS classifications have any liability for any direct, indirect, special, punitive, consequential or any other damages (including lost profits) even if notified of the possibility of such damages.
© 2024 Goldman Sachs. All rights reserved.
No Bank Guarantee
May Lose Value
Not FDIC Insured
Goldman Sachs Rising Dividend Growth Fund
Annual Shareholder Report
October 31, 2024
Goldman Sachs Rising Dividend Growth Fund
This annual shareholder report contains important information about Goldman Sachs Rising Dividend Growth Fund (the "Fund") for the period of November 1, 2023 to October 31, 2024. You can find additional information about the Fund at am.gs.com or dfinview.com/GoldmanSachs. You can also request this information by contacting us at 1-800-621-2550.
What were the Fund costs for the period?
Based on a hypothetical $10,000 investment.
| Class | Costs of a $10,000 investment | Costs paid as a percentage of a $10,000 investment |
|---|
| R | $144 | 1.26% |
How did the Fund perform and what affected its performance?
The broad U.S. equity market was volatile but strong amid a soft economic landing, disinflation, better market breadth, AI excitement and a Fed shift to monetary policy easing beginning September 2024. Energy-related equities lagged but performed well given supportive commodity prices and effective management teams.
Top Contributors to Performance:
Underweight positions in information technology giants Microsoft and Apple and overweights in materials science company Corning, high-tech connectors manufacturer Amphenol and financials company Discover Financial Services were the top individual contributors to the Fund’s performance relative to the S&P 500 ex-Energy Index.
Security selection contributed most positively to results within the Fund’s MLP & Infrastructure Sleeve relative to the Alerian MLP Index (MLP Index). Top individual contributors included out-of-MLP Index positions in Targa Resources Corp., a midstream provider of natural gas and natural gas liquids, and DT Midstream, Inc., an owner and operator of natural gas infrastructure. An underweight to USA Compression Partners LP, a natural gas compression services provider, also helped.
Top Detractors from Performance:
Stock selection detracted most from results within the dividend-paying growers portion of the Fund relative to the S&P 500 ex-Energy Index, especially within the information technology and communication services sectors.
Underweight positions in semiconductor company NVIDIA and social media platform operator Meta Platforms and overweights in health insurance company Humana, cosmetics seller Estee Lauder and athletic apparel retailer NIKE detracted most from the Fund’s results relative to the S&P 500 ex-Energy Index.
Underweight positions in midstream oil & gas company NuStar Energy L.P., petroleum and energy marketing company Global Partners LP and midstream oil & gas company Western Midstream Partners, LP detracted most from the Fund’s results relative to the MLP Index. NuStar Energy LP was removed from the MLP Index in May 2024 upon its acquisition by Sunoco.
Gathering & Processing–SS & OW
Natural Gas Pipeline Transportation–SS & OW
Hydrocarbon Production & Mining–OW
The above represents MLP Index sub-industries.
KEY
SS – Security Selection
OW - Overweight
Goldman Sachs Rising Dividend Growth Fund
The following graph assumes an initial $10,000 investment in the Fund and compares the initial and subsequent account values at the end of each of the most recently completed 10 fiscal years of the Fund's share class (or less if the share class has been in operation for less than 10 years). The Fund's performance reflects applicable sales charges, if any. For comparative purposes, the performance of the Fund's benchmark and any additional performance benchmark(s) are also shown.
| Class R | S&P 500® Index |
|---|
| 10/14 | $10,000 | $10,000 |
| 10/15 | $9,800 | $10,520 |
| 10/16 | $9,411 | $10,994 |
| 10/17 | $11,130 | $13,592 |
| 10/18 | $11,806 | $14,591 |
| 10/19 | $12,996 | $16,682 |
| 10/20 | $12,735 | $18,302 |
| 10/21 | $18,641 | $26,156 |
| 10/22 | $17,690 | $22,334 |
| 10/23 | $18,294 | $24,599 |
| 10/24 | $23,405 | $33,952 |
Average Annual Total Returns (%)
| AATR | 1 Year | 5 Years | 10 Years |
|---|
| Class R | 27.94% | 12.47% | 8.87% |
S&P 500® Index | 38.02% | 15.25% | 12.99% |
Performance data quoted above represents past performance. Past performance does not guarantee future results.
The Fund’s investment return and principal value will fluctuate so that an investor’s shares, when redeemed, may be worth more or less than their original cost. Current performance may be lower or higher than the performance quoted above. Please visit our web site at: am.gs.com to obtain the most recent month-end returns. Performance reflects applicable fee waivers and/or expense limitations in effect during the periods shown and in their absence, performance would be reduced. The graph and table do not reflect the deduction of taxes that a shareholder would pay on Fund distributions or redemption of Fund shares.
Goldman Sachs Rising Dividend Growth Fund
| Total Net Assets | $479,296,685 |
| # of Portfolio Holdings | 117 |
| Portfolio Turnover Rate | 42% |
| Total Net Advisory Fees Paid | $3,144,106 |
What did the Fund invest in?
The table below shows the investment makeup of the Fund, representing the percentage of total net assets of the Fund. Figures in the table below may not sum to 100% due to the exclusion of other assets and liabilities and may not represent the Fund’s market exposure due to the exclusion of certain derivatives, if any. These allocations may not be representative of the Fund’s future investments.
| Information Technology | 27.2% |
| Energy | 15.0% |
| Financials | 11.7% |
| Health Care | 9.8% |
| Consumer Discretionary | 8.5% |
| Industrials | 7.5% |
| Communication Services | 6.5% |
| Consumer Staples | 4.8% |
| Utilities | 2.3% |
| Other | 6.5% |
Goldman Sachs Rising Dividend Growth Fund
If you wish to view additional information about the Fund, including the documents and other information listed below, please visit dfinview.com/GoldmanSachs or call 1-800-621-2550.
prospectus
financial information
fund holdings
proxy voting information
Goldman Sachs & Co. LLC is the distributor of the Goldman Sachs Funds.
The S&P 500 (“Index”) is a product of S&P Dow Jones Indices LLC and/or its affiliates and has been licensed for use by Goldman Sachs. Copyright © 2024 S&P Dow Jones Indices LLC, a division of S&P Global, Inc., and/or its affiliates. All rights reserved. Redistribution or reproduction in whole or in part are prohibited without written permission of S&P Dow Jones Indices LLC. For more information on any of S&P Dow Jones Indices LLC’s indices please visit www.spdji.com. S&P® is a registered trademark of S&P Global and Dow Jones® is a registered trademark of Dow Jones Trademark Holdings LLC. Neither S&P Dow Jones Indices LLC, Dow Jones Trademark Holdings LLC, their affiliates nor their third party licensors make any representation or warranty, express or implied, as to the ability of any index to accurately represent the asset class or market sector that it purports to represent and neither S&P Dow Jones Indices LLC, Dow Jones Trademark Holdings LLC, their affiliates nor their third party licensors shall have any liability for any errors, omissions, or interruptions of any index or the data included therein.
The Global Industry Classification Standard (GICS) was developed by and is the exclusive property and a service mark of Morgan Stanley Capital International Inc. (MSCI) and Standard & Poor’s, a division of The McGraw-Hill Companies, Inc. (S&P) and is licensed for use by Goldman Sachs. Neither MSCI, S&P nor any other party involved in making or compiling the GICS or any GICS classifications makes any express or implied warranties or representations with respect to such standard or classification (or the results to be obtained by the use thereof), and all such parties hereby expressly disclaim all warranties of originality, accuracy, completeness, merchantability or fitness for a particular purpose with respect to any of such standard or classification. Without limiting any of the foregoing, in no event shall MSCI, S&P, any of their affiliates or any third party involved in making or compiling the GICS or any GICS classifications have any liability for any direct, indirect, special, punitive, consequential or any other damages (including lost profits) even if notified of the possibility of such damages.
© 2024 Goldman Sachs. All rights reserved.
No Bank Guarantee
May Lose Value
Not FDIC Insured
Goldman Sachs Rising Dividend Growth Fund
Annual Shareholder Report
October 31, 2024
Goldman Sachs Rising Dividend Growth Fund
This annual shareholder report contains important information about Goldman Sachs Rising Dividend Growth Fund (the "Fund") for the period of November 1, 2023 to October 31, 2024. You can find additional information about the Fund at am.gs.com or dfinview.com/GoldmanSachs. You can also request this information by contacting us at 1-800-621-2550.
What were the Fund costs for the period?
Based on a hypothetical $10,000 investment.
| Class | Costs of a $10,000 investment | Costs paid as a percentage of a $10,000 investment |
|---|
| R6 | $78 | 0.68% |
How did the Fund perform and what affected its performance?
The broad U.S. equity market was volatile but strong amid a soft economic landing, disinflation, better market breadth, AI excitement and a Fed shift to monetary policy easing beginning September 2024. Energy-related equities lagged but performed well given supportive commodity prices and effective management teams.
Top Contributors to Performance:
Underweight positions in information technology giants Microsoft and Apple and overweights in materials science company Corning, high-tech connectors manufacturer Amphenol and financials company Discover Financial Services were the top individual contributors to the Fund’s performance relative to the S&P 500 ex-Energy Index.
Security selection contributed most positively to results within the Fund’s MLP & Infrastructure Sleeve relative to the Alerian MLP Index (MLP Index). Top individual contributors included out-of-MLP Index positions in Targa Resources Corp., a midstream provider of natural gas and natural gas liquids, and DT Midstream, Inc., an owner and operator of natural gas infrastructure. An underweight to USA Compression Partners LP, a natural gas compression services provider, also helped.
Top Detractors from Performance:
Stock selection detracted most from results within the dividend-paying growers portion of the Fund relative to the S&P 500 ex-Energy Index, especially within the information technology and communication services sectors.
Underweight positions in semiconductor company NVIDIA and social media platform operator Meta Platforms and overweights in health insurance company Humana, cosmetics seller Estee Lauder and athletic apparel retailer NIKE detracted most from the Fund’s results relative to the S&P 500 ex-Energy Index.
Underweight positions in midstream oil & gas company NuStar Energy L.P., petroleum and energy marketing company Global Partners LP and midstream oil & gas company Western Midstream Partners, LP detracted most from the Fund’s results relative to the MLP Index. NuStar Energy LP was removed from the MLP Index in May 2024 upon its acquisition by Sunoco.
Gathering & Processing–SS & OW
Natural Gas Pipeline Transportation–SS & OW
Hydrocarbon Production & Mining–OW
The above represents MLP Index sub-industries.
KEY
SS – Security Selection
OW - Overweight
Goldman Sachs Rising Dividend Growth Fund
The following graph assumes an initial $10,000 investment in the Fund and compares the initial and subsequent account values at the end of each of the most recently completed 10 fiscal years of the Fund's share class (or less if the share class has been in operation for less than 10 years). The Fund's performance reflects applicable sales charges, if any. For comparative purposes, the performance of the Fund's benchmark and any additional performance benchmark(s) are also shown.
| Class R6 | S&P 500® Index |
|---|
| 02/18 | $10,000 | $10,000 |
| 10/18 | $10,154 | $10,116 |
| 10/19 | $11,249 | $11,566 |
| 10/20 | $11,083 | $12,689 |
| 10/21 | $16,317 | $18,133 |
| 10/22 | $15,563 | $15,484 |
| 10/23 | $16,190 | $17,054 |
| 10/24 | $20,845 | $23,538 |
Average Annual Total Returns (%)
| AATR | 1 Year | 5 Years | Since Inception 2/28/18 |
|---|
| Class R6 | 28.75% | 13.11% | 11.63% |
S&P 500® Index | 38.02% | 15.25% | 13.67% |
Performance data quoted above represents past performance. Past performance does not guarantee future results.
The Fund’s investment return and principal value will fluctuate so that an investor’s shares, when redeemed, may be worth more or less than their original cost. Current performance may be lower or higher than the performance quoted above. Please visit our web site at: am.gs.com to obtain the most recent month-end returns. Performance reflects applicable fee waivers and/or expense limitations in effect during the periods shown and in their absence, performance would be reduced. The graph and table do not reflect the deduction of taxes that a shareholder would pay on Fund distributions or redemption of Fund shares.
Goldman Sachs Rising Dividend Growth Fund
| Total Net Assets | $479,296,685 |
| # of Portfolio Holdings | 117 |
| Portfolio Turnover Rate | 42% |
| Total Net Advisory Fees Paid | $3,144,106 |
What did the Fund invest in?
The table below shows the investment makeup of the Fund, representing the percentage of total net assets of the Fund. Figures in the table below may not sum to 100% due to the exclusion of other assets and liabilities and may not represent the Fund’s market exposure due to the exclusion of certain derivatives, if any. These allocations may not be representative of the Fund’s future investments.
| Information Technology | 27.2% |
| Energy | 15.0% |
| Financials | 11.7% |
| Health Care | 9.8% |
| Consumer Discretionary | 8.5% |
| Industrials | 7.5% |
| Communication Services | 6.5% |
| Consumer Staples | 4.8% |
| Utilities | 2.3% |
| Other | 6.5% |
Goldman Sachs Rising Dividend Growth Fund
If you wish to view additional information about the Fund, including the documents and other information listed below, please visit dfinview.com/GoldmanSachs or call 1-800-621-2550.
prospectus
financial information
fund holdings
proxy voting information
Goldman Sachs & Co. LLC is the distributor of the Goldman Sachs Funds.
The S&P 500 (“Index”) is a product of S&P Dow Jones Indices LLC and/or its affiliates and has been licensed for use by Goldman Sachs. Copyright © 2024 S&P Dow Jones Indices LLC, a division of S&P Global, Inc., and/or its affiliates. All rights reserved. Redistribution or reproduction in whole or in part are prohibited without written permission of S&P Dow Jones Indices LLC. For more information on any of S&P Dow Jones Indices LLC’s indices please visit www.spdji.com. S&P® is a registered trademark of S&P Global and Dow Jones® is a registered trademark of Dow Jones Trademark Holdings LLC. Neither S&P Dow Jones Indices LLC, Dow Jones Trademark Holdings LLC, their affiliates nor their third party licensors make any representation or warranty, express or implied, as to the ability of any index to accurately represent the asset class or market sector that it purports to represent and neither S&P Dow Jones Indices LLC, Dow Jones Trademark Holdings LLC, their affiliates nor their third party licensors shall have any liability for any errors, omissions, or interruptions of any index or the data included therein.
The Global Industry Classification Standard (GICS) was developed by and is the exclusive property and a service mark of Morgan Stanley Capital International Inc. (MSCI) and Standard & Poor’s, a division of The McGraw-Hill Companies, Inc. (S&P) and is licensed for use by Goldman Sachs. Neither MSCI, S&P nor any other party involved in making or compiling the GICS or any GICS classifications makes any express or implied warranties or representations with respect to such standard or classification (or the results to be obtained by the use thereof), and all such parties hereby expressly disclaim all warranties of originality, accuracy, completeness, merchantability or fitness for a particular purpose with respect to any of such standard or classification. Without limiting any of the foregoing, in no event shall MSCI, S&P, any of their affiliates or any third party involved in making or compiling the GICS or any GICS classifications have any liability for any direct, indirect, special, punitive, consequential or any other damages (including lost profits) even if notified of the possibility of such damages.
© 2024 Goldman Sachs. All rights reserved.
No Bank Guarantee
May Lose Value
Not FDIC Insured
Goldman Sachs Rising Dividend Growth Fund
Annual Shareholder Report
October 31, 2024
Goldman Sachs Rising Dividend Growth Fund
GSRLX: Institutional Class
This annual shareholder report contains important information about Goldman Sachs Rising Dividend Growth Fund (the "Fund") for the period of November 1, 2023 to October 31, 2024. You can find additional information about the Fund at am.gs.com or dfinview.com/GoldmanSachs. You can also request this information by contacting us at 1-800-621-2550.
What were the Fund costs for the period?
Based on a hypothetical $10,000 investment.
| Class | Costs of a $10,000 investment | Costs paid as a percentage of a $10,000 investment |
|---|
| Institutional | $79 | 0.69% |
How did the Fund perform and what affected its performance?
The broad U.S. equity market was volatile but strong amid a soft economic landing, disinflation, better market breadth, AI excitement and a Fed shift to monetary policy easing beginning September 2024. Energy-related equities lagged but performed well given supportive commodity prices and effective management teams.
Top Contributors to Performance:
Underweight positions in information technology giants Microsoft and Apple and overweights in materials science company Corning, high-tech connectors manufacturer Amphenol and financials company Discover Financial Services were the top individual contributors to the Fund’s performance relative to the S&P 500 ex-Energy Index.
Security selection contributed most positively to results within the Fund’s MLP & Infrastructure Sleeve relative to the Alerian MLP Index (MLP Index). Top individual contributors included out-of-MLP Index positions in Targa Resources Corp., a midstream provider of natural gas and natural gas liquids, and DT Midstream, Inc., an owner and operator of natural gas infrastructure. An underweight to USA Compression Partners LP, a natural gas compression services provider, also helped.
Top Detractors from Performance:
Stock selection detracted most from results within the dividend-paying growers portion of the Fund relative to the S&P 500 ex-Energy Index, especially within the information technology and communication services sectors.
Underweight positions in semiconductor company NVIDIA and social media platform operator Meta Platforms and overweights in health insurance company Humana, cosmetics seller Estee Lauder and athletic apparel retailer NIKE detracted most from the Fund’s results relative to the S&P 500 ex-Energy Index.
Underweight positions in midstream oil & gas company NuStar Energy L.P., petroleum and energy marketing company Global Partners LP and midstream oil & gas company Western Midstream Partners, LP detracted most from the Fund’s results relative to the MLP Index. NuStar Energy LP was removed from the MLP Index in May 2024 upon its acquisition by Sunoco.
Gathering & Processing–SS & OW
Natural Gas Pipeline Transportation–SS & OW
Hydrocarbon Production & Mining–OW
The above represents MLP Index sub-industries.
KEY
SS – Security Selection
OW - Overweight
Goldman Sachs Rising Dividend Growth Fund
The following graph assumes an initial $1,000,000 investment in the Fund and compares the initial and subsequent account values at the end of each of the most recently completed 10 fiscal years of the Fund's share class (or less if the share class has been in operation for less than 10 years). The Fund's performance reflects applicable sales charges, if any. For comparative purposes, the performance of the Fund's benchmark and any additional performance benchmark(s) are also shown.
| Institutional Shares | S&P 500® Index |
|---|
| 10/14 | $1,000,000 | $1,000,000 |
| 10/15 | $987,100 | $1,052,000 |
| 10/16 | $953,933 | $1,099,445 |
| 10/17 | $1,135,276 | $1,359,244 |
| 10/18 | $1,211,907 | $1,459,149 |
| 10/19 | $1,343,399 | $1,668,245 |
| 10/20 | $1,323,651 | $1,830,231 |
| 10/21 | $1,947,885 | $2,615,583 |
| 10/22 | $1,857,893 | $2,233,447 |
| 10/23 | $1,932,580 | $2,459,918 |
| 10/24 | $2,487,424 | $3,395,179 |
Average Annual Total Returns (%)
| AATR | 1 Year | 5 Years | 10 Years |
|---|
| Institutional Shares | 28.71% | 13.10% | 9.53% |
S&P 500® Index | 38.02% | 15.25% | 12.99% |
Performance data quoted above represents past performance. Past performance does not guarantee future results.
The Fund’s investment return and principal value will fluctuate so that an investor’s shares, when redeemed, may be worth more or less than their original cost. Current performance may be lower or higher than the performance quoted above. Please visit our web site at: am.gs.com to obtain the most recent month-end returns. Performance reflects applicable fee waivers and/or expense limitations in effect during the periods shown and in their absence, performance would be reduced. The graph and table do not reflect the deduction of taxes that a shareholder would pay on Fund distributions or redemption of Fund shares.
Goldman Sachs Rising Dividend Growth Fund
| Total Net Assets | $479,296,685 |
| # of Portfolio Holdings | 117 |
| Portfolio Turnover Rate | 42% |
| Total Net Advisory Fees Paid | $3,144,106 |
What did the Fund invest in?
The table below shows the investment makeup of the Fund, representing the percentage of total net assets of the Fund. Figures in the table below may not sum to 100% due to the exclusion of other assets and liabilities and may not represent the Fund’s market exposure due to the exclusion of certain derivatives, if any. These allocations may not be representative of the Fund’s future investments.
| Information Technology | 27.2% |
| Energy | 15.0% |
| Financials | 11.7% |
| Health Care | 9.8% |
| Consumer Discretionary | 8.5% |
| Industrials | 7.5% |
| Communication Services | 6.5% |
| Consumer Staples | 4.8% |
| Utilities | 2.3% |
| Other | 6.5% |
Goldman Sachs Rising Dividend Growth Fund
If you wish to view additional information about the Fund, including the documents and other information listed below, please visit dfinview.com/GoldmanSachs or call 1-800-621-2550.
prospectus
financial information
fund holdings
proxy voting information
Goldman Sachs & Co. LLC is the distributor of the Goldman Sachs Funds.
The S&P 500 (“Index”) is a product of S&P Dow Jones Indices LLC and/or its affiliates and has been licensed for use by Goldman Sachs. Copyright © 2024 S&P Dow Jones Indices LLC, a division of S&P Global, Inc., and/or its affiliates. All rights reserved. Redistribution or reproduction in whole or in part are prohibited without written permission of S&P Dow Jones Indices LLC. For more information on any of S&P Dow Jones Indices LLC’s indices please visit www.spdji.com. S&P® is a registered trademark of S&P Global and Dow Jones® is a registered trademark of Dow Jones Trademark Holdings LLC. Neither S&P Dow Jones Indices LLC, Dow Jones Trademark Holdings LLC, their affiliates nor their third party licensors make any representation or warranty, express or implied, as to the ability of any index to accurately represent the asset class or market sector that it purports to represent and neither S&P Dow Jones Indices LLC, Dow Jones Trademark Holdings LLC, their affiliates nor their third party licensors shall have any liability for any errors, omissions, or interruptions of any index or the data included therein.
The Global Industry Classification Standard (GICS) was developed by and is the exclusive property and a service mark of Morgan Stanley Capital International Inc. (MSCI) and Standard & Poor’s, a division of The McGraw-Hill Companies, Inc. (S&P) and is licensed for use by Goldman Sachs. Neither MSCI, S&P nor any other party involved in making or compiling the GICS or any GICS classifications makes any express or implied warranties or representations with respect to such standard or classification (or the results to be obtained by the use thereof), and all such parties hereby expressly disclaim all warranties of originality, accuracy, completeness, merchantability or fitness for a particular purpose with respect to any of such standard or classification. Without limiting any of the foregoing, in no event shall MSCI, S&P, any of their affiliates or any third party involved in making or compiling the GICS or any GICS classifications have any liability for any direct, indirect, special, punitive, consequential or any other damages (including lost profits) even if notified of the possibility of such damages.
© 2024 Goldman Sachs. All rights reserved.
No Bank Guarantee
May Lose Value
Not FDIC Insured
Goldman Sachs Rising Dividend Growth Fund
Annual Shareholder Report
October 31, 2024
Goldman Sachs Rising Dividend Growth Fund
This annual shareholder report contains important information about Goldman Sachs Rising Dividend Growth Fund (the "Fund") for the period of November 1, 2023 to October 31, 2024. You can find additional information about the Fund at am.gs.com or dfinview.com/GoldmanSachs. You can also request this information by contacting us at 1-800-621-2550.
What were the Fund costs for the period?
Based on a hypothetical $10,000 investment.
| Class | Costs of a $10,000 investment | Costs paid as a percentage of a $10,000 investment |
|---|
| Investor | $87 | 0.76% |
How did the Fund perform and what affected its performance?
The broad U.S. equity market was volatile but strong amid a soft economic landing, disinflation, better market breadth, AI excitement and a Fed shift to monetary policy easing beginning September 2024. Energy-related equities lagged but performed well given supportive commodity prices and effective management teams.
Top Contributors to Performance:
Underweight positions in information technology giants Microsoft and Apple and overweights in materials science company Corning, high-tech connectors manufacturer Amphenol and financials company Discover Financial Services were the top individual contributors to the Fund’s performance relative to the S&P 500 ex-Energy Index.
Security selection contributed most positively to results within the Fund’s MLP & Infrastructure Sleeve relative to the Alerian MLP Index (MLP Index). Top individual contributors included out-of-MLP Index positions in Targa Resources Corp., a midstream provider of natural gas and natural gas liquids, and DT Midstream, Inc., an owner and operator of natural gas infrastructure. An underweight to USA Compression Partners LP, a natural gas compression services provider, also helped.
Top Detractors from Performance:
Stock selection detracted most from results within the dividend-paying growers portion of the Fund relative to the S&P 500 ex-Energy Index, especially within the information technology and communication services sectors.
Underweight positions in semiconductor company NVIDIA and social media platform operator Meta Platforms and overweights in health insurance company Humana, cosmetics seller Estee Lauder and athletic apparel retailer NIKE detracted most from the Fund’s results relative to the S&P 500 ex-Energy Index.
Underweight positions in midstream oil & gas company NuStar Energy L.P., petroleum and energy marketing company Global Partners LP and midstream oil & gas company Western Midstream Partners, LP detracted most from the Fund’s results relative to the MLP Index. NuStar Energy LP was removed from the MLP Index in May 2024 upon its acquisition by Sunoco.
Gathering & Processing–SS & OW
Natural Gas Pipeline Transportation–SS & OW
Hydrocarbon Production & Mining–OW
The above represents MLP Index sub-industries.
KEY
SS – Security Selection
OW - Overweight
Goldman Sachs Rising Dividend Growth Fund
The following graph assumes an initial $10,000 investment in the Fund and compares the initial and subsequent account values at the end of each of the most recently completed 10 fiscal years of the Fund's share class (or less if the share class has been in operation for less than 10 years). The Fund's performance reflects applicable sales charges, if any. For comparative purposes, the performance of the Fund's benchmark and any additional performance benchmark(s) are also shown.
| Investor Shares | S&P 500® Index |
|---|
| 10/14 | $10,000 | $10,000 |
| 10/15 | $9,851 | $10,520 |
| 10/16 | $9,510 | $10,994 |
| 10/17 | $11,303 | $13,592 |
| 10/18 | $12,044 | $14,591 |
| 10/19 | $13,337 | $16,682 |
| 10/20 | $13,130 | $18,302 |
| 10/21 | $19,313 | $26,156 |
| 10/22 | $18,405 | $22,334 |
| 10/23 | $19,132 | $24,599 |
| 10/24 | $24,606 | $33,952 |
Average Annual Total Returns (%)
| AATR | 1 Year | 5 Years | 10 Years |
|---|
| Investor Shares | 28.61% | 13.02% | 9.41% |
S&P 500® Index | 38.02% | 15.25% | 12.99% |
Performance data quoted above represents past performance. Past performance does not guarantee future results.
The Fund’s investment return and principal value will fluctuate so that an investor’s shares, when redeemed, may be worth more or less than their original cost. Current performance may be lower or higher than the performance quoted above. Please visit our web site at: am.gs.com to obtain the most recent month-end returns. Performance reflects applicable fee waivers and/or expense limitations in effect during the periods shown and in their absence, performance would be reduced. The graph and table do not reflect the deduction of taxes that a shareholder would pay on Fund distributions or redemption of Fund shares.
Goldman Sachs Rising Dividend Growth Fund
| Total Net Assets | $479,296,685 |
| # of Portfolio Holdings | 117 |
| Portfolio Turnover Rate | 42% |
| Total Net Advisory Fees Paid | $3,144,106 |
What did the Fund invest in?
The table below shows the investment makeup of the Fund, representing the percentage of total net assets of the Fund. Figures in the table below may not sum to 100% due to the exclusion of other assets and liabilities and may not represent the Fund’s market exposure due to the exclusion of certain derivatives, if any. These allocations may not be representative of the Fund’s future investments.
| Information Technology | 27.2% |
| Energy | 15.0% |
| Financials | 11.7% |
| Health Care | 9.8% |
| Consumer Discretionary | 8.5% |
| Industrials | 7.5% |
| Communication Services | 6.5% |
| Consumer Staples | 4.8% |
| Utilities | 2.3% |
| Other | 6.5% |
Goldman Sachs Rising Dividend Growth Fund
If you wish to view additional information about the Fund, including the documents and other information listed below, please visit dfinview.com/GoldmanSachs or call 1-800-621-2550.
prospectus
financial information
fund holdings
proxy voting information
Goldman Sachs & Co. LLC is the distributor of the Goldman Sachs Funds.
The S&P 500 (“Index”) is a product of S&P Dow Jones Indices LLC and/or its affiliates and has been licensed for use by Goldman Sachs. Copyright © 2024 S&P Dow Jones Indices LLC, a division of S&P Global, Inc., and/or its affiliates. All rights reserved. Redistribution or reproduction in whole or in part are prohibited without written permission of S&P Dow Jones Indices LLC. For more information on any of S&P Dow Jones Indices LLC’s indices please visit www.spdji.com. S&P® is a registered trademark of S&P Global and Dow Jones® is a registered trademark of Dow Jones Trademark Holdings LLC. Neither S&P Dow Jones Indices LLC, Dow Jones Trademark Holdings LLC, their affiliates nor their third party licensors make any representation or warranty, express or implied, as to the ability of any index to accurately represent the asset class or market sector that it purports to represent and neither S&P Dow Jones Indices LLC, Dow Jones Trademark Holdings LLC, their affiliates nor their third party licensors shall have any liability for any errors, omissions, or interruptions of any index or the data included therein.
The Global Industry Classification Standard (GICS) was developed by and is the exclusive property and a service mark of Morgan Stanley Capital International Inc. (MSCI) and Standard & Poor’s, a division of The McGraw-Hill Companies, Inc. (S&P) and is licensed for use by Goldman Sachs. Neither MSCI, S&P nor any other party involved in making or compiling the GICS or any GICS classifications makes any express or implied warranties or representations with respect to such standard or classification (or the results to be obtained by the use thereof), and all such parties hereby expressly disclaim all warranties of originality, accuracy, completeness, merchantability or fitness for a particular purpose with respect to any of such standard or classification. Without limiting any of the foregoing, in no event shall MSCI, S&P, any of their affiliates or any third party involved in making or compiling the GICS or any GICS classifications have any liability for any direct, indirect, special, punitive, consequential or any other damages (including lost profits) even if notified of the possibility of such damages.
© 2024 Goldman Sachs. All rights reserved.
No Bank Guarantee
May Lose Value
Not FDIC Insured
Goldman Sachs Rising Dividend Growth Fund
| | (a) | As of the end of the period covered by this report, the registrant has adopted a code of ethics that applies to the registrant’s principal executive officer, principal financial officer, principal accounting officer or controller, or persons performing similar functions, regardless of whether these individuals are employed by the registrant or a third party (the “Code of Ethics”). |
| | (c) | During the period covered by this report, no amendments were made to the provisions of the Code of Ethics. |
| | (d) | During the period covered by this report, the registrant did not grant any waivers, including an implicit waiver, from any provision of the Code of Ethics. |
| | (f) | A copy of the Code of Ethics is available as provided in Item 19(a)(1) of this report. |
| ITEM 3. | AUDIT COMMITTEE FINANCIAL EXPERT. |
The registrant’s board of trustees has determined that the registrant has at least one “audit committee financial expert” (as defined in Item 3 of Form N-CSR) serving on its audit committee. Kathryn A. Cassidy and Michael Latham are each an “audit committee financial expert” and “independent” (as each term is defined in Item 3 of Form N-CSR).
| ITEM 4. | PRINCIPAL ACCOUNTANT FEES AND SERVICES. |
Table 1 — Items 4(a) - 4(d). The accountant fees below reflect the aggregate fees billed by all of the Funds of the Goldman Sachs Trust and includes the Goldman Sachs Funds to which this certified shareholder report relates.
| | | | | | | | | | | | |
| | | 2024 | | 2023 | | Description of Services Rendered |
| | | |
| | | | | | | | | | | | |
| | | |
Audit Fees: | | | | | | | | | | | | |
| | | |
• PricewaterhouseCoopers LLP
(“PwC”) | | | $ | 3,874,810 | | | | $ | 4,008,636 | | | Financial Statement audits. |
| | | |
Audit-Related Fees: | | | | | | | | | | | | |
| | | |
• PwC | | | $ | 466,200 | | | | $ | 516,600 | | | Other attest services. |
| | | |
Tax Fees: | | | | | | | | | | | | |
| | | |
• PwC | | | $ | 0 | | | | $ | 0 | | | |
Table 2 — Items 4(b)(c) & (d). Non-Audit Services to the Goldman Sachs Trust’s service affiliates* that were pre-approved by the Audit Committee of the Goldman Sachs Trust pursuant to Rule 2-01(c)(7)(ii) of Regulation S-X.
| | | | | | | | | | | | |
| | | 2024 | | 2023 | | Description of Services Rendered |
| | | |
| | | | | | | | | | | | |
| | | |
Audit-Related Fees: | | | | | | | | | | | | |
| | | |
• PwC | | | $ | 2,122,312 | | | | $ | 2,075,449 | | | Internal control review performed in accordance with Statement on Standards for Attestation Engagements No. 16 and semi-annual updates related to withholding tax accrual for non-US jurisdictions. These fees are borne by the Funds’ Adviser. |
| * | These include the advisor (excluding sub-advisors) and any entity controlling, controlled by or under common control with the advisor that provides ongoing services to the registrant (hereinafter referred to as “service affiliates”). |
Item 4(e)(1) — Audit Committee Pre-Approval Policies and Procedures
Pre-Approval of Audit and Non-Audit Services Provided to the Funds of the Goldman Sachs Trust. The Audit and Non-Audit Services Pre-Approval Policy (the “Policy”) adopted by the Audit Committee of Goldman Sachs Trust (“GST”) sets forth the procedures and the conditions pursuant to which services performed by an independent auditor for GST may be pre-approved. Services may be pre-approved specifically by the Audit Committee as a whole or, in certain circumstances, by the Audit Committee Chairman or the person designated as the Audit Committee Financial Expert. In addition, subject to specified cost limitations, certain services may be pre-approved under the provisions of the Policy. The Policy provides that the Audit Committee will consider whether the services provided by an independent auditor are consistent with the Securities and Exchange Commission’s rules on auditor independence. The Policy provides for periodic review and pre-approval by the Audit Committee of the services that may be provided by the independent auditor.
De Minimis Waiver. The pre-approval requirements of the Policy may be waived with respect to the provision of non-audit services that are permissible for an independent auditor to perform, provided (1) the aggregate amount of all such services provided constitutes no more than five percent of the total amount of revenues subject to pre-approval that was paid to the independent auditors during the fiscal year in which the services are provided; (2) such services were not recognized by GST at the time of the engagement to be non-audit services; and (3) such services are promptly brought to the attention of the Audit Committee and approved prior to the completion of the audit by the Audit Committee or by one or more members of the Audit Committee to whom authority to grant such approvals has been delegated by the Audit Committee, pursuant to the pre-approval provisions of the Policy.
Pre-Approval of Non-Audit Services Provided to GST’s Investment Advisers. The Policy provides that, in addition to requiring pre-approval of audit and non-audit services provided to GST, the Audit Committee will pre-approve those non-audit services provided to GST’s investment advisers (and entities controlling, controlled by or under common control with the investment advisers that provide ongoing services to GST) where the engagement relates directly to the operations or financial reporting of GST.
Item 4(e)(2) – 0% of the audit-related fees, tax fees and other fees listed in Table 1 were approved by GST’s Audit Committee pursuant to the “de minimis” exception of Rule 2-01(c)(7)(i)(C) of Regulation S-X. In addition, 0% of the non-audit services to the GST’s service affiliates listed in Table 2 were approved by GST’s Audit Committee pursuant to the “de minimis” exception of Rule 2-01 (c)(7)(i)(C) of Regulation S-X.
Item 4(f) – Not applicable.
Item 4(g) Aggregate Non-Audit Fees Disclosure
The aggregate non-audit fees billed to GST by PwC for the twelve months ended October 31, 2024 and October 31, 2023 were approximately $466,200 and $516,600, respectively. The aggregate non-audit fees billed to GST’s adviser and service affiliates by PwC for non-audit services for the twelve months ended December 31, 2023 and December 31, 2022 were approximately $18.0 million and $17.1 million, respectively. With regard to the aggregate non-audit fees billed to GST’s adviser and service affiliates, the 2023 and 2022 amounts include fees for non-audit services required to be pre-approved [see Table 2] and fees for non-audit services that did not require pre-approval since they did not directly relate to GST’s operations or financial reporting.
Item 4(h) — GST’s Audit Committee has considered whether the provision of non-audit services to GST’s investment adviser and service affiliates that did not require pre-approval pursuant to paragraph (c)(7)(ii) of Rule 2-01 of Regulation S-X is compatible with maintaining the auditors’ independence.
Item 4(i) – Not applicable.
Item 4(j) – Not applicable.
| ITEM 5. | AUDIT COMMITTEE OF LISTED REGISTRANTS. |
Not applicable.
Schedule of Investments is included in Item 7 of this report.
| ITEM 7. | FINANCIAL STATEMENTS AND FINANCIAL HIGHLIGHTS FOR OPEN-END MANAGEMENT INVESTMENT COMPANIES. |
Dividend Focus Funds
GOLDMAN SACHS INCOME BUILDER FUND
|
Schedule of Investments October 31, 2024 |
| | | | | | | | | | | | | | | | |
| | | Principal Amount | | | Interest Rate | | | Maturity Date | | Value | |
| |
| | Corporate Obligations – 45.9% | |
| |
| | Advertising(a)(b) – 0.1% | |
| | Clear Channel Outdoor Holdings, Inc. | |
| | $ | | | 3,210,000 | | | | 7.875 | % | | 04/01/30 | | $ | 3,272,017 | |
| | | |
| |
| | Aerospace & Defense(a) – 1.0% | |
| | Boeing Co. | |
| | | | | 1,875,000 | | | | 3.450 | | | 11/01/28 | | | 1,736,963 | |
| | | | | 3,432,000 | | | | 5.150 | | | 05/01/30 | | | 3,390,507 | |
| | | | | 1,652,000 | | | | 5.805 | | | 05/01/50 | | | 1,558,232 | |
| | Bombardier, Inc. (b) | |
| | | | | 4,340,000 | | | | 7.000 | | | 06/01/32 | | | 4,444,941 | |
| | Spirit AeroSystems, Inc. (b) | |
| | | | | 2,850,000 | | | | 9.750 | | | 11/15/30 | | | 3,165,581 | |
| | TransDigm, Inc. | |
| | | | | 2,050,000 | | | | 6.750 | (b) | | 08/15/28 | | | 2,096,043 | |
| | | | | 6,895,000 | | | | 4.625 | | | 01/15/29 | | | 6,549,078 | |
| | | | | 2,246,000 | | | | 4.875 | | | 05/01/29 | | | 2,142,145 | |
| | | | | 100,000 | | | | 7.125 | (b) | | 12/01/31 | | | 103,650 | |
| | | | | | | | | | | | | | | | |
| | | | | | | | | | | | | | | 25,187,140 | |
| | | |
| |
| | Agriculture(a) – 0.2% | |
| | BAT Capital Corp. | |
| | | | | 7,000,000 | | | | 4.390 | | | 08/15/37 | | | 6,097,070 | |
| | | |
| |
| | Airlines – 0.5% | |
| | American Airlines, Inc./AAdvantage Loyalty IP Ltd. (b) | |
| | | | | 1,717,000 | | | | 5.750 | | | 04/20/29 | | | 1,701,358 | |
| | Delta Air Lines, Inc. (a) | |
| | | | | 3,600,000 | | | | 7.375 | | | 01/15/26 | | | 3,686,364 | |
| | Latam Airlines Group SA (a)(b) | |
| | | | | 440,000 | | | | 7.875 | | | 04/15/30 | | | 440,550 | |
| | United Airlines, Inc. (a)(b) | |
| | | | | 2,080,000 | | | | 4.625 | | | 04/15/29 | | | 1,991,746 | |
| | VistaJet Malta Finance PLC/Vista Management Holding, Inc. (a)(b) | |
| | | | | 4,145,000 | | | | 7.875 | | | 05/01/27 | | | 4,037,810 | |
| | | | | 1,295,000 | | | | 9.500 | | | 06/01/28 | | | 1,272,078 | |
| | | | | | | | | | | | | | | | |
| | | | | | | | | | | | | | | 13,129,906 | |
| | | |
| |
| | Auto Parts & Equipment(a) – 0.0% | |
| | Tupy Overseas SA | |
| | | | | 200,000 | | | | 4.500 | | | 02/16/31 | | | 173,300 | |
| | | |
| |
| | Automotive(a) – 1.1% | |
| | Adient Global Holdings Ltd. (b) | |
| | | | | 2,000,000 | | | | 7.000 | | | 04/15/28 | | | 2,033,180 | |
| | Clarios Global LP/Clarios U.S. Finance Co. (b) | |
| | | | | 1,850,000 | | | | 8.500 | | | 05/15/27 | | | 1,860,193 | |
| | Dana, Inc. | |
| | | | | 2,075,000 | | | | 4.250 | | | 09/01/30 | | | 1,809,919 | |
| | Dealer Tire LLC/DT Issuer LLC (b) | |
| | | | | 5,637,000 | | | | 8.000 | | | 02/01/28 | | | 5,557,744 | |
| | Ford Motor Credit Co. LLC | |
| | | | | 210,000 | | | | 3.375 | | | 11/13/25 | | | 205,981 | |
| | General Motors Financial Co., Inc. | |
| | | | | 1,975,000 | | | | 5.650 | | | 01/17/29 | | | 2,007,864 | |
| | | | | 4,100,000 | | | | 3.100 | | | 01/12/32 | | | 3,523,909 | |
| | | |
| | | | | | | | | | | | | | | | |
| | | Principal Amount | | | Interest Rate | | | Maturity Date | | Value | |
| |
| | Corporate Obligations – (continued) | |
| |
| | Automotive(a) – (continued) | |
| | Hyundai Capital America (b) | |
| | $ | | | 4,050,000 | | | | 5.700 | % | | 06/26/30 | | $ | 4,144,648 | |
| | Phinia, Inc. (b) | |
| | | | | 4,284,000 | | | | 6.750 | | | 04/15/29 | | | 4,380,133 | |
| | | | | 935,000 | | | | 6.625 | | | 10/15/32 | | | 932,560 | |
| | | | | | | | | | | | | | | | |
| | | | | | | | | | | | | | | 26,456,131 | |
| | | |
| |
| | Banks – 5.4% | |
| | Absa Group Ltd. (a)(c) (5 yr. CMT + 5.411%) | |
| | | | | 960,000 | | | | 6.375 | | | 05/27/26 | | | 938,102 | |
| | Access Bank PLC (b) | |
| | | | | 900,000 | | | | 6.125 | | | 09/21/26 | | | 856,404 | |
| | Alfa Bank AO Via Alfa Bond Issuance PLC (a)(d) (5 yr. CMT + 4.546%) | |
| | | | | 360,000 | | | | 5.950 | | | 04/15/30 | | | — | |
| | Banca Transilvania SA (a)(c) (1 yr. EURIBOR ICE Swap + 5.580%) | |
| | EUR | | | 650,000 | | | | 8.875 | | | 04/27/27 | | | 745,924 | |
| | Banco Continental SAECA (a) | |
| | $ | | | 1,210,000 | | | | 2.750 | | | 12/10/25 | | | 1,168,406 | |
| | Banco Davivienda SA (a)(c) (10 yr. CMT + 5.097%) | |
| | | | | 420,000 | | | | 6.650 | (b) | | 04/22/31 | | | 351,821 | |
| | | | | 200,000 | | | | 6.650 | | | 04/22/31 | | | 167,534 | |
| | Banco de Bogota SA | |
| | | | | 740,000 | | | | 6.250 | | | 05/12/26 | | | 740,000 | |
| | Banco de Credito del Peru SA (a)(b) | |
| | | | | 650,000 | | | | 5.850 | | | 01/11/29 | | | 661,973 | |
| | Banco del Estado de Chile (a)(b)(c) (5 yr. CMT + 3.228%) | |
| | | | | 600,000 | | | | 7.950 | | | 05/02/29 | | | 631,500 | |
| | Banco do Brasil SA (a)(c) (10 yr. CMT + 4.398%) | |
| | | | | 340,000 | | | | 8.748 | | | 04/15/25 | | | 345,419 | |
| | Banco Industrial SA (a)(b)(c) (5 yr. CMT + 4.442%) | |
| | | | | 930,000 | | | | 4.875 | | | 01/29/31 | | | 903,793 | |
| | Banco Internacional del Peru SAA Interbank (a)(c) (5 yr. CMT + 3.711%) | |
| | | | | 790,000 | | | | 4.000 | | | 07/08/30 | | | 775,188 | |
| | Banco Mercantil del Norte SA (a)(c) (5 yr. CMT + 4.643%) | |
| | | | | 340,000 | | | | 5.875 | (b) | | 01/24/27 | | | 328,950 | |
| | | | | 460,000 | | | | 5.875 | | | 01/24/27 | | | 445,050 | |
| | Banco Santander SA | |
| | | | | 2,000,000 | | | | 3.490 | | | 05/28/30 | | | 1,833,220 | |
| | (1 yr. CMT + 1.600%) | |
| | | | | 3,600,000 | | | | 3.225 | (a)(c) | | 11/22/32 | | | 3,106,548 | |
| | Bancolombia SA (a)(c) (5 yr. CMT + 4.320%) | |
| | | | | 460,000 | | | | 8.625 | | | 12/24/34 | | | 478,345 | |
| | Bank Hapoalim BM (a)(b)(c) (5 yr. CMT + 2.155%) | |
| | | | | 540,000 | | | | 3.255 | | | 01/21/32 | | | 500,845 | |
| | Bank Leumi Le-Israel BM (a)(b)(c) (5 yr. CMT + 1.631%) | |
| | | | | 520,000 | | | | 3.275 | | | 01/29/31 | | | 494,614 | |
| | Bank of America Corp. (a)(c) | |
| | (3 mo. USD Term SOFR + 4.160%) | |
| | | | | 4,000,000 | | | | 6.100 | | | 03/17/25 | | | 4,001,600 | |
| | | |
| | |
| The accompanying notes are an integral part of these financial statements. | | 1 |
GOLDMAN SACHS INCOME BUILDER FUND
|
Schedule of Investments (continued) October 31, 2024 |
| | | | | | | | | | | | | | | | |
| | | Principal Amount | | | Interest Rate | | | Maturity Date | | Value | |
| |
| | Corporate Obligations – (continued) | |
| |
| | Banks – (continued) | |
| | (Secured Overnight Financing Rate + 1.630%) | |
| | $ | | | 1,760,000 | | | | 5.202 | % | | 04/25/29 | | $ | 1,777,459 | |
| | Bank of New York Mellon Corp. (a)(c) | |
| | (5 yr. CMT + 3.352%) | |
| | | | | 1,000,000 | | | | 3.700 | | | 03/20/26 | | | 970,300 | |
| | (5 yr. CMT + 4.358%) | |
| | | | | 2,000,000 | | | | 4.700 | | | 09/20/25 | | | 1,982,080 | |
| | Barclays PLC (a)(c) | |
| | (1 yr. CMT + 3.000%) | |
| | | | | 4,810,000 | | | | 5.746 | | | 08/09/33 | | | 4,894,175 | |
| | (5 yr. CMT + 5.431%) | |
| | | | | 2,353,000 | | | | 8.000 | | | 03/15/29 | | | 2,432,390 | |
| | BNP Paribas SA (b) | |
| | | | | 2,700,000 | | | | 4.375 | | | 05/12/26 | | | 2,666,439 | |
| | (5 yr. CMT + 4.354%) | |
| | | | | 3,000,000 | | | | 8.500 | (a)(c) | | 08/14/28 | | | 3,139,440 | |
| | BPCE SA (b) | |
| | | | | 4,150,000 | | | | 4.625 | | | 09/12/28 | | | 4,067,539 | |
| | (Secured Overnight Financing Rate + 1.730%) | |
| | | | | 2,100,000 | | | | 3.116 | (a)(c) | | 10/19/32 | | | 1,776,453 | |
| | Citigroup, Inc. (a)(c) | |
| | (10 yr. CMT + 2.757%) | |
| | | | | 2,200,000 | | | | 7.000 | | | 08/15/34 | | | 2,327,754 | |
| | (3 mo. USD Term SOFR + 4.779%) | |
| | | | | 1,890,000 | | | | 6.250 | | | 08/15/26 | | | 1,916,744 | |
| | (5 yr. CMT + 3.209%) | |
| | | | | 3,000,000 | | | | 7.375 | | | 05/15/28 | | | 3,143,340 | |
| | (5 yr. CMT + 3.211%) | |
| | | | | 2,147,000 | | | | 7.625 | | | 11/15/28 | | | 2,283,914 | |
| | (5 yr. CMT + 3.597%) | |
| | | | | 1,000,000 | | | | 4.000 | | | 12/10/25 | | | 975,140 | |
| | (Secured Overnight Financing Rate + 1.351%) | |
| | | | | 3,325,000 | | | | 3.057 | | | 01/25/33 | | | 2,891,121 | |
| | (Secured Overnight Financing Rate + 3.914%) | |
| | | | | 900,000 | | | | 4.412 | | | 03/31/31 | | | 870,291 | |
| | Citizens Financial Group, Inc. (a)(c) (5 yr. CMT + 5.313%) | |
| | | | | 1,000,000 | | | | 5.650 | | | 10/06/25 | | | 992,710 | |
| | Comerica, Inc. (a)(c) (5 yr. CMT + 5.291%) | |
| | | | | 1,000,000 | | | | 5.625 | | | 07/01/25 | | | 990,880 | |
| | Credit Bank of Moscow Via CBOM Finance PLC (d) | |
| | | | | 260,000 | | | | 4.700 | (b) | | 01/29/25 | | | — | |
| | (5 yr. USD Swap + 5.416%) | |
| | | | | 280,000 | | | | 7.500 | (a)(c) | | 10/05/27 | | | — | |
| | Deutsche Bank AG (a)(c) (5 yr. CMT + 4.524%) | |
| | | | | 800,000 | | | | 6.000 | | | 10/30/25 | | | 784,824 | |
| | Fifth Third Bancorp (a)(c) (5 yr. CMT + 4.215%) | |
| | | | | 1,000,000 | | | | 4.500 | | | 09/30/25 | | | 986,550 | |
| | First Bank of Nigeria Ltd. Via FBN Finance Co. BV (b) | |
| | | | | 200,000 | | | | 8.625 | | | 10/27/25 | | | 200,500 | |
| | Freedom Mortgage Corp. (a)(b) | |
| | | | | 2,610,000 | | | | 6.625 | | | 01/15/27 | | | 2,580,089 | |
| | Grupo Aval Ltd. (a) | |
| | | | | 1,410,000 | | | | 4.375 | | | 02/04/30 | | | 1,232,876 | |
| | Huntington Bancshares, Inc. (a)(c) (7 yr. CMT + 4.045%) | |
| | | | | 1,000,000 | | | | 4.450 | | | 10/15/27 | | | 955,350 | |
| | | |
| | | | | | | | | | | | | | | | |
| | | Principal Amount | | | Interest Rate | | | Maturity Date | | Value | |
| |
| | Corporate Obligations – (continued) | |
| |
| | Banks – (continued) | |
| | ING Groep NV (a)(c) (5 yr. USD Swap + 4.446%) | |
| | $ | | | 3,000,000 | | | | 6.500 | % | | 04/16/25 | | $ | 2,996,640 | |
| | Ipoteka-Bank ATIB | |
| | | | | 710,000 | | | | 5.500 | | | 11/19/25 | | | 697,795 | |
| | Itau Unibanco Holding SA (a)(c) (5 yr. CMT + 3.981%) | |
| | | | | 500,000 | | | | 7.721 | | | 12/12/24 | | | 499,605 | |
| | JPMorgan Chase & Co. (a)(c) | |
| | (3 mo. USD Term SOFR + 2.515%) | |
| | | | | 2,666,000 | | | | 2.956 | | | 05/13/31 | | | 2,391,562 | |
| | (5 yr. CMT + 2.737%) | |
| | | | | 3,742,000 | | | | 6.875 | | | 06/01/29 | | | 3,966,632 | |
| | Macquarie Group Ltd. (a)(b)(c) (3 mo. USD Term SOFR + 1.372%) | |
| | | | | 3,650,000 | | | | 3.763 | | | 11/28/28 | | | 3,524,002 | |
| | Morgan Stanley (a)(c) (Secured Overnight Financing Rate + 1.290%) | |
| | | | | 1,950,000 | | | | 2.943 | | | 01/21/33 | | | 1,693,380 | |
| | NatWest Group PLC (a)(c) (5 yr. CMT + 3.752%) | |
| | | | | 2,000,000 | | | | 8.125 | | | 11/10/33 | | | 2,138,220 | |
| | NBK Tier 1 Financing 2 Ltd. (a)(c) (6 yr. CMT + 2.832%) | |
| | | | | 790,000 | | | | 4.500 | | | 08/27/25 | | | 774,445 | |
| | PNC Financial Services Group, Inc. (a)(c) | |
| | (5 yr. CMT + 3.000%) | |
| | | | | 2,000,000 | | | | 6.000 | | | 05/15/27 | | | 2,004,060 | |
| | (5 yr. CMT + 3.238%) | |
| | | | | 3,000,000 | | | | 6.200 | | | 09/15/27 | | | 3,031,710 | |
| | (7 yr. CMT + 2.808%) | |
| | | | | 2,000,000 | | | | 6.250 | | | 03/15/30 | | | 2,004,240 | |
| | Regions Financial Corp. (a)(c) (5 yr. CMT + 5.430%) | |
| | | | | 1,000,000 | | | | 5.750 | | | 06/15/25 | | | 995,940 | |
| | Royal Bank of Canada (a)(c) (5 yr. CMT + 2.887%) | |
| | | | | 3,315,000 | | | | 7.500 | | | 05/02/84 | | | 3,484,463 | |
| | Standard Chartered PLC (a)(b)(c) (5 yr. CMT + 3.805%) | |
| | | | | 4,255,000 | | | | 4.750 | | | 01/14/31 | | | 3,736,188 | |
| | State Street Corp. (a)(c) (5 yr. CMT + 2.628%) | |
| | | | | 2,000,000 | | | | 6.700 | | | 09/15/29 | | | 2,055,200 | |
| | Toronto-Dominion Bank (a)(c) (5 yr. CMT + 4.075%) | |
| | | | | 2,000,000 | | | | 8.125 | | | 10/31/82 | | | 2,107,660 | |
| | Truist Financial Corp. (a)(c) (10 yr. CMT + 4.349%) | |
| | | | | 2,237,000 | | | | 5.100 | | | 03/01/30 | | | 2,172,015 | |
| | (5 yr. CMT + 4.605%) | |
| | | | | 1,000,000 | | | | 4.950 | | | 09/01/25 | | | 990,450 | |
| | Turkiye Garanti Bankasi AS (a)(b)(c) (5 yr. CMT + 4.090%) | |
| | | | | 510,000 | | | | 8.375 | | | 02/28/34 | | | 520,838 | |
| | U.S. Bancorp (a)(c) (5 yr. CMT + 2.541%) | |
| | | | | 1,000,000 | | | | 3.700 | | | 01/15/27 | | | 937,800 | |
| | UBS Group AG (a) | |
| | | | | 1,726,000 | | | | 4.282 | (b) | | 01/09/28 | | | 1,688,598 | |
| | (5 yr. CMT + 3.098%) | |
| | | | | 4,801,000 | | | | 3.875 | (b)(c) | | 06/02/26 | | | 4,545,443 | |
| | (5 yr. CMT + 4.745%) | |
| | | | | 5,590,000 | | | | 9.250 | (b)(c) | | 11/13/28 | | | 6,084,994 | |
| | (5 yr. USD Swap + 4.590%) | |
| | | | | 4,000,000 | | | | 6.875 | (c) | | 08/07/25 | | | 4,014,480 | |
| | | |
| | |
| 2 | | The accompanying notes are an integral part of these financial statements. |
GOLDMAN SACHS INCOME BUILDER FUND
| | | | | | | | | | | | | | | | |
| | | Principal Amount | | | Interest Rate | | | Maturity Date | | Value | |
| |
| | Corporate Obligations – (continued) | |
| |
| | Banks – (continued) | |
| | UniCredit SpA (a)(b)(c) (5 yr. CMT + 4.750%) | |
| | $ | | | 1,525,000 | | | | 5.459 | % | | 06/30/35 | | $ | 1,471,442 | |
| | United Bank for Africa PLC | |
| | | | | 200,000 | | | | 6.750 | | | 11/19/26 | | | 195,910 | |
| | Uzbek Industrial & Construction Bank ATB (b) | |
| | | | | 550,000 | | | | 8.950 | | | 07/24/29 | | | 552,200 | |
| | Wells Fargo & Co. (a)(c) | |
| | (5 yr. CMT + 2.767%) | |
| | | | | 2,275,000 | | | | 6.850 | | | 09/15/29 | | | 2,352,577 | |
| | (5 yr. CMT + 3.453%) | |
| | | | | 1,000,000 | | | | 3.900 | | | 03/15/26 | | | 967,690 | |
| | (5 yr. CMT + 3.606%) | |
| | | | | 1,000,000 | | | | 7.625 | | | 09/15/28 | | | 1,072,620 | |
| | Yapi ve Kredi Bankasi AS (b) | |
| | | | | 510,000 | | | | 9.250 | | | 10/16/28 | | | 554,625 | |
| | (5 yr. CMT + 5.278%) | |
| | | | | 450,000 | | | | 9.250 | (a)(c) | | 01/17/34 | | | 473,344 | |
| | (5 yr. CMT + 5.499%) | |
| | | | | 470,000 | | | | 9.743 | (a)(c) | | 04/04/29 | | | 486,450 | |
| | | | | | | | | | | | | | | | |
| | | | | | | | | | | | | | | 133,496,812 | |
| | | |
| |
| | Beverages(a) – 0.6% | |
| | Anadolu Efes Biracilik Ve Malt Sanayii AS | |
| | | | | 420,000 | | | | 3.375 | (b) | | 06/29/28 | | | 371,306 | |
| | | | | 950,000 | | | | 3.375 | | | 06/29/28 | | | 839,860 | |
| | Anheuser-Busch Cos. LLC/Anheuser-Busch InBev Worldwide, Inc. | |
| | | | | 8,050,000 | | | | 4.700 | | | 02/01/36 | | | 7,762,132 | |
| | Becle SAB de CV | |
| | | | | 610,000 | | | | 2.500 | | | 10/14/31 | | | 492,575 | |
| | Central American Bottling Corp./CBC Bottling Holdco SL/Beliv Holdco SL (b) | |
| | | | | 680,000 | | | | 5.250 | | | 04/27/29 | | | 652,800 | |
| | Constellation Brands, Inc. | |
| | | | | 3,975,000 | | | | 2.250 | | | 08/01/31 | | | 3,347,944 | |
| | Keurig Dr. Pepper, Inc. | |
| | | | | 308,000 | | | | 3.800 | | | 05/01/50 | | | 236,208 | |
| | | | | | | | | | | | | | | | |
| | | | | | | | | | | | | | | 13,702,825 | |
| | | |
| |
| | Building Materials(a) – 0.5% | |
| | Builders FirstSource, Inc. (b) | |
| | | | | 1,800,000 | | | | 5.000 | | | 03/01/30 | | | 1,723,572 | |
| | Cemex SAB de CV (c) | |
| | (5 yr. CMT + 4.534%) | |
| | | | | 800,000 | | | | 5.125 | (b) | | 06/08/26 | | | 776,488 | |
| | | | | 460,000 | | | | 5.125 | | | 06/08/26 | | | 446,481 | |
| | (5 yr. CMT + 5.157%) | |
| | | | | 590,000 | | | | 9.125 | (b) | | 03/14/28 | | | 628,533 | |
| | GCC SAB de CV (b) | |
| | | | | 860,000 | | | | 3.614 | | | 04/20/32 | | | 748,596 | |
| | Sisecam U.K. PLC (b) | |
| | | | | 230,000 | | | | 8.250 | | | 05/02/29 | | | 235,607 | |
| | | | | 630,000 | | | | 8.625 | | | 05/02/32 | | | 642,600 | |
| | Standard Industries, Inc. (b) | |
| | | | | 1,880,000 | | | | 4.375 | | | 07/15/30 | | | 1,730,051 | |
| | | |
| | | | | | | | | | | | | | | | |
| | | Principal Amount | | | Interest Rate | | | Maturity Date | | Value | |
| |
| | Corporate Obligations – (continued) | |
| |
| | Building Materials(a) – (continued) | |
| | $ | | | 4,054,000 | | | | 3.375 | % | | 01/15/31 | | $ | 3,520,129 | |
| | | | | 1,760,000 | | | | 6.500 | | | 08/15/32 | | | 1,771,686 | |
| | | | | | | | | | | | | | | | |
| | | | | | | | | | | | | | | 12,223,743 | |
| | | |
| |
| | Chemicals – 1.1% | |
| | Ashland, Inc. (a)(b) | |
| | | | | 3,225,000 | | | | 3.375 | | | 09/01/31 | | | 2,798,332 | |
| | Avient Corp. (a)(b) | |
| | | | | 1,725,000 | | | | 7.125 | | | 08/01/30 | | | 1,774,559 | |
| | Axalta Coating Systems LLC (a)(b) | |
| | | | | 3,100,000 | | | | 3.375 | | | 02/15/29 | | | 2,851,411 | |
| | Chemours Co. (a)(b) | |
| | | | | 4,560,000 | | | | 4.625 | | | 11/15/29 | | | 3,952,745 | |
| | Huntsman International LLC (a) | |
| | | | | 2,104,000 | | | | 4.500 | | | 05/01/29 | | | 2,021,355 | |
| | Ingevity Corp. (a)(b) | |
| | | | | 1,305,000 | | | | 3.875 | | | 11/01/28 | | | 1,202,558 | |
| | LG Chem Ltd. (e) | |
| | | | | 200,000 | | | | 1.250 | | | 07/18/28 | | | 195,194 | |
| | Minerals Technologies, Inc. (a)(b) | |
| | | | | 1,695,000 | | | | 5.000 | | | 07/01/28 | | | 1,641,014 | |
| | OCP SA (a) | |
| | | | | 960,000 | | | | 5.125 | | | 06/23/51 | | | 729,533 | |
| | Olympus Water U.S. Holding Corp. (a)(b) | |
| | | | | 2,500,000 | | | | 9.750 | | | 11/15/28 | | | 2,653,150 | |
| | | | | 1,925,000 | | | | 7.250 | | | 06/15/31 | | | 1,975,127 | |
| | Sasol Financing USA LLC (a) | |
| | | | | 280,000 | | | | 4.375 | | | 09/18/26 | | | 270,025 | |
| | | | | 890,000 | | | | 5.500 | | | 03/18/31 | | | 766,234 | |
| | SNF Group SACA (a)(b) | |
| | | | | 740,000 | | | | 3.125 | | | 03/15/27 | | | 703,673 | |
| | | | | 925,000 | | | | 3.375 | | | 03/15/30 | | | 827,505 | |
| | Valvoline, Inc. (a)(b) | |
| | | | | 885,000 | | | | 3.625 | | | 06/15/31 | | | 767,304 | |
| | WR Grace Holdings LLC (a)(b) | |
| | | | | 1,855,000 | | | | 5.625 | | | 08/15/29 | | | 1,712,833 | |
| | | | | | | | | | | | | | | | |
| | | | | | | | | | | | | | | 26,842,552 | |
| | | |
| |
| | Commercial Services(a) – 1.6% | |
| | ADT Security Corp. (b) | |
| | | | | 4,387,000 | | | | 4.125 | | | 08/01/29 | | | 4,102,152 | |
| | APi Group DE, Inc. (b) | |
| | | | | 4,030,000 | | | | 4.125 | | | 07/15/29 | | | 3,715,579 | |
| | | | | 575,000 | | | | 4.750 | | | 10/15/29 | | | 545,457 | |
| | Belron U.K. Finance PLC (b) | |
| | | | | 1,115,000 | | | | 5.750 | | | 10/15/29 | | | 1,117,308 | |
| | Bidvest Group U.K. PLC (b) | |
| | | | | 1,260,000 | | | | 3.625 | | | 09/23/26 | | | 1,222,200 | |
| | Garda World Security Corp. (b) | |
| | | | | 1,807,000 | | | | 7.750 | | | 02/15/28 | | | 1,865,854 | |
| | | | | 1,040,000 | | | | 8.250 | | | 08/01/32 | | | 1,034,426 | |
| | | | | 745,000 | | | | 8.375 | | | 11/15/32 | | | 744,724 | |
| | HealthEquity, Inc. (b) | |
| | | | | 1,058,000 | | | | 4.500 | | | 10/01/29 | | | 1,006,486 | |
| | | |
| | |
| The accompanying notes are an integral part of these financial statements. | | 3 |
GOLDMAN SACHS INCOME BUILDER FUND
|
Schedule of Investments (continued) October 31, 2024 |
| | | | | | | | | | | | | | | | |
| | | Principal Amount | | | Interest Rate | | | Maturity Date | | Value | |
| |
| | Corporate Obligations – (continued) | |
| |
| | Commercial Services(a) – (continued) | |
| | Hertz Corp. (b) | |
| | $ | | | 1,165,000 | | | | 12.625 | % | | 07/15/29 | | $ | 1,235,051 | |
| | Limak Iskenderun Uluslararasi Liman Isletmeciligi AS (b) | |
| | | | | 886,604 | | | | 9.500 | | | 07/10/36 | | | 836,183 | |
| | Mavis Tire Express Services Topco Corp. (b) | |
| | | | | 2,621,000 | | | | 6.500 | | | 05/15/29 | | | 2,510,079 | |
| | Mersin Uluslararasi Liman Isletmeciligi AS (b) | |
| | | | | 1,660,000 | | | | 8.250 | | | 11/15/28 | | | 1,718,100 | |
| | Techem Verwaltungsgesellschaft 674 GmbH | |
| | EUR | | | 668,190 | | | | 6.000 | | | 07/30/26 | | | 727,209 | |
| | Verisure Holding AB (b) | |
| | | | | 725,000 | | | | 3.250 | | | 02/15/27 | | | 775,788 | |
| | | | | 2,133,000 | | | | 5.500 | | | 05/15/30 | | | 2,401,980 | |
| | Verisure Midholding AB | |
| | | | | 800,000 | | | | 5.250 | (b) | | 02/15/29 | | | 869,025 | |
| | | | | 1,450,000 | | | | 5.250 | | | 02/15/29 | | | 1,575,108 | |
| | VT Topco, Inc. (b) | |
| | $ | | | 5,282,000 | | | | 8.500 | | | 08/15/30 | | | 5,557,668 | |
| | Wand NewCo 3, Inc. (b) | |
| | | | | 2,944,000 | | | | 7.625 | | | 01/30/32 | | | 3,040,799 | |
| | Williams Scotsman, Inc. (b) | |
| | | | | 1,878,000 | | | | 6.625 | | | 06/15/29 | | | 1,906,996 | |
| | | | | | | | | | | | | | | | |
| | | | | | | | | | | | | | | 38,508,172 | |
| | | |
| |
| | Computers(a) – 0.6% | |
| | Amentum Holdings, Inc. (b) | |
| | | | | 695,000 | | | | 7.250 | | | 08/01/32 | | | 720,430 | |
| | Booz Allen Hamilton, Inc. (b) | |
| | | | | 2,513,000 | | | | 3.875 | | | 09/01/28 | | | 2,408,786 | |
| | Dell International LLC/EMC Corp. | |
| | | | | 2,699,000 | | | | 8.100 | | | 07/15/36 | | | 3,258,503 | |
| | Hewlett Packard Enterprise Co. | |
| | | | | 2,730,000 | | | | 6.200 | | | 10/15/35 | | | 2,904,966 | |
| | KBR, Inc. (b) | |
| | | | | 1,161,000 | | | | 4.750 | | | 09/30/28 | | | 1,116,011 | |
| | McAfee Corp. (b) | |
| | | | | 3,435,000 | | | | 7.375 | | | 02/15/30 | | | 3,314,809 | |
| | Virtusa Corp. (b) | |
| | | | | 2,371,000 | | | | 7.125 | | | 12/15/28 | | | 2,301,364 | |
| | | | | | | | | | | | | | | | |
| | | | | | | | | | | | | | | 16,024,869 | |
| | | |
| |
| | Cosmetics & Personal Care(a) – 0.0% | |
| | Perrigo Finance Unlimited Co. | |
| | | | | 860,000 | | | | 6.125 | | | 09/30/32 | | | 848,209 | |
| | | |
| |
| | Distribution & Wholesale(a)(b) – 0.3% | |
| | American Builders & Contractors Supply Co., Inc. | |
| | | | | 2,760,000 | | | | 3.875 | | | 11/15/29 | | | 2,524,572 | |
| | BCPE Empire Holdings, Inc. | |
| | | | | 2,436,000 | | | | 7.625 | | | 05/01/27 | | | 2,450,251 | |
| | H&E Equipment Services, Inc. | |
| | | | | 2,105,000 | | | | 3.875 | | | 12/15/28 | | | 1,944,599 | |
| | Telecommunications Co. Telekom Srbija AD Belgrade | |
| | | | | 200,000 | | | | 7.000 | | | 10/28/29 | | | 200,230 | |
| | | | | | | | | | | | | | | | |
| | | | | | | | | | | | | | | 7,119,652 | |
| | | |
| | | | | | | | | | | | | | | | |
| | | Principal Amount | | | Interest Rate | | | Maturity Date | | Value | |
| |
| | Corporate Obligations – (continued) | |
| |
| | Diversified Financial Services – 2.7% | |
| | AerCap Ireland Capital DAC/AerCap Global Aviation Trust (a) | |
| | $ | | | 3,625,000 | | | | 3.000 | % | | 10/29/28 | | $ | 3,363,601 | |
| | (5 yr. CMT + 2.720%) | |
| | | | | 2,000,000 | | | | 6.950 | (c) | | 03/10/55 | | | 2,059,820 | |
| | AG TTMT Escrow Issuer LLC (a)(b) | |
| | | | | 1,025,000 | | | | 8.625 | | | 09/30/27 | | | 1,058,620 | |
| | Air Lease Corp. (a)(c) (5 yr. CMT + 2.560%) | |
| | | | | 530,000 | | | | 6.000 | | | 09/24/29 | | | 524,149 | |
| | Ally Financial, Inc. | |
| | | | | 4,000,000 | | | | 8.000 | | | 11/01/31 | | | 4,449,920 | |
| | (7 yr. CMT + 3.481%) | |
| | | | | 3,415,000 | | | | 4.700 | (a)(c) | | 05/15/28 | | | 2,775,131 | |
| | American Express Co. (a)(c) (5 yr. CMT + 2.854%) | |
| | | | | 1,000,000 | | | | 3.550 | | | 09/15/26 | | | 948,670 | |
| | Aviation Capital Group LLC (a)(b) | |
| | | | | 800,000 | | | | 1.950 | | | 01/30/26 | | | 768,320 | |
| | Avolon Holdings Funding Ltd. (a)(b) | |
| | | | | 1,300,000 | | | | 3.250 | | | 02/15/27 | | | 1,244,295 | |
| | | | | 1,927,000 | | | | 2.528 | | | 11/18/27 | | | 1,780,452 | |
| | Castlelake Aviation Finance DAC (a)(b) | |
| | | | | 2,420,000 | | | | 5.000 | | | 04/15/27 | | | 2,435,198 | |
| | Charles Schwab Corp. (a)(c) | |
| | (5 yr. CMT + 3.168%) | |
| | | | | 2,875,000 | | | | 4.000 | | | 06/01/26 | | | 2,758,505 | |
| | (5 yr. CMT + 4.971%) | |
| | | | | 2,250,000 | | | | 5.375 | | | 06/01/25 | | | 2,244,375 | |
| | Discover Financial Services (a)(c) (5 yr. CMT + 5.783%) | |
| | | | | 1,000,000 | | | | 6.125 | | | 06/23/25 | | | 997,970 | |
| | Focus Financial Partners LLC (a)(b) | |
| | | | | 2,225,000 | | | | 6.750 | | | 09/15/31 | | | 2,210,693 | |
| | Freedom Mortgage Holdings LLC (a)(b) | |
| | | | | 5,075,000 | | | | 9.250 | | | 02/01/29 | | | 5,203,194 | |
| | Intercorp Financial Services, Inc. (a) | |
| | | | | 340,000 | | | | 4.125 | | | 10/19/27 | | | 325,019 | |
| | Jane Street Group/JSG Finance, Inc. (a)(b) | |
| | | | | 2,640,000 | | | | 6.125 | | | 11/01/32 | | | 2,642,957 | |
| | Jefferies Finance LLC/JFIN Co-Issuer Corp. (a)(b) | |
| | | | | 3,269,000 | | | | 5.000 | | | 08/15/28 | | | 3,017,549 | |
| | Macquarie Airfinance Holdings Ltd. (a)(b) | |
| | | | | 355,000 | | | | 6.400 | | | 03/26/29 | | | 365,994 | |
| | | | | 1,950,000 | | | | 8.125 | | | 03/30/29 | | | 2,060,702 | |
| | Midcap Financial Issuer Trust (a)(b) | |
| | | | | 2,567,000 | | | | 6.500 | | | 05/01/28 | | | 2,428,613 | |
| | | | | 810,000 | | | | 5.625 | | | 01/15/30 | | | 717,684 | |
| | Nationstar Mortgage Holdings, Inc. (a)(b) | |
| | | | | 2,651,000 | | | | 5.500 | | | 08/15/28 | | | 2,590,080 | |
| | Navient Corp. (a) | |
| | | | | 2,388,000 | | | | 5.500 | | | 03/15/29 | | | 2,274,809 | |
| | | | | 1,715,000 | | | | 9.375 | | | 07/25/30 | | | 1,860,123 | |
| | OneMain Finance Corp. | |
| | | | | 1,602,000 | | | | 7.125 | | | 03/15/26 | | | 1,641,249 | |
| | | | | 1,643,000 | | | | 4.000 | (a) | | 09/15/30 | | | 1,446,185 | |
| | ONEMAIN FINANCE Corp. | |
| | | | | 1,815,000 | | | | 6.625 | | | 05/15/29 | | | 1,815,000 | |
| | | |
| | |
| 4 | | The accompanying notes are an integral part of these financial statements. |
GOLDMAN SACHS INCOME BUILDER FUND
| | | | | | | | | | | | | | | | |
| | | Principal Amount | | | Interest Rate | | | Maturity Date | | Value | |
| |
| | Corporate Obligations – (continued) | |
| |
| | Diversified Financial Services – (continued) | |
| | Oxford Finance LLC/Oxford Finance Co-Issuer II, Inc. (a)(b) | |
| | $ | | | 1,365,000 | | | | 6.375 | % | | 02/01/27 | | $ | 1,345,399 | |
| | Rocket Mortgage LLC/Rocket Mortgage Co-Issuer, Inc. (a)(b) | |
| | | | | 2,390,000 | | | | 4.000 | | | 10/15/33 | | | 2,058,746 | |
| | StoneX Group, Inc. (a)(b) | |
| | | | | 1,785,000 | | | | 7.875 | | | 03/01/31 | | | 1,878,873 | |
| | United Wholesale Mortgage LLC (a)(b) | |
| | | | | 3,195,000 | | | | 5.500 | | | 04/15/29 | | | 3,045,889 | |
| | VFH Parent LLC/Valor Co-Issuer, Inc. (a)(b) | |
| | | | | 1,570,000 | | | | 7.500 | | | 06/15/31 | | | 1,614,619 | |
| | | | | | | | | | | | | | | | |
| | | | | | | | | | | | | | | 67,952,403 | |
| | | |
| |
| | Electrical – 1.2% | |
| | Adani Electricity Mumbai Ltd. | |
| | | | | 410,000 | | | | 3.949 | | | 02/12/30 | | | 360,800 | |
| | AES Panama Generation Holdings SRL (a) | |
| | | | | 1,389,789 | | | | 4.375 | | | 05/31/30 | | | 1,227,878 | |
| | California Buyer Ltd./Atlantica Sustainable Infrastructure PLC (a)(b) | |
| | | | | 2,780,000 | | | | 6.375 | | | 02/15/32 | | | 2,759,289 | |
| | Calpine Corp. (a)(b) | |
| | | | | 4,215,000 | | | | 3.750 | | | 03/01/31 | | | 3,797,884 | |
| | Cikarang Listrindo Tbk. PT (a) | |
| | | | | 200,000 | | | | 4.950 | | | 09/14/26 | | | 198,000 | |
| | Energuate Trust (a)(b) | |
| | | | | 470,000 | | | | 5.875 | | | 05/03/27 | | | 457,663 | |
| | EnfraGen Energia Sur SA/EnfraGen Spain SA/Prime Energia SpA (a) | |
| | | | | 200,000 | | | | 5.375 | | | 12/30/30 | | | 173,096 | |
| | Eskom Holdings SOC Ltd. | |
| | | | | 430,000 | | | | 7.125 | | | 02/11/25 | | | 429,329 | |
| | | | | 220,000 | | | | 6.350 | (f) | | 08/10/28 | | | 219,725 | |
| | | | | 458,000 | | | | 8.450 | | | 08/10/28 | | | 477,896 | |
| | FIEMEX Energia - Banco Actinver SA Institucion de Banca Multiple (a)(b) | |
| | | | | 210,000 | | | | 7.250 | | | 01/31/41 | | | 209,921 | |
| | Huachen Energy Co. Ltd. (a)(g) (PIK 2.350%, Cash 2.300%) | |
| | | | | 464,110 | | | | 2.300 | | | 12/29/26 | | | 262,218 | |
| | Lamar Funding Ltd. | |
| | | | | 470,000 | | | | 3.958 | | | 05/07/25 | | | 464,769 | |
| | Lightning Power LLC (a)(b) | |
| | | | | 2,020,000 | | | | 7.250 | | | 08/15/32 | | | 2,102,436 | |
| | LLPL Capital Pte. Ltd. | |
| | | | | 347,714 | | | | 6.875 | | | 02/04/39 | | | 354,016 | |
| | Minejesa Capital BV | |
| | | | | 223,496 | | | | 4.625 | | | 08/10/30 | | | 218,048 | |
| | Mong Duong Finance Holdings BV (a) | |
| | | | | 733,654 | | | | 5.125 | | | 05/07/29 | | | 713,024 | |
| | National Central Cooling Co. PJSC | |
| | | | | 820,000 | | | | 2.500 | | | 10/21/27 | | | 761,831 | |
| | NextEra Energy Operating Partners LP (a)(b) | |
| | | | | 2,025,000 | | | | 7.250 | | | 01/15/29 | | | 2,083,867 | |
| | NRG Energy, Inc. (a) | |
| | | | | 115,000 | | | | 5.750 | | | 01/15/28 | | | 115,163 | |
| | | | | 448,000 | | | | 3.375 | (b) | | 02/15/29 | | | 409,136 | |
| | | |
| | | | | | | | | | | | | | | | |
| | | Principal Amount | | | Interest Rate | | | Maturity Date | | Value | |
| |
| | Corporate Obligations – (continued) | |
| |
| | Electrical – (continued) | |
| | $ | | | 5,153,000 | | | | 5.750 | %(b) | | 07/15/29 | | $ | 5,108,421 | |
| | Pacific Gas & Electric Co. (a) | |
| | | | | 1,470,000 | | | | 3.500 | | | 08/01/50 | | | 1,023,414 | |
| | Pike Corp. (a)(b) | |
| | | | | 2,420,000 | | | | 5.500 | | | 09/01/28 | | | 2,369,422 | |
| | | | | 820,000 | | | | 8.625 | | | 01/31/31 | | | 873,685 | |
| | Sempra (a)(c) (5 yr. CMT + 4.550%) | |
| | | | | 3,335,000 | | | | 4.875 | | | 10/15/25 | | | 3,303,218 | |
| | | | | | | | | | | | | | | | |
| | | | | | | | | | | | | | | 30,474,149 | |
| | | |
| |
| | Electrical Components & Equipment(a)(b) – 0.1% | |
| | WESCO Distribution, Inc. | |
| | | | | 1,000,000 | | | | 6.375 | | | 03/15/29 | | | 1,019,980 | |
| | | | | 760,000 | | | | 6.625 | | | 03/15/32 | | | 779,205 | |
| | | | | | | | | | | | | | | | |
| | | | | | | | | | | | | | | 1,799,185 | |
| | | |
| |
| | Electronics(a)(b) – 0.2% | |
| | Imola Merger Corp. | |
| | | | | 4,498,000 | | | | 4.750 | | | 05/15/29 | | | 4,374,080 | |
| | TTM Technologies, Inc. | |
| | | | | 799,000 | | | | 4.000 | | | 03/01/29 | | | 746,857 | |
| | | | | | | | | | | | | | | | |
| | | | | | | | | | | | | | | 5,120,937 | |
| | | |
| |
| | Energy-Alternate Sources(a) – 0.0% | |
| | Greenko Wind Projects Mauritius Ltd. | |
| | | | | 380,000 | | | | 5.500 | | | 04/06/25 | | | 378,400 | |
| | | |
| |
| | Engineering & Construction(a) – 0.7% | |
| | Aeropuerto Internacional de Tocumen SA | |
| | | | | 1,040,000 | | | | 5.125 | | | 08/11/61 | | | 785,200 | |
| | Aeropuertos Dominicanos Siglo XXI SA (b) | |
| | | | | 1,380,000 | | | | 7.000 | | | 06/30/34 | | | 1,407,600 | |
| | Arcosa, Inc. (b) | |
| | | | | 1,221,000 | | | | 4.375 | | | 04/15/29 | | | 1,150,719 | |
| | | | | 615,000 | | | | 6.875 | | | 08/15/32 | | | 630,830 | |
| | ATP Tower Holdings LLC/Andean Tower Partners Colombia SAS/Andean Telecom Partners | |
| | | | | 950,000 | | | | 4.050 | (b) | | 04/27/26 | | | 915,990 | |
| | | | | 200,000 | | | | 4.050 | | | 04/27/26 | | | 192,840 | |
| | Dycom Industries, Inc. (b) | |
| | | | | 2,764,000 | | | | 4.500 | | | 04/15/29 | | | 2,607,558 | |
| | Global Infrastructure Solutions, Inc. (b) | |
| | | | | 4,435,000 | | | | 5.625 | | | 06/01/29 | | | 4,324,214 | |
| | | | | 1,390,000 | | | | 7.500 | | | 04/15/32 | | | 1,412,949 | |
| | IHS Holding Ltd. (b) | |
| | | | | 750,000 | | | | 5.625 | | | 11/29/26 | | | 734,655 | |
| | | | | 200,000 | | | | 6.250 | | | 11/29/28 | | | 187,460 | |
| | International Airport Finance SA | |
| | | | | 630,383 | | | | 12.000 | | | 03/15/33 | | | 672,540 | |
| | Kingston Airport Revenue Finance Ltd. (b) | |
| | | | | 739,000 | | | | 6.750 | | | 12/15/36 | | | 748,141 | |
| | Mexico City Airport Trust | |
| | | | | 490,000 | | | | 3.875 | | | 04/30/28 | | | 466,122 | |
| | | | | 320,000 | | | | 5.500 | | | 10/31/46 | | | 266,202 | |
| | | |
| | |
| The accompanying notes are an integral part of these financial statements. | | 5 |
GOLDMAN SACHS INCOME BUILDER FUND
|
Schedule of Investments (continued) October 31, 2024 |
| | | | | | | | | | | | | | | | |
| | | Principal Amount | | | Interest Rate | | | Maturity Date | | Value | |
| |
| | Corporate Obligations – (continued) | |
| |
| | Engineering & Construction(a) – (continued) | |
| | $ | | | 930,000 | | | | 5.500 | % | | 07/31/47 | | $ | 773,937 | |
| | | | | | | | | | | | | | | | |
| | | | | 17,276,957 | |
| | | |
| |
| | Entertainment(a) – 1.5% | |
| | AMC Entertainment Holdings, Inc. (b) | |
| | | | | 853,000 | | | | 7.500 | | | 02/15/29 | | | 736,378 | |
| | Boyne USA, Inc. (b) | |
| | | | | 2,706,000 | | | | 4.750 | | | 05/15/29 | | | 2,578,602 | |
| | Caesars Entertainment, Inc. (b) | |
| | | | | 4,508,000 | | | | 4.625 | | | 10/15/29 | | | 4,225,123 | |
| | | | | 1,380,000 | | | | 6.000 | | | 10/15/32 | | | 1,346,300 | |
| | Cinemark USA, Inc. (b) | |
| | | | | 3,842,000 | | | | 5.250 | | | 07/15/28 | | | 3,772,345 | |
| | | | | 1,110,000 | | | | 7.000 | | | 08/01/32 | | | 1,138,694 | |
| | Cirsa Finance International SARL (b) | |
| | EUR | | | 511,000 | | | | 6.500 | | | 03/15/29 | | | 584,427 | |
| | Light & Wonder International, Inc. (b) | |
| | $ | | | 500,000 | | | | 7.000 | | | 05/15/28 | | | 502,195 | |
| | Lions Gate Capital Holdings LLC (b) | |
| | | | | 2,540,000 | | | | 5.500 | | | 04/15/29 | | | 1,837,893 | |
| | Merlin Entertainments Group U.S. Holdings, Inc. (b) | |
| | | | | 1,405,000 | | | | 7.375 | | | 02/15/31 | | | 1,378,389 | |
| | Motion Bondco DAC (b) | |
| | | | | 3,250,000 | | | | 6.625 | | | 11/15/27 | | | 3,067,545 | |
| | Penn Entertainment, Inc. (b) | |
| | | | | 3,067,000 | | | | 4.125 | | | 07/01/29 | | | 2,751,896 | |
| | SeaWorld Parks & Entertainment, Inc. (b) | |
| | | | | 4,880,000 | | | | 5.250 | | | 08/15/29 | | | 4,689,680 | |
| | Six Flags Entertainment Corp. (b) | |
| | | | | 1,854,000 | | | | 5.500 | | | 04/15/27 | | | 1,841,819 | |
| | Warnermedia Holdings, Inc. | |
| | | | | 2,300,000 | | | | 4.054 | | | 03/15/29 | | | 2,148,821 | |
| | | | | 4,775,000 | | | | 4.279 | | | 03/15/32 | | | 4,188,630 | |
| | | | | | | | | | | | | | | | |
| | | | | 36,788,737 | |
| | | |
| |
| | Environmental(a) – 0.5% | |
| | GFL Environmental, Inc. (b) | |
| | | | | 6,980,000 | | | | 4.000 | | | 08/01/28 | | | 6,596,030 | |
| | Madison IAQ LLC (b) | |
| | | | | 4,294,000 | | | | 4.125 | | | 06/30/28 | | | 4,065,388 | |
| | | | | 1,659,000 | | | | 5.875 | | | 06/30/29 | | | 1,573,080 | |
| | Reworld Holding Corp. | |
| | | | | 670,000 | | | | 5.000 | | | 09/01/30 | | | 615,295 | |
| | | | | | | | | | | | | | | | |
| | | | | 12,849,793 | |
| | | |
| |
| | Food & Drug Retailing – 1.1% | |
| | Albertsons Cos., Inc./Safeway, Inc./New Albertsons LP/Albertsons LLC (a)(b) | |
| | | | | 2,595,000 | | | | 4.625 | | | 01/15/27 | | | 2,543,775 | |
| | | | | 1,995,000 | | | | 5.875 | | | 02/15/28 | | | 1,998,352 | |
| | | | | 502,000 | | | | 4.875 | | | 02/15/30 | | | 490,665 | |
| | BRF GmbH | |
| | | | | 317,000 | | | | 4.350 | | | 09/29/26 | | | 311,677 | |
| | Chobani Holdco II LLC (a)(b)(g) (PIK 8.750%, Cash 9.500%) | |
| | | | | 440,000 | | | | 9.500 | | | 10/01/29 | | | 453,996 | |
| | | |
| | | | | | | | | | | | | | | | |
| | | Principal Amount | | | Interest Rate | | | Maturity Date | | Value | |
| |
| | Corporate Obligations – (continued) | |
| |
| | Food & Drug Retailing – (continued) | |
| | H-Food Holdings LLC/Hearthside Finance Co., Inc. (a)(b) | |
| | $ | | | 2,820,000 | | | | 8.500 | % | | 06/01/26 | | $ | 208,201 | |
| | Kraft Heinz Foods Co. (a) | |
| | | | | 2,303,000 | | | | 5.000 | | | 07/15/35 | | | 2,275,663 | |
| | | | | 2,592,000 | | | | 4.375 | | | 06/01/46 | | | 2,172,200 | |
| | Performance Food Group, Inc. (a)(b) | |
| | | | | 1,150,000 | | | | 5.500 | | | 10/15/27 | | | 1,141,329 | |
| | Post Holdings, Inc. (a)(b) | |
| | | | | 5,984,000 | | | | 4.625 | | | 04/15/30 | | | 5,595,519 | |
| | | | | 3,766,000 | | | | 6.375 | | | 03/01/33 | | | 3,729,168 | |
| | U.S. Foods, Inc. (a)(b) | |
| | | | | 2,690,000 | | | | 4.750 | | | 02/15/29 | | | 2,592,299 | |
| | | | | 1,020,000 | | | | 4.625 | | | 06/01/30 | | | 967,990 | |
| | United Natural Foods, Inc. (a)(b) | |
| | | | | 2,295,000 | | | | 6.750 | | | 10/15/28 | | | 2,216,006 | |
| | | | | | | | | | | | | | | | |
| | | | | 26,696,840 | |
| | | |
| |
| | Forest Products & Paper(a)(b) – 0.0% | |
| | Inversiones CMPC SA | |
| | | | | 200,000 | | | | 6.125 | | | 06/23/33 | | | 204,120 | |
| | | | | 310,000 | | | | 6.125 | | | 02/26/34 | | | 315,890 | |
| | | | | | | | | | | | | | | | |
| | | | | 520,010 | |
| | | |
| |
| | Hand/Machine Tools(a) – 0.1% | |
| | Regal Rexnord Corp. | |
| | | | | 2,020,000 | | | | 6.300 | | | 02/15/30 | | | 2,089,306 | |
| | | |
| |
| | Healthcare Providers & Services(a) – 1.4% | |
| | CAB SELAS | |
| | EUR | | | 1,175,000 | | | | 3.375 | (b) | | 02/01/28 | | | 1,185,277 | |
| | | | | 1,307,000 | | | | 3.375 | | | 02/01/28 | | | 1,318,432 | |
| | Catalent Pharma Solutions, Inc. (b) | |
| | $ | | | 1,005,000 | | | | 3.125 | | | 02/15/29 | | | 977,182 | |
| | | | | 603,000 | | | | 3.500 | | | 04/01/30 | | | 584,578 | |
| | DaVita, Inc. (b) | |
| | | | | 7,070,000 | | | | 3.750 | | | 02/15/31 | | | 6,152,243 | |
| | Encompass Health Corp. | |
| | | | | 1,200,000 | | | | 4.500 | | | 02/01/28 | | | 1,166,940 | |
| | Laboratoire Eimer Selas | |
| | EUR | | | 702,000 | | | | 5.000 | | | 02/01/29 | | | 658,567 | |
| | LifePoint Health, Inc. (b) | |
| | $ | | | 4,595,000 | | | | 5.375 | | | 01/15/29 | | | 4,202,265 | |
| | Medline Borrower LP (b) | |
| | | | | 3,270,000 | | | | 3.875 | | | 04/01/29 | | | 3,060,884 | |
| | | | | 4,574,000 | | | | 5.250 | | | 10/01/29 | | | 4,432,847 | |
| | Molina Healthcare, Inc. (b) | |
| | | | | 1,893,000 | | | | 3.875 | | | 05/15/32 | | | 1,679,034 | |
| | Prime Healthcare Services, Inc. (b) | |
| | | | | 1,600,000 | | | | 9.375 | | | 09/01/29 | | | 1,627,200 | |
| | Select Medical Corp. (b) | |
| | | | | 1,700,000 | | | | 6.250 | | | 08/15/26 | | | 1,704,250 | |
| | Tenet Healthcare Corp. | |
| | | | | 2,000,000 | | | | 6.250 | | | 02/01/27 | | | 2,001,140 | |
| | | | | 3,289,000 | | | | 6.125 | | | 06/15/30 | | | 3,299,689 | |
| | | | | | | | | | | | | | | | |
| | | | | 34,050,528 | |
| | | |
| | |
| 6 | | The accompanying notes are an integral part of these financial statements. |
GOLDMAN SACHS INCOME BUILDER FUND
| | | | | | | | | | | | | | | | |
| | | Principal Amount | | | Interest Rate | | | Maturity Date | | Value | |
| |
| | Corporate Obligations – (continued) | |
| |
| | Home Builders – 0.4% | |
| | Brookfield Residential Properties, Inc./Brookfield Residential U.S. LLC (a)(b) | |
| | $ | | | 1,642,000 | | | | 4.875 | % | | 02/15/30 | | $ | 1,528,817 | |
| | Installed Building Products, Inc. (a)(b) | |
| | | | | 800,000 | | | | 5.750 | | | 02/01/28 | | | 794,656 | |
| | KB Home (a) | |
| | | | | 1,805,000 | | | | 7.250 | | | 07/15/30 | | | 1,869,240 | |
| | PulteGroup, Inc. | |
| | | | | 3,000,000 | | | | 7.875 | | | 06/15/32 | | | 3,491,250 | |
| | Taylor Morrison Communities, Inc. (a)(b) | |
| | | | | 1,301,000 | | | | 5.125 | | | 08/01/30 | | | 1,260,604 | |
| | | | | | | | | | | | | | | | |
| | | | | 8,944,567 | |
| | | |
| |
| | Home Furnishings(a)(b) – 0.1% | |
| | Tempur Sealy International, Inc. | |
| | | | | 1,515,000 | | | | 3.875 | | | 10/15/31 | | | 1,319,004 | |
| | | |
| |
| | Household Products(a) – 0.1% | |
| | Central Garden & Pet Co. | |
| | | | | 1,380,000 | | | | 4.125 | | | 10/15/30 | | | 1,251,674 | |
| | Kronos Acquisition Holdings, Inc. (b) | |
| | | | | 1,280,000 | | | | 8.250 | | | 06/30/31 | | | 1,266,496 | |
| | Spectrum Brands, Inc. (b) | |
| | | | | 462,000 | | | | 3.875 | | | 03/15/31 | | | 406,195 | |
| | | | | | | | | | | | | | | | |
| | | | | 2,924,365 | |
| | | |
| |
| | Housewares(a) – 0.2% | |
| | Newell Brands, Inc. | |
| | | | | 495,000 | | | | 6.375 | | | 05/15/30 | | | 497,678 | |
| | | | | 760,000 | | | | 6.625 | | | 05/15/32 | | | 762,743 | |
| | | | | 1,380,000 | | | | 7.000 | | | 04/01/46 | | | 1,279,191 | |
| | Scotts Miracle-Gro Co. | |
| | | | | 3,702,000 | | | | 4.000 | | | 04/01/31 | | | 3,310,847 | |
| | | | | | | | | | | | | | | | |
| | | | | 5,850,459 | |
| | | |
| |
| | Insurance – 1.4% | |
| | Acrisure LLC/Acrisure Finance, Inc. (a)(b) | |
| | | | | 935,000 | | | | 8.250 | | | 02/01/29 | | | 950,437 | |
| | | | | 2,230,000 | | | | 4.250 | | | 02/15/29 | | | 2,098,006 | |
| | | | | 2,490,000 | | | | 6.000 | | | 08/01/29 | | | 2,353,772 | |
| | Alliant Holdings Intermediate LLC/Alliant Holdings Co-Issuer (a)(b) | |
| | | | | 1,666,000 | | | | 6.750 | | | 10/15/27 | | | 1,659,786 | |
| | | | | 5,500,000 | | | | 6.750 | | | 04/15/28 | | | 5,531,900 | |
| | American International Group, Inc. (a) | |
| | | | | 2,250,000 | | | | 3.400 | | | 06/30/30 | | | 2,084,153 | |
| | APH Somerset Investor 2 LLC/APH2 Somerset Investor 2 LLC/APH3 Somerset Inves (a)(b) | |
| | | | | 3,275,000 | | | | 7.875 | | | 11/01/29 | | | 3,271,594 | |
| | Ardonagh Group Finance Ltd. (a)(b) | |
| | | | | 4,416,000 | | | | 8.875 | | | 02/15/32 | | | 4,521,277 | |
| | BroadStreet Partners, Inc. (a)(b) | |
| | | | | 4,594,000 | | | | 5.875 | | | 04/15/29 | | | 4,378,817 | |
| | Fidelity & Guaranty Life Holdings, Inc. (a)(b) | |
| | | | | 900,000 | | | | 5.500 | | | 05/01/25 | | | 898,974 | |
| | | |
| | | | | | | | | | | | | | | | |
| | | Principal Amount | | | Interest Rate | | | Maturity Date | | Value | |
| |
| | Corporate Obligations – (continued) | |
| |
| | Insurance – (continued) | |
| | HUB International Ltd. (a)(b) | |
| | $ | | | 1,530,000 | | | | 7.375 | % | | 01/31/32 | | $ | 1,561,181 | |
| | Markel Group, Inc. (a)(c) (5 yr. CMT + 5.662%) | |
| | | | | 1,500,000 | | | | 6.000 | | | 06/01/25 | | | 1,495,875 | |
| | Prudential Financial, Inc. (a)(c) (5 yr. CMT + 3.234%) | |
| | | | | 2,500,000 | | | | 6.000 | | | 09/01/52 | | | 2,536,825 | |
| | Sagicor Financial Co. Ltd. (a)(b) | |
| | | | | 790,000 | | | | 5.300 | | | 05/13/28 | | | 767,288 | |
| | Transatlantic Holdings, Inc. | |
| | | | | 75,000 | | | | 8.000 | | | 11/30/39 | | | 94,031 | |
| | USI, Inc. (a)(b) | |
| | | | | 1,170,000 | | | | 7.500 | | | 01/15/32 | | | 1,194,125 | |
| | | | | | | | | | | | | | | | |
| | | | | 35,398,041 | |
| | | |
| |
| | Internet(a) – 1.1% | |
| | ANGI Group LLC (b) | |
| | | | | 2,604,000 | | | | 3.875 | | | 08/15/28 | | | 2,358,365 | |
| | Booking Holdings, Inc. | |
| | | | | 2,850,000 | | | | 4.625 | | | 04/13/30 | | | 2,840,168 | |
| | Expedia Group, Inc. | |
| | | | | 3,425,000 | | | | 3.250 | | | 02/15/30 | | | 3,166,687 | |
| | Getty Images, Inc. (b) | |
| | | | | 1,267,000 | | | | 9.750 | | | 03/01/27 | | | 1,262,768 | |
| | GrubHub Holdings, Inc. (b) | |
| | | | | 3,400,000 | | | | 5.500 | | | 07/01/27 | | | 3,166,522 | |
| | ION Trading Technologies SARL (b) | |
| | | | | 1,868,000 | | | | 5.750 | | | 05/15/28 | | | 1,687,682 | |
| | | | | 1,980,000 | | | | 9.500 | | | 05/30/29 | | | 2,014,650 | |
| | Match Group Holdings II LLC (b) | |
| | | | | 1,205,000 | | | | 5.625 | | | 02/15/29 | | | 1,188,178 | |
| | | | | 918,000 | | | | 3.625 | | | 10/01/31 | | | 804,076 | |
| | Meituan | |
| | | | | 480,000 | | | | 3.050 | | | 10/28/30 | | | 424,950 | |
| | Prosus NV | |
| | | | | 600,000 | | | | 3.257 | | | 01/19/27 | | | 573,000 | |
| | Uber Technologies, Inc. (b) | |
| | | | | 1,800,000 | | | | 6.250 | | | 01/15/28 | | | 1,817,820 | |
| | | | | 4,090,000 | | | | 4.500 | | | 08/15/29 | | | 3,980,715 | |
| | United Group BV | |
| | EUR | | | 1,225,000 | | | | 4.625 | (b) | | 08/15/28 | | | 1,306,117 | |
| | (3 mo. EUR EURIBOR + 4.250%) | |
| | | | | 1,125,000 | | | | 7.792 | (c) | | 02/15/31 | | | 1,220,659 | |
| | | | | | | | | | | | | | | | |
| | | | | 27,812,357 | |
| | | |
| |
| | Investment Companies(a) – 0.2% | |
| | Icahn Enterprises LP/Icahn Enterprises Finance Corp. | |
| | $ | | | 4,999,000 | | | | 4.375 | | | 02/01/29 | | | 4,170,466 | |
| | | |
| |
| | Iron/Steel(a) – 0.2% | |
| | CAP SA (b) | |
| | | | | 200,000 | | | | 3.900 | | | 04/27/31 | | | 161,750 | |
| | Cleveland-Cliffs, Inc. | |
| | | | | 2,250,000 | | | | 5.875 | | | 06/01/27 | | | 2,246,895 | |
| | | | | 1,280,000 | | | | 6.875 | (b) | | 11/01/29 | | | 1,284,442 | |
| | | | | 1,620,000 | | | | 4.875 | (b) | | 03/01/31 | | | 1,494,142 | |
| | | |
| | |
| The accompanying notes are an integral part of these financial statements. | | 7 |
GOLDMAN SACHS INCOME BUILDER FUND
|
Schedule of Investments (continued) October 31, 2024 |
| | | | | | | | | | | | | | | | |
| | | Principal Amount | | | Interest Rate | | | Maturity Date | | Value | |
| |
| | Corporate Obligations – (continued) | |
| |
| | Iron/Steel(a) – (continued) | |
| | Metinvest BV | |
| | $ | | | 200,000 | | | | 8.500 | % | | 04/23/26 | | $ | 153,000 | |
| | Samarco Mineracao SA (g) (PIK 9.049%, Cash 9.000%) | |
| | | | | 215,354 | | | | 9.000 | | | 06/30/31 | | | 203,688 | |
| | | | | | | | | | | | | | | | |
| | | | | 5,543,917 | |
| | | |
| |
| | Leisure Time(a)(b) – 0.5% | |
| | Acushnet Co. | |
| | | | | 325,000 | | | | 7.375 | | | 10/15/28 | | | 339,739 | |
| | Carnival Corp. | |
| | | | | 750,000 | | | | 7.000 | | | 08/15/29 | | | 784,163 | |
| | MajorDrive Holdings IV LLC | |
| | | | | 3,925,000 | | | | 6.375 | | | 06/01/29 | | | 3,764,114 | |
| | Royal Caribbean Cruises Ltd. | |
| | | | | 2,525,000 | | | | 5.625 | | | 09/30/31 | | | 2,516,794 | |
| | | | | 4,296,000 | | | | 6.250 | | | 03/15/32 | | | 4,377,108 | |
| | TUI Cruises GmbH | |
| | EUR | | | 994,938 | | | | 6.500 | | | 05/15/26 | | | 1,097,211 | |
| | | | | | | | | | | | | | | | |
| | | | | 12,879,129 | |
| | | |
| |
| | Lodging – 0.5% | |
| | Champion Path Holdings Ltd. (a) | |
| | $ | | | 200,000 | | | | 4.850 | | | 01/27/28 | | | 187,562 | |
| | Genting New York LLC/GENNY Capital, Inc. (a)(b) | |
| | | | | 4,425,000 | | | | 7.250 | | | 10/01/29 | | | 4,484,826 | |
| | Hilton Grand Vacations Borrower Escrow LLC/Hilton Grand Vacations Borrower Escrow, Inc. (a)(b) | |
| | | | | 3,795,000 | | | | 5.000 | | | 06/01/29 | | | 3,556,484 | |
| | Las Vegas Sands Corp. (a) | |
| | | | | 260,000 | | | | 3.900 | | | 08/08/29 | | | 242,882 | |
| | Melco Resorts Finance Ltd. (a) | |
| | | | | 630,000 | | | | 5.625 | | | 07/17/27 | | | 610,903 | |
| | | | | 1,360,000 | | | | 7.625 | (b) | | 04/17/32 | | | 1,377,204 | |
| | MGM Resorts International (a) | |
| | | | | 1,832,000 | | | | 4.750 | | | 10/15/28 | | | 1,769,932 | |
| | Sands China Ltd. (a) | |
| | | | | 230,000 | | | | 5.400 | | | 08/08/28 | | | 228,954 | |
| | Travel & Leisure Co. (a)(b) | |
| | | | | 598,000 | | | | 6.625 | | | 07/31/26 | | | 602,640 | |
| | Wynn Macau Ltd. (b)(e) | |
| | | | | 510,000 | | | | 4.500 | | | 03/07/29 | | | 520,970 | |
| | | | | | | | | | | | | | | | |
| | | | | 13,582,357 | |
| | | |
| |
| | Machinery - Construction & Mining(a)(b) – 0.2% | |
| | BWX Technologies, Inc. | |
| | | | | 1,023,000 | | | | 4.125 | | | 06/30/28 | | | 975,973 | |
| | Terex Corp. | |
| | | | | 1,060,000 | | | | 6.250 | | | 10/15/32 | | | 1,054,912 | |
| | Vertiv Group Corp. | |
| | | | | 2,956,000 | | | | 4.125 | | | 11/15/28 | | | 2,815,708 | |
| | | | | | | | | | | | | | | | |
| | | | | 4,846,593 | |
| | | |
| |
| | Machinery-Diversified(a)(b) – 0.4% | |
| | Chart Industries, Inc. | |
| | | | | 1,735,000 | | | | 7.500 | | | 01/01/30 | | | 1,802,665 | |
| | | |
| | | | | | | | | | | | | | | | |
| | | Principal Amount | | | Interest Rate | | | Maturity Date | | Value | |
| |
| | Corporate Obligations – (continued) | |
| |
| | Machinery-Diversified(a)(b) – (continued) | |
| | Husky Injection Molding Systems Ltd./Titan Co-Borrower LLC | |
| | $ | | | 3,060,000 | | | | 9.000 | % | | 02/15/29 | | $ | 3,140,600 | |
| | TK Elevator Holdco GmbH | |
| | | | | 4,509,000 | | | | 7.625 | | | 07/15/28 | | | 4,530,553 | |
| | | | | | | | | | | | | | | | |
| | | | | 9,473,818 | |
| | | |
| |
| | Media(a) – 2.4% | |
| | Altice Financing SA (b) | |
| | | | | 1,848,000 | | | | 5.000 | | | 01/15/28 | | | 1,563,371 | |
| | EUR | | | 2,975,000 | | | | 4.250 | | | 08/15/29 | | | 2,675,247 | |
| | AMC Networks, Inc. (b) | |
| | $ | | | 1,020,000 | | | | 10.250 | | | 01/15/29 | | | 1,050,090 | |
| | CCO Holdings LLC/CCO Holdings Capital Corp. (b) | |
| | | | | 4,980,000 | | | | 4.750 | | | 03/01/30 | | | 4,531,651 | |
| | | | | 6,135,000 | | | | 4.250 | | | 02/01/31 | | | 5,324,076 | |
| | | | | 4,800,000 | | | | 4.750 | | | 02/01/32 | | | 4,154,448 | |
| | Charter Communications Operating LLC/Charter Communications Operating Capital | |
| | | | | 12,000,000 | | | | 6.384 | | | 10/23/35 | | | 11,996,880 | |
| | Cumulus Media New Holdings, Inc. (b) | |
| | | | | 2,300,000 | | | | 8.000 | | | 07/01/29 | | | 935,985 | |
| | Diamond Sports Group LLC/Diamond Sports Finance Co. (b)(h) | |
| | | | | 3,345,000 | | | | 6.625 | | | 08/15/27 | | | 21,207 | |
| | Directv Financing LLC/Directv Financing Co-Obligor, Inc. (b) | |
| | | | | 5,980,000 | | | | 5.875 | | | 08/15/27 | | | 5,758,740 | |
| | DISH DBS Corp. (b) | |
| | | | | 1,720,000 | | | | 5.250 | | | 12/01/26 | | | 1,592,015 | |
| | iHeartCommunications, Inc. | |
| | | | | 4,605,000 | | | | 8.375 | | | 05/01/27 | | | 2,424,026 | |
| | | | | 550,000 | | | | 4.750 | (b) | | 01/15/28 | | | 337,056 | |
| | News Corp. (b) | |
| | | | | 2,470,000 | | | | 3.875 | | | 05/15/29 | | | 2,299,965 | |
| | Nexstar Media, Inc. (b) | |
| | | | | 1,500,000 | | | | 5.625 | | | 07/15/27 | | | 1,474,200 | |
| | Sinclair Television Group, Inc. (b) | |
| | | | | 1,210,000 | | | | 5.125 | | | 02/15/27 | | | 1,070,838 | |
| | Sirius XM Radio, Inc. (b) | |
| | | | | 820,000 | | | | 3.125 | | | 09/01/26 | | | 787,282 | |
| | | | | 5,020,000 | | | | 4.000 | | | 07/15/28 | | | 4,694,754 | |
| | | | | 2,260,000 | | | | 3.875 | | | 09/01/31 | | | 1,944,165 | |
| | TEGNA, Inc. | |
| | | | | 2,300,000 | | | | 4.625 | | | 03/15/28 | | | 2,168,693 | |
| | Ziggo Bond Co. BV (b) | |
| | EUR | | | 675,000 | | | | 3.375 | | | 02/28/30 | | | 656,300 | |
| | $ | | | 500,000 | | | | 5.125 | | | 02/28/30 | | | 452,545 | |
| | Ziggo BV (b) | |
| | | | | 1,628,000 | | | | 4.875 | | | 01/15/30 | | | 1,509,140 | |
| | | | | | | | | | | | | | | | |
| | | | | 59,422,674 | |
| | | |
| |
| | Mining – 0.6% | |
| | Constellium SE (a)(b) | |
| | | | | 2,585,000 | | | | 3.750 | | | 04/15/29 | | | 2,340,123 | |
| | Endeavour Mining PLC (a) | |
| | | | | 200,000 | | | | 5.000 | (b) | | 10/14/26 | | | 192,812 | |
| | | | | 400,000 | | | | 5.000 | | | 10/14/26 | | | 385,624 | |
| | | |
| | |
| 8 | | The accompanying notes are an integral part of these financial statements. |
GOLDMAN SACHS INCOME BUILDER FUND
| | | | | | | | | | | | | | | | |
| | | Principal Amount | | | Interest Rate | | | Maturity Date | | Value | |
| |
| | Corporate Obligations – (continued) | |
| |
| | Mining – (continued) | |
| | First Quantum Minerals Ltd. (a)(b) | |
| | $ | | | 550,000 | | | | 6.875 | % | | 10/15/27 | | $ | 543,614 | |
| | | | | 250,000 | | | | 8.625 | | | 06/01/31 | | | 251,875 | |
| | Freeport-McMoRan, Inc. (a) | |
| | | | | 2,000,000 | | | | 5.400 | | | 11/14/34 | | | 2,000,840 | |
| | Glencore Finance Canada Ltd. (b) | |
| | | | | 3,000,000 | | | | 5.550 | | | 10/25/42 | | | 2,895,660 | |
| | Glencore Funding LLC (a)(b) | |
| | | | | 2,975,000 | | | | 2.850 | | | 04/27/31 | | | 2,594,587 | |
| | Navoi Mining & Metallurgical Combinat (b) | |
| | | | | 200,000 | | | | 6.700 | | | 10/17/28 | | | 200,400 | |
| | | | | 200,000 | | | | 6.950 | | | 10/17/31 | | | 200,400 | |
| | Novelis Corp. (a)(b) | |
| | | | | 2,400,000 | | | | 4.750 | | | 01/30/30 | | | 2,247,480 | |
| | Vedanta Resources Ltd. (a) | |
| | | | | 244,400 | | | | 13.875 | | | 12/09/28 | | | 249,288 | |
| | | | | | | | | | | | | | | | |
| | | | | 14,102,703 | |
| | | |
| |
| | Miscellaneous Manufacturing(a) – 0.1% | |
| | Hillenbrand, Inc. | |
| | | | | 1,135,000 | | | | 6.250 | | | 02/15/29 | | | 1,139,699 | |
| | | | | 1,349,000 | | | | 3.750 | | | 03/01/31 | | | 1,180,429 | |
| | | | | | | | | | | | | | | | |
| | | | | 2,320,128 | |
| | | |
| |
| | Multi-National(a) – 0.0% | |
| | African Export-Import Bank | |
| | | | | 670,000 | | | | 3.994 | | | 09/21/29 | | | 622,470 | |
| | | |
| |
| | Office & Business Equipment(a)(b) – 0.0% | |
| | Xerox Holdings Corp. | |
| | | | | 353,000 | | | | 5.000 | | | 08/15/25 | | | 347,860 | |
| | | |
| | Oil Field Services – 3.1% | |
| | Adnoc Murban Rsc Ltd. (a)(b) | |
| | | | | 420,000 | | | | 5.125 | | | 09/11/54 | | | 390,600 | |
| | Aethon United BR LP/Aethon United Finance Corp. (a)(b) | |
| | | | | 968,000 | | | | 7.500 | | | 10/01/29 | | | 974,340 | |
| | Archrock Partners LP/Archrock Partners Finance Corp. (a)(b) | |
| | | | | 1,750,000 | | | | 6.625 | | | 09/01/32 | | | 1,757,595 | |
| | California Resources Corp. (a)(b) | |
| | | | | 824,000 | | | | 7.125 | | | 02/01/26 | | | 826,802 | |
| | Chesapeake Energy Corp. | |
| | | | | 2,000,000 | | | | 5.500 | | | 09/15/26 | | | 40,000 | |
| | Civitas Resources, Inc. (a)(b) | |
| | | | | 1,320,000 | | | | 8.375 | | | 07/01/28 | | | 1,364,840 | |
| | CNX Resources Corp. (a)(b) | |
| | | | | 1,025,000 | | | | 7.250 | | | 03/01/32 | | | 1,055,699 | |
| | Continental Resources, Inc. (a)(b) | |
| | | | | 1,306,000 | | | | 5.750 | | | 01/15/31 | | | 1,306,457 | |
| | Crescent Energy Finance LLC (a)(b) | |
| | | | | 3,865,000 | | | | 7.375 | | | 01/15/33 | | | 3,748,006 | |
| | DNO ASA (a) | |
| | | | | 590,000 | | | | 7.875 | (b) | | 09/09/26 | | | 590,295 | |
| | | | | 330,000 | | | | 9.250 | | | 06/04/29 | | | 339,570 | |
| | Ecopetrol SA (a) | |
| | | | | 220,000 | | | | 8.625 | | | 01/19/29 | | | 232,562 | |
| | | |
| | | | | | | | | | | | | | | | |
| | | Principal Amount | | | Interest Rate | | | Maturity Date | | Value | |
| |
| | Corporate Obligations – (continued) | |
| |
| | Oil Field Services – (continued) | |
| | $ | | | 120,000 | | | | 6.875 | % | | 04/29/30 | | $ | 116,844 | |
| | | | | 470,000 | | | | 4.625 | | | 11/02/31 | | | 387,280 | |
| | | | | 560,000 | | | | 8.875 | | | 01/13/33 | | | 572,432 | |
| | | | | 650,000 | | | | 5.875 | | | 11/02/51 | | | 441,220 | |
| | EQT Corp. (a)(b) | |
| | | | | 1,915,000 | | | | 3.625 | | | 05/15/31 | | | 1,713,638 | |
| | Expand Energy Corp. (a) | |
| | | | | 1,445,000 | | | | 4.750 | | | 02/01/32 | | | 1,357,563 | |
| | Geopark Ltd. (a)(b) | |
| | | | | 400,000 | | | | 5.500 | | | 01/17/27 | | | 376,876 | |
| | Guara Norte SARL | |
| | | | | 786,743 | | | | 5.198 | | | 06/15/34 | | | 743,983 | |
| | Hunt Oil Co. of Peru LLC Sucursal Del Peru (a)(b) | |
| | | | | 1,110,000 | | | | 8.550 | | | 09/18/33 | | | 1,212,675 | |
| | KazMunayGas National Co. JSC (a) | |
| | | | | 970,000 | | | | 3.500 | | | 04/14/33 | | | 814,800 | |
| | Kodiak Gas Services LLC (a)(b) | |
| | | | | 3,825,000 | | | | 7.250 | | | 02/15/29 | | | 3,935,275 | |
| | Kosmos Energy Ltd. (a)(b) | |
| | | | | 910,000 | | | | 8.750 | | | 10/01/31 | | | 888,388 | |
| | Lukoil Securities BV | |
| | | | | 250,000 | | | | 3.875 | | | 05/06/30 | | | 180,000 | |
| | Matador Resources Co. (a)(b) | |
| | | | | 2,795,000 | | | | 6.875 | | | 04/15/28 | | | 2,843,381 | |
| | | | | 1,395,000 | | | | 6.500 | | | 04/15/32 | | | 1,382,166 | |
| | | | | 1,980,000 | | | | 6.250 | | | 04/15/33 | | | 1,938,816 | |
| | MEG Energy Corp. (a)(b) | |
| | | | | 1,250,000 | | | | 5.875 | | | 02/01/29 | | | 1,222,838 | |
| | Murphy Oil Corp. (a) | |
| | | | | 1,448,000 | | | | 6.000 | | | 10/01/32 | | | 1,393,917 | |
| | Nabors Industries, Inc. (a)(b) | |
| | | | | 1,848,000 | | | | 7.375 | | | 05/15/27 | | | 1,851,031 | |
| | Noble Finance II LLC (a)(b) | |
| | | | | 3,820,000 | | | | 8.000 | | | 04/15/30 | | | 3,872,754 | |
| | Occidental Petroleum Corp. (a) | |
| | | | | 2,550,000 | | | | 6.625 | | | 09/01/30 | | | 2,679,515 | |
| | Permian Resources Operating LLC (a)(b) | |
| | | | | 1,083,000 | | | | 5.875 | | | 07/01/29 | | | 1,068,347 | |
| | | | | 1,020,000 | | | | 7.000 | | | 01/15/32 | | | 1,040,879 | |
| | | | | 1,230,000 | | | | 6.250 | | | 02/01/33 | | | 1,221,181 | |
| | Petroleos Mexicanos | |
| | | | | 96,000 | | | | 6.490 | (a) | | 01/23/27 | | | 94,645 | |
| | | | | 428,000 | | | | 6.500 | | | 03/13/27 | | | 418,965 | |
| | SEPLAT Energy PLC (a) | |
| | | | | 630,000 | | | | 7.750 | (b) | | 04/01/26 | | | 629,016 | |
| | | | | 820,000 | | | | 7.750 | | | 04/01/26 | | | 818,719 | |
| | ShaMaran Petroleum Corp. (a)(b) | |
| | | | | 280,628 | | | | 12.000 | | | 07/30/27 | | | 281,593 | |
| | Sitio Royalties Operating Partnership LP/Sitio Finance Corp. (a)(b) | |
| | | | | 4,082,000 | | | | 7.875 | | | 11/01/28 | | | 4,238,912 | |
| | SM Energy Co. (a)(b) | |
| | | | | 975,000 | | | | 6.750 | | | 08/01/29 | | | 969,287 | |
| | | | | 1,560,000 | | | | 7.000 | | | 08/01/32 | | | 1,549,564 | |
| | Sunoco LP (a)(b) | |
| | | | | 1,335,000 | | | | 7.000 | | | 05/01/29 | | | 1,378,668 | |
| | | |
| | |
| The accompanying notes are an integral part of these financial statements. | | 9 |
GOLDMAN SACHS INCOME BUILDER FUND
|
Schedule of Investments (continued) October 31, 2024 |
| | | | | | | | | | | | | | | | |
| | | Principal Amount | | | Interest Rate | | | Maturity Date | | Value | |
| |
| | Corporate Obligations – (continued) | |
| |
| | Oil Field Services – (continued) | |
| | $ | | | 1,020,000 | | | | 7.250 | % | | 05/01/32 | | $ | 1,062,667 | |
| | Sunoco LP/Sunoco Finance Corp. (a) | |
| | | | | 6,970,000 | | | | 4.500 | | | 05/15/29 | | | 6,624,985 | |
| | TechnipFMC PLC (a)(b) | |
| | | | | 3,635,000 | | | | 6.500 | | | 02/01/26 | | | 3,638,889 | |
| | Tengizchevroil Finance Co. International Ltd. (a) | |
| | | | | 830,000 | | | | 2.625 | | | 08/15/25 | | | 806,760 | |
| | | | | 200,000 | | | | 3.250 | | | 08/15/30 | | | 169,750 | |
| | Transocean Poseidon Ltd. (a)(b) | |
| | | | | 624,600 | | | | 6.875 | | | 02/01/27 | | | 625,474 | |
| | Transocean Titan Financing Ltd. (a)(b) | |
| | | | | 815,000 | | | | 8.375 | | | 02/01/28 | | | 839,768 | |
| | Transocean, Inc. (a)(b) | |
| | | | | 1,305,000 | | | | 8.250 | | | 05/15/29 | | | 1,311,368 | |
| | | | | 306,000 | | | | 8.750 | | | 02/15/30 | | | 316,814 | |
| | | | | 1,315,000 | | | | 8.500 | | | 05/15/31 | | | 1,324,718 | |
| | Tullow Oil PLC (a) | |
| | | | | 240,000 | | | | 7.000 | | | 03/01/25 | | | 229,075 | |
| | | | | 223,000 | | | | 10.250 | | | 05/15/26 | | | 204,881 | |
| | USA Compression Partners LP/USA Compression Finance Corp. (a)(b) | |
| | | | | 2,305,000 | | | | 7.125 | | | 03/15/29 | | | 2,348,057 | |
| | Wildfire Intermediate Holdings LLC (a)(b) | |
| | | | | 965,000 | | | | 7.500 | | | 10/15/29 | | | 934,728 | |
| | YPF SA (a)(b) | |
| | | | | 180,000 | | | | 9.500 | | | 01/17/31 | | | 188,910 | |
| | | | | | | | | | | | | | | | |
| | | | | 76,888,778 | |
| | | |
| |
| | Packaging – 0.9% | |
| | ARD Finance SA (a)(g) | |
| | (PIK 5.750%, Cash 5.000%) | |
| | EUR | | | 2,648,270 | | | | 5.000 | | | 06/30/27 | | | 563,197 | |
| | (PIK 7.250%, Cash 6.500%) | |
| | $ | | | 2,030,000 | | | | 6.500 | (b) | | 06/30/27 | | | 444,184 | |
| | Ardagh Metal Packaging Finance USA LLC/Ardagh Metal Packaging Finance PLC (a) | |
| | | | | 523,000 | | | | 6.000 | (b) | | 06/15/27 | | | 521,698 | |
| | EUR | | | 2,531,000 | | | | 3.000 | | | 09/01/29 | | | 2,389,962 | |
| | $ | | | 1,463,000 | | | | 4.000 | (b) | | 09/01/29 | | | 1,283,695 | |
| | Ardagh Packaging Finance PLC/Ardagh Holdings USA, Inc. (a)(b) | |
| | | | | 3,295,000 | | | | 5.250 | | | 08/15/27 | | | 1,976,967 | |
| | Ball Corp. (a) | |
| | | | | 3,895,000 | | | | 6.000 | | | 06/15/29 | | | 3,956,112 | |
| | Berry Global, Inc. (a)(b) | |
| | | | | 458,000 | | | | 4.500 | | | 02/15/26 | | | 451,831 | |
| | | | | 2,000,000 | | | | 5.625 | | | 07/15/27 | | | 1,996,820 | |
| | LABL, Inc. (a)(b) | |
| | | | | 3,015,000 | | | | 8.625 | | | 10/01/31 | | | 2,906,008 | |
| | Pactiv Evergreen Group Issuer, Inc./Pactiv Evergreen Group Issuer LLC (a)(b) | |
| | | | | 1,410,000 | | | | 4.000 | | | 10/15/27 | | | 1,347,128 | |
| | SAN Miguel Industrias Pet SA/NG PET R&P Latin America SA (a)(b) | |
| | | | | 290,000 | | | | 3.750 | | | 08/02/28 | | | 263,279 | |
| | | |
| | | | | | | | | | | | | | | | |
| | | Principal Amount | | | Interest Rate | | | Maturity Date | | Value | |
| |
| | Corporate Obligations – (continued) | |
| |
| | Packaging – (continued) | |
| | Sealed Air Corp. (b) | |
| | $ | | | 1,843,000 | | | | 6.875 | % | | 07/15/33 | | $ | 1,952,345 | |
| | Trivium Packaging Finance BV (a)(b) | |
| | | | | 1,075,000 | | | | 5.500 | | | 08/15/26 | | | 1,065,336 | |
| | | | | | | | | | | | | | | | |
| | | | | 21,118,562 | |
| | | |
| |
| | Pharmaceuticals(a) – 0.8% | |
| | AdaptHealth LLC (b) | |
| | | | | 1,445,000 | | | | 6.125 | | | 08/01/28 | | | 1,425,016 | |
| | | | | 670,000 | | | | 4.625 | | | 08/01/29 | | | 608,782 | |
| | | | | 1,020,000 | | | | 5.125 | | | 03/01/30 | | | 935,330 | |
| | Cigna Group | |
| | | | | 6,662,000 | | | | 2.400 | | | 03/15/30 | | | 5,869,222 | |
| | CVS Health Corp. | |
| | | | | 6,765,000 | | | | 3.750 | | | 04/01/30 | | | 6,275,214 | |
| | Organon & Co./Organon Foreign Debt Co-Issuer BV (b) | |
| | | | | 700,000 | | | | 4.125 | | | 04/30/28 | | | 663,201 | |
| | | | | 1,950,000 | | | | 5.125 | | | 04/30/31 | | | 1,778,010 | |
| | Prestige Brands, Inc. (b) | |
| | | | | 1,855,000 | | | | 3.750 | | | 04/01/31 | | | 1,659,372 | |
| | Teva Pharmaceutical Finance Netherlands II BV | |
| | EUR | | | 210,000 | | | | 3.750 | | | 05/09/27 | | | 226,963 | |
| | | | | 310,000 | | | | 7.375 | | | 09/15/29 | | | 379,676 | |
| | | | | | | | | | | | | | | | |
| | | | | 19,820,786 | |
| | | |
| |
| | Pipelines – 4.0% | |
| | Acu Petroleo Luxembourg SARL (a) | |
| | $ | | | 472,397 | | | | 7.500 | | | 07/13/35 | | | 474,050 | |
| | Antero Midstream Partners LP/Antero Midstream Finance Corp. (a)(b) | |
| | | | | 2,440,000 | | | | 6.625 | | | 02/01/32 | | | 2,467,011 | |
| | Blue Racer Midstream LLC/Blue Racer Finance Corp. (a)(b) | |
| | | | | 705,000 | | | | 7.000 | | | 07/15/29 | | | 722,223 | |
| | | | | 710,000 | | | | 7.250 | | | 07/15/32 | | | 733,004 | |
| | Buckeye Partners LP (a) | |
| | | | | 929,000 | | | | 4.125 | | | 12/01/27 | | | 888,737 | |
| | | | | 1,217,000 | | | | 4.500 | (b) | | 03/01/28 | | | 1,158,268 | |
| | | | | 2,340,000 | | | | 6.875 | (b) | | 07/01/29 | | | 2,377,159 | |
| | CNX Midstream Partners LP (a)(b) | |
| | | | | 2,387,000 | | | | 4.750 | | | 04/15/30 | | | 2,221,748 | |
| | CQP Holdco LP/BIP-V Chinook Holdco LLC (a)(b) | |
| | | | | 4,130,000 | | | | 5.500 | | | 06/15/31 | | | 3,928,621 | |
| | DCP Midstream Operating LP (b) | |
| | | | | 4,000,000 | | | | 6.750 | | | 09/15/37 | | | 4,232,240 | |
| | Delek Logistics Partners LP/Delek Logistics Finance Corp. (a)(b) | |
| | | | | 1,465,000 | | | | 8.625 | | | 03/15/29 | | | 1,501,230 | |
| | DT Midstream, Inc. (a)(b) | |
| | | | | 4,130,000 | | | | 4.375 | | | 06/15/31 | | | 3,800,426 | |
| | Energy Transfer LP | |
| | | | | 2,985,000 | | | | 6.625 | | | 10/15/36 | | | 3,213,711 | |
| | Enterprise Products Operating LLC (a)(c) (-1X 3 mo. USD Term SOFR + 3.039%) | |
| | | | | 1,000,000 | | | | 8.055 | | | 06/01/67 | | | 996,280 | |
| | EQM Midstream Partners LP (a)(b) | |
| | | | | 2,305,000 | | | | 7.500 | | | 06/01/27 | | | 2,362,625 | |
| | | |
| | |
| 10 | | The accompanying notes are an integral part of these financial statements. |
GOLDMAN SACHS INCOME BUILDER FUND
| | | | | | | | | | | | | | | | |
| | | Principal Amount | | | Interest Rate | | | Maturity Date | | Value | |
| |
| | Corporate Obligations – (continued) | |
| |
| | Pipelines – (continued) | |
| | Galaxy Pipeline Assets Bidco Ltd. | |
| | $ | | | 920,000 | | | | 3.250 | % | | 09/30/40 | | $ | 712,715 | |
| | Genesis Energy LP/Genesis Energy Finance Corp. (a) | |
| | | | | 2,010,000 | | | | 7.750 | | | 02/01/28 | | | 2,029,618 | |
| | | | | 2,815,000 | | | | 7.875 | | | 05/15/32 | | | 2,812,410 | |
| | Global Partners LP/GLP Finance Corp. (a) | |
| | | | | 3,922,000 | | | | 6.875 | | | 01/15/29 | | | 3,914,587 | |
| | GNL Quintero SA | |
| | | | | 158,868 | | | | 4.634 | | | 07/31/29 | | | 156,795 | |
| | Howard Midstream Energy Partners LLC (a)(b) | |
| | | | | 1,615,000 | | | | 8.875 | | | 07/15/28 | | | 1,704,100 | |
| | | | | 1,455,000 | | | | 7.375 | | | 07/15/32 | | | 1,483,576 | |
| | Kinder Morgan Energy Partners LP | |
| | | | | 7,000,000 | | | | 7.300 | | | 08/15/33 | | | 7,909,580 | |
| | Kinetik Holdings LP (a)(b) | |
| | | | | 3,490,000 | | | | 5.875 | | | 06/15/30 | | | 3,459,218 | |
| | MPLX LP (a) | |
| | | | | 5,925,000 | | | | 2.650 | | | 08/15/30 | | | 5,212,874 | |
| | NuStar Logistics LP (a) | |
| | | | | 2,569,000 | | | | 6.375 | | | 10/01/30 | | | 2,599,725 | |
| | Oleoducto Central SA (a) | |
| | | | | 490,000 | | | | 4.000 | | | 07/14/27 | | | 465,059 | |
| | Prairie Acquiror LP (a)(b) | |
| | | | | 3,475,000 | | | | 9.000 | | | 08/01/29 | | | 3,522,538 | |
| | Summit Midstream Holdings LLC (a)(b) | |
| | | | | 4,395,000 | | | | 8.625 | | | 10/31/29 | | | 4,540,606 | |
| | Tallgrass Energy Partners LP/Tallgrass Energy Finance Corp. (a)(b) | |
| | | | | 1,870,000 | | | | 7.375 | | | 02/15/29 | | | 1,875,049 | |
| | | | | 525,000 | | | | 6.000 | | | 12/31/30 | | | 492,749 | |
| | | | | 4,485,000 | | | | 6.000 | | | 09/01/31 | | | 4,161,049 | |
| | Targa Resources Partners LP/Targa Resources Partners Finance Corp. (a) | |
| | | | | 1,910,000 | | | | 4.875 | | | 02/01/31 | | | 1,855,928 | |
| | Venture Global Calcasieu Pass LLC (a)(b) | |
| | | | | 3,243,000 | | | | 4.125 | | | 08/15/31 | | | 2,952,427 | |
| | Venture Global LNG, Inc. (a)(b) | |
| | | | | 4,010,000 | | | | 8.125 | | | 06/01/28 | | | 4,161,217 | |
| | | | | 2,480,000 | | | | 9.500 | | | 02/01/29 | | | 2,741,987 | |
| | | | | 1,380,000 | | | | 7.000 | | | 01/15/30 | | | 1,388,280 | |
| | Williams Cos., Inc. | |
| | | | | 7,000,000 | | | | 7.500 | | | 01/15/31 | | | 7,787,640 | |
| | | | | | | | | | | | | | | | |
| | | | | 99,017,060 | |
| | | |
| |
| | Real Estate(a) – 0.2% | |
| | Anywhere Real Estate Group LLC/Realogy Co-Issuer Corp. (b) | |
| | | | | 3,715,000 | | | | 5.750 | | | 01/15/29 | | | 3,051,761 | |
| | Howard Hughes Corp. (b) | |
| | | | | 734,000 | | | | 4.125 | | | 02/01/29 | | | 676,807 | |
| | Modernland Overseas Pte. Ltd. (g) | |
| | | | | 9,300 | | | | 5.000 | | | 04/30/27 | | | 930 | |
| | (PIK 2.000%, Cash 3.000%) | |
| | | | | 320,000 | | | | 3.000 | | | 04/30/27 | | | 106,345 | |
| | Redsun Properties Group Ltd. (h) | |
| | | | | 230,000 | | | | 7.300 | | | 01/13/25 | | | 2,300 | |
| | | |
| | | | | | | | | | | | | | | | |
| | | Principal Amount | | | Interest Rate | | | Maturity Date | | Value | |
| |
| | Corporate Obligations – (continued) | |
| |
| | Real Estate(a) – (continued) | |
| | Yuzhou Group Holdings Co. Ltd. (c)(h) (-1X 5 yr. CMT + 8.527%) | |
| | $ | | | 380,000 | | | | 5.375 | % | | 03/29/25 | | $ | 7,600 | |
| | | | | | | | | | | | | | | | |
| | | | | 3,845,743 | |
| | | |
| |
| | Real Estate Investment Trust(a) – 1.2% | |
| | American Tower Corp. | |
| | | | | 2,125,000 | | | | 3.950 | | | 03/15/29 | | | 2,043,527 | |
| | Brookfield Property REIT, Inc./BPR Cumulus LLC/BPR Nimbus LLC/GGSI Sellco LLC (b) | |
| | | | | 525,000 | | | | 5.750 | | | 05/15/26 | | | 520,910 | |
| | CIBANCO SA Institucion de Banca Multiple Trust CIB/3332 (b) | |
| | | | | 1,630,000 | | | | 4.375 | | | 07/22/31 | | | 1,362,069 | |
| | Crown Castle, Inc. | |
| | | | | 300,000 | | | | 4.150 | | | 07/01/50 | | | 237,429 | |
| | Iron Mountain Information Management Services, Inc. (b) | |
| | | | | 9,503,000 | | | | 5.000 | | | 07/15/32 | | | 8,961,614 | |
| | MPT Operating Partnership LP/MPT Finance Corp. | |
| | | | | 3,000,000 | | | | 5.000 | | | 10/15/27 | | | 2,648,400 | |
| | | | | 2,680,000 | | | | 3.500 | | | 03/15/31 | | | 1,896,502 | |
| | SBA Communications Corp. | |
| | | | | 2,637,000 | | | | 3.875 | | | 02/15/27 | | | 2,552,405 | |
| | Starwood Property Trust, Inc. | |
| | | | | 2,700,000 | | | | 4.750 | | | 03/15/25 | | | 2,690,577 | |
| | Trust Fibra Uno | |
| | | | | 510,000 | | | | 4.869 | | | 01/15/30 | | | 457,929 | |
| | Uniti Group LP/Uniti Group Finance 2019, Inc./CSL Capital LLC (b) | |
| | | | | 2,140,000 | | | | 4.750 | | | 04/15/28 | | | 1,967,409 | |
| | VICI Properties LP | |
| | | | | 2,480,000 | | | | 4.750 | | | 02/15/28 | | | 2,456,961 | |
| | VICI Properties LP/VICI Note Co., Inc. (b) | |
| | | | | 1,526,000 | | | | 3.500 | | | 02/15/25 | | | 1,516,188 | |
| | | | | | | | | | | | | | | | |
| | | | | 29,311,920 | |
| | | |
| |
| | Retailing(a) – 1.3% | |
| | Arko Corp. (b) | |
| | | | | 1,770,000 | | | | 5.125 | | | 11/15/29 | | | 1,631,692 | |
| | Asbury Automotive Group, Inc. (b) | |
| | | | | 1,462,000 | | | | 4.625 | | | 11/15/29 | | | 1,369,031 | |
| | | | | 809,000 | | | | 5.000 | | | 02/15/32 | | | 744,604 | |
| | AutoNation, Inc. | |
| | | | | 961,000 | | | | 4.750 | | | 06/01/30 | | | 936,619 | |
| | Beacon Roofing Supply, Inc. (b) | |
| | | | | 2,560,000 | | | | 4.125 | | | 05/15/29 | | | 2,378,086 | |
| | Cougar JV Subsidiary LLC (b) | |
| | | | | 3,392,000 | | | | 8.000 | | | 05/15/32 | | | 3,544,844 | |
| | Foundation Building Materials, Inc. (b) | |
| | | | | 2,540,000 | | | | 6.000 | | | 03/01/29 | | | 2,249,703 | |
| | Group 1 Automotive, Inc. (b) | |
| | | | | 500,000 | | | | 6.375 | | | 01/15/30 | | | 502,005 | |
| | GYP Holdings III Corp. (b) | |
| | | | | 1,852,000 | | | | 4.625 | | | 05/01/29 | | | 1,750,899 | |
| | InRetail Consumer | |
| | | | | 400,000 | | | | 3.250 | | | 03/22/28 | | | 370,500 | |
| | | |
| | |
| The accompanying notes are an integral part of these financial statements. | | 11 |
GOLDMAN SACHS INCOME BUILDER FUND
|
Schedule of Investments (continued) October 31, 2024 |
| | | | | | | | | | | | | | | | |
| | | Principal Amount | | | Interest Rate | | | Maturity Date | | Value | |
| |
| | Corporate Obligations – (continued) | |
| |
| | Retailing(a) – (continued) | |
| | LCM Investments Holdings II LLC (b) | |
| | $ | | | 3,020,000 | | | | 4.875 | % | | 05/01/29 | | $ | 2,852,964 | |
| | | | | 1,205,000 | | | | 8.250 | | | 08/01/31 | | | 1,260,057 | |
| | Lowe’s Cos., Inc. | |
| | | | | 2,062,000 | | | | 3.750 | | | 04/01/32 | | | 1,907,412 | |
| | | | | 4,400,000 | | | | 5.000 | | | 04/15/33 | | | 4,394,104 | |
| | Penske Automotive Group, Inc. | |
| | | | | 2,179,000 | | | | 3.750 | | | 06/15/29 | | | 1,989,972 | |
| | Suburban Propane Partners LP/Suburban Energy Finance Corp. (b) | |
| | | | | 2,245,000 | | | | 5.000 | | | 06/01/31 | | | 2,060,888 | |
| | Vivo Energy Investments BV | |
| | | | | 290,000 | | | | 5.125 | | | 09/24/27 | | | 282,570 | |
| | Yum! Brands, Inc. (b) | |
| | | | | 3,064,000 | | | | 4.750 | | | 01/15/30 | | | 2,963,409 | |
| | | | | | | | | | | | | | | | |
| | | | | 33,189,359 | |
| | | |
| |
| | Semiconductors(a) – 0.3% | |
| | Broadcom, Inc. (b) | |
| | | | | 2,069,000 | | | | 3.469 | | | 04/15/34 | | | 1,805,803 | |
| | | | | 1,856,000 | | | | 3.137 | | | 11/15/35 | | | 1,523,405 | |
| | | | | 3,319,000 | | | | 3.187 | | | 11/15/36 | | | 2,690,282 | |
| | NXP BV/NXP Funding LLC/NXP USA, Inc. | |
| | | | | 982,000 | | | | 3.400 | | | 05/01/30 | | | 905,237 | |
| | Qorvo, Inc. | |
| | | | | 750,000 | | | | 4.375 | | | 10/15/29 | | | 707,167 | |
| | | | | | | | | | | | | | | | |
| | | | | 7,631,894 | |
| | | |
| |
| | Software(a) – 1.4% | |
| | AthenaHealth Group, Inc. (b) | |
| | | | | 4,765,000 | | | | 6.500 | | | 02/15/30 | | | 4,505,117 | |
| | Castle U.S. Holding Corp. (b) | |
| | | | | 4,104,000 | | | | 9.500 | | | 02/15/28 | | | 1,915,173 | |
| | Clarivate Science Holdings Corp. (b) | |
| | | | | 3,509,000 | | | | 3.875 | | | 07/01/28 | | | 3,313,443 | |
| | | | | 2,401,000 | | | | 4.875 | | | 07/01/29 | | | 2,269,425 | |
| | Cloud Software Group, Inc. (b) | |
| | | | | 1,650,000 | | | | 8.250 | | | 06/30/32 | | | 1,695,920 | |
| | Elastic NV (b) | |
| | | | | 1,835,000 | | | | 4.125 | | | 07/15/29 | | | 1,698,604 | |
| | Open Text Corp. (b) | |
| | | | | 6,945,000 | | | | 3.875 | | | 12/01/29 | | | 6,340,507 | |
| | Oracle Corp. | |
| | | | | 2,015,000 | | | | 4.900 | | | 02/06/33 | | | 1,988,241 | |
| | | | | 1,405,000 | | | | 3.600 | | | 04/01/50 | | | 1,012,527 | |
| | ROBLOX Corp. (b) | |
| | | | | 1,975,000 | | | | 3.875 | | | 05/01/30 | | | 1,788,046 | |
| | SS&C Technologies, Inc. (b) | |
| | | | | 850,000 | | | | 5.500 | | | 09/30/27 | | | 846,541 | |
| | | | | 3,680,000 | | | | 6.500 | | | 06/01/32 | | | 3,742,744 | |
| | TeamSystem SpA (b) | |
| | EUR | | | 3,100,000 | | | | 3.500 | | | 02/15/28 | | | 3,263,243 | |
| | ZoomInfo Technologies LLC/ZoomInfo Finance Corp. (b) | |
| | $ | | | 1,450,000 | | | | 3.875 | | | 02/01/29 | | | 1,321,414 | |
| | | | | | | | | | | | | | | | |
| | | | | 35,700,945 | |
| | | |
| | | | | | | | | | | | | | | | |
| | | Principal Amount | | | Interest Rate | | | Maturity Date | | Value | |
| |
| | Corporate Obligations – (continued) | |
| |
| | Sovereign(a)(c) – 0.2% | |
| | CoBank ACB (3 mo. USD Term SOFR + 4.660%) | |
| | $ | | | 5,350,000 | | | | 6.250 | % | | 10/01/26 | | $ | 5,329,113 | |
| | | |
| |
| | Telecommunication Services – 1.1% | |
| | Altice France SA (a)(b) | |
| | | | | 4,695,000 | | | | 5.500 | | | 10/15/29 | | | 3,545,476 | |
| | AT&T, Inc. (a) | |
| | | | | 2,900,000 | | | | 2.750 | | | 06/01/31 | | | 2,547,679 | |
| | | | | 3,475,000 | | | | 2.250 | | | 02/01/32 | | | 2,891,478 | |
| | Axian Telecom (a) | |
| | | | | 250,000 | | | | 7.375 | (b) | | 02/16/27 | | | 251,172 | |
| | | | | 200,000 | | | | 7.375 | | | 02/16/27 | | | 200,938 | |
| | CAS Capital No. 1 Ltd. (a)(c) (5 yr. CMT + 3.642%) | |
| | | | | 204,000 | | | | 4.000 | | | 07/12/26 | | | 195,648 | |
| | Hughes Satellite Systems Corp. | |
| | | | | 1,190,000 | | | | 6.625 | | | 08/01/26 | | | 1,019,199 | |
| | Level 3 Financing, Inc. (a)(b) | |
| | | | | 1,506,000 | | | | 10.500 | | | 05/15/30 | | | 1,649,808 | |
| | MTN Mauritius Investments Ltd. | |
| | | | | 420,000 | | | | 6.500 | | | 10/13/26 | | | 423,469 | |
| | Nokia of America Corp. | |
| | | | | 3,000,000 | | | | 6.450 | | | 03/15/29 | | | 3,015,060 | |
| | Optics Bidco SpA (a)(b) | |
| | | | | 1,348,000 | | | | 7.200 | | | 07/18/36 | | | 1,386,418 | |
| | | | | 674,000 | | | | 7.721 | | | 06/04/38 | | | 715,903 | |
| | SoftBank Group Corp. (a) | |
| | | | | 260,000 | | | | 5.125 | | | 09/19/27 | | | 257,338 | |
| | Sprint Capital Corp. | |
| | | | | 1,150,000 | | | | 8.750 | | | 03/15/32 | | | 1,390,384 | |
| | Telecom Italia Capital SA | |
| | | | | 452,000 | | | | 7.200 | | | 07/18/36 | | | 459,128 | |
| | | | | 326,000 | | | | 7.721 | | | 06/04/38 | | | 339,017 | |
| | Telefonica Celular del Paraguay SA (a) | |
| | | | | 493,000 | | | | 5.875 | | | 04/15/27 | | | 491,151 | |
| | T-Mobile USA, Inc. (a) | |
| | | | | 4,381,000 | | | | 3.875 | | | 04/15/30 | | | 4,161,643 | |
| | | | | 1,896,000 | | | | 4.500 | | | 04/15/50 | | | 1,607,960 | |
| | | | | | | | | | | | | | | | |
| | | | | 26,548,869 | |
| | | |
| |
| | Toys/Games/Hobbies(a)(b) – 0.1% | |
| | Mattel, Inc. | |
| | | | | 2,185,000 | | | | 3.375 | | | 04/01/26 | | | 2,133,500 | |
| | | |
| |
| | Transportation – 0.3% | |
| | Cargo Aircraft Management, Inc. (a)(b) | |
| | | | | 785,000 | | | | 4.750 | | | 02/01/28 | | | 749,094 | |
| | MV24 Capital BV | |
| | | | | 268,022 | | | | 6.748 | (b) | | 06/01/34 | | | 260,716 | |
| | | | | 606,991 | | | | 6.748 | | | 06/01/34 | | | 590,444 | |
| | Rand Parent LLC (a)(b) | |
| | | | | 2,910,000 | | | | 8.500 | | | 02/15/30 | | | 2,902,987 | |
| | RXO, Inc. (a)(b) | |
| | | | | 1,745,000 | | | | 7.500 | | | 11/15/27 | | | 1,811,921 | |
| | Transnet SOC Ltd. (b) | |
| | | | | 860,000 | | | | 8.250 | | | 02/06/28 | | | 875,856 | |
| | | |
| | |
| 12 | | The accompanying notes are an integral part of these financial statements. |
GOLDMAN SACHS INCOME BUILDER FUND
| | | | | | | | | | | | | | | | |
| | | Principal Amount | | | Interest
Rate | | | Maturity Date | | Value | |
| |
| | Corporate Obligations – (continued) | |
| |
| | Transportation – (continued) | |
| | XPO, Inc. (a)(b) | |
| | $ | | | 1,370,000 | | | | 7.125 | % | | 02/01/32 | | $ | 1,422,019 | |
| | | | | | | | | | | | | | | | |
| | | | | 8,613,037 | |
| | | |
| |
| | Trucking & Leasing(a)(b) – 0.1% | |
| | Fortress Transportation & Infrastructure Investors LLC | |
| | | | | 2,220,000 | | | | 5.500 | | | 05/01/28 | | | 2,179,174 | |
| | | |
| | |
| | TOTAL CORPORATE OBLIGATIONS (Cost $1,185,852,643) | | $ | 1,139,969,291 | |
| | | |
| | | | | | | | |
| | | Shares | | Description | | Value | |
| |
| | Common Stocks – 36.0% | |
| |
| | Aerospace & Defense – 1.0% | |
| | 75,597 | | General Electric Co. | | $ | 12,986,053 | |
| | 24,724 | | L3Harris Technologies, Inc. | | | 6,118,448 | |
| | 10,920 | | Northrop Grumman Corp. | | | 5,558,498 | |
| | | | | | | | |
| | | | | 24,662,999 | |
| | | |
| |
| | Air Freight & Logistics – 0.3% | |
| | 50,021 | | United Parcel Service, Inc. | | | | |
| | | | Class B | | | 6,705,815 | |
| | | |
| |
| | Banks – 3.1% | |
| | 790,127 | | Banco Bilbao Vizcaya Argentaria SA ADR | | | 7,845,961 | |
| | 359,668 | | Bank of America Corp. | | | 15,041,316 | |
| | 146,871 | | Citigroup, Inc. | | | 9,424,712 | |
| | 140,992 | | JPMorgan Chase & Co. | | | 31,288,945 | |
| | 288,682 | | Truist Financial Corp. | | | 12,427,760 | |
| | | | | | | | |
| | | | | 76,028,694 | |
| | | |
| |
| | Beverages – 0.7% | |
| | 134,627 | | Coca-Cola Co. | | | 8,792,489 | |
| | 123,527 | | Coca-Cola Europacific Partners PLC | | | 9,388,052 | |
| | | | | | | | |
| | | | | 18,180,541 | |
| | | |
| |
| | Biotechnology – 0.5% | |
| | 36,454 | | Amgen, Inc. | | | 11,671,113 | |
| | | |
| |
| | Capital Markets – 1.4% | |
| | 100,251 | | Blackstone, Inc. | | | 16,817,105 | |
| | 84,517 | | KKR & Co., Inc. | | | 11,683,630 | |
| | 45,952 | | Singapore Exchange Ltd. ADR | | | 5,673,234 | |
| | | | | | | | |
| | | | | 34,173,969 | |
| | | |
| |
| | Chemicals – 0.5% | |
| | 29,791 | | Linde PLC | | | 13,589,165 | |
| | | |
| |
| | Commercial Services & Supplies – 0.3% | |
| | 40,134 | | Republic Services, Inc. | | | 7,946,532 | |
| | | |
| |
| | Communications Equipment – 0.5% | |
| | 217,481 | | Cisco Systems, Inc. | | | 11,911,434 | |
| | | |
| | | | | | | | |
| | | Shares | | Description | | Value | |
| |
| | Common Stocks – (continued) | |
| |
| | Communications Equipment – (continued) | |
| | 35,685 | | Intelsat SA(h) | | $ | 1,046,748 | |
| | | | | | | | |
| | | | | 12,958,182 | |
| | | |
| |
| | Construction & Engineering – 0.2% | |
| | 149,877 | | Vinci SA ADR | | | 4,180,070 | |
| | | |
| |
| | Consumer Finance – 0.5% | |
| | 41,795 | | American Express Co. | | | 11,287,994 | |
| | | |
| |
| | Consumer Staples Distribution & Retail – 0.9% | |
| | 244,447 | | Koninklijke Ahold Delhaize NV ADR | | | 8,056,973 | |
| | 182,108 | | Walmart, Inc. | | | 14,923,751 | |
| | | | | | | | |
| | | | | 22,980,724 | |
| | | |
| |
| | Diversified Telecommunication Services – 0.6% | |
| | 627,541 | | AT&T, Inc. | | | 14,144,774 | |
| | | |
| |
| | Electric Utilities – 1.2% | |
| | 151,536 | | Iberdrola SA ADR | | | 9,008,815 | |
| | 132,004 | | NextEra Energy, Inc. | | | 10,461,317 | |
| | 161,084 | | Xcel Energy, Inc. | | | 10,762,022 | |
| | | | | | | | |
| | | | | 30,232,154 | |
| | | |
| |
| | Electrical Equipment – 0.9% | |
| | 39,835 | | Eaton Corp. PLC | | | 13,208,489 | |
| | 179,023 | | Schneider Electric SE ADR | | | 9,253,699 | |
| | | | | | | | |
| | | | | 22,462,188 | |
| | | |
| |
| | Energy Equipment & Services – 0.1% | |
| | 63,962 | | Noble Corp. PLC | | | 2,045,505 | |
| | | |
| |
| | Financial Services – 0.4% | |
| | 32,050 | | Visa, Inc. Class A | | | 9,289,692 | |
| | | |
| |
| | Food Products – 0.7% | |
| | 70,995 | | General Mills, Inc. | | | 4,829,080 | |
| | 159,242 | | Kraft Heinz Co. | | | 5,328,237 | |
| | 82,260 | | Nestle SA ADR | | | 7,775,215 | |
| | | | | | | | |
| | | | | 17,932,532 | |
| | | |
| |
| | Ground Transportation – 0.2% | |
| | 24,542 | | Norfolk Southern Corp. | | | 6,146,053 | |
| | | |
| |
| | Health Care Equipment & Supplies – 1.0% | |
| | 103,017 | | Abbott Laboratories | | | 11,679,037 | |
| | 49,682 | | Hoya Corp. ADR | | | 6,670,802 | |
| | 54,399 | | Zimmer Biomet Holdings, Inc. | | | 5,816,341 | |
| | | | | | | | |
| | | | | 24,166,180 | |
| | | |
| |
| | Health Care Providers & Services – 0.9% | |
| | 114,163 | | CVS Health Corp. | | | 6,445,643 | |
| | 26,462 | | UnitedHealth Group, Inc. | | | 14,937,799 | |
| | | | | | | | |
| | | | | 21,383,442 | |
| | | |
| |
| | Health Care REITs – 0.3% | |
| | 278,299 | | Healthpeak Properties, Inc. | | | 6,247,813 | |
| | | |
| | |
| The accompanying notes are an integral part of these financial statements. | | 13 |
GOLDMAN SACHS INCOME BUILDER FUND
|
Schedule of Investments (continued) October 31, 2024 |
| | | | | | | | |
| | | Shares | | Description | | Value | |
| |
| | Common Stocks – (continued) | |
| |
| | Hotels, Restaurants & Leisure – 0.6% | |
| | 54,066 | | McDonald’s Corp. | | $ | 15,793,219 | |
| | | |
| |
| | Household Products – 0.4% | |
| | 60,093 | | Procter & Gamble Co. | | | 9,926,162 | |
| | | |
| |
| | Industrial Conglomerates – 0.5% | |
| | 57,251 | | Honeywell International, Inc. | | | 11,775,386 | |
| | | |
| |
| | Insurance – 1.7% | |
| | 60,234 | | Allstate Corp. | | | 11,234,846 | |
| | 41,479 | | Marsh & McLennan Cos., Inc. | | | 9,052,377 | |
| | 51,916 | | Progressive Corp. | | | 12,606,762 | |
| | 308,208 | | Zurich Insurance Group AG ADR | | | 9,104,464 | |
| | | | | | | | |
| | | | | 41,998,449 | |
| | | |
| |
| | Interactive Media & Services – 1.0% | |
| | 152,179 | | Alphabet, Inc. Class A | | | 26,039,349 | |
| | | |
| |
| | IT Services – 0.2% | |
| | 18,092 | | Accenture PLC Class A | | | 6,238,483 | |
| | | |
| |
| | Life Sciences Tools & Services – 0.4% | |
| | 41,055 | | Danaher Corp. | | | 10,085,571 | |
| | | |
| |
| | Machinery – 0.6% | |
| | 22,699 | | Caterpillar, Inc. | | | 8,539,364 | |
| | 24,030 | | Illinois Tool Works, Inc. | | | 6,274,954 | |
| | | | | | | | |
| | | | | 14,814,318 | |
| | | |
| |
| | Media – 0.6% | |
| | 194,738 | | Bright Pattern Holdco(d)(h) | | | 195 | |
| | 635,140 | | iHeartMedia, Inc. Class A(h) | | | 1,257,577 | |
| | 108,014 | | New York Times Co. Class A | | | 6,031,502 | |
| | 79,319 | | Omnicom Group, Inc. | | | 8,011,219 | |
| | | | | | | | |
| | | | | 15,300,493 | |
| | | |
| |
| | Metals & Mining – 1.0% | |
| | 232,050 | | Freeport-McMoRan, Inc. | | | 10,446,891 | |
| | 227,045 | | Rio Tinto PLC ADR | | | 14,732,950 | |
| | | | | | | | |
| | | | | 25,179,841 | |
| | | |
| |
| | Multi-Utilities – 1.9% | |
| | 118,902 | | Ameren Corp. | | | 10,357,553 | |
| | 165,340 | | CMS Energy Corp. | | | 11,509,318 | |
| | 160,921 | | Dominion Energy, Inc. | | | 9,579,627 | |
| | 147,031 | | National Grid PLC ADR | | | 9,349,701 | |
| | 88,996 | | Sempra | | | 7,419,597 | |
| | | | | | | | |
| | | | | 48,215,796 | |
| | | |
| |
| | Oil, Gas & Consumable Fuels – 2.4% | |
| | 172,464 | | BP PLC ADR | | | 5,063,543 | |
| | 110,340 | | ConocoPhillips | | | 12,086,643 | |
| | 59,828 | | EOG Resources, Inc. | | | 7,296,623 | |
| | 2,490 | | Expand Energy Corp. | | | 210,953 | |
| | 153,314 | | Exxon Mobil Corp. | | | 17,904,009 | |
| | 235,803 | | Shell PLC ADR | | | 15,928,493 | |
| | | |
| | | | | | | | |
| | | Shares | | Description | | Value | |
| |
| | Common Stocks – (continued) | |
| |
| | Oil, Gas & Consumable Fuels – (continued) | |
| | 44,333 | | Summit Midstream Corp.(h) | | $ | 1,548,108 | |
| | | | | | | | |
| | | | | 60,038,372 | |
| | | |
| |
| | Personal Products – 0.8% | |
| | 409,276 | | Kenvue, Inc. | | | 9,384,699 | |
| | 153,787 | | Unilever PLC ADR | | | 9,367,166 | |
| | | | | | | | |
| | | | | 18,751,865 | |
| | | |
| |
| | Pharmaceuticals – 2.0% | |
| | 130,929 | | AstraZeneca PLC ADR | | | 9,315,598 | |
| | 6,393 | | Eli Lilly & Co. | | | 5,304,528 | |
| | 99,061 | | Johnson & Johnson | | | 15,835,891 | |
| | 115,641 | | Merck & Co., Inc. | | | 11,832,387 | |
| | 207,328 | | Roche Holding AG ADR | | | 8,046,400 | |
| | | | | | | | |
| | | | | 50,334,804 | |
| | | |
| |
| | Real Estate Management & Development(b) – 0.0% | |
| | 122,732 | | Sunac Services Holdings Ltd. | | | 30,423 | |
| | | |
| |
| | Residential REITs – 0.3% | |
| | 34,970 | | AvalonBay Communities, Inc. | | | 7,749,702 | |
| | | |
| |
| | Retail REITs – 0.2% | |
| | 79,965 | | Regency Centers Corp. | | | 5,712,700 | |
| | | |
| |
| | Semiconductors & Semiconductor Equipment – 1.5% | |
| | 6,261 | | ASML Holding NV | | | 4,210,836 | |
| | 7,452 | | KLA Corp. | | | 4,964,746 | |
| | 120,821 | | Marvell Technology, Inc. | | | 9,678,970 | |
| | 59,575 | | Taiwan Semiconductor Manufacturing Co. Ltd. ADR | | | 11,351,420 | |
| | 31,612 | | Texas Instruments, Inc. | | | 6,422,294 | |
| | | | | | | | |
| | | | | 36,628,266 | |
| | | |
| |
| | Software – 1.4% | |
| | 22,586 | | Microsoft Corp. | | | 9,177,821 | |
| | 84,554 | | Oracle Corp. | | | 14,191,544 | |
| | 41,855 | �� | Salesforce, Inc. | | | 12,195,291 | |
| | | | | | | | |
| | | | | 35,564,656 | |
| | | |
| |
| | Specialized REITs – 0.8% | |
| | 34,499 | | American Tower Corp. | | | 7,366,917 | |
| | 63,567 | | Digital Realty Trust, Inc. | | | 11,329,546 | |
| | | | | | | | |
| | | | | 18,696,463 | |
| | | |
| |
| | Specialty Retail – 0.6% | |
| | 53,688 | | Lowe’s Cos., Inc. | | | 14,057,129 | |
| | | |
| |
| | Textiles, Apparel & Luxury Goods – 0.3% | |
| | 87,454 | | NIKE, Inc. Class B | | | 6,745,327 | |
| | | |
| |
| | Trading Companies & Distributors – 0.4% | |
| | 127,163 | | Fastenal Co. | | | 9,941,603 | |
| | | |
| | |
| 14 | | The accompanying notes are an integral part of these financial statements. |
GOLDMAN SACHS INCOME BUILDER FUND
| | | | | | | | |
| | | Shares | | Description | | Value | |
| |
| | Common Stocks – (continued) | |
| |
| | Water Utilities – 0.2% | |
| | 41,082 | | American Water Works Co., Inc. | | $ | 5,673,835 | |
| | | |
| | TOTAL COMMON STOCKS
(Cost $659,462,454) | | $ | 893,708,343 | |
| | | |
| | | | | | | | | | | | | | | | |
| | | Principal
Amount | | | Interest
Rate | | | Maturity Date | | Value | |
| |
| | Bank Loans(i) – 4.3% | |
| |
| | Aerospace & Defense(c) – 0.1% | |
| | Bleriot U.S. Bidco, Inc.(3 mo. USD Term SOFR + 3.250%) | |
| | $ | | | 1,271,813 | | | | 7.854 | % | | 10/31/30 | | $ | 1,274,305 | |
| | | |
| |
| | Auto Parts & Equipment(c) – 0.4% | |
| | First Brands Group LLC | |
| | (3 mo. USD Term SOFR + 8.500%) | |
| | | | | 2,900,000 | | | | 13.964 | | | 03/30/28 | | | 2,682,500 | |
| | (3 mo. USD Term SOFR + 5.000%) | |
| | | | | 3,929,890 | | | | 9.847 | | | 03/30/27 | | $ | 3,814,035 | |
| | Garrett LX I SARL(3 mo. USD Term SOFR + 2.750%) | |
| | | | | 2,716,000 | | | | 7.335 | | | 04/30/28 | | | 2,716,000 | |
| | | | | | | | | | | | | | | | |
| | | | | 9,212,535 | |
| | | |
| |
| | Building Materials(c) – 0.3% | |
| | Chamberlain Group, Inc.(1 mo. USD Term SOFR + 3.250%) | |
| | | | | 4,303,312 | | | | 8.035 | | | 11/03/28 | | | 4,294,190 | |
| | Icebox Holdco III, Inc. | |
| | (3 mo. USD Term SOFR + 3.500%) | |
| | | | | 2,171,258 | | | | 8.615 | | | 12/22/28 | | | 2,175,470 | |
| | (3 mo. USD Term SOFR + 6.750%) | |
| | | | | 625,000 | | | | 11.615 | | | 12/21/29 | | | 629,169 | |
| | | | | | | | | | | | | | | | |
| | | | | 7,098,829 | |
| | | |
| |
| | Chemicals(c) – 0.2% | |
| | Nouryon Finance BV(3 mo. USD Term SOFR + 3.250%) | |
| | | | | 4,575,256 | | | | 8.059 | | | 04/03/28 | | | 4,596,210 | |
| | | |
| |
| | Commercial Services(c) – 0.4% | |
| | Albion Financing 3 SARL(3 mo. USD Term SOFR + 4.250%) | |
| | | | | 2,955,094 | | | | 9.096 | | | 08/16/29 | | | 2,958,788 | |
| | Anticimex International AB | |
| | (3 mo. USD Term SOFR + 3.150%) | |
| | | | | 1,948,139 | | | | 8.480 | | | 11/16/28 | | | 1,948,295 | |
| | (3 mo. USD Term SOFR + 3.400%) | |
| | | | | 2,906,372 | | | | 8.730 | | | 11/16/28 | | | 2,911,836 | |
| | TruGreen LP(3 mo. USD Term SOFR + 8.500%) | |
| | | | | 1,750,000 | | | | 13.347 | | | 11/02/28 | | | 1,557,500 | |
| | | | | | | | | | | | | | | | |
| | | | | 9,376,419 | |
| | | |
| |
| | Computers(c) – 0.1% | |
| | Virtusa Corp.(1 mo. USD Term SOFR + 3.250%) | |
| | | | | 1,869,623 | | | | 7.935 | | | 02/15/29 | | | 1,868,221 | |
| | | |
| | | | | | | | | | | | | | | | |
| | | Principal
Amount | | | Interest Rate | | | Maturity Date | | Value | |
| |
| | Bank Loans(i) – (continued) | |
| |
| | Diversified Financial Services(c) – 0.0% | |
| | Fiserv Investment Solutions, Inc.(3 mo. USD Term SOFR + 4.000%) | |
| | $ | | | 622,375 | | | | 9.128 | % | | 02/18/27 | | $ | 593,721 | |
| | | |
| |
| | Electronics(d)(j) – 0.1% | |
| | LSF12 Crown U.S. Commercial Bidco LLC | |
| | | | | 3,250,000 | | | | 0.000 | | | 10/10/31 | | | 3,241,875 | |
| | | |
| |
| | Engineering & Construction – 0.4% | |
| | AAL Delaware Holdco, Inc.(c)(1 mo. USD Term SOFR + 3.500%) | |
| | | | | 4,550,000 | | | | 8.185 | | | 07/30/31 | | | 4,568,973 | |
| | Brown Group Holding LLC (c) | |
| | (1 mo. USD Term SOFR + 2.750%) | |
| | | | | 964,963 | | | | 7.468 | | | 07/01/31 | | | 963,883 | |
| | (1 mo. USD Term SOFR + 2.750%)–(3 mo. USD Term SOFR + 2.750%) | |
| | | | | 1,182,038 | | | | 7.335–7.807 | | | 07/01/31 | | | 1,180,264 | |
| | Construction Partners, Inc.(d)(j) | |
| | | | | 600,000 | | | | 0.000 | | | 10/29/31 | | | 600,000 | |
| | Energize HoldCo LLC(c)(1 mo. USD Term SOFR + 3.750%) | |
| | | | | 3,384,748 | | | | 8.550 | | | 12/08/28 | | | 3,383,902 | |
| | | | | | | | | | | | | | | | |
| | | | | 10,697,022 | |
| | | |
| |
| | Entertainment – 0.2% | |
| | Cinemark USA, Inc.(c)(1 mo. USD Term SOFR + 3.250%)–(3 mo. USD Term SOFR + 3.250%) | |
| | | | | 2,905,897 | | | | 7.854–7.935 | | | 05/24/30 | | | 2,912,552 | |
| | Crown Finance U.S., Inc.(j) | |
| | | | | 2,625,000 | | | | 0.000 | | | 10/31/31 | | | 2,608,594 | |
| | | | | | | | | | | | | | | | |
| | | | | 5,521,146 | |
| | | |
| |
| | Health Care Services(c) – 0.1% | |
| | LifePoint Health, Inc.(3 mo. USD Term SOFR + 4.750%) | |
| | | | | 2,786,915 | | | | 8.406 | | | 05/17/31 | | | 2,786,692 | |
| | | |
| |
| | Insurance(c) – 0.1% | |
| | Asurion LLC(1 mo. USD Term SOFR + 3.250%) | |
| | | | | 2,657,313 | | | | 8.050 | | | 12/23/26 | | | 2,656,463 | |
| | | |
| |
| | Internet(c) – 0.2% | |
| | Plano HoldCo, Inc. | |
| | | | | 3,100,000 | | | | 8.092 | | | 10/02/31 | | | 3,115,500 | |
| | Syndigo LLC(1 mo. USD Term SOFR + 4.500%) | |
| | | | | 2,002,375 | | | | 9.300 | | | 12/15/27 | | | 1,997,369 | |
| | | | | | | | | | | | | | | | |
| | | | | 5,112,869 | |
| | | |
| |
| | Leisure Time(c) – 0.1% | |
| | Arcis Golf LLC(1 mo. USD Term SOFR + 3.750%) | |
| | | | | 1,979,665 | | | | 8.572 | | | 11/24/28 | | | 1,988,336 | |
| | LC Ahab U.S. Bidco LLC | |
| | | | | 950,000 | | | | 8.185 | | | 05/01/31 | | | 952,375 | |
| | | | | | | | | | | | | | | | |
| | | | | 2,940,711 | |
| | | |
| |
| | Machinery-Diversified(c) – 0.3% | |
| | Clark Equipment Co.(3 mo. USD Term SOFR + 2.000%) | |
| | | | | 300,196 | | | | 6.604 | | | 04/20/29 | | | 299,728 | |
| | | |
| | |
| The accompanying notes are an integral part of these financial statements. | | 15 |
GOLDMAN SACHS INCOME BUILDER FUND
|
Schedule of Investments (continued) October 31, 2024 |
| | | | | | | | | | | | | | | | |
| | | Principal Amount | | | Interest
Rate | | | Maturity Date | | Value | |
| |
| | Bank Loans(i) – (continued) | |
| |
| | Machinery-Diversified(c) – (continued) | |
| | Engineered Machinery Holdings, Inc. | |
| | (3 mo. EUR EURIBOR + 3.750%) | |
| | EUR | | | 848,750 | | | | 7.095 | % | | 05/21/28 | | $ | 924,880 | |
| | (3 mo. USD Term SOFR + 3.750%) | |
| | $ | | | 1,819,668 | | | | 8.615 | | | 05/19/28 | | | 1,823,962 | |
| | TK Elevator U.S. Newco, Inc.(6 mo. USD Term SOFR + 3.500%) | |
| | | | | 4,583,813 | | | | 8.588 | | | 04/30/30 | | | 4,593,852 | |
| | | | | | | | | | | | | | | | |
| | | | | 7,642,422 | |
| | | |
| |
| | Media – 0.1% | |
| | Audacy Capital Corp.(c)(1 mo. USD Term SOFR + 6.114%) | |
| | | | | 119,349 | | | | 10.800 | | | 08/19/24 | | | 119,647 | |
| | Cumulus Media New Holdings, Inc.(c)(3 mo. USD Term SOFR + 5.000%) | |
| | | | | 572,401 | | | | 9.559 | | | 05/02/29 | | | 248,995 | |
| | Diamond Sports Group LLC(Fixed + 5.000%) | |
| | | | | 191,849 | | | | 5.000 | | | 12/02/24 | | | 201,921 | |
| | DirecTV Financing LLC(c)(3 mo. USD Term SOFR + 5.000%) | |
| | | | | 923,564 | | | | 9.847 | | | 08/02/27 | | | 924,543 | |
| | Entercom Media Corp. | |
| | | | | 4,070,000 | | | | 7.717 | | | 11/18/24 | | | 1,788,602 | |
| | | | | | | | | | | | | | | | |
| | | | | 3,283,708 | |
| | | |
| |
| | Metal Fabricate & Hardware(c) – 0.1% | |
| | Grinding Media, Inc.(3 mo. USD Term SOFR + 4.000%) | |
| | | | | 2,594,750 | | | | 8.898 | | | 10/12/28 | | | 2,594,750 | |
| | | |
| |
| | Packaging(c) – 0.1% | |
| | LABL, Inc.(1 mo. USD Term SOFR + 5.000%) | |
| | | | | 1,847,750 | | | | 9.785 | | | 10/29/28 | | | 1,804,106 | |
| | | |
| |
| | Pipelines(c) – 0.4% | |
| | AL GCX Holdings LLC(1 mo. USD Term SOFR + 2.750%) | |
| | | | | 900,000 | | | | 7.601 | | | 05/17/29 | | | 900,747 | |
| | CQP Holdco LP(3 mo. USD Term SOFR + 2.250%) | |
| | | | | 2,955,147 | | | | 6.854 | | | 12/31/30 | | | 2,952,635 | |
| | Epic Y-Grade Services LP(3 mo. USD Term SOFR + 5.750%) | |
| | | | | 4,150,000 | | | | 10.601 | | | 06/29/29 | | | 4,137,674 | |
| | NGP XI Midstream Holdings LLC(3 mo. USD Term SOFR + 4.000%) | |
| | | | | 2,425,000 | | | | 8.604 | | | 07/25/31 | | | 2,423,497 | |
| | | | | | | | | | | | | | | | |
| | | | | 10,414,553 | |
| | | |
| |
| | Software(c) – 0.5% | |
| | AppLovin Corp.(1 mo. USD Term SOFR + 3.350%) | |
| | | | | 820,054 | | | | 7.185 | | | 08/16/30 | | | 820,653 | |
| | Athenahealth Group, Inc.(1 mo. USD Term SOFR + 3.250%) | |
| | | | | 2,352,855 | | | | 7.935 | | | 02/15/29 | | | 2,343,538 | |
| | Drake Software LLC(1 mo. USD Term SOFR + 4.250%) | |
| | | | | 4,400,000 | | | | 8.935 | | | 06/26/31 | | | 4,312,000 | |
| | Dun & Bradstreet Corp.(1 mo. USD Term SOFR + 2.750%) | |
| | | | | 3,310,217 | | | | 7.468 | | | 01/18/29 | | | 3,315,381 | |
| | iSolved, Inc.(1 mo. USD Term SOFR + 3.500%) | |
| | | | | 1,220,067 | | | | 8.185 | | | 10/15/30 | | | 1,223,118 | |
| | | |
| | | | | | | | | | | | | | | | |
| | | Principal Amount | | | Interest
Rate | | | Maturity Date | | Value | |
| |
| | Bank Loans(i) – (continued) | |
| |
| | Software(c) – (continued) | |
| | UKG, Inc.(3 mo. USD Term SOFR + 3.000%) | |
| | $ | | | 1,216,798 | | | | 7.617 | % | | 02/10/31 | | $ | 1,217,795 | |
| | | | | | | | | | | | | | | | |
| | | | | 13,232,485 | |
| | | |
| |
| | Telecommunications(c) – 0.1% | |
| | Level 3 Financing, Inc.(1 mo. USD Term SOFR + 3.000%) | |
| | | | | 1,568,485 | | | | 11.278 | | | 04/15/29 | | | 1,601,423 | |
| | | |
| | TOTAL BANK LOANS
(Cost $109,869,096) | | $ | 107,550,465 | |
| | | |
| | | |
| |
| | Sovereign Debt Obligations – 0.4% | |
| |
| | United States Dollar – 0.4% | |
| | Angola Government International Bonds | |
| | $ | | | 570,000 | | | | 9.125 | % | | 11/26/49 | | $ | 475,722 | |
| | Bahrain Government International Bonds | |
| | | | | 540,000 | | | | 5.625 | | | 05/18/34 | | | 500,342 | |
| | Benin Government International Bonds | |
| | EUR | | | 350,000 | | | | 4.875 | | | 01/19/32 | | | 339,429 | |
| | Ecuador Government International Bonds | |
| | $ | | | 57,283 | | | | 0.000 | (b)(k) | | 07/31/30 | | | 31,219 | |
| | | | | 550,000 | | | | 5.500 | (l) | | 07/31/35 | | | 303,600 | |
| | Egypt Government International Bonds | |
| | | | | 880,000 | | | | 8.875 | | | 05/29/50 | | | 713,900 | |
| | El Salvador Government International Bonds (a) | |
| | | | | 720,000 | | | | 7.125 | | | 01/20/50 | | | 549,360 | |
| | Guatemala Government Bonds (a) | |
| | | | | 766,000 | | | | 6.125 | | | 06/01/50 | | | 700,651 | |
| | Hungary Government International Bonds | |
| | | | | 730,000 | | | | 3.125 | | | 09/21/51 | | | 449,278 | |
| | Ivory Coast Government International Bonds (b) | |
| | | | | 450,000 | | | | 6.375 | | | 03/03/28 | | | 446,909 | |
| | Mexico Government International Bonds (a) | |
| | | | | 200,000 | | | | 5.400 | | | 02/09/28 | | | 200,813 | |
| | National Bank of Uzbekistan | |
| | | | | 200,000 | | | | 4.850 | | | 10/21/25 | | | 196,274 | |
| | Nigeria Government International Bonds | |
| | | | | 400,000 | | | | 7.625 | | | 11/28/47 | | | 304,252 | |
| | | | | 320,000 | | | | 8.250 | | | 09/28/51 | | | 254,602 | |
| | Oman Government International Bonds | |
| | | | | 280,000 | | | | 5.625 | | | 01/17/28 | | | 281,050 | |
| | | | | 200,000 | | | | 6.250 | (b) | | 01/25/31 | | | 208,313 | |
| | | | | 980,000 | | | | 6.500 | | | 03/08/47 | | | 986,125 | |
| | Pakistan Government International Bonds | |
| | | | | 540,000 | | | | 8.875 | | | 04/08/51 | | | 429,300 | |
| | Panama Government International Bonds | |
| | | | | 930,000 | | | | 4.300 | | | 04/29/53 | | | 590,550 | |
| | Paraguay Government International Bonds (a) | |
| | | | | 820,000 | | | | 5.400 | | | 03/30/50 | | | 725,956 | |
| | Republic of South Africa Government International Bonds | |
| | | | | 710,000 | | | | 5.000 | | | 10/12/46 | | | 512,975 | |
| | Romania Government International Bonds | |
| | | | | 1,030,000 | | | | 4.000 | | | 02/14/51 | | | 693,319 | |
| | | |
| | |
| 16 | | The accompanying notes are an integral part of these financial statements. |
GOLDMAN SACHS INCOME BUILDER FUND
| | | | | | | | | | | | | | | | |
| | | Principal Amount | | | Interest
Rate | | | Maturity Date | | Value | |
| |
| | Sovereign Debt Obligations – (continued) | |
| |
| | United States Dollar – (continued) | |
| | Turkiye Government International Bonds | |
| | $ | | | 300,000 | | | | 9.875 | % | | 01/15/28 | | $ | 334,781 | |
| | | | | 260,000 | | | | 6.125 | | | 10/24/28 | | | 260,894 | |
| | Ukraine Government International Bonds (b)(l) | |
| | | | | 63,457 | | | | 1.750 | | | 02/01/29 | | | 37,979 | |
| | | | | 5,777 | | | | 0.000 | (k) | | 02/01/30 | | | 2,764 | |
| | | | | 21,588 | | | | 0.000 | (k) | | 02/01/34 | | | 7,912 | |
| | | | | 42,304 | | | | 1.750 | | | 02/01/34 | | | 19,819 | |
| | | | | 18,243 | | | | 0.000 | (k) | | 02/01/35 | | | 8,848 | |
| | | | | 15,203 | | | | 0.000 | (k) | | 02/01/36 | | | 7,335 | |
| | | |
| | TOTAL SOVEREIGN DEBT OBLIGATIONS
(Cost $10,045,405) | | $ | 10,574,271 | |
| | | |
| | | | | | | | |
| | | Shares | | Dividend Rate | | Value | |
| |
| | Preferred Stocks – 0.3% | |
| |
| | Capital Markets – 0.2% | |
| | Morgan Stanley | |
| | 183,597 | | 6.375% | | $ | 4,665,200 | |
| | | |
| |
| | Diversified Telecommunication Services – 0.0% | |
| | Qwest Corp. | |
| | 43,276 | | 6.500 | | | 693,714 | |
| | | |
| |
| | Insurance(h) – 0.1% | |
| | Delphi Financial Group, Inc. (3 mo. USD Term SOFR + 3.452%) | |
| | 143,849 | | 8.570 | | | 3,488,338 | |
| | | |
| | TOTAL PREFERRED STOCKS
(Cost $8,780,987) | | $ | 8,847,252 | |
| | | |
| | | | | | | | | | | | | | | | |
| | | Principal Amount | | | Interest
Rate | | | Maturity Date | | Value | |
| |
| | Mortgage-Backed Obligations(a)(c) – 0.0% | |
| |
| | Collateralized Mortgage Obligations – 0.0% | |
| |
| | Sequential Floating Rate – 0.0% | |
| | Merrill Lynch Alternative Note Asset Trust Series 2007-OAR3, Class A1 (1 mo. USD Term SOFR + 0.494%) | |
| | $ | | | 104,488 | | | | 5.232 | % | | 07/25/47 | | $ | 93,394 | |
| | | |
| | TOTAL COLLATERALIZED MORTGAGE OBLIGATIONS | | | 93,394 | |
| | | |
| | TOTAL MORTGAGE-BACKED OBLIGATIONS
(Cost $40,489) | | $ | 93,394 | |
| | | |
| | | | | | | | |
| | | |
| | | Units | | Expiration Date | | Value | |
| |
| | Warrants(h) – 0.0% | |
| |
| | Aspect Software, Inc.(d) | |
| | 194,739 | | 12/31/99 | | $ | 195 | |
| | | |
| | | | | | | | |
| | | Units | | Expiration Date | | Value | |
| |
| | Warrants(h) – (continued) | |
| |
| | Noble Corp. PLC | |
| | 5,288 | | 02/04/28 | | $ | 66,840 | |
| | | |
| | TOTAL WARRANTS
(Cost $13,220) | | $ | 67,035 | |
| | | |
| | | |
| | | Shares | | Description | | Value | |
| |
| | Exchange Traded Funds – 3.7% | |
| | | |
| | 1,805,470 | | Goldman Sachs Nasdaq-100 | | | | |
| | | | Core Premium Income ETF(m) | | $ | 85,452,895 | |
| | 43,398 | | iShares U.S. Technology ETF | | | 6,539,645 | |
| | | |
| | TOTAL EXCHANGE TRADED FUNDS
(Cost $92,363,297) | | $ | 91,992,540 | |
| | | |
| | | |
| | | Shares | | Dividend Rate | | Value | |
| |
| | Investment Companies(m) – 7.1% | |
| |
| | Goldman Sachs Financial Square Government Fund — Class R6 | |
| | 19,765,967 | | 4.766% | | $ | 19,765,967 | |
| | Goldman Sachs Financial Square Government Fund — Institutional Shares | |
| | 121,015,964 | | 4.766 | | | 121,015,964 | |
| | Goldman Sachs MLP Energy Infrastructure Fund — Class R6 | |
| | 950,467 | | 4.890 | | | 35,195,778 | |
| | | |
| | TOTAL INVESTMENT COMPANIES
(Cost $157,623,815) | | $ | 175,977,709 | |
| | | |
| | TOTAL INVESTMENTS – 97.7%
(Cost $2,224,051,406) | | $ | 2,428,780,300 | |
| | | |
| | OTHER ASSETS IN EXCESS OF LIABILITIES – 2.3% | | | 56,041,605 | |
| | | |
| | NET ASSETS – 100.0% | | $ | 2,484,821,905 | |
| | | |
The percentage shown for each investment category reflects the value of investments in that category as a percentage of net assets.
| | |
| |
| (a) | | Security with “Call” features with resetting interest rates. Maturity dates disclosed are the final maturity dates. |
| |
| (b) | | Exempt from registration under Rule 144A of the Securities Act of 1933. |
| |
| (c) | | Variable rate security. Except for floating rate notes (for which final maturity is disclosed), maturity date disclosed is the next interest reset date. Interest rate disclosed is that which is in effect on October 31, 2024. |
| |
| (d) | | Significant unobservable inputs were used in the valuation of this portfolio security; i.e., Level 3. |
| |
| (e) | | Security with “Put” features and resetting interest rates. Maturity dates disclosed are the puttable dates. Interest rate disclosed is that which is in effect on October 31, 2024. |
| |
| (f) | | Guaranteed by a foreign government until maturity. |
| |
| (g) | | Pay-in-kind securities. |
| | |
| The accompanying notes are an integral part of these financial statements. | | 17 |
GOLDMAN SACHS INCOME BUILDER FUND
|
Schedule of Investments (continued) October 31, 2024 |
| | |
| |
| (h) | | Security is currently in default and/or non-income producing. |
| |
| (i) | | Bank Loans often require prepayments from excess cash flows or permit the borrower to repay at its election. The degree to which borrowers repay, whether as a contractual requirement or at their election, cannot be predicted with accuracy. As a result, the actual remaining maturity may be substantially less than the stated maturities shown. As bank loan positions may involve multiple underlying tranches for which the aggregate position is presented, the stated interest rate represents the weighted average interest rate of all contracts on October 31, 2024. Bank Loans typically have rates of interest which are predetermined either daily, monthly, quarterly or semi-annually by reference to a base lending rate, plus a premium. These base lending rates are primarily the Secured Overnight Financing Rate (“SOFR”), and secondarily the prime rate offered by one or more major United States banks (the “Prime Rate”) and the certificate of deposit (“CD”) rate or other base lending rates used by commercial lenders. |
| | |
| |
| (j) | | This position represents an unsettled loan commitment at period end. Certain details associated with this purchase are not known prior to the settlement date, including coupon rate. |
| |
| (k) | | Issued with a zero coupon. Income is recognized through the accretion of discount. |
| |
| (l) | | Coupon changes periodically based upon a predetermined schedule. Interest rate disclosed is that which is in effect on October 31, 2024. |
| |
| (m) | | Represents an affiliated issuer. |
|
|
ADDITIONAL INVESTMENT INFORMATION |
FORWARD FOREIGN CURRENCY EXCHANGE CONTRACTS — At October 31, 2024, the Fund had the following forward foreign currency exchange contracts:
FORWARD FOREIGN CURRENCY EXCHANGE CONTRACTS WITH UNREALIZED GAIN
| | | | | | | | | | | | | | | | | | |
| Counterparty | | Currency Purchased | | | Currency Sold | | | Settlement Date | | Unrealized Gain | |
|
| |
| | | | | | |
MS & Co. Int. PLC | | EUR | | | 16,300,000 | | | USD | | | 17,659,127 | | | 12/18/24 | | $ | 109,107 | |
| | | | | | |
| | USD | | | 18,136,570 | | | EUR | | | 16,300,000 | | | 12/18/24 | | | 368,337 | |
|
| |
| | | | | | |
TOTAL | | | | | | | | | | | | | | | | $ | 477,444 | |
|
| |
FORWARD FOREIGN CURRENCY EXCHANGE CONTRACTS WITH UNREALIZED LOSS
| | | | | | | | | | | | | | | | | | | | | | | | |
| Counterparty | | Currency Purchased | | | Currency Sold | | | | | Settlement Date | | | | | Unrealized Loss | |
|
| |
| | | | | | | | |
MS & Co. Int. PLC | | USD | | | 26,720,216 | | | EUR | | | 24,633,170 | | | | | 01/16/25 | | | | | | $ | (166,177 | ) |
|
| |
FUTURES CONTRACTS — At October 31, 2024, the Fund had the following futures contracts:
| | | | | | | | | | | | | | | | |
| Description | | Number of
Contracts | | | Expiration
Date | | | Notional
Amount | | | Unrealized
Appreciation/
(Depreciation) | |
|
| |
| | | | |
Long position contracts: | | | | | | | | | | | | | | | | |
10 Year U.S. Treasury Notes | | | 420 | | | | 12/19/24 | | | $ | 46,396,875 | | | $ | (1,377,995 | ) |
2 Year U.S. Treasury Notes | | | 87 | | | | 12/31/24 | | | | 17,917,242 | | | | (125,428 | ) |
20 Year U.S. Treasury Bonds | | | 299 | | | | 12/19/24 | | | | 35,272,656 | | | | (1,988,625 | ) |
5 Year U.S. Treasury Notes | | | 454 | | | | 12/31/24 | | | | 48,684,406 | | | | (1,352,137 | ) |
Dow Jones U.S. Real Estate Index | | | 164 | | | | 12/20/24 | | | | 6,197,560 | | | | (145,460 | ) |
Euro Stoxx 50 Index | | | 44 | | | | 12/20/24 | | | | 2,313,601 | | | | (69,284 | ) |
French 10 Year Government Bonds | | | 206 | | | | 12/06/24 | | | | 27,933,373 | | | | (325,601 | ) |
S&P 500 E-Mini Index | | | 195 | | | | 12/20/24 | | | | 55,950,375 | | | | 525,469 | |
TOPIX Index | | | 52 | | | | 12/12/24 | | | | 9,221,666 | | | | 550,678 | |
Ultra 10-Year U.S. Treasury Notes | | | 4 | | | | 12/19/24 | | | | 455,000 | | | | (18,394 | ) |
Ultra Long U.S. Treasury Bonds | | | 599 | | | | 12/19/24 | | | | 75,249,375 | | | | (4,886,374 | ) |
|
| |
| | | | |
| Total | | | | | | | | | | | | | | $ | (9,213,151 | ) |
|
| |
| | | | |
Short position contracts: | | | | | | | | | | | | | | | | |
10 Year German Euro-Bund | | | (221) | | | | 12/06/24 | | | | (31,683,761 | ) | | | 391,094 | |
10 Year U.S. Treasury Notes | | | (198) | | | | 12/19/24 | | | | (21,872,812 | ) | | | 584,742 | |
5 Year German Euro-Bobl | | | (44) | | | | 12/06/24 | | | | (5,654,776 | ) | | | 48,750 | |
| | |
| 18 | | The accompanying notes are an integral part of these financial statements. |
GOLDMAN SACHS INCOME BUILDER FUND
|
|
ADDITIONAL INVESTMENT INFORMATION (continued) |
FUTURES CONTRACTS (continued)
| | | | | | | | | | | | | | | | |
| Description | | Number of
Contracts | | | Expiration
Date | | | Notional
Amount | | | Unrealized
Appreciation/
(Depreciation) | |
|
| |
| | | | |
Short position contracts: | | | | | | | | | | | | | | | | |
5 Year U.S. Treasury Notes | | | (728) | | | | 12/31/24 | | | $ | (78,066,625 | ) | | $ | 1,869,351 | |
Ultra 10-Year U.S. Treasury Notes | | | (90) | | | | 12/19/24 | | | | (10,237,500 | ) | | | 405,806 | |
Ultra Long U.S. Treasury Bonds | | | (94) | | | | 12/19/24 | | | | (11,808,750 | ) | | | 716,491 | |
|
| |
| | | | |
| Total | | | | | | | | | | | | | | $ | 4,016,234 | |
|
| |
| | | | |
| TOTAL FUTURES CONTRACTS | | | | | | | | | | | | | | $ | (5,196,917 | ) |
|
| |
SWAP CONTRACTS — At October 31, 2024, the Fund had the following swap contracts:
CENTRALLY CLEARED INTEREST RATE SWAP CONTRACTS
| | | | | | | | | | | | | | | | | | | | | | |
| Payments Made by the Fund | | Payments Received by Fund | | Termination
Date | | Notional
Amount (000s)(a) | | | Market
Value | | | Upfront
Premium
(Received)
Paid | | | Unrealized
Appreciation/
(Depreciation) | |
|
| |
| | | | | | | |
4.000%(b) | | 12M SOFR(b) | | 12/18/25 | | $ | | | 4,600 | | | $ | 2,615 | | | $ | (8,278 | ) | | $ | 10,893 | |
3.750(c) | | 12M SOFR(c) | | 12/18/26 | | | | | 5,770 | | | | 13,191 | | | | (67,317 | ) | | | 80,508 | |
12M SOFR(c) | | 3.750%(c) | | 12/18/27 | | | | | 14,870 | | | | (24,851 | ) | | | 270,524 | | | | (295,375 | ) |
2.500(d) | | 6M EURO(c) | | 12/18/27 | | EUR | | | 170 | | | | (943 | ) | | | (1,342 | ) | | | 399 | |
12M SOFR(c) | | 3.750(c) | | 12/18/29 | | $ | | | 133,640 | | | | (19,084 | ) | | | 3,988,791 | | | | (4,007,875 | ) |
2.500(d) | | 6M EURO(c) | | 12/18/29 | | EUR | | | 430 | | | | (3,568 | ) | | | (5,069 | ) | | | 1,501 | |
3.750(c) | | 12M SOFR(c) | | 12/18/31 | | $ | | | 20,850 | | | | (769 | ) | | | (841,996 | ) | | | 841,227 | |
2.500(d) | | 6M EURO(c) | | 12/18/31 | | EUR | | | 220 | | | | (2,097 | ) | | | (2,867 | ) | | | 770 | |
12M SOFR(c) | | 3.750(c) | | 12/18/34 | | $ | | | 154,110 | | | | (201,098 | ) | | | 4,731,595 | | | | (4,932,693 | ) |
12M SOFR(c) | | 3.750(c) | | 12/18/44 | | | | | 360 | | | | (2,696 | ) | | | 26,551 | | | | (29,247 | ) |
12M SOFR(c) | | 3.500(c) | | 12/18/54 | | | | | 10,960 | | | | (277,897 | ) | | | 496,110 | | | | (774,007 | ) |
|
| |
| | | | | | | |
| TOTAL | | | | | | | | | | | | $ | (517,197 | ) | | $ | 8,586,702 | | | $ | (9,103,899 | ) |
|
| |
| | (a) | Represents forward starting interest rate swaps whose effective dates of commencement of accruals and cash flows occur subsequent to October 31, 2024. |
| | (b) | Payments made at maturity. |
| | (c) | Payments made annually. |
| | (d) | Payments made semi-annually. |
WRITTEN OPTIONS CONTRACTS — At October 31, 2024, the Fund had the following written options:
OVER-THE-COUNTER OPTIONS ON EQUITIES
| | | | | | | | | | | | | | | | | | | | | | | | | | | | | | |
| Description | | Counterparty | | Exercise
Price | | | Expiration Date | | | Number of
Contracts | | | Notional Amount | | | Market Value | | | Premiums Paid
(Received) by Fund | | | Unrealized
Appreciation/
(Depreciation) | |
|
| |
| | | | | |
Written option contract | | | | | | | | | | | | | | | | | | | | | |
Calls | | | | | | | | | | | | | | | | | | | | | | | | | | | | | | |
STOX Index | | UBS AG (London) | | | $4,972.459 | | | | 11/19/2024 | | | | (4,029 | ) | | | $(2,003,403,731 | ) | | | $(142,722 | ) | | | $(139,638 | ) | | | $(3,084) | |
|
| |
| | |
|
|
| Currency Abbreviations: |
| EUR | | —Euro |
| USD | | —U.S. Dollar |
|
|
| | |
| The accompanying notes are an integral part of these financial statements. | | 19 |
GOLDMAN SACHS INCOME BUILDER FUND
|
Schedule of Investments (continued) October 31, 2024 |
|
|
ADDITIONAL INVESTMENT INFORMATION (continued) |
| | |
|
|
| Investment Abbreviations: |
| ADR | | —American Depositary Receipt |
| CMT | | —Constant Maturity Treasury Indexes |
| ETF | | —Exchange Traded Fund |
| EURIBOR | | —Euro Interbank Offered Rate |
| ICE | | —Inter-Continental Exchange |
| LLC | | —Limited Liability Company |
| LP | | —Limited Partnership |
| MLP | | —Master Limited Partnership |
| MTN | | —Medium Term Note |
| PIK | | —Payment in kind |
| PLC | | —Public Limited Company |
| REIT | | —Real Estate Investment Trust |
| SOFR | | —Secured Overnight Financing Rate |
|
|
| | |
|
|
| Abbreviations: |
| EURO | | —Euro Offered Rate |
| MS & Co. Int. PLC | | —Morgan Stanley & Co. International PLC |
| SOFR | | —Secured Overnight Financing Rate |
|
|
| | |
| 20 | | The accompanying notes are an integral part of these financial statements. |
GOLDMAN SACHS RISING DIVIDEND GROWTH FUND
|
Schedule of Investments October 31, 2024 |
| | | | | | | | |
| | | Shares | | Description | | Value | |
| |
| | Common Stocks – 97.2% | |
| |
| | Banks – 0.9% | |
| | 2,120 | | First Citizens BancShares, Inc. Class A | | $ | 4,107,182 | |
| | | |
| |
| | Biotechnology – 2.4% | |
| | 29,040 | | AbbVie, Inc. | | | 5,920,385 | |
| | 16,921 | | Amgen, Inc. | | | 5,417,427 | |
| | | | | | | | |
| | | | | 11,337,812 | |
| | | |
| |
| | Broadline Retail – 0.5% | |
| | 5,965 | | Dillard’s, Inc. Class A | | | 2,216,117 | |
| | | |
| |
| | Building Products – 2.7% | |
| | 36,615 | | A.O. Smith Corp. | | | 2,749,787 | |
| | 24,560 | | AAON, Inc. | | | 2,805,243 | |
| | 6,490 | | Lennox International, Inc. | | | 3,910,679 | |
| | 43,870 | | Masco Corp. | | | 3,505,652 | |
| | | | | | | | |
| | | | | 12,971,361 | |
| | | |
| |
| | Capital Markets – 5.1% | |
| | 81,240 | | Charles Schwab Corp. | | | 5,754,229 | |
| | 11,052 | | Evercore, Inc. Class A | | | 2,919,607 | |
| | 8,000 | | FactSet Research Systems, Inc. | | | 3,632,480 | |
| | 10,710 | | MarketAxess Holdings, Inc. | | | 3,099,688 | |
| | 10,790 | | Moody’s Corp. | | | 4,899,092 | |
| | 37,621 | | T. Rowe Price Group, Inc. | | | 4,133,043 | |
| | | | | | | | |
| | | | | 24,438,139 | |
| | | |
| |
| | Chemicals – 0.8% | |
| | 10,269 | | Sherwin-Williams Co. | | | 3,684,209 | |
| | | |
| |
| | Commercial Services & Supplies – 0.8% | |
| | 80,767 | | Rollins, Inc. | | | 3,807,356 | |
| | | |
| |
| | Communications Equipment – 1.3% | |
| | 14,368 | | Motorola Solutions, Inc. | | | 6,456,261 | |
| | | |
| |
| | Consumer Finance – 1.0% | |
| | 31,010 | | Discover Financial Services | | | 4,602,814 | |
| | | |
| |
| | Consumer Staples Distribution & Retail – 2.0% | |
| | 6,144 | | Costco Wholesale Corp. | | | 5,370,962 | |
| | 77,022 | | Kroger Co. | | | 4,295,517 | |
| | | | | | | | |
| | | | | 9,666,479 | |
| | | |
| |
| | Diversified Telecommunication Services – 0.7% | |
| | 43,145 | | Cogent Communications Holdings, Inc. | | | 3,463,249 | |
| | | |
| |
| | Electric Utilities – 1.0% | |
| | 59,547 | | NextEra Energy, Inc. | | | 4,719,100 | |
| | | |
| |
| | Electronic Equipment, Instruments & Components – 4.9% | |
| | 104,167 | | Amphenol Corp. Class A | | | 6,981,272 | |
| | 13,840 | | Badger Meter, Inc. | | | 2,768,692 | |
| | 25,410 | | CDW Corp. | | | 4,782,924 | |
| | 131,211 | | Corning, Inc. | | | 6,244,332 | |
| | 11,825 | | Littelfuse, Inc. | | | 2,892,750 | |
| | | | | | | | |
| | | | | 23,669,970 | |
| | | |
| |
| | Energy Equipment & Services – 0.5% | |
| | 39,517 | | Archrock, Inc. | | | 791,130 | |
| | 19,156 | | Atlas Energy Solutions, Inc. | | | 374,883 | |
| | | |
| | | | | | | | |
| | | Shares | | Description | | Value | |
| |
| | Common Stocks – (continued) | |
| |
| | Energy Equipment & Services – (continued) | |
| | 16,029 | | Kodiak Gas Services, Inc. | | $ | 511,005 | |
| | 40,811 | | USA Compression Partners LP | | | 890,088 | |
| | | | | | | | |
| | | | | 2,567,106 | |
| | | |
| |
| | Financial Services – 2.6% | |
| | 11,903 | | Mastercard, Inc. Class A | | | 5,946,620 | |
| | 21,720 | | Visa, Inc. Class A | | | 6,295,542 | |
| | | | | | | | |
| | | | | 12,242,162 | |
| | | |
| |
| | Food Products – 1.8% | |
| | 22,815 | | Hershey Co. | | | 4,051,488 | |
| | 69,005 | | Mondelez International, Inc. Class A | | | 4,725,462 | |
| | | | | | | | |
| | | | | 8,776,950 | |
| | | |
| |
| | Gas Utilities – 0.1% | |
| | 29,655 | | Suburban Propane Partners LP | | | 556,624 | |
| | | |
| |
| | Ground Transportation – 0.5% | |
| | 12,510 | | Landstar System, Inc. | | | 2,198,883 | |
| | | |
| |
| | Health Care Providers & Services – 2.9% | |
| | 1 | | CVS Health Corp. | | | 56 | |
| | 10,442 | | Elevance Health, Inc. | | | 4,236,946 | |
| | 16,621 | | Humana, Inc. | | | 4,285,392 | |
| | 9,749 | | UnitedHealth Group, Inc. | | | 5,503,311 | |
| | | | | | | | |
| | | | | 14,025,705 | |
| | | |
| |
| | Hotels, Restaurants & Leisure – 2.1% | |
| | 8,210 | | Domino’s Pizza, Inc. | | | 3,396,723 | |
| | 26,145 | | Papa John’s International, Inc. | | | 1,369,737 | |
| | 56,024 | | Starbucks Corp. | | | 5,473,545 | |
| | | | | | | | |
| | | | | 10,240,005 | |
| | | |
| |
| | Independent Power and Renewable Electricity Producers – 0.5% | |
| | 154,810 | | AES Corp. | | | 2,552,817 | |
| | | |
| |
| | Insurance – 2.2% | |
| | 22,270 | | American Financial Group, Inc. | | | 2,871,271 | |
| | 23,525 | | Marsh & McLennan Cos., Inc. | | | 5,134,096 | |
| | 9,945 | | Primerica, Inc. | | | 2,752,876 | |
| | | | | | | | |
| | | | | 10,758,243 | |
| | | |
| |
| | IT Services – 2.4% | |
| | 21,285 | | Accenture PLC Class A | | | 7,339,494 | |
| | 47,310 | | Amdocs Ltd. | | | 4,151,216 | |
| | | | | | | | |
| | | | | 11,490,710 | |
| | | |
| |
| | Life Sciences Tools & Services – 2.1% | |
| | 20,699 | | Danaher Corp. | | | 5,084,916 | |
| | 9,320 | | Thermo Fisher Scientific, Inc. | | | 5,091,703 | |
| | | | | | | | |
| | | | | 10,176,619 | |
| | | |
| |
| | Machinery – 1.2% | |
| | 39,198 | | Graco, Inc. | | | 3,192,677 | |
| | 31,285 | | Toro Co. | | | 2,517,817 | |
| | | | | | | | |
| | | | | 5,710,494 | |
| | | |
| |
| | Media – 5.8% | |
| | 274,494 | | Comcast Corp. Class A | | | 11,987,153 | |
| | | |
| | |
| The accompanying notes are an integral part of these financial statements. | | 21 |
GOLDMAN SACHS RISING DIVIDEND GROWTH FUND
|
Schedule of Investments (continued) October 31, 2024 |
| | | | | | | | |
| | | Shares | | Description | | Value | |
| |
| | Common Stocks – (continued) | |
| |
| | Media – (continued) | |
| | 202,858 | | Interpublic Group of Cos., Inc. | | $ | 5,964,025 | |
| | 101,320 | | New York Times Co. Class A | | | 5,657,709 | |
| | 24,410 | | Nexstar Media Group, Inc. | | | 4,294,207 | |
| | | | | | | | |
| | | | | 27,903,094 | |
| | | |
| |
| | Metals & Mining – 1.1% | |
| | 9,310 | | Reliance, Inc. | | | 2,665,825 | |
| | 21,634 | | Steel Dynamics, Inc. | | | 2,823,237 | |
| | | | | | | | |
| | | | | 5,489,062 | |
| | | |
| |
| | Multi-Utilities – 0.6% | |
| | 87,020 | | NiSource, Inc. | | | 3,059,623 | |
| | | |
| |
| | Oil, Gas & Consumable Fuels – 14.5% | |
| | 41,220 | | BKV Corp.* | | | 743,609 | |
| | 29,970 | | Cheniere Energy Partners LP | | | 1,514,983 | |
| | 11,980 | | Cheniere Energy, Inc. | | | 2,292,732 | |
| | 14,120 | | Delek Logistics Partners LP | | | 544,608 | |
| | 25,167 | | DT Midstream, Inc. | | | 2,268,805 | |
| | 31,224 | | Enbridge, Inc. | | | 1,261,450 | |
| | 570,211 | | Energy Transfer LP | | | 9,397,077 | |
| | 358,081 | | EnLink Midstream LLC* | | | 5,313,922 | |
| | 241,478 | | Enterprise Products Partners LP | | | 6,920,759 | |
| | 56,104 | | Genesis Energy LP | | | 634,536 | |
| | 12,935 | | Global Partners LP Class E | | | 605,617 | |
| | 108,888 | | Hess Midstream LP Class A | | | 3,772,969 | |
| | 4,416 | | Kinetik Holdings, Inc. | | | 214,927 | |
| | 213,307 | | MPLX LP | | | 9,475,097 | |
| | 8,202 | | ONEOK, Inc. | | | 794,610 | |
| | 9,728 | | Pembina Pipeline Corp. | | | 406,533 | |
| | 410,328 | | Plains All American Pipeline LP | | | 6,676,037 | |
| | 151,662 | | Sunoco LP | | | 7,704,430 | |
| | 8,903 | | Targa Resources Corp. | | | 1,486,445 | |
| | 148,823 | | Western Midstream Partners LP | | | 5,615,092 | |
| | 34,960 | | Williams Cos., Inc. | | | 1,830,855 | |
| | | | | | | | |
| | | | | 69,475,093 | |
| | | |
| |
| | Personal Products – 1.0% | |
| | 44,414 | | Estee Lauder Cos., Inc. Class A | | | 3,061,901 | |
| | 13,000 | | Interparfums, Inc. | | | 1,573,910 | |
| | | | | | | | |
| | | | | 4,635,811 | |
| | | |
| |
| | Pharmaceuticals – 2.4% | |
| | 6,340 | | Eli Lilly & Co. | | | 5,260,552 | |
| | 57,730 | | Perrigo Co. PLC | | | 1,479,620 | |
| | 25,880 | | Zoetis, Inc. | | | 4,626,826 | |
| | | | | | | | |
| | | | | 11,366,998 | |
| | | |
| |
| | Professional Services – 0.5% | |
| | 35,510 | | Robert Half, Inc. | | | 2,418,586 | |
| | | |
| |
| | Residential REITs – 0.5% | |
| | 35,580 | | Equity LifeStyle Properties, Inc. | | | 2,494,870 | |
| | | |
| |
| | Semiconductors & Semiconductor Equipment – 9.7% | |
| | 37,130 | | Applied Materials, Inc. | | | 6,742,065 | |
| | 8,817 | | KLA Corp. | | | 5,874,150 | |
| | 85,280 | | Lam Research Corp. | | | 6,340,568 | |
| | 6,685 | | Monolithic Power Systems, Inc. | | | 5,075,920 | |
| | | |
| | | | | | | | |
| | | Shares | | Description | | Value | |
| |
| | Common Stocks – (continued) | |
| |
| | Semiconductors & Semiconductor Equipment – (continued) | |
| | 61,955 | | NVIDIA Corp. | | $ | 8,225,146 | |
| | 34,402 | | Power Integrations, Inc. | | | 2,078,913 | |
| | 48,420 | | Skyworks Solutions, Inc. | | | 4,240,624 | |
| | 37,709 | | Texas Instruments, Inc. | | | 7,660,960 | |
| | | | | | | | |
| | | | | 46,238,346 | |
| | | |
| |
| | Software – 6.6% | |
| | 15,180 | | InterDigital, Inc. | | | 2,283,679 | |
| | 12,328 | | Intuit, Inc. | | | 7,523,779 | |
| | 19,591 | | Microsoft Corp. | | | 7,960,803 | |
| | 45,061 | | Oracle Corp. | | | 7,563,038 | |
| | 11,804 | | Roper Technologies, Inc. | | | 6,347,365 | |
| | | | | | | | |
| | | | | 31,678,664 | |
| | | |
| |
| | Specialized REITs – 1.5% | |
| | 17,904 | | American Tower Corp. | | | 3,823,220 | |
| | 19,350 | | Extra Space Storage, Inc. | | | 3,159,855 | |
| | | | | | | | |
| | | | | 6,983,075 | |
| | | |
| |
| | Specialty Retail – 4.6% | |
| | 40,409 | | Best Buy Co., Inc. | | | 3,654,186 | |
| | 14,466 | | Home Depot, Inc. | | | 5,695,987 | |
| | 20,272 | | Lowe’s Cos., Inc. | | | 5,307,818 | |
| | 14,670 | | Tractor Supply Co. | | | 3,895,032 | |
| | 25,819 | | Williams-Sonoma, Inc. | | | 3,463,102 | |
| | | | | | | | |
| | | | | 22,016,125 | |
| | | |
| |
| | Technology Hardware, Storage & Peripherals – 2.3% | |
| | 161,791 | | HP, Inc. | | | 5,746,816 | |
| | 43,655 | | NetApp, Inc. | | | 5,033,858 | |
| | | | | | | | |
| | | | | 10,780,674 | |
| | | |
| |
| | Textiles, Apparel & Luxury Goods – 1.3% | |
| | 67,105 | | NIKE, Inc. Class B | | | 5,175,809 | |
| | 16,455 | | Oxford Industries, Inc. | | | 1,194,962 | |
| | | | | | | | |
| | | | | 6,370,771 | |
| | | |
| |
| | Trading Companies & Distributors – 1.8% | |
| | 64,363 | | Fastenal Co. | | | 5,031,899 | |
| | 7,617 | | Watsco, Inc. | | | 3,602,917 | |
| | | | | | | | |
| | | | | 8,634,816 | |
| | | |
| | TOTAL COMMON STOCKS (Cost $312,980,295) | | $ | 465,981,975 | |
| | | |
| | | |
| | | Shares | | Dividend Rate | | Value | |
| |
| | Investment Companies(a) – 2.6% | |
| |
| | Goldman Sachs Financial Square Government Fund — Class R6 | |
| | 12,041,915 | | 4.766% | | $ | 12,041,915 | |
| | | |
| | |
| 22 | | The accompanying notes are an integral part of these financial statements. |
GOLDMAN SACHS RISING DIVIDEND GROWTH FUND
| | | | | | | | |
| | | Shares | | Dividend Rate | | Value | |
| |
| | Investment Companies(a) – (continued) | |
| |
| | Goldman Sachs Financial Square Government Fund —
Institutional Shares | |
| | 270,356 | | 4.766% | | $ | 270,356 | |
| | | |
| | TOTAL INVESTMENT COMPANIES (Cost $12,312,271) | | $ | 12,312,271 | |
| | | |
| | TOTAL INVESTMENTS – 99.8% (Cost $325,292,566) | | $ | 478,294,246 | |
| | | |
| | OTHER ASSETS IN EXCESS OF LIABILITIES – 0.2% | | | 1,002,439 | |
| | | |
| | NET ASSETS – 100.0% | | $ | 479,296,685 | |
| | | |
| | |
| The percentage shown for each investment category reflects the value of investments in that category as a percentage of net assets. |
| |
| * | | Non-income producing security. |
| |
| (a) | | Represents an affiliated issuer. |
|
|
ADDITIONAL INVESTMENT INFORMATION |
FUTURES CONTRACTS — At October 31, 2024, the Fund had the following futures contracts:
| | | | | | | | | | | | |
| Description | | Number of Contracts | | Expiration Date | | Notional Amount | | | Unrealized Appreciation/ (Depreciation) | |
|
| |
| | | | |
Long position contracts: | | | | | | | | | | | | |
S&P 500 E-Mini Index | | 47 | | 12/20/24 | | | $13,485,475 | | | | $(1,569) | |
|
| |
| | | | |
| | |
| Investment Abbreviations: | | |
| LLC | | —Limited Liability Company | | |
| LP | | —Limited Partnership | | |
| PLC | | —Public Limited Company | | |
| | |
| The accompanying notes are an integral part of these financial statements. | | 23 |
GOLDMAN SACHS DIVIDEND FOCUS FUNDS
|
Statements of Assets and Liabilities October 31, 2024 |
| | | | | | | | | | | | |
| | | | | Income Builder Fund | | | Rising Dividend Growth Fund | | | |
| | | | |
| | Assets: | | | | | | | | | | |
| | | | |
| | Investments in unaffiliated issuers, at value (cost $1,980,546,132 and $312,980,295, respectively) | | $ | 2,167,349,696 | | | $ | 465,981,975 | | | |
| | Investments in affiliated issuers, at value (cost $243,505,274 and $12,312,271, respectively) | | | 261,430,604 | | | | 12,312,271 | | | |
| | Cash | | | 27,197,261 | | | | 494,315 | | | |
| | Foreign currencies, at value (cost $1,052,791 and $0, respectively) | | | 1,007,407 | | | | — | | | |
| | Unrealized gain on forward foreign currency exchange contracts | | | 477,444 | | | | — | | | |
| | Variation margin on swaps contracts | | | 2,184,594 | | | | — | | | |
| | Receivables: | | | | | | | | | | |
| | Collateral on certain derivative contracts(a) | | | 20,880,563 | | | | 754,820 | | | |
| | Interest and dividends | | | 19,647,916 | | | | 637,929 | | | |
| | Investments sold | | | 5,920,369 | | | | — | | | |
| | Fund shares sold | | | 1,632,048 | | | | 71,376 | | | |
| | Foreign tax reclaims | | | 1,280,934 | | | | 62,143 | | | |
| | Reimbursement from investment adviser | | | 39,729 | | | | 22,823 | | | |
| | Securities lending income | | | 3,614 | | | | — | | | |
| | Other assets | | | 123,626 | | | | 42,394 | | | |
| | |
| | | | |
| | Total assets | | | 2,509,175,805 | | | | 480,380,046 | | | |
| | |
| | | | | | | | | | | | |
| | | | |
| | Liabilities: | | | | | | | | | | |
| | | | |
| | Variation margin on futures contracts | | | 1,223,880 | | | | 266,781 | | | |
| | Unrealized loss on forward foreign currency exchange contracts | | | 166,177 | | | | — | | | |
| | Written option contracts, at value (premium received $139,638 and $0, respectively) | | | 142,722 | | | | — | | | |
| | Payables: | | | | | | | | | | |
| | Investments purchased | | | 14,830,373 | | | | 42,906 | | | |
| | Investments purchased on an extended-settlement basis | | | 4,035,000 | | | | — | | | |
| | Fund shares redeemed | | | 2,644,250 | | | | 277,943 | | | |
| | Management fees | | | 449,011 | | | | 139,212 | | | |
| | Distribution and Service fees and Transfer Agency fees | | | 236,495 | | | | 63,621 | | | |
| | Due to broker — upfront payment | | | 90,467 | | | | — | | | |
| | Accrued expenses | | | 535,525 | | | | 292,898 | | | |
| | |
| | | | |
| | Total liabilities | | | 24,353,900 | | | | 1,083,361 | | | |
| | |
| | | | | | | | | | | | |
| | | | |
| | Net Assets: | | | | | | | | | | |
| | | | |
| | Paid-in capital | | | 2,283,044,429 | | | | 295,472,506 | | | |
| | Total distributable earnings | | | 201,777,476 | | | | 183,824,179 | | | |
| | |
| | | | |
| | NET ASSETS | | $ | 2,484,821,905 | | | $ | 479,296,685 | | | |
| | | Net Assets: | | | | | | | | | | |
| | | Class A | | $ | 671,053,576 | | | $ | 257,940,616 | | | |
| | | Class C | | | 162,658,945 | | | | 19,890,718 | | | |
| | | Institutional | | | 1,098,588,594 | | | | 118,920,704 | | | |
| | | Investor | | | 482,623,696 | | | | 62,963,178 | | | |
| | | Class R6 | | | 43,102,005 | | | | 6,347,054 | | | |
| | | Class R | | | —1,185,129 | | | | | | | |
| | | Class P | | | 26,795,089 | | | | 12,049,286 | | | |
| | | Total Net Assets | | $ | 2,484,821,905 | | | $ | 479,296,685 | | | |
| | | Shares Outstanding $0.001 par value (unlimited number of shares authorized): | | | | | | | | | | |
| | | Class A | | | 26,253,597 | | | | 20,578,309 | | | |
| | | Class C | | | 6,502,641 | | | | 1,540,223 | | | |
| | | Institutional | | | 41,752,304 | | | | 8,726,242 | | | |
| | | Investor | | | 18,413,513 | | | | 4,632,148 | | | |
| | | Class R6 | | | 1,638,654 | | | | 466,098 | | | |
| | | Class R | | | —95,245 | | | | | | | |
| | | Class P | | | 1,018,463 | | | | 884,029 | | | |
| | | Net asset value, offering and redemption price per share:(b) | | | | | | | | | | |
| | | Class A | | | $25.56 | | | | $12.53 | | | |
| | | Class C | | | 25.01 | | | | 12.91 | | | |
| | | Institutional | | | 26.31 | | | | 13.63 | | | |
| | | Investor | | | 26.21 | | | | 13.59 | | | |
| | | Class R6 | | | 26.30 | | | | 13.62 | | | |
| | | Class R | | | — | | | | 12.44 | | | |
| | | Class P | | | 26.31 | | | | 13.63 | | | |
| | (a) | Segregated for initial margin and/or collateral as follows: |
| | | | | | | | | | | | | | | | | | | | | | |
| | | Fund | | Futures | | | | | | Swaps | | | | | | Forwards | |
| | | |
| | Income Builder Fund | | $ | 9,071,445 | | | | | | | $ | 11,459,118 | | | | | | | $ | 350,000 | |
| | Rising Dividend Growth Fund | | | 754,820 | | | | | | | | — | | | | | | | | — | |
| | | |
| | (b) | Maximum public offering price per share for Class A Shares of the Income Builder and the Rising Dividend Growth Funds is $27.05 and $13.26, respectively. At redemption, Class C Shares may be subject to a contingent deferred sales charge, assessed on the amount equal to the lesser of the current net asset value or the original purchase price of the shares. |
| | |
| 24 | | The accompanying notes are an integral part of these financial statements. |
GOLDMAN SACHS DIVIDEND FOCUS FUNDS
|
Statements of Operations For the Fiscal Year Ended October 31, 2024 |
| | | | | | | | | | |
| | | | | Income Builder Fund | | | Rising Dividend Growth Fund | |
| | | |
| | | Investment Income: | | | | | | | | |
| | | |
| | Interest (net of foreign withholding taxes of $492 and $0, respectively) | | $ | 82,558,608 | | | $ | 34,205 | |
| | Dividends — unaffiliated issuers (net of tax withholding of $563,931 and $7,701, respectively) | | | 23,235,017 | | | | 8,114,337 | |
| | Dividends — affiliated issuers | | | 7,771,003 | | | | 529,446 | |
| | Securities lending income, net of rebates received or paid to borrowers — unaffiliated issuers | | | 139,062 | | | | — | |
| | | |
| | | |
| | Total investment income | | | 113,703,690 | | | | 8,677,988 | |
| | | |
| | | | | | | | | | |
| | | |
| | Expenses: | | | | | | | | |
| | | |
| | Management fees | | | 11,843,724 | | | | 3,646,842 | |
| | Distribution and Service (12b-1) fees(a) | | | 2,868,419 | | | | 822,618 | |
| | Transfer Agency fees(a) | | | 1,916,622 | | | | 578,382 | |
| | Service fees — Class C | | | 439,124 | | | | 57,099 | |
| | Printing and mailing costs | | | 403,505 | | | | 128,857 | |
| | Custody, accounting and administrative services | | | 340,453 | | | | 136,720 | |
| | Registration fees | | | 161,103 | | | | 114,471 | |
| | Professional fees | | | 146,003 | | | | 142,744 | |
| | Trustee fees | | | 31,676 | | | | 27,743 | |
| | Other | | | 62,079 | | | | 37,175 | |
| | | |
| | | |
| | Total expenses | | | 18,212,708 | | | | 5,692,651 | |
| | | |
| | | |
| | Less — expense reductions | | | (3,118,633 | ) | | | (1,215,055) | |
| | | |
| | | |
| | Net expenses | | | 15,094,075 | | | | 4,477,596 | |
| | | |
| | | |
| | NET INVESTMENT INCOME | | | 98,609,615 | | | | 4,200,392 | |
| | | |
| | | | | | | | | | |
| | | |
| | Realized and unrealized gain (loss): | | | | | | | | |
| | | |
| | Net realized gain (loss) from: | | | | | | | | |
| | Investments — unaffiliated issuers | | | 40,592,186 | | | | 45,106,920 | |
| | Futures contracts | | | 16,021,750 | | | | 2,528,688 | |
| | Written options | | | (9,251,636 | ) | | | — | |
| | Swap contracts | | | 6,857,287 | | | | — | |
| | Forward foreign currency exchange contracts | | | (362,876 | ) | | | — | |
| | Foreign currency transactions | | | (271,279 | ) | | | 249 | |
| | Net change in unrealized gain (loss) on: | | | | | | | | |
| | Investments — affiliated issuers | | | 4,521,551 | | | | — | |
| | Investments — unaffiliated issuers | | | 275,206,443 | | | | 66,306,564 | |
| | Futures contracts | | | 4,018,503 | | | | 963,250 | |
| | Written options | | | (152,634 | ) | | | — | |
| | Swap contracts | | | (2,515,235 | ) | | | — | |
| | Forward foreign currency exchange contracts | | | 42,554 | | | | — | |
| | Foreign currency translation | | | (5,544 | ) | | | — | |
| | | |
| | | |
| | Net realized and unrealized gain | | | 334,701,070 | | | | 114,905,671 | |
| | | |
| | | |
| | NET INCREASE IN NET ASSETS RESULTING FROM OPERATIONS | | $ | 433,310,685 | | | $ | 119,106,063 | |
| | | |
| | (a) | Class specific Distribution and/or Service (12b-1) and Transfer Agency fees were as follows: |
| | | | | | | | | | | | | | | | | | | | | | | | | | | | | | | | | | | | | | | | | | | | | | | | | | |
| | | Distribution and/or Service (12b-1) Fees | | Transfer Agency Fees |
| | | | | | | | | | |
Fund | | Class A | | Class C | | Class R | | Class A | | Class C | | Institutional | | Investor | | Class R6 | | Class R | | Class P |
Income Builder Fund | | | $ | 1,551,047 | | | | $ | 1,317,372 | | | | $ | — | | | | $ | 744,503 | | | | $ | 210,780 | | | | $ | 409,886 | | | | $ | 530,365 | | | | $ | 12,706 | | | | $ | — | | | | $ | 8,382 | |
Rising Dividend Growth Fund | | | | 644,797 | | | | | 171,297 | | | | | 6,524 | | | | | 386,879 | | | | | 34,259 | | | | | 46,400 | | | | | 103,040 | | | | | 1,904 | | | | | 1,957 | | | | | 3,943 | |
| | |
| The accompanying notes are an integral part of these financial statements. | | 25 |
GOLDMAN SACHS DIVIDEND FOCUS FUNDS
|
| Statements of Changes in Net Assets |
| | | | | | | | | | | | | | | | | | | | | | |
| | | | | Income Builder Fund | | | Rising Dividend Growth Fund | | | | |
| | | | | | |
| | | | | For the Fiscal
Year Ended
October 31, 2024 | | | For the Fiscal
Year Ended
October 31, 2023 | | | For the Fiscal
Year Ended
October 31, 2024 | | | For the Fiscal
Year Ended
October 31, 2023 | | | | |
| | | | | | |
| | | From operations: | | | | | | | | | | | | | | | | | | | | |
| | | | | | |
| | Net investment income | | $ | 98,609,615 | | | $ | 99,456,743 | | | $ | 4,200,392 | | | $ | 4,570,385 | | | | | |
| | | | | | |
| | Net realized gain (loss) | | | 53,585,432 | | | | (7,652,021 | ) | | | 47,635,857 | | | | 46,855,231 | | | | | |
| | | | | | |
| | Net change in unrealized gain (loss) | | | 281,115,638 | | | | (31,990,092 | ) | | | 67,269,814 | | | | (32,548,494 | ) | | | | |
| |
| | | |
| | | | | | |
| | Net increase in net assets resulting from operations | | | 433,310,685 | | | | 59,814,630 | | | | 119,106,063 | | | | 18,877,122 | | | | | |
| | | |
| | | | | | | | | | | | | | | | | | | | | | |
| | | | | | |
| | Distributions to shareholders: | | | | | | | | | | | | | | | | | | | | |
| | | | | | |
| | From distributable earnings: | | | | | | | | | | | | | | | | | | | | |
| | | | | | |
| | Class A Shares | | | (25,956,929 | ) | | | (25,025,157 | ) | | | (18,281,697 | ) | | | (37,009,107 | ) | | | | |
| | | | | | |
| | Class C Shares | | | (6,065,716 | ) | | | (8,386,590 | ) | | | (1,575,200 | ) | | | (5,482,663 | ) | | | | |
| | | | | | |
| | Institutional Shares | | | (44,972,270 | ) | | | (48,071,340 | ) | | | (7,821,861 | ) | | | (15,912,617 | ) | | | | |
| | | | | | |
| | Investor Shares | | | (19,009,759 | ) | | | (19,418,894 | ) | | | (4,849,423 | ) | | | (9,773,523 | ) | | | | |
| | | | | | |
| | Class R6 Shares | | | (1,849,294 | ) | | | (1,887,663 | ) | | | (443,860 | ) | | | (525,668 | ) | | | | |
| | | | | | |
| | Class R Shares | | | — | | | | — | | | | (94,863 | ) | | | (204,263 | ) | | | | |
| | | | | | |
| | Class P Shares | | | (1,214,857 | ) | | | (1,674,317 | ) | | | (902,309 | ) | | | (2,194,943 | ) | | | | |
| | | | | | |
| | Return of capital: | | | | | | | | | | | | | | | | | | | | |
| | | | | | |
| | Class A Shares | | | — | | | | (68,487 | ) | | | — | | | | — | | | | | |
| | | | | | |
| | Class C Shares | | | — | | | | (22,952 | ) | | | — | | | | — | | | | | |
| | | | | | |
| | Institutional Shares | | | — | | | | (131,557 | ) | | | — | | | | — | | | | | |
| | | | | | |
| | Investor Shares | | | — | | | | (53,144 | ) | | | — | | | | — | | | | | |
| | | | | | |
| | Class R6 Shares | | | — | | | | (5,166 | ) | | | — | | | | — | | | | | |
| | | | | | |
| | Class P Shares | | | — | | | | (4,582 | ) | | | — | | | | — | | | | | |
| |
| | | |
| | | | | | |
| | Total distributions to shareholders | | | (99,068,825 | ) | | | (104,749,849 | ) | | | (33,969,213 | ) | | | (71,102,784 | ) | | | | |
| | | |
| | | | | | | | | | | | | | | | | | | | | | |
| | | | | | |
| | From share transactions: | | | | | | | | | | | | | | | | | | | | |
| | | | | | |
| | Proceeds from sales of shares | | | 586,166,745 | | | | 587,855,935 | | | | 43,422,301 | | | | 75,086,284 | | | | | |
| | | | | | |
| | Reinvestment of distributions | | | 89,726,625 | | | | 93,973,415 | | | | 32,254,188 | | | | 67,611,063 | | | | | |
| | | | | | |
| | Cost of shares redeemed | | | (634,710,819 | ) | | | (792,159,058 | ) | | | (124,196,446 | ) | | | (121,791,713 | ) | | | | |
| |
| | | |
| | | | | | |
| | Net increase (decrease) in net assets resulting from share transactions | | | 41,182,551 | | | | (110,329,708 | ) | | | (48,519,957 | ) | | | 20,905,634 | | | | | |
| | | |
| | | | | | |
| | TOTAL INCREASE (DECREASE) | | | 375,424,411 | | | | (155,264,927 | ) | | | 36,616,893 | | | | (31,320,028 | ) | | | | |
| | | |
| | | | | | | | | | | | | | | | | | | | | | |
| | | | | | |
| | Net assets: | | | | | | | | | | | | | | | | | | | | |
| | | | | | |
| | Beginning of year | | | 2,109,397,494 | | | | 2,264,662,421 | | | | 442,679,792 | | | | 473,999,820 | | | | | |
| |
| | | |
| | | | | | |
| | End of year | | $ | 2,484,821,905 | | | $ | 2,109,397,494 | | | $ | 479,296,685 | | | $ | 442,679,792 | | | | | |
| | | |
| | |
| 26 | | The accompanying notes are an integral part of these financial statements. |
GOLDMAN SACHS DIVIDEND FOCUS FUNDS
|
Financial Highlights Selected Share Data for a Share Outstanding Throughout Each Year |
| | | | | | | | | | | | | | | | | | | | | | | | | | | |
| | | | | Income Builder Fund |
| | |
| | | | | Class A Shares |
| | |
| | | | | Year Ended October 31, |
| | | | | | |
| | | | | 2024 | | 2023 | | 2022 | | 2021 | | 2020 |
| | | | | | |
| | | Per Share Data | | | | | | | | | | | | | | | | | | | | | | | | | |
| | | | | | |
| | Net asset value, beginning of year | | | $ | 22.04 | | | | $ | 22.54 | | | | $ | 26.97 | | | | $ | 23.40 | | | | $ | 23.67 | |
| | | |
| | | | | | |
| | Net investment income(a) | | | | 1.00 | | | | | 0.97 | | | | | 0.83 | | | | | 0.81 | | | | | 0.73 | |
| | | | | | |
| | Net realized and unrealized gain (loss) | | | | 3.55 | | | | | (0.43 | ) | | | | (3.47 | ) | | | | 3.58 | | | | | (0.21) | |
| | | |
| | | | | | |
| | Total from investment operations | | | | 4.55 | | | | | 0.54 | | | | | (2.64 | ) | | | | 4.39 | | | | | 0.52 | |
| | | |
| | | | | | |
| | Distributions to shareholders from net investment income | | | | (1.03 | ) | | | | (1.04 | ) | | | | (0.86 | ) | | | | (0.82 | ) | | | | (0.76) | |
| | | | | | |
| | Distributions to shareholders from net realized gains | | | | — | | | | | — | | | | | (0.93 | ) | | | | — | | | | | — | |
| | | | | | |
| | Distributions to shareholders from return of capital | | | | — | | | | | — | (b) | | | | — | | | | | — | | | | | (0.03) | |
| | | |
| | | | | | |
| | Total distributions | | | | (1.03 | ) | | | | (1.04 | ) | | | | (1.79 | ) | | | | (0.82 | ) | | | | (0.79) | |
| | | |
| | | | | | |
| | Net asset value, end of year | | | $ | 25.56 | | | | $ | 22.04 | | | | $ | 22.54 | | | | $ | 26.97 | | | | $ | 23.40 | |
| | | |
| | | | | | |
| | Total return(c) | | | | 20.94 | % | | | | 2.30 | % | | | | (10.34 | )% | | | | 18.90 | % | | | | 2.29% | |
| | | |
| | | | | | |
| | Net assets, end of year (in 000s) | | | $ | 671,054 | | | | $ | 541,496 | | | | $ | 524,002 | | | | $ | 505,134 | | | | $ | 328,039 | |
| | | | | | |
| | Ratio of net expenses to average net assets | | | | 0.79 | % | | | | 0.80 | % | | | | 0.79 | % | | | | 0.79 | % | | | | 0.92% | |
| | | | | | |
| | Ratio of total expenses to average net assets | | | | 0.93 | % | | | | 0.93 | % | | | | 0.92 | % | | | | 0.92 | % | | | | 0.98% | |
| | | | | | |
| | Ratio of net investment income to average net assets | | | | 4.07 | % | | | | 4.18 | % | | | | 3.42 | % | | | | 3.07 | % | | | | 3.15% | |
| | | | | | |
| | Portfolio turnover rate(d) | | | | 30 | % | | | | 29 | % | | | | 25 | % | | | | 47 | % | | | | 46% | |
| | | |
| | (a) | Calculated based on the average shares outstanding methodology. |
| | (b) | Amount is less than ($0.005) per share. |
| | (c) | Assumes investment at the NAV at the beginning of the year, reinvestment of all dividends and distributions, a complete redemption of the investment at the NAV at the end of the year and no sales or redemption charges (if any). Total returns would be reduced if a sales or redemption charge was taken into account. Returns do not reflect the impact of taxes to shareholders relating to Fund distributions or the redemption of Fund shares. |
| | (d) | The Fund’s portfolio turnover rate is calculated in accordance with regulatory requirements, without regard to transactions involving short term investments and certain derivatives. If such transactions were included, the Fund’s portfolio turnover rate may be higher. |
| | |
| The accompanying notes are an integral part of these financial statements. | | 27 |
GOLDMAN SACHS DIVIDEND FOCUS FUNDS
|
Financial Highlights (continued) Selected Share Data for a Share Outstanding Throughout Each Year |
| | | | | | | | | | | | | | | | | | | | | | | | | | | |
| | | | | Income Builder Fund |
| | |
| | | | | Class C Shares |
| | |
| | | | | Year Ended October 31, |
| | | | | | |
| | | | | 2024 | | 2023 | | 2022 | | 2021 | | 2020 |
| | | | | | |
| | | Per Share Data | | | | | | | | | | | | | | | | | | | | | | | | | |
| | | | | | |
| | Net asset value, beginning of year | | | $ | 21.58 | | | | $ | 22.09 | | | | $ | 26.47 | | | | $ | 22.98 | | | | $ | 23.26 | |
| | | |
| | | | | | |
| | Net investment income(a) | | | | 0.80 | | | | | 0.78 | | | | | 0.64 | | | | | 0.60 | | | | | 0.55 | |
| | | | | | |
| | Net realized and unrealized gain (loss) | | | | 3.48 | | | | | (0.42 | ) | | | | (3.41 | ) | | | | 3.51 | | | | | (0.21) | |
| | | |
| | | | | | |
| | Total from investment operations | | | | 4.28 | | | | | 0.36 | | | | | (2.77 | ) | | | | 4.11 | | | | | 0.34 | |
| | | |
| | | | | | |
| | Distributions to shareholders from net investment income | | | | (0.85 | ) | | | | (0.87 | ) | | | | (0.68 | ) | | | | (0.62 | ) | | | | (0.60) | |
| | | | | | |
| | Distributions to shareholders from net realized gains | | | | — | | | | | — | | | | | (0.93 | ) | | | | — | | | | | — | |
| | | | | | |
| | Distributions to shareholders from return of capital | | | | — | | | | | — | (b) | | | | — | | | | | — | | | | | (0.02) | |
| | | |
| | | | | | |
| | Total distributions | | | | (0.85 | ) | | | | (0.87 | ) | | | | (1.61 | ) | | | | (0.62 | ) | | | | (0.62) | |
| | | |
| | | | | | |
| | Net asset value, end of year | | | $ | 25.01 | | | | $ | 21.58 | | | | $ | 22.09 | | | | $ | 26.47 | | | | $ | 22.98 | |
| | | |
| | | | | | |
| | Total return(c) | | | | 20.00 | % | | | | 1.52 | % | | | | (10.99 | )% | | | | 18.01 | % | | | | 1.57% | |
| | | |
| | | | | | |
| | Net assets, end of year (in 000s) | | | $ | 162,659 | | | | $ | 182,505 | | | | $ | 243,523 | | | | $ | 368,881 | | | | $ | 380,590 | |
| | | | | | |
| | Ratio of net expenses to average net assets | | | | 1.54 | % | | | | 1.55 | % | | | | 1.54 | % | | | | 1.54 | % | | | | 1.67% | |
| | | | | | |
| | Ratio of total expenses to average net assets | | | | 1.68 | % | | | | 1.68 | % | | | | 1.67 | % | | | | 1.67 | % | | | | 1.73% | |
| | | | | | |
| | Ratio of net investment income to average net assets | | | | 3.34 | % | | | | 3.43 | % | | | | 2.64 | % | | | | 2.32 | % | | | | 2.41% | |
| | | | | | |
| | Portfolio turnover rate(d) | | | | 30 | % | | | | 29 | % | | | | 25 | % | | | | 47 | % | | | | 46% | |
| | | |
| | (a) | Calculated based on the average shares outstanding methodology. |
| | (b) | Amount is less than ($0.005) per share. |
| | (c) | Assumes investment at the NAV at the beginning of the year, reinvestment of all dividends and distributions, a complete redemption of the investment at the NAV at the end of the year and no sales or redemption charges (if any). Total returns would be reduced if a sales or redemption charge was taken into account. Returns do not reflect the impact of taxes to shareholders relating to Fund distributions or the redemption of Fund shares. |
| | (d) | The Fund’s portfolio turnover rate is calculated in accordance with regulatory requirements, without regard to transactions involving short term investments and certain derivatives. If such transactions were included, the Fund’s portfolio turnover rate may be higher. |
| | |
| 28 | | The accompanying notes are an integral part of these financial statements. |
GOLDMAN SACHS DIVIDEND FOCUS FUNDS
|
Financial Highlights (continued) Selected Share Data for a Share Outstanding Throughout Each Year |
| | | | | | | | | | | | | | | | | | | | | | | | | | | |
| | | | | Income Builder Fund |
| | |
| | | | | Institutional Shares |
| | |
| | | | | Year Ended October 31, |
| | | | | | |
| | | | | 2024 | | 2023 | | 2022 | | 2021 | | 2020 |
| | | | | | |
| | | Per Share Data | | | | | | | | | | | | | | | | | | | | | | | | | |
| | | | | | |
| | Net asset value, beginning of year | | | $ | 22.65 | | | | $ | 23.14 | | | | $ | 27.64 | | | | $ | 23.96 | | | | $ | 24.21 | |
| | | |
| | | | | | |
| | Net investment income(a) | | | | 1.12 | | | | | 1.07 | | | | | 0.94 | | | | | 0.91 | | | | | 0.84 | |
| | | | | | |
| | Net realized and unrealized gain (loss) | | | | 3.65 | | | | | (0.44 | ) | | | | (3.57 | ) | | | | 3.67 | | | | | (0.21) | |
| | | |
| | | | | | |
| | Total from investment operations | | | | 4.77 | | | | | 0.63 | | | | | (2.63 | ) | | | | 4.58 | | | | | 0.63 | |
| | | |
| | | | | | |
| | Distributions to shareholders from net investment income | | | | (1.11 | ) | | | | (1.12 | ) | | | | (0.94 | ) | | | | (0.90 | ) | | | | (0.85) | |
| | | | | | |
| | Distributions to shareholders from net realized gains | | | | — | | | | | — | | | | | (0.93 | ) | | | | — | | | | | — | |
| | | | | | |
| | Distributions to shareholders from return of capital | | | | — | | | | | — | (b) | | | | — | | | | | — | | | | | (0.03) | |
| | | |
| | | | | | |
| | Total distributions | | | | (1.11 | ) | | | | (1.12 | ) | | | | (1.87 | ) | | | | (0.90 | ) | | | | (0.88) | |
| | | |
| | | | | | |
| | Net asset value, end of year | | | $ | 26.31 | | | | $ | 22.65 | | | | $ | 23.14 | | | | $ | 27.64 | | | | $ | 23.96 | |
| | | |
| | | | | | |
| | Total return(c) | | | | 21.32 | % | | | | 2.61 | % | | | | (10.02 | )% | | | | 19.29 | % | | | | 2.68% | |
| | | |
| | | | | | |
| | Net assets, end of year (in 000s) | | | $ | 1,098,589 | | | | $ | 921,860 | | | | $ | 993,214 | | | | $ | 1,061,582 | | | | $ | 669,848 | |
| | | | | | |
| | Ratio of net expenses to average net assets | | | | 0.46 | % | | | | 0.47 | % | | | | 0.46 | % | | | | 0.46 | % | | | | 0.56% | |
| | | | | | |
| | Ratio of total expenses to average net assets | | | | 0.60 | % | | | | 0.60 | % | | | | 0.59 | % | | | | 0.59 | % | | | | 0.62% | |
| | | | | | |
| | Ratio of net investment income to average net assets | | | | 4.41 | % | | | | 4.51 | % | | | | 3.75 | % | | | | 3.40 | % | | | | 3.52% | |
| | | | | | |
| | Portfolio turnover rate(d) | | | | 30 | % | | | | 29 | % | | | | 25 | % | | | | 47 | % | | | | 46% | |
| | | |
| | (a) | Calculated based on the average shares outstanding methodology. |
| | (b) | Amount is less than ($0.005) per share. |
| | (c) | Assumes investment at the NAV at the beginning of the year, reinvestment of all dividends and distributions, a complete redemption of the investment at the NAV at the end of the year and no sales or redemption charges (if any). Total returns would be reduced if a sales or redemption charge was taken into account. Returns do not reflect the impact of taxes to shareholders relating to Fund distributions or the redemption of Fund shares. |
| | (d) | The Fund’s portfolio turnover rate is calculated in accordance with regulatory requirements, without regard to transactions involving short term investments and certain derivatives. If such transactions were included, the Fund’s portfolio turnover rate may be higher. |
| | |
| The accompanying notes are an integral part of these financial statements. | | 29 |
GOLDMAN SACHS DIVIDEND FOCUS FUNDS
|
Financial Highlights (continued) Selected Share Data for a Share Outstanding Throughout Each Year |
| | | | | | | | | | | | | | | | | | | | | | | | | | | |
| | | | | Income Builder Fund |
| | |
| | | | | Investor Shares |
| | |
| | | | | Year Ended October 31, |
| | | | | | |
| | | | | 2024 | | 2023 | | 2022 | | 2021 | | 2020 |
| | | | | | |
| | | Per Share Data | | | | | | | | | | | | | | | | | | | | | | | | | |
| | | | | | |
| | Net asset value, beginning of year | | | $ | 22.57 | | | | $ | 23.06 | | | | $ | 27.55 | | | | $ | 23.89 | | | | $ | 24.14 | |
| | | |
| | | | | | |
| | Net investment income(a) | | | | 1.09 | | | | | 1.05 | | | | | 0.91 | | | | | 0.89 | | | | | 0.81 | |
| | | | | | |
| | Net realized and unrealized gain (loss) | | | | 3.64 | | | | | (0.44 | ) | | | | (3.55 | ) | | | | 3.65 | | | | | (0.21) | |
| | | |
| | | | | | |
| | Total from investment operations | | | | 4.73 | | | | | 0.61 | | | | | (2.64 | ) | | | | 4.54 | | | | | 0.60 | |
| | | |
| | | | | | |
| | Distributions to shareholders from net investment income | | | | (1.09 | ) | | | | (1.10 | ) | | | | (0.92 | ) | | | | (0.88 | ) | | | | (0.82) | |
| | | | | | |
| | Distributions to shareholders from net realized gains | | | | — | | | | | — | | | | | (0.93 | ) | | | | — | | | | | — | |
| | | | | | |
| | Distributions to shareholders from return of capital | | | | — | | | | | — | (b) | | | | — | | | | | — | | | | | (0.03) | |
| | | |
| | | | | | |
| | Total distributions | | | | (1.09 | ) | | | | (1.10 | ) | | | | (1.85 | ) | | | | (0.88 | ) | | | | (0.85) | |
| | | |
| | | | | | |
| | Net asset value, end of year | | | $ | 26.21 | | | | $ | 22.57 | | | | $ | 23.06 | | | | $ | 27.55 | | | | $ | 23.89 | |
| | | |
| | | | | | |
| | Total return(c) | | | | 21.27 | % | | | | 2.49 | % | | | | (10.09 | )% | | | | 19.22 | % | | | | 2.53% | |
| | | |
| | | | | | |
| | Net assets, end of year (in 000s) | | | $ | 482,624 | | | | $ | 392,480 | | | | $ | 421,142 | | | | $ | 355,534 | | | | $ | 256,919 | |
| | | | | | |
| | Ratio of net expenses to average net assets | | | | 0.54 | % | | | | 0.55 | % | | | | 0.54 | % | | | | 0.54 | % | | | | 0.67% | |
| | | | | | |
| | Ratio of total expenses to average net assets | | | | 0.68 | % | | | | 0.68 | % | | | | 0.67 | % | | | | 0.67 | % | | | | 0.73% | |
| | | | | | |
| | Ratio of net investment income to average net assets | | | | 4.33 | % | | | | 4.43 | % | | | | 3.68 | % | | | | 3.32 | % | | | | 3.40% | |
| | | | | | |
| | Portfolio turnover rate(d) | | | | 30 | % | | | | 29 | % | | | | 25 | % | | | | 47 | % | | | | 46% | |
| | | |
| | (a) | Calculated based on the average shares outstanding methodology. |
| | (b) | Amount is less than ($0.005) per share. |
| | (c) | Assumes investment at the NAV at the beginning of the year, reinvestment of all dividends and distributions, a complete redemption of the investment at the NAV at the end of the year and no sales or redemption charges (if any). Total returns would be reduced if a sales or redemption charge was taken into account. Returns do not reflect the impact of taxes to shareholders relating to Fund distributions or the redemption of Fund shares. |
| | (d) | The Fund’s portfolio turnover rate is calculated in accordance with regulatory requirements, without regard to transactions involving short term investments and certain derivatives. If such transactions were included, the Fund’s portfolio turnover rate may be higher. |
| | |
| 30 | | The accompanying notes are an integral part of these financial statements. |
GOLDMAN SACHS DIVIDEND FOCUS FUNDS
|
Financial Highlights (continued) Selected Share Data for a Share Outstanding Throughout Each Year |
| | | | | | | | | | | | | | | | | | | | | | | | | | | |
| | | | | Income Builder Fund |
| | |
| | | | | Class R6 Shares |
| | |
| | | | | Year Ended October 31, |
| | | | | | |
| | | | | 2024 | | 2023 | | 2022 | | 2021 | | 2020 |
| | | | | | |
| | Per Share Data | | | | | | | | | | | | | | | | | | | | | | | | | |
| | | | | | |
| | Net asset value, beginning of year | | | $ | 22.65 | | | | $ | 23.13 | | | | $ | 27.64 | | | | $ | 23.95 | | | | $ | 24.21 | |
| | | |
| | | | | | |
| | Net investment income(a) | | | | 1.12 | | | | | 1.07 | | | | | 0.94 | | | | | 0.92 | | | | | 0.83 | |
| | | | | | |
| | Net realized and unrealized gain (loss) | | | | 3.64 | | | | | (0.43 | ) | | | | (3.58 | ) | | | | 3.67 | | | | | (0.21) | |
| | | |
| | | | | | |
| | Total from investment operations | | | | 4.76 | | | | | 0.64 | | | | | (2.64 | ) | | | | 4.59 | | | | | 0.62 | |
| | | |
| | | | | | |
| | Distributions to shareholders from net investment income | | | | (1.11 | ) | | | | (1.12 | ) | | | | (0.94 | ) | | | | (0.90 | ) | | | | (0.85) | |
| | | | | | |
| | Distributions to shareholders from net realized gains | | | | — | | | | | — | | | | | (0.93 | ) | | | | — | | | | | — | |
| | | | | | |
| | Distributions to shareholders from return of capital | | | | — | | | | | — | (b) | | | | — | | | | | — | | | | | (0.03) | |
| | | |
| | | | | | |
| | Total distributions | | | | (1.11 | ) | | | | (1.12 | ) | | | | (1.87 | ) | | | | (0.90 | ) | | | | (0.88) | |
| | | |
| | | | | | |
| | Net asset value, end of year | | | $ | 26.30 | | | | $ | 22.65 | | | | $ | 23.13 | | | | $ | 27.64 | | | | $ | 23.95 | |
| | | |
| | | | | | |
| | Total return(c) | | | | 21.34 | % | | | | 2.62 | % | | | | (10.05 | )% | | | | 19.35 | % | | | | 2.70% | |
| | | |
| | | | | | |
| | Net assets, end of year (in 000s) | | | $ | 43,102 | | | | $ | 40,051 | | | | $ | 39,187 | | | | $ | 25,215 | | | | $ | 65,293 | |
| | | | | | |
| | Ratio of net expenses to average net assets | | | | 0.45 | % | | | | 0.46 | % | | | | 0.45 | % | | | | 0.46 | % | | | | 0.54% | |
| | | | | | |
| | Ratio of total expenses to average net assets | | | | 0.59 | % | | | | 0.59 | % | | | | 0.58 | % | | | | 0.58 | % | | | | 0.61% | |
| | | | | | |
| | Ratio of net investment income to average net assets | | | | 4.42 | % | | | | 4.52 | % | | | | 3.76 | % | | | | 3.44 | % | | | | 3.51% | |
| | | | | | |
| | Portfolio turnover rate(d) | | | | 30 | % | | | | 29 | % | | | | 25 | % | | | | 47 | % | | | | 46% | |
| | | |
| | (a) | Calculated based on the average shares outstanding methodology. |
| | (b) | Amount is less than ($0.005) per share. |
| | (c) | Assumes investment at the NAV at the beginning of the year, reinvestment of all dividends and distributions, a complete redemption of the investment at the NAV at the end of the year and no sales or redemption charges (if any). Total returns would be reduced if a sales or redemption charge was taken into account. Returns do not reflect the impact of taxes to shareholders relating to Fund distributions or the redemption of Fund shares. |
| | (d) | The Fund’s portfolio turnover rate is calculated in accordance with regulatory requirements, without regard to transactions involving short term investments and certain derivatives. If such transactions were included, the Fund’s portfolio turnover rate may be higher. |
| | |
| The accompanying notes are an integral part of these financial statements. | | 31 |
GOLDMAN SACHS DIVIDEND FOCUS FUNDS
|
Financial Highlights (continued) Selected Share Data for a Share Outstanding Throughout Each Year |
| | | | | | | | | | | | | | | | | | | | | | | | | | | |
| | | | | Income Builder Fund |
| | |
| | | | | Class P Shares |
| | |
| | | | | Year Ended October 31, |
| | | | | | |
| | | | | 2024 | | 2023 | | 2022 | | 2021 | | 2020 |
| | | | | | |
| | | Per Share Data | | | | | | | | | | | | | | | | | | | | | | | | | |
| | | | | | |
| | Net asset value, beginning of year | | | $ | 22.65 | | | | $ | 23.14 | | | | $ | 27.64 | | | | $ | 23.96 | | | | $ | 24.21 | |
| | | |
| | | | | | |
| | Net investment income(a) | | | | 1.12 | | | | | 1.08 | | | | | 0.94 | | | | | 0.91 | | | | | 0.84 | |
| | | | | | |
| | Net realized and unrealized gain (loss) | | | | 3.65 | | | | | (0.45 | ) | | | | (3.57 | ) | | | | 3.68 | | | | | (0.21) | |
| | | |
| | | | | | |
| | Total from investment operations | | | | 4.77 | | | | | 0.63 | | | | | (2.63 | ) | | | | 4.59 | | | | | 0.63 | |
| | | |
| | | | | | |
| | Distributions to shareholders from net investment income | | | | (1.11 | ) | | | | (1.12 | ) | | | | (0.94 | ) | | | | (0.91 | ) | | | | (0.85) | |
| | | | | | |
| | Distributions to shareholders from net realized gains | | | | — | | | | | — | | | | | (0.93 | ) | | | | — | | | | | — | |
| | | | | | |
| | Distributions to shareholders from return of capital | | | | — | | | | | — | (b) | | | | — | | | | | — | | | | | (0.03) | |
| | | |
| | | | | | |
| | Total distributions | | | | (1.11 | ) | | | | (1.12 | ) | | | | (1.87 | ) | | | | (0.91 | ) | | | | (0.88) | |
| | | |
| | | | | | |
| | Net asset value, end of year | | | $ | 26.31 | | | | $ | 22.65 | | | | $ | 23.14 | | | | $ | 27.64 | | | | $ | 23.96 | |
| | | |
| | | | | | |
| | Total return(c) | | | | 21.39 | % | | | | 2.62 | % | | | | (10.05 | )% | | | | 19.31 | % | | | | 2.70% | |
| | | |
| | | | | | |
| | Net assets, end of year (in 000s) | | | $ | 26,795 | | | | $ | 31,006 | | | | $ | 43,595 | | | | $ | 52,764 | | | | $ | 16,404 | |
| | | | | | |
| | Ratio of net expenses to average net assets | | | | 0.45 | % | | | | 0.46 | % | | | | 0.45 | % | | | | 0.45 | % | | | | 0.55% | |
| | | | | | |
| | Ratio of total expenses to average net assets | | | | 0.59 | % | | | | 0.59 | % | | | | 0.58 | % | | | | 0.58 | % | | | | 0.61% | |
| | | | | | |
| | Ratio of net investment income to average net assets | | | | 4.42 | % | | | | 4.52 | % | | | | 3.75 | % | | | | 3.38 | % | | | | 3.51% | |
| | | | | | |
| | Portfolio turnover rate(d) | | | | 30 | % | | | | 29 | % | | | | 25 | % | | | | 47 | % | | | | 46% | |
| | | |
| | (a) | Calculated based on the average shares outstanding methodology. |
| | (b) | Amount is less than ($0.005) per share. |
| | (c) | Assumes investment at the NAV at the beginning of the year, reinvestment of all dividends and distributions, a complete redemption of the investment at the NAV at the end of the year and no sales or redemption charges (if any). Total returns would be reduced if a sales or redemption charge was taken into account. Returns do not reflect the impact of taxes to shareholders relating to Fund distributions or the redemption of Fund shares. |
| | (d) | The Fund’s portfolio turnover rate is calculated in accordance with regulatory requirements, without regard to transactions involving short term investments and certain derivatives. If such transactions were included, the Fund’s portfolio turnover rate may be higher. |
| | |
| 32 | | The accompanying notes are an integral part of these financial statements. |
GOLDMAN SACHS DIVIDEND FOCUS FUNDS
|
Financial Highlights (continued) Selected Share Data for a Share Outstanding Throughout Each Year |
| | | | | | | | | | | | | | | | | | | | | | | | | | | |
| | | | | Rising Dividend Growth Fund |
| | |
| | | | | Class A Shares |
| | |
| | | | | Year Ended October 31, |
| | | | | | |
| | | | | 2024 | | 2023 | | 2022 | | 2021 | | 2020 |
| | | | | | |
| | | Per Share Data | | | | | | | | | | | | | | | | | | | | | | | | | |
| | | | | | |
| | Net asset value, beginning of year | | | $ | 10.52 | | | | $ | 11.87 | | | | $ | 13.87 | | | | $ | 9.81 | | | | $ | 11.18 | |
| | | |
| | | | | | |
| | Net investment income(a) | | | | 0.09 | | | | | 0.10 | | | | | 0.07 | | | | | 0.05 | | | | | 0.08 | |
| | | | | | |
| | Net realized and unrealized gain (loss) | | | | 2.78 | | | | | 0.37 | | | | | (0.71 | ) | | | | 4.44 | | | | | (0.23) | |
| | | |
| | | | | | |
| | Total from investment operations | | | | 2.87 | | | | | 0.47 | | | | | (0.64 | ) | | | | 4.49 | | | | | (0.15) | |
| | | |
| | | | | | |
| | Distributions to shareholders from net investment income | | | | (0.18 | ) | | | | (0.48 | ) | | | | (0.19 | ) | | | | (0.39 | ) | | | | (0.24) | |
| | | | | | |
| | Distributions to shareholders from net realized gains | | | | (0.68 | ) | | | | (1.34 | ) | | | | (1.17 | ) | | | | (0.04 | ) | | | | (0.98) | |
| | | |
| | | | | | |
| | Total distributions | | | | (0.86 | ) | | | | (1.82 | ) | | | | (1.36 | ) | | | | (0.43 | ) | | | | (1.22) | |
| | | |
| | | | | | |
| | Net asset value, end of year | | | $ | 12.53 | | | | $ | 10.52 | | | | $ | 11.87 | | | | $ | 13.87 | | | | $ | 9.81 | |
| | | |
| | | | | | |
| | Total return(b) | | | | 28.26 | % | | | | 3.71 | % | | | | (4.99 | )% | | | | 46.88 | % | | | | (1.80)% | |
| | | |
| | | | | | |
| | Net assets, end of year (in 000s) | | | $ | 257,941 | | | | $ | 228,422 | | | | $ | 240,085 | | | | $ | 255,730 | | | | $ | 167,765 | |
| | | | | | |
| | Ratio of net expenses to average net assets | | | | 1.01 | % | | | | 1.02 | % | | | | 1.03 | % | | | | 1.03 | % | | | | 1.09% | |
| | | | | | |
| | Ratio of total expenses to average net assets | | | | 1.27 | % | | | | 1.28 | % | | | | 1.28 | % | | | | 1.27 | % | | | | 1.29% | |
| | | | | | |
| | Ratio of net investment income to average net assets | | | | 0.77 | % | | | | 0.89 | % | | | | 0.55 | % | | | | 0.42 | % | | | | 0.81% | |
| | | | | | |
| | Portfolio turnover rate(c) | | | | 42 | % | | | | 45 | % | | | | 50 | % | | | | 38 | % | | | | 43% | |
| | | |
| | (a) | Calculated based on the average shares outstanding methodology. |
| | (b) | Assumes investment at the NAV at the beginning of the year, reinvestment of all dividends and distributions, a complete redemption of the investment at the NAV at the end of the year and no sales or redemption charges (if any). Total returns would be reduced if a sales or redemption charge was taken into account. Returns do not reflect the impact of taxes to shareholders relating to Fund distributions or the redemption of Fund shares. |
| | (c) | The Fund’s portfolio turnover rate is calculated in accordance with regulatory requirements, without regard to transactions involving short term investments and certain derivatives. If such transactions were included, the Fund’s portfolio turnover rate may be higher. |
| | |
| The accompanying notes are an integral part of these financial statements. | | 33 |
GOLDMAN SACHS DIVIDEND FOCUS FUNDS
|
Financial Highlights (continued) Selected Share Data for a Share Outstanding Throughout Each Year |
| | | | | | | | | | | | | | | | | | | | | | | | | | | |
| | | | | Rising Dividend Growth Fund |
| | |
| | | | | Class C Shares |
| | |
| | | | | Year Ended October 31, |
| | | | | | |
| | | | | 2024 | | 2023 | | 2022 | | 2021 | | 2020 |
| | | | | | |
| | | Per Share Data | | | | | | | | | | | | | | | | | | | | | | | | | |
| | | | | | |
| | Net asset value, beginning of year | | | $ | 10.81 | | | | $ | 12.14 | | | | $ | 14.13 | | | | $ | 9.99 | | | | $ | 11.36 | |
| | | |
| | | | | | |
| | Net investment income (loss)(a) | | | | 0.01 | | | | | 0.02 | | | | | (0.02 | ) | | | | (0.03 | ) | | | | —(b) | |
| | | | | | |
| | Net realized and unrealized gain (loss) | | | | 2.85 | | | | | 0.37 | | | | | (0.72 | ) | | | | 4.52 | | | | | (0.23) | |
| | | |
| | | | | | |
| | Total from investment operations | | | | 2.86 | | | | | 0.39 | | | | | (0.74 | ) | | | | 4.49 | | | | | (0.23) | |
| | | |
| | | | | | |
| | Distributions to shareholders from net investment income | | | | (0.08 | ) | | | | (0.38 | ) | | | | (0.08 | ) | | | | (0.31 | ) | | | | (0.16) | |
| | | | | | |
| | Distributions to shareholders from net realized gains | | | | (0.68 | ) | | | | (1.34 | ) | | | | (1.17 | ) | | | | (0.04 | ) | | | | (0.98) | |
| | | |
| | | | | | |
| | Total distributions | | | | (0.76 | ) | | | | (1.72 | ) | | | | (1.25 | ) | | | | (0.35 | ) | | | | (1.14) | |
| | | |
| | | | | | |
| | Net asset value, end of year | | | $ | 12.91 | | | | $ | 10.81 | | | | $ | 12.14 | | | | $ | 14.13 | | | | $ | 9.99 | |
| | | |
| | | | | | |
| | Total return(c) | | | | 27.31 | % | | | | 2.90 | % | | | | (5.65 | )% | | | | 45.74 | % | | | | (2.50)% | |
| | | |
| | | | | | |
| | Net assets, end of year (in 000s) | | | $ | 19,891 | | | | $ | 23,425 | | | | $ | 41,110 | | | | $ | 75,965 | | | | $ | 108,840 | |
| | | | | | |
| | Ratio of net expenses to average net assets | | | | 1.76 | % | | | | 1.77 | % | | | | 1.78 | % | | | | 1.78 | % | | | | 1.84% | |
| | | | | | |
| | Ratio of total expenses to average net assets | | | | 2.02 | % | | | | 2.03 | % | | | | 2.02 | % | | | | 2.03 | % | | | | 2.03% | |
| | | | | | |
| | Ratio of net investment income (loss) to average net assets | | | | 0.05 | % | | | | 0.16 | % | | | | (0.15 | )% | | | | (0.23 | )% | | | | 0.03% | |
| | | | | | |
| | Portfolio turnover rate(d) | | | | 42 | % | | | | 45 | % | | | | 50 | % | | | | 38 | % | | | | 43% | |
| | | |
| | (a) | Calculated based on the average shares outstanding methodology. |
| | (b) | Amount is less than $0.005 per share. |
| | (c) | Assumes investment at the NAV at the beginning of the year, reinvestment of all dividends and distributions, a complete redemption of the investment at the NAV at the end of the year and no sales or redemption charges (if any). Total returns would be reduced if a sales or redemption charge was taken into account. Returns do not reflect the impact of taxes to shareholders relating to Fund distributions or the redemption of Fund shares. |
| | (d) | The Fund’s portfolio turnover rate is calculated in accordance with regulatory requirements, without regard to transactions involving short term investments and certain derivatives. If such transactions were included, the Fund’s portfolio turnover rate may be higher. |
| | |
| 34 | | The accompanying notes are an integral part of these financial statements. |
GOLDMAN SACHS DIVIDEND FOCUS FUNDS
|
Financial Highlights (continued) Selected Share Data for a Share Outstanding Throughout Each Year |
| | | | | | | | | | | | | | | | | | | | | | | | | | | |
| | | | | Rising Dividend Growth Fund |
| | |
| | | | | Institutional Shares |
| | |
| | | | | Year Ended October 31, |
| | | | | | |
| | | | | 2024 | | 2023 | | 2022 | | 2021 | | 2020 |
| | | | | | |
| | | Per Share Data | | | | | | | | | | | | | | | | | | | | | | | | | |
| | | | | | |
| | Net asset value, beginning of year | | | $ | 11.37 | | | | $ | 12.69 | | | | $ | 14.72 | | | | $ | 10.38 | | | | $ | 11.76 | |
| | | |
| | | | | | |
| | Net investment income(a) | | | | 0.14 | | | | | 0.15 | | | | | 0.11 | | | | | 0.10 | | | | | 0.12 | |
| | | | | | |
| | Net realized and unrealized gain (loss) | | | | 3.02 | | | | | 0.38 | | | | | (0.74 | ) | | | | 4.70 | | | | | (0.24) | |
| | | |
| | | | | | |
| | Total from investment operations | | | | 3.16 | | | | | 0.53 | | | | | (0.63 | ) | | | | 4.80 | | | | | (0.12) | |
| | | |
| | | | | | |
| | Distributions to shareholders from net investment income | | | | (0.22 | ) | | | | (0.51 | ) | | | | (0.23 | ) | | | | (0.42 | ) | | | | (0.28) | |
| | | | | | |
| | Distributions to shareholders from net realized gains | | | | (0.68 | ) | | | | (1.34 | ) | | | | (1.17 | ) | | | | (0.04 | ) | | | | (0.98) | |
| | | |
| | | | | | |
| | Total distributions | | | | (0.90 | ) | | | | (1.85 | ) | | | | (1.40 | ) | | | | (0.46 | ) | | | | (1.26) | |
| | | |
| | | | | | |
| | Net asset value, end of year | | | $ | 13.63 | | | | $ | 11.37 | | | | $ | 12.69 | | | | $ | 14.72 | | | | $ | 10.38 | |
| | | |
| | | | | | |
| | Total return(b) | | | | 28.71 | % | | | | 4.02 | % | | | | (4.62 | )% | | | | 47.16 | % | | | | (1.47)% | |
| | | |
| | | | | | |
| | Net assets, end of year (in 000s) | | | $ | 118,921 | | | | $ | 105,744 | | | | $ | 108,367 | | | | $ | 130,706 | | | | $ | 97,358 | |
| | | | | | |
| | Ratio of net expenses to average net assets | | | | 0.69 | % | | | | 0.70 | % | | | | 0.72 | % | | | | 0.72 | % | | | | 0.78% | |
| | | | | | |
| | Ratio of total expenses to average net assets | | | | 0.91 | % | | | | 0.92 | % | | | | 0.90 | % | | | | 0.90 | % | | | | 0.90% | |
| | | | | | |
| | Ratio of net investment income to average net assets | | | | 1.09 | % | | | | 1.21 | % | | | | 0.87 | % | | | | 0.75 | % | | | | 1.10% | |
| | | | | | |
| | Portfolio turnover rate(c) | | | | 42 | % | | | | 45 | % | | | | 50 | % | | | | 38 | % | | | | 43% | |
| | | |
| | (a) | Calculated based on the average shares outstanding methodology. |
| | (b) | Assumes investment at the NAV at the beginning of the year, reinvestment of all dividends and distributions, a complete redemption of the investment at the NAV at the end of the year and no sales or redemption charges (if any). Total returns would be reduced if a sales or redemption charge was taken into account. Returns do not reflect the impact of taxes to shareholders relating to Fund distributions or the redemption of Fund shares. |
| | (c) | The Fund’s portfolio turnover rate is calculated in accordance with regulatory requirements, without regard to transactions involving short term investments and certain derivatives. If such transactions were included, the Fund’s portfolio turnover rate may be higher. |
| | |
| The accompanying notes are an integral part of these financial statements. | | 35 |
GOLDMAN SACHS DIVIDEND FOCUS FUNDS
|
Financial Highlights (continued) Selected Share Data for a Share Outstanding Throughout Each Year |
| | | | | | | | | | | | | | | | | | | | | | | | | | | |
| | | | | Rising Dividend Growth Fund |
| | |
| | | | | Investor Shares |
| | |
| | | | | Year Ended October 31, |
| | | | | | |
| | | | | 2024 | | 2023 | | 2022 | | 2021 | | 2020 |
| | | | | | |
| | | Per Share Data | | | | | | | | | | | | | | | | | | | | | | | | | |
| | | | | | |
| | Net asset value, beginning of year | | | $ | 11.34 | | | | $ | 12.66 | | | | $ | 14.69 | | | | $ | 10.36 | | | | $ | 11.75 | |
| | | |
| | | | | | |
| | Net investment income(a) | | | | 0.13 | | | | | 0.14 | | | | | 0.11 | | | | | 0.09 | | | | | 0.11 | |
| | | | | | |
| | Net realized and unrealized gain (loss) | | | | 3.01 | | | | | 0.38 | | | | | (0.75 | ) | | | | 4.69 | | | | | (0.25) | |
| | | |
| | | | | | |
| | Total from investment operations | | | | 3.14 | | | | | 0.52 | | | | | (0.64 | ) | | | | 4.78 | | | | | (0.14) | |
| | | |
| | | | | | |
| | Distributions to shareholders from net investment income | | | | (0.21 | ) | | | | (0.50 | ) | | | | (0.22 | ) | | | | (0.41 | ) | | | | (0.27) | |
| | | | | | |
| | Distributions to shareholders from net realized gains | | | | (0.68 | ) | | | | (1.34 | ) | | | | (1.17 | ) | | | | (0.04 | ) | | | | (0.98) | |
| | | |
| | | | | | |
| | Total distributions | | | | (0.89 | ) | | | | (1.84 | ) | | | | (1.39 | ) | | | | (0.45 | ) | | | | (1.25) | |
| | | |
| | | | | | |
| | Net asset value, end of year | | | $ | 13.59 | | | | $ | 11.34 | | | | $ | 12.66 | | | | $ | 14.69 | | | | $ | 10.36 | |
| | | |
| | | | | | |
| | Total return(b) | | | | 28.61 | % | | | | 3.95 | % | | | | (4.70 | )% | | | | 47.09 | % | | | | (1.55)% | |
| | | |
| | | | | | |
| | Net assets, end of year (in 000s) | | | $ | 62,963 | | | | $ | 65,745 | | | | $ | 64,950 | | | | $ | 71,231 | | | | $ | 64,328 | |
| | | | | | |
| | Ratio of net expenses to average net assets | | | | 0.76 | % | | | | 0.77 | % | | | | 0.78 | % | | | | 0.78 | % | | | | 0.84% | |
| | | | | | |
| | Ratio of total expenses to average net assets | | | | 1.02 | % | | | | 1.03 | % | | | | 1.02 | % | | | | 1.02 | % | | | | 1.03% | |
| | | | | | |
| | Ratio of net investment income to average net assets | | | | 1.03 | % | | | | 1.15 | % | | | | 0.81 | % | | | | 0.71 | % | | | | 1.04% | |
| | | | | | |
| | Portfolio turnover rate(c) | | | | 42 | % | | | | 45 | % | | | | 50 | % | | | | 38 | % | | | | 43% | |
| | | |
| | (a) | Calculated based on the average shares outstanding methodology. |
| | (b) | Assumes investment at the NAV at the beginning of the year, reinvestment of all dividends and distributions, a complete redemption of the investment at the NAV at the end of the year and no sales or redemption charges (if any). Total returns would be reduced if a sales or redemption charge was taken into account. Returns do not reflect the impact of taxes to shareholders relating to Fund distributions or the redemption of Fund shares. |
| | (c) | The Fund’s portfolio turnover rate is calculated in accordance with regulatory requirements, without regard to transactions involving short term investments and certain derivatives. If such transactions were included, the Fund’s portfolio turnover rate may be higher. |
| | |
| 36 | | The accompanying notes are an integral part of these financial statements. |
GOLDMAN SACHS DIVIDEND FOCUS FUNDS
|
Financial Highlights (continued) Selected Share Data for a Share Outstanding Throughout Each Year |
| | | | | | | | | | | | | | | | | | | | | | | | | | | |
| | | | | Rising Dividend Growth Fund |
| | |
| | | | | Class R6 Shares |
| | |
| | | | | Year Ended October 31, |
| | | | | | |
| | | | | 2024 | | 2023 | | 2022 | | 2021 | | 2020 |
| | | | | | |
| | | Per Share Data | | | | | | | | | | | | | | | | | | | | | | | | | |
| | | | | | |
| | Net asset value, beginning of year | | | $ | 11.36 | | | | $ | 12.68 | | | | $ | 14.71 | | | | $ | 10.37 | | | | $ | 11.76 | |
| | | |
| | | | | | |
| | Net investment income(a) | | | | 0.14 | | | | | 0.14 | | | | | 0.11 | | | | | 0.10 | | | | | 0.12 | |
| | | | | | |
| | Net realized and unrealized gain (loss) | | | | 3.02 | | | | | 0.39 | | | | | (0.74 | ) | | | | 4.70 | | | | | (0.25) | |
| | | |
| | | | | | |
| | Total from investment operations | | | | 3.16 | | | | | 0.53 | | | | | (0.63 | ) | | | | 4.80 | | | | | (0.13) | |
| | | |
| | | | | | |
| | Distributions to shareholders from net investment income | | | | (0.22 | ) | | | | (0.51 | ) | | | | (0.23 | ) | | | | (0.42 | ) | | | | (0.28) | |
| | | | | | |
| | Distributions to shareholders from net realized gains | | | | (0.68 | ) | | | | (1.34 | ) | | | | (1.17 | ) | | | | (0.04 | ) | | | | (0.98) | |
| | | |
| | | | | | |
| | Total distributions | | | | (0.90 | ) | | | | (1.85 | ) | | | | (1.40 | ) | | | | (0.46 | ) | | | | (1.26) | |
| | | |
| | | | | | |
| | Net asset value, end of year | | | $ | 13.62 | | | | $ | 11.36 | | | | $ | 12.68 | | | | $ | 14.71 | | | | $ | 10.37 | |
| | | |
| | | | | | |
| | Total return(b) | | | | 28.75 | % | | | | 4.03 | % | | | | (4.62 | )% | | | | 47.22 | % | | | | (1.47)% | |
| | | |
| | | | | | |
| | Net assets, end of year (in 000s) | | | $ | 6,347 | | | | $ | 5,831 | | | | $ | 2,738 | | | | $ | 3,063 | | | | $ | 1,868 | |
| | | | | | |
| | Ratio of net expenses to average net assets | | | | 0.68 | % | | | | 0.69 | % | | | | 0.71 | % | | | | 0.71 | % | | | | 0.76% | |
| | | | | | |
| | Ratio of total expenses to average net assets | | | | 0.90 | % | | | | 0.91 | % | | | | 0.89 | % | | | | 0.89 | % | | | | 0.90% | |
| | | | | | |
| | Ratio of net investment income to average net assets | | | | 1.10 | % | | | | 1.19 | % | | | | 0.87 | % | | | | 0.75 | % | | | | 1.11% | |
| | | | | | |
| | Portfolio turnover rate(c) | | | | 42 | % | | | | 45 | % | | | | 50 | % | | | | 38 | % | | | | 43% | |
| | | |
| | (a) | Calculated based on the average shares outstanding methodology. |
| | (b) | Assumes investment at the NAV at the beginning of the year, reinvestment of all dividends and distributions, a complete redemption of the investment at the NAV at the end of the year and no sales or redemption charges (if any). Total returns would be reduced if a sales or redemption charge was taken into account. Returns do not reflect the impact of taxes to shareholders relating to Fund distributions or the redemption of Fund shares. |
| | (c) | The Fund’s portfolio turnover rate is calculated in accordance with regulatory requirements, without regard to transactions involving short term investments and certain derivatives. If such transactions were included, the Fund’s portfolio turnover rate may be higher. |
| | |
| The accompanying notes are an integral part of these financial statements. | | 37 |
GOLDMAN SACHS DIVIDEND FOCUS FUNDS
|
Financial Highlights (continued) Selected Share Data for a Share Outstanding Throughout Each Year |
| | | | | | | | | | | | | | | | | | | | | | | | | | | |
| | | | | Rising Dividend Growth Fund |
| | |
| | | | | Class R Shares |
| | |
| | | | | Year Ended October 31, |
| | | | | | |
| | | | | 2024 | | 2023 | | 2022 | | 2021 | | 2020 |
| | | | | | |
| | | Per Share Data | | | | | | | | | | | | | | | | | | | | | | | | | |
| | | | | | |
| | Net asset value, beginning of year | | | $ | 10.45 | | | | $ | 11.81 | | | | $ | 13.79 | | | | $ | 9.76 | | | | $ | 11.13 | |
| | | |
| | | | | | |
| | Net investment income(a) | | | | 0.06 | | | | | 0.07 | | | | | 0.04 | | | | | 0.02 | | | | | 0.06 | |
| | | | | | |
| | Net realized and unrealized gain (loss) | | | | 2.76 | | | | | 0.36 | | | | | (0.69 | ) | | | | 4.42 | | | | | (0.24) | |
| | | |
| | | | | | |
| | Total from investment operations | | | | 2.82 | | | | | 0.43 | | | | | (0.65 | ) | | | | 4.44 | | | | | (0.18) | |
| | | |
| | | | | | |
| | Distributions to shareholders from net investment income | | | | (0.15 | ) | | | | (0.45 | ) | | | | (0.16 | ) | | | | (0.37 | ) | | | | (0.21) | |
| | | | | | |
| | Distributions to shareholders from net realized gains | | | | (0.68 | ) | | | | (1.34 | ) | | | | (1.17 | ) | | | | (0.04 | ) | | | | (0.98) | |
| | | |
| | | | | | |
| | Total distributions | | | | (0.83 | ) | | | | (1.79 | ) | | | | (1.33 | ) | | | | (0.41 | ) | | | | (1.19) | |
| | | |
| | | | | | |
| | Net asset value, end of year | | | $ | 12.44 | | | | $ | 10.45 | | | | $ | 11.81 | | | | $ | 13.79 | | | | $ | 9.76 | |
| | | |
| | | | | | |
| | Total return(b) | | | | 27.94 | % | | | | 3.41 | % | | | | (5.10 | )% | | | | 46.38 | % | | | | (2.01)% | |
| | | |
| | | | | | |
| | Net assets, end of year (in 000s) | | | $ | 1,185 | | | | $ | 1,198 | | | | $ | 1,346 | | | | $ | 1,357 | | | | $ | 1,131 | |
| | | | | | |
| | Ratio of net expenses to average net assets | | | | 1.26 | % | | | | 1.27 | % | | | | 1.28 | % | | | | 1.28 | % | | | | 1.35% | |
| | | | | | |
| | Ratio of total expenses to average net assets | | | | 1.52 | % | | | | 1.53 | % | | | | 1.52 | % | | | | 1.52 | % | | | | 1.53% | |
| | | | | | |
| | Ratio of net investment income to average net assets | | | | 0.54 | % | | | | 0.63 | % | | | | 0.31 | % | | | | 0.19 | % | | | | 0.57% | |
| | | | | | |
| | Portfolio turnover rate(c) | | | | 42 | % | | | | 45 | % | | | | 50 | % | | | | 38 | % | | | | 43% | |
| | | |
| | (a) | Calculated based on the average shares outstanding methodology. |
| | (b) | Assumes investment at the NAV at the beginning of the year, reinvestment of all dividends and distributions, a complete redemption of the investment at the NAV at the end of the year and no sales or redemption charges (if any). Total returns would be reduced if a sales or redemption charge was taken into account. Returns do not reflect the impact of taxes to shareholders relating to Fund distributions or the redemption of Fund shares. |
| | (c) | The Fund’s portfolio turnover rate is calculated in accordance with regulatory requirements, without regard to transactions involving short term investments and certain derivatives. If such transactions were included, the Fund’s portfolio turnover rate may be higher. |
| | |
| 38 | | The accompanying notes are an integral part of these financial statements. |
GOLDMAN SACHS DIVIDEND FOCUS FUNDS
|
Financial Highlights (continued) Selected Share Data for a Share Outstanding Throughout Each Year |
| | | | | | | | | | | | | | | | | | | | | | | | | | | |
| | | | | Rising Dividend Growth Fund |
| | |
| | | | | Class P Shares |
| | |
| | | | | Year Ended October 31, |
| | | | | | |
| | | | | 2024 | | 2023 | | 2022 | | 2021 | | 2020 |
| | | | | | |
| | | Per Share Data | | | | | | | | | | | | | | | | | | | | | | | | | |
| | | | | | |
| | Net asset value, beginning of year | | | $ | 11.37 | | | | $ | 12.69 | | | | $ | 14.72 | | | | $ | 10.38 | | | | $ | 11.76 | |
| | | |
| | | | | | |
| | Net investment income(a) | | | | 0.14 | | | | | 0.15 | | | | | 0.11 | | | | | 0.09 | | | | | 0.12 | |
| | | | | | |
| | Net realized and unrealized gain (loss) | | | | 3.02 | | | | | 0.38 | | | | | (0.74 | ) | | | | 4.71 | | | | | (0.24) | |
| | | |
| | | | | | |
| | Total from investment operations | | | | 3.16 | | | | | 0.53 | | | | | (0.63 | ) | | | | 4.80 | | | | | (0.12) | |
| | | |
| | | | | | |
| | Distributions to shareholders from net investment income | | | | (0.22 | ) | | | | (0.51 | ) | | | | (0.23 | ) | | | | (0.42 | ) | | | | (0.28) | |
| | | | | | |
| | Distributions to shareholders from net realized gains | | | | (0.68 | ) | | | | (1.34 | ) | | | | (1.17 | ) | | | | (0.04 | ) | | | | (0.98) | |
| | | |
| | | | | | |
| | Total distributions | | | | (0.90 | ) | | | | (1.85 | ) | | | | (1.40 | ) | | | | (0.46 | ) | | | | (1.26) | |
| | | |
| | | | | | |
| | Net asset value, end of year | | | $ | 13.63 | | | | $ | 11.37 | | | | $ | 12.69 | | | | $ | 14.72 | | | | $ | 10.38 | |
| | | |
| | | | | | |
| | Total return(b) | | | | 28.72 | % | | | | 4.02 | % | | | | (4.62 | )% | | | | 47.17 | % | | | | (1.46)% | |
| | | |
| | | | | | |
| | Net assets, end of year (in 000s) | | | $ | 12,049 | | | | $ | 12,316 | | | | $ | 15,404 | | | | $ | 14,747 | | | | $ | 7,791 | |
| | | | | | |
| | Ratio of net expenses to average net assets | | | | 0.68 | % | | | | 0.69 | % | | | | 0.71 | % | | | | 0.71 | % | | | | 0.77% | |
| | | | | | |
| | Ratio of total expenses to average net assets | | | | 0.90 | % | | | | 0.91 | % | | | | 0.90 | % | | | | 0.89 | % | | | | 0.89% | |
| | | | | | |
| | Ratio of net investment income to average net assets | | | | 1.12 | % | | | | 1.22 | % | | | | 0.87 | % | | | | 0.70 | % | | | | 1.10% | |
| | | | | | |
| | Portfolio turnover rate(c) | | | | 42 | % | | | | 45 | % | | | | 50 | % | | | | 38 | % | | | | 43% | |
| | | |
| | (a) | Calculated based on the average shares outstanding methodology. |
| | (b) | Assumes investment at the NAV at the beginning of the year, reinvestment of all dividends and distributions, a complete redemption of the investment at the NAV at the end of the year and no sales or redemption charges (if any). Total returns would be reduced if a sales or redemption charge was taken into account. Returns do not reflect the impact of taxes to shareholders relating to Fund distributions or the redemption of Fund shares. |
| | (c) | The Fund’s portfolio turnover rate is calculated in accordance with regulatory requirements, without regard to transactions involving short term investments and certain derivatives. If such transactions were included, the Fund’s portfolio turnover rate may be higher. |
| | |
| The accompanying notes are an integral part of these financial statements. | | 39 |
GOLDMAN SACHS DIVIDEND FOCUS FUNDS
|
Notes to Financial Statements October 31, 2024 |
Goldman Sachs Trust (the “Trust”) is a Delaware statutory trust registered under the Investment Company Act of 1940, as amended (the “Act”), as an open-end management investment company. The following table lists those series of the Trust that are included in this report (collectively, the “Funds” or individually a “Fund”), along with their corresponding share classes and respective diversification status under the Act:
| | | | |
| Fund | | Share Classes Offered | | Diversified/ Non-diversified |
| | |
| Goldman Sachs Income Builder Fund | | A, C, Institutional, Investor, R6 and P | | Diversified |
| | |
| Goldman Sachs Rising Dividend Growth Fund | | A, C, Institutional, Investor, R6, R and P | | Diversified |
Class A Shares are sold with a front-end sales charge of up to 5.50%. Class C Shares are sold with a contingent deferred sales charge (“CDSC”) of 1.00% which is imposed on redemptions made within 12 months of purchase. Institutional, Investor, Class R6, Class R and Class P Shares are not subject to a sales charge.
Goldman Sachs Asset Management, L.P. (“GSAM”), an affiliate of Goldman Sachs & Co. LLC (“Goldman Sachs”), serves as investment adviser to the Funds pursuant to a management agreement (the “Agreement”) with the Trust.
|
|
2. SIGNIFICANT ACCOUNTING POLICIES |
The financial statements have been prepared in accordance with accounting principles generally accepted in the United States of America (“GAAP”) and require management to make estimates and assumptions that may affect the reported amounts and disclosures. Actual results may differ from those estimates and assumptions. Each Fund is an investment company under GAAP and follows the accounting and reporting guidance applicable to investment companies.
A. Investment Valuation — The Funds’ valuation policy is to value investments at fair value.
B. Investment Income and Investments — Investment income includes interest income, dividend income and securities lending income, if any. Interest income is accrued daily and adjusted for amortization of premiums and accretion of discounts. Dividend income is recognized on ex-dividend date or, for certain foreign securities, as soon as such information is obtained subsequent to the ex-dividend date. Non-cash dividends, if any, are recorded at the fair market value of the securities received. Investment transactions are reflected on trade date. Realized gains and losses are calculated using identified cost. Investment transactions are recorded on the following business day for daily net asset value (“NAV”) calculations. Investment income is recorded net of any foreign withholding taxes, less any amounts reclaimable. The Funds may file withholding tax reclaims in certain jurisdictions to recover a portion of amounts previously withheld. Any foreign capital gains tax is accrued daily based upon net unrealized gains, and is payable upon sale of such investments. Distributions received from the Funds’ investments in U.S. real estate investment trusts (“REITs”) may be characterized as ordinary income, net capital gain and/or a return of capital. A return of capital is recorded by the Funds as a reduction to the cost basis of the REIT. Distributions from master limited partnerships (“MLPs”) are generally recorded based on the characterization reported on the MLP’s tax return. A Fund records its pro-rata share of the income/loss and capital gains/losses, allocated from the underlying partnerships and adjusts the cost basis of the underlying partnerships accordingly.
For derivative contracts, unrealized gains and losses are recorded daily and become realized gains and losses upon disposition or termination of the contract. Upfront payments, if any, are made or received upon entering into a swap agreement and are reflected in the Statements of Assets and Liabilities. Upfront payments are recognized over the contract’s term/event as realized gains or losses, with the exception of forward starting swap contracts whose realized gains or losses are recognized from the effective start date. For securities with paydown provisions, principal payments received are treated as a proportionate reduction to the cost basis of the securities, and excess or shortfall amounts are recorded as income.
GOLDMAN SACHS DIVIDEND FOCUS FUNDS
|
|
2. SIGNIFICANT ACCOUNTING POLICIES (continued) |
C. Class Allocations and Expenses — Investment income, realized and unrealized gain (loss), if any, and non-class specific expenses of each Fund are allocated daily based upon the proportion of net assets of each class. Non-class specific expenses directly incurred by a Fund are charged to that Fund, while such expenses incurred by the Trust are allocated across the applicable Funds on a straight-line and/or pro-rata basis depending upon the nature of the expenses. Class specific expenses, where applicable, are borne by the respective share classes and include Distribution and Service, Transfer Agency and Service fees.
D. Federal Taxes and Distributions to Shareholders — It is each Fund’s policy to comply with the requirements of the Internal Revenue Code of 1986, as amended (the “Code”), applicable to regulated investment companies and to distribute each year substantially all of its investment company taxable income and capital gains to its shareholders. Accordingly, each Fund is not required to make any provisions for the payment of federal income tax. Distributions to shareholders are recorded on the ex-dividend date. Income and capital gains distributions, if any, are declared and paid according to the following schedule:
| | | | |
| Fund | | Income Distributions Declared/Paid | | Capital Gains Distributions Declared/Paid |
| | |
| Income Builder Fund | | Monthly | | Annually |
| | |
| Rising Dividend Growth Fund | | Quarterly | | Annually |
Net capital losses, if any, are carried forward to future fiscal years and may be used to the extent allowed by the Code to offset any future capital gains. Losses that are carried forward will retain their character as either short-term or long-term capital losses. Utilization of capital loss carryforwards will reduce the requirement of future capital gains distributions.
The characterization of distributions to shareholders for financial reporting purposes is determined in accordance with federal income tax rules, which may differ from GAAP. The source of each Fund’s distributions may be shown in the accompanying financial statements as either from distributable earnings or capital. Certain components of the Funds’ net assets on the Statements of Assets and Liabilities reflect permanent GAAP/tax differences based on the appropriate tax character.
E. Foreign Currency Translation — The accounting records and reporting currency of a Fund are maintained in U.S. dollars. Assets and liabilities denominated in foreign currencies are translated into U.S. dollars using the current exchange rates at the close of each business day. The effect of changes in foreign currency exchange rates on investments is included within net realized and unrealized gain (loss) on investments. Changes in the value of other assets and liabilities as a result of fluctuations in foreign exchange rates are included in the Statements of Operations within net change in unrealized gain (loss) on foreign currency translation. Transactions denominated in foreign currencies are translated into U.S. dollars on the date the transaction occurred, the effects of which are included within net realized gain (loss) on foreign currency transactions.
|
|
3. INVESTMENTS AND FAIR VALUE MEASUREMENTS |
U.S. GAAP defines the fair value of a financial instrument as the amount that would be received to sell an asset or paid to transfer a liability in an orderly transaction between market participants at the measurement date (i.e., the exit price); the Funds’ policy is to use the market approach. GAAP establishes a fair value hierarchy that prioritizes the inputs to valuation techniques used to measure fair value. The hierarchy gives the highest priority to unadjusted quoted prices in active markets for identical assets or liabilities (Level 1 measurements) and the lowest priority to unobservable inputs (Level 3 measurements). The level in the fair value hierarchy within which the fair value measurement in its entirety falls shall be determined based on the lowest level input that is significant to the fair value measurement in its entirety. The levels used for classifying investments are not necessarily an indication of the risk associated with investing in these investments. The three levels of the fair value hierarchy are described below:
Level 1 — Unadjusted quoted prices in active markets that are accessible at the measurement date for identical, unrestricted assets or liabilities;
GOLDMAN SACHS DIVIDEND FOCUS FUNDS
|
Notes to Financial Statements (continued) October 31, 2024 |
|
|
3. INVESTMENTS AND FAIR VALUE MEASUREMENTS (continued) |
Level 2 — Quoted prices in markets that are not active or financial instruments for which significant inputs are observable (including, but not limited to, quoted prices for similar investments, interest rates, foreign exchange rates, volatility and credit spreads), either directly or indirectly;
Level 3 — Prices or valuations that require significant unobservable inputs (including GSAM’s assumptions in determining fair value measurement).
The Board of Trustees (“Trustees”) has approved Valuation Procedures that govern the valuation of the portfolio investments held by the Funds, including investments for which market quotations are not readily available. With respect to the Funds’ investments that do not have readily available market quotations, the Trustees have designated GSAM as the valuation designee to perform fair valuations pursuant to Rule 2a-5 under the Investment Company Act of 1940 (the “Valuation Designee”). GSAM has day-to-day responsibility for implementing and maintaining internal controls and procedures related to the valuation of the Funds’ investments. To assess the continuing appropriateness of pricing sources and methodologies, GSAM regularly performs price verification procedures and issues challenges as necessary to third party pricing vendors or brokers, and any differences are reviewed in accordance with the Valuation Procedures.
A. Level 1 and Level 2 Fair Value Investments — The valuation techniques and significant inputs used in determining the fair values for investments classified as Level 1 and Level 2 are as follows:
Equity Securities — Equity securities traded on a United States (“U.S.”) securities exchange or the NASDAQ system, or those located on certain foreign exchanges, including but not limited to the Americas, are valued daily at their last sale price or official closing price on the principal exchange or system on which they are traded. If there is no sale or official closing price or such price is believed by GSAM to not represent fair value, equity securities will be valued at the valid closing bid price for long positions and at the valid closing ask price for short positions (i.e., where there is sufficient volume, during normal exchange trading hours). If no valid bid/ask price is available, the equity security will be valued pursuant to the Valuation Procedures and consistent with applicable regulatory guidance. To the extent these investments are actively traded, they are classified as Level 1 of the fair value hierarchy, otherwise they are generally classified as Level 2. Certain equity securities containing unique attributes may be classified as Level 2.
Unlisted equity securities for which market quotations are available are valued at the last sale price on the valuation date, or if no sale occurs, at the last bid price for long positions or the last ask price for short positions, and are generally classified as Level 2. Securities traded on certain foreign securities exchanges are valued daily at fair value determined by an independent fair value service (if available) under the Valuation Procedures and consistent with applicable regulatory guidance. The independent fair value service takes into account multiple factors including, but not limited to, movements in the securities markets, certain depositary receipts, futures contracts and foreign currency exchange rates that have occurred subsequent to the close of the foreign securities exchange. These investments are generally classified as Level 2 of the fair value hierarchy.
Underlying Funds (including Money Market Funds) — Underlying funds (“Underlying Funds”) include exchange-traded funds (“ETFs”) and other investment companies. Investments in the Underlying Funds (except ETFs) are valued at the NAV per share on the day of valuation. ETFs are valued daily at the last sale price or official closing price on the principal exchange or system on which the investment is traded. Because the Funds invest in Underlying Funds that fluctuate in value, the Funds’ shares will correspondingly fluctuate in value. Underlying Funds are generally classified as Level 1 of the fair value hierarchy. To the extent that underlying ETFs are actively traded, they are classified as Level 1 of the fair value hierarchy, otherwise they are generally classified as Level 2. For information regarding an Underlying Fund’s accounting policies and investment holdings, please see the Underlying Fund’s shareholder report.
Debt Securities — Debt securities for which market quotations are readily available are valued daily on the basis of quotations supplied by dealers or an independent pricing service. The pricing services may use valuation models or matrix pricing, which consider: (i) yield or price with respect to bonds that are considered comparable in characteristics such as rating, interest rate and maturity date or (ii) quotations from securities dealers to determine current value. With the exception of treasury securities of G7 countries, which are generally classified as Level 1, these investments are generally classified as Level 2 of the fair value hierarchy.
GOLDMAN SACHS DIVIDEND FOCUS FUNDS
|
|
3. INVESTMENTS AND FAIR VALUE MEASUREMENTS (continued) |
i. Bank Loans — Bank loans (“Loans”) are interests in amounts owed by corporate, governmental, or other borrowers to lenders or lending syndicates. Loans are arranged through private negotiations between the borrower and one or more financial institutions (“Lenders”). A Fund’s investments in Loans are in the form of either participations in Loans (“Participations”) or assignments of all or a portion of Loans from third parties (“Assignments”). With respect to Participations, a Fund has the right to receive payments of principal, interest and any fees to which it is entitled from the Lender selling the Participations and only upon receipt by the Lender of the payments from the borrower. A Fund generally has no right to enforce compliance by the borrower with the terms of the loan agreement with respect to Participations. Conversely, assignments result in a Fund having a direct contractual relationship with the borrower, and the Fund may be permitted to enforce compliance by the borrower with the terms of the loan agreement.
The Income Builder Fund may also enter into certain credit arrangements, all or a portion of which may be unfunded. Unfunded loan commitments represent the remaining obligation of the Fund to the borrower. The Fund is obligated to fund these commitments at the borrower’s discretion. The Fund may receive a commitment fee based on the undrawn portion of the underlying line of credit of a loan. All loans and unfunded loan commitments involve interest rate risk, liquidity risk and credit risk, including the potential default or insolvency of the borrower. Loans, including unfunded loan commitments, are marked to market daily using pricing vendor quotations and the change in value, if any, is recorded as an unrealized gain or loss.
Derivative Contracts — A derivative is an instrument whose value is derived from underlying assets, indices, reference rates or a combination of these factors. A Fund enters into derivative transactions to hedge against changes in interest rates, securities prices, and/or currency exchange rates, to increase total return, or to gain access to certain markets or attain exposure to other underliers. For financial reporting purposes, cash collateral that has been pledged to cover obligations of a Fund and cash collateral received, if any, is reported separately on the Statements of Assets and Liabilities as either due to broker/receivable for collateral on certain derivative contracts. Non-cash collateral pledged by a Fund, if any, is noted in the Schedules of Investments.
Exchange-traded derivatives, including futures and options contracts, are generally valued at the last sale or settlement price on the exchange where they are principally traded. Exchange-traded options without settlement prices are generally valued at the midpoint of the bid and ask prices on the exchange where they are principally traded (or, in the absence of two-way trading, at the last bid price for long positions and the last ask price for short positions). Exchange-traded derivatives typically fall within Level 1 of the fair value hierarchy. Over-the-counter (“OTC”) and centrally cleared derivatives are valued using market transactions and other market evidence, including market-based inputs to models, calibration to market-clearing transactions, broker or dealer quotations, or other alternative pricing sources. Where models are used, the selection of a particular model to value OTC and centrally cleared derivatives depends upon the contractual terms of, and specific risks inherent in, the instrument, as well as the availability of pricing information in the market. Valuation models require a variety of inputs, including contractual terms, market prices, yield curves, credit curves, measures of volatility, voluntary and involuntary prepayment rates, loss severity rates and correlations of such inputs. For OTC and centrally cleared derivatives that trade in liquid markets, model inputs can generally be verified and model selection does not involve significant management judgment. OTC and centrally cleared derivatives are classified within Level 2 of the fair value hierarchy when significant inputs are corroborated by market evidence.
i. Forward Contracts — A forward contract is a contract between two parties to buy or sell an asset at a specified price on a future date. A forward contract settlement can occur on a cash or delivery basis. Forward contracts are marked-to-market daily using independent vendor prices, and the change in value, if any, is recorded as an unrealized gain or loss. Cash and certain investments may be used to collateralize forward contracts.
A forward foreign currency exchange contract is a forward contract in which a Fund agrees to receive or deliver a fixed quantity of one currency for another, at a pre-determined price at a future date. All forward foreign currency exchange contracts are marked to market daily by using the outright forward rates or interpolating based upon maturity dates, where available. Non-deliverable forward foreign currency exchange contracts are settled with the counterparty in cash without the delivery of foreign currency.
GOLDMAN SACHS DIVIDEND FOCUS FUNDS
|
Notes to Financial Statements (continued) October 31, 2024 |
|
|
3. INVESTMENTS AND FAIR VALUE MEASUREMENTS (continued) |
ii. Futures Contracts — Futures contracts are contracts to buy or sell a standardized quantity of a specified commodity or security. Upon entering into a futures contract, a Fund deposits cash or securities in an account on behalf of the broker in an amount sufficient to meet the initial margin requirement. Subsequent payments are made or received by a Fund equal to the daily change in the contract value and are recorded as variation margin receivable or payable with a corresponding offset to unrealized gains or losses.
iii. Options — When a Fund writes call or put options, an amount equal to the premium received is recorded as a liability and is subsequently marked-to-market to reflect the current value of the option written. Swaptions are options on swap contracts.
Upon the purchase of a call option or a put option by a Fund, the premium paid is recorded as an investment and subsequently marked-to-market to reflect the current value of the option. Certain options may be purchased with premiums to be determined on a future date. The premiums for these options are based upon implied volatility parameters at specified terms.
iv. Swap Contracts — Bilateral swap contracts are agreements in which a Fund and a counterparty agree to exchange periodic payments on a specified notional amount or make a net payment upon termination. Bilateral swap transactions are privately negotiated in the OTC market and payments are settled through direct payments between a Fund and the counterparty. By contrast, certain swap transactions are subject to mandatory central clearing. These swaps are executed through a derivatives clearing member (“DCM”), acting in an agency capacity, and submitted to a central counterparty (“CCP”) (“centrally cleared swaps”), in which case all payments are settled with the CCP through the DCM. Swaps are marked-to-market daily using pricing vendor quotations, counterparty or clearinghouse prices or model prices, and the change in value, if any, is recorded as an unrealized gain or loss. Upon entering into a swap contract, a Fund is required to satisfy an initial margin requirement by delivering cash or securities to the counterparty (or in some cases, segregated in a triparty account on behalf of the counterparty), which can be adjusted by any mark-to-market gains or losses pursuant to bilateral or centrally cleared arrangements. For centrally cleared swaps the daily change in valuation, if any, is recorded as a receivable or payable for variation margin.
An interest rate swap is an agreement that obligates two parties to exchange a series of cash flows at specified intervals, based upon or calculated by reference to changes in interest rates on a specified notional principal amount. The payment flows are usually netted against each other, with the difference being paid by one party to the other.
B. Level 3 Fair Value Investments — To the extent that significant inputs to valuation models and other alternative pricing sources are unobservable, or if quotations are not readily available, or if GSAM believes that such quotations do not accurately reflect fair value, the fair value of a Fund’s investments may be determined under the Valuation Procedures. GSAM, consistent with its procedures and applicable regulatory guidance, may make an adjustment to the most recent valuation prices of either domestic or foreign securities in light of significant events to reflect what it believes to be the fair value of the securities at the time of determining a Fund’s NAV. To the extent investments are valued using single source broker quotations obtained directly from the broker or passed through from third party pricing vendors, such investments are classified as Level 3 investments.
GOLDMAN SACHS DIVIDEND FOCUS FUNDS
|
|
3. INVESTMENTS AND FAIR VALUE MEASUREMENTS (continued) |
C. Fair Value Hierarchy — The following is a summary of the Funds’ investments and derivatives classified in the fair value hierarchy as of October 31, 2024:
| | | | | | | | | | | | |
| INCOME BUILDER FUND | | | | | | | | | | | | |
| | | |
| Investment Type | | Level 1 | | | Level 2 | | | Level 3 | |
|
| |
| | | |
Assets | | | | | | | | | | | | |
| | | |
Fixed Income | | | | | | | | | | | | |
| | | |
Corporate Obligations | | $ | — | | | $ | 1,139,969,291 | | | $ | — | |
| | | |
Bank Loans | | | — | | | | 103,708,590 | | | | 3,841,875 | |
| | | |
Sovereign Debt Obligations | | | — | | | | 10,574,271 | | | | — | |
| | | |
Mortgage-Backed Obligations | | | — | | | | 93,394 | | | | — | |
| | | |
Common Stock and/or Other Equity Investments(a) | | | | | | | | | | | | |
| | | |
Asia | | | 23,695,456 | | | | 30,423 | | | | — | |
| | | |
Europe | | | 157,735,580 | | | | 1,046,748 | | | | — | |
| | | |
North America | | | 695,271,448 | | | | — | | | | 195 | |
| | | |
South America | | | 15,928,493 | | | | — | | | | — | |
| | | |
Preferred Stocks | | | — | | | | 8,847,252 | | | | — | |
| | | |
Warrants | | | — | | | | 66,840 | | | | 195 | |
| | | |
Exchange Traded Funds | | | 91,992,540 | | | | — | | | | — | |
| | | |
Investment Companies | | | 175,977,709 | | | | — | | | | — | |
|
| |
| | | |
Total | | $ | 1,160,601,226 | | | $ | 1,264,336,809 | | | $ | 3,842,265 | |
|
| |
| | | |
| Derivative Type | | | | | | | | | |
|
| |
| | | |
Assets(b) | | | | | | | | | | | | |
| | | |
Forward Foreign Currency Exchange Contracts | | $ | — | | | $ | 477,444 | | | $ | — | |
| | | |
Futures Contracts | | | 5,092,381 | | | | — | | | | — | |
| | | |
Interest Rate Swap Contracts | | | — | | | | 935,298 | | | | — | |
|
| |
| | | |
Total | | $ | 5,092,381 | | | $ | 1,412,742 | | | $ | — | |
|
| |
| | | |
Liabilities | | | | | | | | | | | | |
| | | |
Forward Foreign Currency Exchange Contracts(b) | | $ | — | | | $ | (166,177 | ) | | $ | — | |
| | | |
Futures Contracts(b) | | | (10,289,298 | ) | | | — | | | | — | |
| | | |
Interest Rate Swap Contracts(b) | | | — | | | | (10,039,197 | ) | | | — | |
| | | |
Written Option Contracts | | | — | | | | (142,722 | ) | | | — | |
|
| |
| | | |
Total | | $ | (10,289,298 | ) | | $ | (10,348,096 | ) | | $ | — | |
|
| |
| | | | | | | | | | | | |
| RISING DIVIDEND GROWTH FUND | | | | | | | | | | | | |
| | | |
| Investment Type | | Level 1 | | | Level 2 | | | Level 3 | |
|
| |
| | | |
Assets | | | | | | | | | | | | |
| | | |
Common Stock and/or Other Equity Investments(a) | | | | | | | | | | | | |
| | | |
Europe | | $ | 8,819,114 | | | $ | — | | | $ | — | |
| | | |
North America | | | 457,162,861 | | | | — | | | | — | |
| | | |
Investment Companies | | | 12,312,271 | | | | — | | | | — | |
|
| |
| | | |
Total | | $ | 478,294,246 | | | $ | — | | | $ | — | |
|
| |
GOLDMAN SACHS DIVIDEND FOCUS FUNDS
|
Notes to Financial Statements (continued) October 31, 2024 |
|
|
3. INVESTMENTS AND FAIR VALUE MEASUREMENTS (continued) |
| | | | | | | | | | | | |
| RISING DIVIDEND GROWTH FUND (continued) | | | | | | | | | | | | |
| | | |
| Derivative Type | | Level 1 | | | Level 2 | | | Level 3 | |
|
| |
| | | |
Liabilities(b) | | | | | | | | | | | | |
| | | |
Futures Contracts | | $ | (1,569) | | | $ | — | | | $ | — | |
|
| |
| | (a) | Amounts are disclosed by continent to highlight the impact of time zone differences between local market close and the calculation of NAV. Security valuations are based on the principal exchange or system on which they are traded, which may differ from country of domicile. The Fund utilizes fair value model prices provided by an independent fair value service for international equities, resulting in a Level 2 classification. |
| | (b) | Amount shown represents unrealized gain (loss) at period end. |
For further information regarding security characteristics, see the Schedules of Investments.
|
|
4. INVESTMENTS IN DERIVATIVES |
The following tables set forth, by certain risk types, the gross value of derivative contracts (not considered to be hedging instruments for accounting disclosure purposes) as of October 31, 2024. These instruments were used as part of the Funds’ investment strategies and to obtain and/or manage exposure related to the risks below. The values in the tables below exclude the effects of cash collateral received or posted pursuant to these derivative contracts, and therefore are not representative of the Funds’ net exposure.
| | | | | | | | | | | | |
| Income Builder Fund | | | | | | | |
| | | | |
| Risk | | Statements of Assets and Liabilities | | Assets | | | Statements of Assets and Liabilities | | Liabilities | |
| | | | |
| Currency | | Receivable for unrealized gain on forward foreign currency exchange contracts | | $ | 477,444 | | | Payable for unrealized loss on forward foreign currency exchange contracts | | $ | (166,177 | ) |
| | | | |
| Equity | | Variation margin on futures contracts | | | 1,076,147 | (a) | | Variation margin on futures contracts | | | (214,744 | )(a) |
| | | | |
| Interest rate | | Variation margin on swap contracts; Variation margin on futures contracts | | | 4,951,532 | (a) | | Variation margin on swap contracts; Variation margin on futures contracts and written options | | | (20,256,473 | )(a) |
| | | | |
Total | | | | $ | 6,505,123 | | | | | $ | (20,637,394 | ) |
| | |
| Rising Dividend Growth Fund | | | | | | | |
| | | | |
| Risk | | Statements of Assets and Liabilities | | Assets | | | Statements of Assets and Liabilities | | Liabilities | |
| | | | |
Equity | | | | $ | — | | | Variation margin on futures contracts | | $ | (1,569 | )(a) |
| | (a) | Includes unrealized gain (loss) on futures contracts and centrally cleared swaps described in the Additional Investment Information sections of the Schedules of Investments. Only current day’s variation margin is reported within the Statements of Assets and Liabilities. |
The following tables set forth, by certain risk types, the Funds’ gains (losses) related to these derivatives and their indicative volumes for the fiscal year ended October 31, 2024. These gains (losses) should be considered in the context that these derivative contracts may have been executed to create investment opportunities and/or economically hedge certain investments, and
GOLDMAN SACHS DIVIDEND FOCUS FUNDS
|
|
4. INVESTMENTS IN DERIVATIVES (continued) |
accordingly, certain gains (losses) on such derivative contracts may offset certain (losses) gains attributable to investments. These gains (losses) are included in “Net realized gain (loss)” or “Net change in unrealized gain (loss)” on the Statements of Operations:
| | | | | | | | | | | | |
| Income Builder Fund | | | | | | | | | | |
| | | |
| Risk | | Statements of Operations | | Net Realized Gain (Loss) | | Net Change in
Unrealized
Gain (Loss) |
| | | |
| Currency | | Net realized gain (loss) from forward foreign currency exchange contracts/Net unrealized gain on forward foreign currency exchange contracts | | | | $ (362,876 | ) | | | | $ 42,554 | |
| | | |
| Equity | | Net realized gain from futures, swap contracts, purchased and written options/Net unrealized gain on futures, swap contracts and written options | | | | 4,200,557 | | | | | 3,713,185 | |
| | | |
| Interest rate | | Net realized gain (loss) from futures contracts and swap contracts/Net change in unrealized gain on futures contracts and swap contracts | | | | 9,426,844 | | | | | (2,362,551 | ) |
| | | |
Total | | | | | | $13,264,525 | | | | | $ 1,393,188 | |
| | | | | | | | | | | | |
| Rising Dividend Growth Fund | | | | | | | | | | |
| | | |
| Risk | | Statements of Operations | | Net Realized Gain (Loss) | | Net Change in
Unrealized
Gain (Loss) |
| | | |
| Equity | | Net realized gain (loss) from futures contracts/Net unrealized gain(loss) on futures contracts | | | $ | 2,528,688 | | | | $ | 963,250 | |
For the fiscal year ended October 31, 2024, the relevant values for each derivative type were as follows:
| | | | | | | | | | | | | | | | |
| | | Average Number of Contracts, Notional Amounts, or Shares/Units(a) |
| |
| | | | |
| | | | |
| Fund | | Futures
Contracts | | Forward
Contracts | | Swap
Agreements | | Written
Options | |
|
| |
| | | | |
Income Builder Fund | | | 3,555 | | | | $51,182,131 | | | | $333,785,504 | | | | 16,520 | |
|
| |
| | | | |
Rising Dividend Growth Fund | | | 51 | | | | — | | | | — | | | | — | |
|
| |
| | (a) | Amounts disclosed represent average number of contracts for futures contracts, notional amounts for forward contracts, swaptions, swap agreements, purchased and written swaptions, or shares/units outstanding for purchased options and written options, based on absolute values, which is indicative of volume for this derivative type, for the months that the Fund held such derivatives during the fiscal year ended October 31, 2024. |
|
|
5. AGREEMENTS AND AFFILIATED TRANSACTIONS |
A. Management Agreement — Under the Agreement, GSAM manages the Funds, subject to the general supervision of the Trustees.
As compensation for the services rendered pursuant to the Agreement, the assumption of the expenses related thereto and administration of the Funds’ business affairs, including providing facilities, GSAM is entitled to a management fee, accrued daily and paid monthly, equal to an annual percentage rate of each Fund’s average daily net assets.
GOLDMAN SACHS DIVIDEND FOCUS FUNDS
|
Notes to Financial Statements (continued) October 31, 2024 |
|
|
5. AGREEMENTS AND AFFILIATED TRANSACTIONS (continued) |
For the fiscal year ended October 31, 2024, contractual and effective net management fees with GSAM were at the following rates:
| | | | | | | | | | | | | | | | | | | | | | | | | | | | |
| | | Contractual Management Rate | | | | | | | |
| Fund | | First
$1 billion | | | Next
$1 billion | | | Next
$3 billion | | | Next
$3 billion | | | Over
$8 billion | | | Effective Rate | | | Effective Net
Management
Rate^ | |
|
| |
| | | | | | | |
Income Builder Fund | | | 0.54 | % | | | 0.49 | % | | | 0.46 | % | | | 0.45 | % | | | 0.44 | % | | | 0.51 | % | | | 0.42*% | |
|
| |
| | | | | | | |
Rising Dividend Growth Fund | | | 0.75 | | | | 0.68 | | | | 0.64 | | | | 0.63 | | | | 0.62 | | | | 0.75 | | | | 0.65** | |
|
| |
| | ^ | Effective Net Management Rate includes the impact of management fee waivers of affiliated underlying funds, if any. |
| | * | The Investment Adviser agreed to waive a portion of the Management Fee so that the net management fee will not exceed 0.44% as an annual percentage rate of the Fund’s average net assets. This management fee waiver arrangement will remain in effect through at least February 28, 2025, and prior to such date, GSAM may not terminate the arrangement without the approval of the Board of Trustees. |
| | ** | The Investment Adviser agreed to waive a portion of the Management Fee so that the net management fee will not exceed 0.65% as an annual percentage rate of the Fund’s average net assets. This management fee waiver arrangement will remain in effect through at least February 28, 2025, and prior to such date, GSAM may not terminate the arrangement without the approval of the Board of Trustees. |
Both the Funds invest in Institutional Shares and Class R6 Shares of the Goldman Sachs Financial Square Government Fund and Income Builder Fund invests in Class R6 Shares of the Goldman Sachs MLP Energy Infrastructure and Goldman Sachs NASDAQ 100 Core Premium Income ETF Funds, which are affiliated Underlying Funds. GSAM has agreed to waive a portion of its management fee payable by each applicable Fund in an amount equal to the management fee it earns as an investment adviser to the affiliated Underlying Funds in which each Fund invests. For the fiscal year ended October 31, 2024, the management fee waived by GSAM for each Fund was as follows:
| | | | |
| Fund | | Management
Fee Waived | |
|
| |
| |
Income Builder Fund | | | $477,935 | |
|
| |
| |
Rising Dividend Growth Fund | | | 16,490 | |
|
| |
B. Distribution and/or Service (12b-1) Plans — The Trust, on behalf of Class A and Class R Shares of the Fund, has adopted Distribution and Service Plans subject to Rule 12b-1 under the Act. Under the Distribution and Service Plans, Goldman Sachs, which serves as distributor (the “Distributor”), is entitled to a fee accrued daily and paid monthly for distribution services and personal and account maintenance services, which may then be paid by Goldman Sachs to authorized dealers. These fees are equal to an annual percentage rate of the average daily net assets attributable to Class A or Class R Shares of the Fund, as applicable, as set forth below.
The Trust, on behalf of Class C Shares of each applicable Fund, has adopted a Distribution Plan subject to Rule 12b-1 under the Act. Under the Distribution Plan, Goldman Sachs as Distributor is entitled to a fee accrued daily and paid monthly for distribution services, which may then be paid by Goldman Sachs to authorized dealers. These fees are equal to an annual percentage rate of the average daily net assets attributable to Class C Shares of the Funds, as set forth below.
| | | | | | | | | | | | |
| | | Distribution and/or Service Plan Rates | |
| | | |
| Fund | | Class A* | | | Class C | | | Class R* | |
|
| |
| | | |
Income Builder Fund | | | 0.25 | % | | | 0.75 | % | | | —% | |
|
| |
| | | |
Rising Dividend Growth Fund | | | 0.25 | | | | 0.75 | | | | 0.50 | |
|
| |
| | * | With respect to Class A and Class R Shares, the Distributor at its discretion may use compensation for distribution services paid under the Distribution Plan to compensate service organizations for personal and account maintenance services and expenses as long as such total compensation does not exceed the maximum cap on “service fees” imposed by the Financial Industry Regulatory Authority. |
GOLDMAN SACHS DIVIDEND FOCUS FUNDS
|
|
5. AGREEMENTS AND AFFILIATED TRANSACTIONS (continued) |
C. Distribution Agreement — Goldman Sachs, as Distributor of the shares of the Funds pursuant to a Distribution Agreement, may retain a portion of the Class A Shares’ front end sales charge and Class C Shares’ CDSC. During the fiscal year ended October 31, 2024, Goldman Sachs retained the following amounts:
| | |
| |
| | | Front End
Sales Charge |
| |
| | |
| |
| Fund | | Class A |
|
|
| |
Income Builder Fund | | $73,226 |
|
|
| |
Rising Dividend Growth Fund | | 8,352 |
|
|
D. Service Plan — The Trust, on behalf of each applicable Fund, has adopted a Service Plan to allow Class C Shares to compensate service organizations (including Goldman Sachs) for providing varying levels of personal and account maintenance services to their customers who are beneficial owners of such shares. The Service Plan provides for compensation to the service organizations equal to an annual percentage rate of 0.25% of the average daily net assets attributable to Class C Shares of the Funds.
E. Transfer Agency Agreement — Goldman Sachs also serves as the transfer agent of the Funds for a fee pursuant to the Transfer Agency Agreement. The fees charged for such transfer agency services are accrued daily and paid monthly at annual rates as follows: 0.12% of the average daily net assets of Class A, Class C and Investor Shares of the Income Builder Fund; 0.15% of the average daily net assets of Class A, Class C, Investor and Class R Shares of the Rising Dividend Growth Fund; 0.03% of the average daily net assets of Class R6 and P Shares of each Fund; and 0.04% of the average daily net assets of Institutional Shares of each Fund.
Goldman Sachs has agreed to waive a portion of its transfer agency fee (a component of “Other Expenses”) equal to 0.04% as an annual percentage rate of the average daily net assets attributable to Class A, Class C, Investor and Class R Shares, as applicable, of the Rising Dividend Growth Fund through at least February 28, 2025, and prior to such date, Goldman Sachs may not terminate the arrangement without the approval of the Board of Trustees.
F. Other Expense Agreements and Affiliated Transactions — GSAM has agreed to reduce or limit certain “Other Expenses” of the Funds (excluding acquired fund fees and expenses, transfer agency fees and expenses, service fees and shareholder administration fees (as applicable), taxes, interest, brokerage fees, expenses of shareholder meetings, litigation and indemnification, and extraordinary expenses) to the extent such expenses exceed, on an annual basis, a percentage rate of the average daily net assets of each Fund. Such Other Expense reimbursements, if any, are accrued daily and paid monthly. In addition, the Funds are not obligated to reimburse GSAM for prior fiscal year expense reimbursements, if any. The Other Expense limitations as an annual percentage rate of average daily net assets for the Income Builder and Rising Dividend Growth Funds are 0.004% and 0.004%, respectively. These Other Expense limitations will remain in place through at least February 28, 2025, and prior to such date GSAM may not terminate the arrangements without the approval of the Trustees. In addition, the Funds have entered into certain offset arrangements with the transfer agent, which may result in a reduction of the Funds’ expenses and are received irrespective of the application of the “Other Expense” limitations described above.
For the fiscal year ended October 31, 2024, these expense reductions, including any fee waivers and Other Expense reimbursements, were as follows:
| | | | | | | | | | | | | | | | | | |
| | | | | | | |
| Fund | | Management
Fee Waiver | | | | | Transfer Agency
Waivers/Credits | | | | Other Expense
Reimbursements | | | | Total Expense
Reductions | |
|
| |
| | | | | | | |
Income Builder Fund | | $2,045,053 | | | | | | $ 6,417 | | | | $1,067,163 | | | | $ | 3,118,633 | |
|
| |
| | | | | | | |
Rising Dividend Growth Fund | | 502,736 | | | | | | 141,108 | | | | 571,211 | | | | | 1,215,055 | |
|
| |
GOLDMAN SACHS DIVIDEND FOCUS FUNDS
|
Notes to Financial Statements (continued) October 31, 2024 |
|
|
5. AGREEMENTS AND AFFILIATED TRANSACTIONS (continued) |
G. Line of Credit Facility — As of October 31, 2024, the Funds participated in a $1,150,000,000 committed, unsecured revolving line of credit facility (the “facility”) together with other funds of the Trust and certain registered investment companies having management agreements with GSAM or its affiliates. This facility is to be used for temporary emergency purposes, or to allow for an orderly liquidation of securities to meet redemption requests. The interest rate on borrowings is based on the federal funds rate. The facility also requires a fee to be paid by the Funds based on the amount of the commitment that has not been utilized. For the fiscal year ended October 31, 2024, the Funds did not have any borrowings under the facility. Prior to April 16, 2024, the facility was $1,110,000,000.
H. Other Transactions with Affiliates — For the fiscal year ended October 31, 2024, Goldman Sachs earned $46,790 in brokerage commissions from portfolio transactions, including futures transactions executed with Goldman Sachs as the Futures Commission Merchant, on behalf of the Income Builder Fund.
The table below shows the transactions in and earnings from investments in the Underlying Funds for the fiscal year ended October 31, 2024:
| | | | | | | | | | | | | | | | | | | | | | | | | | | | | | | | |
| | | | | | | | | |
| Fund | | | | Underlying Fund | | Beginning
Value as of
October 31,
2023 | | | Purchases at Cost | | | Proceeds
from Sales | | | Change In
Unrealized
Gain (Loss) | | | Ending
Value as of
October 31,
2024 | | | Shares as of
October 31,
2024 | | | Dividend Income | |
|
| |
| | | | | | | | | |
Income Builder Fund | | | | Goldman Sachs Financial Square Government Fund — Class R6 | | $ | 8,740,276 | | | $ | 339,372,486 | | | $ | (328,346,795 | ) | | $ | — | | | $ | 19,765,967 | | | | 19,765,967 | | | $ | 1,041,152 | |
|
| |
| | | | | | | | | |
| | | | Goldman Sachs Financial Square Government Fund — Institutional Shares | | | 17,500,773 | | | | 469,461,076 | | | | (365,945,885 | ) | | | — | | | | 121,015,964 | | | | 121,015,964 | | | | 2,123,889 | |
|
| |
| | | | | | | | | |
| | | | Goldman Sachs MLP Energy Infrastructure Fund — Class R6 | | | 28,040,584 | | | | 2,205,079 | | | | — | | | | 4,950,115 | | | | 35,195,778 | | | | 950,467 | | | | 2,205,079 | |
|
| |
| | | | | | | | | |
| | | | Goldman Sachs Nasdaq-100 Core Premium Income ETF | | | — | | | | 85,881,459 | | | | — | | | | (428,564 | ) | | | 85,452,895 | | | | 1,805,470 | | | | 2,400,883 | |
|
| |
| | | | | | | | | |
Rising Dividend Growth Fund | | | | Goldman Sachs Financial Square Government Fund — Class R6 | | | 13,320,035 | | | | 117,814,839 | | | | (119,092,959 | ) | | | — | | | | 12,041,915 | | | | 12,041,915 | | | | 508,181 | |
|
| |
| | | | | | | | | |
| | | | Goldman Sachs Financial Square Government Fund — Institutional Shares | | | 278,047 | | | | 9,219,699 | | | | (9,227,390 | ) | | | — | | | | 270,356 | | | | 270,356 | | | | 21,265 | |
|
| |
|
|
6. PORTFOLIO SECURITIES TRANSACTIONS |
The cost of purchases and proceeds from sales and maturities of long-term securities for the fiscal year ended October 31, 2024, were as follows:
| | | | | | |
| | | |
| Fund | | Purchases (Excluding
U.S. Government and
Agency Obligations) | | | | Sales and
Maturities of (Excluding
U.S. Government and
Agency Obligations) |
|
|
| | | |
Income Builder Fund | | $662,043,380 | | | | $722,738,757 |
|
|
| | | |
Rising Dividend Growth Fund | | 200,106,947 | | | | 268,028,359 |
|
|
GOLDMAN SACHS DIVIDEND FOCUS FUNDS
The Income Builder Fund may lend its securities through a securities lending agent, the Bank of New York Mellon (“BNYM”), to certain qualified borrowers. Pursuant to exemptive relief granted by the SEC and the terms and conditions contained therein, the Rising Dividend Growth Fund may lend its securities through a securities lending agent, Goldman Sachs Agency Lending (“GSAL”), a wholly-owned subsidiary of Goldman Sachs, to certain qualified borrowers including Goldman Sachs and affiliates. In accordance with the Funds’ securities lending procedures, the Funds receive cash collateral at least equal to the market value of the securities on loan. The market value of the loaned securities is determined at the close of business of the Funds, at their last sale price or official closing price on the principal exchange or system on which they are traded, and any additional required collateral is delivered to the Funds on the next business day. As with other extensions of credit, the Funds may experience delay in the recovery of their securities or incur a loss should the borrower of the securities breach its agreement with the Funds or become insolvent at a time when the collateral is insufficient to cover the cost of repurchasing securities on loan. Dividend income received from securities on loan may not be subject to withholding taxes and therefore withholding taxes paid may differ from the amounts listed in the Statements of Operations. Loans of securities are terminable at any time and as such 1) the remaining contractual maturities of the outstanding securities lending transactions are considered to be overnight and continuous and 2) the borrower, after notice, is required to return borrowed securities within the standard time period for settlement of securities transactions.
The Funds invest the cash collateral received in connection with securities lending transactions in the Goldman Sachs Financial Square Government Fund (“Government Money Market Fund”), an affiliated series of the Goldman Sachs Trust. The Government Money Market Fund is registered under the Act as an open end investment company, is subject to Rule 2a-7 under the Act, and is managed by GSAM, for which GSAM may receive a management fee of up to 0.16% on an annualized basis of the average daily net assets of the Government Money Market Fund.
In the event of a default by a borrower with respect to any loan, GSAL will and BNYM may exercise any and all remedies provided under the applicable borrower agreement to make the Funds whole. These remedies include purchasing replacement securities by applying the collateral held from the defaulting broker against the purchase cost of the replacement securities. If GSAL or BNYM are unable to purchase replacement securities, GSAL and/or BNYM will indemnify the Funds by paying the Funds an amount equal to the market value of the securities loaned minus the value of cash collateral received from the borrower for the loan, subject to an exclusion for any shortfalls resulting from a loss of value in such cash collateral due to reinvestment risk.
The Funds’ master netting agreements with certain borrowers provide the right, in the event of a default (including bankruptcy or insolvency), for the non-defaulting party to liquidate the collateral and calculate net exposure to the defaulting party or request additional collateral. However, in the event of a default by a borrower, a resolution authority could determine that such rights are not enforceable due to the restrictions or prohibitions against the right of set-off that may be imposed in accordance with a particular jurisdiction’s bankruptcy or insolvency laws. The Funds’ loaned securities were all subject to enforceable Securities Lending Agreements and the value of the collateral was at least equal to the value of the cash received. The amounts of the Funds’ overnight and continuous agreements, which represent the gross amounts of recognized liabilities for securities lending transactions outstanding as of October 31, 2024, are disclosed as “Payable upon return of securities loaned” on the Statements of Assets and Liabilities, where applicable.
The Income Builder Fund and BNYM received compensation relating to the lending of the Fund’s securities. The amounts earned, if any, by the Funds for the fiscal year ended October 31, 2024, are reported under Investment Income on the Statements of Operations.
The following table provides information about the Fund’s investment in the Government Money Market Fund for the fiscal year ended October 31, 2024:
| | | | | | | | | | | | | | |
| | | | | | | |
| Fund | | Beginning Value as of
October 31, 2023 | | | | Purchases
at cost | | | | Proceeds
from Sales | | | | Ending Value as of
October 31, 2024 |
|
|
| | | | | | | |
Income Builder Fund | | $104,950 | | | | $98,905,524 | | | | $(99,010,474) | | | | $— |
|
|
GOLDMAN SACHS DIVIDEND FOCUS FUNDS
|
Notes to Financial Statements (continued) October 31, 2024 |
The tax character of distributions paid during the fiscal year ended October 31, 2024 was as follows:
| | | | | | | | | | | | |
| | | |
| | | Income Builder
Fund | | | | | | Rising Dividend
Growth Fund | |
|
| |
| | | |
Distributions paid from: | | | | | | | | | | | | |
| | | |
Ordinary income | | | $98,455,815 | | | | | | | | $ 7,259,738 | |
| | | |
Net long-term capital gains | | | 613,010 | | | | | | | | 26,709,475 | |
|
| |
| | | |
Total taxable distributions | | | $99,068,825 | | | | | | | | $33,969,213 | |
|
| |
The tax character of distributions paid during the fiscal year ended October 31, 2023 was as follows:
| | | | | | | | | | | | |
| | | |
| | | Income Builder
Fund | | | | | | Rising Dividend
Growth Fund | |
|
| |
| | | |
Distributions paid from: | | | | | | | | | | | | |
| | | |
Ordinary income | | | $104,463,961 | | | | | | | | $29,513,224 | |
| | | |
Net long-term capital gains | | | — | | | | | | | | 41,589,560 | |
|
| |
| | | |
Total taxable distributions | | | $104,463,961 | | | | | | | | $71,102,784 | |
|
| |
| | | |
Tax return of capital | | | $ 285,888 | | | | | | | | $ — | |
|
| |
As of October 31, 2024, the components of accumulated earnings (losses) on a tax basis were as follows:
| | | | | | | | | | | | |
| | | |
| | | Income Builder
Fund | | | | | | Rising Dividend
Growth Fund | |
|
| |
| | | |
Undistributed ordinary income — net | | | $ — | | | | | | | | $ 14,832,104 | |
| | | |
Undistributed long-term capital gains | | | 11,840,365 | | | | | | | | 34,334,623 | |
|
| |
| | | |
Total Undistributed Earnings | | | $ 11,840,365 | | | | | | | | $ 49,166,727 | |
|
| |
| | | |
Capital loss carryforwards(1): | | | | | | | | | | | | |
| | | |
Timing differences (Open MBS Amortization - Pre-Election/Defaulted Bonds/Straddle Loss Deferral) | | | $ (118,281 | ) | | | | | | | $ — | |
| |
| | | | |
| | | |
Unrealized gains (loss) — net | | | 190,055,392 | | | | | | | | 134,657,452 | |
|
| |
| | | |
Total accumulated earnings (loss) net | | | $201,777,476 | | | | | | | | $183,824,179 | |
|
| |
| | (1) | The Income Builder Fund utilized $44,701,411 of capital losses in the current fiscal year. |
As of October 31, 2024, the Funds’ aggregate security unrealized gains and losses based on cost for U.S. federal income tax purposes were as follows:
| | | | | | | | | | | | |
| | | |
| | | Income Builder
Fund | | | | | | Rising Dividend
Growth Fund | |
|
| |
| | | |
Tax Cost | | | $2,224,684,161 | | | | | | | | $343,635,225 | |
|
| |
| | | |
Gross unrealized gain | | | 270,347,395 | | | | | | | | 146,045,062 | |
| | | |
Gross unrealized loss | | | (80,292,003 | ) | | | | | | | (11,387,610 | ) |
|
| |
| | | |
Net unrealized gain | | | $ 190,055,392 | | | | | | | | $134,657,452 | |
|
| |
GOLDMAN SACHS DIVIDEND FOCUS FUNDS
|
|
8. TAX INFORMATION (continued) |
The difference between GAAP-basis and tax basis unrealized gains (losses) is attributable primarily to wash sales, net mark to market gains/(losses) on regulated futures contracts, net mark to market gains/(losses) on foreign currency contracts, material modification of debt securities, and market discount accretion and premium amortization and differences in the tax treatment of partnership investments.
The Income Builder and Rising Dividend Growth Funds reclassed $678,890 and $105,071, respectively, from paid-in capital to distributable earnings for the year ending October 31, 2024. In order to present certain components of the Funds’ capital accounts on a tax-basis, certain reclassifications have been recorded to the Funds’ accounts. These reclassifications have no impact on the net asset value of the Funds and result primarily from differences in the tax treatment of paydown gains and losses and partnership investments.
GSAM has reviewed the Funds’ tax positions for all open tax years (the current and prior three years, as applicable) and has concluded that no provision for income tax is required in the Funds’ financial statements. Such open tax years remain subject to examination and adjustment by tax authorities.
The Funds’ risks include, but are not limited to, the following:
Derivatives Risk — The Funds’ use of derivatives and other similar instruments (collectively referred to in this paragraph as “derivatives”) may result in loss, including due to adverse market movements. Derivatives, which may pose risks in addition to and greater than those associated with investing directly in securities, currencies or other assets and instruments, may increase market exposure and be illiquid or less liquid, volatile, difficult to price and leveraged so that small changes in the value of the underlying assets or instruments may produce disproportionate losses to the Funds. Certain derivatives are also subject to counterparty risk, which is the risk that the other party in the transaction will not, or lacks the capacity or authority to, fulfill its contractual obligations, liquidity risk, which includes the risk that the Funds will not be able to exit the derivative when it is advantageous to do so, and risks arising from margin requirements, which include the risk that the Funds will be required to pay additional margin or set aside additional collateral to maintain open derivative positions. The use of derivatives is a highly specialized activity that involves investment techniques and risks different from those associated with investments in more traditional securities and instruments. Losses from derivatives can also result from a lack of correlation between changes in the value of derivative instruments and the portfolio assets (if any) being hedged.
Dividend-Paying Investments Risk — A Fund’s investments in dividend-paying securities could cause a Fund to underperform other funds. Securities that pay dividends, as a group, can fall out of favor with the market, causing such securities to underperform securities that do not pay dividends. Depending upon market conditions and political and legislative responses to such conditions, dividend-paying securities that meet a Fund’s investment criteria may not be widely available and/or may be highly concentrated in only a few market sectors. In addition, issuers that have paid regular dividends or distributions to shareholders may not continue to do so at the same level or at all in the future. This may limit the ability of a Fund to produce current income.
Energy Sector Risk — The Underlying MLP Fund concentrates its investments in the energy sector, and will therefore be susceptible to adverse economic, business, social, political, environmental, regulatory or other developments affecting that sector. The energy sector has historically experienced substantial price volatility. MLPs, energy infrastructure companies, and other companies operating in the energy sector are subject to specific risks, including, among others: fluctuations in commodity prices and/or interest rates; increased governmental or environmental regulation; reduced availability of natural gas or other commodities for transporting, processing, storing or delivering; declines in domestic or foreign production; slowdowns in new construction; extreme weather or other natural disasters; and threats of attack by terrorists on energy assets. Energy companies can be significantly affected by the supply of, and demand for, particular energy products (such as oil and natural gas), which may result in overproduction or underproduction. Additionally, changes in the regulatory environment for energy companies may adversely impact their profitability. Over time, depletion of natural gas reserves and other energy reserves may also affect the profitability of energy companies.
GOLDMAN SACHS DIVIDEND FOCUS FUNDS
|
Notes to Financial Statements (continued) October 31, 2024 |
|
|
9. OTHER RISKS (continued) |
Foreign and Emerging Countries Risk — Investing in foreign markets may involve special risks and considerations not typically associated with investing in the U.S. Foreign securities may be subject to risk of loss because of more or less foreign government regulation; less public information; less stringent investor protections; less stringent accounting, corporate governance, financial reporting and disclosure standards; and less economic, political and social stability in the countries in which a Fund invests. The imposition of sanctions, exchange controls (including repatriation restrictions), confiscation of assets and property, trade restrictions (including tariffs) and other government restrictions by the U.S. or other governments, or from problems in registration, settlement or custody, may also result in losses. The type and severity of sanctions and other similar measures, including counter sanctions and other retaliatory actions, that may be imposed could vary broadly in scope, and their impact is impossible to predict. For example, the imposition of sanctions and other similar measures could, among other things, cause a decline in the value and/or liquidity of securities issued by the sanctioned country or companies located in or economically tied to the sanctioned country and increase market volatility and disruption in the sanctioned country and throughout the world. Sanctions and other similar measures could limit or prevent a Fund from buying and selling securities (in the sanctioned country and other markets), significantly delay or prevent the settlement of securities transactions, and significantly impact a Fund’s liquidity and performance. Foreign risk also involves the risk of negative foreign currency exchange rate fluctuations, which may cause the value of securities denominated in such foreign currency (or other instruments through which a Fund has exposure to foreign currencies) to decline in value. Currency exchange rates may fluctuate significantly over short periods of time. To the extent that the Fund also invests in securities of issuers located in, or economically tied to, emerging markets, these risks may be more pronounced.
Interest Rate Risk — When interest rates increase, fixed income securities or instruments held by a Fund will generally decline in value. Long-term fixed income securities or instruments will normally have more price volatility because of this risk than short-term fixed income securities or instruments. A wide variety of market factors can cause interest rates to rise, including central bank monetary policy, rising inflation and changes in general economic conditions. Changing interest rates may have unpredictable effects on the markets, may result in heightened market volatility and may detract from Fund performance. In addition, changes in monetary policy may exacerbate the risks associated with changing interest rates. Funds with longer average portfolio durations will generally be more sensitive to changes in interest rates than funds with a shorter average portfolio duration. Fluctuations in interest rates may also affect the liquidity of fixed income securities and instruments held by the Funds. A sudden or unpredictable increase in interest rates may cause volatility in the market and may decrease the liquidity of a Fund’s investments, which would make it harder for the Fund to sell its investments at an advantageous time.
Investment Style Risk — Different investment styles (e.g., “growth”, “value” or “quantitative”) tend to shift in and out of favor depending upon market and economic conditions and investor sentiment. The Funds may outperform or underperform other funds that invest in similar asset classes but employ different investment styles.
Large Shareholder Transactions Risk — A Fund may experience adverse effects when certain large shareholders, such as other funds, institutional investors (including those trading by use of non-discretionary mathematical formulas), financial intermediaries (who may make investment decisions on behalf of underlying clients and/or include a Fund in their investment model), individuals, accounts and Goldman Sachs affiliates, purchase or redeem large amounts of shares of a Fund. Such large shareholder redemptions, which may occur rapidly or unexpectedly, may cause a Fund to sell portfolio securities at times when it would not otherwise do so, which may negatively impact a Fund’s NAV and liquidity. These transactions may also accelerate the realization of taxable income to shareholders if such sales of investments resulted in gains, and may also increase transaction costs. In addition, a large redemption could result in a Fund’s current expenses being allocated over a smaller asset base, leading to an increase in the Fund’s expense ratio. Similarly, large Fund share purchases may adversely affect a Fund’s performance to the extent that the Fund is delayed in investing new cash or otherwise maintains a larger cash position than it ordinarily would.
Loan-Related Investments Risk — In addition to risks generally associated with debt investments (e.g., interest rate risk and default risk), loan-related investments such as loan participations and assignments are subject to other risks. Although a loan obligation may be fully collateralized at the time of acquisition, the collateral may decline in value, be or become illiquid or less liquid, or lose all or substantially all of its value subsequent to investment. Many loan investments are subject to legal or
GOLDMAN SACHS DIVIDEND FOCUS FUNDS
|
|
9. OTHER RISKS (continued) |
contractual restrictions on resale and certain loan investments may be or become illiquid or less liquid and more difficult to value, particularly in the event of a downgrade of the loan or the borrower. There is less readily available, reliable information about most loan investments than is the case for many other types of securities. Substantial increases in interest rates may cause an increase in loan obligation defaults. With respect to loan participations, a Fund may not always have direct recourse against a borrower if the borrower fails to pay scheduled principal and/or interest; may be subject to greater delays, expenses and risks than if a Fund had purchased a direct obligation of the borrower; and may be regarded as the creditor of the agent lender (rather than the borrower), subjecting a Fund to the creditworthiness of that lender as well. Investors in loans, such as a Fund, may not be entitled to rely on the anti-fraud protections of the federal securities laws, although they may be entitled to certain contractual remedies. The market for loan obligations may be subject to irregular trading activity, wide bid/ask spreads and extended trade settlement periods. Because transactions in many loans are subject to extended trade settlement periods, a Fund may not receive the proceeds from the sale of a loan for a period after the sale. As a result, sale proceeds related to the sale of loans may not be available to make additional investments or to meet a Fund’s redemption obligations for a period after the sale of the loans, and, as a result, a Fund may have to sell other investments or engage in borrowing transactions, such as borrowing from its credit facility, if necessary to raise cash to meet its obligations.
Senior Loans hold the most senior position in the capital structure of a business entity, and are typically secured with specific collateral, but are nevertheless usually rated below investment grade. Because Second Lien Loans are subordinated or unsecured and thus lower in priority of payment to Senior Loans, they are subject to the additional risk that the cash flow of the borrower and property securing the loan or debt, if any, may be insufficient to meet scheduled payments after giving effect to the senior secured obligations of the borrower. Second Lien Loans generally have greater price volatility than Senior Loans and may be less liquid.
Market and Credit Risks — In the normal course of business, a Fund trades financial instruments and enters into financial transactions where risk of potential loss exists due to changes in the market (market risk). The value of the securities in which a Fund invests may go up or down in response to the prospects of individual companies, particular sectors or governments and/or general economic conditions throughout the world due to increasingly interconnected global economies and financial markets. Events such as war, military conflict, acts of terrorism, social unrest, natural disasters, recessions, inflation, rapid interest rate changes, supply chain disruptions, sanctions, the spread of infectious illness or other public health threats could also significantly impact a Fund and its investments. Additionally, a Fund may also be exposed to credit risk in the event that an issuer or guarantor fails to perform or that an institution or entity with which a Fund has unsettled or open transactions defaults.
Master Limited Partnership Risk — Investments in securities of MLPs involve risks that differ from investments in common stock, including risks related to limited control and limited rights to vote on matters affecting the MLP, risks related to potential conflicts of interest between the MLP and the MLP’s general partner, cash flow risks, dilution risks, limited liquidity and risks related to the general partner’s right to require unit-holders to sell their common units at an undesirable time or price.
Other Investments Risk — By investing in pooled investment vehicles (including investment companies and ETFs), partnerships and REITs indirectly through the Fund, investors will incur a proportionate share of the expenses of the other pooled investment vehicles, partnerships and REITs held by the Fund (including operating costs and investment management fees) in addition to the fees and expenses regularly borne by the Fund. In addition, the Fund will be affected by the investment policies, practices and performance of such investments in direct proportion to the amount of assets the Fund invests therein.
REIT Risk — Risks associated with investments in the real estate industry (such as REITs) include, among others: possible declines in the value of real estate; risks related to general and local economic conditions; possible lack of availability of mortgage financing, variations in rental income, neighborhood values or the appeal of property to tenants; interest rates; overbuilding; extended vacancies of properties; increases in competition, property taxes and operating expenses; and changes in zoning laws. REITs whose underlying properties are concentrated in a particular industry or geographic region are subject to risks affecting such industries and regions. The securities of REITs involve greater risks than those associated with larger, more established companies and may be subject to more abrupt or erratic price movements because of interest rate changes, economic conditions and other factors. Securities of such issuers may lack sufficient market liquidity to enable the Fund to effect sales at an advantageous time or without a substantial drop in price.
GOLDMAN SACHS DIVIDEND FOCUS FUNDS
|
Notes to Financial Statements (continued) October 31, 2024 |
Under the Trust’s organizational documents, its Trustees, officers, employees and agents are indemnified, to the extent permitted by the Act and state law, against certain liabilities that may arise out of performance of their duties to the Funds. Additionally, in the course of business, the Funds enter into contracts that contain a variety of indemnification clauses. The Funds’ maximum exposure under these arrangements is unknown, as this would involve future claims that may be made against the Funds that have not yet occurred. However, GSAM believes the risk of loss under these arrangements to be remote.
Subsequent events have been evaluated through the date of issuance, and GSAM has concluded that there is no impact requiring adjustment or disclosure in the financial statements.
GOLDMAN SACHS DIVIDEND FOCUS FUNDS
|
|
12. SUMMARY OF SHARE TRANSACTIONS |
Share activity is as follows:
| | | | | | | | | | | | | | | | |
| | | Income Builder Fund | |
| | |
| | | For the Fiscal Year Ended
October 31, 2024 | | | For the Fiscal Year Ended
October 31, 2023 | |
| |
| | | | |
| | | | |
| | | Shares | | | Dollars | | | Shares | | | Dollars | |
| |
| | | | |
| | | | |
Class A Shares | | | | | | | | | | | | | | | | |
| | | | |
Shares sold | | | 6,416,789 | | | $ | 159,267,163 | | | | 6,284,421 | | | $ | 145,538,546 | |
| | | | |
Reinvestment of distributions | | | 943,354 | | | | 23,369,388 | | | | 976,063 | | | | 22,453,866 | |
| | | | |
Shares redeemed | | | (5,679,352 | ) | | | (139,863,949 | ) | | | (5,937,056 | ) | | | (137,177,274 | ) |
|
| |
| | | | |
| | | 1,680,791 | | | | 42,772,602 | | | | 1,323,428 | | | | 30,815,138 | |
|
| |
| | | | |
Class C Shares | | | | | | | | | | | | | | | | |
| | | | |
Shares sold | | | 700,149 | | | | 16,898,684 | | | | 1,268,520 | | | | 28,776,292 | |
| | | | |
Reinvestment of distributions | | | 241,750 | | | | 5,849,651 | | | | 359,858 | | | | 8,117,740 | |
| | | | |
Shares redeemed | | | (2,895,077 | ) | | | (69,662,652 | ) | | | (4,195,252 | ) | | | (95,041,927 | ) |
|
| |
| | | | |
| | | (1,953,178 | ) | | | (46,914,317 | ) | | | (2,566,874 | ) | | | (58,147,895 | ) |
|
| |
| | | | |
Institutional Shares | | | | | | | | | | | | | | | | |
| | | | |
Shares sold | | | 9,590,638 | | | | 243,959,103 | | | | 10,150,095 | | | | 241,981,773 | |
| | | | |
Reinvestment of distributions | | | 1,510,564 | | | | 38,495,957 | | | | 1,709,722 | | | | 40,427,482 | |
| | | | |
Shares redeemed | | | (10,040,283 | ) | | | (252,435,228 | ) | | | (14,089,963 | ) | | | (333,770,466 | ) |
|
| |
| | | | |
| | | 1,060,919 | | | | 30,019,832 | | | | (2,230,146 | ) | | | (51,361,211 | ) |
|
| |
| | | | |
Investor Shares | | | | | | | | | | | | | | | | |
| | | | |
Shares sold | | | 5,928,131 | | | | 151,809,088 | | | | 6,601,610 | | | | 156,843,691 | |
| | | | |
Reinvestment of distributions | | | 748,869 | | | | 19,007,622 | | | | 826,651 | | | | 19,470,873 | |
| | | | |
Shares redeemed | | | (5,651,741 | ) | | | (143,645,451 | ) | | | (8,303,137 | ) | | | (197,593,917 | ) |
|
| |
| | | | |
| | | 1,025,259 | | | | 27,171,259 | | | | (874,876 | ) | | | (21,279,353 | ) |
|
| |
| | | | |
Class R6 Shares | | | | | | | | | | | | | | | | |
| | | | |
Shares sold | | | 456,858 | | | | 11,637,785 | | | | 516,748 | | | | 12,291,469 | |
| | | | |
Reinvestment of distributions | | | 70,328 | | | | 1,789,150 | | | | 77,227 | | | | 1,824,555 | |
| | | | |
Shares redeemed | | | (656,997 | ) | | | (16,595,051 | ) | | | (519,488 | ) | | | (12,372,105 | ) |
|
| |
| | | | |
| | | (129,811 | ) | | | (3,168,116 | ) | | | 74,487 | | | | 1,743,919 | |
|
| |
| | | | |
Class P Shares | | | | | | | | | | | | | | | | |
| | | | |
Shares sold | | | 102,147 | | | | 2,594,922 | | | | 103,382 | | | | 2,424,164 | |
| | | | |
Reinvestment of distributions | | | 47,804 | | | | 1,214,857 | | | | 71,002 | | | | 1,678,899 | |
| | | | |
Shares redeemed | | | (500,252 | ) | | | (12,508,488 | ) | | | (689,731 | ) | | | (16,203,369 | ) |
|
| |
| | | | |
| | | (350,301 | ) | | | (8,698,709 | ) | | | (515,347 | ) | | | (12,100,306 | ) |
|
| |
| | | | |
NET INCREASE (DECREASE) | | | 1,333,679 | | | $ | 41,182,551 | | | | (4,789,328 | ) | | $ | (110,329,708 | ) |
|
| |
GOLDMAN SACHS DIVIDEND FOCUS FUNDS
|
Notes to Financial Statements (continued) October 31, 2024 |
|
|
12. SUMMARY OF SHARE TRANSACTIONS (continued) |
| | | | | | | | | | | | | | | | |
| | | Rising Dividend Growth Fund | |
| | |
| | | For the Fiscal Year Ended
October 31, 2024 | | | For the Fiscal Year Ended
October 31, 2023 | |
| |
| | | | |
| | | | |
| | | Shares | | | Dollars | | | Shares | | | Dollars | |
| |
| | | | |
| | | | |
Class A Shares | | | | | | | | | | | | | | | | |
| | | | |
Shares sold | | | 1,421,161 | | | $ | 16,740,169 | | | | 2,574,820 | | | $ | 28,406,557 | |
| | | | |
Reinvestment of distributions | | | 1,483,628 | | | | 16,838,225 | | | | 3,079,478 | | | | 34,077,928 | |
| | | | |
Shares redeemed | | | (4,032,084 | ) | | | (48,005,773 | ) | | | (4,167,386 | ) | | | (46,472,959 | ) |
|
| |
| | | | |
| | | (1,127,295 | ) | | | (14,427,379 | ) | | | 1,486,912 | | | | 16,011,526 | |
|
| |
| | | | |
Class C Shares | | | | | | | | | | | | | | | | |
| | | | |
Shares sold | | | 158,357 | | | | 1,948,031 | | | | 321,089 | | | | 3,653,376 | |
| | | | |
Reinvestment of distributions | | | 136,025 | | | | 1,572,092 | | | | 481,266 | | | | 5,465,976 | |
| | | | |
Shares redeemed | | | (920,256 | ) | | | (11,286,066 | ) | | | (2,022,802 | ) | | | (22,756,374 | ) |
|
| |
| | | | |
| | | (625,874 | ) | | | (7,765,943 | ) | | | (1,220,447 | ) | | | (13,637,022 | ) |
|
| |
| | | | |
Institutional Shares | | | | | | | | | | | | | | | | |
| | | | |
Shares sold | | | 1,065,418 | | | | 13,703,716 | | | | 1,918,677 | | | | 22,797,525 | |
| | | | |
Reinvestment of distributions | | | 611,239 | | | | 7,557,278 | | | | 1,289,881 | | | | 15,376,979 | |
| | | | |
Shares redeemed | | | (2,249,292 | ) | | | (28,739,636 | ) | | | (2,450,303 | ) | | | (29,543,264 | ) |
|
| |
| | | | |
| | | (572,635 | ) | | | (7,478,642 | ) | | | 758,255 | | | | 8,631,240 | |
|
| |
| | | | |
Investor Shares | | | | | | | | | | | | | | | | |
| | | | |
Shares sold | | | 640,820 | | | | 8,129,852 | | | | 1,163,836 | | | | 13,855,691 | |
| | | | |
Reinvestment of distributions | | | 394,027 | | | | 4,848,069 | | | | 821,538 | | | | 9,770,714 | |
| | | | |
Shares redeemed | | | (2,198,160 | ) | | | (28,316,907 | ) | | | (1,319,182 | ) | | | (15,734,805 | ) |
|
| |
| | | | |
| | | (1,163,313 | ) | | | (15,338,986 | ) | | | 666,192 | | | | 7,891,600 | |
|
| |
| | | | |
Class R6 Shares | | | | | | | | | | | | | | | | |
| | | | |
Shares sold | | | 76,419 | | | | 989,911 | | | | 471,388 | | | | 5,609,148 | |
| | | | |
Reinvestment of distributions | | | 35,950 | | | | 443,859 | | | | 44,152 | | | | 525,668 | |
| | | | |
Shares redeemed | | | (159,385 | ) | | | (2,042,227 | ) | | | (218,326 | ) | | | (2,547,304 | ) |
|
| |
| | | | |
| | | (47,016 | ) | | | (608,457 | ) | | | 297,214 | | | | 3,587,512 | |
|
| |
| | | | |
Class R Shares | | | | | | | | | | | | | | | | |
| | | | |
Shares sold | | | 15,218 | | | | 179,337 | | | | 24,490 | | | | 274,210 | |
| | | | |
Reinvestment of distributions | | | 8,225 | | | | 92,356 | | | | 18,087 | | | | 198,856 | |
| | | | |
Shares redeemed | | | (42,793 | ) | | | (506,693 | ) | | | (41,950 | ) | | | (444,360 | ) |
|
| |
| | | | |
| | | (19,350 | ) | | | (235,000 | ) | | | 627 | | | | 28,706 | |
|
| |
| | | | |
Class P Shares | | | | | | | | | | | | | | | | |
| | | | |
Shares sold | | | 137,145 | | | | 1,731,285 | | | | 39,760 | | | | 489,777 | |
| | | | |
Reinvestment of distributions | | | 73,047 | | | | 902,309 | | | | 184,084 | | | | 2,194,942 | |
| | | | |
Shares redeemed | | | (408,984 | ) | | | (5,299,144 | ) | | | (354,885 | ) | | | (4,292,647 | ) |
|
| |
| | | | |
| | | (198,792 | ) | | | (2,665,550 | ) | | | (131,041 | ) | | | (1,607,928 | ) |
|
| |
| | | | |
NET INCREASE (DECREASE) | | | (3,754,275 | ) | | $ | (48,519,957 | ) | | | 1,857,712 | | | $ | 20,905,634 | |
|
| |
Report of Independent Registered Public Accounting Firm
To the Board of Trustees of Goldman Sachs Trust and Shareholders of Goldman Sachs Income Builder Fund and Goldman Sachs Rising Dividend Growth Fund
Opinions on the Financial Statements
We have audited the accompanying statements of assets and liabilities, including the schedules of investments, of Goldman Sachs Income Builder Fund and Goldman Sachs Rising Dividend Growth Fund (two of the funds constituting Goldman Sachs Trust, hereafter collectively referred to as the “Funds”) as of October 31, 2024, the related statements of operations for the year ended October 31, 2024, the statements of changes in net assets for each of the two years in the period ended October 31, 2024, including the related notes, and the financial highlights for each of the five years in the period ended October 31, 2024 (collectively referred to as the “financial statements”). In our opinion, the financial statements present fairly, in all material respects, the financial position of each of the Funds as of October 31, 2024, the results of each of their operations for the year then ended, the changes in each of their net assets for each of the two years in the period ended October 31, 2024 and each of the financial highlights for each of the five years in the period ended October 31, 2024 in conformity with accounting principles generally accepted in the United States of America.
Basis for Opinions
These financial statements are the responsibility of the Funds’ management. Our responsibility is to express an opinion on the Funds’ financial statements based on our audits. We are a public accounting firm registered with the Public Company Accounting Oversight Board (United States) (PCAOB) and are required to be independent with respect to the Funds in accordance with the U.S. federal securities laws and the applicable rules and regulations of the Securities and Exchange Commission and the PCAOB.
We conducted our audits of these financial statements in accordance with the standards of the PCAOB. Those standards require that we plan and perform the audit to obtain reasonable assurance about whether the financial statements are free of material misstatement, whether due to error or fraud.
Our audits included performing procedures to assess the risks of material misstatement of the financial statements, whether due to error or fraud, and performing procedures that respond to those risks. Such procedures included examining, on a test basis, evidence regarding the amounts and disclosures in the financial statements. Our audits also included evaluating the accounting principles used and significant estimates made by management, as well as evaluating the overall presentation of the financial statements. Our procedures included confirmation of securities owned as of October 31, 2024 by correspondence with the custodian, transfer agent, agent banks and brokers; when replies were not received from agent banks or brokers, we performed other auditing procedures. We believe that our audits provide a reasonable basis for our opinions.
/s/ PricewaterhouseCoopers LLP
Boston, Massachusetts
December 20, 2024
We have served as the auditor of one or more investment companies in the Goldman Sachs fund complex since 2000.
GOLDMAN SACHS DIVIDEND FOCUS FUNDS
Statement Regarding Basis for Approval of Management Agreement (Unaudited)
Background
The Goldman Sachs Income Builder Fund and Goldman Sachs Rising Dividend Growth Fund (the “Funds”) are investment portfolios of Goldman Sachs Trust (the “Trust”). The Board of Trustees oversees the management of the Trust and reviews the investment performance and expenses of the Funds at regularly scheduled meetings held throughout the year. In addition, the Board of Trustees determines annually whether to approve the continuance of the Trust’s investment management agreement (the “Management Agreement”) with Goldman Sachs Asset Management, L.P. (the “Investment Adviser”) on behalf of the Funds.
The Management Agreement was most recently approved for continuation until June 30, 2025 by the Board of Trustees, including those Trustees who are not parties to the Management Agreement or “interested persons” (as defined in the Investment Company Act of 1940, as amended) of any party thereto (the “Independent Trustees”), at a meeting held on June 11-12, 2024 (the “Annual Meeting”).
The review process undertaken by the Trustees spans the course of the year and culminates with the Annual Meeting. To assist the Trustees in their deliberations, the Trustees have established a Contract Review Committee (the “Committee”), comprised of the Independent Trustees. The Committee held two meetings over the course of the year since the Management Agreement was last approved. At those Committee meetings, regularly scheduled Board or other committee meetings, and/or the Annual Meeting, matters relevant to the renewal of the Management Agreement were considered by the Board, or the Independent Trustees, as applicable. With respect to each Fund, such matters included:
| | (a) | the nature and quality of the advisory, administrative, and other services provided to the Fund by the Investment Adviser and its affiliates, including information about: |
| | (i) | the structure, staff, and capabilities of the Investment Adviser and its portfolio management teams; |
| | (ii) | the groups within the Investment Adviser and its affiliates that support the portfolio management teams or provide other types of necessary services, including fund services groups (e.g., accounting and financial reporting, tax, shareholder services, and operations); controls and risk management groups (e.g., legal, compliance, valuation oversight, credit risk management, internal audit, compliance testing, market risk analysis, finance, and central funding); sales and distribution support groups, and others (e.g., information technology and training); |
| | (iii) | trends in employee headcount; |
| | (iv) | the Investment Adviser’s financial resources and ability to hire and retain talented personnel and strengthen its operations; and |
| | (v) | the parent company’s support of the Investment Adviser and its mutual fund business, as expressed by the firm’s senior management; |
| | (b) | information on the investment performance of the Fund, including comparisons to the performance of similar mutual funds, as provided by a third-party mutual fund data provider engaged as part of the contract review process (the “Outside Data Provider”), and a benchmark performance index; and information on general investment outlooks in the markets in which the Fund invests; |
| | (c) | information provided by the Investment Adviser indicating the Investment Adviser’s views on whether the Fund’s peer group and/or benchmark index had high, medium, or low relevance given the Fund’s particular investment strategy; |
| | (d) | the terms of the Management Agreement and other agreements with affiliated service providers entered into by the Trust on behalf of the Fund; |
| | (e) | fee and expense information for the Fund, including: |
| | (i) | the relative management fee and expense levels of the Fund as compared to those of comparable funds managed by other advisers, as provided by the Outside Data Provider; |
| | (ii) | the Fund’s expense trends over time; and |
| | (iii) | to the extent the Investment Adviser manages other types of accounts (such as bank collective trusts, private wealth management accounts, institutional separate accounts, sub-advised mutual funds, and non-U.S. funds) having investment objectives and policies similar to those of the Fund, comparative information on the advisory fees charged and services provided to those accounts by the Investment Adviser; |
| | (f) | with respect to the extensive investment performance and expense comparison data provided by the Outside Data Provider, its processes in producing that data for the Fund; |
| | (g) | the undertakings of the Investment Adviser and its affiliates to implement fee waivers and/or expense limitations; |
| | (h) | information relating to the profitability of the Management Agreement and the transfer agency and distribution and service arrangements of the Fund to the Investment Adviser and its affiliates; |
| | (i) | whether the Fund’s existing management fee schedule adequately addressed any economies of scale; |
| | (j) | a summary of the “fall-out” benefits derived by the Investment Adviser and its affiliates from their relationships with the Fund, including the fees received by the Investment Adviser’s affiliates from the Fund for transfer agency, securities lending (with respect to the Rising Dividend Growth Fund), portfolio trading, distribution and other services; |
| | (k) | a summary of potential benefits derived by the Fund as a result of its relationship with the Investment Adviser; |
GOLDMAN SACHS DIVIDEND FOCUS FUNDS
Statement Regarding Basis for Approval of Management Agreement (Unaudited) (continued)
| | (l) | information regarding commissions paid by the Fund and broker oversight, an update on the Investment Adviser’s soft dollars practices, other information regarding portfolio trading, and how the Investment Adviser carries out its duty to seek best execution; |
| | (m) | portfolio manager ownership of Fund shares; the manner in which portfolio manager compensation is determined; and the number and types of accounts managed by the portfolio managers; |
| | (n) | the nature and quality of the services provided to the Fund by its unaffiliated service providers, and the Investment Adviser’s general oversight and evaluation (including reports on due diligence) of those service providers as part of the administrative services provided under the Management Agreement; and |
| | (o) | the Investment Adviser’s processes and policies addressing various types of potential conflicts of interest; its approach to risk management; the annual review of the effectiveness of the Fund’s compliance program; and periodic compliance reports. |
The Trustees also received an overview of the Funds’ distribution arrangements. They received information regarding the Funds’ assets, share purchase and redemption activity, and payment of distribution and service fees. Information was also provided to the Trustees relating to revenue sharing payments made by and services provided by the Investment Adviser and its affiliates to intermediaries that promote the sale, distribution, and/or servicing of Fund shares. The Independent Trustees also discussed the broad range of other investment choices that are available to Fund investors, including the availability of comparable funds managed by other advisers.
The presentations made at the Board and Committee meetings and at the Annual Meeting encompassed the Funds and other mutual funds for which the Board of Trustees has responsibility. In evaluating the Management Agreement at the Annual Meeting, the Trustees relied upon their knowledge, resulting from their meetings and other interactions throughout the year, of the Investment Adviser and its affiliates, their services, and the Funds. In conjunction with these meetings, the Trustees received written materials and oral presentations on the topics covered, and the Investment Adviser addressed the questions and concerns of the Trustees, including concerns regarding the investment performance of certain of the funds they oversee. The Independent Trustees were advised by their independent legal counsel regarding their responsibilities and other regulatory requirements related to the approval and continuation of mutual fund investment management agreements under applicable law. In addition, the Investment Adviser and its affiliates provided the Independent Trustees with a written response to a formal request for information sent on behalf of the Independent Trustees by their independent legal counsel. During the course of their deliberations, the Independent Trustees met in executive sessions with their independent legal counsel, without representatives of the Investment Adviser or its affiliates present.
Nature, Extent, and Quality of the Services Provided Under the Management Agreement
As part of their review, the Trustees considered the nature, extent, and quality of the services provided to the Funds by the Investment Adviser. In this regard, the Trustees considered both the investment advisory services and non-advisory services that are provided by the Investment Adviser and its affiliates. The Trustees noted the Investment Adviser’s commitment to maintaining high quality systems and expending substantial resources to respond to ongoing changes to the market, regulatory and control environment in which the Funds and their service providers operate, including developments associated with geopolitical events and economic sanctions, as well as the efforts of the Investment Adviser and its affiliates to combat cyber security risks. They also noted the transition in the leadership and changes in personnel of various of the Investment Adviser’s portfolio management teams that had occurred in recent periods, and the ongoing recruitment efforts aimed at bringing high quality investment talent to the Investment Adviser. The Trustees also considered information regarding the Investment Adviser’s efforts relating to business continuity planning. The Trustees concluded that the Investment Adviser continued to commit substantial financial and operational resources to the Funds and expressed confidence that the Investment Adviser would continue to do so in the future. The Trustees also recognized that the Investment Adviser had made significant commitments to address regulatory compliance requirements applicable to the Funds and the Investment Adviser and its affiliates.
Investment Performance
The Trustees also considered the investment performance of the Funds. In this regard, they compared the investment performance of each Fund to its peers using rankings and ratings compiled by the Outside Data Provider as of December 31, 2023, and updated performance information prepared by the Investment Adviser using the peer group identified by the Outside Data Provider as of March 31, 2024. The information on each Fund’s investment performance was provided for the one-, three-, five-, and ten-year periods ending on the applicable dates. The Trustees also reviewed each Fund’s investment performance relative to its performance benchmark. As part of this review, they considered the investment performance trends of the Funds over time, and reviewed the investment performance of each Fund in light of its investment objective and policies and market conditions. In
GOLDMAN SACHS DIVIDEND FOCUS FUNDS
Statement Regarding Basis for Approval of Management Agreement (Unaudited) (continued)
addition, the Trustees considered materials prepared and presentations made by the Investment Adviser’s senior management and portfolio management personnel in which Fund performance was assessed. The Trustees also considered the Investment Adviser’s periodic reports with respect to the Funds’ risk profiles, and how the Investment Adviser’s approach to risk monitoring and management influences portfolio management. They noted the efforts of the Rising Dividend Growth Fund’s portfolio management team to continue to enhance the investment models used in managing the Fund.
The Trustees observed that the Rising Dividend Growth Fund’s Institutional Shares had placed in the top half of the Fund’s peer group for the three-year period, in the third quartile for the five-year period, and in the fourth quartile for the one- and ten-year periods, and had outperformed the Fund’s benchmark index for the three-year period and underperformed for the one-, five-, and ten-year periods ended March 31, 2024. They noted that the Investment Adviser’s Quantitative Investment Strategies Team manages a portion of the Rising Dividend Growth Fund’s portfolio (the “10/10 Strategy”) and that they had approved the re-assignment of the portion of the Fund’s portfolio that invests in energy infrastructure companies (the “Energy Infrastructure Strategy”) from the Fund’s former sub-adviser to the Investment Adviser’s Energy and Infrastructure Team in 2020. The Trustees observed that the Investment Adviser’s Multi-Asset Solutions team manages allocations between the “10/10 Strategy” and the Energy Infrastructure Strategy. They noted that the Rising Dividend Growth Fund’s peer group (Large Blend) and benchmark (the S&P 500 Index) were broad-based, whereas the Fund focused on dividend-paying stocks. The Trustees recalled that the Rising Dividend Growth Fund’s predecessor had commenced operations in March 2004 and had been reorganized into the Fund as a series of the Trust in February 2012. The Trustees observed that the Income Builder Fund’s Institutional Shares had placed in the top half of the Fund’s peer group for the one-, three-, five-, and ten-year periods, and had outperformed the Fund’s benchmark index for the five-year period and underperformed for the one-, three-, and ten-year periods ended March 31, 2024. They noted that the Income Builder Fund had experienced certain portfolio management changes in 2022.
Costs of Services Provided and Competitive Information
The Trustees considered the contractual terms of the Management Agreement and the fee rates payable by each Fund thereunder. In this regard, the Trustees considered information on the services rendered by the Investment Adviser to the Funds, which included both advisory and administrative services that were directed to the needs and operations of the Funds as registered mutual funds.
In particular, the Trustees reviewed analyses prepared by the Outside Data Provider regarding the expense rankings of the Funds. The analyses provided a comparison of each Fund’s management fee and breakpoints to those of a relevant peer group and category universe; an expense analysis which compared each Fund’s overall net and gross expenses to a peer group and a category universe; and data comparing each Fund’s net expenses to the peer and category medians. The analyses also compared each Fund’s other expenses and fee waivers/reimbursements to those of the peer group and category medians. The Trustees concluded that the comparisons provided by the Outside Data Provider were useful in evaluating the reasonableness of the management fees and total expenses paid by the Funds.
In addition, the Trustees considered the Investment Adviser’s undertakings to implement fee waivers and/or expense limitations. They also considered, to the extent that the Investment Adviser manages other types of accounts having investment objectives and policies similar to those of the Funds, comparative fee information for services provided by the Investment Adviser to those accounts, and information that indicated that services provided to the Funds differed in various significant respects from the services provided to other types of accounts which, in many cases, operated under less stringent legal and regulatory structures, required fewer services from the Investment Adviser to a smaller number of client contact points, and were less time-intensive.
In addition, the Trustees noted that shareholders are able to redeem their shares at any time if shareholders believe that the Fund fees and expenses are too high or if they are dissatisfied with the performance of the Fund.
Profitability
The Trustees reviewed each Fund’s contribution to the Investment Adviser’s revenues and pre-tax profit margins. In this regard the Trustees noted that they had received, among other things, profitability analyses and summaries, revenue and expense schedules by Fund and by function (i.e., investment management, transfer agency and distribution and service), and information on the Investment Adviser’s expense allocation methodology. They observed that the profitability and expense figures are substantially similar to those used by the Investment Adviser for many internal purposes, including compensation decisions among various business groups, and are thus subject to a vigorous internal debate about how certain revenue and expenses should be allocated. The Trustees also noted that the internal audit group within the Goldman Sachs organization periodically audits the expense allocation methodology and that the internal audit group was satisfied with the reasonableness, consistency, and accuracy of the Investment Adviser’s expense allocation methodology. Profitability data for each Fund was provided for 2023 and 2022, and the Trustees considered this information in relation to the Investment Adviser’s overall profitability.
GOLDMAN SACHS DIVIDEND FOCUS FUNDS
Statement Regarding Basis for Approval of Management Agreement (Unaudited) (continued)
Economies of Scale
The Trustees considered the information that had been provided regarding whether there have been economies of scale with respect to the management of the Funds. The Trustees also considered the breakpoints in the fee rate payable under the Management Agreement for each of the Funds at the following annual percentage rates of the average daily net assets of the Funds:
| | | | |
| | | Income Builder | | Rising Dividend |
| Average Daily Net Assets | | Fund | | Growth Fund |
|
|
| | |
First $1 billion | | 0.54% | | 0.75% |
| | |
Next $1 billion | | 0.49 | | 0.68 |
| | |
Next $3 billion | | 0.46 | | 0.64 |
| | |
Next $3 billion | | 0.45 | | 0.63 |
| | |
Over $8 billion | | 0.44 | | 0.62 |
The Trustees noted that the breakpoints were designed to share potential economies of scale, if any, with the Funds and their shareholders as assets under management reach those asset levels. The Trustees considered the amounts of assets in the Funds; the Funds’ recent share purchase and redemption activity; the information provided by the Investment Adviser relating to the costs of the services provided by the Investment Adviser and its affiliates and their realized profits; information comparing fee rates charged by the Investment Adviser with fee rates charged to other funds in the peer groups; and the Investment Adviser’s undertakings to waive a portion of its management fee and to limit certain expenses of the Funds that exceed specified levels, as well as Goldman Sachs & Co. LLC’s (“Goldman Sachs”) undertaking to waive a portion of the transfer agency fees paid by the Rising Dividend Growth Fund’s Class A, Class C, Investor and Class R Shares. Upon reviewing these matters at the Annual Meeting, the Trustees concluded that the fee breakpoints represented a means of assuring that benefits of scalability, if any, would be passed along to shareholders at the specified asset levels. They also noted that the Investment Adviser had passed along savings to shareholders of the Income Builder Fund, which had asset levels above at least the first breakpoint during the prior fiscal year.
Other Benefits to the Investment Adviser and Its Affiliates
The Trustees also considered the other benefits derived by the Investment Adviser and its affiliates from their relationships with the Funds as stated above, including: (a) transfer agency fees received by Goldman Sachs; (b) brokerage and futures commissions earned by Goldman Sachs for executing securities and futures transactions on behalf of the Funds; (c) research received by the Investment Adviser from broker-dealers in exchange for executing certain transactions on behalf of the Funds; (d) trading efficiencies resulting from aggregation of orders of the Funds with those for other funds or accounts managed by the Investment Adviser; (e) fees earned by Goldman Sachs Agency Lending (“GSAL”), an affiliate of the Investment Adviser, as securities lending agent for the Rising Dividend Growth Fund (and fees earned by the Investment Adviser for managing the fund in which the Funds’ securities lending cash collateral is invested); (f) the Investment Adviser’s ability to leverage the infrastructure designed to service the Funds on behalf of its other clients; (g) the Investment Adviser’s ability to cross-market other products and services to Fund shareholders; (h) Goldman Sachs’ retention of certain fees as Fund Distributor; (i) the Investment Adviser’s ability to negotiate better pricing with custodians on behalf of its other clients, as a result of the relationship with the Funds; (j) the investment of cash and cash collateral in money market funds managed by the Investment Adviser that will result in increased assets under management for those money market funds; (k) the investment in exchange-traded funds (“ETFs”) managed by the Investment Adviser that will result in increased assets under management for those ETFs and may facilitate the development of the Investment Adviser’s ETF advisory business; and (l) the possibility that the working relationship between the Investment Adviser and the Funds’ third-party service providers may cause those service providers to be more likely to do business with other areas of Goldman Sachs. In the course of considering the foregoing, the Independent Trustees requested and received further information quantifying certain of these fall-out benefits.
Other Benefits to the Funds and Their Shareholders
The Trustees also noted that the Funds receive certain other potential benefits as a result of their relationship with the Investment Adviser, including: (a) trading efficiencies resulting from aggregation of orders of the Funds with those of other funds or accounts managed by the Investment Adviser; (b) enhanced servicing from vendors due to the volume of business generated by the Investment Adviser and its affiliates; (c) enhanced servicing from broker-dealers due to the volume of business generated by the Investment Adviser and its affiliates; (d) the Investment Adviser’s ability to negotiate favorable terms with derivatives counterparties on behalf of the Funds as a result of the size and reputation of the Goldman Sachs organization; (e) the advantages received from the Investment Adviser’s knowledge and experience gained from managing other accounts and products; (f) the Investment Adviser’s ability to hire and retain qualified personnel to provide services to the Funds because of the reputation of the
GOLDMAN SACHS DIVIDEND FOCUS FUNDS
Statement Regarding Basis for Approval of Management Agreement (Unaudited) (continued)
Goldman Sachs organization; (g) the Funds’ access, through the Investment Adviser, to certain firm-wide resources (e.g., proprietary risk management systems and databases), subject to certain restrictions; (h) the Rising Dividend Growth Fund’s ability to participate in the securities lending program administered by GSAL, as measured by the revenue received by the Funds in connection with the program; and (i) the Funds’ access to certain affiliated distribution channels. In addition, the Trustees noted the competitive nature of the mutual fund marketplace, and considered that many of the Funds’ shareholders invested in the Funds in part because of the Funds’ relationship with the Investment Adviser and that those shareholders have a general expectation that the relationship will continue.
Conclusion
In connection with their consideration of the Management Agreement, the Trustees gave weight to each of the factors described above, but did not identify any particular factor as controlling their decision. After deliberation and consideration of all of the information provided, including the factors described above, the Trustees concluded, in the exercise of their business judgment, that the management fees paid by each of the Funds were reasonable in light of the services provided to it by the Investment Adviser, the Investment Adviser’s costs and each Fund’s current and reasonably foreseeable asset levels. The Trustees unanimously concluded that the Investment Adviser’s continued management likely would benefit each Fund and its shareholders and that the Management Agreement should be approved and continued with respect to each Fund until June 30, 2025.
Goldman Sachs Trust – Dividend Focus Funds - Tax Information (Unaudited)
For the year ended October 31, 2024, 18.08% and 34.64% of the dividends paid from net investment company taxable income by the Income Builder Fund and Rising Dividend Growth Fund, respectively, qualify for the dividends received deduction available to corporations.
For the year ended October 31, 2024, 26.83% and 56.45% of the dividends paid from net investment company taxable income by the Income Builder Fund and Rising Dividend Growth Fund, respectively, qualify for the reduced tax rate under the Jobs and Growth Tax Relief and Reconciliation Act of 2003.
Pursuant to Section 852 of the Internal Revenue Code, the Income Builder Fund and Rising Dividend Growth Fund designate $613,010 and $26,709,475, or if different, the maximum amount allowable, as capital gain dividends paid during the fiscal year ended October 31, 2024.
For the year ended October 31, 2024, 1.29% and 2.38% of the dividends paid from net investment company taxable income by the Income Builder Fund and Rising Dividend Growth Fund, respectively, qualify as section 199A dividends.
During the fiscal year ended October 31, 2024, the Rising Dividend Growth Fund designates $1,175,772 as short-term capital gain dividends pursuant to Section 871(k) of the Internal Revenue Code.
For the fiscal year ended October 31, 2024, the Income Builder Fund designates 74.37% of the dividends paid from net investment company taxable income as section 163(j) Interest Dividends.
TRUSTEES Gregory G. Weaver, Chair Cheryl K. Beebe Dwight L. Bush Kathryn A. Cassidy John G. Chou Joaquin Delgado Eileen H. Dowling Lawrence Hughes John F. Killian Steven D. Krichmar Michael Latham James A. McNamara Lawrence W. Stranghoener PaulC.Wirth GOLDMAN SACHS & CO. LLC Distributor and Transfer Agent GOLDMAN SACHS ASSET MANAGEMENT, L.P. Investment Adviser 200 West Street, New York, New York 10282 OFFICERS James A. McNamara, President Joseph F. DiMaria, Principal Financial Officer, Principal Accounting Officer and Treasurer Robert Griffith, Secretary © 2024 Goldman Sachs. All rights reserved. DIVFOAR-24
| ITEM 8. | CHANGES IN AND DISAGREEMENTS WITH ACCOUNTANTS FOR OPEN-END MANAGEMENT INVESTMENT COMPANIES. |
Not applicable.
| ITEM 9. | PROXY DISCLOSURES FOR OPEN-END MANAGEMENT INVESTMENT COMPANIES. |
Not applicable.
| ITEM 10. | REMUNERATION PAID TO DIRECTORS, OFFICERS, AND OTHERS OF OPEN-END MANAGEMENT INVESTMENT COMPANIES. |
The aggregate remuneration paid to the Funds’ trustees, officers and others, if any, is included in Item 7 of this report.
| ITEM 11. | STATEMENT REGARDING BASIS FOR APPROVAL OF INVESTMENT ADVISORY CONTRACT. |
The Funds’ statement regarding the basis for approval of their investment advisory contract is included in Item 7 of this report.
| ITEM 12. | DISCLOSURE OF PROXY VOTING POLICIES AND PROCEDURES FOR CLOSED-END MANAGEMENT INVESTMENT COMPANIES. |
Not applicable.
| ITEM 13. | PORTFOLIO MANAGERS OF CLOSED-END MANAGEMENT INVESTMENT COMPANIES. |
Not applicable.
| ITEM 14. | PURCHASES OF EQUITY SECURITIES BY CLOSED-END MANAGEMENT INVESTMENT COMPANY AND AFFILIATED PURCHASERS. |
Not applicable.
| ITEM 15. | SUBMISSION OF MATTERS TO A VOTE OF SECURITY HOLDERS. |
There have been no material changes to the procedures by which shareholders may recommend nominees to the registrant’s board of trustees.
| ITEM 16. | CONTROLS AND PROCEDURES. |
| | (a) | The registrant’s principal executive and principal financial officers, or persons performing similar functions, have concluded that the registrant’s disclosure controls and procedures (as defined in Rule 30a-3(c) under the Investment Company Act of 1940, as amended (the “1940 Act”)) are effective as of a date within 90 days of the filing of this report that includes the disclosure required by this paragraph, based on the evaluation of these controls and procedures required by Rule 30a-3(b) under the 1940 Act and 15d-15(b) under the Securities Exchange Act of 1934, as amended. |
| | (b) | There were no changes in the registrant’s internal control over financial reporting (as defined in Rule 30a-3(d) under the 1940 Act) that occurred during the period covered by this report that have materially affected, or are reasonably likely to materially affect, the registrant’s internal control over financial reporting. |
| ITEM 17. | DISCLOSURE OF SECURITIES LENDING ACTIVITIES FOR CLOSED-END MANAGEMENT INVESTMENT COMPANIES. |
Not applicable.
| ITEM 18. | RECOVERY OF ERRONEOUSLY AWARDED COMPENSATION. |
SIGNATURES
Pursuant to the requirements of the Securities Exchange Act of 1934 and the Investment Company Act of 1940, the registrant has duly caused this report to be signed on its behalf by the undersigned, thereunto duly authorized.
| | | | |
| | | | Goldman Sachs Trust |
| | |
| By: | | | | /s/ James A. McNamara |
| | |
| | | | James A. McNamara |
| | | | President/Chief Executive Officer |
| | | | Goldman Sachs Trust |
| | |
| Date: | | | | January 3, 2025 |
Pursuant to the requirements of the Securities Exchange Act of 1934 and the Investment Company Act of 1940, this report has been signed below by the following persons on behalf of the registrant and in the capacities and on the dates indicated.
| | | | |
| | |
| By: | | | | /s/ James A. McNamara |
| | |
| | | | James A. McNamara |
| | | | President/Chief Executive Officer |
| | | | Goldman Sachs Trust |
| | |
| Date: | | | | January 3, 2025 |
| | |
| By: | | | | /s/ Joseph F. DiMaria |
| | |
| | | | Joseph F. DiMaria |
| | | | Principal Financial Officer |
| | | | Goldman Sachs Trust |
| | |
| Date: | | | | January 3, 2025 |