UNITED STATES
SECURITIES AND EXCHANGE COMMISSION
WASHINGTON, D.C. 20549
FORM N-CSR
CERTIFIED SHAREHOLDER REPORT OF REGISTERED MANAGEMENT
INVESTMENT COMPANIES
Investment Company Act file number 811-5360
Oppenheimer Main Street Funds
(Exact name of registrant as specified in charter)
6803 South Tucson Way, Centennial, Colorado 80112-3924
(Address of principal executive offices) (Zip code)
Arthur S. Gabinet
OFI Global Asset Management, Inc.
225 Liberty Street, New York, New York 10281-1008
(Name and address of agent for service)
Registrant’s telephone number, including area code: (303) 768-3200
Date of fiscal year end: August 31
Date of reporting period: 8/31/2015
Item 1. Reports to Stockholders.
Table of Contents
Class A Shares
AVERAGE ANNUAL TOTAL RETURNS AT 8/31/15
| | | | | | |
| | | Class A Shares of the Fund | | |
| | | Without Sales Charge | | With Sales Charge | | S&P 500 Index |
1-Year | | 0.99% | | -4.82% | | 0.48% |
|
5-Year | | 15.04 | | 13.69 | | 15.87 |
|
10-Year | | 6.66 | | 6.03 | | 7.15 |
|
Performance data quoted represents past performance, which does not guarantee future results. The investment return and principal value of an investment in the Fund will fluctuate so that an investor’s shares, when redeemed, may be worth more or less than their original cost. Fund returns include changes in share price, reinvested distributions, and a 5.75% maximum applicable sales charge except where “without sales charge” is indicated. Current performance may be lower or higher than the performance quoted. Returns do not consider capital gains or income taxes on an individual’s investment. For performance data current to the most recent month-end, visit oppenheimerfunds.com or call 1.800.CALL OPP (225.5677).
| | | | | | |
| | | | 2 OPPENHEIMER MAIN STREET FUND | | |
Fund Performance Discussion
The Fund’s Class A shares (without sales charge) produced a total return of 0.99% during the reporting period. On a relative basis, the Fund outperformed its benchmark, the S&P 500 Index (the “Index”), which returned 0.48% during the reporting period. The Fund outperformed the Index within the health care, materials and information technology sectors, due primarily to stronger relative stock selection. The Fund underperformed in the industrials and energy sectors as a result of less favorable stock selection.
MARKET OVERVIEW
In 2014, growth in the U.S. continued at a higher pace than any other developed economy and employment gains remained positive. Growth in the rest of the world was subdued, however, with major developed economies like the Eurozone and Japan continuing to disappoint due to weak aggregate demand. The biggest surprise of the reporting period and possibly all of 2014 was the precipitous fall in the price of crude oil. Weak demand amid tepid global growth was responsible for part of the drop, but
significantly, the U.S. energy revolution is increasingly helping to insulate global and domestic energy supplies from shocks in the Middle East and elsewhere.
The start of 2015 was marked by cooling U.S. growth after the positive results in 2014. The dollar continued to strengthen significantly during this time against most of the U.S.’s major trading partners, which acted as a drag on growth. Businesses, especially U.S. firms with revenues dependent on exporting goods
COMPARISON OF CHANGE IN VALUE OF $10,000 HYPOTHETICAL INVESTMENTS IN:
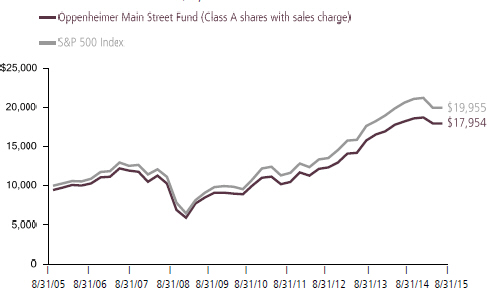
3 OPPENHEIMER MAIN STREET FUND
and services, cited this as a headwind. European Central Bank (“ECB”) President Mario Draghi announced the purchase of €60 billion a month in sovereign bonds from Eurozone countries for at least 19 months, a form of quantitative easing (“QE”) that is projected to increase the ECB’s balance sheet by over €1 trillion. The announcement and implementation of these extraordinary monetary policies had a significant impact on financial markets, with European markets rallying and the euro falling against most major trading partners. The Fed appeared to remain on track to raise U.S. rates during 2015, but made it clear that it will remain flexible on the timing and extent of rate hikes. In the closing months of the reporting period, concerns re-emerged around Greece’s debt situation and the possibility that the country would exit from the Eurozone. However, Eurozone leaders agreed to offer Greece a third bailout, averting a Greek exit for the time being. Fears around slowing growth in China also spooked investors. As a result, equity markets saw a spike in volatility and fell sharply in August of 2015.
FUND REVIEW
Top contributing holdings this reporting period included Vulcan Materials, Allergan (previously named Actavis) and Mondelez International. Shares of Vulcan Materials, a provider of aggregates, delivered strong results as construction demand continued to improve. Additionally, management issued
an optimistic outlook for the company’s growth over the next several years, which resulted in rising investor sentiment. During the reporting period, specialty pharmaceutical company Actavis, with exposure to both generic and branded drugs, continued to augment its growth potential with the closure of its acquisition of Allergan. The company was re-named Allergan during the reporting period. Mondelez manufactures and sells consumer products—primarily in the snack food and confection categories—globally. Management reported significant margin expansion during the first quarter of 2015, surprising investors and leading to the stock’s positive performance. We believe the company has the potential to experience a further rise in profitability as it benefits from the capital spent to improve manufacturing efficiency, and management pursues a leaner cost structure as a result of implementing zero-based budgeting. We also expect part of the cost savings from these initiatives to be reinvested to boost top-line growth.
Detractors from performance this reporting period included energy stocks Noble Energy, National Oilwell Varco, and Chevron. These stocks experienced declines—along with most energy-related stocks—due to the decline in oil prices. Noble Energy is a global exploration and production energy company. In addition to the decline in oil process, investors reacted unfavorably to the company’s announced merger with Rosetta
4 OPPENHEIMER MAIN STREET FUND
Resources. While there may be concerns regarding future execution, we believe the merger can better position the company to grow onshore domestic operations. Consequently, we maintained our holdings in this stock. National Oilwell Varco is a worldwide supplier of equipment to the energy sector. The company’s management revised the outlook for earnings downward. As oil prices have fallen, many of the company’s customers have decreased spending expectations, thereby negatively impacting the projected growth of National Oilwell’s products and services. We exited our position. With Chevron, though earnings results were mostly in-line with consensus – with strong refining operations helping to offset lower oil prices – concerns about the pace of new projects coming online, combined with a high cash spend rate, negatively impacted sentiment.
STRATEGY & OUTLOOK
While financial engineering, as exemplified by the robust repurchase of shares and a step-up in merger and acquisition (“M&A”) activities, will augment earnings per share growth in the short term, neither lead to long-term growth. These behaviors, though rational due to the supply of “cheap” money resulting from the easy monetary policies across most Central Banks globally, do not lead to sustainable fundamental economic improvements. We believe only real investments, such as capital spending and research and development, ultimately lead to viable growth over the longer run. These issues remain a concern of the Main Street
team and we continue to emphasize investing in companies that are effectively allocating capital for both short-term and long-term sustainable fundamental growth.
We remain alert to disruption—both through product innovation and, increasingly, due to business model and/or process dislocations. Examples include Amazon’s dramatic impact on how goods and services are sold to customers, and how the Affordable Care Act is changing the winners and losers within health care. These disruptors pose both threats and opportunities, and our research is increasingly focused on distinguishing between the two.
Though equity market valuations are a bit above historical averages at period end, a higher valuation level might be justified should profitability remain strong and interest rates remain low. Given our outlook that inflation will remain tame and, therefore, interest rates are unlikely to rise dramatically over the immediate future, we are not expecting a significant contraction in the market’s multiple; however, there is little margin for error.
Regardless, we remain focused on seeking to build an “all weather” portfolio by targeting companies we believe have: 1) sustainable competitive advantages; 2) skilled management with a proven track record of executing effectively; and 3) financial resources with the potential to generate improving profitability, gain market share, and/or return significant cash to shareholders.
5 OPPENHEIMER MAIN STREET FUND
During times of volatile or slow economic growth, such companies frequently widen their lead over weaker competitors. We seek to invest in companies characterized by these qualities at compelling valuations, and believe this disciplined approach is essential in seeking to generate superior long-term performance.
| | |
 | |  |
| | Manind Govil, CFA Portfolio Manager |
| | |
 | |  |
| | Paul Larson Portfolio Manager |
| | |
 | |  |
| | Benjamin Ram Portfolio Manager |
6 OPPENHEIMER MAIN STREET FUND
Top Holdings and Allocations
TOP TEN COMMON STOCK HOLDINGS
| | |
Apple, Inc. | | 4.8% |
Google, Inc., Cl. C | | 4.6 |
Citigroup, Inc. | | 3.7 |
Mondelez International, Inc., Cl. A | | 3.3 |
CME Group, Inc., Cl. A | | 2.8 |
Philip Morris International, Inc. | | 2.8 |
General Electric Co. | | 2.7 |
Allergan plc | | 2.6 |
PepsiCo, Inc. | | 2.4 |
Comcast Corp., Cl. A | | 2.3 |
Portfolio holdings and allocations are subject to change. Percentages are as of August 31, 2015, and are based on net assets. For more current Fund holdings, please visit oppenheimerfunds.com.
TOP TEN COMMON STOCK INDUSTRIES
| | |
Pharmaceuticals | | 6.7% |
Oil, Gas & Consumable Fuels | | 6.4 |
Diversified Financial Services | | 6.3 |
Internet Software & Services | | 6.2 |
Health Care Providers & Services | | 6.1 |
IT Services | | 5.8 |
Technology Hardware, Storage & Peripherals | | 5.4 |
Commercial Banks | | 4.9 |
Specialty Retail | | 3.8 |
Insurance | | 3.7 |
Portfolio holdings and allocations are subject to change. Percentages are as of August 31, 2015, and are based on net assets.
SECTOR ALLOCATION
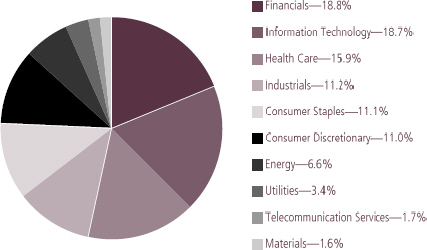
Portfolio holdings and allocations are subject to change. Percentages are as of August 31, 2015, and are based on the total market value of common stocks.
7 OPPENHEIMER MAIN STREET FUND
Share Class Performance
AVERAGE ANNUAL TOTAL RETURNS WITHOUT SALES CHARGE AS OF 8/31/15
| | | | | | | | | | | | | | | | | | | | | | | | |
| | | Inception Date | | | | | 1-Year | | | | | 5-Year | | | | | 10-Year | | | |
Class A (MSIGX) | | | 2/3/88 | | | | | | 0.99% | | | | | | 15.04% | | | | | | 6.66% | | | |
Class B (OMSBX) | | | 10/3/94 | | | | | | 0.21% | | | | | | 14.05% | | | | | | 6.15% | | | |
Class C (MIGCX) | | | 12/1/93 | | | | | | 0.23% | | | | | | 14.18% | | | | | | 5.87% | | | |
Class I (OMSIX) | | | 12/29/11 | | | | | | 1.41% | | | | | | 15.62% | * | | | | | N/A | | | |
Class R (OMGNX) | | | 3/1/01 | | | | | | 0.73% | | | | | | 14.74% | | | | | | 6.38% | | | |
Class Y (MIGYX) | | | 11/1/96 | | | | | | 1.23% | | | | | | 15.42% | | | | | | 7.08% | | | |
|
AVERAGE ANNUAL TOTAL RETURNS WITH SALES CHARGE AS OF 8/31/15 |
| | | Inception Date | | | | | 1-Year | | | | | 5-Year | | | | | 10-Year | | | |
Class A (MSIGX) | | | 2/3/88 | | | | | | -4.82% | | | | | | 13.69% | | | | | | 6.03% | | | |
Class B (OMSBX) | | | 10/3/94 | | | | | | -4.29% | | | | | | 13.81% | | | | | | 6.15% | | | |
Class C (MIGCX) | | | 12/1/93 | | | | | | -0.67% | | | | | | 14.18% | | | | | | 5.87% | | | |
Class I (OMSIX) | | | 12/29/11 | | | | | | 1.41% | | | | | | 15.62% | * | | | | | N/A | | | |
Class R (OMGNX) | | | 3/1/01 | | | | | | 0.73% | | | | | | 14.74% | | | | | | 6.38% | | | |
Class Y (MIGYX) | | | 11/1/96 | | | | | | 1.23% | | | | | | 15.42% | | | | | | 7.08% | | | |
*Shows performance since inception
Performance data quoted represents past performance, which does not guarantee future results. The investment return and principal value of an investment in the Fund will fluctuate so that an investor’s shares, when redeemed, may be worth more or less than their original cost. Current performance may be lower or higher than the performance quoted. Returns do not consider capital gains or income taxes on an individual’s investment. For performance data current to the most recent month-end, visit oppenheimerfunds.com or call 1.800.CALL OPP (225.5677). Fund returns include changes in share price, reinvested distributions, and the applicable sales charge: for Class A shares, the current maximum initial sales charge of 5.75%; for Class B shares, the contingent deferred sales charge of 5% (1-year) and 2% (5-year); and for Class C shares, the contingent deferred sales charge (“CDSC”) of 1% for the 1-year period. Prior to 7/1/14, Class R shares were named Class N shares. Beginning 7/1/14, new purchases of Class R shares will no longer be subject to a CDSC upon redemption (any CDSC will remain in effect for purchases prior to 7/1/14). There is no sales charge for Class I and Class Y shares. Because Class B shares convert to Class A shares 72 months after purchase, the 10-year return for Class B shares uses Class A performance for the period after conversion.
The Fund’s performance is compared to the performance of the S&P 500 Index. The S&P 500 Index is an index of large-capitalization equity securities that is a measure of the general domestic stock market. The Index is unmanaged and cannot be purchased directly by investors. While index comparisons may be useful to provide a benchmark for the Fund’s performance, it must be noted that the Fund’s investments are not limited to the investments comprising the index. Index performance includes reinvestment of income, but does not reflect transaction costs, fees, expenses or taxes. Index performance is shown for illustrative purposes only as a benchmark for the Fund’s performance, and does not predict or depict
8 OPPENHEIMER MAIN STREET FUND
performance of the Fund. The Fund’s performance reflects the effects of the Fund’s business and operating expenses.
The Fund’s investment strategy and focus can change over time. The mention of specific fund holdings does not constitute a recommendation by OppenheimerFunds, Inc. or its affiliates.
Before investing in any of the Oppenheimer funds, investors should carefully consider a fund’s investment objectives, risks, charges and expenses. Fund prospectuses and summary prospectuses contain this and other information about the funds, and may be obtained by asking your financial advisor, visiting oppenheimerfunds.com, or calling 1.800.CALL OPP (225.5677). Read prospectuses and summary prospectuses carefully before investing.
Shares of Oppenheimer funds are not deposits or obligations of any bank, are not guaranteed by any bank, are not insured by the FDIC or any other agency, and involve investment risks, including the possible loss of the principal amount invested.
9 OPPENHEIMER MAIN STREET FUND
Fund Expenses
Fund Expenses. As a shareholder of the Fund, you incur two types of costs: (1) transaction costs, which may include sales charges (loads) on purchase payments and/or contingent deferred sales charges on redemptions; and (2) ongoing costs, including management fees; distribution and service fees; and other Fund expenses. These examples are intended to help you understand your ongoing costs (in dollars) of investing in the Fund and to compare these costs with the ongoing costs of investing in other mutual funds.
The examples are based on an investment of $1,000.00 invested at the beginning of the period and held for the entire 6-month period ended August 31, 2015.
Actual Expenses. The first section of the table provides information about actual account values and actual expenses. You may use the information in this section for the class of shares you hold, together with the amount you invested, to estimate the expense that you paid over the period. Simply divide your account value by $1,000.00 (for example, an $8,600.00 account value divided by $1,000.00 = 8.60), then multiply the result by the number in the first section under the heading entitled “Expenses Paid During 6 Months Ended August 31, 2015” to estimate the expenses you paid on your account during this period.
Hypothetical Example for Comparison Purposes. The second section of the table provides information about hypothetical account values and hypothetical expenses based on the Fund’s actual expense ratio for each class of shares, and an assumed rate of return of 5% per year for each class before expenses, which is not the Fund’s actual return. The hypothetical account values and expenses may not be used to estimate the actual ending account balance or expenses you paid for the period. You may use this information to compare the ongoing costs of investing in the Fund and other funds. To do so, compare this 5% hypothetical example for the class of shares you hold with the 5% hypothetical examples that appear in the shareholder reports of the other funds.
Please note that the expenses shown in the table are meant to highlight your ongoing costs only and do not reflect any transactional costs, such as front-end or contingent deferred sales charges (loads). Therefore, the “hypothetical” section of the table is useful in comparing ongoing costs only, and will not help you determine the relative total costs of owning different funds. In addition, if these transactional costs were included, your costs would have been higher.
10 OPPENHEIMER MAIN STREET FUND
| | | | | | | | | | | | |
| Actual | | Beginning Account Value March 1, 2015 | | | | Ending Account Value August 31, 2015 | | | | Expenses Paid During 6 Months Ended August 31, 2015 | | |
Class A | | $ 1,000.00 | | | | $ 965.90 | | | | $ 4.57 | | |
Class B | | 1,000.00 | | | | 962.10 | | | | 8.34 | | |
Class C | | 1,000.00 | | | | 962.20 | | | | 8.29 | | |
Class I | | 1,000.00 | | | | 967.90 | | | | 2.48 | | |
Class R | | 1,000.00 | | | | 964.70 | | | | 5.86 | | |
Class Y | | 1,000.00 | | | | 967.10 | | | | 3.43 | | |
| | | | | | |
Hypothetical | | | | | | | | | | | | |
(5% return before expenses) | | | | | | | | | | | | |
Class A | | 1,000.00 | | | | 1,020.57 | | | | 4.70 | | |
Class B | | 1,000.00 | | | | 1,016.74 | | | | 8.58 | | |
Class C | | 1,000.00 | | | | 1,016.79 | | | | 8.52 | | |
Class I | | 1,000.00 | | | | 1,022.68 | | | | 2.55 | | |
Class R | | 1,000.00 | | | | 1,019.26 | | | | 6.02 | | |
Class Y | | 1,000.00 | | | | 1,021.73 | | | | 3.52 | | |
Expenses are equal to the Fund’s annualized expense ratio for that class, multiplied by the average account value over the period, multiplied by 184/365 (to reflect the one-half year period). Those annualized expense ratios, excluding indirect expenses from affiliated funds, based on the 6-month period ended August 31, 2015 are as follows:
| | | | | | |
| Class | | Expense Ratios | | | |
Class A | | | 0.92 | % | | |
Class B | | | 1.68 | | | |
Class C | | | 1.67 | | | |
Class I | | | 0.50 | | | |
Class R | | | 1.18 | | | |
Class Y | | | 0.69 | | | |
The expense ratios reflect voluntary and/or contractual waivers and/or reimbursements of expenses by the Fund’s Manager. Some of these undertakings may be modified or terminated at any time, as indicated in the Fund’s prospectus. The “Financial Highlights” tables in the Fund’s financial statements, included in this report, also show the gross expense ratios, without such waivers or reimbursements and reduction to custodian expenses, if applicable.
11 OPPENHEIMER MAIN STREET FUND
STATEMENT OF INVESTMENTS August 31, 2015
| | | | | | | | |
| | | Shares | | | Value | |
| |
| Common Stocks—97.9% | |
| |
Consumer Discretionary—10.8% | |
| |
Auto Components—1.4% | |
Delphi Automotive plc | | | 1,274,150 | | | $ | 96,223,808 | |
| |
Automobiles—1.3% | | | | | | | | |
General Motors Co. | | | 1,656,400 | | | | 48,764,416 | |
| |
Harley-Davidson, Inc. | | | 761,170 | | | | 42,663,578 | |
| | | | | | | | |
| | | | | | | 91,427,994 | |
| |
Hotels, Restaurants & Leisure—0.6% | | | | | | | | |
Dunkin’ Brands Group, Inc. | | | 858,030 | | | | 43,038,785 | |
| |
Internet & Catalog Retail—1.4% | | | | | | | | |
Amazon.com, Inc.1 | | | 192,540 | | | | 98,751,841 | |
| |
Media—2.3% | | | | | | | | |
Comcast Corp., Cl. A | | | 2,834,640 | | | | 159,675,271 | |
| |
Specialty Retail—3.8% | | | | | | | | |
AutoZone, Inc.1 | | | 185,777 | | | | 133,014,474 | |
| |
Home Depot, Inc. (The) | | | 1,124,240 | | | | 130,928,991 | |
| | | | | | | | |
| | | | | | | 263,943,465 | |
| |
Consumer Staples—10.8% | | | | | | | | |
| |
Beverages—2.8% | | | | | | | | |
Diageo plc | | | 1,095,590 | | | | 29,105,869 | |
| |
PepsiCo, Inc. | | | 1,781,560 | | | | 165,560,371 | |
| | | | | | | | |
| | | | | | | 194,666,240 | |
| |
Food Products—3.3% | | | | | | | | |
Mondelez International, Inc., Cl. A | | | 5,461,460 | | | | 231,347,446 | |
| |
Household Products—1.9% | | | | | | | | |
Henkel AG & Co. KGaA | | | 1,466,101 | | | | 134,348,855 | |
| |
Tobacco—2.8% | | | | | | | | |
Philip Morris International, Inc. | | | 2,433,638 | | | | 194,204,312 | |
| |
Energy—6.4% | | | | | | | | |
| |
Oil, Gas & Consumable Fuels—6.4% | | | | | | | | |
Chevron Corp. | | | 1,854,929 | | | | 150,230,700 | |
| | | | | | | | |
| | | Shares | | | Value | |
| |
Oil, Gas & Consumable Fuels (Continued) | |
| |
HollyFrontier Corp. | | | 942,880 | | | $ | 44,183,357 | |
| |
Magellan Midstream Partners LP2 | | | 617,845 | | | | 43,601,322 | |
| |
Noble Energy, Inc. | | | 2,583,220 | | | | 86,305,380 | |
| |
Suncor Energy, Inc. | | | 4,378,540 | | | | 123,649,969 | |
| | | | | | | | |
| | | | | | | 447,970,728 | |
| |
Financials—18.4% | | | | | | | | |
| |
Capital Markets—1.2% | | | | | | | | |
Bank of New York Mellon Corp. (The) | | | 2,019,820 | | | | 80,388,836 | |
| |
Commercial Banks—4.9% | | | | | | | | |
Citigroup, Inc. | | | 4,841,080 | | | | 258,900,959 | |
| |
JPMorgan Chase & Co. | | | 457,820 | | | | 29,346,262 | |
| |
M&T Bank Corp. | | | 481,360 | | | | 56,916,006 | |
| | | | | | | | |
| | | | | | | 345,163,227 | |
| |
Consumer Finance—1.1% | | | | | | | | |
Discover Financial Services | | | 1,490,255 | | | | 80,071,401 | |
| |
Diversified Financial Services—6.3% | | | | | | | | |
Berkshire Hathaway, Inc., Cl. B1 | | | 991,810 | | | | 132,942,212 | |
| |
CME Group, Inc., Cl. A | | | 2,089,570 | | | | 197,338,991 | |
| |
McGraw Hill Financial, Inc. | | | 1,138,658 | | | | 110,438,440 | |
| | | | | | | | |
| | | | | | | 440,719,643 | |
| |
Insurance—3.7% | | | | | | | | |
American International Group, Inc. | | | 2,292,860 | | | | 138,351,172 | |
| |
Genworth Financial, Inc., Cl. A1 | | | 5,625,500 | | | | 29,140,090 | |
| |
Marsh & McLennan Cos., Inc. | | | 1,641,320 | | | | 88,188,124 | |
| | | | | | | | |
| | | | | | | 255,679,386 | |
12 OPPENHEIMER MAIN STREET FUND
| | | | | | | | |
| | | Shares | | | Value | |
| |
Real Estate Investment Trusts (REITs)—1.2% | |
Simon Property Group, Inc. | | | 450,060 | | | $ | 80,704,759 | |
| |
Health Care—15.6% | | | | | | | | |
| |
Biotechnology—1.6% | | | | | | | | |
Gilead Sciences, Inc. | | | 1,061,460 | | | | 111,527,602 | |
| |
Health Care Equipment & Supplies—1.2% | |
Boston Scientific Corp.1 | | | 4,908,910 | | | | 82,175,154 | |
| |
Health Care Providers & Services—6.1% | |
Express Scripts Holding Co.1 | | | 1,718,812 | | | | 143,692,683 | |
| |
HCA Holdings, Inc.1 | | | 1,729,170 | | | | 149,780,706 | |
| |
UnitedHealth Group, Inc. | | | 1,148,240 | | | | 132,851,368 | |
| | | | | | | | |
| | | | | | | 426,324,757 | |
| |
Pharmaceuticals—6.7% | | | | | | | | |
Allergan plc1 | | | 592,410 | | | | 179,938,613 | |
| |
Bristol-Myers Squibb Co. | | | 1,346,570 | | | | 80,080,518 | |
| |
Merck & Co., Inc. | | | 2,615,120 | | | | 140,824,212 | |
| |
Zoetis, Inc., Cl. A | | | 1,493,592 | | | | 67,017,473 | |
| | | | | | | | |
| | | | | | | 467,860,816 | |
| |
Industrials—10.9% | | | | | | | | |
| |
Aerospace & Defense—0.8% | | | | | | | | |
United Technologies Corp. | | | 648,520 | | | | 59,410,917 | |
| |
Commercial Services & Supplies—2.4% | |
Republic Services, Inc., Cl. A | | | 1,595,210 | | | | 65,371,706 | |
| |
Tyco International plc | | | 2,764,818 | | | | 100,335,245 | |
| | | | | | | | |
| | | | | | | 165,706,951 | |
| |
Industrial Conglomerates—2.7% | | | | | | | | |
General Electric Co. | | | 7,545,760 | | | | 187,285,763 | |
| |
Machinery—1.8% | | | | | | | | |
Deere & Co. | | | 1,509,150 | | | | 123,418,287 | |
| |
Professional Services—1.2% | | | | | | | | |
Nielsen Holdings plc1 | | | 1,903,445 | | | | 86,092,817 | |
| | | | | | | | |
| | | Shares | | | Value | |
| |
Road & Rail—2.0% | | | | | | | | |
Canadian National Railway Co. | | | 1,839,420 | | | $ | 102,051,022 | |
| |
CSX Corp. | | | 1,384,200 | | | | 37,899,396 | |
| | | | | | | | |
| | | | | | | 139,950,418 | |
| |
Information Technology—18.4% | | | | | | | | |
| |
Internet Software & Services—6.2% | | | | | | | | |
Facebook, Inc., Cl. A1 | | | 1,232,820 | | | | 110,251,093 | |
| |
Google, Inc., Cl. C1 | | | 523,526 | | | | 323,669,949 | |
| | | | | | | | |
| | | | | | | 433,921,042 | |
| |
IT Services—5.8% | | | | | | | | |
Amdocs Ltd. | | | 2,493,650 | | | | 142,661,717 | |
| |
MasterCard, Inc., Cl. A | | | 994,220 | | | | 91,836,101 | |
| |
PayPal Holdings, Inc.1 | | | 2,780,730 | | | | 97,325,550 | |
| |
Xerox Corp. | | | 6,804,640 | | | | 69,203,189 | |
| | | | | | | | |
| | | | | | | 401,026,557 | |
| |
Semiconductors & Semiconductor Equipment—1.0% | |
Applied Materials, Inc. | | | 4,263,610 | | | | 68,580,167 | |
| |
Technology Hardware, Storage & Peripherals—5.4% | |
Apple, Inc. | | | 2,968,865 | | | | 334,769,217 | |
| |
Western Digital Corp. | | | 500,970 | | | | 41,059,501 | |
| | | | | | | | |
| | | | | | | 375,828,718 | |
| |
Materials—1.6% | | | | | | | | |
| |
Construction Materials—1.5% | | | | | | | | |
Vulcan Materials Co. | | | 1,103,123 | | | | 103,274,375 | |
| |
Metals & Mining—0.1% | | | | | | | | |
Teck Resources Ltd., Cl. B | | | 1,177,200 | | | | 8,440,524 | |
| |
Telecommunication Services—1.7% | | | | | | | | |
| |
Diversified Telecommunication Services—1.7% | |
Verizon Communications, Inc. | | | 2,517,650 | | | | 115,837,076 | |
| |
Utilities—3.3% | | | | | | | | |
| |
Electric Utilities—1.0% | | | | | | | | |
ITC Holdings Corp. | | | 1,159,430 | | | | 37,913,361 | |
13 OPPENHEIMER MAIN STREET FUND
STATEMENT OF INVESTMENTS Continued
| | | | | | | | |
| | | Shares | | | Value | |
| |
Electric Utilities (Continued) | |
| |
Southern Co. (The) | | | 629,410 | | | $ | 27,322,688 | |
| | | | | | | | |
| | | | | | | 65,236,049 | |
| |
Gas Utilities—0.5% | | | | | | | | |
AmeriGas Partners LP2 | | | 802,930 | | | | 36,003,381 | |
| |
Multi-Utilities—1.8% | | | | | | | | |
PG&E Corp. | | | 2,579,610 | | | | 127,897,064 | |
| | | | | | | | |
Total Common Stocks (Cost $5,443,810,449) | | | | | | | 6,824,124,432 | |
| | | | | | | | |
| | | Shares | | | Value | |
| |
| Investment Company—2.3% | |
| |
Oppenheimer Institutional Money Market Fund, Cl. E, 0.17%3,4 (Cost $163,401,761) | | | 163,401,761 | | | $ | 163,401,761 | |
| |
Total Investments, at Value (Cost $5,607,212,210) | | | 100.2 | % | | | 6,987,526,193 | |
| |
Net Other Assets (Liabilities) | | | (0.2 | ) | | | (11,823,897 | ) |
| | | | |
Net Assets | | | 100.0 | % | | $ | 6,975,702,296 | |
| | | | |
Footnotes to Statement of Investments
1. Non-income producing security.
2. Security is a Master Limited Partnership.
3. Is or was an affiliate, as defined in the Investment Company Act of 1940, as amended, at or during the reporting period ended, by virtue of the Fund owning at least 5% of the voting securities of the issuer or as a result of the Fund and the issuer having the same investment adviser. Transactions during the period in which the issuer was an affiliate are as follows:
| | | | | | | | | | | | | | | | |
| | | Shares August 29, 2014a | | | Gross
Additions | | | Gross Reductions | | | Shares August 31, 2015 | |
| |
Oppenheimer Institutional Money Market Fund, Cl. E | | | 82,705,816 | | | | 1,770,604,249 | | | | 1,689,908,304 | | | | 163,401,761 | |
| | | | |
| | | | | | | | | Value | | | Income | |
| |
Oppenheimer Institutional Money Market Fund, Cl. E | | | | | | | | | | $ | 163,401,761 | | | $ | 162,198 | |
a. August 29, 2014 represents the last business day of the Fund’s reporting period. See Note 2 of the accompanying Notes.
4. Rate shown is the 7-day yield as of period.
See accompanying Notes to Financial Statements.
14 OPPENHEIMER MAIN STREET FUND
STATEMENT OF ASSETS AND LIABILITIES August 31, 2015
| | | | |
| |
Assets | | | | |
| Investments, at value—see accompanying statement of investments: | | | | |
| Unaffiliated companies (cost $5,443,810,449) | | $ | 6,824,124,432 | |
| Affiliated companies (cost $163,401,761) | | | 163,401,761 | |
| | | | |
| | | 6,987,526,193 | |
| |
| Cash | | | 3,001,632 | |
| |
| Receivables and other assets: | | | | |
| Investments sold | | | 40,630,619 | |
| Dividends | | | 6,428,681 | |
| Shares of beneficial interest sold | | | 3,914,957 | |
| Other | | | 6,200,588 | |
| | | | |
Total assets | | | 7,047,702,670 | |
| |
Liabilities | | | | |
| Payables and other liabilities: | | | | |
| Investments purchased | | | 63,955,487 | |
| Shares of beneficial interest redeemed | | | 6,230,602 | |
| Distribution and service plan fees | | | 1,330,210 | |
| Trustees’ compensation | | | 377,131 | |
| Shareholder communications | | | 28,229 | |
| Other | | | 78,715 | |
| | | | |
Total liabilities | | | 72,000,374 | |
| |
Net Assets | | $ | 6,975,702,296 | |
| | | | |
| | | | |
| |
Composition of Net Assets | | | | |
| Par value of shares of beneficial interest | | $ | 147,318 | |
| |
| Additional paid-in capital | | | 4,906,012,816 | |
| |
| Accumulated net investment income | | | 27,693,434 | |
| |
| Accumulated net realized gain on investments and foreign currency transactions | | | 661,529,747 | |
| |
| Net unrealized appreciation on investments and translation of assets and liabilities denominated in foreign currencies | | | 1,380,318,981 | |
| | | | |
Net Assets | | $ | 6,975,702,296 | |
| | | | |
15 OPPENHEIMER MAIN STREET FUND
STATEMENT OF ASSETS AND LIABILITIES Continued
| | | | |
| |
Net Asset Value Per Share | | | | |
| Class A Shares: | | | | |
| |
| Net asset value and redemption price per share (based on net assets of $5,162,999,930 and 108,383,235 shares of beneficial interest outstanding) | | $ | 47.64 | |
| |
| Maximum offering price per share (net asset value plus sales charge of 5.75% of offering price) | | $ | 50.55 | |
| |
| |
| Class B Shares: | | | | |
| |
| Net asset value, redemption price (excludes applicable contingent deferred sales charge) and offering price per share (based on net assets of $113,578,579 and 2,487,997 shares of beneficial interest outstanding) | | $ | 45.65 | |
| |
| |
| Class C Shares: | | | | |
| |
| Net asset value, redemption price (excludes applicable contingent deferred sales charge) and offering price per share (based on net assets of $641,862,745 and 14,103,648 shares of beneficial interest outstanding) | | $ | 45.51 | |
| |
| |
| Class I Shares: | | | | |
| |
| Net asset value, redemption price and offering price per share (based on net assets of $277,748,899 and 5,864,256 shares of beneficial interest outstanding) | | $ | 47.36 | |
| |
| |
| Class R Shares: | | | | |
| |
| Net asset value, redemption price (excludes applicable contingent deferred sales charge) and offering price per share (based on net assets of $115,038,510 and 2,450,150 shares of beneficial interest outstanding) | | $ | 46.95 | |
| |
| |
| Class Y Shares: | | | | |
| |
| Net asset value, redemption price and offering price per share (based on net assets of $664,473,633 and 14,028,266 shares of beneficial interest outstanding) | | $ | 47.37 | |
See accompanying Notes to Financial Statements.
16 OPPENHEIMER MAIN STREET FUND
STATEMENT OF OPERATIONS For the Year Ended August 31, 2015
| | | | |
| |
Investment Income | | | | |
| Dividends: | | | | |
| Unaffiliated companies (net of foreign withholding taxes of $1,110,871) | | $ | 118,995,850 | |
| Affiliated companies | | | 162,198 | |
| |
| Interest | | | 1,662 | |
| | | | |
| Total investment income | | | 119,159,710 | |
|
| |
Expenses | | | | |
| Management fees | | | 33,651,002 | |
| |
| Distribution and service plan fees: | | | | |
| Class A | | | 12,902,344 | |
| Class B | | | 1,470,220 | |
| Class C | | | 6,645,399 | |
| Class R | | | 585,361 | |
| |
| Transfer and shareholder servicing agent fees: | | | | |
| Class A | | | 11,859,376 | |
| Class B | | | 325,783 | |
| Class C | | | 1,472,373 | |
| Class I | | | 86,325 | |
| Class R | | | 261,000 | |
| Class Y | | | 1,522,170 | |
| |
| Shareholder communications: | | | | |
| Class A | | | 77,237 | |
| Class B | | | 7,243 | |
| Class C | | | 9,415 | |
| Class I | | | 276 | |
| Class R | | | 958 | |
| Class Y | | | 7,126 | |
| |
| Trustees’ compensation | | | 197,511 | |
| |
| Custodian fees and expenses | | | 59,987 | |
| |
| Borrowing fees | | | 12,770 | |
| |
| Other | | | 378,512 | |
| | | | |
| Total expenses | | | 71,532,388 | |
| Less waivers and reimbursements of expenses | | | (132,847 | ) |
| | | | |
| Net expenses | | | 71,399,541 | |
| |
| Net Investment Income | | | 47,760,169 | |
17 OPPENHEIMER MAIN STREET FUND
STATEMENT OF OPERATIONS Continued
| | | | |
| |
Realized and Unrealized Gain (Loss) | | | | |
Net realized gain (loss) on: | | | | |
Investments from unaffiliated companies | | $ | 828,030,262 | |
Foreign currency transactions | | | (162,485 | ) |
| | | | |
Net realized gain | | | 827,867,777 | |
| |
Net change in unrealized appreciation/depreciation on: | | | | |
Investments | | | (780,236,012 | ) |
Translation of assets and liabilities denominated in foreign currencies | | | (17,700,835 | ) |
| | | | |
Net change in unrealized appreciation/depreciation | | | (797,936,847 | ) |
|
| |
Net Increase in Net Assets Resulting from Operations | | $ | 77,691,099 | |
| | | | |
See accompanying Notes to Financial Statements.
18 OPPENHEIMER MAIN STREET FUND
STATEMENTS OF CHANGES IN NET ASSETS
| | | | | | | | |
| | | Year Ended
August 31, 2015 | | | Year Ended
August 29, 20141 | |
| |
Operations | | | | | | | | |
| Net investment income | | $ | 47,760,169 | | | $ | 37,170,775 | |
| |
| Net realized gain | | | 827,867,777 | | | | 1,047,687,366 | |
| |
| Net change in unrealized appreciation/depreciation | | | (797,936,847 | ) | | | 440,890,827 | |
| | | | | | | | |
Net increase in net assets resulting from operations | | | 77,691,099 | | | | 1,525,748,968 | |
| |
Dividends and/or Distributions to Shareholders | | | | | | | | |
| Dividends from net investment income: | | | | | | | | |
| Class A | | | (35,700,794 | ) | | | (32,462,343 | ) |
| Class B | | | — | | | | — | |
| Class C | | | — | | | | — | |
| Class I | | | (3,198,300 | ) | | | (1,274,578 | ) |
| Class R2 | | | (506,000 | ) | | | (471,221 | ) |
| Class Y | | | (6,431,979 | ) | | | (8,563,438 | ) |
| | | | |
| | | (45,837,073 | ) | | | (42,771,580 | ) |
| |
| Distributions from net realized gain: | | | | | | | | |
| Class A | | | (544,781,064 | ) | | | — | |
| Class B | | | (17,113,014 | ) | | | — | |
| Class C | | | (70,627,684 | ) | | | — | |
| Class I | | | (29,773,516 | ) | | | — | |
| Class R2 | | | (12,191,316 | ) | | | — | |
| Class Y | | | (71,039,880 | ) | | | — | |
| | | | |
| | | (745,526,474 | ) | | | — | |
| |
Beneficial Interest Transactions | | | | | | | | |
| Net increase (decrease) in net assets resulting from beneficial interest transactions: | | | | | | | | |
| Class A | | | 255,115,542 | | | | (254,468,541 | ) |
| Class B | | | (56,635,480 | ) | | | (63,195,646 | ) |
| Class C | | | 32,959,484 | | | | (42,487,169 | ) |
| Class I | | | 11,250,779 | | | | 236,370,198 | |
| Class R2 | | | 8,191,907 | | | | (11,674,330 | ) |
| Class Y | | | 66,645,854 | | | | (206,670,797 | ) |
| | | | | | | | |
| | | 317,528,086 | | | | (342,126,285 | ) |
| |
Net Assets | | | | | | | | |
| Total increase (decrease) | | | (396,144,362 | ) | | | 1,140,851,103 | |
| |
| Beginning of period | | | 7,371,846,658 | | | | 6,230,995,555 | |
| | | | | | | | |
| End of period (including accumulated net investment income of $27,693,434 and $25,915,965, respectively) | | $ | 6,975,702,296 | | | $ | 7,371,846,658 | |
| | | | | | | | |
1. August 29, 2014 represents the last business day of the Fund’s reporting period. See Note 2 of the accompanying Notes.
2. Effective July 1, 2014, Class N shares were renamed Class R. See Note 1 of the accompanying Notes.
See accompanying Notes to Financial Statements.
19 OPPENHEIMER MAIN STREET FUND
FINANCIAL HIGHLIGHTS
| | | | | | | | | | | | | | | | | | | | |
| Class A | | Year Ended
August 31,
2015 | | | Year Ended
August 29,
20141 | | | Year Ended
August 30,
20131 | | | Year Ended
August 31,
2012 | | | Year Ended
August 31,
2011 | |
| |
Per Share Operating Data | | | | | | | | | | | | | | | | | | | | |
| Net asset value, beginning of period | | $ | 52.73 | | | $ | 42.39 | | | $ | 36.69 | | | $ | 30.93 | | | $ | 27.17 | |
| |
| Income (loss) from investment operations: | | | | | | | | | | | | | | | | | | | | |
| Net investment income2 | | | 0.35 | | | | 0.29 | | | | 0.37 | | | | 0.25 | | | | 0.20 | |
| Net realized and unrealized gain | | | 0.26 | | | | 10.36 | | | | 5.73 | | | | 5.67 | | | | 3.73 | |
| | | | |
| Total from investment operations | | | 0.61 | | �� | | 10.65 | | | | 6.10 | | | | 5.92 | | | | 3.93 | |
| |
| Dividends and/or distributions to shareholders: | | | | | | | | | | | | | | | | | | | | |
| Dividends from net investment income | | | (0.35 | ) | | | (0.31 | ) | | | (0.40 | ) | | | (0.16 | ) | | | (0.17 | ) |
| Distributions from net realized gain | | | (5.35 | ) | | | 0.00 | | | | 0.00 | | | | 0.00 | | | | 0.00 | |
| | | | |
| Total dividends and/or distributions to shareholders | | | (5.70 | ) | | | (0.31 | ) | | | (0.40 | ) | | | (0.16 | ) | | | (0.17 | ) |
| |
| Net asset value, end of period | | $ | 47.64 | | | $ | 52.73 | | | $ | 42.39 | | | $ | 36.69 | | | $ | 30.93 | |
| | | | |
|
| |
Total Return, at Net Asset Value3 | | | 0.99% | | | | 25.20% | | | | 16.78% | | | | 19.21% | | | | 14.46% | |
| |
Ratios/Supplemental Data | | | | | | | | | | | | | | | | | | | | |
| Net assets, end of period (in thousands) | | $ | 5,163,000 | | | $ | 5,429,874 | | | $ | 4,588,619 | | | $ | 4,318,726 | | | $ | 4,005,609 | |
| |
| Average net assets (in thousands) | | $ | 5,404,461 | | | $ | 5,096,996 | | | $ | 4,494,340 | | | $ | 4,164,196 | | | $ | 4,453,926 | |
| |
| Ratios to average net assets:4 | | | | | | | | | | | | | | | | | | | | |
| Net investment income | | | 0.70% | | | | 0.60% | | | | 0.95% | | | | 0.74% | | | | 0.62% | |
| Expenses excluding interest and fees from borrowings | | | 0.93% | | | | 0.92% | | | | 0.93% | | | | 0.97% | | | | 0.99% | |
| Interest and fees from borrowings | | | 0.00% | 5 | | | 0.00% | | | | 0.00% | | | | 0.00% | | | | 0.00% | |
| | | | |
| Total expenses6 | | | 0.93% | | | | 0.92% | | | | 0.93% | | | | 0.97% | | | | 0.99% | |
| Expenses after payments, waivers and/or reimbursements and reduction to custodian expenses | | | 0.93% | | | | 0.92% | | | | 0.93% | | | | 0.97% | | | | 0.99% | |
| |
| Portfolio turnover rate | | | 43% | | | | 52% | | | | 46% | | | | 37% | | | | 35% | |
1. August 29, 2014 and August 30, 2013 represent the last business days of the Fund’s respective reporting periods. See Note 2 of the accompanying Notes.
2. Per share amounts calculated based on the average shares outstanding during the period.
3. Assumes an initial investment on the business day before the first day of the fiscal period, with all dividends and distributions reinvested in additional shares on the reinvestment date, and redemption at the net asset value calculated on the last business day of the fiscal period. Sales charges are not reflected in the total returns. Total returns are not annualized for periods less than one full year. Returns do not reflect the deduction of taxes that a shareholder would pay on fund distributions or the redemption of fund shares. The returns do not include adjustments in accordance with generally accepted accounting principles required at the period end for financial reporting purposes.
4. Annualized for periods less than one full year.
5. Less than 0.005%.
6. Total expenses including indirect expenses from affiliated fund fees and expenses were as follows:
| | | | | | |
| | Year Ended August 31, 2015 | | 0.93% | | |
| | Year Ended August 29, 2014 | | 0.92% | |
| | Year Ended August 30, 2013 | | 0.93% | |
| | Year Ended August 31, 2012 | | 0.97% | |
| | Year Ended August 31, 2011 | | 0.99% | |
See accompanying Notes to Financial Statements.
20 OPPENHEIMER MAIN STREET FUND
| | | | | | | | | | | | | | | | | | | | |
| Class B | | Year Ended
August 31,
2015 | | | Year Ended
August 29,
20141 | | | Year Ended
August 30,
20131 | | | Year Ended
August 31,
2012 | | | Year Ended
August 31,
2011 | |
| |
Per Share Operating Data | | | | | | | | | | | | | | | | | | | | |
| Net asset value, beginning of period | | $ | 50.78 | | | $ | 40.88 | | | $ | 35.33 | | | $ | 29.90 | | | $ | 26.37 | |
| |
| Income (loss) from investment operations: | | | | | | | | | | | | | | | | | | | | |
| Net investment income (loss)2 | | | (0.02 | ) | | | (0.10 | ) | | | 0.01 | | | | (0.05 | ) | | | (0.09 | ) |
| Net realized and unrealized gain | | | 0.24 | | | | 10.00 | | | | 5.54 | | | | 5.48 | | | | 3.62 | |
| | | | |
| Total from investment operations | | | 0.22 | | | | 9.90 | | | | 5.55 | | | | 5.43 | | | | 3.53 | |
| |
| Dividends and/or distributions to shareholders: | | | | | | | | | | | | | | | | | | | | |
| Dividends from net investment income | | | 0.00 | | | | 0.00 | | | | 0.00 | | | | 0.00 | | | | 0.00 | |
| Distributions from net realized gain | | | (5.35 | ) | | | 0.00 | | | | 0.00 | | | | 0.00 | | | | 0.00 | |
| | | | |
| Total dividends and/or distributions to shareholders | | | (5.35 | ) | | | 0.00 | | | | 0.00 | | | | 0.00 | | | | 0.00 | |
| |
| Net asset value, end of period | | $ | 45.65 | | | $ | 50.78 | | | $ | 40.88 | | | $ | 35.33 | | | $ | 29.90 | |
| | | | |
|
| |
Total Return, at Net Asset Value3 | | | 0.21% | | | | 24.22% | | | | 15.71% | | | | 18.16% | | | | 13.39% | |
| |
Ratios/Supplemental Data | | | | | | | | | | | | | | | | | | | | |
| Net assets, end of period (in thousands) | | $ | 113,578 | | | $ | 185,705 | | | $ | 205,386 | | | $ | 245,172 | | | $ | 267,723 | |
| |
| Average net assets (in thousands) | | $ | 148,294 | | | $ | 199,044 | | | $ | 224,582 | | | $ | 257,205 | | | $ | 332,239 | |
| |
| Ratios to average net assets:4 | | | | | | | | | | | | | | | | | | | | |
| Net investment income (loss) | | | (0.05)% | | | | (0.22)% | | | | 0.02% | | | | (0.15)% | | | | (0.28)% | |
| Expenses excluding interest and fees from borrowings | | | 1.68% | | | | 1.74% | | | | 1.92% | | | | 1.97% | | | | 2.00% | |
| Interest and fees from borrowings | | | 0.00% | 5 | | | 0.00% | | | | 0.00% | | | | 0.00% | | | | 0.00% | |
| | | | |
| Total expenses6 | | | 1.68% | | | | 1.74% | | | | 1.92% | | | | 1.97% | | | | 2.00% | |
| Expenses after payments, waivers and/or reimbursements and reduction to custodian expenses | | | 1.68% | | | | 1.73% | | | | 1.86% | | | | 1.85% | | | | 1.89% | |
| |
| Portfolio turnover rate | | | 43% | | | | 52% | | | | 46% | | | | 37% | | | | 35% | |
1. August 29, 2014 and August 30, 2013 represent the last business days of the Fund’s respective reporting periods. See Note 2 of the accompanying Notes.
2. Per share amounts calculated based on the average shares outstanding during the period.
3. Assumes an initial investment on the business day before the first day of the fiscal period, with all dividends and distributions reinvested in additional shares on the reinvestment date, and redemption at the net asset value calculated on the last business day of the fiscal period. Sales charges are not reflected in the total returns. Total returns are not annualized for periods less than one full year. Returns do not reflect the deduction of taxes that a shareholder would pay on fund distributions or the redemption of fund shares. The returns do not include adjustments in accordance with generally accepted accounting principles required at the period end for financial reporting purposes.
4. Annualized for periods less than one full year.
5. Less than 0.005%.
6. Total expenses including indirect expenses from affiliated fund fees and expenses were as follows:
| | | | | | |
| | Year Ended August 31, 2015 | | 1.68% | | |
| | Year Ended August 29, 2014 | | 1.74% | |
| | Year Ended August 30, 2013 | | 1.92% | |
| | Year Ended August 31, 2012 | | 1.97% | |
| | Year Ended August 31, 2011 | | 2.00% | |
See accompanying Notes to Financial Statements.
21 OPPENHEIMER MAIN STREET FUND
FINANCIAL HIGHLIGHTS Continued
| | | | | | | | | | | | | | | | | | | | |
| Class C | | Year Ended
August 31,
2015 | | | Year Ended
August 29,
20141 | | | Year Ended
August 30,
20131 | | | Year Ended
August 31,
2012 | | | Year Ended
August 31,
2011 | |
| |
Per Share Operating Data | | | | | | | | | | | | | | | | | | | | |
| Net asset value, beginning of period | | $ | 50.63 | | | $ | 40.74 | | | $ | 35.22 | | | $ | 29.77 | | | $ | 26.20 | |
| |
| Income (loss) from investment operations: | | | | | | | | | | | | | | | | | | | | |
| Net investment income (loss)2 | | | (0.02 | ) | | | (0.07 | ) | | | 0.07 | | | | 0.00 | 3 | | | (0.04 | ) |
| Net realized and unrealized gain | | | 0.25 | | | | 9.96 | | | | 5.53 | | | | 5.45 | | | | 3.61 | |
| | | | |
| Total from investment operations | | | 0.23 | | | | 9.89 | | | | 5.60 | | | | 5.45 | | | | 3.57 | |
| |
| Dividends and/or distributions to shareholders: | | | | | | | | | | | | | | | | | | | | |
| Dividends from net investment income | | | 0.00 | | | | 0.00 | | | | (0.08 | ) | | | 0.00 | | | | 0.00 | |
| Distributions from net realized gain | | | (5.35 | ) | | | 0.00 | | | | 0.00 | | | | 0.00 | | | | 0.00 | |
| | | | |
| Total dividends and/or distributions to shareholders | | | (5.35 | ) | | | 0.00 | | | | (0.08 | ) | | | 0.00 | | | | 0.00 | |
| |
| Net asset value, end of period | | $ | 45.51 | | | $ | 50.63 | | | $ | 40.74 | | | $ | 35.22 | | | $ | 29.77 | |
| | | | |
|
| |
Total Return, at Net Asset Value4 | | | 0.23% | | | | 24.28% | | | | 15.92% | | | | 18.31% | | | | 13.63% | |
| |
Ratios/Supplemental Data | | | | | | | | | | | | | | | | | | | | |
| Net assets, end of period (in thousands) | | $ | 641,863 | | | $ | 677,274 | | | $ | 582,360 | | | $ | 550,341 | | | $ | 520,988 | |
| |
| Average net assets (in thousands) | | $ | 670,954 | | | $ | 641,903 | | | $ | 568,419 | | | $ | 535,180 | | | $ | 577,960 | |
| |
| Ratios to average net assets:5 | | | | | | | | | | | | | | | | | | | | |
| Net investment income (loss) | | | (0.05)% | | | | (0.15)% | | | | 0.20% | | | | 0.00%6 | | | | (0.12)% | |
| Expenses excluding interest and fees from borrowings | | | 1.68% | | | | 1.67% | | | | 1.68% | | | | 1.71% | | | | 1.73% | |
| Interest and fees from borrowings | | | 0.00%6 | | | | 0.00% | | | | 0.00% | | | | 0.00% | | | | 0.00% | |
| | | | |
| Total expenses7 | | | 1.68% | | | | 1.67% | | | | 1.68% | | | | 1.71% | | | | 1.73% | |
| Expenses after payments, waivers and/or reimbursements and reduction to custodian expenses | | | 1.68% | | | | 1.67% | | | | 1.68% | | | | 1.71% | | | | 1.73% | |
| |
| Portfolio turnover rate | | | 43% | | | | 52% | | | | 46% | | | | 37% | | | | 35% | |
1. August 29, 2014 and August 30, 2013 represent the last business days of the Fund’s respective reporting periods. See Note 2 of the accompanying Notes.
2. Per share amounts calculated based on the average shares outstanding during the period.
3. Less than $0.005 per share.
4. Assumes an initial investment on the business day before the first day of the fiscal period, with all dividends and distributions reinvested in additional shares on the reinvestment date, and redemption at the net asset value calculated on the last business day of the fiscal period. Sales charges are not reflected in the total returns. Total returns are not annualized for periods less than one full year. Returns do not reflect the deduction of taxes that a shareholder would pay on fund distributions or the redemption of fund shares. The returns do not include adjustments in accordance with generally accepted accounting principles required at the period end for financial reporting purposes.
5. Annualized for periods less than one full year.
6. Less than 0.005%.
7. Total expenses including indirect expenses from affiliated fund fees and expenses were as follows:
| | | | | | |
| | Year Ended August 31, 2015 | | 1.68% | | |
| | Year Ended August 29, 2014 | | 1.67% | |
| | Year Ended August 30, 2013 | | 1.68% | |
| | Year Ended August 31, 2012 | | 1.71% | |
| | Year Ended August 31, 2011 | | 1.73% | |
See accompanying Notes to Financial Statements.
22 OPPENHEIMER MAIN STREET FUND
| | | | | | | | | | | | | | | | |
| Class I | | Year Ended
August 31,
2015 | | | Year Ended
August 29,
20141 | | | Year Ended
August 30,
20131 | | | Period Ended
August 31,
20122 | |
| |
Per Share Operating Data | | | | | | | | | | | | | | | | |
| Net asset value, beginning of period | | $ | 52.47 | | | $ | 42.33 | | | $ | 36.82 | | | $ | 32.31 | |
| |
| Income (loss) from investment operations: | | | | | | | | | | | | | | | | |
| Net investment income3 | | | 0.56 | | | | 0.51 | | | | 0.50 | | | | 0.29 | |
| Net realized and unrealized gain | | | 0.25 | | | | 10.30 | | | | 5.75 | | | | 4.22 | |
| | | | |
| Total from investment operations | | | 0.81 | | | | 10.81 | | | | 6.25 | | | | 4.51 | |
| |
| Dividends and/or distributions to shareholders: | | | | | | | | | | | | | | | | |
| Dividends from net investment income | | | (0.57 | ) | | | (0.67 | ) | | | (0.74 | ) | | | 0.00 | |
| Distributions from net realized gain | | | (5.35 | ) | | | 0.00 | | | | 0.00 | | | | 0.00 | |
| | | | |
| Total dividends and/or distributions to shareholders | | | (5.92 | ) | | | (0.67 | ) | | | (0.74 | ) | | | 0.00 | |
| |
| Net asset value, end of period | | $ | 47.36 | | | $ | 52.47 | | | $ | 42.33 | | | $ | 36.82 | |
| | | | |
|
| |
Total Return, at Net Asset Value4 | | | 1.41% | | | | 25.73% | | | | 17.28% | | | | 13.96% | |
| |
Ratios/Supplemental Data | | | | | | | | | | | | | | | | |
| Net assets, end of period (in thousands) | | $ | 277,749 | | | $ | 295,519 | | | $ | 25,203 | | | $ | 11 | |
| |
| Average net assets (in thousands) | | $ | 288,411 | | | $ | 203,534 | | | $ | 15,305 | | | $ | 11 | |
| |
| Ratios to average net assets:5 | | | | | | | | | | | | | | | | |
| Net investment income | | | 1.13% | | | | 1.05% | | | | 1.26% | | | | 1.22% | |
| Expenses excluding interest and fees from borrowings | | | 0.50% | | | | 0.50% | | | | 0.51% | | | | 0.50% | |
| Interest and fees from borrowings | | | 0.00% | 6 | | | 0.00% | | | | 0.00% | | | | 0.00% | |
| | | | |
| Total expenses7 | | | 0.50% | | | | 0.50% | | | | 0.51% | | | | 0.50% | |
| Expenses after payments, waivers and/or reimbursements and reduction to custodian expenses | | | 0.50% | | | | 0.50% | | | | 0.51% | | | | 0.50% | |
| |
| Portfolio turnover rate | | | 43% | | | | 52% | | | | 46% | | | | 37% | |
1. August 29, 2014 and August 30, 2013 represent the last business days of the Fund’s respective reporting periods. See Note 2 of the accompanying Notes.
2. For the period from December 29, 2011 (inception of offering) to August 31, 2012.
3. Per share amounts calculated based on the average shares outstanding during the period.
4. Assumes an initial investment on the business day before the first day of the fiscal period, with all dividends and distributions reinvested in additional shares on the reinvestment date, and redemption at the net asset value calculated on the last business day of the fiscal period. Sales charges are not reflected in the total returns. Total returns are not annualized for periods less than one full year. Returns do not reflect the deduction of taxes that a shareholder would pay on fund distributions or the redemption of fund shares. The returns do not include adjustments in accordance with generally accepted accounting principles required at the period end for financial reporting purposes.
5. Annualized for periods less than one full year.
6. Less than 0.005%.
7. Total expenses including indirect expenses from affiliated fund fees and expenses were as follows:
| | | | | | |
| | Year Ended August 31, 2015 | | 0.50% | | |
| | Year Ended August 29, 2014 | | 0.50% | |
| | Year Ended August 30, 2013 | | 0.51% | |
| | Period Ended August 31, 2012 | | 0.50% | |
See accompanying Notes to Financial Statements.
23 OPPENHEIMER MAIN STREET FUND
FINANCIAL HIGHLIGHTS Continued
| | | | | | | | | | | | | | | | | | | | |
| Class R | | Year Ended
August 31,
2015 | | | Year Ended
August 29,
20141 | | | Year Ended
August 30,
20131 | | | Year Ended
August 31,
2012 | | | Year Ended
August 31,
2011 | |
| |
Per Share Operating Data | | | | | | | | | | | | | | | | | | | | |
| Net asset value, beginning of period | | $ | 52.05 | | | $ | 41.85 | | | $ | 36.17 | | | $ | 30.49 | | | $ | 26.77 | |
| |
| Income (loss) from investment operations: | | | | | | | | | | | | | | | | | | | | |
| Net investment income2 | | | 0.22 | | | | 0.16 | | | | 0.26 | | | | 0.16 | | | | 0.12 | |
| Net realized and unrealized gain | | | 0.26 | | | | 10.23 | | | | 5.66 | | | | 5.59 | | | | 3.68 | |
| | | | |
| Total from investment operations | | | 0.48 | | | | 10.39 | | | | 5.92 | | | | 5.75 | | | | 3.80 | |
| |
| Dividends and/or distributions to shareholders: | | | | | | | | | | | | | | | | | | | | |
| Dividends from net investment income | | | (0.23 | ) | | | (0.19 | ) | | | (0.24 | ) | | | (0.07 | ) | | | (0.08 | ) |
| Distributions from net realized gain | | | (5.35 | ) | | | 0.00 | | | | 0.00 | | | | 0.00 | | | | 0.00 | |
| | | | |
| Total dividends and/or distributions to shareholders | | | (5.58 | ) | | | (0.19 | ) | | | (0.24 | ) | | | (0.07 | ) | | | (0.08 | ) |
| |
| Net asset value, end of period | | $ | 46.95 | | | $ | 52.05 | | | $ | 41.85 | | | $ | 36.17 | | | $ | 30.49 | |
| | | | |
|
| |
Total Return, at Net Asset Value3 | | | 0.73% | | | | 24.88% | | | | 16.47% | | | | 18.91% | | | | 14.18% | |
| |
Ratios/Supplemental Data | | | | | | | | | | | | | | | | | | | | |
| Net assets, end of period (in thousands) | | $ | 115,038 | | | $ | 118,479 | | | $ | 105,630 | | | $ | 101,596 | | | $ | 98,147 | |
| |
| Average net assets (in thousands) | | $ | 118,942 | | | $ | 114,029 | | | $ | 104,731 | | | $ | 99,620 | | | $ | 111,540 | |
| |
| Ratios to average net assets:4 | | | | | | | | | | | | | | | | | | | | |
| Net investment income | | | 0.45% | | | | 0.34% | | | | 0.68% | | | | 0.48% | | | | 0.37% | |
| Expenses excluding interest and fees from borrowings | | | 1.18% | | | | 1.17% | | | | 1.20% | | | | 1.22% | | | | 1.23% | |
| Interest and fees from borrowings | | | 0.00% | 5 | | | 0.00% | | | | 0.00% | | | | 0.00% | | | | 0.00% | |
| | | | |
| Total expenses6 | | | 1.18% | | | | 1.17% | | | | 1.20% | | | | 1.22% | | | | 1.23% | |
| Expenses after payments, waivers and/or reimbursements and reduction to custodian expenses | | | 1.18% | | | | 1.17% | | | | 1.20% | | | | 1.22% | | | | 1.23% | |
| |
| Portfolio turnover rate | | | 43% | | | | 52% | | | | 46% | | | | 37% | | | | 35% | |
1. August 29, 2014 and August 30, 2013 represent the last business days of the Fund’s respective reporting periods. See Note 2 of the accompanying Notes.
2. Per share amounts calculated based on the average shares outstanding during the period.
3. Assumes an initial investment on the business day before the first day of the fiscal period, with all dividends and distributions reinvested in additional shares on the reinvestment date, and redemption at the net asset value calculated on the last business day of the fiscal period. Sales charges are not reflected in the total returns. Total returns are not annualized for periods less than one full year. Returns do not reflect the deduction of taxes that a shareholder would pay on fund distributions or the redemption of fund shares. The returns do not include adjustments in accordance with generally accepted accounting principles required at the period end for financial reporting purposes.
4. Annualized for periods less than one full year.
5. Less than 0.005%.
6. Total expenses including indirect expenses from affiliated fund fees and expenses were as follows:
| | | | | | |
| | Year Ended August 31, 2015 | | 1.18% | | |
| | Year Ended August 29, 2014 | | 1.17% | |
| | Year Ended August 30, 2013 | | 1.20% | |
| | Year Ended August 31, 2012 | | 1.22% | |
| | Year Ended August 31, 2011 | | 1.23% | |
See accompanying Notes to Financial Statements.
24 OPPENHEIMER MAIN STREET FUND
| | | | | | | | | | | | | | | | | | | | |
| Class Y | | Year Ended
August 31,
2015 | | | Year Ended
August 29,
20141 | | | Year Ended
August 30,
20131 | | | Year Ended
August 31,
2012 | | | Year Ended
August 31,
2011 | |
| |
Per Share Operating Data | | | | | | | | | | | | | | | | | | | | |
| Net asset value, beginning of period | | $ | 52.48 | | | $ | 42.30 | | | $ | 36.81 | | | $ | 31.04 | | | $ | 27.27 | |
| |
| Income (loss) from investment operations: | | | | | | | | | | | | | | | | | | | | |
| Net investment income2 | | | 0.46 | | | | 0.40 | | | | 0.49 | | | | 0.40 | | | | 0.33 | |
| Net realized and unrealized gain | | | 0.26 | | | | 10.32 | | | | 5.72 | | | | 5.67 | | | | 3.75 | |
| | | | |
| Total from investment operations | | | 0.72 | | | | 10.72 | | | | 6.21 | | | | 6.07 | | | | 4.08 | |
| |
| Dividends and/or distributions to shareholders: | | | | | | | | | | | | | | | | | | | | |
| Dividends from net investment income | | | (0.48 | ) | | | (0.54 | ) | | | (0.72 | ) | | | (0.30 | ) | | | (0.31 | ) |
| Distributions from net realized gain | | | (5.35 | ) | | | 0.00 | | | | 0.00 | | | | 0.00 | | | | 0.00 | |
| | | | |
| Total dividends and/or distributions to shareholders | | | (5.83 | ) | | | (0.54 | ) | | | (0.72 | ) | | | (0.30 | ) | | | (0.31 | ) |
| |
| Net asset value, end of period | | $ | 47.37 | | | $ | 52.48 | | | $ | 42.30 | | | $ | 36.81 | | | $ | 31.04 | |
| | | | |
|
| |
Total Return, at Net Asset Value3 | | | 1.23% | | | | 25.52% | | | | 17.18% | | | | 19.70% | | | | 14.94% | |
| |
Ratios/Supplemental Data | | | | | | | | | | | | | | | | | | | | |
| Net assets, end of period (in thousands) | | $ | 664,474 | | | $ | 664,996 | | | $ | 723,798 | | | $ | 242,186 | | | $ | 117,659 | |
| |
| Average net assets (in thousands) | | $ | 693,669 | | | $ | 655,922 | | | $ | 469,824 | | | $ | 192,143 | | | $ | 117,050 | |
| |
| Ratios to average net assets:4 | | | | | | | | | | | | | | | | | | | | |
| Net investment income | | | 0.94% | | | | 0.84% | | | | 1.21% | | | | 1.16% | | | | 1.03% | |
| Expenses excluding interest and fees from borrowings | | | 0.69% | | | | 0.67% | | | | 0.61% | | | | 0.54% | | | | 0.57% | |
| Interest and fees from borrowings | | | 0.00% | 5 | | | 0.00% | | | | 0.00% | | | | 0.00% | | | | 0.00% | |
| | | | |
| Total expenses6 | | | 0.69% | | | | 0.67% | | | | 0.61% | | | | 0.54% | | | | 0.57% | |
| Expenses after payments, waivers and/or reimbursements and reduction to custodian expenses | | | 0.69% | | | | 0.67% | | | | 0.61% | | | | 0.54% | | | | 0.57% | |
| |
| Portfolio turnover rate | | | 43% | | | | 52% | | | | 46% | | | | 37% | | | | 35% | |
1. August 29, 2014 and August 30, 2013 represent the last business days of the Fund’s respective reporting periods. See Note 2 of the accompanying Notes.
2. Per share amounts calculated based on the average shares outstanding during the period.
3. Assumes an initial investment on the business day before the first day of the fiscal period, with all dividends and distributions reinvested in additional shares on the reinvestment date, and redemption at the net asset value calculated on the last business day of the fiscal period. Sales charges are not reflected in the total returns. Total returns are not annualized for periods less than one full year. Returns do not reflect the deduction of taxes that a shareholder would pay on fund distributions or the redemption of fund shares. The returns do not include adjustments in accordance with generally accepted accounting principles required at the period end for financial reporting purposes.
4. Annualized for periods less than one full year.
5. Less than 0.005%.
6. Total expenses including indirect expenses from affiliated fund fees and expenses were as follows:
| | | | | | |
| | Year Ended August 31, 2015 | | 0.69% | | |
| | Year Ended August 29, 2014 | | 0.67% | |
| | Year Ended August 30, 2013 | | 0.61% | |
| | Year Ended August 31, 2012 | | 0.54% | |
| | Year Ended August 31, 2011 | | 0.57% | |
See accompanying Notes to Financial Statements.
25 OPPENHEIMER MAIN STREET FUND
NOTES TO FINANCIAL STATEMENTS August 31, 2015
1. Organization
Oppenheimer Main Street Fund (the “Fund”) is a separate series of Oppenheimer Main Street Funds, a diversified open-end management investment company registered under the Investment Company Act of 1940 (“1940 Act”), as amended. The Fund’s investment objective is to seek capital appreciation. The Fund’s investment adviser is OFI Global Asset Management, Inc. (“OFI Global” or the “Manager”), a wholly-owned subsidiary of OppenheimerFunds, Inc. (“OFI” or the “Sub-Adviser”). The Manager has entered into a sub-advisory agreement with OFI.
The Fund offers Class A, Class C, Class I, Class R and Class Y shares, and previously offered Class B shares for new purchase through June 29, 2012. Subsequent to that date, no new purchases of Class B shares are permitted, however reinvestment of dividend and/or capital gain distributions and exchanges of Class B shares into and from other Oppenheimer funds will be allowed. As of July 1, 2014, Class N shares were renamed Class R shares. Class N shares subject to a contingent deferred sales charge (“CDSC”) on July 1, 2014, continue to be subject to a CDSC after the shares were renamed. Purchases of Class R shares occurring on or after July 1, 2014, are not subject to a CDSC upon redemption. Class A shares are sold at their offering price, which is normally net asset value plus a front-end sales charge. Class C and Class R shares are sold, and Class B shares were sold, without a front-end sales charge but may be subject to a contingent deferred sales charge (“CDSC”). Class R shares are sold only through retirement plans. Retirement plans that offer Class R shares may impose charges on those accounts. Class I and Class Y shares are sold to certain institutional investors or intermediaries without either a front-end sales charge or a CDSC, however, the intermediaries may impose charges on their accountholders who beneficially own Class I and Class Y shares. All classes of shares have identical rights and voting privileges with respect to the Fund in general and exclusive voting rights on matters that affect that class alone. Earnings, net assets and net asset value per share may differ due to each class having its own expenses, such as transfer and shareholder servicing agent fees and shareholder communications, directly attributable to that class. Class A, B, C and R shares have separate distribution and/or service plans under which they pay fees. Class I and Class Y shares do not pay such fees. Class B shares will automatically convert to Class A shares 72 months after the date of purchase.
The following is a summary of significant accounting policies followed in the Fund’s preparation of financial statements in accordance with accounting principles generally accepted in the United States (“U.S. GAAP”).
2. Significant Accounting Policies
Security Valuation. All investments in securities are recorded at their estimated fair value, as described in Note 3.
Reporting Period End Date. The last day of the Fund’s reporting period is the last day the New York Stock Exchange was open for trading during the period. The Fund’s financial
26 OPPENHEIMER MAIN STREET FUND
|
2. Significant Accounting Policies (Continued) |
statements have been presented through that date to maintain consistency with the Fund’s net asset value calculations used for shareholder transactions.
Foreign Currency Translation. The Fund’s accounting records are maintained in U.S. dollars. The values of securities denominated in foreign currencies and amounts related to the purchase and sale of foreign securities and foreign investment income are translated into U.S. dollars as of the close of the New York Stock Exchange (the “Exchange”), normally 4:00 P.M. Eastern time, on each day the Exchange is open for trading. Foreign exchange rates may be valued primarily using a reliable bank, dealer or service authorized by the Board of Trustees.
Reported net realized gains and losses from foreign currency transactions arise from sales of portfolio securities, sales and maturities of short-term securities, sales of foreign currencies, exchange rate fluctuations between the trade and settlement dates on securities transactions, and the difference between the amounts of dividends, interest, and foreign withholding taxes recorded on the Fund’s books and the U.S. dollar equivalent of the amounts actually received or paid. Net unrealized appreciation and depreciation on the translation of assets and liabilities denominated in foreign currencies arise from changes in the values of assets and liabilities, including investments in securities at fiscal period end, resulting from changes in exchange rates.
The effect of changes in foreign currency exchange rates on investments is separately identified from the fluctuations arising from changes in market values of securities held and reported with all other foreign currency gains and losses in the Fund’s Statement of Operations.
Allocation of Income, Expenses, Gains and Losses. Income, expenses (other than those attributable to a specific class), gains and losses are allocated on a daily basis to each class of shares based upon the relative proportion of net assets represented by such class. Operating expenses directly attributable to a specific class are charged against the operations of that class.
Dividends and Distributions to Shareholders. Dividends and distributions to shareholders, which are determined in accordance with income tax regulations and may differ from U.S. generally accepted accounting principles, are recorded on the ex-dividend date. Income and capital gain distributions, if any, are declared and paid annually or at other times as deemed necessary by the Manager.
Investment Income. Dividend income is recorded on the ex-dividend date or upon ex-dividend notification in the case of certain foreign dividends where the ex-dividend date may have passed. Non-cash dividends included in dividend income, if any, are recorded at the fair market value of the securities received. Interest income is recognized on an accrual basis. Discount and premium, which are included in interest income on the Statement of Operations, are amortized or accreted daily.
27 OPPENHEIMER MAIN STREET FUND
NOTES TO FINANCIAL STATEMENTS Continued
2. Significant Accounting Policies (Continued)
Return of Capital Estimates. Distributions received from the Fund’s investments in Master Limited Partnerships (MLPs) and Real Estate Investments Trusts (REITs), generally are comprised of income and return of capital. The Fund records investment income and return of capital based on estimates made at the time such distributions are received. Such estimates are based on historical information available from each MLP, REIT and other industry sources. These estimates may subsequently be revised based on information received from MLPs and REITs after their tax reporting periods are concluded.
Custodian Fees. “Custodian fees and expenses” in the Statement of Operations may include interest expense incurred by the Fund on any cash overdrafts of its custodian account during the period. Such cash overdrafts may result from the effects of failed trades in portfolio securities and from cash outflows resulting from unanticipated shareholder redemption activity. The Fund pays interest to its custodian on such cash overdrafts, to the extent they are not offset by positive cash balances maintained by the Fund, at a rate equal to the Federal Funds Rate plus 0.50%. The “Reduction to custodian expenses” line item, if applicable, represents earnings on cash balances maintained by the Fund during the period. Such interest expense and other custodian fees may be paid with these earnings.
Security Transactions. Security transactions are recorded on the trade date. Realized gains and losses on securities sold are determined on the basis of identified cost.
Indemnifications. The Fund’s organizational documents provide current and former Trustees and officers with a limited indemnification against liabilities arising in connection with the performance of their duties to the Fund. In the normal course of business, the Fund may also enter into contracts that provide general indemnifications. The Fund’s maximum exposure under these arrangements is unknown as this would be dependent on future claims that may be made against the Fund. The risk of material loss from such claims is considered remote.
Federal Taxes. The Fund intends to comply with provisions of the Internal Revenue Code applicable to regulated investment companies and to distribute substantially all of its investment company taxable income, including any net realized gain on investments not offset by capital loss carryforwards, if any, to shareholders. Therefore, no federal income or excise tax provision is required. The Fund files income tax returns in U.S. federal and applicable state jurisdictions. The statute of limitations on the Fund’s tax return filings generally remains open for the three preceding fiscal reporting period ends.
The tax components of capital shown in the following table represent distribution requirements the Fund must satisfy under the income tax regulations, losses the Fund may be able to offset against income and gains realized in future years and unrealized appreciation or depreciation of securities and other investments for federal income tax purposes.
28 OPPENHEIMER MAIN STREET FUND
|
2. Significant Accounting Policies (Continued) |
| | | | | | | | | | | | |
Undistributed Net Investment Income | | Undistributed
Long-Term
Gain | | | Accumulated
Loss
Carryforward1,2,3 | | | Net Unrealized
Appreciation
Based on cost of
Securities and
Other Investments
for Federal Income
Tax Purposes | |
| |
$80,681,271 | | | $613,928,834 | | | | $563,361 | | | | $1,376,435,270 | |
1. At period end, the Fund had $563,361 of net capital loss carryforward available to offset future realized capital gains, if any, and thereby reduce future taxable gain distributions. Details of the capital loss carryforwards are included in the table below. Capital loss carryovers with no expiration, if any, must be utilized prior to those with expiration dates.
| | | | |
| Expiring | | | |
| |
2016 | | $ | 405,777 | |
2017 | | | 157,584 | |
| | | | |
Total | | $ | 563,361 | |
| | | | |
Of these losses, $563,361 are subject to loss limitation rules resulting from merger activity. The utilization of these losses are limited to $405,777 at 8/31/16 fiscal year end and $157,584 at 8/31/17 fiscal year end.
2. During the reporting period, the Fund utilized $685,289 of capital loss carryforward to offset capital gains realized in that fiscal year.
3. During the previous reporting period, the Fund utilized $369,031,408 of capital loss carryforward to offset capital gains realized in that fiscal year.
Net investment income (loss) and net realized gain (loss) may differ for financial statement and tax purposes. The character of dividends and distributions made during the fiscal year from net investment income or net realized gains determined in accordance with federal income tax requirements, which may differ from the character of net investment income or net realized gains presented in those financial statements in accordance with GAAP. Also, due to timing of dividends and distributions, the fiscal year in which amounts are distributed may differ from the fiscal year in which the income or net realized gain was recorded by the Fund.
Accordingly, the following amounts have been reclassified for the reporting period. Net assets of the Fund were unaffected by the reclassifications.
| | | | | | | | |
Increase to Paid-in Capital | | Reduction to Accumulated
Net Investment
Income | | | Reduction to Accumulated Net
Realized Gain on Investments4 | |
| |
$40,328,095 | | | $145,627 | | | | $40,182,468 | |
4. $48,837,718, including $45,020,912 of long-term capital gain, was distributed in connection with Fund share redemptions.
The tax character of distributions paid during the reporting periods:
29 OPPENHEIMER MAIN STREET FUND
|
NOTES TO FINANCIAL STATEMENTS Continued 2. Significant Accounting Policies (Continued) |
| | | | | | | | |
| | | Year Ended
August 31, 2015 | | | Year Ended
August 31, 2014 | |
| |
Distributions paid from: | | | | | | | | |
Ordinary income | | $ | 45,837,073 | | | $ | 42,771,580 | |
Long-term capital gain | | | 745,526,474 | | | | — | |
| | | | | | | | |
Total | | $ | 791,363,547 | | | $ | 42,771,580 | |
| | | | | | | | |
The aggregate cost of securities and other investments and the composition of unrealized appreciation and depreciation of securities and other investments for federal income tax purposes at period end are noted in the following table. The primary difference between book and tax appreciation or depreciation of securities and other investments, if applicable, is attributable to the tax deferral of losses or tax realization of financial statement unrealized gain or loss.
| | | | |
Federal tax cost of securities | | $ | 5,611,095,921 | |
| | | | |
Gross unrealized appreciation | | $ | 1,680,225,574 | |
Gross unrealized depreciation | | | (303,790,304) | |
| | | | |
Net unrealized appreciation | | $ | 1,376,435,270 | |
| | | | |
Use of Estimates. The preparation of financial statements in conformity with accounting principles generally accepted in the United States of America requires management to make estimates and assumptions that affect the reported amounts of assets and liabilities and disclosure of contingent assets and liabilities at the date of the financial statements and the reported amounts of increases and decreases in net assets from operations during the reporting period. Actual results could differ from those estimates.
3. Securities Valuation
The Fund calculates the net asset value of its shares as of the close of the New York Stock Exchange (the “Exchange”), normally 4:00 P.M. Eastern time, on each day the Exchange is open for trading.
The Fund’s Board has adopted procedures for the valuation of the Fund’s securities and has delegated the day-to-day responsibility for valuation determinations under those procedures to the Manager. The Manager has established a Valuation Committee which is responsible for determining a “fair valuation” for any security for which market quotations are not “readily available.” The Valuation Committee’s fair valuation determinations are subject to review, approval and ratification by the Fund’s Board at its next regularly scheduled meeting covering the calendar quarter in which the fair valuation was determined.
Valuation Methods and Inputs
Securities are valued using unadjusted quoted market prices, when available, as supplied primarily by third party pricing services or dealers.
The following methodologies are used to determine the market value or the fair value of the types of securities described below:
30 OPPENHEIMER MAIN STREET FUND
|
3. Securities Valuation (Continued) |
Securities traded on a registered U.S. securities exchange (including exchange-traded derivatives other than futures and futures options) are valued based on the last sale price of the security reported on the principal exchange on which it is traded, prior to the time when the Fund’s assets are valued. In the absence of a sale, the security is valued at the last sale price on the prior trading day, if it is within the spread of the current day’s closing “bid” and “asked” prices, and if not, at the current day’s closing bid price. A security of a foreign issuer traded on a foreign exchange, but not listed on a registered U.S. securities exchange, is valued based on the last sale price on the principal exchange on which the security is traded, as identified by the third party pricing service used by the Manager, prior to the time when the Fund’s assets are valued. If the last sale price is unavailable, the security is valued at the most recent official closing price on the principal exchange on which it is traded. If the last sales price or official closing price for a foreign security is not available, the security is valued at the mean between the bid and asked price per the exchange or, if not available from the exchange, obtained from two dealers. If bid and asked prices are not available from either the exchange or two dealers, the security is valued by using one of the following methodologies (listed in order of priority): (1) using a bid from the exchange, (2) the mean between the bid and asked price as provided by a single dealer, or (3) a bid from a single dealer.
Shares of a registered investment company that are not traded on an exchange are valued at that investment company’s net asset value per share.
Corporate and government debt securities (of U.S. or foreign issuers) and municipal debt securities, event-linked bonds, loans, mortgage-backed securities, collateralized mortgage obligations, and asset-backed securities are valued at the mean between the “bid” and “asked” prices utilizing evaluated prices obtained from third party pricing services or broker-dealers who may use matrix pricing methods to determine the evaluated prices.
Short-term money market type debt securities with a remaining maturity of sixty days or less are valued at cost adjusted by the amortization of discount or premium to maturity (amortized cost), which approximates market value. Short-term debt securities with a remaining maturity in excess of sixty days are valued at the mean between the “bid” and “asked” prices utilizing evaluated prices obtained from third party pricing services or broker-dealers.
A description of the standard inputs that may generally be considered by the third party pricing vendors in determining their evaluated prices is provided below.
| | |
| Security Type | | Standard inputs generally considered by third-party pricing vendors |
|
| Corporate debt, government debt, municipal, mortgage-backed and asset-backed securities | | Reported trade data, broker-dealer price quotations, benchmark yields, issuer spreads on comparable securities, the credit quality, yield, maturity, and other appropriate factors. |
|
| Loans | | Information obtained from market participants regarding reported trade data and broker-dealer price quotations. |
|
| Event-linked bonds | | Information obtained from market participants regarding reported trade data and broker-dealer price quotations. |
31 OPPENHEIMER MAIN STREET FUND
|
NOTES TO FINANCIAL STATEMENTS Continued 3. Securities Valuation (Continued) |
If a market value or price cannot be determined for a security using the methodologies described above, or if, in the “good faith” opinion of the Manager, the market value or price obtained does not constitute a “readily available market quotation,” or a significant event has occurred that would materially affect the value of the security, the security is fair valued either (i) by a standardized fair valuation methodology applicable to the security type or the significant event as previously approved by the Valuation Committee and the Fund’s Board or (ii) as determined in good faith by the Manager’s Valuation Committee. The Valuation Committee considers all relevant facts that are reasonably available, through either public information or information available to the Manager, when determining the fair value of a security. Fair value determinations by the Manager are subject to review, approval and ratification by the Fund’s Board at its next regularly scheduled meeting covering the calendar quarter in which the fair valuation was determined. Those fair valuation standardized methodologies include, but are not limited to, valuing securities at the last sale price or initially at cost and subsequently adjusting the value based on: changes in company specific fundamentals, changes in an appropriate securities index, or changes in the value of similar securities which may be further adjusted for any discounts related to security-specific resale restrictions. When possible, such methodologies use observable market inputs such as unadjusted quoted prices of similar securities, observable interest rates, currency rates and yield curves. The methodologies used for valuing securities are not necessarily an indication of the risks associated with investing in those securities nor can it be assured that the Fund can obtain the fair value assigned to a security if it were to sell the security.
To assess the continuing appropriateness of security valuations, the Manager, or its third party service provider who is subject to oversight by the Manager, regularly compares prior day prices, prices on comparable securities, and sale prices to the current day prices and challenges those prices exceeding certain tolerance levels with the third party pricing service or broker source. For those securities valued by fair valuations, whether through a standardized fair valuation methodology or a fair valuation determination, the Valuation Committee reviews and affirms the reasonableness of the valuations based on such methodologies and fair valuation determinations on a regular basis after considering all relevant information that is reasonably available.
Classifications
Each investment asset or liability of the Fund is assigned a level at measurement date based on the significance and source of the inputs to its valuation. Various data inputs are used in determining the value of each of the Fund’s investments as of the reporting period end. These data inputs are categorized in the following hierarchy under applicable financial accounting standards:
1) Level 1-unadjusted quoted prices in active markets for identical assets or liabilities (including securities actively traded on a securities exchange)
2) Level 2-inputs other than unadjusted quoted prices that are observable for the asset or liability (such as unadjusted quoted prices for similar assets and market corroborated inputs such as interest rates, prepayment speeds, credit risks, etc.)
32 OPPENHEIMER MAIN STREET FUND
|
3. Securities Valuation (Continued) |
3) Level 3-significant unobservable inputs (including the Manager’s own judgments about assumptions that market participants would use in pricing the asset or liability).
The inputs used for valuing securities are not necessarily an indication of the risks associated with investing in those securities.
The table below categorizes amounts that are included in the Fund’s Statement of Assets and Liabilities at period end based on valuation input level:
| | | | | | | | | | | | | | | | |
| | | Level 1— Unadjusted Quoted Prices | | | Level 2— Other Significant Observable Inputs | | | Level 3— Significant Unobservable Inputs | | | Value | |
| |
Assets Table | | | | | | | | | | | | | | | | |
Investments, at Value: | | | | | | | | | | | | | | | | |
Common Stocks | | | | | | | | | | | | | | | | |
Consumer Discretionary | | $ | 753,061,164 | | | $ | — | | | $ | — | | | $ | 753,061,164 | |
Consumer Staples | | | 591,112,129 | | | | 163,454,724 | | | | — | | | | 754,566,853 | |
Energy | | | 447,970,728 | | | | — | | | | — | | | | 447,970,728 | |
Financials | | | 1,282,727,252 | | | | — | | | | — | | | | 1,282,727,252 | |
Health Care | | | 1,087,888,329 | | | | — | | | | — | | | | 1,087,888,329 | |
Industrials | | | 761,865,153 | | | | — | | | | — | | | | 761,865,153 | |
Information Technology | | | 1,279,356,484 | | | | — | | | | — | | | | 1,279,356,484 | |
Materials | | | 111,714,899 | | | | — | | | | — | | | | 111,714,899 | |
Telecommunication Services | | | 115,837,076 | | | | — | | | | — | | | | 115,837,076 | |
Utilities | | | 229,136,494 | | | | — | | | | — | | | | 229,136,494 | |
Investment Company | | | 163,401,761 | | | | — | | | | — | | | | 163,401,761 | |
| | | | |
Total Assets | | $ | 6,824,071,469 | | | $ | 163,454,724 | | | $ | — | | | $ | 6,987,526,193 | |
| | | | |
Forward currency exchange contracts and futures contracts, if any, are reported at their unrealized appreciation/depreciation at measurement date, which represents the change in the contract’s value from trade date. All additional assets and liabilities included in the above table are reported at their market value at measurement date.
4. Investments and Risks
Investments in Affiliated Funds. The Fund is permitted to invest in other mutual funds advised by the Manager (“Affiliated Funds”). Affiliated Funds are open-end management investment companies registered under the 1940 Act, as amended. The Manager is the investment adviser of, and the Sub-Adviser provides investment and related advisory services to, the Affiliated Funds. When applicable, the Fund’s investments in Affiliated Funds are included in the Statement of Investments. Shares of Affiliated Funds are valued at their net asset value per share. As a shareholder, the Fund is subject to its proportional share of the Affiliated Funds’ expenses, including their management fee. The Manager will waive fees and/or reimburse Fund expenses in an amount equal to the indirect management fees incurred through the Fund’s investment in the Affiliated Funds.
Each of the Affiliated Funds in which the Fund invests has its own investment risks, and those risks can affect the value of the Fund’s investments and therefore the value of the
33 OPPENHEIMER MAIN STREET FUND
|
NOTES TO FINANCIAL STATEMENTS Continued 4. Investments and Risks (Continued) |
Fund’s shares. To the extent that the Fund invests more of its assets in one Affiliated Fund than in another, the Fund will have greater exposure to the risks of that Affiliated Fund.
Investment in Oppenheimer Institutional Money Market Fund. The Fund is permitted to invest daily available cash balances in a money market Affiliated Fund. The Fund may invest the available cash in Class E shares of Oppenheimer Institutional Money Market Fund (“IMMF”) to seek current income while preserving liquidity or for defensive purposes. IMMF is regulated as a money market fund under the Investment Company Act of 1940, as amended.
Master Limited Partnerships (“MLPs”). MLPs issue common units that represent an equity ownership interest in a partnership and provide limited voting rights. MLP common units are registered with the Securities and Exchange Commission (“SEC”), and are freely tradable on securities exchanges such as the NYSE and the NASDAQ Stock Market (“NASDAQ”), or in the over-the-counter (“OTC”) market. An MLP consists of one or more general partners, who conduct the business, and one or more limited partners, who contribute capital. MLP common unit holders have a limited role in the partnership’s operations and management. The Fund, as a limited partner, normally would not be liable for the debts of the MLP beyond the amounts the Fund has contributed, but would not be shielded to the same extent that a shareholder of a corporation would be. In certain circumstances creditors of an MLP would have the right to seek return of capital distributed to a limited partner. This right of an MLP’s creditors would continue after the Fund sold its investment in the MLP.
Equity Security Risk. Stocks and other equity securities fluctuate in price. The value of the Fund’s portfolio may be affected by changes in the equity markets generally. Equity markets may experience significant short-term volatility and may fall sharply at times. Different markets may behave differently from each other and U.S. equity markets may move in the opposite direction from one or more foreign stock markets. Adverse events in any part of the equity or fixed-income markets may have unexpected negative effects on other market segments.
The prices of individual equity securities generally do not all move in the same direction at the same time and a variety of factors can affect the price of a particular company’s securities. These factors may include, but are not limited to, poor earnings reports, a loss of customers, litigation against the company, general unfavorable performance of the company’s sector or industry, or changes in government regulations affecting the company or its industry.
5. Shares of Beneficial Interest
The Fund has authorized an unlimited number of $0.001 par value shares of beneficial interest of each class. Transactions in shares of beneficial interest were as follows:
34 OPPENHEIMER MAIN STREET FUND
|
5. Shares of Beneficial Interest (Continued) |
| | | | | | | | | | | | | | | | |
| | | Year Ended August 31, 2015 | | | Year Ended August 29, 20141 | |
| | | Shares | | | Amount | | | Shares | | | Amount | |
| |
Class A | | | | | | | | | | | | | | | | |
| Sold | | | 6,724,541 | | | $ | 333,444,173 | | | | 6,401,475 | | | $ | 309,467,062 | |
| Dividends and/or distributions reinvested | | | 11,578,907 | | | | 560,766,530 | | | | 670,830 | | | | 31,269,321 | |
| Redeemed | | | (12,890,380 | ) | | | (639,095,161 | ) | | | (12,348,590 | ) | | | (595,204,924 | ) |
| | | | |
| Net increase (decrease) | | | 5,413,068 | | | $ | 255,115,542 | | | | (5,276,285 | ) | | $ | (254,468,541 | ) |
| | | | |
|
| |
Class B | | | | | | | | | | | | | | | | |
| Sold | | | 65,259 | | | $ | 3,105,495 | | | | 114,133 | | | $ | 5,390,065 | |
| Dividends and/or distributions reinvested | | | 363,094 | | | | 16,949,219 | | | | — | | | | — | |
| Redeemed | | | (1,597,639 | ) | | | (76,690,194 | ) | | | (1,480,563 | ) | | | (68,585,711 | ) |
| | | | |
| Net decrease | | | (1,169,286 | ) | | $ | (56,635,480 | ) | | | (1,366,430 | ) | | $ | (63,195,646 | ) |
| | | | |
|
| |
Class C | | | | | | | | | | | | | | | | |
| Sold | | | 1,281,101 | | | $ | 60,692,660 | | | | 1,005,757 | | | $ | 46,541,449 | |
| Dividends and/or distributions reinvested | | | 1,410,952 | | | | 65,651,599 | | | | — | | | | — | |
| Redeemed | | | (1,964,329 | ) | | | (93,384,775 | ) | | | (1,923,393 | ) | | | (89,028,618 | ) |
| | | | |
| Net increase (decrease) | | | 727,724 | | | $ | 32,959,484 | | | | (917,636 | ) | | $ | (42,487,169 | ) |
| | | | |
|
| |
Class I | | | | | | | | | | | | | | | | |
| Sold | | | 1,115,702 | | | $ | 55,144,474 | | | | 5,997,348 | | | $ | 282,983,589 | |
| Dividends and/or distributions reinvested | | | 686,875 | | | | 32,969,982 | | | | 26,824 | | | | 1,274,371 | |
| Redeemed | | | (1,570,185 | ) | | | (76,863,677 | ) | | | (987,659 | ) | | | (47,887,762 | ) |
| | | | |
| Net increase | | | 232,392 | | | $ | 11,250,779 | | | | 5,036,513 | | | $ | 236,370,198 | |
| | | | |
|
| |
Class R2 | | | | | | | | | | | | | | | | |
| Sold | | | 434,094 | | | $ | 21,104,666 | | | | 448,740 | | | $ | 21,251,150 | |
| Dividends and/or distributions reinvested | | | 259,961 | | | | 12,431,322 | | | | 9,939 | | | | 458,186 | |
| Redeemed | | | (520,132 | ) | | | (25,344,081 | ) | | | (706,581 | ) | | | (33,383,666 | ) |
| | | | |
| Net increase (decrease) | | | 173,923 | | | $ | 8,191,907 | | | | (247,902 | ) | | $ | (11,674,330 | ) |
| | | | |
|
| |
Class Y | | | | | | | | | | | | | | | | |
| Sold | | | 3,073,725 | | | $ | 153,287,175 | | | | 2,906,362 | | | $ | 140,110,266 | |
| Dividends and/or distributions reinvested | | | 1,586,409 | | | | 76,258,670 | | | | 181,045 | | | | 8,442,176 | |
| Redeemed | | | (3,303,235 | ) | | | (162,899,991 | ) | | | (7,527,290 | ) | | | (355,223,239 | ) |
| | | | |
| Net increase (decrease) | | | 1,356,899 | | | $ | 66,645,854 | | | | (4,439,883 | ) | | $ | (206,670,797 | ) |
| | | | |
1. August 29, 2014 represents the last business day of the Fund’s reporting period. See Note 2.
2. Effective July 1, 2014, Class N shares were renamed Class R. See Note 1.
35 OPPENHEIMER MAIN STREET FUND
NOTES TO FINANCIAL STATEMENTS Continued
6. Purchases and Sales of Securities
The aggregate cost of purchases and proceeds from sales of securities, other than short-term obligations and investments in IMMF, for the reporting period were as follows:
| | | | | | | | | | |
| | | Purchases | | | | | Sales | |
| |
| Investment securities | | | $3,094,531,364 | | | | | | $3,545,995,052 | |
7. Fees and Other Transactions with Affiliates
Management Fees. Under the investment advisory agreement, the Fund pays the Manager a management fee based on the daily net assets of the Fund at an annual rate as shown in the following table:
| | | | |
| Fee Schedule | |
| |
| Up to $200 million | | | 0.65% | |
| Next $150 million | | | 0.60 | |
| Next $150 million | | | 0.55 | |
| Next $9.5 billion | | | 0.45 | |
| Over $10 billion | | | 0.43 | |
The Fund’s effective management fee for the reporting period was 0.46% of average annual net assets before any applicable waivers.
Sub-Adviser Fees. The Manager has retained the Sub-Adviser to provide the day-to-day portfolio management of the Fund. Under the Sub-Advisory Agreement, the Manager pays the Sub-Adviser an annual fee in monthly installments, equal to a percentage of the investment management fee collected by the Manager from the Fund, which shall be calculated after any investment management fee waivers. The fee paid to the Sub-Adviser is paid by the Manager, not by the Fund.
Transfer Agent Fees. OFI Global (the “Transfer Agent”) serves as the transfer and shareholder servicing agent for the Fund. The Fund pays the Transfer Agent a fee based on annual net assets. Fees incurred and average net assets for each class with respect to these services are detailed in the Statement of Operations and Financial Highlights, respectively.
Sub-Transfer Agent Fees. The Transfer Agent has retained Shareholder Services, Inc., a wholly-owned subsidiary of OFI (the “Sub-Transfer Agent”), to provide the day-to-day transfer agent and shareholder servicing of the Fund. Under the Sub-Transfer Agency Agreement, the Transfer Agent pays the Sub-Transfer Agent an annual fee in monthly installments, equal to a percentage of the transfer agent fee collected by the Transfer Agent from the Fund, which shall be calculated after any applicable fee waivers. The fee paid to the Sub-Transfer Agent is paid by the Transfer Agent, not by the Fund.
Trustees’ Compensation. The Fund’s Board of Trustees (“Board”) has adopted a compensation deferral plan for Independent Trustees that enables Trustees to elect to defer receipt of all or a portion of the annual compensation they are entitled to receive from the Fund. For purposes of determining the amount owed to the Trustee under the plan, deferred
36 OPPENHEIMER MAIN STREET FUND
|
7. Fees and Other Transactions with Affiliates (Continued) |
amounts are treated as though equal dollar amounts had been invested in shares of the Fund or in other Oppenheimer funds selected by the Trustee. The Fund purchases shares of the funds selected for deferral by the Trustee in amounts equal to his or her deemed investment, resulting in a Fund asset equal to the deferred compensation liability. Such assets are included as a component of “Other” within the asset section of the Statement of Assets and Liabilities. Deferral of Trustees’ fees under the plan will not affect the net assets of the Fund and will not materially affect the Fund’s assets, liabilities or net investment income per share. Amounts will be deferred until distributed in accordance with the compensation deferral plan.
Distribution and Service Plan (12b-1) Fees. Under its General Distributor’s Agreement with the Fund, OppenheimerFunds Distributor, Inc. (the “Distributor”) acts as the Fund’s principal underwriter in the continuous public offering of the Fund’s classes of shares.
Service Plan for Class A Shares. The Fund has adopted a Service Plan (the “Plan”) for Class A shares pursuant to Rule 12b-1 under the 1940 Act. Under the Plan, the Fund reimburses the Distributor for a portion of its costs incurred for services provided to accounts that hold Class A shares. Reimbursement is made periodically at an annual rate of up to 0.25% of the daily net assets of Class A shares of the Fund. The Distributor currently uses all of those fees to pay dealers, brokers, banks and other financial institutions periodically for providing personal service and maintenance of accounts of their customers that hold Class A shares. Any unreimbursed expenses the Distributor incurs with respect to Class A shares in any fiscal year cannot be recovered in subsequent periods. Fees incurred by the Fund under the Plan are detailed in the Statement of Operations.
Distribution and Service Plans for Class B, Class C and Class R Shares. The Fund has adopted Distribution and Service Plans (the “Plans”) for Class B, Class C and Class R shares pursuant to Rule 12b-1 under the 1940 Act to compensate the Distributor for distributing those share classes, maintaining accounts and providing shareholder services. Under the Plans, the Fund pays the Distributor an annual asset-based sales charge of 0.75% on Class B and Class C shares’ daily net assets and 0.25% on Class R shares’ daily net assets. The Fund also pays a service fee under the Plans at an annual rate of 0.25% of daily net assets. The Plans continue in effect from year to year only if the Fund’s Board of Trustees votes annually to approve their continuance at an in person meeting called for that purpose. Fees incurred by the Fund under the Plans are detailed in the Statement of Operations.
Sales Charges. Front-end sales charges and CDSC do not represent expenses of the Fund. They are deducted from the proceeds of sales of Fund shares prior to investment or from redemption proceeds prior to remittance, as applicable. The sales charges retained by the Distributor from the sale of shares and the CDSC retained by the Distributor on the redemption of shares is shown in the following table for the period indicated.
37 OPPENHEIMER MAIN STREET FUND
NOTES TO FINANCIAL STATEMENTS Continued
7. Fees and Other Transactions with Affiliates (Continued)
| | | | | | | | | | | | | | | | | | | | |
| Year Ended | | Class A Front-End Sales Charges Retained by Distributor | | | Class A Contingent Deferred Sales Charges Retained by Distributor | | | Class B Contingent Deferred Sales Charges Retained by Distributor | | | Class C Contingent Deferred Sales Charges Retained by Distributor | | | Class R Contingent Deferred Sales Charges Retained by Distributor | |
| |
August 31, 2015 | | | $1,083,408 | | | | $3,917 | | | | $100,457 | | | | $26,838 | | | | $3,049 | |
Waivers and Reimbursements of Expenses. The Manager will waive fees and/or reimburse Fund expenses in an amount equal to the indirect management fees incurred through the Fund’s investment in IMMF. During the reporting period, the Manager waived fees and/or reimbursed the Fund $132,847 for IMMF management fees.
Waivers and/or reimbursements may be modified or terminated as set forth according to the terms in the prospectus.
8. Borrowings and Other Financing
Joint Credit Facility. A number of mutual funds managed by the Manager participate in a $1.28 billion revolving credit facility (the “Facility”) intended to provide short-term financing, if necessary, subject to certain restrictions in connection with atypical redemption activity. Expenses and fees related to the Facility are paid by the participating funds and are disclosed separately or as other expenses on the Statement of Operations. The Fund did not utilize the Facility during the period.
9. Pending Litigation
In 2009, several putative class action lawsuits were filed and later consolidated before the U.S. District Court for the District of Colorado against OppenheimerFunds, Inc. (“OFI”), OppenheimerFunds Distributor, Inc. (“OFDI”), and Oppenheimer Rochester California Municipal Fund, a fund advised by OFI Global Asset Management, Inc. and distributed by the Distributor (the “California Fund”), in connection with the California Fund’s investment performance. The plaintiffs asserted claims against OFI, OFDI and certain present and former trustees and officers of the California Fund under the federal securities laws, alleging, among other things, that the disclosure documents of the California Fund contained misrepresentations and omissions and the investment policies of the California Fund were not followed. Plaintiffs in the suit filed an amended complaint and defendants filed a motion to dismiss. In 2011, the court issued an order which granted in part and denied in part the defendants’ motion to dismiss. In 2012, plaintiffs filed a motion, which defendants opposed, to certify a class and appoint class representatives and class counsel. In March 2015, the court granted plaintiffs’ motion for class certification. In May 2015, the U.S. Court of Appeals for the Tenth Circuit vacated the class certification order and remanded the matter to the district court for further proceedings. In July 2015, the district court held an evidentiary hearing on plaintiffs’ motion for class certification.
38 OPPENHEIMER MAIN STREET FUND
9. Pending Litigation (Continued)
OFI and OFDI believe the suit is without merit; that it is premature to render any opinion as to the likelihood of an outcome unfavorable to them in the suit; and that no estimate can yet be made as to the amount or range of any potential loss. Furthermore, OFI believes that the suit should not impair the ability of OFI or OFDI to perform their respective duties to the Fund and that the outcome of the suit should not have any material effect on the operations of any of the Oppenheimer funds.
39 OPPENHEIMER MAIN STREET FUND
REPORT OF INDEPENDENT REGISTERED PUBLIC ACCOUNTING FIRM
The Board of Trustees and Shareholders of Oppenheimer Main Street Funds:
We have audited the accompanying statement of assets and liabilities of Oppenheimer Main Street Fund, a separate series of Oppenheimer Main Street Funds, including the statement of investments, as of August 31, 2015, and the related statement of operations for the year then ended, the statements of changes in net assets for each of the years in the two-year period then ended, and the financial highlights for each of the years or periods in the five-year period then ended. These financial statements and financial highlights are the responsibility of the Fund’s management. Our responsibility is to express an opinion on these financial statements and financial highlights based on our audits.
We conducted our audits in accordance with the standards of the Public Company Accounting Oversight Board (United States). Those standards require that we plan and perform the audit to obtain reasonable assurance about whether the financial statements and financial highlights are free of material misstatement. An audit includes examining, on a test basis, evidence supporting the amounts and disclosures in the financial statements. Our procedures included confirmation of securities owned as of August 31, 2015, by correspondence with the custodian, transfer agent and brokers, or by other appropriate auditing procedures where replies from brokers were not received. An audit also includes assessing the accounting principles used and significant estimates made by management, as well as evaluating the overall financial statement presentation. We believe that our audits provide a reasonable basis for our opinion.
In our opinion, the financial statements and financial highlights referred to above present fairly, in all material respects, the financial position of Oppenheimer Main Street Fund as of August 31, 2015, the results of its operations for the year then ended, the changes in its net assets for each of the years in the two-year period then ended, and the financial highlights for each of the years or periods in the five-year period then ended, in conformity with U.S. generally accepted accounting principles.
KPMG LLP
Denver, Colorado
October 12, 2015
40 OPPENHEIMER MAIN STREET FUND
FEDERAL INCOME TAX INFORMATION Unaudited
In early 2015, if applicable, shareholders of record received information regarding all dividends and distributions paid to them by the Fund during calendar year 2014.
Capital gain distributions of $5.35212 per share were paid to Class A, Class B, Class C, Class I, Class R and Class Y shareholders, respectively, on December 3, 2014. Whether received in stock or in cash, the capital gain distribution should be treated by shareholders as a gain from the sale of the capital assets held for more than one year (long-term capital gains).
Dividends, if any, paid by the Fund during the reporting period which are not designated as capital gain distributions should be multiplied by the maximum amount allowable but not less than 100% to arrive at the amount eligible for the corporate dividend-received deduction.
A portion, if any, of the dividends paid by the Fund during the reporting period which are not designated as capital gain distributions are eligible for lower individual income tax rates to the extent that the Fund has received qualified dividend income as stipulated by recent tax legislation. The maximum amount allowable but not less than $114,501,683 of the Fund’s fiscal year taxable income may be eligible for the lower individual income tax rates. In early 2015, shareholders of record received information regarding the percentage of distributions that are eligible for lower individual income tax rates.
Recent tax legislation allows a regulated investment company to designate distributions not designated as capital gain distributions, as either interest related dividends or short-term capital gain dividends, both of which are exempt from the U.S. withholding tax applicable to non U.S. taxpayers. For the reporting period, the maximum amount allowable but not less than $65,756 of the ordinary distributions to be paid by the Fund qualifies as an interest related dividend.
The foregoing information is presented to assist shareholders in reporting distributions received from the Fund to the Internal Revenue Service. Because of the complexity of the federal regulations which may affect your individual tax return and the many variations in state and local tax regulations, we recommend that you consult your tax advisor for specific guidance.
41 OPPENHEIMER MAIN STREET FUND
BOARD APPROVAL OF THE FUND’S INVESTMENT ADVISORY AND SUB-ADVISORY AGREEMENTS Unaudited
The Fund has entered into an investment advisory agreement with OFI Global Asset Management, Inc. (“OFI Global” or the “Adviser”), a wholly-owned subsidiary of OppenheimerFunds, Inc. (“OFI” or the “Sub-Adviser”) (“OFI Global” and “OFI” together the “Managers”) and OFI Global has entered into a sub-advisory agreement with OFI whereby OFI provides investment sub-advisory services to the Fund (collectively, the “Agreements”). Each year, the Board of Trustees (the “Board”), including a majority of the independent Trustees, is required to determine whether to approve the terms of the Agreements and the renewal thereof. The Investment Company Act of 1940, as amended, requires that the Board request and evaluate, and that the Managers provide, such information as may be reasonably necessary to evaluate the terms of the Agreements. The Board employs an independent consultant to prepare a report that provides information, including comparative information that the Board requests for that purpose. In addition to in-person meetings focused on this evaluation, the Board receives information throughout the year regarding Fund services, fees, expenses and performance.
The Adviser, Sub-Adviser and the independent consultant provided information to the Board on the following factors: (i) the nature, quality and extent of the Managers’ services, (ii) the comparative investment performance of the Fund and the Managers, (iii) the fees and expenses of the Fund, including comparative fee and expense information, (iv) the profitability of the Managers and their affiliates, including an analysis of the cost of providing services, (v) whether economies of scale are realized as the Fund grows and whether fee levels reflect these economies of scale for Fund investors and (vi) other benefits to the Managers from their relationship with the Fund. The Board was aware that there are alternatives to retaining the Managers.
Outlined below is a summary of the principal information considered by the Board as well as the Board’s conclusions.
Nature, Quality and Extent of Services. The Board considered information about the nature, quality and extent of the services provided to the Fund and information regarding the Managers’ key personnel who provide such services. The Managers’ duties include providing the Fund with the services of the portfolio managers and the Sub-Adviser’s investment team, who provide research, analysis and other advisory services in regard to the Fund’s investments; and securities trading services. OFI Global is responsible for oversight of third-party service providers; monitoring compliance with applicable Fund policies and procedures and adherence to the Fund’s investment restrictions; risk management; and oversight of the Sub-Adviser. OFI Global is also responsible for providing certain administrative services to the Fund as well. Those services include providing and supervising all administrative and clerical personnel who are necessary in order to provide effective corporate administration for the Fund; compiling and maintaining records with respect to the Fund’s operations; preparing and filing reports required by the U.S. Securities and Exchange Commission; preparing periodic reports regarding the operations of the Fund for its shareholders; preparing proxy materials for shareholder meetings; and preparing the registration statements required by federal and state securities laws for the sale of the Fund’s shares. OFI Global also provides the Fund with office space, facilities and equipment.
The Board also considered the quality of the services provided and the quality of the Managers’ resources that are available to the Fund. The Board took account of the fact that
42 OPPENHEIMER MAIN STREET FUND
the Sub-Adviser has had over fifty years of experience as an investment adviser and that its assets under management rank it among the top mutual fund managers in the United States. The Board evaluated the Managers’ advisory, administrative, accounting, legal, compliance services and risk management, and information the Board has received regarding the experience and professional qualifications of the Managers’ key personnel and the size and functions of its staff. In its evaluation of the quality of the portfolio management services provided, the Board considered the experience of Manind (“Mani”) Govil, Benjamin Ram and Paul Larson, the portfolio managers for the Fund, and the Sub-Adviser’s investment team and analysts. The Board members also considered the totality of their experiences with the Managers as directors or trustees of the Fund and other funds advised by the Managers. The Board considered information regarding the quality of services provided by affiliates of the Managers, which the Board members have become knowledgeable about through their experiences with the Managers and in connection with the renewal of the Fund’s service agreements. The Board concluded, in light of the Managers’ experience, reputation, personnel, operations and resources that the Fund benefits from the services provided under the Agreements.
Investment Performance of the Managers and the Fund. Throughout the year, the Adviser and the Sub-Adviser provided information on the investment performance of the Fund, the Adviser and the Sub-Adviser, including comparative performance information. The Board also reviewed information, prepared by the Adviser, the Sub-Adviser and the independent consultant, comparing the Fund’s historical performance to its benchmark and to the performance of other retail large blend funds. The Board considered that the Fund outperformed its category median for the five-year period, although it underperformed its category median for the one-, three- and ten-year periods. The Board also considered that the Fund’s performance for the five-year period ranked in the second quintile of its category and in the third quintile for the three- and ten-year periods.
Fees and Expenses of the Fund. The Board reviewed the fees paid to the Adviser and the Sub-Adviser and the other expenses borne by the Fund. The Board noted that the Adviser, not the Fund, pays the Sub-Adviser’s fee under the sub-advisory agreement. The Board also considered the comparability of the fees charged and the services provided to the Fund to the fees and services for other clients or accounts advised by the Adviser. The independent consultant provided comparative data in regard to the fees and expenses of the Fund and other retail large blend funds with comparable asset levels and distribution features. The Fund’s contractual management fees and total expenses were lower than their respective peer group medians and category medians and ranked in the first quintile of their respective categories. Within the average net asset range of $5 billion to $10 billion, the Fund’s effective management fee rate was lower than its peer group median and category median.
Economies of Scale and Profits Realized by the Managers. The Board considered information regarding the Managers’ costs in serving as the Fund’s investment adviser and sub-adviser, including the costs associated with the personnel and systems necessary to manage the Fund, and information regarding the Managers’ profitability from their relationship with the Fund. The Board reviewed whether the Managers may realize economies of scale in managing and supporting the Fund. The Board noted that the Fund currently has management fee breakpoints, which are intended to share with Fund shareholders economies
43 OPPENHEIMER MAIN STREET FUND
BOARD APPROVAL OF THE FUND’S INVESTMENT
ADVISORY AND SUB-ADVISORY AGREEMENTS Unaudited / Continued
of scale that may exist as the Fund’s assets grow and which are appropriate given the Fund’s current size.
Other Benefits to the Managers. In addition to considering the profits realized by the Managers, the Board considered information that was provided regarding the direct and indirect benefits the Managers receive as a result of their relationship with the Fund, including compensation paid to the Managers’ affiliates and research provided to the Adviser in connection with permissible brokerage arrangements (soft dollar arrangements).
Conclusions. These factors were also considered by the independent Trustees meeting separately from the full Board, assisted by experienced counsel to the Fund and to the independent Trustees. Fund counsel and the independent Trustees’ counsel are independent of the Managers within the meaning and intent of the Securities and Exchange Commission Rules.
Based on its review of the information it received and its evaluations described above, the Board, including a majority of the independent Trustees, decided to continue the Agreements through August 31, 2016. In arriving at its decision, the Board did not identify any factor or factors as being more important than others, but considered all of the above information, and considered the terms and conditions of the Agreements, including the management fees, in light of all the surrounding circumstances.
44 OPPENHEIMER MAIN STREET FUND
PORTFOLIO PROXY VOTING POLICIES AND PROCEDURES; UPDATES TO STATEMENTS OF
INVESTMENTS Unaudited
The Fund has adopted Portfolio Proxy Voting Policies and Procedures under which the Fund votes proxies relating to securities (“portfolio proxies”) held by the Fund. A description of the Fund’s Portfolio Proxy Voting Policies and Procedures is available (i) without charge, upon request, by calling the Fund toll-free at 1.800.CALL OPP (225.5677), (ii) on the Fund’s website at www.oppenheimerfunds.com, and (iii) on the SEC’s website at www.sec.gov. In addition, the Fund is required to file Form N-PX, with its complete proxy voting record for the 12 months ended June 30th, no later than August 31st of each year. The Fund’s voting record is available (i) without charge, upon request, by calling the Fund toll-free at 1.800.CALL OPP (225.5677), and (ii) in the Form N-PX filing on the SEC’s website at www.sec.gov.
The Fund files its complete schedule of portfolio holdings with the SEC for the first quarter and the third quarter of each fiscal year on Form N-Q. The Fund’s Form N-Q filings are available on the SEC’s website at www.sec.gov. Those forms may be reviewed and copied at the SEC’s Public Reference Room in Washington, D.C. Information on the operation of the Public Reference Room may be obtained by calling 1-800-SEC-0330.
Householding—Delivery of Shareholder Documents
This is to inform you about OppenheimerFunds’ “householding” policy. If more than one member of your household maintains an account in a particular fund, OppenheimerFunds will mail only one copy of the fund’s prospectus (or, if available, the fund’s summary prospectus), annual and semiannual report and privacy policy. The consolidation of these mailings, called householding, benefits your fund through reduced mailing expense, and benefits you by reducing the volume of mail you receive from OppenheimerFunds. Householding does not affect the delivery of your account statements.
Please note that we will continue to household these mailings for as long as you remain an OppenheimerFunds shareholder, unless you request otherwise. If you prefer to receive multiple copies of these materials, please call us at 1.800.CALL-OPP (225-5677). You may also notify us in writing or via email. We will begin sending you individual copies of the prospectus (or, if available, the summary prospectus), reports and privacy policy within 30 days of receiving your request to stop householding.
45 OPPENHEIMER MAIN STREET FUND
TRUSTEES AND OFFICERS Unaudited
| | |
Name, Position(s) Held with the Fund, Length of Service, Year of Birth | | Principal Occupation(s) During the Past 5 Years; Other Trusteeships/Directorships Held; Number of Portfolios in the Fund Complex Currently Overseen |
| |
INDEPENDENT TRUSTEES | | The address of each Trustee in the chart below is 6803 S. Tucson Way, Centennial, Colorado 80112-3924. Each Trustee serves for an indefinite term, or until his or her resignation, retirement, death or removal. |
| |
Sam Freedman, Chairman of the Board of Trustees (since 2012) and Trustee (since 1996) Year of Birth: 1940 | | Director of Colorado UpLIFT (charitable organization) (since September 1984). Mr. Freedman held several positions with the Sub-Adviser and with subsidiary or affiliated companies of the Sub-Adviser (until October 1994). Oversees 38 portfolios in the OppenheimerFunds complex. Mr. Freedman has served on the Boards of certain Oppenheimer funds since 1996, during which time he has become familiar with the Fund’s (and other Oppenheimer funds’) financial, accounting, regulatory and investment matters and has contributed to the Boards’ deliberations. |
| |
Jon S. Fossel, Trustee (since 1990) Year of Birth: 1942 | | Chairman of the Board (2006-December 2011) and Director (June 2002- December 2011) of UNUMProvident (insurance company); Director of Northwestern Energy Corp. (public utility corporation) (November 2004- December 2009); Director of P.R. Pharmaceuticals (October 1999-October 2003); Director of Rocky Mountain Elk Foundation (non-profit organization) (February 1998-February 2003 and February 2005-February 2007); Chairman and Director (until October 1996) and President and Chief Executive Officer (until October 1995) of the Sub-Adviser; President, Chief Executive Officer and Director of the following: Oppenheimer Acquisition Corp. (“OAC”) (parent holding company of the Sub-Adviser), Shareholders Services, Inc. and Shareholder Financial Services, Inc. (until October 1995). Oversees 38 portfolios in the OppenheimerFunds complex. Mr. Fossel has served on the Boards of certain Oppenheimer funds since 1990, during which time he has become familiar with the Fund’s (and other Oppenheimer funds’) financial, accounting, regulatory and investment matters and has contributed to the Boards’ deliberations. |
| |
Richard F. Grabish, Trustee (since 2012) Year of Birth: 1948 | | Formerly Senior Vice President and Assistant Director of Sales and Marketing (March 1997-December 2007), Director (March 1987-December 2007) and Manager of Private Client Services (June 1985-June 2005) of A.G. Edwards & Sons, Inc. (broker/dealer and investment firm); Chairman and Chief Executive Officer of A.G. Edwards Trust Company, FSB (March 2001-December 2007); President and Vice Chairman of A.G. Edwards Trust Company, FSB (investment adviser) (April 1987-March 2001); President of A.G. Edwards Trust Company, FSB (investment adviser) (June 2005-December 2007). Oversees 38 portfolios in the OppenheimerFunds complex. Mr. Grabish has served on the Boards of certain Oppenheimer funds since 2001, during which time he has become familiar with the Fund’s (and other Oppenheimer funds’) financial, accounting, regulatory and investment matters and has contributed to the Boards’ deliberations. |
| |
Beverly L. Hamilton, Trustee (since 2002) Year of Birth: 1946 | | Trustee of Monterey Institute for International Studies (educational organization) (since February 2000); Board Member of Middlebury College (educational organization) (December 2005-June 2011); Chairman (since 2010) of American Funds’ Emerging Markets Growth Fund, Inc. (mutual fund); |
46 OPPENHEIMER MAIN STREET FUND
| | |
Beverly L. Hamilton, Continued | | Director of The California Endowment (philanthropic organization) (April 2002-April 2008); Director (February 2002-2005) and Chairman of Trustees (2006-2007) of the Community Hospital of Monterey Peninsula; Director (October 1991-2005); Vice Chairman (2006-2009) of American Funds’ Emerging Markets Growth Fund, Inc. (mutual fund); President of ARCO Investment Management Company (February 1991-April 2000); Member of the investment committees of The Rockefeller Foundation (2001-2006) and The University of Michigan (since 2000); Advisor at Credit Suisse First Boston’s Sprout venture capital unit (venture capital fund) (1994-January 2005); Trustee of MassMutual Institutional Funds (investment company) (1996-June 2004); Trustee of MML Series Investment Fund (investment company) (April 1989-June 2004); Member of the investment committee of Hartford Hospital (2000-2003); and Advisor to Unilever (Holland) pension fund (2000-2003). Oversees 38 portfolios in the OppenheimerFunds complex. Ms. Hamilton has served on the Boards of certain Oppenheimer funds since 2002, during which time she has become familiar with the Fund’s (and other Oppenheimer funds’) financial, accounting, regulatory and investment matters and has contributed to the Boards’ deliberations. |
| |
Victoria J. Herget, Trustee (since 2012) Year of Birth:1951 | | Board Chair (2008-Present) and Director (2004-Present), United Educators (insurance company); Trustee (since 2000) and Chair (since 2010), Newberry Library (independent research library); Trustee, Mather LifeWays (senior living organization) (since 2001); Independent Director of the First American Funds (mutual fund family) (2003-2011); former Managing Director (1993-2001), Principal (1985-1993), Vice President (1978-1985) and Assistant Vice President (1973-1978) of Zurich Scudder Investments (investment adviser) (and its predecessor firms); Trustee (1992-2007), Chair of the Board of Trustees (1999-2007), Investment Committee Chair (1994-1999) and Investment Committee member (2007-2010) of Wellesley College; Trustee, BoardSource (non-profit organization) (2006-2009) and Chicago City Day School (K-8 School) (1994-2005). Oversees 38 portfolios in the OppenheimerFunds complex. Ms. Herget has served on the Boards of certain Oppenheimer funds since 2012, during which time she has become familiar with the Fund’s (and other Oppenheimer funds’) financial, accounting, regulatory and investment matters and has contributed to the Boards’ deliberations. |
| |
Robert J. Malone, Trustee (since 2002) Year of Birth: 1944 | | Chairman of the Board (since 2012) and Director (since August 2005) of Jones International University (educational organization) (since August 2005); Chairman, Chief Executive Officer and Director of Steele Street Bank Trust (commercial banking) (since August 2003); Trustee of the Gallagher Family Foundation (non-profit organization) (since 2000); Board of Directors of Opera Colorado Foundation (non-profit organization) (2008-2012); Director of Colorado UpLIFT (charitable organization) (1986-2010); Director of Jones Knowledge, Inc. (2006-2010); Former Chairman of U.S. Bank-Colorado (subsidiary of U.S. Bancorp and formerly Colorado National Bank) (July 1996- April 1999); Director of Commercial Assets, Inc. (real estate investment trust) (1993-2000); Director of U.S. Exploration, Inc. (oil and gas exploration) (1997- February 2004); Chairman of the Board (1991-1994) and Trustee (1985- 1994) of Regis University; and Chairman of the Board (1990-1991 and Trustee (1984-1999) of Young Presidents Organization. Oversees 39 portfolios in the OppenheimerFunds complex. Mr. Malone has served on the Boards of |
47 OPPENHEIMER MAIN STREET FUND
TRUSTEES AND OFFICERS Unaudited / Continued
| | |
Robert J. Malone, Continued | | certain Oppenheimer funds since 2002, during which time he has become familiar with the Fund’s (and other Oppenheimer funds’) financial, accounting, regulatory and investment matters and has contributed to the Boards’ deliberations. |
| |
F. William Marshall, Jr., Trustee (since 2001) Year of Birth: 1942 | | Trustee Emeritus of Worcester Polytech Institute (WPI) (private university) (since 2009); Trustee of MassMutual Select Funds (formerly MassMutual Institutional Funds) (investment company) (since 1996), MML Series Investment Fund (investment company) (since 1996) and Mass Mutual Premier Funds (investment company) (since January 2012); President and Treasurer of the SIS Funds (private charitable fund) (January 1999-March 2011); Former Trustee of WPI (1985-2008); Former Chairman of the Board (2004-2006) and Former Chairman of the Investment Committee of WPI (1994-2008); Chairman of SIS Family Bank, F.S.B. (formerly SIS Bank) (commercial bank) (January 1999-July 1999); Executive Vice President of Peoples Heritage Financial Group, Inc. (commercial bank) (January 1999-July 1999); and Former President and Chief Executive Officer of SIS Bancorp. (1993-1999). Oversees 42 portfolios in the OppenheimerFunds complex. Mr. Marshall has served on the Boards of certain Oppenheimer funds since 2000, during which time he has become familiar with the Fund’s (and other Oppenheimer funds’) financial, accounting, regulatory and investment matters and has contributed to the Boards’ deliberations. |
| |
Karen L. Stuckey, Trustee (since 2012) Year of Birth: 1953 | | Partner (1990-2012) of PricewaterhouseCoopers LLP (professional services firm) (held various positions 1975-1990); Trustee (1992-2006) and member of Executive, Nominating and Audit Committees and Chair of Finance Committee of Lehigh University; and member, Women’s Investment Management Forum (professional organization) since inception. Oversees 38 portfolios in the OppenheimerFunds complex. Ms. Stuckey has served on the Boards of certain Oppenheimer funds since 2012, during which time she has become familiar with the Fund’s (and other Oppenheimer funds’) financial, accounting, regulatory and investment matters and has contributed to the Boards’ deliberations. |
| |
James D. Vaughn, Trustee (since 2012) Year of Birth:1945 | | Retired; former managing partner (1994-2001) of Denver office of Deloitte & Touche LLP, (held various positions 1969-1993); Trustee and Chairman of the Audit Committee of Schroder Funds (2003-2012); Board member and Chairman of Audit Committee of AMG National Trust Bank (since 2005); Trustee and Investment Committee member, University of South Dakota Foundation (since 1996); Board member, Audit Committee Member and past Board Chair, Junior Achievement (since 1993); former Board member, Mile High United Way, Boys and Girls Clubs, Boy Scouts, Colorado Business Committee for the Arts, Economic Club of Colorado and Metro Denver Network. Oversees 38 portfolios in the OppenheimerFunds complex. Mr. Vaughn has served on the Boards of certain Oppenheimer funds since 2012, during which time he has become familiar with the Fund’s (and other Oppenheimer funds’) financial, accounting, regulatory and investment matters and has contributed to the Boards’ deliberations. |
48 OPPENHEIMER MAIN STREET FUND
| | |
| |
INTERESTED TRUSTEE AND OFFICER | | Mr. Steinmetz is an “Interested Trustee” because he is affiliated with the Manager and the Sub-Adviser by virtue of his positions as Chairman of the Sub-Adviser and officer and director of the Manager. Both as a Trustee and as an officer, Mr. Steinmetz serves for an indefinite term, or until his resignation, retirement, death or removal. Mr. Steinmetz’s address is 225 Liberty Street, New York, New York 10281-1008. |
| |
Arthur P. Steinmetz, Trustee (since 2015), President and Principal Executive Officer (since 2014) Year of Birth: 1958 | | Chairman of the Sub-Adviser (since January 2015); CEO and Chairman of the Manager (since July 2014), President of the Manager (since May 2013), a Director of the Manager (since January 2013), Director of the Sub-Adviser (since July 2014), President, Management Director and CEO of Oppenheimer Acquisition Corp. (the Sub-Adviser’s parent holding company) (since July 2014), and President and Director of OFI SteelPath, Inc. (since January 2013). Chief Investment Officer of the OppenheimerFunds advisory entities from (January 2013-December 2013); Executive Vice President of the Manager (January 2013-May 2013); Chief Investment Officer of the Sub-Adviser (October 2010-December 2012); Chief Investment Officer, Fixed-Income, of the Sub-Adviser (April 2009-October 2010); Executive Vice President of the Sub-Adviser (October 2009-December 2012); Director of Fixed Income of the Sub-Adviser (January 2009-April 2009); and a Senior Vice President of the Sub-Adviser (March 1993-September 2009). An officer of 91 portfolios in the OppenheimerFunds complex. |
| | | |
| |
OTHER OFFICERS OF THE FUND | | The addresses of the Officers in the chart below are as follows: for Messrs. Govil, Ram, Larson, Gabinet, Mss. Sexton and Picciotto, 225 Liberty Street, New York, New York 10281-1008, for Mr. Wixted, 6803 S. Tucson Way, Centennial, Colorado 80112-3924. Each Officer serves for an indefinite term or until his or her resignation, retirement, death or removal. |
| |
Manind Govil, Vice President (since 2009) Year of Birth: 1969 | | Senior Vice President, the Main Street Team Leader and a portfolio manager of the Sub-Adviser (since May 2009). Portfolio manager with RS Investments Management Co. LLC (October 2006-March 2009). Head of equity investments at The Guardian Life Insurance Company of America (August 2005-October 2006) when Guardian Life Insurance acquired an interest in RS Investments Management Co. LLC. Lead portfolio manager - large cap blend/core equity, co-head of equities and head of equity research (2001-July 2005), and was lead portfolio manager - core equity (April 1996-July 2005), at Mercantile Capital Advisers, Inc. A portfolio manager and officer of other portfolios in the OppenheimerFunds complex. |
| |
Benjamin Ram, Vice President (since 2009) Year of Birth: 1972 | | Vice President and portfolio manager of the Sub-Adviser (since May 2009); Senior Portfolio Manager of the Sub-Adviser (since January 2011). Sector manager for financial investments and a co portfolio manager for mid-cap portfolios with the RS Core Equity Team of RS Investments Management Co. LLC (October 2006-May 2009). Portfolio Manager of Mid Cap Strategies, Sector Manager Financials at The Guardian Life Insurance Company of America (January 2006-October 2006) when Guardian Life Insurance acquired an interest in RS Investments Management Co. LLC. Financial analyst (2003- 2005), and co portfolio manager (2005-2006) at Mercantile Capital Advisers, Inc.; Bank analyst at Legg Mason Securities (2000-2003) and a senior financial analyst at the CitiFinancial division of Citigroup, Inc. (1997-2000). A portfolio manager and officer of other portfolios in the OppenheimerFunds complex. |
49 OPPENHEIMER MAIN STREET FUND
TRUSTEES AND OFFICERS Unaudited / Continued
| | |
Paul Larson, Vice President (since 2014) Year of Birth: 1971 | | Vice President of the Sub-Adviser (since January 2013). Prior to joining the Sub-Adviser, he was a portfolio manager and Chief Equity Strategist at Morningstar. He was previously an analyst at Morningstar covering the energy sector and oversaw the firm’s natural resources analysts. Prior to joining Morningstar in 2002, Mr. Larson was an analyst with The Motley Fool. A portfolio manager and officer of other portfolios in the OppenheimerFunds complex. |
| |
Arthur S. Gabinet, Secretary and Chief Legal Officer (since 2011) Year of Birth: 1958 | | Executive Vice President, Secretary and General Counsel of the Manager (since January 2013); General Counsel OFI SteelPath, Inc. (since January 2013); Executive Vice President (May 2010-December 2012) and General Counsel (since January 2011) of the Sub-Adviser; General Counsel of the Distributor (since January 2011); General Counsel of Centennial Asset Management Corporation (January 2011-December 2012); Executive Vice President (January 2011-December 2012) and General Counsel of HarbourView Asset Management Corporation (since January 2011); Assistant Secretary (since January 2011) and Director (since January 2011) of OppenheimerFunds International Ltd. and OppenheimerFunds plc; Director of Oppenheimer Real Asset Management, Inc. (January 2011-December 2012) and General Counsel (since January 2011); Executive Vice President (January 2011-December 2011) and General Counsel of Shareholder Financial Services, Inc. and Shareholder Services, Inc. (since January 2011); Executive Vice President (January 2011- December 2012) and General Counsel of OFI Private Investments Inc. (since January 2011); Vice President of OppenheimerFunds Legacy Program (January 2011-December 2011); Executive Vice President (January 2011-December 2012) and General Counsel of OFI Institutional Asset Management, Inc. (since January 2011); General Counsel, Asset Management of the Sub-Adviser (May 2010-December 2010); Principal, The Vanguard Group (November 2005-April 2010); District Administrator, U.S. Securities and Exchange Commission (January 2003-October 2005). An officer of 91 portfolios in the OppenheimerFunds complex. |
| |
Jennifer Sexton, Vice President and Chief Business Officer (since 2014) Year of Birth: 1969 | | Senior Vice President of OppenheimerFunds Distributor, Inc. (since June 2014); Vice President of OppenheimerFunds Distributor, Inc. (April 2006-June 2014); Vice President of the Sub-Adviser (January 1998-March 2006); Assistant Vice President of the Sub-Adviser (October 1991-December 1998). An officer of 91 portfolios in the OppenheimerFunds complex. |
| |
Mary Ann Picciotto, Chief Compliance Officer and Chief Anti-Money Laundering Officer (since 2014) Year of Birth: 1973 | | Senior Vice President and Chief Compliance Officer of the Manager (since March 2014); Chief Compliance Officer of the Sub-Adviser, OFI SteelPath, Inc., OFI Global Trust Company, OFI Global Institutional, Inc., Oppenheimer Real Asset Management, Inc., OFI Private Investments, Inc., Harborview Asset Management Corporation, Trinity Investment Management Corporation, and Shareholder Services, Inc. (since March 2014); Managing Director of Morgan Stanley Investment Management Inc. and certain of its various affiliated entities; Chief Compliance Officer of various Morgan Stanley Funds (May 2010-January 2014); Chief Compliance Officer of Morgan Stanley Investment Management Inc. (April 2007-January 2014). An officer of 91 portfolios in the OppenheimerFunds complex. |
50 OPPENHEIMER MAIN STREET FUND
| | |
Brian W. Wixted, Treasurer and Principal Financial & Accounting Officer (since 1999) Year of Birth: 1959 | | Senior Vice President of the Manager (since January 2013); Treasurer of the Sub-Adviser, HarbourView Asset Management Corporation, Shareholder Financial Services, Inc., Shareholder Services, Inc., and Oppenheimer Real Asset Management, Inc. (March 1999-June 2008), OFI Private Investments, Inc. (March 2000-June 2008), OppenheimerFunds International Ltd. and OppenheimerFunds plc (since May 2000), OFI Institutional Asset Management, Inc. (November 2000-June 2008), and OppenheimerFunds Legacy Program (charitable trust program established by the Sub-Adviser) (June 2003-December 2011); Treasurer and Chief Financial Officer of OFI Trust Company (since May 2000); Assistant Treasurer of Oppenheimer Acquisition Corporation (March 1999-June 2008). An officer of 91 portfolios in the OppenheimerFunds complex. |
The Fund’s Statement of Additional Information contains additional information about the Fund’s Trustees and Officers and is available without charge upon request, by calling 1.800.CALL OPP (225.5677).
51 OPPENHEIMER MAIN STREET FUND
OPPENHEIMER MAIN STREET FUND
| | |
| Manager | | OFI Global Asset Management, Inc. |
| |
| Sub-Adviser | | OppenheimerFunds, Inc. |
| |
| Distributor | | OppenheimerFunds Distributor, Inc. |
| |
| Transfer and Shareholder Servicing Agent | | OFI Global Asset Management, Inc. |
| |
| Sub-Transfer Agent | | Shareholder Services, Inc. DBA OppenheimerFunds Services |
| |
| Independent Registered Public Accounting Firm | | KPMG LLP |
| |
| Legal Counsel | | Ropes & Gray LLP |
© 2015 OppenheimerFunds, Inc. All rights reserved.
52 OPPENHEIMER MAIN STREET FUND
PRIVACY POLICY NOTICE
As an Oppenheimer fund shareholder, you are entitled to know how we protect your personal information and how we limit its disclosure.
Information Sources
We obtain nonpublic personal information about our shareholders from the following sources:
| ● | | Applications or other forms |
| ● | | When you create a user ID and password for online account access |
| ● | | When you enroll in eDocs Direct, our electronic document delivery service |
| ● | | Your transactions with us, our affiliates or others |
| ● | | A software program on our website, often referred to as a “cookie,” which indicates which parts of our site you’ve visited |
| ● | | When you set up challenge questions to reset your password online |
If you visit oppenheimerfunds.com and do not log on to the secure account information areas, we do not obtain any personal information about you. When you do log on to a secure area, we do obtain your user ID and password to identify you. We also use this information to provide you with products and services you have requested, to inform you about products and services that you may be interested in and assist you in other ways.
We do not collect personal information through our website unless you willingly provide it to us, either directly by email or in those areas of the website that request information. In order to update your personal information (including your mailing address, email address and phone number) you must first log on and visit your user profile.
If you have set your browser to warn you before accepting cookies, you will receive the warning message with each cookie. You can refuse cookies by turning them off in your browser. However, doing so may limit your access to certain sections of our website.
We use cookies to help us improve and manage our website. For example, cookies help us recognize new versus repeat visitors to the site, track the pages visited, and enable some special features on the website. This data helps us provide a better service for our website visitors.
Protection of Information
We do not disclose any non-public personal information (such as names on a customer list) about current or former customers to anyone, except as permitted by law.
Disclosure of Information
Copies of confirmations, account statements and other documents reporting activity in your fund accounts are made available to your financial advisor (as designated by you). We may also use details about you and your investments to help us, our financial service affiliates, or firms that jointly market their financial products and services with ours, to better serve your investment needs or suggest financial services or educational material that may be of interest to you. If this requires us to provide you with an opportunity to “opt in” or “opt out” of such information sharing with a firm not affiliated with us, you will receive notification on how to do so, before any such sharing takes place.
Right of Refusal
We will not disclose your personal information to unaffiliated third parties (except as permitted by law), unless we first offer you a reasonable opportunity to refuse or “opt out” of such disclosure.
53 OPPENHEIMER MAIN STREET FUND
|
| PRIVACY POLICY NOTICE Continued |
Internet Security and Encryption
In general, the email services provided by our website are encrypted and provide a secure and private means of communication with us. To protect your own privacy, confidential and/or personal information should only be communicated via email when you are advised that you are using a secure website. As a security measure, we do not include personal or account information in non-secure emails, and we advise you not to send such information to us in non-secure emails. Instead, you may take advantage of the secure features of our website to encrypt your email correspondence. To do this, you will need to use a browser that supports Secure Sockets Layer (SSL) protocol.
We do not guarantee or warrant that any part of our website, including files available for download, are free of viruses or other harmful code. It is your responsibility to take appropriate precautions, such as use of an anti-virus software package, to protect your computer hardware and software.
| ● | | All transactions, including redemptions, exchanges and purchases, are secured by SSL and 256-bit encryption. SSL is used to establish a secure connection between your PC and OppenheimerFunds’ server. It transmits information in an encrypted and scrambled format. |
| ● | | Encryption is achieved through an electronic scrambling technology that uses a “key” to code and then decode the data. Encryption acts like the cable converter box you may have on your television set. It scrambles data with a secret code so that no one can make sense of it while it is being transmitted. When the data reaches its destination, the same software unscrambles the data. |
| ● | | You can exit the secure area by either closing your browser, or for added security, you can use the Log Out button before you close your browser. |
Other Security Measures
We maintain physical, electronic and procedural safeguards to protect your personal account information. Our employees and agents have access to that information only so that they may offer you products or provide services, for example, when responding to your account questions.
How You Can Help
You can also do your part to keep your account information private and to prevent unauthorized transactions. If you obtain a user ID and password for your account, do not allow it to be used by anyone else. Also, take special precautions when accessing your account on a computer used by others.
Who We Are
This joint notice describes the privacy policies of the Oppenheimer funds, OppenheimerFunds, Inc., each of its investment adviser subsidiaries, OppenheimerFunds Distributor, Inc. and OFI Global Trust Co. It applies to all Oppenheimer fund accounts you presently have, or may open in the future, using your Social Security number—whether or not you remain a shareholder of our funds. This notice was last updated March 2015. In the event it is updated or changed, we will post an updated notice on our website at oppenheimerfunds.com. If you have any questions about this privacy policy, write to us at P.O. Box 5270, Denver, CO 80217-5270, email us by clicking on the Contact Us section of our website at oppenheimerfunds.com or call us at 1.800.CALL OPP (225.5677).
54 OPPENHEIMER MAIN STREET FUND
THIS PAGE INTENTIONALLY LEFT BLANK.
55 OPPENHEIMER MAIN STREET FUND

Item 2. Code of Ethics.
The registrant has adopted a code of ethics that applies to the registrant’s principal executive officer, principal financial officer, principal accounting officer or controller or persons performing similar functions.
Item 3. Audit Committee Financial Expert.
The Board of Trustees of the registrant has determined that F. William Marshall, Jr., the Chairman of the Board’s Audit Committee, is the audit committee financial expert and that Mr. Marshall is “independent” for purposes of this Item 3.
Item 4. Principal Accountant Fees and Services.
The principal accountant for the audit of the registrant’s annual financial statements billed $30,900 in fiscal 2015 and $32,200 in fiscal 2014.
The principal accountant for the audit of the registrant’s annual financial statements billed no such fees in fiscal 2015 and no such fees in fiscal 2014.
The principal accountant for the audit of the registrant’s annual financial statements billed $815,922 in fiscal 2015 and $476,156 in fiscal 2014 to the registrant’s investment adviser or any entity controlling, controlled by, or under common control with the adviser that provides ongoing services to the registrant.
Such services include: Internal control reviews, GIPS attestation procedures, system conversion testing, and corporate restructuring.
The principal accountant for the audit of the registrant’s annual financial statements billed no such fees in fiscal 2015 and no such fees in fiscal 2014.
The principal accountant for the audit of the registrant’s annual financial statements billed $595,129 in fiscal 2015 and $336,709 in fiscal 2014 to the registrant’s investment adviser or any entity controlling, controlled by, or under common control with the adviser that provides ongoing services to the registrant.
Such services include: tax compliance, tax planning and tax advice. Tax compliance generally involves preparation of original and amended tax returns, claims for a refund and tax payment-planning services. Tax planning and tax advice includes assistance with tax audits and appeals, tax advice related to mergers and acquisitions and requests for rulings or technical advice from taxing authorities.
The principal accountant for the audit of the registrant’s annual financial statements billed no such fees in fiscal 2015 and no such fees in fiscal 2014.
The principal accountant for the audit of the registrant’s annual financial statements billed no such fees in fiscal 2015 and no such fees in fiscal 2014 to the registrant’s investment adviser or any entity controlling, controlled by, or under common control with the adviser that provides ongoing services to the registrant.
Such fees would include the cost to the principal accountant of attending audit committee meetings and consultations regarding the registrant’s retirement plan with respect to its Trustees.
| (e) | (1) During its regularly scheduled periodic meetings, the registrant’s audit committee will pre-approve all audit, audit-related, tax and other services to be provided by the principal accountants of the registrant. |
The audit committee has delegated pre-approval authority to its Chairman for any subsequent new engagements that arise between regularly scheduled meeting dates provided that any fees such pre-approved are presented to the audit committee at its next regularly scheduled meeting.
Under applicable laws, pre-approval of non-audit services may be waived provided that: 1) the aggregate amount of all such services provided constitutes no more than five percent of the total amount of fees paid by the registrant to its principal accountant during the fiscal year in which services are provided 2) such services were not recognized by the registrant at the time of engagement as non-audit services and 3) such services are promptly brought to the attention of the audit committee of the registrant and approved prior to the completion of the audit.
| (f) | Not applicable as less than 50%. |
| (g) | The principal accountant for the audit of the registrant’s annual financial statements billed $1,411,051 in fiscal 2015 and $812,865 in fiscal 2014 to the registrant and the registrant’s investment adviser or any entity controlling, controlled by, or under common control with the adviser that provides ongoing services to the registrant related to non-audit fees. Those billings did not include any prohibited non-audit services as defined by the Securities Exchange Act of 1934. |
| (h) | The registrant’s audit committee of the board of Trustees has considered whether the provision of non-audit services that were rendered to the registrant’s investment adviser, and any entity controlling, controlled by, or under common control with the investment adviser that provides ongoing services to the registrant that were not pre-approved pursuant to paragraph (c)(7)(ii) of Rule 2-01 of Regulation S-X is compatible with maintaining the principal accountant’s independence. No such services were rendered. |
Item 5. Audit Committee of Listed Registrants
Not applicable.
Item 6. Schedule of Investments.
a) Not applicable. The complete schedule of investments is included in Item 1 of this Form N-CSR.
b) Not applicable.
Item 7. Disclosure of Proxy Voting Policies and Procedures for Closed-End Management Investment Companies.
Not applicable.
Item 8. Portfolio Managers of Closed-End Management Investment Companies.
Not applicable.
Item 9. Purchases of Equity Securities by Closed-End Management Investment Company and Affiliated Purchasers.
Not applicable.
Item 10. Submission of Matters to a Vote of Security Holders.
The Fund’s Governance Committee Provisions with Respect to Nominations of Directors/Trustees to the Respective Boards
None
Item 11. Controls and Procedures.
Based on their evaluation of the registrant’s disclosure controls and procedures (as defined in rule 30a-3(c) under the Investment Company Act of 1940 (17 CFR 270.30a-3(c)) as of 8/31/2015, the registrant’s principal executive officer and principal financial officer found the registrant’s disclosure controls and procedures to provide reasonable assurances that information required to be disclosed by the registrant in the reports that it files under the Securities Exchange Act of 1934 (a) is accumulated and communicated to registrant’s management, including its principal executive officer and principal financial officer, to allow timely decisions regarding required disclosure, and (b) is recorded, processed, summarized and reported, within the time periods specified in the rules and forms adopted by the U.S. Securities and Exchange Commission.
There have been no changes in the registrant’s internal controls over financial reporting that occurred during the registrant’s second fiscal quarter of the period covered by this report that have materially affected, or are reasonably likely to materially affect, the registrant’s internal control over financial reporting.
Item 12. Exhibits.
| (a) | (1) Exhibit attached hereto. |
(2) Exhibits attached hereto.
(3) Not applicable.
| (b) | Exhibit attached hereto. |
SIGNATURES
Pursuant to the requirements of the Securities Exchange Act of 1934 and the Investment Company Act of 1940, the registrant has duly caused this report to be signed on its behalf by the undersigned, thereunto duly authorized.
Oppenheimer Main Street Funds
| | |
| By: | | /s/ Arthur P. Steinmetz |
| | Arthur P. Steinmetz |
| | Principal Executive Officer |
| Date: | | 10/12/2015 |
Pursuant to the requirements of the Securities Exchange Act of 1934 and the Investment Company Act of 1940, this report has been signed below by the following persons on behalf of the registrant and in the capacities and on the dates indicated.
| | |
| By: | | /s/ Arthur P. Steinmetz |
| | Arthur P. Steinmetz |
| | Principal Executive Officer |
| Date: | | 10/12/2015 |
| |
| By: | | /s/ Brian W. Wixted |
| | Brian W. Wixted |
| | Principal Financial Officer |
| Date: | | 10/12/2015 |